TREEHOUSE FOODS, INC.
10-Ks and 10-Qs
|
|
|
|
|
|
|
|
|
|
|
|
|
|
|
|
|
|
|
|
|
|
|
|
|
|
|
|
|
|
|
|
|
|
|
|
|
|
|
|
|
|
|
|
|
|
|
|
|
|
|
|
|
|
|
|
UNITED STATES SECURITIES AND EXCHANGE COMMISSION
Washington, D.C. 20549
Form 10-Q
(Mark One)
|
|
x
|
Quarterly Report Pursuant to Section 13 or 15(d) of the Securities Exchange Act of 1934
|
For the Quarterly Period Ended
September 30, 2018
.
or
|
|
o
|
Transition Report Pursuant to Section 13 or 15(d) of the Securities Exchange Act of 1934
|
For the Transition Period from to
Commission File Number 001-32504
TreeHouse Foods, Inc.
(Exact name of the registrant as specified in its charter)

|
Delaware
|
20-2311383
|
|
(State or other jurisdiction of incorporation or organization)
|
(I.R.S. employer identification no.)
|
|
|
|
|
2021 Spring Road, Suite 600
|
|
|
Oak Brook, IL
|
60523
|
|
(Address of principal executive offices)
|
(Zip Code)
|
(Registrant’s telephone number, including area code)
(708) 483-1300
Indicate by check mark whether the registrant (1) has filed all reports required to be filed by Section 13 or 15(d) of the Securities Exchange Act of 1934 during the preceding 12 months (or for such shorter period that the registrant was required to file such reports), and (2) has been subject to such filing requirements for the past 90 days. Yes
x
No
o
Indicate by check mark whether the registrant has submitted electronically and posted on its corporate Web site, if any, every Interactive Data File required to be submitted and posted pursuant to Rule 405 of Regulation S-T (§232.405 of this chapter) during the preceding 12 months (or for such shorter period that the registrant was required to submit and post such files). Yes
x
No
o
Indicate by check mark whether the registrant is a large accelerated filer, an accelerated filer, a non-accelerated filer, a smaller reporting company, or an emerging growth company. See the definitions of “large accelerated filer,” “accelerated filer” and “smaller reporting company” in Rule 12b-2 of the Exchange Act.
|
Large accelerated filer
|
x
|
Accelerated filer
|
o
|
|
|
|
|
|
|
Non-accelerated filer
|
o
|
Smaller reporting Company
|
o
|
|
(Do not check if a smaller reporting company)
|
|
|
|
|
|
|
|
|
|
Emerging growth company
|
o
|
|
|
If an emerging growth company, indicate by check mark if the registrant has elected not to use the extended transition period for complying with any new or revised financial accounting standards provided pursuant to Section 13(a) of the Exchange Act.
o
Indicate by check mark whether the registrant is a shell company (as defined in Rule 12b-2 of the Exchange Act).
Yes
o
No
x
Number of shares of Common Stock, $0.01 par value, outstanding as of
October 26, 2018
:
55,997,265
.
1
Table of Contents
|
|
Page
|
|
|
|
|
|
|
|
|
|
|
|
|
|
|
|
|
|
|
|
|
|
|
|
|
|
|
|
|
|
|
|
|
|
|
|
|
|
|
|
2
TREEHOUSE FOODS, INC.
(In millions, except per share data)
|
September 30, 2018
|
December 31, 2017
|
|||||||
|
|
(Unaudited)
|
|||||||
|
Assets
|
|
|
|
|
||||
|
Current assets:
|
|
|
|
|
||||
|
Cash and cash equivalents
|
$
|
52.8
|
|
$
|
132.8
|
|
||
|
Investments
|
15.4
|
|
14.1
|
|
||||
|
Receivables, net
|
285.6
|
|
329.8
|
|
||||
|
Inventories
|
999.3
|
|
918.3
|
|
||||
|
Prepaid expenses and other current assets
|
92.5
|
|
89.7
|
|
||||
|
Total current assets
|
1,445.6
|
|
|
1,484.7
|
|
|||
|
Property, plant and equipment, net
|
1,272.1
|
|
1,294.4
|
|
||||
|
Goodwill
|
2,168.0
|
|
2,182.0
|
|
||||
|
Intangible assets, net
|
722.3
|
|
773.0
|
|
||||
|
Other assets, net
|
36.2
|
|
45.2
|
|
||||
|
Total assets
|
$
|
5,644.2
|
|
|
$
|
5,779.3
|
|
|
|
Liabilities and Stockholders’ Equity
|
|
|
|
|
||||
|
Current liabilities:
|
|
|
|
|
||||
|
Accounts payable
|
$
|
562.6
|
|
$
|
451.3
|
|
||
|
Accrued expenses
|
188.3
|
|
138.4
|
|
||||
|
Current portion of long-term debt
|
10.4
|
|
10.1
|
|
||||
|
Total current liabilities
|
761.3
|
|
|
599.8
|
|
|||
|
Long-term debt
|
2,333.1
|
|
2,535.7
|
|
||||
|
Deferred income taxes
|
173.3
|
|
178.4
|
|
||||
|
Other long-term liabilities
|
186.8
|
|
202.1
|
|
||||
|
Total liabilities
|
3,454.5
|
|
|
3,516.0
|
|
|||
|
Commitments and contingencies (Note 15)
|
|
|
|
|
||||
|
Stockholders’ equity:
|
|
|
|
|
||||
|
Preferred stock, par value $0.01 per share, 10.0 shares authorized, none issued
|
—
|
|
—
|
|
||||
|
Common stock, par value $0.01 per share, 90.0 shares authorized, 56.1 and 56.6 shares issued and outstanding, respectively
|
0.6
|
|
0.6
|
|
||||
|
Treasury stock
|
(70.9
|
)
|
(28.7
|
)
|
||||
|
Additional paid-in capital
|
2,136.7
|
|
2,107.0
|
|
||||
|
Retained earnings
|
198.5
|
|
245.9
|
|
||||
|
Accumulated other comprehensive loss
|
(75.2
|
)
|
(61.5
|
)
|
||||
|
Total stockholders’ equity
|
2,189.7
|
|
|
2,263.3
|
|
|||
|
Total liabilities and stockholders’ equity
|
$
|
5,644.2
|
|
|
$
|
5,779.3
|
|
|
See Notes to Condensed Consolidated Financial Statements.
3
TREEHOUSE FOODS, INC.
(In millions, except per share data)
|
Three Months Ended
September 30, |
Nine Months Ended
September 30, |
|||||||||||||||
|
|
2018
|
2017
|
2018
|
2017
|
||||||||||||
|
|
(Unaudited)
|
(Unaudited)
|
||||||||||||||
|
Net sales
|
$
|
1,394.0
|
|
$
|
1,548.8
|
|
$
|
4,331.0
|
|
$
|
4,607.2
|
|
||||
|
Cost of sales
|
1,166.5
|
|
1,289.1
|
|
3,635.8
|
|
3,784.5
|
|
||||||||
|
Gross profit
|
227.5
|
|
|
259.7
|
|
|
695.2
|
|
|
822.7
|
|
|||||
|
Operating expenses:
|
||||||||||||||||
|
Selling and distribution
|
85.4
|
|
95.6
|
|
285.5
|
|
295.0
|
|
||||||||
|
General and administrative
|
66.5
|
|
66.9
|
|
220.5
|
|
228.9
|
|
||||||||
|
Amortization expense
|
21.4
|
|
28.5
|
|
64.9
|
|
85.8
|
|
||||||||
|
Other operating expense, net
|
23.3
|
|
11.1
|
|
98.9
|
|
111.9
|
|
||||||||
|
Total operating expenses
|
196.6
|
|
|
202.1
|
|
|
669.8
|
|
|
721.6
|
|
|||||
|
Operating income
|
30.9
|
|
|
57.6
|
|
|
25.4
|
|
|
101.1
|
|
|||||
|
Other expense:
|
||||||||||||||||
|
Interest expense
|
27.8
|
|
31.4
|
|
87.6
|
|
92.9
|
|
||||||||
|
Interest income
|
(1.3
|
)
|
(0.4
|
)
|
(3.8
|
)
|
(3.5
|
)
|
||||||||
|
Loss (income) on foreign currency exchange
|
0.6
|
|
(2.5
|
)
|
5.0
|
|
(2.8
|
)
|
||||||||
|
Other expense (income), net
|
3.6
|
|
(1.0
|
)
|
6.5
|
|
0.7
|
|
||||||||
|
Total other expense
|
30.7
|
|
|
27.5
|
|
|
95.3
|
|
|
87.3
|
|
|||||
|
Income (loss) before income taxes
|
0.2
|
|
30.1
|
|
(69.9
|
)
|
13.8
|
|
||||||||
|
Income tax (benefit) expense
|
(5.2
|
)
|
1.3
|
|
(21.1
|
)
|
(9.0
|
)
|
||||||||
|
Net income (loss)
|
$
|
5.4
|
|
|
$
|
28.8
|
|
|
$
|
(48.8
|
)
|
|
$
|
22.8
|
|
|
|
Net earnings (loss) per common share:
|
||||||||||||||||
|
Basic
|
$
|
0.10
|
|
$
|
0.50
|
|
$
|
(0.87
|
)
|
$
|
0.40
|
|
||||
|
Diluted
|
$
|
0.10
|
|
$
|
0.50
|
|
$
|
(0.87
|
)
|
$
|
0.40
|
|
||||
|
Weighted average common shares:
|
||||||||||||||||
|
Basic
|
56.3
|
|
57.3
|
|
56.4
|
|
57.1
|
|
||||||||
|
Diluted
|
56.7
|
|
57.7
|
|
56.4
|
|
57.7
|
|
||||||||
See Notes to Condensed Consolidated Financial Statements.
4
TREEHOUSE FOODS, INC.
CONDENSED CONSOLIDATED STATEMENTS OF COMPREHENSIVE INCOME (LOSS)
(In millions)
|
Three Months Ended
September 30, |
Nine Months Ended
September 30, |
|||||||||||||||
|
|
2018
|
2017
|
2018
|
2017
|
||||||||||||
|
|
(Unaudited)
|
(Unaudited)
|
||||||||||||||
|
Net income (loss)
|
$
|
5.4
|
|
$
|
28.8
|
|
$
|
(48.8
|
)
|
$
|
22.8
|
|
||||
|
Other comprehensive income (loss):
|
||||||||||||||||
|
Foreign currency translation adjustments (1)
|
6.5
|
|
18.0
|
|
(13.0
|
)
|
34.5
|
|
||||||||
|
Pension and postretirement reclassification adjustment (2)
|
0.1
|
|
0.1
|
|
0.4
|
|
7.2
|
|
||||||||
|
Adoption of ASU 2018-02 reclassification to retained earnings
|
—
|
|
—
|
|
(1.1
|
)
|
—
|
|
||||||||
|
Other comprehensive income (loss)
|
6.6
|
|
18.1
|
|
(13.7
|
)
|
41.7
|
|
||||||||
|
Comprehensive income (loss)
|
$
|
12.0
|
|
|
$
|
46.9
|
|
|
$
|
(62.5
|
)
|
|
$
|
64.5
|
|
|
|
(1)
|
Net of tax of
$(0.1) million
and
$0.1 million
for the
three and nine
months ended
September 30, 2018
, respectively. There was no tax impact for the
three or nine
months ended
September 30, 2017
.
|
|
(2)
|
Net of tax of
$0.1 million
and
$0.1
million for the
three months ended September 30,
2018
and
2017
, respectively, and
$0.2 million
and
$4.4 million
for the
nine months ended September 30,
2018
and
2017
, respectively.
|
See Notes to Condensed Consolidated Financial Statements.
5
TREEHOUSE FOODS, INC.
(In millions)
|
Nine Months Ended
September 30, |
||||||||
|
2018
|
2017
|
|||||||
|
(Unaudited)
|
||||||||
|
Cash flows from operating activities:
|
||||||||
|
Net (loss) income
|
$
|
(48.8
|
)
|
$
|
22.8
|
|
||
|
Adjustments to reconcile net (loss) income to net cash provided by operating activities:
|
||||||||
|
Depreciation and amortization
|
193.7
|
|
213.2
|
|
||||
|
Stock-based compensation
|
28.2
|
|
25.2
|
|
||||
|
(Gain) loss on divestitures
|
(14.3
|
)
|
85.6
|
|
||||
|
Other
|
5.2
|
|
0.7
|
|
||||
|
Changes in operating assets and liabilities, net of effect of divestitures and acquisitions:
|
||||||||
|
Receivables
|
40.1
|
|
0.2
|
|
||||
|
Inventories
|
(85.2
|
)
|
(205.0
|
)
|
||||
|
Prepaid expenses and other assets
|
13.5
|
|
(39.2
|
)
|
||||
|
Accounts payable, accrued expenses, and other liabilities
|
138.1
|
|
159.9
|
|
||||
|
Net cash provided by operating activities
|
270.5
|
|
263.4
|
|
||||
|
Cash flows from investing activities:
|
||||||||
|
Additions to property, plant, and equipment
|
(116.7
|
)
|
(102.5
|
)
|
||||
|
Additions to intangible assets
|
(16.4
|
)
|
(18.6
|
)
|
||||
|
Proceeds from sale of fixed assets
|
4.7
|
|
7.2
|
|
||||
|
Proceeds from divestitures
|
30.8
|
|
19.3
|
|
||||
|
Other
|
(1.1
|
)
|
(1.0
|
)
|
||||
|
Net cash used in investing activities
|
(98.7
|
)
|
(95.6
|
)
|
||||
|
Cash flows from financing activities:
|
||||||||
|
Borrowings under Revolving Credit Facility
|
80.4
|
|
584.5
|
|
||||
|
Payments under Revolving Credit Facility
|
(80.4
|
)
|
(634.5
|
)
|
||||
|
Payments on capitalized lease obligations and other debt
|
(0.9
|
)
|
(2.3
|
)
|
||||
|
Payment of deferred financing costs
|
(2.4
|
)
|
—
|
|
||||
|
Payments on Term Loans
|
(10.5
|
)
|
(50.8
|
)
|
||||
|
Repurchases of 2022 Notes
|
(24.1
|
)
|
—
|
|
||||
|
Repurchases of 2024 Notes
|
(172.1
|
)
|
—
|
|
||||
|
Repurchases of common stock
|
(42.2
|
)
|
—
|
|
||||
|
Receipts related to stock-based award activities
|
4.7
|
|
11.1
|
|
||||
|
Payments related to stock-based award activities
|
(3.3
|
)
|
(6.7
|
)
|
||||
|
Net cash used in financing activities
|
(250.8
|
)
|
(98.7
|
)
|
||||
|
Effect of exchange rate changes on cash and cash equivalents
|
(1.0
|
)
|
0.7
|
|
||||
|
Net (decrease) increase in cash and cash equivalents
|
(80.0
|
)
|
69.8
|
|
||||
|
Cash and cash equivalents, beginning of period
|
132.8
|
|
62.1
|
|
||||
|
Cash and cash equivalents, end of period
|
$
|
52.8
|
|
$
|
131.9
|
|
||
6
|
Nine Months Ended
September 30, |
||||||||
|
2018
|
2017
|
|||||||
|
(Unaudited)
|
||||||||
|
Supplemental cash flow disclosures
|
||||||||
|
Interest paid
|
$
|
102.7
|
|
$
|
102.8
|
|
||
|
Net income taxes (refunded) paid
|
(4.3
|
)
|
25.8
|
|
||||
|
Non-cash investing activities:
|
||||||||
|
Accrued purchase of property and equipment
|
$
|
22.8
|
|
$
|
20.9
|
|
||
|
Accrued other intangible assets
|
8.0
|
|
3.8
|
|
||||
See Notes to Condensed Consolidated Financial Statements.
7
TREEHOUSE FOODS, INC.
NOTES TO CONDENSED CONSOLIDATED FINANCIAL STATEMENTS
As of and for the nine months ended September 30, 2018
(Unaudited)
1. BASIS OF PRESENTATION
The unaudited Condensed Consolidated Financial Statements included herein have been prepared by TreeHouse Foods, Inc. and its consolidated subsidiaries (the “Company,” “TreeHouse,” “we,” “us,” or “our”), pursuant to the rules and regulations of the Securities and Exchange Commission (“SEC”) applicable to quarterly reporting on Form 10-Q. In our opinion, these statements include all adjustments necessary for a fair presentation of the results of all interim periods reported herein. Certain information and footnote disclosures normally included in financial statements prepared in accordance with accounting principles generally accepted in the United States of America (“GAAP”) have been condensed or omitted as permitted by such rules and regulations. The Condensed Consolidated Financial Statements and related notes should be read in conjunction with the Consolidated Financial Statements and related notes included in the Company’s Annual Report on Form 10-K for the fiscal year ended
December 31, 2017
. Results of operations for interim periods are not necessarily indicative of annual results.
The preparation of our Condensed Consolidated Financial Statements in conformity with GAAP requires us to use our judgment to make estimates and assumptions that affect the reported amounts of assets and liabilities, and disclosures of contingent assets and liabilities at the date of the Condensed Consolidated Financial Statements, and the reported amounts of net sales and expenses during the reporting period. Actual results could differ from these estimates.
A detailed description of the Company’s significant accounting policies can be found in the Company’s Annual Report on Form 10-K for the fiscal year ended
December 31, 2017
.
2. RESTRUCTURING PROGRAMS
The Company’s restructuring and margin improvement activities are part of an enterprise-wide transformation to improve long-term profitability of the Company. These activities are aggregated into three categories: (1) TreeHouse 2020 – a long-term growth and margin improvement strategy; (2) Structure to Win – an operating expenses improvement program; and (3) other restructuring and plant closing costs (collectively the “Restructuring Programs”).
The costs by activity for the Restructuring Programs are outlined below:
|
|
Three Months Ended
September 30, |
Nine Months Ended
September 30, |
||||||||||||||
|
|
2018
|
2017
|
2018
|
2017
|
||||||||||||
|
|
(In millions)
|
|||||||||||||||
|
TreeHouse 2020
|
$
|
39.2
|
|
$
|
14.7
|
|
$
|
99.0
|
|
$
|
14.7
|
|
||||
|
Structure to Win
|
5.3
|
|
—
|
|
31.5
|
|
—
|
|
||||||||
|
Other restructuring and plant closing costs
|
1.0
|
|
6.0
|
|
4.2
|
|
24.8
|
|
||||||||
|
Total Restructuring Programs
|
$
|
45.5
|
|
$
|
20.7
|
|
$
|
134.7
|
|
$
|
39.5
|
|
||||
Expenses associated with these programs are recorded in Cost of sales, General and administrative, and Other operating expense, net in the Condensed Consolidated Statements of Operations. The Company does not allocate costs associated with Restructuring Programs to reportable segments when evaluating the performance of its segments. As a result, costs associated with Restructuring Programs are not presented by reportable segment. See
Note 18
for more information.
Below is a summary of costs by line item for the Restructuring Programs:
|
|
Three Months Ended
September 30, |
Nine Months Ended
September 30, |
||||||||||||||
|
|
2018
|
2017
|
2018
|
2017
|
||||||||||||
|
|
(In millions)
|
|||||||||||||||
|
Cost of sales
|
$
|
7.2
|
|
$
|
10.2
|
|
$
|
18.8
|
|
$
|
13.5
|
|
||||
|
General and administrative
|
1.0
|
|
—
|
|
3.3
|
|
—
|
|
||||||||
|
Other operating expense, net
|
37.3
|
|
10.5
|
|
112.6
|
|
26.0
|
|
||||||||
|
Total
|
$
|
45.5
|
|
$
|
20.7
|
|
$
|
134.7
|
|
$
|
39.5
|
|
||||
8
TREEHOUSE FOODS, INC.
NOTES TO CONDENSED CONSOLIDATED FINANCIAL STATEMENTS — (Continued)
The table below presents the activity of the liabilities associated with the Restructuring Programs as of
September 30, 2018
:
|
|
Severance
|
Multiemployer
Pension
Plan Withdrawal
|
Other Costs
|
Total Liabilities
|
||||||||||||
|
|
(In millions)
|
|||||||||||||||
|
Balance as of December 31, 2017
|
$
|
6.1
|
|
$
|
0.8
|
|
$
|
2.7
|
|
$
|
9.6
|
|
||||
|
Expenses recognized
|
17.8
|
|
—
|
|
2.4
|
|
20.2
|
|
||||||||
|
Cash payments
|
(11.2
|
)
|
(0.6
|
)
|
(2.7
|
)
|
(14.5
|
)
|
||||||||
|
Adjustments
|
—
|
|
—
|
|
(0.8
|
)
|
(0.8
|
)
|
||||||||
|
Balance as of September 30, 2018
|
$
|
12.7
|
|
$
|
0.2
|
|
$
|
1.6
|
|
$
|
14.5
|
|
||||
Liabilities recorded as of
September 30, 2018
associated with total exit cost reserves relate to severance, the partial withdrawal from a multiemployer pension plan, and lease termination costs. The severance and lease termination liabilities were included in Accrued expenses in the Condensed Consolidated Balance Sheets, while the multiemployer pension plan withdrawal liability was included in Other long-term liabilities in the Condensed Consolidated Balance Sheets.
(1) TreeHouse 2020
In the third quarter of 2017, the Company announced TreeHouse 2020, a program intended to accelerate long-term growth through optimization of our manufacturing network, transformation of our mixing centers and warehouse footprint, and leveraging of systems and processes to drive performance. The Company’s workstreams related to these activities and selling, general, and administrative cost reductions will increase our capacity utilization, expand operating margins, and streamline our plant structure to optimize our supply chain.
This program began in 2017 and will be executed through 2020.
In 2017, the Company announced the closure of the Brooklyn Park, Minnesota and Plymouth, Indiana facilities, as well as the downsizing of the Dothan, Alabama facility. In the first quarter of 2018, the Company announced the closure of the Company’s Visalia, California and Battle Creek, Michigan facilities.
All facilities have either closed or are successfully tracking toward their closure dates noted in the table below. The table below shows key information regarding the Company's announced plant closures, a component of the broader TreeHouse 2020 program:
|
Facility Location
|
Date of Closure
Announcement
|
Full Facility
Closure
|
Primary Products
Produced
|
Primary Segment(s)
Affected
|
Total
Costs to
Close
|
Total Cash
Costs to
Close
|
||||||||||
|
Dothan, Alabama
|
August 3, 2017
|
Partial closure completed in Q3 2018
|
Trail mix and snack nuts
|
Snacks
|
$
|
11.2
|
|
$
|
5.2
|
|
||||||
|
Brooklyn Park, Minnesota
|
August 3, 2017
|
Completed in Q4 2017
|
Dry dinners
|
Meals
|
19.5
|
|
12.2
|
|
||||||||
|
Plymouth, Indiana
|
August 3, 2017
|
Completed in Q4 2017
|
Pickles
|
Condiments
|
13.3
|
|
8.5
|
|
||||||||
|
Battle Creek, Michigan
|
January 31, 2018
|
Mid-2019
|
Ready-to-eat cereal
|
Meals
|
18.2
|
|
11.8
|
|
||||||||
|
Visalia, California
|
February 15, 2018
|
Q1 2019
|
Pretzels
|
Baked Goods
|
23.6
|
|
11.0
|
|
||||||||
|
$
|
85.8
|
|
$
|
48.7
|
|
|||||||||||
9
TREEHOUSE FOODS, INC.
NOTES TO CONDENSED CONSOLIDATED FINANCIAL STATEMENTS — (Continued)
During the third quarter of 2018, the Company announced the closure of its Omaha, Nebraska office by January 31, 2019. Estimated costs to close are approximately
$5.8 million
, of which
$4.3 million
is expected to be in cash.
Below is a summary of the overall TreeHouse 2020 program costs by type:
|
|
Three Months Ended September 30,
|
Nine Months Ended September 30,
|
Cumulative Costs
|
Total Expected
|
||||||||||||||||||||
|
|
2018
|
2017
|
2018
|
2017
|
To Date
|
Costs
|
||||||||||||||||||
|
|
(In millions)
|
|||||||||||||||||||||||
|
Asset-related
|
$
|
5.5
|
|
$
|
8.0
|
|
$
|
11.4
|
|
$
|
8.0
|
|
$
|
49.7
|
|
$
|
80.0
|
|
||||||
|
Employee-related
|
10.4
|
|
4.3
|
|
27.5
|
|
4.3
|
|
36.6
|
|
75.0
|
|
||||||||||||
|
Other costs
|
23.3
|
|
2.4
|
|
60.1
|
|
2.4
|
|
70.3
|
|
210.0
|
|
||||||||||||
|
Total
|
$
|
39.2
|
|
$
|
14.7
|
|
$
|
99.0
|
|
$
|
14.7
|
|
$
|
156.6
|
|
$
|
365.0
|
|
||||||
For the
three and nine
months ended
September 30, 2018
, asset-related costs primarily consisted of accelerated depreciation; employee-related costs primarily consisted of dedicated project employee cost and severance; and other costs primarily consisted of consulting costs. For the three and nine months ended September 30, 2017, asset-related costs primarily consisted of accelerated depreciation; employee-related costs primarily consisted of severance; and other costs primarily consisted of consulting costs. Asset-related costs are included in Cost of sales while employee-related and other costs are primarily included in Other operating expense, net of the Condensed Consolidated Statements of Operations.
(2) Structure to Win
In the first quarter of 2018, the Company announced an operating expenses improvement program (“Structure to Win”) designed to align our organization structure with strategic priorities. The program is intended to drive operational effectiveness, cost reduction, and position the Company for growth with a focus on a lean customer focused go-to-market team, centralized supply chain, and streamlined back office.
Below is a summary of costs by type associated with the Structure to Win program:
|
Three Months Ended
September 30, 2018 |
Nine Months Ended
September 30, 2018 |
Cumulative Costs
To Date
|
Total Full Year 2018 Expected
Costs
|
|||||||||||||
|
|
(In millions)
|
|||||||||||||||
|
Asset-related
|
$
|
—
|
|
$
|
2.2
|
|
$
|
2.2
|
|
$
|
2.2
|
|
||||
|
Employee-related
|
3.4
|
|
13.0
|
|
13.0
|
|
14.0
|
|
||||||||
|
Other costs
|
1.9
|
|
16.3
|
|
16.3
|
|
20.8
|
|
||||||||
|
Total
|
$
|
5.3
|
|
$
|
31.5
|
|
$
|
31.5
|
|
$
|
37.0
|
|
||||
For the three months ended
September 30, 2018
, employee-related costs primarily consisted of severance and other costs primarily consisted of consulting services. For the nine months ended September 30, 2018, asset-related costs primarily consisted of accelerated depreciation, employee-related costs primarily consisted of severance, and other costs primarily consisted of consulting services. Asset-related costs are included in General and administrative expense and the employee-related and other costs are included in Other operating expense, net of the Condensed Consolidated Statements of Operations. There were
no
costs related to this program during the
three and nine
months ended
September 30, 2017
.
(3) Other Restructuring and Plant Closing Costs
The Company continually analyzes its plant network to align operations with the current and future needs of its customers. Facility closure decisions are made when the Company identifies opportunities to lower production costs or eliminate excess manufacturing capacity while maintaining a competitive cost structure, service levels, and product quality. Expenses associated with facility closures are primarily aggregated in Other operating expense, net of the Condensed Consolidated Statements of Operations, with the exception of asset-related costs, which are recorded in Cost of sales. The key information regarding the Company’s announced facility closures is outlined in the table below.
10
TREEHOUSE FOODS, INC.
NOTES TO CONDENSED CONSOLIDATED FINANCIAL STATEMENTS — (Continued)
|
Facility Location
|
Date of Closure
Announcement
|
Full Facility
Closure
|
Primary Products
Produced
|
Primary Segment(s)
Affected
|
Total
Costs to
Close
|
Total
Cash
Costs to
Close
|
||||||||||
|
|
|
|
|
|
(In millions)
|
|||||||||||
|
City of Industry, California
|
November 18, 2015
|
Completed in Q3 2016
|
Liquid non-dairy creamer and refrigerated salad dressings
|
Beverages, Condiments
|
$
|
6.8
|
|
$
|
3.7
|
|
||||||
|
Ayer, Massachusetts
|
April 5, 2016
|
Completed in Q3 2017
|
Mayonnaise
|
Condiments
|
5.6
|
|
4.0
|
|
||||||||
|
Azusa, California
|
May 24, 2016
|
Completed in Q3 2017
|
Bars and fruit snacks
|
Snacks
|
21.8
|
|
17.1
|
|
||||||||
|
Ripon, Wisconsin
|
May 24, 2016
|
Completed in Q4 2016
|
Sugar wafer cookies
|
Baked Goods
|
0.8
|
|
1.0
|
|
||||||||
|
Delta, British Columbia
|
November 3, 2016
|
Completed in Q1 2018
|
Frozen griddle products
|
Baked Goods
|
3.7
|
|
2.7
|
|
||||||||
|
Battle Creek, Michigan
|
November 3, 2016
|
(1)
|
Ready-to-eat cereal
|
Meals
|
10.4
|
|
2.2
|
|
||||||||
|
$
|
49.1
|
|
$
|
30.7
|
|
|||||||||||
|
(1)
|
The downsizing of this facility began in January 2017. On January 31, 2018, the Company announced the full closure of this facility, with a targeted completion date of mid-2019. The costs associated with the full closure are included in the TreeHouse 2020 section of this footnote.
|
Below is a summary of costs by type associated with the other restructuring and plant closing costs:
|
|
Three Months Ended September 30,
|
Nine Months Ended September 30,
|
Cumulative Costs
|
Total Expected
|
||||||||||||||||||||
|
|
2018
|
2017
|
2018
|
2017
|
To Date
|
Costs
|
||||||||||||||||||
|
|
(In millions)
|
|||||||||||||||||||||||
|
Asset-related
|
$
|
0.1
|
|
$
|
0.8
|
|
$
|
1.4
|
|
$
|
4.3
|
|
$
|
18.4
|
|
$
|
18.5
|
|
||||||
|
Employee-related
|
—
|
|
0.2
|
|
—
|
|
2.9
|
|
10.5
|
|
11.3
|
|
||||||||||||
|
Other costs
|
0.3
|
|
1.9
|
|
0.3
|
|
12.2
|
|
18.9
|
|
19.3
|
|
||||||||||||
|
Total
|
$
|
0.4
|
|
$
|
2.9
|
|
$
|
1.7
|
|
$
|
19.4
|
|
$
|
47.8
|
|
$
|
49.1
|
|
||||||
For the three and nine months ended
September 30, 2018
, asset-related costs primarily consisted of inventory dispositions. For the three and nine months ended September 30, 2017, asset-related costs consisted of accelerated depreciation; employee-related costs primarily consisted of severance; and other costs primarily consisted of third-party costs. Asset-related costs are included in Cost of sales and employee-related and other closure costs are recorded in Other operating expense, net in the Condensed Consolidated Statements of Operations.
Other cost reduction activities not related to our plant closings above totaled
$0.6 million
and
$2.5 million
, respectively, for the
three and nine
months ended
September 30, 2018
and were primarily the result of a Private Brands plant closure initiated prior to TreeHouse’s acquisition and severance-related costs. Other cost reduction activities were
$3.1 million
and
$5.4 million
for the
three and nine
months ended
September 30, 2017
, respectively.
3. REVENUE RECOGNITION
On January 1, 2018, we adopted ASU No. 2014-09,
Revenue from Contracts with Customers
(“Topic 606”) using the modified retrospective method. See
Note 19
for additional information. As a result of the adoption of Topic 606, we have updated our accounting policy for revenue recognition as follows:
Nature of Products
We manufacture and sell the following:
|
•
|
private label products to retailers, such as supermarkets, mass merchandisers, and specialty retailers, for resale under the retailers’ own or controlled labels;
|
11
TREEHOUSE FOODS, INC.
NOTES TO CONDENSED CONSOLIDATED FINANCIAL STATEMENTS — (Continued)
|
•
|
private label and branded products to the foodservice industry, including foodservice distributors and national restaurant operators;
|
|
•
|
branded products under our own proprietary brands, primarily on a regional basis to retailers;
|
|
•
|
branded products under co-pack agreements to other major branded companies for their distributions; and
|
|
•
|
products to our industrial customer base for repackaging in portion control packages and for use as ingredients by other food manufacturers.
|
Disaggregation of Revenue
Segment revenue disaggregated by product category groups are as follows:
|
Three Months Ended
September 30, |
Nine Months Ended
September 30, |
|||||||||||||||
|
|
2018
|
2017
|
2018
|
2017
|
||||||||||||
|
|
(In millions)
|
(In millions)
|
||||||||||||||
|
Retail bakery
|
$
|
161.6
|
|
$
|
169.4
|
|
$
|
488.5
|
|
$
|
514.0
|
|
||||
|
Baked products
|
171.2
|
|
181.8
|
|
509.4
|
|
502.6
|
|
||||||||
|
Total Baked Goods
|
332.8
|
|
351.2
|
|
997.9
|
|
1,016.6
|
|
||||||||
|
Beverages
|
166.8
|
|
168.1
|
|
503.5
|
|
518.9
|
|
||||||||
|
Beverage enhancers
|
69.5
|
|
76.8
|
|
218.3
|
|
240.2
|
|
||||||||
|
Total Beverages
|
236.3
|
|
244.9
|
|
721.8
|
|
759.1
|
|
||||||||
|
Dressings and sauces
|
240.0
|
|
250.4
|
|
735.0
|
|
738.6
|
|
||||||||
|
Pickles
|
77.1
|
|
83.4
|
|
233.4
|
|
250.2
|
|
||||||||
|
Total Condiments
|
317.1
|
|
333.8
|
|
968.4
|
|
988.8
|
|
||||||||
|
Pasta and dry dinners
|
129.6
|
|
147.8
|
|
400.6
|
|
420.6
|
|
||||||||
|
Cereals and other meals (1)
|
124.1
|
|
136.8
|
|
376.6
|
|
476.4
|
|
||||||||
|
Total Meals
|
253.7
|
|
284.6
|
|
777.2
|
|
897.0
|
|
||||||||
|
Snack nuts
|
171.0
|
|
224.9
|
|
568.2
|
|
608.1
|
|
||||||||
|
Trail mix and bars
|
83.1
|
|
107.7
|
|
297.5
|
|
332.1
|
|
||||||||
|
Total Snacks
|
254.1
|
|
332.6
|
|
865.7
|
|
940.2
|
|
||||||||
|
Unallocated net sales (2)
|
—
|
|
1.7
|
|
—
|
|
5.5
|
|
||||||||
|
Total net sales
|
$
|
1,394.0
|
|
|
$
|
1,548.8
|
|
|
$
|
4,331.0
|
|
|
$
|
4,607.2
|
|
|
|
(1)
|
On May 22, 2017, the Company sold the soup and infant feeding business (“SIF”). Included within this category was
$59.5 million
of SIF related sales for the nine months ended
September 30, 2017
. No amounts were included for the three months ended September 30, 2017.
|
|
(2)
|
Represents product recall reimbursements that were received during the
three and nine
months ended
September 30, 2017
.
|
When Performance Obligations Are Satisfied
A performance obligation is a promise in a contract to transfer a distinct good or service to the customer and is the unit of account for revenue recognition. A contract’s transaction price is allocated to each distinct performance obligation and recognized as revenue when, or as, the performance obligation is satisfied.
The Company’s performance obligations are food and beverage products.
Revenue recognition is completed on a point in time basis when product control is transferred to the customer. In general, control transfers to the customer when the product is shipped or delivered to the customer based upon applicable shipping terms, as the customer can direct the use and obtain substantially all of the remaining benefits from the asset at this point in time.
Customer contracts generally do not include more than one performance obligation. When a contract does contain more than one performance obligation, we allocate the contract’s transaction price to each performance obligation based on its relative standalone selling price. The standalone selling price for each distinct good is generally determined by directly observable data.
12
TREEHOUSE FOODS, INC.
NOTES TO CONDENSED CONSOLIDATED FINANCIAL STATEMENTS — (Continued)
The performance obligations in our contracts are satisfied within
one year
. As such, we have not disclosed the transaction price allocated to remaining performance obligations as of
September 30, 2018
.
Significant Payment Terms
Our customer contracts identify the product, quantity, price, payment, and final delivery terms. Payment terms usually include early pay discounts. We grant payment terms consistent with industry standards. Although some payment terms may be more extended, no terms beyond one year are granted at contract inception. As a result, we do not adjust the promised amount of consideration for the effects of a significant financing component because the period between our transfer of a promised good or service to a customer and the customer’s payment for that good or service will be one year or less.
Shipping
Shipping and handling costs associated with outbound freight are included within Selling and distribution expenses and are accounted for as a fulfillment cost as incurred, including shipping and handling costs after control over a product has transferred to a customer.
Variable Consideration
In addition to fixed contract consideration, most contracts include some form of variable consideration.
The most common forms of variable consideration include discounts, rebates, and sales returns and allowances. Variable consideration is treated as a reduction in revenue when product revenue is recognized. Depending on the specific type of variable consideration, we use either the expected value or most likely amount method to determine the variable consideration. We believe there will not be significant changes to our estimates of variable consideration when any related uncertainties are resolved with our customers. The Company reviews and updates its estimates and related accruals of variable consideration each period based on the terms of the agreements, historical experience, and any recent changes in the market. Any uncertainties in the ultimate resolution of variable consideration due to factors outside of the Company’s influence are typically resolved within a short timeframe therefore not requiring any additional constraint on the variable consideration.
Warranties & Returns
TreeHouse provides all customers with a standard or assurance type warranty. Either stated or implied, the Company provides assurance the related products will comply with all agreed-upon specifications and other warranties provided under the law. No services beyond an assurance warranty are provided to customers.
The Company does not grant a general right of return. However, customers may return defective or non-conforming products. Customer remedies may include either a cash refund or an exchange of the product. As a result, the right of return and related refund liability is estimated and recorded as a reduction in revenue. This return estimate is reviewed and updated each period and is based on historical sales and return experience.
Contract Balances
Contract asset and liability balances as of
September 30, 2018
are immaterial. The Company does not have significant deferred revenue or unbilled receivable balances arising from transactions with customers.
Contract Costs
We have identified certain incremental costs to obtain a contract, primarily sales commissions, requiring capitalization under Topic 606. The Company continues to expense these costs as incurred because the amortization period for the costs would be one year or less. The Company does not incur significant fulfillment costs requiring capitalization.
Impact of Adoption
The Company adopted Topic 606 on a modified retrospective basis on January 1, 2018. As a result of adoption, the Company reclassified
$51.0 million
of certain customer liabilities related to customer trade promotional activity from Receivables, net to
13
TREEHOUSE FOODS, INC.
NOTES TO CONDENSED CONSOLIDATED FINANCIAL STATEMENTS — (Continued)
Accrued expenses during the first quarter of 2018. There were no material impacts to the Condensed Consolidated Statements of Operations or the Condensed Consolidated Statements of Cash Flows upon adoption.
4. RECEIVABLES SALES AGREEMENT
In December 2017, the Company entered into an agreement (the “Receivables Sales Agreement”), to sell, on a revolving basis, certain trade accounts receivable balances to an unrelated third-party financial institution. Transfers under this agreement are accounted for as sales of receivables resulting in the receivables being de-recognized from the Condensed Consolidated Balance Sheet. The Receivables Sales Agreement provides for the sale of certain receivables on a revolving basis until terminated by either party. On September 28, 2018, the Company entered into an Amendment to the Receivables Sales Agreement, increasing the maximum receivables that may be sold at any time from
$200.0 million
to
$300.0 million
.
The outstanding amount of accounts receivable sold under the Receivables Sales Agreement were
$200.0 million
and
$74.6 million
as of
September 30, 2018
and
December 31, 2017
, respectively. The proceeds from these sales of receivables are included within the change in receivables in the operating activities section of the Condensed Consolidated Statements of Cash Flows. The recorded loss on sale of receivables is
$1.0 million
and
$2.3 million
for the
three and nine
months ended
September 30, 2018
, respectively, and is included in
Other expense (income), net
in the Condensed Consolidated Statements of Operations.
The Company has
no
retained interest in the receivables sold under the program above; however, the Company does have collection and administrative responsibilities for the sold receivables. The Company has not recorded any servicing assets or liabilities as of
September 30, 2018
, as the fair value of the servicing arrangement as well as the fees earned were not material to the financial statements.
5. INVENTORIES
|
September 30, 2018
|
December 31, 2017
|
|||||||
|
|
(In millions)
|
|||||||
|
Raw materials and supplies
|
$
|
495.3
|
|
$
|
416.5
|
|
||
|
Finished goods
|
529.9
|
|
530.0
|
|
||||
|
LIFO reserve
|
(25.9
|
)
|
(28.2
|
)
|
||||
|
Total inventories
|
$
|
999.3
|
|
$
|
918.3
|
|
||
Inventory is generally accounted for under the first-in, first-out (“FIFO”) method and a portion was accounted for under the last-in, first-out (“LIFO”) method. Approximately
$75.1 million
and
$92.9 million
of our inventory was accounted for under the LIFO method of accounting at
September 30, 2018
and
December 31, 2017
, respectively. In the first quarter of 2018, the Company changed the inventory costing methodology for a portion of the Snacks segment from weighted average cost to FIFO. The FIFO costing method was preferable to the prior method used as it aligns all of the Snacks inventory costing with the majority of the Company, allows for more accurate matching of revenues and expenses, and is a more common industry practice. The change in costing methodology was not material to the presented periods. As such, prior period information was not retrospectively revised, and the impact of the change was recorded in the period ended March 31, 2018.
Due in part to the closure of the Plymouth, Indiana pickle facility and lower overall inventory levels, the Company has reduced the quantity of LIFO inventory on hand during 2018, resulting in a liquidation of inventory carried at lower costs from prior years. The LIFO liquidation resulted in a reduction to Cost of sales of
$4.2 million
during the third quarter of 2018. There were no LIFO liquidations during the three or nine months ended September 30, 2017.
14
TREEHOUSE FOODS, INC.
NOTES TO CONDENSED CONSOLIDATED FINANCIAL STATEMENTS — (Continued)
6. GOODWILL AND INTANGIBLE ASSETS
|
Baked
Goods
|
Beverages
|
Condiments
|
Meals
|
Snacks
|
Total
|
|||||||||||||||||||
|
|
(In millions)
|
|||||||||||||||||||||||
|
Goodwill
|
$
|
555.6
|
|
$
|
716.7
|
|
$
|
449.5
|
|
$
|
471.7
|
|
$
|
609.8
|
|
$
|
2,803.3
|
|
||||||
|
Accumulated impairment losses
|
—
|
|
—
|
|
(11.5
|
)
|
—
|
|
(609.8
|
)
|
(621.3
|
)
|
||||||||||||
|
Balance at January 1, 2018
|
555.6
|
|
716.7
|
|
438.0
|
|
471.7
|
|
—
|
|
2,182.0
|
|
||||||||||||
|
Foreign currency exchange adjustments
|
—
|
|
(1.4
|
)
|
(2.0
|
)
|
—
|
|
—
|
|
(3.4
|
)
|
||||||||||||
|
Divestiture
|
—
|
|
—
|
|
—
|
|
(10.6
|
)
|
—
|
|
(10.6
|
)
|
||||||||||||
|
Balance at September 30, 2018
|
$
|
555.6
|
|
$
|
715.3
|
|
$
|
436.0
|
|
$
|
461.1
|
|
$
|
—
|
|
|
$
|
2,168.0
|
|
|||||
Indefinite Lived Intangible Assets
The carrying amounts of our intangible assets with indefinite lives, other than goodwill, as of
September 30, 2018
and
December 31, 2017
are as follows:
|
|
September 30, 2018
|
December 31, 2017
|
||||||
|
|
(In millions)
|
|||||||
|
Trademarks
|
$
|
22.2
|
|
$
|
22.8
|
|
||
|
Total indefinite lived intangibles
|
$
|
22.2
|
|
$
|
22.8
|
|
||
The decrease in the indefinite lived intangibles balance is due to foreign currency translation.
Finite Lived Intangible Assets
The gross carrying amounts and accumulated amortization of intangible assets with finite lives as of
September 30, 2018
and
December 31, 2017
are as follows:
|
|
September 30, 2018
|
December 31, 2017
|
||||||||||||||||||||||||||
|
Gross
Carrying
Amount
|
Accumulated
Amortization
|
Net
Carrying
Amount
|
Gross
Carrying
Amount
|
Accumulated
Amortization
|
Impairment
Losses
|
Net
Carrying
Amount
|
||||||||||||||||||||||
|
|
(In millions)
|
|||||||||||||||||||||||||||
|
Intangible assets with finite lives:
|
|
|
|
|
|
|
|
|
|
|
|
|
|
|
||||||||||||||
|
Customer-related
|
$
|
961.7
|
|
$
|
(376.9
|
)
|
$
|
584.8
|
|
$
|
1,265.4
|
|
$
|
(361.4
|
)
|
$
|
(273.3
|
)
|
$
|
630.7
|
|
|||||||
|
Contractual agreements
|
3.0
|
|
(3.0
|
)
|
—
|
|
3.0
|
|
(3.0
|
)
|
—
|
|
—
|
|
||||||||||||||
|
Trademarks
|
59.4
|
|
(26.8
|
)
|
32.6
|
|
69.6
|
|
(28.7
|
)
|
—
|
|
40.9
|
|
||||||||||||||
|
Formulas/recipes
|
33.8
|
|
(22.2
|
)
|
11.6
|
|
33.8
|
|
(18.3
|
)
|
—
|
|
15.5
|
|
||||||||||||||
|
Computer software
|
151.2
|
|
(80.1
|
)
|
71.1
|
|
137.8
|
|
(74.7
|
)
|
—
|
|
63.1
|
|
||||||||||||||
|
Total finite lived intangibles
|
$
|
1,209.1
|
|
$
|
(509.0
|
)
|
$
|
700.1
|
|
$
|
1,509.6
|
|
|
$
|
(486.1
|
)
|
$
|
(273.3
|
)
|
$
|
750.2
|
|
||||||
Total intangible assets, excluding goodwill, as of
September 30, 2018
and
December 31, 2017
were
$722.3 million
and
$773.0 million
, respectively.
7. INCOME TAXES
Income taxes were recorded at an effective rate of
(2,600.0)%
and
30.2%
for the
three and nine
months ended
September 30, 2018
, respectively, compared to
4.3%
and
(65.2)%
for the
three and nine
months ended
September 30, 2017
, respectively. The income tax benefit in the third quarter of 2018 was primarily driven by the release of certain tax reserves related to statute expirations of
$6.7 million
. In tandem with recognizing the
$6.7 million
tax benefit, during the third quarter of 2018 the Company wrote off
$6.7 million
of related tax indemnification asset, which was reflected in Other expense (income), net in the
15
TREEHOUSE FOODS, INC.
NOTES TO CONDENSED CONSOLIDATED FINANCIAL STATEMENTS — (Continued)
Condensed Consolidated Statements of Operations. The change in the effective tax rates for the
three and nine
months ended
September 30, 2018
compared to
2017
are primarily a result of the reduction in the U.S. Federal statutory tax rate, an increase in the amount of income tax benefit from the release of tax reserves, a decrease in the tax deduction related to share–based payments, a reduction in the benefit from foreign tax credits on a year–over–year basis, and the overall impact of discrete items on low third quarter income before income taxes. Our effective tax rate may change from period to period based on recurring and non-recurring factors including the jurisdictional mix of earnings, enacted tax legislation, state income taxes, settlement of tax audits, and the expiration of the statute of limitations in relation to unrecognized tax benefits.
The Company’s effective tax rate differs from the U.S. federal statutory tax rate primarily due to state tax expense, the impact of stock compensation expense that is not deductible for tax purposes, and an intercompany financing structure entered into in conjunction with the E.D. Smith Foods, Ltd. (“E.D. Smith”) acquisition in 2007. In addition, the Company’s effective tax rate for the
nine
months ended
September 30, 2018
reflects a discrete expense with a rate impact of approximately
(2.4)%
attributable to the vesting and exercise of share-based awards.
The Internal Revenue Service (“IRS”) completed their examination of the TreeHouse Foods, Inc. & Subsidiaries’
2015
tax year, resulting in an insignificant impact to income tax expense during the first quarter of 2018. Our Canadian operations are under exam by the Canadian Revenue Agency (“CRA”) for tax years
2008
through
2015
. These examinations are expected to be completed in the fourth quarter of
2018
or
2019
. The Italian Agency of Revenue (“IAR”) is examining the
2007
through 2009 and
2013
tax years of our Italian operations. The IAR examinations are not expected to be completed prior to 2020 due to a backlog of appeals before the agency. The Company has examinations in process with various state taxing authorities, which are expected to be completed in 2018.
Management estimates that it is reasonably possible that the total amount of unrecognized tax benefits could decrease by as much as
$3.4 million
within the next 12 months, primarily as a result of the resolution of audits currently in progress and the lapsing of statutes of limitations. As much as
$0.8 million
of the
$3.4 million
could affect net income when settled.
Tax Reform
On December 22, 2017, the U.S. Tax Cuts and Jobs Act (the “Tax Act”) was enacted. The Tax Act made significant changes to the Internal Revenue Code, including, but not limited to, a corporate tax rate decrease from
35%
to
21%
, limitation of the tax deduction for interest expense to
30%
of adjusted earnings, the transition of U.S. international taxation from a worldwide tax system to a territorial system, allowing for the full expensing of certain qualified property and a one-time transition tax on the mandatory repatriation of cumulative foreign earnings.
The SEC issued Staff Accounting Bulletin No. 118 ("SAB 118") to address the application of US GAAP in situations where a registrant does not have the necessary information available, prepared, or analyzed (including computations) in reasonable detail to complete the accounting for certain income tax effects of the Tax Act. To the extent that a company’s accounting for the Tax Act is incomplete but it is able to provide a reasonable estimate, it must record a provisional amount in the financial statements. SAB 118 provides a measurement period that should not extend beyond one year from the Tax Act enactment date for companies to complete the accounting under ASC 740.
For the period ended
December 31, 2017
, the Company recorded a provisional net tax benefit of
$104.2 million
primarily consisting of (1) a
$108.4 million
benefit related to adjustments to our net deferred tax liability and (2) a
$9.6 million
expense related to the one-time transition tax on the mandatory deemed repatriation of cumulative foreign earnings. During the nine months ended September 30, 2018, the Company recorded a
$1.4 million
adjustment to its provisional tax benefit consisting of (1) a
$1.0 million
additional benefit related to adjustments to our net deferred tax liability and (2) a
$0.4 million
reduction to the expense related to the one-time transition tax.
The Tax Act also creates a new requirement that certain income (i.e., Global Intangible Low Taxed Income or “GILTI”) earned by controlled foreign corporations (“CFCs”) must be included currently in the gross income of the CFC’s U.S. shareholder. The FASB allows an entity to make an accounting policy election of either (1) treating taxes due of future U.S. inclusions in taxable income related to GILTI as a current-period expense when incurred or (2) factoring such amounts into the company’s measurement of deferred taxes. We continue to assess the impact of GILTI and have not yet made an accounting policy election.
As the Company has not completed its analysis of the impact of the Tax Act, the net tax benefit of
$105.6 million
remains provisional and is subject to change due to, among other things, additional analysis, changes in interpretations and assumptions
16
TREEHOUSE FOODS, INC.
NOTES TO CONDENSED CONSOLIDATED FINANCIAL STATEMENTS — (Continued)
the Company has made, and additional regulatory guidance that may be issued. We expect to complete our analysis within the one-year measurement period allowed by SAB 118.
|
September 30, 2018
|
December 31, 2017
|
|||||||
|
|
(In millions)
|
|||||||
|
Term Loan A
|
$
|
495.0
|
|
$
|
498.8
|
|
||
|
Term Loan A-1
|
891.0
|
|
897.8
|
|
||||
|
2022 Notes
|
375.9
|
|
400.0
|
|
||||
|
2024 Notes
|
602.9
|
|
775.0
|
|
||||
|
Other debt
|
2.6
|
|
3.1
|
|
||||
|
Total outstanding debt
|
2,367.4
|
|
2,574.6
|
|
||||
|
Deferred financing costs
|
(23.9
|
)
|
(28.8
|
)
|
||||
|
Less current portion
|
(10.4
|
)
|
(10.1
|
)
|
||||
|
Total long-term debt
|
$
|
2,333.1
|
|
$
|
2,535.7
|
|
||
During the three months ended September 30, 2018, the Company repurchased
$2.7 million
and
$53.3 million
of its 2022 Notes and 2024 Notes, respectively. The Company wrote off
$0.7 million
of debt issuance costs and recorded a loss on debt extinguishment of
$1.1 million
related to the repurchases, recorded within Interest expense and Other expense (income), net of the Condensed Consolidated Statements of Operations, respectively. During the nine months ended September 30, 2018, the Company repurchased
$24.1 million
and
$172.1 million
of its 2022 Notes and 2024 Notes, respectively. The Company wrote off
$2.4 million
of debt issuance costs and recorded a loss on debt extinguishment of
$4.2 million
related to the repurchases, recorded within
Interest expense
and
Other expense (income), net
of the Condensed Consolidated Statement of Operations, respectively. There were no amounts repurchased during the three or nine months ended September 30, 2017.
On December 1, 2017, the Company entered into the Second Amended and Restated Credit Agreement (the “Credit Agreement”) which amends, restates, and replaces the Company’s prior credit agreement, dated as of February 1, 2016 (as amended from time to time prior to February 1, 2016, the “Prior Credit Agreement”). As amended, the senior unsecured credit facility includes a revolving credit facility (the “Revolving Credit Facility” or the “Revolver”) and two term loans.
The Credit Agreement (1) extended the maturity dates of the Revolving Credit Facility, Term Loan A, and Term Loan A-1, (2) resized the Revolver from
$900 million
to
$750 million
, (3) consolidated three term loans into two, (4) improved pricing, and (5) modified the fee structure on the Revolving Credit Facility to now calculate based on the unused portion of the commitments under the Revolving Credit Facility rather than the total commitments under the Revolving Credit Facility.
On June 11, 2018, the Company entered into Amendment No. 1 (the “Amendment”) to the Credit Agreement. Under the Amendment, among other things,
(i) the leverage covenant threshold has increased through fiscal year 2019, (ii) the Company and the other loan parties secured the obligations with liens on substantially all of their personal property, and (iii) such liens will be released upon the Company’s leverage ratio being less than or equal to 4.00 to 1.00 no earlier than the fiscal quarter ended on December 31, 2019.
The material terms and conditions under the Credit Agreement are otherwise substantially consistent with those contained in the Credit Agreement prior to the Amendment. In connection with this Amendment,
$0.6 million
in lender fees will be amortized ratably through
January 31, 2025
and
$1.8 million
of fees will be amortized ratably through
February 1, 2023
.
The Company’s average interest rate on debt outstanding under its Credit Agreement for the
three months ended September 30, 2018
was
3.71%
. Including the impact of interest rate swap agreements in effect as of
September 30, 2018
, the average rate decreased to
3.28%
.
Revolving Credit Facility
— As of
September 30, 2018
, there were
$30.4 million
in letters of credit that were issued but undrawn, and
$719.6 million
of available credit under the
$750.0 million
Revolving Credit Facility. The Revolving Credit Facility matures on February 1, 2023.
17
TREEHOUSE FOODS, INC.
NOTES TO CONDENSED CONSOLIDATED FINANCIAL STATEMENTS — (Continued)
9. STOCKHOLDERS' EQUITY
Share Repurchase Authorization
On November 2, 2017, the Company announced that the Board of Directors adopted a stock repurchase program. The stock repurchase program authorizes the Company to repurchase up to
$400 million
of the Company’s common stock at any time, or from time to time. Any repurchases under the program may be made by means of open market transactions, negotiated block transactions, or otherwise, including pursuant to a repurchase plan administered in accordance with Rules 10b5-1 and 10b-18 under the Securities Exchange Act of 1934, as amended (the “Exchange Act”). The size and timing of any repurchases will depend on price, market and business conditions, and other factors. The Company is authorized to enter into an administrative repurchase plan for
$50 million
of the
$400 million
in fiscal 2018 and is also authorized to repurchase an additional
$100 million
per year outside the administrative repurchase plan (total annual cap of
$150 million
). Any shares repurchased will be held as treasury stock.
For the
nine months ended September 30, 2018
, the Company repurchased approximately
0.9 million
shares of common stock for a total of
$42.2 million
.
10. EARNINGS PER SHARE
The following table summarizes the effect of the share-based compensation awards on the weighted average number of shares outstanding used in calculating diluted earnings (loss) per share:
|
|
Three Months Ended
September 30, |
Nine Months Ended
September 30, |
||||||||||||||
|
|
2018
|
2017
|
2018
|
2017
|
||||||||||||
|
|
(In millions, except per share data)
|
|||||||||||||||
|
Net income (loss)
|
$
|
5.4
|
|
$
|
28.8
|
|
$
|
(48.8
|
)
|
$
|
22.8
|
|
||||
|
Weighted average common shares outstanding
|
56.3
|
|
57.3
|
|
56.4
|
|
57.1
|
|
||||||||
|
Assumed exercise/vesting of equity awards (1)
|
0.4
|
|
0.4
|
|
—
|
|
0.6
|
|
||||||||
|
Weighted average diluted common shares outstanding
|
56.7
|
|
57.7
|
|
56.4
|
|
57.7
|
|
||||||||
|
Net earnings (loss) per basic share
|
$
|
0.10
|
|
$
|
0.50
|
|
$
|
(0.87
|
)
|
$
|
0.40
|
|
||||
|
Net earnings (loss) per diluted share
|
$
|
0.10
|
|
$
|
0.50
|
|
$
|
(0.87
|
)
|
$
|
0.40
|
|
||||
|
(1)
|
Incremental shares from equity awards are computed using the treasury stock method. For the nine months ended
September 30, 2018
, the weighted average common shares outstanding is the same for both the computations of basic and diluted shares because the Company had a net loss for the period. Equity awards excluded from the Company's computation of diluted earnings per share because they were anti-dilutive, were
1.8 million
for both the
three and nine
months ended
September 30, 2018
, and
1.7 million
and
1.4 million
for the
three and nine
months ended
September 30, 2017
, respectively.
|
11. STOCK-BASED COMPENSATION
The Board of Directors adopted, and the Company’s stockholders approved, the “TreeHouse Foods, Inc. Equity and Incentive Plan” (the “Plan”). Under the Plan, the Compensation Committee may grant awards of various types of compensation, including stock options, restricted stock, restricted stock units, performance shares, performance units, other types of stock-based awards, and other cash-based compensation. The maximum number of shares available to be awarded under the Plan is approximately
16.1 million
, of which approximately
3.8 million
remain available at
September 30, 2018
.
Income (loss) before income taxes for the
three and nine
months ended
September 30, 2018
includes stock-based compensation expense of
$5.0 million
and
$28.2 million
, respectively. Stock-based compensation expense for the
three and nine
months ended
September 30, 2017
was
$6.6 million
and
$25.2 million
, respectively. The tax benefit recognized related to the compensation cost of these share-based awards was approximately
$1.3 million
and
$7.1 million
for the
three and nine
months
18
TREEHOUSE FOODS, INC.
NOTES TO CONDENSED CONSOLIDATED FINANCIAL STATEMENTS — (Continued)
ended
September 30, 2018
, respectively, and
$2.4 million
and
$9.3 million
for the
three and nine
months ended
September 30, 2017
, respectively.
In the first quarter of 2018, the Company entered into an amended employment agreement with our former Chief Executive Officer. The amended plan resulted in the modification of his outstanding equity awards by accelerating the vesting dates, changing outstanding performance units to vest at target, and extending the exercisability of options outstanding. Modification of the existing awards resulted in a charge of
$10.0 million
in the three months ended March 31, 2018. The impact of this modification on expense recognized for stock options, restricted stock units, and performance units was
$1.2 million
,
$3.8 million
, and
$5.0 million
, respectively.
Stock Options —
The following table summarizes stock option activity during the
nine
months ended
September 30, 2018
. Stock options generally vest in approximately three equal installments on each of the first three anniversaries of the grant date and expire
ten
years from the grant date.
|
Employee
Options
|
Weighted
Average
Exercise
Price
|
Weighted
Average
Remaining
Contractual
Term (yrs)
|
Aggregate
Intrinsic
Value
|
||||||||||
|
|
(In thousands)
|
|
|
(In millions)
|
|||||||||
|
Outstanding, at December 31, 2017
|
2,099
|
|
$
|
71.46
|
|
6.1
|
$
|
5.9
|
|
||||
|
Forfeited
|
(106
|
)
|
88.19
|
|
|||||||||
|
Exercised
|
(196
|
)
|
24.06
|
|
|||||||||
|
Expired
|
(39
|
)
|
84.72
|
|
|||||||||
|
Outstanding, at September 30, 2018
|
1,758
|
|
75.43
|
|
5.7
|
0.7
|
|
||||||
|
Vested/expected to vest, at September 30, 2018
|
1,727
|
|
75.27
|
|
5.6
|
0.7
|
|
||||||
|
Exercisable, at September 30, 2018
|
1,436
|
|
72.77
|
|
5.1
|
0.7
|
|
||||||
|
|
Three Months Ended
September 30, |
Nine Months Ended
September 30, |
||||||||||||||
|
|
2018
|
2017
|
2018
|
2017
|
||||||||||||
|
|
(In millions)
|
(In millions)
|
||||||||||||||
|
Compensation expense
|
$
|
0.8
|
|
$
|
2.3
|
|
$
|
4.9
|
|
$
|
6.8
|
|
||||
|
Intrinsic value of stock options exercised
|
—
|
|
0.9
|
|
3.8
|
|
11.0
|
|
||||||||
|
Tax benefit recognized from stock option exercises
|
0.1
|
|
0.4
|
|
0.7
|
|
4.2
|
|
||||||||
Future compensation costs related to unvested options totaled
$3.9 million
at
September 30, 2018
and will be recognized over the remaining vesting period of the grants, which averages
1.3 years
.
Restricted Stock Units
— Employee restricted stock unit awards generally vest based on the passage of time. These awards generally vest in approximately three equal installments on each of the first three anniversaries of the grant date. Director restricted stock units generally vest on the first anniversary of the grant date. Certain directors have deferred receipt of their awards until either their departure from the Board of Directors or a specified date. As of
September 30, 2018
, director restricted stock units that have been earned and deferred totaled
91,400
.
19
TREEHOUSE FOODS, INC.
NOTES TO CONDENSED CONSOLIDATED FINANCIAL STATEMENTS — (Continued)
The following table summarizes the restricted stock unit activity during the
nine
months ended
September 30, 2018
:
|
Employee
Restricted
Stock Units
|
Weighted
Average
Grant Date
Fair Value
|
Director
Restricted
Stock Units
|
Weighted
Average
Grant Date
Fair Value
|
|||||||||||
|
|
(In thousands)
|
|
(In thousands)
|
|
||||||||||
|
Outstanding, at December 31, 2017
|
547
|
|
$
|
85.41
|
|
117
|
|
$
|
60.21
|
|
||||
|
Granted
|
657
|
|
38.70
|
|
38
|
|
39.01
|
|
||||||
|
Vested
|
(209
|
)
|
86.68
|
|
(25
|
)
|
61.20
|
|
||||||
|
Forfeited
|
(139
|
)
|
65.92
|
|
(1
|
)
|
84.66
|
|
||||||
|
Outstanding, at September 30, 2018
|
856
|
|
52.39
|
|
129
|
|
53.75
|
|
||||||
|
|
Three Months Ended
September 30, |
Nine Months Ended
September 30, |
||||||||||||||
|
|
2018
|
2017
|
2018
|
2017
|
||||||||||||
|
|
(In millions)
|
(In millions)
|
||||||||||||||
|
Compensation expense
|
$
|
3.8
|
|
$
|
5.5
|
|
$
|
17.1
|
|
$
|
17.3
|
|
||||
|
Fair value of vested restricted stock units
|
0.8
|
|
0.7
|
|
10.7
|
|
13.7
|
|
||||||||
|
Tax benefit recognized from vested restricted stock units
|
0.2
|
|
0.3
|
|
2.3
|
|
5.0
|
|
||||||||
Future compensation costs related to restricted stock units are approximately
$24.7 million
as of
September 30, 2018
and will be recognized on a weighted average basis over the next
2.0 years
. The grant date fair value of the awards is equal to the Company’s closing stock price on the grant date.
Performance Units
— Performance unit awards are granted to certain members of management. These awards contain service and performance conditions. For each of the three performance periods, one-third of the units will accrue, multiplied by a predefined percentage between
0%
and
200%
, depending on the achievement of certain operating performance measures. Additionally, for the cumulative performance period, a number of units will accrue, equal to the number of units granted multiplied by a predefined percentage between
0%
and
200%
, depending on the achievement of certain operating performance measures, less any units previously accrued. Accrued units will be converted to stock or cash, at the discretion of the Compensation Committee, generally, on the third anniversary of the grant date. The Company intends to settle these awards in stock and has the shares available to do so. On June 26, 2018, based on the achievement of operating performance measures,
79,910
performance units were converted into
18,139
shares of common stock, or an average conversion of
0.23
shares for each performance unit.
The following table summarizes the performance unit activity during the
nine
months ended
September 30, 2018
:
|
Performance
Units
|
Weighted
Average
Grant Date
Fair Value
|
||||||
|
|
(In thousands)
|
|
|||||
|
Unvested, at December 31, 2017
|
264
|
|
$
|
86.13
|
|
||
|
Granted
|
141
|
|
38.27
|
|
|||
|
Vested
|
(18
|
)
|
76.30
|
|
|||
|
Forfeited
|
(74
|
)
|
78.89
|
|
|||
|
Unvested, at September 30, 2018
|
313
|
|
66.92
|
|
|||
20
TREEHOUSE FOODS, INC.
NOTES TO CONDENSED CONSOLIDATED FINANCIAL STATEMENTS — (Continued)
|
|
Three Months Ended
September 30, |
Nine Months Ended
September 30, |
||||||||||||||
|
|
2018
|
2017
|
2018
|
2017
|
||||||||||||
|
|
(In millions)
|
(In millions)
|
||||||||||||||
|
Compensation expense
|
$
|
0.4
|
|
$
|
(1.2
|
)
|
$
|
6.2
|
|
$
|
1.1
|
|
||||
|
Fair value of vested performance units
|
—
|
|
—
|
|
1.0
|
|
6.5
|
|
||||||||
|
Tax benefit recognized from performance units vested
|
—
|
|
—
|
|
0.1
|
|
2.5
|
|
||||||||
Future compensation costs related to the performance units are estimated to be approximately
$2.6 million
as of
September 30, 2018
and are expected to be recognized over the next
2.2 years
. The grant date fair value of the awards is equal to the Company’s closing stock price on the date of grant.
12. ACCUMULATED OTHER COMPREHENSIVE LOSS
Accumulated other comprehensive loss consists of the following components, all of which are net of tax:
|
Foreign
Currency
Translation (1)
|
Unrecognized
Pension and
Postretirement
Benefits (2)
|
Accumulated
Other
Comprehensive
Loss
|
||||||||||
|
|
(In millions)
|
|||||||||||
|
Balance at December 31, 2017
|
$
|
(57.2
|
)
|
$
|
(4.3
|
)
|
$
|
(61.5
|
)
|
|||
|
Other comprehensive loss
|
(13.0
|
)
|
—
|
|
(13.0
|
)
|
||||||
|
Reclassifications from accumulated other comprehensive loss
|
—
|
|
0.4
|
|
0.4
|
|
||||||
|
Reclassifications from accumulated other comprehensive loss - Adoption of ASU 2018-02
|
—
|
|
(1.1
|
)
|
(1.1
|
)
|
||||||
|
Other comprehensive loss
|
(13.0
|
)
|
(0.7
|
)
|
(13.7
|
)
|
||||||
|
Balance at September 30, 2018
|
$
|
(70.2
|
)
|
$
|
(5.0
|
)
|
$
|
(75.2
|
)
|
|||
|
Foreign
Currency
Translation (1)
|
Unrecognized
Pension and
Postretirement
Benefits (2)
|
Accumulated
Other
Comprehensive
Loss
|
||||||||||
|
|
(In millions)
|
|||||||||||
|
Balance at December 31, 2016
|
$
|
(89.4
|
)
|
$
|
(11.9
|
)
|
$
|
(101.3
|
)
|
|||
|
Other comprehensive income
|
34.5
|
|
—
|
|
34.5
|
|
||||||
|
Reclassifications from accumulated other comprehensive loss
|
—
|
|
7.2
|
|
7.2
|
|
||||||
|
Other comprehensive income
|
34.5
|
|
7.2
|
|
41.7
|
|
||||||
|
Balance at September 30, 2017
|
$
|
(54.9
|
)
|
$
|
(4.7
|
)
|
$
|
(59.6
|
)
|
|||
|
(1)
|
The foreign currency translation adjustment is presented net of tax of
$0.1 million
for the
nine
months ended
September 30, 2018
. There was
no
tax impact for the
nine
months ended
September 30, 2017
.
|
|
(2)
|
The unrecognized pension and postretirement benefits reclassification is presented net of tax of
$0.2 million
and
$4.4 million
for the
nine
months ended
September 30, 2018
and
2017
, respectively. Also included is a
$1.1 million
adjustment related to the adoption of ASU 2018-02 (see
Note 19
for more information).
|
21
TREEHOUSE FOODS, INC.
NOTES TO CONDENSED CONSOLIDATED FINANCIAL STATEMENTS — (Continued)
The Condensed Consolidated Statements of Operations lines impacted by reclassifications out of Accumulated other comprehensive loss are outlined below:
|
|
|
|
Affected line in
|
|||||||||||||||
|
Reclassifications from Accumulated
Other Comprehensive Loss
|
the Condensed Consolidated
Statements of Operations
|
|||||||||||||||||
|
|
Three Months Ended
September 30, |
Nine Months Ended
September 30, |
|
|||||||||||||||
|
|
2018
|
2017
|
2018
|
2017
|
|
|||||||||||||
|
|
(In millions)
|
(In millions)
|
|
|||||||||||||||
|
Amortization of defined benefit pension and postretirement items:
|
|
|
|
|
|
|
|
|
|
|||||||||
|
Prior service costs
|
$
|
0.1
|
|
$
|
—
|
|
$
|
0.2
|
|
$
|
0.1
|
|
Other expense (income), net
|
|||||
|
Unrecognized net loss
|
0.1
|
|
0.1
|
|
0.4
|
|
0.7
|
|
Other expense (income), net
|
|||||||||
|
Actuarial adjustment
|
—
|
|
—
|
|
—
|
|
2.1
|
|
(a)
|
|||||||||
|
Divestiture
|
—
|
|
—
|
|
—
|
|
8.7
|
|
Other operating expense, net
|
|||||||||
|
Total before tax
|
0.2
|
|
0.1
|
|
0.6
|
|
11.6
|
|
|
|||||||||
|
Income taxes
|
0.1
|
|
—
|
|
0.2
|
|
4.4
|
|
Income tax (benefit) expense
|
|||||||||
|
Adoption of ASU 2018-02
|
—
|
|
—
|
|
1.1
|
|
—
|
|
Income tax (benefit) expense
|
|||||||||
|
Net of tax
|
$
|
0.1
|
|
$
|
0.1
|
|
$
|
(0.7
|
)
|
$
|
7.2
|
|
|
|||||
|
(a)
|
Represents the actuarial adjustment that was recorded in conjunction with the divestiture of a pension plan and a postretirement benefit plan in the second quarter of 2017 due to the SIF business divestiture.
|
13. EMPLOYEE RETIREMENT AND POSTRETIREMENT BENEFITS
Pension, Profit Sharing, and Postretirement Benefits
— Certain employees and retirees participate in pension and other postretirement benefit plans. Employee benefit plan obligations and expenses included in the Condensed Consolidated Financial Statements are determined based on plan assumptions, employee demographic data, including years of service and compensation, benefits and claims paid, and employer contributions. In connection with the divestiture of the SIF business in the second quarter of
2017
, the Company divested a pension plan and a postretirement benefit plan. The net unfunded liability associated with these plans as of the closing date, which was included in
Other operating expense, net
of the Condensed Consolidated Statements of Operations, was
$10.5 million
for the nine months ended
September 30, 2017
.
Components of net periodic pension expense are as follows:
|
Three Months Ended
September 30, |
Nine Months Ended
September 30, |
|||||||||||||||
|
|
2018
|
2017
|
2018
|
2017
|
||||||||||||
|
|
(In millions)
|
(In millions)
|
||||||||||||||
|
Service cost
|
$
|
0.6
|
|
$
|
0.8
|
|
$
|
1.8
|
|
$
|
2.9
|
|
||||
|
Interest cost
|
3.0
|
|
3.6
|
|
8.9
|
|
11.4
|
|
||||||||
|
Expected return on plan assets
|
(4.1
|
)
|
(4.2
|
)
|
(12.2
|
)
|
(13.3
|
)
|
||||||||
|
Amortization of unrecognized prior service cost
|
0.1
|
|
—
|
|
0.2
|
|
0.1
|
|
||||||||
|
Amortization of unrecognized net loss
|
0.1
|
|
0.1
|
|
0.4
|
|
0.7
|
|
||||||||
|
Net periodic pension (benefit) cost
|
$
|
(0.3
|
)
|
$
|
0.3
|
|
$
|
(0.9
|
)
|
$
|
1.8
|
|
||||
The Company contributed
$1.7 million
to the pension plans during the first nine months of
2018
. The Company does not expect to make additional contributions to the plans in 2018.
22
TREEHOUSE FOODS, INC.
NOTES TO CONDENSED CONSOLIDATED FINANCIAL STATEMENTS — (Continued)
Components of net periodic postretirement expense are as follows:
|
Three Months Ended
September 30, |
Nine Months Ended
September 30, |
|||||||||||||||
|
|
2018
|
2017
|
2018
|
2017
|
||||||||||||
|
|
(In millions)
|
(In millions)
|
||||||||||||||
|
Interest cost
|
$
|
0.3
|
|
$
|
0.3
|
|
$
|
0.9
|
|
$
|
0.9
|
|
||||
|
Net periodic postretirement cost
|
$
|
0.3
|
|
$
|
0.3
|
|
$
|
0.9
|
|
$
|
0.9
|
|
||||
The Company expects to contribute approximately
$1.8 million
to the postretirement health plans during
2018
.
The service cost components of net periodic pension and postretirement costs were recorded in Cost of sales and the other components were recorded in
Other expense (income), net
of the Condensed Consolidated Statements of Operations.
14. OTHER OPERATING EXPENSE, NET
The Company incurred other operating expense for the
three and nine
months ended
September 30, 2018
and
2017
, which consisted of the following:
|
Three Months Ended
September 30, |
Nine Months Ended
September 30, |
|||||||||||||||
|
|
2018
|
2017
|
2018
|
2017
|
||||||||||||
|
|
(In millions)
|
(In millions)
|
||||||||||||||
|
Restructuring programs (1)
|
$
|
37.3
|
|
$
|
10.5
|
|
$
|
112.6
|
|
$
|
26.0
|
|
||||
|
(Gain) loss on divestitures (2)
|
(14.3
|
)
|
0.4
|
|
(14.3
|
)
|
85.6
|
|
||||||||
|
Other
|
0.3
|
|
0.2
|
|
0.6
|
|
0.3
|
|
||||||||
|
Total other operating expense, net
|
$
|
23.3
|
|
$
|
11.1
|
|
$
|
98.9
|
|
$
|
111.9
|
|
||||
|
(1)
|
See
Note 2
for more information.
|
|
(2)
|
On July 16, 2018, the Company completed the divestiture of its McCann's business. The McCann's business produced steel cut Irish oatmeal and was previously reported within the Meals segment. On May 22, 2017, the Company completed the divestiture of its SIF business. The SIF business produced private label condensed and ready-to-serve soup, baby food, and gravies for the Meals segment. Neither of these divestitures met the criteria to be presented as discontinued operations.
|
15. COMMITMENTS AND CONTINGENCIES
Litigation, Investigations, and Audits
— On November 16, 2016, a purported TreeHouse shareholder filed a class action captioned
Tarara v. TreeHouse Foods, Inc., et al.
, Case No. 1:16-cv-10632, in the United States District Court for the Northern District of Illinois against TreeHouse and certain of its officers. The complaint, amended on March 24, 2017, is purportedly brought on behalf of all purchasers of TreeHouse common stock from January 20, 2016 through and including November 2, 2016, asserts claims under Sections 10(b) and 20(a) of the Securities Exchange Act of 1934 and Rule 10b-5 promulgated thereunder and seeks, among other things, damages and costs and expenses. On December 22, 2016, another purported TreeHouse shareholder filed an action captioned
Wells v. Reed, et al.
, Case No. 2016-CH-16359, in the Circuit Court of Cook County, Illinois, against TreeHouse and certain of its officers. This complaint, purportedly brought derivatively on behalf of TreeHouse, asserts state law claims against certain officers for breach of fiduciary duty, unjust enrichment, and corporate waste. On February 7, 2017, another purported TreeHouse shareholder filed an action captioned
Lavin v. Reed
, Case No. 17-cv-01014, in the Northern District of Illinois, against TreeHouse and certain of its officers. This complaint, like
Wells
, is purportedly brought derivatively on behalf of TreeHouse, and it asserts state law claims against certain officers for breach of fiduciary duty, unjust enrichment, abuse of control, gross mismanagement, and corporate waste.
All three complaints make substantially similar allegations (though the amended complaint in
Tarara
now contains additional detail). Essentially, the complaints allege that TreeHouse, under the authority and control of the individual defendants: (i) made certain false and misleading statements regarding the Company’s business, operations, and future prospects; and (ii) failed to disclose that (a) the Company’s private label business was underperforming; (b) the Company’s Flagstone business was
23
TREEHOUSE FOODS, INC.
NOTES TO CONDENSED CONSOLIDATED FINANCIAL STATEMENTS — (Continued)
underperforming; (c) the Company’s acquisition strategy was underperforming; (d) the Company had overstated its full-year 2016 guidance; and (e) TreeHouse’s statements lacked reasonable basis. The complaints allege that these actions artificially inflated the market price of TreeHouse common stock during the class period, thus purportedly harming investors. We believe that these claims are without merit and intend to defend against them vigorously.
Since its initial docketing, the
Tarara
matter has been re-captioned as
Public Employees’ Retirement Systems of Mississippi v. TreeHouse Foods, Inc., et al.
, in accordance with the Court’s order appointing Public Employees’ Retirement Systems of Mississippi as the lead plaintiff. On May 26, 2017, the
Public Employees’
defendants filed a motion to dismiss, which the court denied on February 12, 2018. On April 12, 2018, the
Public Employees’
defendants filed their answer to the amended complaint. On April 23, 2018, the parties filed a joint status report with the Court, describing the nature of the case and issues involved, as well as setting forth a proposed discovery and briefing schedule for the Court’s consideration. On July 13, 2018, lead plaintiff filed a motion to certify the class, and defendants filed their response in opposition to the motion to certify the class on October 8, 2018. The motion to certify remains pending before the Court. The next status hearing is scheduled for December 20, 2018.
Additionally, due to the similarity of the complaints, the parties in
Wells
and
Lavin
have entered stipulations deferring the litigation until the earlier of (i) the court in
Public Employees’
entering an order resolving defendants’ anticipated motion to dismiss therein or (ii) plaintiffs’ counsel receiving notification of a settlement of
Public Employees’
or until otherwise agreed to by the parties. On September 27, 2018, the parties in
Wells
and
Lavin
filed joint motions for entry of agreed orders further deferring the matters in light of the
Public Employees’
Court’s denial of the motion to dismiss in February 2018. The
Wells
and
Lavin
Courts entered the agreed orders further deferring the matters on September 27, 2018 and October 10, 2018, respectively.
In
Lavin,
the parties filed a joint status report on the progress of the related litigation on October 26, 2017. The
Lavin
parties also filed additional status reports with the Court on March 12, 2018 and June 19, 2018.
There is no set status date in
Lavin
at this time. The next status date in
Wells
is set for January 7, 2019.
In addition, the Company is party in the ordinary course of business to certain claims, litigation, audits, and investigations. The Company will record an accrual for a loss contingency when it is probable that a loss has been incurred and the amount of the loss can be reasonably estimated. The Company believes it has established adequate accruals for liabilities that are probable and reasonably estimable that may be incurred in connection with any such currently pending or threatened matter, none of which are significant. In the Company’s opinion, the settlement of any such currently pending or threatened matter is not expected to have a material impact on the Company’s financial position, results of operations, or cash flows.
16. DERIVATIVE INSTRUMENTS
The Company is exposed to certain risks relating to its ongoing business operations. The primary risks managed by derivative instruments include interest rate risk, foreign currency risk, and commodity price risk. Derivative contracts are entered into for periods consistent with the related underlying exposure and do not constitute positions independent of those exposures. The Company does not enter into derivative instruments for trading or speculative purposes.
Interest Rate Risk -
The Company manages its exposure to changes in interest rates by optimizing the use of variable-rate and fixed-rate debt and by utilizing interest rate swaps to hedge our exposure to changes in interest rates, to reduce the volatility of our financing costs, and to achieve a desired proportion of fixed versus floating-rate debt, based on current and projected market conditions.
As of
September 30, 2018
, the Company had entered into
$2.1 billion
of long-term interest rate swap agreements to lock into a fixed LIBOR interest rate base. Under the terms of the agreements,
$2.1 billion
in variable-rate debt was swapped for a weighted average fixed interest rate base of approximately
2.22%
through
February 28, 2025
. These instruments are not accounted for under hedge accounting and the changes in their fair value are recorded in the Condensed Consolidated Statements of Operations.
Foreign Currency Risk
- Due to the Company’s foreign operations, we are exposed to foreign currency risk. The Company enters into foreign currency contracts to manage the risk associated with foreign currency cash flows. The Company’s objective in using foreign currency contracts is to establish a fixed foreign currency exchange rate for the net cash flow requirements for purchases that are denominated in U.S. dollars. These contracts do not qualify for hedge accounting and changes in their fair
24
TREEHOUSE FOODS, INC.
NOTES TO CONDENSED CONSOLIDATED FINANCIAL STATEMENTS — (Continued)
value are recorded in the Condensed Consolidated Statements of Operations. As of
September 30, 2018
, the Company had
$24.5 million
of U.S. dollar foreign currency contracts outstanding, expiring
throughout 2018 and 2019.
Commodity Risk
- Certain commodities we use in the production and distribution of our products are exposed to market price risk. The Company utilizes derivative contracts to manage this risk. The majority of commodity forward contracts are not derivatives, and those that are generally qualify for the normal purchases and normal sales scope exception under the guidance for derivative instruments and hedging activities and, therefore, are not subject to its provisions. For derivative commodity contracts that do not qualify for the normal purchases and normal sales scope exception, the Company records their fair value on the Condensed Consolidated Balance Sheets, with changes in value being recorded in the Condensed Consolidated Statements of Operations.
The Company’s derivative commodity contracts may include contracts for diesel, oil, plastics, natural gas, electricity, and other commodity contracts that do not meet the requirements for the normal purchases and normal sales scope exception.
Diesel contracts are used to manage the Company’s risk associated with the underlying cost of diesel fuel used to deliver products. Contracts for oil and plastics are used to manage the Company’s risk associated with the underlying commodity cost of a significant component used in packaging materials. Contracts for natural gas and electricity are used to manage the Company’s risk associated with the utility costs of its manufacturing facilities, and commodity contracts are used to manage the price risk associated with raw material costs. As of
September 30, 2018
, the Company had outstanding contracts for the purchase of
0.2 million
megawatts of electricity, expiring
throughout 2018, 2019, and 2020
;
4.5 million
gallons of diesel, expiring
throughout 2018
; and
3.9 million
dekatherms of natural gas, expiring
throughout 2018 and 2019
.
The following table identifies the derivative, its fair value, and location on the Condensed Consolidated Balance Sheets:
|
|
September 30, 2018
|
December 31, 2017
|
||||||||
|
Asset Derivatives
|
Balance Sheet Location
|
(In millions)
|
||||||||
|
Commodity contracts
|
Prepaid expenses and other current assets
|
$
|
1.3
|
|
$
|
2.7
|
|
|||
|
Foreign currency contracts
|
Prepaid expenses and other current assets
|
1.0
|
|
0.5
|
|
|||||
|
Interest rate swap agreements
|
Prepaid expenses and other current assets
|
17.6
|
|
11.9
|
|
|||||
|
|
|
$
|
19.9
|
|
$
|
15.1
|
|
|||
|
Liability Derivatives
|
|
|||||||||
|
Commodity contracts
|
Accrued expenses
|
$
|
0.2
|
|
$
|
1.2
|
|
|||
|
|
|
$
|
0.2
|
|
$
|
1.2
|
|
|||
25
TREEHOUSE FOODS, INC.
NOTES TO CONDENSED CONSOLIDATED FINANCIAL STATEMENTS — (Continued)
We recognized the following gains and losses on our derivative contracts in the Condensed Consolidated Statements of Operations:
|
Location of Gain (Loss)
|
Three Months Ended
September 30, |
Nine Months Ended
September 30, |
||||||||||||||||
|
|
Recognized in Net Income (Loss)
|
2018
|
2017
|
2018
|
2017
|
|||||||||||||
|
|
|
(In millions)
|
(In millions)
|
|||||||||||||||
|
Mark-to-market unrealized gain (loss)
|
|
|
|
|
|
|
|
|
||||||||||
|
Commodity contracts
|
Other expense (income), net
|
$
|
(0.5
|
)
|
$
|
2.6
|
|
$
|
(0.3
|
)
|
$
|
1.5
|
|
|||||
|
Foreign currency contracts
|
Other expense (income), net
|
(1.4
|
)
|
(0.5
|
)
|
0.5
|
|
(1.3
|
)
|
|||||||||
|
Interest rate swap agreements
|
Other expense (income), net
|
5.7
|
|
(0.3
|
)
|
5.6
|
|
(0.8
|
)
|
|||||||||
|
Total unrealized gain (loss)
|
|
3.8
|
|
1.8
|
|
5.8
|
|
(0.6
|
)
|
|||||||||
|
Realized gain (loss)
|
|
|||||||||||||||||
|
Commodity contracts
|
Manufacturing related to Cost of sales and transportation related to Selling and distribution
|
1.2
|
|
(0.2
|
)
|
4.1
|
|
(0.4
|
)
|
|||||||||
|
Foreign currency contracts
|
Cost of sales
|
0.4
|
|
(1.3
|
)
|
1.4
|
|
(0.1
|
)
|
|||||||||
|
Interest rate swap agreements
|
Interest expense
|
1.5
|
|
0.5
|
|
3.4
|
|
0.6
|
|
|||||||||
|
Total realized gain (loss)
|
|
3.1
|
|
(1.0
|
)
|
8.9
|
|
0.1
|
|
|||||||||
|
Total gain (loss)
|
|
$
|
6.9
|
|
$
|
0.8
|
|
$
|
14.7
|
|
$
|
(0.5
|
)
|
|||||
17. FAIR VALUE
The following table presents the carrying value and fair value of our financial instruments as of
September 30, 2018
and
December 31, 2017
:
|
|
September 30, 2018
|
December 31, 2017
|
|
||||||||||||||||
|
|
Carrying
Value
|
Fair
Value
|
Carrying
Value
|
Fair
Value
|
Level
|
||||||||||||||
|
|
(In millions)
|
(In millions)
|
|
||||||||||||||||
|
Liabilities not recorded at fair value:
|
|
|
|
|
|
|
|
|
|
|
|||||||||
|
Term Loan A
|
$
|
(495.0
|
)
|
$
|
(496.2
|
)
|
$
|
(498.8
|
)
|
$
|
(500.7
|
)
|
2
|
|
|||||
|
Term Loan A-1
|
(891.0
|
)
|
(892.3
|
)
|
(897.8
|
)
|
(900.0
|
)
|
2
|
|
|||||||||
|
2022 Notes
|
(375.9
|
)
|
(374.9
|
)
|
(400.0
|
)
|
(405.0
|
)
|
2
|
|
|||||||||
|
2024 Notes
|
(602.9
|
)
|
(617.2
|
)
|
(775.0
|
)
|
(806.0
|
)
|
2
|
|
|||||||||
|
Assets recorded on a recurring basis at fair value:
|
|||||||||||||||||||
|
Commodity contracts
|
$
|
1.1
|
|
$
|
1.1
|
|
$
|
1.5
|
|
$
|
1.5
|
|
2
|
|
|||||
|
Foreign currency contracts
|
1.0
|
|
1.0
|
|
0.5
|
|
0.5
|
|
2
|
|
|||||||||
|
Interest rate swap agreements
|
17.6
|
|
17.6
|
|
11.9
|
|
11.9
|
|
2
|
|
|||||||||
|
Investments
|
15.4
|
|
15.4
|
|
14.1
|
|
14.1
|
|
1
|
|
|||||||||
Cash and cash equivalents and accounts receivable are financial assets with carrying values that approximate fair value. Accounts payable are financial liabilities with carrying values that approximate fair value.
The fair values of Term Loan A, Term Loan A-1, 2022 Notes, 2024 Notes, commodity contracts, foreign currency contracts, and interest rate swap agreements are determined using Level 2 inputs. Level 2 inputs are inputs other than quoted market prices that are observable for an asset or liability, either directly or indirectly. The fair values of Term Loan A and Term Loan A-1 were estimated using present value techniques and market-based interest rates and credit spreads. The fair values of the Company’s 2022 Notes and 2024 Notes were estimated based on quoted market prices for similar instruments, where the inputs are considered Level 2, due to their infrequent trading volume. The fair values of the commodity contracts, foreign currency
26
TREEHOUSE FOODS, INC.
NOTES TO CONDENSED CONSOLIDATED FINANCIAL STATEMENTS — (Continued)
contracts, and interest rate swap agreements are based on an analysis comparing the contract rates to the market rates at the balance sheet date.
The fair value of the investments was determined using Level 1 inputs. Level 1 inputs are quoted prices in active markets for identical assets or liabilities that the reporting entity has the ability to access at the measurement dates.
18. SEGMENT INFORMATION
The Company manages operations on a company-wide basis, thereby making determinations as to the allocation of resources in total rather than on a segment-level basis. The Company has designated reportable segments based on how management views its business. The Company does not segregate assets between segments for internal reporting. Therefore, asset-related information has not been presented. The reportable segments, as presented below, are consistent with the manner in which the Company reports its results to the Chief Operating Decision Maker. Our segments are as follows:
Baked Goods
– Our Baked Goods segment sells candy; cookies; crackers; in-store bakery products; pita chips; pretzels; refrigerated dough; and retail griddle waffles, pancakes, and French toast.
Beverages
– Our Beverages segment sells broths; liquid non-dairy creamer; non-dairy powdered creamers; powdered drinks; single serve hot beverages; specialty teas, and sweeteners.
Condiments
– Our Condiments segment sells aseptic cheese and pudding products; jams, preserves, and jellies; mayonnaise; Mexican, barbeque, and other sauces; pickles and related products; refrigerated and shelf stable dressings and sauces; and table and flavored syrups.
Meals
– Our Meals segment sells baking and mix powders; powdered soups and gravies; macaroni and cheese; pasta; ready-to-eat and hot cereals; and skillet dinners. Condensed and ready to serve soup and infant feeding products were sold within the Meals segment through the divestiture of the SIF business on May 22, 2017.
Snacks
– Our Snacks segment sells bars; dried fruit; snack nuts; trail mixes; and other wholesome snacks.
The Company evaluates the performance of its segments based on net sales dollars and direct operating income. Direct operating income is defined as gross profit less freight out, sales commissions, and direct selling, general, and administrative expenses. The amounts in the following tables are obtained from reports used by senior management and do not include income taxes. Other expenses not allocated include unallocated selling, general, and administrative expenses, unallocated costs of sales, and unallocated corporate expenses (amortization expense and other operating expense). The accounting policies of the Company’s segments are the same as those described in the summary of significant accounting policies set forth in Note 1 to the Consolidated Financial Statements contained in our Annual Report on Form 10-K for the year ended
December 31, 2017
.
27
TREEHOUSE FOODS, INC.
NOTES TO CONDENSED CONSOLIDATED FINANCIAL STATEMENTS — (Continued)
Financial information relating to the Company’s reportable segments is as follows:
|
Three Months Ended
September 30, |
Nine Months Ended
September 30, |
|||||||||||||||
|
|
2018
|
2017
|
2018
|
2017
|
||||||||||||
|
|
(In millions)
|
(In millions)
|
||||||||||||||
|
Net sales to external customers:
|
|
|
|
|
|
|
|
|
||||||||
|
Baked Goods
|
$
|
332.8
|
|
$
|
351.2
|
|
$
|
997.9
|
|
$
|
1,016.6
|
|
||||
|
Beverages
|
236.3
|
|
244.9
|
|
721.8
|
|
759.1
|
|
||||||||
|
Condiments
|
317.1
|
|
333.8
|
|
968.4
|
|
988.8
|
|
||||||||
|
Meals
|
253.7
|
|
284.6
|
|
777.2
|
|
897.0
|
|
||||||||
|
Snacks
|
254.1
|
|
332.6
|
|
865.7
|
|
940.2
|
|
||||||||
|
Unallocated
|
—
|
|
1.7
|
|
—
|
|
5.5
|
|
||||||||
|
Total
|
$
|
1,394.0
|
|
$
|
1,548.8
|
|
$
|
4,331.0
|
|
$
|
4,607.2
|
|
||||
|
Direct operating income:
|
||||||||||||||||
|
Baked Goods
|
$
|
35.2
|
|
$
|
46.9
|
|
$
|
94.0
|
|
$
|
121.3
|
|
||||
|
Beverages
|
44.1
|
|
51.7
|
|
129.3
|
|
170.7
|
|
||||||||
|
Condiments
|
49.4
|
|
34.4
|
|
112.7
|
|
102.2
|
|
||||||||
|
Meals
|
29.8
|
|
32.1
|
|
88.1
|
|
99.9
|
|
||||||||
|
Snacks
|
(3.8
|
)
|
1.8
|
|
7.2
|
|
24.4
|
|
||||||||
|
Total
|
154.7
|
|
166.9
|
|
431.3
|
|
518.5
|
|
||||||||
|
Unallocated selling, general, and administrative expenses
|
(64.2
|
)
|
(66.0
|
)
|
(219.4
|
)
|
(228.1
|
)
|
||||||||
|
Unallocated cost of sales (1)
|
(14.9
|
)
|
(5.2
|
)
|
(22.7
|
)
|
3.2
|
|
||||||||
|
Unallocated corporate expense and other (1)
|
(44.7
|
)
|
(38.1
|
)
|
(163.8
|
)
|
(192.5
|
)
|
||||||||
|
Operating income
|
$
|
30.9
|
|
$
|
57.6
|
|
$
|
25.4
|
|
$
|
101.1
|
|
||||
|
(1)
|
Includes charges related to restructuring programs and other costs managed at corporate.
|
19. RECENT ACCOUNTING PRONOUNCEMENTS
Adopted
In May 2014, the Financial Accounting Standards Board (“FASB”) issued Topic 606, which introduced a new framework to be used when recognizing revenue to reduce complexity and increase comparability of revenue recognition practices across entities, industries, jurisdictions, and capital markets. Topic 606 supersedes the revenue recognition requirements under Topic 605 “Revenue Recognition”. On January 1, 2018, we adopted Topic 606 using the modified retrospective method and elected to apply guidance retrospectively to all contracts that were not completed as of January 1, 2018. Under the modified retrospective method, periods beginning January 1, 2018 are presented under Topic 606 while prior periods continue to be presented under Topic 605. We have determined that the cumulative effect on net income and the opening balance sheet caused by adopting Topic 606 effective January 1, 2018 is immaterial. See Note 3 for additional information on revenue recognition.
In November 2016, the FASB issued Accounting Standards Update (“ASU”) No. 2016-18,
Restricted Cash
, to require that restricted cash and restricted cash equivalents be included with cash and cash equivalents when reconciling the beginning-of-period and end-of-period amounts on the statement of cash flows. The ASU is effective for fiscal years, and interim periods within those years, beginning after December 15, 2017 and is required to be applied retrospectively. The Company adopted this standard as of January 1, 2018. The adoption did not result in any changes to the financial statements presented within this Form 10-Q, as the Company does not have any restricted cash balances.
In August 2016, the FASB issued ASU No. 2016-15,
Statement of Cash Flows,
to provide cash flow statement classification guidance for certain cash receipts and payments including (a) debt prepayment or extinguishment costs; (b) contingent consideration payments made after a business combination; (c) insurance settlement proceeds; (d) distributions from equity method investees; (e) beneficial interests in securitization transactions and (f) application of the predominance principle for cash receipts and payments with aspects of more than one class of cash flows. The ASU is effective for fiscal years, and interim
28
TREEHOUSE FOODS, INC.
NOTES TO CONDENSED CONSOLIDATED FINANCIAL STATEMENTS — (Continued)
periods within those years, beginning after December 15, 2017. The amendments in this ASU should be applied retrospectively. The Company adopted this ASU on January 1, 2018. The adoption of this ASU did not result in any changes to our financial statements as we were already compliant with the changes.
In March 2017, the FASB issued ASU No. 2017-07,
Improving the Presentation of Net Periodic Pension Cost and Net Periodic Postretirement Benefit Cost
, which revises how employers that sponsor defined benefit pension and other postretirement plans present net periodic benefit cost. The ASU requires an employer to present the service cost component in the same income statement line item or items as other compensation costs arising from services rendered by the pertinent employees during the period. The other components of net benefit cost are required to be presented in the income statement separately from the service cost component and outside of any subtotal of operating income. The ASU is effective for fiscal years, and interim periods within those years, beginning after December 15, 2017. The standard requires adoption on a retrospective basis for the presentation of net benefit cost components. The Company adopted this standard as of January 1, 2018. Upon adoption, the Company recorded the service cost component of net benefit cost in Cost of sales and the other components of net benefit cost in
Other expense (income), net
of the Condensed Consolidated Statements of Operations. The Company also reclassified a total of
$0.2 million
of net benefit from operating income (
$0.4 million
of income from Cost of sales and
$0.2 million
of expense from General and administrative expense) to
Other expense (income), net
of the Condensed Consolidated Statements of Operations for the
third
quarter ended
September 30, 2017
.
In October 2016, the FASB issued ASU No. 2016-16,
Intra-Entity Transfers of Assets Other Than Inventory,
to improve the accounting for the income tax consequences of intra-entity transfers of assets other than inventory. This ASU requires an entity to recognize the consequences of an intra-entity transfer of an asset other than inventory when the transfer occurs. This ASU was issued as part of a simplification initiative. The ASU is effective on a modified retrospective basis for fiscal years, and interim periods within those years, beginning after September 15, 2017. The Company adopted the ASU on a modified retrospective basis through a cumulative-effect adjustment directly to retained earnings during the first quarter of 2018, the impact of which was not significant.
In February 2018, the FASB issued ASU No. 2018-02,
Reclassification of Certain Tax Effects from Accumulated AOCI,
which allows an entity to elect to reclassify the deferred tax effects, including any related valuation allowance, resulting from the application of the Tax Act from AOCI to retained earnings. The amendment in this ASU essentially eliminates the stranded deferred tax effects in AOCI resulting from the enactment of the Tax Act. ASU 2018-02 is effective for all entities for fiscal years beginning after December 15, 2018 and interim periods within those fiscal years. Early adoption is permitted. The amendments in ASU 2018-02 should be applied either in the period of adoption or retrospectively to each period in which the effect of the change in the federal income tax rate in the Tax Act is recognized. The Company adopted this ASU in the first quarter of 2018 and elected to reclassify the deferred tax effects due to the decrease in the U.S. Federal statutory tax rate, primarily associated with its pension and postretirement activity, from AOCI to retained earnings. The impact of adopting this ASU is outlined in
Note 12
.
In August 2018, the FASB issued ASU No. 2018-15,
Customer’s Accounting for Implementation Costs Incurred in a Cloud Computing Arrangement That is a Service Contract,
which aligns the requirements for capitalizing implementation costs incurred in a hosting arrangement that is a service contract with the requirements for capitalizing implementation costs incurred to develop or obtain internal-use software. The ASU is effective for fiscal years, and interim periods within those years, beginning after December 15, 2019 with early adoption permitted. The Company early adopted the ASU on a prospective basis during the third quarter of 2018 with no impact to the financial statements or related disclosures.
Not yet adopted
In February 2016, the FASB issued ASU No. 2016-02,
Leases
, to increase transparency and comparability by recognizing lease assets and lease liabilities on the balance sheet and disclosing key information about leasing arrangements. The main difference between existing GAAP and this ASU is the recognition of lease assets and lease liabilities by lessees for those leases classified as operating leases under existing GAAP. The standard requires that entities apply the effects of these changes using a modified retrospective approach, which includes a number of optional practical expedients. In July 2018, the FASB issued ASU No. 2018-11,
Leases (842), Targeted Improvements,
which provides an additional transition election to not restate comparative periods for the effects of applying the new standard. This transition election permits entities to apply ASU No. 2016-02 on the adoption date and recognize a cumulative-effect adjustment to the opening balance of retained earnings. The Company expects to elect this transition approach and recognize the cumulative impact of adoption in the opening balance of retained earnings as of January 1, 2019. These ASU's are effective for fiscal years, and interim periods within those years, beginning after December 15, 2018. The adoption of these ASU's will result in a significant increase to the Company’s Balance Sheets for lease
29
TREEHOUSE FOODS, INC.
NOTES TO CONDENSED CONSOLIDATED FINANCIAL STATEMENTS — (Continued)
liabilities and lease assets, and the Company is currently assessing the impact that this standard will have upon adoption on its accounting policies, processes, system requirements, internal controls, and disclosures. The Company does not anticipate that the adoption of these ASU’s will have a significant impact on the Company’s Consolidated Statements of Operations or Cash Flows. The Company has completed the initial review of its lease contracts and has selected a lease accounting system. The Company is currently implementing the lease accounting system and has been collecting the required information from lease contracts for adoption.
In August 2017, the FASB issued ASU No. 2017-12,
Derivatives and Hedging: Targeted Improvements to Accounting for Hedging Activities
, which simplifies hedge accounting by better aligning an entity’s financial reporting for hedging relationships with its risk management activities. The ASU also simplifies the application of the hedge accounting guidance. The new guidance is effective on January 1, 2019, with early adoption permitted. For cash flow hedges existing at the adoption date, the standard requires adoption on a modified retrospective basis with a cumulative-effect adjustment to the Consolidated Balance Sheet as of the beginning of the year of adoption. The amendments to presentation guidance and disclosure requirements are required to be adopted prospectively. The Company anticipates adopting this ASU as of the first quarter of 2019 and does not expect a material impact upon adoption.
In August 2018, the FASB issued ASU No. 2018-14,
Disclosure Framework - Changes to the Disclosure Requirements for Defined Benefit Plans
, which modifies the disclosure requirements for employers that sponsor defined benefit pension or other postretirement benefit plans. The guidance removes disclosures that are no longer considered cost beneficial, clarifies the specific requirements of disclosures, and adds disclosure requirements identified as relevant. The ASU is effective for fiscal years ending after December 15, 2021 with early adoption permitted. The Company plans to early adopt during the fourth quarter of 2018 and anticipates minimal disclosure impact upon adoption.
30
TREEHOUSE FOODS, INC.
NOTES TO CONDENSED CONSOLIDATED FINANCIAL STATEMENTS — (Continued)
20. GUARANTOR AND NON-GUARANTOR FINANCIAL INFORMATION
The 2022 Notes and 2024 Notes are fully and unconditionally, as well as jointly and severally, guaranteed by our directly and indirectly owned domestic subsidiaries, which are collectively known as the “Guarantor Subsidiaries”. Bay Valley Foods, LLC, which is a 100% owned direct subsidiary, maintains
100%
direct and indirect ownership of the following Guarantor Subsidiaries: Sturm Foods, Inc.; S.T. Specialty Foods, Inc.; Associated Brands, Inc.; Cains Foods, Inc.; Cains Foods L.P.; Cains GP, LLC; Flagstone Foods, Inc., Protenergy Holdings, Inc.; Protenergy Natural Foods, Inc.; TreeHouse Private Brands, Inc. (formerly Ralcorp Holdings, Inc.); American Italian Pasta Company.; Nutcracker Brands, Inc.; Linette Quality Chocolates, Inc.; Ralcorp Frozen Bakery Products, Inc.; Cottage Bakery, Inc.; The Carriage House Companies, Inc. and certain other domestic subsidiaries that may become guarantors in the future.
The guarantees of the Guarantor Subsidiaries are subject to release in limited circumstances, only upon the occurrence of certain customary conditions. There are no significant restrictions on the ability of the parent company or any guarantor to obtain funds from its subsidiaries by dividend or loan. The following condensed supplemental consolidating financial information presents the results of operations, financial position, and cash flows of the parent company, its Guarantor Subsidiaries, its non-guarantor subsidiaries, and the eliminations necessary to arrive at the information for the Company on a consolidated basis as of
September 30, 2018
and
December 31, 2017
, and for the
three and nine
months ended
September 30, 2018
and
2017
. The equity method has been used with respect to investments in subsidiaries. The principal elimination entries eliminate investments in subsidiaries and intercompany balances and transactions.
Condensed Supplemental Consolidating Balance Sheet
September 30, 2018
(In millions)
|
Parent
Company
|
Guarantor
Subsidiaries
|
Non-Guarantor
Subsidiaries
|
Eliminations
|
Consolidated
|
||||||||||||||||
|
Assets
|
|
|
|
|
|
|
|
|
||||||||||||
|
Current assets:
|
|
|
|
|
|
|
|
|
|
|
||||||||||
|
Cash and cash equivalents
|
$
|
0.2
|
|
$
|
—
|
|
$
|
52.6
|
|
$
|
—
|
|
$
|
52.8
|
|
|||||
|
Investments
|
—
|
|
—
|
|
15.4
|
|
—
|
|
15.4
|
|
||||||||||
|
Accounts receivable, net
|
3.4
|
|
221.6
|
|
60.6
|
|
—
|
|
285.6
|
|
||||||||||
|
Inventories
|
—
|
|
890.7
|
|
108.6
|
|
—
|
|
999.3
|
|
||||||||||
|
Prepaid expenses and other current assets
|
25.7
|
|
53.0
|
|
13.8
|
|
—
|
|
92.5
|
|
||||||||||
|
Total current assets
|
29.3
|
|
1,165.3
|
|
251.0
|
|
—
|
|
1,445.6
|
|
||||||||||
|
Property, plant, and equipment, net
|
34.0
|
|
1,084.9
|
|
153.2
|
|
—
|
|
1,272.1
|
|
||||||||||
|
Goodwill
|
—
|
|
2,046.7
|
|
121.3
|
|
—
|
|
2,168.0
|
|
||||||||||
|
Investment in subsidiaries
|
5,112.2
|
|
584.7
|
|
—
|
|
(5,696.9
|
)
|
—
|
|
||||||||||
|
Deferred income taxes
|
12.4
|
|
—
|
|
—
|
|
(12.4
|
)
|
—
|
|
||||||||||
|
Intangible and other assets, net
|
68.5
|
|
600.4
|
|
89.6
|
|
—
|
|
758.5
|
|
||||||||||
|
Total assets
|
$
|
5,256.4
|
|
$
|
5,482.0
|
|
$
|
615.1
|
|
$
|
(5,709.3
|
)
|
$
|
5,644.2
|
|
|||||
|
Liabilities and Stockholders’ Equity
|
||||||||||||||||||||
|
Current liabilities:
|
||||||||||||||||||||
|
Accounts payable and accrued expenses
|
$
|
61.8
|
|
$
|
624.6
|
|
$
|
64.5
|
|
$
|
—
|
|
$
|
750.9
|
|
|||||
|
Current portion of long-term debt
|
9.8
|
|
0.5
|
|
0.1
|
|
—
|
|
10.4
|
|
||||||||||
|
Total current liabilities
|
71.6
|
|
625.1
|
|
64.6
|
|
—
|
|
761.3
|
|
||||||||||
|
Long-term debt
|
2,332.1
|
|
0.5
|
|
0.5
|
|
—
|
|
2,333.1
|
|
||||||||||
|
Deferred income taxes
|
—
|
|
163.4
|
|
22.3
|
|
(12.4
|
)
|
173.3
|
|
||||||||||
|
Other long-term liabilities
|
10.8
|
|
162.4
|
|
13.6
|
|
—
|
|
186.8
|
|
||||||||||
|
Intercompany accounts receivable (payable), net
|
652.2
|
|
(581.6
|
)
|
(70.6
|
)
|
—
|
|
—
|
|
||||||||||
|
Stockholders’ equity
|
2,189.7
|
|
5,112.2
|
|
584.7
|
|
(5,696.9
|
)
|
2,189.7
|
|
||||||||||
|
Total liabilities and stockholders’ equity
|
$
|
5,256.4
|
|
$
|
5,482.0
|
|
$
|
615.1
|
|
$
|
(5,709.3
|
)
|
$
|
5,644.2
|
|
|||||
31
TREEHOUSE FOODS, INC.
NOTES TO CONDENSED CONSOLIDATED FINANCIAL STATEMENTS — (Continued)
Condensed Supplemental Consolidating Balance Sheet
December 31, 2017
(In millions)
|
Parent
Company
|
Guarantor
Subsidiaries
|
Non-Guarantor
Subsidiaries
|
Eliminations
|
Consolidated
|
||||||||||||||||
|
Assets
|
|
|
|
|
|
|
|
|
|
|
||||||||||
|
Current assets:
|
|
|
|
|
|
|
|
|
|
|
||||||||||
|
Cash and cash equivalents
|
$
|
83.2
|
|
$
|
0.2
|
|
$
|
49.4
|
|
$
|
—
|
|
$
|
132.8
|
|
|||||
|
Investments
|
—
|
|
—
|
|
14.1
|
|
—
|
|
14.1
|
|
||||||||||
|
Accounts receivable, net
|
0.2
|
|
297.1
|
|
32.5
|
|
—
|
|
329.8
|
|
||||||||||
|
Inventories
|
—
|
|
803.1
|
|
115.2
|
|
—
|
|
918.3
|
|
||||||||||
|
Prepaid expenses and other current assets
|
69.8
|
|
32.0
|
|
20.0
|
|
(32.1
|
)
|
89.7
|
|
||||||||||
|
Total current assets
|
153.2
|
|
1,132.4
|
|
231.2
|
|
(32.1
|
)
|
1,484.7
|
|
||||||||||
|
Property, plant, and equipment, net
|
29.3
|
|
1,108.7
|
|
156.4
|
|
—
|
|
1,294.4
|
|
||||||||||
|
Goodwill
|
—
|
|
2,057.3
|
|
124.7
|
|
—
|
|
2,182.0
|
|
||||||||||
|
Investment in subsidiaries
|
4,945.5
|
|
582.6
|
|
—
|
|
(5,528.1
|
)
|
—
|
|
||||||||||
|
Intercompany accounts (payable) receivable, net
|
(328.6
|
)
|
274.5
|
|
54.1
|
|
—
|
|
—
|
|
||||||||||
|
Deferred income taxes
|
15.1
|
|
—
|
|
—
|
|
(15.1
|
)
|
—
|
|
||||||||||
|
Intangible and other assets, net
|
62.5
|
|
652.1
|
|
103.6
|
|
—
|
|
818.2
|
|
||||||||||
|
Total assets
|
$
|
4,877.0
|
|
$
|
5,807.6
|
|
$
|
670.0
|
|
$
|
(5,575.3
|
)
|
$
|
5,779.3
|
|
|||||
|
Liabilities and Stockholders’ Equity
|
||||||||||||||||||||
|
Current liabilities:
|
||||||||||||||||||||
|
Accounts payable and accrued expenses
|
$
|
53.3
|
|
$
|
513.8
|
|
$
|
54.7
|
|
$
|
(32.1
|
)
|
$
|
589.7
|
|
|||||
|
Current portion of long-term debt
|
9.0
|
|
1.1
|
|
—
|
|
—
|
|
10.1
|
|
||||||||||
|
Total current liabilities
|
62.3
|
|
514.9
|
|
54.7
|
|
(32.1
|
)
|
599.8
|
|
||||||||||
|
Long-term debt
|
2,533.8
|
|
1.4
|
|
0.5
|
|
—
|
|
2,535.7
|
|
||||||||||
|
Deferred income taxes
|
—
|
|
167.3
|
|
26.2
|
|
(15.1
|
)
|
178.4
|
|
||||||||||
|
Other long-term liabilities
|
17.6
|
|
178.5
|
|
6.0
|
|
—
|
|
202.1
|
|
||||||||||
|
Stockholders’ equity
|
2,263.3
|
|
4,945.5
|
|
582.6
|
|
(5,528.1
|
)
|
2,263.3
|
|
||||||||||
|
Total liabilities and stockholders’ equity
|
$
|
4,877.0
|
|
$
|
5,807.6
|
|
$
|
670.0
|
|
$
|
(5,575.3
|
)
|
$
|
5,779.3
|
|
|||||
32
TREEHOUSE FOODS, INC.
NOTES TO CONDENSED CONSOLIDATED FINANCIAL STATEMENTS — (Continued)
Condensed Supplemental Consolidating Statement of Operations
Three Months Ended September 30, 2018
(In millions)
|
Parent
Company
|
Guarantor
Subsidiaries
|
Non-Guarantor
Subsidiaries
|
Eliminations
|
Consolidated
|
||||||||||||||||
|
Net sales
|
$
|
—
|
|
$
|
1,400.2
|
|
$
|
170.9
|
|
$
|
(177.1
|
)
|
$
|
1,394.0
|
|
|||||
|
Cost of sales
|
—
|
|
1,193.9
|
|
149.7
|
|
(177.1
|
)
|
1,166.5
|
|
||||||||||
|
Gross profit
|
—
|
|
206.3
|
|
21.2
|
|
—
|
|
227.5
|
|
||||||||||
|
Selling, general, and administrative expense
|
35.3
|
|
107.7
|
|
8.9
|
|
—
|
|
151.9
|
|
||||||||||
|
Amortization expense
|
3.0
|
|
16.1
|
|
2.3
|
|
—
|
|
21.4
|
|
||||||||||
|
Other operating expense, net
|
26.2
|
|
(3.4
|
)
|
0.5
|
|
—
|
|
23.3
|
|
||||||||||
|
Operating income (loss)
|
(64.5
|
)
|
85.9
|
|
9.5
|
|
—
|
|
30.9
|
|
||||||||||
|
Interest expense
|
28.3
|
|
—
|
|
1.3
|
|
(1.8
|
)
|
27.8
|
|
||||||||||
|
Interest income
|
(0.3
|
)
|
(1.5
|
)
|
(1.3
|
)
|
1.8
|
|
(1.3
|
)
|
||||||||||
|
Other expense (income), net
|
(4.2
|
)
|
5.7
|
|
2.7
|
|
—
|
|
4.2
|
|
||||||||||
|
Income (loss) before income taxes
|
(88.3
|
)
|
81.7
|
|
6.8
|
|
—
|
|
0.2
|
|
||||||||||
|
Income tax (benefit) expense
|
(18.0
|
)
|
12.3
|
|
0.5
|
|
—
|
|
(5.2
|
)
|
||||||||||
|
Equity in net income (loss) of subsidiaries
|
75.7
|
|
6.3
|
|
—
|
|
(82.0
|
)
|
—
|
|
||||||||||
|
Net income (loss)
|
$
|
5.4
|
|
$
|
75.7
|
|
$
|
6.3
|
|
$
|
(82.0
|
)
|
$
|
5.4
|
|
|||||
Condensed Supplemental Consolidating Statement of Operations
Three Months Ended September 30, 2017
(In millions)
|
Parent
Company
|
Guarantor
Subsidiaries
|
Non-Guarantor
Subsidiaries
|
Eliminations
|
Consolidated
|
||||||||||||||||
|
Net sales
|
$
|
—
|
|
$
|
1,458.0
|
|
$
|
175.9
|
|
$
|
(85.1
|
)
|
$
|
1,548.8
|
|
|||||
|
Cost of sales
|
—
|
|
1,221.9
|
|
152.3
|
|
(85.1
|
)
|
1,289.1
|
|
||||||||||
|
Gross profit
|
—
|
|
236.1
|
|
23.6
|
|
—
|
|
259.7
|
|
||||||||||
|
Selling, general, and administrative expense
|
23.9
|
|
128.3
|
|
10.3
|
|
—
|
|
162.5
|
|
||||||||||
|
Amortization expense
|
3.3
|
|
22.7
|
|
2.5
|
|
—
|
|
28.5
|
|
||||||||||
|
Other operating expense, net
|
2.4
|
|
8.0
|
|
0.7
|
|
—
|
|
11.1
|
|
||||||||||
|
Operating income (loss)
|
(29.6
|
)
|
77.1
|
|
10.1
|
|
—
|
|
57.6
|
|
||||||||||
|
Interest expense
|
31.3
|
|
0.1
|
|
3.8
|
|
(3.8
|
)
|
31.4
|
|
||||||||||
|
Interest income
|
—
|
|
(3.8
|
)
|
(0.4
|
)
|
3.8
|
|
(0.4
|
)
|
||||||||||
|
Other expense (income), net
|
(2.4
|
)
|
(1.9
|
)
|
0.8
|
|
—
|
|
(3.5
|
)
|
||||||||||
|
Income (loss) before income taxes
|
(58.5
|
)
|
82.7
|
|
5.9
|
|
—
|
|
30.1
|
|
||||||||||
|
Income tax (benefit) expense
|
(22.4
|
)
|
22.7
|
|
1.0
|
|
—
|
|
1.3
|
|
||||||||||
|
Equity in net income (loss) of subsidiaries
|
64.9
|
|
4.9
|
|
—
|
|
(69.8
|
)
|
—
|
|
||||||||||
|
Net income (loss)
|
$
|
28.8
|
|
$
|
64.9
|
|
$
|
4.9
|
|
$
|
(69.8
|
)
|
$
|
28.8
|
|
|||||
33
TREEHOUSE FOODS, INC.
NOTES TO CONDENSED CONSOLIDATED FINANCIAL STATEMENTS — (Continued)
Condensed Supplemental Consolidating Statement of Operations
Nine Months Ended September 30, 2018
(In millions)
|
Parent
Company
|
Guarantor
Subsidiaries
|
Non-Guarantor
Subsidiaries
|
Eliminations
|
Consolidated
|
||||||||||||||||
|
Net sales
|
$
|
—
|
|
$
|
4,336.9
|
|
$
|
518.3
|
|
$
|
(524.2
|
)
|
$
|
4,331.0
|
|
|||||
|
Cost of sales
|
—
|
|
3,699.5
|
|
460.5
|
|
(524.2
|
)
|
3,635.8
|
|
||||||||||
|
Gross profit
|
—
|
|
637.4
|
|
57.8
|
|
—
|
|
695.2
|
|
||||||||||
|
Selling, general, and administrative expense
|
114.9
|
|
361.7
|
|
29.4
|
|
—
|
|
506.0
|
|
||||||||||
|
Amortization expense
|
8.7
|
|
49.3
|
|
6.9
|
|
—
|
|
64.9
|
|
||||||||||
|
Other operating expense, net
|
81.6
|
|
14.0
|
|
3.3
|
|
—
|
|
98.9
|
|
||||||||||
|
Operating income (loss)
|
(205.2
|
)
|
212.4
|
|
18.2
|
|
—
|
|
25.4
|
|
||||||||||
|
Interest expense
|
88.9
|
|
—
|
|
2.7
|
|
(4.0
|
)
|
87.6
|
|
||||||||||
|
Interest income
|
(2.6
|
)
|
(3.6
|
)
|
(1.6
|
)
|
4.0
|
|
(3.8
|
)
|
||||||||||
|
Other expense (income), net
|
(1.4
|
)
|
12.2
|
|
0.7
|
|
—
|
|
11.5
|
|
||||||||||
|
Income (loss) before income taxes
|
(290.1
|
)
|
203.8
|
|
16.4
|
|
—
|
|
(69.9
|
)
|
||||||||||
|
Income tax (benefit) expense
|
(61.4
|
)
|
39.0
|
|
1.3
|
|
—
|
|
(21.1
|
)
|
||||||||||
|
Equity in net income (loss) of subsidiaries
|
179.9
|
|
15.1
|
|
—
|
|
(195.0
|
)
|
—
|
|
||||||||||
|
Net income (loss)
|
$
|
(48.8
|
)
|
$
|
179.9
|
|
$
|
15.1
|
|
$
|
(195.0
|
)
|
$
|
(48.8
|
)
|
|||||
Condensed Supplemental Consolidating Statement of Operations
Nine Months Ended September 30, 2017
(In millions)
|
Parent
Company
|
Guarantor
Subsidiaries
|
Non-Guarantor
Subsidiaries
|
Eliminations
|
Consolidated
|
||||||||||||||||
|
Net sales
|
$
|
—
|
|
$
|
4,353.3
|
|
$
|
498.8
|
|
$
|
(244.9
|
)
|
$
|
4,607.2
|
|
|||||
|
Cost of sales
|
—
|
|
3,597.6
|
|
431.8
|
|
(244.9
|
)
|
3,784.5
|
|
||||||||||
|
Gross profit
|
—
|
|
755.7
|
|
67.0
|
|
—
|
|
822.7
|
|
||||||||||
|
Selling, general, and administrative expense
|
86.0
|
|
407.6
|
|
30.3
|
|
—
|
|
523.9
|
|
||||||||||
|
Amortization expense
|
9.4
|
|
69.2
|
|
7.2
|
|
—
|
|
85.8
|
|
||||||||||
|
Other operating expense, net
|
2.4
|
|
107.4
|
|
2.1
|
|
—
|
|
111.9
|
|
||||||||||
|
Operating income (loss)
|
(97.8
|
)
|
171.5
|
|
27.4
|
|
—
|
|
101.1
|
|
||||||||||
|
Interest expense
|
94.2
|
|
0.3
|
|
4.8
|
|
(6.4
|
)
|
92.9
|
|
||||||||||
|
Interest income
|
(2.2
|
)
|
(6.4
|
)
|
(1.3
|
)
|
6.4
|
|
(3.5
|
)
|
||||||||||
|
Other expense (income), net
|
(0.8
|
)
|
(2.1
|
)
|
0.8
|
|
—
|
|
(2.1
|
)
|
||||||||||
|
Income (loss) before income taxes
|
(189.0
|
)
|
179.7
|
|
23.1
|
|
—
|
|
13.8
|
|
||||||||||
|
Income tax (benefit) expense
|
(72.6
|
)
|
59.2
|
|
4.4
|
|
—
|
|
(9.0
|
)
|
||||||||||
|
Equity in net income (loss) of subsidiaries
|
139.2
|
|
18.7
|
|
—
|
|
(157.9
|
)
|
—
|
|
||||||||||
|
Net income (loss)
|
$
|
22.8
|
|
$
|
139.2
|
|
$
|
18.7
|
|
$
|
(157.9
|
)
|
$
|
22.8
|
|
|||||
34
TREEHOUSE FOODS, INC.
NOTES TO CONDENSED CONSOLIDATED FINANCIAL STATEMENTS — (Continued)
Condensed Supplemental Consolidating Statement of Comprehensive Income (Loss)
Three Months Ended September 30, 2018
(In millions)
|
Parent
Company
|
Guarantor
Subsidiaries
|
Non-Guarantor
Subsidiaries
|
Eliminations
|
Consolidated
|
||||||||||||||||
|
Net income (loss)
|
$
|
5.4
|
|
$
|
75.7
|
|
$
|
6.3
|
|
$
|
(82.0
|
)
|
$
|
5.4
|
|
|||||
|
Other comprehensive income (loss):
|
||||||||||||||||||||
|
Foreign currency translation adjustments
|
—
|
|
—
|
|
6.5
|
|
—
|
|
6.5
|
|
||||||||||
|
Pension and postretirement reclassification
adjustment, net of tax
|
—
|
|
0.1
|
|
—
|
|
—
|
|
0.1
|
|
||||||||||
|
Other comprehensive income (loss)
|
—
|
|
0.1
|
|
6.5
|
|
—
|
|
6.6
|
|
||||||||||
|
Equity in other comprehensive (loss) income of
subsidiaries
|
6.6
|
|
6.5
|
|
—
|
|
(13.1
|
)
|
—
|
|
||||||||||
|
Comprehensive income (loss)
|
$
|
12.0
|
|
$
|
82.3
|
|
$
|
12.8
|
|
$
|
(95.1
|
)
|
$
|
12.0
|
|
|||||
Condensed Supplemental Consolidating Statement of Comprehensive Income (Loss)
Three Months Ended September 30, 2017
(In millions)
|
Parent
Company
|
Guarantor
Subsidiaries
|
Non-Guarantor
Subsidiaries
|
Eliminations
|
Consolidated
|
||||||||||||||||
|
Net income (loss)
|
$
|
28.8
|
|
$
|
64.9
|
|
$
|
4.9
|
|
$
|
(69.8
|
)
|
$
|
28.8
|
|
|||||
|
Other comprehensive income (loss):
|
||||||||||||||||||||
|
Foreign currency translation adjustments
|
—
|
|
—
|
|
18.0
|
|
—
|
|
18.0
|
|
||||||||||
|
Pension and postretirement reclassification
adjustment, net of tax
|
—
|
|
0.1
|
|
—
|
|
—
|
|
0.1
|
|
||||||||||
|
Other comprehensive income (loss)
|
—
|
|
0.1
|
|
18.0
|
|
—
|
|
18.1
|
|
||||||||||
|
Equity in other comprehensive income (loss) of
subsidiaries
|
18.1
|
|
18.0
|
|
—
|
|
(36.1
|
)
|
—
|
|
||||||||||
|
Comprehensive income (loss)
|
$
|
46.9
|
|
$
|
83.0
|
|
$
|
22.9
|
|
$
|
(105.9
|
)
|
$
|
46.9
|
|
|||||
35
TREEHOUSE FOODS, INC.
NOTES TO CONDENSED CONSOLIDATED FINANCIAL STATEMENTS — (Continued)
Condensed Supplemental Consolidating Statement of Comprehensive Income (Loss)
Nine Months Ended September 30, 2018
(In millions)
|
Parent
Company
|
Guarantor
Subsidiaries
|
Non-Guarantor
Subsidiaries
|
Eliminations
|
Consolidated
|
||||||||||||||||
|
Net income (loss)
|
$
|
(48.8
|
)
|
$
|
179.9
|
|
$
|
15.1
|
|
$
|
(195.0
|
)
|
$
|
(48.8
|
)
|
|||||
|
Other comprehensive income (loss):
|
||||||||||||||||||||
|
Foreign currency translation adjustments
|
—
|
|
—
|
|
(13.0
|
)
|
—
|
|
(13.0
|
)
|
||||||||||
|
Pension and postretirement reclassification
adjustment, net of tax
|
—
|
|
0.4
|
|
—
|
|
—
|
|
0.4
|
|
||||||||||
|
Adoption of ASU 2018-02 reclassification to retained earnings
|
—
|
|
(1.1
|
)
|
—
|
|
—
|
|
(1.1
|
)
|
||||||||||
|
Other comprehensive income (loss)
|
—
|
|
(0.7
|
)
|
(13.0
|
)
|
—
|
|
(13.7
|
)
|
||||||||||
|
Equity in other comprehensive (loss) income of
subsidiaries
|
(13.7
|
)
|
(13.0
|
)
|
—
|
|
26.7
|
|
—
|
|
||||||||||
|
Comprehensive income (loss)
|
$
|
(62.5
|
)
|
$
|
166.2
|
|
$
|
2.1
|
|
$
|
(168.3
|
)
|
$
|
(62.5
|
)
|
|||||
Condensed Supplemental Consolidating Statement of Comprehensive Income (Loss)
Nine Months Ended September 30, 2017
(In millions)
|
Parent
Company
|
Guarantor
Subsidiaries
|
Non-Guarantor
Subsidiaries
|
Eliminations
|
Consolidated
|
||||||||||||||||
|
Net income (loss)
|
$
|
22.8
|
|
$
|
139.2
|
|
$
|
18.7
|
|
$
|
(157.9
|
)
|
$
|
22.8
|
|
|||||
|
Other comprehensive income (loss):
|
||||||||||||||||||||
|
Foreign currency translation adjustments
|
—
|
|
—
|
|
34.5
|
|
—
|
|
34.5
|
|
||||||||||
|
Pension and postretirement reclassification
adjustment, net of tax
|
—
|
|
7.2
|
|
—
|
|
—
|
|
7.2
|
|
||||||||||
|
Other comprehensive income (loss)
|
—
|
|
7.2
|
|
34.5
|
|
—
|
|
41.7
|
|
||||||||||
|
Equity in other comprehensive income (loss) of
subsidiaries
|
41.7
|
|
34.5
|
|
—
|
|
(76.2
|
)
|
—
|
|
||||||||||
|
Comprehensive income (loss)
|
$
|
64.5
|
|
$
|
180.9
|
|
$
|
53.2
|
|
$
|
(234.1
|
)
|
$
|
64.5
|
|
|||||
36
TREEHOUSE FOODS, INC.
NOTES TO CONDENSED CONSOLIDATED FINANCIAL STATEMENTS — (Continued)
Condensed Supplemental Consolidating Statement of Cash Flows
Nine Months Ended September 30, 2018
(In millions)
|
Parent
Company
|
Guarantor
Subsidiaries
|
Non-Guarantor
Subsidiaries
|
Eliminations
|
Consolidated
|
||||||||||||||||
|
Cash flows from operating activities:
|
|
|
|
|
|
|
|
|
|
|
||||||||||
|
Net cash provided by (used in) operating
activities
|
$
|
89.3
|
|
$
|
323.9
|
|
$
|
51.5
|
|
$
|
(194.2
|
)
|
$
|
270.5
|
|
|||||
|
Cash flows from investing activities:
|
||||||||||||||||||||
|
Additions to property, plant, and equipment
|
(2.2
|
)
|
(99.2
|
)
|
(15.3
|
)
|
—
|
|
(116.7
|
)
|
||||||||||
|
Additions to intangible assets
|
(15.8
|
)
|
(0.6
|
)
|
—
|
|
—
|
|
(16.4
|
)
|
||||||||||
|
Intercompany transfer
|
(25.8
|
)
|
(162.2
|
)
|
(16.2
|
)
|
204.2
|
|
—
|
|
||||||||||
|
Other
|
—
|
|
35.5
|
|
(1.1
|
)
|
—
|
|
34.4
|
|
||||||||||
|
Net cash (used in) provided by investing
activities
|
(43.8
|
)
|
(226.5
|
)
|
(32.6
|
)
|
204.2
|
|
(98.7
|
)
|
||||||||||
|
Cash flows from financing activities:
|
||||||||||||||||||||
|
Net (repayment) borrowing of debt
|
(208.5
|
)
|
(1.5
|
)
|
—
|
|
—
|
|
(210.0
|
)
|
||||||||||
|
Intercompany transfer
|
120.8
|
|
(95.1
|
)
|
(15.7
|
)
|
(10.0
|
)
|
—
|
|
||||||||||
|
Repurchases of common stock
|
(42.2
|
)
|
—
|
|
—
|
|
—
|
|
(42.2
|
)
|
||||||||||
|
Receipts related to stock-based award activities
|
4.7
|
|
—
|
|
—
|
|
—
|
|
4.7
|
|
||||||||||
|
Payments related to stock-based award activities
|
(3.3
|
)
|
—
|
|
—
|
|
—
|
|
(3.3
|
)
|
||||||||||
|
Net cash (used in) provided by financing
activities
|
(128.5
|
)
|
(96.6
|
)
|
(15.7
|
)
|
(10.0
|
)
|
(250.8
|
)
|
||||||||||
|
Effect of exchange rate changes on cash and
cash equivalents
|
—
|
|
(1.0
|
)
|
—
|
|
—
|
|
(1.0
|
)
|
||||||||||
|
Decrease (increase) in cash and cash equivalents
|
(83.0
|
)
|
(0.2
|
)
|
3.2
|
|
—
|
|
(80.0
|
)
|
||||||||||
|
Cash and cash equivalents, beginning of period
|
83.2
|
|
0.2
|
|
49.4
|
|
—
|
|
132.8
|
|
||||||||||
|
Cash and cash equivalents, end of period
|
$
|
0.2
|
|
$
|
—
|
|
$
|
52.6
|
|
$
|
—
|
|
$
|
52.8
|
|
|||||
37
TREEHOUSE FOODS, INC.
NOTES TO CONDENSED CONSOLIDATED FINANCIAL STATEMENTS — (Continued)
Condensed Supplemental Consolidating Statement of Cash Flows
Nine Months Ended September 30, 2017
(In millions)
|
Parent
Company
|
Guarantor
Subsidiaries
|
Non-Guarantor
Subsidiaries
|
Eliminations
|
Consolidated
|
||||||||||||||||
|
Cash flows from operating activities:
|
|
|
|
|
|
|
|
|
|
|
||||||||||
|
Net cash provided by (used in) operating
activities
|
$
|
13.4
|
|
$
|
406.0
|
|
$
|
1.4
|
|
$
|
(157.4
|
)
|
$
|
263.4
|
|
|||||
|
Cash flows from investing activities:
|
||||||||||||||||||||
|
Additions to property, plant, and equipment
|
(1.6
|
)
|
(87.4
|
)
|
(13.5
|
)
|
—
|
|
(102.5
|
)
|
||||||||||
|
Additions to intangible assets
|
(17.7
|
)
|
(0.8
|
)
|
(0.1
|
)
|
—
|
|
(18.6
|
)
|
||||||||||
|
Intercompany transfer
|
69.8
|
|
(128.2
|
)
|
—
|
|
58.4
|
|
—
|
|
||||||||||
|
Proceeds from sale of fixed assets
|
—
|
|
7.2
|
|
—
|
|
—
|
|
7.2
|
|
||||||||||
|
Proceeds from divestiture
|
—
|
|
19.0
|
|
0.3
|
|
—
|
|
19.3
|
|
||||||||||
|
Other
|
—
|
|
—
|
|
(1.0
|
)
|
—
|
|
(1.0
|
)
|
||||||||||
|
Net cash (used in) provided by investing
activities
|
50.5
|
|
(190.2
|
)
|
(14.3
|
)
|
58.4
|
|
(95.6
|
)
|
||||||||||
|
Cash flows from financing activities:
|
||||||||||||||||||||
|
Net borrowing (repayment) of debt
|
(100.8
|
)
|
(2.2
|
)
|
(0.1
|
)
|
—
|
|
(103.1
|
)
|
||||||||||
|
Intercompany transfer
|
109.2
|
|
(213.6
|
)
|
5.4
|
|
99.0
|
|
—
|
|
||||||||||
|
Receipts related to stock-based award activities
|
11.1
|
|
—
|
|
—
|
|
—
|
|
11.1
|
|
||||||||||
|
Payments related to stock-based award activities
|
(6.7
|
)
|
—
|
|
—
|
|
—
|
|
(6.7
|
)
|
||||||||||
|
Net cash (used in) provided by financing
activities
|
12.8
|
|
(215.8
|
)
|
5.3
|
|
99.0
|
|
(98.7
|
)
|
||||||||||
|
Effect of exchange rate changes on cash and
cash equivalents
|
—
|
|
—
|
|
0.7
|
|
—
|
|
0.7
|
|
||||||||||
|
Increase (decrease) in cash and cash equivalents
|
76.7
|
|
—
|
|
(6.9
|
)
|
—
|
|
69.8
|
|
||||||||||
|
Cash and cash equivalents, beginning of period
|
—
|
|
0.2
|
|
61.9
|
|
—
|
|
62.1
|
|
||||||||||
|
Cash and cash equivalents, end of period
|
$
|
76.7
|
|
$
|
0.2
|
|
$
|
55.0
|
|
$
|
—
|
|
$
|
131.9
|
|
|||||
38
Business Overview
TreeHouse Foods, Inc. is a manufacturer of packaged foods and beverages with manufacturing facilities across the United States, Canada, and Italy that focuses primarily on private label products for both retail grocery and food away from home customers. We manufacture shelf stable, refrigerated, frozen, and fresh products within our five segments (Baked Goods, Beverages, Condiments, Meals, and Snacks). We have a comprehensive offering of packaging formats and flavor profiles, and we also offer natural, organic, and preservative free ingredients in many categories.
Our reportable segments, and the product categories that make up each segment, are as follows:

39
Net sales are relatively evenly distributed across segments:
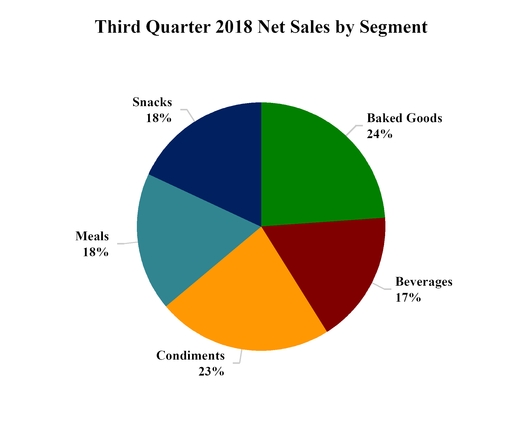
We believe we are the largest manufacturer of private label snack nuts, trail mixes, refrigerated dough, crackers, pickles, salsa, non-dairy powdered creamer, ready-to-eat cereals, bouillon, and dry pasta in the United States, the largest manufacturer of private label pretzels, retail griddle items, powdered drink mixes, retail salad dressings, macaroni and cheese dinners, and instant hot cereals in both the United States and Canada, and the largest manufacturer of private label jams and pasta sauces in Canada, based on volume. We also believe we are one of the largest manufacturers of private label in-store bakery products, cookies, pitas, snack bars, table syrup, flavored syrup, barbeque sauce, preserves, and jellies in the United States, based on volume.
The following discussion and analysis presents the factors that had a material effect on our results of operations for the
three and nine
month periods ended
September 30, 2018
and
2017
. Also discussed is our financial position as of the end of the current period. This discussion should be read in conjunction with the Condensed Consolidated Financial Statements and the Notes to those Condensed Consolidated Financial Statements included elsewhere in this report. This Management’s Discussion and Analysis of Financial Condition and Results of Operations contains forward-looking statements. See
Cautionary Statement Regarding Forward-Looking Statements
on page 61 for a discussion of the uncertainties, risks, and assumptions associated with these statements.
Current Market Environment
Retail food sales and volumes have been under pressure in recent years. However, trends might be starting to shift as positive sales growth has returned across most measured channels during the past year. Based on the Citi
DD’s Nielsen AOC+C Data Analysis – 9/8/18
report, total retail food sales increased 0.6% over the past year as minimal volume decreases of 1.0% were more than offset by price increases of 1.6%. Private label sales and volume growth continues to outpace branded products as total private label sales in measured channels over the past year increased 3.5% compared to a decrease of 0.1% for branded products. These increases were led by private label pricing and volume increases of 2.2% and 1.3%, respectively, compared to branded pricing increases of 2.1% and volume decreases of 2.2%. As such, on an industry basis, strong private label sales and volumes continue to be attractive compared to branded counterparts.
40
Retail sectors are continuing to experience growth in premium, better for you, natural, and organic foods (collectively referred to as “PBFY”) as consumers shift their consumptions trends towards a focus on healthier eating with cleaner labels. PBFY foods include items such as fresh or freshly prepared foods, foods with premium ingredients, natural, organic, clean label, or specialty foods, most of which are located in the perimeter of the store. Recent data shows that these product offerings are expected to be the primary growth area for both branded and private label products, and that growth in private label is expected to drive the overall growth in these product categories. These trends are prompting companies, TreeHouse included, to increase or adjust their offerings, while retaining their commitment to provide products at reasonable prices. The margin on these PBFY products tend to be higher and more stable than other labels. In an effort to respond to shifting consumer demand, the Company offers an increasing variety of PBFY products, currently offering PBFY products in 28 of our categories.
Recent Developments
TreeHouse 2020
On August 3, 2017, the Company announced the TreeHouse 2020 program, which is a comprehensive strategic blueprint intended to accelerate long-term growth through optimization of our manufacturing network, transformation of our mixing centers and warehouse footprint, and leveraging of systems and processes to drive performance. TreeHouse 2020 is a multi-year plan to fully integrate the business and reduce its cost structure in order to invest in market-differentiated capabilities, including higher growth potential product categories to serve the rapidly evolving needs of customers which are strategically focused and highly committed to their corporate brands. TreeHouse 2020 is expected to produce significant savings to achieve our operating margin expansion targets creating reinvestment opportunities to drive future growth. Specifically, we are targeting to improve our operating margin structure by approximately 300 basis points by the end of 2020. In the short-term, while we continue to execute on these margin improvement initiatives we might experience modest sales declines due to the rationalization of low margin business.
The TreeHouse 2020 program will be executed through 2020. In 2017, the Company announced the closure of its Brooklyn Park, Minnesota and Plymouth, Indiana facilities, as well as the downsizing of the Dothan, Alabama facility. Production at the Brooklyn Park, Minnesota and Plymouth, Indiana facilities ceased in the fourth quarter of 2017. The partial facility downsizing at Dothan, Alabama was completed in the third quarter of 2018.
In addition, we have taken steps toward increasing our capacity utilization, operational margin expansion, and streamlining our plant structure to optimize our supply chain. Plant closings, line shutdowns, warehouse consolidations, and the rollout of a standardized management operating structure continue to track to plan. See Note 2 to our Condensed Consolidated Financial Statements for additional information regarding restructuring programs.
On January 31, 2018, the Company announced its intention to close its remaining operations in Battle Creek, Michigan. The Company had previously announced its decision to downsize the Battle Creek facility; however, following completion of the first phase of downsizing, it was determined that the remaining operations would not be economically viable. Current production at Battle Creek will be moved to other cereal manufacturing facilities. The costs to close the remainder of the Battle Creek facility are expected to be approximately
$18.2 million
, of which approximately
$11.8 million
is expected to be in cash. Components of the charges include non-cash asset write-offs of approximately $6.4 million, employee-related costs of approximately $3.2 million, and other closure costs of approximately $8.6 million. Total expected costs to close decreased $11.8 million from the initial announcement through
September 30, 2018
due to revised estimates. The full closure of the facility was initially scheduled for the fourth quarter of 2018, but this date has been delayed to mid-2019 due to recent customer bid activity.
On February 15, 2018, the Company announced the planned closure of its Visalia, California facility by the end of the first quarter of 2019. The plant primarily produces pretzels and cereal snack mixes for the Baked Goods segment. Current pretzel production will be moved to other TreeHouse manufacturing facilities prior to the plant closure. The costs to close the Visalia facility are expected to be approximately
$23.6 million
, of which approximately
$11.0 million
is expected to be in cash. Components of the charges include non-cash accelerated depreciation of approximately $12.6 million, employee-related costs of approximately $3.7 million, and other closure costs of approximately $7.3 million. Total expected costs to close increased $2.6 million since the initial announcement through
September 30, 2018
due to revised estimates.
On July 18, 2018, the Company announced the planned closure of an administrative office located in Omaha, Nebraska by January 31, 2019. Costs associated with this office closure are expected to be approximately $5.8 million, of which $4.3 million is expected to be in cash.
41
Structure to Win
In the first quarter of 2018, the Company announced an operating expenses improvement program designed to align our organization structure with strategic priorities. The program is intended to support operational effectiveness, cost reduction, and position the Company for growth with a focus on a lean customer focused go-to-market team, centralized supply chain, and streamlined back office. In the
nine months ended September 30, 2018
, we incurred costs of
$31.5 million
on this program. We expect to spend
$37.0 million
in 2018 primarily on employee-related costs and consulting services, which is intended to yield $55.0 million in annualized run-rate savings starting in 2019.
Results of Operations
The following table presents certain information concerning our financial results, including information presented as a percentage of consolidated net sales:
|
|
Three Months Ended September 30,
|
Nine Months Ended September 30,
|
||||||||||||||||||||||||||
|
|
2018
|
2017
|
2018
|
2017
|
||||||||||||||||||||||||
|
|
Dollars
|
Percent
|
Dollars
|
Percent
|
Dollars
|
Percent
|
Dollars
|
Percent
|
||||||||||||||||||||
|
|
(Dollars in millions)
|
(Dollars in millions)
|
||||||||||||||||||||||||||
|
Net sales
|
$
|
1,394.0
|
|
100.0
|
%
|
$
|
1,548.8
|
|
100.0
|
%
|
$
|
4,331.0
|
|
100.0
|
%
|
$
|
4,607.2
|
|
100.0
|
%
|
||||||||
|
Cost of sales
|
1,166.5
|
|
83.7
|
|
1,289.1
|
|
83.2
|
|
3,635.8
|
|
83.9
|
|
3,784.5
|
|
82.1
|
|
||||||||||||
|
Gross profit
|
227.5
|
|
16.3
|
|
259.7
|
|
16.8
|
|
695.2
|
|
16.1
|
|
822.7
|
|
17.9
|
|
||||||||||||
|
Operating expenses:
|
|
|
|
|
|
|
|
|
|
|
||||||||||||||||||
|
Selling and distribution
|
85.4
|
|
6.1
|
|
95.6
|
|
6.2
|
|
285.5
|
|
6.6
|
|
295.0
|
|
6.4
|
|
||||||||||||
|
General and administrative
|
66.5
|
|
4.8
|
|
66.9
|
|
4.3
|
|
220.5
|
|
5.1
|
|
228.9
|
|
5.0
|
|
||||||||||||
|
Amortization expense
|
21.4
|
|
1.5
|
|
28.5
|
|
1.8
|
|
64.9
|
|
1.5
|
|
85.8
|
|
1.9
|
|
||||||||||||
|
Other operating expense, net
|
23.3
|
|
1.7
|
|
11.1
|
|
0.7
|
|
98.9
|
|
2.3
|
|
111.9
|
|
2.4
|
|
||||||||||||
|
Total operating expenses
|
196.6
|
|
14.1
|
|
202.1
|
|
13.0
|
|
669.8
|
|
15.5
|
|
721.6
|
|
15.7
|
|
||||||||||||
|
Operating income
|
30.9
|
|
2.2
|
|
57.6
|
|
3.8
|
|
25.4
|
|
0.6
|
|
101.1
|
|
2.2
|
|
||||||||||||
|
Other expense:
|
|
|
|
|
|
|
|
|
|
|
||||||||||||||||||
|
Interest expense
|
27.8
|
|
2.0
|
|
31.4
|
|
2.0
|
|
87.6
|
|
2.0
|
|
92.9
|
|
2.0
|
|
||||||||||||
|
Interest income
|
(1.3
|
)
|
(0.1
|
)
|
(0.4
|
)
|
—
|
|
(3.8
|
)
|
(0.1
|
)
|
(3.5
|
)
|
(0.1
|
)
|
||||||||||||
|
Loss (income) on foreign currency exchange
|
0.6
|
|
—
|
|
(2.5
|
)
|
(0.2
|
)
|
5.0
|
|
0.1
|
|
(2.8
|
)
|
(0.1
|
)
|
||||||||||||
|
Other expense (income), net
|
3.6
|
|
0.3
|
|
(1.0
|
)
|
—
|
|
6.5
|
|
0.2
|
|
0.7
|
|
0.1
|
|
||||||||||||
|
Total other expense
|
30.7
|
|
2.2
|
|
27.5
|
|
1.8
|
|
95.3
|
|
2.2
|
|
87.3
|
|
1.9
|
|
||||||||||||
|
Income (loss) before income taxes
|
0.2
|
|
—
|
|
30.1
|
|
2.0
|
|
(69.9
|
)
|
(1.6
|
)
|
13.8
|
|
0.3
|
|
||||||||||||
|
Income tax (benefit) expense
|
(5.2
|
)
|
(0.4
|
)
|
1.3
|
|
0.1
|
|
(21.1
|
)
|
(0.5
|
)
|
(9.0
|
)
|
(0.2
|
)
|
||||||||||||
|
Net income (loss)
|
$
|
5.4
|
|
0.4
|
%
|
$
|
28.8
|
|
1.9
|
%
|
$
|
(48.8
|
)
|
(1.1
|
)%
|
$
|
22.8
|
|
0.5
|
%
|
||||||||
42
Three Months Ended September 30, 2018
Compared to
Three Months Ended September 30, 2017
Net Sales
—
Third
quarter net sales
decreased
by
$154.8 million
, or
10.0%
, in
2018
compared to
2017
. The change in net sales from the
third
quarter of
2017
to the
third
quarter of
2018
was due to the following:
|
|
Dollars
|
Percent
|
|||||
|
|
(Dollars in millions)
|
||||||
|
2017 Net sales
|
$
|
1,548.8
|
|
|
|
||
|
SKU rationalization
|
(36.7
|
)
|
(2.3
|
)%
|
|||
|
Volume/mix excluding SKU rationalization
|
(137.8
|
)
|
(8.9
|
)
|
|||
|
Pricing
|
26.8
|
|
1.7
|
|
|||
|
Product recalls
|
(1.7
|
)
|
(0.1
|
)
|
|||
|
Divestitures
|
(2.7
|
)
|
(0.2
|
)
|
|||
|
Foreign currency
|
(2.7
|
)
|
(0.2
|
)
|
|||
|
2018 Net sales
|
$
|
1,394.0
|
|
(10.0
|
)%
|
||
The change in net sales was driven by the ongoing efforts to simplify and rationalize low margin SKUs, which contributed 2.3% to the year-over-year decline, and the divestiture of the McCann's business in July 2018, which contributed 0.2% to the year-over-year decline. Excluding the impact of the divestiture and SKU rationalization, net sales decreased 7.5% in the
third
quarter
2018
compared to
2017
, driven by the following:
|
•
|
Volume/mix was unfavorable 8.9% year-over-year mostly driven by declines in the Snacks and Meals segments.
|
|
•
|
Foreign currency exchange was unfavorable 0.2% in the
third
quarter of
2018
compared to
2017
.
|
|
•
|
Included in
third
quarter
2017
net sales was a $1.7 million product recall reimbursement, which did not recur in
2018
, contributing a 0.1% decrease to the year-over-year change in net sales.
|
|
•
|
Pricing was favorable 1.7% in the
third
quarter of
2018
compared to
2017
reflecting pricing actions to cover commodity, packaging, and freight inflation across most product categories.
|
Gross Profit
— Gross profit as a percentage of net sales was
16.3%
in the
third
quarter of
2018
, compared to
16.8%
in the
third
quarter of
2017
, a
decrease
of
0.5%
. Of this
decrease
, 0.4 percentage points was related to $4.7 of expenses for plant restoration costs related to a temporary shutdown at our Snacks plant in Robersonville, NC in the third quarter of 2018, and $3.2 million related to product recall reimbursement in the third quarter of 2017 that did not recur in 2018. This was partially offset by a reduction in expenses associated with restructuring programs to $7.2 million in the third quarter of 2018 compared to $10.2 million in
2017
. The remaining 0.1 percentage point decrease was primarily due to unfavorable volume/mix, higher
operating costs, including unanticipated hurricane expenses, higher freight costs, higher variable incentive compensation, and higher commodity costs, partially offset by pricing actions and lower costs resulting from a LIFO liquidation.
Operating Expenses
— Total operating expenses were
$196.6 million
in the
third
quarter of
2018
compared to
$202.1 million
in the
third
quarter of
2017
. The
decrease
in
2018
resulted from the following:
Selling and distribution expenses
decreased
$10.2 million
, or
10.7%
, in the
third
quarter of
2018
compared to the
third
quarter of
2017
driven by savings from the Structure to Win initiative and other cost saving measures, lower broker commissions, and lower freight expense due to volume, partially offset by higher freight rates and higher variable incentive compensation. Selling and distribution expenses as a percentage of net sales
decreased
0.1
percentage points to
6.1%
in the
third
quarter of
2018
, compared to
6.2%
in the
third
quarter of
2017
. This
decrease
was primarily related to savings from the Structure to Win initiative and other cost saving measures.
General and administrative expenses
decreased
$0.4 million
, or
0.6%
, in the
third
quarter of
2018
compared to the
third
quarter of
2017
. General and administrative expenses as a percentage of net sales
increased
0.5
percentage points to
4.8%
in the
third
quarter of
2018
, compared to
4.3%
in the
third
quarter of
2017
. Of this
increase
, 0.2 percentage points was related to $5.1 million of costs associated with restructuring programs and acquisition, integration, divestiture and related costs in
2018
, compared to $3.4 million associated with acquisition, integration, divestiture and related costs in
2017
. The remaining 0.3 percentage point increase year-over-year was mostly due increased variable incentive compensation partially offset by savings from the Structure to Win initiative and other cost saving measures.
43
Amortization expense
decreased
$7.1 million
in the
third
quarter of
2018
compared to the
third
quarter of
2017
reflecting the impairment of the customer related intangible assets in the Snacks segment in the fourth quarter of
2017
.
Other operating expense was
$23.3 million
in the
third
quarter of
2018
compared to
$11.1 million
in the
third
quarter of
2017
, an
increase
of
$12.2 million
. The
increase
was mostly due to $26.8 million of higher costs in
2018
associated with restructuring programs that were announced in recent quarters with respect to the TreeHouse 2020 margin improvement plan and the Company’s plant closures partially offset by a gain on the divestiture of the McCann's business of $14.3 million. See
Note 2
and
Note 14
to our Condensed Consolidated Financial Statements for additional information regarding restructuring programs and other operating expense, net.
Interest Expense
— Interest expense
decreased
to
$27.8 million
in the
third
quarter of
2018
, compared to
$31.4 million
in
2017
, primarily due to lower net debt and lower credit facility pricing from the December 1, 2017 credit agreement amendment, partially offset by higher interest rates and the write-off of $0.7 million of deferred debt issuance costs associated with the repurchase of the 2022 Notes and 2024 Notes in the
third
quarter of
2018
. The higher interest rates reflect the year-over-year increase in LIBOR.
Interest Income
– Interest income of
$1.3 million
primarily relates to cash held by our Canadian subsidiaries and gains on investments. Interest income increased slightly from the
third
quarter of
2017
.
Foreign Currency
— The Company’s foreign currency impact was a
$0.6 million
loss for
third
quarter of
2018
, compared to income of
$2.5 million
in the
third
quarter of
2017
, primarily due to fluctuations in currency exchange rates between the U.S. and Canadian dollar during the respective periods.
Other Expense (Income), net
— Other expense was
$3.6 million
for the
third
quarter of 2018, compared to income of
$1.0 million
in the
third
quarter of
2017
. The change was primarily due to expenses associated with tax indemnification and a loss on debt extinguishment related to the repurchase of 2022 Notes and 2024 Notes partially offset by an increase in non-cash mark-to-market gains from hedging activities, driven by interest rate swaps.
Income Taxes
— Income tax (benefit) expense was a benefit of $5.2 million in the third quarter of 2018 compared to an expense of $1.3 million for the same period of 2017. The income tax benefit in the third quarter of 2018 was primarily driven by the release of certain tax reserves related to statute expirations of $6.7 million. In tandem with recognizing the $6.7 million tax benefit, during the third quarter of 2018 the Company wrote off $6.7 million of related tax indemnification asset, which was reflected in Other expense (income), net in the Condensed Consolidated Statements of Operations. The remaining fluctuation in the tax provision for the third quarter of 2018 compared to the third quarter of 2017 was primarily a result of the reduction in the U.S. Federal statutory tax rate, an increase in the amount of income tax benefit from the release of certain tax reserves, a reduction in the benefit from foreign tax credits on a year-over-year basis, and the overall impact of discrete items on low third quarter income before taxes. Our effective tax rate may change from period to period based on recurring and non-recurring factors including the jurisdictional mix of earnings, enacted tax legislation, state income taxes, settlement of tax audits, and the expiration of the statute of limitations in relation to unrecognized tax benefits.
The Company’s effective tax rate differs from the U.S. federal statutory tax rate primarily due to state tax expense, executive compensation expense that is not deductible for tax purposes, and an intercompany financing structure entered into in conjunction with the E.D. Smith Foods, Ltd. (“E.D. Smith”) acquisition in 2007.
44
Three Months Ended September 30, 2018
Compared to
Three Months Ended September 30, 2017
— Results by Segment
Baked Goods
|
|
Three Months Ended September 30,
|
|||||||||||||
|
|
2018
|
2017
|
||||||||||||
|
|
Dollars
|
Percent
|
Dollars
|
Percent
|
||||||||||
|
|
(Dollars in millions)
|
|||||||||||||
|
Net sales
|
$
|
332.8
|
|
100.0
|
%
|
$
|
351.2
|
|
100.0
|
%
|
||||
|
Cost of sales
|
269.2
|
|
80.9
|
|
275.1
|
|
78.3
|
|
||||||
|
Gross profit
|
63.6
|
|
19.1
|
|
76.1
|
|
21.7
|
|
||||||
|
Freight out and commissions
|
22.5
|
|
6.8
|
|
22.2
|
|
6.3
|
|
||||||
|
Direct selling, general, and administrative
|
5.9
|
|
1.7
|
|
7.0
|
|
2.0
|
|
||||||
|
Direct operating income
|
$
|
35.2
|
|
10.6
|
%
|
$
|
46.9
|
|
13.4
|
%
|
||||
Net sales in the Baked Goods segment
decreased
$18.4 million
, or
5.2%
, in the
third
quarter of
2018
compared to the
third
quarter of
2017
. The change in net sales from
2017
to
2018
was due to the following:
|
|
Dollars
|
Percent
|
|||||
|
|
(Dollars in millions)
|
||||||
|
2017 Net sales
|
$
|
351.2
|
|
|
|
||
|
SKU rationalization
|
(7.6
|
)
|
(2.1
|
)%
|
|||
|
Volume/mix excluding SKU rationalization
|
(18.6
|
)
|
(5.3
|
)
|
|||
|
Pricing
|
8.5
|
|
2.4
|
|
|||
|
Foreign currency
|
(0.7
|
)
|
(0.2
|
)
|
|||
|
2018 Net sales
|
$
|
332.8
|
|
(5.2
|
)%
|
||
Net sales
decreased
during the
third
quarter of
2018
compared to the
third
quarter of
2017
primarily due to unfavorable volume/mix due to lost distribution from competitive pressure in the dough, crackers, and cookies categories combined with unfavorable mix, the ongoing efforts to simplify and rationalize low margin SKUs, and unfavorable foreign currency, partially offset by favorable pricing driven by commodity and freight inflation.
Gross profit as a percentage of net sales
decreased
2.6
percentage points, from
21.7%
in the
third
quarter of
2017
to
19.1%
in the
third
quarter of
2018
, primarily due to higher operating costs, higher commodity costs (wheat, eggs, and resin), and unfavorable volume/mix, partially offset by favorable pricing.
Freight out and commissions paid to independent sales brokers was
$22.5 million
in the
third
quarter of
2018
, compared to
$22.2 million
in the
third
quarter of
2017
. Freight and commissions as a percentage of net sales
increased
0.5
percentage points year-over-year due to freight cost inflation, particularly in the temperature controlled freight market.
Direct selling, general, and administrative expenses were
$5.9 million
in the
third
quarter of
2018
compared to
$7.0 million
in the
third
quarter of
2017
. The
decrease
in direct selling, general, and administrative expenses as a percentage of net sales was primarily due to Structure to Win savings combined with lower spend due to other cost saving activities.
45
Beverages
|
|
Three Months Ended September 30,
|
|||||||||||||
|
|
2018
|
2017
|
||||||||||||
|
|
Dollars
|
Percent
|
Dollars
|
Percent
|
||||||||||
|
|
(Dollars in millions)
|
|||||||||||||
|
Net sales
|
$
|
236.3
|
|
100.0
|
%
|
$
|
244.9
|
|
100.0
|
%
|
||||
|
Cost of sales
|
180.4
|
|
76.3
|
|
178.3
|
|
72.8
|
|
||||||
|
Gross profit
|
55.9
|
|
23.7
|
|
66.6
|
|
27.2
|
|
||||||
|
Freight out and commissions
|
7.9
|
|
3.3
|
|
10.3
|
|
4.2
|
|
||||||
|
Direct selling, general, and administrative
|
3.9
|
|
1.7
|
|
4.6
|
|
1.9
|
|
||||||
|
Direct operating income
|
$
|
44.1
|
|
18.7
|
%
|
$
|
51.7
|
|
21.1
|
%
|
||||
Net sales in the Beverages segment
decreased
$8.6 million
, or
3.5%
, in the
third
quarter of
2018
compared to the
third
quarter of
2017
. The change in net sales from
2017
to
2018
was due to the following:
|
|
Dollars
|
Percent
|
|||||
|
|
(Dollars in millions)
|
||||||
|
2017 Net sales
|
$
|
244.9
|
|
|
|
||
|
SKU rationalization
|
(3.9
|
)
|
(1.6
|
)%
|
|||
|
Volume/mix excluding SKU rationalization
|
(3.5
|
)
|
(1.4
|
)
|
|||
|
Pricing
|
(1.2
|
)
|
(0.5
|
)
|
|||
|
2018 Net sales
|
$
|
236.3
|
|
(3.5
|
)%
|
||
Net sales
decreased
during the
third
quarter of
2018
compared to the
third
quarter of
2017
primarily due to the ongoing efforts to simplify and rationalize low margin SKUs, unfavorable volume/mix in creamers, partially offset by category gains in broth. Pricing was unfavorable primarily due to competitive pressure in the single serve beverages category, partially offset by favorable pricing driven by commodity inflation.
Gross profit as a percentage of net sales
decreased
3.5
percentage points, from
27.2%
in the
third
quarter of
2017
to
23.7%
in the
third
quarter of
2018
, primarily due to a labor dispute and ensuing recovery at a creamer plant that has driven unfavorable volume/mix and higher operating costs.
Freight out and commissions paid to independent sales brokers was
$7.9 million
in the
third
quarter of
2018
, compared to
$10.3 million
in the
third
quarter of
2017
. Freight and commissions as a percentage of net sales
decreased
0.9
percentage points year-over-year due to improvements in logistics efficiency.
Direct selling, general, and administrative expenses were
$3.9 million
in the
third
quarter of
2018
, compared to
$4.6 million
in the
third
quarter of
2017
. The
decrease
in direct selling, general, and administrative expenses as a percentage of net sales was primarily due to Structure to Win savings combined with lower spend due to other cost saving activities.
46
Condiments
|
|
Three Months Ended September 30,
|
|||||||||||||
|
|
2018
|
2017
|
||||||||||||
|
|
Dollars
|
Percent
|
Dollars
|
Percent
|
||||||||||
|
|
(Dollars in millions)
|
|||||||||||||
|
Net sales
|
$
|
317.1
|
|
100.0
|
%
|
$
|
333.8
|
|
100.0
|
%
|
||||
|
Cost of sales
|
248.8
|
|
78.5
|
|
278.8
|
|
83.5
|
|
||||||
|
Gross profit
|
68.3
|
|
21.5
|
|
55.0
|
|
16.5
|
|
||||||
|
Freight out and commissions
|
14.0
|
|
4.4
|
|
14.8
|
|
4.4
|
|
||||||
|
Direct selling, general, and administrative
|
4.9
|
|
1.5
|
|
5.8
|
|
1.8
|
|
||||||
|
Direct operating income
|
$
|
49.4
|
|
15.6
|
%
|
$
|
34.4
|
|
10.3
|
%
|
||||
Net sales in the Condiments segment
decreased
$16.7 million
, or
5.0%
, in the
third
quarter of
2018
compared to the
third
quarter of
2017
. The change in net sales from
2017
to
2018
was due to the following:
|
|
Dollars
|
Percent
|
|||||
|
|
(Dollars in millions)
|
||||||
|
2017 Net sales
|
$
|
333.8
|
|
|
|
||
|
SKU rationalization
|
(16.1
|
)
|
(4.8
|
)%
|
|||
|
Volume/mix excluding SKU rationalization
|
(9.0
|
)
|
(2.7
|
)
|
|||
|
Pricing
|
10.4
|
|
3.1
|
|
|||
|
Foreign currency
|
(2.0
|
)
|
(0.6
|
)
|
|||
|
2018 Net sales
|
$
|
317.1
|
|
(5.0
|
)%
|
||
Net sales
decreased
during the
third
quarter of
2018
compared to the
third
quarter of
2017
primarily due to the ongoing efforts to simplify and rationalize low margin SKUs, unfavorable volume/mix due to competitive pressure in pickles and preserves, and unfavorable foreign currency exchange rates, partially offset by favorable pricing driven by commodity inflation.
Gross profit as a percentage of net sales
increased
5.0
percentage points, from
16.5%
in the
third
quarter of
2017
to
21.5%
in the
third
quarter of
2018
, primarily due to favorable pricing and lower costs resulting from a LIFO liquidation.
Freight out and commissions paid to independent sales brokers was
$14.0 million
in the
third
quarter of
2018
, compared to
$14.8 million
in the
third
quarter of
2017
. Freight and commissions as a percentage of net sales were flat year-over-year.
Direct selling, general, and administrative expenses were
$4.9 million
in the
third
quarter of
2018
and
$5.8 million
in the
third
quarter of
2017
. The
decrease
in direct selling, general, and administrative expenses as a percentage of net sales was primarily due to Structure to Win savings combined with lower spend due to other cost saving activities.
Meals
|
|
Three Months Ended September 30,
|
|||||||||||||
|
|
2018
|
2017
|
||||||||||||
|
|
Dollars
|
Percent
|
Dollars
|
Percent
|
||||||||||
|
|
(Dollars in millions)
|
|||||||||||||
|
Net sales
|
$
|
253.7
|
|
100.0
|
%
|
$
|
284.6
|
|
100.0
|
%
|
||||
|
Cost of sales
|
206.1
|
|
81.2
|
|
233.7
|
|
82.1
|
|
||||||
|
Gross profit
|
47.6
|
|
18.8
|
|
50.9
|
|
17.9
|
|
||||||
|
Freight out and commissions
|
10.3
|
|
4.1
|
|
11.6
|
|
4.1
|
|
||||||
|
Direct selling, general, and administrative
|
7.5
|
|
3.0
|
|
7.2
|
|
2.5
|
|
||||||
|
Direct operating income
|
$
|
29.8
|
|
11.7
|
%
|
$
|
32.1
|
|
11.3
|
%
|
||||
47
Net sales in the Meals segment
decreased
$30.9 million
, or
10.9%
, in the
third
quarter of
2018
compared to the
third
quarter of
2017
. The change in net sales from
2017
to
2018
was due to the following:
|
|
Dollars
|
Percent
|
|||||
|
|
(Dollars in millions)
|
||||||
|
2017 Net sales
|
$
|
284.6
|
|
|
|
||
|
SKU rationalization
|
(5.7
|
)
|
(2.0
|
)%
|
|||
|
Volume/mix excluding SKU rationalization
|
(31.0
|
)
|
(11.0
|
)
|
|||
|
Pricing
|
8.5
|
|
3.0
|
|
|||
|
Divestiture
|
(2.7
|
)
|
(0.9
|
)
|
|||
|
2018 Net sales
|
$
|
253.7
|
|
(10.9
|
)%
|
||
Net sales
decreased
during the
third
quarter of
2018
compared to the
third
quarter of
2017
due to unfavorable volume/mix from competitive pressure (principally in the ready-to-eat cereal, pasta, and dry dinner categories) and category softness (principally in the ready-to-eat cereal category), the ongoing efforts to simplify and rationalize low margin SKUs, and the divestiture of the McCann's business in July 2018. These decreases were partially offset by favorable pricing driven by commodity and freight inflation.
Gross profit as a percentage of net sales
increased
0.9
percentage points, from
17.9%
in the
third
quarter of
2017
to
18.8%
in the
third
quarter of
2018
, primarily due to favorable pricing and lower operating costs from plant closures and supply chain optimization activities.
Freight out and commissions paid to independent sales brokers was
$10.3 million
in the
third
quarter of
2018
, compared to
$11.6 million
in the
third
quarter of
2017
. Freight and commissions as a percentage of net sales was consistent year-over-year.
Direct selling, general, and administrative expenses were
$7.5 million
in the
third
quarter of
2018
compared to
$7.2 million
in
2017
. Direct selling, general, and administrative expenses as a percentage of net sales
increased
compared to prior year primarily due to advertising investments in the pasta category.
Snacks
|
|
Three Months Ended September 30,
|
|||||||||||||
|
|
2018
|
2017
|
||||||||||||
|
|
Dollars
|
Percent
|
Dollars
|
Percent
|
||||||||||
|
|
(Dollars in millions)
|
|||||||||||||
|
Net sales
|
$
|
254.1
|
|
100.0
|
%
|
$
|
332.6
|
|
100.0
|
%
|
||||
|
Cost of sales
|
247.2
|
|
97.3
|
|
317.6
|
|
95.5
|
|
||||||
|
Gross profit
|
6.9
|
|
2.7
|
|
15.0
|
|
4.5
|
|
||||||
|
Freight out and commissions
|
7.0
|
|
2.8
|
|
8.4
|
|
2.5
|
|
||||||
|
Direct selling, general, and administrative
|
3.7
|
|
1.4
|
|
4.8
|
|
1.5
|
|
||||||
|
Direct operating income
|
$
|
(3.8
|
)
|
(1.5
|
)%
|
$
|
1.8
|
|
0.5
|
%
|
||||
48
Net sales in the Snacks segment
decreased
$78.5 million
, or
23.6%
, in the
third
quarter of
2018
compared to the
third
quarter of
2017
. The change in net sales from
2017
to
2018
was due to the following:
|
|
Dollars
|
Percent
|
|||||
|
|
(Dollars in millions)
|
||||||
|
2017 Net sales
|
$
|
332.6
|
|
|
|
||
|
SKU rationalization
|
(3.4
|
)
|
(1.0
|
)%
|
|||
|
Volume/mix excluding SKU rationalization
|
(75.7
|
)
|
(22.8
|
)
|
|||
|
Pricing
|
0.6
|
|
0.2
|
|
|||
|
2018 Net sales
|
$
|
254.1
|
|
(23.6
|
)%
|
||
Net sales
decreased
during the
third
quarter of
2018
compared to the
third
quarter of
2017
primarily due to unfavorable volume from the expected loss of low margin business, competitive pressure in all categories (snack nuts, trail mix, and bars) combined with business interruption resulting from hurricane activity. Sales also decreased due to the ongoing efforts to simplify and rationalize low margin SKUs, partially offset by favorable pricing.
Gross profit as a percentage of net sales
decreased
1.8
percentage points, from
4.5%
in the
third
quarter of
2017
to
2.7%
in the
third
quarter of
2018
, primarily due to lower volume and higher operating costs partially attributed to hurricane activity.
Freight out and commissions paid to independent sales brokers was
$7.0 million
in the
third
quarter of
2018
, compared to
$8.4 million
in
2017
. Freight and commissions as a percentage of net sales
increased
0.3
percentage points year-over-year due to freight cost inflation.
Direct selling, general, and administrative expenses were
$3.7 million
in the
third
quarter of
2018
compared to
$4.8 million
in the
third
quarter of
2017
. The
decrease
in direct selling, general, and administrative expenses as a percentage of net sales was primarily due to the impact of fixed overhead costs that did not adjust proportionately with the decrease in net sales in the quarter, partially offset by Structure to Win savings combined with lower spend due to other cost saving activities.
Nine Months Ended September 30, 2018
Compared to
Nine Months Ended September 30, 2017
Net Sales
— Net sales
decreased
by
$276.2 million
, or
6.0%
, in the first
nine
months of
2018
compared to the first
nine
months of
2017
. The change in net sales from
2017
to
2018
was due to the following:
|
|
Dollars
|
Percent
|
|||||
|
|
(Dollars in millions)
|
||||||
|
2017 Net sales
|
$
|
4,607.2
|
|
|
|
||
|
SKU rationalization
|
(141.7
|
)
|
(3.1
|
)%
|
|||
|
Volume/mix excluding SKU rationalization
|
(133.0
|
)
|
(2.9
|
)
|
|||
|
Pricing
|
62.7
|
|
1.4
|
|
|||
|
Product recalls
|
(5.5
|
)
|
(0.1
|
)
|
|||
|
Divestitures
|
(62.2
|
)
|
(1.4
|
)
|
|||
|
Foreign currency
|
3.5
|
|
0.1
|
|
|||
|
2018 Net sales
|
$
|
4,331.0
|
|
(6.0
|
)%
|
||
The change in net sales was driven by the ongoing efforts to simplify and rationalize low margin SKUs, which contributed 3.1% to the year-over-year decline, and the divestiture of the McCann's business in July 2018 and the SIF business in May 2017, which contributed 1.4% to the year-over-year decline. Excluding the impact of SKU rationalization and the divestitures, net sales decreased 1.5% in the first
nine
months of
2018
compared to
2017
, driven by the following:
|
•
|
Volume/mix was unfavorable year-over-year driven by the Meals and Snacks segments.
|
|
•
|
Included in the first
nine
months of
2017
net sales was a $5.5 million product recall reimbursement, which did not repeat in
2018
, that contributed a decrease of 0.1% to the change in net sales year-over-year.
|
49
|
•
|
Pricing was favorable 1.4% in the first
nine
months of
2018
compared to
2017
reflecting pricing actions to cover commodity and freight inflation.
|
|
•
|
Foreign currency exchange was favorable 0.1% in the first
nine
months of
2018
compared to
2017
.
|
Gross Profit
— Gross profit as a percentage of net sales was
16.1%
in the first
nine
months of
2018
, compared to
17.9%
in the first
nine
months of
2017
, a
decrease
of
1.8
percentage points. Of this decrease, 0.4 percentage points was related to $18.8 million of expenses for restructuring programs and $4.7 million of expenses for plant restoration in the first
nine
months of
2018
, compared to $13.5 million for restructuring programs and a $8.4 million reimbursement related to product recalls in the first
nine
months of
2017
. The remaining 1.4 percentage point decrease in gross profit as a percentage of net sales was primarily due to lower volumes, higher operating costs including costs associated with a labor dispute in the Beverages segment and higher freight costs, higher commodity costs, and higher variable incentive compensation, partially offset by favorable pricing and lower costs resulting from a LIFO liquidation.
Operating Expenses
— Total operating expenses were
$669.8 million
in the first
nine
months of
2018
compared to
$721.6 million
in the first
nine
months of
2017
. The
decrease
in
2018
resulted from the following:
Selling and distribution expenses
decreased
$9.5 million
, or
3.2%
, in the first
nine
months of
2018
compared to the first
nine
months of
2017
. Selling and distribution expenses as a percentage of net sales
increased
0.2
percentage points to
6.6%
in the first
nine
months of
2018
compared to
6.4%
in the first
nine
months of
2017
. This
increase
was primarily related to higher freight due to freight cost inflation and increases in the use of the spot market, and higher variable incentive compensation, partially offset by lower freight volumes and savings from the Structure to Win initiative and other cost saving measures.
General and administrative expenses
decreased
by
$8.4 million
or
3.7%
, in the first
nine
months of
2018
compared to the first
nine
months of
2017
. General and administrative expenses as a percentage of net sales
increased
0.1
percentage point from
5.0%
in the first
nine
months of 2017 to
5.1%
in the first
nine
months of
2018
. An increase of 0.2 percentage points was related to $13.0 million of CEO transition expense mostly related to incremental stock based compensation expense for modified awards and $8.3 million of expenses related to restructuring programs; acquisition, integration, divestiture and related costs; and debt amendment and repurchase costs in the first
nine
months of
2018
compared to $12.7 million of acquisition, integration, divestiture, and related costs in the first
nine
months of
2017
. The remaining 0.1 percentage point decline year-over-year was due to savings from the Structure to Win initiative and other cost saving measures, partially offset by increased variable incentive compensation.
Amortization expense
decreased
$20.9 million
in the first
nine
months of
2018
compared to the first
nine
months of
2017
reflecting the impairment of the customer related intangible assets in the Snacks segment in the fourth quarter of
2017
.
Other operating expense was
$98.9 million
in the first
nine
months of
2018
compared to
$111.9 million
in the first
nine
months of
2017
. The
decrease
was mostly due to the loss on the divestiture of the SIF business of $85.6 million in the second quarter of
2017
partially offset by the gain on the divestiture of the McCann's business of $14.3 million in the third quarter of 2018 and higher costs associated with restructuring programs that were announced in recent quarters with respect to the Company’s TreeHouse 2020 margin improvement activities and other plant closures. See
Note 2
to our Condensed Consolidated Financial Statements for additional information regarding restructuring activity.
Interest Expense
— Interest expense
decreased
to
$87.6 million
in the first
nine
months of
2018
, compared to
$92.9 million
in
2017
, due to lower net debt and lower credit facility pricing from the December 1, 2017 credit agreement amendment, partially offset by higher interest rates and the write-off of $2.4 million deferred debt issuance costs associated with the repurchase of the 2022 Notes and 2024 Notes in the second and third quarters of
2018
. The higher interest rates reflect the year-over-year increase in the LIBOR interest rate.
Interest Income
– Interest income of
$3.8 million
in the first
nine
months of
2018
primarily relates to cash held by our Canadian subsidiaries and gains on investments. Interest income increased slightly from
2017
.
Foreign Currency
— The Company’s foreign currency impact was a
$5.0 million
expense for the first
nine
months of
2018
, compared to a gain of
$2.8 million
in the first
nine
months of
2017
, primarily due to fluctuations in currency exchange rates between the U.S. and Canadian dollar during the respective periods.
Other Expense (Income), net
— Other expense was
$6.5 million
for the first
nine
months of
2018
, compared to
$0.7 million
in the first
nine
months of
2017
. The change was mostly due to expenses associated with tax indemnification, a loss on debt
50
extinguishment related to the repurchase of 2022 Notes and 2024 Notes, partially offset by the non-cash mark-to-market adjustments on derivative instruments, primarily interest rate swaps and foreign currency contracts.
Income Taxes
— Income tax (benefit) expense was a benefit of
$21.1 million
in the first
nine
months of
2018
compared to a benefit of
$9.0 million
for the same period of
2017
. The income tax benefit in the first nine months of 2018 was primarily driven by the release of certain tax reserves related to statute expirations of $7.9 million. In tandem with recognizing the $7.9 million tax benefit, during the first nine months of 2018 the Company wrote off $7.9 million of related tax indemnification asset, which was reflected in Other expense (income), net in the Condensed Consolidated Statements of Operations. The remaining fluctuation in the tax provision for the first
nine
months of 2018 compared to the first
nine
months of
2017
is primarily a result of the reduction in the U.S. Federal statutory tax rate, an increase in the amount of income tax benefit from the release of tax reserves, a decrease in the tax deduction related to share-based payments, and a reduction in the benefit from foreign tax credits on a year-over-year basis. The Company’s effective tax rate may change from period to period based on recurring and non-recurring factors including the jurisdictional mix of earnings, enacted tax legislation, state income taxes, settlement of tax audits, and the expiration of the statute of limitations in relation to unrecognized tax benefits.
The Company’s effective tax rate differs from the U.S. federal statutory tax rate primarily due to state tax expense, executive compensation that is not deductible for tax purposes, and an intercompany financing structure entered into in conjunction with the E.D. Smith acquisition in 2007.
Nine Months Ended September 30, 2018
Compared to
Nine Months Ended September 30, 2017
— Results by Segment
Baked Goods
|
|
Nine Months Ended September 30,
|
|||||||||||||
|
|
2018
|
2017
|
||||||||||||
|
|
Dollars
|
Percent
|
Dollars
|
Percent
|
||||||||||
|
|
(Dollars in millions)
|
|||||||||||||
|
Net sales
|
$
|
997.9
|
|
100.0
|
%
|
$
|
1,016.6
|
|
100.0
|
%
|
||||
|
Cost of sales
|
807.2
|
|
80.9
|
|
807.6
|
|
79.4
|
|
||||||
|
Gross profit
|
190.7
|
|
19.1
|
|
209.0
|
|
20.6
|
|
||||||
|
Freight out and commissions
|
77.2
|
|
7.7
|
|
63.8
|
|
6.3
|
|
||||||
|
Direct selling, general, and administrative
|
19.5
|
|
2.0
|
|
23.9
|
|
2.4
|
|
||||||
|
Direct operating income
|
$
|
94.0
|
|
9.4
|
%
|
$
|
121.3
|
|
11.9
|
%
|
||||
Net sales in the Baked Goods segment
decreased
$18.7 million
, or
1.8%
, in the first
nine
months of
2018
compared to the first
nine
months of
2017
. The change in net sales from
2017
to
2018
was due to the following:
|
|
Dollars
|
Percent
|
|||||
|
|
(Dollars in millions)
|
||||||
|
2017 Net sales
|
$
|
1,016.6
|
|
|
|
||
|
SKU rationalization
|
(18.7
|
)
|
(1.8
|
)%
|
|||
|
Volume/mix excluding SKU rationalization
|
(18.5
|
)
|
(1.8
|
)
|
|||
|
Pricing
|
17.6
|
|
1.7
|
|
|||
|
Foreign currency
|
0.9
|
|
0.1
|
|
|||
|
2018 Net sales
|
$
|
997.9
|
|
(1.8
|
)%
|
||
The change in net sales from
2017
to
2018
was due to the ongoing efforts to simplify and rationalize low margin SKUs, unfavorable volume/mix predominately in the cracker, dough, and cookies categories, partially offset by favorable pricing driven by commodity and freight inflation and favorable foreign currency.
Gross profit as a percentage of net sales
decreased
1.5
percentage points, from
20.6%
in the first
nine
months of
2017
to
19.1%
in the first
nine
months of
2018
, primarily due to higher plant operations, higher warehouse costs, higher commodity costs (wheat and eggs), and unfavorable mix partially offset by favorable pricing.
51
Freight out and commissions paid to independent sales brokers was
$77.2 million
in the first
nine
months of
2018
, compared to
$63.8 million
in the first
nine
months of
2017
. Freight and commissions as a percentage of net sales
increased
1.4
percentage points from the first
nine
months of
2017
due to freight cost inflation, particularly in the temperature controlled freight market.
Direct selling, general, and administrative expenses were
$19.5 million
in the first
nine
months of
2018
compared to
$23.9 million
in the first
nine
months of
2017
. The
decrease
in direct selling, general, and administrative expenses as a percentage of net sales was primarily attributable to lower spend due to Structure to Win savings combined with lower spend due to other cost saving activities.
Beverages
|
|
Nine Months Ended September 30,
|
|||||||||||||
|
|
2018
|
2017
|
||||||||||||
|
|
Dollars
|
Percent
|
Dollars
|
Percent
|
||||||||||
|
|
(Dollars in millions)
|
|||||||||||||
|
Net sales
|
$
|
721.8
|
|
100.0
|
%
|
$
|
759.1
|
|
100.0
|
%
|
||||
|
Cost of sales
|
552.8
|
|
76.6
|
|
544.6
|
|
71.7
|
|
||||||
|
Gross profit
|
169.0
|
|
23.4
|
|
214.5
|
|
28.3
|
|
||||||
|
Freight out and commissions
|
26.7
|
|
3.7
|
|
28.3
|
|
3.8
|
|
||||||
|
Direct selling, general, and administrative
|
13.0
|
|
1.8
|
|
15.5
|
|
2.0
|
|
||||||
|
Direct operating income
|
$
|
129.3
|
|
17.9
|
%
|
$
|
170.7
|
|
22.5
|
%
|
||||
Net sales in the Beverages segment
decreased
$37.3 million
, or
4.9%
, in the first
nine
months of
2018
compared to the first
nine
months of
2017
. The change in net sales from
2017
to
2018
was due to the following:
|
|
Dollars
|
Percent
|
|||||
|
|
(Dollars in millions)
|
||||||
|
2017 Net sales
|
$
|
759.1
|
|
|
|
||
|
SKU rationalization
|
(16.0
|
)
|
(2.1
|
)%
|
|||
|
Volume/mix excluding SKU rationalization
|
(15.3
|
)
|
(2.0
|
)
|
|||
|
Pricing
|
(6.0
|
)
|
(0.8
|
)
|
|||
|
2018 Net sales
|
$
|
721.8
|
|
(4.9
|
)%
|
||
Net sales
decreased
from
2017
to
2018
primarily due to the ongoing efforts to simplify and rationalize low margin SKUs, unfavorable volume/mix related to a labor dispute at one of our Beverage plants and competitive pressure in the single serve beverage category. Pricing was also unfavorable due to competitive pressure.
Gross profit as a percentage of net sales
decreased
4.9
percentage points, from
28.3%
in the first
nine
months of
2017
to
23.4%
in the first
nine
months of
2018
, primarily due to higher operating costs (creamers), higher commodity costs (primarily oils), and unfavorable pricing due to competitive pressure.
Freight out and commissions paid to independent sales brokers was
$26.7 million
in the first
nine
months of
2018
, compared to
$28.3 million
in the first
nine
months of
2017
. Freight out and commissions as a percentage of net sales
decreased
0.1
percentage points from the first
nine
months of
2017
due to improvements in logistics efficiency partially offset by freight cost inflation.
Direct selling, general, and administrative expenses were
$13.0 million
in the first
nine
months of
2018
and
$15.5 million
in the first
nine
months of
2017
. The
decrease
in direct selling, general, and administrative expenses as a percent of net sales was primarily attributable to lower spend due to Structure to Win savings combined with lower spend due to other cost saving activities.
52
Condiments
|
|
Nine Months Ended September 30,
|
|||||||||||||
|
|
2018
|
2017
|
||||||||||||
|
|
Dollars
|
Percent
|
Dollars
|
Percent
|
||||||||||
|
|
(Dollars in millions)
|
|||||||||||||
|
Net sales
|
$
|
968.4
|
|
100.0
|
%
|
$
|
988.8
|
|
100.0
|
%
|
||||
|
Cost of sales
|
795.6
|
|
82.2
|
|
824.5
|
|
83.4
|
|
||||||
|
Gross profit
|
172.8
|
|
17.8
|
|
164.3
|
|
16.6
|
|
||||||
|
Freight out and commissions
|
44.8
|
|
4.6
|
|
42.2
|
|
4.3
|
|
||||||
|
Direct selling, general, and administrative
|
15.3
|
|
1.6
|
|
19.9
|
|
2.0
|
|
||||||
|
Direct operating income
|
$
|
112.7
|
|
11.6
|
%
|
$
|
102.2
|
|
10.3
|
%
|
||||
Net sales in the Condiments segment
decreased
$20.4 million
, or
2.1%
, in the first
nine
months of
2018
compared to the first
nine
months of
2017
. The change in net sales from
2017
to
2018
was due to the following:
|
|
Dollars
|
Percent
|
|||||
|
|
(Dollars in millions)
|
||||||
|
2017 Net sales
|
$
|
988.8
|
|
|
|
||
|
SKU rationalization
|
(45.7
|
)
|
(4.7
|
)%
|
|||
|
Volume/mix excluding SKU rationalization
|
2.4
|
|
0.2
|
|
|||
|
Pricing
|
20.3
|
|
2.1
|
|
|||
|
Foreign currency
|
2.6
|
|
0.3
|
|
|||
|
2018 Net sales
|
$
|
968.4
|
|
(2.1
|
)%
|
||
Net sales
decreased
from
2017
to
2018
due to the ongoing efforts to simplify and rationalize low margin SKUs. The decline was partially offset by favorable pricing driven by commodity and freight inflation, favorable volume/mix excluding SKU rationalization and favorable foreign currency.
Gross profit as a percentage of net sales
increased
1.2
percentage points, from
16.6%
in the first
nine
months of
2017
to
17.8%
in the first
nine
months of
2018
, primarily due to favorable pricing and lower costs resulting from a LIFO liquidation.
Freight out and commissions paid to independent sales brokers was
$44.8 million
in the first
nine
months of
2018
, compared to
$42.2 million
in the first
nine
months of
2017
. Freight and commissions as a percentage of net sales
increased
0.3
percentage points from the first
nine
months of
2017
primarily due to freight cost inflation.
Direct selling, general, and administrative expenses were
$15.3 million
in the first
nine
months of
2018
and
$19.9 million
in the first
nine
months of
2017
. The
decrease
in direct selling, general, and administrative expenses as a percent of net sales was primarily attributable to lower spend due to Structure to Win savings combined with lower spend due to other cost saving activities.
53
Meals
|
|
Nine Months Ended September 30,
|
|||||||||||||
|
|
2018
|
2017
|
||||||||||||
|
|
Dollars
|
Percent
|
Dollars
|
Percent
|
||||||||||
|
|
(Dollars in millions)
|
|||||||||||||
|
Net sales
|
$
|
777.2
|
|
100.0
|
%
|
$
|
897.0
|
|
100.0
|
%
|
||||
|
Cost of sales
|
633.5
|
|
81.5
|
|
735.6
|
|
82.0
|
|
||||||
|
Gross profit
|
143.7
|
|
18.5
|
|
161.4
|
|
18.0
|
|
||||||
|
Freight out and commissions
|
34.9
|
|
4.5
|
|
39.2
|
|
4.4
|
|
||||||
|
Direct selling, general, and administrative
|
20.7
|
|
2.7
|
|
22.3
|
|
2.5
|
|
||||||
|
Direct operating income
|
$
|
88.1
|
|
11.3
|
%
|
$
|
99.9
|
|
11.1
|
%
|
||||
Net sales in the Meals segment
decreased
$119.8 million
, or
13.4%
, in the first
nine
months of
2018
compared to the first
nine
months of
2017
. The change in net sales from
2017
to
2018
was due to the following:
|
|
Dollars
|
Percent
|
|||||
|
|
(Dollars in millions)
|
||||||
|
2017 Net sales
|
$
|
897.0
|
|
|
|
||
|
SKU rationalization
|
(17.9
|
)
|
(2.0
|
)%
|
|||
|
Volume/mix excluding SKU rationalization
|
(59.6
|
)
|
(6.6
|
)
|
|||
|
Pricing
|
19.9
|
|
2.2
|
|
|||
|
Divestitures
|
(62.2
|
)
|
(7.0
|
)
|
|||
|
2018 Net sales
|
$
|
777.2
|
|
(13.4
|
)%
|
||
Net sales
decreased
from
2017
to
2018
primarily due to unfavorable volume/mix from competitive pressure (principally in the pasta, ready-to-eat cereal, and dry dinner categories), the divestiture of the McCann's and SIF businesses, and the ongoing efforts to simplify and rationalize low margin SKUs, partially offset by favorable pricing driven by commodity and freight inflation.
Gross profit as a percentage of net sales
increased
0.5
percentage points, from
18.0%
in the first
nine
months of
2017
to
18.5%
in the first
nine
months of
2018
, primarily due to lower operating costs from plant closure and supply chain optimization activities and favorable pricing net of commodity cost inflation (durum, flour, and packaging).
Freight out and commissions paid to independent sales brokers was
$34.9 million
in the first
nine
months of
2018
, compared to
$39.2 million
in the first
nine
months of
2017
. Freight and commissions as a percentage of net sales
increased
0.1
percentage points from the first
nine
months of
2017
due to freight cost inflation.
Direct selling, general, and administrative expenses were
$20.7 million
in the first
nine
months of
2018
compared to
$22.3 million
in the first
nine
months of
2017
. Direct selling, general, and administrative expenses as a percentage of net sales
increased
compared to prior year primarily due to advertising investments in the pasta category.
54
Snacks
|
|
Nine Months Ended September 30,
|
|||||||||||||
|
|
2018
|
2017
|
||||||||||||
|
|
Dollars
|
Percent
|
Dollars
|
Percent
|
||||||||||
|
|
(Dollars in millions)
|
|||||||||||||
|
Net sales
|
$
|
865.7
|
|
100.0
|
%
|
$
|
940.2
|
|
100.0
|
%
|
||||
|
Cost of sales
|
823.9
|
|
95.2
|
|
874.8
|
|
93.0
|
|
||||||
|
Gross profit
|
41.8
|
|
4.8
|
|
65.4
|
|
7.0
|
|
||||||
|
Freight out and commissions
|
23.1
|
|
2.7
|
|
22.2
|
|
2.4
|
|
||||||
|
Direct selling, general, and administrative
|
11.5
|
|
1.3
|
|
18.8
|
|
2.0
|
|
||||||
|
Direct operating income
|
$
|
7.2
|
|
0.8
|
%
|
$
|
24.4
|
|
2.6
|
%
|
||||
Net sales in the Snacks segment
decreased
$74.5 million
, or
7.9%
, in the first
nine
months of
2018
compared to the first
nine
months of
2017
. The change in net sales from
2017
to
2018
was due to the following:
|
|
Dollars
|
Percent
|
|||||
|
|
(Dollars in millions)
|
||||||
|
2017 Net sales
|
$
|
940.2
|
|
|
|
||
|
SKU rationalization
|
(43.4
|
)
|
(4.6
|
)%
|
|||
|
Volume/mix excluding SKU rationalization
|
(42.0
|
)
|
(4.5
|
)
|
|||
|
Pricing
|
10.9
|
|
1.2
|
|
|||
|
2018 Net sales
|
$
|
865.7
|
|
(7.9
|
)%
|
||
Net sales
decreased
from
2017
to
2018
primarily due to the ongoing efforts to simplify and rationalize low margin SKUs, lost distribution due to competitive pressure in the snack nuts and trail mix category, and business interruption in the third quarter resulting from hurricane activity, partially offset by favorable pricing driven by commodity and freight inflation.
Gross profit as a percentage of net sales
decreased
2.2
percentage points, from
7.0%
in the first
nine
months of
2017
to
4.8%
in the first
nine
months of
2018
, primarily due to unfavorable mix and higher operating costs (plant performance and hurricane related), partially offset by favorable pricing.
Freight out and commissions paid to independent sales brokers
increased
to
$23.1 million
in the first
nine
months of
2018
, compared to
$22.2 million
in the first
nine
months of
2017
. Freight and commissions as a percentage of net sales
increased
0.3
percentage points from the first
nine
months of
2017
due to freight cost inflation.
Direct selling, general, and administrative expenses were
$11.5 million
in the first
nine
months of
2018
compared to
$18.8 million
in the first
nine
months of
2017
. The
decrease
in direct selling, general, and administrative expenses as a percent of net sales was primarily attributable to lower spend due to Structure to Win savings combined with lower spend due to other cost saving activities.
Liquidity and Capital Resources
Cash Flow
Management assesses the Company’s liquidity in terms of its ability to generate cash to fund its operating, investing, and financing activities. The Company generates substantial cash flow from operating activities and remains in a strong financial position, with resources available for reinvesting in existing businesses, conducting acquisitions, and managing its capital structure on a short and long-term basis including the repurchase of common stock and senior debt. If additional borrowings are needed, approximately
$720 million
was available under the Revolving Credit Facility as of
September 30, 2018
. See
Note 8
to our Condensed Consolidated Financial Statements for additional information regarding our Revolving Credit Facility. We believe that we comply with the current terms of the Revolving Credit Facility and can meet foreseeable financial requirements.
55
The following table is derived from our Condensed Consolidated Statement of Cash Flows:
|
|
Nine Months Ended
September 30, |
|||||||
|
|
2018
|
2017
|
||||||
|
|
(In millions)
|
|||||||
|
Net Cash Flows Provided By (Used In):
|
|
|
|
|
||||
|
Operating activities
|
$
|
270.5
|
|
$
|
263.4
|
|
||
|
Investing activities
|
(98.7
|
)
|
(95.6
|
)
|
||||
|
Financing activities
|
(250.8
|
)
|
(98.7
|
)
|
||||
Operating Activities
Our cash provided by operations was
$270.5 million
in the first
nine
months of
2018
compared to
$263.4 million
in the first
nine
months of
2017
, an
increase
of
$7.1 million
. The
increase
is mostly attributable to improved working capital, partially offset by lower earnings year-over-year. Working capital management is focused around extending vendor payment terms, managing inventory, and driving faster collection of receivables. In the fourth quarter of 2017, the Company entered into an agreement (the “Receivables Sales Agreement”) to sell, on a revolving basis, certain trade receivable balances to an unrelated institution. The agreement allows us to sell our accounts receivable to increase operating cash flow, while reducing the cost of borrowing on the Revolving Credit Facility (as defined below under “Sources of Capital”), net working capital, and interest expense. The agreement provides for the periodic sale of certain receivables on a revolving basis with a minimum funding of at least $0.5 million on each sale. As of September 30, 2018, we had
$200.0 million
of outstanding accounts receivable sold under this program. As of September 28, 2018, we have the ability to sell up to $300.0 million at any point in time under this program. See Note 4 to the Condensed Consolidated Financial Statements for more information regarding the Receivables Sales Agreement. The Company uses cash provided by operating activities to pay down debt, repurchase senior public debt, and fund investments in property, plant, and equipment.
Investing Activities
Cash used in investing activities was
$98.7 million
in the first
nine
months of
2018
compared to
$95.6 million
in the first
nine
months of
2017
, an
increase
in cash used of
$3.1 million
. During the first
nine
months of 2018, capital expenditures were higher compared to the first nine months of 2017, partially offset by increased proceeds from divestitures.
We expect capital spending programs to be approximately $190 million in
2018
. Capital spending in
2018
is focused on TreeHouse 2020 initiatives, the continued implementation of an Enterprise Resource Planning system, food safety, quality, productivity improvements, and routine equipment upgrades or replacements at our plants.
Financing Activities
Net cash used in financing activities was
$250.8 million
in the first nine months of 2018 compared to
$98.7 million
in the first nine months of 2017, an
increase
in cash used of
$152.1 million
. The
increase
is primarily attributable to repurchases of the 2022 Notes and 2024 Notes (refer to
Note 8
) and common stock repurchases, partially offset by reduced net loan activity under the Revolver during the first
nine
months of
2018
. The Company reduced net debt by approximately $122 million since
December 31, 2017
, consistent with our objective of using available cash to pay down outstanding debt.
Free Cash Flow
In addition to measuring our cash flow generation and usage based upon the operating, investing, and financing classifications included in the Condensed Consolidated Statements of Cash Flows, we also measure free cash flow (a Non-GAAP measure) which represents net cash provided by operating activities less capital expenditures. We believe free cash flow is an important measure of operating performance because it provides management and investors a measure of cash generated from operations that is available for mandatory payment obligations and investment opportunities such as funding acquisitions, repaying debt, repurchasing public debt, and repurchasing our common stock.
56
The following table reconciles cash flow provided by operating activities (a GAAP measure) to our free cash flow (a Non-GAAP measure).
|
|
Nine Months Ended
September 30, |
|||||||
|
|
2018
|
2017
|
||||||
|
|
(In millions)
|
|||||||
|
Cash flow provided by operating activities
|
$
|
270.5
|
|
$
|
263.4
|
|
||
|
Less: Capital expenditures
|
(133.1
|
)
|
(121.1
|
)
|
||||
|
Free cash flow
|
$
|
137.4
|
|
$
|
142.3
|
|
||
For the
nine months ended September 30, 2018
, we generated free cash flow of
$137.4 million
. Free cash flow in
2018
decreased
$4.9 million
over the prior year primarily due to higher capital expenditures during the first nine months of 2018.
Other
The earnings of our Canadian and Italian operations generate a portion of the Company’s cash. As of
September 30, 2018
, there was $52.6 million of cash and cash equivalents held by our foreign subsidiaries. The U.S. Tax Cuts and Jobs Act (the “Tax Act”) imposes a one-time transition tax on cumulative foreign earnings and eliminates U.S. taxes on foreign subsidiary distributions. As earnings in foreign jurisdictions are now available for distribution to the U.S. without incremental U.S. taxes, the Company no longer considers these earnings as permanently reinvested outside the U.S.
Our short-term financing needs are primarily for financing working capital. Our financing needs are generally highest in the second and third quarters due to inventory builds, while cash flow is highest in the fourth and first quarters following the corresponding sale of this built-up inventory. We expect our Revolving Credit Facility, plus cash flow from operations, to be adequate to provide liquidity for current operations. Our long-term financing needs depend largely on potential acquisition activity.
Debt Obligations
At
September 30, 2018
, we had
$495.0 million
outstanding under Term Loan A,
$891.0 million
outstanding under Term Loan A-1,
$375.9 million
of the 2022 Notes outstanding,
$602.9 million
of the 2024 Notes outstanding, and
$2.6 million
of other obligations. In addition, at
September 30, 2018
, there were
$30.4 million
in letters of credit under the Revolving Credit Facility that were issued but undrawn.
Also, at
September 30, 2018
, our Revolving Credit Facility provided for an aggregate commitment of
$750 million
, of which
$719.6 million
was available. Interest rates on debt outstanding under the Revolving Credit Facility, Term Loan A, and Term Loan A-1 (collectively known as the “Amended and Restated Credit Agreement”) for the
three months ended September 30, 2018
averaged
3.71%
. Including the interest rate swap agreements in effect as of
September 30, 2018
, the average rate decreases to
3.28%
.
We are in compliance with all applicable financial debt covenants as of
September 30, 2018
. See
Note 8
to our Condensed Consolidated Financial Statements for additional information regarding our indebtedness and related agreements.
Non-GAAP Measures
We have included in this report measures of financial performance that are not defined by GAAP (“Non-GAAP”). A Non-GAAP financial measure is a numerical measure of financial performance that excludes or includes amounts so as to be different than the most directly comparable measure calculated and presented in accordance with GAAP in the Company’s Condensed Consolidated Financial Statements. We believe these measures provide useful information to the users of the financial statements as we also have included these measures in other communications and publications.
For each of these Non-GAAP financial measures, we provide a reconciliation between the Non-GAAP measure and the most directly comparable GAAP measure, an explanation of why management believes the Non-GAAP measure provides useful information to financial statement users, and any additional purposes for which management uses the Non-GAAP measure. This Non-GAAP financial information is provided as additional information for the financial statement users and is not in
57
accordance with, or an alternative to, GAAP. These Non-GAAP measures may be different from similar measures used by other companies.
Adjusted Diluted Earnings Per Share, Adjusting for Certain Items Affecting Comparability
Adjusted earnings per fully diluted share (“Adjusted Diluted EPS”) reflects adjustments to GAAP earnings per fully diluted share to identify items that, in management’s judgment, significantly affect the assessment of earnings results between periods. This information is provided in order to allow investors to make meaningful comparisons of the Company’s earnings performance between periods and to view the Company’s business from the same perspective as Company management. This measure is also used as a component of the Board of Directors' measurement of the Company’s performance for incentive compensation purposes. As the Company cannot predict the timing and amount of charges that include, but are not limited to, items such as acquisition, integration, divestiture, and related costs, mark-to-market adjustments on derivative contracts, foreign currency exchange impact on the re-measurement of intercompany notes, or restructuring programs, management does not consider these costs when evaluating the Company’s performance, when making decisions regarding the allocation of resources, in determining incentive compensation for management, or in determining earnings estimates.
The reconciliation of Adjusted Diluted EPS, excluding certain items affecting comparability, to the relevant GAAP measure of diluted EPS as presented in the Condensed Consolidated Statements of Operations, is as follows:
|
|
Three Months Ended
September 30, |
Nine Months Ended
September 30, |
||||||||||||||
|
|
2018
|
2017
|
2018
|
2017
|
||||||||||||
|
|
(unaudited)
|
(unaudited)
|
||||||||||||||
|
Diluted earnings (loss) per share per GAAP
|
$
|
0.10
|
|
$
|
0.50
|
|
$
|
(0.87
|
)
|
$
|
0.40
|
|
||||
|
Restructuring programs
|
0.80
|
|
0.35
|
|
2.37
|
|
0.68
|
|
||||||||
|
CEO transition costs
|
—
|
|
—
|
|
0.23
|
|
—
|
|
||||||||
|
Mark-to-market adjustments
|
(0.07
|
)
|
(0.03
|
)
|
(0.10
|
)
|
0.01
|
|
||||||||
|
Foreign currency (gain) loss on re-measurement of intercompany notes
|
(0.02
|
)
|
(0.07
|
)
|
0.03
|
|
(0.13
|
)
|
||||||||
|
Product recall reimbursement
|
—
|
|
(0.06
|
)
|
—
|
|
(0.15
|
)
|
||||||||
|
Acquisition, integration, divestiture, and related costs
|
(0.17
|
)
|
0.07
|
|
(0.15
|
)
|
1.71
|
|
||||||||
|
Debt amendment and repurchase activity
|
0.03
|
|
—
|
|
0.12
|
|
—
|
|
||||||||
|
Tax indemnification
|
0.12
|
|
—
|
|
0.14
|
|
—
|
|
||||||||
|
Plant restoration
|
0.08
|
|
—
|
|
0.08
|
|
—
|
|
||||||||
|
Taxes on adjusting items
|
(0.25
|
)
|
(0.09
|
)
|
(0.69
|
)
|
(0.73
|
)
|
||||||||
|
Dilutive impact of shares
1
|
—
|
|
—
|
|
0.01
|
|
—
|
|
||||||||
|
Adjusted diluted EPS
|
$
|
0.62
|
|
$
|
0.67
|
|
$
|
1.17
|
|
$
|
1.79
|
|
||||
|
1
|
|
As reported results for the nine months ended September 30, 2018 reflect a loss; therefore, all equity awards were considered non-dilutive and excluded from the EPS calculation. Adjusted amounts, however, reflect net income and equity awards are considered dilutive. Accordingly, an adjustment is required to reflect total dilutive shares of 56.8 million compared to basic shares of 56.4 million.
|
During the three and nine months ended September 30,
2018
and
2017
, the Company entered into transactions that affected the year-over-year comparison of its financial results that included restructuring programs, CEO transition costs, mark-to-market adjustments, foreign currency (gain) loss on re-measurement of intercompany notes, product recall reimbursement, acquisition, integration, divestiture, and related costs, debt amendment and repurchase activity, tax indemnification, plant restoration, and the related tax impact of these items.
As the Company continues to grow, consolidation, restructuring, and margin improvement activities are necessary. During the
third
quarter of
2018
, the Company incurred approximately
$45.5 million
in costs versus
$20.7 million
last year. For the
nine months ended September 30, 2018
and
2017
, the Company incurred restructuring program costs of approximately
$134.7 million
and
$39.5 million
, respectively. Refer to Note 2 for additional details.
58
The CEO transition cost line primarily relates to accelerated stock-based compensation and modification accounting related to the transition of Chief Executive Officers. Refer to Note 11 for additional details.
The Company’s derivative contracts are marked-to-market each period with the changes being recorded in the Condensed Consolidated Statements of Operations. These are non-cash charges. As the contracts are settled, realized gains and losses are recognized. Refer to Note 16 for additional details.
The Company has Canadian dollar denominated intercompany loans and incurred foreign currency gains of
$1.4 million
in the
third
quarter of
2018
versus foreign currency gains of
$4.2 million
in the prior year to re-measure the loans at quarter end. These charges are non-cash and the loans are eliminated in consolidation.
The product recall reimbursement line primarily represents insurance proceeds related to an announced voluntary recall of products that may have been impacted by sunflower seeds contaminated with Listeria monocytogenes (L.mono) that were provided by a supplier. Product was distributed nationwide through retail stores. TreeHouse initiated the voluntary recall as a cautionary measure to protect public health. Related costs include, but are not limited to, customer fees, customer reimbursements, inventory write-offs, and other costs to manage the recall. The Company expects to be reimbursed for these costs and will exclude any gains from adjusted earnings in the period in which the proceeds are received, consistent with the Company’s exclusion from adjusted earnings of the costs incurred in 2016. In each of February 2017 and August 2017, the Company received a $4.0 million reimbursement ($8.0 million combined) and has included it in this line. Other product recalls during the first
nine
months of
2018
and
2017
were insignificant.
The acquisition, integration, divestiture, and related costs line represents costs associated with completed and potential acquisitions, the related integration of the acquisitions, and divestitures. Gains incurred in the first
nine
months of
2018
primarily related to divestiture activity and transition services agreement (“TSA”) revenue related to the SIF divestiture, while costs incurred in the first
nine
months of
2017
primarily related to the divestiture of the SIF business in the second quarter. Costs associated with integrating businesses into the Company’s operations are also included in this line.
During the second quarter of
2018
, the Company amended its Credit Agreement, resulting in third party costs to complete the transaction. Also, during the nine months ended September 30,
2018
, the Company completed the repurchase of certain of its outstanding debt. This activity resulted in the write-off of a portion of deferred financing costs as well as a loss on debt extinguishment.
The tax indemnification line represents the non-cash write off of indemnification assets that were recorded in connection with acquisitions from prior years. These write-offs arose as a result of the related uncertain tax position being released due to the statute of limitation lapse or settlement with taxing authorities.
During the three months ended September 30, 2018 the Company incurred $4.7 million in restoration costs related to a temporary shutdown at our Snacks plant in Robersonville, NC. The shutdown and related expenses were necessary to maintain and improve the quality, safety and performance of our equipment and processes. The facility is again fully operational and no additional expenses are anticipated.
The tax impact on adjusting items is calculated based upon the tax laws and statutory tax rates applicable in the tax jurisdiction of the underlying non-GAAP adjustments. This item also includes the release of tax reserves due to the statute of limitation lapses, which is a direct offset to the impact of the write–off of indemnification assets as discussed above.
Adjusted Net Income, Adjusted EBIT, and Adjusted EBITDAS, Adjusting for Certain Items Affecting Comparability
Adjusted net income represents GAAP
net income (loss)
as reported in the Condensed Consolidated Statements of Operations adjusted for items that, in management’s judgment, significantly affect the assessment of earnings results between periods as outlined in the adjusted diluted EPS section above. This information is provided in order to allow investors to make meaningful comparisons of the Company’s earnings performance between periods and to view the Company’s business from the same perspective as Company management. This measure is also used as a component of the Board of Directors' measurement of the Company’s performance for incentive compensation purposes and is the basis of calculating the adjusted diluted EPS metric outlined above.
Adjusted EBIT represents adjusted net income before interest expense, interest income, and income tax expense. Adjusted EBITDAS represents adjusted EBIT before depreciation expense, amortization expense, and non-cash stock-based
59
compensation expense. Adjusted EBIT and adjusted EBITDAS are performance measures commonly used by management to assess operating performance, and the Company believes they are commonly reported and widely used by investors and other interested parties as a measure of a company’s operating performance between periods.
The following table reconciles the Company’s
net income (loss)
as presented in the Condensed Consolidated Statements of Operations, the relevant GAAP measure, to Adjusted net income, Adjusted EBIT, and Adjusted EBITDAS for the
three and nine
months ended
September 30, 2018
and
2017
:
|
|
|
Three Months Ended
September 30, |
Nine Months Ended
September 30, |
|||||||||||||||
|
|
|
2018
|
2017
|
2018
|
2017
|
|||||||||||||
|
|
|
(unaudited in millions)
|
||||||||||||||||
|
Net income (loss) per GAAP
|
|
$
|
5.4
|
|
$
|
28.8
|
|
$
|
(48.8
|
)
|
$
|
22.8
|
|
|||||
|
Restructuring programs
|
(1)
|
45.5
|
|
20.7
|
|
134.7
|
|
39.5
|
|
|||||||||
|
CEO transition costs
|
(2)
|
—
|
|
—
|
|
13.0
|
|
—
|
|
|||||||||
|
Mark-to-market adjustments
|
(3)
|
(3.8
|
)
|
(1.9
|
)
|
(5.8
|
)
|
0.6
|
|
|||||||||
|
Foreign currency (gain) loss on re-measurement of intercompany notes
|
(4)
|
(1.4
|
)
|
(4.2
|
)
|
1.9
|
|
(7.6
|
)
|
|||||||||
|
Product recall reimbursement
|
(5)
|
—
|
|
(3.2
|
)
|
—
|
|
(8.4
|
)
|
|||||||||
|
Acquisition, integration, divestiture, and related costs
|
(6)
|
(9.9
|
)
|
3.8
|
|
(8.9
|
)
|
98.5
|
|
|||||||||
|
Debt amendment and repurchase activity
|
(7)
|
1.8
|
|
—
|
|
6.8
|
|
—
|
|
|||||||||
|
Tax indemnification
|
(8)
|
6.7
|
|
—
|
|
7.9
|
|
—
|
|
|||||||||
|
Plant restoration
|
(9)
|
4.7
|
|
—
|
|
4.7
|
|
—
|
|
|||||||||
|
Less: Taxes on adjusting items
|
|
(13.9
|
)
|
(5.1
|
)
|
(39.3
|
)
|
(42.0
|
)
|
|||||||||
|
Adjusted net income
|
|
35.1
|
|
38.9
|
|
66.2
|
|
103.4
|
|
|||||||||
|
Interest expense
|
|
27.1
|
|
31.4
|
|
85.2
|
|
92.9
|
|
|||||||||
|
Interest income
|
|
(1.3
|
)
|
(0.4
|
)
|
(3.8
|
)
|
(3.5
|
)
|
|||||||||
|
Income tax (benefit) expense
|
|
(5.2
|
)
|
1.3
|
|
(21.1
|
)
|
(9.0
|
)
|
|||||||||
|
Add: Taxes on adjusting items
|
|
13.9
|
|
5.1
|
|
39.3
|
|
42.0
|
|
|||||||||
|
Adjusted EBIT
|
|
69.6
|
|
76.3
|
|
165.8
|
|
225.8
|
|
|||||||||
|
Depreciation and amortization
|
(10)
|
58.0
|
|
65.1
|
|
174.5
|
|
199.6
|
|
|||||||||
|
Stock-based compensation expense
|
(11)
|
4.9
|
|
6.6
|
|
18.0
|
|
25.2
|
|
|||||||||
|
Adjusted EBITDAS
|
|
$
|
132.5
|
|
$
|
148.0
|
|
$
|
358.3
|
|
$
|
450.6
|
|
|||||
|
Location in Condensed
|
Three Months Ended
September 30, |
Nine Months Ended
September 30, |
|||||||||||||||||||
|
|
|
Consolidated Statements of Operations
|
2018
|
2017
|
2018
|
2017
|
|||||||||||||||
|
|
|
|
(unaudited in millions)
|
||||||||||||||||||
|
(1
|
)
|
Restructuring programs
|
Other operating expense, net
|
$
|
37.3
|
|
$
|
10.5
|
|
$
|
112.6
|
|
$
|
26.0
|
|
||||||
|
|
|
Cost of sales
|
7.2
|
|
10.2
|
|
18.8
|
|
13.5
|
|
|||||||||||
|
|
|
General and administrative
|
1.0
|
|
—
|
|
3.3
|
|
—
|
|
|||||||||||
|
(2
|
)
|
CEO transition costs
|
General and administrative
|
—
|
|
—
|
|
13.0
|
|
—
|
|
||||||||||
|
(3
|
)
|
Mark-to-market adjustments
|
Other expense (income), net
|
(3.8
|
)
|
(1.9
|
)
|
(5.8
|
)
|
0.6
|
|
||||||||||
|
(4
|
)
|
Foreign currency (gain) loss on re-measurement of intercompany notes
|
Loss (income) on foreign currency exchange
|
(1.4
|
)
|
(4.2
|
)
|
1.9
|
|
(7.6
|
)
|
||||||||||
|
(5
|
)
|
Product recall reimbursement
|
Net sales
|
—
|
|
(1.7
|
)
|
—
|
|
(5.5
|
)
|
||||||||||
|
|
|
Cost of sales
|
—
|
|
(1.5
|
)
|
—
|
|
(2.9
|
)
|
|||||||||||
|
(6
|
)
|
Acquisition, integration, divestiture, and related costs
|
General and administrative
|
4.1
|
|
3.4
|
|
4.8
|
|
12.7
|
|
||||||||||
|
|
|
Other operating expense, net
|
(14.0
|
)
|
0.6
|
|
(13.7
|
)
|
85.8
|
|
|||||||||||
60
|
|
|
Other expense (income), net
|
—
|
|
(0.2
|
)
|
—
|
|
—
|
|
|||||||||||
|
(7
|
)
|
Debt amendment and repurchase activity
|
General and administrative
|
—
|
|
—
|
|
0.2
|
|
—
|
|
||||||||||
|
|
|
Other expense (income), net
|
1.1
|
|
—
|
|
4.2
|
|
—
|
|
|||||||||||
|
|
|
Interest expense
|
0.7
|
|
—
|
|
2.4
|
|
—
|
|
|||||||||||
|
(8
|
)
|
Tax indemnification
|
Other expense (income), net
|
6.7
|
|
—
|
|
7.9
|
|
—
|
|
||||||||||
|
(9
|
)
|
Plant restoration
|
Cost of sales
|
4.7
|
|
—
|
|
4.7
|
|
—
|
|
||||||||||
|
(10
|
)
|
Accelerated depreciation
|
Cost of sales
|
5.8
|
|
9.1
|
|
15.9
|
|
13.3
|
|
||||||||||
|
|
|
General and administrative
|
1.0
|
|
—
|
|
3.3
|
|
0.3
|
|
|||||||||||
|
(11
|
)
|
Stock-based compensation expense included as an adjusting item
|
General and administrative
|
0.1
|
|
—
|
|
10.2
|
|
—
|
|
||||||||||
Other Commitments and Contingencies
We also have the following commitments and contingent liabilities, in addition to contingent liabilities related to the ordinary course of litigation, investigations, and tax audits:
|
•
|
certain lease obligations, and
|
|
•
|
selected levels of property and casualty risks, primarily related to employee health care, workers’ compensation claims, and other casualty losses.
|
See
Note 15
to our Condensed Consolidated Financial Statements included herein and Note 19 to our Consolidated Financial Statements in our Annual Report on Form 10-K for the fiscal year ended
December 31, 2017
for more information about our commitments and contingent obligations.
Recent Accounting Pronouncements
Information regarding recent accounting pronouncements is provided in
Note 19
to the Company’s Condensed Consolidated Financial Statements.
Critical Accounting Policies
A description of the Company’s critical accounting policies is contained in our Annual Report on Form 10-K for the year ended
December 31, 2017
. We adopted ASC 606, Revenue from Contracts with Customers, effective January 1, 2018 and have updated our revenue recognition accounting policy accordingly. See
Note 3
to our Condensed Consolidated Financial Statements for additional information regarding these updates.
Off-Balance Sheet Arrangements
We do not have any obligations that meet the definition of an off-balance sheet arrangement, other than operating leases and letters of credit, which have or are reasonably likely to have a material effect on our Condensed Consolidated Financial Statements.
Cautionary Statement Regarding Forward Looking Statements
From time to time, we and our representatives may provide information, whether orally or in writing, including certain statements in this Quarterly Report on Form 10-Q, which are deemed to be “forward-looking” within the meaning of the Private Securities Litigation Reform Act of 1995 (the “Litigation Reform Act”). These forward-looking statements and other information are based on our beliefs as well as assumptions made by us using information currently available.
The words “anticipate,” “believe,” “estimate,” “project,” “expect,” “intend,” “plan,” “should,” and similar expressions, as they relate to us, are intended to identify forward-looking statements. Such statements reflect our current views with respect to future events and are subject to certain risks, uncertainties, and assumptions. Should one or more of these risks or uncertainties materialize, or should underlying assumptions prove incorrect, actual results may vary materially from those described herein as anticipated, believed, estimated, expected, or intended. We do not intend to update these forward-looking statements following the date of this report. In accordance with the provisions of the Litigation Reform Act, we are making investors
61
aware that such forward-looking statements, because they relate to future events, are by their very nature subject to many important factors that could cause actual results to differ materially from those contemplated by the forward-looking statements contained in this Quarterly Report on Form 10-Q and other public statements we make. Such factors include, but are not limited to: the success of our restructuring programs; our level of indebtedness and related obligations; disruptions in the financial markets; interest rates; changes in foreign currency exchange rates; customer concentration and consolidation; raw material and commodity costs; competition; our ability to continue to make acquisitions in accordance with our business strategy; changes and developments affecting our industry, including customer preferences; the outcome of litigation and regulatory proceedings to which we may be a party; product recalls; changes in laws and regulations applicable to us; disruptions in or failures of our information technology systems; and labor strikes or work stoppages; and other risks that are set forth in the Risk Factors section, the Legal Proceedings section, the Management’s Discussion and Analysis of Financial Condition and Results of Operations section, and other sections of this Quarterly Report on Form 10-Q, our Annual Report on Form 10-K for the year ended
December 31, 2017
, and from time to time in our filings with the Securities and Exchange Commission.
The Company is exposed to certain market risks, which exist as part of its ongoing business operations. The Company uses derivative instruments, where appropriate, to manage these risks. Refer to Note 16 for additional information regarding these derivative instruments.
Refer to Item 7A within the Company's 2017 Annual Report on Form 10-K. Other than the changes noted below, there have been no material changes in the Company's market risk as of September 30, 2018.
In February of 2018, the Company entered into an additional $1,625 million of staggered long-term interest rate swap agreements to lock into a fixed LIBOR interest rate base.
We do not hold any derivative financial instruments, other than the interest rate swap agreements discussed above, which could expose us to significant interest rate market risk as of
September 30, 2018
. Our exposure to market risk for changes in interest rates relates primarily to the increase in the amount of interest expense we expect to pay with respect to our Amended and Restated Credit Agreement, which is tied to variable market rates. Based on our outstanding debt balance of
$1,386.0 million
under the Amended and Restated Credit Agreement at
September 30, 2018
and adjusting for the impact of the $875 million in interest rate swap agreements (in effect as of September 30, 2018) that have a fixed interest rate base, each 1% rise in the LIBOR rate would increase our annual interest expense by approximately $5.1 million.
The Company maintains a system of disclosure controls and procedures to give reasonable assurance that information required to be disclosed in the Company’s reports filed or submitted under the Exchange Act is recorded, processed, summarized, and reported within the time periods specified in the rules and forms of the Securities and Exchange Commission. These controls and procedures also give reasonable assurance that information required to be disclosed in such reports is accumulated and communicated to management to allow timely decisions regarding required disclosures.
As of
September 30, 2018
, the Company’s Chief Executive Officer (“CEO”) and Chief Financial Officer (“CFO”), together with management, conducted an evaluation of the effectiveness of the Company’s disclosure controls and procedures pursuant to Rules 13a-15(e) and 15d-15(e) of the Exchange Act. Based on that evaluation, the CEO and CFO concluded that these disclosure controls and procedures are effective.
In the ordinary course of business, the Company reviews its internal control over financial reporting and makes changes to systems and processes to improve such controls and increase efficiency, while ensuring that an effective internal control environment is maintained. In connection with the Company’s restructuring programs, during the quarter ended September 30, 2018, the Company began centralizing certain accounting functions within a shared service center. This initiative is not in response to any identified deficiency or weakness in the Company’s internal control over financial reporting. In response to this initiative, the Company has and will continue to align and streamline the design and operation of its financial control environment.
Other than as described in the preceeding paragraph, there have been no changes in the Company’s internal control over financial reporting that occurred during the quarter ended
September 30, 2018
that have materially affected or are reasonably likely to materially affect the Company’s internal control over financial reporting.
62
REPORT OF INDEPENDENT REGISTERED PUBLIC ACCOUNTING FIRM
To the Stockholders and the Board of Directors of TreeHouse Foods, Inc.
Results of Review of Interim Financial Information
We have reviewed the accompanying condensed consolidated balance sheet of Treehouse Foods, Inc. and subsidiaries (the "Company") as of
September 30, 2018
, the related condensed consolidated statements of operations and comprehensive income (loss) for the three-month and
nine
-month periods ended
September 30, 2018
and
2017
, and of cash flows for the
nine
-month periods ended
September 30, 2018
and
2017
, and the related notes (collectively referred to as the "interim financial information"). Based on our reviews, we are not aware of any material modifications that should be made to the accompanying interim financial information for it to be in conformity with accounting principles generally accepted in the United States of America.
We have previously audited, in accordance with the standards of the Public Company Accounting Oversight Board (United States) (PCAOB), the consolidated balance sheet of the Company as of
December 31, 2017
, and the related consolidated statements of operations, comprehensive income (loss), and cash flows for the year then ended (not presented herein); and in our report dated February 20, 2018, we expressed an unqualified opinion on those consolidated financial statements. In our opinion, the information set forth in the accompanying condensed consolidated balance sheet as of
December 31, 2017
, is fairly stated, in all material respects, in relation to the consolidated balance sheet from which it has been derived.
Basis for Review Results
This interim financial information is the responsibility of the Company's management. We are a public accounting firm registered with the PCAOB and are required to be independent with respect to the Company in accordance with the U.S. federal securities laws and the applicable rules and regulations of the Securities and Exchange Commission and the PCAOB.
We conducted our reviews in accordance with standards of the PCAOB. A review of interim financial information consists principally of applying analytical procedures and making inquiries of persons responsible for financial and accounting matters. It is substantially less in scope than an audit conducted in accordance with the standards of the PCAOB, the objective of which is the expression of an opinion regarding the financial information taken as a whole. Accordingly, we do not express such an opinion.
/s/ DELOITTE & TOUCHE LLP
Chicago, IL
November 1, 2018
63
Litigation, Investigations, and Audits
— On November 16, 2016, a purported TreeHouse shareholder filed a class action captioned
Tarara v. TreeHouse Foods, Inc., et al.
, Case No. 1:16-cv-10632, in the United States District Court for the Northern District of Illinois against TreeHouse and certain of its officers. The complaint, amended on March 24, 2017, is purportedly brought on behalf of all purchasers of TreeHouse common stock from January 20, 2016 through and including November 2, 2016, asserts claims under Sections 10(b) and 20(a) of the Securities Exchange Act of 1934 and Rule 10b-5 promulgated thereunder and seeks, among other things, damages and costs and expenses. On December 22, 2016, another purported TreeHouse shareholder filed an action captioned
Wells v. Reed, et al.
, Case No. 2016-CH-16359, in the Circuit Court of Cook County, Illinois, against TreeHouse and certain of its officers. This complaint, purportedly brought derivatively on behalf of TreeHouse, asserts state law claims against certain officers for breach of fiduciary duty, unjust enrichment, and corporate waste. On February 7, 2017, another purported TreeHouse shareholder filed an action captioned
Lavin v. Reed
, Case No. 17-cv-01014, in the Northern District of Illinois, against TreeHouse and certain of its officers. This complaint, like
Wells
, is purportedly brought derivatively on behalf of TreeHouse, and it asserts state law claims against certain officers for breach of fiduciary duty, unjust enrichment, abuse of control, gross mismanagement, and corporate waste.
All three complaints make substantially similar allegations (though the amended complaint in
Tarara
now contains additional detail). Essentially, the complaints allege that TreeHouse, under the authority and control of the individual defendants: (i) made certain false and misleading statements regarding the Company’s business, operations, and future prospects; and (ii) failed to disclose that (a) the Company’s private label business was underperforming; (b) the Company’s Flagstone business was underperforming; (c) the Company’s acquisition strategy was underperforming; (d) the Company had overstated its full-year 2016 guidance; and (e) TreeHouse’s statements lacked reasonable basis. The complaints allege that these actions artificially inflated the market price of TreeHouse common stock during the class period, thus purportedly harming investors. We believe that these claims are without merit and intend to defend against them vigorously.
Since its initial docketing, the
Tarara
matter has been re-captioned as
Public Employees’ Retirement Systems of Mississippi v. TreeHouse Foods, Inc., et al.
, in accordance with the Court’s order appointing Public Employees’ Retirement Systems of Mississippi as the lead plaintiff. On May 26, 2017, the
Public Employees’
defendants filed a motion to dismiss, which the court denied on February 12, 2018. On April 12, 2018, the
Public Employees’
defendants filed their answer to the amended complaint. On April 23, 2018, the parties filed a joint status report with the Court, describing the nature of the case and issues involved, as well as setting forth a proposed discovery and briefing schedule for the Court’s consideration. On July 13, 2018, lead plaintiff filed a motion to certify the class, and defendants filed their response in opposition to the motion to certify the class on October 8, 2018. The motion to certify remains pending before the Court. The next status hearing is scheduled for December 20, 2018.
Additionally, due to the similarity of the complaints, the parties in
Wells
and
Lavin
have entered stipulations deferring the litigation until the earlier of (i) the court in
Public Employees’
entering an order resolving defendants’ anticipated motion to dismiss therein or (ii) plaintiffs’ counsel receiving notification of a settlement of
Public Employees’
or until otherwise agreed to by the parties. On September 27, 2018, the parties in
Wells
and
Lavin
filed joint motions for entry of agreed orders further deferring the matters in light of the
Public Employees’
Court’s denial of the motion to dismiss in February 2018. The
Wells
and
Lavin
Courts entered the agreed orders further deferring the matters on September 27, 2018 and October 10, 2018, respectively.
In
Lavin,
the parties filed a joint status report on the progress of the related litigation on October 26, 2017. The
Lavin
parties also filed additional status reports with the Court on March 12, 2018 and June 19, 2018.
There is no set status date in
Lavin
at this time. The next status date in
Wells
is set for January 7, 2019.
In addition, we are party to a variety of legal proceedings arising out of the conduct of our business. While the results of proceedings cannot be predicted with certainty, management believes that the final outcome of these proceedings will not have a material adverse effect on our consolidated financial statements, results of operations, or cash flows.
Information regarding risk factors appears in Management’s Discussion and Analysis of Financial Condition and Results of Operations — Information Related to Forward-Looking Statements, in Part I — Item 2 of this Form 10-Q, and in Part I — Item
64
1A of the TreeHouse Foods, Inc. Annual Report on Form 10-K for the year ended
December 31, 2017
. There have been no material changes from the risk factors previously disclosed in the TreeHouse Foods, Inc. Annual Report on Form 10-K for the year ended
December 31, 2017
.
On November 2, 2017, the Company announced that the Board of Directors adopted a stock repurchase program. The stock repurchase program authorizes the Company to repurchase up to $400 million of the Company’s common stock at any time, or from time to time. Any repurchases under the program may be made by means of open market transactions, negotiated block transactions, or otherwise, including pursuant to a repurchase plan administered in accordance with Rules 10b5-1 and 10b-18 under the Securities Exchange Act of 1934, as amended (the “Exchange Act”). The size and timing of any repurchases will depend on price, market and business conditions, and other factors. The Company is authorized to enter into an administrative repurchase plan for $50 million of the $400 million in fiscal 2018 and is also authorized to repurchase an additional $100 million per year outside the administrative repurchase plan (total annual cap of $150 million). Any shares repurchased will be held as treasury stock.
The following table presents the total number of shares of common stock purchased during the
third
quarter of
2018
, the average price paid per share, the number of shares that were purchased as part of a publicly announced repurchase program, and the approximate dollar value of the maximum number of shares that may yet be purchased under the share repurchase program:
|
Period
|
Weighted Average Price Paid per Share
|
Total Number of Shares Purchased
|
Total Number of Shares Purchased as Part of Publicly Announced Plans or Programs
|
Approximate Dollar Value of Maximum Number of Shares that may yet be Purchased under the Program
|
||||||||||
|
|
|
(in millions)
|
(in millions)
|
(in millions)
|
||||||||||
|
July 1 through July 31, 2018
|
$
|
52.72
|
|
0.1
|
|
0.1
|
|
$
|
337.6
|
|
||||
|
August 1 through August 31, 2018
|
47.68
|
|
0.1
|
|
0.1
|
|
333.4
|
|
||||||
|
September 1 through September 30, 2018
|
52.79
|
|
0.1
|
|
0.1
|
|
329.1
|
|
||||||
|
For the Quarter Ended September 30, 2018
|
$
|
50.96
|
|
0.3
|
|
0.3
|
|
$
|
329.1
|
|
||||
For the
three months ended September 30, 2018
, the Company repurchased approximately
0.3
million shares of common stock for a total of $
12.6 million
.
65
|
|
|
|
12.1*
|
|
|
|
|
|
15.1*
|
|
|
|
|
|
31.1*
|
|
|
|
|
|
31.2*
|
|
|
|
|
|
32.1*
|
|
|
|
|
|
32.2*
|
|
|
|
|
|
101.INS*
|
XBRL Instance Document.
|
|
|
|
|
101.SCH*
|
XBRL Taxonomy Extension Schema Document.
|
|
|
|
|
101.CAL*
|
XBRL Taxonomy Extension Calculation Linkbase Document.
|
|
|
|
|
101.LAB*
|
XBRL Taxonomy Extension Label Linkbase Document.
|
|
|
|
|
101.PRE*
|
XBRL Taxonomy Extension Presentation Linkbase Document.
|
|
|
|
|
101.DEF*
|
XBRL Taxonomy Extension Definition Linkbase Document.
|
*Filed herewith.
**Management contract or compensatory plan or arrangement.
66
SIGNATURES
Pursuant to the requirement of the Securities Exchange Act of 1934, the registrant has duly caused this report to be signed on its behalf by the undersigned thereunto duly authorized.
|
TREEHOUSE FOODS, INC.
|
|
|
|
|
|
/s/ Matthew J. Foulston
|
|
|
Matthew J. Foulston
|
|
|
Executive Vice President and Chief Financial Officer
|
|
November 1, 2018
67
TABLE OF CONTENTS
Part I Financial InformationItem 1. Financial StatementsItem 2. Management S Discussion and Analysis Of Financial Condition and Results Of OperationsItem 3. Quantitative and Qualitative Disclosures About Market RiskItem 4. Controls and ProceduresPart II Other InformationItem 1. Legal ProceedingsItem 1A. Risk FactorsItem 2. Unregistered Sale Of Equity Securities and Use Of ProceedsItem 6. Exhibits