TREEHOUSE FOODS, INC.
10-Ks and 10-Qs
|
|
|
|
|
|
|
|
|
|
|
|
|
|
|
|
|
|
|
|
|
|
|
|
|
|
|
|
|
|
|
|
|
|
|
|
|
|
|
|
|
|
|
|
|
|
|
|
|
|
|
|
|
|
|
|
UNITED STATES SECURITIES AND EXCHANGE COMMISSION
Washington, D.C. 20549
Form 10-Q
(Mark One)
|
|
x
|
Quarterly Report Pursuant to Section 13 or 15(d) of the Securities Exchange Act of 1934
|
For the Quarterly Period Ended
March 31, 2019
.
or
|
|
o
|
Transition Report Pursuant to Section 13 or 15(d) of the Securities Exchange Act of 1934
|
For the Transition Period from to
Commission File Number 001-32504
TreeHouse Foods, Inc.
(Exact name of the registrant as specified in its charter)

|
Delaware
|
20-2311383
|
|
(State or other jurisdiction of incorporation or organization)
|
(I.R.S. employer identification no.)
|
|
|
|
|
2021 Spring Road, Suite 600
|
|
|
Oak Brook, IL
|
60523
|
|
(Address of principal executive offices)
|
(Zip Code)
|
(Registrant’s telephone number, including area code)
(708) 483-1300
Indicate by check mark whether the registrant (1) has filed all reports required to be filed by Section 13 or 15(d) of the Securities Exchange Act of 1934 during the preceding 12 months (or for such shorter period that the registrant was required to file such reports), and (2) has been subject to such filing requirements for the past 90 days. Yes
x
No
o
Indicate by check mark whether the registrant has submitted electronically and posted on its corporate Web site, if any, every Interactive Data File required to be submitted and posted pursuant to Rule 405 of Regulation S-T (§232.405 of this chapter) during the preceding 12 months (or for such shorter period that the registrant was required to submit and post such files). Yes
x
No
o
Indicate by check mark whether the registrant is a large accelerated filer, an accelerated filer, a non-accelerated filer, a smaller reporting company, or an emerging growth company. See the definitions of “large accelerated filer,” “accelerated filer” and “smaller reporting company” in Rule 12b-2 of the Exchange Act.
|
Large accelerated filer
|
x
|
Accelerated filer
|
o
|
|
|
|
|
|
|
Non-accelerated filer
|
o
|
Smaller reporting company
|
o
|
|
(Do not check if a smaller reporting company)
|
|
|
|
|
|
|
|
|
|
Emerging growth company
|
o
|
|
|
If an emerging growth company, indicate by check mark if the registrant has elected not to use the extended transition period for complying with any new or revised financial accounting standards provided pursuant to Section 13(a) of the Exchange Act.
o
Indicate by check mark whether the registrant is a shell company (as defined in Rule 12b-2 of the Exchange Act).
Yes
o
No
x
Number of shares of Common Stock, $0.01 par value, outstanding as of
April 26, 2019
:
56,138,851
.
1
Table of Contents
|
|
Page
|
|
|
|
|
|
|
|
|
|
|
|
|
|
|
|
|
|
|
|
|
|
|
|
|
|
|
|
|
|
|
|
|
|
|
|
|
|
|
|
2
Part I — Financial Information
Item 1. Financial Statements
TREEHOUSE FOODS, INC.
CONDENSED CONSOLIDATED BALANCE SHEETS
(In millions, except per share data)
|
March 31, 2019
|
December 31, 2018
|
|||||||
|
|
(Unaudited)
|
|||||||
|
Assets
|
|
|
|
|
||||
|
Current assets:
|
|
|
|
|
||||
|
Cash and cash equivalents
|
$
|
79.0
|
|
$
|
164.3
|
|
||
|
Receivables, net
|
367.3
|
|
351.3
|
|
||||
|
Inventories
|
854.2
|
|
839.7
|
|
||||
|
Prepaid expenses and other current assets
|
78.8
|
|
61.8
|
|
||||
|
Total current assets
|
1,379.3
|
|
|
1,417.1
|
|
|||
|
Property, plant and equipment, net
|
1,260.0
|
|
1,274.4
|
|
||||
|
Operating lease right-of-use assets
|
228.8
|
|
|
—
|
|
|||
|
Goodwill
|
2,163.9
|
|
2,161.4
|
|
||||
|
Intangible assets, net
|
690.5
|
|
700.2
|
|
||||
|
Other assets, net
|
42.5
|
|
46.2
|
|
||||
|
Total assets
|
$
|
5,765.0
|
|
|
$
|
5,599.3
|
|
|
|
Liabilities and Stockholders’ Equity
|
|
|
|
|
||||
|
Current liabilities:
|
|
|
|
|
||||
|
Accounts payable
|
$
|
591.1
|
|
$
|
577.9
|
|
||
|
Accrued expenses
|
245.6
|
|
256.1
|
|
||||
|
Current portion of long-term debt
|
4.6
|
|
1.2
|
|
||||
|
Total current liabilities
|
841.3
|
|
|
835.2
|
|
|||
|
Long-term debt
|
2,285.2
|
|
2,297.4
|
|
||||
|
Operating lease liabilities
|
204.6
|
|
—
|
|
||||
|
Deferred income taxes
|
155.2
|
|
154.2
|
|
||||
|
Other long-term liabilities
|
155.5
|
|
170.6
|
|
||||
|
Total liabilities
|
3,641.8
|
|
|
3,457.4
|
|
|||
|
Commitments and contingencies (Note 14)
|
|
|
|
|
||||
|
Stockholders’ equity:
|
|
|
|
|
||||
|
Preferred stock, par value $0.01 per share, 10.0 shares authorized, none issued
|
—
|
|
—
|
|
||||
|
Common stock, par value $0.01 per share, 90.0 shares authorized, 56.2 and 56.0 shares issued and outstanding, respectively
|
0.6
|
|
0.6
|
|
||||
|
Treasury stock
|
(83.3
|
)
|
(83.3
|
)
|
||||
|
Additional paid-in capital
|
2,137.5
|
|
2,135.8
|
|
||||
|
Retained earnings
|
158.6
|
|
185.9
|
|
||||
|
Accumulated other comprehensive loss
|
(90.2
|
)
|
(97.1
|
)
|
||||
|
Total stockholders’ equity
|
2,123.2
|
|
|
2,141.9
|
|
|||
|
Total liabilities and stockholders’ equity
|
$
|
5,765.0
|
|
|
$
|
5,599.3
|
|
|
See Notes to Condensed Consolidated Financial Statements.
3
TREEHOUSE FOODS, INC.
CONDENSED CONSOLIDATED STATEMENTS OF OPERATIONS
(In millions, except per share data)
|
Three Months Ended
March 31, |
|||||||||
|
|
2019
|
2018
|
|||||||
|
|
(Unaudited)
|
||||||||
|
Net sales
|
$
|
1,301.1
|
|
$
|
1,481.2
|
|
|||
|
Cost of sales
|
1,106.5
|
|
1,249.3
|
|
|||||
|
Gross profit
|
|
194.6
|
|
|
231.9
|
|
|||
|
Operating expenses:
|
|||||||||
|
Selling and distribution
|
79.2
|
|
108.4
|
|
|||||
|
General and administrative
|
65.9
|
|
81.1
|
|
|||||
|
Amortization expense
|
21.6
|
|
22.2
|
|
|||||
|
Other operating expense, net
|
28.8
|
|
28.9
|
|
|||||
|
Total operating expenses
|
|
195.5
|
|
|
240.6
|
|
|||
|
Operating loss
|
|
(0.9
|
)
|
|
(8.7
|
)
|
|||
|
Other expense:
|
|||||||||
|
Interest expense
|
26.9
|
|
28.5
|
|
|||||
|
(Gain) loss on foreign currency exchange
|
(0.4
|
)
|
2.5
|
|
|||||
|
Other expense, net
|
12.2
|
|
4.2
|
|
|||||
|
Total other expense
|
|
38.7
|
|
|
35.2
|
|
|||
|
Loss before income taxes
|
(39.6
|
)
|
(43.9
|
)
|
|||||
|
Income tax benefit
|
(12.3
|
)
|
(9.8
|
)
|
|||||
|
Net loss
|
|
$
|
(27.3
|
)
|
|
$
|
(34.1
|
)
|
|
|
Net loss per common share:
|
|||||||||
|
Basic
|
$
|
(0.49
|
)
|
$
|
(0.60
|
)
|
|||
|
Diluted
|
$
|
(0.49
|
)
|
$
|
(0.60
|
)
|
|||
|
Weighted average common shares:
|
|||||||||
|
Basic
|
56.1
|
|
56.5
|
|
|||||
|
Diluted
|
56.1
|
|
56.5
|
|
|||||
See Notes to Condensed Consolidated Financial Statements.
4
TREEHOUSE FOODS, INC.
CONDENSED CONSOLIDATED STATEMENTS OF COMPREHENSIVE INCOME (LOSS)
(In millions)
|
Three Months Ended
March 31, |
|||||||||
|
|
2019
|
2018
|
|||||||
|
|
(Unaudited)
|
||||||||
|
Net loss
|
$
|
(27.3
|
)
|
$
|
(34.1
|
)
|
|||
|
Other comprehensive income (loss):
|
|||||||||
|
Foreign currency translation adjustments
|
6.8
|
|
(10.1
|
)
|
|||||
|
Pension and postretirement reclassification adjustment
|
0.1
|
|
0.2
|
|
|||||
|
Adoption of ASU 2018-02 reclassification to retained earnings
|
—
|
|
(1.1
|
)
|
|||||
|
Other comprehensive income (loss)
|
6.9
|
|
(11.0
|
)
|
|||||
|
Comprehensive loss
|
|
$
|
(20.4
|
)
|
|
$
|
(45.1
|
)
|
|
See Notes to Condensed Consolidated Financial Statements.
5
TREEHOUSE FOODS, INC.
CONDENSED CONSOLIDATED STATEMENTS OF STOCKHOLDERS' EQUITY
(Unaudited, in millions)
|
Additional
|
Accumulated Other
|
|||||||||||||||||||||||||||||
|
Common Stock
|
Paid-In
|
Retained
|
Treasury Stock
|
Comprehensive
|
Total
|
|||||||||||||||||||||||||
|
Shares
|
Amount
|
Capital
|
Earnings
|
Shares
|
Amount
|
Loss
|
Equity
|
|||||||||||||||||||||||
|
Balance, January 1, 2018
|
57.2
|
|
$
|
0.6
|
|
$
|
2,107.0
|
|
$
|
245.9
|
|
(0.6
|
)
|
$
|
(28.7
|
)
|
$
|
(61.5
|
)
|
$
|
2,263.3
|
|
||||||||
|
Net loss
|
—
|
|
—
|
|
—
|
|
(34.1
|
)
|
—
|
|
—
|
|
—
|
|
(34.1
|
)
|
||||||||||||||
|
Other comprehensive loss
|
—
|
|
—
|
|
—
|
|
—
|
|
—
|
|
—
|
|
(9.9
|
)
|
(9.9
|
)
|
||||||||||||||
|
Treasury stock repurchases
|
—
|
|
—
|
|
—
|
|
—
|
|
(0.4
|
)
|
(17.1
|
)
|
—
|
|
(17.1
|
)
|
||||||||||||||
|
Equity awards exercised
|
0.2
|
|
—
|
|
0.9
|
|
—
|
|
—
|
|
—
|
|
—
|
|
0.9
|
|
||||||||||||||
|
Stock-based compensation
|
—
|
|
—
|
|
16.3
|
|
—
|
|
—
|
|
—
|
|
—
|
|
16.3
|
|
||||||||||||||
|
Cumulative effect of accounting change
|
—
|
|
—
|
|
—
|
|
1.5
|
|
—
|
|
—
|
|
(1.1
|
)
|
0.4
|
|
||||||||||||||
|
Balance, March 31, 2018
|
57.4
|
|
$
|
0.6
|
|
$
|
2,124.2
|
|
$
|
213.3
|
|
(1.0
|
)
|
$
|
(45.8
|
)
|
$
|
(72.5
|
)
|
$
|
2,219.8
|
|
||||||||
|
Balance, January 1, 2019
|
57.8
|
|
$
|
0.6
|
|
$
|
2,135.8
|
|
$
|
185.9
|
|
(1.8
|
)
|
$
|
(83.3
|
)
|
$
|
(97.1
|
)
|
$
|
2,141.9
|
|
||||||||
|
Net loss
|
—
|
|
—
|
|
—
|
|
(27.3
|
)
|
—
|
|
—
|
|
—
|
|
(27.3
|
)
|
||||||||||||||
|
Other comprehensive income
|
—
|
|
—
|
|
—
|
|
—
|
|
—
|
|
—
|
|
6.9
|
|
6.9
|
|
||||||||||||||
|
Equity awards exercised
|
0.2
|
|
—
|
|
(4.4
|
)
|
—
|
|
—
|
|
—
|
|
—
|
|
(4.4
|
)
|
||||||||||||||
|
Stock-based compensation
|
—
|
|
—
|
|
6.1
|
|
—
|
|
—
|
|
—
|
|
—
|
|
6.1
|
|
||||||||||||||
|
Balance, March 31, 2019
|
58.0
|
|
$
|
0.6
|
|
$
|
2,137.5
|
|
$
|
158.6
|
|
(1.8
|
)
|
$
|
(83.3
|
)
|
$
|
(90.2
|
)
|
$
|
2,123.2
|
|
||||||||
See Notes to Condensed Consolidated Financial Statements.
6
TREEHOUSE FOODS, INC.
CONDENSED CONSOLIDATED STATEMENTS OF CASH FLOWS
(In millions)
|
Three Months Ended
March 31, |
||||||||
|
2019
|
2018
|
|||||||
|
(Unaudited)
|
||||||||
|
Cash flows from operating activities:
|
||||||||
|
Net loss
|
$
|
(27.3
|
)
|
$
|
(34.1
|
)
|
||
|
Adjustments to reconcile net loss to net cash (used in) provided by operating activities:
|
||||||||
|
Depreciation and amortization
|
61.9
|
|
67.0
|
|
||||
|
Stock-based compensation
|
6.1
|
|
16.3
|
|
||||
|
Unrealized loss on derivative contracts
|
15.9
|
|
5.7
|
|
||||
|
Other
|
0.7
|
|
7.7
|
|
||||
|
Changes in operating assets and liabilities, net of effect of divestitures:
|
||||||||
|
Receivables
|
(16.4
|
)
|
(16.5
|
)
|
||||
|
Inventories
|
(13.2
|
)
|
(24.9
|
)
|
||||
|
Prepaid expenses and other assets
|
(14.3
|
)
|
(10.5
|
)
|
||||
|
Accounts payable, accrued expenses, and other liabilities
|
(51.3
|
)
|
47.1
|
|
||||
|
Net cash (used in) provided by operating activities
|
(37.9
|
)
|
57.8
|
|
||||
|
Cash flows from investing activities:
|
||||||||
|
Additions to property, plant, and equipment
|
(29.9
|
)
|
(38.5
|
)
|
||||
|
Additions to intangible assets
|
(6.5
|
)
|
(2.9
|
)
|
||||
|
Other
|
(0.1
|
)
|
(0.3
|
)
|
||||
|
Net cash used in investing activities
|
(36.5
|
)
|
(41.7
|
)
|
||||
|
Cash flows from financing activities:
|
||||||||
|
Borrowings under Revolving Credit Facility
|
14.0
|
|
5.9
|
|
||||
|
Payments under Revolving Credit Facility
|
(14.0
|
)
|
(5.9
|
)
|
||||
|
Payments on financing lease obligations
|
(0.4
|
)
|
(0.3
|
)
|
||||
|
Payments on Term Loans
|
(10.0
|
)
|
(3.5
|
)
|
||||
|
Repurchases of common stock
|
—
|
|
(17.1
|
)
|
||||
|
Receipts related to stock-based award activities
|
0.2
|
|
1.9
|
|
||||
|
Payments related to stock-based award activities
|
(4.6
|
)
|
(1.1
|
)
|
||||
|
Net cash used in financing activities
|
(14.8
|
)
|
(20.1
|
)
|
||||
|
Effect of exchange rate changes on cash and cash equivalents
|
3.9
|
|
(0.3
|
)
|
||||
|
Net decrease in cash and cash equivalents
|
(85.3
|
)
|
(4.3
|
)
|
||||
|
Cash and cash equivalents, beginning of period
|
164.3
|
|
132.8
|
|
||||
|
Cash and cash equivalents, end of period
|
$
|
79.0
|
|
$
|
128.5
|
|
||
|
Supplemental cash flow disclosures
|
||||||||
|
Interest paid
|
$
|
41.8
|
|
$
|
44.3
|
|
||
|
Net income taxes paid
|
4.7
|
|
2.4
|
|
||||
|
Non-cash investing activities:
|
||||||||
|
Accrued purchase of property and equipment
|
$
|
18.9
|
|
$
|
21.0
|
|
||
|
Accrued other intangible assets
|
7.3
|
|
4.8
|
|
||||
|
Right-of-use assets and operating lease obligations recognized at ASU 2016-02 transition
|
252.5
|
|
—
|
|
||||
|
Right-of-use assets and operating lease obligations recognized after ASU 2016-02 transition
|
6.1
|
|
—
|
|
||||
See Notes to Condensed Consolidated Financial Statements.
7
TREEHOUSE FOODS, INC.
NOTES TO CONDENSED CONSOLIDATED FINANCIAL STATEMENTS
As of and for the three months ended March 31, 2019
(Unaudited)
1. BASIS OF PRESENTATION
The unaudited Condensed Consolidated Financial Statements included herein have been prepared by TreeHouse Foods, Inc. and its consolidated subsidiaries (the “Company,” “TreeHouse,” “we,” “us,” or “our”), pursuant to the rules and regulations of the Securities and Exchange Commission (“SEC”) applicable to quarterly reporting on Form 10-Q. In our opinion, these statements include all adjustments necessary for a fair presentation of the results of all interim periods reported herein. Certain information and footnote disclosures normally included in financial statements prepared in accordance with accounting principles generally accepted in the United States of America (“GAAP”) have been condensed or omitted as permitted by such rules and regulations. The Condensed Consolidated Financial Statements and related notes should be read in conjunction with the Consolidated Financial Statements and related notes included in the Company’s Annual Report on Form 10-K for the fiscal year ended
December 31, 2018
. Results of operations for interim periods are not necessarily indicative of annual results.
In the first quarter of 2019, the Company changed how it manages its business, allocates resources, and goes to market, which resulted in modifications to its organizational and segment structure. All prior period information has been recast to reflect this change in reportable segments. Refer to
Note 16
for additional information.
The preparation of our Condensed Consolidated Financial Statements in conformity with GAAP requires us to use our judgment to make estimates and assumptions that affect the reported amounts of assets and liabilities, and disclosures of contingent assets and liabilities at the date of the Condensed Consolidated Financial Statements, and the reported amounts of net sales and expenses during the reporting period. Actual results could differ from these estimates.
A detailed description of the Company’s significant accounting policies can be found in the Company’s Annual Report on Form 10-K for the fiscal year ended
December 31, 2018
.
2. RECENT ACCOUNTING PRONOUNCEMENTS
Adopted
In February 2016, the FASB issued Accounting Standards Update ("ASU") No. 2016-02,
Leases
, to increase transparency and comparability by recognizing lease assets and lease liabilities on the balance sheet and disclosing key information about leasing arrangements. The main difference between existing GAAP and this ASU is the recognition of lease assets and lease liabilities by lessees for those leases classified as operating leases under existing GAAP. The standard requires that entities apply the effects of these changes using a modified retrospective approach, which includes a number of optional practical expedients. In July 2018, the FASB issued ASU No. 2018-11,
Leases (842), Targeted Improvements,
which provides an additional transition election to not restate comparative periods for the effects of applying the new standard. This transition election permits entities to apply ASU No. 2016-02 on the adoption date and recognize a cumulative-effect adjustment to the opening balance of retained earnings. These ASU's are effective for fiscal years, and interim periods within those years, beginning after December 15, 2018.
The Company adopted these ASUs as of January 1, 2019 under the modified retrospective transition method prescribed by ASU 2018-11. Under this transition method, financial results reported in periods prior to the first quarter of 2019 are unchanged. The adoption of these ASUs resulted in the recognition of approximately
$252.5 million
of right-of-use assets and lease liabilities as of January 1, 2019. Also as a result of adoption, the Company reclassified
$17.2 million
of liabilities and
$0.6 million
of assets on its Condensed Consolidated Balance Sheet as of January 1, 2019 against the operating lease right-of-use asset. The adoption of these ASUs did not result in a cumulative-effect adjustment to the opening balance of retained earnings.
In addition, the Company elected the package of practical expedients permitted by the transition guidance. The adoption of these ASU’s did not have an impact on the Company’s Condensed Consolidated Statements of Operations or Cash Flows.
Refer to
Note 4
for additional information regarding the Company's leases.
Not yet adopted
The Company does not anticipate a material impact upon adoption from any accounting standards issued but not yet adopted.
8
TREEHOUSE FOODS, INC.
NOTES TO CONDENSED CONSOLIDATED FINANCIAL STATEMENTS — (Continued)
3. RESTRUCTURING PROGRAMS
The Company’s restructuring and margin improvement activities are part of an enterprise-wide transformation to improve long-term profitability of the Company. These activities are aggregated into three categories: (1) TreeHouse 2020 – a long-term growth and margin improvement strategy; (2) Structure to Win – an operating expenses improvement program; and (3) other restructuring and plant closing costs (collectively the “Restructuring Programs”).
The costs by activity for the Restructuring Programs are outlined below:
|
|
Three Months Ended
March 31, |
||||||||
|
|
2019
|
2018
|
|||||||
|
|
(In millions)
|
||||||||
|
TreeHouse 2020
|
$
|
28.0
|
|
$
|
27.7
|
|
|||
|
Structure to Win
|
5.7
|
|
8.4
|
|
|||||
|
Other restructuring and plant closing costs
|
—
|
|
2.5
|
|
|||||
|
Total Restructuring Programs
|
$
|
33.7
|
|
$
|
38.6
|
|
|||
Expenses associated with these programs are recorded in Cost of sales, General and administrative, and Other operating expense, net in the Condensed Consolidated Statements of Operations. The Company does not allocate costs associated with Restructuring Programs to reportable segments when evaluating the performance of its segments. As a result, costs associated with Restructuring Programs are not presented by reportable segment. See
Note 16
for more information.
Below is a summary of costs by line item for the Restructuring Programs:
|
|
Three Months Ended
March 31, |
||||||||
|
|
2019
|
2018
|
|||||||
|
|
(In millions)
|
||||||||
|
Cost of sales
|
$
|
4.1
|
|
$
|
9.7
|
|
|||
|
General and administrative
|
0.8
|
|
—
|
|
|||||
|
Other operating expense, net
|
28.8
|
|
28.9
|
|
|||||
|
Total
|
$
|
33.7
|
|
$
|
38.6
|
|
|||
The table below presents the activity of the liabilities associated with the Restructuring Programs as of
March 31, 2019
:
|
|
Severance
|
Other Costs
|
Total Liabilities
|
|||||||||
|
|
(In millions)
|
|||||||||||
|
Balance as of December 31, 2018
|
$
|
19.3
|
|
$
|
2.6
|
|
$
|
21.9
|
|
|||
|
Expenses recognized
|
3.1
|
|
—
|
|
3.1
|
|
||||||
|
Cash payments
|
(7.7
|
)
|
—
|
|
(7.7
|
)
|
||||||
|
Reclassification due to adoption of ASU 2016-02
|
—
|
|
(2.6
|
)
|
(2.6
|
)
|
||||||
|
Balance as of March 31, 2019
|
$
|
14.7
|
|
$
|
—
|
|
$
|
14.7
|
|
|||
Liabilities recorded as of
March 31, 2019
associated with total exit cost reserves primarily relate to severance. The severance liability was included in Accrued expenses in the Condensed Consolidated Balance Sheets. Other costs represent early lease termination liabilities. As part of the Company's adoption of ASU 2016-02, these lease termination liabilities were offset with the initial right-of-use asset at transition. Refer to Note 4 for additional information.
9
TREEHOUSE FOODS, INC.
NOTES TO CONDENSED CONSOLIDATED FINANCIAL STATEMENTS — (Continued)
(1) TreeHouse 2020
In the third quarter of 2017, the Company announced TreeHouse 2020, a program intended to accelerate long-term growth through optimization of our manufacturing network, transformation of our mixing centers and warehouse footprint, and leveraging of systems and processes to drive performance. The Company’s workstreams related to these activities and selling, general, and administrative cost reductions will increase our capacity utilization, expand operating margins, and streamline our plant structure to optimize our supply chain.
This program began in 2017 and will be executed through 2020.
In 2017, the Company announced the closure of the Brooklyn Park, Minnesota and Plymouth, Indiana facilities, as well as the downsizing of the Dothan, Alabama facility. In the first quarter of 2018, the Company announced the closure of the Company’s Visalia, California and Battle Creek, Michigan facilities.
All facilities have either closed or are successfully tracking toward their closure dates noted in the table below. The table below shows key information regarding the Company's announced plant closures, a component of the broader TreeHouse 2020 program:
|
Facility Location
|
Date of Closure
Announcement
|
Full Facility
Closure
|
Primary Products
Produced
|
Primary Segment(s)
Affected
|
Total
Costs to
Close
|
Total Cash
Costs to
Close
|
||||||||||
|
(In millions)
|
||||||||||||||||
|
Dothan, Alabama
|
August 3, 2017
|
Partial closure completed in Q3 2018
|
Trail mix and snack nuts
|
Snacks
|
$
|
11.8
|
|
$
|
6.1
|
|
||||||
|
Brooklyn Park, Minnesota
|
August 3, 2017
|
Completed in Q4 2017
|
Dry dinners
|
Meal Solutions
|
16.1
|
|
9.6
|
|
||||||||
|
Plymouth, Indiana
|
August 3, 2017
|
Completed in Q4 2017
|
Pickles
|
Meal Solutions
|
9.3
|
|
3.8
|
|
||||||||
|
Battle Creek, Michigan
|
January 31, 2018
|
Q3 2019
|
Ready-to-eat cereal
|
Baked Goods
|
18.2
|
|
11.8
|
|
||||||||
|
Visalia, California
|
February 15, 2018
|
Completed in Q1 2019
|
Pretzels
|
Baked Goods
|
22.1
|
|
8.8
|
|
||||||||
|
$
|
77.5
|
|
$
|
40.1
|
|
|||||||||||
During the third quarter of 2018, the Company announced the closure of its Omaha, Nebraska office by January 31, 2019. This closure was completed during the first quarter of 2019.
Below is a summary of the overall TreeHouse 2020 program costs by type:
|
|
Three Months Ended March 31,
|
Cumulative Costs To Date
|
Total Expected Costs
|
||||||||||||||
|
|
2019
|
2018
|
|||||||||||||||
|
|
(In millions)
|
||||||||||||||||
|
Asset-related
|
$
|
2.9
|
|
$
|
5.3
|
|
$
|
58.7
|
|
$
|
71.0
|
|
|||||
|
Employee-related
|
4.7
|
|
8.4
|
|
54.6
|
|
77.0
|
|
|||||||||
|
Other costs
|
20.4
|
|
14.0
|
|
109.1
|
|
202.0
|
|
|||||||||
|
Total
|
$
|
28.0
|
|
$
|
27.7
|
|
$
|
222.4
|
|
$
|
350.0
|
|
|||||
For the
three
months ended
March 31, 2019
and 2018, asset-related costs primarily consisted of accelerated depreciation; employee-related costs primarily consisted of dedicated project employee cost and severance; and other costs primarily consisted of consulting costs. Asset-related costs were recorded in Cost of sales while employee-related and other costs were primarily recorded in Other operating expense, net of the Condensed Consolidated Statement of Operations.
(2) Structure to Win
In the first quarter of 2018, the Company announced an operating expenses improvement program (“Structure to Win”) designed to align our organization structure with strategic priorities. The program is intended to drive operational effectiveness, cost reduction, and position the Company for growth with a focus on a lean customer focused go-to-market team, centralized supply chain, and streamlined administrative functions.
10
TREEHOUSE FOODS, INC.
NOTES TO CONDENSED CONSOLIDATED FINANCIAL STATEMENTS — (Continued)
Below is a summary of costs by type associated with the Structure to Win program:
|
Three Months Ended March 31,
|
Cumulative Costs
To Date
|
Total Expected Costs
|
||||||||||||||
|
2019
|
2018
|
|||||||||||||||
|
|
(In millions)
|
|||||||||||||||
|
Asset-related
|
$
|
0.8
|
|
$
|
—
|
|
$
|
3.0
|
|
$
|
3.8
|
|
||||
|
Employee-related
|
1.4
|
|
5.5
|
|
23.7
|
|
31.8
|
|
||||||||
|
Other costs
|
3.5
|
|
2.9
|
|
24.1
|
|
27.4
|
|
||||||||
|
Total
|
$
|
5.7
|
|
$
|
8.4
|
|
$
|
50.8
|
|
$
|
63.0
|
|
||||
The Company increased total expected costs for the Structure to Win program from
$49.5 million
to
$63.0 million
during the three months ended March 31, 2019 due to additional actions taken to consolidate our administrative footprint and better align divisional support structures.
For the three months ended
March 31, 2019
and 2018, employee-related costs primarily consisted of severance and other costs primarily consisted of consulting services. Asset-related costs are included in General and administrative expense and the employee-related and other costs are included in Other operating expense, net of the Condensed Consolidated Statements of Operations.
During the first quarter of 2019, the Company announced the closure of its St. Louis, Missouri office by June 28, 2019. Estimated costs to close are approximately
$7.8 million
, most of which are anticipated to be in cash.
(3) Other Restructuring and Plant Closing Costs
The Company continually analyzes its plant network to align operations with the current and future needs of its customers. Facility closure decisions are made when the Company identifies opportunities to lower production costs or eliminate excess manufacturing capacity while maintaining a competitive cost structure, service levels, and product quality. Expenses associated with facility closures are primarily aggregated in Other operating expense, net of the Condensed Consolidated Statements of Operations, with the exception of asset-related costs, which are recorded in Cost of sales.
Other restructuring and plant closing costs were
$2.5 million
for the three months ended March 31, 2018. There were
no
costs associated with other restructuring and plant closing costs during the three months ended March 31, 2019.
4. LEASES
The Company has operating and finance leases for manufacturing facilities, warehouses and distribution centers, office space, and certain equipment. Remaining lease terms for these leases range from
1
year to
21
years. Some of the Company’s leases include options to extend the leases for up to
29
years, and some of which include options to terminate the leases within
1
year.
The Company does not record leases with an initial term of 12 months or less on the balance sheet. Expense for these short-term leases is recorded on a straight-line basis over the lease term.
11
TREEHOUSE FOODS, INC.
NOTES TO CONDENSED CONSOLIDATED FINANCIAL STATEMENTS — (Continued)
Supplemental balance sheet information related to leases was as follows:
|
Balance Sheet Classification
|
March 31, 2019
|
|||||
|
Assets
|
||||||
|
Operating
|
Operating lease right-of-use assets
|
$
|
228.8
|
|
||
|
Finance
|
Property, plant, and equipment, net
|
1.8
|
|
|||
|
Total assets
|
|
$
|
230.6
|
|
||
|
Liabilities
|
||||||
|
Current liabilities
|
||||||
|
Operating
|
Accrued expenses
|
$
|
41.1
|
|
||
|
Finance
|
Current portion of long-term debt
|
1.1
|
|
|||
|
Total current liabilities
|
42.2
|
|
||||
|
Noncurrent liabilities
|
||||||
|
Operating
|
Operating lease liabilities
|
204.6
|
|
|||
|
Finance
|
Long-term debt
|
1.3
|
|
|||
|
Total noncurrent liabilities
|
205.9
|
|
||||
|
Total lease liabilities
|
$
|
248.1
|
|
|||
Right-of-use assets and lease liabilities are measured and recognized based on the present value of the future minimum lease payments over the lease term at the commencement date. The Company has elected the practical expedient to combine lease and nonlease components into a single component for all of its leases. The majority of the Company's leases do not provide an implicit rate; therefore, the Company uses its incremental borrowing rate based on the information available at the commencement date in determining the present value of future payments for those leases. The Company has elected the practical expedient to apply discount rates to its lease portfolio based on the portfolio approach. The portfolios grouped the leases by remaining lease term. The Company includes options to extend or terminate the lease in the measurement of the right-of-use asset and lease liability when it is reasonably certain that it will exercise such options. Lease expense for minimum lease payments is recognized on a straight-line basis over the lease term.
The components of lease expense were as follows:
|
Three Months Ended
|
||||||
|
Income Statement Classification
|
March 31, 2019
|
|||||
|
Operating lease cost
|
Cost of sales and General and administrative
|
$
|
11.6
|
|
||
|
Finance lease cost:
|
||||||
|
Amortization of right-of-use assets
|
Cost of sales and General and administrative
|
0.4
|
|
|||
|
Interest on lease liabilities
|
Interest expense
|
0.1
|
|
|||
|
Total finance lease cost
|
0.5
|
|
||||
|
Variable lease cost (1)
|
Cost of sales and General and administrative
|
1.2
|
|
|||
|
Net lease cost
|
$
|
13.3
|
|
|||
|
(1)
|
Includes short-term leases, which are immaterial.
|
Fixed lease costs represent the explicitly quantified lease payments prescribed by the lease agreement. Variable lease payments that depend on an index or a rate are included in the calculation of the right-of-use asset and lease liability based on the index or rate at lease commencement. Other variable lease payments such as those that depend on the usage or performance of an underlying asset are not included in the measurement of the right-of-use asset or lease liability.
12
TREEHOUSE FOODS, INC.
NOTES TO CONDENSED CONSOLIDATED FINANCIAL STATEMENTS — (Continued)
Future maturities of lease liabilities were as follows:
|
Operating Leases (1)
|
Finance Leases
|
|||||||
|
Nine months ended December 31, 2019
|
$
|
39.3
|
|
$
|
1.1
|
|
||
|
2020
|
47.0
|
|
0.5
|
|
||||
|
2021
|
42.2
|
|
0.4
|
|
||||
|
2022
|
33.8
|
|
0.1
|
|
||||
|
2023
|
27.1
|
|
0.1
|
|
||||
|
Thereafter
|
115.6
|
|
0.3
|
|
||||
|
Total lease payments
|
305.0
|
|
2.5
|
|
||||
|
Less: Interest
|
(59.3
|
)
|
(0.1
|
)
|
||||
|
Present value of lease liabilities
|
$
|
245.7
|
|
$
|
2.4
|
|
||
|
(1)
|
Operating lease payments include
$3.0 million
related to options to extend lease terms that are reasonably certain of being exercised.
|
Other information related to leases were as follows:
|
Three Months Ended
|
||||
|
March 31, 2019
|
||||
|
Cash paid for amounts included in the measurement of lease liabilities:
|
||||
|
Operating cash flows from operating leases
|
$
|
12.6
|
|
|
|
Operating cash flows from finance leases
|
0.1
|
|
||
|
Financing cash flows from finance leases
|
0.4
|
|
||
The weighted average remaining lease term was as follows:
|
March 31, 2019
|
||
|
Operating leases (in years)
|
7.9
|
|
|
Finance leases (in years)
|
2.6
|
|
The weighted average discount rate was as follows:
|
March 31, 2019
|
|||
|
Operating leases
|
4.8
|
%
|
|
|
Finance leases
|
4.1
|
|
|
5. RECEIVABLES SALES AGREEMENT
In December 2017, the Company entered into an agreement (the “Receivables Sales Agreement”), to sell, on a revolving basis, certain trade accounts receivable balances to an unrelated third-party financial institution. Transfers under this agreement are accounted for as sales of receivables resulting in the receivables being de-recognized from the Condensed Consolidated Balance Sheet. The Receivables Sales Agreement provides for the sale of certain receivables on a revolving basis until terminated by either party. On September 28, 2018, the Company entered into an Amendment to the Receivables Sales Agreement, increasing the maximum receivables that may be sold at any time from
$200.0 million
to
$300.0 million
.
The outstanding amount of accounts receivable sold under the Receivables Sales Agreement were
$148.7 million
and
$177.0 million
as of
March 31, 2019
and
December 31, 2018
, respectively. The proceeds from these sales of receivables are included within the change in receivables in the operating activities section of the Condensed Consolidated Statements of Cash Flows. The recorded loss on sale of receivables is
$0.9 million
and
$0.6 million
for the
three
months ended
March 31, 2019
and
2018
, respectively, and is included in
Other expense, net
in the Condensed Consolidated Statements of Operations.
13
TREEHOUSE FOODS, INC.
NOTES TO CONDENSED CONSOLIDATED FINANCIAL STATEMENTS — (Continued)
The Company has
no
retained interest in the receivables sold under the program above; however, the Company does have collection and administrative responsibilities for the sold receivables. As of
March 31, 2019
and
December 31, 2018
, the Company had collected
$97.5 million
and
$119.3 million
, respectively, of cash from customers which was not yet remitted to the third-party financial institution. These amounts were included in Accounts payable in the Condensed Consolidated Balance Sheets. The Company has not recorded any servicing assets or liabilities as of
March 31, 2019
or December 31, 2018, as the fair value of the servicing arrangement as well as the fees earned were not material to the financial statements.
6. INVENTORIES
|
March 31, 2019
|
December 31, 2018
|
|||||||
|
|
(In millions)
|
|||||||
|
Raw materials and supplies
|
$
|
361.8
|
|
$
|
390.8
|
|
||
|
Finished goods
|
517.0
|
|
473.0
|
|
||||
|
LIFO reserve
|
(24.6
|
)
|
(24.1
|
)
|
||||
|
Total inventories
|
$
|
854.2
|
|
$
|
839.7
|
|
||
Inventory is generally accounted for under the first-in, first-out (“FIFO”) method and a portion was accounted for under the last-in, first-out (“LIFO”) method. Approximately
$53.5 million
and
$67.8 million
of our inventory was accounted for under the LIFO method of accounting at
March 31, 2019
and
December 31, 2018
, respectively.
7. GOODWILL AND INTANGIBLE ASSETS
As a result of the changes in organizational structure completed in the first quarter of 2019, the Company now has the following
four
operating segments, which are also its reporting units: Baked Goods, Beverages, Meal Solutions, and Snacks. See
Note 16
for more information.
The Company allocated goodwill and accumulated impairment loss balances as of January 1, 2019 between reporting units using a relative fair value allocation approach. The change was considered a triggering event indicating a test for goodwill impairment was required as of January 1, 2019. The Company performed the impairment test, which did not result in the identification of any impairment losses.
Changes in the carrying amount of goodwill for the
three
months ended
March 31, 2019
are as follows:
|
Baked
Goods
|
Beverages
|
Meal Solutions
|
Snacks
|
Total
|
||||||||||||||||
|
|
(In millions)
|
|||||||||||||||||||
|
Goodwill
|
$
|
642.2
|
|
$
|
712.5
|
|
$
|
851.2
|
|
$
|
576.8
|
|
$
|
2,782.7
|
|
|||||
|
Accumulated impairment losses
|
(33.0
|
)
|
—
|
|
(11.5
|
)
|
(576.8
|
)
|
(621.3
|
)
|
||||||||||
|
Balance at January 1, 2019
|
609.2
|
|
712.5
|
|
839.7
|
|
—
|
|
2,161.4
|
|
||||||||||
|
Foreign currency exchange adjustments
|
—
|
|
1.0
|
|
1.5
|
|
—
|
|
2.5
|
|
||||||||||
|
Balance at March 31, 2019
|
$
|
609.2
|
|
$
|
713.5
|
|
$
|
841.2
|
|
$
|
—
|
|
|
$
|
2,163.9
|
|
||||
Indefinite Lived Intangible Assets
The Company has
$21.7 million
and
$21.4 million
of trademarks with indefinite lives as of
March 31, 2019
and
December 31, 2018
, respectively.
14
TREEHOUSE FOODS, INC.
NOTES TO CONDENSED CONSOLIDATED FINANCIAL STATEMENTS — (Continued)
Finite Lived Intangible Assets
The gross carrying amounts and accumulated amortization of intangible assets with finite lives as of
March 31, 2019
and
December 31, 2018
are as follows:
|
|
March 31, 2019
|
December 31, 2018
|
||||||||||||||||||||||
|
Gross
Carrying
Amount
|
Accumulated
Amortization
|
Net
Carrying
Amount
|
Gross
Carrying
Amount
|
Accumulated
Amortization
|
Net
Carrying
Amount
|
|||||||||||||||||||
|
|
(In millions)
|
|||||||||||||||||||||||
|
Intangible assets with finite lives:
|
|
|
|
|
|
|
|
|
|
|
|
|
||||||||||||
|
Customer-related
|
$
|
957.0
|
|
$
|
(403.9
|
)
|
$
|
553.1
|
|
$
|
954.3
|
|
$
|
(387.9
|
)
|
$
|
566.4
|
|
||||||
|
Contractual agreements
|
3.0
|
|
(3.0
|
)
|
—
|
|
3.0
|
|
(3.0
|
)
|
—
|
|
||||||||||||
|
Trademarks
|
59.2
|
|
(28.8
|
)
|
30.4
|
|
59.1
|
|
(27.6
|
)
|
31.5
|
|
||||||||||||
|
Formulas/recipes
|
33.7
|
|
(24.8
|
)
|
8.9
|
|
33.7
|
|
(23.5
|
)
|
10.2
|
|
||||||||||||
|
Computer software
|
165.4
|
|
(89.0
|
)
|
76.4
|
|
155.3
|
|
(84.6
|
)
|
70.7
|
|
||||||||||||
|
Total finite lived intangibles
|
$
|
1,218.3
|
|
$
|
(549.5
|
)
|
$
|
668.8
|
|
$
|
1,205.4
|
|
|
$
|
(526.6
|
)
|
$
|
678.8
|
|
|||||
8. INCOME TAXES
Income tax benefit was recorded at an effective rate of
31.1%
for the
three
months ended
March 31, 2019
compared to
22.3%
for the
three
months ended
March 31, 2018
. The change in the Company's effective tax rate for the
three
months ended
March 31, 2019
compared to
2018
is primarily the result of an adjustment to the one-time transition tax liability due to the January 15, 2019 release of final regulations, the impact of a decrease in executive compensation that is non-deductible for tax purposes, and a change in the valuation allowance. In addition, the Company’s effective tax rate for the three months ended March 31, 2019 reflects a discrete benefit with a rate impact of approximately
1.3%
attributable to the vesting and exercise of share-based awards. Our effective tax rate may change from period to period based on recurring and non-recurring factors including the jurisdictional mix of earnings, enacted tax legislation, state income taxes, settlement of tax audits, and the expiration of the statute of limitations in relation to unrecognized tax benefits.
Management estimates that it is reasonably possible that the total amount of unrecognized tax benefits could decrease by as much as
$4.0 million
within the next 12 months, primarily as a result of the resolution of audits currently in progress and the lapsing of statutes of limitations. As much as
$1.0 million
of the
$4.0 million
could affect net income when settled.
On January 15, 2019, the U.S. Treasury Department and Internal Revenue Service released final regulations regarding the one-time transition tax on the mandatory deemed repatriation of cumulative foreign earnings. During the three months ended March 31, 2019, the Company recorded a
$1.4 million
benefit to reflect the final regulations.
9. LONG-TERM DEBT
|
March 31, 2019
|
December 31, 2018
|
|||||||
|
|
(In millions)
|
|||||||
|
Term Loan A
|
$
|
488.8
|
|
$
|
488.8
|
|
||
|
Term Loan A-1
|
841.3
|
|
851.2
|
|
||||
|
2022 Notes
|
375.9
|
|
375.9
|
|
||||
|
2024 Notes
|
602.9
|
|
602.9
|
|
||||
|
Finance leases
|
2.4
|
|
2.5
|
|
||||
|
Total outstanding debt
|
2,311.3
|
|
2,321.3
|
|
||||
|
Deferred financing costs
|
(21.5
|
)
|
(22.7
|
)
|
||||
|
Less current portion
|
(4.6
|
)
|
(1.2
|
)
|
||||
|
Total long-term debt
|
$
|
2,285.2
|
|
$
|
2,297.4
|
|
||
15
TREEHOUSE FOODS, INC.
NOTES TO CONDENSED CONSOLIDATED FINANCIAL STATEMENTS — (Continued)
The Company’s average interest rate on debt outstanding under its Credit Agreement for the
three months ended March 31, 2019
was
4.34%
. Including the impact of interest rate swap agreements in effect as of
March 31, 2019
, the average rate decreased to
3.62%
.
Revolving Credit Facility
— As of
March 31, 2019
,
$719.6 million
of the aggregate commitment of
$750.0 million
of the Revolving Credit Facility was available. Under the Credit Agreement, the Revolving Credit Facility matures on February 1, 2023. In addition, as of March 31, 2019, there were
$30.4 million
in letters of credit under the Revolving Credit Facility that were issued but undrawn, which have been included as a reduction to the calculation of available credit.
Fair Value -
At
March 31, 2019
, the aggregate fair value of the Company's total debt was
$2,337.5 million
and its carrying value was
$2,308.9 million
. At
December 31, 2018
, the aggregate fair value of the Company's total debt was
$2,311.3 million
and its carrying value was
$2,318.8 million
. The fair values of Term Loan A and Term Loan A-1 were estimated using present value techniques and market-based interest rates and credit spreads. The fair values of the Company's 2022 Notes and 2024 Notes were estimated based on quoted market prices for similar instruments due to their infrequent trading volume. Accordingly, the fair value of the Company's debt is classified as Level 2 within the valuation hierarchy.
10. EARNINGS PER SHARE
The following table summarizes the effect of the share-based compensation awards on the weighted average number of shares outstanding used in calculating diluted loss per share:
|
|
Three Months Ended
March 31, |
||||||||
|
|
2019
|
2018
|
|||||||
|
|
(In millions, except per share data)
|
||||||||
|
Net loss
|
$
|
(27.3
|
)
|
$
|
(34.1
|
)
|
|||
|
Weighted average common shares outstanding
|
56.1
|
|
56.5
|
|
|||||
|
Assumed exercise/vesting of equity awards (1)
|
—
|
|
—
|
|
|||||
|
Weighted average diluted common shares outstanding
|
56.1
|
|
56.5
|
|
|||||
|
Net loss per basic share
|
$
|
(0.49
|
)
|
$
|
(0.60
|
)
|
|||
|
Net loss per diluted share
|
$
|
(0.49
|
)
|
$
|
(0.60
|
)
|
|||
|
(1)
|
Incremental shares from equity awards are computed using the treasury stock method. For the
three
months ended
March 31, 2019
and
2018
, the weighted average common shares outstanding is the same for both the computations of basic and diluted shares because the Company had a net loss for the period. Equity awards excluded from the Company's computation of diluted earnings per share because they were anti-dilutive, were
1.7 million
and
2.1 million
for the
three
months ended
March 31, 2019
and
2018
, respectively.
|
11. STOCK-BASED COMPENSATION
The Board of Directors adopted, and the Company’s stockholders approved, the “TreeHouse Foods, Inc. Equity and Incentive Plan” (the “Plan”). Under the Plan, the Compensation Committee may grant awards of various types of compensation, including stock options, restricted stock, restricted stock units, performance shares, performance units, other types of stock-based awards, and other cash-based compensation. On April 25, 2019, the Plan was amended and restated to increase the number of shares available for issuance under the Plan by
1.5 million
shares, effective February 27, 2019. The maximum number of shares available to be awarded under the Plan is approximately
17.5 million
, of which approximately
4.6 million
remained available at
March 31, 2019
.
Loss before income taxes for the
three
months ended
March 31, 2019
and 2018 includes stock-based compensation expense of
$6.1 million
and
$16.3 million
, respectively. The tax benefit recognized related to the compensation cost of these share-based awards was approximately
$1.5 million
and
$4.0 million
for the
three
months ended
March 31, 2019
and 2018, respectively.
16
TREEHOUSE FOODS, INC.
NOTES TO CONDENSED CONSOLIDATED FINANCIAL STATEMENTS — (Continued)
In the first quarter of 2018, the Company entered into an amended employment agreement with our former Chief Executive Officer. The amended plan resulted in the modification of his outstanding equity awards by accelerating the vesting dates, changing outstanding performance units to vest at target, and extending the exercisability of options outstanding. Modification of the existing awards resulted in a charge of
$10.0 million
in the three months ended March 31, 2018. The impact of this modification on expense recognized for stock options, restricted stock units, and performance units was
$1.2 million
,
$3.8 million
, and
$5.0 million
, respectively.
Stock Options —
The following table summarizes stock option activity during the
three
months ended
March 31, 2019
. Stock options generally vest in approximately three equal installments on each of the first three anniversaries of the grant date and expire
ten
years from the grant date.
|
Employee
Options
|
Weighted
Average
Exercise
Price
|
Weighted
Average
Remaining
Contractual
Term (yrs)
|
Aggregate
Intrinsic
Value
|
||||||||||
|
|
(In thousands)
|
|
|
(In millions)
|
|||||||||
|
Outstanding, at December 31, 2018
|
1,720
|
|
$
|
75.24
|
|
4.8
|
$
|
1.1
|
|
||||
|
Forfeited
|
(8
|
)
|
89.54
|
|
|||||||||
|
Exercised
|
(4
|
)
|
58.27
|
|
|||||||||
|
Expired
|
(74
|
)
|
77.45
|
|
|||||||||
|
Outstanding, at March 31, 2019
|
1,634
|
|
75.07
|
|
4.7
|
4.5
|
|
||||||
|
Vested/expected to vest, at March 31, 2019
|
1,619
|
|
74.99
|
|
4.6
|
4.4
|
|
||||||
|
Exercisable, at March 31, 2019
|
1,506
|
|
73.95
|
|
4.4
|
4.4
|
|
||||||
|
|
Three Months Ended
March 31, |
||||||||
|
|
2019
|
2018
|
|||||||
|
|
(In millions)
|
||||||||
|
Compensation expense
|
$
|
0.9
|
|
$
|
2.7
|
|
|||
|
Intrinsic value of stock options exercised
|
—
|
|
1.5
|
|
|||||
Future compensation costs related to unvested options totaled
$1.8 million
at
March 31, 2019
and will be recognized over the remaining vesting period of the grants, which averages
0.9 years
.
Restricted Stock Units
— Employee restricted stock unit awards generally vest based on the passage of time. These awards generally vest in approximately three equal installments on each of the first three anniversaries of the grant date. Director restricted stock units generally vest on the first anniversary of the grant date. Certain directors have deferred receipt of their awards until either their departure from the Board of Directors or a specified date. As of
March 31, 2019
, director restricted stock units that have been earned and deferred totaled approximately
118,000
.
The following table summarizes the restricted stock unit activity during the
three
months ended
March 31, 2019
:
|
Employee
Restricted
Stock Units
|
Weighted
Average
Grant Date
Fair Value
|
Director
Restricted
Stock Units
|
Weighted
Average
Grant Date
Fair Value
|
|||||||||||
|
|
(In thousands)
|
|
(In thousands)
|
|
||||||||||
|
Outstanding, at December 31, 2018
|
685
|
|
$
|
52.20
|
|
129
|
|
$
|
53.75
|
|
||||
|
Granted
|
327
|
|
64.39
|
|
—
|
|
—
|
|
||||||
|
Vested
|
(231
|
)
|
55.58
|
|
(9
|
)
|
38.27
|
|
||||||
|
Forfeited
|
(23
|
)
|
47.49
|
|
—
|
|
—
|
|
||||||
|
Outstanding, at March 31, 2019
|
758
|
|
56.59
|
|
120
|
|
54.99
|
|
||||||
17
TREEHOUSE FOODS, INC.
NOTES TO CONDENSED CONSOLIDATED FINANCIAL STATEMENTS — (Continued)
|
|
Three Months Ended
March 31, |
||||||||
|
|
2019
|
2018
|
|||||||
|
|
(In millions)
|
||||||||
|
Compensation expense
|
$
|
4.6
|
|
$
|
8.3
|
|
|||
|
Fair value of vested restricted stock units
|
15.2
|
|
4.3
|
|
|||||
|
Tax benefit recognized from vested restricted stock units
|
2.6
|
|
1.0
|
|
|||||
Future compensation costs related to restricted stock units are approximately
$32.1 million
as of
March 31, 2019
and will be recognized on a weighted average basis over the next
2.4 years
. The grant date fair value of the awards is equal to the Company’s closing stock price on the grant date.
Performance Units
— Performance unit awards are granted to certain members of management. These awards contain service and performance conditions. For each of the three performance periods, one-third of the units will accrue, multiplied by a predefined percentage generally between
0%
and
200%
, depending on the achievement of certain operating performance measures. Additionally, for the cumulative performance period, a number of units will accrue, equal to the number of units granted multiplied by a predefined percentage generally between
0%
and
200%
, depending on the achievement of certain operating performance measures, less any units previously accrued. Accrued units will be converted to stock or cash, at the discretion of the Compensation Committee, generally, on the third anniversary of the grant date. The Company intends to settle these awards in stock and has the shares available to do so.
The following table summarizes the performance unit activity during the
three
months ended
March 31, 2019
:
|
Performance
Units
|
Weighted
Average
Grant Date
Fair Value
|
||||||
|
|
(In thousands)
|
|
|||||
|
Unvested, at December 31, 2018
|
176
|
|
$
|
71.49
|
|
||
|
Granted
|
353
|
|
62.07
|
|
|||
|
Forfeited
|
(4
|
)
|
89.37
|
|
|||
|
Unvested, at March 31, 2019
|
525
|
|
65.04
|
|
|||
|
|
Three Months Ended
March 31, |
||||||||
|
|
2019
|
2018
|
|||||||
|
|
(In millions)
|
||||||||
|
Compensation expense
|
$
|
0.6
|
|
$
|
5.3
|
|
|||
Future compensation costs related to the performance units are estimated to be approximately
$23.3 million
as of
March 31, 2019
and are expected to be recognized over the next
2.8 years
. The grant date fair value of the awards is equal to the Company’s closing stock price on the date of grant.
18
TREEHOUSE FOODS, INC.
NOTES TO CONDENSED CONSOLIDATED FINANCIAL STATEMENTS — (Continued)
12. ACCUMULATED OTHER COMPREHENSIVE LOSS
Accumulated other comprehensive loss consists of the following components, all of which are net of tax:
|
Foreign
Currency
Translation (1)
|
Unrecognized
Pension and
Postretirement
Benefits (1)
|
Accumulated
Other
Comprehensive
Loss
|
||||||||||
|
|
(In millions)
|
|||||||||||
|
Balance at December 31, 2017
|
$
|
(57.2
|
)
|
$
|
(4.3
|
)
|
$
|
(61.5
|
)
|
|||
|
Other comprehensive loss
|
(10.1
|
)
|
—
|
|
(10.1
|
)
|
||||||
|
Reclassifications from accumulated other comprehensive loss (2)
|
—
|
|
0.2
|
|
0.2
|
|
||||||
|
Reclassifications from accumulated other comprehensive loss - Adoption of ASU 2018-02
|
—
|
|
(1.1
|
)
|
(1.1
|
)
|
||||||
|
Other comprehensive loss
|
(10.1
|
)
|
(0.9
|
)
|
(11.0
|
)
|
||||||
|
Balance at March 31, 2018
|
$
|
(67.3
|
)
|
$
|
(5.2
|
)
|
$
|
(72.5
|
)
|
|||
|
Balance at December 31, 2018
|
$
|
(91.7
|
)
|
$
|
(5.4
|
)
|
$
|
(97.1
|
)
|
|||
|
Other comprehensive income
|
6.8
|
|
—
|
|
6.8
|
|
||||||
|
Reclassifications from accumulated other comprehensive income (2)
|
—
|
|
0.1
|
|
0.1
|
|
||||||
|
Other comprehensive income
|
6.8
|
|
0.1
|
|
6.9
|
|
||||||
|
Balance at March 31, 2019
|
$
|
(84.9
|
)
|
$
|
(5.3
|
)
|
$
|
(90.2
|
)
|
|||
|
(1)
|
The tax impact of the foreign currency translation adjustment and the unrecognized pension and postretirement benefits reclassification was insignificant for the three months ended March 31, 2019 and 2018.
|
|
(2)
|
Refer to
Note 13
for additional information regarding these reclassifications.
|
13. EMPLOYEE RETIREMENT AND POSTRETIREMENT BENEFITS
Pension, Profit Sharing, and Postretirement Benefits
— Certain employees and retirees participate in pension and other postretirement benefit plans. Employee benefit plan obligations and expenses included in the Condensed Consolidated Financial Statements are determined based on plan assumptions, employee demographic data, including years of service and compensation, benefits and claims paid, and employer contributions.
Components of net periodic pension benefit are as follows:
|
Three Months Ended
March 31, |
|||||||||
|
|
2019
|
2018
|
|||||||
|
|
(In millions)
|
||||||||
|
Service cost
|
$
|
0.5
|
|
$
|
0.6
|
|
|||
|
Interest cost
|
3.2
|
|
2.9
|
|
|||||
|
Expected return on plan assets
|
(3.8
|
)
|
(4.0
|
)
|
|||||
|
Amortization of unrecognized prior service cost
|
—
|
|
—
|
|
|||||
|
Amortization of unrecognized net loss
|
0.1
|
|
0.2
|
|
|||||
|
Net periodic pension benefit
|
$
|
—
|
|
$
|
(0.3
|
)
|
|||
19
TREEHOUSE FOODS, INC.
NOTES TO CONDENSED CONSOLIDATED FINANCIAL STATEMENTS — (Continued)
Components of net periodic postretirement expense are as follows:
|
Three Months Ended
March 31, |
|||||||||
|
|
2019
|
2018
|
|||||||
|
|
(In millions)
|
||||||||
|
Interest cost
|
$
|
0.3
|
|
$
|
0.3
|
|
|||
|
Net periodic postretirement cost
|
$
|
0.3
|
|
$
|
0.3
|
|
|||
The service cost components of net periodic pension and postretirement costs were recorded in Cost of sales and the other components were recorded in
Other expense, net
of the Condensed Consolidated Statements of Operations.
14. COMMITMENTS AND CONTINGENCIES
Litigation, Investigations, and Audits
- On November 16, 2016, a purported TreeHouse shareholder filed a class action captioned
Tarara v. TreeHouse Foods, Inc., et al.
, Case No. 1:16-cv-10632, in the United States District Court for the Northern District of Illinois against TreeHouse and certain of its officers. The complaint, amended on March 24, 2017, is purportedly brought on behalf of all purchasers of TreeHouse common stock from January 20, 2016 through and including November 2, 2016. It asserts claims under Sections 10(b) and 20(a) of the Securities Exchange Act of 1934 and Rule 10b-5 promulgated thereunder and seeks, among other things, damages and costs and expenses. On December 22, 2016, another purported TreeHouse shareholder filed an action captioned
Wells v. Reed, et al.
, Case No. 2016-CH-16359, in the Circuit Court of Cook County, Illinois, against TreeHouse and certain of its officers. This complaint, purportedly brought derivatively on behalf of TreeHouse, asserts state law claims against certain officers for breach of fiduciary duty, unjust enrichment, and corporate waste. On February 7, 2017, another purported TreeHouse shareholder filed an action captioned
Lavin v. Reed
, Case No. 17-cv-01014, in the Northern District of Illinois, against TreeHouse and certain of its officers. This complaint is also purportedly brought derivatively on behalf of TreeHouse, and it asserts state law claims against certain officers for breach of fiduciary duty, unjust enrichment, abuse of control, gross mismanagement, and corporate waste. Finally, on February 8, 2019, another purported TreeHouse shareholder filed an action captioned
Bartelt v. Reed, et al.
, Case No. 1:19-cv-00835, in the United States District Court for the Northern District of Illinois. Like
Wells
and
Lavin
, this complaint is purportedly brought derivatively on behalf of TreeHouse and asserts state law claims against certain officers for breach of fiduciary duty, unjust enrichment, abuse of control, gross mismanagement, and corporate waste, in addition to asserting violations of Section 14 of the Securities Exchange Act of 1934.
All four complaints make substantially similar allegations (though the amended complaint in
Tarara
now contains additional detail). Essentially, the complaints allege that TreeHouse, under the authority and control of the individual defendants: (i) made certain false and misleading statements regarding the Company’s business, operations, and future prospects; and (ii) failed to disclose that (a) the Company’s private label business was underperforming; (b) the Company’s Flagstone business was underperforming; (c) the Company’s acquisition strategy was underperforming; (d) the Company had overstated its full-year 2016 guidance; and (e) TreeHouse’s statements lacked reasonable basis. The
Bartelt
action also includes substantially similar allegations concerning events in 2017. The complaints allege that these actions artificially inflated the market price of TreeHouse common stock during the class period, thus purportedly harming investors. We believe that these claims are without merit and intend to defend against them vigorously.
Since its initial docketing, the
Tarara
matter has been re-captioned as
Public Employees’ Retirement Systems of Mississippi v. TreeHouse Foods, Inc., et al.
, in accordance with the Court’s order appointing Public Employees’ Retirement Systems of Mississippi as the lead plaintiff. On May 26, 2017, the
Public Employees’
defendants filed a motion to dismiss, which the court denied on February 12, 2018. On April 12, 2018, the
Public Employees’
defendants filed their answer to the amended complaint. On April 23, 2018, the parties filed a joint status report with the Court, which set forth a proposed discovery and briefing schedule for the Court’s consideration. On July 13, 2018, lead plaintiff filed a motion to certify the class, and defendants filed their response in opposition to the motion to certify the class on October 8, 2018. On November 12, 2018, the parties filed an agreed motion to stay proceedings to allow them to explore mediation. The motion was granted on November 19. The parties thereafter engaged in mediation but failed to resolve the dispute. On March 29, 2019, the parties resumed litigation by filing an agreed motion for extension of time, which was granted on April 9. Pursuant to that schedule, lead plaintiff must file its reply class certification brief by May 17, 2019, and document production must be substantially completed by August 2.
20
TREEHOUSE FOODS, INC.
NOTES TO CONDENSED CONSOLIDATED FINANCIAL STATEMENTS — (Continued)
Due to the similarity of the complaints, the parties in
Wells
and
Lavin
entered stipulations deferring the litigation until the earlier of (i) the court in
Public Employees’
entering an order resolving defendants’ anticipated motion to dismiss therein or (ii) plaintiffs’ counsel receiving notification of a settlement of
Public Employees’
or until otherwise agreed to by the parties. On September 27, 2018, the parties in
Wells
and
Lavin
filed joint motions for entry of agreed orders further deferring the matters in light of the
Public Employees’
Court’s denial of the motion to dismiss in February 2018. The
Wells
and
Lavin
Courts entered the agreed orders further deferring the matters on September 27, 2018 and October 10, 2018, respectively. In
Wells
,
the next status conference
is set for July 8, 2019. In
Bartelt
, the parties have agreed to move to consolidate the matter with
Lavin
such that the
Bartelt
complaint will be subject to the same deferral order already in place. There is no set status date in
Lavin
at this time.
The Company is also party to matters challenging its wage and hour practices. These matters include a number of class actions consolidated under the caption Negrete v. Ralcorp Holdings, Inc., et al, pending in the U.S. District Court for the Central District of California, in which the plaintiffs allege a pattern of violations of California and/or federal law at several current and former Company manufacturing facilities across the State of California. While the Company cannot predict with certainty the results of this or any other legal proceeding, it does not expect this matter to have a material adverse effect on its financial condition, results of operations, or business.
In addition, the Company is party in the ordinary course of business to certain claims, litigation, audits, and investigations. The Company will record an accrual for a loss contingency when it is probable that a loss has been incurred and the amount of the loss can be reasonably estimated. The Company believes it has established adequate accruals for liabilities that are probable and reasonably estimable that may be incurred in connection with any such currently pending or threatened matter, none of which are significant. In the Company’s opinion, the settlement of any such currently pending or threatened matter is not expected to have a material impact on the Company’s financial position, results of operations, or cash flows.
15. DERIVATIVE INSTRUMENTS
The Company is exposed to certain risks relating to its ongoing business operations. The primary risks managed by derivative instruments include interest rate risk, foreign currency risk, and commodity price risk. Derivative contracts are entered into for periods consistent with the related underlying exposure and do not constitute positions independent of those exposures. The Company does not enter into derivative instruments for trading or speculative purposes.
Interest Rate Risk -
The Company manages its exposure to changes in interest rates by optimizing the use of variable-rate and fixed-rate debt and by utilizing interest rate swaps to hedge our exposure to changes in interest rates, to reduce the volatility of our financing costs, and to achieve a desired proportion of fixed versus floating-rate debt, based on current and projected market conditions.
As of
March 31, 2019
, the Company had entered into
$1.8 billion
of long-term interest rate swap agreements to lock into a fixed LIBOR interest rate base. Under the terms of the agreements,
$1.8 billion
in variable-rate debt was swapped for a weighted average fixed interest rate base of approximately
1.54%
through 2019;
2.68%
from
2019 through 2020
; and
2.91%
from
2021 through 2025
. These instruments are not accounted for under hedge accounting and the changes in their fair value are recorded in the Condensed Consolidated Statements of Operations.
Foreign Currency Risk
- Due to the Company’s foreign operations, it is exposed to foreign currency risk. The Company enters into foreign currency contracts to manage the risk associated with foreign currency cash flows. The Company’s objective in using foreign currency contracts is to establish a fixed foreign currency exchange rate for the net cash flow requirements for purchases that are denominated in U.S. dollars. These contracts do not qualify for hedge accounting and changes in their fair value are recorded in the Condensed Consolidated Statements of Operations. As of
March 31, 2019
, the Company had
$6.3 million
of U.S. dollar foreign currency contracts outstanding, expiring
throughout 2019.
Commodity Risk
- Certain commodities the Company uses in the production and distribution of our products are exposed to market price risk. The Company utilizes derivative contracts to manage this risk. The majority of commodity forward contracts are not derivatives, and those that are generally qualify for the normal purchases and normal sales scope exception under the guidance for derivative instruments and hedging activities and, therefore, are not subject to its provisions. For derivative commodity contracts that do not qualify for the normal purchases and normal sales scope exception, the Company records their fair value on the Condensed Consolidated Balance Sheets, with changes in value being recorded in the Condensed Consolidated Statements of Operations.
21
TREEHOUSE FOODS, INC.
NOTES TO CONDENSED CONSOLIDATED FINANCIAL STATEMENTS — (Continued)
The Company’s derivative commodity contracts may include contracts for diesel, oil, plastics, natural gas, electricity, resin, and other commodity contracts that do not meet the requirements for the normal purchases and normal sales scope exception.
Diesel contracts are used to manage the Company’s risk associated with the underlying cost of diesel fuel used to deliver products. Contracts for oil, plastics, and resin are used to manage the Company’s risk associated with the underlying commodity cost of a significant component used in packaging materials. Contracts for natural gas and electricity are used to manage the Company’s risk associated with the utility costs of its manufacturing facilities, and commodity contracts are used to manage the price risk associated with raw material costs. As of
March 31, 2019
, the Company had outstanding contracts for the purchase of
0.1 million
megawatts of electricity, expiring
throughout 2019, and 2020
;
12.7 million
gallons of diesel, expiring
throughout 2019
;
2.1 million
dekatherms of natural gas, expiring
throughout 2019
; and
15.5 million
pounds of resin, expiring
throughout 2019
.
The following table identifies the fair value of each derivative instrument:
|
Fair Value
|
||||||||
|
|
March 31, 2019
|
December 31, 2018
|
||||||
|
Asset Derivatives
|
(In millions)
|
|||||||
|
Commodity contracts
|
$
|
1.2
|
|
$
|
0.6
|
|
||
|
Foreign currency contracts
|
0.3
|
|
1.5
|
|
||||
|
Interest rate swap agreements
|
7.1
|
|
10.1
|
|
||||
|
|
$
|
8.6
|
|
$
|
12.2
|
|
||
|
Liability Derivatives
|
||||||||
|
Commodity contracts
|
$
|
0.7
|
|
$
|
1.8
|
|
||
|
Foreign currency contracts
|
0.1
|
|
—
|
|
||||
|
Interest rate swap agreements
|
32.3
|
|
19.0
|
|
||||
|
|
$
|
33.1
|
|
$
|
20.8
|
|
||
As of March 31, 2019 and December 31, 2018, asset derivatives are included within Other assets, net and liability derivatives are included within Accrued expenses in the Condensed Consolidated Balance Sheets.
The fair values of the commodity contracts, foreign currency contracts, and interest rate swap agreements are determined using Level 2 inputs. Level 2 inputs are inputs other than quoted market prices that are observable for an asset or liability, either directly or indirectly. The fair values of the commodity contracts, foreign currency contracts, and interest rate swap agreements are based on an analysis comparing the contract rates to the market rates at the balance sheet date.
22
TREEHOUSE FOODS, INC.
NOTES TO CONDENSED CONSOLIDATED FINANCIAL STATEMENTS — (Continued)
We recorded the following gains and losses on our derivative contracts in the Condensed Consolidated Statements of Operations:
|
Location of Gain (Loss)
|
Three Months Ended
March 31, |
||||||||||
|
|
Recognized in Net Loss
|
2019
|
2018
|
||||||||
|
|
|
(In millions)
|
|||||||||
|
Mark-to-market unrealized gain (loss)
|
|
|
|
|
|||||||
|
Commodity contracts
|
Other expense, net
|
$
|
1.7
|
|
$
|
(1.0
|
)
|
||||
|
Foreign currency contracts
|
Other expense, net
|
(1.3
|
)
|
1.8
|
|
||||||
|
Interest rate swap agreements
|
Other expense, net
|
(16.3
|
)
|
(6.4
|
)
|
||||||
|
Total unrealized loss
|
|
(15.9
|
)
|
(5.6
|
)
|
||||||
|
Realized gain
|
|
||||||||||
|
Commodity contracts
|
Manufacturing related to Cost of sales and transportation related to Selling and distribution
|
0.5
|
|
2.4
|
|
||||||
|
Foreign currency contracts
|
Cost of sales
|
0.3
|
|
0.6
|
|
||||||
|
Interest rate swap agreements
|
Interest expense
|
2.4
|
|
0.8
|
|
||||||
|
Total realized gain
|
|
3.2
|
|
3.8
|
|
||||||
|
Total loss
|
|
$
|
(12.7
|
)
|
$
|
(1.8
|
)
|
||||
23
TREEHOUSE FOODS, INC.
NOTES TO CONDENSED CONSOLIDATED FINANCIAL STATEMENTS — (Continued)
16. SEGMENT INFORMATION
On January 1, 2019, the Company changed how it manages its business, allocates resources, and goes to market, which resulted in modifications to its organizational and segment structure. As a result, the Company consolidated its Condiments and Meals segments into one segment called Meal Solutions. Additionally, the Bars and Ready-to-eat cereal categories moved from the Company's Snacks and Meals segments, respectively, into the Baked Goods segment. All prior period information has been recast to reflect this change in reportable segments.
The Company manages operations on a company-wide basis, thereby making determinations as to the allocation of resources in total rather than on a segment-level basis. The Company has designated reportable segments based on how management views its business. The Company does not segregate assets between segments for internal reporting. Therefore, asset-related information has not been presented. The reportable segments, as presented below, are consistent with the manner in which the Company reports its results to the Chief Operating Decision Maker.
As of the first quarter of 2019, our segments are as follows:
Baked Goods
– Our Baked Goods segment sells candy; cookies; crackers; in-store bakery products; pita chips; pretzels; refrigerated dough; retail griddle waffles, pancakes, and French toast; bars; and ready-to-eat cereal.
Beverages
– Our Beverages segment sells broths; liquid non-dairy creamer; non-dairy powdered creamers; powdered drinks; single serve hot beverages; specialty teas, and sweeteners.
Meal Solutions
– Our Meal Solutions segment sells aseptic cheese and pudding products; jams, preserves, and jellies; mayonnaise; Mexican, barbeque, and other sauces; pickles and related products; refrigerated and shelf stable dressings and sauces; table and flavored syrups; baking and mix powders; powdered soups and gravies; macaroni and cheese; pasta; hot cereals; and skillet dinners.
Snacks
– Our Snacks segment sells snack nuts; trail mixes; dried fruit; and other wholesome snacks.
The Company evaluates the performance of its segments based on net sales dollars and direct operating income. Direct operating income is defined as gross profit less freight out, sales commissions, and direct selling, general, and administrative expenses. The amounts in the following tables are obtained from reports used by senior management and do not include income taxes. Other expenses not allocated include unallocated selling, general, and administrative expenses, unallocated costs of sales, and unallocated corporate expenses (amortization expense and other operating expense). The accounting policies of the Company’s segments are the same as those described in the summary of significant accounting policies set forth in Note 1 to the Consolidated Financial Statements contained in our Annual Report on Form 10-K for the year ended
December 31, 2018
.
24
TREEHOUSE FOODS, INC.
NOTES TO CONDENSED CONSOLIDATED FINANCIAL STATEMENTS — (Continued)
Financial information relating to the Company’s reportable segments, revised to reflect the new segment structure, is as follows:
|
Three Months Ended
March 31, |
||||||||
|
|
2019
|
2018
|
||||||
|
|
(In millions)
|
|||||||
|
Net sales to external customers:
|
|
|
|
|
||||
|
Baked Goods
|
$
|
422.7
|
|
$
|
455.4
|
|
||
|
Beverages
|
237.2
|
|
249.1
|
|
||||
|
Meal Solutions
|
464.9
|
|
523.3
|
|
||||
|
Snacks
|
176.3
|
|
253.4
|
|
||||
|
Total
|
$
|
1,301.1
|
|
$
|
1,481.2
|
|
||
|
Direct operating income:
|
||||||||
|
Baked Goods
|
$
|
44.7
|
|
$
|
28.0
|
|
||
|
Beverages
|
43.9
|
|
39.4
|
|
||||
|
Meal Solutions
|
46.9
|
|
56.2
|
|
||||
|
Snacks
|
(13.8
|
)
|
7.6
|
|
||||
|
Total
|
121.7
|
|
131.2
|
|
||||
|
Unallocated selling, general, and administrative expenses
|
(58.5
|
)
|
(81.3
|
)
|
||||
|
Unallocated cost of sales (1)
|
(8.1
|
)
|
(7.5
|
)
|
||||
|
Unallocated corporate expense and other (1)
|
(56.0
|
)
|
(51.1
|
)
|
||||
|
Operating loss
|
$
|
(0.9
|
)
|
$
|
(8.7
|
)
|
||
|
(1)
|
Includes charges related to restructuring programs and other costs managed at corporate.
|
Disaggregation of Revenue
Segment revenue disaggregated by product category groups, revised to reflect the new segment structure, is as follows:
|
Three Months Ended
March 31, |
||||||||
|
|
2019
|
2018
|
||||||
|
|
(In millions)
|
|||||||
|
Retail bakery
|
$
|
159.9
|
|
$
|
177.1
|
|
||
|
Baked products
|
262.8
|
|
278.3
|
|
||||
|
Total Baked Goods
|
422.7
|
|
455.4
|
|
||||
|
Beverages
|
165.8
|
|
171.4
|
|
||||
|
Beverage enhancers
|
71.4
|
|
77.7
|
|
||||
|
Total Beverages
|
237.2
|
|
249.1
|
|
||||
|
Dressings and sauces
|
225.9
|
|
246.2
|
|
||||
|
Pickles
|
60.2
|
|
69.0
|
|
||||
|
Pasta and dry dinners
|
113.4
|
|
142.0
|
|
||||
|
Cereals and other meals
|
65.4
|
|
66.1
|
|
||||
|
Total Meal Solutions
|
464.9
|
|
523.3
|
|
||||
|
Snack nuts
|
149.9
|
|
202.4
|
|
||||
|
Trail mix
|
26.4
|
|
51.0
|
|
||||
|
Total Snacks
|
176.3
|
|
253.4
|
|
||||
|
Total net sales
|
$
|
1,301.1
|
|
$
|
1,481.2
|
|
||
25
TREEHOUSE FOODS, INC.
NOTES TO CONDENSED CONSOLIDATED FINANCIAL STATEMENTS — (Continued)
17. GUARANTOR AND NON-GUARANTOR FINANCIAL INFORMATION
The 2022 Notes and 2024 Notes are fully and unconditionally, as well as jointly and severally, guaranteed by our directly and indirectly owned domestic subsidiaries, which are collectively known as the “Guarantor Subsidiaries”. Bay Valley Foods, LLC, which is a 100% owned direct subsidiary, maintains
100%
direct and indirect ownership of the following Guarantor Subsidiaries: Sturm Foods, Inc.; S.T. Specialty Foods, Inc.; Associated Brands, Inc.; Cains Foods, Inc.; Cains Foods L.P.; Cains GP, LLC; Flagstone Foods, Inc., Protenergy Holdings, Inc.; Protenergy Natural Foods, Inc.; TreeHouse Private Brands, Inc. (formerly Ralcorp Holdings, Inc.); American Italian Pasta Company.; Nutcracker Brands, Inc.; Linette Quality Chocolates, Inc.; Ralcorp Frozen Bakery Products, Inc.; Cottage Bakery, Inc.; The Carriage House Companies, Inc. and certain other domestic subsidiaries that may become guarantors in the future.
The guarantees of the Guarantor Subsidiaries are subject to release in limited circumstances, only upon the occurrence of certain customary conditions. There are no significant restrictions on the ability of the parent company or any guarantor to obtain funds from its subsidiaries by dividend or loan. The following condensed supplemental consolidating financial information presents the results of operations, financial position, and cash flows of the parent company, its Guarantor Subsidiaries, its non-guarantor subsidiaries, and the eliminations necessary to arrive at the information for the Company on a consolidated basis as of
March 31, 2019
and
December 31, 2018
, and for the
three
months ended
March 31, 2019
and
2018
. The equity method has been used with respect to investments in subsidiaries. The principal elimination entries eliminate investments in subsidiaries and intercompany balances and transactions.
26
TREEHOUSE FOODS, INC.
NOTES TO CONDENSED CONSOLIDATED FINANCIAL STATEMENTS — (Continued)
Condensed Supplemental Consolidating Balance Sheet
March 31, 2019
(In millions)
|
Parent
Company
|
Guarantor
Subsidiaries
|
Non-Guarantor
Subsidiaries
|
Eliminations
|
Consolidated
|
||||||||||||||||
|
Assets
|
|
|
|
|
|
|
|
|
||||||||||||
|
Current assets:
|
|
|
|
|
|
|
|
|
|
|
||||||||||
|
Cash and cash equivalents
|
$
|
40.8
|
|
$
|
—
|
|
$
|
38.2
|
|
$
|
—
|
|
$
|
79.0
|
|
|||||
|
Accounts receivable, net
|
0.7
|
|
320.7
|
|
45.9
|
|
—
|
|
367.3
|
|
||||||||||
|
Inventories
|
—
|
|
748.8
|
|
105.4
|
|
—
|
|
854.2
|
|
||||||||||
|
Prepaid expenses and other current assets
|
99.3
|
|
60.9
|
|
24.7
|
|
(106.1
|
)
|
78.8
|
|
||||||||||
|
Total current assets
|
140.8
|
|
1,130.4
|
|
214.2
|
|
(106.1
|
)
|
1,379.3
|
|
||||||||||
|
Property, plant, and equipment, net
|
41.8
|
|
1,074.1
|
|
144.1
|
|
—
|
|
1,260.0
|
|
||||||||||
|
Operating lease right-of-use assets
|
38.1
|
|
160.8
|
|
29.9
|
|
—
|
|
228.8
|
|
||||||||||
|
Goodwill
|
—
|
|
2,046.7
|
|
117.2
|
|
—
|
|
2,163.9
|
|
||||||||||
|
Investment in subsidiaries
|
5,206.9
|
|
484.1
|
|
—
|
|
(5,691.0
|
)
|
—
|
|
||||||||||
|
Deferred income taxes
|
34.0
|
|
—
|
|
—
|
|
(34.0
|
)
|
—
|
|
||||||||||
|
Intangible and other assets, net
|
90.0
|
|
560.6
|
|
82.4
|
|
—
|
|
733.0
|
|
||||||||||
|
Total assets
|
$
|
5,551.6
|
|
$
|
5,456.7
|
|
$
|
587.8
|
|
$
|
(5,831.1
|
)
|
$
|
5,765.0
|
|
|||||
|
Liabilities and Stockholders’ Equity
|
||||||||||||||||||||
|
Current liabilities:
|
||||||||||||||||||||
|
Accounts payable
|
$
|
37.5
|
|
$
|
495.3
|
|
$
|
58.3
|
|
$
|
—
|
|
$
|
591.1
|
|
|||||
|
Accrued expenses
|
65.4
|
|
260.5
|
|
25.8
|
|
(106.1
|
)
|
245.6
|
|
||||||||||
|
Current portion of long-term debt
|
4.1
|
|
0.4
|
|
0.1
|
|
—
|
|
4.6
|
|
||||||||||
|
Total current liabilities
|
107.0
|
|
756.2
|
|
84.2
|
|
(106.1
|
)
|
841.3
|
|
||||||||||
|
Long-term debt
|
2,284.2
|
|
0.4
|
|
0.6
|
|
—
|
|
2,285.2
|
|
||||||||||
|
Operating lease liabilities
|
43.6
|
|
135.5
|
|
25.5
|
|
—
|
|
204.6
|
|
||||||||||
|
Deferred income taxes
|
—
|
|
172.1
|
|
17.1
|
|
(34.0
|
)
|
155.2
|
|
||||||||||
|
Other long-term liabilities
|
9.0
|
|
142.0
|
|
4.5
|
|
—
|
|
155.5
|
|
||||||||||
|
Intercompany accounts (receivable) payable, net
|
984.6
|
|
(956.4
|
)
|
(28.2
|
)
|
—
|
|
—
|
|
||||||||||
|
Stockholders’ equity
|
2,123.2
|
|
5,206.9
|
|
484.1
|
|
(5,691.0
|
)
|
2,123.2
|
|
||||||||||
|
Total liabilities and stockholders’ equity
|
$
|
5,551.6
|
|
$
|
5,456.7
|
|
$
|
587.8
|
|
$
|
(5,831.1
|
)
|
$
|
5,765.0
|
|
|||||
27
TREEHOUSE FOODS, INC.
NOTES TO CONDENSED CONSOLIDATED FINANCIAL STATEMENTS — (Continued)
Condensed Supplemental Consolidating Balance Sheet
December 31, 2018
(In millions)
|
Parent
Company
|
Guarantor
Subsidiaries
|
Non-Guarantor
Subsidiaries
|
Eliminations
|
Consolidated
|
||||||||||||||||
|
Assets
|
|
|
|
|
|
|
|
|
|
|
||||||||||
|
Current assets:
|
|
|
|
|
|
|
|
|
|
|
||||||||||
|
Cash and cash equivalents
|
$
|
77.9
|
|
$
|
—
|
|
$
|
86.4
|
|
$
|
—
|
|
$
|
164.3
|
|
|||||
|
Accounts receivable, net
|
1.0
|
|
314.1
|
|
36.2
|
|
—
|
|
351.3
|
|
||||||||||
|
Inventories
|
—
|
|
746.7
|
|
93.0
|
|
—
|
|
839.7
|
|
||||||||||
|
Prepaid expenses and other current assets
|
80.9
|
|
60.4
|
|
16.8
|
|
(96.3
|
)
|
61.8
|
|
||||||||||
|
Total current assets
|
159.8
|
|
1,121.2
|
|
232.4
|
|
(96.3
|
)
|
1,417.1
|
|
||||||||||
|
Property, plant, and equipment, net
|
42.8
|
|
1,087.8
|
|
143.8
|
|
—
|
|
1,274.4
|
|
||||||||||
|
Goodwill
|
—
|
|
2,046.7
|
|
114.7
|
|
—
|
|
2,161.4
|
|
||||||||||
|
Investment in subsidiaries
|
5,152.4
|
|
559.3
|
|
—
|
|
(5,711.7
|
)
|
—
|
|
||||||||||
|
Deferred income taxes
|
34.2
|
|
—
|
|
—
|
|
(34.2
|
)
|
—
|
|
||||||||||
|
Intangible and other assets, net
|
86.6
|
|
577.0
|
|
82.8
|
|
—
|
|
746.4
|
|
||||||||||
|
Total assets
|
$
|
5,475.8
|
|
$
|
5,392.0
|
|
$
|
573.7
|
|
$
|
(5,842.2
|
)
|
$
|
5,599.3
|
|
|||||
|
Liabilities and Stockholders’ Equity
|
||||||||||||||||||||
|
Current liabilities:
|
||||||||||||||||||||
|
Accounts payable
|
$
|
23.9
|
|
$
|
508.3
|
|
$
|
45.7
|
|
$
|
—
|
|
$
|
577.9
|
|
|||||
|
Accrued expenses
|
71.8
|
|
261.6
|
|
19.0
|
|
(96.3
|
)
|
256.1
|
|
||||||||||
|
Current portion of long-term debt
|
0.6
|
|
0.5
|
|
0.1
|
|
—
|
|
1.2
|
|
||||||||||
|
Total current liabilities
|
96.3
|
|
770.4
|
|
64.8
|
|
(96.3
|
)
|
835.2
|
|
||||||||||
|
Long-term debt
|
2,296.2
|
|
0.6
|
|
0.6
|
|
—
|
|
2,297.4
|
|
||||||||||
|
Deferred income taxes
|
—
|
|
171.9
|
|
16.5
|
|
(34.2
|
)
|
154.2
|
|
||||||||||
|
Other long-term liabilities
|
17.7
|
|
147.8
|
|
5.1
|
|
—
|
|
170.6
|
|
||||||||||
|
Intercompany accounts (receivable) payable, net
|
923.7
|
|
(851.1
|
)
|
(72.6
|
)
|
—
|
|
—
|
|
||||||||||
|
Stockholders’ equity
|
2,141.9
|
|
5,152.4
|
|
559.3
|
|
(5,711.7
|
)
|
2,141.9
|
|
||||||||||
|
Total liabilities and stockholders’ equity
|
$
|
5,475.8
|
|
$
|
5,392.0
|
|
$
|
573.7
|
|
$
|
(5,842.2
|
)
|
$
|
5,599.3
|
|
|||||
28
TREEHOUSE FOODS, INC.
NOTES TO CONDENSED CONSOLIDATED FINANCIAL STATEMENTS — (Continued)
Condensed Supplemental Consolidating Statement of Operations
Three Months Ended March 31, 2019
(In millions)
|
Parent
Company
|
Guarantor
Subsidiaries
|
Non-Guarantor
Subsidiaries
|
Eliminations
|
Consolidated
|
|||||||||||||||||
|
Net sales
|
$
|
—
|
|
$
|
1,245.7
|
|
$
|
152.7
|
|
$
|
(97.3
|
)
|
$
|
1,301.1
|
|
||||||
|
Cost of sales
|
—
|
|
1,058.3
|
|
145.5
|
|
(97.3
|
)
|
1,106.5
|
|
|||||||||||
|
Gross profit
|
—
|
|
187.4
|
|
7.2
|
|
—
|
|
194.6
|
|
|||||||||||
|
Selling, general, and administrative expense
|
34.7
|
|
102.0
|
|
8.4
|
|
—
|
|
—
|
|
145.1
|
|
|||||||||
|
Amortization expense
|
3.4
|
|
16.0
|
|
2.2
|
|
—
|
|
21.6
|
|
|||||||||||
|
Other operating expense, net
|
19.4
|
|
9.1
|
|
0.3
|
|
—
|
|
28.8
|
|
|||||||||||
|
Operating income (loss)
|
(57.5
|
)
|
60.3
|
|
(3.7
|
)
|
—
|
|
(0.9
|
)
|
|||||||||||
|
Interest expense
|
26.1
|
|
—
|
|
0.8
|
|
—
|
|
26.9
|
|
|||||||||||
|
(Gain) loss on foreign currency exchange
|
—
|
|
(0.4
|
)
|
—
|
|
—
|
|
(0.4
|
)
|
|||||||||||
|
Other expense, net
|
13.6
|
|
0.2
|
|
(1.6
|
)
|
—
|
|
12.2
|
|
|||||||||||
|
Loss before income taxes
|
(97.2
|
)
|
60.5
|
|
(2.9
|
)
|
—
|
|
(39.6
|
)
|
|||||||||||
|
Income tax benefit
|
(22.3
|
)
|
9.7
|
|
0.3
|
|
—
|
|
(12.3
|
)
|
|||||||||||
|
Equity in net income (loss) of subsidiaries
|
47.6
|
|
(3.2
|
)
|
—
|
|
(44.4
|
)
|
—
|
|
|||||||||||
|
Net loss
|
$
|
(27.3
|
)
|
$
|
47.6
|
|
$
|
(3.2
|
)
|
$
|
(44.4
|
)
|
$
|
(27.3
|
)
|
||||||
Condensed Supplemental Consolidating Statement of Operations
Three Months Ended March 31, 2018
(In millions)
|
Parent
Company
|
Guarantor
Subsidiaries
|
Non-Guarantor
Subsidiaries
|
Eliminations
|
Consolidated
|
||||||||||||||||
|
Net sales
|
$
|
—
|
|
$
|
1,408.8
|
|
$
|
177.2
|
|
$
|
(104.8
|
)
|
$
|
1,481.2
|
|
|||||
|
Cost of sales
|
—
|
|
1,194.3
|
|
159.8
|
|
(104.8
|
)
|
1,249.3
|
|
||||||||||
|
Gross profit
|
—
|
|
214.5
|
|
17.4
|
|
—
|
|
231.9
|
|
||||||||||
|
Selling, general, and administrative expense
|
44.6
|
|
136.0
|
|
8.9
|
|
—
|
|
189.5
|
|
||||||||||
|
Amortization expense
|
3.0
|
|
16.9
|
|
2.3
|
|
—
|
|
22.2
|
|
||||||||||
|
Other operating expense, net
|
18.8
|
|
10.0
|
|
0.1
|
|
—
|
|
28.9
|
|
||||||||||
|
Operating income (loss)
|
(66.4
|
)
|
51.6
|
|
6.1
|
|
—
|
|
(8.7
|
)
|
||||||||||
|
Interest expense
|
29.0
|
|
—
|
|
1.4
|
|
(1.9
|
)
|
28.5
|
|
||||||||||
|
(Gain) loss on foreign currency exchange
|
(0.4
|
)
|
2.1
|
|
0.8
|
|
—
|
|
2.5
|
|
||||||||||
|
Other expense, net
|
5.3
|
|
(0.2
|
)
|
(2.8
|
)
|
1.9
|
|
4.2
|
|
||||||||||
|
Loss before income taxes
|
(100.3
|
)
|
49.7
|
|
6.7
|
|
—
|
|
(43.9
|
)
|
||||||||||
|
Income tax benefit
|
(20.2
|
)
|
9.2
|
|
1.2
|
|
—
|
|
(9.8
|
)
|
||||||||||
|
Equity in net income (loss) of subsidiaries
|
46.0
|
|
5.5
|
|
—
|
|
(51.5
|
)
|
—
|
|
||||||||||
|
Net loss
|
$
|
(34.1
|
)
|
$
|
46.0
|
|
$
|
5.5
|
|
$
|
(51.5
|
)
|
$
|
(34.1
|
)
|
|||||
29
TREEHOUSE FOODS, INC.
NOTES TO CONDENSED CONSOLIDATED FINANCIAL STATEMENTS — (Continued)
Condensed Supplemental Consolidating Statement of Comprehensive Income (Loss)
Three Months Ended March 31, 2019
(In millions)
|
Parent
Company
|
Guarantor
Subsidiaries
|
Non-Guarantor
Subsidiaries
|
Eliminations
|
Consolidated
|
||||||||||||||||
|
Net loss
|
$
|
(27.3
|
)
|
$
|
47.6
|
|
$
|
(3.2
|
)
|
$
|
(44.4
|
)
|
$
|
(27.3
|
)
|
|||||
|
Other comprehensive income (loss):
|
||||||||||||||||||||
|
Foreign currency translation adjustments
|
—
|
|
—
|
|
6.8
|
|
—
|
|
6.8
|
|
||||||||||
|
Pension and postretirement reclassification
adjustment, net of tax
|
—
|
|
0.1
|
|
—
|
|
—
|
|
0.1
|
|
||||||||||
|
Other comprehensive income (loss)
|
—
|
|
0.1
|
|
6.8
|
|
—
|
|
6.9
|
|
||||||||||
|
Equity in other comprehensive (loss) income of
subsidiaries
|
6.9
|
|
6.8
|
|
—
|
|
(13.7
|
)
|
—
|
|
||||||||||
|
Comprehensive loss
|
$
|
(20.4
|
)
|
$
|
54.5
|
|
$
|
3.6
|
|
$
|
(58.1
|
)
|
$
|
(20.4
|
)
|
|||||
Condensed Supplemental Consolidating Statement of Comprehensive Income (Loss)
Three Months Ended March 31, 2018
(In millions)
|
Parent
Company
|
Guarantor
Subsidiaries
|
Non-Guarantor
Subsidiaries
|
Eliminations
|
Consolidated
|
||||||||||||||||
|
Net loss
|
$
|
(34.1
|
)
|
$
|
46.0
|
|
$
|
5.5
|
|
$
|
(51.5
|
)
|
$
|
(34.1
|
)
|
|||||
|
Other comprehensive income (loss):
|
||||||||||||||||||||
|
Foreign currency translation adjustments
|
—
|
|
—
|
|
(10.1
|
)
|
—
|
|
(10.1
|
)
|
||||||||||
|
Pension and postretirement reclassification
adjustment, net of tax
|
—
|
|
0.2
|
|
—
|
|
—
|
|
0.2
|
|
||||||||||
|
Adoption of ASU 2018-02 reclassification to retained earnings
|
—
|
|
(1.1
|
)
|
—
|
|
—
|
|
(1.1
|
)
|
||||||||||
|
Other comprehensive income (loss)
|
—
|
|
(0.9
|
)
|
(10.1
|
)
|
—
|
|
(11.0
|
)
|
||||||||||
|
Equity in other comprehensive income (loss) of
subsidiaries
|
(9.9
|
)
|
(10.1
|
)
|
—
|
|
20.0
|
|
—
|
|
||||||||||
|
Comprehensive loss
|
$
|
(44.0
|
)
|
$
|
35.0
|
|
$
|
(4.6
|
)
|
$
|
(31.5
|
)
|
$
|
(45.1
|
)
|
|||||
30
TREEHOUSE FOODS, INC.
NOTES TO CONDENSED CONSOLIDATED FINANCIAL STATEMENTS — (Continued)
Condensed Supplemental Consolidating Statement of Cash Flows
Three Months Ended March 31, 2019
(In millions)
|
Parent
Company
|
Guarantor
Subsidiaries
|
Non-Guarantor
Subsidiaries
|
Eliminations
|
Consolidated
|
||||||||||||||||
|
Cash flows from operating activities:
|
|
|
|
|
|
|
|
|
|
|
||||||||||
|
Net cash provided by (used in) operating
activities
|
$
|
(50.0
|
)
|
$
|
61.9
|
|
$
|
(5.3
|
)
|
$
|
(44.5
|
)
|
$
|
(37.9
|
)
|
|||||
|
Cash flows from investing activities:
|
||||||||||||||||||||
|
Additions to property, plant, and equipment
|
—
|
|
(27.7
|
)
|
(2.2
|
)
|
—
|
|
(29.9
|
)
|
||||||||||
|
Additions to intangible assets
|
(6.4
|
)
|
(0.1
|
)
|
—
|
|
—
|
|
(6.5
|
)
|
||||||||||
|
Intercompany transfer
|
(21.5
|
)
|
(11.8
|
)
|
—
|
|
33.3
|
|
—
|
|
||||||||||
|
Other
|
—
|
|
—
|
|
(0.1
|
)
|
—
|
|
(0.1
|
)
|
||||||||||
|
Net cash (used in) provided by investing
activities
|
(27.9
|
)
|
(39.6
|
)
|
(2.3
|
)
|
33.3
|
|
(36.5
|
)
|
||||||||||
|
Cash flows from financing activities:
|
||||||||||||||||||||
|
Net (repayment) borrowing of debt
|
(10.0
|
)
|
(0.4
|
)
|
—
|
|
—
|
|
(10.4
|
)
|
||||||||||
|
Intercompany transfer
|
55.2
|
|
(21.9
|
)
|
(44.5
|
)
|
11.2
|
|
—
|
|
||||||||||
|
Receipts related to stock-based award activities
|
0.2
|
|
—
|
|
—
|
|
—
|
|
0.2
|
|
||||||||||
|
Payments related to stock-based award activities
|
(4.6
|
)
|
—
|
|
—
|
|
—
|
|
(4.6
|
)
|
||||||||||
|
Net cash (used in) provided by financing
activities
|
40.8
|
|
(22.3
|
)
|
(44.5
|
)
|
11.2
|
|
(14.8
|
)
|
||||||||||
|
Effect of exchange rate changes on cash and
cash equivalents
|
—
|
|
—
|
|
3.9
|
|
—
|
|
3.9
|
|
||||||||||
|
Decrease (increase) in cash and cash equivalents
|
(37.1
|
)
|
—
|
|
(48.2
|
)
|
—
|
|
(85.3
|
)
|
||||||||||
|
Cash and cash equivalents, beginning of period
|
77.9
|
|
—
|
|
86.4
|
|
—
|
|
164.3
|
|
||||||||||
|
Cash and cash equivalents, end of period
|
$
|
40.8
|
|
$
|
—
|
|
$
|
38.2
|
|
$
|
—
|
|
$
|
79.0
|
|
|||||
31
TREEHOUSE FOODS, INC.
NOTES TO CONDENSED CONSOLIDATED FINANCIAL STATEMENTS — (Continued)
Condensed Supplemental Consolidating Statement of Cash Flows
Three Months Ended March 31, 2018
(In millions)
|
Parent
Company
|
Guarantor
Subsidiaries
|
Non-Guarantor
Subsidiaries
|
Eliminations
|
Consolidated
|
||||||||||||||||
|
Cash flows from operating activities:
|
|
|
|
|
|
|
|
|
|
|
||||||||||
|
Net cash provided by (used in) operating
activities
|
$
|
41.3
|
|
$
|
41.2
|
|
$
|
26.5
|
|
$
|
(51.2
|
)
|
$
|
57.8
|
|
|||||
|
Cash flows from investing activities:
|
||||||||||||||||||||
|
Additions to property, plant, and equipment
|
(0.9
|
)
|
(32.3
|
)
|
(5.3
|
)
|
—
|
|
(38.5
|
)
|
||||||||||
|
Additions to intangible assets
|
(2.5
|
)
|
(0.4
|
)
|
—
|
|
—
|
|
(2.9
|
)
|
||||||||||
|
Intercompany transfer
|
(42.8
|
)
|
(43.3
|
)
|
0.5
|
|
85.6
|
|
—
|
|
||||||||||
|
Other
|
—
|
|
—
|
|
(0.3
|
)
|
—
|
|
(0.3
|
)
|
||||||||||
|
Net cash (used in) provided by investing
activities
|
(46.2
|
)
|
(76.0
|
)
|
(5.1
|
)
|
85.6
|
|
(41.7
|
)
|
||||||||||
|
Cash flows from financing activities:
|
||||||||||||||||||||
|
Net borrowing (repayment) of debt
|
(2.4
|
)
|
(1.4
|
)
|
—
|
|
—
|
|
(3.8
|
)
|
||||||||||
|
Intercompany transfer
|
10.8
|
|
36.2
|
|
(12.6
|
)
|
(34.4
|
)
|
—
|
|
||||||||||
|
Repurchases of common stock
|
(17.1
|
)
|
—
|
|
—
|
|
—
|
|
(17.1
|
)
|
||||||||||
|
Receipts related to stock-based award activities
|
1.9
|
|
—
|
|
—
|
|
—
|
|
1.9
|
|
||||||||||
|
Payments related to stock-based award activities
|
(1.1
|
)
|
—
|
|
—
|
|
—
|
|
(1.1
|
)
|
||||||||||
|
Net cash (used in) provided by financing
activities
|
(7.9
|
)
|
34.8
|
|
(12.6
|
)
|
(34.4
|
)
|
(20.1
|
)
|
||||||||||
|
Effect of exchange rate changes on cash and
cash equivalents
|
—
|
|
—
|
|
(0.3
|
)
|
—
|
|
(0.3
|
)
|
||||||||||
|
Increase (decrease) in cash and cash equivalents
|
(12.8
|
)
|
—
|
|
8.5
|
|
—
|
|
(4.3
|
)
|
||||||||||
|
Cash and cash equivalents, beginning of period
|
83.2
|
|
0.2
|
|
49.4
|
|
—
|
|
132.8
|
|
||||||||||
|
Cash and cash equivalents, end of period
|
$
|
70.4
|
|
$
|
0.2
|
|
$
|
57.9
|
|
$
|
—
|
|
$
|
128.5
|
|
|||||
18. SUBSEQUENT EVENTS
Ready-to-eat Cereal Divestiture
On May 2, 2019, the Company announced that it had entered into a definitive agreement to sell its Ready-to-eat cereal business. The business produces private label ready-to-eat cereal at plants located in Battle Creek, Michigan; Lancaster, Ohio, and Sparks, Nevada for the Baked Goods segment. The transaction is subject to customary closing conditions and is expected to close in the third quarter of 2019.
Minneapolis Plant Closure
On May 2, 2019, the Company announced the closure of its Minneapolis, Minnesota Snack nuts and Trail mix plant by the end of the third quarter of 2019. Costs associated with the facility closure are expected to be approximately
$13 million
, of which approximately
$4 million
is expected to be in cash. Components of the charges include non-cash asset write-offs of approximately
$9 million
, employee-related costs of approximately
$1 million
, and other closure costs of approximately
$3 million
.
32
Item 2. Management’s Discussion and Analysis of Financial Condition and Results of Operations
Business Overview
TreeHouse Foods, Inc. is a manufacturer of packaged foods and beverages with manufacturing facilities across the United States, Canada, and Italy that focuses primarily on private label products for both retail grocery and food away from home customers. We manufacture shelf stable, refrigerated, frozen, and fresh products within our four segments (Baked Goods, Beverages, Meal Solutions, and Snacks). We have a comprehensive offering of packaging formats and flavor profiles, and we also offer natural, organic, and preservative free ingredients in many categories.
Our reportable segments, and the principal products that comprise each segment, are as follows:
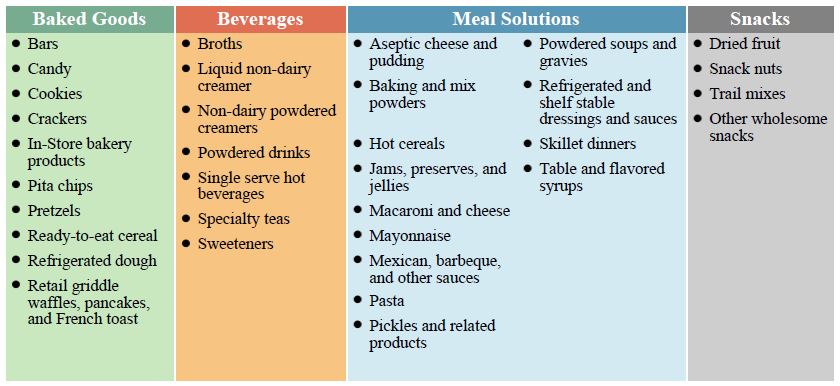
33
Net sales are distributed across segments in the following manner:

We believe we are the largest manufacturer of private label snack nuts, trail mixes, refrigerated dough, crackers, pickles, salsa, non-dairy powdered creamer, ready-to-eat cereals, bouillon, and dry pasta in the United States, the largest manufacturer of private label pretzels, retail griddle items, powdered drink mixes, retail salad dressings, macaroni and cheese dinners, and instant hot cereals in both the United States and Canada, and the largest manufacturer of private label jams and pasta sauces in Canada, based on volume. We also believe we are one of the largest manufacturers of private label in-store bakery products, cookies, pitas, snack bars, table syrup, flavored syrup, barbeque sauce, preserves, and jellies in the United States, based on volume.
The following discussion and analysis presents the factors that had a material effect on our results of operations for the
three
month periods ended
March 31, 2019
and
2018
. Also discussed is our financial position as of the end of the current period. This discussion should be read in conjunction with the Condensed Consolidated Financial Statements and the Notes to those Condensed Consolidated Financial Statements included elsewhere in this report. This Management’s Discussion and Analysis of Financial Condition and Results of Operations contains forward-looking statements. See
Cautionary Statement Regarding Forward-Looking Statements
on page 44 for a discussion of the uncertainties, risks, and assumptions associated with these statements.
Current Market Environment
Retail food sales and volumes have been under pressure in recent years. However, trends might be starting to shift as positive sales growth has returned across most measured channels during the past year. Based on the Citi
DD’s Nielsen AOC+C Data Analysis – 3/23/19
report, total retail food sales increased 0.6% in the first quarter of 2019, with volume decreases of 1.3% more than offset by price increases of 1.9%. Private label sales and volume growth continues to outpace branded products as total private label sales in measured channels in the first quarter of 2019 increased 2.5% compared to an increase of 0.2% for branded products. These increases were led by private label price increases of 2.7%, partially offset by a volume decrease of 0.2% compared to branded price increases of 2.0%, mostly offset by volume decreases of 1.8%. As such, on an industry basis, strong private label sales and volumes continue to be attractive compared to branded counterparts.
34
Retail sectors are continuing to experience growth in premium, better for you, natural, and organic foods (collectively referred to as “PBFY”) as consumers shift their consumptions trends towards a focus on healthier eating with cleaner labels. PBFY foods include items such as fresh or freshly prepared foods, foods with premium ingredients, natural, organic, clean label, or specialty foods, most of which are located in the perimeter of the store. Recent data shows that these product offerings are expected to be the primary growth area for both branded and private label products, and that growth in private label is expected to drive the overall growth in these product categories. These trends are prompting companies, TreeHouse included, to increase or adjust their offerings, while retaining their commitment to provide products at reasonable prices. The margin on these PBFY products tend to be higher and more stable than other labels. In an effort to respond to shifting consumer demand, the Company offers an increasing variety of PBFY products, currently offering PBFY products in 28 of our categories.
Recent Developments
Change in Segments
On January 1, 2019, the Company changed how it manages its business, allocates resources, and goes to market, which resulted in modifications to its organizational and segment structure. As a result, the Company consolidated its Condiments and Meals segments into one segment called Meal Solutions. Additionally, the Bars and Ready-to-eat cereal categories moved from the Company's Snacks and Meals segments, respectively, into the Baked Goods segment. All prior period information has been recast to reflect this change in reportable segments.
Minneapolis Plant Closure
On May 2, 2019, the Company announced the closure of its Minneapolis, Minnesota Snack nuts and Trail mix plant. The Company believes the plant closure is necessary to position the Snacks business for success at lower volume levels. The strategic review related to the Snacks business is on-going and may result in a restructuring, disposition or similar action. Consequently, the Company may incur restructuring, impairment, disposal or other related charges in future periods.
35
Results of Operations
The following table presents certain information concerning our financial results, including information presented as a percentage of consolidated net sales:
|
|
Three Months Ended March 31,
|
|||||||||||||
|
|
2019
|
2018
|
||||||||||||
|
|
Dollars
|
Percent
|
Dollars
|
Percent
|
||||||||||
|
|
(Dollars in millions)
|
|||||||||||||
|
Net sales
|
$
|
1,301.1
|
|
100.0
|
%
|
$
|
1,481.2
|
|
100.0
|
%
|
||||
|
Cost of sales
|
1,106.5
|
|
85.0
|
|
1,249.3
|
|
84.3
|
|
||||||
|
Gross profit
|
194.6
|
|
15.0
|
|
231.9
|
|
15.7
|
|
||||||
|
Operating expenses:
|
|
|
|
|
||||||||||
|
Selling and distribution
|
79.2
|
|
6.1
|
|
108.4
|
|
7.3
|
|
||||||
|
General and administrative
|
65.9
|
|
5.1
|
|
81.1
|
|
5.5
|
|
||||||
|
Amortization expense
|
21.6
|
|
1.7
|
|
22.2
|
|
1.5
|
|
||||||
|
Other operating expense, net
|
28.8
|
|
2.2
|
|
28.9
|
|
2.0
|
|
||||||
|
Total operating expenses
|
195.5
|
|
15.1
|
|
240.6
|
|
16.3
|
|
||||||
|
Operating loss
|
(0.9
|
)
|
(0.1
|
)
|
(8.7
|
)
|
(0.6
|
)
|
||||||
|
Other expense:
|
|
|
|
|
||||||||||
|
Interest expense
|
26.9
|
|
2.1
|
|
28.5
|
|
1.9
|
|
||||||
|
(Gain) loss on foreign currency exchange
|
(0.4
|
)
|
—
|
|
2.5
|
|
0.2
|
|
||||||
|
Other expense, net
|
12.2
|
|
0.9
|
|
4.2
|
|
0.3
|
|
||||||
|
Total other expense
|
38.7
|
|
3.0
|
|
35.2
|
|
2.4
|
|
||||||
|
Loss before income taxes
|
(39.6
|
)
|
(3.0
|
)
|
(43.9
|
)
|
(3.0
|
)
|
||||||
|
Income tax benefit
|
(12.3
|
)
|
(0.9
|
)
|
(9.8
|
)
|
(0.7
|
)
|
||||||
|
Net loss
|
$
|
(27.3
|
)
|
(2.1
|
)%
|
$
|
(34.1
|
)
|
(2.3
|
)%
|
||||
Three Months Ended March 31, 2019
Compared to
Three Months Ended March 31, 2018
Net Sales
— Net sales
decreased
by
$180.1 million
, or
12.2%
, in the first
three
months of
2019
compared to the first
three
months of
2018
. The change in net sales from
2018
to
2019
was due to the following:
|
|
Dollars
|
Percent
|
|||||
|
|
(In millions)
|
||||||
|
2018 Net Sales
|
$
|
1,481.2
|
|
|
|
||
|
SKU rationalization
|
(25.3
|
)
|
(1.7
|
)%
|
|||
|
Volume/mix excluding SKU rationalization
|
(151.3
|
)
|
(10.2
|
)
|
|||
|
Pricing
|
2.3
|
|
0.2
|
|
|||
|
Divestiture
|
(3.3
|
)
|
(0.3
|
)
|
|||
|
Foreign currency
|
(2.5
|
)
|
(0.2
|
)
|
|||
|
2019 Net Sales
|
$
|
1,301.1
|
|
(12.2
|
)%
|
||
The change in net sales includes the efforts to simplify and rationalize low margin SKUs, which contributed
1.7%
to the year-over-year decline, and the divestiture of the McCann's business in July 2018 which contributed
0.3%
to the year-over-year decline. Excluding the impact of SKU rationalization and divestiture, net sales decreased 10.2% in the first
three
months of
2019
compared to
2018
, driven by the following:
|
•
|
Volume/mix was unfavorable year-over-year across all segments with the largest decreases in the Snacks and Meal Solutions segments.
|
|
•
|
Foreign currency exchange was unfavorable
0.2%
in the first
three
months of
2019
compared to
2018
.
|
36
|
•
|
Pricing was favorable
0.2%
in the first
three
months of
2019
compared to
2018
reflecting pricing actions to cover commodity inflation offset by lower pricing in the Single serve beverage category due to competitive pressure and commodity-based pass-through pricing declines in the Snacks segment.
|
Gross Profit
— Gross profit as a percentage of net sales was
15.0%
in the first
three
months of
2019
, compared to
15.7%
in the first
three
months of
2018
, a
decrease
of
0.7
percentage points. The decrease is primarily due to the fixed cost impact of declining volumes and unfavorable mix driven by the Snacks and Meal Solutions segments, partially offset by lower expenses associated with our restructuring programs.
Total Operating Expenses
— Total operating expenses as a percentage of net sales were
15.1%
in the first
three
months of
2019
compared to
16.3%
in the first
three
months of
2018
. The
decrease
in
2019
is primarily a result of lower freight costs due to lower spot market usage and lower spot market premiums, and cost savings from the TreeHouse 2020 and Structure to Win initiatives.
Total Other Expense
—
Total other expense
increased
by
$3.5 million
to
$38.7 million
in
2019
compared to
$35.2 million
in
2018
. The change was primarily related to an increase in non-cash mark-to-market expenses from hedging activities, driven by interest rate swaps, partially offset by favorable fluctuations in currency exchange rates between the U.S. and Canadian dollar during the respective periods, gains on investments held by our Canadian subsidiaries, and lower interest expense. The decrease in interest expense reflects a lower debt level, partially offset by a higher interest rate reflecting the year-over-year increase in LIBOR.
Income Taxes
—
Income tax benefit was recorded at an effective rate of
31.1%
in the first quarter of 2019 compared to
22.3%
in the first quarter of 2018. The change in the Company’s effective tax rate for the three months ended March 31, 2019 compared to 2018 is primarily the result of an adjustment to the one-time transition tax liability due to the January 15, 2019 release of final regulations, the impact of a decrease in executive compensation that is non-deductible for tax purposes, a change in the valuation allowance, and the tax impact of vesting and exercise of share-based awards.
Our effective tax rate may change from period to period based on recurring and non-recurring factors including the jurisdictional mix of earnings, enacted tax legislation, state income taxes, settlement of tax audits, and the expiration of the statute of limitations in relation to unrecognized tax benefits.
Three Months Ended March 31, 2019
Compared to
Three Months Ended March 31, 2018
— Results by Segment
|
Three Months Ended March 31, 2019
|
|||||||||||||||||||||||||||
|
Baked Goods
|
Beverages
|
Meal Solutions
|
Snacks
|
||||||||||||||||||||||||
|
|
Dollars
|
Percent
|
Dollars
|
Percent
|
Dollars
|
Percent
|
Dollars
|
Percent
|
|||||||||||||||||||
|
|
(unaudited, dollars in millions)
|
||||||||||||||||||||||||||
|
Net sales
|
$
|
422.7
|
|
100.0
|
%
|
$
|
237.2
|
|
100.0
|
%
|
$
|
464.9
|
|
100.0
|
%
|
$
|
176.3
|
|
100.0
|
%
|
|||||||
|
Cost of sales
|
344.6
|
|
81.5
|
|
180.5
|
|
76.1
|
|
389.9
|
|
83.9
|
|
183.4
|
|
104.0
|
|
|||||||||||
|
Gross profit
|
78.1
|
|
18.5
|
|
56.7
|
|
23.9
|
|
75.0
|
|
16.1
|
|
(7.1
|
)
|
(4.0
|
)
|
|||||||||||
|
Freight out and commissions
|
25.7
|
|
6.1
|
|
8.3
|
|
3.5
|
|
18.6
|
|
4.0
|
|
4.0
|
|
2.3
|
|
|||||||||||
|
Direct selling, general, and administrative
|
7.7
|
|
1.8
|
|
4.5
|
|
1.9
|
|
9.5
|
|
2.0
|
|
2.7
|
|
1.5
|
|
|||||||||||
|
Direct operating income
|
$
|
44.7
|
|
10.6
|
%
|
$
|
43.9
|
|
18.5
|
%
|
$
|
46.9
|
|
10.1
|
%
|
$
|
(13.8
|
)
|
(7.8
|
)%
|
|||||||
37
|
Three Months Ended March 31, 2018
|
|||||||||||||||||||||||||||
|
Baked Goods
|
Beverages
|
Meal Solutions
|
Snacks
|
||||||||||||||||||||||||
|
|
Dollars
|
Percent
|
Dollars
|
Percent
|
Dollars
|
Percent
|
Dollars
|
Percent
|
|||||||||||||||||||
|
|
(unaudited, dollars in millions)
|
||||||||||||||||||||||||||
|
Net sales
|
$
|
455.4
|
|
100.0
|
%
|
$
|
249.1
|
|
100.0
|
%
|
$
|
523.3
|
|
100.0
|
%
|
$
|
253.4
|
|
100.0
|
%
|
|||||||
|
Cost of sales
|
381.8
|
|
83.8
|
|
194.3
|
|
78.0
|
|
430.1
|
|
82.2
|
|
235.6
|
|
93.0
|
|
|||||||||||
|
Gross profit
|
73.6
|
|
16.2
|
|
54.8
|
|
22.0
|
|
93.2
|
|
17.8
|
|
17.8
|
|
7.0
|
|
|||||||||||
|
Freight out and commissions
|
36.6
|
|
8.0
|
|
10.6
|
|
4.3
|
|
25.8
|
|
4.9
|
|
6.7
|
|
2.6
|
|
|||||||||||
|
Direct selling, general, and administrative
|
9.0
|
|
2.0
|
|
4.8
|
|
1.9
|
|
11.2
|
|
2.2
|
|
3.5
|
|
1.4
|
|
|||||||||||
|
Direct operating income
|
$
|
28.0
|
|
6.2
|
%
|
$
|
39.4
|
|
15.8
|
%
|
$
|
56.2
|
|
10.7
|
%
|
$
|
7.6
|
|
3.0
|
%
|
|||||||
Baked Goods
Net sales in the Baked Goods segment
decreased
$32.7 million
, or
7.2%
, in the first
three
months of
2019
compared to the first
three
months of
2018
. The change in net sales from
2018
to
2019
was due to the following:
|
|
Dollars
|
Percent
|
|||||
|
|
(In millions)
|
||||||
|
2018 Net Sales
|
$
|
455.4
|
|
|
|
||
|
SKU rationalization
|
(11.5
|
)
|
(2.5
|
)%
|
|||
|
Volume/mix excluding SKU rationalization
|
(32.0
|
)
|
(7.0
|
)
|
|||
|
Pricing
|
11.5
|
|
2.5
|
|
|||
|
Foreign currency
|
(0.7
|
)
|
(0.2
|
)
|
|||
|
2019 Net Sales
|
$
|
422.7
|
|
(7.2
|
)%
|
||
The change in net sales from
2018
to
2019
was due to unfavorable volume/mix predominately in the Ready-to-eat cereal, In-store bakery, and Refrigerated dough categories, the efforts to simplify and rationalize low margin SKUs, and unfavorable foreign currency, partially offset by favorable pricing actions taken in response to commodity based inflation and a reduction in trade spending primarily in the In-store bakery and Refrigerated dough categories.
Direct operating income as a percentage of net sales
increased
4.4
percentage points in the first
three
months of
2019
compared to the first
three
months of
2018
. The
increase
was primarily due to favorable pricing, lower production costs, lower freight due to reduced spot market usage, particularly in the temperature controlled freight market, favorable mix due to the rationalization of low margin business, and lower direct selling, general and administrative expenses driven by the TreeHouse 2020 and Structure to Win initiatives. These improvements were partially offset by higher commodity costs (flour and packaging).
Beverages
Net sales in the Beverages segment
decreased
$11.9 million
, or
4.8%
, in the first
three
months of
2019
compared to the first
three
months of
2018
. The change in net sales from
2018
to
2019
was due to the following:
|
|
Dollars
|
Percent
|
|||||
|
|
(In millions)
|
||||||
|
2018 Net Sales
|
$
|
249.1
|
|
|
|
||
|
SKU rationalization
|
(3.5
|
)
|
(1.4
|
)%
|
|||
|
Volume/mix excluding SKU rationalization
|
(6.0
|
)
|
(2.4
|
)
|
|||
|
Pricing
|
(2.4
|
)
|
(1.0
|
)
|
|||
|
2019 Net Sales
|
$
|
237.2
|
|
(4.8
|
)%
|
||
38
Net sales
decreased
from
2018
to
2019
primarily due to unfavorable volume/mix mostly in the Broth and Powdered creamers categories, partially offset by distribution gains in the Single serve beverage category, the efforts to simplify and rationalize low margin SKUs, and unfavorable pricing primarily due to competitive pressure in the Single serve beverage category.
Direct operating income as a percentage of net sales
increased
2.7
percentage points in the first
three
months of
2019
compared to the first
three
months of
2018
. The
increase
was primarily due to lower commodity costs (coffee, casein, oils), lower production costs, lower freight due to geographic sales mix, particularly in the Broth category, and freight rate favorability, and favorable mix driven by the Tea category. These improvements were partially offset by unfavorable pricing driven by the Single serve beverage category.
Meal Solutions
Net sales in the Meal Solutions segment
decreased
$58.4 million
, or
11.2%
, in the first
three
months of
2019
compared to the first
three
months of
2018
. The change in net sales from
2018
to
2019
was due to the following:
|
|
Dollars
|
Percent
|
|||||
|
|
(In millions)
|
||||||
|
2018 Net Sales
|
$
|
523.3
|
|
|
|
||
|
SKU rationalization
|
(10.3
|
)
|
(2.0
|
)%
|
|||
|
Volume/mix excluding SKU rationalization
|
(48.5
|
)
|
(9.3
|
)
|
|||
|
Pricing
|
5.5
|
|
1.0
|
|
|||
|
Divestiture
|
(3.3
|
)
|
(0.6
|
)
|
|||
|
Foreign currency
|
(1.8
|
)
|
(0.3
|
)
|
|||
|
2019 Net Sales
|
$
|
464.9
|
|
(11.2
|
)%
|
||
Net sales
decreased
from
2018
to
2019
due to unfavorable volume/mix primarily in the Pasta, Jams, preserves and jellies, and Pickles categories, the efforts to simplify and rationalize low margin SKUs, the divestiture of the McCann's business in July 2018, and foreign currency. Pricing was favorable reflecting certain pricing actions taken in response to commodity inflation that was only partially offset by durum pass-through pricing reductions.
Direct operating income as a percentage of net sales
decreased
0.6
percentage points in the first
three
months of
2019
compared to the first
three
months of
2018
. The
decrease
was primarily due to lower volumes and the related fixed cost impact, unfavorable mix within the Pasta category, and higher commodity costs partially offset by favorable pricing and lower direct selling, general and administrative expenses driven by the TreeHouse 2020 and Structure to Win initiatives.
Snacks
Net sales in the Snacks segment
decreased
$77.1 million
, or
30.4%
, in the first
three
months of
2019
compared to the first
three
months of
2018
. The change in net sales from
2018
to
2019
was due to the following:
|
|
Dollars
|
Percent
|
|||||
|
|
(In millions)
|
||||||
|
2018 Net Sales
|
$
|
253.4
|
|
|
|
||
|
Volume/mix
|
(64.8
|
)
|
(25.6
|
)%
|
|||
|
Pricing
|
(12.3
|
)
|
(4.8
|
)
|
|||
|
2019 Net Sales
|
$
|
176.3
|
|
(30.4
|
)%
|
||
Net sales
decreased
from
2018
to
2019
primarily due to lost distribution and competitive pressure in the Snack nuts and Trail mix categories and unfavorable pricing as a result of commodity-based pass-through pricing declines.
Direct operating income as a percentage of net sales
decreased
10.8
percentage points in the first
three
months of
2019
compared to the first
three
months of
2018
. The
decrease
was primarily due to lower volume and the related fixed cost impact, and higher input costs associated with certain commodities.
39
Liquidity and Capital Resources
Cash Flow
Management assesses the Company’s liquidity in terms of its ability to generate cash to fund its operating, investing, and financing activities. The Company remains in a strong financial position, with resources available for reinvesting in existing businesses, conducting acquisitions, and managing its capital structure on a short and long-term basis. If additional borrowings are needed, approximately
$719.6 million
was available under the Revolving Credit Facility as of
March 31, 2019
. See
Note 9
to our Condensed Consolidated Financial Statements for additional information regarding our Revolving Credit Facility. We are in compliance with the current terms of the Revolving Credit Facility and can meet foreseeable financial requirements.
The following table is derived from our Condensed Consolidated Statement of Cash Flows:
|
|
Three Months Ended
March 31, |
|||||||
|
|
2019
|
2018
|
||||||
|
|
(In millions)
|
|||||||
|
Net Cash Flows (Used In) Provided By:
|
|
|
|
|
||||
|
Operating activities
|
$
|
(37.9
|
)
|
$
|
57.8
|
|
||
|
Investing activities
|
(36.5
|
)
|
(41.7
|
)
|
||||
|
Financing activities
|
(14.8
|
)
|
(20.1
|
)
|
||||
Operating Activities
Our cash used in operations was
$37.9 million
in the first
three
months of
2019
compared to cash provided of
$57.8 million
in the first
three
months of
2018
, a
decrease
of
$95.7 million
. The
decrease
is mostly attributable to a decline in cash provided by the Receivables Sales Agreement during the first three months of 2019 compared to the first three months of 2018 and higher incentive compensation payouts during the first three months of 2019. The Company's working capital management emphasis continues to be focused on driving faster collection of receivables, managing inventory, and extending vendor payment terms.
Investing Activities
Cash used in investing activities was
$36.5 million
in the first
three
months of
2019
compared to
$41.7 million
in the first
three
months of
2018
, a
decrease
in cash used of
$5.2 million
. During the first
three
months of
2019
, capital expenditures were lower compared to the first three months of 2018.
We expect capital spending programs to be approximately $190 million in
2019
. Capital spending in
2019
is focused on TreeHouse 2020 initiatives, the continued implementation of an Enterprise Resource Planning system, food safety, quality, productivity improvements, and routine equipment upgrades or replacements at our plants.
Financing Activities
Net cash used in financing activities was
$14.8 million
in the first
three
months of
2019
compared to
$20.1 million
in the first
three
months of
2018
, a
decrease
in cash used of
$5.3 million
. The
decrease
is primarily attributable to share repurchase activity during the first three months of 2018, which did not recur in the first three months of 2019, partially offset by an early payment of $10.0 million on the Company's term loan during the first three months of 2019.
Free Cash Flow
In addition to measuring our cash flow generation and usage based upon the operating, investing, and financing classifications included in the Condensed Consolidated Statements of Cash Flows, we also measure free cash flow (a Non-GAAP measure) which represents net cash provided by operating activities less capital expenditures. We believe free cash flow is an important measure of operating performance because it provides management and investors a measure of cash generated from operations that is available for mandatory payment obligations and investment opportunities such as funding acquisitions, repaying debt, repurchasing public debt, and repurchasing our common stock.
40
The following table reconciles cash flow (used in) provided by operating activities (a GAAP measure) to our free cash flow (a Non-GAAP measure).
|
|
Three Months Ended
March 31, |
|||||||
|
|
2019
|
2018
|
||||||
|
|
(In millions)
|
|||||||
|
Cash flow (used in) provided by operating activities
|
$
|
(37.9
|
)
|
$
|
57.8
|
|
||
|
Less: Capital expenditures
|
(36.4
|
)
|
(41.4
|
)
|
||||
|
Free cash flow
|
$
|
(74.3
|
)
|
$
|
16.4
|
|
||
For the
three months ended March 31, 2019
, we generated negative free cash flow of
$74.3 million
. Free cash flow in
2019
decreased
$90.7 million
over the prior year primarily due to lower cash flow provided by operating activities during the first three months of 2019.
Debt Obligations
At
March 31, 2019
, we had
$488.8 million
outstanding under Term Loan A,
$841.3 million
outstanding under Term Loan A-1,
$375.9 million
of the 2022 Notes outstanding,
$602.9 million
of the 2024 Notes outstanding, and
$2.4 million
of other obligations. In addition, at
March 31, 2019
, there were
$30.4 million
in letters of credit under the Revolving Credit Facility that were issued but undrawn.
Also, at
March 31, 2019
, our Revolving Credit Facility provided for an aggregate commitment of
$750 million
, of which
$719.6 million
was available. Interest rates on debt outstanding under the Revolving Credit Facility, Term Loan A, and Term Loan A-1 (collectively known as the “Amended and Restated Credit Agreement”) for the
three months ended March 31, 2019
averaged
4.34%
. Including the interest rate swap agreements in effect as of
March 31, 2019
, the average rate decreases to
3.62%
.
We are in compliance with all applicable financial debt covenants as of
March 31, 2019
. See
Note 9
to our Condensed Consolidated Financial Statements for additional information regarding our indebtedness and related agreements.
Non-GAAP Measures
We have included in this report measures of financial performance that are not defined by GAAP (“Non-GAAP”). A Non-GAAP financial measure is a numerical measure of financial performance that excludes or includes amounts so as to be different than the most directly comparable measure calculated and presented in accordance with GAAP in the Company’s Condensed Consolidated Financial Statements. We believe these measures provide useful information to the users of the financial statements as we also have included these measures in other communications and publications.
For each of these Non-GAAP financial measures, we provide a reconciliation between the Non-GAAP measure and the most directly comparable GAAP measure, an explanation of why management believes the Non-GAAP measure provides useful information to financial statement users, and any additional purposes for which management uses the Non-GAAP measure. This Non-GAAP financial information is provided as additional information for the financial statement users and is not in accordance with, or an alternative to, GAAP. These Non-GAAP measures may be different from similar measures used by other companies.
Adjusted Earnings Per Fully Diluted Share, Adjusting for Certain Items Affecting Comparability
Adjusted earnings per fully diluted share (“Adjusted Diluted EPS”) reflects adjustments to GAAP loss per fully diluted share to identify items that, in management’s judgment, significantly affect the assessment of earnings results between periods. This information is provided in order to allow investors to make meaningful comparisons of the Company’s earnings performance between periods and to view the Company’s business from the same perspective as Company management. As the Company cannot predict the timing and amount of charges that include, but are not limited to, items such as acquisition, integration, divestiture, and related costs, mark-to-market adjustments on derivative contracts, foreign currency exchange impact on the re-measurement of intercompany notes, restructuring programs, and other items that may arise from time to time that would
41
impact comparability, management does not consider these costs when evaluating the Company’s performance, when making decisions regarding the allocation of resources, in determining incentive compensation, or in determining earnings estimates.
The reconciliation of Adjusted Diluted EPS, excluding certain items affecting comparability, to the relevant GAAP measure of diluted EPS as presented in the Condensed Consolidated Statements of Operations, is as follows:
|
|
Three Months Ended
March 31, |
|||||||||
|
|
2019
|
2018
|
||||||||
|
|
(unaudited)
|
|||||||||
|
Diluted loss per share (GAAP)
|
$
|
(0.49
|
)
|
$
|
(0.60
|
)
|
||||
|
Restructuring programs
|
(1)
|
0.60
|
|
0.68
|
|
|||||
|
Mark-to-market adjustments
|
(2)
|
0.28
|
|
0.10
|
|
|||||
|
Acquisition, integration, divestiture, and related costs
|
(3)
|
0.02
|
|
—
|
|
|||||
|
Product recall
|
(4)
|
0.01
|
|
—
|
|
|||||
|
Tax indemnification
|
(5)
|
(0.01
|
)
|
—
|
|
|||||
|
Foreign currency (gain) loss on re-measurement of intercompany notes
|
(6)
|
(0.03
|
)
|
0.03
|
|
|||||
|
CEO transition costs
|
(7)
|
—
|
|
0.23
|
|
|||||
|
Taxes on adjusting items
|
(0.25
|
)
|
(0.26
|
)
|
||||||
|
Adjusted diluted EPS (Non-GAAP)
|
$
|
0.13
|
|
$
|
0.18
|
|
||||
During the
three
months ended
March 31,
2019
and
2018
, the Company entered into transactions that affected the year-over-year comparison of its financial results that included restructuring programs, mark-to-market adjustments, acquisition, integration, divestiture, and related costs, product recall, tax indemnification, foreign currency (gain) loss on re-measurement of intercompany notes, CEO transition costs, and the related tax impact of these items.
|
(1)
|
The Company's restructuring and margin improvement activities are part of an enterprise-wide transformation to improve the long-term profitability of the Company. For the
three months ended March 31, 2019
and
2018
, the Company incurred restructuring program costs of approximately
$33.7 million
and
$38.6 million
, respectively. Refer to
Note 3
to our Condensed Consolidated Financial Statements for additional details.
|
|
(2)
|
The Company’s derivative contracts are marked-to-market each period with the unrealized changes in fair value being recorded in the Condensed Consolidated Statements of Operations. These are non-cash charges. As the contracts are settled, realized gains and losses are recognized and included in earnings. The mark-to-market impacts only are treated as Non-GAAP adjustments. Refer to
Note 15
to our Condensed Consolidated Financial Statements for additional details.
|
|
(3)
|
The acquisition, integration, divestiture, and related costs line represents costs associated with completed and potential divestitures, completed and potential acquisitions and the related integration of the acquisitions. Costs incurred in the first
three
months of
2019
primarily related to divestiture activity partially offset by transition services agreement (“TSA”) revenue related to the 2017 SIF divestiture, while gains incurred in the first
three
months of
2018
primarily related to the divestiture of the SIF business and the related transition services agreement (“TSA”) revenue.
|
|
(4)
|
The product recall line primarily represents legal fees associated with ongoing efforts to recover additional insurance proceeds related to an announced voluntary recall of products in 2016 that may have been impacted by sunflower seeds contaminated with Listeria monocytogenes (L.mono) that were provided by a supplier.
|
|
(5)
|
The tax indemnification line represents the non-cash write off of indemnification assets that were recorded in connection with acquisitions from prior years. These write-offs arose as a result of the related uncertain tax position being released due to the statute of limitation lapse or settlement with taxing authorities.
|
|
(6)
|
The Company has Canadian dollar denominated intercompany loans and incurred foreign currency gains of
$1.6 million
in the
first
quarter of
2019
versus foreign currency losses of
$1.9 million
in the prior year to re-measure the loans at quarter end. These charges are non-cash and the loans are eliminated in consolidation.
|
42
|
(7)
|
The CEO transition cost line primarily relates to accelerated stock-based compensation and modification accounting related to the transition of Chief Executive Officers in 2018. Refer to
Note 11
to our Condensed Consolidated Financial Statements for additional details.
|
The tax impact on adjusting items is calculated based upon the tax laws and statutory tax rates applicable in the tax jurisdiction of the underlying Non-GAAP adjustments.
Adjusted Net Income, Adjusted EBIT, and Adjusted EBITDAS, Adjusting for Certain Items Affecting Comparability
Adjusted net income represents GAAP
net loss
as reported in the Condensed Consolidated Statements of Operations adjusted for items that, in management’s judgment, significantly affect the assessment of earnings results between periods as outlined in the adjusted diluted EPS section above. This information is provided in order to allow investors to make meaningful comparisons of the Company’s earnings performance between periods and to view the Company’s business from the same perspective as Company management. This measure is also used as a component of the Board of Directors' measurement of the Company’s performance for incentive compensation purposes and is the basis of calculating the adjusted diluted EPS metric outlined above.
Adjusted EBIT represents adjusted net income before interest expense, interest income, and income tax expense. Adjusted EBITDAS represents adjusted net income before interest expense, interest income, income tax expense, depreciation and amortization expense, and non-cash stock-based compensation expense. Adjusted EBITDAS is a performance measure commonly used by management to assess operating performance, and the Company believes it is commonly reported and widely used by investors and other interested parties as a measure of a company’s operating performance between periods and as a component of our debt covenant calculations.
The following table reconciles the Company’s
net loss
as presented in the Condensed Consolidated Statements of Operations, the relevant GAAP measure, to Adjusted net income, Adjusted EBIT, and Adjusted EBITDAS for the
three
months ended
March 31, 2019
and
2018
:
|
|
|
Three Months Ended
March 31, |
||||||||
|
|
|
2019
|
2018
|
|||||||
|
|
|
(unaudited in millions)
|
||||||||
|
Net loss per GAAP
|
|
$
|
(27.3
|
)
|
$
|
(34.1
|
)
|
|||
|
Restructuring programs
|
(1)
|
33.7
|
|
38.6
|
|
|||||
|
Mark-to-market adjustments
|
(2)
|
15.9
|
|
5.6
|
|
|||||
|
Acquisition, integration, divestiture, and related costs
|
(3)
|
1.0
|
|
(0.1
|
)
|
|||||
|
Product recall
|
(4)
|
0.4
|
|
—
|
|
|||||
|
Tax indemnification
|
(5)
|
(0.3
|
)
|
—
|
|
|||||
|
Foreign currency (gain) loss on re-measurement of intercompany notes
|
(6)
|
(1.6
|
)
|
1.9
|
|
|||||
|
CEO transition costs
|
(7)
|
—
|
|
13.0
|
|
|||||
|
Less: Taxes on adjusting items
|
|
(14.3
|
)
|
(14.8
|
)
|
|||||
|
Adjusted net income
|
|
7.5
|
|
10.1
|
|
|||||
|
Interest expense
|
|
26.9
|
|
28.5
|
|
|||||
|
Interest income
|
|
(2.6
|
)
|
(2.0
|
)
|
|||||
|
Income tax benefit
|
|
(12.3
|
)
|
(9.8
|
)
|
|||||
|
Add: Taxes on adjusting items
|
|
14.3
|
|
14.8
|
|
|||||
|
Adjusted EBIT
|
|
33.8
|
|
41.6
|
|
|||||
|
Depreciation and amortization
|
(8)
|
59.2
|
|
58.8
|
|
|||||
|
Stock-based compensation expense
|
(9)
|
5.9
|
|
6.4
|
|
|||||
|
Adjusted EBITDAS
|
|
$
|
98.9
|
|
$
|
106.8
|
|
|||
43
|
Location in Condensed
|
Three Months Ended
March 31, |
||||||||||||
|
|
|
Consolidated Statements of Operations
|
2019
|
2018
|
|||||||||
|
|
|
|
(unaudited in millions)
|
||||||||||
|
(1
|
)
|
Restructuring programs
|
Other operating expense, net
|
$
|
28.8
|
|
$
|
28.9
|
|
||||
|
Cost of sales
|
4.1
|
|
9.7
|
|
|||||||||
|
General and administrative
|
0.8
|
|
—
|
|
|||||||||
|
(2
|
)
|
Mark-to-market adjustments
|
Other expense, net
|
15.9
|
|
5.6
|
|
||||||
|
(3
|
)
|
Acquisition, integration, divestiture, and related costs
|
General and administrative
|
1.0
|
|
(0.1
|
)
|
||||||
|
(4
|
)
|
Product recall
|
General and administrative
|
0.4
|
|
—
|
|
||||||
|
(5
|
)
|
Tax indemnification
|
Other expense, net
|
(0.3
|
)
|
—
|
|
||||||
|
(6
|
)
|
Foreign currency (gain) loss on re-measurement of intercompany notes
|
(Gain) loss on foreign currency exchange
|
(1.6
|
)
|
1.9
|
|
||||||
|
(7
|
)
|
CEO transition costs
|
General and administrative
|
—
|
|
13.0
|
|
||||||
|
(8
|
)
|
Depreciation included as an adjusting item
|
Cost of sales
|
2.7
|
|
8.2
|
|
||||||
|
(9
|
)
|
Stock-based compensation expense included as an adjusting item
|
General and administrative
|
0.2
|
|
9.9
|
|
||||||
Other Commitments and Contingencies
We also have the following commitments and contingent liabilities, in addition to contingent liabilities related to the ordinary course of litigation, investigations, and tax audits:
|
•
|
certain lease obligations, and
|
|
•
|
selected levels of property and casualty risks, primarily related to employee health care, workers’ compensation claims, and other casualty losses.
|
See
Note 14
to our Condensed Consolidated Financial Statements included herein and Note 19 to our Consolidated Financial Statements in our Annual Report on Form 10-K for the fiscal year ended
December 31, 2018
for more information about our commitments and contingent obligations.
Recent Accounting Pronouncements
Information regarding recent accounting pronouncements is provided in
Note 2
to the Company’s Condensed Consolidated Financial Statements.
Critical Accounting Policies
A description of the Company’s critical accounting policies is contained in our Annual Report on Form 10-K for the year ended
December 31, 2018
. We adopted ASC 842,
Leases
, effective January 1, 2019 and have updated our accounting policy specific to leases accordingly. See
Note 4
to our Condensed Consolidated Financial Statements for additional information regarding these updates.
Off-Balance Sheet Arrangements
We do not have any obligations that meet the definition of an off-balance sheet arrangement, other than letters of credit, which have or are reasonably likely to have a material effect on our Condensed Consolidated Financial Statements.
Cautionary Statement Regarding Forward Looking Statements
From time to time, we and our representatives may provide information, whether orally or in writing, including certain statements in this Quarterly Report on Form 10-Q, which are deemed to be “forward-looking” within the meaning of the Private Securities Litigation Reform Act of 1995 (the “Litigation Reform Act”). These forward-looking statements and other information are based on our beliefs as well as assumptions made by us using information currently available.
44
The words “anticipate,” “believe,” “estimate,” “project,” “expect,” “intend,” “plan,” “should,” and similar expressions, as they relate to us, are intended to identify forward-looking statements. Such statements reflect our current views with respect to future events and are subject to certain risks, uncertainties, and assumptions. Should one or more of these risks or uncertainties materialize, or should underlying assumptions prove incorrect, actual results may vary materially from those described herein as anticipated, believed, estimated, expected, or intended. We do not intend to update these forward-looking statements following the date of this report. In accordance with the provisions of the Litigation Reform Act, we are making investors aware that such forward-looking statements, because they relate to future events, are by their very nature subject to many important factors that could cause actual results to differ materially from those contemplated by the forward-looking statements contained in this Quarterly Report on Form 10-Q and other public statements we make. Such factors include, but are not limited to: the success of our restructuring programs; our level of indebtedness and related obligations; disruptions in the financial markets; interest rates; changes in foreign currency exchange rates; customer concentration and consolidation; raw material and commodity costs; competition; our ability to continue to make acquisitions in accordance with our business strategy; changes and developments affecting our industry, including customer preferences; the outcome of litigation and regulatory proceedings to which we may be a party; product recalls; changes in laws and regulations applicable to us; disruptions in or failures of our information technology systems; and labor strikes or work stoppages; and other risks that are set forth in the Risk Factors section, the Legal Proceedings section, the Management’s Discussion and Analysis of Financial Condition and Results of Operations section, and other sections of this Quarterly Report on Form 10-Q, our Annual Report on Form 10-K for the year ended
December 31, 2018
, and from time to time in our filings with the Securities and Exchange Commission.
Item 3. Quantitative and Qualitative Disclosures About Market Risk
The Company is exposed to certain market risks, which exist as part of its ongoing business operations. The Company uses derivative instruments, where appropriate, to manage these risks. Refer to
Note 15
to our Condensed Consolidated Financial Statements for additional information regarding these derivative instruments.
For additional information regarding the Company's exposure to certain market risk, refer to Item 7A,
Quantitative and Qualitative Disclosures About Market Risk,
within the Company's 2018 Annual Report on Form 10-K. There have been no significant changes in the Company's portfolio of financial instruments or market risk exposures from the 2018 year-end.
Item 4. Controls and Procedures
The Company maintains a system of disclosure controls and procedures to give reasonable assurance that information required to be disclosed in the Company’s reports filed or submitted under the Exchange Act is recorded, processed, summarized, and reported within the time periods specified in the rules and forms of the Securities and Exchange Commission. These controls and procedures also give reasonable assurance that information required to be disclosed in such reports is accumulated and communicated to management to allow timely decisions regarding required disclosures.
As of
March 31, 2019
, the Company’s Chief Executive Officer (“CEO”) and Chief Financial Officer (“CFO”), together with management, conducted an evaluation of the effectiveness of the Company’s disclosure controls and procedures pursuant to Rules 13a-15(e) and 15d-15(e) of the Exchange Act. Based on that evaluation, the CEO and CFO concluded that these disclosure controls and procedures are effective.
In the ordinary course of business, the Company reviews its internal control over financial reporting and makes changes to systems and processes to improve such controls and increase efficiency, while ensuring that an effective internal control environment is maintained.
In connection with the Company’s restructuring programs, in the first quarter of 2019, the Company continued centralizing certain accounting functions within its shared service center and began the process of implementing a new IT system which will support centralized accounting functions. This implementation is expected to continue throughout 2019, with initial changes to begin in the second quarter of 2019. These initiatives were not in response to any identified deficiency or weakness in the Company’s internal control over financial reporting. In response to these initiatives, the Company has and will continue to align and streamline the design and operation of its financial control environment.
Additionally, in the first quarter of 2019, the Company adopted ASC 842,
Leases
. The adoption of this new accounting standard resulted in the implementation of additional controls as changes were made to certain processes and systems.
45
Other than as described in the preceding paragraphs, there have been no changes in the Company’s internal control over financial reporting that occurred during the quarter ended
March 31, 2019
that have materially affected or are reasonably likely to materially affect the Company’s internal control over financial reporting.
REPORT OF INDEPENDENT REGISTERED PUBLIC ACCOUNTING FIRM
To the Stockholders and the Board of Directors of TreeHouse Foods, Inc.
Results of Review of Interim Financial Information
We have reviewed the accompanying condensed consolidated balance sheet of Treehouse Foods, Inc. and subsidiaries (the "Company") as of
March 31, 2019
, the related condensed consolidated statements of operations, comprehensive income (loss), and cash flows, for the
three
-month periods ended
March 31, 2019
and
2018
, and the related notes and schedules (collectively referred to as the "interim financial information"). Based on our reviews, we are not aware of any material modifications that should be made to the accompanying interim financial information for it to be in conformity with accounting principles generally accepted in the United States of America.
We have previously audited, in accordance with the standards of the Public Company Accounting Oversight Board (United States) (PCAOB), the consolidated balance sheet of the Company as of
December 31, 2018
, and the related consolidated statements of operations, comprehensive income (loss), and cash flows for the year then ended (not presented herein); and in our report dated February 14, 2019, we expressed an unqualified opinion on those consolidated financial statements. In our opinion, the information set forth in the accompanying condensed consolidated balance sheet as of
December 31, 2018
, is fairly stated, in all material respects, in relation to the consolidated balance sheet from which it has been derived.
Basis for Review Results
This interim financial information is the responsibility of the Company's management. We are a public accounting firm registered with the PCAOB and are required to be independent with respect to the Company in accordance with the U.S. federal securities laws and the applicable rules and regulations of the Securities and Exchange Commission and the PCAOB.
We conducted our reviews in accordance with standards of the PCAOB. A review of interim financial information consists principally of applying analytical procedures and making inquiries of persons responsible for financial and accounting matters. It is substantially less in scope than an audit conducted in accordance with the standards of the PCAOB, the objective of which is the expression of an opinion regarding the financial information taken as a whole. Accordingly, we do not express such an opinion.
/s/ DELOITTE & TOUCHE LLP
Chicago, IL
May 2, 2019
46
Part II — Other Information
Item 1. Legal Proceedings
Information regarding legal proceedings is available in
Note 14
to the Condensed Consolidated Financial Statements in this report.
Item 1A. Risk Factors
Information regarding risk factors appears in Management’s Discussion and Analysis of Financial Condition and Results of Operations — Information Related to Forward-Looking Statements, in Part I — Item 2 of this Form 10-Q, and in Part I — Item 1A of the TreeHouse Foods, Inc. Annual Report on Form 10-K for the year ended
December 31, 2018
. There have been no material changes from the risk factors previously disclosed in the TreeHouse Foods, Inc. Annual Report on Form 10-K for the year ended
December 31, 2018
.
Item 2. Unregistered Sale of Equity Securities and Use of Proceeds
On November 2, 2017, the Company announced that the Board of Directors adopted a stock repurchase program. The stock repurchase program authorizes the Company to repurchase up to $400 million of the Company’s common stock at any time, or from time to time. Any repurchases under the program may be made by means of open market transactions, negotiated block transactions, or otherwise, including pursuant to a repurchase plan administered in accordance with Rules 10b5-1 and 10b-18 under the Securities Exchange Act of 1934, as amended (the “Exchange Act”). The size and timing of any repurchases will depend on price, market and business conditions, and other factors. The Company was authorized to enter into an administrative repurchase plan for $50 million of the $400 million in fiscal 2018. The administrative repurchase plan expired as of December 31, 2018. The Company continues to have the ability to make discretionary repurchases up to an annual cap of $150 million under the $400 million total authorization. Any shares repurchased will be held as treasury stock.
For the
three months ended March 31, 2019
, the Company did not make any share repurchases.
47
Item 6. Exhibits
|
|
|
|
10.1
|
|
|
15.1*
|
|
|
|
|
|
31.1*
|
|
|
|
|
|
31.2*
|
|
|
|
|
|
32.1*
|
|
|
|
|
|
32.2*
|
|
|
|
|
|
101.INS*
|
XBRL Instance Document.
|
|
|
|
|
101.SCH*
|
XBRL Taxonomy Extension Schema Document.
|
|
|
|
|
101.CAL*
|
XBRL Taxonomy Extension Calculation Linkbase Document.
|
|
|
|
|
101.LAB*
|
XBRL Taxonomy Extension Label Linkbase Document.
|
|
|
|
|
101.PRE*
|
XBRL Taxonomy Extension Presentation Linkbase Document.
|
|
|
|
|
101.DEF*
|
XBRL Taxonomy Extension Definition Linkbase Document.
|
*Filed herewith.
**Management contract or compensatory plan or arrangement.
48
SIGNATURES
Pursuant to the requirement of the Securities Exchange Act of 1934, the registrant has duly caused this report to be signed on its behalf by the undersigned thereunto duly authorized.
|
TREEHOUSE FOODS, INC.
|
|
|
|
|
|
Date: May 2, 2019
|
/s/ Matthew J. Foulston
|
|
Matthew J. Foulston
|
|
|
Executive Vice President and Chief Financial Officer
|
|
|
Date: May 2, 2019
|
/s/ John P. Waldron
|
|
John P. Waldron
|
|
|
Vice President, Corporate Controller, and Principal Accounting Officer
|
|
49
TABLE OF CONTENTS
Part I Financial InformationItem 1. Financial StatementsItem 2. Management S Discussion and Analysis Of Financial Condition and Results Of OperationsItem 3. Quantitative and Qualitative Disclosures About Market RiskItem 4. Controls and ProceduresPart II Other InformationItem 1. Legal ProceedingsItem 1A. Risk FactorsItem 2. Unregistered Sale Of Equity Securities and Use Of ProceedsItem 6. Exhibits