TIFFANY & CO
10-Ks and 10-Qs
|
|
|
|
|
|
|
|
|
|
|
|
|
|
|
|
|
|
|
|
|
|
|
|
|
|
|
|
|
|
|
|
UNITED STATES
SECURITIES AND EXCHANGE COMMISSION
Washington, D.C. 20549
Form 10-K
|
x
|
ANNUAL REPORT PURSUANT TO SECTION 13 OR 15(d) OF THE SECURITIES
EXCHANGE ACT OF 1934 |
|
For the fiscal year ended January 31, 2017
OR
|
|
|
¨
|
TRANSITION REPORT PURSUANT TO SECTION 13 OR 15(d) OF THE SECURITIES EXCHANGE ACT OF 1934
|
For the transition period from
to
Commission file number: 1-9494

(Exact name of registrant as specified in its charter)
|
Delaware
|
|
13-3228013
|
|
(State or other jurisdiction of incorporation or organization)
|
|
(I.R.S. Employer Identification No.)
|
|
727 Fifth Avenue, New York, NY
|
|
10022
|
|
(Address of principal executive offices)
|
|
(Zip Code)
|
|
Registrant's telephone number, including area code: (212) 755-8000
|
||
|
Securities registered pursuant to Section 12(b) of the Act:
|
||
|
Title of each class
|
|
Name of each exchange on which registered
|
|
Common Stock, $.01 par value per share
|
New York Stock Exchange
|
|
|
Securities registered pursuant to Section 12(g) of the Act: None
|
||
Indicate by check mark if the registrant is a well-known seasoned issuer, as defined in Rule 405 of the Securities Act. Yes
x
No
¨
Indicate by check mark if the registrant is not required to file reports pursuant to Section 13 or Section 15(d) of the Act. Yes
¨
No
x
Indicate by check mark whether the registrant (1) has filed all reports required to be filed by Section 13 or 15(d) of the Securities Exchange Act of 1934 during the preceding 12 months (or for such shorter period that the registrant was required to file such reports), and (2) has been subject to such filing requirements for the past 90 days. Yes
x
No
¨
Indicate by check mark whether the registrant has submitted electronically and posted on its corporate Web site, if any, every Interactive Data File required to be submitted and posted pursuant to Rule 405 of Regulation S-T (§232.405 of this chapter) during the preceding 12 months (or for such shorter period that the registrant was required to submit and post such files). Yes
x
No
¨
Indicate by check mark if disclosure of delinquent filers pursuant to Item 405 of Regulation S-K (§229.405 of this chapter) is not contained herein, and will not be contained, to the best of registrant's knowledge, in definitive proxy or information statements incorporated by reference in Part III of this Form10-K or any amendment to this Form10-K.
¨
Indicate by check mark whether the registrant is a large accelerated filer, an accelerated filer, a non-accelerated filer, or a smaller reporting company. See the definitions of "large accelerated filer," "accelerated filer" and "smaller reporting company" in Rule 12b-2 of the Exchange Act.
|
Large accelerated filer
|
x
|
Accelerated filer
|
|
¨
|
||
|
Non-accelerated filer
|
¨
|
(Do not check if a smaller reporting company)
|
Smaller reporting company
|
|
¨
|
|
Indicate by check mark whether the registrant is a shell company (as defined in Rule 12b-2 of the Act). Yes
¨
No
x
As of July 31, 2016, the aggregate market value of the registrant's voting and non-voting stock held by non-affiliates of the registrant was approximately $8,002,474,636 using the closing sales price on July 29, 2016 of $64.52. See Item 5. Market for Registrant's Common Equity, Related Stockholder Matters and Issuer Purchases of Equity Securities.
As of March 13, 2017, the registrant had outstanding 124,564,854 shares of its common stock, $.01 par value per share.
DOCUMENTS INCORPORATED BY REFERENCE.
The following documents are incorporated by reference into this Annual Report on Form 10-K: Registrant's Proxy Statement Dated April 7, 2017 (Part III).
TIFFANY & CO.
K-
1
Tiffany & Co.
Table of Contents
Form 10-K for the fiscal year ended January 31, 2017
|
Page
|
||
|
Item 1.
|
K-
3
|
|
|
Item 1A.
|
K-
11
|
|
|
Item 1B.
|
K-
18
|
|
|
Item 2.
|
K-
18
|
|
|
Item 3.
|
K-
19
|
|
|
Item 4.
|
K-
21
|
|
|
Item 5.
|
K-
22
|
|
|
Item 6.
|
K-
25
|
|
|
Item 7.
|
K-
27
|
|
|
Item 7A.
|
K-
48
|
|
|
Item 8.
|
K-
49
|
|
|
Item 9.
|
K-
97
|
|
|
Item 9A.
|
K-
97
|
|
|
Item 9B.
|
K-
98
|
|
|
Item 10.
|
K-
99
|
|
|
Item 11.
|
K-
99
|
|
|
Item 12.
|
K-
99
|
|
|
Item 13.
|
K-
99
|
|
|
Item 14.
|
K-
99
|
|
|
Item 15.
|
K-
100
|
|
|
Item 16.
|
K-
100
|
|
SPECIAL NOTE REGARDING FORWARD-LOOKING STATEMENTS
The historical trends and results reported in this annual report on Form 10-K should not be considered an indication of future performance. Further, statements contained in this annual report on Form 10-K that are not statements of historical fact, including those that refer to plans, assumptions and expectations for future periods, are forward-looking statements within the meaning of the Private Securities Litigation Reform Act of 1995. Forward-looking statements include, but are not limited to, the statements under "2017 Outlook" as well as statements that can be identified by the use of words such as 'expects,' 'projects,' 'anticipates,' 'assumes,' 'forecasts,' 'plans,' 'believes,' 'intends,' 'estimates,' 'pursues,' 'continues,' 'outlook,' 'may,' 'will,' 'can,' 'should' and variations of such words and similar expressions. Examples of forward-looking statements include, but are not limited to, statements we make regarding the Company's plans, assumptions, expectations, beliefs and objectives with respect to store openings and closings; product introductions; sales; sales growth; sales trends; store traffic; the Company's strategy and initiatives and the pace of execution thereon; the Company's objectives to compete in the global luxury market and to improve financial performance; retail prices; gross margin; operating margin; expenses; interest expense and financing costs; effective income tax rate; net earnings and net earnings per share; share count; inventories; capital expenditures; cash flow; liquidity; currency translation; macroeconomic conditions; growth opportunities; litigation outcomes and recovery related thereto; the collectability of amounts due under financing arrangements with diamond mining and exploration companies; contributions to Company pension plans; and certain ongoing or planned real estate, product, marketing, retail, customer experience, manufacturing, supply chain, information systems development, upgrades and replacement, and other operational and strategic initiatives.
These forward-looking statements are based upon the current views and plans of management, speak only as of the date on which they are made and are subject to a number of risks and uncertainties, many of which are outside of our control. Actual results could therefore differ materially from the planned, assumed or expected results expressed in, or implied by, these forward-looking statements. While we cannot predict all of the factors that could form the basis of such differences, key factors include, but are not limited to: global macroeconomic and geopolitical developments; changes in interest and foreign currency rates; changes in taxation policies and regulations; shifting tourism trends; regional instability; violence (including terrorist activities); political activities or events; weather conditions that may affect local and tourist consumer spending; changes in consumer confidence, preferences and shopping patterns, as well as our ability to accurately predict and timely respond to such changes; shifts in the Company's product and geographic sales mix; variations in the cost and availability of diamonds, gemstones and precious metals; adverse publicity regarding the Company and its products, the Company’s third-party vendors or the diamond or jewelry industry more generally; any non-compliance by third-party vendors and suppliers with the Company’s sourcing and quality standards, codes of conduct, or contractual requirements as well as applicable laws and regulations; changes in our competitive landscape; disruptions impacting the Company's business and operations; failure to successfully implement or make changes to the Company's information systems; gains or losses in the trading value of the Company's stock, which may impact the amount of stock repurchased; and our ability to successfully control costs and execute on, and achieve the expected benefits from, the operational and strategic initiatives referenced above; and any difficulties or delays encountered in identifying a successor chief executive officer. Developments relating to these and other factors may also warrant changes to the Company's operating and strategic plans, including with respect to store openings, closings and renovations, capital expenditures, information systems development, inventory management, and continuing execution on, or timing of, the aforementioned initiatives. Such changes could also cause actual results to differ materially from the expected results expressed in, or implied by, the forward-looking statements.
Additional information about potential risks and uncertainties that could affect the Company’s business and financial results is included under "Item 1A. Risk Factors" and "Item 7. Management's Discussion and Analysis of Financial Condition and Results of Operations" in this annual report on Form 10-K for the fiscal year ended January 31, 2017. Readers of this annual report on Form 10-K should consider the risks, uncertainties and factors outlined above and in this Form 10-K in evaluating, and are cautioned not to place undue reliance on, the forward-looking statements contained herein. The Company undertakes no obligation to update or revise any forward-looking statements to reflect subsequent events or circumstances, except as required by applicable law or regulation.
TIFFANY & CO.
K-
2
GENERAL HISTORY AND NARRATIVE DESCRIPTION OF BUSINESS
Tiffany & Co. (the "Registrant") is a holding company that operates through its subsidiary companies (collectively, the "Company"). The Registrant's principal subsidiary is Tiffany and Company ("Tiffany"). Charles Lewis Tiffany founded Tiffany's business in 1837. He incorporated Tiffany in New York in 1868. The Registrant acquired Tiffany in 1984 and completed the initial public offering of the Registrant's Common Stock in 1987. The Registrant, through its subsidiaries, sells jewelry and other items that it manufactures or has made by others to its specifications.
All references to years relate to fiscal years that end on January 31 of the following calendar year.
MAINTENANCE OF THE TIFFANY & CO. BRAND
The TIFFANY & CO. brand (the "Brand") is the single most important asset of Tiffany and, indirectly, of the Company. The strength of the Brand goes beyond trademark rights (see "TRADEMARKS" below) and is derived from consumer perceptions of the Brand. Management monitors the strength of the Brand through focus groups and survey research.
Management believes that consumers associate the Brand with high-quality gemstone jewelry, particularly diamond jewelry; sophisticated style and romance; excellent customer service; an elegant store and online environment; upscale store locations; "classic" product positioning; and distinctive and high-quality packaging materials (most significantly, the TIFFANY & CO. blue box). Tiffany's business plan includes expenses to maintain the strength of the Brand, such as the following:
|
•
|
Maintaining its position within the high-end of the jewelry market requires Tiffany to invest significantly in diamond and gemstone inventory, which carries a lower overall gross margin; it also causes some consumers to view Tiffany as beyond their price range;
|
|
•
|
To provide excellent service, stores must be well staffed with knowledgeable professionals;
|
|
•
|
Elegant stores in the best "high street" and luxury mall locations are more expensive and difficult to secure and maintain, but reinforce the Brand's luxury connotations through association with other luxury brands;
|
|
•
|
While the classic positioning of much of Tiffany's product line supports the Brand and requires sufficient display space in its stores, management's strategy also includes an active pace of new product introductions which could result in a necessary reallocation of product display space;
|
|
•
|
Tiffany's packaging supports consumer expectations with respect to the Brand but is expensive; and
|
|
•
|
A significant amount of advertising is required to both reinforce the Brand's association with luxury, sophistication, style and romance, as well as to market specific products.
|
All of the foregoing require that management make tradeoffs between business initiatives that might generate incremental sales and earnings and Brand maintenance objectives. This is a dynamic process. To the extent that management deems that product, marketing or distribution initiatives will unduly and negatively affect the strength of the Brand, such initiatives have been and will be curtailed or modified appropriately. At the same time, Brand maintenance suppositions are regularly questioned by management to determine if any tradeoff between sales and earnings is truly worth the positive effect on the Brand. At times, management has determined, and may in the future determine, that the strength of the Brand warranted, or that it will permit, more aggressive and profitable product, marketing or distribution initiatives.
FINANCIAL INFORMATION ABOUT REPORTABLE SEGMENTS
The Company has four reportable segments: (i) Americas, (ii) Asia-Pacific, (iii) Japan and (iv) Europe. All non-reportable segments are included within Other. The Company transacts business within certain of its segments through the following channels: (i) retail, (ii) Internet, (iii) catalog, (iv) business-to-business (products drawn from the retail product line and items specially developed for the business market) and (v) wholesale distribution
TIFFANY & CO.
K-
3
(merchandise sold to independent distributors for resale). The Company's segment information for the fiscal years ended January 31,
2017
,
2016
and
2015
is reported in "Item 8. Financial Statements and Supplementary Data - Note P. Segment Information."
Americas
Sales in the Americas were
46%
of worldwide net sales in
2016
, while sales in the U.S. represented 88% of net sales in the Americas. Sales are transacted through the following channels: retail, Internet and catalog (in the U.S. and Canada), business-to-business (in the U.S.) and wholesale distribution (in Central/South America and the Caribbean).
Retail sales in the Americas are transacted in
125
Company-operated TIFFANY & CO. stores in (number of stores at January 31,
2017
included in parentheses): the U.S. (95), Canada (13), Mexico (11), Brazil (5) and Chile (1). Included within these totals are 13 Company-operated stores located within various department stores in Canada and Mexico. Included in the U.S. retail stores is the New York Flagship store, which represented less than 10% of worldwide net sales in
2016
.
Asia-Pacific
Sales in Asia-Pacific represented
25%
of worldwide net sales in
2016
, while sales in Greater China represented more than half of Asia-Pacific's net sales. Sales are transacted through the following channels: retail, Internet (in Australia) and wholesale distribution.
Retail sales in Asia-Pacific are transacted in
85
Company-operated TIFFANY & CO. stores in (number of stores at January 31,
2017
included in parentheses): China (31), Korea (15), Australia (9), Hong Kong (9), Taiwan (8), Singapore (5), Macau (4), Malaysia (2), New Zealand (1) and Thailand (1). Included within these totals are 30 Company-operated stores located within various department stores.
Japan
Sales in Japan represented
15%
of worldwide net sales in
2016
. Sales are transacted through the following channels: retail, Internet, business-to-business and wholesale distribution.
Retail sales in Japan are transacted in
55
Company-operated TIFFANY & CO. stores. Included within this total are 50 stores located within department stores, generating approximately
75%
of Japan's net sales. There are four large department store groups in Japan. The Company operates TIFFANY & CO. stores in locations controlled by these groups as follows (number of locations at January 31,
2017
included in parentheses): Isetan Mitsukoshi Ltd. (13), J. Front Retailing Co., Ltd. (Daimaru and Matsuzakaya department stores) (9), Takashimaya Co., Ltd. (8) and Seven & i Holding Co., Ltd. (Sogo and Seibu department stores) (5). The Company also operates 15 stores in other department stores.
Europe
Sales in Europe represented
11%
of worldwide net sales in
2016
, while sales in the United Kingdom ("U.K.") represented approximately 40% of European net sales. Sales are transacted through the following channels: retail, Internet and wholesale distribution.
Retail sales in Europe are transacted in
43
Company-operated TIFFANY & CO. stores in (number of stores at January 31,
2017
included in parentheses): the U.K. (10), Italy (9), Germany (6), France (5), Spain (3), Switzerland (3), the Netherlands (2), Austria (1), Belgium (1), the Czech Republic (1), Ireland (1), and Russia (1). Included within these totals are eight Company-operated stores located within various department stores. Internet sales are conducted within the following countries: U.K., Austria, Belgium, France, Germany, Ireland, Italy, the Netherlands and Spain.
Other
Other consists of all non-reportable segments, including: (i) retail sales and wholesale distribution in the Emerging Markets region (which represented approximately 60% of Other net sales in 2016); (ii) wholesale sales of diamonds
TIFFANY & CO.
K-
4
(see "PRODUCT SUPPLY CHAIN – Supply of Diamonds" below); and (iii) licensing agreements. Retail sales are transacted in five Company-operated TIFFANY & CO. stores in the United Arab Emirates.
Licensing Agreements.
The Company receives earnings from a licensing agreement with Luxottica Group for the distribution of TIFFANY & CO. brand eyewear. The earnings received from this licensing agreement represented less than 1% of worldwide net sales in
2016
.
In 2015, the Company entered into a licensing agreement with Coty Inc. regarding the development, production and distribution of a new line of TIFFANY & CO. brand fragrances. The Company did not receive any earnings from this agreement in 2015 or 2016, and does not expect any earnings in 2017 to be significant.
Retail Distribution Base
Management regularly evaluates opportunities to optimize its retail store base. This includes evaluating potential markets for new TIFFANY & CO. stores, as well as the renovation, relocation, or, in certain instances, closure of existing stores. Considerations include the characteristics of the markets to be served, consumer demand and the proximity of other luxury brands and existing TIFFANY & CO. locations. Management recognizes that over-saturation of any market could diminish the distinctive appeal of the Brand, but believes that there are a number of opportunities remaining in new and existing markets that will meet the requirements for a TIFFANY & CO. location in the future.
The following chart details the number of TIFFANY & CO. retail locations operated by the Company since 2012:
|
Americas
|
||||||||||||||
|
Year:
|
U.S.
|
|
Canada &
Latin America
|
|
Asia-Pacific
|
|
Japan
|
|
Europe
|
|
Emerging Markets
|
|
Total
|
|
|
2012
|
91
|
|
24
|
|
66
|
|
55
|
|
34
|
|
5
|
|
275
|
|
|
2013
|
94
|
|
27
|
|
72
|
|
54
|
|
37
|
|
5
|
|
289
|
|
|
2014
|
95
|
|
27
|
|
73
|
|
56
|
|
39
|
|
5
|
|
295
|
|
|
2015
|
95
|
|
29
|
|
81
|
|
56
|
|
41
|
|
5
|
|
307
|
|
|
2016
|
95
|
|
30
|
|
85
|
|
55
|
|
43
|
|
5
|
|
313
|
|
As part of the Company's strategy, management plans to increase gross retail square footage by approximately 3%, net through the addition of new stores, relocations, renovations and closings in 2017. For a summary of the Company's existing retail square footage, see "Item 2. Properties".
E-Commerce
The Company currently operates e-commerce enabled websites in 13 countries as well as informational websites in several additional countries. Sales transacted on those websites accounted for 6% of worldwide net sales in
2016
,
2015
and
2014
. The Company invests in ongoing website enhancements and is evaluating opportunities to expand its e-commerce sites to additional countries. In addition, management believes that these websites serve a role as marketing tools to attract customers to the Company's stores.
Products
The Company's principal product category is jewelry, which represented 92%, 93% and 92% of worldwide net sales in
2016
,
2015
and
2014
. The Company offers an extensive selection of TIFFANY & CO. brand jewelry at a wide range of prices.
Designs are developed by employees, suppliers, independent designers and independent "named" designers (see "MATERIAL DESIGNER LICENSE" below).
The Company also sells timepieces, leather goods, sterling silver goods (other than jewelry), china, crystal, stationery, fragrances and accessories, which represented, in total, 7% of worldwide net sales in
2016
,
2015
and
2014
. The remaining approximately 1% of worldwide net sales were attributable to wholesale sales of diamonds and earnings received from a third-party licensing agreement.
TIFFANY & CO.
K-
5
Sales by Reportable Segment of TIFFANY & CO. Jewelry by Category
|
2016
|
% of total
Americas
Sales
|
|
% of total
Asia-Pacific
Sales
|
|
% of total
Japan
Sales
|
|
% of total
Europe
Sales
|
|
% of total
Reportable
Segment Sales
|
|
|
High, fine & solitaire jewelry
a
|
21
|
%
|
22
|
%
|
14
|
%
|
15
|
%
|
20
|
%
|
|
Engagement jewelry & wedding bands
b
|
22
|
%
|
35
|
%
|
39
|
%
|
26
|
%
|
28
|
%
|
|
Fashion jewelry
c
|
34
|
%
|
35
|
%
|
19
|
%
|
46
|
%
|
33
|
%
|
|
Designer jewelry
d
|
12
|
%
|
6
|
%
|
21
|
%
|
10
|
%
|
12
|
%
|
|
2015
|
||||||||||
|
High, fine & solitaire jewelry
a
|
22
|
%
|
24
|
%
|
16
|
%
|
16
|
%
|
21
|
%
|
|
Engagement jewelry & wedding bands
b
|
23
|
%
|
35
|
%
|
39
|
%
|
25
|
%
|
28
|
%
|
|
Fashion jewelry
c
|
33
|
%
|
33
|
%
|
18
|
%
|
45
|
%
|
33
|
%
|
|
Designer jewelry
d
|
12
|
%
|
7
|
%
|
20
|
%
|
10
|
%
|
11
|
%
|
|
2014
|
||||||||||
|
High, fine & solitaire jewelry
a
|
21
|
%
|
23
|
%
|
17
|
%
|
16
|
%
|
21
|
%
|
|
Engagement jewelry & wedding bands
b
|
23
|
%
|
37
|
%
|
41
|
%
|
24
|
%
|
29
|
%
|
|
Fashion jewelry
c
|
33
|
%
|
31
|
%
|
14
|
%
|
47
|
%
|
32
|
%
|
|
Designer jewelry
d
|
12
|
%
|
7
|
%
|
21
|
%
|
10
|
%
|
12
|
%
|
a) This category includes high, fine and solitaire jewelry (other than engagement jewelry). Most sales in this category are of items containing diamonds, other gemstones or both. Most jewelry in this category is constructed of platinum, although gold was used as the primary metal in approximately 15% of sales in
2016
. The average price of merchandise sold in
2016
,
2015
and
2014
in this category was approximately $6,300, $6,300 and $5,800 for total reportable segments.
b) This category includes engagement rings (approximately 60% of the category) and wedding bands. Most sales in this category are of items containing diamonds. Most jewelry in this category is constructed of platinum, although gold was used as the primary metal in approximately 10% of sales in
2016
. The average price of merchandise sold in
2016
,
2015
and
2014
in this category was approximately $3,400, $3,500 and $3,800 for total reportable segments.
c) This category generally consists of non-gemstone jewelry, primarily containing sterling silver and gold jewelry, although small gemstones are used as accents in some pieces. The average price of merchandise sold in
2016
,
2015
and
2014
in this category was approximately $350, $335 and $310 for total reportable segments.
|
d)
|
This category includes only items that are attributed to one of the Company’s "named" designers: Elsa Peretti (refer to "MATERIAL DESIGNER LICENSE" below) and Paloma Picasso. Merchandise primarily consists of sterling silver and gold jewelry, although platinum was used as the primary metal in approximately 15% of sales in
2016
. Some of the items sold contain diamonds, other gemstones or a combination of both. The average price of merchandise sold in
2016
,
2015
and
2014
in this category was approximately $530, $525 and $535 for total reportable segments.
|
Items bearing the name of and attributed to one of the Company's "named" designers: Elsa Peretti and Paloma Picasso, which were previously reported across the high, fine & solitaire jewelry, engagement jewelry & wedding bands and fashion jewelry categories, have been reclassified into the designer jewelry category to conform with management's current internal analysis of product sales. Additionally, certain reclassifications within the jewelry categories have been made to the prior years' amounts to conform to the current year category presentation.
TIFFANY & CO.
K-
6
ADVERTISING, MARKETING, PUBLIC AND MEDIA RELATIONS
The Company regularly advertises in newspapers, magazines and through digital media. Public and media relations activities are also significant to the Company's business. The Company engages in a program of media activities and marketing events to maintain consumer awareness of the Brand and TIFFANY & CO. products. It also publishes its well-known
Blue Book
to showcase its high-end jewelry. In
2016
,
2015
and
2014
, the Company spent $299.0 million, $302.0 million and $284.0 million, representing 7.5%, 7.4% and 6.7% of worldwide net sales in those respective years, on advertising, marketing and public and media relations, which include costs for media, production, catalogs, Internet, visual merchandising (in-store and window displays), marketing events and other related items.
In addition, management believes that the Brand is enhanced by a program of charitable sponsorships, grants and merchandise donations. The Company also periodically makes donations to The Tiffany & Co. Foundation, a private foundation organized to support 501(c)(3) charitable organizations. The efforts of this Foundation are primarily focused on environmental conservation.
TRADEMARKS
The designations TIFFANY
®
and TIFFANY & CO.
®
are the principal trademarks of Tiffany, and also serve as tradenames. Tiffany has obtained and is the proprietor of trademark registrations for TIFFANY and TIFFANY & CO., as well as the TIFFANY BLUE BOX
®
, the TIFFANY BLUE BOX design, TIFFANY BLUE
®
and the color Tiffany Blue for a variety of product categories and services in the U.S. and in other countries.
Tiffany maintains a program to protect its trademarks and institutes legal action where necessary to prevent others either from registering or using marks which are considered to create a likelihood of confusion with the Company or its products.
Tiffany has been generally successful in such actions and management considers that the Company's worldwide rights in its principal trademarks, TIFFANY and TIFFANY & CO., are strong. However, use of the designation TIFFANY by third parties on related or unrelated goods or services, frequently transient in nature, may not come to the attention of Tiffany or may not rise to a level of concern warranting legal action.
Tiffany actively pursues those who produce or sell counterfeit TIFFANY & CO. goods through civil action and cooperation with criminal law enforcement agencies. However, counterfeit TIFFANY & CO. goods remain available in many markets because it is not possible or cost-effective to eradicate the problem. The cost of enforcement is expected to continue to rise. In recent years, there has been an increase in the availability of counterfeit goods, predominantly silver jewelry, on the Internet and in various markets by street vendors and small retailers. Tiffany pursues infringers through leads generated internally and through a network of investigators, legal counsel, law enforcement and customs authorities worldwide. The Company responds to such infringing activity by taking various actions, including sending cease and desist letters, cooperating with law enforcement in criminal prosecutions, initiating civil proceedings and participating in joint actions and anti-counterfeiting programs with other like-minded third party rights holders.
Despite the general fame of the TIFFANY and TIFFANY & CO. name and mark for the Company's products and services, Tiffany is not the sole person entitled to use the name TIFFANY in every category of use in every country of the world; for example, in some countries, third parties have registered the name TIFFANY in connection with certain product categories (including, in the U.S., the category of bedding and, in certain foreign countries, the categories of food, cosmetics, clothing, paper goods and tobacco products) under circumstances where Tiffany's rights were not sufficiently clear under local law, and/or where management concluded that Tiffany's foreseeable business interests did not warrant the expense of legal action.
TIFFANY & CO.
K-
7
MATERIAL DESIGNER LICENSE
Since 1974, Tiffany has been the sole licensee for the intellectual property rights necessary to make and sell jewelry and other products designed by Elsa Peretti and bearing her trademarks. The designs of Ms. Peretti accounted for 9%, 8% and 8% of the Company's worldwide net sales in
2016
,
2015
and
2014
.
Tiffany is party to an Amended and Restated Agreement (the "Peretti Agreement") with Ms. Peretti, which largely reflects the long-standing rights and marketing and royalty obligations of the parties. Pursuant to the Peretti Agreement, Ms. Peretti grants Tiffany an exclusive license, in all of the countries in which Peretti-designed jewelry and products are currently sold, to make, have made, advertise and sell these items. Ms. Peretti continues to retain ownership of the copyrights for her designs and her trademarks and remains entitled to exercise approval and consultation rights with respect to important aspects of the promotion, display, manufacture and merchandising of the products made in accordance with her designs. Under and in accordance with the terms set forth in the Peretti Agreement, Tiffany is required to display the licensed products in stores, to devote a portion of its advertising budget to the promotion of the licensed products, to pay royalties to Ms. Peretti for the licensed products sold, to maintain total on-hand and on-order inventory of non-jewelry licensed products (such as tabletop products) at approximately $8.0 million and to take certain actions to protect Ms. Peretti's intellectual property, including to maintain trademark registrations reasonably necessary to sell the licensed products in the markets in which the licensed products are sold by Tiffany.
The Peretti Agreement has a term that expires in 2032 and is binding upon Ms. Peretti, her heirs, estate, trustees and permitted assignees. During the term of the Peretti Agreement, Ms. Peretti may not sell, lease or otherwise dispose of her copyrights and trademarks unless the acquiring party expressly agrees with Tiffany to be bound by the provisions of the Peretti Agreement. The Peretti Agreement is terminable by Ms. Peretti only in the event of a material breach by Tiffany (subject to a cure period) or upon a change of control of Tiffany or the Company. It is terminable by Tiffany only in the event of a material breach by Ms. Peretti or following an attempt by Ms. Peretti to revoke the exclusive license (subject, in each case, to a cure period).
PRODUCT SUPPLY CHAIN
The Company manufactures jewelry in New York, Rhode Island and Kentucky, polishes jewelry in the Dominican Republic and crafts silver hollowware in Rhode Island. The Company processes, cuts and polishes rough diamonds at facilities outside the U.S. In total, these internal manufacturing facilities produce approximately 60% of the jewelry sold by the Company. The balance, including almost all non-jewelry items, is purchased from third-parties. The Company may increase the percentage of internally-manufactured jewelry in the future, but management does not expect that the Company will ever manufacture all of its needs. Factors considered by management in its decision to use third-party manufacturers include access to or mastery of various product-making skills and technology, support for alternative capacity, product cost and the cost of capital investments. To supply its internal manufacturing facilities, the Company sources precious metals, rough diamonds, polished diamonds and other gemstones, as well as certain fabricated components, from third parties.
Supply of Diamonds
. The Company regularly purchases parcels of rough diamonds for polishing and further processing. The vast majority of diamonds acquired by the Company originate from Botswana, Canada, Namibia, Russia, Sierra Leone and South Africa. The Company has diamond processing operations in Belgium, Botswana, Cambodia, Mauritius and Vietnam that prepare and/or cut and polish rough diamonds for its use. The Company conducts operations in Botswana through a subsidiary in which local third-parties own minority, non-controlling interests, allowing the Company to access rough diamond allocations reserved for local manufacturers. The Company maintains a relationship and has an arrangement with these local third-parties; however, if circumstances warrant, the Company could seek to replace its existing local partners or operate without local partners.
The Company secures supplies of rough diamonds primarily through arrangements with diamond producers and, to a lesser extent, on the secondary market. These arrangements include purchase agreements under which the Company agrees to purchase a minimum volume of rough diamonds, as well as arrangements in which the Company maintains access to rough diamonds that are offered for sale (including as a sightholder), although with no contractual obligation to purchase such rough diamonds. Additionally, the Company has a limited number of arrangements under which the Company, having provided loans to, or made equity investments in, mining projects, has agreed to, or has the right to, purchase a defined portion of a mine's output. All such supply arrangements are generally at the market
TIFFANY & CO.
K-
8
price prevailing at the time of purchase. Management anticipates that its minimum purchase obligations of rough diamonds under all of these arrangements will be approximately
$60.0
million in
2017
.
As a result of the manner in which rough diamonds are typically assorted for sale, it is occasionally necessary for the Company to knowingly purchase, as part of a larger assortment, rough diamonds that do not meet the Company's quality standards or assortment needs. The Company seeks to recover its costs related to these diamonds by selling such diamonds to third parties (generally other diamond polishers), which has the effect of modestly reducing the Company's overall gross margins. Any such sales are included in the Other non-reportable segment.
In recent years, approximately 65% - 75% (by dollar value) of the polished diamonds used in the Company's jewelry have been produced from rough diamonds that the Company has purchased. The balance of the Company's needs for polished diamonds is purchased from polishers or polished-diamond dealers generally through purchase orders for fixed quantities. These relationships may be terminated at any time by either party, but such a termination would not discharge either party's obligations under unfulfilled purchase orders accepted prior to the termination. It is the Company's intention to continue to supply the majority of its needs for diamonds by purchasing and polishing rough diamonds.
Products containing one or more diamonds of varying sizes, including diamonds used as accents, side-stones and center-stones, accounted for 59%, 59% and 58% of worldwide net sales in
2016
,
2015
and
2014
. Products containing one or more diamonds of one carat or larger accounted for 13%, 14% and 14% of worldwide net sales in each of those years.
Conflict Diamonds.
Media attention has been drawn to the issue of "conflict" diamonds. This term is used to refer to diamonds extracted from war-torn geographic regions and sold by rebel forces to fund insurrection. Allegations have also been made that trading in such diamonds supports terrorist activities. Management believes that it is not possible in most purchasing scenarios to distinguish diamonds produced in conflict regions from diamonds produced in other regions once they have been polished. Therefore, concerned participants in the diamond trade, including the Company and nongovernment organizations, seek to exclude "conflict" diamonds, which represent a small fraction of the world's supply, from legitimate trade through an international system of certification and legislation known as the Kimberley Process Certification Scheme. All rough diamonds the Company buys, crossing an international border, must be accompanied by a Kimberley Process certificate and all trades of rough and polished diamonds must conform to a system of warranties that references the aforesaid scheme. It is not expected that such efforts will substantially affect the supply of diamonds. In addition, concerns over human rights abuses in Zimbabwe, Angola and the Democratic Republic of the Congo underscore that the aforementioned system has not deterred the production of diamonds in state-sanctioned mines under poor working conditions. The Company has informed its vendors that it does not intend to purchase Zimbabwean, Angolan or Congolese-produced diamonds. Accordingly, the Company has implemented the Diamond Source Warranty Protocol, which requires vendors to provide a warranty, and a qualified independent audit certificate, that loose polished diamonds were not obtained from Zimbabwean, Angolan or Congolese mines.
Worldwide Availability and Price of Diamonds
. The availability and price of diamonds are dependent on a number of factors, including global consumer demand, the political situation in diamond-producing countries, the opening of new mines, the continuance of the prevailing supply and marketing arrangements for rough diamonds and levels of industry liquidity. In recent years, there has been substantial volatility in the prices of both rough and polished diamonds. Prices for rough diamonds do not necessarily reflect current demand for polished diamonds.
In addition, the supply and prices of rough and polished diamonds in the principal world markets have been and continue to be influenced by the Diamond Trading Company ("DTC"), an affiliate of the De Beers Group. Although the DTC's historical ability to control worldwide production has diminished due to its lower share of worldwide production and changing policies in diamond-producing countries, the DTC continues to supply a meaningful portion of the world market for rough, gem-quality diamonds and continues to impact diamond supply through its marketing and advertising initiatives. A significant portion of the diamonds that the Company purchased in 2016 had their source with the DTC.
Sustained interruption in the supply of diamonds, an overabundance of supply or a substantial change in the marketing arrangements described above could adversely affect the Company and the retail jewelry industry as a whole. Changes in the marketing and advertising spending of the DTC and its direct purchasers could affect consumer demand for diamonds.
TIFFANY & CO.
K-
9
The Company purchases conflict-free rough and polished colorless diamonds, in high color and clarity ranges. Management does not foresee a shortage of diamonds in these quality ranges in the short term but believes that, unless new mines are developed, rising demand will eventually create such a shortage and lead to higher prices.
Synthetic and Treated Diamonds.
Synthetic diamonds (diamonds manufactured but not naturally occurring) and treated diamonds (naturally occurring diamonds subject to treatment processes, such as irradiation) are produced in growing quantities. Although significant questions remain as to the ability of producers to produce synthetic and/or treated diamonds economically within a full range of sizes and natural diamond colors, and as to consumer acceptance of these diamonds, such diamonds are becoming a larger factor in the market. Should synthetic and/or treated diamonds be offered in significant quantities, the supply of and prices for natural diamonds may be affected. The Company does not produce and does not intend to purchase or sell such diamonds.
Purchases of Precious Metals and Other Polished Gemstones
. Precious metals and other polished gemstones used in making jewelry are purchased from a variety of sources for use in the Company's internal manufacturing operations and/or for use by third-party manufacturers contracted to supply Tiffany merchandise. The silver, gold and platinum sourced directly by the Company principally comes from two sources: in-ground, large-scale deposits of metals, primarily in the U.S., that meet the Company's standards for responsible mining and metals from recycled sources. While the Company may supply precious metals to a manufacturer, it cannot determine, in all circumstances, whether the finished goods provided by such manufacturer were actually produced with Company-supplied precious metals.
The Company generally enters into purchase orders for fixed quantities with precious metals and other polished gemstone vendors. Purchases are generally made at prevailing market prices, which have, with respect to precious metals, experienced substantial volatility in recent years. These relationships may be terminated at any time by either party; such termination would not discharge either party's obligations under unfulfilled purchase orders accepted prior to the termination. The Company believes that there are numerous alternative sources for other polished gemstones and precious metals and that the loss of any single supplier would not have a material adverse effect on its operations.
Finished Jewelry
. Finished jewelry is purchased from approximately 45 manufacturers. However, the Company does not enter into long-term supply arrangements with its finished goods vendors. The Company does enter into merchandise vendor agreements with nearly all of its finished goods vendors. The merchandise vendor agreements establish non-price terms by which the Company may purchase and by which vendors may sell finished goods to the Company. These terms include payment terms, shipping procedures, product quality requirements, merchandise specifications and vendor social responsibility requirements. The Company generally enters into purchase orders for fixed quantities of merchandise with its vendors. These relationships may be terminated at any time by either party; such termination would not discharge either party's obligations under unfulfilled purchase orders accepted prior to termination. The Company actively seeks alternative sources for its best-selling jewelry items to mitigate any potential disruptions in supply. However, due to the craftsmanship involved in a small number of designs, the Company may have difficulty finding readily available alternative suppliers for those jewelry designs in the short term.
Watches
. In 2015, management introduced new TIFFANY & CO. brand watches, which have been designed, produced, marketed and distributed through certain of the Company's Swiss subsidiaries. In support of this introduction, the Company has relationships with approximately 30 component and subassembly vendors to manufacture watches. The terms of the Company's contractual relationships with these vendors are substantially similar to those described under "Finished Jewelry" above. Sales of these new TIFFANY & CO. brand watches represented approximately 1% of worldwide net sales in both 2016 and 2015. While management anticipates an increase in these sales in 2017, it does not expect this new watch business to increase the Company's profitability in 2017, as the Company expects to continue to invest significant resources in marketing to continue to build customer awareness and further establish product differentiation.
COMPETITION
The global jewelry industry is competitively fragmented. The Company encounters significant competition in all product categories. Some competitors specialize in just one area in which the Company is active. Many competitors have established worldwide, national or local reputations for style, quality, expertise and customer service similar to
TIFFANY & CO.
K-
10
the Company and compete on the basis of that reputation. Certain other jewelers and retailers compete primarily through advertised price promotion. The Company competes on the basis of the Brand's reputation for high-quality products, customer service and distinctive merchandise and does not engage in price promotional advertising.
Competition for engagement jewelry sales is particularly and increasingly intense. The Company's retail price for diamond jewelry reflects the rarity of the stones it offers and the rigid parameters it exercises with respect to the cut, clarity and other diamond quality factors which increase the beauty of the diamonds, but which also increase the Company's cost. The Company competes in this market by emphasizing quality.
SEASONALITY
As a jeweler and specialty retailer, the Company's business is seasonal in nature, with the fourth quarter typically representing approximately one-third of annual net sales and a higher percentage of annual net earnings. Management expects such seasonality to continue.
EMPLOYEES
As of January 31,
2017
, the Company employed an aggregate of approximately
11,900
full-time and part-time persons. Of those employees, approximately 5,200 are employed in the United States.
AVAILABLE INFORMATION
The Company files annual reports on Form 10-K, quarterly reports on Form 10-Q, current reports on Form 8-K, proxy and information statements and amendments to reports filed or furnished pursuant to Sections 13(a), 14 and 15(d) of the Securities Exchange Act of 1934, as amended. The public may read and copy these materials at the SEC's Public Reference Room at 100 F Street, N.E., Washington, D.C. 20549. The public may obtain information on the operation of the public reference room by calling the SEC at 1-800-SEC-0330. The SEC also maintains a website at
www.sec.gov
that contains reports, proxy and information statements and other information regarding Tiffany & Co. and other companies that electronically file materials with the SEC. Copies of the Company's reports on Form 10-K, Forms 10-Q and Forms 8-K may be obtained, free of charge, on the Company's website at
http://investor.tiffany.com/financials.cfm
.
As is the case for any retailer, the Company's success in achieving its objectives and expectations is dependent upon general economic conditions, competitive conditions and consumer attitudes. However, certain factors are specific to the Company and/or the markets in which it operates. The following "risk factors" are specific to the Company; these risk factors affect the likelihood that the Company will achieve the objectives and expectations communicated by management:
(i) Challenging global economic conditions and related low levels of consumer confidence over a prolonged period of time could adversely affect the Company's sales and earnings.
As a retailer of goods which are discretionary purchases, the Company's sales results are particularly sensitive to changes in economic conditions and consumer confidence. Consumer confidence is affected by general business conditions; political uncertainties and/or developments; changes in the market value of equity securities and real estate; inflation; interest rates and the availability of consumer credit; tax rates; and expectations of future economic conditions and employment prospects.
Consumer spending for discretionary goods generally declines during times of falling consumer confidence, which negatively affects the Company's sales and earnings.
TIFFANY & CO.
K-
11
Certain competitors may react to such conditions by reducing retail prices and promoting such reductions; such reductions and/or inventory liquidations can have a short-term adverse effect on the Company's sales, especially given the Company's policy of not engaging in price promotional activity.
The Company has invested in and operates a significant number of stores in Greater China and anticipates continuing to do so. Any slowdown in the Chinese economy could have a negative impact on the sales and profitability of stores in Greater China as well as stores in other markets that serve Chinese tourists.
Uncertainty surrounding the current global economic environment makes it more difficult for the Company to forecast operating results. The Company's forecasts employ the use of estimates and assumptions. Actual results could differ from forecasts, and those differences could be material.
(ii) Sales may decline or remain flat in the Company's fourth fiscal quarter, which includes the Holiday selling season.
The Company's business is seasonal in nature, with the fourth quarter typically representing approximately one-third of annual net sales and a higher percentage of annual net earnings. Poor sales results during the fourth quarter would have an adverse effect on annual earnings and inventories in the short-term.
(iii) The Company conducts operations globally, the risks of which could increase its costs, reduce its profits or disrupt its business.
The Company operates globally and generates a majority of its worldwide net sales outside the United States. It also has both U.S. and foreign manufacturing operations, and relies on certain U.S. and foreign third-party vendors and suppliers. In addition, the Company maintains investments in, and has provided loans to, certain foreign suppliers. As a result, the Company is subject to the risks of doing business globally, including:
|
•
|
the laws, regulations and policies of governments relating to investments, loans and operations, the costs or desirability of complying with local practices and customs and the impact of various anti-corruption and other laws affecting the activities of U.S. companies abroad;
|
|
•
|
uncertainties from changes in U.S. or foreign taxation policies, including, for example, as a result of recent proposals to reform the manner in which the earnings of U.S. multinational corporations are taxed by the U.S. government;
|
|
•
|
compliance by third party vendors and suppliers with the Company’s sourcing and quality standards, codes of conduct, or contractual requirements as well as applicable laws and regulations;
|
|
•
|
import and export licensing requirements and regulations, as well as unforeseen changes in regulatory requirements;
|
|
•
|
political or economic instability in foreign countries, including the potential for rapid and unexpected changes in government, economic and political policies (including diplomatic and trade relations with other countries), political or civil unrest, acts of terrorism or the threat of international boycotts or U.S. anti-boycott legislation – as a result of, for example, (1) the United Kingdom's referendum vote to exit the European Union, as discussed below, or (2) changes in government policies resulting from the recent change in the U.S. Presidential administration;
|
|
•
|
challenges inherent in oversight of foreign operations, systems and controls; for example, in the fourth quarter of 2015, management identified inaccuracies in the Japan segment relating to the timing of recognizing sales and related costs, as well as inventory, at period-ends. Management determined these inaccuracies did not materially affect the Company's annual or quarterly financial statements, including the reported financial information for the Japan segment. However, management has reviewed the processes and personnel involved and completed appropriate remediation activities;
|
|
•
|
potential negative consequences from foreign governments' currency management practices;
|
|
•
|
uncertainties as to enforcement of certain contract and other rights; and
|
|
•
|
inventory risk exposures.
|
In June 2016, voters in the United Kingdom approved an advisory referendum to withdraw from the European Union, commonly referred to as "Brexit." If passed into law, negotiations will commence to determine the United Kingdom's future relationship with the European Union, including terms of trade. Such negotiations will likely be complex and
TIFFANY & CO.
K-
12
protracted, and there can be no assurance regarding the terms or timing of any such arrangements. A withdrawal could significantly disrupt the free movement of goods, services, and people between the United Kingdom and the European Union, and result in increased legal and regulatory complexities, as well as potential higher costs of conducting business in Europe. There may be similar referendums or votes in other European countries in which the Company does business. The uncertainty surrounding the terms of the United Kingdom's withdrawal and its consequences, as well as the impact of any similar circumstances that may arise elsewhere in Europe, could increase the Company's costs and adversely impact consumer and investor confidence, and the level of consumer discretionary purchases, including purchases of the Company’s products.
While these factors and the effect of these factors are difficult to predict, any one or more of them could lower the Company's revenues, increase its costs, reduce its earnings or disrupt its business.
(iv) A strengthening of the U.S. dollar against foreign currencies would negatively affect the Company's sales and profitability.
The Company operates retail stores in more than 20 countries outside of the U.S. and, as a result, is exposed to market risk from fluctuations in foreign currency exchange rates, including, among others, the Japanese Yen, Euro, British Pound, Chinese yuan and the Hong Kong dollar. In
2016
, sales in countries outside of the U.S. in aggregate represented more than half of the Company's net sales and earnings from operations. A continued strengthening of the U.S. dollar against foreign currencies would require the Company to raise its retail prices in order to maintain its worldwide relative pricing structure, or reduce its profit margins in various locations outside of the U.S. Consumers in those markets may not accept significant price increases on the Company's goods; thus, there is a risk that a continued strengthening of the U.S. dollar would result in reduced sales and profitability. In addition, a continued weakening of any foreign currency relative to other currencies may negatively affect spending by foreign tourists in the various regions where the Company operates retail stores which would adversely affect its net sales and profitability.
The reported results of operations of the Company's international subsidiaries are exposed to foreign exchange rate fluctuations as the financial results of the applicable subsidiaries are translated from the local currency into U.S. dollars during the process of financial statement consolidation. If the U.S. dollar continues to strengthen against foreign currencies, the translation of these foreign currency-denominated transactions would decrease consolidated net sales and profitability. See "Item 7. Management's Discussion and Analysis of Financial Condition and Results of Operations." for a discussion of such impacts.
(v) Political activities, regional instability and/or conflict or similar events could disrupt tourist travel and local consumer spending.
Regional and global conflicts or crises, such as military actions, terrorist activities (like those that occurred in several major European cities in 2016 and 2015) and natural disasters, geopolitical or regulatory developments (and any related protests) and other similar events and conditions in the various regions and cities where the Company operates retail stores may negatively affect spending by both foreign tourists and local consumers. The Company's retail stores, many of which are located in major metropolitan areas globally, may in fact have close proximity to the locations of such events – for example, the Company's New York Flagship store is located adjacent to a private residence of the U.S. President which has, at times, impacted consumer access as a result of security measures. The occurrence of the types of events or conditions described above, or the related effect of security measures implemented to address the possibility of such occurrences, could affect consumer traffic and/or spending in one or more of the Company's locations, which could adversely affect the Company's sales and earnings. While sales in the Company's largest store (the New York Flagship) represent less than 10% of worldwide net sales, the impact of significant sales declines in any one store could still be meaningful to consolidated results.
TIFFANY & CO.
K-
13
(vi) Changes in the Company's product or geographic sales mix could affect the Company's profitability.
The Company sells an extensive selection of jewelry and other merchandise at a wide range of retail price points that yield different gross profit margins. Additionally, the Company's geographic regions achieve different operating profit margins due to a variety of factors including product mix, store size and occupancy costs, labor costs, retail pricing and fixed versus variable expenses. The increasing availability of, and ease of access to, retail price information across markets, primarily through the Internet, may affect consumers' decisions regarding in which geographies to shop. If the Company's sales mix were to shift toward products or geographic regions that are significantly different than the Company's plans, it could have an effect, either positively or negatively, on its expected profitability.
(vii) Increases in costs of diamonds and precious metals or reduced supply availability may adversely affect the Company's ability to produce and sell products at desired profit margins.
Most of the Company's jewelry offerings are made with diamonds, gemstones and/or precious metals. A significant increase in the costs or change in the supply of these commodities could adversely affect the Company's business, which is vulnerable to the risks inherent in the trade for such commodities. A substantial increase or decrease in the cost or supply of precious metals and/or high-quality rough and polished diamonds within the quality grades, colors and sizes that customers demand could affect, negatively or positively, customer demand, sales and gross profit margins. Additionally, should synthetic diamonds (diamonds manufactured but not naturally occurring) and/or treated diamonds (naturally occurring diamonds subject to treatment processes, such as irradiation) be offered in significant quantities and gain consumer acceptance, the supply of, demand for and prices for natural diamonds may be affected.
(viii) The Company may be unable to secure and retain sufficient space for its retail stores in prime locations, and maintaining the Company's brand image and desirability to consumers requires significant investment in store construction, maintenance and periodic renovation.
The Company, positioned as a luxury goods retailer, has established its retail presence in choice store locations. Management regularly evaluates opportunities to optimize its retail store base, including potential markets for new TIFFANY & CO. stores, as well as the renovation and relocation of its existing stores. Maintaining the Company's brand image and desirability to consumers requires that stores be constructed and maintained in a manner consistent with that brand image. This requires significant capital investment, including for periodic renovations of existing stores. Renovations of existing stores may also result in temporary disruptions to an individual store's business. For example, the Company has begun the conceptual phase of a multi-year effort to renovate its New York Flagship store, which may result in business and/or consumer traffic disruptions to that store once such renovations begin. If the Company cannot secure and retain store locations on suitable terms in prime and desired luxury shopping locations, or if its investments to construct and/or renovate existing stores do not generate sufficient incremental sales and/or profitability, the Company's sales and/or earnings performance could be jeopardized.
(ix) The value of the TIFFANY & CO. and TIFFANY trademarks could decline due to third-party use and infringement.
The TIFFANY & CO. and TIFFANY trademarks are assets that are essential to the competitiveness and success of the Company's business, and the Company takes appropriate action to protect them. The Company actively pursues those who produce or sell counterfeit TIFFANY & CO. goods through civil action and cooperation with criminal law enforcement agencies. However, use of the designation TIFFANY by third parties on related goods or services and the Company's failure or inability to protect against such use could adversely affect and dilute the value of the TIFFANY & CO. brand.
Notwithstanding the general success of the Company's enforcement actions, such actions have not stopped the imitation and counterfeiting of the Company's merchandise or the infringement of the trademark, and counterfeit TIFFANY & CO. goods remain available in most markets. In recent years, there has been an increase in the availability of counterfeit goods, predominantly silver jewelry, on the Internet and in various markets by street vendors and small retailers. The continued sale of counterfeit merchandise or merchandise that infringes the Company's trademarks could have an adverse effect on the TIFFANY & CO. brand by undermining the Company's reputation for quality goods and making such goods appear less desirable to consumers of luxury goods. Damage to the TIFFANY & CO. brand could result in lost sales and earnings.
TIFFANY & CO.
K-
14
(x) The Company's business is dependent upon the distinctive appeal of the TIFFANY & CO. brand.
The TIFFANY & CO. brand's association with quality and luxury is integral to the success of the Company's business. The Company's expansion plans for retail and direct selling operations and development, production and management support the appeal of the TIFFANY & CO. brand. Consequently, poor maintenance, promotion and positioning of the TIFFANY & CO. brand, as well as market over-saturation, may adversely affect the business by diminishing the distinctive appeal of the TIFFANY & CO. brand and tarnishing its image. This could result in lower sales and earnings.
In addition, adverse publicity regarding TIFFANY & CO. and its products, as well as adverse publicity in respect of, or resulting from, the Company's third-party vendors or the diamond or jewelry industries more generally, could adversely affect the Company’s business. For example, the Company sources from third-party vendors certain products that, from time to time, may not, or may contain raw materials that do not, meet the Company's sourcing and quality standards as well as applicable requirements and regulations. In such instances, although the Company may have recourse against such third-party vendors, the Company may self-report to the relevant regulatory agencies, recall affected products and/or pay potential fines. By way of further example, during the Company's regular internal quality testing, the Company identified a potential breach of the Company's sourcing and quality standards applicable to third party vendors. The Company is currently in the early stages of assessing the composition of certain of its gold products manufactured by certain U.S. third-party vendors, which contain gold solder manufactured by other U.S. vendors, to determine whether such products are in compliance with applicable consumer products requirements and regulations.
Any of the above could harm the TIFFANY & CO. brand and reputation, cause a loss of consumer confidence in the TIFFANY & CO. brand, its products and the industry, and/or negatively affect the Company's results of operations.
The considerable expansion in the use of social media in recent years has compounded the potential scope of any negative publicity.
(xi) A significant data security or privacy breach of the Company's information systems could affect its business.
The protection of customer, employee and Company data is important to the Company, and its customers and employees expect that their personal information will be adequately protected. In addition, the regulatory environment surrounding information security and privacy is becoming increasingly demanding, with evolving requirements in the various jurisdictions in which the Company does business. Although the Company has developed and implemented systems and processes that are designed to protect personal and Company information and prevent data loss and other security breaches, such measures cannot provide absolute security. Additionally, the Company’s increased use and reliance on web-based hosted (i.e., cloud computing) applications and systems for the storage, processing and transmission of information, including customer and employee information, could expose the Company, its employees and its customers to a risk of loss or misuse of such information. The Company’s efforts to protect personal and Company information may also be adversely impacted by data security or privacy breaches that occur at its third-party vendors. While the Company's contractual arrangements with such third-party vendors provide for the protection of Company data, the Company cannot control these vendors or their systems and cannot guarantee that a data security or privacy breach of their systems will not occur in the future. A significant breach of customer, employee or Company data could damage the Company's reputation, its relationship with customers and the TIFFANY & CO. brand and could result in lost sales, sizable fines, significant breach-notification costs and lawsuits as well as adversely affect results of operations. The Company may also incur additional costs in the future related to the implementation of additional security measures to protect against new or enhanced data security and privacy threats, to comply with state, federal and international laws that may be enacted to address those threats or to investigate or address potential or actual data security or privacy breaches.
(xii) Any material disruption of, or a failure to successfully implement or make changes to, information systems could negatively impact the Company's business.
The Company is increasingly dependent on its information systems to operate its business, including in designing, manufacturing, marketing and distributing its products, as well as processing transactions, managing inventory and accounting for and reporting its results. Given the complexity of the Company’s global business, it is critical that the Company maintain the uninterrupted operation of its information systems. Despite the Company’s preventative efforts, its information systems may be vulnerable to damage, disruption or shutdown due to power outages,
TIFFANY & CO.
K-
15
computer and telecommunications failures, computer viruses, security breaches or natural disasters. Damage, disruption or shutdown of the Company’s information systems may require a significant investment to fix or replace them, and the Company could suffer interruptions in its operations in the interim.
In addition, in the ordinary course of business, the Company regularly evaluates and makes changes and upgrades to its information systems. The Company has commenced a multi-year effort to evaluate and, where appropriate, to upgrade and/or replace certain of its information systems, including systems for global customer relationship management, order management and inventory management. These system changes and upgrades can require significant capital investments and dedication of resources. While the Company follows a disciplined methodology when evaluating and making such changes, there can be no assurances that the Company will successfully implement such changes, that such changes will occur without disruptions to its operations or that the new or upgraded systems will achieve the desired business objectives. For example, in 2016 the Company recorded a pre-tax impairment charge of $25.4 million related to software costs capitalized in connection with the development of a new finished goods inventory management and merchandising information system. See "Item 7. Management's Discussion and Analysis of Financial Condition and Results of Operations – Information Systems Assessment" for a discussion of this impairment charge.
Any damage, disruption or shutdown of the Company's information systems, or the failure to successfully implement new or upgraded systems, such as those referenced above, could have a direct material adverse effect on the Company's results of operations, could undermine the Company's ability to execute on its strategic and operational initiatives, and could also affect the Company's reputation, its ability to compete effectively, its relationship with customers and the TIFFANY & CO. brand, which could result in reduced sales and profitability.
(xiii) The loss or a prolonged disruption in the operation of the Company's centralized distribution centers could adversely affect its business and operations.
The Company maintains two separate distribution centers in close proximity to one another in New Jersey. Both are dedicated to warehousing merchandise; one handles worldwide store replenishment and the other processes direct-to-customer orders. Although the Company believes that it has appropriate contingency plans, unforeseen disruptions impacting one or both locations for a prolonged period of time may result in delays in the delivery of merchandise to stores or in fulfilling customer orders.
(xiv) The loss or a prolonged disruption in the operation of the Company's internal manufacturing facilities could adversely affect its business and operations.
The Company's internal manufacturing facilities produce approximately 60% of the merchandise sold by the Company. Any prolonged disruption to their operations would require the Company to seek alternate sources of production and could have a negative effect on inventory availability and sales until such sources are established.
(xv) If diamond mining and exploration companies to which the Company or its subsidiaries have provided financing were to experience financial difficulties, those funds might not be recovered, which would reduce the Company's earnings.
The Company and its subsidiaries may, from time to time, provide financing to diamond mining and exploration companies in order to obtain rights to purchase mining output. Mining operations are inherently risky, and often occur in regions subject to additional political, social and environmental risks. Given these risks, there is no assurance that the diamond mining and exploration companies subject to these arrangements will be able to meet their obligations to the Company under their financing agreements. If a diamond mining or exploration company defaults under its financing agreement, the Company would be required to evaluate whether it should take a period charge in respect of all or a portion of the financing, which would affect the Company's earnings.
For example, in 2016 and 2015, the Company recorded impairment charges, and related valuation allowances, of $4.2 million and $37.9 million, respectively, associated with a $43.8 million financing arrangement with Koidu Limited (previously Koidu Holdings S.A.). See "Item 8. Financial Statements and Supplementary Data – Note J. Commitments and Contingencies" for additional information.
TIFFANY & CO.
K-
16
(xvi) There is no assurance that the Company will be able to effectively and successfully grow its new watch business.
In 2015, management introduced new TIFFANY & CO. brand watches, which have been designed, produced, marketed and distributed through certain of the Company's Swiss subsidiaries. The effective development of this watch business has required and will continue to require additional resources and involves risks and uncertainties, including: (i) significant ongoing expenditures; (ii) the need to employ highly specialized and experienced personnel; (iii) new regulatory requirements; (iv) dependence on relatively small supply partners; and (v) production and distribution inefficiencies. Sales of these new TIFFANY & CO. brand watches represented approximately 1% of worldwide net sales in 2016 and 2015. While management anticipates an increase in these sales in 2017, it does not expect this new watch business to significantly contribute to the Company's profitability in the near term. As with any new business, the Company is competing with businesses with stronger market positions and has invested and will continue to invest significant resources in marketing to build customer awareness and to establish product differentiation. There is, however, no assurance that the Company will be able to effectively grow its new watch business or that such business will be successful in growing the Company's revenues or enhancing its profitability.
(xvii) If the Company is unable to effectively anticipate and respond to changes in consumer preferences and shopping patterns, or introduce new products or marketing programs that appeal to new or existing customers, the Company's sales and profitability could be adversely affected.
The Company's continued success depends on its ability to anticipate and respond in a timely and cost-effective manner to changes in consumer preferences for jewelry and other luxury goods, attitudes towards the global jewelry industry as a whole, as well as the manner and locations in which consumers purchase such goods. The Company recognizes that consumer tastes cannot be predicted with certainty and are subject to change, which is compounded by the expanding use of digital and social media by consumers and the speed by which information and opinions are shared. The Company's product development strategy is to introduce new design collections, primarily jewelry, and/or expand certain existing collections annually. In addition, management intends to continue to invest in marketing and public relations programs designed to build awareness of the Brand, its heritage and its products, as well as to enhance the Brand's association among consumers with quality and luxury. There can be no assurance these strategies will appeal to new or existing customers or will result in increased sales or profitability. Further, if the Company is unable to anticipate and respond in a timely and cost-effective manner to changes in consumer preferences and shopping patterns, the Company’s sales and profitability could be adversely impacted.
In addition, approximately 75% of the Company's stores are located within luxury department stores and shopping malls and benefit from the ability of those locations to generate consumer traffic. A substantial decline in department store and/or mall traffic may negatively impact the Company's ability to maintain or increase its sales in existing stores, as well as its ability to open new stores.
(xviii) The price of the Company's common stock may periodically rise or fall based on the Company's achievement of earnings forecasts and investors' expectations.
The Company's strategic planning process is designed to maximize its long-term strength, growth, and profitability, and not to achieve an earnings target in any particular fiscal period. Management believes that this longer-term focus is in the best interests of the Company and its stockholders. At the same time, however, the Company recognizes that, from time to time, it may be helpful to provide investors with guidance as to management's annual earnings forecast. If, or when, the Company announces actual results that differ from those that have been forecast by management or others, the market price of the Company's common stock could be adversely affected.
The Company periodically returns value to its stockholders through common stock share repurchases and payment of quarterly cash dividends. The market price of the Company's common stock could be adversely affected if the Company’s share repurchase activity and/or cash dividend rate differs from investors' expectations.
(xix) Recent changes in the Company's executive management team may be disruptive to, or cause uncertainty in, its business, results of operations and the price of the Company's common stock.
On February 5, 2017, Frederic Cumenal stepped down from his position as Chief Executive Officer of the Company, and the Company’s Board of Directors appointed Michael J. Kowalski, Chairman of the Board, as the Company’s Interim Chief Executive Officer. The Company's Board of Directors has commenced an external search to recruit a successor with the assistance of a leading executive search firm. In addition to this recent change, certain members
TIFFANY & CO.
K-
17
of the Company's executive management team have left the Company in recent years, which has required the Company to focus time and resources on recruiting the new members of its current executive management team. These changes in the Company's executive management team, may be disruptive to, or cause uncertainty in, the Company's business, and any additional changes to the executive management team could have a negative impact on the Company's ability to manage and grow its business effectively. In addition, if the Company is not effective in succession planning, there may be a negative impact on the Company's ability to successfully hire for key executive management roles, including the Chief Executive Officer position, in a timely manner. Any such disruption or uncertainty or difficulty in efficiently and effectively filling key roles could have a material adverse impact on the Company's results of operations and the price of the Company's common stock.
(xx) Environmental and climate changes could affect the Company's business.
The Company operates retail stores in more than 20 countries and has both domestic and foreign manufacturing operations that are susceptible to the risks associated with climate change, including the potential for more frequent and severe weather events. Such events could result in social, cultural and economic disruptions in these areas, including the disruption of local infrastructure and transportation systems that could limit the ability of the Company's employees and/or its customers to access the Company's stores or manufacturing locations. Despite the fact that the Company is pursuing numerous initiatives to reduce its environmental footprint, including its recent pledge to achieve net-zero greenhouse gas emissions by the year 2050, there remains the risk that insufficient global cooperation could lead to heightened levels of climate change. While the Company has a program for reviewing its vulnerability to the impacts of severe weather events and other risks associated with climate change, these events could nonetheless negatively affect the Company's business and operations.
NONE
The Company leases its various store premises (other than the New York Flagship store, which is owned by the Company) under arrangements that generally range from 3 to 10 years. The following table provides information on the number of locations and square footage of Company-operated TIFFANY & CO. stores as of January 31,
2017
:
|
Total Stores
|
|
Total Gross Retail Square Footage
|
|
Gross Retail Square Footage Range
|
|
Average Gross Retail Square Footage
|
|
|
|
Americas:
|
||||||||
|
New York Flagship
|
1
|
|
45,500
|
|
45,500
|
|
45,500
|
|
|
Other stores
|
124
|
|
676,200
|
|
1,000 - 17,600
|
|
5,500
|
|
|
Asia-Pacific
|
85
|
|
240,600
|
|
400 - 12,800
|
|
2,800
|
|
|
Japan:
|
||||||||
|
Tokyo Ginza
|
1
|
|
13,300
|
|
13,300
|
|
13,300
|
|
|
Other stores
|
54
|
|
140,100
|
|
1,600 - 7,500
|
|
2,600
|
|
|
Europe:
|
||||||||
|
London Old Bond Street
|
1
|
|
22,400
|
|
22,400
|
|
22,400
|
|
|
Other stores
|
42
|
|
135,300
|
|
600 - 9,600
|
|
3,200
|
|
|
Emerging Markets
|
5
|
|
7,900
|
|
400 - 3,600
|
|
1,600
|
|
|
Total
|
313
|
|
1,281,300
|
|
400 - 45,500
|
|
4,100
|
|
TIFFANY & CO.
K-
18
NEW YORK FLAGSHIP STORE
The Company owns the building, but not the air rights above the building, housing its New York Flagship store at 727 Fifth Avenue, which was designed to be a retail store for Tiffany and is well located for this function. Approximately 45,500 gross square feet of this 124,000 square foot building are devoted to retail sales, with the balance devoted to administrative offices, certain product services, jewelry manufacturing and storage. The New York Flagship store is also the focal point for marketing and public relations efforts. Sales in this store represent less than 10% of worldwide net sales.
RETAIL SERVICE CENTER
The Company's Retail Service Center ("RSC"), located in Parsippany, New Jersey, comprises approximately 370,000 square feet. Approximately half of the building is devoted to office and information technology operations and half to warehousing, shipping, receiving, merchandise processing and other distribution functions. The RSC receives merchandise and replenishes retail stores. The Company has a 20-year lease for this facility, which expires in 2025, and has two 10-year renewal options.
CUSTOMER FULFILLMENT CENTER
The Company owns the Customer Fulfillment Center ("CFC") in Whippany, New Jersey and leases the land on which the facility resides. The CFC is approximately 266,000 square feet and is primarily used for warehousing merchandise and processing direct-to-customer orders. The land lease expires in 2032 and the Company has the right to renew the lease for an additional 20-year term.
MANUFACTURING FACILITIES
The Company owns and operates jewelry manufacturing facilities in Cumberland, Rhode Island and Lexington, Kentucky, and leases a jewelry manufacturing facility in Pelham, New York as well as a facility in the Dominican Republic which performs certain functions such as jewelry polishing. Lease expiration dates range from 2019 to 2023. The owned and leased facilities total approximately 225,000 square feet.
The Company leases a facility in Belgium and owns facilities in Botswana, Cambodia, Mauritius and Vietnam (although the land in Botswana, Cambodia and Vietnam is leased) that prepare, cut and/or polish rough diamonds for use by Tiffany. These facilities total approximately 280,000 square feet and the lease expiration dates range from 2021 to 2062.
Arbitration Award.
On December 21, 2013, an award was issued (the "Arbitration Award") in favor of The Swatch Group Ltd. ("Swatch") and its wholly owned subsidiary Tiffany Watch Co. ("Watch Company"; Swatch and Watch Company, together, the "Swatch Parties") in an arbitration proceeding (the "Arbitration") between the Registrant and its wholly owned subsidiaries, Tiffany and Company and Tiffany (NJ) Inc. (the Registrant and such subsidiaries, together, the "Tiffany Parties") and the Swatch Parties.
The Arbitration was initiated in June 2011 by the Swatch Parties, who sought damages for alleged breach of agreements entered into by and among the Swatch Parties and the Tiffany Parties in December 2007 (the "Agreements"). The Agreements pertained to the development and commercialization of a watch business and, among other things, contained various licensing and governance provisions and approval requirements relating to business, marketing and branding plans and provisions allocating profits relating to sales of the watch business between the Swatch Parties and the Tiffany Parties.
In general terms, the Swatch Parties alleged that the Tiffany Parties breached the Agreements by obstructing and delaying development of Watch Company’s business and otherwise failing to proceed in good faith. The Swatch Parties sought damages based on alternate theories ranging from CHF 73.0 million (or approximately
$73.0 million
at January 31,
2017
) (based on its alleged wasted investment) to CHF 3.8 billion (or approximately
$3.8 billion
at January 31,
2017
) (calculated based on alleged future lost profits of the Swatch Parties and their affiliates over the entire term of the Agreements).
TIFFANY & CO.
K-
19
The Registrant believes that the claims of the Swatch Parties are without merit. In the Arbitration, the Tiffany Parties defended against the Swatch Parties’ claims vigorously, disputing both the merits of the claims and the calculation of the alleged damages. The Tiffany Parties also asserted counterclaims for damages attributable to breach by the Swatch Parties, stemming from the Swatch Parties’ September 12, 2011 public issuance of a Notice of Termination purporting to terminate the Agreements due to alleged material breach by the Tiffany Parties, and for termination due to such breach. In general terms, the Tiffany Parties alleged that the Swatch Parties did not have grounds for termination, failed to meet the high standard for proving material breach set forth in the Agreements and failed to provide appropriate management, distribution, marketing and other resources for TIFFANY & CO. brand watches and to honor their contractual obligations to the Tiffany Parties regarding brand management. The Tiffany Parties’ counterclaims sought damages based on alternate theories ranging from CHF 120.0 million (or approximately
$121.0 million
at January 31,
2017
) (based on its wasted investment) to approximately CHF 540.0 million (or approximately
$542.0 million
at January 31,
2017
) (calculated based on alleged future lost profits of the Tiffany Parties).
The Arbitration hearing was held in October 2012 before a three-member arbitral panel convened in the Netherlands pursuant to the Arbitration Rules of the Netherlands Arbitration Institute (the "Rules"), and the Arbitration record was completed in February 2013.
Under the terms of the Arbitration Award, and at the request of the Swatch Parties and the Tiffany Parties, the Agreements were deemed terminated. The Arbitration Award stated that the effective date of termination was March 1, 2013. Pursuant to the Arbitration Award, the Tiffany Parties were ordered to pay the Swatch Parties damages of CHF 402.7 million (the "Arbitration Damages"), as well as interest from June 30, 2012 to the date of payment, two-thirds of the cost of the Arbitration and two-thirds of the Swatch Parties' legal fees, expenses and costs. These amounts were paid in full in January 2014.
Prior to the ruling of the arbitral panel, no accrual was established in the Company's consolidated financial statements because management did not believe the likelihood of an award of damages to the Swatch Parties was probable. As a result of the ruling, in the fourth quarter of 2013, the Company recorded a charge of $480.2 million, which included the damages, interest, and other costs associated with the ruling and which was classified as Arbitration award expense in the consolidated statement of earnings.
On March 31, 2014, the Tiffany Parties took action in the District Court of Amsterdam to annul the Arbitration Award. Generally, arbitration awards are final; however, Dutch law does provide for limited grounds on which arbitral awards may be set aside. The Tiffany Parties petitioned to annul the Arbitration Award on these statutory grounds. These grounds include, for example, that the arbitral tribunal violated its mandate by changing the express terms of the Agreements.
A three-judge panel presided over the annulment hearing on January 19, 2015, and, on March 4, 2015, issued a decision in favor of the Tiffany Parties. Under this decision, the Arbitration Award is set aside. However, the Swatch Parties took action in the Dutch courts to appeal the District Court's decision, and a three-judge panel presided over an appellate hearing in respect of the annulment, and the related claim by the Tiffany Parties for return of the Arbitration Damages and related costs, on June 29, 2016. That panel's decision, which may be appealed to the Supreme Court of the Netherlands, is pending. As a result of this ongoing appellate process, the Arbitration Award may ultimately be upheld by the courts of the Netherlands. Registrant’s management expects that the annulment action is not likely to be ultimately resolved until, at the earliest, Registrant's fiscal year ending January 31, 2018.
If the Arbitration Award is finally annulled, management anticipates that the claims and counterclaims that formed the basis of the Arbitration, and potentially additional claims and counterclaims, will be litigated in court proceedings between and among the Swatch Parties and the Tiffany Parties. The identity and location of the courts that would hear such actions have not been determined at this time.
In any litigation regarding the claims and counterclaims that formed the basis of the arbitration, issues of liability and damages will be pled and determined without regard to the findings of the arbitral panel. As such, it is possible that the court could find that the Swatch Parties were in material breach of their obligations under the Agreements, that the Tiffany Parties were in material breach of their obligations under the Agreements or that neither the Swatch Parties nor the Tiffany Parties were in material breach. If the Swatch Parties’ claims of liability were accepted by the court, the damages award cannot be reasonably estimated at this time, but could exceed the Arbitration Damages and could have a material adverse effect on the Registrant’s consolidated financial statements or liquidity.
TIFFANY & CO.
K-
20
Although the District Court issued a decision in favor of the Tiffany Parties, an amount will only be recorded for any return of amounts paid under the Arbitration Award when the District’s Court decision is final (i.e., after all rights of appeal have been exhausted) and return of these amounts is deemed probable and collection is reasonably assured. As such, the Company has not recorded any amounts in its consolidated financial statements related to the District Court’s decision.
Additionally, management has not established any accrual in the Company's consolidated financial statements for the year ended January 31,
2017
related to the annulment process or any potential subsequent litigation because it does not believe that the final annulment of the Arbitration Award and a subsequent award of damages exceeding the Arbitration Damages is probable.
Royalties payable to the Tiffany Parties by Watch Company under the Agreements and sales of watches manufactured by Watch Company and sold in TIFFANY & CO. stores were not significant in any year.
In 2015, management introduced new TIFFANY & CO. brand watches, which have been designed, produced, marketed and distributed through certain of the Company's Swiss subsidiaries. The effective development and growth of this watch business has required and will continue to require additional resources and involves risks and uncertainties.
Other Matters.
The Company is from time to time involved in routine litigation incidental to the conduct of its business, including proceedings to protect its trademark rights, litigation with parties claiming infringement of patents and other intellectual property rights by the Company, litigation instituted by persons alleged to have been injured upon premises under the Company's control and litigation with present and former employees and customers. Although litigation with present and former employees is routine and incidental to the conduct of the Company's business, as well as for any business employing significant numbers of employees, such litigation can result in large monetary awards when a civil jury is allowed to determine compensatory and/or punitive damages for actions claiming discrimination on the basis of age, gender, race, religion, disability or other legally protected characteristic or for termination of employment that is wrongful or in violation of implied contracts. However, the Company believes that all such litigation currently pending to which it is a party or to which its properties are subject will be resolved without any material adverse effect on the Company's financial position, earnings or cash flows.
Gain Contingency.
On February 14, 2013, Tiffany and Company and Tiffany (NJ) LLC (collectively, the "Tiffany plaintiffs") initiated a lawsuit against Costco Wholesale Corp. ("Costco") for trademark infringement, false designation of origin and unfair competition, trademark dilution and trademark counterfeiting (the "Costco Litigation"). The Tiffany plaintiffs sought injunctive relief, monetary recovery and statutory damages on account of Costco's use of "Tiffany" on signs in the jewelry cases at Costco stores used to describe certain diamond engagement rings that were not manufactured by Tiffany. Costco filed a counterclaim arguing that the TIFFANY trademark was a generic term for multi-pronged ring settings and seeking to have the trademark invalidated, modified or partially canceled in that respect. On September 8, 2015, the U.S. District Court for the Southern District of New York (the "Court") granted the Tiffany plaintiffs' motion for summary judgment of liability in its entirety, dismissing Costco's genericism counterclaim and finding that Costco was liable for trademark infringement, trademark counterfeiting and unfair competition under New York law in its use of "Tiffany" on the above-referenced signs. On September 29, 2016, a civil jury rendered its verdict, finding that Costco's profits on the sale of the infringing rings should be awarded at $5.5 million, and further finding that an award of punitive damages was warranted. On October 5, 2016, the jury awarded $8.25 million in punitive damages. The aggregate award of $13.75 million is not final, and is subject to post-verdict motion practice and ultimately to adjustment by the Court. In such post-verdict motion practice, the Tiffany plaintiffs asserted that the profits award should be trebled and that Costco should also pay the Tiffany plaintiffs' legal fees in respect of this matter. Management expects that the Court will enter its final judgment as to the damages and other monetary recovery that Costco will be ordered to pay to the Tiffany plaintiffs during the Company's 2017 fiscal year. Management also expects that Costco will appeal this judgment, and that the Tiffany plaintiffs will be unable to enforce the judgment while the appeal is pending. As such, the Company has not recorded any amount in its consolidated financial statements related to this gain contingency as of January 31, 2017, and expects that this matter will not ultimately be resolved until, at the earliest, the Company's fiscal year ending January 31, 2018.
Not Applicable.
TIFFANY & CO.
K-
21
In calculating the aggregate market value of the voting stock held by non-affiliates of the Company shown on the cover page of this Annual Report on Form 10-K, 860,775 shares of Common Stock beneficially owned by the executive officers and directors of the Company (exclusive of shares which may be acquired on exercise of employee stock options) were excluded, on the assumption that certain of those persons could be considered "affiliates" under the provisions of Rule 405 promulgated under the Securities Act of 1933, as amended.
Performance of Company Stock
The Registrant's Common Stock is traded on the New York Stock Exchange. In consolidated trading, the high and low selling prices per share for shares of such Common Stock for
2016
were:
|
High
|
|
Low
|
|
|
|
First Quarter
|
$ 74.06
|
|
$ 59.75
|
|
|
Second Quarter
|
$ 72.18
|
|
$ 56.99
|
|
|
Third Quarter
|
$ 74.81
|
|
$ 58.77
|
|
|
Fourth Quarter
|
$ 85.44
|
|
$ 71.86
|
|
On March 13,
2017
, the high and low selling prices quoted on such exchange were $88.93 and $88.29. On March 13,
2017
, there were 14,241 holders of record of the Registrant's Common Stock.
In consolidated trading, the high and low selling prices per share for shares of such Common Stock for
2015
were:
|
High
|
|
Low
|
|
|
|
First Quarter
|
$ 90.83
|
|
$ 82.64
|
|
|
Second Quarter
|
$ 96.33
|
|
$ 84.83
|
|
|
Third Quarter
|
$ 96.43
|
|
$ 74.28
|
|
|
Fourth Quarter
|
$ 84.19
|
|
$ 59.73
|
|
The following graph compares changes in the cumulative total shareholder return on the Company’s stock for the previous five fiscal years to returns for the same five-year period on (i) the Standard & Poor’s 500 Stock Index and (ii) the Standard & Poor’s 500 Consumer Discretionary Index. Cumulative shareholder return is defined as changes in the closing price of the stock on the New York Stock Exchange, plus the reinvestment of any dividends paid on the stock. The graph assumes an investment of $100 on January 31, 2012 in the Company's common stock and in each of the two indices as well as the reinvestment of any subsequent dividends.
TIFFANY & CO.
K-
22
Total returns are based on market capitalization; indices are weighted at the beginning of each period for which a return is indicated. The stock performance shown in the graph is not intended to forecast or be indicative of future performance.
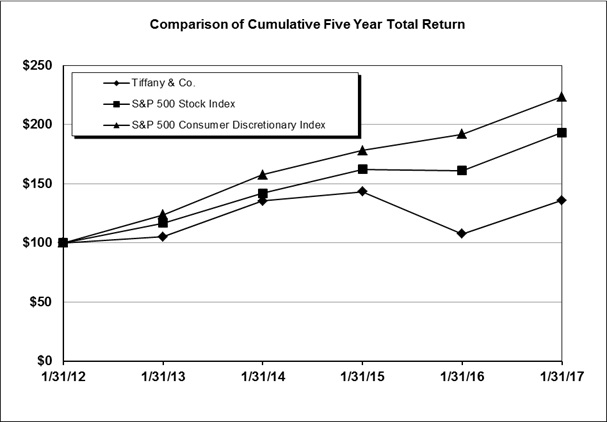
|
1/31/12
|
|
1/31/13
|
|
1/31/14
|
|
1/31/15
|
|
1/31/16
|
|
1/31/17
|
|
|
|
Tiffany & Co.
|
$ 100.00
|
|
$ 105.24
|
|
$ 135.48
|
|
$ 143.26
|
|
$ 107.59
|
|
$ 136.00
|
|
|
S&P 500 Stock Index
|
100.00
|
|
116.78
|
|
141.91
|
|
162.09
|
|
161.01
|
|
193.28
|
|
|
S&P 500 Consumer Discretionary Index
|
100.00
|
|
123.67
|
|
157.51
|
|
178.00
|
|
191.84
|
|
223.45
|
|
Dividends
It is the Company's policy to pay a quarterly dividend on its Common Stock, subject to declaration by its Board of Directors. In 2015, a dividend of $0.38 per share of Common Stock was paid on April 10, 2015. On May 28, 2015, the Company announced a 5% increase in its regular quarterly dividend rate to a new rate of $0.40 per share of Common Stock which was paid on July 10, 2015, October 13, 2015 and January 11, 2016.
In
2016
, a dividend of $0.40 per share of Common Stock was paid on April 11,
2016
. On May 26,
2016
, the Company announced a 12.5% increase in its regular quarterly dividend rate to a new rate of $0.45 per share of Common Stock which was paid on July 11,
2016
, October 11,
2016
and January 10,
2017
.
TIFFANY & CO.
K-
23
Issuer Purchases of Equity Securities
In January 2016, the Registrant's Board of Directors approved the termination of the Company's then-existing share repurchase program, which was approved in March 2014 and had authorized the Company to repurchase up to
$300.0
million of its Common Stock through open market transactions (the "2014 Program"), in favor of a new share repurchase program ("2016 Program"). The 2016 Program, which will expire on January 31, 2019, authorizes the Company to repurchase up to
$500.0
million of its Common Stock through open market transactions, block trades or privately negotiated transactions. Purchases under the 2014 Program were, and purchases under the 2016 Program have been, executed under a written plan for trading securities as specified under Rule 10b5-1 promulgated under the Securities and Exchange Act of 1934, as amended, the terms of which are within the Company's discretion, subject to applicable securities laws, and are based on market conditions and the Company's liquidity needs. Approximately
$310.4
million remained available for repurchase under the 2016 Program at
January 31, 2017
.
The following table contains the Company's purchases of equity securities in the fourth quarter of
2016
:
|
Period
|
(a) Total Number of Shares (or Units) Purchased
|
|
(b) Average Price Paid per Share (or Unit)
|
|
(c) Total Number of Shares (or Units) Purchased as Part of Publicly Announced Plans or Programs
|
|
(d) Maximum Number (or Approximate Dollar Value) of Shares (or Units) that May Yet Be Purchased Under the Plans or Programs
(in millions)
|
|
|
November 1, 2016 to November 30, 2016
|
39,480
|
|
$ 73.10
|
|
39,480
|
|
$ 310.4
|
|
|
December 1, 2016 to December 31, 2016
|
—
|
|
$ —
|
|
—
|
|
$ 310.4
|
|
|
January 1, 2017 to January 31, 2017
|
—
|
|
$ —
|
|
—
|
|
$ 310.4
|
|
|
TOTAL
|
39,480
|
|
$ 73.10
|
|
39,480
|
|
$ 310.4
|
|
TIFFANY & CO.
K-
24
The following table sets forth selected financial data, certain of which have been derived from the Company's consolidated financial statements for fiscal years
2012
-
2016
, which ended on January 31 of the following calendar year:
|
(in millions, except per share amounts, percentages, ratios, stores and employees)
|
2016
a
|
|
2015
b
|
|
2014
c
|
|
2013
d
|
|
2012
|
|
|||||
|
EARNINGS DATA
|
|||||||||||||||
|
Net sales
|
$
|
4,001.8
|
|
$
|
4,104.9
|
|
$
|
4,249.9
|
|
$
|
4,031.1
|
|
$
|
3,794.2
|
|
|
Gross profit
|
2,490.3
|
|
2,491.3
|
|
2,537.2
|
|
2,340.4
|
|
2,163.3
|
|
|||||
|
Selling, general & administrative expenses
|
1,769.1
|
|
1,731.2
|
|
1,645.8
|
|
1,555.9
|
|
1,466.1
|
|
|||||
|
Net earnings
|
446.1
|
|
463.9
|
|
484.2
|
|
181.4
|
|
416.2
|
|
|||||
|
Net earnings per diluted share
|
3.55
|
|
3.59
|
|
3.73
|
|
1.41
|
|
3.25
|
|
|||||
|
Weighted-average number of diluted common shares
|
125.5
|
|
129.1
|
|
129.9
|
|
128.9
|
|
127.9
|
|
|||||
|
BALANCE SHEET AND CASH FLOW DATA
|
|||||||||||||||
|
Total assets *
|
$
|
5,097.6
|
|
$
|
5,121.6
|
|
$
|
5,171.8
|
|
$
|
4,745.1
|
|
$
|
4,628.9
|
|
|
Cash and cash equivalents
|
928.0
|
|
843.6
|
|
730.0
|
|
345.8
|
|
504.8
|
|
|||||
|
Inventories, net
|
2,157.6
|
|
2,225.0
|
|
2,362.1
|
|
2,326.6
|
|
2,234.3
|
|
|||||
|
Short-term borrowings and long-term debt (including current portion) *
|
1,107.1
|
|
1,095.8
|
|
1,107.8
|
|
996.3
|
|
957.4
|
|
|||||
|
Stockholders' equity
|
3,028.4
|
|
2,929.5
|
|
2,850.7
|
|
2,734.0
|
|
2,611.3
|
|
|||||
|
Working capital
|
2,940.8
|
|
2,778.5
|
|
2,850.8
|
|
2,431.1
|
|
2,485.4
|
|
|||||
|
Cash flows from operating activities
|
702.1
|
|
813.6
|
|
615.1
|
|
154.7
|
|
328.3
|
|
|||||
|
Capital expenditures
|
222.8
|
|
252.7
|
|
247.4
|
|
221.4
|
|
219.5
|
|
|||||
|
Stockholders' equity per share
|
24.33
|
|
23.10
|
|
22.04
|
|
21.31
|
|
20.57
|
|
|||||
|
Cash dividends paid per share
|
1.75
|
|
1.58
|
|
1.48
|
|
1.34
|
|
1.25
|
|
|||||
|
RATIO ANALYSIS AND OTHER DATA
|
|||||||||||||||
|
As a percentage of net sales:
|
|||||||||||||||
|
Gross profit
|
62.2
|
%
|
60.7
|
%
|
59.7
|
%
|
58.1
|
%
|
57.0
|
%
|
|||||
|
Selling, general & administrative expenses
|
44.2
|
%
|
42.2
|
%
|
38.7
|
%
|
38.6
|
%
|
38.6
|
%
|
|||||
|
Earnings from operations
|
18.0
|
%
|
18.5
|
%
|
21.0
|
%
|
7.5
|
%
|
18.4
|
%
|
|||||
|
Net earnings
|
11.1
|
%
|
11.3
|
%
|
11.4
|
%
|
4.5
|
%
|
11.0
|
%
|
|||||
|
Capital expenditures
|
5.6
|
%
|
6.2
|
%
|
5.8
|
%
|
5.5
|
%
|
5.8
|
%
|
|||||
|
Return on average assets *
|
8.7
|
%
|
9.0
|
%
|
9.8
|
%
|
3.9
|
%
|
9.5
|
%
|
|||||
|
Return on average stockholders' equity
|
15.0
|
%
|
16.1
|
%
|
17.3
|
%
|
6.8
|
%
|
16.8
|
%
|
|||||
|
Total debt-to-equity ratio *
|
36.6
|
%
|
37.4
|
%
|
38.9
|
%
|
36.4
|
%
|
36.7
|
%
|
|||||
|
Dividends as a percentage of net earnings
|
49.0
|
%
|
43.8
|
%
|
39.5
|
%
|
93.9
|
%
|
38.1
|
%
|
|||||
|
Company-operated TIFFANY & CO. stores
|
313
|
|
307
|
|
295
|
|
289
|
|
275
|
|
|||||
|
Number of employees
|
11,900
|
|
12,200
|
|
12,000
|
|
10,600
|
|
9,900
|
|
|||||
|
*
|
The Company adopted ASU No. 2015-03 –
Simplifying the Presentation of Debt Issuance Costs
retrospectively as of February 1, 2016. Accordingly, debt issuance costs were reclassified from an asset to a direct deduction from long-term debt in each of the years presented. See "Item 8. Financial Statements and Supplementary Data - Note B. Summary of Significant Accounting Policies" for additional information.
|
TIFFANY & CO.
K-
25
NOTES TO SELECTED FINANCIAL DATA
|
a.
|
Financial information and ratios for 2016 include the following amounts, totaling $38.0 million of pre-tax expense ($24.0 million net after tax expense, or $0.19 per diluted share):
|
|
•
|
$25.4 million of net pre-tax expense ($16.0 million net after tax expense, or $0.13 per diluted share) associated with an asset impairment charge related to software costs capitalized in connection with the development of a new finished goods inventory management and merchandising information system. See "Item 8. Financial Statements and Supplementary Data - Note B. Summary of Significant Accounting Policies" and "Note E. Property, Plant and Equipment" for additional information; and
|
|
•
|
$12.6 million of net pre-tax expense ($8.0 million net after tax expense, or $0.06 per diluted share) associated with impairment charges related to financing arrangements with diamond mining and exploration companies. See "Item 8. Financial Statements and Supplementary Data - Note B. Summary of Significant Accounting Policies" for additional information.
|
|
b.
|
Financial information and ratios for 2015 include the following amounts, totaling $46.7 million of net pre-tax expense ($29.9 million net after tax expense, or $0.24 per diluted share):
|
|
•
|
$37.9 million of net pre-tax expense ($24.3 million net after tax expense, or $0.19 per diluted share) associated with impairment charges related to a financing arrangement with Koidu Limited. See "Item 8. Financial Statements and Supplementary Data - Note J. Commitments and Contingencies" for additional information; and
|
|
•
|
$8.8 million of net pre-tax expense ($5.6 million net after tax expense, or $0.05 per diluted share) associated with severance related to staffing reductions and subleasing of certain office space for which only a portion of the Company's future rent obligations will be recovered.
|
|
c.
|
Financial information and ratios for 2014 include $93.8 million of net pre-tax expense ($60.9 million net after tax expense, or $0.47 per diluted share) associated with the redemption of $400.0 million in aggregate principal amount of certain senior notes prior to their scheduled maturities. See "Item 8. Financial Statements and Supplementary Data - Note G. Debt" for additional information.
|
|
d.
|
Financial information and ratios for 2013 include the following amounts, totaling $482.1 million of net pre-tax expense ($299.2 million net after-tax expense, or $2.32 per diluted share):
|
|
•
|
$480.2 million pre-tax expense associated with the Swatch arbitration award and $7.5 million pre-tax income associated with a foreign currency transaction gain on this expense. See "Item 8. Financial Statements and Supplementary Data - Note J. Commitments and Contingencies" for additional information regarding the arbitration proceeding; and
|
|
•
|
$9.4 million pre-tax expense associated with severance related to staffing reductions and subleasing of certain office space for which only a portion of the Company's future rent obligations will be recovered.
|
TIFFANY & CO.
K-
26
The following discussion and analysis should be read in conjunction with the Company's consolidated financial statements and related notes. All references to years relate to fiscal years which ended on January 31 of the following calendar year.
KEY STRATEGIES
The Company's key strategies are:
|
•
|
To enhance the customer experience through engaging service and store environments.
|
To ensure a superior shopping experience, the Company employs highly qualified sales and customer service professionals, focuses on enhancing sales and product training programs, and is investing in enhancing its information systems for customer relationship management. The Company also focuses on enhancing the design of its stores, as well as the creative visual presentation of its merchandise, to provide an engaging luxury experience in both its new and existing stores.
|
•
|
To regularly develop and introduce new products.
|
The Company's product development strategy is to introduce new design collections, primarily in jewelry, and/or expand certain existing collections annually, both of which are intended to appeal to the Company’s existing customer base as well as to new customers. The Company is also investing in the watch category, which it deems appropriate for the Brand and which presents an incremental long-term growth opportunity.
|
•
|
To enhance customer awareness of the TIFFANY & CO. trademark (the "Brand"), its heritage, its products and its association with quality and luxury.
|
The Brand is the single most important asset of Tiffany and, indirectly, of the Company. Management intends to continue to invest in marketing and public relations programs designed to build awareness of the Brand, its heritage and its products, as well as to enhance the Brand’s association among consumers with quality and luxury. Management monitors these efforts and the strength of the Brand through market research.
|
•
|
To expand and optimize its global distribution base.
|
Management intends to continue to expand and optimize its global store base by evaluating potential markets for new TIFFANY & CO. stores, as well as through the renovation, relocation, or, in certain cases, the closure of existing stores. Management will also continue to pursue opportunities to grow sales through its e-commerce websites and utilize the websites to drive store traffic. Management recognizes that over-saturation of any market could diminish the distinctive appeal of the Brand, but believes that there are a number of potential worldwide locations remaining that meet financial and Brand requirements.
|
•
|
To improve its business operations and processes, while efficiently managing its capital and costs
|
The Company is focused on improving its business operations and processes, including by realizing greater efficiencies in its product supply chain and other operations, and enhancing its global procurement capabilities.
|
•
|
To maintain substantial control over product supply through direct diamond sourcing and internal jewelry manufacturing.
|
The Company has developed substantial product supply infrastructure related to the procurement and processing of diamonds and to the manufacturing of jewelry. This infrastructure is intended to ensure adequate product supply and favorable product costs while adhering to the Company's quality and ethical standards. The Company will continue to supplement its internal capabilities through its network of external suppliers.
TIFFANY & CO.
K-
27
Through the efforts above, management is committed to the following long-term financial objectives:
|
•
|
To achieve improved operating margins, through both improved gross margin and efficient expense management.
|
Management's long-term objective is to improve gross margin, including through controlling product input costs, realizing greater efficiencies in its product supply chain and adjusting retail prices when appropriate. Additionally, management is focused on efficient selling, general and administrative expense management, thereby generating sales leverage on fixed costs. These efforts are collectively intended to generate a higher rate of operating earnings growth relative to sales growth, and management targets an improvement in operating margin of 50 basis points per year over the long term.
|
•
|
To increase store productivity and profitability.
|
Management is focused on increasing the frequency of store visits and the percentage of store visitors who make a purchase, as well as optimal utilization of square footage, to grow sales and sales per square foot.
|
•
|
To improve inventory and other asset productivity and cash flow.
|
Management's long-term objective is to maintain inventory growth at a rate less than sales growth, with greater focus on efficiencies in product sourcing and manufacturing as well as optimizing store inventory levels, all of which is intended to contribute to improvements in cash flow and return on assets.
|
•
|
To maintain a capital structure that provides financial strength and the ability to invest in strategic initiatives, while also allowing for the return of excess capital to shareholders.
|
2016
SUMMARY
|
•
|
Worldwide net sales decreased
3%
to
$4.0 billion
reflecting declines in the Americas and Europe partly offset by an increase in Japan and unchanged sales in Asia-Pacific, and comparable store sales decreased
5%
due to declines in all regions except Japan. On a constant-exchange-rate basis (see "Non-GAAP Measures"), worldwide net sales decreased
3%
and comparable store sales decreased
5%
reflecting similar trends.
|
|
•
|
The Company added a net of 6 TIFFANY & CO. stores (opening seven in Asia-Pacific, three in Europe and one in the Americas, while closing three in Asia-Pacific and one each in Japan and Europe and relocating 5 stores) resulting in a 3% net increase in gross retail square footage.
|
|
•
|
The Company expanded its offerings within several existing jewelry collections, including its TIFFANY T and RETURN TO TIFFANY
®
LOVE collections, and introduced new watch designs.
|
|
•
|
Earnings from operations as a percentage of net sales ("operating margin") decreased 0.5 percentage point. Excluding impairment charges recorded in 2016 and 2015 (see "Non-GAAP Measures"), operating margin decreased 0.7 percentage point. An improvement in gross margin was more than offset by a lack of sales leverage on selling, general and administrative ("SG&A") expenses.
|
|
•
|
Net earnings decreased 4% to
$446.1 million
, or
$3.55
per diluted share. Net earnings in 2016 included impairment charges of $0.19 per diluted share (see "Non-GAAP Measures") and an income tax benefit of $0.05 per diluted share (as a result of the conclusion of a tax examination). Net earnings in 2015 included charges of $0.24 per diluted share (see "Non-GAAP Measures"). Excluding these charges, net earnings per diluted share declined 2% to $3.75.
|
|
•
|
Inventories, net decreased
3%
.
|
|
•
|
Cash flow from operating activities of
$702.1 million
in
2016
, compared with
$813.6 million
in
2015
. Free cash flow (see "Non-GAAP Measures") of
$479.3 million
in
2016
, compared with
$560.9 million
in
2015
. Cash flow from operating activities and free cash flow in 2016 include a voluntary cash contribution of
|
TIFFANY & CO.
K-
28
$120.0 million made by the Company to its U.S. pension plan (See "Item 8. Financial Statements and Supplementary Data - Note N. Employee Benefit Plans").
|
•
|
The Company returned cash to shareholders by continuing to pay regular quarterly dividends (which were increased 12.5% effective July 2016 to $0.45 per share, or an annualized rate of $1.80 per share) and spending $183.6 million to repurchase 2.8 million shares of its Common Stock.
|
RESULTS OF OPERATIONS
Non-GAAP Measures
The Company reports information in accordance with U.S. Generally Accepted Accounting Principles ("GAAP"). Internally, management also monitors and measures its performance using certain sales and earnings measures that include or exclude amounts, or are subject to adjustments that have the effect of including or excluding amounts, from the most directly comparable GAAP measure ("non-GAAP financial measures"). The Company presents such non-GAAP financial measures in reporting its financial results to provide investors with useful supplemental information that will allow them to evaluate the Company's operating results using the same measures that management uses to monitor and measure its performance. The Company's management does not, nor does it suggest that investors should, consider non-GAAP financial measures in isolation from, or as a substitute for, financial information prepared in accordance with GAAP. These non-GAAP financial measures presented here may not be comparable to similarly-titled measures used by other companies.
Net Sales
. The Company's reported net sales reflect either a translation-related benefit from strengthening foreign currencies or a detriment from a strengthening U.S. dollar. Internally, management monitors and measures its sales performance on a non-GAAP basis that eliminates the positive or negative effects that result from translating sales made outside the U.S. into U.S. dollars ("constant-exchange-rate basis"). Sales on a constant-exchange-rate basis are calculated by taking the current year's sales in local currencies and translating them into U.S. dollars using the prior year's foreign exchange rates. Management believes this constant-exchange-rate basis provides a useful supplemental basis for the assessment of sales performance and of comparability between reporting periods. The following table reconciles the sales percentage increases (decreases) from the GAAP to the non-GAAP basis versus the previous year:
|
|
2016
|
2015
|
|||||||||||||||
|
|
GAAP
Reported
|
|
Translation
Effect
|
|
Constant-
Exchange-
Rate Basis
|
|
GAAP
Reported
|
|
Translation
Effect
|
|
Constant-
Exchange-
Rate Basis
|
|
|||||
|
Net Sales:
|
|||||||||||||||||
|
Worldwide
|
(3
|
)%
|
—
|
%
|
(3
|
)%
|
(3
|
)%
|
(5
|
)%
|
2
|
%
|
|||||
|
Americas
|
(5
|
)
|
—
|
|
(5
|
)
|
(4
|
)
|
(2
|
)
|
(2
|
)
|
|||||
|
Asia-Pacific
|
—
|
|
(1
|
)
|
1
|
|
(2
|
)
|
(5
|
)
|
3
|
|
|||||
|
Japan
|
12
|
|
12
|
|
—
|
|
(2
|
)
|
(12
|
)
|
10
|
|
|||||
|
Europe
|
(10
|
)
|
(7
|
)
|
(3
|
)
|
(1
|
)
|
(13
|
)
|
12
|
|
|||||
|
Other
|
(8
|
)
|
—
|
|
(8
|
)
|
(13
|
)
|
—
|
|
(13
|
)
|
|||||
|
Comparable Store Sales:
|
|||||||||||||||||
|
Worldwide
|
(5
|
)%
|
—
|
%
|
(5
|
)%
|
(6
|
)%
|
(6
|
)%
|
—
|
%
|
|||||
|
Americas
|
(6
|
)
|
(1
|
)
|
(5
|
)
|
(6
|
)
|
(2
|
)
|
(4
|
)
|
|||||
|
Asia-Pacific
|
(9
|
)
|
(2
|
)
|
(7
|
)
|
(5
|
)
|
(5
|
)
|
—
|
|
|||||
|
Japan
|
16
|
|
11
|
|
5
|
|
(7
|
)
|
(12
|
)
|
5
|
|
|||||
|
Europe
|
(14
|
)
|
(5
|
)
|
(9
|
)
|
(5
|
)
|
(14
|
)
|
9
|
|
|||||
|
Other
|
(15
|
)
|
—
|
|
(15
|
)
|
(15
|
)
|
—
|
|
(15
|
)
|
|||||
TIFFANY & CO.
K-
29
Statements of Earnings.
Internally, management monitors and measures its earnings performance excluding certain items listed below. Management believes excluding such items provides a useful supplemental basis for the assessment of the Company's results relative to the corresponding period in the prior year. The following tables reconcile certain GAAP amounts to non-GAAP amounts:
|
(in millions, except per share amounts)
|
GAAP
|
Impairment charges
a
|
Non-GAAP
|
||||||||
|
Year Ended January 31, 2017
|
|||||||||||
|
SG&A expenses
|
$
|
1,769.1
|
|
$
|
(38.0
|
)
|
$
|
1,731.1
|
|
||
|
As a % of sales
|
44.2
|
%
|
43.3
|
%
|
|||||||
|
Earnings from operations
|
721.2
|
|
38.0
|
|
759.2
|
|
|||||
|
As a % of sales
|
18.0
|
%
|
19.0
|
%
|
|||||||
|
Provision for income taxes
b
|
230.5
|
|
14.0
|
|
244.5
|
|
|||||
|
Net earnings
|
446.1
|
|
24.0
|
|
470.1
|
|
|||||
|
Diluted earnings per share*
|
3.55
|
|
0.19
|
|
3.75
|
|
|||||
*Amounts may not add due to rounding.
|
a
|
Expenses associated with the following:
|
|
•
|
$25.4 million of net pre-tax expense ($16.0 million net after tax expense, or $0.13 per diluted share) associated with an asset impairment charge related to software costs capitalized in connection with the development of a new finished goods inventory management and merchandising information system (see "Information Systems Assessment"); and
|
|
•
|
$12.6 million of net pre-tax expense ($8.0 million net after tax expense, or $0.06 per diluted share) associated with impairment charges related to financing arrangements with diamond mining and exploration companies (see "Financing Arrangements with Diamond Mining and Exploration Companies").
|
|
b
|
The income tax effect resulting from the adjustments has been calculated as both current and deferred tax benefit (expense), based upon the tax laws and statutory income tax rates applicable in the tax jurisdiction(s) of the underlying adjustment.
|
|
(in millions, except per share amounts)
|
GAAP
|
Impairment charges
c
|
Specific cost-reduction initiatives
d
|
Non-GAAP
|
|||||||||||
|
Year Ended January 31, 2016
|
|||||||||||||||
|
SG&A expenses
|
$
|
1,731.2
|
|
$
|
(37.9
|
)
|
$
|
(8.8
|
)
|
$
|
1,684.5
|
|
|||
|
As a % of net sales
|
42.2
|
%
|
41.0
|
%
|
|||||||||||
|
Earnings from operations
|
760.1
|
|
37.9
|
|
8.8
|
|
806.8
|
|
|||||||
|
As a % of net sales
|
18.5
|
%
|
19.7
|
%
|
|||||||||||
|
Provision for income taxes
b
|
246.0
|
|
13.6
|
|
3.2
|
|
262.8
|
|
|||||||
|
Net earnings
|
463.9
|
|
24.3
|
|
5.6
|
|
493.8
|
|
|||||||
|
Diluted earnings per share
|
3.59
|
|
0.19
|
|
0.05
|
|
3.83
|
|
|||||||
|
c
|
Expenses associated with impairment charges related to a financing arrangement with Koidu Limited (see "Financing Arrangements with Diamond Mining and Exploration Companies").
|
|
d
|
Expenses associated with specific cost-reduction initiatives which included severance related to staffing reductions and subleasing of certain office space for which only a portion of the Company's future rent obligations will be recovered.
|
TIFFANY & CO.
K-
30
|
(in millions, except per share amounts)
|
GAAP
|
Debt extinguishment
e
|
Non-GAAP
|
||||||||
|
Year Ended January 31, 2015
|
|||||||||||
|
Loss on extinguishment of debt
|
$
|
93.8
|
|
$
|
(93.8
|
)
|
$
|
—
|
|
||
|
Provision for income taxes
b
|
253.4
|
|
32.8
|
|
286.2
|
|
|||||
|
Net earnings
|
484.2
|
|
60.9
|
|
545.1
|
|
|||||
|
Diluted earnings per share
|
3.73
|
|
0.47
|
|
4.20
|
|
|||||
|
e
|
Expenses associated with the redemption of $400.0 million in aggregate principal amount of certain senior notes prior to their scheduled maturities (see "Loss on Extinguishment of Debt").
|
Free Cash Flow.
Internally, management monitors its cash flow on a non-GAAP basis. Free cash flow is calculated by deducting capital expenditures from net cash provided by operating activities. The ability to generate free cash flow demonstrates how much cash the Company has available for discretionary and non-discretionary purposes after deduction of capital expenditures. The Company's operations require regular capital expenditures for the opening, renovation and expansion of stores and distribution and manufacturing facilities as well as ongoing investments in information technology. Management believes this provides a useful supplemental basis for assessing the Company's operating cash flows. The following table reconciles GAAP net cash provided by operating activities to non-GAAP free cash flow:
|
Years Ended January 31,
|
||||||
|
(
in millions)
|
2017
|
|
2016
|
|
||
|
Net cash provided by operating activities
|
$
|
702.1
|
|
$
|
813.6
|
|
|
Less: Capital expenditures
|
(222.8
|
)
|
(252.7
|
)
|
||
|
Free cash flow
a
|
$
|
479.3
|
|
$
|
560.9
|
|
|
a
|
Free cash flow in 2016 reflects a voluntary cash contribution of $120.0 million made by the Company to its U.S. pension plan (See "Item 8. Financial Statements and Supplementary Data - Note N. Employee Benefit Plans").
|
Comparable Store Sales
Comparable store sales include only sales transacted in Company-operated stores open for more than 12 months. Sales for relocated stores are included in comparable store sales if the relocation occurs within the same geographical market. Sales for a new store are not included in comparable store sales if that store was relocated from one department store to another or from a department store to a free-standing location. In all markets, the results of a store in which the square footage has been expanded or reduced remain in the comparable store base.
TIFFANY & CO.
K-
31
Net Sales
The Company generates sales through its retail, Internet, wholesale, business-to-business and catalog channels (see "Item 1. Business - Financial Information about Reportable Segments").
Net sales by segment were as follows:
|
(in millions)
|
2016
|
|
2015
|
|
2014
|
|
2016 vs 2015 % Change
|
|
2015 vs 2014 % Change
|
|
|||||||
|
Americas
a
|
$
|
1,841.9
|
|
$
|
1,947.0
|
|
$
|
2,033.5
|
|
(5
|
)%
|
(4
|
)%
|
||||
|
Asia-Pacific
b
|
999.1
|
|
1,003.1
|
|
1,025.2
|
|
—
|
|
(2
|
)
|
|||||||
|
Japan
c
|
604.4
|
|
541.3
|
|
554.3
|
|
12
|
|
(2
|
)
|
|||||||
|
Europe
d
|
457.6
|
|
505.7
|
|
513.3
|
|
(10
|
)
|
(1
|
)
|
|||||||
|
Other
|
98.8
|
|
107.8
|
|
123.6
|
|
(8
|
)
|
(13
|
)
|
|||||||
|
$
|
4,001.8
|
|
$
|
4,104.9
|
|
$
|
4,249.9
|
|
(3
|
)%
|
(3
|
)%
|
|||||
|
a)
|
Represented
46%
of worldwide net sales in
2016
, 47% in
2015
and 48% in
2014
, while sales in the U.S. represented 88% of net sales in the Americas in those periods. Total sales in the Company's New York Flagship store represented less than 10% of worldwide net sales in 2016, 2015 and 2014.
|
|
b)
|
Represented
25%
of worldwide net sales in
2016
and 24% in
2015
and
2014
, while sales in Greater China represented more than half of Asia-Pacific's net sales in those periods.
|
|
c)
|
Represented
15%
of worldwide net sales in
2016
and 13% in
2015
and
2014
.
|
|
d)
|
Represented
11%
of worldwide net sales in
2016
and 12% in
2015
and
2014
, while sales in the United Kingdom ("U.K.") represented approximately 40% of European net sales in those periods.
|
Net Sales — 2016 compared with 2015
.
In
2016
, worldwide net sales decreased
$103.1 million
, or
3%
, reflecting declines in the Americas and Europe, an increase in Japan and unchanged sales in Asia-Pacific. There was no significant impact from foreign currency translation on worldwide net sales.
In 2016, jewelry sales represented 92% of worldwide net sales. Changes in jewelry sales by product category relative to the prior year were as follows:
|
(in millions)
|
$ Change
|
|
% Change
|
|
||
|
High, fine & solitaire jewelry
|
$
|
(75.0
|
)
|
(9
|
)%
|
|
|
Engagement jewelry & wedding bands
|
(20.2
|
)
|
(2
|
)
|
||
|
Fashion jewelry
|
(11.8
|
)
|
(1
|
)
|
||
|
Designer jewelry
|
4.2
|
|
1
|
|
||
The decrease in sales of high, fine & solitaire jewelry reflected declines across the category, while the engagement jewelry & wedding bands category decreased due to a shift in sales mix towards wedding bands. The fashion jewelry category decreased as declines in silver jewelry, although at a smaller rate than in prior year, more than offset increases in gold jewelry.
Items bearing the name of and attributed to one of the Company's "named" designers: Elsa Peretti and Paloma Picasso, which were previously reported across the high, fine & solitaire jewelry, engagement jewelry & wedding bands and fashion jewelry categories, have been reclassified into a designer jewelry category to conform with management's current internal analysis of product sales. Additionally, certain reclassifications within the jewelry categories have been made to the prior years' amounts to conform to the current year category presentation.
TIFFANY & CO.
K-
32
Changes in net sales by reportable segment were as follows:
|
(in millions)
|
Comparable Store Sales
|
|
Non-comparable Store Sales
|
|
Wholesale/Other
|
|
Total
|
|
|||||||
|
Americas
|
$
|
(96.1
|
)
|
$
|
2.3
|
|
$
|
(11.3
|
)
|
$
|
(105.1
|
)
|
|||
|
Asia-Pacific
|
(80.1
|
)
|
59.8
|
|
16.3
|
|
(4.0
|
)
|
|||||||
|
Japan
|
78.8
|
|
(1.3
|
)
|
(14.4
|
)
|
63.1
|
|
|||||||
|
Europe
|
(59.7
|
)
|
13.1
|
|
(1.5
|
)
|
(48.1
|
)
|
|||||||
In 2016, jewelry sales represented 90%, 98%, 93% and 96% of total sales in the Americas, Asia-Pacific, Japan and Europe, respectively. Changes in jewelry sales relative to the prior year were as follows:
|
Average Price per Unit Sold
|
||||||||
|
As Reported
|
|
Impact of Currency Translation
|
|
Number of
Units Sold |
|
|||
|
Change in Jewelry Sales
|
||||||||
|
Americas
|
1
|
%
|
—
|
%
|
(6
|
)%
|
||
|
Asia-Pacific
|
(5
|
)%
|
(2
|
)%
|
4
|
%
|
||
|
Japan
|
(2
|
)%
|
11
|
%
|
13
|
%
|
||
|
Europe
|
(1
|
)%
|
(6
|
)%
|
(9
|
)%
|
||
Americas
. In
2016
, total sales decreased
$105.1 million
, or
5%
, which management attributed to lower sales to U.S. customers and foreign tourist spending (primarily Chinese tourists). Comparable store sales decreased
$96.1 million
, or
6%
. On a constant-exchange-rate basis, both total sales and comparable store sales decreased
5%
.
The decrease in the number of jewelry units sold reflected declines across most categories, particularly in fashion silver jewelry.
Asia-Pacific.
In
2016
, total sales were approximately equal to the prior year, decreasing
$4.0 million
, partly reflecting new stores and increased wholesale sales; comparable store sales decreased
$80.1 million
, or
9%
. Management attributed performance in this region to increased purchasing by local customers and declines in spending by foreign tourists. In addition, sales growth in China, increased wholesale sales in Korea, a decelerating rate of retail sales declines in Hong Kong and varying performance in other countries. On a constant-exchange-rate basis, total sales increased
1%
and comparable store sales decreased
7%
.
The increase in the number of jewelry units sold reflected increases in fashion jewelry, particularly in silver jewelry, and wedding bands within the engagement category. Management attributed the decrease in the average price per jewelry unit sold to a shift in mix away from high, fine & solitaire jewelry to fashion jewelry and within the engagement jewelry & wedding bands category toward wedding bands.
Japan.
In
2016
, total sales increased
$63.1 million
, or
12%
, and comparable store sales increased
$78.8 million
, or
16%
. On a constant-exchange-rate basis, total sales were in line with prior year and comparable store sales increased
5%
. Management attributed this performance to higher spending by local customers and lower spending by Chinese tourists, as well as lower wholesale sales.
The increase in number of jewelry units sold primarily reflected increases in the fashion jewelry, designer jewelry and the engagement jewelry & wedding bands categories. Management attributed the decrease in the average price per jewelry unit sold to a shift away from the high, fine & solitaire jewelry category to designer jewelry, as well as a shift in sales mix within the fashion jewelry category towards silver jewelry.
Europe.
In
2016
, total sales decreased
$48.1 million
, or
10%
, and comparable store sales decreased
$59.7 million
, or
14%
, which management attributed to lower spending by foreign tourists and local customers across continental Europe. On a constant-exchange-rate basis, total sales decreased
3%
and comparable store sales decreased
9%
, as
TIFFANY & CO.
K-
33
softness across continental Europe was partially offset by sales increases in the U.K. (particularly in the second half of the year, largely attributable to foreign tourist spending).
The decrease in the number of jewelry units sold reflected decreases across all categories, especially in fashion silver jewelry. Management attributed the decrease in average price per unit sold to the negative effect of currency translation, which offset a favorable shift toward higher-priced products within the engagement jewelry & wedding bands category.
Other.
In
2016
, total sales decreased
$9.0 million
, or
8%
, partly due to a $16.9 million, or 22%, sales decline in the Emerging Markets region partly offset by an increase in wholesale sales of diamonds.
Net Sales — 2015 compared with 2014
.
In
2015
, worldwide net sales decreased
$145.0 million
, or
3%
, due to lower sales in all regions. The strengthening of the U.S. dollar versus other currencies had the translation effect of reducing worldwide net sales growth by 5%, with net sales on a constant-exchange-rate basis increasing 2% (due to growth in Europe, Japan and Asia-Pacific, while sales in the Americas decreased modestly from the prior year).
In 2015, jewelry sales represented 93% of worldwide net sales. Changes in jewelry sales by product category were as follows:
|
(in millions)
|
$ Change
|
|
% Change
|
|
||
|
High, fine & solitaire jewelry
|
$
|
(16.3
|
)
|
(2
|
)%
|
|
|
Engagement jewelry & wedding bands
|
(78.8
|
)
|
(6
|
)
|
||
|
Fashion jewelry
|
(16.9
|
)
|
(1
|
)
|
||
|
Designer jewelry
|
(20.7
|
)
|
(4
|
)
|
||
The decrease in the high, fine & solitaire jewelry category reflected lower sales of fine jewelry partly offset by increased high jewelry sales. The decrease in the engagement jewelry & wedding bands category reflected decreases in both solitaire diamond rings and wedding bands. The decrease in the fashion jewelry category reflected a decline in sales of entry-level price point jewelry, largely in silver, partly offset by growth in gold jewelry sales. The decrease in designer jewelry primarily reflected decreases in gold and silver jewelry.
Items bearing the name of and attributed to one of the Company's "named" designers: Elsa Peretti and Paloma Picasso, which were previously reported across the high, fine & solitaire jewelry, engagement jewelry & wedding bands and fashion jewelry categories, have been reclassified into the designer jewelry category to conform with management's current internal analysis of product sales. Additionally, certain reclassifications within the jewelry categories have been made to the prior years' amounts to conform to the current year category presentation.
Changes in net sales by reportable segment were as follows:
|
(in millions)
|
Comparable Store Sales
|
|
Non-comparable Store Sales
|
|
Wholesale/Other
|
|
Total
|
|
|||||||
|
Americas
|
$
|
(103.5
|
)
|
$
|
12.9
|
|
$
|
4.1
|
|
$
|
(86.5
|
)
|
|||
|
Asia-Pacific
|
(46.0
|
)
|
32.7
|
|
(8.8
|
)
|
(22.1
|
)
|
|||||||
|
Japan
|
(36.4
|
)
|
9.6
|
|
13.8
|
|
(13.0
|
)
|
|||||||
|
Europe
|
(24.0
|
)
|
11.7
|
|
4.7
|
|
(7.6
|
)
|
|||||||
TIFFANY & CO.
K-
34
In 2015, jewelry sales represented 89%, 98%, 93% and 96% of total sales in the Americas, Asia-Pacific, Japan and Europe, respectively. Changes in jewelry sales relative to the prior year were as follows:
|
Average Price per Unit Sold
|
||||||||
|
As Reported
|
|
Impact of Currency Translation
|
|
Number of
Units Sold |
|
|||
|
Change in Jewelry Sales
|
||||||||
|
Americas
|
6
|
%
|
(2
|
)%
|
(11
|
)%
|
||
|
Asia-Pacific
|
4
|
%
|
(5
|
)%
|
(6
|
)%
|
||
|
Japan
|
(2
|
)%
|
(12
|
)%
|
—
|
%
|
||
|
Europe
|
—
|
%
|
(14
|
)%
|
(2
|
)%
|
||
Americas
. In
2015
, total sales decreased
$86.5 million
, or
4%
, and comparable store sales decreased
$103.5 million
, or
6%
, while on a constant-exchange-rate basis, total sales decreased
2%
and comparable store sales decreased
4%
. Management attributed the decrease in total sales and comparable store sales to lower foreign tourist spending in the U.S. (which management believes was the result of a strong U.S. dollar) as well as to lower sales to U.S. customers. The strong sales growth in Canada and Latin America was more than offset by currency translation.
The decrease in the number of jewelry units sold reflected decreases across most categories, especially in entry-level price point silver jewelry. Management attributed the increase in the average price per jewelry unit sold to price increases and a shift in sales mix toward higher-priced products within the fashion jewelry category and toward high jewelry.
Asia-Pacific.
In
2015
, total sales decreased
$22.1 million
, or
2%
, and comparable store sales decreased $46.0 million, or 5%, while on a constant-exchange-rate basis, total sales increased
3%
and comparable store sales were unchanged. Sales rose in China and declined in Hong Kong; overall sales results were negatively affected by currency translation.
The decrease in the number of jewelry units sold primarily reflected declines in entry-level price point silver jewelry. Management attributed the increase in the average price per jewelry unit sold to price increases and a shift in sales mix toward higher-priced products within the fashion jewelry category and toward high jewelry.
Japan.
In
2015
, total sales decreased
$13.0 million
, or
2%
, and comparable store sales declined
$36.4 million
, or
7%
, while on a constant-exchange-rate basis, total sales increased 10% and comparable store sales increased
5%
. Management attributed the decrease in sales to currency translation, which offset higher spending by foreign tourists.
Management attributed the decrease in average price per unit sold to currency translation, which offset the favorable effect of price increases and a shift in sales mix toward higher-priced products.
Europe.
In
2015
, total sales decreased
$7.6 million
, or
1%
, and comparable store sales declined
$24.0 million
, or
5%
, while on a constant-exchange-rate basis, total sales increased
12%
and comparable store sales increased
9%
. Growth across the region, which management attributed to higher spending by foreign tourists and, to a lesser extent, higher sales to local customers was entirely offset by currency translation.
The decrease in the number of jewelry units sold was attributed to soft demand for silver jewelry. Management attributed the increase in average price per jewelry unit sold to price increases and a shift in sales mix toward higher-priced products, entirely offset by currency translation.
Other.
In
2015
, total sales decreased
$15.8 million
, or
13%
, partly due to a $9.2 million, or 11%, sales decline in the Emerging Markets region that largely reflected lower comparable store sales. The remainder of the decrease was related to lower wholesale sales of diamonds.
Store Data
. In
2016
, the Company increased gross retail square footage by 3%, net, through store openings, closings and relocations. The Company opened 11 stores and closed five: opening seven in Asia-Pacific (three in China, two
TIFFANY & CO.
K-
35
in Australia and one each in Korea and New Zealand), three in Europe (two in Italy and one in the Netherlands) and one in the Americas (in Canada) while closing three stores in Asia-Pacific (two in China and one in Singapore) and one each in Japan and Europe (in Germany). In addition, the Company relocated five existing stores.
In
2015
, the Company increased gross retail square footage by 4%, net, through store openings, closings and relocations. The Company opened 16 stores and closed four: opening three in the Americas (in the U.S., Canada and Chile), 11 in Asia-Pacific (five in China, two in Macau and one each in Korea, Singapore, Taiwan and Thailand) and two in Europe (in Spain and Switzerland) while closing one store in the Americas and three stores in Asia-Pacific. In addition, the Company relocated nine existing stores.
Sales per gross square foot generated by all company-operated stores were approximately $2,700 in
2016
, $2,900 in
2015
and $3,100 in
2014
. The declines in 2016 and 2015 reflected the effects of decreased sales (which in 2015 were negatively affected by currency translation) and growth in retail square footage.
Gross Margin
|
(in millions)
|
2016
|
|
2015
|
|
2014
|
|
|||||
|
Gross profit
|
$
|
2,490.3
|
|
$
|
2,491.3
|
|
$
|
2,537.2
|
|
||
|
Gross profit as a percentage of net sales
|
62.2
|
%
|
60.7
|
%
|
59.7
|
%
|
|||||
Gross margin (gross profit as a percentage of net sales) increased 1.5 percentage points in
2016
reflecting favorable product input costs and the effect of price increases, and, to a lesser extent, favorable changes in product sales mix.
Gross margin increased 1.0 percentage point in
2015
reflecting favorable product input costs that were partly offset by a shift in sales mix to higher-priced, lower-margin products. In addition, the benefit from retail price increases was partly offset by the negative effect from the strong U.S. dollar.
Management periodically reviews and adjusts its retail prices when appropriate to address product input cost increases, specific market conditions and changes in foreign currencies/U.S. dollar relationships. Its long-term strategy is to continue that approach, although significant increases in product input costs or weakening foreign currencies can affect gross margin negatively over the short-term until management makes necessary price adjustments. Among the market conditions that management considers are consumer demand for the product category involved, which may be influenced by consumer confidence, and competitive pricing conditions. Management uses derivative instruments to mitigate certain foreign exchange and precious metal price exposures (see "Item 8. Financial Statements and Supplementary Data – Note H. Hedging Instruments"). Management increased retail prices in both 2016 and 2015 across most geographic regions and product categories, some of which were intended to mitigate foreign currency fluctuations.
Selling, General and Administrative Expenses
|
(in millions)
|
2016
|
|
2015
|
|
2014
|
|
|||||
|
As reported:
|
|||||||||||
|
SG&A expenses
|
$
|
1,769.1
|
|
$
|
1,731.2
|
|
$
|
1,645.8
|
|
||
|
SG&A expenses as a percentage of net sales
|
44.2
|
%
|
42.2
|
%
|
38.7
|
%
|
|||||
|
Excluding items in "Non-GAAP Measures":
|
|||||||||||
|
SG&A expenses
|
$
|
1,731.1
|
|
$
|
1,684.5
|
|
$
|
1,645.8
|
|
||
|
SG&A expenses as a percentage of net sales
|
43.3
|
%
|
41.0
|
%
|
38.7
|
%
|
|||||
SG&A expenses increased
$37.9 million
, or
2%
, in
2016
and $85.4 million, or 5%, in 2015. SG&A expenses in 2016 included various impairment charges and, in 2015, included loan impairment charges and certain expenses associated with specific cost-reduction initiatives. See "Non-GAAP Measures" for further details.
SG&A expenses in 2016 (excluding the 2016 and 2015 items noted in "Non-GAAP Measures") increased $46.6 million, or 3%, largely reflecting increased store occupancy and depreciation expenses and labor and incentive compensation costs. There was no significant effect on SG&A expense changes from foreign currency translation.
TIFFANY & CO.
K-
36
SG&A expenses in 2015 (excluding the 2015 items noted in "Non-GAAP Measures") increased $38.7 million, or 2%, largely reflecting increased marketing expenses and store occupancy and depreciation expenses partly offset by decreased labor costs (primarily lower variable labor costs for incentive compensation and sales commissions partly offset by increased costs for U.S. pension and postretirement benefit plans). The strengthening of the U.S. dollar had the effect of decreasing SG&A expense growth by 4%.
The Company's SG&A expenses are largely fixed in nature. Variable costs (which include items such as variable store rent, sales commissions and fees paid to credit card companies) typically represent approximately 15 - 20% of total SG&A expenses.
Earnings from Operations
|
(dollars in millions)
|
2016
|
|
2015
|
|
2014
|
|
|||||
|
As reported:
|
|||||||||||
|
Earnings from operations
|
$
|
721.2
|
|
$
|
760.1
|
|
$
|
891.4
|
|
||
|
Operating margin
|
18.0
|
%
|
18.5
|
%
|
21.0
|
%
|
|||||
|
Percentage point change from prior year
|
(0.5
|
)
|
(2.5
|
)
|
13.5
|
|
|||||
|
Excluding other operating expenses:
|
|||||||||||
|
Earnings from operations
|
$
|
759.2
|
|
$
|
806.8
|
|
$
|
891.4
|
|
||
|
Operating margin
|
19.0
|
%
|
19.7
|
%
|
21.0
|
%
|
|||||
|
Percentage point change from prior year
|
(0.7
|
)
|
(1.3
|
)
|
1.3
|
|
|||||
The declines in both 2016 and 2015 resulted from sales deleveraging of SG&A expenses, which were only partly offset by higher gross margins.
Results by segment are as follows:
|
(in millions)
|
2016
|
|
% of Net
Sales
|
|
2015
|
|
% of Net
Sales
|
|
2014
|
|
% of Net
Sales
|
|
||||||||
|
Earnings from operations*:
|
||||||||||||||||||||
|
Americas
|
$
|
373.0
|
|
20.3
|
%
|
$
|
390.8
|
|
20.1
|
%
|
$
|
435.5
|
|
21.4
|
%
|
|||||
|
Asia-Pacific
|
256.0
|
|
25.6
|
|
264.4
|
|
26.4
|
|
281.6
|
|
27.5
|
|
||||||||
|
Japan
|
204.6
|
|
33.9
|
|
199.9
|
|
36.9
|
|
196.0
|
|
35.4
|
|
||||||||
|
Europe
|
81.6
|
|
17.8
|
|
97.4
|
|
19.3
|
|
110.5
|
|
21.5
|
|
||||||||
|
Other
|
5.9
|
|
6.0
|
|
6.4
|
|
6.0
|
|
4.9
|
|
4.0
|
|
||||||||
|
921.1
|
|
958.9
|
|
1,028.5
|
|
|||||||||||||||
|
Unallocated corporate
expenses
|
(161.9
|
)
|
(4.0
|
)%
|
(152.1
|
)
|
(3.7
|
)%
|
(137.1
|
)
|
(3.2
|
)%
|
||||||||
|
Earnings from operations before other operating expenses
|
759.2
|
|
19.0
|
%
|
806.8
|
|
19.7
|
%
|
891.4
|
|
21.0
|
%
|
||||||||
|
Other operating expenses
|
(38.0
|
)
|
(46.7
|
)
|
—
|
|
||||||||||||||
|
Earnings from operations
|
$
|
721.2
|
|
18.0
|
%
|
$
|
760.1
|
|
18.5
|
%
|
$
|
891.4
|
|
21.0
|
%
|
|||||
|
*
|
Percentages represent earnings from operations as a percentage of each segment's net sales.
|
On a segment basis, the ratio of earnings from operations to each segment's net sales in
2016
compared with
2015
was as follows:
|
•
|
Americas – the ratio increased 0.2 percentage point due to an improvement in gross margin, largely offset by a lack of sales leverage on operating expenses resulting from a decrease in net sales;
|
TIFFANY & CO.
K-
37
|
•
|
Asia-Pacific – the ratio decreased 0.8 percentage point due to a lack of sales leverage on operating expenses, primarily attributable to new store-related expenses, partly offset by an improvement in gross margin;
|
|
•
|
Japan – the ratio decreased 3.0 percentage points primarily due to a decrease in gross margin that reflected an unfavorable impact tied to the strengthening of the Yen on the Company's program to utilize Yen forward contracts for a portion of its forecasted merchandise purchases; and
|
|
•
|
Europe – the ratio decreased 1.5 percentage points due to a decrease in net sales resulting in a lack of sales leverage on operating expenses, partly offset by an improvement in gross margin.
|
On a segment basis, the ratio of earnings from operations to each segment's net sales in
2015
compared with
2014
was as follows:
|
•
|
Americas – the ratio decreased 1.3 percentage points due to a decrease in net sales resulting in sales deleveraging of operating expenses, partly offset by an improvement in gross margin;
|
|
•
|
Asia-Pacific – the ratio decreased 1.1 percentage points due to increased store-related operating expenses and marketing spending, partly offset by an improvement in gross margin;
|
|
•
|
Japan – the ratio increased 1.5 percentage points due to leveraging of operating expenses (as operating expenses decreased at a higher rate than sales), partly offset by a decrease in gross margin attributable to currency translation; and
|
|
•
|
Europe – the ratio decreased 2.2 percentage points resulting from increased store-related operating expenses and marketing spending, partly offset by an improvement in gross margin.
|
Unallocated corporate expenses include costs related to administrative support functions which the Company does not allocate to its segments. Such unallocated costs include those for centralized information technology, finance, legal and human resources departments. Unallocated corporate expenses increased by $9.8 million in 2016 and$15.0 million in 2015, primarily due to increased costs, including depreciation and amortization expense, associated with upgrades to the Company's information technology systems as well as increased incentive compensation expense in 2016.
Included in other operating expenses in the table above, the 2016 amount represented $25.4 million associated with an impairment charge related to software costs capitalized in connection with the development of a new finished goods inventory management and merchandising information system (see "Item 8. Financial Statements and Supplementary Data - Note B. Summary of Significant Accounting Policies and Note E. Property, Plant and Equipment") and $12.6 million associated with impairment charges related to financing arrangements with diamond mining and exploration companies (see "Item 8. Financial Statements and Supplementary Data - Note B. Summary of Significant Accounting Policies").
Included in other operating expenses in the table above, the 2015 amount represented $37.9 million associated with impairment charges related to a financing arrangement with Koidu Limited and $8.8 million of expenses associated with specific cost-reduction initiatives. See "Item 8. Financial Statements and Supplementary Data - Note J. Commitments and Contingencies."
Interest Expense and Financing Costs
Interest expense and financing costs decreased
$3.0 million
, or 6%, in
2016
due to lower interest expense. Interest expense and financing costs decreased $13.9 million, or 22%, in 2015 as a result of lower interest expense on long-term debt (reflecting the October 2014 redemption of long-term debt using proceeds from the issuance of lower-rate long-term debt in September 2014) as well as lower average credit facility borrowings.
Other (Income) Expense, Net
Other (income) expense, net includes interest income as well as gains/losses on investment activities and foreign currency transactions. Net income of $1.4 million in 2016 compared with net expense of $1.2 million in 2015. The
$2.6 million
change was primarily due to reduced foreign currency transaction losses. Net expense of $1.2
TIFFANY & CO.
K-
38
million in 2015 compared with net income of $2.8 million in 2014. The $4.0 million change was primarily due to foreign currency transaction losses.
Loss on Extinguishment of Debt
In 2014, the Company recorded a loss on extinguishment of debt of $93.8 million associated with the redemption of all of the aggregate principal amount outstanding of the Company's (i) $100.0 million principal amount of 9.05% Series A Senior Notes due December 23, 2015; (ii) $125.0 million principal amount of 10.0% Series A-2009 Senior Notes due February 13, 2017; (iii) $50.0 million principal amount of 10.0% Series A Senior Notes due April 9, 2018; and (iv) $125.0 million principal amount of 10.0% Series B-2009 Senior Notes due February 13, 2019 (collectively, the "Private Placement Notes") prior to maturity in accordance with the respective note purchase agreements governing each series of Private Placement Notes, which included provisions for make-whole payments in the event of early repayment.
Provision for Income Taxes
The effective income tax rate was
34.1%
in
2016
compared with 34.7% in
2015
and 34.4% in
2014
. The effective income tax rate in 2016 was reduced by 1.0 percentage point due to an income tax benefit of $6.6 million, or $0.05 per diluted share, resulting from the conclusion of a tax examination during the first quarter of 2016.
LIQUIDITY AND CAPITAL RESOURCES
The Company's liquidity needs have been, and are expected to remain, primarily a function of its ongoing, seasonal and expansion-related working capital requirements and capital expenditure needs. Over the long term, the Company manages its cash and capital structure to maintain a strong financial position that provides flexibility to pursue strategic initiatives. Management regularly assesses its working capital needs, capital expenditure requirements, debt service, dividend payouts, share repurchases and future investments. Management believes that cash on hand, internally generated cash flows, the funds available under its revolving credit facilities and the ability to access the debt and capital markets are sufficient to support the Company's liquidity and capital requirements for the foreseeable future.
As of January 31,
2017
, the Company’s cash and cash equivalents totaled
$928.0 million
, of which approximately one-third was held in locations outside the U.S. where the Company has the intention to indefinitely reinvest any undistributed earnings to support its continued expansion and investments outside of the U.S. Such cash balances are not available to fund U.S. cash requirements unless the Company were to decide to repatriate such funds and incur applicable income tax charges. The Company has sufficient sources of cash in the U.S. to fund its U.S. operations without the need to repatriate any of those funds held outside the U.S.
The following table summarizes cash flows from operating, investing and financing activities:
|
(in millions)
|
2016
|
|
2015
|
|
2014
|
|
|||||
|
Net cash provided by (used in):
|
|||||||||||
|
Operating activities
|
$
|
702.1
|
|
$
|
813.6
|
|
$
|
615.1
|
|
||
|
Investing activities
|
(236.8
|
)
|
(278.2
|
)
|
(217.0
|
)
|
|||||
|
Financing activities
|
(382.8
|
)
|
(422.3
|
)
|
(23.4
|
)
|
|||||
|
Effect of exchange rates on cash and cash equivalents
|
1.9
|
|
0.5
|
|
9.5
|
|
|||||
|
Net increase in cash and cash equivalents
|
$
|
84.4
|
|
$
|
113.6
|
|
$
|
384.2
|
|
||
Operating Activities
The Company had net cash inflows from operating activities of
$702.1 million
in
2016
,
$813.6 million
in
2015
and
$615.1 million
in
2014
. The decrease from 2015 to 2016 was primarily due to a $120.0 million voluntary contribution made by the Company to its U.S. pension plan in 2016. The year-over-year improvement from 2014 to 2015 was primarily due to reduced inventory purchases.
TIFFANY & CO.
K-
39
Working Capital.
Working capital (current assets less current liabilities) increased to
$2.9 billion
at
January 31, 2017
from
$2.8 billion
at
January 31, 2016
. The increase was primarily due to the repayment of the ¥10.0 billion ($88.0 million) Senior Notes due in September 2016 (which had been classified as Current portion of long-term debt) and the issuance of the ¥10.0 billion Senior Notes due in August 2026 (which is classified as Long-term debt). See "Financing Activities" below for additional information.
Accounts receivable, less allowances at
January 31, 2017
were
10%
higher than at
January 31, 2016
largely attributable to sales growth in Japan and the timing of collections from department stores. Currency translation had the effect of increasing accounts receivable, less allowances by 2% from
January 31, 2016
, primarily from the strengthening of the Japanese yen. On a 12-month rolling basis, accounts receivable turnover was 18 times in
2016
and 21 times in
2015
.
Inventories, net at
January 31, 2017
were
3%
lower than at
January 31, 2016
, which reflected similar declines in both finished goods inventories and combined raw material and work-in-process inventories. Currency translation did not have a significant effect on the change in inventories, net.
Investing Activities
The Company had net cash outflows from investing activities of
$236.8 million
in
2016
,
$278.2 million
in
2015
and
$217.0 million
in
2014
. The decrease in net cash outflows in 2016 was driven by decreased capital expenditures as well as reduced net purchases of marketable securities and short-term investments. The increased outflow in 2015 was primarily due to increased purchases of marketable securities and short-term investments.
Marketable Securities and Short-Term Investments.
The Company invests a portion of its cash in marketable securities and short-term investments. The Company had net purchases of
$15.7 million
during
2016
and $26.4 million during 2015 compared with net proceeds received from the sale of marketable securities and short-term investments of $15.2 million during 2014.
Capital Expenditures.
Capital expenditures are typically related to the opening, renovation and/or relocation of stores (which represented approximately 60% of capital expenditures in
2016
and approximately half in
2015
and
2014
) as well as distribution and manufacturing facilities and ongoing investments in information technology. Capital expenditures were
$222.8 million
in
2016
,
$252.7 million
in
2015
and
$247.4 million
in
2014
, representing
6%
of worldwide net sales in those years.
Proceeds from Notes Receivable Funded.
In 2016 and 2014, the Company received $1.7 million and $15.2 million of repayments associated with loans extended to diamond mining and exploration companies. No such proceeds were received in 2015.
Financing Activities
The Company had net cash outflows from financing activities of
$382.8 million
in
2016
,
$422.3 million
in
2015
and
$23.4 million
in
2014
. Year-over-year changes in cash flows from financing activities were largely driven by share repurchases and borrowings.
TIFFANY & CO.
K-
40
Recent Borrowings.
The Company had net proceeds from (repayments of) short-term and long-term borrowings as follows:
|
(in millions)
|
2016
|
|
2015
|
|
2014
|
|
|||||
|
Short-term borrowings:
|
|||||||||||
|
Proceeds from (repayments of) credit facility borrowings, net
|
$
|
14.2
|
|
$
|
(11.3
|
)
|
$
|
(12.5
|
)
|
||
|
Proceeds from other credit facility borrowings
|
76.8
|
|
24.8
|
|
19.8
|
|
|||||
|
Repayments of other credit facility borrowings
|
(83.1
|
)
|
(16.0
|
)
|
(3.4
|
)
|
|||||
|
Net proceeds from (repayments of) short-term borrowings
|
7.9
|
|
(2.5
|
)
|
3.9
|
|
|||||
|
Long-term borrowings:
|
|||||||||||
|
Proceeds from issuances
|
98.1
|
|
—
|
|
548.0
|
|
|||||
|
Repayments
|
(97.1
|
)
|
—
|
|
(400.0
|
)
|
|||||
|
Net proceeds from long-term borrowings
|
1.0
|
|
—
|
|
148.0
|
|
|||||
|
Net proceeds from (repayments of) total borrowings
|
8.9
|
|
(2.5
|
)
|
151.9
|
|
|||||
|
Payments of debt extinguishment costs (included in operating activities)
|
—
|
|
—
|
|
(93.4
|
)
|
|||||
|
Net proceeds (repayments)
|
$
|
8.9
|
|
$
|
(2.5
|
)
|
$
|
58.5
|
|
||
Credit Facilities.
In 2014, the Registrant entered into a four-year $375.0 million and a five-year $375.0 million multi-bank, multi-currency, committed unsecured revolving credit facility, including letter of credit subfacilities (collectively, the "Credit Facilities"), resulting in a total borrowing capacity of $750.0 million. In October 2016, the maturity for each of the Credit Facilities was extended for one additional year pursuant to the terms set forth in the respective agreements governing the Credit Facilities. Therefore, the four-year and five-year Credit Facilities will mature in October of 2019 and 2020, respectively. See "Item 8. Financial Statements and Supplementary Data - Note G. Debt" for additional information.
Other Credit Facilities.
In 2016, the Registrant's wholly owned subsidiary, Tiffany & Co. (Shanghai) Commercial Company Limited ("Tiffany-Shanghai"), entered into a three-year multi-bank revolving credit agreement (the "Tiffany-Shanghai Credit Agreement"). The Tiffany-Shanghai Credit Agreement has an aggregate borrowing limit of RMB 990.0 million (
$143.8 million
at
January 31, 2017
). The Tiffany-Shanghai Credit Agreement, which matures in July 2019, was made available to refinance amounts outstanding under Tiffany-Shanghai's previously existing RMB 930.0 million three-year multi-bank revolving credit agreement (the "2013 Agreement"), which expired pursuant to its terms in July 2016, as well as for Tiffany-Shanghai's general working capital requirements. See "Item 8. Financial Statements and Supplementary Data - Note G. Debt" for additional information.
Under all of the Company's credit facilities, at
January 31, 2017
, there were $228.7 million of borrowings outstanding, $4.0 million of letters of credit issued but not outstanding and $798.4 million available for borrowing. At
January 31, 2016
, there were $221.6 million of borrowings outstanding, $5.6 million of letters of credit issued but not outstanding and $790.8 million available for borrowing. The weighted-average interest rate for borrowings outstanding was 2.71% at
January 31, 2017
and 2.90% at
January 31, 2016
.
Senior Notes.
In 2014, the Registrant issued $250.0 million aggregate principal amount of 3.80% Senior Notes due 2024 (the "2024 Notes") and $300.0 million aggregate principal amount of 4.90% Senior Notes due 2044 (the "2044 Notes" and, together with the 2024 Notes, the "Senior Notes"). The Senior Notes were issued at a discount with aggregate net proceeds of $548.0 million (with an effective yield of 3.836% for the 2024 Notes and an effective yield of 4.926% for the 2044 Notes). The Registrant used the net proceeds from the issuance of the Senior Notes to redeem $400.0 million in aggregate principal amount of long-term debt prior to their scheduled maturities which ranged from 2015 to 2019 and paid $93.4 million of debt extinguishment costs associated with the redemption. The Company used the remaining net proceeds from the sale of the Senior Notes for general corporate purposes. See "Item 8. Financial Statements and Supplementary Data - Note G. Debt" for additional information.
TIFFANY & CO.
K-
41
In August 2016, the Registrant issued ¥10.0 billion (
$88.0 million
at
January 31, 2017
) of 0.78% Senior Notes due August 2026 (the "Yen Notes") in a private transaction. The Yen Notes bear interest at a rate of 0.78% per annum, payable semi-annually on February 26 and August 26 of each year, commencing February 26, 2017. The proceeds from the issuance of the Yen Notes were used to repay the Registrant's ¥10.0 billion 1.72% Senior Notes due September 2016 upon the maturity thereof. See "Item 8. Financial Statements and Supplementary Data - Note G. Debt" for additional information.
The ratio of total debt (short-term borrowings, current portion of long-term debt and long-term debt) to stockholders' equity was
37%
at both
January 31, 2017
and
2016
.
At
January 31, 2017
, the Company was in compliance with all debt covenants.
Share Repurchases.
In March 2014, the Company's Board of Directors approved a share repurchase program ("2014 Program") which authorized the Company to repurchase up to $300.0 million of its Common Stock through open market transactions. The program had an expiration date of March 31, 2017, but was terminated in January 2016 in connection with the authorization of a new program with increased repurchase capacity (as described in more detail below). Approximately $58.6 million remained available for repurchase under the 2014 Program at the time of its termination.
In January 2016, the Company's Board of Directors approved a new share repurchase program ("2016 Program") which authorizes the Company to repurchase up to $500.0 million of its Common Stock through open market transactions, block trades or privately negotiated transactions and terminated the 2014 Program. Purchases under the 2014 Program were, and purchases under the 2016 Program have been, executed under a written plan for trading securities as specified under Rule 10b5-1 promulgated under the Securities and Exchange Act of 1934, as amended, the terms of which are within the Company's discretion, subject to applicable securities laws, and are based on market conditions and the Company's liquidity needs. The 2016 Program will expire on January 31, 2019. Approximately
$310.4 million
remained available for repurchase under the 2016 Program at
January 31, 2017
.
The Company's share repurchase activity was as follows:
|
(in millions, except per share amounts)
|
2016
|
|
2015
|
|
2014
|
|
|||||
|
Cost of repurchases
|
$
|
183.6
|
|
$
|
220.4
|
|
$
|
27.0
|
|
||
|
Shares repurchased and retired
|
2.8
|
|
2.8
|
|
0.3
|
|
|||||
|
Average cost per share
|
$
|
65.24
|
|
$
|
78.40
|
|
$
|
89.91
|
|
||
Dividends.
The cash dividend on the Company's Common Stock was increased once in each of
2016
,
2015
and
2014
. The Company's Board of Directors declared quarterly dividends which totaled $1.75, $1.58 and $1.48 per common share in
2016
,
2015
and
2014
with cash dividends paid of
$218.8 million
,
$203.4 million
and
$191.2 million
in those respective years. The dividend payout ratio (dividends as a percentage of net earnings) was
49%
,
44%
and
39%
in
2016
,
2015
and
2014
. Dividends as a percentage of adjusted net earnings (see "Non-GAAP Measures") were 47% in 2016, 41% in 2015 and 35% in 2014.
At least annually, the Company's Board of Directors reviews its policies with respect to dividends and share repurchases with a view to actual and projected earnings, cash flows and capital requirements.
Financing Arrangements with Diamond Mining and Exploration Companies
The Company has provided financing to diamond mining and exploration companies in order to obtain rights to purchase the output from mines owned by these companies. At January 31, 2016, there was $43.8 million of principal outstanding under a financing arrangement (the "Loan") with Koidu Limited (previously Koidu Holdings S.A.) ("Koidu"), with a carrying amount, net of valuation allowance, of
$5.9 million
. The Loan, which was entered into between Koidu and Laurelton Diamonds, Inc. ("Laurelton"), a wholly owned subsidiary of the Company, in March 2011, originally provided that repayments of principal would begin in March 2013. However, in March 2013, the Company agreed to Koidu's request to defer the principal and interest payments due in 2013 to subsequent years and, in March 2014, the Company agreed to Koidu's request to provide for monthly rather than semi-annual payments of the principal payments due in 2014. The Company received such scheduled monthly payments from Koidu in 2014. On April 30, 2015, the Company also agreed to defer Koidu's principal payment due on March 30,
TIFFANY & CO.
K-
42
2015 ("2015 Amendment"), subject to certain conditions set forth in the 2015 Amendment, which were met in June 2015.
As of January 31, 2016, Koidu had not made any of its interest payments due in July 2015 and thereafter, nor its principal payment due in September 2015. The missed payments constitute events of default under the Loan. In February 2016, the Company received the results from two separate and independent reviews of Koidu's operational plans, forecasts, and cash flow projections for the mine, which were commissioned by the Company and by Koidu's largest creditor, respectively. Based on these factors, ongoing discussions with Koidu, and consideration of the possible actions that all parties, including the Government of Sierra Leone and Koidu's largest creditor, might take under the circumstances, management determined that it was probable that it would be unable to collect a portion of the amounts due under the contractual terms of the Loan, and recorded impairment charges, and a related valuation allowance, of $37.9 million in 2015. Additionally, the Company ceased accruing interest income on the outstanding Loan balance as of July 31, 2015. The carrying amount of the Company’s loan receivable from Koidu, net of the valuation allowance, was $5.9 million at January 31, 2016.
Koidu did not make any payments due to the Company under the Loan in 2016. On March 17, 2017, the Company entered into an agreement with Koidu's largest creditor under which that creditor has agreed to purchase the Company's interest in the loan, on and effective March 22, 2017, for $1.7 million. Based on this agreement, the Company has recorded an additional impairment charge, and a related valuation allowance, of $4.2 million in 2016 to reduce the carrying amount of the Company’s loan receivable from Koidu, net of the valuation allowance, to $1.7 million at January 31, 2017. Additionally, on March 16, 2017, the Company and Koidu entered into an agreement to terminate the supply agreement between the parties, pursuant to which Laurelton had previously been required to purchase at fair market value certain diamonds recovered from Koidu's mine that met Laurelton's quality standards. See "Item 8. Financial Statements and Supplementary Data - Note B. Summary of Significant Accounting Policies and Note J. Commitments and Contingencies" for additional information on this financing arrangement.
The Company also recorded an impairment charge, and a related valuation allowance, of
$8.4 million
during the fiscal year ended January 31, 2017 related to a separate financing arrangement with another diamond mining and exploration company.
Information Systems Assessment
The Company is engaged in a multi-year program to evaluate and, where appropriate, upgrade and/or replace certain of its information systems. As part of this program, the Company identified opportunities to enhance its finished goods inventory management and merchandising capabilities, and began development efforts to replace certain of its existing systems and provide these enhanced capabilities. The Company recently completed an assessment of the replacement system under development to evaluate whether the continued development of this system would deliver sufficiently improved operating capabilities. Following the completion of this assessment, in the three months ended January 31, 2017, the Company concluded that the development of this system should be modified such that the finished goods inventory management and merchandising capabilities that were intended to be delivered utilizing this new system will instead be delivered through further development of the Company’s current Enterprise Resource Planning system and continued implementation of a new order management system. Accordingly, the Company has evaluated the costs capitalized for the development of the replacement system for impairment in accordance with its policy on the review of long-lived assets, and determined, based on specific identification of costs capitalized pertaining to the development of specific capabilities in the new system, that $25.4 million of such capitalized costs relate to software functionality which will not be utilized, and therefore will not have future benefit to the Company. As such, the Company recorded a pre-tax impairment charge of $25.4 million as a component of Selling, General and Administrative expenses in the three months ended January 31, 2017. This multi-year program is ongoing and, as previously disclosed, may require significant capital expenditures and dedication of resources in both current and future periods, though management believes that the modified approach referenced above will ultimately result in a lower overall cost to the Company in delivering these capabilities.
TIFFANY & CO.
K-
43
Contractual Cash Obligations and Commercial Commitments
The following is a summary of the Company's contractual cash obligations at
January 31, 2017
:
|
(in millions)
|
Total
|
|
2017
|
|
2018-2019
|
|
2020-2021
|
|
Thereafter
|
|
|||||
|
Unrecorded contractual obligations:
|
|||||||||||||||
|
Operating leases
a
|
$
|
1,552.7
|
|
$
|
286.2
|
|
$
|
390.8
|
|
$
|
317.5
|
|
$
|
558.2
|
|
|
Inventory purchase obligations
b
|
196.6
|
|
196.6
|
|
—
|
|
—
|
|
—
|
|
|||||
|
Interest on debt
c
|
665.0
|
|
35.9
|
|
71.8
|
|
71.8
|
|
485.5
|
|
|||||
|
Other contractual obligations
d
|
71.4
|
|
48.9
|
|
15.4
|
|
1.0
|
|
6.1
|
|
|||||
|
Recorded contractual obligations:
|
|||||||||||||||
|
Short-term borrowings
|
228.7
|
|
228.7
|
|
—
|
|
—
|
|
—
|
|
|||||
|
Long-term debt
e
|
888.0
|
|
—
|
|
—
|
|
—
|
|
888.0
|
|
|||||
|
$
|
3,602.4
|
|
$
|
796.3
|
|
$
|
478.0
|
|
$
|
390.3
|
|
$
|
1,937.8
|
|
|
|
a)
|
Operating lease obligations do not include obligations for contingent rent, property taxes, insurance and maintenance that are required by most lease agreements. Contingent rent for the year ended January 31,
2017
totaled
$32.4 million
. See "Item 8. Financial Statements and Supplementary Data - Note J. Commitment and Contingencies" for a discussion of the Company’s operating leases.
|
|
b)
|
The Company will, from time to time, enter into arrangements to purchase rough diamonds that contain minimum purchase obligations. Inventory purchase obligations associated with these agreements have been estimated at approximately
$60.0
million for
2017
and included in this table. Purchases beyond
2017
that are contingent upon mine production have been excluded as they cannot be reasonably estimated.
|
|
c)
|
Excludes interest payments on amounts outstanding under available lines of credit, as the outstanding amounts fluctuate based on the Company's working capital needs.
|
|
d)
|
Consists primarily of technology licensing and service contracts, fixed royalty commitments, construction-in-progress and packaging supplies.
|
|
e)
|
Amounts exclude any unamortized discount or premium.
|
The summary above does not include the following items:
|
•
|
Cash contributions to the Company's pension plan and cash payments for other postretirement obligations. The Company funds the Qualified Plan's trust in accordance with regulatory limits to provide for current service and for the unfunded benefit obligation over a reasonable period and for current service benefit accruals. To the extent that these requirements are fully covered by assets in the Qualified Plan, the Company may elect not to make any contribution in a particular year. No cash contribution was required in 2016, and none is required in 2017, to meet the minimum funding requirements of the Employee Retirement Income Security Act ("ERISA"). However, the Company periodically evaluates whether to make discretionary cash contributions to the Qualified Plan and made a voluntary cash contribution of $120.0 million in 2016 but currently does not anticipate making such contributions in 2017. This expectation is subject to change based on management's assessment of a variety of factors, including, but not limited to, asset performance, interest rates and changes in actuarial assumptions. The Company estimates cash payments for postretirement health-care and life insurance benefit obligations to be
$1.9 million
in
2017
.
|
|
•
|
Unrecognized tax benefits at
January 31, 2017
of
$3.4 million
and accrued interest and penalties of
$8.3 million
. The final outcome of tax uncertainties is dependent upon various matters including tax examinations, interpretation of the applicable tax laws or expiration of statutes of limitations. The Company believes that its tax positions comply with applicable tax law and that it has adequately provided for these matters. However, the examinations may result in proposed assessments where the ultimate resolution may result in the Company owing additional taxes. At January 31,
2017
, approximately
$1.0
million of total unrecognized tax benefits, if recognized, would affect the effective income tax rate. As of January 31, 2017,
|
TIFFANY & CO.
K-
44
unrecognized tax benefits are not expected to change materially in the next 12 months. Future developments may result in a change in this assessment.
The following is a summary of the Company's outstanding borrowings and available capacity under its credit facilities at
January 31, 2017
:
|
(in millions)
|
Total
Capacity
|
|
Borrowings Outstanding
|
|
Letters of Credit Issued
|
|
Available
Capacity
|
|
||||
|
Four-year revolving credit facility
a
|
$
|
375.0
|
|
$
|
26.3
|
|
$
|
—
|
|
$
|
348.7
|
|
|
Five-year revolving credit facility
b
|
375.0
|
|
66.7
|
|
4.0
|
|
304.3
|
|
||||
|
Other credit facilities
c
|
281.1
|
|
135.7
|
|
—
|
|
145.4
|
|
||||
|
$
|
1,031.1
|
|
$
|
228.7
|
|
$
|
4.0
|
|
$
|
798.4
|
|
|
a
Matures in October 2019.
b
Matures in October 2020.
c
Maturities through 2019.
In addition, the Company has other available letters of credit and financial guarantees of
$76.1
million of which
$26.4
million was outstanding at
January 31, 2017
. Of those available letters of credit and financial guarantees,
$57.5
million expires within one year.
Seasonality
As a jeweler and specialty retailer, the Company's business is seasonal in nature, with the fourth quarter typically representing approximately one-third of annual net sales and a higher percentage of annual net earnings. Management expects such seasonality to continue.
Critical Accounting Estimates
The Company's consolidated financial statements have been prepared in accordance with accounting principles generally accepted in the United States of America. These principles require management to make certain estimates and assumptions that affect amounts reported and disclosed in the financial statements and related notes. Actual results could differ from those estimates and the differences could be material. Periodically, the Company reviews all significant estimates and assumptions affecting the financial statements and records any necessary adjustments.
The development and selection of critical accounting estimates and the related disclosures below have been reviewed with the Audit Committee of the Company's Board of Directors. The following critical accounting policies that rely on assumptions and estimates were used in the preparation of the Company's consolidated financial statements:
Inventory.
The Company writes down its inventory for discontinued and slow-moving products. This write-down is equal to the difference between the cost of inventory and its estimated market value, and is based on assumptions about future demand and market conditions. If actual market conditions are less favorable than those projected by management, additional inventory write-downs might be required. The Company has not made any material changes in the accounting methodology used to establish its reserve for discontinued and slow-moving products during the past three years. At
January 31, 2017
, a 10% change in the reserve for discontinued and slow-moving products would have resulted in a change of $6.5 million in inventory and cost of sales.
Property, plant and equipment and intangibles assets and key money
. The Company reviews its property, plant and equipment and intangibles assets and key money for impairment when management determines that the carrying value of such assets may not be recoverable due to events or changes in circumstances. Recoverability of these assets is evaluated by comparing the carrying value of the asset with estimated future undiscounted cash flows. If the comparisons indicate that the value of the asset is not recoverable, an impairment loss is calculated as the difference between the carrying value and the fair value of the asset and the loss is recognized during that period. In 2016, the Company recorded an asset impairment charge of $25.4 million associated with software costs capitalized in connection with the development of a new finished goods inventory management and merchandising information system (see "Item 8. Financial Statements and Supplementary Data - Note B. Summary of Significant Accounting
TIFFANY & CO.
K-
45
Policies and Note E. Property, Plant and Equipment" for additional information). The Company did not record any material impairment charges in
2015
or
2014
.
Goodwill
. The Company performs its annual impairment evaluation of goodwill during the fourth quarter of its fiscal year or when circumstances otherwise indicate an evaluation should be performed. A qualitative assessment is first performed for each reporting unit to determine whether it is more-likely-than-not that the fair value of the reporting unit is less than its carrying value. If it is concluded that this is the case, an evaluation, based upon discounted cash flows, is performed and requires management to estimate future cash flows, growth rates and economic and market conditions. The
2016
,
2015
and
2014
evaluations resulted in no impairment charges.
Notes receivable and other financing arrangements.
The Company has provided financing to diamond mining and exploration companies in order to obtain rights to purchase the mine's output. Management evaluates these financing arrangements for potential impairment by reviewing the parties' financial statements and projections along with business, operational and other economic factors on a periodic basis. If the analyses indicate that the financing receivable is not recoverable, an impairment loss is recognized, in respect to all or a portion of the financing, during that period. In 2016 and 2015, the Company recorded impairment charges totaling $12.6 million and $37.9 million, respectively (see "Item 8. Financial Statements and Supplementary Data - Note B. Summary of Significant Accounting Policies and Note J. Commitments and Contingencies" for additional information). The Company did not record any material impairment charges in
2014
.
Income taxes
. The Company is subject to income taxes in U.S. federal and state, as well as foreign jurisdictions. The calculation of the Company's tax liabilities involves dealing with uncertainties in the application of complex tax laws and regulations in a multitude of jurisdictions across the Company's global operations. Significant judgments and estimates are required in determining consolidated income tax expense. The Company's income tax expense, deferred tax assets and liabilities and reserves for uncertain tax positions reflect management's best assessment of estimated future taxes to be paid.
Foreign and domestic tax authorities periodically audit the Company's income tax returns. These audits often examine and test the factual and legal basis for positions the Company has taken in its tax filings with respect to its tax liabilities, including the timing and amount of deductions and the allocation of income among various tax jurisdictions ("tax filing positions"). Management believes that its tax filing positions are reasonable and legally supportable. However, in specific cases, various tax authorities may take a contrary position. In evaluating the exposures associated with the Company's various tax filing positions, management records reserves using a more-likely-than-not recognition threshold for income tax positions taken or expected to be taken. Earnings could be affected to the extent the Company prevails in matters for which reserves have been established or is required to pay amounts in excess of established reserves. At January 31,
2017
, total unrecognized tax benefits were
$3.4
million of which approximately
$1.0
million, if recognized, would affect the effective income tax rate. As of January 31, 2017, unrecognized tax benefits are not expected to change materially in the next 12 months. Future developments may result in a change in this assessment.
In evaluating the Company's ability to recover its deferred tax assets within the jurisdiction from which they arise, management considers all available evidence. The Company records valuation allowances when management determines it is more likely than not that deferred tax assets will not be realized in the future.
Employee benefit plans
. The Company maintains several pension and retirement plans, as well as provides certain postretirement health-care and life insurance benefits for retired employees. The Company makes certain assumptions that affect the underlying estimates related to pension and other postretirement costs. Significant changes in interest rates, the market value of securities and projected health-care costs would require the Company to revise key assumptions and could result in a higher or lower charge to earnings.
The Company used discount rates of 4.50% to determine
2016
expense for its U.S. Qualified Plan as well as its postretirement plans and 4.25% for its Excess Plan/SRIP. Holding all other assumptions constant, a 0.5% increase in the discount rates would have decreased
2016
pension and postretirement expenses by $6.1 million and $0.5 million. A decrease of 0.5% in the discount rates would have increased the
2016
pension and postretirement expenses by $6.6 million and $0.3 million. The discount rate is subject to change each year, consistent with changes in the yield on applicable high-quality, long-term corporate bonds. Management selects a discount rate at which pension and postretirement benefits could be effectively settled based on (i) an analysis of expected benefit payments attributable to current employment service and (ii) appropriate yields related to such cash flows.
TIFFANY & CO.
K-
46
The Company used an expected long-term rate of return on pension plan assets of 7.00% to determine its
2016
pension expense. Holding all other assumptions constant, a 0.5% change in the long-term rate of return would have changed the
2016
pension expense by approximately $1.7 million. The expected long-term rate of return on pension plan assets is selected by taking into account the average rate of return expected on the funds invested or to be invested to provide for the benefits included in the projected benefit obligation. More specifically, consideration is given to the expected rates of return (including reinvestment asset return rates) based upon the plan's current asset mix, investment strategy and the historical performance of plan assets.
For postretirement benefit measurement purposes, a 7.00% annual rate of increase in the per capita cost of covered health care was assumed for
2017
. The rate was assumed to decrease gradually to 4.75% by 2023 and remain at that level thereafter. A one-percentage-point change in the assumed health-care cost trend rate would not have a significant effect on the Company's accumulated postretirement benefit obligation for the year ended January 31,
2017
or aggregate service and interest cost components of the
2016
postretirement expense.
2017 Outlook
For the fiscal year ending January 31, 2018 ("fiscal 2017"), management's outlook calls for: (i) worldwide net sales increasing over the prior year by a low-single-digit percentage and by a mid-single-digit percentage on a constant-exchange-rate basis and (ii) net earnings per diluted share increasing by a high-single-digit percentage over 2016's earnings per diluted share of
$3.55
and by a mid-single-digit percentage over 2016's earnings per diluted share (excluding charges) of $3.75 (see "Non-GAAP Measures"). These expectations are approximations and are based on the Company's plans and assumptions, including: (i) worldwide gross retail square footage increasing 3%, net through 11 store openings, 9 relocations and 6 closings; (ii) operating margin above the prior year entirely due to an expected increase in gross margin, with SG&A expenses increasing slightly faster than sales growth; (iii) interest and other expenses, net of approximately $40 million; (iv) an effective income tax rate consistent with the prior year; (v) the U.S. dollar in 2017 stronger overall than other foreign currencies on a year-over-year basis; and (vi) minimal benefit to net earnings per diluted share from share repurchases.
Management also expects for fiscal 2017: (i) net cash provided by operating activities of approximately $700 million and (ii) free cash flow (see "Non-GAAP Measures") of approximately $450 million. These expectations are approximations and are based on the Company's plans and assumptions, including: (i) net inventories unchanged from the prior year, (ii) capital expenditures of $250 million and (iii) net earnings in line with management’s expectations as described above.
NEW ACCOUNTING STANDARDS
See "Item 8. Financial Statements and Supplementary Data - Note B. Summary of Significant Accounting Policies."
OFF-BALANCE SHEET ARRANGEMENTS
The Company does not have any off-balance sheet arrangements.
TIFFANY & CO.
K-
47
The Company is exposed to market risk from fluctuations in foreign currency exchange rates, precious metal prices and interest rates, which could affect its consolidated financial position, earnings and cash flows. The Company manages its exposure to market risk through its regular operating and financing activities and, when deemed appropriate, through the use of derivative financial instruments. The Company uses derivative financial instruments as risk management tools and not for trading or speculative purposes.
Foreign Currency Risk
The Company uses foreign exchange forward contracts or put option contracts to offset a portion of the foreign currency exchange risks associated with foreign currency-denominated liabilities, intercompany transactions and forecasted purchases of merchandise between entities with differing functional currencies. The maximum term of the Company's outstanding foreign exchange forward contracts as of
January 31, 2017
is 12 months. At
January 31, 2017
and
2016
, the fair values of the Company's outstanding foreign exchange forwards were net assets of
$7.1 million
and net liabilities of
$0.9 million
, respectively.
In 2016, the Company entered into cross-currency swaps to hedge the foreign exchange risk associated with Japanese yen-denominated intercompany loans. As of
January 31, 2017
, the notional amount of these cross-currency swaps was approximately ¥10.6 billion or $100.0 million. The cross-currency swaps have a term ending on October 1, 2024. At
January 31, 2017
, the fair value of the Company's outstanding cross-currency swaps were liabilities of
$0.4 million
.
At
January 31, 2017
, for the total contracts and swaps noted above, a 10% depreciation in the hedged foreign exchange rates from the prevailing market rates would have resulted in a liability with a fair value of approximately $44.0 million.
Precious Metal Price Risk
The Company periodically hedges a portion of its forecasted purchases of precious metals for use in its internal manufacturing operations in order to manage the effect of volatility in precious metal prices. The Company may use a combination of call and put option contracts in net-zero-cost collar arrangements ("precious metal collars") or forward contracts. For precious metal collars, if the price of the precious metal at the time of the expiration of the precious metal collar is within the call and put price, the precious metal collar would expire at no cost to the Company. The maximum term of the Company's outstanding precious metal forward contracts as of
January 31, 2017
is 24 months. At
January 31, 2017
and
2016
, the fair values of the Company's outstanding precious metal derivative instruments were net liabilities of
$1.7 million
and $12.6 million, respectively. At
January 31, 2017
, a 10% depreciation in precious metal prices from the prevailing market rates would have resulted in a liability with a fair value of approximately $16.0 million.
TIFFANY & CO.
K-
48
Report of Independent Registered Public Accounting Firm
To the Shareholders and Board of Directors of Tiffany & Co.:
In our opinion, the accompanying consolidated balance sheets and the related consolidated statements of earnings, of comprehensive earnings, of stockholders' equity, and of cash flows present fairly, in all material respects, the financial position of Tiffany & Co. and its subsidiaries (the "Company")
at January 31, 2017 and 2016, and the results of their operations and their cash flows for each of the three years in the period ended January 31, 2017
in conformity with accounting principles generally accepted in the United States of America. In addition, in our opinion, the financial statement schedule listed in the index appearing under Item 15(a)(2) presents fairly, in all material respects, the information set forth therein when read in conjunction with the related consolidated financial statements. Also in our opinion, the Company maintained, in all material respects, effective internal control over financial reporting as of January 31, 2017, based on criteria established in
Internal Control - Integrated Framework (2013)
issued by the Committee of Sponsoring Organizations of the Treadway Commission (COSO). The Company's management is responsible for these financial statements and financial statement schedule, for maintaining effective internal control over financial reporting and for its assessment of the effectiveness of internal control over financial reporting, included in Management's Report on Internal Control over Financial Reporting, appearing under Item 9A. Our responsibility is to express opinions on these financial statements, on the financial statement schedule, and on the Company's internal control over financial reporting based on our integrated audits. We conducted our audits in accordance with the standards of the Public Company Accounting Oversight Board (United States). Those standards require that we plan and perform the audits to obtain reasonable assurance about whether the financial statements are free of material misstatement and whether effective internal control over financial reporting was maintained in all material respects. Our audits of the financial statements included examining, on a test basis, evidence supporting the amounts and disclosures in the financial statements, assessing the accounting principles used and significant estimates made by management, and evaluating the overall financial statement presentation. Our audit of internal control over financial reporting included obtaining an understanding of internal control over financial reporting, assessing the risk that a material weakness exists, and testing and evaluating the design and operating effectiveness of internal control based on the assessed risk. Our audits also included performing such other procedures as we considered necessary in the circumstances. We believe that our audits provide a reasonable basis for our opinions.
A company's internal control over financial reporting is a process designed to provide reasonable assurance regarding the reliability of financial reporting and the preparation of financial statements for external purposes in accordance with generally accepted accounting principles. A company's internal control over financial reporting includes those policies and procedures that (i) pertain to the maintenance of records that, in reasonable detail, accurately and fairly reflect the transactions and dispositions of the assets of the company; (ii) provide reasonable assurance that transactions are recorded as necessary to permit preparation of financial statements in accordance with generally accepted accounting principles, and that receipts and expenditures of the company are being made only in accordance with authorizations of management and directors of the company; and (iii) provide reasonable assurance regarding prevention or timely detection of unauthorized acquisition, use, or disposition of the company's assets that could have a material effect on the financial statements.
Because of its inherent limitations, internal control over financial reporting may not prevent or detect misstatements. Also, projections of any evaluation of effectiveness to future periods are subject to the risk that controls may become inadequate because of changes in conditions, or that the degree of compliance with the policies or procedures may deteriorate.
/s/ PricewaterhouseCoopers LLP
New York, New York
March 17, 2017
TIFFANY & CO.
K-
49
|
January 31,
|
|||||||
|
(in millions, except per share amounts)
|
2017
|
|
2016
|
|
|||
|
ASSETS
|
|||||||
|
Current assets:
|
|||||||
|
Cash and cash equivalents
|
$
|
928.0
|
|
$
|
843.6
|
|
|
|
Short-term investments
|
57.8
|
|
43.0
|
|
|||
|
Accounts receivable, less allowances of $11.5 and $11.5
|
226.8
|
|
206.4
|
|
|||
|
Inventories, net
|
2,157.6
|
|
2,225.0
|
|
|||
|
Prepaid expenses and other current assets
|
203.4
|
|
190.4
|
|
|||
|
Total current assets
|
3,573.6
|
|
3,508.4
|
|
|||
|
Property, plant and equipment, net
|
931.8
|
|
935.8
|
|
|||
|
Deferred income taxes
|
301.8
|
|
382.8
|
|
|||
|
Other assets, net
|
290.4
|
|
294.6
|
|
|||
|
$
|
5,097.6
|
|
$
|
5,121.6
|
|
||
|
LIABILITIES AND STOCKHOLDERS' EQUITY
|
|||||||
|
Current liabilities:
|
|||||||
|
Short-term borrowings
|
$
|
228.7
|
|
$
|
221.6
|
|
|
|
Current portion of long-term debt
|
—
|
|
84.2
|
|
|||
|
Accounts payable and accrued liabilities
|
312.8
|
|
329.1
|
|
|||
|
Income taxes payable
|
22.1
|
|
27.1
|
|
|||
|
Merchandise credits and deferred revenue
|
69.2
|
|
67.9
|
|
|||
|
Total current liabilities
|
632.8
|
|
729.9
|
|
|||
|
Long-term debt
|
878.4
|
|
790.0
|
|
|||
|
Pension/postretirement benefit obligations
|
318.6
|
|
428.1
|
|
|||
|
Deferred gains on sale-leasebacks
|
45.9
|
|
55.1
|
|
|||
|
Other long-term liabilities
|
193.5
|
|
189.0
|
|
|||
|
Commitments and contingencies
|
|
|
|
|
|||
|
Stockholders' equity:
|
|||||||
|
Preferred Stock, $0.01 par value; authorized 2.0 shares, none issued and outstanding
|
—
|
|
—
|
|
|||
|
Common Stock, $0.01 par value; authorized 240.0 shares, issued and outstanding 124.5 and 126.8
|
1.2
|
|
1.3
|
|
|||
|
Additional paid-in capital
|
1,190.2
|
|
1,175.7
|
|
|||
|
Retained earnings
|
2,078.3
|
|
2,012.5
|
|
|||
|
Accumulated other comprehensive loss, net of tax
|
(256.2
|
)
|
(278.1
|
)
|
|||
|
Total Tiffany & Co. stockholders' equity
|
3,013.5
|
|
2,911.4
|
|
|||
|
Non-controlling interests
|
14.9
|
|
18.1
|
|
|||
|
Total stockholders' equity
|
3,028.4
|
|
2,929.5
|
|
|||
|
$
|
5,097.6
|
|
$
|
5,121.6
|
|
||
|
See notes to consolidated financial statements.
|
|||||||
TIFFANY & CO.
K-
50
|
|
Years Ended January 31,
|
||||||||
|
(in millions, except per share amounts)
|
2017
|
|
2016
|
|
2015
|
|
|||
|
Net sales
|
$
|
4,001.8
|
|
$
|
4,104.9
|
|
$
|
4,249.9
|
|
|
Cost of sales
|
1,511.5
|
|
1,613.6
|
|
1,712.7
|
|
|||
|
Gross profit
|
2,490.3
|
|
2,491.3
|
|
2,537.2
|
|
|||
|
Selling, general and administrative expenses
|
1,769.1
|
|
1,731.2
|
|
1,645.8
|
|
|||
|
Earnings from operations
|
721.2
|
|
760.1
|
|
891.4
|
|
|||
|
Interest expense and financing costs
|
46.0
|
|
49.0
|
|
62.9
|
|
|||
|
Other (income) expense, net
|
(1.4
|
)
|
1.2
|
|
(2.8
|
)
|
|||
|
Loss on extinguishment of debt
|
—
|
|
—
|
|
93.8
|
|
|||
|
Earnings from operations before income taxes
|
676.6
|
|
709.9
|
|
737.5
|
|
|||
|
Provision for income taxes
|
230.5
|
|
246.0
|
|
253.3
|
|
|||
|
Net earnings
|
$
|
446.1
|
|
$
|
463.9
|
|
$
|
484.2
|
|
|
Net earnings per share:
|
|||||||||
|
Basic
|
$
|
3.57
|
|
$
|
3.61
|
|
$
|
3.75
|
|
|
Diluted
|
$
|
3.55
|
|
$
|
3.59
|
|
$
|
3.73
|
|
|
Weighted-average number of common shares:
|
|||||||||
|
Basic
|
125.1
|
|
128.6
|
|
129.2
|
|
|||
|
Diluted
|
125.5
|
|
129.1
|
|
129.9
|
|
|||
|
See notes to consolidated financial statements.
|
|||||||||
TIFFANY & CO.
K-
51
CONSOLIDATED STATEMENTS OF COMPREHENSIVE EARNINGS
|
|
Years Ended January 31,
|
||||||||
|
(in millions)
|
2017
|
|
2016
|
|
2015
|
|
|||
|
Net earnings
|
$
|
446.1
|
|
$
|
463.9
|
|
$
|
484.2
|
|
|
Other comprehensive earnings (loss), net of tax
|
|||||||||
|
Foreign currency translation adjustments
|
(8.4
|
)
|
(59.0
|
)
|
(93.1
|
)
|
|||
|
Unrealized gain (loss) on marketable securities
|
1.8
|
|
(2.9
|
)
|
(0.8
|
)
|
|||
|
Unrealized gain (loss) on hedging instruments
|
10.7
|
|
(21.4
|
)
|
1.2
|
|
|||
|
Net unrealized gain (loss) on benefit plans
|
17.8
|
|
95.7
|
|
(139.2
|
)
|
|||
|
Total other comprehensive earnings (loss), net of tax
|
21.9
|
|
12.4
|
|
(231.9
|
)
|
|||
|
Comprehensive earnings
|
$
|
468.0
|
|
$
|
476.3
|
|
$
|
252.3
|
|
|
See notes to consolidated financial statements.
|
|||||||||
TIFFANY & CO.
K-
52
CONSOLIDATED STATEMENTS OF STOCKHOLDERS' EQUITY
|
|
Total
Stockholders' Equity |
Retained
Earnings
|
Accumulated
Other
Comprehensive
Loss
|
Common Stock
|
Additional
Paid-In
Capital
|
Non-
Controlling
Interests
|
||||||||||||||||||||
|
(in millions)
|
Shares
|
Amount
|
||||||||||||||||||||||||
|
Balance at January 31, 2014
|
$
|
2,734.0
|
|
$
|
1,682.5
|
|
$
|
(58.6
|
)
|
128.3
|
|
$
|
1.3
|
|
$
|
1,095.3
|
|
$
|
13.5
|
|
||||||
|
Exercise of stock options and vesting of restricted stock units ("RSUs")
|
36.9
|
|
—
|
|
—
|
|
1.3
|
|
—
|
|
36.9
|
|
—
|
|
||||||||||||
|
Tax effect of exercise of stock options and vesting of RSUs
|
14.1
|
|
—
|
|
—
|
|
—
|
|
—
|
|
14.1
|
|
—
|
|
||||||||||||
|
Share-based compensation expense
|
26.7
|
|
—
|
|
—
|
|
—
|
|
—
|
|
26.7
|
|
—
|
|
||||||||||||
|
Issuance of Common Stock under Employee Profit Sharing and Retirement Savings Plan
|
3.9
|
|
—
|
|
—
|
|
—
|
|
—
|
|
3.9
|
|
—
|
|
||||||||||||
|
Purchase and retirement of Common Stock
|
(27.0
|
)
|
(24.8
|
)
|
—
|
|
(0.3
|
)
|
—
|
|
(2.2
|
)
|
—
|
|
||||||||||||
|
Cash dividends on Common Stock
|
(191.2
|
)
|
(191.2
|
)
|
—
|
|
—
|
|
—
|
|
—
|
|
—
|
|
||||||||||||
|
Other comprehensive loss, net of tax
|
(231.9
|
)
|
—
|
|
(231.9
|
)
|
—
|
|
—
|
|
—
|
|
—
|
|
||||||||||||
|
Net earnings
|
484.2
|
|
484.2
|
|
—
|
|
—
|
|
—
|
|
—
|
|
—
|
|
||||||||||||
|
Redemption of non-controlling interest
|
—
|
|
—
|
|
—
|
|
—
|
|
—
|
|
(1.1
|
)
|
1.1
|
|
||||||||||||
|
Non-controlling interests
|
1.0
|
|
—
|
|
—
|
|
—
|
|
—
|
|
—
|
|
1.0
|
|
||||||||||||
|
Balance at January 31, 2015
|
2,850.7
|
|
1,950.7
|
|
(290.5
|
)
|
129.3
|
|
1.3
|
|
1,173.6
|
|
15.6
|
|
||||||||||||
|
Exercise of stock options and vesting of RSUs
|
0.3
|
|
—
|
|
—
|
|
0.3
|
|
—
|
|
0.3
|
|
—
|
|
||||||||||||
|
Tax effect of exercise of stock options and vesting of RSUs
|
2.1
|
|
—
|
|
—
|
|
—
|
|
—
|
|
2.1
|
|
—
|
|
||||||||||||
|
Share-based compensation expense
|
24.8
|
|
—
|
|
—
|
|
—
|
|
—
|
|
24.8
|
|
—
|
|
||||||||||||
|
Purchase and retirement of Common Stock
|
(220.4
|
)
|
(198.7
|
)
|
—
|
|
(2.8
|
)
|
—
|
|
(21.7
|
)
|
—
|
|
||||||||||||
|
Cash dividends on Common Stock
|
(203.4
|
)
|
(203.4
|
)
|
—
|
|
—
|
|
—
|
|
—
|
|
—
|
|
||||||||||||
|
Other comprehensive earnings, net of tax
|
12.4
|
|
—
|
|
12.4
|
|
—
|
|
—
|
|
—
|
|
—
|
|
||||||||||||
|
Net earnings
|
463.9
|
|
463.9
|
|
—
|
|
—
|
|
—
|
|
—
|
|
—
|
|
||||||||||||
|
Redemption of non-controlling interest
|
(2.2
|
)
|
—
|
|
—
|
|
—
|
|
—
|
|
(3.4
|
)
|
1.2
|
|
||||||||||||
|
Non-controlling interests
|
1.3
|
|
—
|
|
—
|
|
—
|
|
—
|
|
—
|
|
1.3
|
|
||||||||||||
|
Balance at January 31, 2016
|
2,929.5
|
|
2,012.5
|
|
(278.1
|
)
|
126.8
|
|
1.3
|
|
1,175.7
|
|
18.1
|
|
||||||||||||
|
Exercise of stock options and vesting of RSUs
|
12.5
|
|
—
|
|
—
|
|
0.5
|
|
—
|
|
12.5
|
|
—
|
|
||||||||||||
|
Tax effect of exercise of stock options and vesting of RSUs
|
(0.5
|
)
|
—
|
|
—
|
|
—
|
|
—
|
|
(0.5
|
)
|
—
|
|
||||||||||||
|
Share-based compensation expense
|
24.5
|
|
—
|
|
—
|
|
—
|
|
—
|
|
24.5
|
|
—
|
|
||||||||||||
|
Purchase and retirement of Common Stock
|
(183.6
|
)
|
(161.5
|
)
|
—
|
|
(2.8
|
)
|
(0.1
|
)
|
(22.0
|
)
|
—
|
|
||||||||||||
|
Cash dividends on Common Stock
|
(218.8
|
)
|
(218.8
|
)
|
—
|
|
—
|
|
—
|
|
—
|
|
—
|
|
||||||||||||
|
Other comprehensive earnings, net of tax
|
21.9
|
|
—
|
|
21.9
|
|
—
|
|
—
|
|
—
|
|
—
|
|
||||||||||||
|
Net earnings
|
446.1
|
|
446.1
|
|
—
|
|
—
|
|
—
|
|
—
|
|
—
|
|
||||||||||||
|
Non-controlling interests
|
(3.2
|
)
|
—
|
|
—
|
|
—
|
|
—
|
|
—
|
|
(3.2
|
)
|
||||||||||||
|
Balance at January 31, 2017
|
$
|
3,028.4
|
|
$
|
2,078.3
|
|
$
|
(256.2
|
)
|
124.5
|
|
$
|
1.2
|
|
$
|
1,190.2
|
|
$
|
14.9
|
|
||||||
|
See notes to consolidated financial statements.
|
||||||||||||||||||||||||||
TIFFANY & CO.
K-
53
|
|
Years Ended January 31,
|
||||||||||
|
(in millions)
|
2017
|
|
2016
|
|
2015
|
|
|||||
|
CASH FLOWS FROM OPERATING ACTIVITIES:
|
|||||||||||
|
Net earnings
|
$
|
446.1
|
|
$
|
463.9
|
|
$
|
484.2
|
|
||
|
Adjustments to reconcile net earnings to net cash provided by operating activities:
|
|||||||||||
|
Depreciation and amortization
|
208.5
|
|
202.5
|
|
194.2
|
|
|||||
|
Amortization of gain on sale-leasebacks
|
(8.5
|
)
|
(8.3
|
)
|
(9.2
|
)
|
|||||
|
Excess tax benefits from share-based payment arrangements
|
(0.7
|
)
|
(2.2
|
)
|
(14.1
|
)
|
|||||
|
Provision for inventories
|
19.2
|
|
25.4
|
|
33.6
|
|
|||||
|
Deferred income taxes
|
46.1
|
|
(1.9
|
)
|
37.7
|
|
|||||
|
Provision for pension/postretirement benefits
|
45.4
|
|
65.8
|
|
39.2
|
|
|||||
|
Share-based compensation expense
|
24.3
|
|
24.5
|
|
26.5
|
|
|||||
|
Loan impairment charges
|
12.6
|
|
37.9
|
|
—
|
|
|||||
|
Asset impairment charge
|
25.4
|
|
—
|
|
—
|
|
|||||
|
Changes in assets and liabilities:
|
|||||||||||
|
Accounts receivable
|
(19.2
|
)
|
(16.7
|
)
|
(17.6
|
)
|
|||||
|
Inventories
|
54.8
|
|
63.7
|
|
(167.6
|
)
|
|||||
|
Prepaid expenses and other current assets
|
33.6
|
|
1.1
|
|
(20.9
|
)
|
|||||
|
Other assets, net
|
0.8
|
|
(17.5
|
)
|
(20.2
|
)
|
|||||
|
Accounts payable and accrued liabilities
|
(24.6
|
)
|
(15.3
|
)
|
(5.9
|
)
|
|||||
|
Income taxes payable
|
(39.3
|
)
|
3.1
|
|
81.9
|
|
|||||
|
Merchandise credits and deferred revenue
|
1.5
|
|
3.0
|
|
(2.7
|
)
|
|||||
|
Other long-term liabilities
|
(123.9
|
)
|
(15.4
|
)
|
(24.0
|
)
|
|||||
|
Net cash provided by operating activities
|
702.1
|
|
813.6
|
|
615.1
|
|
|||||
|
CASH FLOWS FROM INVESTING ACTIVITIES:
|
|||||||||||
|
Purchases of marketable securities and short-term investments
|
(125.5
|
)
|
(100.0
|
)
|
(40.1
|
)
|
|||||
|
Proceeds from sales of marketable securities and short-term investments
|
109.8
|
|
73.6
|
|
55.3
|
|
|||||
|
Capital expenditures
|
(222.8
|
)
|
(252.7
|
)
|
(247.4
|
)
|
|||||
|
Proceeds from sale of assets, net
|
—
|
|
0.9
|
|
—
|
|
|||||
|
Proceeds from notes receivable
|
1.7
|
|
—
|
|
15.2
|
|
|||||
|
Net cash used in investing activities
|
(236.8
|
)
|
(278.2
|
)
|
(217.0
|
)
|
|||||
|
CASH FLOWS FROM FINANCING ACTIVITIES:
|
|||||||||||
|
Proceeds from (repayment of) credit facility borrowings, net
|
14.2
|
|
(11.3
|
)
|
(12.5
|
)
|
|||||
|
Proceeds from other credit facility borrowings
|
76.8
|
|
24.8
|
|
19.8
|
|
|||||
|
Repayment of other credit facility borrowings
|
(83.1
|
)
|
(16.0
|
)
|
(3.4
|
)
|
|||||
|
Proceeds from the issuance of long-term debt
|
98.1
|
|
—
|
|
548.0
|
|
|||||
|
Repayment of long-term debt
|
(97.1
|
)
|
—
|
|
(400.0
|
)
|
|||||
|
Payment for settlement of interest rate swaps
|
—
|
|
—
|
|
(4.2
|
)
|
|||||
|
Repurchase of Common Stock
|
(183.6
|
)
|
(220.4
|
)
|
(27.0
|
)
|
|||||
|
Proceeds from exercised stock options
|
15.3
|
|
2.0
|
|
42.9
|
|
|||||
|
Excess tax benefits from share-based payment arrangements
|
0.7
|
|
2.2
|
|
14.1
|
|
|||||
|
Cash dividends on Common Stock
|
(218.8
|
)
|
(203.4
|
)
|
(191.2
|
)
|
|||||
|
Distribution to non-controlling interest
|
(3.8
|
)
|
—
|
|
(1.9
|
)
|
|||||
|
Financing fees
|
(1.5
|
)
|
(0.2
|
)
|
(8.0
|
)
|
|||||
|
Net cash used in financing activities
|
(382.8
|
)
|
(422.3
|
)
|
(23.4
|
)
|
|||||
|
Effect of exchange rate changes on cash and cash equivalents
|
1.9
|
|
0.5
|
|
9.5
|
|
|||||
|
Net increase in cash and cash equivalents
|
84.4
|
|
113.6
|
|
384.2
|
|
|||||
|
Cash and cash equivalents at beginning of year
|
843.6
|
|
730.0
|
|
345.8
|
|
|||||
|
Cash and cash equivalents at end of year
|
$
|
928.0
|
|
$
|
843.6
|
|
$
|
730.0
|
|
||
|
See notes to consolidated financial statements.
|
|||||||||||
TIFFANY & CO.
K-
54
NOTES TO CONSOLIDATED FINANCIAL STATEMENTS
|
A.
|
NATURE OF BUSINESS
|
Tiffany & Co. is a holding company that operates through its subsidiary companies (collectively, the "Company"). Its principal subsidiary, Tiffany and Company ("Tiffany"), is a jeweler and specialty retailer. Through its subsidiaries, the Company designs and manufactures products and operates TIFFANY & CO. retail stores worldwide, and also sells its products through Internet, catalog, business-to-business and wholesale operations. The Company's principal merchandise offering is jewelry (representing 92% of worldwide net sales in
2016
); it also sells timepieces, leather goods, sterling silverware, china, crystal, stationery, fragrances and accessories.
The Company's reportable segments are as follows:
|
•
|
Americas includes sales in Company-operated TIFFANY & CO. stores in the United States, Canada and Latin America, as well as sales of TIFFANY & CO. products in certain markets through Internet, catalog, business-to-business and wholesale operations;
|
|
•
|
Asia-Pacific includes sales in Company-operated TIFFANY & CO. stores, as well as sales of TIFFANY & CO. products in certain markets through Internet and wholesale operations;
|
|
•
|
Japan includes sales in Company-operated TIFFANY & CO. stores, as well as sales of TIFFANY & CO. products through Internet, business-to-business and wholesale operations;
|
|
•
|
Europe includes sales in Company-operated TIFFANY & CO. stores, as well as sales of TIFFANY & CO. products in certain markets through the Internet and wholesale operations; and
|
|
•
|
Other consists of all non-reportable segments. Other includes the Emerging Markets region, which includes sales in Company-operated TIFFANY & CO. stores and wholesale operations in the Middle East. In addition, Other includes wholesale sales of diamonds as well as earnings received from third-party licensing agreements.
|
|
B.
|
SUMMARY OF SIGNIFICANT ACCOUNTING POLICIES
|
Fiscal Year
The Company's fiscal year ends on January 31 of the following calendar year. All references to years relate to fiscal years rather than calendar years.
Basis of Reporting
The accompanying consolidated financial statements include the accounts of Tiffany & Co. and its subsidiaries in which a controlling interest is maintained. Controlling interest is determined by majority ownership interest and the absence of substantive third-party participating rights or, in the case of variable interest entities (VIEs), if the Company has the power to significantly direct the activities of a VIE, as well as the obligation to absorb significant losses of or the right to receive significant benefits from the VIE. Intercompany accounts, transactions and profits have been eliminated in consolidation. The equity method of accounting is used for investments in which the Company has significant influence, but not a controlling interest.
Certain prior year amounts have been reclassified to conform with the current year presentation. The Company adopted ASU No. 2015-03 –
Simplifying the Presentation of Debt Issuance Costs
, on a retrospective basis, as of February 1, 2016. Accordingly, debt issuance costs of $8.1 million were reclassified from other assets, net to a direct deduction from long-term debt at January 31, 2016.
Use of Estimates
These financial statements have been prepared in accordance with accounting principles generally accepted in the United States of America; these principles require management to make certain estimates and assumptions that
TIFFANY & CO.
K-
55
affect amounts reported and disclosed in the consolidated financial statements and related notes to the consolidated financial statements. Actual results could differ from these estimates and the differences could be material. Periodically, the Company reviews all significant estimates and assumptions affecting the financial statements relative to current conditions and records the effect of any necessary adjustments.
Cash and Cash Equivalents
Cash and cash equivalents are stated at cost plus accrued interest, which approximates fair value. Cash equivalents include highly liquid investments with an original maturity of three months or less and consist of time deposits and/or money market fund investments with a number of U.S. and non-U.S. financial institutions with high credit ratings. The Company's policy restricts the amount invested with any one financial institution.
Short-Term Investments
Short-term investments are classified as available-for-sale and are carried at fair value. At
January 31, 2017
and
2016
, the Company's short-term available-for-sale investments consisted entirely of time deposits. At the time of purchase, management determines the appropriate classification of these investments and reevaluates such designation as of each balance sheet date.
Receivables and Financing Arrangements
Receivables.
The Company's accounts receivable, net primarily consists of amounts due from Credit Receivables (defined below), department store operators that host TIFFANY & CO. boutiques in their stores, third-party credit card issuers and wholesale customers. The Company maintains an allowance for doubtful accounts for estimated losses associated with the accounts receivable recorded on the balance sheet. The allowance is determined based on a combination of factors including, but not limited to, the length of time that the receivables are past due, management's knowledge of the customer, economic and market conditions and historical write-off experiences.
For the receivables associated with Tiffany & Co. credit cards ("Credit Card Receivables"), management uses various indicators to determine whether to extend credit to customers and the amount of credit. Such indicators include reviewing prior experience with the customer, including sales and collection history, and using applicants' credit reports and scores provided by credit rating agencies. Certain customers may be granted payment terms which permit purchases above a minimum amount to be paid for in equal monthly installments over a period not to exceed 12 months (together with Credit Card Receivables, "Credit Receivables"). Credit Receivables require minimum balance payments. An account is classified as overdue if a minimum balance payment has not been received within the allotted timeframe (generally 30 days), after which internal collection efforts commence. In order for the account to return to current status, full payment on all past due amounts needs to be received by the Company. For all Credit Receivables recorded on the balance sheet, once all internal collection efforts have been exhausted and management has reviewed the account, the account balance is written off and may be sent for external collection or legal action. At
January 31, 2017
and
2016
, the carrying amount of the Credit Receivables (recorded in accounts receivable, net) was
$71.9
million and $
75.2
million, of which
97%
were considered current in both periods. The allowance for doubtful accounts for estimated losses associated with the Credit Receivables (approximately
$1.1
million at
January 31, 2017
and $1.0 million at January 31,
2016
) was determined based on the factors discussed above. Finance charges earned on Credit Card accounts are not significant.
Financing Arrangements.
The Company has provided financing to diamond mining and exploration companies in order to obtain rights to purchase the mine's output (see "Note J. Commitments and Contingencies"). Management evaluates these financing arrangements for potential impairment by reviewing the parties' financial statements along with projections and business, operational and other economic factors on a periodic basis.
As of
January 31, 2017
, the Company had a
$43.8 million
financing arrangement (the "Loan") with Koidu Limited (previously Koidu Holdings S.A.) ("Koidu"). The Company recorded impairment charges totaling
$4.2 million
and
$37.9 million
during the fiscal years ended January 31, 2017 and 2016 related to the Loan and ceased accruing interest income on the loan as of July 2015. The net carrying amount of the Loan was
$1.7 million
as of
January 31, 2017
. See "Note J. Commitments and Contingencies" for additional information on this financing arrangement.
TIFFANY & CO.
K-
56
The Company also recorded an impairment charge, and a related valuation allowance, of
$8.4 million
during the fiscal year ended January 31, 2017 related to a separate financing arrangement with another diamond mining and exploration company.
At
January 31, 2017
and
2016
, the current portion of the carrying amount of financing arrangements including accrued interest was
$4.6 million
and
$2.1 million
and was recorded in prepaid expenses and other current assets. At
January 31, 2017
and
2016
, the non-current portion of the carrying amount of financing arrangements including accrued interest was
$4.4 million
and
$18.9 million
and was included in other assets, net.
Inventories
Inventories are valued at the lower of cost or market using the average cost method except for certain diamond and gemstone jewelry which uses the specific identification method.
Property, Plant and Equipment
Property, plant and equipment are stated at cost less accumulated depreciation. Depreciation is calculated on a straight-line basis over the following estimated useful lives:
|
Buildings
|
39 years
|
|
Machinery and equipment
|
5-15 years
|
|
Office equipment
|
3-8 years
|
|
Software
|
5-10 years
|
|
Furniture and fixtures
|
3-10 years
|
Leasehold improvements and building improvements are amortized over the shorter of their estimated useful lives (ranging from 8-10 years) or the related lease terms or building life, respectively. Maintenance and repair costs are charged to earnings while expenditures for major renewals and improvements are capitalized. Upon the disposition of property, plant and equipment, the accumulated depreciation is deducted from the original cost and any gain or loss is reflected in current earnings.
The Company capitalizes interest on borrowings during the active construction period of major capital projects. Capitalized interest is added to the cost of the underlying assets and is amortized over the useful lives of the assets. The Company's capitalized interest costs were not significant in
2016
,
2015
or
2014
.
Information Systems Development Costs
Eligible costs incurred during the development stage of information systems projects are capitalized and amortized over the estimated useful life of the related project. Eligible costs include those related to the purchase, development, and installation of the related software. Costs incurred prior to the development stage, as well as costs for maintenance, data conversion, training, and other general and administrative costs, are expensed as incurred. Costs that are capitalized are included in Property, Plant and Equipment, in Construction-in-progress while in the development stage and in Software once placed into service.
Capitalized software costs are subject to the Company’s accounting policy related to the review of long-lived assets for impairment. See "Impairment of Long-Lived Assets"
below for further details.
Intangible Assets and Key Money
Intangible assets, consisting of product rights and trademarks, are recorded at cost and are amortized on a straight-line basis over their estimated useful lives which range from
15
to
20
years. Intangible assets are reviewed for impairment in accordance with the Company's policy for impairment of long-lived assets (see "Impairment of Long-Lived Assets" below).
Key money is the amount of funds paid to a landlord or tenant to acquire the rights of tenancy under a commercial property lease for a certain property. Key money represents the "right to lease" with an automatic right of renewal.
TIFFANY & CO.
K-
57
This right can be subsequently sold by the Company or can be recovered should the landlord refuse to allow the automatic right of renewal to be exercised. Key money is amortized over the estimated useful life,
39
years.
The following table summarizes intangible assets and key money, included in other assets, net, as follows:
|
January 31, 2017
|
January 31, 2016
|
|||||||||||
|
(in millions)
|
Gross Carrying Amount
|
Accumulated Amortization
|
Gross Carrying
Amount
|
Accumulated Amortization
|
||||||||
|
Product rights
|
$
|
48.9
|
|
$
|
(11.0
|
)
|
$
|
49.6
|
|
$
|
(9.2
|
)
|
|
Key money deposits
|
31.9
|
|
(4.1
|
)
|
32.7
|
|
(3.3
|
)
|
||||
|
Trademarks
|
2.5
|
|
(2.5
|
)
|
2.5
|
|
(2.5
|
)
|
||||
|
$
|
83.3
|
|
$
|
(17.6
|
)
|
$
|
84.8
|
|
$
|
(15.0
|
)
|
|
Amortization of intangible assets and key money for the years ended January 31,
2017
,
2016
and
2015
was
$3.4
million,
$3.7
million and
$7.8
million. Amortization expense is estimated to be approximately
$3.4
million in each of the next five years.
Goodwill
Goodwill represents the excess of cost over fair value of net assets acquired in a business combination. Goodwill is evaluated for impairment annually in the fourth quarter or when events or changes in circumstances indicate that the value of goodwill may be impaired. A qualitative assessment is first performed for each reporting unit to determine whether it is more-likely-than-not that the fair value of a reporting unit is less than its carrying value. If it is concluded that this is the case, a quantitative evaluation, based on discounted cash flows, is performed and requires management to estimate future cash flows, growth rates and economic and market conditions. If the quantitative evaluation indicates that goodwill is not recoverable, an impairment loss is calculated and recognized during that period. At
January 31, 2017
and
2016
, goodwill, included in other assets, net, consisted of the following by segment:
|
(in millions)
|
Americas
|
Asia-Pacific
|
Japan
|
Europe
|
Other
|
Total
|
||||||||||||
|
January 31, 2015
|
$
|
12.3
|
|
$
|
0.3
|
|
$
|
1.1
|
|
$
|
1.1
|
|
$
|
24.0
|
|
$
|
38.8
|
|
|
Translation
|
(0.1
|
)
|
—
|
|
—
|
|
(0.1
|
)
|
(0.1
|
)
|
(0.3
|
)
|
||||||
|
January 31, 2016
|
12.2
|
|
0.3
|
|
1.1
|
|
1.0
|
|
23.9
|
|
38.5
|
|
||||||
|
Translation
|
(0.1
|
)
|
—
|
|
(0.1
|
)
|
0.1
|
|
—
|
|
(0.1
|
)
|
||||||
|
January 31, 2017
|
$
|
12.1
|
|
$
|
0.3
|
|
$
|
1.0
|
|
$
|
1.1
|
|
$
|
23.9
|
|
$
|
38.4
|
|
The Company recorded no impairment charges related to goodwill in
2016
,
2015
or
2014
.
Impairment of Long-Lived Assets
The Company reviews its long-lived assets (such as property, plant and equipment) other than goodwill for impairment when management determines that the carrying value of such assets may not be recoverable due to events or changes in circumstances. Recoverability of long-lived assets is evaluated by comparing the carrying value of the asset with the estimated future undiscounted cash flows. If the comparisons indicate that the asset is not recoverable, an impairment loss is calculated as the difference between the carrying value and the fair value of the asset and the loss is recognized during that period. In 2016, the Company recorded an asset impairment charge of
$25.4 million
associated with the costs capitalized in connection with the development of a new finished goods inventory management and merchandising information system (see "Note E. Property, Plant and Equipment" for additional information). The Company recorded no significant impairment charges related to long-lived assets in
2015
or
2014
.
TIFFANY & CO.
K-
58
Hedging Instruments
The Company uses derivative financial instruments to mitigate a portion of its foreign currency, precious metal price and interest rate exposures. Derivative instruments are recorded on the consolidated balance sheet at their fair values, as either assets or liabilities, with an offset to current or other comprehensive earnings, depending on whether a derivative is designated as part of an effective hedge transaction and, if it is, the type of hedge transaction.
Marketable Securities
The Company's marketable securities, recorded within other assets, net, are classified as available-for-sale and are recorded at fair value with unrealized gains and losses reported as a separate component of stockholders' equity. Realized gains and losses are recorded in other (income) expense, net. The marketable securities are held for an indefinite period of time, but may be sold in the future as changes in market conditions or economic factors occur. The fair value of the marketable securities is determined based on prevailing market prices. The Company recorded
$2.9
million and
$0.9
million of gross unrealized gains and
$1.1
million and
$1.8
million of gross unrealized losses within accumulated other comprehensive loss as of
January 31, 2017
and
2016
.
Realized gains or losses reclassified from other comprehensive earnings are determined on the basis of specific identification.
The Company's marketable securities primarily consist of investments in mutual funds. When evaluating marketable securities for other-than-temporary impairment, the Company reviews factors such as the length of time and the extent to which fair value has been below cost basis, the financial condition of the issuer, and the Company's ability and intent to hold the investments for a period of time which may be sufficient for anticipated recovery in market value. Based on the Company's evaluations, it determined that any unrealized losses on its outstanding mutual funds were temporary in nature and, therefore, did not record any impairment charges as of January 31,
2017
,
2016
or
2015
.
Merchandise Credits and Deferred Revenue
Merchandise credits and deferred revenue primarily represent outstanding gift cards sold to customers and outstanding credits issued to customers for returned merchandise. All such outstanding items may be tendered for future merchandise purchases. A gift card liability is established when the gift card is sold. A merchandise credit liability is established when a merchandise credit is issued to a customer for a returned item and the original sale is reversed. The liabilities are relieved and revenue is recognized when merchandise is purchased and delivered to the customer and the merchandise credit or gift card is used as a form of payment.
If merchandise credits or gift cards are not redeemed over an extended period of time (for example, approximately three to five years in the U.S.), the value of the merchandise credits or gift cards is generally remitted to the applicable jurisdiction in accordance with unclaimed property laws.
Revenue Recognition
Sales are recognized at the "point of sale," which occurs when merchandise is taken in an "over-the-counter" transaction or upon receipt by a customer in a shipped transaction, such as through the Internet and catalog channels. Revenue associated with gift cards and merchandise credits is recognized upon redemption. Sales are reported net of returns, sales tax and other similar taxes. Shipping and handling fees billed to customers are included in net sales. The Company maintains a reserve for potential product returns and it records, as a reduction to sales and cost of sales, its provision for estimated product returns, which is determined based on historical experience.
Additionally, outside of the U.S., the Company operates certain TIFFANY & CO. stores within various department stores. Sales transacted at these store locations are recognized at the "point of sale." The Company and these department store operators have distinct responsibilities and risks in the operation of such TIFFANY & CO. stores. The Company (i) owns and manages the merchandise; (ii) establishes retail prices; (iii) has merchandising, marketing and display responsibilities; and (iv) in almost all locations provides retail staff and bears the risk of inventory loss. The department store operators (i) provide and maintain store facilities; (ii) in almost all locations
TIFFANY & CO.
K-
59
assume retail credit and certain other risks; and (iii) act for the Company in the sale of merchandise. In return for their services and use of their facilities, the department store operators retain a portion of net retail sales made in TIFFANY & CO. stores which is recorded as commission expense within selling, general and administrative expenses.
Cost of Sales
Cost of sales includes costs to internally manufacture merchandise (primarily metal, gemstones, labor and overhead), costs related to the purchase of merchandise from third-parties, inbound freight, purchasing and receiving, inspection, warehousing, internal transfers and other costs associated with distribution and merchandising. Cost of sales also includes royalty fees paid to outside designers and customer shipping and handling charges.
Selling, General and Administrative ("SG&A") Expenses
SG&A expenses include costs associated with the selling and marketing of products as well as administrative expenses. The types of expenses associated with these functions are store operating expenses (such as labor, rent and utilities), advertising and other corporate level administrative expenses.
Advertising, Marketing, Public and Media Relations Costs
Advertising, marketing, public and media relations costs include media, production, catalogs, Internet, marketing events, visual merchandising costs (in-store and window displays) and other related costs. In
2016
,
2015
and
2014
, these costs totaled
$299.0
million,
$302.0
million and
$284.0
million, representing
7.5%
,
7.4%
and
6.7%
of worldwide net sales in each of those periods. Media and production costs for print and digital advertising are expensed as incurred, while catalog costs are expensed upon first distribution.
Pre-Opening Costs
Costs associated with the opening of new retail stores are expensed in the period incurred.
Stock-Based Compensation
New, modified and unvested share-based payment transactions with employees, such as stock options and restricted stock, are measured at fair value and recognized as compensation expense over the requisite service period.
Merchandise Design Activities
Merchandise design activities consist of conceptual formulation and design of possible products and creation of pre-production prototypes and molds. Costs associated with these activities are expensed as incurred.
Foreign Currency
The functional currency of most of the Company's foreign subsidiaries and branches is the applicable local currency. Assets and liabilities are translated into U.S. dollars using the current exchange rates in effect at the balance sheet date, while revenues and expenses are translated at the average exchange rates during the period. The resulting translation adjustments are recorded as a component of other comprehensive earnings within stockholders' equity. The Company also recognizes gains and losses associated with transactions that are denominated in foreign currencies. Within other (income) expense, net, the Company recorded net losses resulting from foreign currency transactions of
$4.8
million,
$9.8
million and
$3.7
million in
2016
,
2015
and
2014
, respectively.
Income Taxes
The Company accounts for income taxes under the asset and liability method, which requires the recognition of deferred tax assets and liabilities for the expected future tax consequences of events that have been included in the financial statements. Under this method, deferred tax assets and liabilities are recognized by applying statutory tax rates in effect in the years in which the differences between the financial reporting and tax filing bases of existing assets and liabilities are expected to reverse. The effect of a change in tax rates on deferred tax assets and liabilities is recognized in income in the period that includes the enactment date.
TIFFANY & CO.
K-
60
The Company records net deferred tax assets to the extent management believes these assets will more likely than not be realized. In making such determination, the Company considers all available evidence, including future reversals of existing taxable temporary differences, projected future taxable income, tax planning strategies and recent financial operations. In the event management were to determine that the Company would be able to realize its deferred income tax assets in the future in excess of their net recorded amount, the Company would make an adjustment to the valuation allowance, which would reduce the provision for income taxes.
In evaluating the exposures associated with the Company's various tax filing positions, management records reserves using a more-likely-than-not recognition threshold for income tax positions taken or expected to be taken.
The Company, its U.S. subsidiaries and the foreign branches of its U.S. subsidiaries file a consolidated Federal income tax return.
Earnings Per Share ("EPS")
Basic EPS is computed as net earnings divided by the weighted-average number of common shares outstanding for the period. Diluted EPS includes the dilutive effect of the assumed exercise of stock options and unvested restricted stock units.
The following table summarizes the reconciliation of the numerators and denominators for the basic and diluted EPS computations:
|
Years Ended January 31,
|
|||||||||
|
(in millions)
|
2017
|
|
2016
|
|
2015
|
|
|||
|
Net earnings for basic and diluted EPS
|
$
|
446.1
|
|
$
|
463.9
|
|
$
|
484.2
|
|
|
Weighted-average shares for basic EPS
|
125.1
|
|
128.6
|
|
129.2
|
|
|||
|
Incremental shares based upon the assumed exercise of stock options and unvested restricted stock units
|
0.4
|
|
0.5
|
|
0.7
|
|
|||
|
Weighted-average shares for diluted EPS
|
125.5
|
|
129.1
|
|
129.9
|
|
|||
For the years ended January 31,
2017
,
2016
and
2015
, there were
1.3
million,
0.8
million and
0.3
million stock options and restricted stock units excluded from the computations of earnings per diluted share due to their antidilutive effect.
New Accounting Standards
In May 2014, the Financial Accounting Standards Board ("FASB") issued Accounting Standards Update ("ASU") No. 2014-09 –
Revenue From Contracts with Customers
, to clarify the principles of recognizing revenue and create common revenue recognition guidance between U.S. Generally Accepted Accounting Principles ("GAAP") and International Financial Reporting Standards. The core principle of the guidance is that a company should recognize revenue when it transfers promised goods or services to customers in an amount that reflects the consideration to which the company expects to be entitled in exchange for those goods or services. In doing so, companies will need to use more judgment and make more estimates than under current guidance. These may include identifying performance obligations in the contract, estimating the amount of variable consideration to include in the transaction price and allocating the transaction price to each separate performance obligation. In August 2015, the FASB issued ASU 2015-14 –
Revenue from Contracts with Customers: Deferral of the Effective Date
, deferring the effective date of ASU 2014-09 for one year to interim and annual reporting periods beginning after December 15, 2017. Early adoption is also permitted as of the original effective date (interim and annual periods beginning after December 15, 2016) and full or modified retrospective application is permitted. Subsequently, the FASB has issued a number of ASU's amending ASU-2014-09 and providing further guidance related to revenue recognition, which management is collectively evaluating. The effective date and transition requirements for these amendments are the same as ASU 2014-09, as amended by ASU 2015-14. Management is currently evaluating the impact of the new guidance on the consolidated financial statements. The Company has identified an implementation project team and related oversight processes and has commenced the assessment phase of the project. The Company has not concluded as to whether the new guidance will be adopted on a full or modified retrospective basis, but will not apply the early adoption provisions of the new guidance.
TIFFANY & CO.
K-
61
In July 2015, the FASB issued ASU No. 2015-11 –
Inventory: Simplifying the Measurement of Inventory
, which states an entity should measure inventory at the lower of cost and net realizable value. Net realizable value is the estimated selling prices in the ordinary course of business, less reasonably predictable costs of completion, disposal and transportation. This amendment applies to all inventory that is measured using the average costs or first-in first-out (FIFO) methods. This supersedes prior guidance which allowed entities to measure inventory at the lower of cost or market, where market could be replacement cost, net realizable value or net realizable value less an approximately normal profit margin. This ASU is effective for interim and annual periods beginning after December 15, 2016. The amendments should be applied prospectively and earlier application is permitted. This ASU is not expected to have a material impact on the consolidated financial statements.
In February 2016, the FASB issued ASU No. 2016-02 –
Leases
, which requires an entity that leases assets to recognize on the balance sheet the assets and liabilities for the rights and obligations created by those leases. Leases will be classified as either financing or operating, similar to current accounting requirements, with the applicable classification determining the pattern of expense recognition in the statement of earnings. This ASU is effective for fiscal years, and interim periods within those fiscal years, beginning after December 15, 2018 and must be adopted using a modified retrospective approach. Management is currently evaluating the impact of this ASU on the consolidated financial statements, but expects that adoption will result in a significant increase in the Company's assets and liabilities. The Company has identified an implementation project team and related oversight processes and has commenced the assessment phase of the project.
In March 2016, the FASB issued ASU No. 2016-05 –
Derivatives and Hedging: Effect of Derivative Contract Novations on Existing Hedge Accounting Relationships
, which states that a change in counterparty to a derivative instrument does not, in and of itself, require dedesignation of that hedging relationship provided that all other hedge account criteria continue to be met. This ASU is effective for fiscal years, and interim periods within those fiscal years, beginning after December 15, 2016. The amendments should be applied on either a prospective basis or a modified retrospective basis and earlier application is permitted. Management does not believe the adoption of this ASU will have a material impact on the consolidated financial statements.
In March 2016, the FASB issued ASU No. 2016-09 –
Compensation – Stock Compensation: Improvements to Employee Share-Based Payment Accounting
, which provides guidance on several aspects of accounting for share-based payment transactions, including the accounting for income taxes, forfeitures, and statutory tax withholding requirements, as well as classification on the statement of cash flows. Most notably, the Company will be required to recognize all excess tax benefits and shortfalls as income tax expense or benefit in the statement of earnings within the reporting period in which they occur. This ASU is effective for interim and annual periods beginning after December 15, 2016 and early adoption is permitted. Management is currently evaluating the impact of this ASU on the consolidated financial statements, but anticipates adoption will result in increased earnings volatility due to the immediate recognition of excess tax benefits and shortfalls.
In June 2016, the FASB issued ASU 2016-13 –
Financial Instruments – Credit Losses: Measurement of Credit Losses on Financial Instruments
. ASU 2016-13 amends the impairment model to utilize an expected loss methodology in place of the currently used incurred loss methodology, which will result in the more timely recognition of losses. The new standard applies to financial assets measured at amortized cost basis, including receivables that result from revenue transactions and held-to-maturity debt securities. The ASU is effective for fiscal years, and interim periods within those fiscal years, beginning after December 15, 2019, and early adoption is permitted for fiscal years beginning after December 15, 2018. Management is currently evaluating the impact of this ASU on the consolidated financial statements.
In August 2016, the FASB issued ASU 2016-15 –
Statement of Cash Flows: Classification of Certain Cash Receipts and Cash Payments
, which provides guidance on eight specific cash flow issues in an effort to reduce diversity in practice in how certain transactions are classified within the statement of cash flows. This ASU is effective for fiscal years, and interim periods within those fiscal years, beginning after December 15, 2017. Early adoption is permitted and the amendments should be applied using a retrospective method. Management is currently evaluating the impact of this ASU on the consolidated financial statements.
In October 2016, the FASB issued ASU 2016-16 –
Income Taxes: Intra-Entity Transfers of Assets Other Than Inventory
. This ASU eliminates the requirement to defer the recognition of current and deferred income taxes for an intra-entity asset transfer until the asset has been sold to an outside party. Therefore, under the new guidance, an entity should recognize the income tax consequences of an intra-entity transfer of an asset other than inventory when
TIFFANY & CO.
K-
62
the transfer occurs. This ASU is effective for interim and annual reporting periods beginning after December 15, 2017. Early adoption is permitted as of the first interim period and the amendments should be applied on a modified retrospective basis through a cumulative-effect adjustment directly to retained earnings as of the beginning of the period of adoption. Management is currently evaluating the impact of this ASU on the consolidated financial statements.
In January 2017, the FASB issued ASU 2017-04 –
Intangibles - Goodwill and Other: Simplifying the Test for Goodwill Impairment
. This ASU eliminates step 2 (which measures a goodwill impairment loss by comparing the implied fair value of a reporting unit’s goodwill with the carrying amount of that goodwill) from the goodwill impairment test. Instead, if the carrying amount of a reporting unit exceeds its fair value, an impairment loss shall be recognized in an amount equal to that excess, limited to the total amount of goodwill allocated to that reporting unit. This ASU should be adopted by the Company for its annual or any interim goodwill impairment tests in fiscal years beginning after December 15, 2019. Early adoption is permitted for interim or annual goodwill impairment tests performed on testing dates after January 1, 2017. Management does not believe the adoption of this ASU will have a material impact on the consolidated financial statements.
|
C.
|
SUPPLEMENTAL CASH FLOW INFORMATION
|
Cash paid during the year for:
|
Years Ended January 31,
|
|||||||||
|
(in millions)
|
2017
|
|
2016
|
|
2015
|
|
|||
|
Interest, net of interest capitalization
|
$
|
40.6
|
|
$
|
42.5
|
|
$
|
59.7
|
|
|
Income taxes
|
$
|
213.9
|
|
$
|
237.5
|
|
$
|
133.4
|
|
Supplemental noncash investing and financing activities:
|
Years Ended January 31,
|
|||||||||
|
(in millions)
|
2017
|
|
2016
|
|
2015
|
|
|||
|
Accrued capital expenditures
|
$
|
10.7
|
|
$
|
8.2
|
|
$
|
8.2
|
|
|
Issuance of Common Stock under the Employee Profit Sharing and Retirement Savings Plan
|
$
|
|
|
$
|
|
|
$
|
3.9
|
|
|
D.
|
INVENTORIES
|
|
January 31,
|
||||||
|
(in millions)
|
2017
|
|
2016
|
|
||
|
Finished goods
|
$
|
1,249.4
|
|
$
|
1,292.9
|
|
|
Raw materials
|
806.3
|
|
813.7
|
|
||
|
Work-in-process
|
101.9
|
|
118.4
|
|
||
|
Inventories, net
|
$
|
2,157.6
|
|
$
|
2,225.0
|
|
TIFFANY & CO.
K-
63
|
E.
|
PROPERTY, PLANT AND EQUIPMENT
|
|
January 31,
|
||||||
|
(in millions)
|
2017
|
|
2016
|
|
||
|
Land
|
$
|
41.8
|
|
$
|
45.6
|
|
|
Buildings
|
122.5
|
|
120.9
|
|
||
|
Leasehold and building improvements
|
1,195.8
|
|
1,108.6
|
|
||
|
Office equipment
|
245.7
|
|
254.0
|
|
||
|
Software
|
312.4
|
|
295.1
|
|
||
|
Furniture and fixtures
|
281.2
|
|
265.3
|
|
||
|
Machinery and equipment
|
177.7
|
|
169.2
|
|
||
|
Construction-in-progress
|
78.6
|
|
95.7
|
|
||
|
2,455.7
|
|
2,354.4
|
|
|||
|
Accumulated depreciation and amortization
|
(1,523.9
|
)
|
(1,418.6
|
)
|
||
|
$
|
931.8
|
|
$
|
935.8
|
|
|
The provision for depreciation and amortization for the years ended January 31,
2017
,
2016
and
2015
was
$202.5
million,
$196.3
million and
$182.8
million, respectively.
Information Systems Assessment.
The Company is engaged in a multi-year program to evaluate and, where appropriate, upgrade and/or replace certain of its information systems. As part of this program, the Company identified opportunities to enhance its finished goods inventory management and merchandising capabilities, and began development efforts to replace certain of its existing systems and provide these enhanced capabilities. The Company recently completed an assessment of the replacement system under development to evaluate whether the continued development of this system would deliver sufficiently improved operating capabilities. Following the completion of this assessment, in the three months ended January 31, 2017, the Company concluded that the development of this system should be modified such that the finished goods inventory management and merchandising capabilities that were intended to be delivered utilizing this new system will instead be delivered through further development of the Company’s current Enterprise Resource Planning system and continued implementation of a new order management system. Accordingly, the Company has evaluated the costs capitalized for the development of the replacement system for impairment in accordance with its policy on the review of long-lived assets (see "Note B. Summary of Significant Accounting Policies"), and determined, based on specific identification of costs capitalized pertaining to the development of specific capabilities in the new system, that
$25.4 million
of such capitalized costs relate to software functionality which will not be utilized, and therefore will not have future benefit to the Company. As such, the Company recorded a pre-tax impairment charge of
$25.4 million
as a component of SG&A expenses in the three months ended January 31, 2017.
|
F.
|
ACCOUNTS PAYABLE AND ACCRUED LIABILTIES
|
|
January 31,
|
||||||
|
(in millions)
|
2017
|
|
2016
|
|
||
|
Accounts payable - trade
|
$
|
108.6
|
|
$
|
127.8
|
|
|
Accrued compensation and commissions
|
96.3
|
|
77.9
|
|
||
|
Accrued sales, withholding and other taxes
|
26.7
|
|
21.9
|
|
||
|
Other
|
81.2
|
|
101.5
|
|
||
|
$
|
312.8
|
|
$
|
329.1
|
|
|
TIFFANY & CO.
K-
64
|
G.
|
|
|
January 31,
|
|
|||||
|
(in millions)
|
2017
|
|
2016
|
|
||
|
Short-term borrowings:
|
||||||
|
Credit Facilities
|
$
|
93.0
|
|
$
|
76.6
|
|
|
Other credit facilities
|
135.7
|
|
145.0
|
|
||
|
$
|
228.7
|
|
$
|
221.6
|
|
|
|
Long-term debt:
|
||||||
|
Unsecured Senior Notes:
|
||||||
|
2010 1.72% Senior Notes, due September 2016
a, b
|
$
|
|
|
$
|
84.2
|
|
|
2012 4.40% Series B Notes, due July 2042
c
|
250.0
|
|
250.0
|
|
||
|
2014 3.80% Senior Notes, due October 2024
d, e
|
250.0
|
|
250.0
|
|
||
|
2014 4.90% Senior Notes, due October 2044
d, e
|
300.0
|
|
300.0
|
|
||
|
2016 0.78% Senior Notes, due August 2026
b, d
|
88.0
|
|
—
|
|
||
|
888.0
|
|
884.2
|
|
|||
|
Less current portion of long-term debt
|
—
|
|
84.2
|
|
||
|
Less unamortized discounts and debt issuance costs
|
9.6
|
|
10.0
|
|
||
|
$
|
878.4
|
|
$
|
790.0
|
|
|
|
a
|
These Senior Notes were repaid upon the maturity thereof during the year ended January 31, 2017 using the proceeds from the issuance of the 0.78% Senior Notes due August 2026.
|
|
b
|
These Senior Notes were issued, at par, ¥
10.0
billion.
|
|
c
|
The agreements governing these Senior Notes require repayments of $
50.0
million in aggregate every five years beginning in July 2022.
|
|
d
|
These agreements require lump sum repayments upon maturity.
|
|
e
|
These Senior Notes were issued at a discount which will be amortized until the debt maturity.
|
Credit Facilities
In 2014, Tiffany & Co. entered into a four-year
$375.0
million and a five-year
$375.0
million multi-bank, multi-currency, committed unsecured revolving credit facility, including letter of credit subfacilities, (collectively, the "New Credit Facilities") resulting in a total borrowing capacity of
$750.0
million. The New Credit Facilities replaced the previously existing
$275.0
million three-year unsecured revolving credit facility and
$275.0
million five-year unsecured revolving credit facility, which were terminated and repaid concurrently with Tiffany & Co.'s entry into the New Credit Facilities. The New Credit Facilities are available for working capital and other corporate purposes. Borrowings under the New Credit Facilities will bear interest at a rate per annum equal to, at the option of the Company, (1)
LIBOR
(or other applicable reference rate) for the relevant currency plus an applicable margin based upon the Company's leverage ratio as defined under the New Credit Facilities, or (2) an alternate base rate equal to the highest of (i) the Federal Funds Rate plus
0.50%
, (ii) Bank of America, N.A.’s prime rate and (iii) one-month
LIBOR
plus
1%
, plus an applicable margin based upon the Company's leverage ratio as defined under the New Credit Facilities. The New Credit Facilities also require payment to the lenders of a facility fee on the amount of the lenders’ commitments under the credit facilities from time to time at rates based upon the Company's leverage ratio as defined under the New Credit Facilities. Voluntary prepayments of the loans and voluntary reductions of the unutilized portion of the commitments under the New Credit Facilities are permissible without penalty, subject to certain conditions pertaining to minimum notice and minimum reduction amounts.
TIFFANY & CO.
K-
65
In October 2016, the maturity for each of the New Credit Facilities was extended for one additional year pursuant to the terms set forth in the respective agreements governing the New Credit Facilities. Therefore, the four-year and five-year New Credit Facilities will mature in October of 2019 and 2020, respectively.
At January 31,
2017
, there were
$93.0
million of borrowings outstanding,
$4.0
million of letters of credit issued but not outstanding and
$653.0
million available for borrowing under the New Credit Facilities. At
January 31, 2016
, there were
$76.6
million of borrowings outstanding,
$5.6
million of letters of credit issued but not outstanding and
$667.8
million available for borrowings. The weighted-average interest rate for borrowings outstanding was
1.72%
at January 31,
2017
and
1.54%
at
January 31, 2016
.
Other Credit Facilities
Tiffany-Shanghai Credit Agreement.
In July 2016, Tiffany & Co.'s wholly owned subsidiary, Tiffany & Co. (Shanghai) Commercial Company Limited ("Tiffany-Shanghai"), entered into a three-year multi-bank revolving credit agreement (the "Tiffany-Shanghai Credit Agreement"). The Tiffany-Shanghai Credit Agreement has an aggregate borrowing limit of RMB
990.0 million
(
$143.8 million
at
January 31, 2017
). The Tiffany-Shanghai Credit Agreement, which matures in July 2019, was made available to refinance amounts outstanding under Tiffany-Shanghai’s previously existing RMB
930.0 million
three-year multi-bank revolving credit agreement (the "2013 Agreement"), which expired pursuant to its terms in July 2016, as well as for Tiffany-Shanghai's ongoing general working capital requirements. The six lenders party to the Tiffany-Shanghai Credit Agreement will make loans, upon Tiffany-Shanghai's request, for periods of up to 12 months at the applicable interest rates as announced by the People's Bank of China (provided, that if such announced rate is below zero, the applicable interest rate shall be deemed to be zero). In connection with the Tiffany-Shanghai Credit Agreement, in July 2016 Tiffany & Co. entered into a Guaranty Agreement by and between Tiffany & Co. and the facility agent under the Tiffany-Shanghai Credit Agreement (the "Guaranty"). At
January 31, 2017
, there was
$103.6
million available to be borrowed under the Tiffany-Shanghai Credit Agreement and
$40.2
million was outstanding at a weighted-average interest rate of
4.35%
. At January 31,
2016
, there was
$99.3
million available to be borrowed under the 2013 Agreement and
$42.1
million was outstanding at a weighted-average interest rate of
4.72%
.
Other.
The Company has various other revolving credit facilities, primarily in Japan and China. At January 31,
2017
, the facilities totaled
$137.3
million and
$95.5
million was outstanding at a weighted-average interest rate of
2.99%
. At January 31,
2016
, the facilities totaled
$126.6
million and
$102.9
million was outstanding at a weighted-average interest rate of
3.16%
.
Senior Notes
2014 Senior Notes.
In 2014, Tiffany & Co. issued
$250.0
million aggregate principal amount of
3.80%
Senior Notes due 2024 (the "2024 Notes") and
$300.0
million aggregate principal amount of
4.90%
Senior Notes due 2044 (the "2044 Notes" and, together with the 2024 Notes, the "2014 Notes"). The 2014 Notes were issued at a discount with aggregate net proceeds of
$548.0
million (with an effective yield of
3.836%
for the 2024 Notes and an effective yield of
4.926%
for the 2044 Notes). Tiffany & Co. used the net proceeds from the issuance of the Notes to redeem all of the aggregate principal amount outstanding of its (i)
$100.0
million principal amount of
9.05%
Series A Senior Notes due December 23, 2015; (ii)
$125.0
million principal amount of
10.0%
Series A-2009 Senior Notes due February 13, 2017; (iii)
$50.0
million principal amount of
10.0%
Series A Senior Notes due April 9, 2018; and (iv)
$125.0
million principal amount of
10.0%
Series B-2009 Senior Notes due February 13, 2019 (collectively, the "Private Placement Notes") prior to maturity in accordance with the respective note purchase agreements governing each series of Private Placement Notes, which included provisions for make-whole payments in the event of early redemption. As a result of the redemptions, the Company recorded a loss on extinguishment of debt of
$93.8
million in 2014. The Company used the remaining net proceeds from the sale of the 2014 Notes for general corporate purposes. The 2014 Notes are Tiffany & Co.’s general unsecured obligations and rank equally in right of payment with all of Tiffany & Co.’s existing and any future unsecured senior debt and rank senior in right of payment to any of Tiffany & Co.’s future subordinated debt.
The 2024 Notes bear interest at a fixed rate of
3.80%
per annum and the 2044 Notes bear interest at a fixed rate of
4.90%
per annum, payable semi-annually in arrears on April 1 and October 1 of each year, commencing on April 1, 2015. Tiffany & Co. will make each interest payment to the holders of record of the 2014 Notes on the immediately preceding March 15 and September 15.
TIFFANY & CO.
K-
66
Tiffany & Co. has the option to redeem the 2014 Notes, in whole or in part, by providing no less than 30 nor more than 60 days' prior notice at a redemption price equal to the sum of (i) 100% of the principal amount of the 2014 Notes to be redeemed, plus (ii) accrued and unpaid interest, if any, on those 2014 Notes to the redemption date, plus (iii) a make-whole premium as of the redemption date, as defined in the indenture governing the 2014 Notes, as amended and supplemented in respect of each series of Notes (the "Indenture"). In addition, Tiffany & Co. has the option to redeem some or all of the 2024 Notes on or after July 1, 2024, at a redemption price equal to the sum of 100% of the principal amount of the 2024 Notes to be redeemed, together with accrued and unpaid interest, if any, on those 2024 Notes to the redemption date. Tiffany & Co. also has the option to redeem some or all of the 2044 Notes on or after April 1, 2044, at a redemption price equal to the sum of 100% of the principal amount of the 2044 Notes to be redeemed, together with accrued and unpaid interest, if any, on those 2044 Notes to the redemption date.
Upon the occurrence of a change of control triggering event (as defined in the Indenture), unless Tiffany & Co. has exercised its right to redeem the 2014 Notes, each holder of 2014 Notes will have the right to require Tiffany & Co. to repurchase all or a portion of such holder’s Notes at a price equal to 101% of the principal amount thereof, plus accrued and unpaid interest, if any, to the date of repurchase.
2016 Senior Notes.
In August 2016, Tiffany & Co. issued ¥
10.0 billion
(
$88.0 million
at
January 31, 2017
) of
0.78%
Senior Notes due August 2026 (the "Yen Notes") in a private transaction. The proceeds from the issuance of the Yen Notes were used to repay Tiffany & Co.'s ¥
10.0 billion
1.72% Senior Notes due September 2016 upon the maturity thereof. The Yen Notes bear interest at a rate of 0.78% per annum, payable semi-annually on February 26 and August 26 of each year, commencing February 26, 2017. Tiffany & Co. may redeem all or part of the Yen Notes upon not less than 30 nor more than 60 days' prior notice at a redemption price equal to the sum of (i) 100% of the principal amount of the Yen Notes to be redeemed, plus (ii) accrued and unpaid interest, if any, on those Yen Notes to the redemption date, plus (iii) a make-whole premium as of the redemption date.
Debt Covenants
The agreements governing the New Credit Facilities include specific financial covenants, as well as other covenants that limit the ability of Tiffany & Co. to incur certain subsidiary indebtedness, incur liens, impose restrictions on subsidiary distributions and engage in mergers, consolidations and sales of all or substantially all of Tiffany & Co. and its subsidiaries' assets, in addition to other requirements and "Events of Default" (as defined in the agreements governing the New Credit Facilities) customary to such borrowings.
The Tiffany-Shanghai Credit Agreement includes certain covenants that limit Tiffany-Shanghai's ability to pay certain dividends, make certain investments and incur certain indebtedness, and the Guaranty requires maintenance by Tiffany & Co. of specific financial covenants and ratios, in addition to other requirements and limitations customary to such borrowings.
The Indenture contains covenants that, among other things, limit the ability of Tiffany & Co. and its subsidiaries under certain circumstances to create liens and impose conditions on Tiffany & Co.’s ability to engage in mergers, consolidations and sales of all or substantially all of its or its subsidiaries’ assets. The Indenture also contains certain "Events of Default" (as defined in the Indenture) customary for indentures of this type. The Indenture does not contain any specific financial covenants.
The agreements governing the 2012
4.40%
Series B Senior Notes and the Yen Notes require maintenance of specific financial covenants and ratios and limit certain changes to indebtedness of Tiffany & Co. and its subsidiaries and the general nature of the business, in addition to other requirements customary to such borrowings.
At January 31, 2017, the Company was in compliance with all debt covenants.
In the event of any default of payment or performance obligations extending beyond applicable cure periods as set forth in the agreements governing the Company's applicable debt instruments, such agreements may be terminated or payment of the applicable debt may be accelerated. Further, each of the New Credit Facilities, the Tiffany-Shanghai Credit Agreement, the agreements governing the 2012 4.40% Series B Senior Notes and the Yen Notes, and certain other loan agreements contain cross default provisions permitting the termination and acceleration of the loans, or acceleration of the notes, as the case may be, in the event that certain of the Company's other debt obligations are terminated or accelerated prior to their maturity.
TIFFANY & CO.
K-
67
Long-Term Debt Maturities
Aggregate maturities of long-term debt as of January 31,
2017
are as follows:
|
Years Ending January 31,
|
Amount
a
(in millions)
|
|
|
|
2018
|
$
|
|
|
|
2019
|
—
|
|
|
|
2020
|
—
|
|
|
|
2021
|
—
|
|
|
|
2022
|
—
|
|
|
|
Thereafter
|
888.0
|
|
|
|
$
|
888.0
|
|
|
|
a
|
Amounts exclude any unamortized discount or premium.
|
Letters of Credit
The Company has available letters of credit and financial guarantees of
$76.1
million of which
$26.4
million was outstanding at January 31,
2017
. Of those available letters of credit and financial guarantees,
$57.5
million expires within one year. These amounts do not include letters of credit issued under the Credit Facilities.
H. HEDGING INSTRUMENTS
Background Information
The Company uses derivative financial instruments, including interest rate swaps, cross-currency swaps, forward contracts, put option contracts and net-zero-cost collar arrangements (combination of call and put option contracts) to mitigate a portion of its exposures to changes in interest rates, foreign currency and precious metal prices.
Derivative Instruments Designated as Hedging Instruments.
If a derivative instrument meets certain hedge accounting criteria, it is recorded on the consolidated balance sheet at its fair value, as either an asset or a liability, with an offset to current or comprehensive earnings, depending on whether the hedge is designated as one of the following on the date it is entered into:
|
•
|
Fair Value Hedge – A hedge of the exposure to changes in the fair value of a recognized asset or liability or an unrecognized firm commitment. For fair value hedge transactions, both the effective and ineffective portions of the changes in the fair value of the derivative and changes in the fair value of the item being hedged are recorded in current earnings.
|
|
•
|
Cash Flow Hedge – A hedge of the exposure to variability in the cash flows of a recognized asset, liability or a forecasted transaction. For cash flow hedge transactions, the effective portion of the changes in fair value of derivatives are reported as other comprehensive income ("OCI") and are recognized in current earnings in the period or periods during which the hedged transaction affects current earnings. Amounts excluded from the effectiveness calculation and any ineffective portions of the change in fair value of the derivative are recognized in current earnings.
|
The Company formally documents the nature of and relationships between the hedging instruments and hedged items for a derivative to qualify as a hedge at inception and throughout the hedged period. The Company also documents its risk management objectives, strategies for undertaking the various hedge transactions and method of assessing hedge effectiveness. Additionally, for hedges of forecasted transactions, the significant characteristics and expected terms of a forecasted transaction must be identified, and it must be probable that each forecasted transaction will occur. If it were deemed probable that the forecasted transaction would not occur, the gain or loss on the derivative financial instrument would be recognized in current earnings. Derivative financial instruments
TIFFANY & CO.
K-
68
qualifying for hedge accounting must maintain a specified level of effectiveness between the hedge instrument and the item being hedged, both at inception and throughout the hedged period.
Derivative Instruments Not Designated as Hedging Instruments.
Derivative instruments which do not meet the criteria to be designated as a hedge are recorded on the consolidated balance sheet at their fair values, as either assets or liabilities, with an offset to current earnings.
The Company does not use derivative financial instruments for trading or speculative purposes.
Types of Derivative Instruments
Interest Rate Swaps
– In 2012, the Company entered into forward-starting interest rate swaps to hedge the impact of interest rate volatility on future interest payments associated with the anticipated incurrence of
$250.0
million of additional debt which was incurred in July 2012. The Company accounted for the forward-starting interest rate swaps as cash flow hedges. As of
January 31, 2017
,
$19.8
million remains recorded as an unrealized loss in accumulated other comprehensive loss, which is being amortized over the term of the 2042 Notes to which the interest rate swaps related.
In 2014, the Company entered into forward-starting interest rate swaps to hedge the impact of interest rate volatility on future interest payments associated with the anticipated incurrence of long-term debt which was incurred shortly thereafter (refer to "Note G. Debt"). The Company accounted for the forward-starting interest rate swaps as cash flow hedges. The Company settled the interest rate swaps in 2014 and recorded an unrealized loss within accumulated other comprehensive loss. As of
January 31, 2017
,
$3.8
million remains recorded as an unrealized loss and is being amortized over the terms of the respective 2024 Notes or 2044 Notes to which the interest rate swaps related.
Cross-currency Swaps
– In 2016, the Company entered into cross-currency swaps to hedge the foreign exchange risk associated with Japanese yen-denominated intercompany loans. These cross-currency swaps are designated and accounted for as cash flow hedges. As of
January 31, 2017
, the notional amount of cross-currency swaps accounted for as cash flow hedges was approximately
¥10.6 billion
or
$100.0 million
. The cross-currency swaps have a term ending on October 1, 2024.
Foreign Exchange Forward Contracts
– The Company uses foreign exchange forward contracts to offset a portion of the foreign currency exchange risks associated with foreign currency-denominated liabilities, intercompany transactions and forecasted purchases of merchandise between entities with differing functional currencies. The Company assesses hedge effectiveness based on the total changes in the foreign exchange forward contracts' cash flows. These foreign exchange forward contracts are designated and accounted for as either cash flow hedges or economic hedges that are not designated as hedging instruments.
TIFFANY & CO.
K-
69
As of
January 31, 2017
, the notional amount of foreign exchange forward contracts accounted for as cash flow hedges was as follows:
|
(in millions)
|
Notional Amount
|
|
USD Equivalent
|
|
||
|
Derivatives designated as hedging instruments:
|
||||||
|
Japanese yen
|
¥
|
16,669.0
|
|
$
|
156.1
|
|
|
British pound
|
£
|
13.3
|
|
17.5
|
|
|
|
Derivatives not designated as hedging instruments:
|
||||||
|
U.S. dollar
|
$
|
58.3
|
|
$
|
58.3
|
|
|
Euro
|
€
|
28.0
|
|
29.7
|
|
|
|
British pound
|
£
|
5.5
|
|
6.8
|
|
|
|
Japanese yen
|
¥
|
952.8
|
|
8.4
|
|
|
|
Korean won
|
₩
|
15,011.6
|
|
12.5
|
|
|
|
Mexican peso
|
₱
|
167.1
|
|
7.7
|
|
|
|
New Zealand dollar
|
NZ$
|
11.7
|
|
8.4
|
|
|
|
Singapore dollar
|
S$
|
25.1
|
|
17.7
|
|
|
|
Swiss franc
|
Fr.
|
4.3
|
|
4.2
|
|
|
The maximum term of the Company's outstanding foreign exchange forward contracts as of
January 31, 2017
is
12
months.
Precious Metal Collars and Forward Contracts
– The Company periodically hedges a portion of its forecasted purchases of precious metals for use in its internal manufacturing operations in order to manage the effect of volatility in precious metal prices. The Company may use either a combination of call and put option contracts in net-zero-cost collar arrangements ("precious metal collars") or forward contracts. For precious metal collars, if the price of the precious metal at the time of the expiration of the precious metal collar is within the call and put price, the precious metal collar expires at no cost to the Company. The Company accounts for its precious metal collars and forward contracts as cash flow hedges. The Company assesses hedge effectiveness based on the total changes in the precious metal collars' and forward contracts' cash flows. As of January 31,
2017
, the maximum term over which the Company is hedging its exposure to the variability of future cash flows for all forecasted transactions is
24
months. As of
January 31, 2017
, there were precious metal derivative instruments outstanding for approximately
72,000
ounces of platinum,
1,440,000
ounces of silver and
51,500
ounces of gold.
TIFFANY & CO.
K-
70
Information on the location and amounts of derivative gains and losses in the consolidated financial statements is as follows:
|
|
Years Ended January 31,
|
||||||||||||||
|
|
2017
|
2016
|
|||||||||||||
|
(in millions)
|
Pre-Tax Gain
(Loss) Recognized
in OCI (Effective
Portion)
|
Pre-Tax Gain (Loss)
Reclassified from
Accumulated OCI
into Earnings
(Effective Portion)
|
Pre-Tax Gain
(Loss) Recognized
in OCI
(Effective Portion)
|
Pre-Tax Gain (Loss) Reclassified
from Accumulated
OCI into Earnings
(Effective Portion)
|
|||||||||||
|
Derivatives in Cash Flow Hedging
Relationships:
|
|||||||||||||||
|
Foreign exchange forward contracts
a
|
$
|
(1.5
|
)
|
$
|
(1.5
|
)
|
$
|
3.9
|
|
$
|
20.2
|
|
|||
|
Precious metal collars
a
|
—
|
|
—
|
|
0.2
|
|
—
|
|
|||||||
|
Precious metal forward contracts
a
|
14.0
|
|
(8.5
|
)
|
(26.3
|
)
|
(7.0
|
)
|
|||||||
|
Cross-currency swaps
c
|
(0.4
|
)
|
6.6
|
|
—
|
|
—
|
|
|||||||
|
Forward-starting interest rate swaps
b
|
—
|
|
(1.5
|
)
|
—
|
|
(1.5
|
)
|
|||||||
|
$
|
12.1
|
|
$
|
(4.9
|
)
|
$
|
(22.2
|
)
|
$
|
11.7
|
|
||||
|
a
|
The gain or loss recognized in earnings is included within Cost of sales.
|
|
b
|
The gain or loss recognized in earnings is included within Interest expense and financing costs.
|
|
c
|
The gain or loss recognized in earnings is included within Other (income) expense, net.
|
The pre-tax losses on derivatives not designated as hedging instruments were
$9.2 million
in the year ended
January 31, 2017
and were included in other (income) expense, net. Such gains and losses were not significant in the year ended January 31,
2016
. There was no material ineffectiveness related to the Company's hedging instruments for the periods ended
January 31, 2017
and
2016
. The Company expects approximately
$1.1
million of net pre-tax derivative losses included in accumulated other comprehensive income at
January 31, 2017
will be reclassified into earnings within the next 12 months. This amount will vary due to fluctuations in foreign currency exchange rates and precious metal prices.
For information regarding the location and amount of the derivative instruments in the Consolidated Balance Sheet, see "Note I. Fair Value of Financial Instruments."
Concentration of Credit Risk
A number of major international financial institutions are counterparties to the Company's derivative financial instruments. The Company enters into derivative financial instrument agreements only with counterparties meeting certain credit standards (a credit rating of A-/A2 or better at the time of the agreement) and limits the amount of agreements or contracts it enters into with any one party. The Company may be exposed to credit losses in the event of nonperformance by individual counterparties or the entire group of counterparties.
|
I.
|
FAIR VALUE OF FINANCIAL INSTRUMENTS
|
Fair value is defined as the exchange price that would be received for an asset or paid to transfer a liability (an exit price) in the principal market for the asset or liability in an orderly transaction between market participants on the measurement date. U.S. GAAP establishes a fair value hierarchy which requires an entity to maximize the use of observable inputs and minimize the use of unobservable inputs when measuring fair value. U.S. GAAP prescribes three levels of inputs that may be used to measure fair value:
Level 1 – Quoted prices in active markets for identical assets or liabilities and are considered to be most reliable.
Level 2 – Observable market-based inputs or unobservable inputs that are corroborated by market data.
Level 3 – Unobservable inputs reflecting the reporting entity's own assumptions and require the most judgment.
TIFFANY & CO.
K-
71
The Company's derivative instruments are considered Level 2 instruments for the purposes of determining fair value. The Company's foreign exchange forward contracts, as well as its put option contracts and cross-currency swaps, are primarily valued using the appropriate foreign exchange spot rates. The Company's precious metal forward contracts and collars are primarily valued using the relevant precious metal spot rate. The Company's interest rate swaps were primarily valued using the 3-month LIBOR rate. For further information on the Company's hedging instruments and program, see "Note H. Hedging Instruments."
Financial assets and liabilities carried at fair value at
January 31, 2017
are classified in the table below in one of the three categories described above:
|
|
Estimated Fair Value
|
Total Fair
Value
|
|||||||||||||
|
(in millions)
|
Level 1
|
Level 2
|
Level 3
|
||||||||||||
|
Financial assets
|
|||||||||||||||
|
Marketable securities
a
|
$
|
36.4
|
|
$
|
—
|
|
$
|
—
|
|
$
|
36.4
|
|
|||
|
Time deposits
b
|
57.8
|
|
—
|
|
—
|
|
57.8
|
|
|||||||
|
Derivatives designated as hedging instruments:
|
|||||||||||||||
|
Precious metal forward contracts
c
|
—
|
|
3.6
|
|
—
|
|
3.6
|
|
|||||||
|
Precious metal collars
c
|
—
|
|
0.4
|
|
—
|
|
0.4
|
|
|||||||
|
Foreign exchange forward contracts
c
|
—
|
|
9.6
|
|
—
|
|
9.6
|
|
|||||||
|
Derivatives not designated as hedging instruments:
|
|||||||||||||||
|
Foreign exchange forward contracts
c
|
—
|
|
0.3
|
|
—
|
|
0.3
|
|
|||||||
|
Total financial assets
|
$
|
94.2
|
|
$
|
13.9
|
|
$
|
—
|
|
$
|
108.1
|
|
|||
|
Estimated Fair Value
|
Total Fair
Value
|
||||||||||||||
|
(in millions)
|
Level 1
|
Level 2
|
Level 3
|
||||||||||||
|
Financial liabilities
|
|||||||||||||||
|
Derivatives designated as hedging instruments:
|
|||||||||||||||
|
Precious metal forward contracts
d
|
$
|
—
|
|
$
|
5.4
|
|
$
|
—
|
|
$
|
5.4
|
|
|||
|
Precious metal collars
d
|
—
|
|
0.3
|
|
—
|
|
0.3
|
|
|||||||
|
Foreign exchange forward contracts
d
|
—
|
|
0.6
|
|
—
|
|
0.6
|
|
|||||||
|
Cross-currency swaps
d
|
—
|
|
0.4
|
|
—
|
|
0.4
|
|
|||||||
|
Derivatives not designated as hedging instruments:
|
|||||||||||||||
|
Foreign exchange forward contracts
d
|
—
|
|
2.2
|
|
—
|
|
2.2
|
|
|||||||
|
Total financial liabilities
|
$
|
—
|
|
$
|
8.9
|
|
$
|
—
|
|
$
|
8.9
|
|
|||
TIFFANY & CO.
K-
72
Financial assets and liabilities carried at fair value at
January 31, 2016
are classified in the table below in one of the three categories described above:
|
|
Estimated Fair Value
|
Total Fair
Value
|
|||||||||||||
|
(in millions)
|
Level 1
|
Level 2
|
Level 3
|
||||||||||||
|
Financial assets
|
|||||||||||||||
|
Marketable securities
a
|
$
|
31.8
|
|
$
|
—
|
|
$
|
—
|
|
$
|
31.8
|
|
|||
|
Time deposits
b
|
43.0
|
|
—
|
|
—
|
|
43.0
|
|
|||||||
|
Derivatives designated as hedging instruments:
|
|||||||||||||||
|
Precious metal forward contracts
c
|
—
|
|
0.6
|
|
—
|
|
0.6
|
|
|||||||
|
Precious metal collar contracts
c
|
—
|
|
0.2
|
|
—
|
|
0.2
|
|
|||||||
|
Foreign exchange forward contracts
c
|
—
|
|
1.6
|
|
—
|
|
1.6
|
|
|||||||
|
Derivatives not designated as hedging instruments:
|
|||||||||||||||
|
Foreign exchange forward contracts
c
|
—
|
|
1.3
|
|
—
|
|
1.3
|
|
|||||||
|
Total financial assets
|
$
|
74.8
|
|
$
|
3.7
|
|
$
|
—
|
|
$
|
78.5
|
|
|||
|
Estimated Fair Value
|
Total Fair
Value
|
||||||||||||||
|
(in millions)
|
Level 1
|
Level 2
|
Level 3
|
||||||||||||
|
Financial liabilities
|
|||||||||||||||
|
Derivatives designated as hedging instruments:
|
|||||||||||||||
|
Precious metal forward contracts
d
|
$
|
—
|
|
$
|
13.4
|
|
$
|
—
|
|
$
|
13.4
|
|
|||
|
Foreign exchange forward contracts
d
|
—
|
|
2.4
|
|
—
|
|
2.4
|
|
|||||||
|
Derivatives not designated as hedging instruments:
|
|||||||||||||||
|
Foreign exchange forward contracts
d
|
—
|
|
1.4
|
|
—
|
|
1.4
|
|
|||||||
|
Total financial liabilities
|
$
|
—
|
|
$
|
17.2
|
|
$
|
—
|
|
$
|
17.2
|
|
|||
|
a
|
Included within Other assets, net.
|
|
b
|
Included within Short-term investments.
|
|
c
|
Included within Prepaid expenses and other current assets or Other assets, net evaluated based on the maturity of the contract.
|
|
d
|
Included within Accounts payable and accrued liabilities or Other long-term liabilities evaluated based on the maturity of the contract.
|
The fair value of cash and cash equivalents, accounts receivable, accounts payable and accrued liabilities approximates carrying value due to the short-term maturities of these assets and liabilities and as such is measured using Level 1 inputs. The fair value of debt with variable interest rates approximates carrying value and is measured using Level 2 inputs. The fair value of debt with fixed interest rates was determined using the quoted market prices of debt instruments with similar terms and maturities, which are considered Level 2 inputs. The total carrying value of short-term borrowings and long-term debt was
$1.1
billion and the corresponding fair value was approximately
$1.1
billion at
January 31, 2017
and
2016
.
J. COMMITMENTS AND CONTINGENCIES
Leases
The Company leases certain office, distribution, retail and manufacturing facilities, land and equipment. Retail store leases may require the payment of minimum rentals and contingent rent based on a percentage of sales exceeding a stipulated amount. The lease agreements, which expire at various dates through 2062, are subject, in many cases, to renewal options and provide for the payment of taxes, insurance and maintenance. Certain leases contain escalation
TIFFANY & CO.
K-
73
clauses resulting from the pass-through of increases in operating costs, property taxes and the effect on costs from changes in consumer price indices.
Rent-free periods and other incentives granted under certain leases and scheduled rent increases are charged to rent expense on a straight-line basis over the related terms of such leases, beginning from when the Company takes possession of the leased facility. Lease expense includes predetermined rent escalations (including escalations based on the Consumer Price Index or other indices) and is recorded on a straight-line basis over the term of the lease. Adjustments to indices are treated as contingent rent and recorded in the period that such adjustments are determined.
The Company entered into sale-leaseback arrangements for its Retail Service Center, a distribution and administrative office facility in New Jersey, in 2005 and for the TIFFANY & CO. stores in Tokyo's Ginza shopping district and on London's Old Bond Street in 2007. These sale-leaseback arrangements resulted in total deferred gains of
$144.5
million which are being amortized in SG&A expenses over periods that range from
15
to
20
years. As of January 31,
2017
,
$45.9 million
of these deferred gains remained to be amortized.
Rent expense for the Company's operating leases consisted of the following:
|
Years Ended January 31,
|
|||||||||
|
(in millions)
|
2017
|
|
2016
|
|
2015
|
|
|||
|
Minimum rent for retail locations
|
$
|
184.1
|
|
$
|
172.2
|
|
$
|
158.2
|
|
|
Contingent rent based on sales
|
32.4
|
|
34.9
|
|
38.6
|
|
|||
|
Office, distribution and manufacturing facilities and equipment
|
40.0
|
|
37.0
|
|
35.8
|
|
|||
|
$
|
256.5
|
|
$
|
244.1
|
|
$
|
232.6
|
|
|
In addition, the Company operates certain TIFFANY & CO. stores within various department stores outside the U.S. and has agreements where the department store operators provide store facilities and other services. The Company pays the department store operators a percentage fee based on sales generated in these locations (recorded as commission expense within SG&A expenses) which totaled
$117.9
million,
$109.4
million and
$113.7
million in
2016
,
2015
and
2014
, and which are not included in the table above.
Aggregate annual minimum rental payments under non-cancelable operating leases are as follows:
|
Years Ending January 31,
|
Annual Minimum Rental Payments
a
(in millions)
|
|
|
|
2018
|
$
|
286.2
|
|
|
2019
|
203.6
|
|
|
|
2020
|
187.2
|
|
|
|
2021
|
168.8
|
|
|
|
2022
|
148.7
|
|
|
|
Thereafter
|
558.2
|
|
|
|
a
|
Operating lease obligations do not include obligations for property taxes, insurance and maintenance that are required by most lease agreements.
|
Diamond Sourcing Activities
The Company has agreements with various diamond producers to purchase a minimum volume of rough diamonds at prevailing fair market prices. Under those agreements, management anticipates that it will purchase approximately
$60.0
million of rough diamonds in
2017
. Purchases beyond
2017
that are contingent upon mine production at then-prevailing fair market prices cannot be reasonably estimated. In addition, the Company also regularly purchases rough and polished diamonds from other suppliers, although it has no contractual obligations to do so.
TIFFANY & CO.
K-
74
In consideration of its diamond supply agreements, the Company has provided financing to certain suppliers of its rough diamonds. In March 2011, Laurelton Diamonds, Inc. ("Laurelton"), a wholly owned subsidiary of the Company, as lender, entered into a
$50.0
million amortizing term loan facility agreement with Koidu, as borrower, and BSG Resources Limited, as a limited guarantor. Koidu operates a kimberlite diamond mine in Sierra Leone (the "Mine") from which Laurelton acquires diamonds. Koidu was required under the terms of the Loan to apply the proceeds of the Loan to capital expenditures necessary to increase the output of the Mine, among other purposes. As of July 31, 2011, the Loan was fully funded. In consideration of the Loan, Laurelton entered into a supply agreement, pursuant to which Laurelton is required to purchase at fair market value certain diamonds recovered from the Mine that meet Laurelton's quality standards. The assets of Koidu, including all equipment and rights in respect of the Mine, are subject to the security interest of a lender that is not affiliated with the Company. The Loan is partially secured by the diamonds, if any, that have been extracted from the Mine and that have not been sold to third parties. The Company has evaluated the variable interest entity consolidation requirements with respect to this transaction and has determined that it is not the primary beneficiary, as it does not have the power to direct any of the activities that most significantly impact Koidu's economic performance.
On March 29, 2013, the Company entered into an amendment relating to the Loan which deferred principal and interest payments due in 2013 to subsequent years, and, on March 31, 2014, the Company entered into a further amendment providing that the principal payments due in 2014 be paid on a monthly basis rather than on a semi-annual basis. On April 30, 2015, the Company entered into a further amendment (the "2015 Amendment"). Pursuant to the 2015 Amendment, once certain customary conditions relating to the addition of one of Koidu's affiliates as an obligor under the Loan were satisfied, the principal payment due on March 30, 2015 would be deferred until a date to be specified by the Company (which date may be upon at least 30 days' written notice to Koidu, or upon the occurrence of certain specified acceleration conditions). As of June 2015, all of the conditions had been satisfied and the deferral of the principal payment due on March 30, 2015 had become effective, subject to the acceleration conditions set forth in the 2015 Amendment, which include Koidu remaining current on its other payment obligations to the Company. The Loan, as amended, is required to be repaid in full by March 2017 through semi-annual payments. Under the 2015 Amendment, the interest rate on the Loan was increased and, as of April 1, 2015, interest will accrue at a rate per annum that is the greater of (i)
LIBOR
plus
3.5%
or (ii)
6.75%
. Koidu also agreed to pay, and subsequently paid, an additional
2%
per annum of interest on all deferred principal repayments.
As of January 31, 2016, Koidu had not made any of its interest payments due in July 2015 and thereafter, nor its principal payment due in September 2015. The missed payments constitute events of default under the Loan. In February 2016, the Company received the results from two separate and independent reviews of Koidu's operational plans, forecasts, and cash flow projections for the mine, which were commissioned by the Company and by Koidu's largest creditor, respectively. Based on these factors, ongoing discussions with Koidu, and consideration of the possible actions that all parties, including the Government of Sierra Leone and Koidu's largest creditor, might take under the circumstances, management determined that it was probable that it would be unable to collect a portion of the amounts due under the contractual terms of the Loan, and recorded impairment charges, and a related valuation allowance, of
$37.9 million
in 2015. Additionally, the Company ceased accruing interest income on the outstanding Loan balance as of July 31, 2015. The carrying amount of the Company’s loan receivable from Koidu, net of the valuation allowance, was
$5.9 million
at January 31,
2016
.
Koidu did not make any payments due to the Company under the Loan in 2016. On March 17, 2017, the Company entered into an agreement with Koidu's largest creditor under which that creditor has agreed to purchase the Company's interest in the loan, on and effective March 22, 2017, for $
1.7 million
. Based on this agreement, the Company has recorded an additional impairment charge, and a related valuation allowance, of
$4.2 million
in 2016 to reduce the carrying amount of the Company's loan receivable from Koidu, net of the valuation allowance, to
$1.7 million
at January 31,
2017
. Additionally, on March 16, 2017, the Company and Koidu entered into an agreement to terminate the supply agreement between the parties, pursuant to which Laurelton had previously been required to purchase at fair market value certain diamonds recovered from the Mine that met Laurelton's quality standards.
Contractual Cash Obligations and Contingent Funding Commitments
At January 31,
2017
, the Company's contractual cash obligations and contingent funding commitments were for inventory purchases of
$196.6 million
(which includes the
$60.0
million obligation discussed in Diamond Sourcing Activities above), as well as for other contractual obligations of
$71.4 million
(primarily for construction-in-progress, technology licensing and service contracts, advertising and media agreements and fixed royalty commitments).
TIFFANY & CO.
K-
75
Litigation
Arbitration Award.
On December 21, 2013, an award was issued (the "Arbitration Award") in favor of The Swatch Group Ltd. ("Swatch") and its wholly owned subsidiary Tiffany Watch Co. ("Watch Company"; Swatch and Watch Company, together, the "Swatch Parties") in an arbitration proceeding (the "Arbitration") between the Registrant and its wholly owned subsidiaries, Tiffany and Company and Tiffany (NJ) Inc. (the Registrant and such subsidiaries, together, the "Tiffany Parties") and the Swatch Parties.
The Arbitration was initiated in June 2011 by the Swatch Parties, who sought damages for alleged breach of agreements entered into by and among the Swatch Parties and the Tiffany Parties in December 2007 (the "Agreements"). The Agreements pertained to the development and commercialization of a watch business and, among other things, contained various licensing and governance provisions and approval requirements relating to business, marketing and branding plans and provisions allocating profits relating to sales of the watch business between the Swatch Parties and the Tiffany Parties.
In general terms, the Swatch Parties alleged that the Tiffany Parties breached the Agreements by obstructing and delaying development of Watch Company’s business and otherwise failing to proceed in good faith. The Swatch Parties sought damages based on alternate theories ranging from CHF
73.0
million (or approximately
$73.0 million
at January 31,
2017
) (based on its alleged wasted investment) to CHF
3.8
billion (or approximately
$3.8 billion
at January 31,
2017
) (calculated based on alleged future lost profits of the Swatch Parties and their affiliates over the entire term of the Agreements).
The Registrant believes that the claims of the Swatch Parties are without merit. In the Arbitration, the Tiffany Parties defended against the Swatch Parties’ claims vigorously, disputing both the merits of the claims and the calculation of the alleged damages. The Tiffany Parties also asserted counterclaims for damages attributable to breach by the Swatch Parties, stemming from the Swatch Parties’ September 12, 2011 public issuance of a Notice of Termination purporting to terminate the Agreements due to alleged material breach by the Tiffany Parties, and for termination due to such breach. In general terms, the Tiffany Parties alleged that the Swatch Parties did not have grounds for termination, failed to meet the high standard for proving material breach set forth in the Agreements and failed to provide appropriate management, distribution, marketing and other resources for TIFFANY & CO. brand watches and to honor their contractual obligations to the Tiffany Parties regarding brand management. The Tiffany Parties’ counterclaims sought damages based on alternate theories ranging from CHF
120.0
million (or approximately
$121.0 million
at January 31,
2017
) (based on its wasted investment) to approximately CHF
540.0
million (or approximately
$542.0 million
at January 31,
2017
) (calculated based on alleged future lost profits of the Tiffany Parties).
The Arbitration hearing was held in October 2012 before a three-member arbitral panel convened in the Netherlands pursuant to the Arbitration Rules of the Netherlands Arbitration Institute (the "Rules"), and the Arbitration record was completed in February 2013.
Under the terms of the Arbitration Award, and at the request of the Swatch Parties and the Tiffany Parties, the Agreements were deemed terminated. The Arbitration Award stated that the effective date of termination was March 1, 2013. Pursuant to the Arbitration Award, the Tiffany Parties were ordered to pay the Swatch Parties damages of CHF
402.7
million (the "Arbitration Damages"), as well as interest from June 30, 2012 to the date of payment, two-thirds of the cost of the Arbitration and two-thirds of the Swatch Parties' legal fees, expenses and costs. These amounts were paid in full in January 2014.
Prior to the ruling of the arbitral panel, no accrual was established in the Company's consolidated financial statements because management did not believe the likelihood of an award of damages to the Swatch Parties was probable. As a result of the ruling, in the fourth quarter of 2013, the Company recorded a charge of
$480.2
million, which included the damages, interest, and other costs associated with the ruling and which was classified as Arbitration award expense in the consolidated statement of earnings.
On March 31, 2014, the Tiffany Parties took action in the District Court of Amsterdam to annul the Arbitration Award. Generally, arbitration awards are final; however, Dutch law does provide for limited grounds on which arbitral awards may be set aside. The Tiffany Parties petitioned to annul the Arbitration Award on these statutory grounds. These grounds include, for example, that the arbitral tribunal violated its mandate by changing the express terms of the Agreements.
TIFFANY & CO.
K-
76
A three-judge panel presided over the annulment hearing on January 19, 2015, and, on March 4, 2015, issued a decision in favor of the Tiffany Parties. Under this decision, the Arbitration Award is set aside. However, the Swatch Parties took action in the Dutch courts to appeal the District Court's decision, and a three-judge panel presided over an appellate hearing in respect of the annulment, and the related claim by the Tiffany Parties for return of the Arbitration Damages and related costs, on June 29, 2016. That panel's decision, which may be appealed to the Supreme Court of the Netherlands, is pending. As a result of this ongoing appellate process, the Arbitration Award may ultimately be upheld by the courts of the Netherlands. Registrant’s management expects that the annulment action is not likely to be ultimately resolved until at the earliest, Registrant's fiscal year ending January 31, 2018.
If the Arbitration Award is finally annulled, management anticipates that the claims and counterclaims that formed the basis of the Arbitration, and potentially additional claims and counterclaims, will be litigated in court proceedings between and among the Swatch Parties and the Tiffany Parties. The identity and location of the courts that would hear such actions have not been determined at this time.
In any litigation regarding the claims and counterclaims that formed the basis of the arbitration, issues of liability and damages will be pled and determined without regard to the findings of the arbitral panel. As such, it is possible that the court could find that the Swatch Parties were in material breach of their obligations under the Agreements, that the Tiffany Parties were in material breach of their obligations under the Agreements or that neither the Swatch Parties nor the Tiffany Parties were in material breach. If the Swatch Parties’ claims of liability were accepted by the court, the damages award cannot be reasonably estimated at this time, but could exceed the Arbitration Damages and could have a material adverse effect on the Registrant’s consolidated financial statements or liquidity.
Although the District Court issued a decision in favor of the Tiffany Parties, an amount will only be recorded for any return of amounts paid under the Arbitration Award when the District’s Court decision is final (i.e., after all rights of appeal have been exhausted) and return of these amounts is deemed probable and collection is reasonably assured. As such, the Company has not recorded any amounts in its consolidated financial statements related to the District Court’s decision.
Additionally, management has not established any accrual in the Company's consolidated financial statements for the year ended January 31, 2017 related to the annulment process or any potential subsequent litigation because it does not believe that the final annulment of the Arbitration Award and a subsequent award of damages exceeding the Arbitration Damages is probable.
In 2015, management introduced new TIFFANY & CO. brand watches, which have been designed, produced, marketed and distributed through certain of the Company's Swiss subsidiaries.
Other Litigation Matters.
The Company is from time to time involved in routine litigation incidental to the conduct of its business, including proceedings to protect its trademark rights, litigation with parties claiming infringement of patents and other intellectual property rights by the Company, litigation instituted by persons alleged to have been injured upon premises under the Company's control and litigation with present and former employees and customers. Although litigation with present and former employees is routine and incidental to the conduct of the Company's business, as well as for any business employing significant numbers of employees, such litigation can result in large monetary awards when a civil jury is allowed to determine compensatory and/or punitive damages for actions claiming discrimination on the basis of age, gender, race, religion, disability or other legally-protected characteristic or for termination of employment that is wrongful or in violation of implied contracts. However, the Company believes that all such litigation currently pending to which it is a party or to which its properties are subject will be resolved without any material adverse effect on the Company's financial position, earnings or cash flows.
Gain contingency.
On February 14, 2013, Tiffany and Company and Tiffany (NJ) LLC (collectively, the "Tiffany plaintiffs") initiated a lawsuit against Costco Wholesale Corp. ("Costco") for trademark infringement, false designation of origin and unfair competition, trademark dilution and trademark counterfeiting (the "Costco Litigation"). The Tiffany plaintiffs sought injunctive relief, monetary recovery and statutory damages on account of Costco's use of "Tiffany" on signs in the jewelry cases at Costco stores used to describe certain diamond engagement rings that were not manufactured by Tiffany. Costco filed a counterclaim arguing that the TIFFANY trademark was a generic term for multi-pronged ring settings and seeking to have the trademark invalidated, modified or partially canceled in that respect. On September 8, 2015, the U.S. District Court for the Southern District of New York (the "Court") granted the Tiffany plaintiffs' motion for summary judgment of liability in its entirety, dismissing Costco's genericism counterclaim and finding that Costco was liable for trademark infringement, trademark counterfeiting and unfair
TIFFANY & CO.
K-
77
competition under New York law in its use of "Tiffany" on the above-referenced signs. On September 29, 2016, a civil jury rendered its verdict, finding that Costco's profits on the sale of the infringing rings should be awarded at
$5.5 million
, and further finding that an award of punitive damages was warranted. On October 5, 2016, the jury awarded
$8.25 million
in punitive damages. The aggregate award of
$13.75 million
is not final, and is subject to post-verdict motion practice and ultimately to adjustment by the Court. In such post-verdict motion practice, the Tiffany plaintiffs asserted that the profits award should be trebled and that Costco should also pay the Tiffany plaintiffs' legal fees in respect of this matter. Management expects that the Court will enter its final judgment as to the damages and other monetary recovery that Costco will be ordered to pay to the Tiffany plaintiffs during the Company's 2017 fiscal year. Management also expects that Costco will appeal this judgment, and that the Tiffany plaintiffs will be unable to enforce the judgment while the appeal is pending. As such, the Company has not recorded any amount in its consolidated financial statements related to this gain contingency as of January 31, 2017, and expects that this matter will not ultimately be resolved until, at the earliest, the Company's fiscal year ending January 31, 2018.
Environmental Matter
In 2005, the U.S. Environmental Protection Agency ("EPA") designated a 17-mile stretch of the Passaic River (the "River") part of the Diamond Alkali "Superfund" site. This designation resulted from the detection of hazardous substances emanating from the site, which was previously home to the Diamond Shamrock Corporation, a manufacturer of pesticides and herbicides. Under the Superfund law, the EPA will negotiate with potentially responsible parties to agree on remediation approaches.
The Company, which operated a silverware manufacturing facility near a tributary of the River from approximately 1897 to 1985, is one of more than 300 parties (the "Potentially Responsible Parties") designated in litigation as potentially responsible parties with respect to the River. The EPA issued general notice letters to 125 of these parties. The Company, along with approximately 70 other Potentially Responsible Parties (collectively, the "Cooperating Parties Group" or "CPG") voluntarily entered into an Administrative Settlement Agreement and Order on Consent ("AOC") with the EPA in May 2007 to perform a Remedial Investigation/Feasibility Study (the "RI/FS") of the lower 17 miles of the River. In June 2012, most of the CPG voluntarily entered into a second AOC related to focused remediation actions at Mile 10.9 of the River. The actions under the Mile 10.9 AOC are complete (except for continued monitoring), the Remedial Investigation ("RI") portion of the RI/FS was submitted to the EPA on February 19, 2015, and the Feasibility Study ("FS") portion of the RI/FS was submitted to the EPA on April 30, 2015. The Company has accrued for its financial obligations under both AOCs, which have not been material to its financial position or results of operations in previous financial periods or on a cumulative basis.
The FS presented and evaluated three options for remediating the lower 17 miles of the River, including the approach recommended by the EPA in its Focused Feasibility Study discussed below, as well as a fourth option of taking no action, and recommended an approach for a targeted remediation of the entire 17-mile stretch of the River. The estimated cost of the approach recommended by the CPG in the FS is approximately
$483.0 million
. The RI and FS are being reviewed by the EPA and other governmental agencies and stakeholders. Ultimately, the Company expects that the EPA will identify and negotiate with any or all of the potentially responsible parties regarding any remediation action that may be necessary, and issue a Record of Decision with a proposed approach to remediating the entire lower 17-mile stretch of the River.
Separately, on April 11, 2014, the EPA issued a proposed plan for remediating the lower eight miles of the River, which is supported by a Focused Feasibility Study (the "FFS"). The FFS evaluated three remediation options, as well as a fourth option of taking no action. Following a public review and comment period and the EPA's review of comments received, the EPA issued a Record of Decision on March 4, 2016 that set forth a remediation plan for the lower eight miles of the River (the "RoD Remediation"). The RoD Remediation is estimated by the EPA to cost
$1.38 billion
. The Record of Decision did not identify any party or parties as being responsible for the design of the remediation or for the remediation itself. The EPA did note that it estimates the design of the necessary remediation activities will take three to four years, with the remediation to follow, which is estimated to take an additional six years to complete.
On March 31, 2016, the EPA issued a letter to approximately 100 companies (including the Company) (collectively, the "notified companies") notifying them of potential liability for the RoD Remediation and of the EPA’s planned approach to addressing the cost of the RoD Remediation, which included the possibility of a de-minimis cash-out settlement (the "settlement option") for certain parties. In April of 2016, the Company notified the EPA of its interest
TIFFANY & CO.
K-
78
in pursuing the settlement option, and accordingly recorded an immaterial liability representing its best estimate of its minimum liability for the RoD Remediation, which reflects the possibility of a de-minimis settlement. Although the EPA must determine which parties are eligible for the settlement option, the Company does not expect any settlement amount that it might agree with the EPA to be material to its financial position, results of operations or cash flows.
In October 2016, the EPA announced that it entered into a legal agreement with one of the notified companies, pursuant to which such company agreed to spend
$165.0 million
to perform the engineering and design work required in advance of the clean-up contemplated by the RoD Remediation (the "RoD Design Phase"). In the absence of a viable settlement option, the Company is unable to determine its participation in the overall RoD Remediation (of which the RoD Design Phase is only a part), if any, relative to the other potentially responsible parties or the allocation of the estimated cost thereof among the potentially responsible parties, until such time as the EPA reaches an agreement with any potentially responsible party or parties to fund the overall RoD Remediation (or pursues legal or administrative action to require any potentially responsible party or parties to perform, or pay for, the overall RoD Remediation). With respect to the RI/FS (which is distinct from the RoD Remediation), until a Record of Decision is issued with respect to the RI/FS, neither the ultimate remedial approach for the remaining upper nine miles of the relevant 17-mile stretch of the River and its cost, nor the Company's participation, if any, relative to the other potentially responsible parties in this approach and cost, can be determined.
As such, the Company's liability, if any, beyond that already recorded for (1) its obligations under the 2007 AOC and the Mile 10.9 AOC, and (2) its estimate related to a de minimis cash-out settlement for the RoD Remediation, cannot be determined at this time. However, the Company does not expect that its ultimate liability related to the relevant 17-mile stretch of the River will be material to its financial position, in light of the number of companies that have previously been identified as Potentially Responsible Parties (i.e., the more than 300 parties that were initially designated in litigation as potentially responsible parties), which includes, but goes well beyond those approximately 70 companies in the CPG that participated in the 2007 AOC and the Mile 10.9 AOC, and the Company's relative participation in the costs related to the 2007 AOC and Mile 10.9 AOC. It is nonetheless possible that any resulting liability when the uncertainties discussed above are resolved could be material to the Company's results of operations or cash flows in the period in which such uncertainties are resolved.
Other Regulatory Matters
The Company is subject to regulations in various jurisdictions in which the Company operates, including those related to the sale of consumer products. During the Company's regular internal quality testing, the Company identified a potential breach of the Company's sourcing and quality standards applicable to third party vendors. The Company is currently in the early stages of assessing the composition of certain of its gold products manufactured by certain U.S. third-party vendors, which contain gold solder manufactured by other U.S. vendors, to determine whether such products are in compliance with applicable consumer products requirements and regulations. This assessment could result in the Company reporting instances of non-compliance to regulatory authorities in one or more markets, and incurring costs, including for the possible payment of fines and penalties. Management has not recorded any liability for these matters as it does not believe that such liability is probable and reasonably estimable. It is nonetheless possible that any resulting liability when the uncertainties discussed above are resolved could be material to the Company's results of operations or cash flows in the periods in which such uncertainties are resolved.
Other
In the fourth quarter of 2015, the Company implemented specific cost-reduction initiatives and recorded
$8.8 million
of expense within SG&A expenses. These unrelated cost-reduction initiatives included severance related to staffing reductions and subleasing of certain office space for which only a portion of the Company's future rent obligations will be recovered.
|
K.
|
RELATED PARTIES
|
The Company's Chairman of the Board and, effective February 5, 2017, Interim Chief Executive Officer was a member of the Board of Directors of The Bank of New York Mellon through April 14, 2015. The Bank of New York Mellon serves as the Company's trustee for its Senior Notes due in 2024 and 2044, participates as a co-syndication agent and lender for its New Credit Facilities, provides other general banking services and serves as the trustee for
TIFFANY & CO.
K-
79
the Company's pension plan. Fees paid to the bank for services rendered and interest on debt amounted to
$0.7
million and
$1.3
million in
2015
and
2014
.
L. STOCKHOLDERS' EQUITY
Accumulated Other Comprehensive Loss
|
January 31,
|
|||||||
|
(in millions)
|
2017
|
|
2016
|
|
|||
|
Accumulated other comprehensive (loss) earnings, net of tax:
|
|||||||
|
Foreign currency translation adjustments
|
$
|
(143.7
|
)
|
$
|
(135.3
|
)
|
|
|
Unrealized gain (loss) on marketable securities
|
0.8
|
|
(1.0
|
)
|
|||
|
Deferred hedging loss
|
(16.1
|
)
|
(26.8
|
)
|
|||
|
Net unrealized loss on benefit plans
|
(97.2
|
)
|
(115.0
|
)
|
|||
|
$
|
(256.2
|
)
|
$
|
(278.1
|
)
|
||
Additions to and reclassifications out of accumulated other comprehensive earnings (loss) are as follows:
|
|
Years Ended January 31,
|
||||||||
|
(
in millions
)
|
2017
|
|
2016
|
|
2015
|
|
|||
|
Foreign currency translation adjustments
|
$
|
8.3
|
|
$
|
(59.9
|
)
|
$
|
(101.9
|
)
|
|
Income tax (expense) benefit
|
(16.7
|
)
|
0.9
|
|
8.8
|
|
|||
|
Foreign currency adjustments, net of tax
|
(8.4
|
)
|
(59.0
|
)
|
(93.1
|
)
|
|||
|
Unrealized gain (loss) on marketable securities
|
2.7
|
|
(4.1
|
)
|
(0.9
|
)
|
|||
|
Reclassification for gain included in net earnings
a
|
—
|
|
(0.4
|
)
|
—
|
|
|||
|
Income tax (expense) benefit
|
(0.9
|
)
|
1.6
|
|
0.1
|
|
|||
|
Unrealized gain (loss) on marketable securities, net of tax
|
1.8
|
|
(2.9
|
)
|
(0.8
|
)
|
|||
|
Unrealized gain (loss) on hedging instruments
|
12.1
|
|
(22.2
|
)
|
14.6
|
|
|||
|
Reclassification adjustment for loss (gain) included in
net earnings
b
|
4.9
|
|
(11.7
|
)
|
(13.0
|
)
|
|||
|
Income tax (expense) benefit
|
(6.3
|
)
|
12.5
|
|
(0.4
|
)
|
|||
|
Unrealized gain (loss) on hedging instruments, net of tax
|
10.7
|
|
(21.4
|
)
|
1.2
|
|
|||
|
Prior service cost
|
—
|
|
—
|
|
(0.5
|
)
|
|||
|
Net actuarial gain (loss)
|
14.1
|
|
122.5
|
|
(234.6
|
)
|
|||
|
Amortization of net loss included in net earnings
c
|
14.7
|
|
30.4
|
|
13.1
|
|
|||
|
Amortization of prior service credit included in net earnings
c
|
(0.7
|
)
|
(0.6
|
)
|
(0.4
|
)
|
|||
|
Income tax (expense) benefit
|
(10.3
|
)
|
(56.6
|
)
|
83.2
|
|
|||
|
Net unrealized gain (loss) on benefit plans, net of tax
|
17.8
|
|
95.7
|
|
(139.2
|
)
|
|||
|
Total other comprehensive earnings (loss), net of tax
|
$
|
21.9
|
|
$
|
12.4
|
|
$
|
(231.9
|
)
|
|
a
|
These gains are reclassified into Other (income) expense, net.
|
|
b
|
These losses (gains) are reclassified into Interest expense and financing costs and Cost of sales (see "Note H. Hedging Instruments" for additional details).
|
|
c
|
These accumulated other comprehensive income components are included in the computation of net periodic pension costs (see "Note N. Employee Benefit Plans" for additional details).
|
TIFFANY & CO.
K-
80
Stock Repurchase Program
In January 2016, the Registrant's Board of Directors approved the termination of the Company's then-existing share repurchase program, which was approved in March 2014 and had authorized the Company to repurchase up to
$300.0
million of its Common Stock through open market transactions (the "2014 Program") in favor of a new share repurchase program ("2016 Program"). The 2016 Program, which will expire on
January 31, 2019
, authorizes the Company to repurchase up to
$500.0
million of its Common Stock through open market transactions, block trades or privately negotiated transactions. Purchases under the 2014 Program were, and purchases under the 2016 Program have been, executed under a written plan for trading securities as specified under Rule 10b5-1 promulgated under the Securities and Exchange Act of 1934, as amended, the terms of which are within the Company's discretion, subject to applicable securities laws, and are based on market conditions and the Company's liquidity needs. Approximately
$310.4
million remained available for repurchase under the 2016 Program at
January 31, 2017
.
The Company's share repurchase activity was as follows:
|
Years Ended January 31,
|
|||||||||
|
(in millions, except per share amounts)
|
2017
|
|
2016
|
|
2015
|
|
|||
|
Cost of repurchases
|
$
|
183.6
|
|
$
|
220.4
|
|
$
|
27.0
|
|
|
Shares repurchased and retired
|
2.8
|
|
2.8
|
|
0.3
|
|
|||
|
Average cost per share
|
$
|
65.24
|
|
$
|
78.40
|
|
$
|
89.91
|
|
Cash Dividends
The Company's Board of Directors declared quarterly dividends which, on an annual basis, totaled
$1.75
,
$1.58
and
$1.48
per share of Common Stock in
2016
,
2015
and
2014
.
On
February 16, 2017
, the Company's Board of Directors declared a quarterly dividend of
$0.45
per share of Common Stock. This dividend will be paid on
April 10, 2017
to stockholders of record on
March 20, 2017
.
M. STOCK COMPENSATION PLANS
The Company has two stock compensation plans under which awards may be made: the Employee Incentive Plan and the Directors Equity Compensation Plan, both of which were approved by the stockholders. No award may be made under the Employee Incentive Plan after May 22, 2024 or under the Directors Equity Compensation Plan after May 15, 2018.
Under the Employee Incentive Plan, the maximum number of common shares authorized for issuance was
8.7
million. Awards may be made to employees of the Company or its related companies in the form of stock options, stock appreciation rights, shares of stock (or rights to receive shares of stock) and cash. Awards made in the form of non-qualified stock options, tax-qualified incentive stock options or stock appreciation rights have a maximum term of
10
years from the grant date and may not be granted for an exercise price below fair market value.
The Company has granted time-vesting restricted stock units ("RSUs"), performance-based restricted stock units ("PSUs") and stock options under the Employee Incentive Plan. Stock options and RSUs vest primarily in increments of
25%
per year over
four
years. PSUs issued to the executive officers vest at the end of a
three
-year period. Vesting of all PSUs is contingent on the Company's performance against established objectives established by the Compensation Committee of the Company's Board of Directors. The PSUs and RSUs require no payment from the employee. PSU and RSU payouts will be in shares of Company stock at vesting. Compensation expense is recognized using the fair market value at the date of grant and recorded ratably over the vesting period. However, PSU compensation expense may be adjusted over the vesting period based on interim estimates of performance against the established objectives. Award holders are not entitled to receive dividends or dividend equivalents on unvested stock options or PSUs or RSUs granted prior to January 2017. PSUs and RSUs granted in January 2017 accrue dividend equivalents that may only be paid or delivered upon vesting of the underlying stock units.
TIFFANY & CO.
K-
81
Under the Directors Equity Compensation Plan, the maximum number of shares of Common Stock authorized for issuance was
1.0
million (subject to adjustment); awards may be made to non-employee directors of the Company in the form of stock options or shares of stock but may not exceed
25
thousand (subject to adjustment) shares per non-employee director in any fiscal year. Awards of shares (or rights to receive shares) reduce the above authorized amount by
1.58
shares for every share delivered pursuant to such an award. Awards made in the form of stock options may have a maximum term of
10
years from the grant date and may not be granted for an exercise price below fair market value unless the director has agreed to forego all or a portion of his or her annual cash retainer or other fees for service as a director in exchange for below-market exercise price options. Director options vest immediately. Director RSUs vest over a
one
-year period.
The Company uses newly issued shares to satisfy stock option exercises and the vesting of PSUs and RSUs.
The fair value of each option award is estimated on the grant date using a Black-Scholes option valuation model and compensation expense is recognized ratably over the vesting period. The valuation model uses the assumptions noted in the following table. Expected volatilities are based on historical volatility of the Company's stock. The Company uses historical data to estimate the expected term of the option that represents the period of time that options granted are expected to be outstanding. The risk-free interest rate for periods within the expected term of the option is based on the U.S. Treasury yield curve in effect at the grant date.
|
Years Ended January 31,
|
||||||
|
2017
|
|
2016
|
|
2015
|
|
|
|
Dividend yield
|
2.0
|
%
|
1.9
|
%
|
1.3
|
%
|
|
Expected volatility
|
23.8
|
%
|
28.1
|
%
|
30.2
|
%
|
|
Risk-free interest rate
|
1.8
|
%
|
1.5
|
%
|
1.5
|
%
|
|
Expected term in years
|
5
|
|
5
|
|
5
|
|
A summary of the option activity for the Company's stock option plans is presented below:
|
Number of
Shares
(in millions)
|
|
Weighted-
Average
Exercise Price
|
|
Weighted-
Average
Remaining
Contractual
Term in Years
|
Aggregate
Intrinsic
Value
(in millions)
|
|
|||
|
Outstanding at January 31, 2016
|
2.1
|
|
$
|
67.59
|
|
7.02
|
$
|
7.9
|
|
|
Granted
|
0.6
|
|
77.20
|
|
|||||
|
Exercised
|
(0.3
|
)
|
57.40
|
|
|||||
|
Forfeited/canceled
|
(0.1
|
)
|
75.16
|
|
|||||
|
Outstanding at January 31, 2017
|
2.3
|
|
$
|
70.72
|
|
7.50
|
$
|
23.8
|
|
|
Exercisable at January 31, 2017
|
1.1
|
|
$
|
66.42
|
|
5.70
|
$
|
17.0
|
|
The weighted-average grant-date fair value of options granted for the years ended January 31,
2017
,
2016
and
2015
was
$14.36
,
$14.42
and
$22.25
. The total intrinsic value (market value on date of exercise less grant price) of options exercised during the years ended January 31,
2017
,
2016
and
2015
was
$4.5
million,
$2.4
million and
$44.1
million.
TIFFANY & CO.
K-
82
A summary of the activity for the Company's RSUs is presented below:
|
Number of Shares
(in millions)
|
|
Weighted-Average
Grant-Date Fair Value
|
|
||
|
Non-vested at January 31, 2016
|
0.5
|
|
$
|
79.02
|
|
|
Granted
|
0.4
|
|
67.46
|
|
|
|
Vested
|
(0.2
|
)
|
71.29
|
|
|
|
Forfeited
|
(0.1
|
)
|
79.51
|
|
|
|
Non-vested at January 31, 2017
|
0.6
|
|
$
|
73.33
|
|
A summary of the activity for the Company's PSUs is presented below:
|
Number of Shares
(in millions)
|
|
Weighted-Average
Grant-Date Fair Value
|
|
||
|
Non-vested at January 31, 2016
|
0.7
|
|
$
|
70.56
|
|
|
Granted
|
0.2
|
|
79.23
|
|
|
|
Vested
|
(0.1
|
)
|
67.15
|
|
|
|
Forfeited/canceled
|
(0.1
|
)
|
69.85
|
|
|
|
Non-vested at January 31, 2017
|
0.7
|
|
$
|
73.52
|
|
The weighted-average grant-date fair value of RSUs granted for the years ended January 31,
2016
and
2015
was
$80.44
and
$90.68
. The weighted-average grant-date fair value of PSUs granted for the years ended January 31,
2016
and
2015
was
$58.09
and
$82.88
.
As of January 31,
2017
, there was
$69.2
million of total unrecognized compensation expense related to non-vested share-based compensation arrangements granted under the Employee Incentive Plan and Directors Equity Compensation Plan. The expense is expected to be recognized over a weighted-average period of
2.6
years. The total fair value of RSUs vested during the years ended January 31,
2017
,
2016
and
2015
was
$13.6
million,
$18.0
million and
$27.7
million. The total fair value of PSUs vested during the years ended January 31,
2017
,
2016
and
2015
was
$6.3
million,
$4.1
million and
$8.1
million.
Total compensation cost for stock-based compensation awards recognized in income and the related income tax benefit was
$24.3
million and
$7.7
million for the year ended
January 31, 2017
,
$24.5
million and
$7.9
million for the year ended January 31,
2016
and
$26.5
million and
$8.9
million for the year ended January 31,
2015
. Total stock-based compensation cost capitalized in inventory was not significant.
|
N.
|
EMPLOYEE BENEFIT PLANS
|
Pensions and Other Postretirement Benefits
The Company maintains the following pension plans: a noncontributory defined benefit pension plan qualified in accordance with the Internal Revenue Service Code ("Qualified Plan") covering substantially all U.S. employees hired before January 1, 2006, a non-qualified unfunded retirement income plan ("Excess Plan") covering certain U.S. employees hired before January 1, 2006 and affected by Internal Revenue Service Code compensation limits, a non-qualified unfunded Supplemental Retirement Income Plan ("SRIP") covering certain executive officers of the Company hired before January 1, 2006 and noncontributory defined benefit pension plans in certain of its international locations ("Other Plans").
Qualified Plan benefits are based on (i) average compensation in the highest paid
five years of the last 10 years
of employment ("average final compensation") and (ii) the number of years of service. Participants with at least
10 years
of service who retire after attaining age 55 may receive reduced retirement benefits. Participants who have at least five years of service when their employment with the Company terminates may also receive certain benefits.
TIFFANY & CO.
K-
83
The Company funds the Qualified Plan's trust in accordance with regulatory limits to provide for current service and for the unfunded benefit obligation over a reasonable period and for current service benefit accruals. To the extent that these requirements are fully covered by assets in the Qualified Plan, the Company may elect not to make any contribution in a particular year. No cash contribution was required in 2016 and none is required in 2017 to meet the minimum funding requirements of the Employee Retirement Income Security Act. The Company periodically evaluates whether to make discretionary cash contributions to the Qualified Plan and made a voluntary cash contribution of
$120.0
million in 2016 but currently does not anticipate to make such contributions in 2017. This expectation is subject to change based on management’s assessment of a variety of factors, including, but not limited to, asset performance, interest rates and changes in actuarial assumptions.
The Qualified Plan, Excess Plan and SRIP exclude all employees hired on or after January 1, 2006. Instead, employees hired on or after January 1, 2006 are eligible to receive a defined contribution retirement benefit under the Employee Profit Sharing and Retirement Savings ("EPSRS") Plan (see "Employee Profit Sharing and Retirement Savings Plan" below). Employees hired before January 1, 2006 continue to be eligible for and accrue benefits under the Qualified Plan.
The Excess Plan uses the same retirement benefit formula set forth in the Qualified Plan, but includes earnings that are excluded under the Qualified Plan due to Internal Revenue Service Code qualified pension plan limitations. Benefits payable under the Qualified Plan offset benefits payable under the Excess Plan. Employees vested under the Qualified Plan are vested under the Excess Plan; however, benefits under the Excess Plan are subject to forfeiture if employment is terminated for cause and, for those who leave the Company prior to age 65, if they fail to execute and adhere to noncompetition and confidentiality covenants. The Excess Plan allows participants with at least
10 years
of service who retire after attaining age 55 to receive reduced retirement benefits.
The SRIP supplements the Qualified Plan, Excess Plan and Social Security by providing additional payments upon a participant's retirement. SRIP benefits are determined by a percentage of average final compensation; this percentage increases as specified service plateaus are achieved. Benefits payable under the Qualified Plan, Excess Plan and Social Security offset benefits payable under the SRIP. Under the SRIP, benefits vest when a participant both (i) attains age 55 while employed by the Company and (ii) has provided at least
10 years
of service. In certain limited circumstances, early vesting can occur due to a change in control. Benefits under the SRIP are forfeited if benefits under the Excess Plan are forfeited.
Benefits for the Other Plans are typically based on monthly eligible compensation and the number of years of service. Benefits are typically payable in a lump sum upon retirement, termination, resignation or death if the participant has completed the requisite service period.
The Company accounts for pension expense using the projected unit credit actuarial method for financial reporting purposes. The actuarial present value of the benefit obligation is calculated based on the expected date of separation or retirement of the Company's eligible employees.
The Company provides certain health-care and life insurance benefits ("Other Postretirement Benefits") for certain retired employees and accrues the cost of providing these benefits throughout the employees' active service period until they attain full eligibility for those benefits. Substantially all of the Company's U.S. full-time employees, hired on or before March 31, 2012, may become eligible for these benefits if they reach normal or early retirement age while working for the Company. The cost of providing postretirement health-care benefits is shared by the retiree and the Company, with retiree contributions evaluated annually and adjusted in order to maintain the Company/retiree cost-sharing target ratio. The life insurance benefits are noncontributory. The Company's employee and retiree health-care benefits are administered by an insurance company, and premiums on life insurance are based on prior years' claims experience.
TIFFANY & CO.
K-
84
Obligations and Funded Status
The following tables provide a reconciliation of benefit obligations, plan assets and funded status of the pension and other postretirement benefit plans as of the measurement date:
|
January 31,
|
|||||||||||||
|
Pension Benefits
|
Other Postretirement Benefits
|
||||||||||||
|
(in millions)
|
2017
|
|
2016
|
|
2017
|
|
2016
|
|
|||||
|
Change in benefit obligation:
|
|||||||||||||
|
Benefit obligation at beginning of year
|
$
|
742.6
|
|
$
|
841.7
|
|
$
|
78.4
|
|
$
|
92.9
|
|
|
|
Service cost
|
17.4
|
|
22.6
|
|
2.8
|
|
4.2
|
|
|||||
|
Interest cost
|
31.6
|
|
30.6
|
|
3.1
|
|
3.2
|
|
|||||
|
Participants' contributions
|
—
|
|
—
|
|
1.2
|
|
1.3
|
|
|||||
|
MMA retiree drug subsidy
|
—
|
|
—
|
|
—
|
|
0.2
|
|
|||||
|
Actuarial loss (gain)
|
15.9
|
|
(128.8
|
)
|
(10.5
|
)
|
(20.4
|
)
|
|||||
|
Benefits paid
|
(24.3
|
)
|
(23.1
|
)
|
(2.5
|
)
|
(3.0
|
)
|
|||||
|
Curtailments
|
—
|
|
(0.2
|
)
|
—
|
|
—
|
|
|||||
|
Translation
|
0.5
|
|
(0.2
|
)
|
—
|
|
—
|
|
|||||
|
Benefit obligation at end of year
|
783.7
|
|
742.6
|
|
72.5
|
|
78.4
|
|
|||||
|
Change in plan assets:
|
|||||||||||||
|
Fair value of plan assets at beginning of year
|
385.8
|
|
406.0
|
|
—
|
|
—
|
|
|||||
|
Actual return on plan assets
|
42.9
|
|
(2.2
|
)
|
—
|
|
—
|
|
|||||
|
Employer contribution
|
125.7
|
|
5.1
|
|
1.3
|
|
1.5
|
|
|||||
|
Participants' contributions
|
—
|
|
—
|
|
1.2
|
|
1.3
|
|
|||||
|
MMA retiree drug subsidy
|
—
|
|
—
|
|
—
|
|
0.2
|
|
|||||
|
Benefits paid
|
(24.3
|
)
|
(23.1
|
)
|
(2.5
|
)
|
(3.0
|
)
|
|||||
|
Fair value of plan assets at end of year
|
530.1
|
|
385.8
|
|
—
|
|
—
|
|
|||||
|
Funded status at end of year
|
$
|
(253.6
|
)
|
$
|
(356.8
|
)
|
$
|
(72.5
|
)
|
$
|
(78.4
|
)
|
|
Actuarial gains in 2015 reflect increases in the discount rates for all plans.
The following tables provide additional information regarding the Company's pension plans' projected benefit obligations and assets (included in pension benefits in the table above) and accumulated benefit obligation:
|
|
January 31, 2017
|
|||||||||||
|
(in millions)
|
Qualified
|
|
Excess/SRIP
|
|
Other
|
|
Total
|
|
||||
|
Projected benefit obligation
|
$
|
661.5
|
|
$
|
103.6
|
|
$
|
18.6
|
|
$
|
783.7
|
|
|
Fair value of plan assets
|
530.1
|
|
—
|
|
—
|
|
530.1
|
|
||||
|
Funded status
|
$
|
(131.4
|
)
|
$
|
(103.6
|
)
|
$
|
(18.6
|
)
|
$
|
(253.6
|
)
|
|
Accumulated benefit obligation
|
$
|
599.0
|
|
$
|
90.9
|
|
$
|
16.9
|
|
$
|
706.8
|
|
TIFFANY & CO.
K-
85
|
January 31, 2016
|
||||||||||||
|
(in millions)
|
Qualified
|
|
Excess/SRIP
|
|
Other
|
|
Total
|
|
||||
|
Projected benefit obligation
|
$
|
620.8
|
|
$
|
105.5
|
|
$
|
16.3
|
|
$
|
742.6
|
|
|
Fair value of plan assets
|
385.8
|
|
—
|
|
—
|
|
385.8
|
|
||||
|
Funded status
|
$
|
(235.0
|
)
|
$
|
(105.5
|
)
|
$
|
(16.3
|
)
|
$
|
(356.8
|
)
|
|
Accumulated benefit obligation
|
$
|
556.8
|
|
$
|
92.1
|
|
$
|
13.5
|
|
$
|
662.4
|
|
At January 31,
2017
, the Company had a current liability of
$7.5
million and a non-current liability of
$318.6 million
for pension and other postretirement benefits. At January 31,
2016
, the Company had a current liability of
$7.1
million and a non-current liability of
$428.1
million for pension and other postretirement benefits.
Amounts recognized in accumulated other comprehensive loss consist of:
|
January 31,
|
|||||||||||||
|
Pension Benefits
|
Other Postretirement Benefits
|
||||||||||||
|
(in millions)
|
2017
|
|
2016
|
|
2017
|
|
2016
|
|
|||||
|
Net actuarial loss (gain)
|
$
|
161.8
|
|
$
|
180.1
|
|
$
|
(0.1
|
)
|
$
|
10.4
|
|
|
|
Prior service cost (credit)
|
0.8
|
|
0.8
|
|
(2.4
|
)
|
(3.0
|
)
|
|||||
|
Total before tax
|
$
|
162.6
|
|
$
|
180.9
|
|
$
|
(2.5
|
)
|
$
|
7.4
|
|
|
The estimated pre-tax amount that will be amortized from accumulated other comprehensive loss into net periodic benefit cost within the next 12 months is as follows:
|
(in millions)
|
Pension Benefits
|
|
Other Postretirement Benefits
|
|
|||
|
Net actuarial loss
|
$
|
14.0
|
|
$
|
|
|
|
|
Prior service cost (credit)
|
0.2
|
|
(0.7
|
)
|
|||
|
$
|
14.2
|
|
$
|
(0.7
|
)
|
||
TIFFANY & CO.
K-
86
Components of Net Periodic Benefit Cost and
Other Amounts Recognized in Other Comprehensive Earnings
|
Years Ended January 31,
|
|||||||||||||||||||
|
Pension Benefits
|
Other Postretirement Benefits
|
||||||||||||||||||
|
(in millions)
|
2017
|
|
2016
|
|
2015
|
|
2017
|
|
2016
|
|
2015
|
|
|||||||
|
Service cost
|
$
|
17.4
|
|
$
|
22.6
|
|
$
|
16.8
|
|
$
|
2.8
|
|
$
|
4.2
|
|
$
|
2.4
|
|
|
|
Interest cost
|
31.6
|
|
30.6
|
|
28.3
|
|
3.1
|
|
3.2
|
|
2.6
|
|
|||||||
|
Expected return on plan assets
|
(23.5
|
)
|
(24.7
|
)
|
(23.6
|
)
|
—
|
|
—
|
|
—
|
|
|||||||
|
Curtailments
|
—
|
|
0.2
|
|
—
|
|
—
|
|
—
|
|
—
|
|
|||||||
|
Amortization of prior service cost
|
—
|
|
—
|
|
0.3
|
|
(0.7
|
)
|
(0.7
|
)
|
(0.7
|
)
|
|||||||
|
Amortization of net loss
|
14.7
|
|
28.9
|
|
13.1
|
|
—
|
|
1.5
|
|
—
|
|
|||||||
|
Net periodic benefit cost
|
40.2
|
|
57.6
|
|
34.9
|
|
5.2
|
|
8.2
|
|
4.3
|
|
|||||||
|
Net actuarial (gain) loss
|
(3.6
|
)
|
(102.1
|
)
|
199.8
|
|
(10.5
|
)
|
(20.4
|
)
|
34.8
|
|
|||||||
|
Recognized actuarial loss
|
(14.7
|
)
|
(28.9
|
)
|
(13.1
|
)
|
—
|
|
(1.5
|
)
|
—
|
|
|||||||
|
Prior service cost
|
—
|
|
—
|
|
0.5
|
|
—
|
|
—
|
|
—
|
|
|||||||
|
Recognized prior service (cost) credit
|
—
|
|
(0.1
|
)
|
(0.3
|
)
|
0.7
|
|
0.7
|
|
0.7
|
|
|||||||
|
Total recognized in other comprehensive earnings
|
(18.3
|
)
|
(131.1
|
)
|
186.9
|
|
(9.8
|
)
|
(21.2
|
)
|
35.5
|
|
|||||||
|
Total recognized in net periodic benefit cost and other comprehensive earnings
|
$
|
21.9
|
|
$
|
(73.5
|
)
|
$
|
221.8
|
|
$
|
(4.6
|
)
|
$
|
(13.0
|
)
|
$
|
39.8
|
|
|
Assumptions
Weighted-average assumptions used to determine benefit obligations:
|
January 31,
|
||||
|
2017
|
|
2016
|
|
|
|
Discount rate:
|
||||
|
Qualified Plan
|
4.25
|
%
|
4.50
|
%
|
|
Excess Plan/SRIP
|
4.25
|
%
|
4.25
|
%
|
|
Other Plans
|
0.81
|
%
|
1.05
|
%
|
|
Other Postretirement Benefits
|
4.25
|
%
|
4.50
|
%
|
|
Rate of increase in compensation:
|
||||
|
Qualified Plan
|
3.00
|
%
|
3.00
|
%
|
|
Excess Plan
|
4.25
|
%
|
4.25
|
%
|
|
SRIP
|
6.50
|
%
|
6.50
|
%
|
|
Other Plans
|
1.12
|
%
|
1.18
|
%
|
TIFFANY & CO.
K-
87
Weighted-average assumptions used to determine net periodic benefit cost:
|
Years Ended January 31,
|
||||||
|
2017
|
|
2016
|
|
2015
|
|
|
|
Discount rate:
|
||||||
|
Qualified Plan
|
4.50
|
%
|
3.75
|
%
|
4.75
|
%
|
|
Excess Plan/SRIP
|
4.25
|
%
|
3.75
|
%
|
5.00
|
%
|
|
Other Plans
|
1.40
|
%
|
1.71
|
%
|
1.81
|
%
|
|
Other Postretirement Benefits
|
4.50
|
%
|
3.50
|
%
|
5.00
|
%
|
|
Expected return on plan assets
|
7.00
|
%
|
7.50
|
%
|
7.50
|
%
|
|
Rate of increase in compensation:
|
||||||
|
Qualified Plan
|
3.00
|
%
|
2.75
|
%
|
2.75
|
%
|
|
Excess Plan
|
4.25
|
%
|
4.25
|
%
|
4.25
|
%
|
|
SRIP
|
6.50
|
%
|
7.25
|
%
|
7.25
|
%
|
|
Other Plans
|
1.38
|
%
|
1.56
|
%
|
1.33
|
%
|
The expected long-term rate of return on Qualified Plan assets is selected by taking into account the average rate of return expected on the funds invested or to be invested to provide for benefits included in the projected benefit obligation. More specifically, consideration is given to the expected rates of return (including reinvestment asset return rates) based upon the plan's current asset mix, investment strategy and the historical performance of plan assets.
For postretirement benefit measurement purposes, a
7.00%
annual rate of increase in the per capita cost of covered health care was assumed for
2017
. This rate was assumed to decrease gradually to
4.75%
by 2023 and remain at that level thereafter.
Assumed health-care cost trend rates can affect amounts reported for the Company's postretirement health-care benefits plan. A one-percentage-point change in the assumed health-care cost trend rate would not have a significant effect on the Company's accumulated postretirement benefit obligation for the year ended January 31,
2017
or aggregate service and interest cost components of the
2016
postretirement expense.
Plan Assets
The Company's investment objectives, related to the Qualified Plan's assets, are the preservation of principal and balancing the management of interest rate risk associated with the duration of the plan's liabilities with the achievement of a reasonable rate of return over time. The Qualified Plan's assets are allocated based on an expectation that equity securities will outperform debt securities over the long term, but that as the plan's funded status (assets relative to liabilities) increases, the amount of assets allocated to fixed income securities which match the interest rate risk profile of the plan's liabilities will increase. The Company's target asset allocations based on its funded status as of January 31, 2017 is as follows: approximately
50%
in equity securities; approximately
35%
in fixed income securities; and approximately
15%
in other securities. The Company attempts to mitigate investment risk by rebalancing asset allocation periodically.
TIFFANY & CO.
K-
88
The fair value of the Qualified Plan's assets at January 31,
2017
and
2016
by asset category is as follows:
|
Fair Value at
|
Fair Value Measurements
Using Inputs Considered as*
|
|||||||||||
|
(in millions)
|
January 31, 2017
|
Level 1
|
Level 2
|
Level 3
|
||||||||
|
Equity securities:
|
||||||||||||
|
U.S. equity securities
|
$
|
56.2
|
|
$
|
56.2
|
|
$
|
—
|
|
$
|
—
|
|
|
Mutual fund
|
35.1
|
|
35.1
|
|
—
|
|
—
|
|
||||
|
Fixed income securities:
|
||||||||||||
|
Government bonds
|
78.2
|
|
77.8
|
|
0.4
|
|
—
|
|
||||
|
Corporate bonds
|
83.8
|
|
—
|
|
83.8
|
|
—
|
|
||||
|
Other types of investments:
|
||||||||||||
|
Cash and cash equivalents
|
7.8
|
|
7.8
|
|
—
|
|
—
|
|
||||
|
Mutual funds
|
36.7
|
|
36.7
|
|
—
|
|
—
|
|
||||
|
Net assets in fair value hierarchy
|
297.8
|
|
213.6
|
|
84.2
|
|
—
|
|
||||
|
Investments at NAV practical expedient
a
|
232.3
|
|
||||||||||
|
Plan assets at fair value
|
$
|
530.1
|
|
$
|
213.6
|
|
$
|
84.2
|
|
$
|
—
|
|
|
Fair Value at
|
Fair Value Measurements
Using Inputs Considered as*
|
|||||||||||
|
(in millions)
|
January 31, 2016
|
Level 1
|
Level 2
|
Level 3
|
||||||||
|
Equity securities:
|
||||||||||||
|
U.S. equity securities
|
$
|
45.6
|
|
$
|
45.6
|
|
$
|
—
|
|
$
|
—
|
|
|
Mutual fund
|
27.4
|
|
27.4
|
|
—
|
|
—
|
|
||||
|
Fixed income securities:
|
||||||||||||
|
Government bonds
|
62.3
|
|
61.3
|
|
1.0
|
|
—
|
|
||||
|
Corporate bonds
|
87.7
|
|
—
|
|
87.7
|
|
—
|
|
||||
|
Other types of investments:
|
||||||||||||
|
Cash and cash equivalents
|
2.5
|
|
2.5
|
|
—
|
|
—
|
|
||||
|
Mutual funds
|
25.6
|
|
25.6
|
|
—
|
|
—
|
|
||||
|
Net assets in fair value hierarchy
|
251.1
|
|
162.4
|
|
88.7
|
|
—
|
|
||||
|
Investments at NAV practical expedient
a
|
134.7
|
|
||||||||||
|
Plan assets at fair value
|
$
|
385.8
|
|
$
|
162.4
|
|
$
|
88.7
|
|
$
|
—
|
|
|
*
|
See "Note I. Fair Value of Financial Instruments" for a description of the levels of inputs.
|
|
a
|
In accordance with ASC 820-10, certain investments that are measured at fair value using the net asset value ("NAV") per share (or its equivalent) practical expedient have not been classified in the fair value hierarchy. The fair value amounts presented in this table are intended to permit reconciliation of the fair value hierarchy to the Qualified Plan's fair value of plan assets at the end of each respective year.
|
Valuation Techniques
Investments within the fair value hierarchy.
Securities traded on the national securities exchange (certain government bonds) are valued at the last reported sales price or closing price on the last business day of the fiscal year. Investments traded in the over-the-counter market and listed securities for which no sales were reported (certain government bonds, corporate bonds and mortgage obligations) are valued at the last reported bid price.
TIFFANY & CO.
K-
89
Certain fixed income investments are held in separately managed accounts and those investments are valued using the underlying securities in the accounts.
Investments in mutual funds are stated at fair value as determined by quoted market prices based on the NAV of shares held by the Plan at year-end. Investments in U.S. equity securities are valued at the closing price reported on the active market on which the individual securities are traded.
Investments measured at NAV.
This category consists of common/collective trusts and limited partnerships.
Common/collective trusts include investments in U.S. and international large, middle and small capitalization equities. Investments in common/collective trusts are stated at estimated fair value which represents the net asset value of shares held by the Qualified Plan as reported by the investment advisor. The net asset value is based on the value of the underlying assets owned by the common/collective trusts, minus its liabilities and then divided by the number of shares outstanding. The NAV is used as a practical expedient to estimate fair value.
The Qualified Plan maintains investments in limited partnerships that are valued at estimated fair value based on financial information received from the investment advisor and/or general partner. The NAV is based on the value of the underlying assets owned by the fund, minus its liabilities and then divided by the number of shares outstanding. The NAV is used as a practical expedient to estimate fair value.
Benefit Payments
The Company expects the following future benefit payments to be paid:
|
Years Ending January 31,
|
Pension Benefits
(in millions)
|
|
Other Postretirement Benefits
(in millions)
|
|
||
|
2018
|
$
|
25.6
|
|
$
|
1.9
|
|
|
2019
|
26.5
|
|
2.0
|
|
||
|
2020
|
27.2
|
|
2.1
|
|
||
|
2021
|
28.6
|
|
2.2
|
|
||
|
2022
|
29.7
|
|
2.3
|
|
||
|
2023-2027
|
171.5
|
|
14.3
|
|
||
Employee Profit Sharing and Retirement Savings ("EPSRS") Plan
The Company maintains an EPSRS Plan that covers substantially all U.S.-based employees. Under the profit-sharing feature of the EPSRS Plan, the Company made contributions, in the form of newly issued Company Common Stock through 2014, to the employees' accounts based on the achievement of certain targeted earnings objectives established by, or as otherwise determined by, the Company's Board of Directors. Beginning in 2015, these contributions were made in cash. The Company recorded expense of
$2.3
million in
2016
, no expense in
2015
and expense of
$3.1
million in
2014
. Under the retirement savings feature of the EPSRS Plan, employees who meet certain eligibility requirements may participate by contributing up to
50%
of their annual compensation, not to exceed Internal Revenue Service limits, and the Company may provide a matching cash contribution of
50%
of each participant's contributions, with a maximum matching contribution of
3%
of each participant's total compensation. The Company recorded expense of
$7.5
million,
$7.3
million and
$7.7
million in
2016
,
2015
and
2014
. Contributions to both features of the EPSRS Plan are made in the following year.
Under the profit-sharing feature of the EPSRS Plan, for contributions made in the Company's stock, the Company's stock contribution is required to be maintained in such stock until the employee has two or more years of service, at which time the employee may diversify his or her Company stock account into other investment options provided under the plan. For contributions made in cash, the contribution is allocated within the participant's account based on their investment elections under the EPSRS Plan. If the participant has made no election, the contribution will be invested in the appropriate default target fund as determined by each participant's date of birth. Under the retirement savings portion of the EPSRS Plan, the employees have the ability to elect to invest a portion of their contribution and the related matching contribution in Company stock. At January 31,
2017
, investments in Company stock represented
20%
of total EPSRS Plan assets.
TIFFANY & CO.
K-
90
The EPSRS Plan provides a defined contribution retirement benefit ("DCRB") to eligible employees hired on or after January 1, 2006. Under the DCRB, the Company makes contributions each year to each employee's account at a rate based upon age and years of service. These contributions are deposited into individual accounts in each employee's name to be invested in a manner similar to the retirement savings portion of the EPSRS Plan. The Company recorded expense of
$4.6
million,
$3.2
million and
$4.6
million in
2016
,
2015
and
2014
.
Deferred Compensation Plan
The Company has a non-qualified deferred compensation plan for directors, executives and certain management employees, whereby eligible participants may defer a portion of their compensation for payment at specified future dates, upon retirement, death or termination of employment. This plan also provides for an excess defined contribution retirement benefit ("Excess DC benefit") for certain eligible executives and management employees, hired on or after January 1, 2006. The Excess DC benefit is credited to the eligible employee's account, based on the compensation paid to the employee in excess of the IRS limits for contribution under the DCRB Plan. Under the plan, the deferred compensation is adjusted to reflect performance, whether positive or negative, of selected investment options chosen by each participant during the deferral period. The amounts accrued under the plans were
$26.5
million and
$24.9
million at January 31,
2017
and
2016
, and are reflected in other long-term liabilities. The Company does not promise or guarantee any rate of return on amounts deferred.
O. INCOME TAXES
Earnings from operations before income taxes consisted of the following:
|
Years Ended January 31,
|
|||||||||
|
(in millions)
|
2017
|
|
2016
|
|
2015
|
|
|||
|
United States
|
$
|
478.2
|
|
$
|
502.5
|
|
$
|
484.5
|
|
|
Foreign
|
198.4
|
|
207.4
|
|
253.0
|
|
|||
|
$
|
676.6
|
|
$
|
709.9
|
|
$
|
737.5
|
|
|
Components of the provision for income taxes were as follows:
|
Years Ended January 31,
|
|||||||||
|
(in millions)
|
2017
|
|
2016
|
|
2015
|
|
|||
|
Current:
|
|||||||||
|
Federal
|
$
|
125.5
|
|
$
|
175.8
|
|
$
|
130.9
|
|
|
State
|
15.4
|
|
22.3
|
|
18.2
|
|
|||
|
Foreign
|
43.5
|
|
49.8
|
|
66.5
|
|
|||
|
184.4
|
|
247.9
|
|
215.6
|
|
||||
|
Deferred:
|
|||||||||
|
Federal
|
36.7
|
|
(15.4
|
)
|
25.2
|
|
|||
|
State
|
7.1
|
|
3.9
|
|
13.2
|
|
|||
|
Foreign
|
2.3
|
|
9.6
|
|
(0.7
|
)
|
|||
|
46.1
|
|
(1.9
|
)
|
37.7
|
|
||||
|
$
|
230.5
|
|
$
|
246.0
|
|
$
|
253.3
|
|
|
TIFFANY & CO.
K-
91
Reconciliations of the provision for income taxes at the statutory Federal income tax rate to the Company's effective income tax rate were as follows:
|
Years Ended January 31,
|
||||||
|
2017
|
|
2016
|
|
2015
|
|
|
|
Statutory Federal income tax rate
|
35.0
|
%
|
35.0
|
%
|
35.0
|
%
|
|
State income taxes, net of Federal benefit
|
2.2
|
|
2.4
|
|
2.8
|
|
|
Foreign losses with no tax benefit
|
0.2
|
|
—
|
|
0.7
|
|
|
Undistributed foreign earnings
|
(2.3
|
)
|
(2.5
|
)
|
(4.2
|
)
|
|
Net change in uncertain tax positions
|
(0.7
|
)
|
0.5
|
|
0.3
|
|
|
Domestic manufacturing deduction
|
(0.9
|
)
|
(1.3
|
)
|
(1.3
|
)
|
|
Other
|
0.6
|
|
0.6
|
|
1.1
|
|
|
34.1
|
%
|
34.7
|
%
|
34.4
|
%
|
|
The Company has the intent to indefinitely reinvest any undistributed earnings of all foreign subsidiaries. As of January 31,
2017
and
2016
, the Company has not provided deferred taxes on approximately
$769.0
million and
$685.0
million of undistributed earnings. Generally, such amounts become subject to U.S. taxation upon the remittance of dividends and under certain other circumstances. U.S. Federal income taxes of approximately
$129.0
million and
$118.0
million would be incurred if these earnings were distributed.
Deferred tax assets (liabilities) consisted of the following:
|
January 31,
|
||||||
|
(in millions)
|
2017
|
|
2016
|
|
||
|
Deferred tax assets:
|
||||||
|
Pension/postretirement benefits
|
$
|
124.7
|
|
$
|
166.7
|
|
|
Accrued expenses
|
36.1
|
|
34.3
|
|
||
|
Share-based compensation
|
17.3
|
|
18.3
|
|
||
|
Depreciation
|
6.5
|
|
6.6
|
|
||
|
Amortization
|
10.8
|
|
11.4
|
|
||
|
Foreign and state net operating losses
|
25.5
|
|
23.5
|
|
||
|
Sale-leaseback
|
25.8
|
|
30.4
|
|
||
|
Inventory
|
57.6
|
|
50.9
|
|
||
|
Financial hedging instruments
|
11.9
|
|
19.7
|
|
||
|
Unearned income
|
10.6
|
|
11.3
|
|
||
|
Other
|
23.0
|
|
53.6
|
|
||
|
349.8
|
|
426.7
|
|
|||
|
Valuation allowance
|
(24.1
|
)
|
(19.5
|
)
|
||
|
325.7
|
|
407.2
|
|
|||
|
Deferred tax liabilities:
|
||||||
|
Foreign tax credit
|
(25.8
|
)
|
(25.1
|
)
|
||
|
Net deferred tax asset
|
$
|
299.9
|
|
$
|
382.1
|
|
The Company has recorded a valuation allowance against certain deferred tax assets related to foreign net operating loss carryforwards where management has determined it is more likely than not that deferred tax assets will not be realized in the future. The overall valuation allowance relates to tax loss carryforwards and temporary differences for
TIFFANY & CO.
K-
92
which no benefit is expected to be realized. Tax loss carryforwards of approximately
$88.5
million exist in certain foreign jurisdictions. Whereas some of these tax loss carryforwards do not have an expiration date, others expire at various times from 2019 through 2024.
The following table reconciles the unrecognized tax benefits:
|
January 31,
|
|
||||||||
|
(in millions)
|
2017
|
|
2016
|
|
2015
|
|
|||
|
Unrecognized tax benefits at beginning of year
|
$
|
10.2
|
|
$
|
8.3
|
|
$
|
27.6
|
|
|
Gross increases – tax positions in prior period
|
0.9
|
|
1.0
|
|
1.0
|
|
|||
|
Gross decreases – tax positions in prior period
|
(5.0
|
)
|
(0.4
|
)
|
(5.4
|
)
|
|||
|
Gross increases – tax positions in current period
|
0.3
|
|
1.4
|
|
0.1
|
|
|||
|
Settlements
|
(3.0
|
)
|
—
|
|
(14.8
|
)
|
|||
|
Lapse of statute of limitations
|
—
|
|
(0.1
|
)
|
(0.2
|
)
|
|||
|
Unrecognized tax benefits at end of year
|
$
|
3.4
|
|
$
|
10.2
|
|
$
|
8.3
|
|
Included in the balance of unrecognized tax benefits at January 31,
2017
,
2016
and
2015
are
$1.0
million,
$9.1
million and
$5.3
million of tax benefits that, if recognized, would affect the effective income tax rate.
The Company recognizes interest expense and penalties related to unrecognized tax benefits within the provision for income taxes. During the year ended January 31,
2017
, the Company recognized no expense associated with interest and penalties while during the years ended January 31, 2016 and 2015, the Company recognized approximately
$1.7
million and
$1.8
million of expense. Accrued interest and penalties are included within accounts payable and accrued liabilities and other long-term liabilities, and were
$8.3
million and
$7.8
million at January 31,
2017
and
2016
.
At January 31, 2017, the Company's gross uncertain tax positions decreased
$6.8
million and gross accrued interest and penalties were unchanged from January 31, 2016, primarily as a result of the conclusion of a tax examination during the three months ended April 30, 2016. This settlement resulted in an income tax benefit of
$6.6
million for the year ended January 31, 2017, and reduced the effective income tax rate by
1.0
percentage point versus the prior year.
The Company conducts business globally, and, as a result, is subject to taxation in the U.S. and various state and foreign jurisdictions. As a matter of course, tax authorities regularly audit the Company. The Company's tax filings are currently being examined by a number of tax authorities in several jurisdictions, both in the U.S. and in foreign jurisdictions. Ongoing audits where subsidiaries have a material presence include New York City (tax years
2011
–
2013
) and New York State (tax years
2012
–
2014
). Tax years from
2010
–present are open to examination in the U.S. Federal jurisdiction and
2006
–present are open in various state, local and foreign jurisdictions. As part of these audits, the Company engages in discussions with taxing authorities regarding tax positions. At January 31,
2017
, total unrecognized tax benefits were
$3.4
million of which approximately
$1.0
million, if recognized, would affect the effective income tax rate. As of January 31, 2017, unrecognized tax benefits are not expected to change materially in the next 12 months. Future developments may result in a change in this assessment.
P. SEGMENT INFORMATION
The Company's products are primarily sold in TIFFANY & CO. retail locations around the world. Net sales by geographic area are presented by attributing revenues from external customers on the basis of the country in which the merchandise is sold.
In deciding how to allocate resources and assess performance, the Company's Chief Operating Decision Maker regularly evaluates the performance of its reportable segments on the basis of net sales and earnings from operations, after the elimination of inter-segment sales and transfers. The accounting policies of the reportable segments are the same as those described in the summary of significant accounting policies.
TIFFANY & CO.
K-
93
Certain information relating to the Company's segments is set forth below:
|
|
Years Ended January 31,
|
||||||||||
|
(in millions)
|
2017
|
|
2016
|
|
2015
|
|
|||||
|
Net sales:
|
|||||||||||
|
Americas
|
$
|
1,841.9
|
|
$
|
1,947.0
|
|
$
|
2,033.5
|
|
||
|
Asia-Pacific
|
999.1
|
|
1,003.1
|
|
1,025.2
|
|
|||||
|
Japan
|
604.4
|
|
541.3
|
|
554.3
|
|
|||||
|
Europe
|
457.6
|
|
505.7
|
|
513.3
|
|
|||||
|
Total reportable segments
|
3,903.0
|
|
3,997.1
|
|
4,126.3
|
|
|||||
|
Other
|
98.8
|
|
107.8
|
|
123.6
|
|
|||||
|
$
|
4,001.8
|
|
$
|
4,104.9
|
|
$
|
4,249.9
|
|
|||
|
Earnings from operations*:
|
|||||||||||
|
Americas
|
$
|
373.0
|
|
$
|
390.8
|
|
$
|
435.5
|
|
||
|
Asia-Pacific
|
256.0
|
|
264.4
|
|
281.6
|
|
|||||
|
Japan
|
204.6
|
|
199.9
|
|
196.0
|
|
|||||
|
Europe
|
81.6
|
|
97.4
|
|
110.5
|
|
|||||
|
Total reportable segments
|
915.2
|
|
952.5
|
|
1,023.6
|
|
|||||
|
Other
|
5.9
|
|
6.4
|
|
4.9
|
|
|||||
|
$
|
921.1
|
|
$
|
958.9
|
|
$
|
1,028.5
|
|
|||
|
*
|
Represents earnings from operations before (i) unallocated corporate expenses, (ii) interest expense, financing costs and other (income) expense, net, (iii) loss on extinguishment of debt, and (iv) other operating expenses.
|
The Company's Chief Operating Decision Maker does not evaluate the performance of the Company's assets on a segment basis for internal management reporting and, therefore, such information is not presented.
The following table sets forth a reconciliation of the segments' earnings from operations to the Company's consolidated earnings from operations before income taxes:
|
|
Years Ended January 31,
|
||||||||
|
(in millions)
|
2017
|
|
2016
|
|
2015
|
|
|||
|
Earnings from operations for segments
|
$
|
921.1
|
|
$
|
958.9
|
|
$
|
1,028.5
|
|
|
Unallocated corporate expenses
|
(161.9
|
)
|
(152.1
|
)
|
(137.1
|
)
|
|||
|
Interest expense, financing costs and other (income) expense, net
|
(44.6
|
)
|
(50.2
|
)
|
(60.1
|
)
|
|||
|
Loss on extinguishment of debt
|
—
|
|
—
|
|
(93.8
|
)
|
|||
|
Other operating expense
|
(38.0
|
)
|
(46.7
|
)
|
—
|
|
|||
|
Earnings from operations before income taxes
|
$
|
676.6
|
|
$
|
709.9
|
|
$
|
737.5
|
|
Unallocated corporate expenses includes certain costs related to administrative support functions which the Company does not allocate to its segments. Such unallocated costs include those for centralized information technology, finance, legal and human resources departments.
Other operating expense in the year ended January 31, 2017 represents an impairment charge related to software costs capitalized in connection with the development of a new finished goods inventory management and merchandising information system and impairment charges related to a financing arrangements with diamond mining and exploration companies. See "Note B. Summary of Significant Accounting Policies" and "Note E. Property, Plant
TIFFANY & CO.
K-
94
and Equipment" for additional details on the asset impairment and "Note B. Summary of Significant Accounting Policies" and "Note J. Commitments and Contingencies" for additional details on the loan impairments.
Other operating expense in the year ended January 31, 2016 represents impairment charges related to a financing arrangement with Koidu and expenses related to specific cost-reduction initiatives. See "Note J. Commitments and Contingencies" for additional details.
Loss on extinguishment of debt in the year ended January 31, 2015 was related to the redemption of
$400.0
million in aggregate principal amount of the Private Placement Notes prior to their scheduled maturities. See "Note G. Debt" for additional details.
Sales to unaffiliated customers and long-lived assets by geographic areas were as follows:
|
Years Ended January 31,
|
|||||||||
|
(in millions)
|
2017
|
|
2016
|
|
2015
|
|
|||
|
Net sales:
|
|||||||||
|
United States
|
$
|
1,691.4
|
|
$
|
1,795.5
|
|
$
|
1,870.8
|
|
|
Japan
|
604.4
|
|
541.3
|
|
554.3
|
|
|||
|
Other countries
|
1,706.0
|
|
1,768.1
|
|
1,824.8
|
|
|||
|
$
|
4,001.8
|
|
$
|
4,104.9
|
|
$
|
4,249.9
|
|
|
|
Long-lived assets:
|
|||||||||
|
United States
|
$
|
691.3
|
|
$
|
706.9
|
|
$
|
680.1
|
|
|
Japan
|
21.7
|
|
20.6
|
|
24.4
|
|
|||
|
Other countries
|
269.0
|
|
256.7
|
|
239.2
|
|
|||
|
$
|
982.0
|
|
$
|
984.2
|
|
$
|
943.7
|
|
|
Classes of Similar Products
|
Years Ended January 31,
|
|||||||||
|
(in millions)
|
2017
|
|
2016
|
|
2015
|
|
|||
|
Net sales:
|
|||||||||
|
High, fine & solitaire jewelry
|
$
|
779.1
|
|
$
|
854.1
|
|
$
|
870.4
|
|
|
Engagement jewelry & wedding bands
|
1,122.0
|
|
1,142.2
|
|
1,221.0
|
|
|||
|
Fashion jewelry
|
1,328.9
|
|
1,340.7
|
|
1,357.6
|
|
|||
|
Designer jewelry
|
465.0
|
|
460.8
|
|
481.5
|
|
|||
|
All other
|
306.8
|
|
307.1
|
|
319.4
|
|
|||
|
$
|
4,001.8
|
|
$
|
4,104.9
|
|
$
|
4,249.9
|
|
|
Items bearing the name of and attributed to one of the Company's "named" designers: Elsa Peretti and Paloma Picasso, which were previously reported across the high, fine & solitaire jewelry, engagement jewelry & wedding bands and fashion jewelry categories, have been reclassified into the designer jewelry category to conform with management's current internal analysis of product sales. Additionally, certain reclassifications within the jewelry categories have been made to the prior years' amounts to conform to the current year category presentation.
TIFFANY & CO.
K-
95
Q. QUARTERLY FINANCIAL DATA (UNAUDITED)
|
2016 Quarters Ended*
|
||||||||||||
|
(in millions, except per share amounts)
|
April 30
|
|
July 31
|
|
October 31
|
|
January 31
a
|
|
||||
|
Net sales
|
$
|
891.3
|
|
$
|
931.6
|
|
$
|
949.3
|
|
$
|
1,229.6
|
|
|
Gross profit
|
545.6
|
|
577.1
|
|
579.5
|
|
788.2
|
|
||||
|
Earnings from operations
|
134.6
|
|
174.9
|
|
155.2
|
|
256.5
|
|
||||
|
Net earnings
|
87.5
|
|
105.7
|
|
95.1
|
|
157.8
|
|
||||
|
Net earnings per share:
|
||||||||||||
|
Basic
|
$
|
0.69
|
|
$
|
0.84
|
|
$
|
0.76
|
|
$
|
1.27
|
|
|
Diluted
|
$
|
0.69
|
|
$
|
0.84
|
|
$
|
0.76
|
|
$
|
1.26
|
|
|
a
|
On a pre-tax basis, includes charges for the quarter ended January 31, 2017 of:
|
|
i.
|
$25.4 million
, which reduced net earnings per diluted share by
$0.13
, associated with an impairment charge related to software costs capitalized in connection with the development of a new finished goods inventory management and merchandising information system (see "Note B. Summary of Significant Accounting Policies" and "Note E. Property, Plant and Equipment"); and
|
|
ii.
|
$12.6 million
, which reduced net earnings per diluted share by
$0.06
, associated with impairment charges related to financing arrangements with diamond mining and exploration companies (see "Note B. Summary of Significant Accounting Policies" and "Note J. Commitments and Contingencies").
|
|
2015 Quarters Ended*
|
||||||||||||
|
(in millions, except per share amounts)
|
April 30
|
|
July 31
b
|
|
October 31
|
|
January 31
c
|
|
||||
|
Net sales
|
$
|
962.4
|
|
$
|
990.5
|
|
$
|
938.2
|
|
$
|
1,213.6
|
|
|
Gross profit
|
569.0
|
|
593.0
|
|
564.5
|
|
764.8
|
|
||||
|
Earnings from operations
|
170.0
|
|
172.8
|
|
156.4
|
|
260.9
|
|
||||
|
Net earnings
|
104.9
|
|
104.9
|
|
91.0
|
|
163.2
|
|
||||
|
Net earnings per share:
|
||||||||||||
|
Basic
|
$
|
0.81
|
|
$
|
0.81
|
|
$
|
0.71
|
|
$
|
1.28
|
|
|
Diluted
|
$
|
0.81
|
|
$
|
0.81
|
|
$
|
0.70
|
|
$
|
1.28
|
|
|
b
|
On a pre-tax basis, includes a charge of
$9.6 million
for the quarter ended July 31, 2015, which reduced net earnings per diluted share by
$0.05
, associated with an impairment charge related to a financing arrangement with Koidu Limited (see "Note B. Summary of Significant Accounting Policies" and "Note J. Commitments and Contingencies").
|
|
c
|
On a pre-tax basis, includes charges for the quarter ended January 31, 2016 of:
|
|
i.
|
$28.3 million
, which reduced net earnings per diluted share by
$0.14
, associated with an impairment charge related to a financing arrangement with Koidu Limited (see "Note B. Summary of Significant Accounting Policies" and "Note J. Commitments and Contingencies"); and
|
|
ii.
|
$8.8 million
, which reduced net earnings per diluted share by
$0.04
, associated with severance related to staffing reductions and subleasing of certain office space for which only a portion of the Company's future rent obligations will be recovered (see "Note J. Commitments and Contingencies").
|
|
*
|
The sum of quarterly amounts may not agree with full year amounts due to rounding.
|
Basic and diluted earnings per share are computed independently for each quarter presented. Accordingly, the sum of the quarterly earnings per share may not agree with the calculated full year earnings per share.
TIFFANY & CO.
K-
96
NONE
DISCLOSURE CONTROLS AND PROCEDURES
Based on their evaluation of the effectiveness of our disclosure controls and procedures (as defined in Rules 13a-15(e) and 15d-15(e) under the Securities Exchange Act of 1934, as amended), the Registrant's principal executive officer and principal financial officer concluded that, as of the end of the period covered by this report, the Registrant's disclosure controls and procedures are effective to ensure that information required to be disclosed by the Registrant in the reports that it files or submits under the Securities Exchange Act of 1934, as amended, is (i) recorded, processed, summarized and reported within the time periods specified in the SEC's rules and forms and (ii) accumulated and communicated to our management, including our principal executive officer and principal financial officer, to allow timely decisions regarding required disclosure.
In the ordinary course of business, the Registrant reviews its system of internal control over financial reporting and makes changes to its systems and processes to improve controls and increase efficiency, while ensuring that the Registrant maintains an effective internal control environment. Changes may include activities such as implementing new, more efficient systems and automating manual processes.
The Registrant's principal executive officer and principal financial officer have determined that there have been no changes in the Registrant's internal control over financial reporting during the most recently completed fiscal quarter covered by this report identified in connection with the evaluation described above that have materially affected, or are reasonably likely to materially affect, the Registrant's internal control over financial reporting.
The Registrant's management, including its principal executive officer and principal financial officer, necessarily applied their judgment in assessing the costs and benefits of such controls and procedures. By their nature, such controls and procedures cannot provide absolute certainty, but can provide reasonable assurance regarding management's control objectives. Our principal executive officer and our principal financial officer have concluded that the Registrant's disclosure controls and procedures are (i) designed to provide such reasonable assurance and (ii) are effective at that reasonable assurance level.
TIFFANY & CO.
K-
97
Report of Management
Management's Responsibility for Financial Information
. The Company's consolidated financial statements were prepared by management, who are responsible for their integrity and objectivity. The financial statements have been prepared in accordance with accounting principles generally accepted in the United States of America and, as such, include amounts based on management's best estimates and judgments.
Management is further responsible for maintaining a system of internal accounting control designed to provide reasonable assurance that the Company's assets are adequately safeguarded, and that the accounting records reflect transactions executed in accordance with management's authorization. The system of internal control is continually reviewed and is augmented by written policies and procedures, the careful selection and training of qualified personnel and a program of internal audit.
The consolidated financial statements have been audited by PricewaterhouseCoopers LLP, an independent registered public accounting firm. Their report is shown on page K-49. The Audit Committee of the Board of Directors, which is composed solely of independent directors, meets regularly with the Company's management and the independent registered public accounting firm to discuss specific accounting, financial reporting and internal control matters. Both the independent registered public accounting firm and the internal auditors have full and free access to the Audit Committee. Each year the Audit Committee selects the firm that is to perform audit services for the Company.
Management's Report on Internal Control over Financial Reporting
. Management is responsible for establishing and maintaining adequate internal control over financial reporting, as defined in Exchange Act Rule 13a - 15(f). Management conducted an evaluation of the effectiveness of internal control over financial reporting using the criteria set forth by the Committee of Sponsoring Organizations ("COSO") of the Treadway Commission in
Internal Control - Integrated Framework
issued in 2013. Because of its inherent limitations, internal control over financial reporting may not prevent or detect misstatements. Also, projections of any evaluation of effectiveness to future periods are subject to the risk that controls may become inadequate because of changes in conditions, or that the degree of compliance with the policies or procedures may deteriorate. Based on this evaluation, management concluded that internal control over financial reporting was effective as of January 31, 2017 based on criteria in
Internal Control - Integrated Framework
issued by the COSO. The effectiveness of the Company's internal control over financial reporting as of January 31, 2017 has been audited by PricewaterhouseCoopers LLP, an independent registered public accounting firm, as stated in their report which is shown on page K-49.
/s/ Michael J. Kowalski
Chairman of the Board and Interim Chief Executive Officer
/s/ Mark J. Erceg
Executive Vice President and Chief Financial Officer
NONE
TIFFANY & CO.
K-
98
Incorporated by reference from the sections titled "Section 16(a) Beneficial Ownership Reporting Compliance," "Executive Officers of the Company," "Item 1. Election of the Board," and "Board of Directors and Corporate Governance" in Registrant's Proxy Statement dated April 7, 2017.
CODE OF ETHICS AND OTHER CORPORATE GOVERNANCE DISCLOSURES
Registrant has adopted a Code of Business and Ethical Conduct for its Directors, Chief Executive Officer, Chief Financial Officer and all other officers of the Registrant. A copy of this Code is posted on the corporate governance section of the Registrant's website,
http://investor.tiffany.com/governance.cfm
; go to "Code of Conduct." The Registrant will also provide a copy of the Code of Business and Ethical Conduct to stockholders upon request.
See Registrant's Proxy Statement dated April 7, 2017, for additional information within the section titled "Business Conduct Policy and Code of Ethics."
Incorporated by reference from the section titled "Board of Directors and Corporate Governance" and "Compensation of the CEO and Other Executive Officers" in Registrant's Proxy Statement dated April 7, 2017.
Incorporated by reference from the section titled "Ownership of the Company" and "Compensation of the CEO and Other Executive Officers" in Registrant's Proxy Statement dated April 7, 2017.
Incorporated by reference from the sections titled "Board of Directors and Corporate Governance" and "Transactions with Related Persons" in Registrant's Proxy Statement dated April 7, 2017.
Incorporated by reference from the section titled "Relationship with Independent Registered Public Accounting Firm" in Registrant's Proxy Statement dated April 7, 2017.
TIFFANY & CO.
K-
99
(a) List of Documents Filed As Part of This Report:
1. Financial Statements
Report of Independent Registered Public Accounting Firm.
Consolidated Balance Sheets as of January 31,
2017
and
2016
.
Consolidated Statements of Earnings for the years ended January 31,
2017
,
2016
and
2015
.
Consolidated Statements of Comprehensive Earnings for the years ended January 31,
2017
,
2016
and
2015
.
Consolidated Statements of Stockholders' Equity for the years ended January 31,
2017
,
2016
and
2015
.
Consolidated Statements of Cash Flows for the years ended January 31,
2017
,
2016
and
2015
.
Notes to Consolidated Financial Statements.
2. Financial Statement Schedules
The following financial statement schedule should be read in conjunction with the Consolidated Financial Statements:
Schedule II - Valuation and Qualifying Accounts and Reserves.
All other schedules have been omitted since they are not applicable, not required, or because the information required is included in the consolidated financial statements and notes thereto.
3. Exhibits
The information called for by this item is incorporated herein by reference to the Exhibit Index in this report.
Not Applicable.
TIFFANY & CO.
K-
100
SIGNATURES
Pursuant to the requirements of Section 13 or 15(d) of the Securities Exchange Act of 1934, the Registrant has duly caused this report to be signed on its behalf by the undersigned, thereunto duly authorized.
|
Date: March 17, 2017
|
|
TIFFANY & CO.
|
|
|
(Registrant)
|
|
|
|
By: /s/ Michael J. Kowalski
|
|
|
|
Michael. J. Kowalski
|
|
|
|
Chairman of the Board and Interim Chief Executive Officer
|
|
TIFFANY & CO.
K-
101
Pursuant to the requirements of the Securities Exchange Act of 1934, this report has been signed below by the following persons on behalf of the Registrant and in the capacities and on the date indicated.
|
By:
|
/s/ Michael J. Kowalski
|
By:
|
/s/ Mark J. Erceg
|
|
|
Michael J. Kowalski
|
|
Mark J. Erceg
|
||
|
Chairman of the Board and
|
|
Executive Vice President,
|
||
|
Interim Chief Executive Officer
|
Chief Financial Officer
|
|||
|
(Principal Executive Officer) (Director)
|
|
(Principal Financial Officer)
|
||
|
|
||||
|
By:
|
/s/ John S. Barresi
|
By:
|
/s/ Rose Marie Bravo
|
|
|
John S. Barresi
|
|
Rose Marie Bravo
|
||
|
Vice President, Controller
|
|
Director
|
||
|
(Principal Accounting Officer)
|
||||
|
|
||||
|
By:
|
/s/ Gary E. Costley
|
By:
|
/s/ Roger N. Farah
|
|
|
Gary E. Costley
|
|
Roger N. Farah
|
||
|
Director
|
|
Director
|
||
|
By:
|
/s/ Lawrence K. Fish
|
By:
|
/s/ Abby F. Kohnstamm
|
|
|
Lawrence K. Fish
|
|
Abby F. Kohnstamm
|
||
|
Director
|
|
Director
|
||
|
By:
|
/s/ James E. Lillie
|
By:
|
/s/ Charles K. Marquis
|
|
|
James E. Lillie
|
|
Charles K. Marquis
|
||
|
Director
|
|
Director
|
||
|
By:
|
/s/ Peter W. May
|
By:
|
/s/ William A. Shutzer
|
|
|
Peter W. May
|
William A. Shutzer
|
|||
|
Director
|
Director
|
|||
|
By:
|
/s/ Robert S. Singer
|
By:
|
/s/ Francesco Trapani
|
|
|
Robert S. Singer
|
|
Francesco Trapani
|
||
|
Director
|
|
Director
|
||
March 17, 2017
TIFFANY & CO.
K-
102
EXHIBIT INDEX
Exhibit Table (numbered in accordance with Item 601 of Regulation S-K)
|
Exhibit No. Description
|
|
|
3.1
|
Restated Certificate of Incorporation of Registrant. Incorporated by reference from Exhibit 3.1 to Registrant’s Report on Form 8-K dated May 16, 1996, as amended by the Certificate of Amendment of Certificate of Incorporation dated May 20, 1999. Incorporated by reference from Exhibit 3.1 filed with Registrant’s Report on Form 10-Q for the Fiscal Quarter ended July 31, 1999.
|
|
3.1a
|
Amendment to Certificate of Incorporation of Registrant dated May 18, 2000. Incorporated by reference from Exhibit 3.1b to Registrant's Annual Report on Form 10-K for the Fiscal Year ended January 31, 2001.
|
|
3.2
|
Restated By-laws of Registrant, as last amended March 16, 2017. Incorporated by reference from Exhibit 3.2 to Registrant’s Report on Form 8-K dated March 16, 2017.
|
|
4.5
|
Indenture, dated September 25, 2014, among Registrant, as issuer, and The Bank of New York Mellon Trust Company, as trustee. Incorporated by reference from Exhibit 4.5 to Registrant’s Report on Form 8-K dated September 26, 2014.
|
|
4.6
|
Supplemental Indenture No. 1, dated September 25, 2014, among Registrant, as issuer, certain subsidiaries of Registrant, as guarantors thereto, and The Bank of New York Mellon Trust Company, as trustee. Incorporated by reference from Exhibit 4.6 to Registrant’s Report on Form 8-K dated September 26, 2014.
|
|
4.7
|
Supplemental Indenture No. 2, dated September 25, 2014, among Registrant, as issuer, certain subsidiaries of Registrant, as guarantors thereto, and The Bank of New York Mellon Trust Company, as trustee. Incorporated by reference from Exhibit 4.7 to Registrant’s Report on Form 8-K dated September 26, 2014.
|
|
4.8
|
Upon the request of the Securities and Exchange Commission, Registrant will furnish a copy of all instruments defining the rights of holders of all other long-term debt of Registrant.
|
|
10.1
|
Amended and Restated Agreement, dated as of December 27, 2012, by and between Tiffany and Company and Elsa Peretti. Incorporated by reference from Exhibit 10.123 filed with Registrant's Report on Form 8-K dated January 2, 2013.
|
|
10.2
|
Ground Lease between Tiffany and Company and River Park Business Center, Inc., dated November 29, 2000. Incorporated by reference from Exhibit 10.145 filed with Registrant’s Annual Report on Form 10-K for the Fiscal Year ended January 31, 2005.
|
|
10.2a
|
First Addendum to the Ground Lease between Tiffany and Company and River Park Business Center, Inc., dated November 29, 2000. Incorporated by reference from Exhibit 10.145a filed with Registrant’s Annual Report on Form 10-K for the Fiscal Year ended January 31, 2005.
|
|
10.3
|
Lease Agreement made as of September 28, 2005 between CLF Sylvan Way LLC and Tiffany and Company, and form of Registrant’s guaranty of such lease. Incorporated by reference from Exhibit 10.149 filed with Registrant’s Report on Form 8-K dated September 23, 2005.
|
|
10.4
|
Four Year Credit Agreement dated as of October 7, 2014 by and among Registrant and each other Subsidiary of Registrant that is a Borrower and is a signatory thereto and Bank of America, N.A., as Administrative Agent, and various lenders party thereto. Incorporated by reference from Exhibit 10.37 filed with Registrant’s Report on Form 8-K dated October 10, 2014.
|
TIFFANY & CO.
K-
103
|
Exhibit No. Description
|
|
|
10.5
|
Five Year Credit Agreement dated as of October 7, 2014 by and among Registrant and each other Subsidiary of Registrant that is a Borrower and is a signatory thereto and Bank of America, N.A., as Administrative Agent, and various lenders party thereto. Incorporated by reference from Exhibit 10.39 filed with Registrant’s Report on Form 8-K dated October 10, 2014.
|
|
10.6
|
Amended and Restated Note Purchase and Private Shelf Agreement dated as of July 25, 2012 by and among Registrant and various institutional note purchasers with respect to Registrant’s $100 million principal amount of 9.05% Series A Senior Notes due December 23, 2015, $150 million principal amount of 4.40% Series B-P Senior Notes due July 25, 2042 and private shelf facility. Incorporated by reference from Exhibit 10.155 filed with Registrant’s Report on Form 8-K dated July 27, 2012.
|
|
10.6a
|
Amendment dated as of January 14, 2014 to the Amended and Restated Note Purchase and Private Shelf Agreement (see Exhibit 10.6 above) by and among Registrant, and various institutional note purchasers. Incorporated by reference from Exhibit 10.157 filed with Registrant’s Report on Form 8-K dated January 17, 2014.
|
|
10.7
|
Amended and Restated Note Purchase and Private Shelf Agreement dated as of July 25, 2012 by and among Registrant and various institutional note purchasers with respect to Registrant’s $50 million principal amount of 10.0% Series A Senior Notes due April 9, 2018, $100 million principal amount of 4.40% Series B-M Senior Notes due July 25, 2042 and up to $50 million private shelf facility. Incorporated by reference from Exhibit 10.159 filed with Registrant’s Report on Form 8-K dated July 27, 2012.
|
|
10.7a
|
Amendment dated as of January 14, 2014 to the Amended and Restated Note Purchase and Private Shelf Agreement, dated as of July 25, 2012 (see Exhibit 10.7 above), by and among Registrant and various institutional note purchasers. Incorporated by reference from Exhibit 10.161 filed with Registrant’s Report on Form 8-K dated January 17, 2014.
|
|
10.8
|
Note Purchase Agreement dated as of August 26, 2016 by and between Registrant and the institutional note purchasers with respect to Registrant’s ¥ 10,000,000,000 principal amount of 0.78% Senior Notes due August 26, 2026. Incorporated by reference from Exhibit 10.37 filed with Registrant’s Report on Form 8-K dated September 1, 2016.
|
|
10.9
|
Amortising term loan facility agreement dated March 30, 2011 between and among Koidu Holdings S.A. (as Borrower), BSG Resources Limited (as Guarantor) and Laurelton Diamonds, Inc. (as Original Lender). Incorporated by reference from Exhibit 10.163 filed with Registrant’s Report on Form 8-K dated March 30, 2011.
|
|
10.9a
|
Amendment Agreement dated as of May 10, 2011 with respect to the Amortising Term Loan Facility Agreement (see Exhibit 10.9 above) between and among Koidu Holdings S.A. (as Borrower), BSG Resources Limited (as Guarantor) and Laurelton Diamonds, Inc. (as Original Lender). Incorporated by reference from Exhibit 10.15a filed with Registrant’s Report on Form 10-K dated March 28, 2013.
|
|
10.9b
|
Second Amendment Agreement dated as of February 12, 2013 with respect to the Amortising Term Loan Facility Agreement (see Exhibit 10.9 above) between and among Koidu Limited (as Borrower), BSG Resources Limited (as Guarantor) and Laurelton Diamonds, Inc. (as Original Lender). Incorporated by reference from Exhibit 10.15b filed with Registrant’s Report on Form 10-K dated March 28, 2013.
|
|
10.9c
|
Third Amendment Agreement dated as of March 29, 2013 with respect to the Amortising Term Loan Facility Agreement (see Exhibit 10.9 above) between and among Koidu Limited (as Borrower), BSG Resources Limited (as Guarantor) and Laurelton Diamonds, Inc. (as Original Lender). Incorporated by reference from Exhibit 10.15c filed with Registrant’s Report on Form 8-K dated April 2, 2013.
|
TIFFANY & CO.
K-
104
|
Exhibit No. Description
|
|
|
10.9d
|
Fourth Amendment Agreement dated as of March 31, 2014 with respect to the Amortising Term Loan Facility Agreement (see Exhibit 10.9 above) between and among Koidu Limited (as Borrower), BSG Resources Limited (as Guarantor) and Laurelton Diamonds, Inc. (as Original Lender). Incorporated by reference from Exhibit 10.15d filed with Registrant’s Report on Form 8-K dated March 31, 2014.
|
|
10.9e
|
Fifth Amendment Agreement dated as of April 30, 2015 with respect to the Amortising Term Loan Facility Agreement (see Exhibit 10.9 above) between and among Koidu Limited, Octea Limited, BSG Resources Limited and Laurelton Diamonds, Inc. Incorporated by reference from Exhibit 10.14e filed with Registrant’s Report on Form 8-K dated May 6, 2015.
|
|
10.9f
|
Sixth Amendment Agreement dated as of October 10, 2016 with respect to the Amortising Term Loan Facility Agreement (see Exhibit 10.9 above) between and among Koidu Limited, Octea Limited, BSG Resources Limited and Laurelton Diamonds, Inc.
|
|
10.10
|
Credit Agreement dated as of July 11, 2016 by and among Tiffany & Co. (Shanghai) Commercial Company Limited, Bank of America, N.A., Shanghai Branch and Mizuho Bank (China), Ltd. as Jointed Coordinators, Mandated Lead Arrangers and Bookrunners, Mizuho Bank (China), Ltd. as Facility Agent and certain other banks and financial institutions party thereto as original lenders. Incorporated by reference from Exhibit 10.15 filed with Registrant’s Report on Form 8-K dated July 15, 2016.
|
|
10.11
|
Guaranty Agreement dated as of July 11, 2016, with respect to the Credit Agreement (see Exhibit 10.10 above) by and between Registrant and Mizuho Bank (China), Ltd. as Facility Agent. Incorporated by reference from Exhibit 10.16 filed with Registrant’s Report on Form 8-K dated July 15, 2016.
|
|
10.12
|
Cooperation Agreement, dated February 20, 2017, between JANA Partners LLC and Registrant. Incorporated by reference from Exhibit 10.37 filed with Registrant’s Report on Form 8-K dated February 21, 2017.
|
|
10.13
|
Cooperation Agreement, dated February 20, 2017, between Francesco Trapani and Registrant. Incorporated by reference from Exhibit 10.38 filed with Registrant’s Report on Form 8-K dated February 21, 2017.
|
|
12.1
|
Ratio of Earnings to Fixed Charges.
|
|
14.1
|
Code of Business and Ethical Conduct. Incorporated by reference from Exhibit 14.1 filed with Registrant’s Report on Form 8-K dated March 22, 2016.
|
|
21.1
|
Subsidiaries of Registrant.
|
|
23.1
|
Consent of PricewaterhouseCoopers LLP, Independent Registered Public Accounting Firm.
|
|
31.1
|
Certification of Chief Executive Officer Pursuant to Section 302 of the Sarbanes-Oxley Act of 2002.
|
|
31.2
|
Certification of Chief Financial Officer Pursuant to Section 302 of the Sarbanes-Oxley Act of 2002.
|
|
32.1
|
Certification of Chief Executive Officer Pursuant to 18 U.S.C. Section 1350, as adopted pursuant to Section 906 of the Sarbanes-Oxley Act of 2002.
|
TIFFANY & CO.
K-
105
|
Exhibit No. Description
|
|
|
32.2
|
Certification of Chief Financial Officer Pursuant to 18 U.S.C. Section 1350, as adopted pursuant to Section 906 of the Sarbanes-Oxley Act of 2002.
|
|
101
|
The following financial information from Registrant’s Annual Report on Form 10-K for the fiscal year ended January 31, 2017, filed with the SEC, formatted in Extensible Business Reporting Language (XBRL): (i) the Consolidated Balance Sheets; (ii) the Consolidated Statements of Earnings; (iii) the Consolidated Statements of Comprehensive Earnings; (iv) the Consolidated Statements of Stockholders’ Equity; (v) the Consolidated Statements of Cash Flows; (vi) the Notes to the Consolidated Financial Statements; and (vii) Schedule II - Valuation and Qualifying Accounts and Reserves.
|
Executive Compensation Plans and Arrangements
|
Exhibit No. Description
|
|
|
10.14
|
Form of Indemnity Agreement, approved by the Board of Directors on March 11, 2005 for use with all directors and executive officers (Corrected Version). Incorporated by reference from Exhibit 10.49a filed with Registrant’s Report on Form 8-K dated May 23, 2005.
|
|
10.15
|
Tiffany and Company Executive Deferral Plan originally made effective October 1, 1989, as amended and restated effective January 19, 2017. Incorporated by reference from Exhibit 10.18 filed with Registrant’s Report on Form 8-K dated January 25, 2017.
|
|
10.16
|
Registrant's Amended and Restated Retirement Plan for Non-Employee Directors originally made effective January 1, 1989, as amended through January 21, 1999. Incorporated by reference from Exhibit 10.108 filed with Registrant's Annual Report on Form 10-K for the Fiscal Year ended January 31, 1999.
|
|
10.17
|
Summary of informal incentive cash bonus plan for managerial employees. Incorporated by reference from Exhibit 10.109 filed with Registrant’s Report on Form 8-K dated March 16, 2005.
|
|
10.18
|
1994 Tiffany and Company Supplemental Retirement Income Plan, Amended and Restated as of March 17, 2016. Incorporated by reference from Exhibit 10.21 filed with Registrant’s Report on Form 8-K dated March 22, 2016.
|
|
10.19
|
Form of 2009 Retention Agreement between and among Registrant and Tiffany and Company and those executive officers indicated within the form and Appendices I and II to such Agreement. Incorporated by reference from Exhibit 10.127c filed with Registrant’s Report on Form 8-K dated February 2, 2009.
|
|
10.20
|
Summary of Executive Long Term Disability Plan available to executive officers. Incorporated by reference from Exhibit 10.24 filed with Registrant’s Report on Form 10-K dated March 28, 2013.
|
|
10.20a
|
Group Long Term Disability Insurance Policy issued by First Unum Life Insurance, Policy No. 533717 001. Incorporated by reference from Exhibit 10.24a filed with Registrant’s Report on Form 10-K dated March 28, 2013.
|
|
10.20b
|
Individual Disability Insurance Policy issued by Provident Life and Casualty Insurance Company. Incorporated by reference from Exhibit 10.24b filed with Registrant’s Report on Form 10-K dated March 28, 2013.
|
TIFFANY & CO.
K-
106
|
Exhibit No. Description
|
|
|
10.20c
|
Individual Disability Insurance Policy issued by Lloyd’s of London. Incorporated by reference from Exhibit 10.24c filed with Registrant’s Report on Form 10-K dated March 28, 2013.
|
|
10.21
|
Summary of arrangements for the payment of premiums on life insurance policies owned by executive officers. Incorporated by reference from Exhibit 10.137 filed with Registrant’s Report on Form 8-K dated February 2, 2009.
|
|
10.22
|
2004 Tiffany and Company Un-funded Retirement Income Plan to Recognize Compensation in Excess of Internal Revenue Code Limits, Amended and Restated as of January 19, 2017. Incorporated by reference from Exhibit 10.25 filed with Registrant’s Report on Form 8-K dated January 25, 2017.
|
|
10.23
|
Registrant’s 2005 Employee Incentive Plan Amended and Adopted as of May 21, 2009. Incorporated by reference from Exhibit 10.28b filed with Registrant’s Report on Form 10-K dated March 28, 2013.
|
|
10.23a
|
Form of Fiscal 2014 Cash Incentive Award Agreement for certain executive officers as adopted on March 19, 2014 under Registrant’s 2005 Employee Incentive Plan. Incorporated by reference from Exhibit 10.139d filed with Registrant’s Report on Form 8-K dated March 21, 2014.
|
|
10.23b
|
Form of Non-Competition and Confidentiality Covenants for use in connection with Performance-Based Restricted Stock Unit Grants to Registrant’s executive officers and Time-Vested Restricted Unit Awards made to other officers of Registrant’s affiliated companies pursuant to the Registrant’s 2005 Employee Incentive Plan and pursuant to the Tiffany and Company Un-funded Retirement Income Plan to Recognize Compensation in Excess of Internal Revenue Code Limits. Incorporated by reference from Exhibit 10.141a filed with Registrant’s Report on Form 8-K dated May 23, 2005.
|
|
10.23c
|
Stock Option Award (Transferable Non-Qualified Option) under Registrant’s 2005 Employee Incentive Plan as revised January 14, 2009 (form used for grants made to executive officers subsequent to that date). Incorporated by reference from Exhibit 10.144b filed with Registrant’s Report on Form 8-K dated February 2, 2009.
|
|
10.23d
|
Terms of Time-Vested Restricted Stock Unit Grants under Registrant’s 2005 Employee Incentive Plan as revised January 14, 2009 (form used for grants made to employees other than executive officers subsequent to that date). Incorporated by reference from Exhibit 10.150a filed with Registrant’s Report on Form 8-K dated February 2, 2009.
|
|
10.23e
|
Terms of Stock Option Award (Transferable Non-Qualified Option) under Registrant’s 2005 Employee Incentive Plan. Incorporated by reference from Exhibit 10.28n filed with Registrant’s Report on Form 8-K dated September 24, 2013.
|
|
10.23f
|
Terms of Restricted Stock Grant (Non-Transferable) under Registrant’s 2005 Employee Incentive Plan. Incorporated by reference from Exhibit 10.28o filed with Registrant’s Report on Form 8-K dated September 24, 2013.
|
|
10.23g
|
Terms of Time-Vesting Restricted Stock Unit Grant to executive officers as adopted on November 20, 2013 under Registrant’s 2005 Employee Incentive Plan. Incorporated by reference from Exhibit 10.28p filed with Registrant’s Report on Form 8-K dated March 21, 2014.
|
|
10.23h
|
Terms of Performance-Based Restricted Stock Unit Grants to executive officers, effective January 15, 2014, under Registrant’s 2005 Employee Incentive Plan. Incorporated by reference from Exhibit 10.28s filed with Registrant’s Report on Form 8-K dated September 19, 2014.
|
TIFFANY & CO.
K-
107
|
Exhibit No. Description
|
|
|
10.23i
|
Form of Non-Competition and Confidentiality Covenants for use in connection with Performance-Based Restricted Stock Unit Grants to Registrant’s executive officers, and Time-Vesting Restricted Unit Awards and Certain Non-Qualified Retirement Contributions made to other officers of Registrant’s affiliated companies pursuant to Registrant’s 2005 Employee Incentive Plan and pursuant to the Tiffany and Company Deferral Plan. Incorporated by reference from Exhibit 10.28r filed with Registrant’s Report on Form 8-K dated March 21, 2014.
|
|
10.23j
|
Terms of 2014 Amended and Restated Performance-Based Restricted Stock Unit Grant for Michael J. Kowalski. Incorporated by reference from Exhibit 10.27s filed with Registrant’s Report on Form 8-K dated March 24, 2015.
|
|
10.23k
|
Terms of 2015 Amended and Restated Performance-Based Restricted Stock Unit Grant for Michael J. Kowalski. Incorporated by reference from Exhibit 10.27t filed with Registrant’s Report on Form 8-K dated March 24, 2015.
|
|
10.24
|
Registrant's 1998 Directors Option Plan. Incorporated by reference from Exhibit 4.3 to Registrant's Registration Statement on Form S-8, file number 333-67725, filed November 23, 1998.
|
|
10.24a
|
Terms of Stock Option Award (Transferable Non-Qualified Option) under Registrant’s 1998 Directors Option Plan as revised March 7, 2005. Incorporated by reference from Exhibit 10.142 filed with Registrant’s Report on Form 8-K dated March 16, 2005.
|
|
10.25
|
Registrant’s 2008 Directors Equity Compensation Plan. Incorporated by reference from Exhibit 4.3a filed with Registrant’s Report on Form 8-K dated March 23, 2009.
|
|
10.25a
|
Terms of Stock Option Award (Transferable Non-Qualified Option) under Registrant’s 2008 Directors Equity Compensation Plan. Incorporated by reference from Exhibit 10.30a filed with Registrant’s Report on Form 10-K dated March 28, 2013.
|
|
10.25b
|
Terms of Stock Option Award (Transferable Non-Qualified Option) under Registrant’s 2008 Directors Equity Compensation Plan, effective May 26, 2016. Incorporated by reference from Exhibit 10.28c filed with Registrant’s Report on Form 8-K dated June 2, 2016.
|
|
10.25c
|
Terms of Restricted Stock Unit Grant under Registrant’s 2008 Directors Equity Compensation Plan, effective May 26, 2016. Incorporated by reference from Exhibit 10.28d filed with Registrant’s Report on Form 8-K dated June 2, 2016.
|
|
10.25d
|
Terms of Stock Option Award (Transferable Non-Qualified Option) under Registrant’s 2008 Directors Equity Compensation Plan, effective March 16, 2017.
|
|
10.25e
|
Terms of Restricted Stock Unit Grant under Registrant’s 2008 Directors Equity Compensation Plan, effective March 16, 2017.
|
|
10.26
|
Registrant’s 2014 Employee Incentive Plan, amended and restated as of March 16, 2016. Incorporated by reference from Exhibit 10.29 filed with Registrant’s Report on Form 8-K dated March 22, 2016.
|
|
10.26a
|
Terms of Stock Option Award (Transferable Non-Qualified Option) under Registrant’s 2014 Employee Incentive Plan. Incorporated by reference from Exhibit 10.31a filed with Registrant’s Report on Form 8-K dated July 18, 2014.
|
TIFFANY & CO.
K-
108
|
Exhibit No. Description
|
|
|
10.26b
|
Terms of Cliff-Vesting Restricted Stock Grant (Non-Transferable) under Registrant’s 2014 Employee Incentive Plan. Incorporated by reference from Exhibit 10.31b filed with Registrant’s Report on Form 8-K dated July 18, 2014.
|
|
10.26c
|
Terms of Tranche-Vesting Restricted Stock Grant (Non-Transferable) under Registrant’s 2014 Employee Incentive Plan. Incorporated by reference from Exhibit 10.31c filed with Registrant’s Report on Form 8-K dated July 18, 2014.
|
|
10.26d
|
Terms of Time-Vesting Restricted Stock Grant (Non-Transferable) under Registrant’s 2014 Employee Incentive Plan. Incorporated by reference from Exhibit 10.31d filed with Registrant’s Report on Form 8-K dated July 18, 2014.
|
|
10.26e
|
Amended and Restated Terms of Performance-Based Restricted Stock Unit Grant (Non-Transferable) to executive officers under Registrant’s 2014 Employee Incentive Plan, effective January 14, 2015.
|
|
10.26f
|
Form of Fiscal 2016 Cash Incentive Award Agreement for certain executive officers as adopted on March 16, 2016 under Registrant’s 2014 Employee Incentive Plan. Incorporated by reference from Exhibit 10.29e filed with Registrant’s Report on Form 8-K dated March 22, 2016.
|
|
10.26g
|
Form of Non-Competition and Confidentiality Covenants for use in connection with Performance-Based Restricted Stock Unit Grants to Registrant’s executive officers, and Time-Vesting Restricted Unit Awards and Certain Non-Qualified Retirement Contributions made to other officers of Registrant’s affiliated companies pursuant to Registrant’s 2014 Employee Incentive Plan and pursuant to the Tiffany and Company Executive Deferral Plan. Incorporated by reference from Exhibit 10.29f filed with Registrant’s Report on Form 8-K dated March 22, 2016.
|
|
10.26h
|
Terms of Stock Option Award (Transferable Non-Qualified Option) under Registrant’s 2014 Employee Incentive Plan, as revised March 16, 2016. Incorporated by reference from Exhibit 10.29g filed with Registrant’s Report on Form 8-K dated March 22, 2016.
|
|
10.26i
|
Terms of Tranche-Vesting Restricted Stock Grant (Non-Transferable) under Registrant’s 2014 Employee Incentive Plan, as revised March 16, 2016. Incorporated by reference from Exhibit 10.29j filed with Registrant’s Report on Form 8-K dated March 22, 2016.
|
|
10.26j
|
Terms of Time-Vesting Restricted Stock Grant (Non-Transferable) under Registrant’s 2014 Employee Incentive Plan, as revised March 16, 2016. Incorporated by reference from Exhibit 10.29k filed with Registrant’s Report on Form 8-K dated March 22, 2016.
|
|
10.26k
|
Form of Cash Incentive Award Agreement for executive officers as adopted on January 19, 2017 under Registrant’s 2014 Employee Incentive Plan. Incorporated by reference from Exhibit 10.29l filed with Registrant’s Report on Form 8-K dated January 25, 2017.
|
|
10.26l
|
Form of Non-Competition and Confidentiality Covenants for use in connection with Performance-Based Restricted Stock Unit Grants to Registrant’s executive officers, Time-Vesting Restricted Stock Unit Grants, Stock Option Awards and certain non-qualified retirement contributions made to executive officers and certain other officers of Registrant’s affiliated companies pursuant to Registrant’s 2014 Employee Incentive Plan, the Tiffany and Company Executive Deferral Plan and the 2004 Tiffany and Company Un-funded Retirement Income Plan to Recognize Compensation in Excess of Internal Revenue Code Limits. Incorporated by reference from Exhibit 10.29m filed with Registrant’s Report on Form 8-K dated January 25, 2017.
|
|
10.26m
|
Terms of Stock Option Award (Transferable Non-Qualified Option) under Registrant’s 2014 Employee Incentive Plan, as revised January 19, 2017. Incorporated by reference from Exhibit 10.29n filed with Registrant’s Report on Form 8-K dated January 25, 2017.
|
TIFFANY & CO.
K-
109
|
Exhibit No. Description
|
|
|
10.26n
|
Terms of Performance-Based Restricted Stock Unit Grant (Non-Transferable) to executive officers under Registrant’s 2014 Employee Incentive Plan, as revised January 19, 2017. Incorporated by reference from Exhibit 10.29o filed with Registrant’s Report on Form 8-K dated January 25, 2017.
|
|
10.26o
|
Terms of Restricted Stock Unit Grant (Non-Transferable) under Registrant’s 2014 Employee Incentive Plan, as revised January 19, 2017. Incorporated by reference from Exhibit 10.29p filed with Registrant’s Report on Form 8-K dated January 25, 2017.
|
|
10.26p
|
Terms of Stock Option Award (Transferable Non-Qualified Option) granted to Michael J. Kowalski under Registrant’s 2014 Employee Incentive Plan on February 15, 2017. Incorporated by reference from Exhibit 10.39 filed with Registrant’s Report on Form 8-K/A dated February 22, 2017.
|
|
10.27
|
Senior Executive Employment Agreement between Frederic Cumenal and Tiffany and Company, effective as of March 10, 2011. Incorporated by reference from Exhibit 10.154 filed with Registrant’s Report on Form 8-K dated March 21, 2011.
|
|
10.28
|
Employment offer letter, dated as of March 7, 2014, between Ralph Nicoletti and Tiffany and Company. Incorporated by reference from Exhibit 10.33 filed with the Registrant’s Report on Form 10-K dated March 20, 2015.
|
|
10.29
|
Employment offer letter, dated as of September 7, 2016, between Mark J. Erceg and Tiffany and Company.
|
|
10.30
|
Employment offer letter, dated as of April 18, 2014, between Jean-Marc Bellaiche and Tiffany and Company. Incorporated by reference from Exhibit 10.32 to Registrant’s Annual Report on Form 10-K for the Fiscal Year ended January 31, 2016.
|
|
10.31
|
Employment offer letter, dated as of December 19, 2014, between Jennifer de Winter and Tiffany and Company. Incorporated by reference from Exhibit 10.33 to Registrant’s Annual Report on Form 10-K for the Fiscal Year ended January 31, 2016.
|
|
10.32
|
Employment offer letter, dated as of June 15, 2015, between Philippe Galtie and Tiffany and Company.
|
|
10.33
|
Form of 2016 Retention Agreement with Registrant and Tiffany and Company. Incorporated by reference from Exhibit 10.34 filed with Registrant’s Report on Form 8-K dated March 22, 2016.
|
|
10.34
|
Share Ownership Policy for Executive Officers and Directors, Amended and Restated as of November 19, 2014. Incorporated by reference from Exhibit 10.152 filed with Registrant’s Report on Form 8-K dated December 1, 2014.
|
|
10.35
|
Separation Agreement and Release, dated as of March 6, 2017, by and among Registrant, Tiffany and Company and Frederic Cumenal. Incorporated by reference from Exhibit 10.41 filed with the Registrant’s Report on Form 8-K dated March 6, 2017.
|
|
10.36
|
Form of Retention Agreement with Registrant and Tiffany and Company, adopted March 15, 2017.
|
|
10.37
|
Corporate Governance Principles, amended and restated effective March 16, 2017. Incorporated by reference from Exhibit 10.42 to Registrant’s Report on Form 8-K dated March 16, 2017.
|
TIFFANY & CO.
K-
110
Tiffany & Co. and Subsidiaries
Schedule II - Valuation and Qualifying Accounts and Reserves
(in millions)
|
Column A
|
Column B
|
Column C
|
Column D
|
Column E
|
||||||||||||
|
Additions
|
||||||||||||||||
|
Description
|
Balance at beginning of period
|
|
Charged to costs and expenses
|
|
Charged to other accounts
|
|
Deductions
|
|
Balance at end
of period
|
|
||||||
|
Year Ended January 31, 2017:
|
||||||||||||||||
|
Reserves deducted from assets:
|
||||||||||||||||
|
Accounts receivable allowances:
|
||||||||||||||||
|
Doubtful accounts
|
$
|
3.2
|
|
$
|
3.8
|
|
$
|
—
|
|
$
|
5.1
|
|
a
|
$
|
1.9
|
|
|
Sales returns
|
8.3
|
|
2.5
|
|
—
|
|
1.2
|
|
b
|
9.6
|
|
|||||
|
Allowance for inventory liquidation
and obsolescence
|
59.2
|
|
19.2
|
|
—
|
|
13.0
|
|
c
|
65.4
|
|
|||||
|
Allowance for inventory shrinkage
|
1.2
|
|
0.5
|
|
—
|
|
0.7
|
|
d
|
1.0
|
|
|||||
|
Deferred tax valuation allowance
|
19.5
|
|
5.0
|
|
—
|
|
0.4
|
|
e
|
24.1
|
|
|||||
a) Uncollectible accounts written off.
b) Adjustment related to sales returns previously provided for.
c) Liquidation of inventory previously written down to market.
d) Physical inventory losses.
e) Reversal of deferred tax valuation allowance and utilization of deferred tax loss carryforward.
TIFFANY & CO.
K-
111
Tiffany & Co. and Subsidiaries
Schedule II - Valuation and Qualifying Accounts and Reserves
(in millions)
|
Column A
|
Column B
|
Column C
|
Column D
|
Column E
|
||||||||||||
|
Additions
|
||||||||||||||||
|
Description
|
Balance at beginning of period
|
|
Charged to costs and expenses
|
|
Charged to other accounts
|
|
Deductions
|
|
Balance at end
of period
|
|
||||||
|
Year Ended January 31, 2016:
|
||||||||||||||||
|
Reserves deducted from assets:
|
||||||||||||||||
|
Accounts receivable allowances:
|
||||||||||||||||
|
Doubtful accounts
|
$
|
1.8
|
|
$
|
4.4
|
|
$
|
—
|
|
$
|
3.0
|
|
a
|
$
|
3.2
|
|
|
Sales returns
|
8.8
|
|
3.5
|
|
—
|
|
4.0
|
|
b
|
8.3
|
|
|||||
|
Allowance for inventory liquidation
and obsolescence
|
63.2
|
|
25.4
|
|
—
|
|
29.4
|
|
c
|
59.2
|
|
|||||
|
Allowance for inventory shrinkage
|
2.2
|
|
0.8
|
|
—
|
|
1.8
|
|
d
|
1.2
|
|
|||||
|
Deferred tax valuation allowance
|
16.2
|
|
5.3
|
|
—
|
|
2.0
|
|
e
|
19.5
|
|
|||||
a) Uncollectible accounts written off.
b) Adjustment related to sales returns previously provided for.
c) Liquidation of inventory previously written down to market.
d) Physical inventory losses.
e) Reversal of deferred tax valuation allowance and utilization of deferred tax loss carryforward.
TIFFANY & CO.
K-
112
Tiffany & Co. and Subsidiaries
Schedule II - Valuation and Qualifying Accounts and Reserves
(in millions)
|
Column A
|
Column B
|
Column C
|
Column D
|
Column E
|
||||||||||||
|
Additions
|
||||||||||||||||
|
Description
|
Balance at beginning of period
|
|
Charged to costs and expenses
|
|
Charged to other accounts
|
|
Deductions
|
|
Balance at end
of period
|
|
||||||
|
Year Ended January 31, 2015:
|
||||||||||||||||
|
Reserves deducted from assets:
|
||||||||||||||||
|
Accounts receivable allowances:
|
||||||||||||||||
|
Doubtful accounts
|
$
|
1.9
|
|
$
|
1.9
|
|
$
|
—
|
|
$
|
2.0
|
|
a
|
$
|
1.8
|
|
|
Sales returns
|
8.5
|
|
1.9
|
|
—
|
|
1.6
|
|
b
|
8.8
|
|
|||||
|
Allowance for inventory liquidation
and obsolescence
|
64.1
|
|
33.6
|
|
—
|
|
34.5
|
|
c
|
63.2
|
|
|||||
|
Allowance for inventory shrinkage
|
1.5
|
|
2.6
|
|
—
|
|
1.9
|
|
d
|
2.2
|
|
|||||
|
Deferred tax valuation allowance
|
17.7
|
|
4.0
|
|
—
|
|
5.5
|
|
e
|
16.2
|
|
|||||
a) Uncollectible accounts written off.
b) Adjustment related to sales returns previously provided for.
c) Liquidation of inventory previously written down to market.
d) Physical inventory losses.
e) Reversal of deferred tax valuation allowance and utilization of deferred tax loss carryforward.
TIFFANY & CO.
K-
113
TABLE OF CONTENTS
Part IItem 1. BusinessItem 1A. Risk FactorsItem 1B. Unresolved Staff CommentsItem 2. PropertiesItem 3. Legal ProceedingsItem 4. Mine Safety DisclosuresPart IIItem 5. Market For Registrant's Common Equity, Related Stockholder Matters and Issuer Purchases Of Equity SecuritiesItem 6. Selected Financial DataItem 7. Management's Discussion and Analysis Of Financial Condition and Results Of OperationsItem 7A. Quantitative and Qualitative Disclosures About Market RiskItem 8. Financial Statements and Supplementary DataItem 9. Changes in and Disagreements with Accountants on Accounting and Financial DisclosureItem 9A. Controls and ProceduresItem 9B. Other InformationPart IIIItem 10. Directors, Executive Officers and Corporate GovernanceItem 11. Executive CompensationItem 12. Security Ownership Of Certain Beneficial Owners and Management and Related Stockholder MattersItem 13. Certain Relationships and Related Transactions, and Director IndependenceItem 14. Principal Accounting Fees and ServicesPart IVItem 15. Exhibits, Financial Statement SchedulesItem 16. Form 10-k Summary