As filed with the Securities and Exchange Commission on February 28, 2020
UNITED STATES
SECURITIES AND EXCHANGE COMMISSION
Washington, D.C. 20549
FORM 20-F
(Mark One)
|
☐
|
REGISTRATION STATEMENT PURSUANT TO SECTION 12(b) OR (g) OF THE SECURITIES EXCHANGE ACT OF 1934
|
OR
|
x
|
ANNUAL REPORT PURSUANT TO SECTION 13 OR 15(d) OF THE SECURITIES EXCHANGE ACT OF 1934
|
For the fiscal year ended December 31, 2019
OR
|
☐
|
TRANSITION REPORT PURSUANT TO SECTION 13 OR 15(d) OF THE SECURITIES EXCHANGE ACT OF 1934
|
For the transition period from
to
.
OR
|
☐
|
SHELL COMPANY REPORT PURSUANT TO SECTION 13 OR 15(d) OF THE SECURITIES EXCHANGE ACT OF 1934
|
Date of event requiring this shell company report
Commission file number:
MILLICOM INTERNATIONAL CELLULAR S.A.
(Exact name of Registrant as specified in its charter)
Grand Duchy of Luxembourg
(Jurisdiction of incorporation)
(Jurisdiction of incorporation)
2, Rue du Fort Bourbon,
L-1249 Luxembourg
Grand Duchy of Luxembourg
(Address of principal executive offices)
Mauricio Ramos
President and Chief Executive Officer
Millicom International Cellular S.A.
2, Rue du Fort Bourbon,
L-1249 Luxembourg
Grand Duchy of Luxembourg
Phone: +352-277-59101
Email: investors@millicom.com
(Name, Telephone, E-mail and/or Facsimile number and Address of Company Contact Person)
Securities registered or to be registered pursuant to Section 12(b) of the Act:
|
Title of each class
|
Name of each exchange on which registered
|
|
Common Stock, par value $1.50 per share
|
The Nasdaq Stock Market LLC
|
Securities registered or to be registered pursuant to Section 12(g) of the Act:
None
(Title of Class)
(Title of Class)
Securities for which there is a reporting obligation pursuant to Section 15(d) of the Act:
None
(Title of Class)
(Title of Class)
Indicate the number of outstanding shares of each of the issuer’s classes of capital or common stock as of the close of the period covered by the annual report.
101,739,217 shares of Common Stock as of December 31, 2019
Indicate by check mark if the registrant is a well-known seasoned issuer, as defined in Rule 405 of the Securities Act.
Yes
☐
No
x
If this report is an annual or transition report, indicate by check mark if the registrant is not required to file reports pursuant to Section 13 or 15(d) of the Securities Exchange Act of 1934
Yes
☐
No
x
Indicate by check mark whether the registrant (1) has filed all reports required to be filed by Section 13 or 15(d) of the Securities Exchange Act of 1934 during the preceding 12 months (or for such shorter period that the registrant was required to file such reports), and (2) has been subject to such filing requirements for the past 90 days.
Yes
☐
No
x
Indicate by check mark whether the registrant has submitted electronically every Interactive Data File required to be submitted pursuant to Rule 405 of Regulation S-T during the preceding 12 months (or for such shorter period that the registrant was required to submit such files).
Yes
x
No
☐
Indicate by check mark whether the registrant is a large accelerated filer, an accelerated filer, a non-accelerated filer, or an emerging growth company. See definition of “large accelerated filer,” “accelerated filer,” and “emerging growth company” in Rule 12b-2 of the Exchange Act.
Large Accelerated Filer
x
Accelerated Filer ☐ Non-accelerated Filer ☐ Emerging growth company ☐
If an emerging growth company that prepares its financial statements in accordance with U.S. GAAP, indicate by check mark if the registrant has elected not to use the extended transition period for complying with any new or revised financial accounting standards† provided pursuant to Section 13(a) of the Exchange Act. ☐
† The term “new or revised financial accounting standard” refers to any update issued by the Financial Accounting Standards Board to its
Accounting Standards Codification after April 5, 2012.
Indicate by check mark which basis of accounting the registrant has used to prepare the financial statements included in this filing:
☐ U.S. GAAP
x
International Financial Reporting Standards as issued by the International Accounting Standards Board
☐ Other
If “Other” has been checked in response to the previous question, indicate by check mark which financial statement item the registrant has elected to follow.
☐ Item 17 ☐ Item 18
If this is an annual report, indicate by check mark whether the registrant is a shell company (as defined in Rule 12b-2 of the Exchange Act).
Yes
☐
No
x
TABLE OF CONTENTS
|
PAGE
|
|
PRESENTATION OF FINANCIAL AND OTHER INFORMATION
Financial statement information
We have included in this Annual Report the Millicom Group’s (as defined below) audited consolidated financial statements as of December 31,
2019
and
2018
and for the years ended December 31,
2019
,
2018
and
2017
. The Millicom Group’s financial statements included herein and the accompanying notes thereto have been prepared in accordance with International Financial Reporting Standards as issued by the International Accounting Standards Board (“IFRS”). We end our fiscal year on December 31. References to fiscal
2019
, fiscal
2018
and fiscal
2017
refer to the years ended December 31,
2019
,
2018
and
2017
, respectively.
Comunicaciones Celulares, S.A. (“Comcel”), our principal Guatemala joint venture company in which we hold a 55% ownership interest but which we do not control, met the income threshold as a significant investee accounted for by the equity method for purposes of Rule 3-09 of Regulation S-X for the years ended December 31, 2019, 2018 and 2017. As permitted by Rule 3-09, the financial statements for Comcel will be separately provided in an amendment to this Form 20-F.
Our management determines operating and reportable segments based on the reports that are used by the chief operating decision maker to make strategic and operational decisions from both a business and geographic perspective. The Millicom Group’s risks and rates of return for its operations are predominantly affected by operating in different geographical regions. The Millicom Group has businesses in two main regions, Latin America and Africa, which constitute our two segments. Our Latin America segment includes our Guatemala and Honduras joint ventures as if they were fully consolidated, as this reflects the way our management reviews and uses internally reported information to make decisions about operating matters and to provide increased transparency to investors on those operations. Our Africa segment does not include our joint venture in Ghana because our management does not consider it a strategic part of our group.
Presentation of data
We present operational and financial data in this Annual Report. Operational data, such as the number of customers, unless otherwise indicated, are presented for the Millicom Group, including our subsidiaries and Guatemala and Honduras joint ventures but excluding our Ghana joint venture. We exclude operational data from our Ghana joint venture because, unlike our other joint ventures, we do not consider it a strategic part of our Group. Financial data is presented either at a consolidated level or at a segmental level, as derived from our financial statements, including the notes thereto.
We have made rounding adjustments to reach some of the figures included in this Annual Report. Accordingly, numerical figures shown as totals in some tables may not be an exact arithmetic aggregation of the figures that preceded them and percentage calculations using these adjusted figures may not result in the same percentage values as are shown in this Annual Report.
Certain references
Unless the context otherwise requires, references to the “Company” or “MIC S.A.” refer only to Millicom International Cellular S.A., a public limited liability company (société anonyme) organized and established under the laws of the Grand Duchy of Luxembourg, and the terms “Millicom,” “Millicom Group,” “our Group”, “we”, “us” and “our” refer to Millicom International Cellular S.A. and its consolidated subsidiaries and, where applicable, its joint ventures in Guatemala and Honduras.
Unless otherwise indicated, all references to “U.S. dollars,” “dollars” or “$” are to the lawful currency of the United States of America; all references to “Euro” or “€” are to the lawful currency of the participating Member States in the Third Stage of European Economic and Monetary Union of the Treaty Establishing the European Community, as amended from time to time; and all references to “Swedish Krona” or “SEK” are to the lawful currency of the Kingdom of Sweden. For a list of the functional currency names and abbreviations in the markets in which we operate, see the introduction to the notes to our audited consolidated financial statements.
FORWARD-LOOKING STATEMENTS
This Annual Report contains statements that constitute “forward-looking” statements within the meaning of Section 21E of the U.S. Securities Exchange Act of 1934, as amended. This Annual Report contains certain forward-looking statements concerning our intentions, beliefs or current expectations regarding our future financial results, plans, liquidity, prospects, growth, strategy and profitability, as well as the general economic conditions of the industries and countries in
which we operate. Forward-looking statements include statements concerning our plans, objectives, goals, strategies, future events, future sales or performance, capital expenditures, financing needs, plans or intentions relating to acquisitions, our competitive strengths and weaknesses, our business strategy and the trends we anticipate in the industries and the economic, political and legal environments in which we operate and other information that is not historical information.
Many of the forward-looking statements contained in this Annual Report can be identified by the use of forward-looking words such as “anticipate,” “believe,” “could,” “expect,” “should,” “plan,” “intend,” “estimate” and “potential,” among others. These statements appear in a number of places in this Annual Report and include, but are not limited to, statements regarding our intent, belief or current expectations with respect to:
|
•
|
global economic conditions and foreign exchange rate fluctuations as well as local economic conditions in the markets we serve;
|
• telecommunications usage levels, including traffic and customer growth;
|
•
|
competitive forces, including pricing pressures, the ability to connect to other operators’ networks and our ability to retain market share in the face of competition from existing and new market entrants as well as industry consolidation;
|
|
•
|
legal or regulatory developments and changes, or changes in governmental policy, including with respect to the availability of spectrum and licenses, the level of tariffs, tax matters, the terms of interconnection, customer access and international settlement arrangements;
|
|
•
|
adverse legal or regulatory disputes or proceedings;
|
|
•
|
the success of our business, operating and financing initiatives and strategies, including partnerships and capital expenditure plans;
|
|
•
|
the level and timing of the growth and profitability of new initiatives, start-up costs associated with entering new markets, the successful deployment of new systems and applications to support new initiatives;
|
|
•
|
relationships with key suppliers and costs of handsets and other equipment;
|
|
•
|
our ability to successfully pursue acquisitions, investments or merger opportunities, integrate any acquired businesses in a timely and cost-effective manner and achieve the expected benefits of such transactions;
|
|
•
|
the availability, terms and use of capital, the impact of regulatory and competitive developments on capital outlays, the ability to achieve cost savings and realize productivity improvements;
|
|
•
|
technological development and evolving industry standards, including challenges in meeting customer demand for new technology and the cost of upgrading existing infrastructure;
|
|
•
|
the capacity to upstream cash generated in operations through dividends, royalties, management fees and repayment of shareholder loans;
|
|
•
|
other factors or trends affecting our financial condition or results of operations; and
|
|
•
|
various other factors, including without limitation those described under “Item 3. Key Information—D. Risk Factors.”
|
This list of important factors is not exhaustive. You should carefully consider the foregoing factors and other uncertainties and events, especially in light of the political, economic, social and legal environments in which we operate. Forward-looking statements are only our current expectations and are based on our management’s beliefs and assumptions and on information currently available to our management. Such statements are subject to risks and uncertainties, and actual results may differ materially from those expressed or implied in the forward-looking statements as a result of various factors, including, but not limited to, those identified under the section of this Annual Report entitled “Item 3. Key Information—D. Risk Factors.” These risks and uncertainties include factors relating to the markets in which we operate and global economies, securities and foreign exchange markets, which exhibit volatility and can be adversely affected by developments in other countries, factors relating to the telecommunications industry in the markets in which we operate and changes in its regulatory environment and factors relating to the competitive markets in which we operate.
Not applicable to Annual Report filing.
Not applicable to Annual Report filing.
A. Selected Financial Data
Historical financial information
The following tables present selected historical financial data for the Millicom Group. The statement of income data for the Millicom Group set forth below for the years ended
December 31, 2019
,
2018
and
2017
and the statements of financial position data set forth below as of
December 31, 2019
and
2018
are derived from the Millicom Group’s audited consolidated financial statements included elsewhere in this Annual Report. The statement of income data for the years ended and as of
December 31, 2016
and 2015 and statement of financial position data as of
December 31, 2017
,
2016
and 2015 are derived from the Millicom Group’s audited consolidated financial statements not included in this Annual Report.
The Guatemala and Honduras joint ventures were fully consolidated in our financial statements for fiscal 2015, as we had a path to full control as a result of our governance arrangements and certain put and call options. The put and call options expired unexercised on December 31, 2015 and the Guatemala and Honduras operations were deconsolidated in our financial statements from that date. Although our ownership interests remain unchanged, our interests in the Guatemala and Honduras joint ventures is now accounted for under the equity method of accounting in our financial statements and results of operations for fiscal 2016 and subsequent periods.
Our management determines operating and reportable segments based on the reports that are used by the chief operating decision maker to make strategic and operational decisions from both a business and geographic perspective. The Millicom Group’s risks and rates of return for its operations are predominantly affected by operating in different geographical regions. The Millicom Group has businesses in two main regions, Latin America and Africa, which constitute our two segments. Our Latin America segment includes the Guatemala and Honduras joint ventures as if they were fully consolidated, as this reflects the way our management reviews and uses internally reported information to make decisions about operating matters and to provide increased transparency to investors on those operations. Our Africa segment does not include our joint venture in Ghana, because our management does not consider it a strategic part of our group.
You should read this selected financial data together with “Item 5. Operating and Financial Review and Prospects” and the financial statements and accompanying notes included in this Annual Report. The historical results are not necessarily indicative of the Millicom Group’s future results of operations or financial condition.
|
Year ended December 31,
|
||||||||||||||
|
2019 (i)
|
2018 (ii) (iii)
|
2017 (ii) (iii)
|
2016 (ii) (iii)
|
2015 (ii) (iii)
|
||||||||||
|
(U.S. dollars in millions)
|
||||||||||||||
|
Revenue
|
4,336
|
|
3,946
|
|
3,936
|
|
3,876
|
|
6,112
|
|
||||
|
Cost of sales
|
(1,201
|
)
|
(1,117
|
)
|
(1,169
|
)
|
(1,142
|
)
|
(1,637
|
)
|
||||
|
Gross profit
|
3,135
|
|
2,829
|
|
2,767
|
|
2,735
|
|
4,474
|
|
||||
|
Operating expenses
|
(1,604
|
)
|
(1,616
|
)
|
(1,531
|
)
|
(1,552
|
)
|
(2,352
|
)
|
||||
|
Depreciation
|
(825
|
)
|
(662
|
)
|
(670
|
)
|
(648
|
)
|
(948
|
)
|
||||
|
Amortization
|
(275
|
)
|
(140
|
)
|
(142
|
)
|
(171
|
)
|
(222
|
)
|
||||
|
Share of profit in the joint ventures in Guatemala and Honduras
|
179
|
|
154
|
|
140
|
|
115
|
|
—
|
|
||||
|
Other operating income (expenses), net
|
(34
|
)
|
75
|
|
69
|
|
(13
|
)
|
(11
|
)
|
||||
|
Operating profit
|
575
|
|
640
|
|
632
|
|
465
|
|
940
|
|
||||
|
Interest and other financial expenses
|
(564
|
)
|
(367
|
)
|
(389
|
)
|
(366
|
)
|
(395
|
)
|
||||
|
Interest and other financial income
|
20
|
|
21
|
|
16
|
|
21
|
|
21
|
|
||||
|
Other non-operating (expenses) income, net
|
227
|
|
(39
|
)
|
(2
|
)
|
21
|
|
(596
|
)
|
||||
|
Profit (loss) from other joint ventures and associates, net
|
(40
|
)
|
(136
|
)
|
(85
|
)
|
(49
|
)
|
100
|
|
||||
|
Profit (loss) before taxes from continuing operations
|
218
|
|
119
|
|
172
|
|
92
|
|
71
|
|
||||
|
Charge for taxes, net
|
(120
|
)
|
(112
|
)
|
(162
|
)
|
(176
|
)
|
(262
|
)
|
||||
|
Profit (loss) for the year from continuing operations
|
97
|
|
7
|
|
10
|
|
(84
|
)
|
(192
|
)
|
||||
|
Profit (loss) from discontinued operations, net of tax
|
57
|
|
(33
|
)
|
60
|
|
(6
|
)
|
(252
|
)
|
||||
|
Net profit (loss) for the year
|
154
|
|
(26
|
)
|
69
|
|
(90
|
)
|
(444
|
)
|
||||
|
Attributable to:
|
||||||||||||||
|
The owners of Millicom
|
149
|
|
(10
|
)
|
87
|
|
(32
|
)
|
(559
|
)
|
||||
|
Non-controlling interests
|
5
|
|
(16
|
)
|
(17
|
)
|
(58
|
)
|
115
|
|
||||
|
Earnings (loss) per common share for profit (loss) attributable to the owners of the Company:
|
1.48
|
|
(0.10
|
)
|
0.86
|
|
(0.32
|
)
|
(5.59
|
)
|
||||
|
Earnings (loss) per common share for profit (loss) from continuing operations attributable to owners of the Company
|
0.92
|
|
0.23
|
|
0.27
|
|
(0.26
|
)
|
(3.07
|
)
|
||||
|
(i)
|
IFRS 16 was adopted as of January 1, 2019, using the modified retrospective method; previous periods were therefore not restated and might not be directly comparable. See "Introduction - New and amended IFRS accounting standards" in the notes to our audited consolidated financial statements included elsewhere in this Annual Report for additional details regarding the impact of the adoptions.
|
2019 figures also include the impact of our acquisitions: one full year of Cable Onda acquired at the end of 2018 and 8 months of Telefonica Celular de Nicaragua and 4 months of Telefonica Moviles Panama, S.A. each acquired in 2019. see note A.1.2. in the notes to our audited consolidated financial statements.
|
(ii)
|
IFRS 15 and IFRS 9 were adopted as of January 1, 2018, using the modified retrospective method; previous periods were therefore not restated and might not be directly comparable. See "Introduction - New and amended IFRS accounting standards" in the notes to our audited consolidated financial statements included elsewhere in this Annual Report for additional details regarding the impact of the adoptions.
|
|
(iii)
|
Restated for discontinued operations.
|
|
December 31,
|
||||||||||||||
|
2019(i)
|
2018(ii)
|
2017(ii)
|
2016(ii)
|
2015(ii)
|
||||||||||
|
(U.S. dollars in millions)
|
||||||||||||||
|
Assets
|
||||||||||||||
|
Total non-current assets
|
10,210
|
|
8,785
|
|
7,646
|
|
7,961
|
|
8,512
|
|
||||
|
Total current assets
|
2,641
|
|
1,525
|
|
1,585
|
|
1,661
|
|
1,871
|
|
||||
|
Assets held for sale
|
5
|
|
3
|
|
233
|
|
5
|
|
12
|
|
||||
|
Total assets
|
12,856
|
|
10,313
|
|
9,464
|
|
9,627
|
|
10,395
|
|
||||
|
Equity and Liabilities
|
||||||||||||||
|
Total non-current liabilities
|
7,770
|
|
4,845
|
|
4,116
|
|
4,361
|
|
4,210
|
|
||||
|
Total current liabilities
|
2,406
|
|
2,676
|
|
1,989
|
|
1,898
|
|
2,457
|
|
||||
|
Liabilities directly associated with assets held for sale
|
—
|
|
—
|
|
79
|
|
—
|
|
—
|
|
||||
|
Total liabilities
|
10,176
|
|
7,521
|
|
6,183
|
|
6,258
|
|
6,667
|
|
||||
|
Equity attributable to owners of the Company
|
2,410
|
|
2,542
|
|
3,096
|
|
3,167
|
|
3,477
|
|
||||
|
Non-controlling interests
|
271
|
|
251
|
|
185
|
|
201
|
|
251
|
|
||||
|
Total equity
|
2,680
|
|
2,792
|
|
3,281
|
|
3,368
|
|
3,728
|
|
||||
|
Total equity and liabilities
|
12,856
|
|
10,313
|
|
9,464
|
|
9,627
|
|
10,395
|
|
||||
|
(i)
|
IFRS 16 was adopted as of January 1, 2019, using the modified retrospective method; previous periods were therefore not restated and might not be directly comparable. See "Introduction - New and amended IFRS accounting standards" in the notes to our audited consolidated financial statements included elsewhere in this Annual Report for additional details regarding the impact of the adoptions.
|
|
(ii)
|
IFRS 15 and IFRS 9 were adopted as of January 1, 2018, using the modified retrospective method; previous periods were therefore not restated and might not be directly comparable. See "Introduction - New and amended IFRS accounting standards" in the notes to our audited consolidated financial statements included elsewhere in this Annual Report for additional details regarding the impact of the adoptions. The consolidated statement of financial position at December 31, 2018 has been restated after finalization of the Cable Onda purchase accounting (see note A.1.2.).
|
|
|
As of and for the year ended
December 31, |
|||||||||||||
|
|
2019
|
|
2018
|
|
2017
|
|
2016
|
2015
|
||||||
|
Share capital
|
153
|
|
|
153
|
|
|
153
|
|
|
153
|
|
153
|
|
|
|
Number of shares (in thousands)
|
101,739
|
|
|
101,739
|
|
|
101,739
|
|
|
101,739
|
|
101,739
|
|
|
|
Dividend declared per share (over the period)
|
2.64
|
|
|
2.64
|
|
|
2.64
|
|
|
2.64
|
|
2.64
|
|
|
|
Diluted net income (loss) per share (over the period) attributable to the owners of the Company
|
1.48
|
|
|
(0.10
|
)
|
|
0.86
|
|
|
(0.32
|
)
|
(5.59
|
)
|
|
Other revenue data
In addition to consolidated revenue data, the following table sets forth for the periods indicated certain segment revenue data, which has been extracted from note B.3 to our audited consolidated financial statements, where segment data is reconciled to consolidated data:
|
Year ended
December 31, |
||||||||||||||
|
2019(i)
|
2018(ii) (iii)
|
2017(ii) (iii)
|
2016(ii) (iii)
|
2015(ii)(iii)
|
||||||||||
|
Consolidated:
|
||||||||||||||
|
Mobile revenue
|
2,150
|
|
2,126
|
|
2,147
|
|
2,182
|
|
3,946
|
|
||||
|
Cable and other fixed services revenue
|
1,928
|
|
1,565
|
|
1,551
|
|
1,437
|
|
1,626
|
|
||||
|
Other revenue
|
52
|
|
43
|
|
38
|
|
36
|
|
37
|
|
||||
|
Total service revenue
|
4,130
|
|
3,734
|
|
3,737
|
|
3,655
|
|
5,609
|
|
||||
|
Telephone and equipment
|
206
|
|
212
|
|
199
|
|
221
|
|
502
|
|
||||
|
Total Consolidated Revenue
|
4,336
|
|
3,946
|
|
3,936
|
|
3,876
|
|
6,112
|
|
||||
|
Latin America segment:
|
||||||||||||||
|
Mobile revenue
|
3,258
|
|
3,214
|
|
3,283
|
|
3,318
|
|
3,580
|
|
||||
|
Cable and other fixed services revenue
|
2,197
|
|
1,808
|
|
1,755
|
|
1,611
|
|
1,621
|
|
||||
|
Other revenue
|
60
|
|
48
|
|
40
|
|
37
|
|
37
|
|
||||
|
Total service revenue
|
5,514
|
|
5,069
|
|
5,078
|
|
4,966
|
|
5,237
|
|
||||
|
Telephone and equipment
|
449
|
|
415
|
|
363
|
|
386
|
|
502
|
|
||||
|
Latin America Segment Revenue
|
5,964
|
|
5,485
|
|
5,441
|
|
5,352
|
|
5,740
|
|
||||
|
Africa segment:
|
||||||||||||||
|
Mobile revenue
|
372
|
|
388
|
|
374
|
|
380
|
|
366
|
|
||||
|
Cable and other fixed services revenue
|
9
|
|
10
|
|
9
|
|
15
|
|
3
|
|
||||
|
Other revenue
|
1
|
|
1
|
|
2
|
|
3
|
|
—
|
|
||||
|
Total service revenue
|
382
|
|
398
|
|
385
|
|
398
|
|
369
|
|
||||
|
Telephone and equipment
|
—
|
|
—
|
|
1
|
|
—
|
|
—
|
|
||||
|
Africa Segment Revenue
|
382
|
|
399
|
|
386
|
|
398
|
|
369
|
|
||||
|
(i)
|
IFRS 16 was adopted as of January 1, 2019, using the modified retrospective method; previous periods were therefore not restated and might not be directly comparable. See "Introduction - New and amended IFRS accounting standards" in the notes to our audited consolidated financial statements included elsewhere in this Annual Report for additional details regarding the impact of the adoptions.
|
|
(ii)
|
IFRS 15 and IFRS 9 were adopted as of January 1, 2018, using the modified retrospective method; previous periods were therefore not restated and might not be directly comparable. See "Introduction - New and amended IFRS accounting standards" in the notes to our audited consolidated financial statements included elsewhere in this Annual Report for additional details regarding the impact of the adoptions.
|
|
(iii)
|
Restated for discontinued operations.
|
Not applicable to Annual Report filing.
C. Reasons for the Offer and Use of Proceeds
Not applicable to Annual Report filing.
D.
Risk Factors
In addition to the other information contained in this Annual Report, you should carefully consider the following risk factors before investing in our shares. The risks and uncertainties we describe below are not the only ones we face. Additional risks and uncertainties of which we are not aware or that we currently believe are less material may also adversely affect the business, financial condition and results of operations, cash flows or prospects of the Millicom
Group. If any of the possible events described below were to occur, the business, financial condition and results of operations of the Millicom Group could be materially and adversely affected. If that happens, the market price of our shares could decline, and you could lose all or part of your investment.
This Annual Report also contains forward-looking statements that involve risks and uncertainties. Our actual results may differ materially from those anticipated in these forward-looking statements as a result of various factors, including the risks described below and elsewhere in this Annual Report.
The risk factors described in this section have been separated into four separate but interrelated areas:
|
1.
|
Risks related to the telecommunication and cable industries
|
|
2.
|
Risks related to Millicom’s businesses in the markets in which it operates
|
|
3.
|
Risks related to Millicom’s size, structure and leadership
|
|
4.
|
Risks related to share ownership and registration with the Securities and Exchange Commission
|
|
1.
|
Risks related to the telecommunication and cable industries
|
|
a.
|
Evolution of the telecommunications and cable industries
|
The telecommunications industry is characterized by rapid technological change and continually evolving industry standards.
The telecommunications industry is characterized by rapidly changing technology and evolving industry standards. The technology we use is increasingly complex, which leads to higher risks of implementation failure or service disruption. Success in the industry is increasingly dependent on the ability of operators to adapt to the changing technological landscape. The technologies utilized today may become obsolete or subject to competition from new technologies in the future. For example, our 3G or 4G services may become obsolete when appropriate devices become available and affordable for consumers and consumers upgrade to 5G services.
Growth in internet connectivity has led to the proliferation of entrants offering Voice over Internet Protocol (“VoIP”) services and video content services delivered over the internet. Such operators could displace the services we provide by using our customers’ internet access (which may or may not be provided by us) to enable the provision of communication, entertainment and information services directly to our customers. Failure to transform to data-driven products could have a negative impact on our legacy services and impact our results from operations.
Our ability to attract and retain customers is, in part, dependent on our ability to meet customer demand for new technology at the same, or at a quicker rate, than our competitors are able to do.
Failure to adapt and evolve could harm our competitive position, render our products obsolete and cause us to incur substantial costs to replace our products or implement new technologies.
Implementing new technologies requires substantial investments which may not generate expected returns.
The introduction of new technologies may require significant capital expenditure on infrastructure and there can be no guarantee that those investments will generate expected returns. As customers reduce their use of mobile voice and short message service (“SMS”) services, there may not be a corresponding increase in their data use or revenue generated from data use.
If we cannot successfully develop and operate our mobile, cable and broadband networks and distribution systems, we will be unable to expand our customer base and may lose market share and revenue.
Our ability to increase or maintain our market share and revenue is partly dependent on the success of our efforts to expand our business, the quality of our services and the management of our networks and distribution systems. As new technologies are developed or upgraded, such as advanced 4G systems, including 4G LTE, 5G systems, and fiber optic cable networks, our equipment may need to be replaced or upgraded or we may need to rebuild our mobile, cable or broadband network, in whole or in part.
The initial build-out of our networks and distribution systems and sustaining sufficient network performance and reliability is a capital-intensive process that is subject to risks and uncertainties which may delay the introduction of services and increase the cost of network construction or upgrade. Such uncertainties include constraints on our ability to fund additional capital expenditures, as well as external forces, such as obtaining necessary permits and spectrum from regulatory and other local authorities.
Unforeseeable technological developments may also render our services or distribution channels unpopular with customers or obsolete. To the extent we fail to expand, upgrade and modernize our networks and distribution systems on a timely basis relative to our competitors, we may not be able to expand our customer base and we may lose customers to competitors.
|
b.
|
Content and content rights
|
We make long-term content and service commitments in advance even though we cannot predict the popularity of the services or ratings the programming will generate and our mobile applications and cable content may not be accepted or widely used by our customers.
We acquire rights to distribute certain content or services for use by our mobile, paid TV and broadband customers, and we have strategic partnerships with major digital players, such as Amazon, Deezer and HBO. We make long–term commitments in advance even though we cannot predict the popularity of the services or ratings the programming will generate. Fees are negotiated for a number of years and on a share revenue basis; however, in some instances, our commitments include minimum guarantees, which means that we are required to pay a certain agreed upon amount regardless of the amount collected from the provision of such services. The commercial success of applications or content also depends on the quality and acceptance of other competing applications or content released into the marketplace at or near the same time.
The success of our pay-TV services depends on our ability to access an attractive selection of television programming from content providers.
The ability to provide movie, sports and other popular programming is a major factor that attracts customers to pay-TV services. We may not be able to obtain sufficient high-quality programming from third-party producers or exclusive sports content for our cable TV services on satisfactory terms or at all in order to offer compelling cable TV services which could result in reduced demand for, and lower revenue and profitability from, our cable services.
Content and programming costs are rising (especially those with exclusivity rights) and we may not be able to pass the increased costs on to our customers.
In recent years, the cable and pay-TV industry has experienced a rapid escalation in the cost of content rights and programming. We expect these costs may continue to increase, particularly those related to exclusive and live broadcasts of sporting and other events. We may not be able to moderate the growth in these costs or fully pass these on to our customers in the form of price increases.
Consumers are increasingly able to choose from a variety of platforms from which to receive content and programming.
A number of content providers have begun to sell their services through alternative distribution channels including IP-based platforms, smart-TVs and other app-compatible devices. Consumers may choose to purchase on-demand content through these alternative transmission methods which may lead to reduced demand for our pay-TV services.
We may be subject to legal liability associated with providing online services or media content.
We host and provide a wide variety of services and products that enable our customers to conduct business, and engage in various online activities. The law relating to the liability of providers of these online services and products for the activities of their customers is still unsettled in some jurisdictions. Claims may be threatened or brought against us for defamation, negligence, breaches of contract, copyright or trademark infringement, unfair competition, tort, including personal injury, fraud, or other theories based on the nature and content of information that we use and store. In addition, we may be subject to domestic or international actions alleging that certain content we have generated or third-party content that we have made available within our services violates applicable law or third-party rights.
We also offer third-party products, services and content. We may be subject to claims concerning these products, services or content by virtue of our involvement in marketing, branding, broadcasting, or providing access to them, even if we do not ourselves host, operate, provide, or provide access to these products, services or content. Defense of any such actions could be costly and involve significant time and attention of our management and other resources, may result in monetary liabilities or penalties, and may require us to change our business in an adverse manner.
|
c.
|
Licenses and spectrum
|
Available spectrum is limited, closely regulated and increasingly expensive.
The availability of spectrum is limited, closely regulated and can be expensive, and we may not be able to obtain it from the regulator or third parties at all or at a price that we deem to be commercially acceptable given competitive conditions. If we acquire spectrum through acquisition, regulators may require us to surrender spectrum to secure regulatory approval. We may need to incur significant capital expenditures in order to acquire licenses or infrastructure to offer new services to our customers or improve our current services.
Additional or supplemental licenses may be required to implement 5G technology in order to remain competitive, and we may be unable to acquire such licenses on reasonable terms or at all.
We may not be able to acquire or retain sufficient quantities of spectrum in our preferred band(s) which could impact the quality and efficiency of our networks and services and may negatively impact our profitability.
Our licenses may be suspended or revoked and we may be fined or penalized for alleged violations of law or regulations.
If we fail to comply with the conditions of our licenses or with the requirements established by the legislation or if we do not obtain permits for the operation of our networks and equipment, use of frequencies or additional licenses for broadcasting directly or through agreements with broadcasting companies, we may not have sufficient opportunity to cure any non-compliance. In the event that we do not cure any non-compliance, the applicable regulator may: levy fines; suspend or terminate our licenses, frequency permissions; or other governmental permissions or refuse to renew licenses that are up for renewal. For example, legislation in Tanzania requires telecommunications companies to list their shares on the Dar es Salaam Stock Exchange and offer 25% of their shares in a public offering. We have not yet complied with this requirement and the maximum penalty for non-compliance could include a revocation of our telecommunications licenses in Tanzania.
Most of our licenses are granted for finite periods.
Most of our licenses are granted for specified terms, and we have no assurance that any license will be renewed upon expiration. Licenses due to expire in the medium-to-near term include our mobile telecommunications licenses in Paraguay (2021, 2022 and 2023) and Colombia (2021 and 2023).
Other licenses due to expire include our license for data transmission and DTH services in Honduras (2022 and 2024) and concessions to operate telephone services and pay-TV services in Panama (2022 and 2024). In Tanzania, our national and international applications services licenses are due to expire in 2022 and 2020, respectively.
Licenses may contain additional obligations.
Licenses may contain additional obligations, including payment obligations, requirements to cover reduced service areas or permit a more limited scope of service (for example, around prisons in El Salvador and Honduras). The cost of extending coverage to reduced service areas may exceed the revenue generated from providing such services. In addition, increased regulations may impose additional obligations on operators and these obligations may affect the retention and renewal of licenses or spectrum. For more information, see “Item 4. Information on the Company—B. Business Overview—Regulation.”
|
d.
|
Quality and resilience of networks and service
|
Equipment and network systems failures, including as a result of a natural disaster, sabotage or terrorist attack, could negatively impact our business.
Our business is dependent on certain sophisticated critical systems, including exchanges, switches, fiber, cable headends, data centers and other key network elements, physical infrastructure and billing and customer service systems. Our technological infrastructure is vulnerable to damage and disruptions from numerous events, including fire, flood, windstorms and other natural disasters, power outages, terrorist acts, equipment and system failures, human errors and intentional wrongdoings, including breaches of our network and information technology security. Ongoing risks to our network include state sponsored censorship, sabotage, theft and poor equipment maintenance.
Inability to manage a crisis could harm our brand and lead to increased government obligations in the future.
Telecommunications networks provide essential support to first responders and government authorities in the event of natural disasters, terrorist attacks and other similar crises. If we fail to develop and implement detailed business continuity and crisis management plans, we may be unable to provide service at the level that is required or perceived to be required by the government, the regulator, our customers and by the public at large, and this could lead to new and burdensome regulatory obligations in the future.
|
e.
|
Regulation
|
The telecommunications and broadcasting market is heavily regulated.
The licensing, construction, ownership and operation of mobile telephone, broadband and cable TV networks, and the grant, maintenance and renewal of the required licenses or permits, as well as radio frequency allocations and interconnection arrangements, are regulated by national, state, regional or local governmental authorities in the markets in which we operate, which can lead to disputes with government regulators. For example, the Colombian regulator previously challenged Colombia Móvil’s license fee, stating that it should be a significantly higher amount than we had recorded, although Colombia Móvil prevailed.
In addition, certain other aspects of mobile telephone operations, including rates charged to customers, resale of mobile telephone services, and user registrations may be subject to public utility regulation in each market. Additionally, because of our market share, regulators could impose asymmetric interconnection or termination rates, which could undermine our competitive position in the markets in which we operate.
Changes in regulations may subject us to legal proceedings and regulatory actions and may disrupt our business activities.
For example, since 2014, mobile operators in El Salvador and Honduras have been required to shut down services or reduce signal capacity in and around prisons. Similar laws have been enacted in Guatemala, although these were later nullified.
Regulations which make it commercially unviable to subsidize our mobile customers’ handsets, or set an expiry date on when our customers must use their prepaid minutes, data or SMS bundles, could reduce revenue and margins for mobile services. For example, in 2015, the regulator in Colombia determined that handsets and telecommunication services cannot be bundled and must be invoiced separately. This had a direct impact on handset affordability and caused a sharp decline in our handset sales. In 2016, the regulator in Paraguay extended the unused prepaid data allowance from 30 to 90 days, which impacted the frequency at which a portion of our prepaid customers purchase additional data allowances from us.
I
n 2019, the regulator in El Salvador made a reform to the Consumer Protection Law, which required a change in the telecommunication companies' commercial activities. It demanded the maintenance for up to 90 days of unused data allowances and prohibited automatic renewals, changing our financial results. Additionally, it banned broadcasts, and collection activities outside business hours, impacting our clients' churn trends and payment behavior.
Our Mobile Financial Services (“MFS”) product may be subject to new legislation and regulation.
In most markets in which we have launched MFS, the regulations governing our MFS are new and evolving, and, as they develop, regulations could become more onerous, imposing additional reporting or controls or limiting our flexibility to design new products, which may limit our ability to provide our services efficiently or at all. We may not be able to modify our service provision in time to comply with any new regulatory requirements, or new regulation may be applied retroactively.
For more information on the regulatory environment in the markets in which we operate, see “Item 4. Information on the Company—B. Business Overview—Regulation.”
|
f.
|
Cyber security and data protection
|
Cyber-attacks may cause equipment failures that render our networks or systems inoperable and could cause disruptions to our customers’ operations.
Cyber-attacks, including through the use of malware, computer viruses, dedicated denial of services attacks, credential harvesting, social engineering and other means for obtaining unauthorized access to or disrupting the operation of our networks and systems and those of our suppliers, vendors and other service providers, could have an adverse effect on our business. Cyber-attacks may cause equipment failures as well as disruptions to our or our customers' operations. Cyber-attacks against companies, including Millicom, have increased in frequency, scope and potential harm in recent years. Other businesses have been victims of ransomware attacks in which the business becomes unable to access its own information and is presented with a demand to pay a ransom in order to once again have access to its information.
The inability to operate or use our networks and systems or those of our suppliers, vendors and other service providers as a result of cyber-attacks, even for a limited period of time, may result in significant expenses to Millicom and/or a loss of market share to other communications providers. The
costs associated with a major cyber-attack on Millicom could include expensive incentives offered to existing customers and business partners to retain their business, increased expenditures on cybersecurity measures and the use of alternate resources, lost revenue from business interruption and litigation.
Cyber-attacks could result in data loss or other security breaches.
Our business involves the receipt, storage, and transmission of confidential information, including sensitive personal information and payment card information, confidential information about our employees and suppliers, and other sensitive information about Millicom, such as our business plans, transactions and
intellectual property. Unauthorized access to confidential information may be difficult to anticipate, detect, or prevent. We may experience unauthorized access or distribution of confidential information by third parties or employees, errors or breaches by third party suppliers, or other breaches of security that compromise the integrity of confidential information.
Our control environment and controls may not be sufficient to prevent or rapidly detect and respond to cyber-attacks, or identify the perpetrators of such attacks.
The perpetrators of cyber-attacks are not restricted to particular groups or persons. These attacks may be committed by company employees or external actors operating in any geography, including jurisdictions where law enforcement measures to address such attacks are unavailable or ineffective, and may even be launched by or at the behest of nation states. Cyber-attacks may occur alone or in conjunction with physical attacks, especially where disruption of service is an objective of the attacker.
We collect and process sensitive customer data.
We increasingly collect, store and use customer data that is protected by data protection laws. Data privacy laws and regulations apply broadly to the collection, use, storage, disclosure and security of personal information that identifies or may be used to identify an individual, such as names and contact information. Many countries have additional laws that regulate the processing, retention and use of communications data (both content and metadata), and in some countries, authorities can intercept communications, sometimes directly or without our knowledge. These laws and regulations are subject to frequent revisions and differing interpretations, and have generally become more stringent over time.
Since we may offer certain services accessed by, or provided to customers within, the European Union, we may be subject to the European Union data protection regulation known as the General Data Protection Regulation (GDPR), which imposes significant penalties for non-compliance.
In addition, some of the countries in which we operate are considering or have passed legislation imposing data privacy requirements that could increase the cost and complexity of providing our services. Although we take precautions to protect data, we may fail to do so and certain data may be leaked or otherwise used inappropriately.
|
g.
|
Competition
|
Our industry is experiencing consolidation that may intensify competition among operators.
The telecommunications and cable industry has been characterized by increasing consolidation and a proliferation of strategic transactions. As a result, we are increasingly competing with larger competitors that may have substantially greater resources than we do. We expect this consolidation and strategic partnering to continue. Acquisitions or strategic relationships could harm us in a number of ways. For example:
|
•
|
competitors could acquire or enter into relationships with companies with which we have strategic relationships and discontinue our relationship, resulting in the loss of distribution opportunities for our services or the loss of certain enhancements or value-added features to our services;
|
|
•
|
a competitor could be acquired by a party with significant resources and experience that could increase the ability of the competitor to compete with our services, as was the case in Guatemala and El Salvador recently when America Movil acquired the mobile businesses of Telefonica; and
|
|
•
|
other companies with related interests could combine to form new, formidable competition, which could preclude us from obtaining access to certain markets or content, or which could dramatically change the market for our services.
|
Consumers in our industry can change service providers relatively easily at little to no cost, which renders the competition for subscribers between operators intense.
If new competitors enter into our markets or existing competitors offer more competitively priced products or services, such as eliminating installation fees, subsidizing handsets, modems, wireless routers or set-top boxes or offering content, channels or applications that we do not offer, our customers may move to another operator. Most of our mobile customers are prepaid, which allows them to switch operators at any time without monetary penalty, and some of our cable operator competitors incentivize customers to accept longer contracts, making it difficult to subsequently switch operators.
Some of our customers use devices with dual SIM card capability, allowing them to also utilize our competitors' services, which may negatively affect our mobile revenue. If we are unable to develop strategies to encourage customers to retain us as their primary or sole provider, we could lose a larger percentage of our revenue to our competitors. Mobile number portability in our markets removes a disincentive to changing providers and increases competition and churn. As devices with eSIMs are introduced in our markets, allowing
customers to change providers without changing their SIM cards, churn and pricing competition among providers may also increase.
If we are unable to compete effectively and match or mitigate our competitors' strategies or aggressive competitive behavior, in pricing our services or acquiring new and preferred customers, or if we are unable to develop strategies to encourage customers to retain us as their primary or sole provider, we could suffer adverse revenue impacts or higher costs for customer retention, which could, individually or together, have a material adverse effect on our business, financial condition and results of operations.
Consumers in the telecommunications industry now have many alternative means of communicating.
The proliferation of VoIP offerings and other services delivered over the internet (referred to as “Over-The-Top” or “OTT” services) for voice, instant messaging, and content has significantly increased competitive risk and has driven down revenue from legacy voice and SMS services. While these alternative communication methods require usage of data, there are no guarantees that consumers will use our networks to obtain data services.
|
h.
|
Environment and sustainability
|
Failure to comply with environmental requirements could result in monetary fines, reputation damage or other obligations.
Certain of our business operations are subject to environmental laws and regulations since they involve fuel consumption, carbon dioxide emission, and disposal of network equipment and old electronics. Environmental requirements have become more stringent over time and pending or proposed new regulations could impact our operations or costs.
|
i.
|
Supplier management
|
We are dependent on key suppliers to provide us with products and devices.
We rely on handset distributors, manufacturers and application developers to provide us with the handsets, hardware and services demanded by our customers. The key suppliers of our handsets and set-top boxes, in terms of both volume of sales and importance to our operations, are Samsung, Huawei, Apple, Motorola, BMobile, Commscope, and Kaon. We import directly, or we source our handsets through resellers in our markets such as Brightstar Corp.
We are dependent on key suppliers to provide us with networks and systems.
We seek to standardize our network equipment to ensure compatibility, ease equipment replacement and reduce downtime of our network and contract with a limited number of international suppliers to achieve economies of scale, which means that we rely on a limited number of manufacturers to provide network and telecommunications equipment and technical support. The key suppliers of equipment and software for our existing networks are Huawei, Ericsson, Commscope, Harmonic, Intraway, Oracle and VMWare.
We have limited influence over these key suppliers and, even less over their suppliers and continuity of their supply chains, which could be disrupted in many ways. Therefore we cannot assure you that we will be able to obtain required products or services on favorable terms or at all.
International actions including trade sanctions could disrupt or otherwise negatively impact our supply chain.
In May 2019, the U.S. government announced executive action that could impact our ability to continue obtaining products or services required to operate our networks from suppliers such as Huawei. In November 2019, the U.S. Department of Commerce issued a proposed rule which does not specifically ban all purchases from these suppliers. The proposed rule has not been finalized yet. Although the extent and potential consequences of this proposed rule remain uncertain, it may have a material and adverse effect on our ability to maintain and expand our networks and business. There are a number of alternative suppliers available to us; however, if we are unable to obtain adequate alternative supplies of equipment or technical support in a timely manner, on acceptable commercial and pricing terms, our ability to maintain and expand our networks and business may be materially and adversely affected.
We rely on interconnection and capacity agreements, the terms of which could be made less favorable due to market participants or regulatory changes.
Interconnection and capacity agreements are required to transmit voice and data to and from our networks. Our ability to provide services would be hampered if our access to local interconnection and international capacity was limited, or if the commercial terms or costs of interconnect and capacity agreements with other local, domestic and international carriers of data and communications were significantly altered, or if an operator is not able to provide interconnection due to operation and maintenance issues or natural disasters.
We depend upon certain third parties to operate and maintain parts of the networks we use, including certain towers and network infrastructure, and related services.
We have sold and leased back a significant number of our towers, including in El Salvador, Colombia, Tanzania and Paraguay, as further discussed under “Item 4. Information on the Company—D. Property, Plant and Equipment—Tower infrastructure,” and we may engage in similar transactions in the future in our other markets.
We have entered into managed services agreements in certain of our markets to outsource the maintenance and replacement of our network equipment. Although the contracts impose performance obligations on the operators and tower management companies, we cannot guarantee that they will meet these obligations or implement remedial action in a timely manner, which may result in these towers or networks not being properly operated. If our managed services agreements terminate, we may be unable to find a cost-effective, suitable alternative provider and we may no longer have the necessary expertise in-house to perform comparable services.
We and our customers are dependent on third party suppliers of electricity to power transmission and customer premise equipment.
Significant failure or disruption in the supply of power to the businesses and households that subscribe to our services, or to the data centers that we operate, could have a negative impact on the experience of our customers, which could result in claims against us for failure to provide services and reduce our revenue.
|
2.
|
Risks related to Millicom’s business in the markets in which we operate
|
|
a.
|
Emerging Market Risks
|
Most of our operations are in emerging markets that may be subject to greater risks than more developed markets, including in some cases significant political, legal and economic risks.
Emerging market governments and judiciaries often exercise broad, unchecked discretion, and are susceptible to abuse and corruption and rapid reversal of political and economic policies on which we depend. Political and economic relations among the countries in which we operate are often complex and have resulted, and may in the future result, in conflicts, which could materially harm our business.
The economies of emerging markets are vulnerable to market downturns and economic slowdowns elsewhere in the world. As has happened in the past, financial problems or an increase in the perceived risks associated with investing in emerging economies could dampen foreign investment in these markets and materially adversely affect their economies.
Turnover of political leaders or parties in emerging markets as a result of a scheduled election upon the end of a term of service or in other circumstances may also affect the legal and regulatory regime in those markets to a great extent than turnover in established countries. Some of the emerging markets in which we operate are susceptible to social unrest, which may lead to military conflict in some cases.
|
b.
|
Strategy and strategic direction
|
We may not be able to successfully implement our strategic priorities.
Our strategic priorities include, among others, expansion of our high-speed data networks (4G and HFC cable), facilitation of growth in our mobile data and cable segments and implementation of technology transformation projects to improve our operating performance and efficiency. There can be no assurance that our strategy will be successfully implemented and will not cause changes in our operational efficiencies or structure. In addition, the implementation of our strategic priorities could result in increased costs, conflicts with employees, local shareholders and other stakeholders, business interruptions and difficulty in recruiting and retaining key personnel.
Lack of sufficient information or poor quality of available information regarding our industry, operations or markets may lead to missed opportunities or inefficient capital allocation.
As the factors we consider in formulating our strategy change (including information, such as customer data insights or new markets into which we may consider entering), we face the risk of not having access to sufficient industry, operational or market data inputs to properly inform our decision-making or needing to rely on poor quality information. There is also a risk that the data to which we have access will be analyzed improperly, if the relevant personnel lack appropriate experience, oversight, or relevant skill sets in data analysis, including through insufficient consideration of interrelationships of key variables such as market dynamics, trends, availability of cash and resources, agility, opportunities and risk factors affecting our business. If we are forced to make assumptions regarding key variables and are unable to consider alternatives to, and consequences of, strategic decisions on a fully informed basis, it may lead to missed opportunities or inefficient capital allocation that could have an adverse effect on our business, financial condition or results of operations.
|
c.
|
Industry structure, market position and competition
|
We face intense competition from other larger telecommunications and cable and broadband providers.
The markets in which we operate are highly competitive. Our main mobile, cable and broadband competitors include major international and regional telecommunication providers such as America Movil, Telefonica, AT&T and Liberty Latin America. Some of our competitors are state-owned entities. Many of our main competitors have substantially greater resources than we do in terms of access to capital. In some of our markets, our competitors may have access to more spectrum and provide greater or better area coverage, and they may face fewer regulatory burdens than we do.
We have a weaker market position and face a challenging competitive environment in Colombia, our largest market.
Relative to our other markets, the telecommunications sector in Colombia is characterized by having more competitors, including America Movil and Telefonica, which are larger than us, and by having more stringent regulatory conditions. Relative to our other markets, our competitive position is also weaker in Colombia, where we are the third largest mobile operator and the second largest provider of fixed services, as measured by subscribers. Additionally, Novator Partners was recently awarded mobile spectrum and has announced plans to enter the Colombian market. Given the importance of Colombia to our results, if we are unable to sustain or improve our position, this could have a material impact on our consolidated financial results.
Competition is driven by a number of factors, most notably price and increasingly customer experience.
Within our markets, operators compete for customers principally on the basis of price, promotions, services offered, advertising and brand image, quality and reliability of service, mobile coverage and overall customer experience. Price competition is especially significant on mobile services, which represented more than half of our revenue from continuing operations in 2019. Mobile voice, SMS and data are largely commoditized services, as the ability to differentiate these services among operators is limited. Competition has resulted in pricing pressure, reduced margins and profitability, increased customer churn, and in some markets, the loss of revenue and market share.
There may be more mobile operators than the market is able to sustain.
Additional licenses may be awarded in already competitive markets, and regulators may also encourage new entrants by offering them favorable conditions, such as holding spectrum auctions in which certain blocks of spectrum are reserved for new entrants, or by capping the amount of spectrum that existing players can acquire, as in Colombia's 2019 auction.
Entry by new competitors may have a significant disruptive effect on our markets.
New competitors may enter our markets with pricing or other product or service strategies, primarily designed to gain market share, that are significantly more competitive than our offers, leading to, for example, significant price competition and lower margins or increased churn.
In certain of our mobile markets, such as Colombia, our competitors may have a dominant market position.
Having a dominant market position may provide our competitors with various competitive advantages including from economies of scale, access to spectrum, the ability to significantly influence market dynamics and market regulation.
Our competitors may be able to provide better pay-TV services than we are able to provide.
Our pay-TV services compete with other pay-TV services that may offer a greater range of channels to a larger audience, reaching a wider area distribution (especially in rural areas) for a lower price than we charge for our pay-TV services. We also compete with satellite distribution of free-to-air television programming, which viewers can receive by purchasing a satellite dish and a set-top box without any physical cabling. Furthermore, our cable networks are subject to the risk of overbuild and our pay-TV content is subject to the possibility of wireless substitution.
Many of the mobile telecommunications markets in which we operate have high mobile penetration levels, inhibiting growth opportunities.
The markets in which we operate have mobile phone service penetration levels that typically exceed 100% of the population. Although there are some opportunities for further growth, our efforts to develop additional sources of revenue may not be successful. Therefore, high mobile penetration rates could constrain future growth and produce an intensification of pricing pressures on all of our mobile services, which could adversely affect our future profitability and return on investments.
|
d.
|
Customer base and customer experience
|
A significant proportion of our mobile revenue is generated from prepaid customers and is short-term in nature.
Prepaid customers do not sign service contracts and are more likely than postpaid customers to switch mobile operators and take advantage of promotional offers by other operators. Many of our mobile customers also subscribe to short-term packages with lengths of one-day to one-week. As a result, we cannot be certain that prepaid customers or short-term data package customers will continue to use our services in the future. Prepaid customers represented
89%
of our mobile customers as of
December 31, 2019
and generated approximately
54%
of our mobile service revenue and
28%
of our total service revenue during
2019
.
Transition to more subscription-based businesses creates new challenges.
Our transition toward an increasingly subscription-based revenue model has implications for our personnel, systems, and business procedures, as we must dedicate increasing levels of management attention and resources toward managing and mitigating risks related to accounts receivables and collections, as well as billing and customer care. If we are unable to implement and manage the information systems and to properly train our employees, we could experience elevated levels of customer churn and bad debt, which would negatively impact our financial results.
|
e.
|
Political
|
Some of the countries in which we operate have a history of political instability.
Some of the countries in which we operate may be subject to greater political and economic risk than developed countries. Some of the countries in which we operate suffer from political instability, civil unrest, or war-like actions by anti-government insurgent groups. These problems may continue or worsen, potentially resulting in significant social unrest or civil war. For example, El Salvador and Honduras have some of the highest murder rates in the world due to violent crime, and both Nicaragua and Bolivia have recently experienced civil unrest.
Any political instability or hostilities in the markets in which we operate can hinder economic growth and reduce discretionary consumer spending on our services and may result in damage to our networks or prevent us from selling our products and services.
Current and future political or social instability may negatively affect our ability to conduct business.
We face a number of risks as a result of political and social instability in the countries in which we operate, ranging from the risk of network disruption, sometimes resulting from government requests to shut down our networks as well as forced and illegal abuse of our network by political forces, to the need to evacuate some or all of our key staff from certain countries, in which case there is no guarantee that we would be able to continue to operate our business as previously conducted in such countries. Any of these events would adversely affect our results of operations.
|
f.
|
Legal and regulatory
|
The nature of legislation and rule of law in emerging markets may affect our ability to enforce our rights under licenses or contracts or defend ourselves against claims by third parties.
The nature of much of the legislation in emerging markets, the lack of consensus about the scope, content and pace of economic and political reform and the rapid evolution of the legal systems in emerging markets, place the enforceability and, possibly, the constitutionality of, laws and regulations in doubt and result in ambiguities, inconsistencies and anomalies. These factors could affect our ability to enforce our rights under our licenses or our contracts, or to defend our company against claims by other parties.
New or proposed changes to laws or new interpretations of existing laws in the markets in which we operate may harm our business.
We are subject to a variety of national and local laws and regulations in the countries in which we do business. These laws and regulations apply to many aspects of our business. Violations of applicable laws or regulations could damage our reputation or result in regulatory or private actions with substantial penalties or damages. In addition, any significant changes in such laws or regulations or their interpretation, or the introduction of higher standards or more stringent laws or regulations, could have an adverse impact on our business, financial condition, results of operations and prospects. For example, in Colombia in 2017, the regulator introduced caps to wholesale rates on mobile services, which forced us to lower our prices for both voice and data services, and it also cut interconnection rates. In 2016, the regulator in Paraguay required that mobile service providers extend to 90 days, from 30 days previously, the minimum expiration of prepaid mobile data allowances.
Developing legal systems in the countries in which we operate create a number of uncertainties for our businesses.
The legal systems in many of the countries in which we operate are less developed than those in more established markets. This creates uncertainties with respect to many of the legal and business decisions that we make, including, among others, potential for negative changes in laws, gaps and inconsistencies between the laws and regulatory structure, difficulties in enforcement, broad regulatory authority held by telecommunications regulators, and inconsistency and lack of transparency in the judicial interpretation of legislation and corruption in judicial or administrative processes or systems. We may not always have access to efficient avenues for appeal and may have to accept the decisions imposed upon us. For more information concerning the legal proceedings to which we are subject, see “Item 8. Financial Information—A. Consolidated Statements and Other Financial Information—Legal Proceedings.”
|
g.
|
Macro-economic and currency
|
The economies of emerging markets, including those in which we operate, are vulnerable to market downturns and economic slowdowns elsewhere in the world.
Telecommunications in emerging markets in general and in our markets in particular, account for a significant part of gross domestic product (“GDP”) and disposable income. As such, any change in economic activity level may impact our business. Furthermore, as consumers in emerging markets have relatively lower levels of disposable income, the demand for our products and services is significantly exposed to the risk of economic slowdown.
As has happened in the past, financial problems or an increase in the perceived risks associated with investing in emerging economies could dampen foreign investments in these markets and materially adversely affect their economies. An economic downturn, a substantial slowdown in economic growth or deterioration in consumer spending could have an adverse effect on the level of demand for our products and services and our growth. We are particularly susceptible to any deterioration in the economic environment of the countries in which we have our largest operations, namely Colombia, Guatemala, Paraguay, Honduras, Panama and Bolivia.
Changes in economic, political and regulatory conditions in the United States or in U.S. laws and policies governing foreign trade and foreign relations could have an impact on the economies in which we operate.
Any decision taken by the U.S. government that has an impact on the Latin American economy, such as reducing commercial activity between the countries in which we operate and the United States, limiting immigration, increasing interest rates or slowing direct foreign investments, could adversely affect the disposable income of consumers. In addition, a slowdown in the U.S. economy may have an adverse impact on the level of U.S. dollar remittances that form a large part of the GDP of many of the countries in which we operate.
Fluctuations or devaluations in local currencies in the markets in which we operate against our U.S. dollar reporting as well as our ability to convert these local currencies into U.S. dollars to make payments, including on our indebtedness, could materially adversely affect our business, financial condition and results of operations.
A significant amount of our costs, expenditures and liabilities are denominated in U.S. dollars, including capital expenditures and borrowings. We mainly collect revenue from our customers in local currencies, and there may be limits to our ability to convert these local currencies into U.S. dollars. Local currency exchange rate fluctuations in relation to the U.S. dollar may have an adverse effect on our earnings, assets and cash flows. For example, the devaluation of the Colombian peso in the fiscal year 2015 reduced our consolidated revenue by approximately $250 million. To the extent that our operations retain earnings or distribute dividends in local currencies, the amount of U.S. dollars ultimately received by MIC S.A. is also affected by currency fluctuations.
A significant amount of our debt and long-term financial commitments are denominated in U.S. dollars.
Where possible and where financially viable, we borrow in local currency to mitigate the risk of exposure to foreign currency exchange. Our ability to reduce our foreign currency exchange exposure may be limited by a lack of long-term financing in local currency or derivative instruments in the currencies in which we operate. As such, there is a risk that we may not be able to finance local capital expenditure needs or reduce our foreign exchange exposure by borrowing in local currency. For more information, see “Item 11. Quantitative and Qualitative Disclosures About Risk—Foreign currency risk.”
Due to the lack of available financial instruments in many of the countries or currencies in which we operate, we may not be able to hedge against foreign currency exposures.
We had net foreign exchange losses of
$32 million
in fiscal
2019
compared to net foreign exchange losses of
$40 million
in fiscal
2018
and net foreign exchange gains of
$21 million
in fiscal
2017
. At the operational level we seek to match the currencies of our cash inflows and outflows, but while this practice reduces, it does not eliminate, our significant foreign exchange exposure to the U.S. dollar.
The governments of the countries in which our operations are located may impose foreign exchange controls that could restrict our ability to receive funds from the operations.
Substantially all our revenue is generated by our local operations, and MIC S.A. is reliant on its subsidiaries’ and joint ventures’ ability to transfer funds to it. None of the foreign exchange controls that exist in the countries in which our companies operate significantly restrict the ability of our operating companies to pay interest, dividends, technical service fees, and royalty fees or repay loans by exporting cash, instruments of credit or securities in foreign currencies. However, foreign exchange controls may be strengthened, or introduced, which could restrict MIC S.A.’s ability to receive funds.
In addition, in some countries it may be difficult to convert local currency into foreign currency due to limited liquidity in foreign exchange markets. These restrictions may constrain the frequency for possible upstreaming of cash from our subsidiaries to MIC S.A. in the future. These and any similar controls enacted in the future may cause delays in accumulating significant amounts of foreign currency, and increase foreign exchange risk, which could have an adverse effect on our results of operations.
We are exposed to the potential impact of any alteration to, or abolition of, foreign exchange which is “pegged” at a fixed rate against the U.S. dollar.
Any “unpegging,” particularly if the currency weakens against the U.S. dollar, could have an adverse effect on our business, financial condition or results of operations. Currently Bolivia operates a fixed peg to the U.S. dollar.
|
h.
|
Taxation
|
Unpredictable tax systems give rise to significant uncertainties and risks that could complicate our tax planning and business decisions.
The tax laws and regulations in the markets in which we operate are complex and subject to varying interpretations. The tax authorities in the markets in which we operate are often arbitrary in their interpretation of tax laws, as well as in their enforcement and tax collection activities. We cannot be sure that our interpretations are accurate or that the responsible tax authority agrees with our views. Tax declarations are subject to review and investigation by a number of authorities, which are empowered to impose fines and penalties on taxpayers, and in some cases criminal penalties on company personnel. Tax audits may result in additional costs to our group if the relevant tax authorities conclude that entities of the group did not satisfy their tax obligations in any given year. Such audits may also impose additional burdens on our group by diverting the attention of management resources. The outcome of these audits could harm our business, financial condition, results of operations, cash flows or prospects. Many of our operating companies are often forced to negotiate their tax bills with tax inspectors who may assess additional taxes. We are currently addressing tax disputes with the local tax authorities in several jurisdictions, further described under “Item 8. Financial Information—A. Consolidated Statements and Other Financial Information—Legal Proceedings—Tax disputes.”
Adverse decisions of tax authorities or changes in tax treaties, laws, rules or interpretations could have a material adverse effect on our business, results of operations, financial conditions or cash flows.
The organizational structure and business arrangements between the various legal entities in the group may give rise to taxation related risks, including relating to the pricing of services which might be challenged as not being on an arm’s-length basis.
Tax authorities could argue that some of these services are on terms more favorable than those that could be obtained from independent third parties and assess higher taxes or fines in respect of the services MIC S.A. provides.
|
i.
|
Litigation and claims
|
Some of the litigation or claims that we face can be complex, costly, and highly disruptive to our business operations.
From time to time, in the ordinary course of our business, we are involved in legal proceedings. Some of these legal proceedings can be complex, costly, and highly disruptive to our business operations. Certain of these proceedings may be spurious in nature and may demand significant energy and attention from management and other key personnel. The assessment of the outcome of legal proceedings, including our potential liability, if any, is a highly subjective process that requires judgments about future events that are not within our control. The amounts ultimately received or paid upon settlement or pursuant to final judgment, order or decree may differ materially from amounts accrued in our financial statements. In addition, litigation or similar proceedings could impose restraints on our current or future manner of doing business.
|
j.
|
Business conduct
|
We may not be able to fully mitigate the risk of inappropriate conduct by our employees, business partners and counterparties.
Millicom’s employees interact with customers, contractors, suppliers and counterparties, and with each other, every day. All employees are expected to respect and abide by the Company's values and code of conduct, commonly referred to as the “Sangre Tigo” culture. While Millicom takes numerous steps to prevent and detect inappropriate conduct by employees, contractors and suppliers that could potentially harm the Company's reputation, customers, or investors, such behavior may not always be detected, deterred or prevented. The consequences of any failure by employees to act consistently with the “Sangre Tigo” expectations could include litigation, regulatory or other governmental investigations or enforcement actions.
We are subject to anti-corruption and anti-bribery laws.
We are subject to a number of anti-corruption laws in the countries in which we operate and are located, in addition to the Foreign Corrupt Practices Act (“FCPA”) in the United States and the Bribery Act in the United Kingdom. Our failure to comply with anticorruption laws applicable to us could result in penalties, which could harm our reputation and harm our business, financial condition, results of operations, cash flows or prospects. The FCPA generally prohibits covered companies, their officers, directors and employees and their intermediaries from making improper payments to foreign officials for the purpose of obtaining or keeping business and/or other benefits. We operate in countries which pose elevated risks of corruption violations. For example, between 2017 and 2019, the Commission Against Impunity in Guatemala (“CICIG”) and Guatemalan prosecutors pursued investigations that have included the country's telecommunications sector and Comcel, our Guatemalan joint venture. On September 3, 2019, the CICIG's activities in Guatemala were discontinued, after the Guatemalan government did not renew the CICIG's mandate, and it is unclear whether the investigations will continue. If we are not in compliance with anti-corruption laws and other laws governing the conduct of business with government entities and/or officials (including local laws), we may be subject to criminal and civil penalties and other remedial measures. Investigations of any actual or alleged violations of such laws or policies related to us could harm our business, financial condition, results of operations, cash flows or prospects.
Our anti-corruption policies, procedures and internal controls may not be effective in complying with anti-corruption laws.
We regularly review and update our policies and procedures and internal controls designed to provide reasonable assurance that we, our employees, joint ventures, distributors and other intermediaries comply with the anti-corruption laws to which we are subject. However, anti-corruption policies, procedures and internal controls are not always effective against this risk. We cannot assure you that such policies or procedures or internal controls work effectively at all times or protect us against liability under these or other laws for actions taken by our employees, joint ventures, distributors and other intermediaries with respect to our business or any businesses that we may acquire.
Our Mobile Financial Services (“MFS”) service is complex and increases our exposure to fraud and money laundering.
Our MFS product has been developed through different distribution channels and we could be responsible, and we may be liable, for online fraud and problems related to inadequately securing our payment systems. These services involve cash handling, exposing us to risk of fraud and money laundering. We must also keep our customers’ MFS cash in local currency demand deposits in local banks in each market and ensure customers’ access to MFS cash, exposing us to local banking risk.
Anti-money laundering laws are often complex. We endeavor to conform to the highest standards but cannot be certain that we will be able to fully meet all applicable legal and regulatory requirements at all times.
We may incur significant costs from fraud, which could adversely affect us.
Our high profile and the nature of the products and services that we offer make us a target for fraud. Many of the markets in which we operate lack fully developed legal and regulatory frameworks and have low conviction rates for fraudulent activities, decreasing deterrence for such schemes. We have been in the past and may in the future be susceptible to fraudulent activity by our employees or third-party contractors despite having robust internal control systems in place across our operations, which could have a material adverse effect on our results of operations.
We also incur costs and revenue losses associated with the unauthorized or unintended use of our networks, including administrative and capital costs associated with the unpaid use of our networks as well as with detecting, monitoring and reducing incidences of fraud. Fraud also impacts interconnection costs, capacity costs, administrative costs and payments to other carriers for unbillable fraudulent roaming charges. In 2019, our most significant impact from fraudulent activity was caused by data charging bypass, where customers were able to use of data without paying the appropriate charges. Any continued or new fraudulent schemes could have an adverse effect on our business, financial condition and results of operations.
Our risk management and internal controls may not prevent or detect fraud, violations of law or other inappropriate conduct.
If any of our customers, suppliers, or other business partners receive or grant inappropriate benefits or use corrupt, fraudulent or other unfair business practices, we could be subject to legal sanctions, penalties and harm to our reputation. Given our international operations, group structure, and size, our internal controls, policies and our risk management practices may not be adequate in preventing, detecting or responding to any such incidents which could have a material negative impact on our reputation, business activities, financial position and results of operations.
We may be directly or indirectly affected by U.S. or other international sanctions laws, which may place restrictions on our ability to interact with business partners or government officials.
We operate in certain countries in which international sanctions may be imposed by the U.S. or Europe and we may
be required to comply with such sanctions
. Such sanctions may restrict our ability to implement our strategy or conduct our business in the manner in which we expect. For example, in Nicaragua, several government officials and other key actors are currently included on the Specially Designated Nationalities list of the U.S. Office of Foreign Assets Control.
|
k.
|
People, health and safety
|
Threats to the safety of our employees or contractors could affect our ability to provide our services.
Heightened states of danger may exist in certain of the countries in which we operate, including as a result of civil unrest, criminal activity, and the threat of natural or manmade disasters. Such events can pose significant risks to the health and safety of our employees and contractors and may impede or delay our ability to provide service to our customers or potential customers. In those locations, we may incur additional costs to maintain the safety of our personnel, customers, suppliers, and contractors. Despite the precautions, the safety of our personnel, customers, suppliers, and contractors in these locations may continue to be at risk.
Enforcement of standards of safety and the promotion of a culture of safety may not prevent the frequency or severity of health and safety incidents.
Although we implement and provide training on health and safety matters, particularly related to the risks of working on telecommunications towers or on TV poles, there is no guarantee that our employees or our contractors will comply with applicable safety standards. If we fail to implement these procedures or if the procedures we implement are ineffective, we may suffer the loss of, or injury, to our employees or contractors, as well as expose ourselves to possible litigation and reputational harm.
Allegations of health risks related to the use of mobile telecommunication devices and base stations could harm our business.
There have been allegations that the use of certain mobile telecommunication devices and equipment may cause serious health risks. The actual or perceived health risks of mobile devices or equipment could diminish customer growth, reduce network usage per customer, spark product liability lawsuits or limit available financing. In addition, the actual or perceived health risks may result in increased regulation of network equipment and restrictions on the construction of towers or other infrastructure. Each of these possibilities has the potential to seriously harm our business.
|
l.
|
Brand and reputation
|
Failing to maintain our intellectual property rights and the reputation of our brands would adversely affect our business.
Our intellectual property rights, including our key trademarks and domain names, including our Tigo, UNE and Cable Onda brand names, which are well known in the markets in which we operate, are extremely important assets and contribute to our success in our markets. If we are unable to maintain the reputation of and value associated with them, we may not be able to successfully retain and attract customers. Furthermore, our reputation may be harmed if any of the risks described in this “Risk Factors” section materialize. Any damage to our reputation or to the value associated with our Tigo, UNE or Cable Onda brands could have a material adverse effect on our business, financial condition and results of operations.
Impairment of our intellectual property rights would adversely affect our business.
We rely upon a combination of trademark and copyright laws, database protections and contractual arrangements, where appropriate, to establish and protect our intellectual property rights. However, intellectual property rights are especially difficult to protect in many of the markets in which we operate. In these markets, the regulatory agencies charged to protect intellectual property rights are inadequately funded, legislation is underdeveloped, piracy is commonplace, and enforcement of court decisions is difficult. The diversion of our management's time and resources along with potentially significant expenses that could be involved in protecting
our intellectual property rights in our markets, or losing any intellectual property rights, could materially adversely affect our business, financial condition and results of operations.
|
m.
|
Workforce
|
A significant portion of our workforce is represented by labor unions, and we could incur additional costs or experience work stoppages as a result of the renegotiations of our labor contracts.
On average during 2019, approximately 26% of our of our employees (including 41% of our direct workforce in Colombia) participated in collective employment agreements. While we have collective bargaining agreements in place, with subsequent negotiations we could incur significant additional labor costs and/or experience work stoppages which could adversely affect our business operations. In addition, we cannot predict what level of success labor unions or other groups representing employees may have in further organizing our workforce or the potentially negative impact it would have on our operations. Furthermore, our strategic objectives may include divestitures of certain business lines, internal restructuring and other activities that impact employees. We cannot assure you that we will be able to maintain a good relationship with our labor unions and works council. Any deterioration in our relationship with our unions and works council could result in work stoppages, strikes or threats to take such an action, which could disrupt our business and operations materially and adversely affect the quality of our services and harm our reputation.
|
3.
|
Risks related to Millicom’s size and structure
|
|
a.
|
Size - capacity and limitations
|
The amount, structure and obligations connected with our debt could impair our liquidity and our ability to expand or finance our future operations.
As of
December 31, 2019
, our consolidated indebtedness excluding lease liabilities was
$5,972 million
, of which MIC S.A. incurred
$2,773 million
directly, and MIC S.A. guaranteed
$464 million
of indebtedness incurred by its subsidiaries. In addition, at
December 31, 2019
our joint ventures in Guatemala and Honduras had
$1,283 million
of debt excluding lease liabilities which was non-recourse to MIC S.A.. Including lease liabilities, our consolidated indebtedness was
$7,036 million
, excluding our joint ventures in Guatemala and Honduras, which had lease liabilities of
$313 million
.
We may incur additional debt in the future. Although certain of our outstanding debt instruments contain restrictions on the incurring of additional indebtedness, these restrictions are subject to a number of significant qualifications and exceptions and, under certain circumstances, the amount of indebtedness that could be incurred in compliance with these restrictions could be substantial. The acquisition of additional debt could, among other things, require us to dedicate a substantial portion of our cash flow to payments on our debt, place us at a competitive disadvantage compared to competitors who might have less debt, restrict us from pursuing strategic acquisitions or reduce our ability to pay dividends and prevent us from complying with our dividend policy.
We have incurred and assumed, and expect to incur and assume, additional indebtedness in connection with recent acquisitions.
We funded our recent acquisitions in Panama and Nicaragua mainly by incurring additional indebtedness, including through the issuance of a $750 million 6.25% bond in March 25 2019, and the issuance by Cable Onda S.A. ("Cable Onda") of a $600 million 4.5% bond in November 2019.
Our increased indebtedness following consummation of these or other acquisitions could have the effect, among other things, of reducing our flexibility to respond to changing business and economic conditions as well as reducing funds available for capital expenditures, acquisitions, and creating competitive disadvantages for us relative to other companies with lower indebtedness levels.
|
b.
|
Portfolio of operations
|
Most of our operations are in emerging markets and may be subject to greater risks than similar businesses in more developed markets.
Investors in emerging markets should be aware that these markets are subject to greater risks than more developed markets, including in some cases significant political, legal and economic risks. Investors should fully consider the significance of the risks involved in investing in a company with significant operations in emerging markets and are urged to consult with their own legal, financial and tax advisers.
We may pursue acquisitions, investments or merger opportunities, or divestitures of existing operations, which may subject us to significant risks and there is no assurance that we will be successful or that we will derive the expected benefits from these transactions.
We may pursue acquisitions of, investments in or mergers with businesses, technologies, services and/or products that complement or expand our business. Some of these potential transactions could be significant relative to the size of our business and operations. Any such transaction would involve a number of risks and could present financial, managerial and operational challenges, including: diverting management attention from running our existing business or from other viable acquisition or investment opportunities; incurring significant transaction expenses; increased costs to integrate financial and operational reporting systems, technology, personnel, customer base and business practices of the businesses involved in any such transaction with our business; not being able to integrate our businesses in a timely fashion or at all; potential exposure to material liabilities not discovered in the due diligence process or as a result of any litigation arising in connection with any such transaction; and failure to retain key management and other critical employees.
Moreover, we may not be able to successfully complete acquisitions, in light of challenges such as strong competition from our competitors and other prospective acquirers who may have substantially greater resources than we do in terms of access to capital and may be able to pay more than we can with respect to merger or acquisition opportunities, and regulatory approvals required.
We may not realize the benefits anticipated from the Cable Onda acquisition or the Telefonica CAM acquisitions.
In December 2018, we purchased 80% of the shares of Cable Onda and in August 2019, Cable Onda purchased 100% of the shares of Telefonica Moviles Panama, S.A. In May 2019, we purchased 100% of the shares of Telefonía Celular de Nicaragua, S.A. We expect to complete the purchase of 100% of the shares of Telefonica de Costa Rica TC, S.A. (the “Costa Rica Acquisition”) in H1 2020.
The anticipated benefits from these acquisitions are, necessarily, based on projections and assumptions about the performance of the acquired businesses as part of the Millicom Group, which may not materialize as expected or which may prove to be inaccurate. We cannot ensure that these acquisitions will achieve the business growth, profits, cost savings and other synergies or benefits we anticipate, or those benefits may take longer to realize than expected. In addition, we may become liable for unforeseen financial, business, legal, environmental or other liabilities that we may have failed, or were unable, to discover in the course of performing our due diligence investigations that we assumed upon consummation of the acquisitions and that may not be fully offset by the indemnification available to us under the acquisitions agreements.
Divestiture of assets and businesses may not realize expected benefits.
We may seek to divest existing operations and/or investments. Any such divestiture could involve a number of risks and could present financial, managerial and operational challenges including: diverting management attention from running our existing business or from pursuing other strategic opportunities; incurring significant transaction expenses; and the possibility of failing to properly manage or time the exit to achieve an optimal return.
Furthermore, the timing of exit from the divestiture of assets and businesses may not result in optimal returns, and the amount and timing of proceeds may be lower than our initial investment, and or lower the corresponding carrying value on our balance sheet.
Our ability to make significant decisions in certain of our operations may depend in part upon the consent of independent shareholders.
We have local shareholders in our operations in various markets, including subsidiaries that are fully controlled (e.g., in Colombia, Panama and Tanzania) as well as joint-ventures with local entities in which we exercise joint-control (e.g., in Guatemala and Honduras). In these operations, our ability to make significant strategic decisions, receive dividends or other distributions may depend in part upon the consent of independent shareholders, and our operations may be negatively affected in the event of disagreements with or breaches by our partners.
Millicom's central functions provide essential support and services to our operating subsidiaries and joint ventures.
These services include, financing, procurement, technical and management services, business support services (including a shared services center in El Salvador), digital transformation, customer experience, procurement, human resources, legal, information technology, marketing services and advisory services related to the construction, installation, operation, management and maintenance of its networks. If Millicom's central functions were unable to provide these services to our operating subsidiaries and joint ventures on a timely basis and at a level that meets our needs, our operating subsidiaries and joint ventures may be disrupted.
The majority of Millicom's operating subsidiaries and joint ventures operate under the Tigo trademark.
Millicom provides trademark licensing agreements for use of the Tigo trademark and/or Millicom name, which are non-transferable and continue for an indefinite period unless terminated pursuant to the terms of the
agreements. If these trademark license agreements were terminated, our operating subsidiaries and joint ventures may be disrupted.
|
c.
|
Talent acquisition and retention
|
We may be unable to obtain or retain adequate managerial and operational resources.
Our operating results depend, in significant part, upon the continued contributions and capacity of key senior management and technical personnel. Certain key employees possess substantial knowledge of our business and operations. We cannot assure you that we will be successful in retaining their services or that we would be successful in hiring and training suitable replacements without undue costs or delays.
Competition for personnel in our markets and certain central functions is intense due to scarcity of qualified individuals.
We need new competencies for the new businesses and services we launch, including in the digital field where there is heightened competition for talent.
|
d.
|
Financing and cash flow generation
|
MIC S.A. is a holding company and is dependent on cash flow from its operating subsidiaries and joint ventures.
MIC S.A.’s primary assets consist of shares in its subsidiaries and joint ventures and cash in its bank accounts. MIC S.A. has no significant revenue generating operations of its own, and therefore its cash flow and ability to service its indebtedness and pay dividends to its shareholders will depend primarily on the operating performance and financial condition of its subsidiaries and joint ventures and its receipt of funds in the form of dividends or otherwise.
There are legal limits on dividends that some of MIC S.A.’s subsidiaries and joint ventures are permitted to pay. Further, some of our indebtedness imposes restrictions on dividends and other restricted payments, which are described under “Item 5. Operating and Financial Review and Prospects—B. Liquidity and Capital Resources—Financing.”
Our ability to generate cash depends on many factors beyond our control and we may need to resort to additional external financing.
Our ability to generate cash is dependent on our future operating and financial performance. This will be impacted by our ability to successfully implement our business strategy, as well as general economic, financial, competitive, regulatory, and technical elements and other factors beyond our control. If we cannot generate sufficient cash, we may, among other things, need to refinance all or a portion of our debt, obtain additional financing, delay capital expenditure or sell assets.
We require a significant amount of capital to operate and grow our business. We fund our capital needs in part through borrowings in the public and private credit markets. Adverse changes in the credit markets, including increases in interest rates, could increase our cost of borrowing and/or make it more difficult for us to obtain financing for our operations or refinance existing indebtedness. In addition, our borrowing costs can be affected by short- and long-term debt ratings assigned by independent rating agencies, which are based, in significant part, on our performance as measured by customary credit metrics. A decrease in these ratings would likely increase our cost of borrowing and/or make it more difficult for us to obtain financing. A severe disruption in the global financial markets could impact some of the financial institutions with which we do business, and such instability could also affect our access to financing.
In particular, periods of industry consolidation require businesses to raise debt and equity capital to remain competitive. An inability to access capital during such periods could have an adverse effect on our business, financial condition or results of operations.
The cash flow we generate is highly dependent on the dividends we receive from our joint ventures in Guatemala and Honduras.
Our joint ventures in Guatemala and Honduras have historically generated healthy cash flows and paid dividends. For the year ended
December 31, 2019
, the Millicom Group received dividends from these joint ventures totaling
$237 million
, representing our share of the total dividends paid by our joint ventures; and the Millicom Group paid
$268 million
in dividends to its own shareholders during the same year. If the financial condition of these joint ventures deteriorates or if they choose to reduce future dividend payments,or if we fail to diversify our sources of cash flow, our liquidity could suffer.
Our ability to pay dividends to our shareholders or otherwise remunerate shareholders is subject to our distributable reserves and solvency requirements.
Any determination to pay dividends or otherwise remunerate shareholders in the future will be at the discretion of our board of directors (as to interim dividends) and at the discretion of the shareholders at the annual general meeting (the "Annual General Meeting") upon recommendation of the board of directors (as to annual dividends or share repurchases) and will depend upon our results of operations, financial condition, distributable reserves, contractual restrictions, restrictions imposed by applicable law and other factors our board of directors and the shareholders at the Annual General Meeting, respectively, deem relevant.
We are not required to pay dividends on our common shares or otherwise remunerate shareholders and holders of our common shares have no recourse if dividends are not declared. Our ability to pay dividends or otherwise remunerate shareholders may be further restricted by the terms of any of our existing and future debt or preferred securities. Additionally, because we are a holding company, our ability to pay dividends on our common shares is limited by restrictions on the ability of our subsidiaries to pay dividends or make distributions to us, including restrictions on our ability to repatriate funds and under the terms of the agreements governing our indebtedness.
|
4.
|
Risks related to share ownership, governance practices and registration with the SEC
|
|
a.
|
Share price, trading volume and market volatility
|
The price of our common shares might fluctuate significantly, and you could lose all or part of your investment.
Volatility in the market price of our common shares may prevent you from being able to sell our common shares at or above the price at which you purchased such shares. The trading price of our common shares may be volatile and subject to wide price fluctuations in response to various factors, including:
•
market conditions in the broader stock market in general, or in our industry in particular;
•
actual or anticipated fluctuations in our financial and operating results;
•
introduction of new products and services by us or our competitors;
•
entry to new markets or exit from existing markets;
•
issuance of new or changed securities analysts’ reports or recommendations;
•
sales of large blocks of our shares;
•
additions or departures of key personnel;
•
regulatory developments; and
•
litigation and governmental investigations or actions.
These and other factors may cause the market price and demand for our common shares to fluctuate substantially, which may limit or prevent investors from readily selling common shares and may otherwise negatively affect the liquidity of our common shares.
In addition, in the past, when the market price of a stock has been volatile, holders of that stock have often instituted securities class action litigation against the company that issued the stock. If any of our shareholders brought a lawsuit against us, we could incur substantial costs defending the lawsuit. Such a lawsuit could also divert the time and attention of our management from our business.
An active trading market that will provide you with adequate liquidity may not develop.
As of
December 31, 2019
, approximately 95% of our issued and outstanding shares were in the form of Swedish Depository Receipts (“SDRs”) listed on the NASDAQ exchange in Stockholm. We cannot predict the extent to which investors will convert SDRs into common shares or whether the relisting of our common shares on the Nasdaq Stock Market on January 9, 2019 will lead to the development of an active trading market in the U.S. or how liquid that market might become. If an active trading market does not develop in the U.S., you may have difficulty selling the common shares that you purchase, and the value of such shares might be materially impaired.
Future sales of our common shares, or the perception in the public markets that these sales may occur, may depress our share price and future sales of our common shares may be dilutive.
Sales of substantial amounts of our common shares in the public market, or the perception that these sales could occur, could adversely affect the price of our common shares and could impair our ability to raise capital through the sale of shares. In the future, we may issue our shares, among other reasons, if we need to raise capital or in connection with merger or acquisition activity. The amount of our common shares issued in connection with a capital raise or acquisition could constitute a material portion of our then-outstanding share capital. Sales of shares in the future may be at prices below prevailing market prices, thereby having a dilutive impact on existing holders and depressing the trading price of our common stock.
If securities or industry analysts in the United States do not publish research or reports or publish unfavorable research about our business, the price and trading volume of our common shares could decline.
The trading market for our common shares in the United States will depend in part on the research and reports that securities or industry analysts publish about us, our business or our industry. We may not have significant research coverage by securities and industry analysts in the United States. If no additional securities or industry analysts commence coverage of us, or if we fail to adequately engage with analysts or the investor community, the trading price for our shares could be negatively affected. In the event we obtain additional securities or industry analyst coverage in the United States, if one or more of the analysts who covers us downgrades our common shares, their price will likely decline. If one or more of these analysts, or those who currently cover us, ceases to cover us or fails to publish regular reports on us, interest in the purchase of our shares could decrease, which could cause the price or trading volume of our common shares to decline.
|
b.
|
Legal and regulatory compliance and burden
|
The obligations associated with being a public company in the United States require significant resources and management attention.
As a public company in the United States, we incur legal, accounting and other expenses that we did not previously incur. We are subject to the reporting requirements of the Securities Exchange Act of 1934, as amended (the “Exchange Act”), the Sarbanes-Oxley Act, the listing requirements of the Nasdaq Stock Market and other applicable securities rules and regulations. The Exchange Act requires that we file annual and current reports with respect to our business, financial condition and results of operations. The Sarbanes-Oxley Act requires, among other things, that we establish and maintain effective internal controls and procedures for financial reporting.
Furthermore, the need to establish and maintain the corporate infrastructure demanded of a U.S. public company may divert management’s attention from implementing our strategy. We have made, and will continue to make, changes to our internal controls and procedures for financial reporting and accounting systems in order to meet our reporting obligations as a U.S. public company. However, the measures we take may not be sufficient to satisfy these obligations. In addition, compliance with these rules and regulations has increased our legal and financial compliance costs and has made some activities more time-consuming. For example, these rules and regulations make it more expensive for us to obtain director and officer liability insurance.
In addition, changing laws, regulations and standards relating to corporate governance and public disclosure are creating uncertainty for U.S. public companies. These laws, regulations and standards are subject to varying interpretations, in many cases due to their lack of specificity, and, as a result, their application in practice may evolve over time as new guidance is provided by regulatory and governing bodies. This could result in continuing uncertainty regarding compliance matters and higher costs necessitated by ongoing revisions to disclosure and governance practices. If our efforts to comply with new laws, regulations and standards differ from the activities intended by regulatory or governing bodies due to ambiguities related to their application and practice, regulatory authorities may initiate legal proceedings against us.
We are a foreign private issuer and, as a result, are not subject to U.S. proxy rules but are subject to Exchange Act reporting obligations that, to some extent, are more lenient and less frequent than those of a U.S. issuer.
We report under the Exchange Act as a non-U.S. company with “foreign private issuer” status, as such term is defined in Rule 3b-4 under the Exchange Act. Because we qualify as a foreign private issuer under the Exchange Act and although we follow Luxembourg laws and regulations with regard to such matters, we are exempt from certain provisions of the Exchange Act that are applicable to U.S. public companies, including:
|
(i)
|
the sections of the Exchange Act regulating the solicitation of proxies, consents or authorizations in respect of a security registered under the Exchange Act;
|
|
(ii)
|
the sections of the Exchange Act requiring insiders to file public reports of their stock ownership and trading activities and liability for insiders who profit from trades made in a short period of time; and
|
|
(iii)
|
the rules under the Exchange Act requiring the filing with the SEC of quarterly reports on Form 10-Q containing unaudited financial and other specified information, or current reports on Form 8-K, upon the occurrence of specified significant events.
|
Foreign private issuers are required to file their annual report on Form 20-F by 120 days after the end of each fiscal year, while U.S. domestic issuers that are accelerated filers are required to file their annual report on Form 10-K within 75 days after the end of each fiscal year. Foreign private issuers are also exempt from the Regulation Fair Disclosure, aimed at preventing issuers from making selective disclosures of material information. As a result of the above, even though we are contractually obligated and intend to make interim reports available to our stockholders, copies of which we are required to furnish to the SEC on a Form 6-K, and even though we are required to file reports on Form 6-K disclosing whatever information we have made or are required to make public pursuant to Luxembourg law or distribute to our stockholders and that is material to our company, you may not have the same protections afforded to stockholders of companies that are not foreign private issuers.
If we fail to maintain an effective system of internal control over financial reporting, we may be unable to accurately report our financial results or prevent fraud, and investor confidence in our company and the market price of our shares may be adversely affected.
We are subject to reporting obligations under the U.S. securities laws. The SEC, as required by Section 404 of the Sarbanes-Oxley Act, adopted rules requiring every public company to include in its annual report a management report on such company’s internal control over financial reporting containing management’s assessment of the effectiveness of its internal control over financial reporting. In addition, an independent registered public accounting firm must attest to and report on the effectiveness of such company’s internal control over financial reporting except where the company is a non-accelerated filer. We currently are a large accelerated filer.
Our management has concluded that our internal control over financial reporting was effective as of December 31, 2019. See “Item 15. Disclosure Controls and Procedures.” Our independent registered public accounting firm has issued an attestation report as of December 31, 2019. See “Item 15. Controls and Procedures-C. Attestation Report of Independent Registered Public Accounting Firm.” However, if we fail to maintain effective internal control over financial reporting in the future, our management and our independent registered public accounting firm may not be able to conclude that we have effective internal control over financial reporting in accordance with Section 404 of the Sarbanes-Oxley Act. If we fail to achieve and maintain an effective internal control environment, we could suffer material misstatements in our financial statements and fail to meet our reporting obligations, which would likely cause investors to lose confidence in our reported financial information. This could in turn limit our access to capital markets, harm our results of operations, and lead to a decline in the trading price of our shares. Additionally, ineffective internal control over financial reporting could expose us to increased risk of fraud or misuse of corporate assets and subject us to potential delisting from the stock exchange on which we list, regulatory investigations and civil or criminal sanctions. Furthermore, we have incurred and anticipate that we will continue to incur considerable costs, management time and other resources in an effort to continue to comply with Section 404 and other requirements of the Sarbanes-Oxley Act.
We may lose our foreign private issuer status in the future, which could result in significant additional costs and expenses.
As a foreign private issuer, we are not required to comply with the same periodic disclosure and current reporting requirements of the Exchange Act, and related rules and regulations, that apply to U.S. domestic issuers. Under Rule 3b-4 of the Exchange Act, the determination of foreign private issuer status is made annually on the last business day of an issuer’s most recently completed second fiscal quarter and, accordingly, we will make the next determination with respect to our foreign private issuer status based on information as of June 30, 2020.
In the future, we could lose our foreign private issuer status if, for example, a majority of our voting power were held by U.S. citizens or residents and we fail to meet additional requirements necessary to avoid loss of foreign private issuer status. The regulatory and compliance costs to us under U.S. securities laws as a domestic issuer may be significantly higher. Kinnevik’s distribution of its shares of MIC S.A. may contribute to a loss of our foreign private issuer status.
If we are not a foreign private issuer, we will be required to file periodic reports and registration statements on U.S. domestic issuer forms with the U.S. Securities and Exchange Commission, which are more detailed and extensive than the forms available to a foreign private issuer. We will also be required to comply with U.S. federal proxy requirements, and our officers, directors and controlling shareholders will become subject to the short-swing profit disclosure and recovery provisions of Section 16 of the Exchange Act. We may also be required to modify certain of our policies to comply with good governance practices associated with U.S. domestic issuers. Such conversion and modifications will involve additional costs. In addition, we may lose our ability to rely upon exemptions from certain corporate governance requirements on U.S. stock exchanges that are available to foreign private issuers.
|
c.
|
Shareholder protection
|
MIC S.A. is incorporated in Luxembourg, and Luxembourg law differs from U.S. law and may afford less protection to holders of our shares.
The Company is incorporated under and subject to Luxembourg laws. Luxembourg laws may differ in some material respects from laws generally applicable to U.S. corporations and shareholders, including the provisions relating to interested directors, mergers, sales, amalgamations and acquisitions, takeovers, shareholder lawsuits and indemnification of directors. Luxembourg laws governing the shares of Luxembourg companies may not be as extensive as those in effect in the United States, and Luxembourg law and regulations in respect of corporate governance matters might not be as protective of shareholders as state corporation laws in the United
States. Therefore, our shareholders may have more difficulty in protecting their interests in connection with actions taken by our directors and officers or our principal shareholders than they would as shareholders of a corporation incorporated in the United States. For example, neither our Amended and Restated Articles of Association nor Luxembourg law provides for appraisal rights for dissenting shareholders in certain extraordinary corporate transactions that may otherwise be available to shareholders under certain U.S. state laws.
In addition, under Luxembourg law, by contrast to the laws generally applicable to U.S. corporations, the duties of directors of a company are in principle owed to the company only, rather than to its shareholders. It is possible that a company may have interests that are different from the interests of its shareholders. Shareholders of Luxembourg companies generally do not have rights to take action themselves against directors or officers of the company. Directors or officers of a Luxembourg company must, in exercising their powers and performing their duties, act in good faith and in the interests of the company as a whole and must exercise due care, skill and diligence.
Directors have a duty to disclose any personal interest in any contract or arrangement with the company in case such interest would constitute a conflict of interest. If any director has a direct or indirect financial interest in a matter which has to be considered by the board of directors which conflicts with the interests of the company, Luxembourg law provides that such director will not be entitled to take part in the relevant deliberations or exercise his vote with respect to the approval of such transaction. If the interest of such director does not conflict with the interests of the company, then the applicable director with such interest may participate in deliberations on, and vote on the approval of, that transaction. If a director of a Luxembourg company is found to have breached his or her duties to that company, he or she may be held personally liable to the company in respect of that breach of duty. A director may, in addition, be jointly and severally liable with other directors implicated in the same breach of duty.
The ability of investors to enforce civil liabilities under U.S. securities laws may be limited.
MIC S.A. is a Luxembourg public limited liability company (société anonyme) and some of its directors and executive officers are residents of countries other than the United States. Most of the Company’s assets and the assets of some of its directors and executive officers are located outside the United States. As a result, it may not be possible for investors in our securities to effect service of process within the United States upon such persons or the Company or to enforce in U.S. courts or outside the United States judgments obtained against such persons or the Company. In addition, it may be difficult for investors to enforce, in original actions brought in courts in jurisdictions located outside the United States, liabilities predicated upon the civil liability provisions of U.S. securities laws.
We have been advised by our Luxembourg counsel, Hogan Lovells (Luxembourg) LLP that the United States and Luxembourg do not have a treaty providing for reciprocal recognition and enforcement of judgments in civil and commercial matters. Therefore, a final judgment for the payment of money rendered by a federal or state court in the United States based on civil liability which is not subject to appeal or any other means of contestation, and is enforceable in the relevant state will be recognized and enforced against MIC S.A. by a court of competent jurisdiction of Luxembourg, without re-examination of the merits of the case, subject to compliance with the applicable enforcement procedure (exequatur). As set out in the relevant provisions of the Luxembourg New Code of Civil Procedure (Nouveau Code de Procédure Civile) and Luxembourg case law, these conditions are:
|
(i)
|
the foreign court awarding the international judgment has jurisdiction to adjudicate the respective matter under applicable foreign rules of the forum, and such jurisdiction is recognized by Luxembourg private international law;
|
|
(ii)
|
the foreign judgment is enforceable in the foreign jurisdiction;
|
|
(iii)
|
the foreign court has applied the substantive law as designated by the Luxembourg conflict of laws rules, or, at least, the order must not contravene the principles underlying these rules (however, based on case law (T.A. Luxembourg, 10 January 2008, no 111736) as well as legal doctrine, it is not certain that this condition would still be required for an exequatur to be granted by a Luxembourg court);
|
|
(iv)
|
the foreign court has acted in accordance with its own procedural laws;
|
|
(v)
|
the judgment was granted following proceedings where the counterparty had the opportunity to appear, and if appeared, to present a defense; and
|
|
(vi)
|
the foreign judgment does not contravene international public policy (ordre public international) as understood under the laws of Luxembourg.
|
|
d.
|
Corporate governance practices
|
As a foreign private issuer and as permitted by the listing requirements of the Nasdaq Stock Market (“Nasdaq”), we may rely on certain home country governance practices rather than the Nasdaq corporate governance requirements.
As are a foreign private issuer and in accordance with Nasdaq Listing Rule 5615(a)(3), we may comply with home country governance requirements and certain exemptions thereunder rather than complying with certain of the corporate governance requirements of Nasdaq. For more information regarding the Nasdaq corporate governance requirements in lieu of which we follow home country corporate governance practices, see “Item 6. Directors, Senior Management and Employees—C. Board Practices—NASDAQ corporate governance exemptions.”
Luxembourg law does not require that a majority of our board of directors consists of independent directors. While we currently have a board of directors that is independent of the Company (i.e., the board members are not members of management or employees of the Company), our board of directors may in the future include fewer independent directors than would be required if we were subject to Nasdaq Listing Rule 5605(b)(1). In addition, we are not subject to Nasdaq Listing Rule 5605(b)(2), which requires that independent directors regularly have scheduled meetings at which only independent directors are present.
Similarly, we have adopted a compensation committee, but Luxembourg law does not require that we adopt a compensation committee or that such committee be fully independent. As a result, our practice may vary from the requirements of Nasdaq Listing Rule 5605(d), which sets forth certain requirements as to the responsibilities, composition and independence of compensation committees. Luxembourg law does not require that we disclose information regarding third-party compensation of our directors or director nominees. As a result, our practice varies from the third-party compensation disclosure requirements of Nasdaq Listing Rule 5250(b)(3).
In addition, as permitted by home country practice and as included in our amended and restated articles of association, our nomination committee is appointed by the major shareholders of MIC S.A. and is not a committee of the MIC S.A. board of directors. Our practice therefore may vary from the independent director oversight of director nominations requirements of Nasdaq Listing Rule 5605(e).
Furthermore, our amended and restated articles of association do not provide any quorum requirement that is generally applicable to general meetings of our shareholders (other than in respect of general meetings convened for the first time in relation to amendments to the amended and restated articles of association). This absence of a quorum requirement is in accordance with Luxembourg law and generally accepted business practice in Luxembourg. This practice differs from the requirement of Nasdaq Listing Rule 5620(c), which requires an issuer to provide in its bylaws for a generally applicable quorum, and that such quorum may not be less than one-third of the outstanding voting stock. In addition, we may opt out of shareholder approval requirements for the issuance of securities in connection with certain events such as the acquisition of stock or assets of another company, the establishment of or amendments to equity-based compensation plans for employees, a change of control of us and certain private placements. To this extent, our practice will vary from the requirements of Nasdaq Listing Rule 5635, which generally requires an issuer to obtain shareholder approval for the issuance of securities in connection with such events.
A. History and Development of the Company
The Company’s legal name is Millicom International Cellular S.A. The Company uses the Tigo brand in the majority of the countries in which we do business. MIC S.A. is a public limited liability company (société anonyme), organized and established under the laws of the Grand Duchy of Luxembourg on June 16, 1992. The Company’s address is: Millicom International Cellular S.A., 2, Rue du Fort Bourbon, L-1249 Luxembourg, Grand Duchy of Luxembourg. The Company’s telephone number is: +352 27 759 101. The Company’s U.S. agent is: CT Corporation, 111 Eighth Avenue, 13th Floor, New York, New York 10011, United States.
The Millicom Group was formed in December 1990 when Kinnevik, formerly named Industriförvaltnings AB Kinnevik, a company established in Sweden, and Millicom Incorporated, a corporation established in the United States, contributed their respective interests in international mobile joint ventures to form the Millicom Group.
See “Item 4. Information on the Company—B. Business Overview” for historical information regarding the development of our principal business segments in our geographic markets. See “Item 5. Operating and Financial Review and Prospects—B. Liquidity and Capital Resources—Capital expenditures” for a description of our capital expenditures.
The SEC maintains an Internet website that contains reports and other information about issuers, like us, that file electronically with the SEC. The address of that website is www.sec.gov. The Company’s website address is www.millicom.com. The information contained on, or that can be accessed through, the Company’s website is not part of, and is not incorporated into, this Annual Report.
B. Business Overview
Introduction
We are a leading provider of cable and mobile services dedicated to emerging markets. Through our main brands Tigo and Tigo Business™, we provide a wide range of digital services in nine countries in Latin America and two countries in Africa, including high-speed data, cable TV, direct-to-home satellite TV (“DTH” and when we refer to DTH together with cable TV, we use the term “pay-TV”), mobile voice, mobile data, SMS, MFS, fixed voice, and business solutions including value-added services (“VAS”). We provide services on both a business-to-consumer (“B2C”) and a business-to-business (“B2B”) basis, and we have used the Tigo brand in all our markets since 2004.
We offer the following principal categories of services:
|
•
|
Mobile, including mobile data, mobile voice, and MFS to consumer, business and government customers;
|
|
•
|
Cable and other fixed services, including broadband, pay-TV, content, and fixed voice services for residential (Home) customers, as well as voice, data and VAS and solutions to business and government customers.
|
In Latin America, our principal region, we provide both mobile and cable services in eight countries - Bolivia, Colombia, El Salvador, Guatemala, Honduras, Nicaragua, Panama and Paraguay. In addition, we provide cable services in Costa Rica. In Africa, we provide mobile services in Tanzania, and our joint venture with Bharti Airtel provides mobile services in Ghana. In 2018, we completed the divestiture of our operations in Rwanda and Senegal and in 2019 we completed the sale of our operations in Chad. These divestitures are part of a broader effort by us in recent years to improve our financial performance and better invest capital, including by selling underperforming businesses in our Africa segment, which has historically produced lower returns on capital than our Latin America segment.
We conduct our operations through local holding and operating entities in various countries, which are either our subsidiaries (in which we are the sole shareholder or the controlling shareholder) or joint ventures with our local partners. For further details, see note A to our consolidated financial statements. In this Annual Report, our description of our operations includes the operations of all of these subsidiaries and joint ventures.
As of
December 31, 2019
, we provided services to
37.1
million mobile customers, including
10.6
million 4G customers, which we define as customers who have a data plan and use a smartphone to access our 4G network. As of that date, we also had
3.6
million customer relationships with a subscription to at least one of our fixed services. This includes
2.9
million customer relationships on our HFC networks and
0.3
million DTH subscribers. The majority of the remaining customer relationships are served by our legacy copper network.
For the year ended
December 31, 2019
, our revenue was
$4,336 million
and our net loss was
$154 million
. We have approximately 22,000 employees.
Our strategy
Underpinning our strategy is management’s assessment that penetration rates for both mobile and fixed broadband services in our markets are low relative to penetration rates in other markets globally, and that these have potential to increase over time. Based on our own subscriber data and based also on data from the GSMA for Costa Rica, an association representing mobile operators worldwide, mobile broadband penetration rates, as measured by the number of subscribers who use a smartphone to access mobile data services on 4G networks, were approximately
23%
in Nicaragua,
36%
in El Salvador,
38%
in Honduras,
36%
in Guatemala,
38%
in Colombia,
44%
in Paraguay,
45%
in Panama and
58%
in Bolivia as of year-end 2019. Based on our own customer data and market intelligence, fixed broadband penetration rates, as measured by the number of residential broadband customers as a percentage of households in the country, ranged from approximately 10% in Honduras to less than 50% Costa Rica. Based on the expectation that mobile and fixed broadband penetration rates in our markets will gradually rise over time, management has defined an operational strategy based on the following four principal pillars.
Monetizing Mobile Data
Our mobile networks continue to experience rapid data traffic growth, and we are very focused on making sure that incremental traffic translates into additional revenues. Our mobile data monetization strategy is built around several key drivers:
|
•
|
4G/LTE network expansion
: Our 4G networks enable us to deliver high volumes of data at faster speeds in a more cost-efficient manner than with 3G networks. As of
December 31, 2019
, our 4G networks covered approximately
68%
of the population in our markets, a significant increase from coverage of approximately 48% as of December 31, 2016.
|
|
•
|
Smartphone adoption
: More data-capable smartphone devices, particularly 4G/LTE, with a strong device portfolio and strategy to enable our customers to use data services on the move.
|
|
•
|
Stimulating data usage
: More compelling data-centric products and services to encourage our consumers to consume more data, while maintaining price discipline.
|
Building Cable
We are moving quickly to meet the growing demand for high-speed data from residential and business customers alike in our Latin American markets. We are doing this by:
|
•
|
Accelerating our hybrid fiber-coaxial (“HFC”) network expansion
: We are rapidly deploying our high-speed HFC fixed network, and we are complementing our organic network build-out with small, targeted acquisitions. In 2016, we expanded our HFC network to pass an additional 777,000 homes. In 2017, 2018 and 2019, we significantly increased the pace of our network expansion, organically adding approximately 1 million homes-passed per year.
|
|
•
|
Increasing our commercial efforts to fill the HFC network
: As we expand the network, we also deploy commercial resources necessary to begin monetizing our investment by marketing our services to new potential customers. In addition, the HFC network allows us to sell additional services to existing customers that drive ARPU growth over time.
|
|
•
|
Product innovation
: We drive customer adoption by expanding our range of digital services and aggregating third-party content, as well as some exclusive local and international content, enabling us to differentiate ourselves from our competitors. For example, we have agreements with local soccer teams, leagues and sports channels in Bolivia, Costa Rica, El Salvador, Guatemala, Honduras, Paraguay and Panama to air matches exclusively on our pay-TV channels. We are committed to bringing the best content to our customers, and for that we partner with various players in the ecosystem, from studios to Over-the-Top providers (“OTTs”) and sports industry players.
|
Our cable network deployment is also critical to help prepare the company for convergence of fixed and mobile networks and services, a trend we expect will accelerate with the deployment of 5G technology in the future.
Expanding B2B
The expansion of our HFC network as well as the development of state-of-the-art datacenters, analytics and Cloud services is also creating new opportunities for us to target business customers by offering a more complete suite of Information and Communications Technology (“ICT”) services. As of
December 31, 2019
, we had a total of 12 data centers across our Latin America footprint, including 8 datacenters which are certified according international standards.
Our strategy is to selectively evolve our portfolio into ICT-managed services to avoid excessive fragmentation and operational risk, while building the Tigo Business brand and differentiating ourselves through our service model and frontline execution. We believe that the small and medium-size business (“SMB”) segment represents a particularly attractive opportunity for growth, as SMBs digitize their business and operations using digital communications, and implement Cloud and datacenter solutions in line with what we see in more developed markets.
Digital innovation and customer-centricity
We are focusing our digital innovation on products and customer-facing developments that drive user adoption of high-speed data services such as: Tigo Shop, Mi Tigo, Tigo Play and Tigo ONEtv.
Through Tigo ONEtv, our next-generation user experience platform, we bring a cutting-edge pay-TV entertainment experience for our customers, with advanced personalization and recommendations, seamless integration of content across linear and on-demand offerings, and robust multiscreen capabilities. We also provide a superior digital user experience through our Tigo Shop App for prepaid customers, Mi Tigo App for post-paid customers, and MFS App. Our focus remains firmly set on driving the adoption and enjoyment of these digital channels by our customers.
We are evolving our strong commercial distribution network to operate digitally, which we believe will improve both customer experience and operational efficiency. To enable a seamless and integrated experience across sales and care touchpoints, we are implementing a business transformation that interlinks user experience, digital innovation, business processes, and our back-end ICT systems.
We have also adopted and deployed a net promoter score (“NPS”) program, designed to strengthen our customer-centric culture, and we have incorporated NPS into our incentive compensation plan beginning in 2018.
Our services
Our services are organized into two principal categories: Mobile and Cable and other fixed services. In addition, we sell telephone and other equipment, comprised mostly of mobile handsets.
Mobile
In our Mobile category, we provide mobile services, including mobile data, mobile voice, SMS and MFS, to consumers. Mobile is the largest part of our business and generated
52%
of consolidated service revenue (and
59%
of our Latin America segment service revenue) for the year ended
December 31, 2019
and
57%
of our consolidated service revenue (and
63%
of our Latin America segment service revenue) for the year ended
December 31, 2018
.
We provide Mobile services in every country where we operate, except Costa Rica. As of
December 31, 2019
, we had a total of
37.1
million Mobile customers.
Mobile data, mobile voice and SMS
We provide our mobile data, mobile voice and SMS services through 2G, 3G and 4G networks in all our mobile markets. 4G is the fourth generation of mobile technology, succeeding 3G, and it is based on Internet Protocol (IP) technology, as opposed to prior generations of mobile communications which were based on and supported circuit-switched telephone service. Our 4G networks enable us to offer new services to our customers such as video calls and mobile broadband data with richer mobile content, such as live video streaming.
The mobile market has been evolving, with consumption gradually shifting from voice and SMS to data. Our ongoing deployment of 4G networks further supports this evolution to more data-centric usage.
We provide our mobile data, mobile voice and SMS services on both prepaid and postpaid bases. In prepaid, customers pay for service in advance through the purchase of wireless airtime and data access, and they do not sign service contracts. Among various options that our customers can choose from, we offer packages that typically include a combination and voice minutes, SMS and a data allowance, with expiration dates varying in length from a few days up to a few weeks or months. In postpaid, customers pay recurring monthly fees for the right to consume up to a predetermined maximum amount of airtime, SMS and data. In most cases, new postpaid customers sign a service contract with a typical length of one year.
MFS
We provide a broad range of mobile financial services such as payments, money transfers, international remittances, savings, real-time loans and micro-insurance for critical needs. MFS allows our customers to send and receive money, without the need for a bank account. As of
December 31, 2019
, we provided MFS to
8.7
million customers, representing
23.8%
of our mobile customer handset base. As of
December 31, 2019
,
74.0%
of our total MFS customers were in Tanzania (including Zantel), where more than one customer out of two uses our MFS services. MFS remains a growing business in our markets, which complements our product offering and increases customers’ satisfaction and loyalty, reducing our customer churn.
Cable and other fixed services
In our Cable and other fixed services category, we provide fixed services, including broadband, fixed voice and pay-TV, to residential (Home) consumers and to government and business (B2B) customers. Cable and other fixed services generated
47%
of our consolidated service revenue (and
40%
of our Latin America segment revenue) for the year ended
December 31, 2019
and
42%
of our consolidated service revenue (and
36%
of our Latin America segment service revenue) for the year ended
December 31, 2018
.
Home
Our fixed service residential customers (a “customer relationship”) generate revenue for us by purchasing one or more of our three fixed services, pay-TV, fixed broadband, and fixed telephony. We refer to each service that a customer purchases as a revenue generating unit (“RGU”), such that a single customer relationship can have up to three RGUs in countries where we are permitted to sell all three services.
We provide Home services mainly over our HFC network, but we also offer pay-TV services to rural areas via our DTH platform and broadband services using WiMAX and copper-based technologies in some markets. Although most of our customers currently choose to receive broadband speeds of less than 10 Mbps, the HFC networks we are rolling out are based on DOCSIS 3.0 and allow us to offer speeds of up to 150 Mbps on our current infrastructure, which gives us scope to significantly raise our customers’ broadband speeds over time. As we retire analog channels over time, our HFC network infrastructure will eventually allow us to offer speeds of up to 1 Gbps. Some of our markets are also compatible for DOCSIS 3.1, which could enable even higher levels of throughput on our HFC networks. In the future, we may also deploy Fiber-To-The-Home ("FTTH") in some markets.
In Latin America, we provide Home services in every country where we operate. As of
December 31, 2019
, we had
4.3
million connected homes, of which
3.5
million were connected to our HFC network, and we had
8.4
million RGUs, including
6.9
million RGUs on our HFC network. We do not provide Home services in Africa.
We provide our Home services on a postpaid basis, with customers paying recurring monthly subscription fees. In most markets, we offer bundled fixed services, such as our triple-play offering of pay-TV, broadband internet and, where possible, fixed telephone. On average, our Home customers typically contract more than one fixed service from us. In some markets, we also market our services on a convergent basis, bundling both fixed and mobile services, to a very small portion of our total customer base.
B2B fixed
We offer fixed voice and data telecommunications services, managed services and cloud and security solutions to small, medium and large businesses and governmental entities. We offer B2B fixed services in all of the markets in which we operate, both in Latin America and in Africa.
We believe that B2B fixed provides a significant growth opportunity for Millicom driven by the expected rapid growth in the small and medium size businesses segment and by the adoption of cloud information technology, security and new software defined networks. We expect that the ongoing expansion of our HFC networks in Latin America will help to make us more competitive and increase our share of the B2B fixed market over time. In addition, as we expand our fixed networks throughout our markets, we can better compete for large enterprise and government contracts that typically require a national presence, and we will be better placed to offer fixed, mobile and other value-added services, such as cloud-based services and data center capacity. We already see evidence of this in Colombia in Panama, where we have a more extensive fixed network than in our other markets, and where the proportion of revenue we generate from B2B fixed is significantly larger than in our other Latin America countries.
We have already deployed approximately 160,000 kilometers of fiber in our Latin American markets, and we are expanding our product portfolio to deliver more VAS and business solutions, such as cloud-based services and ICT managed services. In 2019, we inaugurated a new Tier 3 certified data center in Honduras, which further strengthened our ability to better serve small and midsize businesses (“SMB”) and large enterprise customers that require robust infrastructure and redundancy to achieve their own operational efficiency goals and meet business continuity needs. We have also established partnerships in the area of hypercloud, virtualization and Internet of Things ("IoT"), to capture the growth in the adoption of the such technologies and help our customers accelerate their digital transformations.
Our markets
Overview
The Millicom Group’s risks and rates of return for its operations are predominantly affected by operating in different geographical regions. We have businesses in two regions: Latin America and Africa, which constitute our two segments. Our Latin America segment includes the Guatemala and Honduras joint ventures as if they were fully consolidated, as this reflects the way our management reviews and uses internally reported information to make decisions about operating matters. Our Africa segment does not include our joint venture in Ghana because our management does not consider it a strategic part of our group. See “Item 5. Operating and Financial Review and Prospects—A. Operating Results—Our Segments.”
|
•
|
Latin America.
The Latin American markets we serve are Bolivia, Colombia, Costa Rica, El Salvador, Guatemala, Honduras, Nicaragua, Panama and Paraguay. We provide Mobile services in each of our Latin American markets, except for Costa Rica, and we provide Cable and other fixed services in each of our Latin American markets.
|
|
•
|
Africa
. The African market we serve is Tanzania, in which we provide Mobile and B2B. Our joint venture with Bharti Airtel provides mobile services in Ghana. We do not provide Cable and other fixed services in our African market.
|
Latin America
For the years ended
December 31, 2019
and
2018
, revenue generated by our Latin America segment was
$5,964 million
and
$5,485 million
, respectively.
We provide mobile services in eight countries in Latin America. As of
December 31, 2019
, we had a total of
39.8
million Mobile customers, a
18.3%
increase from
December 31, 2018
mainly due to the acquisitions of mobile operations in Nicaragua and Panama during the year.
As of
December 31, 2019
, our Cable business had a network that passed
11.8
million homes and had to
4.3
million customer relationships in Latin America.
An important recent trend in the Latin American telecommunications market has been the growth in fixed broadband penetration. We have significantly increased the coverage of our HFC network largely in response to demand for high-speed fixed broadband services. As of
December 31, 2019
, our HFC network passed
11.5
million homes, a
8.5%
increase from
December 31, 2018
(
10.6
million), and had
3.5
million customer relationships, a
11.3%
increase from
December 31, 2018
.
The following chart shows the relative revenue generation of each country in our Latin America segment for
2019
:

The Millicom Group’s Latin America Mobile, Broadband, and Pay-TV Operations(1)
_______________
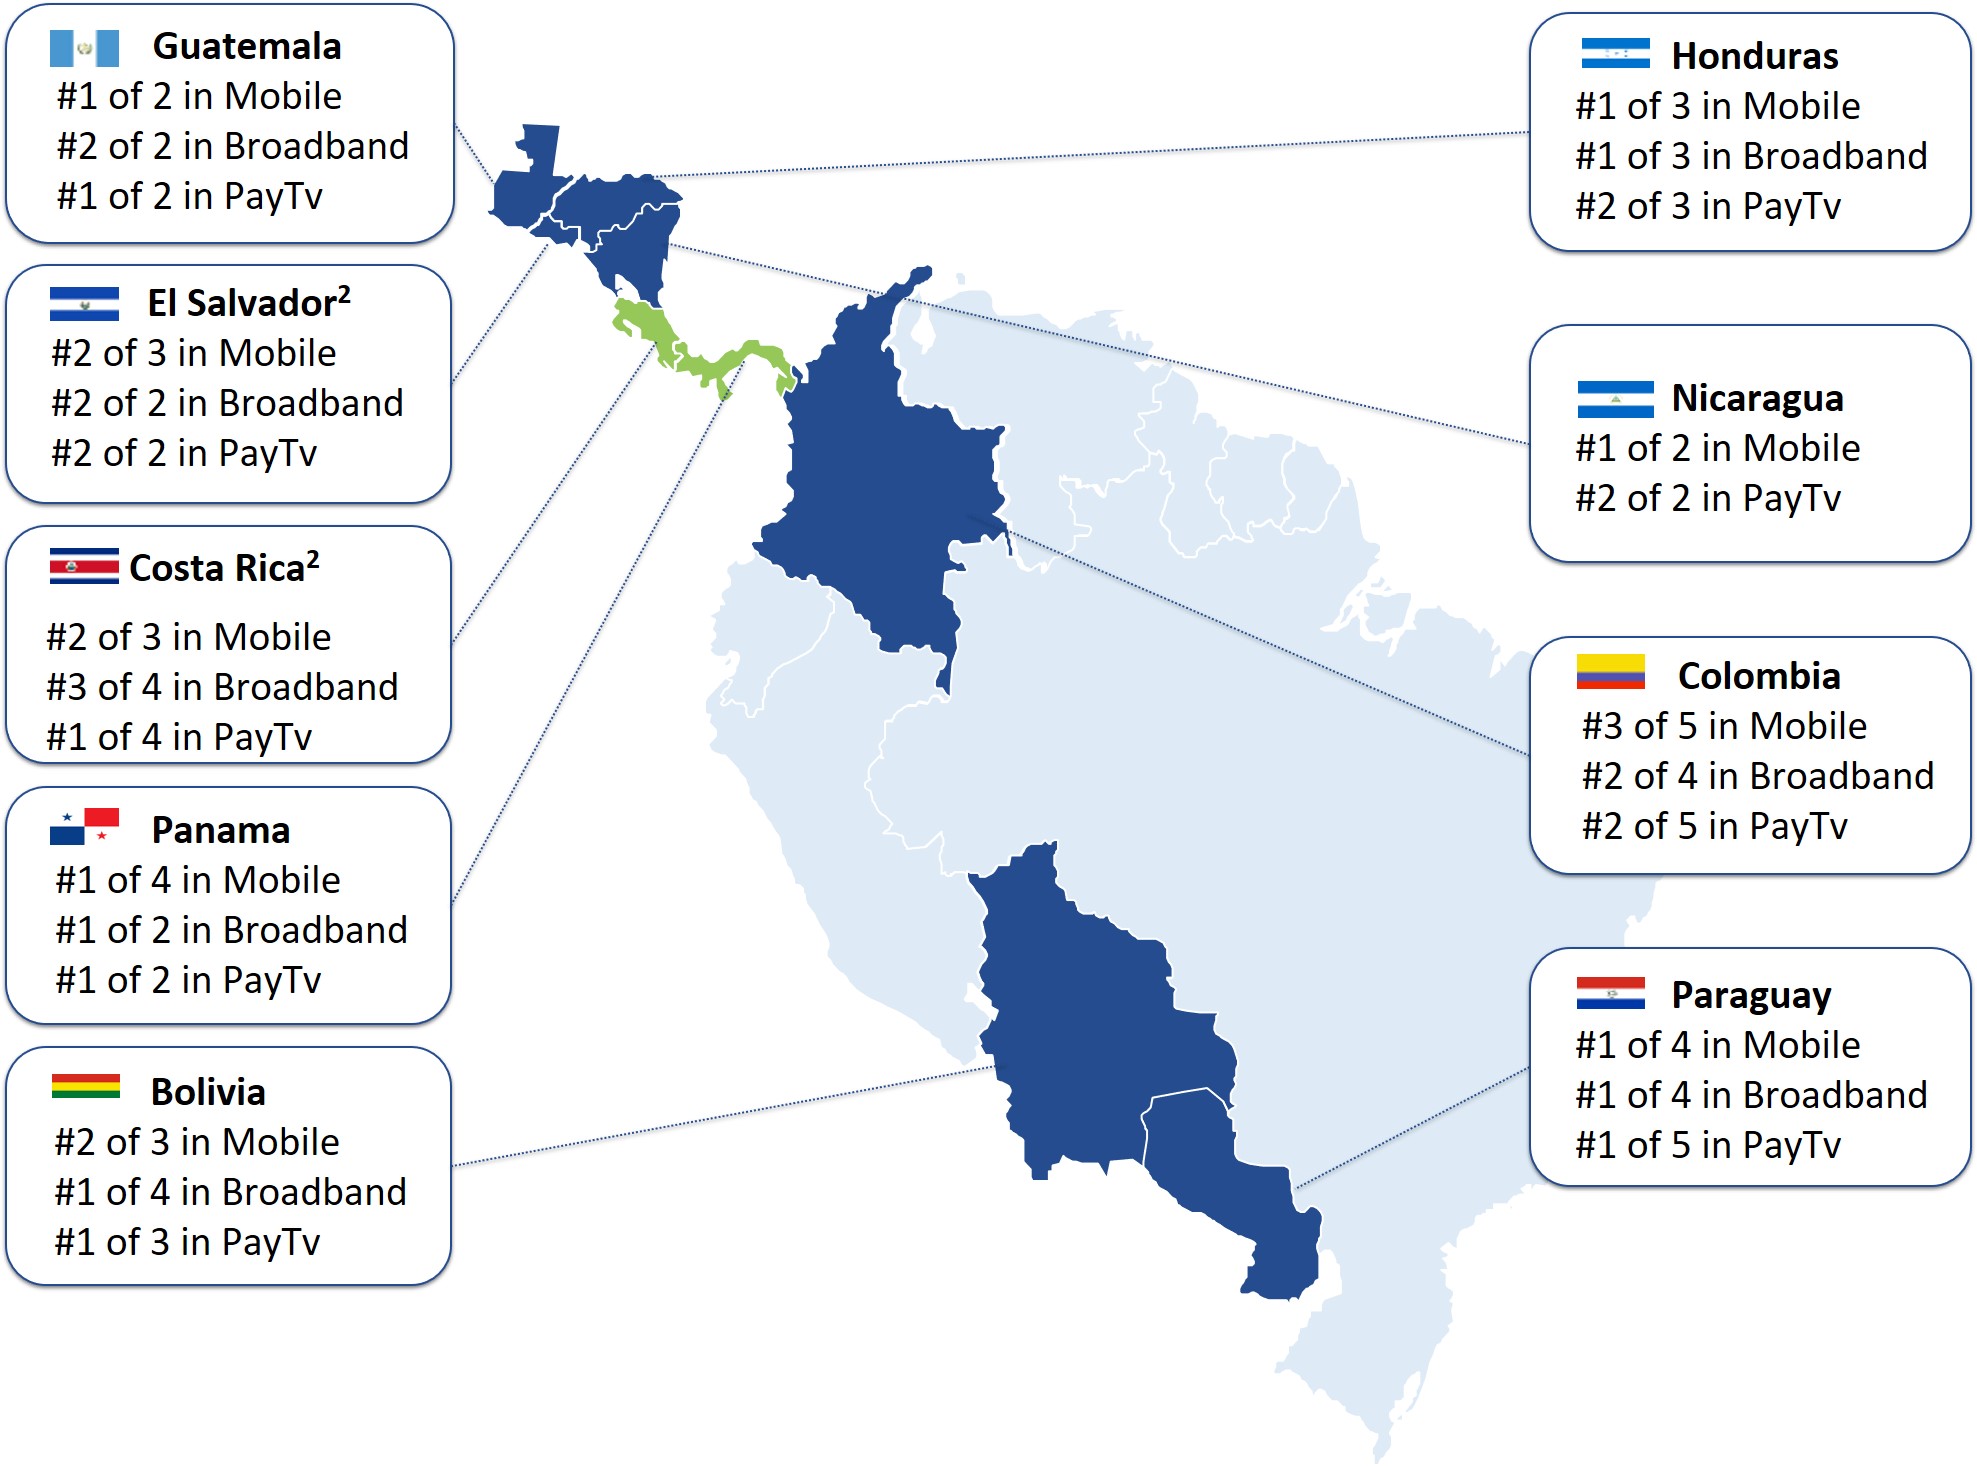
|
(1)
|
The data presented here is based on subscriber numbers as of
December 31, 2019
and reflects the Millicom Group’s experience and our investigation of market conditions. The number of market players in each country is based on large network operators only and excludes minor players, based on total market share by subscribers. The Millicom Group has minority partners in jurisdictions which include: Colombia (50%), Honduras (33%), Guatemala (45%) and Panama (20%).
|
|
(2)
|
Reflects our pending acquisition of Telefonica Costa Rica and America Movil’s pending acquisition in El Salvador.
|
Bolivia
We provide Mobile and Cable and other fixed services through Telefonica Celular de Bolivia S.A. (“Telecel Bolivia”), which is wholly owned by the Millicom Group. We have operated in Bolivia since 1991.
Mobile
: As of
December 31, 2019
, we served
3.7
million subscribers and were the second largest provider of Mobile services in Bolivia, as measured by total subscribers.
Cable and other fixed
: As of
December 31, 2019
, we were the largest provider of broadband and pay-TV services in Bolivia, as measured by subscribers, and we had
510,600
customer relationships. We offer broadband services through HFC, and we provide pay-TV primarily through HFC and DTH in Bolivia. We also offer pay-TV services through Multichannel Multipoint Distribution Service (“MMDS”), but we have been gradually migrating our MMDS customers to HFC, which allows us to provide a better customer experience and to generate additional revenue from each customer we upgrade to HFC.
Colombia
We provide Mobile and Cable and other fixed services in Colombia through Colombia Móvil S.A., which is a wholly-owned subsidiary of UNE, in which we own a 50% plus one voting share interest. We have operated in Colombia through Colombia Móvil S.A. since 2006 and acquired our interest in UNE, with which we had previously co-owned Colombia Móvil S.A., via a merger in 2014. Since the merger, we have been marketing our services using the Tigo and Tigo-UNE brands.
Mobile
: As of
December 31, 2019
, we served
9.4
million subscribers and were the third largest provider of Mobile services in Colombia, as measured by subscribers.
Cable and other fixed services
: Tigo is one of the principal digital cable operators in Colombia. As of
December 31, 2019
, we were the second largest provider of pay-TV and broadband internet services in Colombia, as measured by subscribers, with
1.7
million customer relationships. We have been investing heavily to expand the reach of our HFC network and to upgrade our copper network to HFC. By extending the reach of our HFC network in areas historically served by our copper network, we can gradually migrate our copper customers onto our HFC network, thus significantly enhancing the customer experience by expanding the range of products and services they can choose from, including the availability of faster broadband speeds. In Colombia, we also use DTH to provide pay-TV services to customers located outside of our HFC network coverage area.
Costa Rica
We provide Cable and other fixed services in Costa Rica through Millicom Cable Costa Rica S.A. (“Tigo Costa Rica”), which is wholly owned by the Millicom Group. We have operated in Costa Rica since our acquisition of Amnet in 2008. Amnet and its predecessor companies began operating in Costa Rica in 1982, and the company was the first to provide pay-TV services in the country.
Cable and other fixed services
: As of
December 31, 2019
, we had
255,800
customers and we were the largest provider of pay-TV and the third largest provider of broadband internet services in Costa Rica, as measured by subscribers.
In 2019, we agreed to acquire Telefonica de Costa Rica TC, S.A., the second largest provider of mobile services in the country based on the number of customers.
El Salvador
We provide Mobile and Cable and other fixed services in El Salvador through Telemóvil El Salvador, S.A. de C.V. (“Telemóvil”), which is wholly-owned by the Millicom Group. We have operated in El Salvador since 1993.
Mobile
: As of
December 31, 2019
, we served
2.6
million subscribers and were the second largest provider of Mobile services in El Salvador as measured by subscribers, taking into account America Movil’s announced acquisition in the country.
Cable and other fixed services
: Telemóvil is a leading cable operator in El Salvador. As of
December 31, 2019
, we were the second largest provider of pay-TV and the second largest provider of broadband internet services, as measured by subscribers, with a total of
274,500
customer relationships.
Guatemala
We provide Mobile and Cable and other fixed services in Guatemala, principally through Comunicaciones Celulares S.A. ("Comcel"), a joint venture in which Millicom holds a 55% equity interest. The remaining 45% of Comcel is owned by our local partner. See “Item 5. Operating and Financial Review and Prospects—A. Operating Results—Guatemala and Honduras Joint Ventures” for details regarding the accounting treatment of our Guatemala operations. We have operated in Guatemala since 1990.
Mobile
: As of
December 31, 2019
, we provided Mobile services to
10.8
million customers and were the largest provider of mobile services in Guatemala, as measured by subscribers.
Cable and other fixed services
: As of
December 31, 2019
, our joint venture was the largest provider of pay-TV and the second largest provider of broadband internet services in Guatemala, as measured by subscribers, and it served
519,400
customer relationships with both its HFC network and DTH services.
Honduras
We provide Mobile and Cable and other fixed services in Honduras through Telefonica Celular S.A. de C.V. (“Celtel”), a joint venture in which the Millicom Group holds a 66.67% equity interest. The remaining 33.33% of Celtel is owned by our local partner. See “Item 5. Operating and Financial Review and Prospects—A. Operating Results—Guatemala and Honduras Joint Ventures” for details regarding the accounting treatment of our Honduras operations. We have operated in Honduras since 1996.
Mobile
: As of
December 31, 2019
, we served
4.6
million Mobile subscribers, and we were the largest provider of Mobile services, as measured by subscribers.
Cable and other fixed services
: As of
December 31, 2019
, we were the second largest provider of pay-TV and the largest provider of broadband internet services, as measured by subscribers, with
176,000
customer relationships. We offer triple-play services (cable TV, internet and fixed telephone) using our HFC network in Honduras, and we also offer DTH, expanding the reach of our pay-TV offering to areas not covered by our HFC network. We continue to invest to expand and upgrade the capacity of our HFC network in Honduras.
Nicaragua
In
2019
, we purchased Telefonía Celular de Nicaragua, S.A. ("Telefonía Nicaragua"), the leading provider of Mobile services in the country, based on the number of subscribers. As of
December 31, 2019
, we served
3.4
million mobile subscribers.
Prior to 2019, we had a very small presence in Nicaragua, where we provided mostly B2B fixed services. Since 2018 we also provide Cable services to a small but rapidly-growing customer base.
Panama
We provide Mobile (since 2019) and Cable and other fixed services in Panama through Cable Onda S.A., which is 80% owned by the Millicom Group with the remaining 20% owned by our local partners. We have operated in Panama since our acquisition of Cable Onda in December 2018. Cable Onda and its predecessor companies began operating in Panama in 1982, and the company was the first to provide pay-TV services in the country. In 2019, our Cable Onda subsidiary acquired Telefonica Moviles Panama, S.A. ("Telefonica Panama") and started to provide Mobile services.
Mobile
: As of
December 31, 2019
, we had
1.8
million Mobile subscribers, and we were the largest provider of Mobile services in Panama, as measured by total mobile subscribers.
Cable and other fixed services
: As of
December 31, 2019
,we had
437,300
customer relationships and we were the largest provider of pay-TV and the largest provider of broadband internet services in Panama, as measured by subscribers.
Paraguay
We provide Mobile and Cable and other fixed services in Paraguay through various subsidiaries which are all wholly owned by the Millicom Group. Our largest subsidiary in Paraguay is Telefonica Celular del Paraguay S.A. (“Telecel Paraguay”). We have operated in Paraguay since 1992.
Mobile
: As of
December 31, 2019
, we had
3.5
million Mobile subscribers, and we were the largest provider of Mobile services in Paraguay, as measured by total mobile subscribers.
Cable and other fixed services
: We are the largest provider of pay-TV and broadband internet services in Paraguay as measured by subscribers. As of
December 31, 2019
, we had
436,600
customer relationships with our HFC network, DTH, and, to a much lesser extent, other technologies. We offer pay-TV services primarily using our HFC network, and we use our DTH license to offer pay-TV in areas not reached by our HFC network. We offer residential broadband internet services mostly using our HFC network, but we also employ fixed wireless technology to provide service beyond the reach of our HFC network. We have exclusive rights to broadcast Paraguay’s national league championship games through 2020, and we have exclusive sponsorship rights in telecommunications for the Paraguayan National Soccer Team through 2022.
Africa
For the year ended
December 31, 2019
, the revenue generated by our Africa segment, which consists of our operations in Tanzania, was $
381.9
million. For the year ended
December 31, 2018
, the revenue generated by our Africa segment was $
398.6
million.
As of
December 31, 2019
, we had
12.7
million Mobile customers in Africa. In addition to the African market described below, we own a 50% interest in a joint venture with Bharti Airtel that provides mobile services in Ghana. We do not consider our Ghana joint venture to be a strategic part of our Group.
Tanzania
We provide mostly Mobile services in Tanzania primarily through MIC Tanzania plc ("Tigo Tanzania"), a 98.5% owned subsidiary of the Millicom Group. We have operated in Tanzania since 1994.
On October 22, 2015, we acquired 85% of Zanziber Telecommunications Ltd ("Zantel"), a telecommunications provider operating mainly in Zanzibar, a semi-autonomous region of Tanzania. In 2019, we received approval to combine Tigo Tanzania and Zantel whereby Tigo Tanzania acquired 15% of the remaining shares in Zantel for a consideration representing 1.5% of its own share capital. As a result, the Group's ownership in Tigo Tanzania reduced from 100% to 98.5%, and is now also of 98.5% in Zantel (indirectly).
The Tanzanian government has implemented legislation requiring telecommunications companies to list their shares on the Dar es Salaam Stock Exchange and offer 25% of their shares in a Tanzanian public offering. We are currently planning for the IPO of our Tanzanian operation pursuant to the legislation. We have filed a draft prospectus with the Tanzania Capital
Market and Securities Authority in December 2019, and we await approval of the prospectus to proceed with the mandated IPO. There can be no guarantee if or when such IPO may occur, or the ownership share of our Tanzanian operation that we may sell in the IPO.
Mobile
: As of
December 31, 2019
, Tigo Tanzania had
12.7
million subscribers, including Zantel, and we were the second largest mobile provider in Tanzania, as measured by subscribers.
Regulation
The licensing, construction, ownership and operation of cable TV and mobile telecommunications networks and the grant, maintenance and renewal of cable TV and mobile telecommunications licenses, as well as radio frequency allocations and interconnection arrangements, are regulated by different governmental authorities in each of the markets that Millicom serves. The regulatory regimes in the markets in which Millicom operates are less developed than in other countries such as the United States and countries in the European Union, and can therefore change quickly. See “Item 3. Key Information—D. Risk Factors—2. Risks Related to Millicom's business in the markets in which we operate—F. Legal and regulatory—Developing legal systems in the countries in which we operate create a number of uncertainties for our businesses.”
Typically, Millicom’s cable and mobile operations are regulated by the government (e.g., a ministry of communications), an independent regulatory body or a combination of both. In all of the markets in which Millicom operates, there are ongoing discussions and consultation processes involving other operators and the governing authorities regarding issues such as mobile termination rates and other interconnection rates, universal service obligations, interconnection obligations, spectrum allocations, universal service funds and other industry levies and number portability. This list is not exhaustive; such ongoing discussions are a typical part of operating in a regulated environment.
Changes in regulation can sometimes impose new burdens on the telecommunications industry and have a material impact on our business and on our financial results. For example, beginning in 2014, the government of El Salvador introduced new restrictions on our ability to provide mobile services in specific geographic areas within the country, requesting specifically that our mobile signal not reach inside the country’s incarceration facilities scattered throughout the country. In order to adequately comply with this requirement, we eventually resorted to shutting down more than 10% of our network infrastructure, which significantly reduced traffic on our network and negatively impacted our revenue, profitability, and service quality in the country. Similar laws have been adopted in Honduras and in Guatemala (though later nullified in Guatemala). In 2015, the Colombian regulator introduced new rules that impede the industry’s ability to bundle a subsidized handset with a mobile service contract, thus significantly limiting our ability to attract new mobile customers by offering handsets at subsidized prices, directly impacting handset affordability and causing a sharp decline in our handset sales. In 2016, the regulator in Paraguay introduced new rules that forced us to extend the maturity of unused prepaid data allowances from 30 to 90 days, which had an immediate negative impact on the frequency of top-ups data purchases and a consequent negative impact on our revenue. In 2017, the Colombian regulator lowered mobile interconnection rates and introduced new caps for tariffs on wholesale services. These changes negatively impacted both our revenue and our profitability in Colombia in 2017. The Colombian regulator previously challenged Colombia Móvil’s license fee, stating that it should be a significantly higher amount than we had paid, although Colombia Móvil prevailed. The regulator has sought to nullify an arbitral award in our favor in this matter. In addition, regulators in certain of our markets have reduced interconnection fees, which represented 7% of our revenue in fiscal 2017, and if rates are reduced further or regulators in other markets reduce interconnect fees, these measures could have a material adverse effect on our overall results of operation. For example, in Honduras, from January 2019 mobile interconnection charges were reduced by 25%. Also, in 2019, new regulation enacted in El Salvador regarding the rollover of voice and data traffic affected the Company.
The mobile services we provide require the use of spectrum, for which we have various licenses in each country where we provide mobile services. Spectrum licenses have expiration dates that typically range from 10 to 20 years. Historically, we have been able to renew our licenses upon expiration by agreeing to pay additional fees. We expect to continue to renew our current licenses as they expire, and we expect to acquire new spectrum licenses as they become available in the future. The table below summarizes our most important current spectrum holdings by country for the Latin America region:
|
Country
|
Spectrum
|
Blocks
|
Expiration date
|
|||
|
Bolivia
|
700MHz
|
2x12MHz
|
2028
|
|||
|
Bolivia
|
850MHz
|
2x12.5MHz
|
2030
|
|||
|
Bolivia
|
AWS
|
2x15MHz
|
2028
|
|||
|
Bolivia
|
1900MHz
|
2x10MHz
|
2028
|
|||
|
Colombia*
|
700MHz
|
2x20MHz
|
2040
|
|||
|
Colombia
|
AWS
|
2x15MHz
|
2023
|
|||
|
Colombia
|
1900MHz
|
2x5MHz
|
2029
|
|||
|
Colombia
|
1900MHz
|
2x2.5MHz
|
2021
|
|||
|
Colombia
|
1900MHz
|
2x20MHz
|
2023
|
|||
|
El Salvador
|
850MHz
|
2x12.5MHz
|
2038
|
|||
|
El Salvador
|
AWS
|
2x25MHz
|
2040
|
|||
|
El Salvador
|
1900MHz
|
2x5MHz
|
2041
|
|||
|
El Salvador
|
1900MHz
|
2x5MHz
|
2028
|
|||
|
Guatemala
|
850MHz
|
2x24MHz
|
2032
|
|||
|
Guatemala
|
2600MHz
|
2x10MHz
|
2032
|
|||
|
Guatemala
|
2600MHz
|
1x25 MHz
|
2033
|
|||
|
Guatemala
|
2600MHz
|
1x3.3 MHz
|
2034
|
|||
|
Honduras
|
850MHz
|
2x25MHz
|
2028
|
|||
|
Honduras
|
AWS
|
2x20MHz
|
2028
|
|||
|
Nicaragua
|
700MHz
|
2x20MHz
|
2023
|
|||
|
Nicaragua
|
850MHz
|
2x12.5MHz
|
2023
|
|||
|
Nicaragua
|
1900MHz
|
2x30MHz
|
2023
|
|||
|
Nicaragua
|
AWS
|
2x20MHz
|
2023
|
|||
|
Panama
|
700MHz
|
2x10MHz
|
2036
|
|||
|
Panama
|
850MHz
|
2x12.5MHz
|
2036
|
|||
|
Panama
|
1900MHz
|
2x10MHz
|
2036
|
|||
|
Paraguay
|
850MHz
|
2x12.5MHz
|
2021
|
|||
|
Paraguay
|
700MHz
|
2x15MHz
|
2023
|
|||
|
Paraguay
|
AWS
|
2x15Mz
|
2021
|
|||
|
Paraguay
|
1900MHz
|
2x15MHz
|
2022
|
|||
* Pending legal validation of the auction results.
Below, we provide further regulatory details in respect of certain of our countries of operation in Latin America.
Bolivia
: We hold a license to provide telecommunication services in Bolivia until 2051, mobile service authorization and spectrum licenses until 2030, and cable and VOIP and internet authorizations until 2028.
Colombia
: Colombia Móvil has three separate nationwide spectrum licenses in the 1900 MHz band. In June 2013, Colombia Móvil, acquired spectrum in the AWS (1700/2100 MHz) band, which we use to offer 4G services. In order to reduce the cost and accelerate the deployment of the 4G network, we entered into a network sharing agreement with our competitor, Telefónica Colombia. Colombia Móvil also has an indefinite license (
Habilitación General
) that allows the company to offer several nationwide telecommunication services. In August 2019, the President of Colombia sanctioned the Law of Modernization of the Information Technology and Communications sector which, among other changes, changed the duration of spectrum permits from 10 to 20 years. During 2019, the regulator announced the auction of the 700MHz, 1900MHz and 2500MHz bands, which took place in December 2019, and through which we were awarded the right to use two blocks of 20 MHz in the 700 MHz band. The cable TV license expiring in 2019 was successfully migrated, according to the new Law, to the General Authorization to provide telecommunication services in Colombia.
Costa Rica
: We hold two cable licenses which expire in 2029 and a license to operate telecommunications services which expires in 2024.
El Salvador
: In 2017, Telemóvil successfully renewed all of its spectrum licenses. In December 2019, the regulator completed an auction for AWS spectrum in which we acquired 5 blocks totaling 2x25MHz of bandwidth.
Guatemala
: Comcel operates a nationwide mobile network, and it holds spectrum licenses that expire in 2034. In recent years, the regulator has discussed the possibility of auctioning additional spectrum, but formal plans have not yet been announced.
Honduras
: Celtel owns spectrum licenses in the 850 MHz and AWS bands, and these expire in 2028. In June 2016, the Honduran government approved a multi-band spectrum auction of frequencies in the 700 MHz, 900 MHz and 2500 MHz bands. The auction was initially planned to be conducted by the end of 2017, but the exact terms and timing are still uncertain.
Panama
: We hold three telephone licenses that expire in 2022, two cable TV licenses that expire in 2024, a radio license that expires in 2025 and a commercial data transmission license and an Internet for public access license that expire in 2038.
Paraguay
: We own licenses for four blocks of spectrum in Paraguay, and these give us access to low, mid, and high frequencies, which provide an optimal mix to allow us to offer high-quality network coverage and give us the ability to increase network capacity to meet growing traffic demand needs.
Below, we provide further regulatory details in respect of our operations in Africa.
Tanzania
: Millicom Tanzania has licenses for network facilities services that expire in 2032, national and international network services licenses that expire in 2032 and 2035, respectively, and a license for application services that expires in 2022. In 2019, Millicom Tanzania purchased the right to use 2x10 MHz of spectrum in the 800 MHz band for a period of 15 years and is currently being used to offer 4G services. Zantel has licenses for facilities and network services to use radio frequency spectrum resources that expire in 2031 and application licenses that expire in 2026. Following the acquisition of Zantel by Millicom Tanzania, an application has been made to merge the licenses so they are co-terminus.
Trademarks and licenses
We own or have rights to some registered trademarks in our business, including Tigo®, Tigo Business®; Tigo Sports®, Tigo Music®, Tigo Money®, Tigo OneTv ®, Cable Onda®, Zantel®, Millicom® and The Digital Lifestyle®, among others. Under a number of trademark license agreements and letters of consent, certain operating subsidiaries are authorized to use the Tigo and Millicom trademarks under the applicable terms and conditions.
C. Organizational Structure
The parent company, Millicom International Cellular S.A. ("MIC S.A."), is a Luxembourg public limited liability company (société anonyme). The following table identifies MIC S.A.’s main subsidiaries as of
December 31, 2019
:
|
Entity
|
Country
|
Activity
|
Ownership Interest (%)
|
Voting Interest (%)
|
|
Latin America
|
|
|
||
|
Telemovil El Salvador S.A. de C.V.
|
El Salvador
|
Mobile, MFS, Cable, DTH
|
100
|
100
|
|
Millicom Cable Costa Rica S.A.
|
Costa Rica
|
Cable, DTH
|
100
|
100
|
|
Telefonica Celular de Bolivia S.A.
|
Bolivia
|
Mobile, DTH, MFS, Cable
|
100
|
100
|
|
Telefonica Celular del Paraguay S.A.
|
Paraguay
|
Mobile, MFS, Cable, PayTV
|
100
|
100
|
|
Cable Onda S.A.
|
Panama
|
Cable, PayTV, Internet, DTH, Fixed-line
|
80
|
80
|
|
Telefonica Moviles Panama S.A.
|
Panama
|
Mobile
|
80
|
80
|
|
Telefonia Cellular de Nicaragua S.A.
|
Nicaragua
|
Mobile
|
100
|
100
|
|
Colombia Móvil S.A. E.S.P.
|
Colombia
|
Mobile
|
50-1 share
|
50-1 share
|
|
UNE EPM Telecomunicaciones S.A.
|
Colombia
|
Fixed-line, Internet, PayTV, Mobile
|
50-1 share
|
50-1 share
|
|
Edatel S.A. E.S.P.
|
Colombia
|
Fixed-line, Internet, PayTV, Cable
|
50-1 share
|
50-1 share
|
|
Africa
|
|
|
|
|
|
MIC Tanzania Public Limited Company
|
Tanzania
|
Mobile, MFS
|
98.5
|
98.5
|
|
Zanzibar Telecom Limited
|
Tanzania
|
Mobile, MFS
|
98.5
|
98.5
|
|
Unallocated
|
|
|
|
|
|
Millicom International Operations S.A.
|
Luxembourg
|
Holding Company
|
100
|
100
|
|
Millicom International Operations B.V.
|
Netherlands
|
Holding Company
|
100
|
100
|
|
Millicom LIH S.A.
|
Luxembourg
|
Holding Company
|
100
|
100
|
|
MIC Latin America B.V.
|
Netherlands
|
Holding Company
|
100
|
100
|
|
Millicom Africa B.V.
|
Netherlands
|
Holding Company
|
100
|
100
|
|
Millicom Holding B.V.
|
Netherlands
|
Holding Company
|
100
|
100
|
|
Millicom International Services LLC
|
USA
|
Services Company
|
100
|
100
|
|
Millicom Services UK Ltd
|
UK
|
Services Company
|
100
|
100
|
|
Millicom Spain S.L.
|
Spain
|
Holding Company
|
100
|
100
|
In addition, we provide services in Guatemala primarily through Comcel, a joint venture in which MIC S.A. indirectly holds a 55% equity interest. In Honduras, we provide services through Celtel, a joint venture in which MIC S.A. indirectly holds a 66.67% equity interest. In both Guatemala and Honduras, we entered into our joint ventures at inception of these businesses in the 1990s. At that time, Millicom had limited sources of capital and was investing heavily to deploy mobile operations in many countries around the world; these partners provided local market expertise and reduced Millicom’s overall capital needs. Despite the fact that Millicom owns more than 50% of the shares of these entities and has the right to nominate a majority of the directors of each of these entities, all decisions taken by the boards or the shareholders of these companies must be taken by a supermajority vote. This effectively gives either shareholder the ability to veto any decision and therefore neither shareholder has sole control over either entity.
We also own a 50% interest in Bharti Airtel Ghana Holdings B.V, a joint venture with Bharti Airtel to provide mobile services in Ghana. We entered into our joint venture in Ghana in 2017, when we agreed to combine our operations with those of Bharti Airtel, with the objective of gaining scale and to improve both our competitiveness and the profitability of our business in that country. Millicom has the right to nominate half of the directors of this joint venture, but as with the other joint ventures all decisions taken by the board or the shareholders must be taken by a supermajority vote.
D. Property, Plant and Equipment
Overview
We own, or have the right to access and use through long-term leases, telecommunications sites and related infrastructure and equipment in all of our markets. In addition, we own, or have the right to access and use through long-term finance leases, tower space, warehouses, office buildings and related telecommunications facilities in all of our markets. We are also party to several site sharing agreements whereby we share our owned telecommunications sites and
related infrastructure and equipment, or lease such property from our counterparties in an effort to maximize the use of telecommunications sites globally. Our leased properties are owned by private individuals, corporations and sovereign states.
Assets used for the provision of cable TV and mobile telephone services include, without limitation:
|
•
|
switching, transmission and receiving equipment;
|
|
•
|
connecting lines (cables, wires, poles and other support structures, conduits and similar items);
|
|
•
|
diesel generator sets and air conditioners;
|
|
•
|
real property and infrastructure, including telecommunications towers, office buildings and warehouses;
|
|
•
|
easements and other rights to use or access real property;
|
|
•
|
access roads; and
|
|
•
|
other miscellaneous assets (work equipment, furniture, etc.).
|
Tower infrastructure
In some of our markets, we have determined that owning passive infrastructure, such as mobile telecommunications towers, no longer confers a competitive advantage. As a result, we have completed a number of sale and lease-back transactions involving some of our tower assets in recent years. These transactions have allowed us to focus our capital investment on other fixed assets, such as network equipment, thereby increasing our network coverage, capacity and the overall quality of our service, while also improving our return on invested capital.
We continue to own a significant number of towers in some of our markets, especially in Central America, and we continuously assess the merits of entering into new sale and lease-back agreements, based in part on the competitive dynamics in our markets, but also on demand and investment appetite by tower companies. Our most recent lease-back agreements typically have (i) an initial 12-year term, with a right for us to renew for up to 10 or 20 years, and (ii) rent denominated and payable in local currency.
In 2017 and 2018, Millicom announced agreements to sell and leaseback wireless communications towers in Paraguay, Colombia and El Salvador to subsidiaries of American Tower Corporation and SBA Communications whereby Millicom agreed to the cash sale of tower assets and to lease back a dedicated portion of each tower to locate its network equipment.
The table below summarizes certain key terms of these transactions and their impact on the Millicom Group:
|
Paraguay
|
Colombia
|
El Salvador
|
|||||||
|
Signature date
|
April 26, 2017
|
July 18, 2017
|
February 6, 2018
|
||||||
|
Total number of towers expected to be sold
|
1,411
|
|
1,207
|
|
811
|
|
|||
|
Total number of towers transferred as of December 31, 2019
|
1,411
|
|
960
|
|
547
|
|
|||
|
Expected total cash proceeds ($ millions)
|
127
|
|
147
|
|
145
|
|
|||
|
Cash proceeds received in 2017 ($ millions)
|
75
|
|
86
|
|
—
|
|
|||
|
Cash proceeds received in 2018 ($ millions)
|
41
|
|
26
|
|
74
|
|
|||
|
Cash proceeds received in 2019 ($ millions)
|
11
|
|
8
|
|
3
|
|
|||
|
Gain on sale recognized in 2017 ($ millions) (Note B.2)
|
26
|
|
37
|
|
—
|
|
|||
|
Gain on sale recognized in 2018 ($ millions) (Note B.2)
|
15
|
|
13
|
|
33
|
|
|||
|
Gain on sale recognized in 2019 ($ millions) (Note B.2)
|
—
|
|
3
|
|
2
|
|
|||
For additional information, see note E.4.1. to our audited consolidated financial statements included elsewhere in this Annual Report.
Not applicable.
The following discussion of our financial condition and results of operations should be read in conjunction with our audited financial statements for the years ended
December 31, 2019
,
2018
and
2017
, and the notes thereto, included elsewhere in this Annual Report.
The following discussion contains forward-looking statements that involve risks and uncertainties. Our actual results and the timing of events may differ materially from those expressed or implied in such forward-looking statements as a result of various factors, including those set forth in “Forward-Looking Statements” and “Item 3. Key Information—D. Risk Factors.”
A. Operating Results
Factors affecting our results of operations
Our performance and results of operations have been and will continue to be affected by a number of factors and trends, including principally:
|
•
|
Macro and socio-demographic factors that affect demand for and affordability of our services, such as consumer confidence and expansion of the middle class, as well as foreign currency exchange volatility and inflation which can impact our cost structure and profitability. Growth in GDP per capita and expansion of the middle class makes our services affordable to a larger pool of consumers. The emerging markets we serve tend to have younger populations and faster household formation, and produce more children per family, than developed markets, driving demand for our residential services, such as broadband internet and pay-TV. Digitalization of societies leads to more devices connected per household and more data needs. Exposure to inflationary pressures and foreign currency exchange volatility may negatively impact our profitability or make our services more expensive for our customers; in this respect, see “Item 11. Quantitative and Qualitative Disclosures About Risk—Foreign currency risk.”
|
|
•
|
Competitive intensity, which largely reflects the number of market participants and the financial strength of each
. Competitive intensity varies over time and from market to market. Markets tend to be more price competitive and less profitable for us when there are more market participants, and thus any future increase in the number of market participants in any of our markets would likely have a negative effect on our business.
|
|
•
|
Changes in regulation
. Our business is highly-dependent on a variety of licenses granted by regulators in the countries where we operate. Any changes in how regulators award and renew these licenses could impact our business. In particular, our mobile services business requires access to licensed spectrum, and we expect our business and the mobile industry in general will require more spectrum in the future to meet future mobile data traffic needs. In addition, regulators can impose certain constraints and obligations that can have an impact on how we operate the business and on our profitability. For example, in Colombia in 2017, the regulator introduced caps to wholesale rates on mobile services, which forced us to lower our prices for both voice and data services, and it also cut interconnection rates. In 2016, the regulator in Paraguay required that mobile service providers extend to 90 days, from 30 days previously, the minimum expiration of prepaid mobile data allowances; and in El Salvador, the government required us to shut down certain parts of our network near the country’s incarceration facilities.
|
|
•
|
Technological change
. Our business relies on technology that continues to evolve rapidly, forcing us to adapt and deploy new innovations that can impact our investment needs and our cost structure, as well as create new revenue opportunities. This is true for both our mobile and fixed services. With respect to our mobile services, while we are still deploying 4G networks, the industry is already well advanced in planning for the future deployment of 5G, which we expect will drive continued demand for data in the future. With respect to our fixed services, the cable infrastructure we are deploying, largely based on the DOCSIS 3.0 standard, continues to evolve, and we are continuously evaluating alternatives such as DOCSIS 3.1 and FTTH. Over time, 5G and other mobile technologies may also be considered as viable alternatives for fixed services. In the meantime, an important recent trend in the Latin American telecommunications market has been the growth in fixed broadband penetration. We have significantly increased the coverage of our HFC network largely in response to demand for high-speed fixed broadband services. Technological change is also impacting the capabilities of the equipment our customers use, such as mobile handsets and set-top boxes, and potential change in this area may impact demand for our services in the future.
|
|
•
|
Changes in consumer behavior and needs
. In recent years, consumption of mobile services has shifted from voice and SMS to data services due largely to changes in consumer patterns, including for example the adoption and growth of social media, made possible by new smartphones on 4G networks capable of high quality live video streaming.
|
|
•
|
Political changes.
The countries where we operate are characterized as having a high degree of political uncertainty, and electoral cycles can sometimes impact business investment, consumer confidence, and broader economic activity as well as inflation and foreign exchange rates. Moreover, changes in government can sometimes produce significant changes in taxation and regulation of the telecommunications industry that can have a material impact on our business and financial results.
|
Additional factors and trends affecting our performance and the results of operations are set out in Item 3. Key Information—D. Risk Factors.
Factors affecting comparability of prior periods
Acquisitions
On February 20, 2019 we announced the agreement with Telefonica S.A. to acquire the entire share capital of Telefónica Móviles Panamá, S.A., Telefónica de Costa Rica TC, S.A. (and its wholly owned subsidiary, Telefónica Gestión de Infraestructura y Sistemas de Costa Rica, S.A.) and Telefonía Celular de Nicaragua, S.A. (together, “Telefonica CAM”) for a combined enterprise value of $1,650 million (the “Transaction”) payable in cash.
On May 16, 2019, we acquired 100% of Telefonía Celular de Nicaragua, S.A., the number one mobile operator in Nicacagrua, adding to our existing cable operations. Since the closing date, we have controlled and therefore fully consolidated Telefonía Celular de Nicaragua, S.A. As of December 31, 2019, Telefonía Celular de Nicaragua, S.A. contributed $144 million of revenue and a net profit of
$5 million
.
On August 29, 2019, we acquired 100% of Telefónica Móviles Panamá, S.A., the leading mobile operator in the Panama. The acquisition was made through Millicom's subsidiary, Cable Onda, the leading cable operator in the country. Since the closing date, we have controlled and therefore fully consolidated Telefónica Móviles Panamá, S.A., with a 20% non-controlling interest. As of December 31, 2019, Telefónica Móviles Panamá, S.A. contributed $80 million of revenue and a net profit of
$6 million
.
As of
December 31, 2019
, we had not yet completed the acquisition of Telefónica de Costa Rica TC, S.A. (and its wholly owned subsidiary, Telefónica Gestión de Infraestructura y Sistemas de Costa Rica, S.A.).
On December 13, 2018, we acquired a controlling
80%
stake in Cable Onda, the largest cable and fixed telecommunications services provider in Panama. Pursuant to the terms of the Stock Purchase Agreement, the transaction closed for cash consideration of
$956 million
in addition to which Millicom assumed Cable Onda’s debt obligations, including the Corporate Bonds, of which the aggregate principal amount outstanding was $185 million as of
December 31, 2019
, as well as other indebtedness. Since the closing date, we have controlled and therefore fully consolidated Cable Onda in our financial statements with a 20% non-controlling interest.
In the years ended
December 31, 2019
and
2018
, we also completed certain other minor additional acquisitions. See notes A.1.2. and C.6.3 to our audited consolidated financial statements for additional details regarding our acquisitions and the accounting treatment thereof.
Discontinued operations
As a result of the merger of our business in Ghana with another business, and the resulting change in ownership, as well as the sale of our businesses in Senegal, Rwanda and the Democratic Republic of Congo (“DRC”), those businesses have each been classified as assets held for sale (respectively on September 28, 2017, February 2, 2017, January 23, 2018 and February 8, 2016), and their results have been classified as discontinued operations for all periods presented in our consolidated financial statements included herein. For additional details on our discontinued operations, see notes A.4 and E.3 to our audited consolidated financial statements.
Ghana
On March 3, 2017, we and Bharti Airtel Limited (“Airtel”) announced that we had entered into an agreement for MIC S.A.’s subsidiary Tigo Ghana Limited and Airtel’s subsidiary Airtel Ghana Limited to combine their operations in Ghana. As per the agreement, we and Airtel have equal ownership and governance rights in the combined entity. Necessary regulatory approvals were received in September 2017, and the merger was completed on October 12, 2017.
Senegal
On July 28, 2017, we announced that we had agreed to sell our Senegal business to a consortium consisting of NJJ, Sofima (managed by the Axian Group) and the Teylium Group, subject to customary closing conditions and regulatory approvals. On April 19, 2018, the President of Senegal issued an approval decree in respect of the proposed sale. The sale was completed on April 27, 2018.
Rwanda
On December 19, 2017, we announced that we had signed an agreement for the sale of our Rwanda operations to subsidiaries of Airtel. We received regulatory approvals on January 23, 2018 and the sale was subsequently completed on January 31, 2018.
DRC
On February 8, 2016, Millicom announced that it had signed an agreement for the sale of its businesses in the DRC to Orange S.A. The transaction was completed in respect of the mobile business (Oasis S.A.) on April 20, 2016. The separate disposal of the mobile financial services business (DRC Mobile Cash) was completed in September 2016.
Chad
On March 14, 2019, Millicom announced that it had signed an agreement for the sale of its entire operations in Chad to Maroc Telecom. The transaction was completed on June 27, 2019.
IFRS 16, IFRS 15 and IFRS 9 adoption
IFRS 16 “Leases” was effective for periods starting on January 1, 2019 and has been adopted by the Millicom Group as of that date using the modified retrospective approach with the cumulative effect of applying the new standard recognized in retained profits as of January 1, 2019. For a description of the standard and its impact on the Millicom Group, see “Introduction—New and amended IFRS accounting standards” in the notes to our audited consolidated financial statements.
IFRS 15 “Revenue from contracts with customers” and IFRS 9 “Financial instruments” were effective for annual periods starting on January 1, 2018 and have been adopted by the Millicom Group as of that date using the modified retrospective approach. For a description of the standard and its impact on the Millicom Group, see “Introduction—New and amended IFRS accounting standards” in the notes to our audited consolidated financial statements.
Guatemala and Honduras Joint Ventures
Though we hold majority ownership interests in the entities that conduct each of the Guatemala and Honduras joint ventures, the boards of directors are composed of equal numbers of directors from Millicom and from our respective partners, and the shareholders’ agreements for each entity require unanimous board approval for key decisions relating to the activities of these entities. As such, we have determined that neither party controls the entities, and we therefore account for our investments in these entities as equity method investments.
We report our share of the net income of the Guatemala and Honduras joint ventures in our consolidated statement of income under the caption “Share of profit in our joint ventures in Guatemala and Honduras.”
For additional details on the Guatemala and Honduras joint ventures, see note A.2 to our audited consolidated financial statements.
Comcel, our principal Guatemala joint venture company in which we hold a 55% ownership interest but which we do not control, met the income threshold as a significant investee accounted for by the equity method for purposes of Rule 3-09 of Regulation S-X for the years ended
December 31, 2019
,
2018
and
2017
. As permitted by Rule 3-09, the financial statements for Comcel will be separately provided in an amendment to this Form 20-F.
Our segments
Our management determines operating and reportable segments based on the reports that are used by the chief operating decision maker to make strategic and operational decisions from both a business and geographic perspective. The Millicom Group’s risks and rates of return for its operations are predominantly affected by operating in different geographical regions. The Millicom Group has businesses in two main regions, Latin America and Africa, which constitute our two segments. Our Latin America segment includes the Guatemala and Honduras joint ventures as if they were fully consolidated, as this reflects the way our management reviews and uses internally reported information to make decisions about operating matters and to provide increased transparency to investors on those operations. Our Africa segment does not include our joint venture in Ghana because our management does not consider it a strategic part of our group.
Our customer base
We generate revenue mainly from the mobile and cable and other fixed services that we provide and, to a lesser extent, from the sale of telephone and other equipment. For a description of our services, see “Item 4. Information on the Company—B. Business Overview—Our services.” Our results of operations are therefore dependent on both the size of our customer base and on the amount that customers spend on our services.
We measure the amount that customers spend on our services using a telecommunications industry metric known as ARPU, or average revenue per user per month. We define ARPU for our Mobile customers as (x) the total mobile and mobile financial services revenue (excluding revenue earned from tower rentals, call center, data and mobile virtual network operator, visitor roaming, national third parties roaming and mobile telephone equipment sales revenue) for the period, divided by (y) the average number of Mobile subscribers for the period, divided by (z) the number of months in the period. We define ARPU for our Home customers in our Latin America segment as (x) the total Home revenue (excluding equipment sales, TV advertising and equipment rental) for the period, divided by (y) the average number of customer relationships for the period, divided by (z) the number of months in the period. ARPU is not subject to a standard industry definition and our definition of ARPU may be different to other industry participants.
We provide certain customer data below that we believe will assist investors in understanding our performance and to which we refer later in this section in discussing our results of operations.
Mobile customers by segment
|
As of December 31,
|
|||||||||||
|
2019
|
2018
|
2017
|
|||||||||
|
(in thousands, except where noted)
|
|||||||||||
|
Latin America
|
39,846
|
|
33,691
|
|
33,141
|
|
|||||
|
of which are 4G customers
|
15,398
|
|
10,487
|
|
7,230
|
|
|||||
|
Mobile customer ARPU (in U.S. dollars)
|
$
|
7.3
|
|
$
|
7.9
|
|
$
|
8.2
|
|
||
|
Africa
|
12,686
|
|
12,724
|
|
11,430
|
|
|||||
|
of which are 4G customers
|
865
|
|
456
|
|
261
|
|
|||||
|
Mobile customer ARPU (in U.S. dollars)
|
$
|
2.5
|
|
$
|
2.6
|
|
$
|
2.7
|
|
||
Mobile customers by country in our Latin America segment
|
As of December 31,
|
||||||||
|
2019
|
2018
|
2017
|
||||||
|
(in thousands)
|
||||||||
|
Bolivia
|
3,716
|
|
3,604
|
|
3,433
|
|
||
|
Colombia
|
9,421
|
|
8,601
|
|
8,139
|
|
||
|
El Salvador
|
2,564
|
|
2,590
|
|
2,897
|
|
||
|
Guatemala
|
10,817
|
|
10,941
|
|
10,386
|
|
||
|
Panama
|
1,766
|
|
—
|
|
—
|
|
||
|
Honduras
|
4,639
|
|
4,678
|
|
4,821
|
|
||
|
Nicaragua
|
3,427
|
|
—
|
|
—
|
|
||
|
Paraguay
|
3,496
|
|
3,278
|
|
3,465
|
|
||
Mobile customers by country in our Africa segment
|
As of December 31,
|
||||||||
|
2019
|
2018
|
2017
|
||||||
|
(in thousands)
|
||||||||
|
Tanzania (incl. Zantel)
|
12,686
|
|
12,724
|
|
11,430
|
|
||
Home customers in our Latin America segment
|
As of December 31,
|
|||||||||||
|
2019
|
2018
|
2017
|
|||||||||
|
(in thousands, except where noted)
|
|||||||||||
|
Total homes passed
|
11,842
|
|
11,008
|
|
9,076
|
|
|||||
|
Total customer relationships
|
4,341
|
|
4,133
|
|
3,303
|
|
|||||
|
HFC homes passed
|
11,460
|
|
10,562
|
|
8,446
|
|
|||||
|
HFC customer relationships
|
3,456
|
|
3,103
|
|
2,329
|
|
|||||
|
HFC RGUs
|
6,948
|
|
6,203
|
|
4,367
|
|
|||||
|
Home ARPU (in U.S. dollars)
|
$
|
29.3
|
|
$
|
28.1
|
|
$
|
28.3
|
|
||
Results of operations
We have based the following discussion on our consolidated financial statements included elsewhere in this Annual Report. You should read it along with these financial statements, and it is qualified in its entirety by reference to them. Our results of operations in periods subsequent to
December 31, 2019
will be affected by, among other things, our recent acquisitions and discontinued operations. See “Item 5. Operating and Financial Review and Prospects—A. Operating Results—Factors affecting comparability of prior periods.”
Consolidated results of operations for the years ended
December 31, 2019
and
2018
The following table sets forth certain consolidated statement of income data for the periods indicated:
|
Year ended December 31,
|
Percentage Change
|
|||||||
|
2019 (i)
|
2018 (ii)
|
|||||||
|
(U.S. dollars in millions, except percentages)
|
||||||||
|
Revenue
|
4,336
|
|
3,946
|
|
9.9
|
%
|
||
|
Cost of sales
|
(1,201
|
)
|
(1,117
|
)
|
7.5
|
%
|
||
|
Gross profit
|
3,135
|
|
2,829
|
|
10.8
|
%
|
||
|
Operating expenses
|
(1,604
|
)
|
(1,616
|
)
|
(0.8
|
)%
|
||
|
Depreciation
|
(825
|
)
|
(662
|
)
|
24.5
|
%
|
||
|
Amortization
|
(275
|
)
|
(140
|
)
|
95.9
|
%
|
||
|
Share of profit in our joint ventures in Guatemala and Honduras
|
179
|
|
154
|
|
16.0
|
%
|
||
|
Other operating income (expenses), net
|
(34
|
)
|
75
|
|
NM
|
|
||
|
Operating profit
|
575
|
|
640
|
|
(10.1
|
)%
|
||
|
Interest and other financial expenses
|
(564
|
)
|
(367
|
)
|
53.7
|
%
|
||
|
Interest and other financial income
|
20
|
|
21
|
|
(4.6
|
)%
|
||
|
Other non-operating (expenses) income, net
|
227
|
|
(39
|
)
|
NM
|
|
||
|
Loss from other joint ventures and associates, net
|
(40
|
)
|
(136
|
)
|
(70.3
|
)%
|
||
|
Profit before taxes from continuing operations
|
218
|
|
119
|
|
82.6
|
%
|
||
|
Charge for taxes, net
|
(120
|
)
|
(112
|
)
|
7.2
|
%
|
||
|
Profit for the year from continuing operations
|
97
|
|
7
|
|
NM
|
|
||
|
Profit (loss) for the year from discontinued operations, net of tax
|
57
|
|
(33
|
)
|
NM
|
|
||
|
Net profit (loss) for the year
|
154
|
|
(26
|
)
|
NM
|
|
||
|
(i)
|
IFRS 16 was adopted as of January 1, 2019, using the modified retrospective method; previous periods were therefore not restated and might not be directly comparable. See "Introduction
—
New and amended IFRS accounting standards" in the notes to our audited consolidated financial statements included elsewhere in this Annual Report for additional details regarding the impact of the adoptions.
|
|
(ii)
|
Restated for discontinued operations.
|
Revenue
Revenue increased by
9.9
% for the year ended
December 31, 2019
to
$4,336 million
from
$3,946 million
for the year ended
December 31, 2018
. The increase in revenue was primarily due to additional revenue of
$395 million
related to a full year of Cable Onda's revenue in Panama following the completion of the acquisition in December of 2018, the positive
$144 million
impact from the Nicaragua mobile acquisition in May of 2019 and the positive
$81 million
impact from the Panama mobile acquisition in August of 2019, partially offset by weaker currencies in some of our markets.
Colombia represented over
35%
, Paraguay, Bolivia and Panama each represented between
11%
and
15%
, and no other country represented more than 10% of our consolidated revenue in 2019 and 2018. Panama experienced the highest relative increase in revenues of
$458 million
, as a result of the first full year of operations after the acquisition of Cable Onda in December of 2018, as well as the acquisition of the mobile business in August of 2019. Revenue in Nicaragua increased by
$144 million
due to the acquisition of the mobile business in May of 2019. Revenue in Bolivia grew by
4.2%
due to strong growth in our Cable and other fixed business services. Revenue in Colombia declined by
7.8%
due to a weaker average FX rate for the Colombian Peso. El Salvador revenue declined by
4.5%
as revenue from prepaid mobile services declined in 2019.
Cost of sales
Cost of sales increased by
7.5%
for the year ended
December 31, 2019
to
$1,201 million
from
$1,117 million
for the year ended
December 31, 2018
. The increase was mainly due to the impact of acquisition of mobile operations in Panama and in Nicaragua.
Operating expenses
Operating expenses decreased by
0.8%
for the year ended
December 31, 2019
to
$1,604 million
from
$1,616 million
for the year ended
December 31, 2018
. The decrease was mainly due to lower general and administrative expenses.
Depreciation
Depreciation increased by
24.5%
for the year ended
December 31, 2019
to
$825 million
from
$662 million
for the year ended
December 31, 2018
. The increase was mainly due to the adoption of IFRS 16, which increased depreciation by $
109
million compared to what it would have been if we had continued to follow IAS 17 in the year ended
December 31, 2019
, and the acquistion of our operations in Panama and Nicaragua, which increased depreciation, partially offset by a reduction in depreciation due to weaker currencies, particularly in Colombia and Paraguay.
Amortization
Amortization increased by
95.9%
for the year ended
December 31, 2019
to
$275 million
from
$140 million
for the year ended
December 31, 2018
. The increase was mainly related to our acquisitions in Panama and Nicaragua, which increased amortization by
$129
million for the year ended
December 31, 2019
.
Share of profit in our joint ventures in Guatemala and Honduras
Share of profit in our joint ventures in Guatemala and Honduras increased by
16.0%
for the year ended
December 31, 2019
to
$179 million
from
$154 million
for the year ended
December 31, 2018
. The increase was mainly due to growth of the net profits generated in both Guatemala and Honduras. In Guatemala, the increase in net profits came mostly from increased revenue, lower operating expenses due to lower general and administrative costs during the year, and lower levels of FX losses in the year ended
December 31, 2019
. In Honduras, the increase in net profit was mainly due to an increase in revenues as well as lower levels of FX losses in the year ended
December 31, 2019
.
Other operating income (expenses), net
Other operating income (expenses), net, decreased by $
110
million for the year ended
December 31, 2019
to an expense of
$34 million
from an income of
$75 million
for the year ended
December 31, 2018
. The expense for the year ended
December 31, 2019
was mainly due to a loss from the disposal of equity investments, while the income for the year ended
December 31, 2018
was mainly due to gains registered from the sale of towers in El Salvador, Paraguay and Colombia.
Interest and other financial expenses
Interest and other financial expenses increased by
53.7%
for the year ended
December 31, 2019
to
$564 million
from
$367 million
for the year ended
December 31, 2018
. The increase was mainly due to higher gross debt as a result of incurring debt to fund the acquisitions in Panama and Nicaragua, as well as the adoption of IFRS 16 which added
$72
million to interest expense.
Interest and other financial income
Interest and other financial income decreased by
4.6%
for the year ended
December 31, 2019
to
$20 million
from
$21 million
for the year ended
December 31, 2018
. The slight decrease was mainly due to lower average cash and cash equivalents balances during 2019 as compared to 2018.
Other non-operating (expenses) income, net
Other non-operating (expenses) income, net increased by
$266 million
for the year ended
December 31, 2019
to an income of
$227 million
from an expense of
$39 million
for the year ended
December 31, 2018
. The increase largely reflects a non-cash net loss of
$38 million
related to the revaluation of our stake in Jumia, which completed an initial public offering during 2019 and which is accounted for as a financial asset at fair value and is offset by a net gain of
$312 million
related to the gain from disposal and revaluation of our stake in Helios Towers Africa, which completed an initial public offering during 2019, and which is accounted for as a financial asset at fair value.
Loss from other joint ventures and associates, net
Loss from other joint ventures and associates, net decreased by
70.3%
for the year ended
December 31, 2019
to a loss of
$40 million
from a loss of
$136 million
for the year ended
December 31, 2018
. The decrease was mainly due to the derecognition of Jumia as investment in associates in January. For the year ended December 31, 2018, the Group’s share of results from Jumia and Helios Towers associates was a loss of $66 million. In addition, the decrease was related as well to a lower share of loss from the joint venture in Ghana during 2019 compared to 2018.
Charges for taxes, net
Charges for taxes, net increased by
7.2%
for the year ended
December 31, 2019
to
$120 million
from
$112 million
for the year ended
December 31, 2018
. The increase was mainly due to the inclusion of the Telefonica and Cable Onda operations.
The main components of charges for taxes, net are the income tax generated by most of the operations in our Latin America segment and the withholding tax we pay when cash is upstreamed from our local operations to MIC S.A. We also have net losses mainly in our corporate entities that reduce our profit before taxes and for which no deferred tax asset is recognized due to the history of losses in such entities. As a result, our effective tax rate is generally above our average statutory tax rate. Moreover, due to the jurisdictional differences and mix, we do not have the opportunity to offset tax expense with accumulated tax loss carry-forwards.
Net profit (loss) for the year
Net profit (loss) for the year increased by
$180 million
for the year ended
December 31, 2019
to a profit of
$154 million
from a loss of
$26 million
for the year ended
December 31, 2018
. Profit (loss) for the year from continuing operations increased by
$90 million
for the year ended
December 31, 2019
to a profit of
$97 million
from a profit of
$7 million
for the year ended
December 31, 2018
for the reasons stated above. Profit (loss) for the year from discontinued operations, net of tax increased by
$90 million
for the year ended
December 31, 2019
to a profit of
$57 million
from a loss of
$33 million
for the year ended
December 31, 2018
. The increase in profit (loss) for the year from discontinued operations, net of tax was mainly due to to the complete disposal of our Rwanda and Senegal operations that were included in this line during the first quarter of 2018 as well as the complete disposal of our Chad operations that were included in this line for the entirety of 2018.
Segment results of operations for the years ended
December 31, 2019
and
2018
Our Latin America segment includes the Guatemala and Honduras joint ventures as if they were fully consolidated, as this reflects the way our management reviews and uses internally reported information to make decisions about operating matters. Our Africa segment does not include our joint venture in Ghana because our management does not consider it a strategic part of our group. See “—Our segments” above.
The following table sets forth certain segment data, which has been extracted from note B.3 to our audited consolidated financial statements, where segment data is reconciled to consolidated data, for the periods indicated:
|
Year ended December 31,
|
|||||||||||||||||
|
2019
|
2018
|
Percentage Change
|
|||||||||||||||
|
Latin America
|
Africa
|
Latin America
|
Africa
|
Latin America
|
Africa
|
||||||||||||
|
(U.S. dollars in millions, except percentages)
|
|||||||||||||||||
|
Mobile revenue
|
3,258
|
|
372
|
|
3,214
|
|
|
388
|
|
1.4
|
%
|
(4.0
|
)%
|
||||
|
Cable and other fixed services revenue
|
2,197
|
|
9
|
|
1,808
|
|
|
10
|
|
21.5
|
%
|
(13.1
|
)%
|
||||
|
Other revenue
|
60
|
|
1
|
|
48
|
|
|
1
|
|
25.5
|
%
|
(38.4
|
)%
|
||||
|
Service revenue
|
5,514
|
|
382
|
|
5,069
|
|
|
398
|
|
8.8
|
%
|
(4.2
|
)%
|
||||
|
Telephone and equipment revenue
|
449
|
|
—
|
|
415
|
|
|
—
|
|
8.2
|
%
|
NM
|
|
||||
|
Revenue
|
5,964
|
|
382
|
|
5,485
|
|
|
399
|
|
8.7
|
%
|
(4.2
|
)%
|
||||
|
Operating profit
|
1,006
|
|
24
|
|
995
|
|
|
25
|
|
1.1
|
%
|
(2.6
|
)%
|
||||
|
Add back:
|
|
|
|
||||||||||||||
|
Depreciation and amortization
|
1,435
|
|
99
|
|
1,133
|
|
|
80
|
|
26.7
|
%
|
24.5
|
%
|
||||
|
Other operating income (expenses), net
|
2
|
|
(2
|
)
|
(51
|
)
|
|
(3
|
)
|
NM
|
|
(35.9
|
)%
|
||||
|
EBITDA
|
2,443
|
|
122
|
|
2,077
|
|
|
102
|
|
17.6
|
%
|
19.4
|
%
|
||||
The following table sets forth revenue from continuing operations by country for certain of the countries in our Latin America segment (i):
|
Year ended December 31,
|
Percentage
Change |
|||||||
|
2019
|
2018
|
|||||||
|
(U.S. dollars in millions, except percentages)
|
||||||||
|
Colombia
|
1,532
|
|
1,661
|
|
(7.8
|
)%
|
||
|
Guatemala
|
1,434
|
|
1,373
|
|
4.5
|
%
|
||
|
Panama
|
475
|
|
|
17
|
|
|
nm
|
|
|
Paraguay
|
610
|
|
679
|
|
(10.2
|
)%
|
||
|
Honduras
|
594
|
|
586
|
|
1.4
|
%
|
||
|
Bolivia
|
639
|
|
614
|
|
4.2
|
%
|
||
|
El Salvador
|
387
|
|
405
|
|
(4.5
|
)%
|
||
_____________
|
(i)
|
The revenue figures above are shown before intercompany eliminations.
|
Segment revenue
Revenue of our Latin America segment increased by
8.7%
for the year ended
December 31, 2019
to
$5,964 million
from
$5,485 million
for the year ended
December 31, 2018
. The increase in revenue was due to an increase in our service revenue. The increase in our service revenue was due to an increase in Cable and other fixed services revenue caused by the acquisition of Cable Onda and organic growth driven by the cable business in all of our markets. Additionally, the increase in revenue was due to an increase in Mobile revenue due to the mobile acquisitions in Panama and Nicaragua during 2019. These increases in service revenue were partially offset by a decrease in Mobile organic growth caused by macroeconomic slowdowns as well as increased competition in Bolivia, Paraguay and Guatemala. Our Latin America segment revenue was also negatively impacted by weaker foreign exchange rates in several of the countries which we operate.
Following the disposal of our Chad operations during 2019, our Africa segment operations now consist of Tanzania, including Zantel. Revenue of our Africa segment decreased by
4.2%
for the year ended
December 31, 2019
to $
382
million from $
399
million for the year ended
December 31, 2018
. The decrease was mainly due to the impact of lower interconnection rates as well as increased competition.
Segment operating profit
Operating profit of our Latin America segment increased by
1.1%
for the year ended
December 31, 2019
to
$1,006 million
from
$995 million
for the year ended
December 31, 2018
. The increase was primarily attributable to revenue growth coupled with the positive impact from IFRS 16.
Operating profit of our Africa segment decreased by
2.6%
for the year ended
December 31, 2019
to
$24 million
from
$25 million
for the year ended
December 31, 2018
. The decrease was mainly due to lower revenues and a $21 million regulatory fine.
Segment EBITDA
Segment EBITDA is segment operating profit excluding, depreciation and amortization and other operating income (expenses), net which includes impairment losses and gains/losses on the disposal of fixed assets attributable to the segment. Segment EBITDA is used by the management to monitor the segmental performance and for capital management and is further detailed in note B.3. Segment Information in the consolidated financial statements.
EBITDA of our Latin America segment increased by
17.6%
for the year ended
December 31, 2019
to
$2,443 million
from
$2,077 million
for the year ended
December 31, 2018
. The increase was attributable to including a full year of Cable Onda as well as the inclusion of the mobile acquisitions in Panama and Nicaragua and a $
170.6
million increase resulting from the adoption of IFRS 16, partially offset by weaker currency exchange rates. On an organic basis, having deducted the
8.2
percentage points of positive impact from accounting changes (i.e., the effect of the implementation of IFRS 16 as of January 1, 2019), deducted the
11.9
percentage points positive impact of mobile Panama and Nicaragua acquisitions (which were acquired during 2019), added the
5.0
percentage points negative impact of foreign currency fluctuations between the periods, and added 0.4 percentage points of other impacts resulting from the net effect of small differences that result from calculating organic growth using different baselines for each period, EBITDA of our Latin America segment would have increased by
2.1%
.
EBITDA of our Africa segment increased by
19.4%
for the year ended
December 31, 2019
to
$122 million
from
$102 million
for the year ended
December 31, 2018
. The increase was mainly due to the adoption of IFRS 16, which added $
34.4
million to EBITDA.
Consolidated results of operations for the years ended
December 31, 2018
and
2017
The following table sets forth certain consolidated statement of income data for the periods indicated:
|
Year ended December 31,
|
Percentage Change
|
|||||||
|
2018 (i) (ii)
|
2017 (i) (ii)
|
|||||||
|
(U.S. dollars in millions, except percentages)
|
||||||||
|
Revenue
|
3,946
|
|
3,936
|
|
0.3
|
%
|
||
|
Cost of sales
|
(1,117
|
)
|
(1,169
|
)
|
(4.4
|
)%
|
||
|
Gross profit
|
2,829
|
|
2,767
|
|
2.3
|
%
|
||
|
Operating expenses
|
(1,616
|
)
|
(1,531
|
)
|
5.6
|
%
|
||
|
Depreciation
|
(662
|
)
|
(670
|
)
|
(1.1
|
)%
|
||
|
Amortization
|
(140
|
)
|
(142
|
)
|
(1.2
|
)%
|
||
|
Share of profit in the joint ventures in Guatemala and Honduras
|
154
|
|
140
|
|
9.8
|
%
|
||
|
Other operating income (expenses), net
|
75
|
|
69
|
|
9.2
|
%
|
||
|
Operating profit
|
640
|
|
632
|
|
1.2
|
%
|
||
|
Interest and other financial expenses
|
(367
|
)
|
(389
|
)
|
(5.8
|
)%
|
||
|
Interest and other financial income
|
21
|
|
16
|
|
31.6
|
%
|
||
|
Other non operation income/expenses
|
(39
|
)
|
(2
|
)
|
NM
|
|
||
|
Profit (loss) from other joint ventures and associates, net
|
(136
|
)
|
(85
|
)
|
59.1
|
%
|
||
|
Profit (loss) before taxes from continuing operations
|
119
|
|
172
|
|
(30.5
|
)%
|
||
|
Charge for taxes, net
|
(112
|
)
|
(162
|
)
|
(30.6
|
)%
|
||
|
Profit (loss) for the year from continuing operations
|
7
|
|
10
|
|
(28.7
|
)%
|
||
|
Profit (loss) from discontinued operations, net of tax
|
(33
|
)
|
60
|
|
NM
|
|
||
|
Net profit (loss) for the year
|
(26
|
)
|
69
|
|
NM
|
|
||
_______________
|
(i)
|
IFRS 16 was adopted as of January 1, 2019, using the modified retrospective method; previous periods were therefore not restated and might not be directly comparable. IFRS 15 and IFRS 9 were adopted as of January 1, 2018, using the modified retrospective method; previous periods were therefore not restated and might also not be directly comparable. See "Introduction
—
New and amended IFRS accounting standards" in the notes to our audited consolidated financial statements included elsewhere in this Annual Report for additional details regarding the impact of the adoptions.
|
|
(ii)
|
Restated for discontinued operations
|
Revenue
Revenue increased by
0.3%
for the year ended
December 31, 2018
to
$3,946 million
from
$3,936 million
for the year ended
December 31, 2017
. Year-over-year revenue increased due to an increase in mobile and fixed data as well as Home revenue. The implementation of IFRS 15 had a modest impact as it reduced our 2018 revenue by $77 million, as compared to what our results would have been if we had continued to follow the IAS 18 standard in the year-end 2018. Most of the impact on revenue relates to the change in how we present the results of wholesale international traffic. Revenue for a portion of this business are now presented on a net basis. This change in presentation produced a reduction in revenue of $87 million for the full year 2018. Included in our 2017 results for this business were revenue of $119 million for the full year.
Colombia represented over
42%
, Paraguay, Bolivia and El Salvador each represented between
10%
and
17%
,
and no other country represented more than 10% of our consolidated revenue in 2018 and 2017. Bolivia experienced
the highest relative increase in revenues of $
58
million, or
10.5%
, as a result of robust growth in B2C Home,
which benefited from the continued expansion of our HFC network and from strong demand especially for
residential broadband services and mobile data adoption. Revenue in Paraguay grew
2.5%
with strong performance
of 4G and mobile data adoption. Revenue in Colombia declined by
4.5%
due to the implementation of IFRS 15,
which affected how we present the results of our wholesale international traffic, and due to a weaker average FX rate
for the Colombian Peso. El Salvador recorded a revenue decline of
4.1%
as our operations there continue to be more
exposed than the rest of our Latin America markets to voice and SMS revenue that continues to decline and to
operational challenges that began in 2017 and continued to impact our performance for most of 2018.
Cost of sales
Cost of sales decreased by
4.4%
for the year ended
December 31, 2018
to
$1,117 million
from
$1,169 million
for the year ended
December 31, 2017
. The increase was mainly due to higher costs associated with our increasing fixed service revenue such as pay-TV which incurs programming costs and B2B services that traditionally have lower gross margins, partially offset by the adoption of IFRS 15 which reduced costs by $48 million because of the phone subsidies now being partly recorded in cost of sales.
Operating expenses
Operating expenses increased by
5.6%
for the year ended
December 31, 2018
to
$1,616 million
from
$1,531 million
for the year ended
December 31, 2017
. The increase was mainly due to approximately $50 million of one-off charges, net of gains, related mostly to the Cable Onda acquisition, as well as to our U.S. listing, the restructuring of our regional Africa operations, and to the relocation of certain functions from Luxembourg to our regional Latin America office.
Depreciation
Depreciation decreased by
1.1%
for the year ended
December 31, 2018
to
$662 million
from
$670 million
for the year ended
December 31, 2017
. The decrease was mainly due to our operations in Colombia, where some assets related to our copper network have been fully depreciated.
Amortization
Amortization decreased by
1.2%
for the year ended
December 31, 2018
to
$140 million
from
$142 million
for the year ended
December 31, 2017
. The decrease was mainly due to the full amortization of some assets recognized as part of the purchase accounting in Colombia which was partially offset by the impact of the Cable Onda acquisition that added $9.0 million to the amortization expense in the last quarter of 2018.
Share of profit in our joint ventures in Guatemala and Honduras
Share of profit in our joint ventures in Guatemala and Honduras increased by
9.8%
for the year ended
December 31, 2018
to
$154 million
from
$140 million
for the year ended
December 31, 2017
. The increase was due to growth of the net profits generated in both Guatemala and Honduras. The increase in net profits came principally from steady revenue and operating profit growths in Guatemala and Honduras.
Other operating income (expenses), net
Other operating income (expenses), net increased by
$6 million
for the year ended
December 31, 2018
to an income of
$75 million
from an income of
$69 million
for the year ended
December 31, 2017
. The increase was mainly due to gains registered from the sale of towers in El Salvador, Paraguay and Colombia. See “Item 4. Information on the Company—D. Property, Plant and Equipment—Tower infrastructure.”
Interest and other financial expenses
Interest and other financial expenses decreased by
5.8%
for the year ended
December 31, 2018
to
$367 million
from
$389 million
for the year ended
December 31, 2017
. The decrease was mainly due to lower gross debt as well as lower costs associated with refinancing during 2018 compared to 2017, partially offset by additional finance lease expenses associated with the tower sale and lease back transactions in El Salvador, Colombia and Paraguay.
Interest and other financial income
Interest and other financial income increased by
31.6%
for the year ended
December 31, 2018
to
$21 million
from
$16 million
for the year ended
December 31, 2017
. The increase was mainly due to higher average cash and cash equivalents balances during 2018 as compared to 2017.
Other non-operating (expenses) income, net
Other non-operating (expenses) income, increased by
$37 million
for the year ended
December 31, 2018
to an expense of
$39 million
from an exepense of
$2 million
for the year ended
December 31, 2017
. The decrease was mainly due to higher foreign exchange losses in 2018.
Loss from other joint ventures and associates, net
Loss from other joint ventures and associates, net increased by
59.1%
for the year ended
December 31, 2018
to a loss of
$136 million
from a loss of
$85 million
for the year ended
December 31, 2017
. The increase in the loss was mainly due to losses in Ghana. Our Ghana operations were first accounted for as a joint venture on October 12, 2017 .
Charges for taxes, net
Charges for taxes, net decreased by
30.6%
for the year ended
December 31, 2018
to
$112 million
from
$162 million
for the year ended
December 31, 2017
. The decrease was mainly due to lower taxes at the corporate level and higher utilization of deferred tax assets in 2018 compared to 2017.
The main components of charges for taxes, net are the income tax generated by most of the operations in our Latin America segment and the withholding tax we pay when cash is upstreamed from our local operations to MIC S.A. We also have net losses in our Africa segment and associates, as well as in our corporate entities that, in the aggregate, reduce our profit before taxes and for which no deferred tax asset is recognized due to the history of losses in such entities. As a result, our effective tax rate is generally above our average statutory tax rate. Moreover, due to the jurisdictional differences and mix, we do not have the opportunity to offset tax expense with accumulated tax loss carryforwards.
Net profit (loss) for the year
Net profit for the year decreased by
$95 million
for the year ended
December 31, 2018
to a loss of
$26 million
from a gain of
$69 million
for the year ended
December 31, 2017
. Profit for the year from continuing operations decreased by
$3 million
for the year ended
December 31, 2018
to a profit of
$7 million
from a profit of
$10 million
for the year ended
December 31, 2017
for the reasons stated above. Profit (loss) for the year from discontinued operations, net of tax decreased by
$92 million
for the year ended
December 31, 2018
to a loss of
$33 million
from a profit of
$60 million
for the year ended
December 31, 2017
. The decrease in profit for the year from discontinued operations, net of tax, was mainly due to a loss recognized on the disposal of the Millicom Group's Rwanda operations in 2018.
Segment results of operations for the years ended
December 31, 2018
and
2017
Our Latin America segment includes the Guatemala and Honduras joint ventures as if they were fully consolidated, as this reflects the way our management reviews and uses internally reported information to make decisions about operating matters. Our Africa segment does not include our joint venture in Ghana because our management does not consider it a strategic part of our group. See “—Our segments” above.
The following table sets forth certain segment data, which has been extracted from note B.3 to our audited consolidated financial statements, where segment data is reconciled to consolidated data, for the periods indicated:
|
Year ended December 31,
|
|||||||||||||||||
|
2018
|
2017
|
Percentage Change
|
|||||||||||||||
|
Latin America
|
Africa
|
Latin America
|
Africa
|
Latin America
|
Africa
|
||||||||||||
|
(U.S. dollars in millions, except percentages)
|
|||||||||||||||||
|
Mobile revenue
|
3,214
|
|
388
|
|
3,283
|
|
374
|
|
(2.1
|
)%
|
3.7
|
%
|
|||||
|
Cable and other fixed services revenue
|
1,808
|
|
10
|
|
1,755
|
|
9
|
|
3.0
|
%
|
12.5
|
%
|
|||||
|
Other revenue
|
48
|
|
1
|
|
40
|
|
2
|
|
18.5
|
%
|
(55.2
|
)%
|
|||||
|
Service revenue
|
5,069
|
|
398
|
|
5,078
|
|
385
|
|
(0.2
|
)%
|
3.5
|
%
|
|||||
|
Telephone and equipment revenue
|
415
|
|
—
|
|
363
|
|
1
|
|
14.4
|
%
|
NM
|
|
|||||
|
Revenue
|
5,485
|
|
399
|
|
5,441
|
|
386
|
|
0.8
|
%
|
3.3
|
%
|
|||||
|
Operating profit (loss)
|
995
|
|
25
|
|
899
|
|
28
|
|
10.6
|
%
|
(11.6
|
)%
|
|||||
|
Add back:
|
|||||||||||||||||
|
Depreciation and amortization
|
1,133
|
|
80
|
|
1,174
|
|
81
|
|
(3.6
|
)%
|
(1.1
|
)%
|
|||||
|
Other operating income (expenses), net
|
(51
|
)
|
(3
|
)
|
(49
|
)
|
(11
|
)
|
2.1
|
%
|
(77.7
|
)%
|
|||||
|
EBITDA
|
2,077
|
|
102
|
|
2,024
|
|
97
|
|
2.6
|
%
|
4.7
|
%
|
|||||
The following table sets forth revenue from continuing operations by country for certain of the countries in our Latin America segment:
|
Year ended December 31,
|
Percentage
Change |
|||||||
|
2018
|
2017
|
|||||||
|
(U.S. dollars in millions, except percentages)
|
||||||||
|
Colombia
|
1,661
|
|
1,739
|
|
(4.5
|
)%
|
||
|
Guatemala
|
1,373
|
|
1,328
|
|
3.4
|
%
|
||
|
Paraguay
|
679
|
|
662
|
|
2.5
|
%
|
||
|
Honduras
|
586
|
|
585
|
|
0.1
|
%
|
||
|
Bolivia
|
614
|
|
555
|
|
10.5
|
%
|
||
|
El Salvador
|
405
|
|
422
|
|
(4.1
|
)%
|
||
Segment revenue
Revenue of our Latin America segment increased by
0.8%
for the year ended
December 31, 2018
to
$5,485 million
from
$5,441 million
for the year ended
December 31, 2017
. The increase in revenue was due to an increase in our telephone and equipment revenue, partially offset by a decrease in our service revenue. The increase in telephone and equipment revenue was mainly due to the lower average price of 4G devices leading to increased sales. The decrease in our service revenue was primarily attributable to weaker FX rates prevalent in the last quarter of 2018 that was partially offset by growth of revenue from fixed services, with Cable and other fixed services increasing as a result of an increased number of customer relationships, particularly in Paraguay, Guatemala and Bolivia, and B2B increasing as a result of higher voice and data traffic, particularly in Colombia. Mobile declined slightly, with mobile data almost offsetting the decline in mobile voice and SMS, and as a relative proportion of our Latin America segment revenue. However, mobile service revenue continued to represent over 60% of our Latin America segment revenue.
Revenue of our Africa segment increased by
3.3%
for the year ended
December 31, 2018
to
$399 million
from
$386 million
for the year ended
December 31, 2017
. The year-over-year revenue of our Africa segment increased due to an increase in mobile revenue driven by subscriber additions in Tanzania.
Segment operating profit
Operating profit of our Latin America segment increased by
10.6%
for the year ended
December 31, 2018
to
$995 million
from
$899 million
for the year ended
December 31, 2017
. The increase was primarily attributable to revenue growth coupled with a reduction in depreciation and amortization, primarily in Colombia where some assets recognized as part of the purchase accounting in Colombia were fully amortized during 2018 whereas amortization continued throughout all of 2017.
Operating profit of our Africa segment decreased by
11.6%
for the year ended
December 31, 2018
to
$25 million
from
$28 million
for the year ended
December 31, 2017
. The decrease was mainly due lower gains on disposal of assets.
Segment EBITDA
Segment EBITDA is segment operating profit excluding, depreciation and amortization and other operating income (expenses), net which includes impairment losses and gains/losses on the disposal of fixed assets attributable to the segment. Segment EBITDA is used by the management to monitor the segmental performance and for capital management.
EBITDA of our Latin America segment increased by
2.6%
for the year ended
December 31, 2018
to
$2,077 million
from
$2,024 million
for the year ended
December 31, 2017
. The increase was attributable to growth in revenues driven by handset and equipment sales and higher revenue from fixed services as well as to cost control measures.
EBITDA of our Africa segment increased by
4.7%
for the year ended
December 31, 2018
to
$102 million
from
$97 million
for the year ended
December 31, 2017
. The increase was mainly due to the increase in revenue and cost control measures.
Other Financial Data
|
Year ended
December 31, |
|||
|
2019(i)
|
2018(ii) (iii)
|
||
|
Consolidated:
|
|||
|
Net cash provided by operating activities
|
801
|
792
|
|
|
Net cash used in investing activities
|
(1,502)
|
(1,199)
|
|
|
Net cash provided by financing activities
|
1,355
|
341
|
|
|
Operating free cash flow
(1)
|
425
|
383
|
|
|
Free cash flow
(1)
|
(45)
|
85
|
|
|
Equity free cash flow
(1)
|
179
|
326
|
|
|
Latin America segment:
|
|||
|
Service revenue
|
5,514
|
5,069
|
|
|
Telephone and equipment revenue
|
449
|
415
|
|
|
Revenue
|
5,964
|
5,485
|
|
|
Revenue growth
|
8.7%
|
0.8%
|
|
|
Revenue organic growth
(2)
|
2.8%
|
3.5%
|
|
|
Service revenue growth
|
8.8%
|
(0.2)%
|
|
|
Service revenue organic growth
(2)
|
2.2%
|
4.3%
|
|
|
(i)
|
IFRS 16 was adopted as of January 1, 2019, using the modified retrospective method; previous periods were therefore not restated and might not be directly comparable. See "Introduction
—
New and amended IFRS accounting standards" in the notes to our audited consolidated financial statements included elsewhere in this Annual Report for additional details regarding the impact of the adoptions.
|
|
(ii)
|
IFRS 15 and IFRS 9 were adopted as of January 1, 2018, using the modified retrospective method; previous periods were therefore not restated and might not be directly comparable. See "Introduction - New and amended IFRS accounting standards" in the notes to our audited consolidated financial statements included elsewhere in this Annual Report for additional details regarding the impact of the adoptions.
|
|
(iii)
|
Restated for discontinued operations.
|
(1)
Free Cash Flow Measures
Operating free cash flow
Operating free cash flow is a non-IFRS measure and is not a uniformly or legally defined financial measure. Operating free cash flow is not a substitute for IFRS measures in assessing our overall financial performance. Because Operating free cash flow is not determined in accordance with IFRS, and is susceptible to varying calculations, Operating free cash flow may not be comparable to other similarly titled measures presented by other companies. Operating free cash flow is included in this report because it is used by our management, and we believe may be useful to investors, to evaluate our core operational cash flow performance from period to period, as reflected in the adjustments in the reconciliation table below. Operating free cash flow has limitations as an analytical tool, and you should not consider it in isolation, or as a substitute for an analysis of our results as reported under IFRS.
Free cash flow
Free cash flow is a non-IFRS measure and is not a uniformly or legally defined financial measure. Free cash flow is not a substitute for IFRS measures in assessing our overall financial performance. Because Free cash flow is not determined in accordance with IFRS, and is susceptible to varying calculations, Free cash flow may not be comparable to other similarly titled measures presented by other companies. Free cash flow is included in this report because it is used by our management, and we believe may be useful to investors, to evaluate our cash flow performance from period to period as it reflects the operating free cash flow generated as described above after net finance charges paid. Free cash flow has limitations as an analytical tool, and you should not consider it in isolation, or as a substitute for an analysis of our results as reported under IFRS.
Equity free cash flow
Equity free cash flow is a non-IFRS measure and is not a uniformly or legally defined financial measure. Equity free cash flow is not a substitute for IFRS measures in assessing our overall financial performance. Because Equity free cash flow is not determined in accordance with IFRS, and is susceptible to varying calculations, Equity free cash flow may not be comparable to other similarly titled measures presented by other companies. Equity free cash flow is included in this report because it is used by our management, and we believe may be useful to investors, to evaluate our cash flow performance from period to period as it reflects our non–IFRS Free cash flow as described above with the addition of dividends or advances received from our joint venture operations (namely Guatemala and Honduras) and the deduction dividends paid to non–controlling interests. Equity free cash flow has limitations as an analytical tool, and you should not consider it in isolation, or as a substitute for an analysis of our results as reported under IFRS.
The following table shows a reconciliation from Net cash provided by operating activities to Operating free cash flow, Free cash flow and Equity free cash flow for the Millicom Group:
|
Year ended
December 31, |
|||
|
2019(i)
|
2018(ii) (iii)
|
||
|
Net cash provided by operating activities
|
801
|
|
792
|
|
Purchase of property, plant and equipment
|
(736)
|
|
(632)
|
|
Proceeds from sale of property, plant and equipment
|
24
|
|
154
|
|
Proceeds from sale of towers part of tower sale and leaseback transactions
|
(22)
|
|
(142)
|
|
Purchase of intangible assets
|
(171)
|
|
(148)
|
|
Proceeds from sale of intangible assets
|
—
|
|
—
|
|
Purchase of spectrum and licenses
|
59
|
|
61
|
|
Finance charges paid, net
|
470
|
|
298
|
|
Operating free cash flow
|
425
|
|
383
|
|
Interest (paid), net
|
(470)
|
|
(298)
|
|
Free cash flow
|
(45)
|
|
85
|
|
Dividends received from joint ventures (Guatemala and Honduras)
|
237
|
|
243
|
|
Dividends paid to non-controlling interests
|
(13)
|
|
(2)
|
|
Equity free cash flow
|
179
|
|
326
|
(2)
Revenue and Service Revenue Organic Growth
Revenue Organic Growth and Service Revenue Organic Growth are non-IFRS measures and are not uniformly or legally defined financial measures. Revenue Organic Growth and Service Revenue Organic Growth are not substitutes for IFRS measures in assessing our overall operating performance. Because Revenue Organic Growth and Service Revenue Organic Growth are not determined in accordance with IFRS, and are susceptible to varying calculations, Revenue Organic Growth and Service Revenue Organic Growth may not be comparable to other similarly titled measures presented by other companies.
Revenue Organic Growth and Service Revenue Organic Growth are included in this report because our management uses these measures to evaluate our core revenue generating performance from period to period, having eliminated (1) the impact of revenue from businesses acquired during the most recent period (such as Telefonica Panama and Telefonia Nicaragua in 2019) and the contribution to revenue of businesses disposed of (such as Rwanda, Senegal in 2018 and Chad in 2019) during either period (“change in perimeter”), (2) the impact of accounting changes (such as the removal of the impact of IFRS 15 adoption in 2018) (3) currency fluctuations, and (4) other, which captures the net effect of small differences that result from calculating organic growth using different baselines for each period.
To eliminate the impact of currency fluctuations, we use recent U.S. dollar exchange rate data for the local non-U.S.-dollar currencies of the markets in which we operate to determine an estimated, or budgeted, exchange rate for such currencies. Revenues and service revenues in non-U.S.-dollar currencies from both the more recent period and the corresponding period of the prior year are then translated into U.S. dollars at the same budgeted exchange rates. Revenue Organic Growth and Service Revenue Organic Growth have limitations as analytical tools, and you should not consider them in isolation, or as substitutes for an analysis of our results as reported under IFRS.
The following table shows a reconciliation from reported growth on an IFRS basis to organic growth for revenue and service revenue for the Latin America segment:
|
Revenue
|
Service Revenue
|
||||||
|
As of and for the year ended
December 31, |
|||||||
|
2019
|
2018
|
2019
|
2018
|
||||
|
Current period
|
5,964
|
5,485
|
5,514
|
5,069
|
|||
|
Prior year period
|
5,485
|
5,441
|
5,069
|
5,078
|
|||
|
Reported Growth
|
8.7%
|
|
0.8%
|
8.8%
|
|
(0.2)%
|
|
|
Accounting change impact(i)
|
—%
|
(2.4)%
|
—%
|
(1.0)%
|
|||
|
Change in Perimeter impact
(ii)
|
(11.0)%
|
—%
|
(11.6)%
|
—%
|
|||
|
Foreign exchange impact
(iii)
|
5.2%
|
5.1%
|
5.2%
|
5.3%
|
|||
|
Other
(iv)
|
(0.1)%
|
0.1%
|
(0.1)%
|
0.2%
|
|||
|
Organic Growth
|
2.8%
|
|
3.5%
|
2.2%
|
|
4.3%
|
|
|
(i)
|
The following accounting change impacts were eliminated to calculate revenue organic growth: a positive $
133
million revenue impact in the year ended December 31, 2018 due to the adoption of IFRS 15. The following accounting change impacts were eliminated to calculate service revenue organic growth: a positive $
51
million service revenue impact in the year ended December 31, 2018 due to the adoption of IFRS 15.
|
|
(ii)
|
The following change in perimeter impacts were eliminated to calculate revenue organic growth: a positive $
604
million revenue impact in the year ended December 31, 2019 due to revenue generated by Telefonia Celular de Nicaragua S.A. which was consolidated as of May 16, 2019 and Telefonica Moviles Panama which we consolidated as of August 29, 2019. The following change in perimeter impacts were eliminated to calculate service revenue organic growth: a positive $
590
million service revenue impact in the year ended December 31, 2019 due to service revenue generated by Cable Onda which was consolidated as of December 13, 2018.
|
|
(iii)
|
The following foreign exchange fluctuation impacts were eliminated to calculate revenue organic growth: a negative $
283
million revenue impact in the year ended December 31, 2019, and a negative $
276
million revenue impact in the year ended December 31, 2018. The following foreign exchange fluctuation impacts were eliminated to calculate service revenue organic growth: a positive $
263
million service revenue impact in the year ended December 31, 2019, and a positive $
270
million service revenue impact in the year ended December 31, 2018.
|
|
(iv)
|
The following other impacts related to changes for comparative purposes were eliminated to calculate revenue organic growth: a positive $
6
million revenue impact in the year ended December 31, 2019, a negative $
7
million revenue impact in the year ended December 31, 2018. The following other impacts related to changes for comparative purposes were eliminated to calculate service revenue organic growth: a positive $
5
million service revenue impact in the year ended December 31, 2019, and a negative $
8
million service revenue impact in the year ended December 31, 2018.
|
Critical accounting policies
The preparation of our financial statements requires management to use judgment in applying accounting policies. It also requires the use of certain critical accounting estimates and assumptions that affect the reported amounts of assets and liabilities, and disclosure of contingent assets and liabilities at the date of the financial statements, and the reported amounts of revenue and expenses during the reporting period. These estimates are based on management’s best knowledge of current events, actions and best estimates as of a specified date, and actual results may ultimately differ from these estimates. Areas involving a higher degree of judgment or complexity, or areas where assumptions and estimates are significant to the financial statements are described in “Introduction— Judgments and critical estimates” in the notes to our audited consolidated financial statements, and in the notes referenced therein.
For a description of new or amended IFRS accounting standards to which we are subject, see “Introduction— New and amended IFRS accounting standards” in the notes to our audited consolidated financial statements.
B. Liquidity and Capital Resources
Overview
The Millicom Group’s sources of funds are cash from operations, internal and external financing as well as proceeds from the disposal of assets. The Millicom Group finances its operations centrally at the MIC S.A. level or alternatively, where it deems it more cost effective to do so, at the operational level.
In particular, we seek to finance the costs of deploying and expanding our fixed and mobile networks mainly at the operating level on a country-by-country basis, utilizing credit facilities provided by banks and finance leases, obtaining financing from the debt capital markets, and seeking funding from export credit agencies and development financial institutions such as the InterAmerican Development Bank and the International Finance Corporation.
If we decide to acquire other businesses, we expect to fund these acquisitions from cash resources, borrowings under existing credit facilities and, if necessary, through new borrowings, including under new credit facilities or issuances of debt securities, though we may issue equity also to raise funds.
As of
December 31, 2019
,
$696 million
of the Millicom Group’s cash and cash equivalents balance was at the holdings level and a further
$468 million
was at the operating subsidiaries level. As of
December 31, 2018
and
2017
, respectively,
$145 million
and
$141 million
of the Millicom Group’s cash and cash equivalents balance was at the holdings level and a further
$382 million
and
$479 million
was at the operating subsidiaries level.
If funds at the foreign operating subsidiary level are repatriated, taxes on each type of repatriation and each country would need to be accrued and paid, where applicable.
As of
December 31, 2019
, our total consolidated indebtedness excluding lease liabilities as of
December 31, 2019
was
$5,972 million
. As of
December 31, 2018
and
2017
, respectively, our total consolidated outstanding debt and other financing was
$4,580 million
and $3,785 million.
We believe that our available cash and cash equivalents, borrowings and funds from our operating subsidiaries will be sufficient to meet our projected operating and capital expenditure requirements for at least the next 12 months.
Cash upstreaming
Progressive improvement in operating and financial performance of our operations has enabled the upstreaming of excess cash to MIC S.A. This is accomplished through a combination of dividends, fees and shareholder loan repayments.
The following table sets forth cash upstreamed to MIC S.A. from our subsidiaries and joint ventures for the periods presented:
|
Year ended December 31,
|
||||||||
|
2019
|
2018
|
2017
|
||||||
|
(U.S. dollars in millions)
|
||||||||
|
Subsidiaries
|
346
|
|
594
|
|
754
|
|
||
|
Joint ventures
|
261
|
|
263
|
|
230
|
|
||
|
Total
|
606
|
|
857
|
|
984
|
|
||
In each case, the upstreamed cash was principally used to cover corporate center expenses, service corporate debt, pay corporate center taxes and pay the group dividend.
Some of our operating subsidiaries and joint ventures have covenants on debt outstanding that impose restrictions on their ability to upstream cash to MIC S.A. As a result of these restrictions, significant cash or cash equivalent balances may be held from time to time at our operating subsidiaries and joint ventures.
Cash flows
Set forth below is a comparative discussion of our cash flows, which includes cash flows from discontinued operations.
Years ended
December 31, 2019
and
2018
For the year ended
December 31, 2019
, cash provided by operating activities was
$801 million
, compared to
$792 million
for the year ended
December 31, 2018
. The increase is mainly due to higher interest payments due to an increase in gross debt for the acquisitions made in the past year.
Cash used in investing activities was
$1,502 million
for the year ended
December 31, 2019
, compared to
$1,199 million
for the year ended
December 31, 2018
. In the year ended
December 31, 2019
, Millicom used
$1,014 million
in the acquisition of subsidiaries, net of cash acquired (mobile operations in Panama and Nicaragua),
$736 million
to purchase property, plant and equipment and
$171 million
to purchase intangible assets and licenses, and these items were partially offset by proceeds of
$237 million
in dividends from joint ventures,
$111 million
from the disposal of subsidiaries (mainly Chad), and
$24 million
from the sale of property, plant and equipment such as towers. In the year ended
December 31, 2018
, Millicom used
$953 million
in the acquisition of subsidiaries, net of cash acquired (mainly Cable Onda),
$632 million
to purchase property, plant and equipment and
$148 million
for intangible assets and licenses. These items were partially offset by
$243 million
in proceeds from dividends from joint ventures, and
$154 million
from the sale of property, plant and equipment such as towers.
Cash provided in financing activities was
$1,355 million
for the year ended
December 31, 2019
, compared to cash used by financing activities of
$341 million
for the year ended
December 31, 2018
. In the year ended
December 31, 2019
, we paid
$268 million
in dividends (ordinary dividend of
$2.64
per share) and repaid debt of
$1,157 million
and lease capital of
$107 million
while raising funds of
$2,900 million
through new financing. In the year ended
December 31, 2018
, we paid
$266 million
to shareholders in dividends (ordinary dividend of
$2.64
per share) and repaid debt of
$530 million
and lease capital of
$17 million
while raising funds of
$1,155 million
through new financing.
Years ended
December 31, 2018
and
2017
For the year ended
December 31, 2018
, cash provided by operating activities was
$792 million
, compared to
$820 million
for the year ended
December 31, 2017
. The decrease is mainly due to the weaker average FX rate for the Colombian Peso and no longer having profit before taxes from our operations in Senegal and Rwanda, following the completion of our disposal and discontinuance of those operations in the first few months of 2018.
Cash used in investing activities was
$1,199 million
for the year ended
December 31, 2018
, compared to
$367 million
for the year ended
December 31, 2017
. In the year ended
December 31, 2018
, Millicom used
$953 million
in the acquisition of subsidiaries, net of cash acquired (mainly Cable Onda),
$632 million
to purchase property, plant and equipment and
$148 million
to purchase intangible assets and licenses, and these items were partially offset by proceeds of
$243 million
in dividends from joint ventures,
$176 million
from the disposal of subsidiaries (mainly Rwanda and Senegal) and
$154 million
from the sale of property, plant and equipment such as towers. In the year ended
December 31, 2017
, Millicom used
$650 million
to purchase property, plant and equipment and
$133 million
for intangible assets and licenses. These items were partially offset by
$203 million
in proceeds from dividends from joint ventures, and
$179 million
from the sale of property, plant and equipment such as towers.
Cash used in financing activities was
$341 million
for the year ended
December 31, 2018
, compared to
$464 million
for the year ended
December 31, 2017
. In the year ended
December 31, 2018
, we paid
$266 million
in dividends (ordinary dividend of
$2.64
per share) and repaid debt of
$530 million
while raising funds of
$1,155 million
through new financing. In the year ended
December 31, 2017
, we paid
$265 million
to shareholders in dividends (ordinary dividend of
$2.64
per share) and repaid debt of
$1,195 million
while raising funds of
$996 million
through new financing.
Capital expenditures
Historical capital expenditures
Our capital expenditures of property, plant and equipment, licenses and other intangibles on a consolidated basis and by operating segment, including accruals for such additions at the end of the periods, for the years ended
December 31, 2019
,
2018
, and
2017
is set out in the table below. Our capital expenditure mainly relates to the growth of the 4G network, the rollout of the HFC network, connection of new homes and IT investments.
|
Year ended December 31,
|
||||||||
|
2019
|
2018
|
2017
|
||||||
|
(U.S. dollars in millions)
|
||||||||
|
Additions to property, plant and equipment
|
719
|
|
698
|
|
824
|
|
||
|
Additions to licenses and other intangibles
|
202
|
|
158
|
|
130
|
|
||
|
Total consolidated additions
|
921
|
|
856
|
|
954
|
|
||
|
Latin America segment total additions (including Guatemala and Honduras)
|
1,119
|
|
1,040
|
|
977
|
|
||
|
Africa segment total additions
|
54
|
|
30
|
|
173
|
|
||
Capital expenditure commitments
As of
December 31, 2019
, we had commitments to purchase network equipment, land and buildings and other fixed assets with a value of
$122 million
from a number of suppliers, of which
$102 million
was within one year and
$20 million
more than one year. Out of these commitments,
$52 million
and
$51 million
, respectively, related to the Company’s share in joint ventures. We expect to meet these commitments from our current cash balance and from cash generated from our operations.
Financing
We seek to finance our operations on a country-by-country basis when we determine it to be more cost and risk effective. As local financial markets become more developed, we have been able to finance increasingly at the level of our operations in local currency and on a non-recourse basis to MIC S.A. as of
December 31, 2019
, 54% of our total consolidated debt excluding lease liabilities of
$5,972 million
, or $3,199 million, was at the operational level (excluding our joint ventures in Guatemala and Honduras) and non-recourse to MIC S.A., and 41% of this debt was denominated in local currency. In addition, at
December 31, 2019
our joint ventures in Guatemala and Honduras had
$1,283 million
of debt excluding lease liabilities which was non-recourse to MIC S.A.
Consolidated indebtedness
Millicom’s total consolidated debt excluding lease liabilities as of
December 31, 2019
was
$5,972 million
and our total consolidated net debt (representing total consolidated debt after deduction of cash, cash equivalents, and pledged deposits) was $4,807 million. Including lease liabilities, Millicom's total consolidated financial obligations as of December 31, 2019 were
$7,036 million
and our total consolidated net financial obligations (representing total consolidated financial obligations after deduction of cash, cash equivalents, and pledged deposits) were
$5,870 million
. Millicom’s total consolidated debt as of
December 31, 2018
was
$4,580 million
and our total consolidated net financial obligations was
$4,051 million
. See note C.6 to our audited consolidated financial statements included elsewhere in this Annual Report for a reconciliation of total consolidated debt (and financial obligations) to total consolidated net debt (and financial obligations). Our consolidated interest and other financial expenses for the year ended
December 31, 2019
were
$564 million
and for years ended
December 31, 2018
and
2017
were
$367 million
and
$389 million
, respectively.
Millicom's lease liabilities as of
December 31, 2019
was
$1,063 million
, 97% of our consolidated lease liabilities or
$1,036 million
, was at operational level (excluding our joint ventures in Guatemala and Honduras) and non-recourse to MIC S.A.
The following table sets forth our consolidated debt and financing by entity or operational entity location for the periods indicated:
|
Year ended December 31,
|
||||||||
|
2019
|
2018
|
2017
|
||||||
|
(US$ millions)
|
||||||||
|
MIC S.A. (Luxembourg)
|
2,773
|
|
1,770
|
|
1,255
|
|
||
|
Latin America:
|
||||||||
|
Colombia
|
827
|
|
1,016
|
|
1,130
|
|
||
|
Paraguay
|
502
|
|
504
|
|
488
|
|
||
|
Bolivia
|
350
|
|
317
|
|
352
|
|
||
|
El Salvador
|
268
|
|
299
|
|
147
|
|
||
|
Costa Rica
|
148
|
|
148
|
|
76
|
|
||
|
Panama
|
918
|
|
261
|
|
—
|
|
||
|
Africa:
|
||||||||
|
Tanzania
|
186
|
|
201
|
|
217
|
|
||
|
Chad(1)
|
—
|
|
64
|
|
70
|
|
||
|
Rwanda(1)
|
—
|
|
—
|
|
50
|
|
||
|
Ghana(1)
|
—
|
|
—
|
|
—
|
|
||
|
Senegal(1)
|
—
|
|
—
|
|
—
|
|
||
|
Total debt and financing
|
5,972
|
|
4,580
|
|
3,785
|
|
||
|
(i)
|
Operations were classified as assets held for sale from 2017 and subsequently disposed of or merged.
|
(ii) Finance lease liabilities were included in Debt and Financing until 31 December 2018, but were reclassified to lease liabilities on January 1, 2019 when adopting the new leasing standard. For more details see "New and amended IFRS accounting standards" in our consolidated financial statements.
For a more detailed description of our outstanding financial obligations, including our credit facilities and outstanding bond or note issuances, see note C.3 to our consolidated financial statements.
Our financing facilities at the MIC S.A. level are subject to a number of financial covenants including net leverage and interest coverage requirements. In addition, certain financings at MIC S.A. level contain restrictions on sale of businesses or significant assets within the businesses.
Our financing facilities at the operational level are subject to a number of financial covenants including requirements with respect to net leverage, debt service coverage, debt to earnings and cash levels. In addition, certain financings at the operational level contain restrictions on sale of businesses or significant assets within the businesses.
Indebtedness of the Guatemala and Honduras joint ventures
With respect to the Guatemala and Honduras joint ventures, respectively, total debt excluding lease liabilities as of
December 31, 2019
was
$929 million
and
$353 million
and our total net debt (representing total debt after deduction of cash, cash equivalents, and pledged deposits) was
$740 million
and
$313 million
. As of
December 31, 2019
, our joint ventures in Guatemala and Honduras have lease liabilities of
$313 million
.
Annual interest expense for the Guatemala joint venture for the years ended
December 31, 2019
,
2018
and
2017
was
$90 million
, $74 million and $73 million, respectively. Annual interest expense for the Honduras joint venture for the years ended
December 31, 2019
,
2018
and
2017
was
$37 million
, $29 million and $27 million, respectively.
The following table sets forth the debt and financing of the Guatemala and Honduras joint ventures for the periods indicated:
|
Year ended December 31,
|
||||||||
|
2019
|
2018
|
2017
|
||||||
|
(US$ millions)
|
||||||||
|
Guatemala
|
929
|
|
927
|
|
995
|
|
||
|
Honduras
|
353
|
|
383
|
|
388
|
|
||
(i) Finance lease liabilities were included in Debt and Financing until 31 December 2018, but were reclassified to lease liabilities on January 1, 2019 when adopting the new leasing standard.
The financing facilities of the Guatemala and Honduras joint ventures are subject to a number of financial covenants such as net leverage requirements. In addition, certain of their financings contain restrictions on sale of businesses or significant assets within the businesses.
C. Research and Development, Patents and Licenses, etc.
We do not engage in research and development activities, and we do not own any patents.
D. Trend Information
For a discussion of trend information, see “—A. Operating Results—Factors affecting our results of operations.”
E. Off-Balance Sheet Arrangements
As of
December 31, 2019
, the Millicom Group’s share of total debt and financing secured by either pledged assets, pledged deposits issued to cover letters of credit, or guarantees issued was
$464 million
. Assets pledged by the Millicom Group for these debts and financings amounted to
$1 million
as of
December 31, 2019
. The table below details the maximum exposure under these guarantees and their remaining terms, as of
December 31, 2019
.
|
Total
|
Less than 1 year
|
1-3 years
|
3-5 years
|
|||||||||
|
(US$ millions)
|
||||||||||||
|
Theoretical maximum exposure
|
464
|
|
29
|
|
134
|
|
300
|
|
||||
F. Tabular Disclosure of Contractual Obligations
The Millicom Group has various contractual obligations to make future payments, including debt agreements and payables for license fees and lease obligations.
The following table summarizes our obligations under these contracts due by period as of
December 31, 2019
.
|
Total
|
Less than 1 year
|
1–5 years
|
After 5 years
|
||||||||
|
(US$ millions)
|
|||||||||||
|
Debt and financing (after unamortized financing fees)
|
5,972
|
|
186
|
|
1,902
|
|
3,884
|
|
|||
|
Future interest commitments on debt and financing(1)
|
1,502
|
|
308
|
|
1,088
|
|
106
|
|
|||
|
Lease liabilities
|
1,063
|
|
97
|
|
490
|
|
476
|
|
|||
|
Future interest commitments on leases
|
928
|
|
157
|
|
476
|
|
295
|
|
|||
|
Capital expenditure
|
122
|
|
102
|
|
20
|
|
—
|
|
|||
|
Total
|
9,588
|
|
849
|
|
3,977
|
|
4,762
|
|
|||
|
(1)
|
Future interest commitments on our floating rate debt are calculated using the rates in effect for the floating rate debt as of
December 31, 2019
.
|
A. Directors and Senior Management
Directors
The following table sets forth information of each member of the Company’s Board of Directors as of the date of this filing:
|
Name
|
Position
|
Year First Elected
|
||
|
Mr. José Antonio Ríos García (1)
|
Chairman
|
2017
|
||
|
Ms. Pernille Erenbjerg
|
Deputy Chairman
|
2019
|
||
|
Mr. Odilon Almeida
|
Member
|
2015
|
||
|
Ms. Janet Davidson
|
Member
|
2016
|
||
|
Mr. Tomas Eliasson
|
Member
|
2014
|
||
|
Ms. Mercedes Johnson
|
Member
|
2019
|
||
|
Mr. Lars-Åke Norling
|
Member
|
2018
|
||
|
Mr. James Thompson
|
Member
|
2019
|
||
|
(1)
|
First appointed as Chairman in January 2019.
|
Biographical information of each member of the Company’s Board of Directors is set forth below.
Mr. José Antonio Ríos García
,
Non-executive Director and Chairman of the Board.
Mr. José Antonio Ríos García was re-elected to the Board in May 2019 and was first appointed as Chairman of the Board on January 7, 2019. Mr. Ríos, born in 1945, is currently the Chairman and CEO of Celistics Holdings, a leading provider of distribution and intelligent logistics solutions for the consumer technology industry in Latin America. Prior to joining Celistics in 2012, Mr. Ríos was the founding President and CEO of DIRECTV Latin America (GLA), and the International President of Global Crossing, the telecommunications company later acquired by Level 3 Communications. Mr. Ríos holds an Industrial Engineering degree from the Universidad Católica Andrés Bello, Caracas, Venezuela.
Ms. Pernille Erenbjerg
,
Non-executive Director, Deputy Chairman of the Board, Chairman of the Compensation Committee and Member of the Audit Committee
. Ms. Pernille Erenbjerg was re-elected to the Board in May 2019. Ms. Erenbjerg, born in 1967, is formerly the President and Group Chief Executive Officer of TDC, the leading provider of integrated communications and entertainment solutions in Denmark and Norway. Before being appointed President and Group Chief Executive Officer, Ms. Erenbjerg served as TDC’s Chief Financial Officer and as Executive Vice President of Corporate Finance. Ms. Erenbjerg also serves on the Boards of Nordea, the largest financial services group in the Nordic region, and Genmab, the Danish international biotechnology company. Prior to joining TDC in 2003, Ms. Erenbjerg worked for 16 years in the auditing industry, finishing in 2003 as an equity partner in Deloitte. Ms. Erenbjerg holds an MSc in Business Economics and Auditing from Copenhagen Business School.
Mr. Odilon Almeida
,
Non-executive Director, Member of the Compliance and Business Conduct Committee
. Mr. Odilon Almeida was re-elected to the Board in May 2019. Mr. Almeida, born in 1961, is a senior global leader in the financial, fin-tech, telecom, and consumer goods sectors, and will join ACI Worldwide Inc. as President and CEO in March 2020. He will also be appointed to the Board of ACI. Previously he was an Operating Partner at Advent International, one of the world’s largest private equity funds with $54.3B in assets under management and 345+ investments across 41 countries. His board experience, along with business leadership at Western Union, includes BankBoston (now Bank of America), The Coca-Cola Company and Colgate-Palmolive. Mr. Almeida holds a Bachelor of Civil Engineering degree from the Maua Engineering School in São Paulo, Brazil, a Bachelor of Business Administration degree from the University of São Paulo and an MBA with specialization in Marketing from the Getulio Vargas Foundation, São Paulo. He advanced his education with executive studies at IMD Lausanne, The Wharton School, and Harvard Business School.
Ms. Janet Davidson
,
Non-executive Director and Chairman of the Compliance and Business Conduct Committee
. Ms. Janet Davidson was re-elected to the Board in May 2019. Ms. Davidson, born in 1956, also serves on the supervisory board of ST Microelectronics and as a director of AES Corporation and serves on its Financial Audit Committee Compensation Committee and Innovation and technology Committee. Previously, Ms. Davidson held various managerial positions in Alcatel Lucent from 1979 to 2011 including the role as Chief Strategy Officer, Chief Compliance Officer and Executive Vice President, Quality & Customer Care. She has also been recognized by Working Woman and in 1999, she was inducted into the Academy of Women Achievers of the YWCA of the City of New York, which honors women of high achievement. Ms. Davidson has a Bachelor of Arts degree in physics from Lehigh University, a Master’s degree in Electrical Engineering from Georgia Tech, and a Master of Science in Computer Science through Bell Laboratories.
Mr. Tomas Eliasson
,
Non-executive Director and Chairman of the Audit Committee
. Mr. Tomas Eliasson was re-elected to the Board in May 2019. Mr. Eliasson, born in 1962, is Executive Vice President, Chief Financial Officer of Sandvik. Previously Mr. Eliasson was the Chief Financial Officer and Senior Vice-President of Electrolux, the Swedish appliances manufacturer. Mr. Eliasson has also held various management positions in Sweden and abroad, including ABB Group, Seco Tools AB and Assa Abloy AB. Mr. Eliasson holds a Bachelor of Science Degree in Business Administration and Economics from the University of Uppsala.
Ms. Mercedes Johnson
,
Non-executive Director and Member of the Audit Committee
. Ms. Johnson was first elected to the Board in May 2019. Ms. Johnson, born in 1954, also serves on the Board of Directors of three other NASDAQ technology companies - Synopsys, a provider of solutions for designing and verifying advanced silicon chips, Teradyne, a developer and supplier of automated semiconductor test equipment and Maxim Integrated Products, an integrated circuits designer and producer. During her executive career, Ms. Johnson held positions such as Chief Financial Officer of Avago Technologies (now Broadcom) and Chief Financial Officer of LAM Research Corporation. Ms. Johnson holds a degree in Accounting from the University of Buenos Aires.
Mr. Lars-Åke Norling
,
Non-executive Director, Member of the Compensation Committee and of the Compliance and Business Conduct Committee.
Mr. Norling was re-elected to the Board in May 2019. Mr. Norling, born in 1968, is the CEO of Nordnet since September 2019 and was previously an Investment Director and Sector Head of TMT at Kinnevik AB. Prior to that, he was the Chief Executive Officer of Total Access Communications (dtac) in Thailand where he executed a digital transformation and led a turnaround of the company’s financial performance. He has also been EVP of Developed Asia for Telenor as well as Chief Executive Officer of DigiTelecommunications Malaysia and CEO of Telenor Sweden. Mr. Norling holds an MBA from Gothenburg School of Economics, an MSc in Engineering Physics from Uppsala University and an MSc in Systems Engineering from Case Western Reserve University, USA.
Mr. James Thompson,
Non-executive Director, Member of the Audit Committee and Member of the Compensation Committee.
Mr. Thompson was re-elected to the Board in May 2019. Mr. Thompson, born in 1961, is a Managing Principal at Kingfisher Family Office. He is also a non-executive Director of C&C Group plc and serves on its Audit Committee. Previously, he was a Managing Principal at Southeastern Asset Management. Between 2001 and 2006, he opened and managed Southeastern Asset Management’s London research office. Mr. Thompson holds an MBA from Darden School at the University of Virginia, and a Bachelor’s degree in Business Administration from the University of North Carolina.
Members of the Executive Committee
The following table lists the names and positions of the members of our Executive Committee.
|
Name
|
Position
|
|
|
Mr. Mauricio Ramos
|
President and Chief Executive Officer
|
|
|
Mr. Tim Pennington
|
Senior Executive Vice President, Chief Financial Officer
|
|
|
Mr. Esteban Iriarte
|
Executive Vice President, Chief Operating Officer, Latin America
|
|
|
Mr. Xavier Rocoplan
|
Executive Vice President, Chief Technology and Information Officer
|
|
|
Ms. Rachel Samrén
|
Executive Vice President, Chief External Affairs Officer
|
|
|
Mr. Salvador Escalón
|
Executive Vice President, General Counsel
|
|
|
Ms. Susy Bobenrieth
|
Executive Vice President, Chief Human Resources Officer
|
|
|
Mr. HL Rogers *
|
Executive Vice President, Chief Ethics and Compliance Officer
|
|
*
Until his resignation on January 1, 2020
Biographical information of the members of our Executive Committee is set forth below.
Mr. Mauricio Ramos
,
President and Chief Executive Officer
. Mr. Mauricio Ramos, born in 1968, joined Millicom in April 2015 as CEO. Before joining Millicom, he was President of Liberty Global’s Latin American division, a position he held from 2006 until February 2015. During his career at Liberty Global, Mr. Ramos held several leadership roles, including positions as Chairman and CEO of VTR in Chile and President of Liberty Puerto Rico. Mr. Ramos is also a member of the Board of Directors of Charter Communications (US). Mr. Ramos formerly served as Chairman of TEPAL, the Latin American Association of Cable Broadband Operators and is a former Member of the Board of Directors of the GSMA. He received a degree in Economics, a degree in Law, and a postgraduate degree in Financial Law from Universidad de los Andes in Bogota.
Mr. Tim Pennington
,
Senior Executive Vice President, Chief Financial Officer
. Mr. Tim Pennington, born in 1960, joined Millicom in June 2014 as Senior Executive Vice President, Chief Financial Officer. He also currently serves as a
non-executive director of Euromoney Institutional Investor plc. Previously, he was the Chief Financial Officer at Cable and Wireless Communications plc, Group Finance Director for Cable and Wireless plc and, prior to that, CFO of Hutchison Telecommunications International Ltd, based in Hong Kong. Mr. Pennington was also Finance Director of Hutchison 3G (UK), Hutchison Whampoa’s British mobile business. He also has corporate finance experience, firstly as a Director at Samuel Montagu & Co. Limited, and then as Managing Director of HSBC Investment Bank within its Corporate Finance and Advisory Department. He has a BA (Honours) degree in Economics and Social Studies from the University of Manchester.
Mr. Esteban Iriarte
,
Executive Vice President, Chief Operating Officer, Latin America
. Mr. Esteban Iriarte, born in 1972, was appointed as Executive Vice President, Chief Operating Officer (COO), Latin America in August 2016. Previously, Mr. Iriarte was General Manager of Millicom’s Colombian businesses where, in 2014, he led the merger and integration of Tigo and the fixed-line company UNE. Prior to leading Tigo Colombia, Mr. Iriarte was head of Millicom’s regional Home and B2B divisions. From 2009 to 2011, he was CEO of Amnet, a leading service provider in Central America for broadband, cable TV, fixed line and data services that was bought by Millicom in 2008. In 2016 Mr. Iriarte joined the board of Sura Asset Management. Sura is one of Latin America’s biggest financial groups. Mr. Iriarte received a degree in Business Administration from the Pontificia Universidad Catolica Argentina “Santa Maria de los Buenos Aires”, and an MBA from the Universidad Austral in Buenos Aires.
Mr. Xavier Rocoplan
,
Executive Vice President, Chief Technology and Information Officer
. Mr. Xavier Rocoplan, born in 1974, started working with Millicom in 2000 and joined the Executive Committee as Chief Technology and IT Officer in December 2012. Mr. Rocoplan is currently heading all mobile and fixed network and IT activities across the Group as well as all Procurement & Supply Chain. Mr. Rocoplan first joined Millicom in 2000 as CTO in Vietnam and subsequently for South East Asia. In 2004, he was appointed CEO of Millicom’s subsidiary in Pakistan (Paktel), a role he held until mid-2007. During this time, Mr. Rocoplan launched Paktel’s GSM operation and led the process that was concluded with the disposal of the business in 2007. He was then appointed as head of Corporate Business Development, where he managed the disposal of various Millicom operations (e.g. Asia), the monetization of Millicom infrastructure assets (towers) as well as numerous spectrum acquisitions and license renewal processes in Africa and in Latin America. Mr. Rocoplan holds Masters degrees in engineering from Ecole Nationale Supérieure des Télécommunications de Paris and in economics from Université Paris IX Dauphine.
Ms. Rachel Samrén
,
Executive Vice President, Chief External Affairs Officer
. Ms. Rachel Samrén, born in 1974, joined Millicom in July 2014 and manages the Group’s Government Relations, Regulatory Affairs, Corporate Communications, Corporate Responsibility, and Security & Crisis Management functions. Her focus is on driving Millicom’s global engagement with particular responsibility for special situation strategies. Ms. Samrén’s background is in the risk management consulting sector, most recently as Head of Business Intelligence at The Risk Advisory Group plc. Previously, she worked for Citigroup as well as non-governmental and governmental organizations. Ms. Samrén currently serves on the Board of MIC Tanzania Limited. She holds a BSc in International Relations from the London School of Economics and an MLitt in International Security Studies from the University of St Andrews.
Mr. Salvador Escalón
, Executive Vice President, General Counsel.
Mr. Salvador Escalón, born in 1975, was appointed as Millicom’s General Counsel in March 2013 and became Executive Vice President in July 2015. Mr. Escalón leads Millicom’s legal team and advises the Board of Directors and senior management on legal and governance matters. He joined Millicom as Associate General Counsel Latin America in April 2010. In this role, he successfully led legal negotiations for the merger of Millicom’s Colombian operations with UNE-EPM Telecomunicaciones S.A., as well as the acquisition of Cablevision Paraguay. From January 2006 to March 2010, Mr. Escalón was Senior Counsel at Chevron Corporation, with responsibility for legal matters relating to Chevron’s downstream operations in Latin America. Previously, he was in private practice at the law firms Skadden, Morgan Lewis and Akerman Senterfitt. Mr. Escalón has a J.D. from Columbia Law School and a B.B.A. in Finance and International Business from Florida International University.
Ms. Susy Bobenrieth
,
Executive Vice President, Chief Human Resources Officer
. Ms. Susy Bobenrieth, a global Human Resource professional, born in 1965, joined Millicom in October 2017 with over 25 years of experience in major multi-national companies that include Nike Inc., American President Lines and IBM. As an ex-Nike Executive, she has extensive international knowledge and proven results in leading large scale organizational transformations, driving talent management agenda and leading teams. She is passionate about building great businesses and winning with high performing teams. Ms. Bobenrieth has deep international experience having lived and worked in Mexico, USA, Brazil, Netherlands, and Spain. She received a degree from the University of Maryland, University College in 1989.
Mr. HL Rogers
,
Executive Vice President, Chief Ethics and Compliance Officer (until January 1, 2020)
. Mr. HL Rogers, born in 1977, joined Millicom in August 2016 as Chief Ethics and Compliance Officer. As the leader of Millicom’s Compliance function he is committed to maintaining a world-class compliance program. Previously, he was partner in the Washington DC office of international law firm Sidney Austin LLP where he represented individual, corporate and government clients in compliance issues and complex litigation. Throughout this period, Mr. Rogers
developed a wealth of experience in setting up and managing compliance programs, strengthening compliance policies and procedures, as well as conducting training and development. He has also assisted many large corporations in negotiations with authorities in multiple jurisdictions. Mr. Rogers clerked for Judge Thomas Griffith of the United States Court of Appeals for the District of Columbia Circuit in 2005. He received his J.D. from Harvard Law School in 2004 and has published several articles on compliance and ethics matters within the corporate setting. In 2001, HL received his BA degree in English from Brigham Young University. HL Rogers resigned from Millicom on January 1, 2020.
B. Compensation
For the financial year ended December 31, 2019, the total compensation paid to MIC S.A.’s directors was $1.9 million and to executive management the total cash compensation plus benefits (excluding pension) was $12.2 million. The total amounts set aside or accrued by Millicom to provide pension, retirement or similar benefits for directors and executive management was $1.2 million.
The Company provides information on the individual compensation of its directors and certain members of its executive management in its annual report filed with the
Registre de Commerce et des Sociétés
(Luxembourg Trade and Companies Register), the
Société de la Bourse de Luxembourg S.A.
(Luxembourg Stock Exchange) and the
Commission de Surveillance du Secteur Financier
(CSSF). As that annual report is made publicly available, the relevant individual compensation information it contains for directors and executive management is included below.
Remuneration of Directors
The remuneration of the members of the Board of Directors comprises an annual fee and shares of MIC S.A. common stock. Director remuneration is proposed by the Nomination Committee and approved by the shareholders at the Annual General Meeting or other shareholders’ meetings. Director remuneration for the year ended December 31, 2019 is set forth in the following table.
|
Board and committees
|
Remuneration 2019 (1)
|
|
|
|
(USD '000)
|
|
||
|
Directors
|
|||
|
Mr. José Antonio Ríos García
|
366
|
|
|
|
Ms. Pernille Erenbjerg
|
350
|
|
|
|
Mr. Odilon Almeida
|
173
|
|
|
|
Ms. Janet Davidson
|
186
|
|
|
|
Mr. Tomas Eliasson
|
211
|
|
|
|
Ms. Mercedes Johnson
|
173
|
|
|
|
Mr. Lars-Åke Norling
|
206
|
|
|
|
Mr. James Thompson
|
242
|
|
|
|
Former Directors (until January 2019):
|
|||
|
Mr. Tom Boardman
|
—
|
|
|
|
Mr. Anders Jensen
|
—
|
|
|
|
Former Directors (until May 2019):
|
|||
|
Mr. Roger Solé Rafols
|
16
|
|
|
|
Total (US$ ‘000)
|
1,923
|
|
|
|
(1)
|
Remuneration covers the period from January 7, 2019 to the date of the AGM in May 2020 as resolved at the shareholder meetings on January 7, 2019 and May 2, 2019 respectively. Share based compensation for the period from January 7, 2019 to May 2, 2019 based on the market value of Millicom shares on January 9, 2019 (in total 2,876 shares) and for the period from
|
May 2, 2019 to May 2020 based on the market value of Millicom shares on May 6, 2019 (in total 16,607 shares). Net remuneration for the period from May 2, 2019 to May 2020 comprised
73%
in shares and
27%
in cash.
At the AGM held on May 2, 2019, MIC S.A.’s shareholders approved the compensation for the eight directors expected to serve from that date until the 2020 AGM consisting of two components: (i) cash-based compensation and (ii) share-based compensation. The share-based compensation is in the form of fully paid-up shares of MIC S.A. common stock. Such shares are provided from the Company’s treasury shares or alternatively issued within MIC S.A.’s authorized share capital exclusively in exchange for the allocation from the premium reserve (i.e., for nil consideration from the relevant directors), in each case divided by the MIC S.A. share closing price on the Nasdaq Stock Market on May 6, 2019, or US$57.20 per share, provided that shares shall not be issued below the par value.
In respect of directors who do not serve an entire term from the 2019 AGM until the 2020 AGM, the fee-based and the share-based compensation is pro-rated
pro rata temporis
.
Remuneration of Executive Management
The remuneration of executive management of MIC S.A. comprises an annual base salary, an annual bonus, share based compensation, social security contributions, pension contributions and other benefits. Bonus and share based compensation plans are based on actual and future performance. See “—Share Incentive Plans.” Share based compensation is granted once a year by the Compensation Committee of the Board.
If the employment of MIC S.A.’s senior executives is terminated, other than for cause, severance of up to 12 months’ salary is potentially payable, with the amount of severance calculated based on whichever is the greater of the seniority severance calculation for the terminated executive or the notice period provided in the terminated executive’s employment contract, if applicable.
The annual base salary and other benefits of the Chief Executive Officer (“CEO”) and the Executive Vice Presidents (“EVPs”) (collectively, the “Executive Team”) are proposed by the Compensation Committee and approved by the Board.
The remuneration charge for the Executive Team and the share ownership and unvested share awards beneficially granted to the Executive Team in the year ended
December 31, 2019
are set forth in the following tables.
|
Remuneration charge for the Executive Team for 2019
|
CEO
|
CFO
|
Executive Team(8)
|
||||||
|
(US$ ‘000)
|
|||||||||
|
Base salary
|
1,167
|
|
654
|
|
3,498
|
|
|||
|
Bonus
|
1,428
|
|
626
|
|
2,098
|
|
|||
|
Pension
|
279
|
|
98
|
|
798
|
|
|||
|
Other benefits
|
50
|
|
260
|
|
1,521
|
|
|||
|
Termination benefits
|
—
|
|
—
|
|
863
|
|
|||
|
Total before share based compensation
|
2,924
|
|
1,639
|
|
8,779
|
|
|||
|
Share based compensation(i)(ii) in respect of 2019 LTIP
|
5,625
|
|
1,576
|
|
5,965
|
|
|||
|
Total
|
8,549
|
|
3,215
|
|
14,743
|
|
|||
|
(1)
|
See “—Share Incentive Plans.”
|
|
(2)
|
Share awards of
102,122
and
135,480
were granted in
2019
under the 2019 SIPs (as defined below) to the CEO and Executive Team (
2018
:
80,264
and
112,472
) respectively.
|
|
(3)
|
Including 8 EVPs, and excluding the CEO and CFO.
|
|
Compensation of the Executive Team 2019
|
CEO
|
CFO
|
Executives (8 members)
|
|||
|
Equity Compensation (number of shares)
|
||||||
|
Performance share plan(i)
|
40,565
|
|
20,030
|
|
55,756
|
|
|
Deferred share plan(ii) (for 2019 performance)
|
31,126
|
|
13,657
|
|
41,285
|
|
|
Total shares (number)
|
71,691
|
|
33,687
|
|
97,041
|
|
|
Value of shares(iii) ($ ’000)
|
3,383
|
|
1,592
|
|
4,582
|
|
(i) Vesting amounts relating to the 2017 performance share plan based on the estimated performance over the three year period. The value of shares is based on the closing market value of Millicom shares at December 31, 2019 of $48.23. These shares will vest on March 2020. Final performance metrics will be approved by the Remuneration Committee in March 2020.
(ii) Amounts to be granted relating to the 2020 deferred share plan (awarded in 2020 based on 2019 results). The value of shares is based on the average Q4 2019 closing market value of Millicom shares of $45.86. These shares will vest over three years from the award date with a vesting schedule 30%/30%/40%, dependent on continued service of the employee.
(iii) The value is calculated on the basis described above which differs from the value calculated for the IFRS financial statements.
|
Share ownership and unvested share awards granted from Company equity plans to the Executive Team
|
CEO
|
Executive Team(1)
|
Total
|
||||||
|
(number of shares)
|
|||||||||
|
Share ownership (vested from equity plans and otherwise acquired)
|
190,577
|
|
136,306
|
|
326,883
|
|
|||
|
Share awards not vested
|
236,211
|
|
334,193
|
|
570,404
|
|
|||
|
(1)
|
Including the CFO, 8 EVPs, and excluding the CEO.
|
Details of Share Purchase and Sale Activity
During 2019, Millicom’s CEO, Mr. Mauricio Ramos, acquired 45,000 Millicom shares.
Shareholding Requirements
Millicom’s share ownership policy sets out the Compensation Committee’s requirements on Global Senior Managers
to retain and hold a personal holding of common shares in the Company in order to align their interests with those of our shareholders. All Share Plan participants in the Global Senior Management Team (including all Executives) are required to own Millicom shares to a value of a percentage of their respective base salary as of January of the calendar year.
|
Unless this requirement is met each year, no vested Millicom shares can be sold by the individual.
|
2019
|
|
Global Senior Management Level
|
%
|
|
CEO
|
400
|
|
CFO
|
200
|
|
EVPs
|
100
|
|
General managers and VPs
|
50
|
Unless this requirement is met each year, no vested Millicom shares can be sold by the individual.
|
LTIP
|
Eligibility
|
Participants
|
Maximum shares
awarded
for 2019
|
Basis for
calculating award
|
Comment
|
|
2020 Deferred Share Plan (DSP)
|
CEO, CFO, other executives and other global senior management
|
245
|
377,578
|
20-100% of base salary
|
|
|
2019 Performance Share Plan (PSP)
|
CEO, CFO, other executives and other global senior management
|
44
|
257,601
|
400%**
|
CEO
|
|
175%**
|
CFO
|
||||
|
(50%-160%)**
|
Global senior management team
|
||||
* A limited number of high-potential employees and employees in key roles can be nominated by exception.
** Of base salary as per 01.01.2019
Compensation Guidelines
At the AGM held on May 2, 2019, MIC S.A.’s shareholders approved the following guidelines for remuneration and other employment terms for the senior management for the period up to the 2020 AGM.
The objectives of the guidelines are:
|
•
|
to ensure that MIC S.A. can attract, motivate and retain senior management, within the context of MIC S.A.’s international talent pool, which is mainly composed of telecommunications companies for the EVPs and above, and Mercer and Towers Watson local surveys.
|
|
•
|
to create incentives for senior management to execute strategic plans and deliver excellent operating results, with an emphasis on rewarding growth; and
|
|
•
|
to align the incentives of senior management with the interests of shareholders, including requiring substantial share ownership by all senior management.
|
Compensation shall be based on conditions that are market competitive in the United States and Europe and shall consist of a fixed salary and variable compensation, including the possibility of participation in the equity-based long-term incentive programs and pension schemes. These components shall create a well-balanced compensation reflecting individual performance and responsibility, both short-term and long-term, as well as MIC S.A.’s overall performance.
Base Salary
Senior management base salary shall be competitive and based on individual responsibilities and performance.
Variable Remuneration
The senior management may receive variable remuneration in addition to base salary. The variable remuneration consists of (a) a Short-term Incentive Plan (“STI”) and (b) a Long-term Incentive Plan (“LTI”).
The amounts and percentages for variable remuneration are based on pre-established goals and targets relating to the performance of both MIC S.A. and individual employees and are intended to be competitive as part of a total compensation package.
Short-Term Incentive Plan
The STI consists of two components: a cash bonus and a restricted deferred component: Deferred Share Plan ("DSP") or Deferred Cash Plan ("DCP") for Guatemala and Honduras joint ventures.
Eligibility for participation in the DSP or DCP is limited to members of MIC S.A.’s Global Senior Management, which comprises the CEO, the EVPs, Corporate Vice Presidents (“VPs”), Corporate Directors, Country General Managers
(“GM”), and Country-based Directors reporting directly to Country General Managers. Additionally, employees designated as being “key talents” or having “critical skills” may be nominated to participate in the DSP or DCP. During 2019,276 individuals were included in this group. Other employees participate in the STI and receive a cash bonus, but do not participate in the DSP or DCP.
The DSP is presented for approval each year at MIC S.A.’s AGM. To the extent that the AGM approves the DSP and thereby the granting of share awards under it to those participating in the DSP, the STI payout is delivered 50% through the cash bonus and 50% through the DSP. For those employees not participating in the DSP, or to the extent that the DSP is not approved by the AGM, the STI (including the portion that would have been provided as shares under the DSP) will be implemented as a cash-only bonus program.
Calculation Formula
The actual amount of compensation under the STI is based on the following formula:
Employee’s base salary X a pre-determined % of base salary X plan performance.
The plan performance is determined as a percentage achievement of financial, non-financial and personal performance measures, applied to a payout scale (with a performance level minimum). All measures are based on current financial year goals.
The 2020 DSP plan (granted in Q1 2020 based on 2019 results), MIC S.A. includes performance measures of service revenue, earnings before interest, tax, depreciation and amortization (“EBITDA”), operating free cash flow and net promoter score achievement. Additionally, the payout scale has a zero payout for achievement less than 95%, a 100% payout for 100% achievement and a 200% payout for 110% or more achievement. Finally, the 2020 DSP share awards will vest (generally subject to the participant still being employed by MIC S.A.) 30% in Q1 2021, 30% in Q1 2022 and 40% in Q1 2023.
Long-Term Incentive Plan
Eligibility for participation in the LTI is limited to members of MIC S.A.’s Global Executive Management, which is defined by MIC S.A.’s internal role grading structure and consists of the CEO, EVPs, VPs and GMs. During 2019, 46 individuals were included in this group, including certain employees of the Guatemala and Honduras joint ventures.
The 2020 LTI is a Performance Share Plan (“PSP”) or Performance Cash Plan ("PCP") for Guatemala and Honduras joint ventures. Share awards granted will vest 100% at the end of a three-year period, subject to performance conditions (as further described in “— Share Incentive Plans”).
Other Benefits
Other benefits can include, for example, a car allowance, medical coverage and, in limited cases, while on an expat assignment, housing allowance, school fees, home leave and other travel expenses.
Pension
The Global Senior Management are eligible to participate in a global pension plan, covering also death and disability insurance. The global pension plan is secured through premiums paid to insurance companies.
Notice of Termination and Severance Pay
If the employment of MIC S.A.’s most senior management is terminated, a notice period of up to 12 months potentially applies.
The Compensation Committee regularly reviews best practices in executive compensation and governance and revises our policies and practices when appropriate. For example, in 2019 we revised our change in control agreements for eligible executives to include "double-trigger" provisions, which require an involuntary termination (in addition to change in control) for accelerated vesting of awards.
Deviations from the Guidelines
In special circumstances, the Board of Directors may deviate from the above guidelines, for example additional variable remuneration in the case of exceptional performance.
Share Incentive Plans
MIC S.A. shares granted to management and key employee compensation includes share based compensation in the form of share incentive plans (“SIPs”). Since 2016, MIC S.A. has two types of plans, a PSP and a DSP. The PSP and DSP under which share awards were granted in 2017 are referred to as the “2017 SIPs.” The different plans are further detailed below.
Deferred share plan (issued from 2016 to 2018)
For the deferred awards plan, participants are granted shares based on past performance, with 16.5% of the shares vesting on January 1 of each of year one and two, and the remaining 67% on January 1 of year three. Vesting is conditional upon the participant remaining employed with MIC S.A. at each vesting date. Grants were made under the deferred awards plans in 2016, 2017 and 2018 based, respectively, on financial results for the years ended December 31, 2015, 2016 and 2017.
Deferred share plan (issued from 2019 to 2020)
At the 2018 AGM, guidelines concerning the new 2019 DSP were approved, though the DSP was not presented for approval until the 2019 AGM. See “—Compensation Guidelines—Variable Remuneration.” Grants were made under the new DSP in 2019 based on financial results for the year ended December 31, 2018, with 30% of the shares vesting on January 1st of each of year one and two, and the remaining 40% on January 1st of year three. The same conditions will apply for the 2020 DSP which will be based on financial results for the year ended December 31, 2019.
Performance share plan (issued in 2016 and 2017)
Shares granted under this PSP vest at the end of the three-year period, subject to performance conditions, 25% based on positive absolute TSR, 25% based on relative TSR and 50% based on actual compared to budgeted Free Cash Flow. The 2016 Plan vested in March 2019 and the 2017 Plan will vest in March 2020.
Performance share plan (issued from 2018 to 2020)
At the 2018 AGM, a new PSP for 2018 was approved. Shares granted in March 2018 under this PSP vest at the end of the three-year period, subject to performance conditions, 50% based on operating free cash flow with a specific three-year CAGR target, 25% based on service revenue with a specific three-year CAGR target, and 25% based on relative TSR. The 2018 Plan will vest in March 2021. The same rules apply for the 2019 and 2020 PSP plans, which will vest in March 2022 and March 2023, respectively.
The plan awards and shares expected to vest under the SIPs that have been approved are as follows:
|
2019 plans
|
2018 plans
|
2017 plans
|
2016 plans
|
|||||||||||||
|
Performance plan
|
Deferred plan
|
Performance plan
|
Deferred plan
|
Performance plan
|
Deferred plan
|
Performance plan
|
Deferred plan
|
|||||||||
|
(number of shares)
|
||||||||||||||||
|
Initial shares granted
|
257,601
|
|
320,840
|
|
237,196
|
|
262,317
|
|
279,807
|
|
438,505
|
|
200,617
|
|
287,316
|
|
|
Additional shares granted(i)
|
—
|
|
20,131
|
|
—
|
|
3,290
|
|
2,868
|
|
29,406
|
|
—
|
|
—
|
|
|
Revision for forfeitures
|
(17,182
|
)
|
(9,198
|
)
|
(27,494
|
)
|
(26,860
|
)
|
(40,946
|
)
|
(88,437
|
)
|
(49,164
|
)
|
(78,253
|
)
|
|
Revision for cancellations
|
—
|
|
—
|
|
(4,728
|
)
|
—
|
|
—
|
|
—
|
|
—
|
|
—
|
|
|
Total before issuances
|
240,419
|
|
331,773
|
|
204,974
|
|
238,747
|
|
241,729
|
|
379,474
|
|
151,453
|
|
209,063
|
|
|
Shares issued in 2017
|
—
|
|
—
|
|
—
|
|
—
|
|
—
|
|
(2,686
|
)
|
(1,214
|
)
|
(1,733
|
)
|
|
Shares issued in 2018
|
—
|
|
—
|
|
(97
|
)
|
(18,747
|
)
|
(2,724
|
)
|
(99,399
|
)
|
(752
|
)
|
(43,579
|
)
|
|
Shares issued in 2019
|
(150
|
)
|
(24,294
|
)
|
(3,109
|
)
|
(54,971
|
)
|
(19,143
|
)
|
(82,486
|
)
|
(149,487
|
)
|
(163,751
|
)
|
|
Performance conditions
|
|
|
|
|
—
|
|
—
|
|
—
|
|
—
|
|
—
|
|
—
|
|
|
Shares still expected to vest
|
240,269
|
|
307,479
|
|
201,768
|
|
165,029
|
|
219,862
|
|
194,903
|
|
—
|
|
—
|
|
|
Estimated cost over the vesting period (US$ millions)
|
11
|
|
18
|
|
12
|
|
14
|
|
10
|
|
20
|
|
8
|
|
12
|
|
|
(i)
|
Additional shares granted represent grants made for new joiners and/or as per CEO contractual arrangements.
|
C. Board Practices
MIC SA has a Nomination Committee which is appointed by the major shareholders of MIC S.A. It is not a committee of the MIC S.A. Board. The Nomination Committee’s role is to propose decisions to the shareholders’ meeting in a manner which promotes the common interests of all shareholders. The Nomination Committee has a term of office commencing at the time of its formation each year and ending when a new Nomination Committee is formed. Nomination Committee proposals to the AGM include:
|
•
|
The number of members of the Board of Directors, the candidates to be elected or re-elected as Directors of the Board and Chairman of the Board and their remuneration;
|
|
•
|
Appointment and remuneration of the external auditor;
|
|
•
|
Proposal of the Chairman of the AGM; and
|
|
•
|
The procedure for the appointment of the Nomination Committee
|
Under the terms of the Procedure on Appointment of the Nomination Committee and Determination of the Committee, the Nomination Committee consists of at least three members, appointed by the largest shareholders of Millicom who wish to assert the right to appoint a member. In accordance with the resolution of the 2019 AGM, in consultation with the largest shareholders as of the last business day of May 2019, the current Nomination Committee was formed on October 29, 2019. The members of the Nomination Committee are Mr. John Hernander, appointed by Nordea Investment Funds; Mr. Daniel Sievers, appointed by Fiduciary Management; Mr. Peter Guve, appointed by AMF Pensionsförsäkring AB; and Ms. Juanjuan Niska, appointed by Wellington Management. The members of the Nomination Committee appointed Mr. Hernander as Committee Chairman at their first meeting.
MIC S.A.’s Amended and Restated Articles of Association provide that the Board of Directors must comprise at least six members. The members of the Board of Directors are elected at the AGM which, as required by MIC S.A.’s Amended and Restated Articles of Association and the Luxembourg law of August 10, 1915 on Commercial Companies (as amended), must be held within six months of the end of the fiscal year. At the AGM held May 2, 2019, the number of MIC S.A.’s directors was set at eight and the current directors and the Chairman were elected until the time of the next AGM. The next AGM is scheduled to be held on May 5, 2020.
MIC S.A.’s Board of Directors has developed, and continuously evaluates, work procedures in line with the corporate governance rules of the Swedish Code of Corporate Governance (the “Swedish Code”) applicable to listed companies. MIC S.A. is subject to the Swedish Code as a company with its shares listed on the Nasdaq Stockholm, where they trade in the form of SDRs. From January 9, 2019, MIC S.A. is subject to the listing rules of the Nasdaq Stock Market in the US where its shares are traded.
MIC S.A.’s Board of Directors is responsible for Millicom’s strategy, financial objectives and operating plans and for oversight of governance. The Board of Directors also plans for management succession of the CEO and reviews plans for other senior management positions.
The Board of Directors selects the CEO, who is charged with the daily management of the Company and its business. The CEO is responsible for recruiting, and the Chairman of the Board is responsible for approving, the senior management of the Company. The Board reviews and approves plans for key senior management positions, and the Board supervises, supports and empowers the Executive Committee and monitors its performance. In addition to corporate law rules applicable in Luxembourg, the Swedish Code sets out that the division of work between the Board and the CEO is primarily set out in “The Rules of Procedure and Instruction to the CEO”.
The Board conducts an annual performance review process, wherein each Board member’s personal performance is also reviewed. The review process involves an assessment of the Board’s and its committees’ actions and activities during the year against the Board’s mandate as determined in the Board Charter (and those of its various committees). MIC S.A.’s Board of Directors also evaluates the performance of the CEO annually.
The work conducted by MIC S.A.’s Board of Directors is supported by the following committees:
|
•
|
the Audit Committee;
|
|
•
|
the Compensation Committee;
|
|
•
|
the Compliance and Business Conduct Committee.
|
The Board and each of its Committees have written approved charters which set out the objectives, limits of authority, organization and roles and responsibilities of the Board and its Committees.
Audit Committee
. MIC S.A.’s Board of Directors has delegated to the Audit Committee, as reflected in its charter, the responsibilities for oversight of the robustness, integrity and effectiveness of financial reporting, risk management, internal controls, internal audit, the external audit process, as well as compliance with related laws and regulations. The Audit Committee focuses particularly on compliance with financial requirements, accounting standards and judgments, appointment and independence of the external auditors, transactions with related parties (including major shareholders), the effectiveness of the internal audit function, the Millicom Group’s approach to risk management and ensuring that an efficient and effective system of internal controls is in place. Ultimate responsibility for reviewing and approving MIC S.A.’s Annual Report and Accounts remains with the Board. The members of the Audit Committee are Mr. Eliasson (Chairman and financial expert), Ms. Erenbjerg, Mr. Thompson and Ms. Johnson.
Compensation Committee
. Pursuant to its charter, the Compensation Committee reviews and makes recommendations to the Board of Directors regarding the compensation of the CEO and the other senior managers as well as management succession planning. The evaluation of the CEO is conducted by the Compensation Committee. The evaluation criteria and the results of the evaluation are then discussed by the Compensation Committee Chairman with the entire Board. The members of the Compensation Committee are Ms. Erenbjerg (Chairman), Mr. Norling and Mr. Thompson.
The Board, based on guidelines by the Compensation Committee, proposes the remuneration of senior management. Remuneration of the CEO requires Board approval. The guidelines for remuneration of senior management, including STI and LTI, and the share-based incentive plans for Millicom’s employees are approved by the shareholders at the AGM.
Compliance and Business Conduct Committee
. MIC S.A.’s Compliance and Business Conduct Committee oversees and makes recommendations to the Board regarding the Millicom Group’s compliance programs and standards of business conduct. More specifically, the Compliance and Business Conduct Committee:
|
•
|
monitors the Millicom Group’s compliance program, including the activities performed by the compliance team and its interaction with the rest of the organization;
|
|
•
|
monitors the results of investigations resulting from cases brought through the Millicom Group’s ethics line or otherwise;
|
|
•
|
oversees allocation of resources and personnel to the compliance area;
|
|
•
|
assesses the Millicom Group’s performance in the compliance area; and
|
|
•
|
ensures that the Millicom Group maintains proper standards of business conduct.
|
The members of the Compliance and Business Conduct Committee are Ms. Davidson (Chairman), Mr. Almeida and Mr. Norling.
Code of Conduct
. The Millicom Group’s Code of Conduct is adopted and approved by the Board of Directors. All directors, officers and employees must sign a statement acknowledging that they have read, understood and will comply with the Code of Conduct. Furthermore, all of our directors, officers and employees must complete an annual training on the Code of Conduct.
Directors’ Service Agreements
. None of MIC S.A.’s current directors have entered into service agreements with the Millicom Group or any of its subsidiaries providing for benefits upon termination of their respective directorships.
NASDAQ corporate governance exemptions
As a foreign private issuer incorporated in Luxembourg with its principal listing on the Nasdaq Stockholm, Millicom follows the laws of the Grand Duchy of Luxembourg, its “home country” corporate governance practices, in lieu of the provisions of the Nasdaq Stock Market’s Marketplace Rule 5600 series that apply to the constitution of a quorum for any meeting of shareholders, the composition and independence requirements of the Nominations Committee and the Compensation Committee and the requirement to have regularly scheduled meetings at which only independent directors are present. The Nasdaq Stock Market’s rules provide for a quorum of no less than 33
1
/
3
% of Millicom’s outstanding shares. However, Millicom’s Amended and Restated Articles of Association provide that no quorum is required. The Nasdaq Stock Market’s rules provide for the involvement of independent directors in the selection of director nominees. However, Millicom relies on its home country practices, in lieu of this requirement, which permit its director nominations committee to be comprised of shareholder representatives. See “Item 6. Directors, Senior Management and Employees—C.
Board Practices—Nomination Committee.” The Nasdaq Stock Market’s rules require each Compensation Committee member to be an independent director for purposes of the Nasdaq Stock Market’s Marketplace Rule 5605(d)(2). However, to preserve greater flexibility in who may be appointed to the Compensation Committee, Millicom will be relying on its home country practices, in lieu of this requirement, which do not require the Compensation Committee to be comprised solely of directors who qualify as independent for such purposes. The Nasdaq Stock Market’s rules require listed companies to have regularly scheduled meetings at which only independent directors are present. However, Millicom follows its home country practices instead, which do not impose such a requirement.
D. Employees
On average, the Millicom Group had approximately
22,375
employees in
2019
, and
21,403
employees in
2018
. Management believes that relations with the employees are good. Some of our employees belong to a union and approximately 26% of our employees participated in collective agreements on average during
2019
. The temporary employees of the Company corresponded to 6% of the average total number of employees in
2019
.
E. Share Ownership
The table below sets forth information regarding the beneficial ownership of our common shares as of
January 1, 2020
, by our directors and senior management. For purposes of this table, a person is deemed to have “beneficial ownership” of any shares as of a given date which such person has the right to acquire within 60 days after such date. For purposes of computing the percentage of outstanding shares held by each person, or group of persons, named above on a given date, any security which such person or persons has the right to acquire within 60 days after such date is deemed to be outstanding, but is not deemed to be outstanding for the purpose of computing the percentage ownership of any other person. Except as otherwise indicated, the holders listed below have sole voting and investment power with respect to all shares beneficially owned by them. They have the same voting rights as all other holders of common shares.
|
Shareholder
|
Common
Shares |
Percentage of Common Shares
|
||||
|
Mr. José Antonio Ríos García, Chairman of the Board of Directors
|
5,814
|
|
—
|
%
|
||
|
Ms. Pernille Erenbjerg, Deputy Chairman
|
3,320
|
|
—
|
%
|
||
|
Mr. Odilon Almeida, Director
|
5,086
|
|
—
|
%
|
||
|
Ms. Janet Davidson, Director
|
4,431
|
|
—
|
%
|
||
|
Mr. Tomas Eliasson, Director
|
5,703
|
|
—
|
%
|
||
|
Mr. Lars-Åke Norling, Director
|
2,836
|
|
—
|
%
|
||
|
Ms. Mercedes Johnson, Director
|
1,748
|
|
—
|
%
|
||
|
Mr. James Thompson, Director
|
9,155
|
|
—
|
%
|
||
|
Mr. Mauricio Ramos, President and Chief Executive Officer
|
190,577
|
|
—
|
%
|
||
|
Mr. Tim Pennington, Senior Executive Vice President, Chief Financial Officer
|
28,378
|
|
—
|
%
|
||
|
Mr. Esteban Iriarte, Executive Vice President, Chief Operating Officer, Latin America
|
29,657
|
|
—
|
%
|
||
|
Mr. Xavier Rocoplan, Executive Vice President. Chief Technology and Information Officer
|
38,533
|
|
—
|
%
|
||
|
Ms. Rachel Samrén, Executive Vice President, Chief External Affairs Officer
|
10,309
|
|
—
|
%
|
||
|
Mr. Salvador Escalon, Executive Vice President, General Counsel
|
28,940
|
|
—
|
%
|
||
|
Ms. Susy Bobenrieth, Executive Vice President, Chief Human Resources Officer
|
—
|
|
—
|
%
|
||
|
Mr. HL Rogers, Executive Vice President, Chief Compliance and Ethics Officer
|
1,592
|
|
—
|
%
|
||
|
Directors and members of the Executive Committee as a group
|
366,795
|
|
—
|
%
|
||
* less than 1%
None of the members the Company’s Board of Directors owns any options of the Company. The Company’s senior management and other key personnel do not own options or rights to purchase common shares under the share-based incentive plans. For more information, see “—B. Compensation.”
A. Major Shareholders
To the extent known to the Company, it is neither directly nor indirectly owned or controlled by another corporation, any government, or any other person. In addition, there are no arrangements, known to the Company, the operation of which may result in a change in its control in the future.
The table below sets out beneficial ownership of our common shares (directly or through SDRs), par value $1.50 each, by each person who beneficially owns more than 5% of our common stock at
December 31, 2019
.
|
Name of Shareholder
|
Common Shares
|
Percentage of Share Capital
|
||||
|
Dodge & Cox (1)
|
9,380,493
|
|
9.2
|
%
|
||
|
Swedbank Robur Fonder AB (2)
|
5,276,526
|
|
5.2
|
%
|
||
|
(1)
|
As of December 31, 2019, Dodge & Cox held
9,380,493
of our common shares (
9.2%
of common shares then outstanding). As of December 31, 2018, Dodge & Cox held 8,128,305 of our common shares (8.0% of common shares then outstanding). As of December 31, 2017, Dodge & Cox held 10,744,648 of our common shares (10.6% of common shares then outstanding).
|
|
(2)
|
As of
December 31, 2019
, Swedbank Robur Fonder AB held
5,276,526
of our common shares (
5.2%
of common shares then outstanding). As of
December 31, 2018
, Swedbank Robur Fonder AB held 1,508,980 of our common shares (1.5% of common shares then outstanding). As of December 31, 2017, Swedbank Robur Fonder AB held 1,096,317 of our common shares (1.1% of common shares then outstanding).
|
On November 7, 2019, the shareholders of Kinnevik, who held 37,835,438 of our common shares (37.2% of our shares then outstanding) as of December 31, 2018, agreed to distribute Kinnevik’s shareholding in Millicom to existing Kinnevik shareholders through a share redemption plan. Each ordinary share in Kinnevik (irrespective of share class) was entitled to one redemption share, and each redemption share was entitled to 0.1372 Millicom SDRs. The record date for the share split and the right to receive redemption shares was November 14, 2019, and since that date, Kinnevik is no longer a related party or shareholder in Millicom. The redemption shares were traded on Nasdaq Stockholm from and including November 15, 2019 to and including November 29, 2019. Millicom SDRs were paid out to the holders of redemption shares on December 3, 2019.
Except as otherwise indicated, the holders listed above (“holders”) have sole voting and investment power with respect to all shares beneficially owned by them. The holders have the same voting rights as all other holders of MIC S.A. common stock. For purposes of this table, a person or group of persons is deemed to have “beneficial ownership” of any shares as of a given date which such person or group of persons has the right to acquire within 60 days after such date. For purposes of computing the percentage of outstanding shares held by the holders on a given date, any security which such holder has the right to acquire within 60 days after such date (including shares which may be acquired upon exercise of vested portions of share options) is deemed to be outstanding, but is not deemed to be outstanding for the purpose of computing the percentage ownership of any other person.
Based upon the SDR ownership reported by Euroclear Sweden AB, as of
December 31, 2019
there were 174 SDR holders in the United States holding 26,874,945 SDRs (representing 26.4% of the outstanding share capital as of such date). According to the records held by American Stock Transfer & Trust Company (“AST”) reported as of
December 31, 2019
, there were 83 shareholders in the United States holding 7,896,200 common shares (representing 7.8% of the outstanding share capital as of such date).
However, these figures may not be an accurate representation of the number of beneficial holders nor their actual location because most of the common shares and SDRs were held for the account of brokers or other nominees.
B. Related Party Transactions
The disclosure as to related party transactions in our audited consolidated financial statements is in some respects broader than that required by Form 20-F. As required by Form 20-F, “related parties” includes enterprises that control, are controlled by or are under common control with MIC S.A., associates, individuals owning directly or indirectly an interest in the voting power of the Company that gives them significant influence over MIC S.A., close family members of such persons, key management personnel (including directors and senior management) and any enterprises in which a substantial interest in the voting power is owned, directly or indirectly, by certain of the persons listed above. For the purposes of note G.5 to our audited consolidated financial statements, related parties also includes the entities described below, which
is beyond the scope of the Form 20-F definition. Nonetheless, for purposes of consistency of presentation, we use the broader definition of related parties used in our audited consolidated financial statements for purposes of this Item 7.B.
The Company conducts transactions with certain related parties on normal commercial terms and conditions. The Millicom Group’s significant related parties are:
Kinnevik AB (Kinnevik) and subsidiaries
, Millicom’s previous principal shareholder - until November 14, 2019, date on which Millicom SDRs were paid out to the shareholders of Kinnevik.
Helios Towers Africa Ltd (HTA),
in which Millicom held a direct or indirect equity interest - until October 15, 2019, date on which Millicom lost significant influence on HTA and started accounting for its investments at fair value under IFRS 9.
EPM and subsidiaries (EPM)
, the non-controlling shareholder in our Colombian operations.
Miffin Associates Corp and subsidiaries (Miffin),
our joint venture partner in Guatemala.
Cable Onda partners and subsidiaries,
the non-controlling shareholders in our Panama operations.
Kinnevik
Kinnevik is a Swedish company with interests in the telecommunications, media, publishing, paper and financial services industries. For most of 2019, Kinnevik was Millicom's largest shareholder and the beneficial owner of approximately 37.2% of MIC S.A.’s share capital. However, as at
December 31, 2019
, Kinnevik no longer owns any beneficial interest in Millicom.
During the years 2019, 2018, 2017 and 2016, the Company purchased services from Kinnevik subsidiaries including fraud detection, procurement and professional services. Transactions and balances with Kinnevik Group companies are disclosed under Other in the tables below.
Helios Towers
Millicom sold its tower assets and leased back a portion of space on the towers in several African countries and contracted for related operation and management services with HTA. The Millicom Group has future lease commitments in respect of the tower companies. Millicom’s investments in Helios Towers Africa Ltd (HTA) have been listed during 2019, and Millicom resigned from its board of directors' positions, thereby terminating its significant influence on HTA.
Empresas Públicas de Medellín (EPM)
EPM is a state-owned, industrial and commercial enterprise, owned by the municipality of Medellin, and provides electricity, gas, water, sanitation, and telecommunications. EPM owns 50% of our operations in Colombia.
Miffin Associates Corp (Miffin)
The Millicom Group purchases and sells products and services from Miffin Group. Transactions with Miffin represent recurring commercial operations such as purchase of handsets, and sale of airtime.
Cable Onda Partners
Our partners in Panama are the non-controlling shareholders of Cable Onda and own 20% of the company, and indirectly 20% of Telefonica Moviles Panama, S.A., which was acquired by Cable Onda in August 2019. Additionally, they also hold interests in several entities which have purchasing and selling recurring commercial operations with Cable Onda (such as the sale of content costs, delivery of broadband services, etc.).
The Company had the following expenses and income and gains from transactions with related parties for the periods indicated:
|
Year ended December 31
|
||||||||
|
Expenses from transactions with related parties
|
2019
|
2018
|
2017
|
|||||
|
(US$ millions)
|
||||||||
|
Purchases of goods and services from Miffin
|
(209
|
)
|
(173
|
)
|
(181
|
)
|
||
|
Purchases of goods and services from EPM
|
(42
|
)
|
(40
|
)
|
(36
|
)
|
||
|
Lease of towers and related services from HTA(i)
|
(146
|
)
|
(28
|
)
|
(28
|
)
|
||
|
Other expenses
|
(15
|
)
|
(3
|
)
|
(4
|
)
|
||
|
Total
|
(412
|
)
|
(244
|
)
|
(250
|
)
|
||
(i) HTA ceased to be a related party on October 15, 2019.
|
Year ended December 31
|
||||||||
|
Income and gains from transactions with related parties
|
2019
|
2018
|
2017
|
|||||
|
(US$ millions)
|
||||||||
|
Sale of goods and services to Miffin
|
306
|
|
284
|
|
277
|
|
||
|
Sale of goods and services to EPM
|
13
|
|
17
|
|
18
|
|
||
|
Other revenue
|
3
|
|
2
|
|
1
|
|
||
|
Total
|
322
|
|
303
|
|
295
|
|
||
As at December 31, the Company had the following balances with related parties:
|
2019
|
2018
|
||||
|
(US$ millions)
|
|||||
|
Non-current and current liabilities
|
|||||
|
Payables to Guatemala joint venture(i)
|
361
|
|
315
|
|
|
|
Payables to Honduras joint venture(ii)
|
133
|
|
143
|
|
|
|
Payables to EPM
|
37
|
|
14
|
|
|
|
Payables to Panama non-controlling interests
|
—
|
|
—
|
|
|
|
Other accounts payable
|
—
|
|
9
|
|
|
|
Sub-total
|
531
|
|
482
|
|
|
|
(Finance) Lease liabilities to HTA (iii)
|
—
|
|
99
|
|
|
|
Total
|
531
|
|
580
|
|
|
(i) Shareholder loans bearing interest. Out of the amount above,
$337 million
are due over more than one year.
(ii) Amount payable mainly consist of dividend advances for which dividends are expected to be declared later in 2019 and/or shareholder loans.
(iii) HTA ceased to be a related party on October 15, 2019.
|
2019
|
2018
|
||||
|
(US$ millions)
|
|||||
|
Non-current and current assets
|
|||||
|
Receivables from EPM
|
3
|
|
5
|
|
|
|
Receivables from Guatemala and Honduras joint ventures
|
23
|
|
20
|
|
|
|
Advance payments to Helios Towers Tanzania(ii)
|
—
|
|
6
|
|
|
|
Receivables from Panama
|
—
|
|
—
|
|
|
|
Receivable from AirtelTigo Ghana (i)
|
43
|
|
41
|
|
|
|
Other accounts receivable
|
4
|
|
1
|
|
|
|
Total
|
73
|
|
73
|
|
|
(i) Disclosed under Other non-current assets in the statement of financial position.
(ii) HTA ceased to be a related party on October 15, 2019.
C. Interests of Experts and Counsel
Not applicable to Annual Report filing.
A. Consolidated Statements and Other Financial Information
Financial Statements
Consolidated financial statements are set forth under “Item 18. Financial Statements.”
Legal Proceedings
General litigation
In the ordinary course of business, Millicom is a party to various litigation or arbitration matters in each jurisdiction in which we operate. The principal categories of litigation to which we are subject include the following:
|
•
|
commercial claims, which include claims from third-party dealers, suppliers and customers alleging breaches or improper terminations of commercial agreements, or the charging of fees not in compliance with applicable law;
|
|
•
|
regulatory claims, which consist primarily of consumer claims, as well as complaints regarding the locations of antennae and other equipment, mostly in Colombia and El Salvador; and
|
|
•
|
labor and employment claims, including claims for wrongful termination and unpaid severance or other benefits.
|
By category of litigation, commercial claims account for a majority of the litigation matters to which we are party by both number of cases and total potential exposure based on the amount claimed.
By geography, litigation matters in Colombia represent a majority of the litigation matters to which we are party by both number of cases and total potential exposure. This is due to the size of our operations in Colombia, the comparatively high general prevalence of litigation there, and consumer protection and quality of service regulations which facilitate claims against telecommunications companies.
For additional details, see note G.3.1 of our audited consolidated financial statements.
Tax disputes
In addition to the litigation matters describe above, we have ongoing tax claims and disputes in most of our markets. Generally, these disputes relate to differences with the tax authorities following their completion of audits for prior tax years dating back to 2007 or challenges by the tax authorities to our interpretation of tax regulations. Examples of these challenges and disputes relate to issues such as the following:
|
•
|
the applicability, deductibility or reporting of VAT or sales tax in Honduras, Costa Rica and Tanzania;
|
|
•
|
withholding tax payable on commissions, services fees and finance leases in Bolivia, El Salvador, Guatemala, Honduras, Paraguay and Tanzania;
|
|
•
|
the application of stamp tax on dividend payments in Guatemala;
|
|
•
|
the deductibility of expenses and interest on shareholder loans and other debt instruments in El Salvador and Tanzania;
|
|
•
|
the deductibility of management, royalty and service fees paid to MIC S.A. by our operations in Bolivia, Costa Rica, El Salvador, Honduras and Tanzania;
|
|
•
|
deductibility of commissions and discounts on handsets in Honduras;
|
|
•
|
the deductibility of expenses for depreciation and amortization in Colombia, Guatemala and Paraguay;
|
|
•
|
the application of the territoriality principle in the determination of the taxable base of municipal taxes in Colombia and Nicaragua and
|
|
•
|
the application of withholding taxes on dividends in Nicaragua.
|
In many instances, the tax authorities seek to impose substantial penalties and interest charges while the disputed amounts remain unpaid, as we seek resolution through negotiations or court proceedings, resulting in significantly higher total claims than we expect the tax authorities will receive once the matter has been finally resolved. We work with the local tax authorities to substantiate claims or negotiate settlement amounts to close an audit, except in those instances where we are challenging or appealing the tax authorities’ claims.
For additional details, see note G.3.2 of our audited consolidated financial statements.
Dividend and Share Buyback Program(s)
Holders of MIC S.A. common shares (and SDRs) are entitled to receive dividends proportionately when, as and if declared by the Company’s Board of Directors and approved by shareholders at the AGM, subject to Luxembourg legal reserve requirements, as well as restrictions in the agreements governing our indebtedness.
On May 2, 2019, a dividend distribution of $2.64 per share (or
$267,571,480
in the aggregate) from MIC S.A.'s profit or loss brought forward account at December 31, 2018, was approved by the shareholders at the AGM to be distributed in two equal installments, one of which was paid on May 10, 2019 and the other of which was paid on November 12, 2019.
On May 4, 2018, a dividend distribution of $2.64 per share (or $266,022,071 in the aggregate) from MIC S.A.’s profit or loss brought forward account at December 31, 2017, was approved by the shareholders at the AGM and distributed in two equal installments, one of which was paid on May 15, 2018 and the other of which was paid on November 14, 2018.
On May 4, 2017, a dividend distribution of $2.64 per share (or $265,416,542 in the aggregate) from MIC S.A.’s profit or loss brought forward account at December 31, 2016, was approved by the shareholders at the AGM and distributed on May 12, 2017.
B. Significant Changes
No significant changes have occurred other than as described in this Annual Report since the date of our most recent audited financial statements.
A. Offer and Listing Details
The principal trading market of MIC S.A.’s shares is currently NASDAQ Stockholm, where MIC S.A.’s shares are listed and trade in the form of SDRs. Each SDR represents one share. MIC S.A. does not intend to list its SDRs on any national securities exchange in the United States.
Since January 9, 2019, MIC S.A.’s common shares have been listed on the Nasdaq Stock Market’s Global Select Market (the “Nasdaq Global Select Market”) in the United States. MIC S.A.’s common shares had previously been listed on the Nasdaq Global Select Market until May 27, 2011.
B. Plan of Distribution
Not applicable to Annual Report filing.
C. Markets
The SDRs are listed on the main market of NASDAQ Stockholm under the symbol “MIC_SDB.” NASDAQ Stockholm is a regulated market in accordance with the Swedish Securities Market Act and is subject to regulation and supervision by the Swedish Financial Supervisory Authority. The Swedish Securities Market Act provides for the regulation and supervision of the Swedish securities markets and market participants, and the Swedish Financial Supervisory Authority implements such regulation and supervision.
MIC S.A.’s common shares are listed on the Nasdaq Global Select Market in the United States under the symbol “TIGO.”
D. Selling Shareholders
Not applicable to Annual Report filing.
E. Dilution
Not applicable to Annual Report filing.
F. Expenses of the Issue
Not applicable to Annual Report filing.
A. Share Capital
Not applicable to Annual Report filing.
B. Memorandum and Articles of Association
Articles of Association
Registration and Object
Millicom International Cellular S.A. is a public limited liability company (
société anonyme
) governed by the Luxembourg law of August 10, 1915 on Commercial Companies (as amended), incorporated on June 16, 1992, and registered with the Luxembourg Trade and Companies’ Register (
Registre du Commerce et des Sociétés de Luxembourg
) under number B 40.630.
The articles of association of MIC S.A. define its purpose
inter alia
as follows: “... to engage in all transactions pertaining directly or indirectly to the acquisition and holding of participating interests, in any form whatsoever, in any Luxembourg or foreign business enterprise, including but not limited to, the administration, management, control and development of any such enterprise”. At the extraordinary general meeting of shareholders held on January 7, 2019, the shareholders adopted the Amended and Restated Articles of Association, filed herewith as Exhibit 1.1.
Directors
Restrictions on Voting
If a director has a personal material interest in a proposal, arrangement or contract to be decided by MIC S.A., the amended and restated articles of association provide that the validity of the decision of MIC S.A. is not affected by a conflict of interest existing with respect to a director. However, any such personal interest must be disclosed to the Board of Directors ahead of the vote and the relevant director shall abstain from considering and voting on the relevant issue. Such conflict of interest must be reported to the next general meeting of shareholders.
Compensation and Nomination
The decision on annual remuneration of directors (“
tantièmes
”) is reserved by the amended and restated articles of association to the general meeting of shareholders. Directors are therefore prevented from voting on their own compensation. However, directors may vote on the number of shares they own, including the shares allotted under any share based compensation scheme.
The Nomination Committee makes recommendations for the election of directors to the AGM. At the AGM, shareholders may vote for or against the directors proposed or may abstain. The Nomination Committee reviews and recommends the directors’ fees which are approved by the shareholders at the AGM.
In proposing persons to be elected as directors at the AGM, the Company must comply with the nomination committee rules of the Swedish Code of Corporate Governance, so long as such compliance does not conflict with applicable mandatory law or regulation or the mandatory rules of any stock exchange on which the Company's shares are listed. In the event that the Company does not comply with the nomination committee rules of the Swedish Code of Corporate Governance and a committee of the Board is established to propose persons to be elected as directors at the AGM, any Shareholder holding at least 20% of the issued and outstanding shares of the Company, excluding treasury shares, has the right to designate: (1) one of the then-serving directors to be a member of such committee, so long as such designation and the director so designated meet the requirements of any applicable mandatory law or regulation or the mandatory rules of any stock exchange on which the Company's shares are listed, and (2) one person, who may or may not be a director, to attend any meeting of such committee as an observer, without the right to vote at such meeting, so long as such attendance does not conflict with applicable mandatory law or regulation or the mandatory rules of any stock exchange on which the Company's shares are listed. Any designation made pursuant to this provision lapses upon such designating Shareholder holding less than 20% of the issued and outstanding shares of the Company, excluding treasury shares.
Borrowing Powers
The directors generally have unrestricted borrowing powers on behalf of and for the benefit of MIC S.A.
Age Limit
There is no age limit for being a director of MIC S.A. Directors could be elected for a maximum period of six years, but the Company has followed the practice of electing them annually at the AGM.
Share Ownership Requirements
Directors need not be shareholders in MIC S.A.
Shares
Rights Attached to the Shares
MIC S.A. has only one class of shares, common shares, and each share entitles its holder to:
|
•
|
one vote at the general meeting of shareholders,
|
|
•
|
receive dividends when such distributions are decided, and
|
|
•
|
share in any surplus left after the payment of all the creditors in the event of liquidation. There is a preferential subscription right pursuant to Luxembourg corporate law under any share or rights issue for cash, unless the Board of Directors, within the limits specified in the amended and restated articles of association, or an extraordinary general meeting of shareholders, as the case may be, restricts the exercise thereof.
|
Redemption of Shares
The amended and restated articles of association provide for the possibility and set out the terms for the repurchase by MIC S.A. of its own shares, which repurchase must be approved in accordance with applicable law and the rules of any exchange on which MIC S.A.’s shares are listed. A share repurchase plan was approved at our 2019 AGM authorizing the
Board of Directors, at any time between May 2, 2019 and the date of the 2020 AGM, provided the required levels of distributable reserves are met by MIC S.A. at that time, either directly or through a subsidiary or a third party, to engage in a share repurchase plan of MIC S.A.’s common shares to be carried out for all purposes allowed or which would become authorized by the laws and regulations in force, and in particular the Luxembourg law of 10 August 1915 on commercial companies, as amended (the “Share Repurchase Plan”) by using its available cash reserves, in an amount not exceeding the lower of (i) five per cent (5%) of MIC S.A.’s outstanding share capital as of the date of the AGM (i.e., approximating a maximum of 5,086,960 shares corresponding to $7,630,440 in nominal value) or (ii) the then available amount of MIC S.A.’s distributable reserves on a parent company basis, on the Nasdaq Stock Market in the United States, Nasdaq Stockholm or any other recognized alternative trading platform, at an acquisition price which may not be less than SEK 50 per share (or the U.S. dollar equivalent) nor exceed the higher of (x) the published bid that is the highest current independent published bid on a given date or (y) the last independent transaction price quoted or reported in the consolidated system on the same date, regardless of the market or exchange involved, provided, however, that when common shares are repurchased, the price shall be within the registered interval for the share price prevailing at any time (the so called spread), that is, the interval between the highest buying rate and the lowest selling rate.
Sinking Funds
MIC S.A. shares are not subject to any sinking fund.
Liability for Further Capital Calls
All of the issued shares in MIC S.A.’s capital are fully paid up. Accordingly, none of MIC S.A.’s shareholders are liable for further capital calls.
Principal Shareholder Restrictions
There are no provisions in the amended and restated articles of association that discriminate against any existing or prospective holder of MIC S.A.’s shares as a result of such shareholder owning a substantial number of shares.
Changes to Shareholder’s Rights
In order to change the rights attached to the shares of MIC S.A., an extraordinary general meeting of shareholders must be duly convened and held before a Luxembourg notary, as under Luxembourg law such change requires an amendment of the articles of association. A quorum of presence of at least 50% of the shares present or represented is required at a meeting held after the first convening notice, whereas there is no quorum of presence requirement at a meeting held after the second convening notice. Any decision must be taken by a majority of two thirds of the shares present or represented at the general meeting. Any change to the obligations attached to shares may be adopted only with the unanimous consent of all shareholders.
Shareholders’ Meetings
General meetings of shareholders are convened by convening notice published in the Luxembourg Official Gazette (Journal des Publications, Recueil Electronique des Sociétés et Associations), in a Luxembourg newspaper, in short version in the Swedish newspaper SvD, as a press release and on the Millicom website. According to article 18 of the amended and restated articles of association of MIC S.A., the Board of Directors determines in the convening notice the formalities to be observed by each shareholder for admission to the AGM. An AGM must be convened every year within six months of the end of the financial year, at the registered office of the Company or any other place in Luxembourg as may be specified in the convening notice. Other meetings can be convened as necessary.
Limitation on Securities Ownership
There are no limitations imposed under Luxembourg law or the amended and restated articles of association on the rights of non-resident or foreign entities to own shares of the Company or to hold or exercise voting rights on shares of the Company.
Change of Control
There are no provisions in the amended and restated articles of association of the Company that would have the effect of delaying, deferring or preventing a change in control of MIC S.A. and that would operate only with respect to a merger, acquisition or corporate restructuring involving the Company, or any of its subsidiaries.
Luxembourg laws impose the mandatory disclosure of an important participation in Millicom and any change in such participation.
Disclosure of Shareholder Ownership
As required by the Luxembourg law on transparency obligations of January 11, 2008, as amended (the “Transparency Law”), a shareholder who acquires or disposes of shares, including depositary receipts representing shares in the Company’s capital must notify the Company’s Board of Directors of the proportion of shares held by the relevant person as a result of the acquisition or disposal, where that proportion reaches, exceeds or falls below the thresholds referred to in the Transparency Law. As per the Transparency Law, the above also applies to the mere entitlement to acquire or to dispose of, or to exercise, voting rights in any of the cases referred to in the Transparency Law.
C. Material Contracts
6.0% Senior Notes
On March 17, 2015, MIC S.A. issued a $500 million 6.000% fixed interest rate bond that matures on March 10, 2025. The bond is governed by the Amended and Restated Indenture between Millicom International Cellular S.A., Citibank, N.A., London Branch and Citigroup Global Markets Deutschland AG dated May 30, 2018, included as Exhibit 4.1 to this Annual Report.
On April 8, 2019, MIC S.A. and Citibank, N.A., London Branch, as trustee, entered into the first supplemental indenture to the amended and restated indenture, dated as of May 30, 2018, governing MIC S.A.’s $500 million 6.000% Senior Notes due 2025, included as Exhibit 4.7 to this Annual Report. The purpose of the first supplemental indenture was primarily to generally conform certain terms in the amended and restated indenture to those in the indentures governing all of MIC S.A.’s other outstanding notes.
Revolving Credit Facility
On January 27, 2017, MIC S.A. entered into a $600 million muti-currency revolving credit facility with variable interest rates, which matures on January 27, 2022. The facility was arranged by The Bank Of Nova Scotia, BNP Paribas, Citigroup Global Markets Limited and DNB Markets, a part of DNB Bank ASA, Sweden Branch and is included as Exhibit 4.3 to this Annual Report.
5.125% Senior Notes
On September 20, 2017, MIC S.A. issued a $500 million 5.125% fixed interest rate bond that matures on January 15, 2028. The bond was issued pursuant to the Amended and Restated Indenture for the $500 million 5.125% Senior Notes due 2028 between Millicom International Cellular S.A., Citibank, N.A., London Branch and Citigroup Global Markets Deutschland AG dated May 30, 2018, included as Exhibit 4.2 to this Annual Report.
6.625% Senior Notes
On October 16, 2018, to help finance the Cable Onda Acquisition, MIC S.A. issued $500 million aggregate principal amount of its 6.625% fixed interest rate notes that mature on October 15, 2026. The notes were issued pursuant to the Indenture for the $500 million 6.625% Senior Notes due 2026 between Millicom International Cellular S.A., Citibank, N.A., London Branch and Citigroup Global Markets Europe AG dated October 16, 2018, included as Exhibit 4.5 to this Annual Report.
Stock Purchase Agreements for Telefonica CAM
On February 20, 2019, MIC S.A., Telefonica Centroamerica Inversiones, S.L. (“Telefonica Centroamerica”) and Telefonica S.A. (“Telefonica”) entered into a stock purchase agreement pursuant to which, subject to the terms and conditions contained therein, MIC S.A. agreed to purchase 100% of the shares of Telefonica Moviles Panama, S.A., from Telefonica Centroamerica (the “Panama Acquisition”).
On February 20, 2019, MIC S.A., Telefonica Centroamerica and Telefonica entered into a stock purchase agreement pursuant to which, subject to the terms and conditions contained therein, Millicom agreed to purchase 100% of the shares of Telefonica de Costa Rica TC, S.A., from Telefonica (the “Costa Rica Acquisition”).
On February 20, 2019, MIC S.A., Telefonica Centroamerica and Telefonica entered into a stock purchase agreement pursuant to which, subject to the terms and conditions contained therein, Millicom agreed to purchase 100% of the shares of Telefonia Celular de Nicaragua, S.A., a company incorporated under the laws of Nicaragua, from Telefonica Centroamerica (the “Nicaragua Acquisition,” and together with the Panama Acquisition and the Costa Rica Acquisition, the “Telefonica CAM Acquisitions”).
Camelia US$1.65 billion Bridge Loan
On February 20, 2019, MIC S.A. closed USD 1.65 billion term loan facility agreement by and between Goldman Sachs, JPMorgan and Morgan Stanley, and further syndicated available to be drawn to (i) pay the purchase price for the Telefonica CAM Acquisitions , (ii) refinance the debts of any member of the Telefonica group and/or (iii) pay any costs, fees, interests or other expenses in connection with the Telefonica CAM Acquisitions or the facility. As of December 19, 2019, the Bridge Facility had been canceled in its entirety and was never drawn on.
US$750 million 6.250% Senior Notes due 2029 issued by MIC S.A.
On March 25, 2019, to help finance the Telefonica CAM Acquisitions, MIC S.A. issued $750 million aggregate principal amount of its 6.250% senior notes due 2029. The notes were issued pursuant to the Indenture for the $750 million 6.250% Senior Notes due 2029 between Millicom International Cellular S.A., Citibank, N.A., London Branch and Citigroup Global Markets Europe AG dated March 25, 2019, included as Exhibit 4.6 to this Annual Report.
US$300 million Term Facility Agreement
On April 24, 2019, MIC S.A. executed a $300 million Term Facility Agreement arranged by DNB Bank ASA, Sweden Branch and Nordea Bank Abp, Filial i Sverige, included as Exhibit 4.8 to this Annual Report. This facility was fully drawn on as of December 31, 2019.
SEK 2 Billion Floating-Rate Senior Unsecured Sustainability Bond due 2024 issued by MIC S.A.
On May 15, 2019, MIC S.A. completed its offering of a SEK 2 billion (approximately $210 million) floating-rate senior unsecured sustainability bond due 2024, included as Exhibit 4.9 to this Annual Report.
D. Exchange Controls
There are no governmental laws, decrees, regulations or other legislation of Luxembourg that may affect:
|
•
|
the import or export of capital including the availability of cash and cash equivalents for use by the Millicom Group, or
|
|
•
|
the remittance of dividends, interests or other payments to non-resident holders of MIC S.A.’s securities other than those deriving from the U.S.-Luxembourg double taxation treaty.
|
E. Taxation
Luxembourg Tax Considerations
The following
information
is of a general nature only on certain tax considerations effective in Luxembourg in relation to holders of shares in respect of the ownership and disposition of shares in MIC S.A., and does not purport to be a comprehensive description of all of the tax considerations that might be relevant to an investment decision in such company. It is included herein solely for preliminary information purposes and is not intended to be, nor should it be construed to be, legal or tax advice. The information contained herein is based on the laws presently in force in Luxembourg on the date hereof, and thus subject to any change in law that may take effect after such date. Shareholders in MIC S.A. should therefore consult their own professional advisers as to the effects of state, local or foreign laws, including Luxembourg tax law, to which they may be subject.
Please be aware that the residence concept used under the respective headings below applies for Luxembourg income tax assessment purposes only. Any reference in the present section to a tax, duty, levy, impost or other charge or withholding of a similar nature, or to any other concepts, refers to Luxembourg tax law or concepts only.
Further
, any reference to a resident corporate shareholder/taxpayer includes non-resident corporate shareholders/taxpayers carrying out business activities through a permanent establishment, a permanent representative or a fixed place of business in Luxembourg to which assets would be attributable. Also, please note that a reference to Luxembourg income tax encompasses corporate income tax (impôt sur le revenu des collectivités), municipal business tax (impôt commercial communal), a solidarity surcharge (contribution au fonds pour l’emploi), as well as personal income tax (impôt sur le revenu) generally. Corporate shareholders may further be subject to net wealth tax (impôts sur la fortune), as well as other duties, levies or taxes. Corporate income tax, municipal business tax, as well as the solidarity surcharge invariably apply to most corporate taxpayers resident in Luxembourg for tax purposes. Individual taxpayers are generally subject to personal income tax and the solidarity surcharge. Under certain circumstances, where an individual taxpayer acts in the course of the management of a professional or business undertaking, municipal business tax may apply as well.
(a) Luxembourg withholding tax on dividends paid on MIC S.A. shares
Dividends distributed by MIC S.A. will in principle be subject to Luxembourg withholding tax at the rate of 15%.
Luxembourg resident corporate holders
No dividend withholding should apply on dividends paid by MIC S.A. to a Luxembourg resident company if the conditions of Article 147 of the Luxembourg income tax law (“LITL”) are met, meaning that the Luxembourg residence corporate holder should be a collective entity covered by article 2 of the EU Parent Subsidiary (Council Directive 2011/96/EU of 30 November 2011), a fully taxable (capital) company not listed in the appendix to article 166 LITL, paragraph 10, the Luxembourg State, a Luxembourg commune or a Luxembourg syndicate of communes or an undertaking of a Luxembourg public body, holding shares which meets the qualifying participation test (10% of the share capital or acquisition price of the shares of at least € 1.2 million held or committed to be held for a minimum of 12 months).
Luxembourg resident individual holders
Luxembourg withholding tax on dividends paid by MIC S.A. to a Luxembourg resident individual holder may entitle such holder to a tax credit for the tax withheld.
Non-Luxembourg resident holders
Non-Luxembourg resident shareholders of MIC S.A. should benefit from a withholding tax exemption if the conditions of Article 147 LITL are met, meaning 10% shareholding or share acquisition price of € 1.2 million, 12 months holding period and that the non-Luxembourg resident should either be (i) an entity which fall within the scope of Article 2 of the European Council Directive 2011/96/EU, as amended (the “Parent-Subsidiary Directive”) and which are not excluded to benefit from this directive under its mandatory general anti-avoidance rule as implemented in Luxembourg, or (ii) corporate holder subject to a tax comparable to Luxembourg corporate income tax and which are resident in a country having concluded a double tax treaty with Luxembourg (such as the United States), or (iii) corporate holder subject to a tax comparable to Luxembourg corporate income tax resident in a State member of the European Economic Area other than a Member State of the EU of (iv) corporate holder resident in Switzerland subject to corporate income tax in Switzerland without benefiting from a tax exemption.
Non-Luxembourg resident holders which do not fall within the scope of Article 147 LITL withholding tax exemption but resident in a State with which Luxembourg has concluded a double tax treaty may claim a reduced withholding tax under the conditions set forth in the relevant double tax treaty.
In the case the non-Luxembourg resident holder fulfills the requirements to benefit from a withholding tax exemption or is entitled to a reduced withholding tax under an applicable double tax treaty but has been subject to this 15% withholding tax it may claim a refund from the Luxembourg tax administration.
(b) Luxembourg income tax on dividends and capital gains received from MIC S.A. shares
Fully taxable resident corporate shareholders
For resident corporate taxpayers, dividends (and other payments) derived from shares held in a company and capital gains realized on the sale of shares in a company are, in principle, fully taxable and thus subject to a combined corporate income tax rate of 24.49% (for resident corporate taxpayers established in Luxembourg City), except that, as described in further detail below, (i) dividends can benefit either from a full exemption if the conditions of article 166 LITL are met or from a 50% exemption if the conditions of Article 115 (15a) LITL are met, and (ii) capital gains realized by resident corporate shareholders are fully exempt if the conditions of the Grand Ducal Decree of December 21, 2002, (as amended) are fulfilled.
Under the Luxembourg participation exemption on dividends as implemented by Article 166 LITL, dividends derived from shares may be exempt from income tax at the level of the resident corporate shareholder if cumulatively, (i) the shareholder is either (a) a fully taxable resident collective entity taking one of the forms listed in the appendix to paragraph 10 of Article 166 LITL, (b) a fully taxable resident corporation not listed in the appendix to paragraph 10 of Article 166 LITL, (c) a permanent establishment of a collective entity referred to in Article 2 of the Parent-Subsidiary Directive, (d) a permanent establishment of a corporation resident in a State with which the Grand Duchy of Luxembourg has signed an agreement in an attempt to avoid double taxation, or (e) a permanent establishment of a corporation or a cooperative society resident in a State party to the European Economic Area Agreement other than a Member State of the European Union, (ii) the subsidiary is either (a) a collective entity referred to in Article 2 of the Parent-Subsidiary Directive, (b) a fully taxable resident corporation not listed in the appendix to paragraph (10) of Article 166 LITL, or (c) a non-resident corporation fully subject to a tax corresponding to the Luxembourg corporate income tax, and (iii) the shareholder has held or commits itself to hold, for an uninterrupted period of at least 12 months , a participation representing at least 10% in the share capital of the subsidiary or an acquisition price of at least €1.2 million. Liquidation proceeds are deemed to be a received dividend and may be exempt under the same conditions. The participation through an entity that is transparent for Luxembourg income tax purposes is to be considered as direct participation in proportion to the amount held in the net assets invested in that tax transparent entity.
The Luxembourg participation exemption regime may be denied if the income is (i) deductible in the other EU Member State paying such income or (ii) paid as part of an arrangement or a series of arrangements that, having been put into place with the main purpose or one of the main purposes of obtaining a tax advantage that defeats the object or purpose of the Parent-Subsidiary Directive, is not genuine having regard to all relevant facts and circumstances. For the purposes of this anti-avoidance rule, an arrangement, which may comprise several steps or parts, or a series of arrangements, is considered as not genuine to the extent that it is not put into place for valid commercial reasons that reflect economic reality.
Expenses, including interest expenses and impairments, in direct economic relation with the shareholding held by a resident corporate shareholder should not be deductible for income tax purposes up to the amount of any exempt dividend derived during the same financial year. Expenses exceeding the amount of the exempt dividend received from such shareholding during the same financial year should remain deductible for income tax purposes.
If the conditions of the Luxembourg participation exemption, as described above, are not met, 50% of the gross amount of dividends may however be exempt from corporate income tax in accordance with Article 115 (15a) LITL if such dividends are received from (i) a fully taxable corporation resident in Luxembourg, (ii) a corporation (a) resident in a State with which the Grand Duchy of Luxembourg has signed an agreement in an attempt to avoid double taxation, and (b) fully subject to a tax corresponding to the Luxembourg corporate income tax, or (iii) a company resident in a Member State of the European Union and referred to in Article 2 of the Parent-Subsidiary Directive.
Capital gains realized on shares by resident corporate shareholders may be exempt from corporate income tax if the conditions mentioned above under the Luxembourg participation exemption on dividends are met, except that the acquisition price must be of at least €6 million instead of €1.2 million. The participation through an entity that is transparent for Luxembourg income tax purposes is to be considered as direct participation in proportion to the amount held in the net assets invested in that tax transparent entity. Taxable gains are determined as being the difference between the price for which the shares have been disposed of and the lower of their cost or book value.
Capital gains realized upon the disposal of shares should remain taxable for an amount corresponding to the sum of the expenses related to the shareholding and impairments recorded on the shareholding that reduced the taxable basis of the resident corporate shareholder in the year of disposal or in previous financial years.
Resident corporate shareholders with a special tax regime
A resident corporate shareholder that is governed by the law of May 11, 2007, on Family Estate Management Companies (as amended) or by the Law of February 13, 2007, on Specialized Investment Funds (as amended) or by the Law of December 17, 2010, on Undertakings for Collective Investment (as amended) or by the law of July 23, 2016, on Reserved Alternative Investment Funds not having the exclusive purpose of investing in risk capital, is not subject to Luxembourg income tax; thus, neither dividends (and other payments) derived from shares held in a company nor capital gains realized on the sale or disposal, in any form whatsoever, of shares in a company, are taxable at the level of such resident corporate shareholders.
Resident individual shareholders
For resident individual shareholders, dividends derived from shares and capital gains realized on the sale of shares are, in principle, subject to income tax at the progressive ordinary rate (with a current effective marginal rate of up to 42%). Such income tax rate is increased by 7% for income not exceeding €150,000 for single taxpayers and €300,000 for couples taxed jointly, and by 9% for income above these amounts. In addition, a 1.4% dependence insurance contribution is due.
50% of the gross amount of dividends derived from shares may however be exempt from income tax, if the conditions laid down under Article 115 (15a) LITL, as described above, are complied with. In addition, a total lump-sum of €1,500 (which is doubled for taxpayers who are jointly taxable) is deductible from the total of dividends received during the tax year.
Capital gains realized on the disposal of the shares by resident individual shareholders who act in the course of the management of their private wealth, will in principle only be taxable if said capital gains qualify either as speculative gains or as gains on a substantial participation. A disposal may include a sale, an exchange, a contribution or any other kind of alienation of shares. Capital gains are deemed to be speculative if the shares are disposed within six months after their acquisition or if their disposal precedes their acquisition. Speculative gains realized during the year that are equal to, or are greater than, €500 are subject to income tax at ordinary rates. A participation is deemed to be substantial where a resident individual shareholder holds, either alone or together with his spouse, his partner or minor children, directly or indirectly, at any time within the 5 years preceding the disposal, more than 10% of share capital of a collective entity. A shareholder is also deemed to alienate a substantial participation if such participation (i) has been acquired free of charge, within the 5 years preceding the transfer, and (ii) was constituting a substantial participation in the hands of the alienator (or the alienators in case of successive transfers free of charge within the same 5-year period). Capital gains realized on a substantial participation more than six months after the acquisition thereof may benefit from an allowance of up to €50,000 granted for a ten-year period (which is doubled for taxpayers who are jointly taxable). They are subject to income tax according to the half- global rate method, (i.e., the average rate applicable to the total income is calculated according to progressive income tax rates and half of the average rate is applied to the capital gains realized on the substantial participation).
Capital gains realized on the disposal of the Company’s shares by resident individual shareholders, who act in the course of their professional or business activity, are subject to income tax at ordinary rates. Taxable gains are determined as being the difference between the price for which the shares have been disposed of and the lower of their cost or book value.
Non-resident shareholders
Non resident shareholders (either individual or corporate) owning a non-substantial shareholding are exempt from capital gains taxes. Non resident shareholders owning a substantial shareholding (more than 10% of share capital of a collective entity) are taxable in Luxembourg on a capital gain realized upon the disposal if at the date of the disposal the shareholding has been owned for not more than six months, unless the non resident shareholder is resident in a treaty country and the treaty allocates the taxation right for the capital gain to the country of residence. In this latter case, no capital gains tax will be due by non resident shareholder. Capital gains realized on the disposal of shares by non resident shareholders that have been owned for more than 6 months are exempt from Luxembourg income tax.
(c) Other Taxes
Net wealth tax
Whilst non-resident corporate taxpayers may only be subject to net wealth tax on their on the net assets attributable to a permanent establishment located in Luxembourg or on real estate assets located in Luxembourg, resident corporate taxpayers are in principle subject to net wealth tax at the rate of 0.5% for net wealth up to €500 million and at 0.05% for net wealth exceeding this threshold, unless a double tax treaty provides for an exemption or the asset may benefit from the Luxembourg participation exemption regime. Net worth is referred to as the unitary value (valeur unitaire), as determined at January 1 of each year. The unitary value is basically calculated as the difference between (a) assets estimated at their fair market value and (b) liabilities vis-à-vis third parties, unless one of the exceptions mentioned below are satisfied.
A resident corporate shareholder will be subject to net wealth tax on shares, except if (i) the shareholder is a securitization company governed by the Law of March 22, 2004, on Securitization (as amended) or an investment company in risk capital governed by the Law of June 15, 2004, on Venture Capital Vehicles (as amended) or a specialized investment fund governed by the Law of February 13, 2007, on Specialized Investment Funds (as amended) or a family wealth management company governed by the Law of May 11, 2007, on Family Estate Management Companies (as amended) or an undertaking for collective investment governed by the Law of December 17, 2010, on Undertakings for Collective Investment (as amended) or a pension-saving company as well as a pension-saving association, both governed by the Law of July 13, 2005, (as amended) or a reserved alternative investment fund governed by the law of July 23, 2016, or (ii) if the conditions mentioned above for the participation exemption regime on dividend income are met at the end of the previous year (except that no minimum holding period is required).
A resident corporate shareholder may further be subject to either a minimum net wealth tax of €4,815 or to a progressive minimum net wealth tax from €535 to €32,100, which depends on the total assets on their balance sheet. The minimum net wealth tax of €4,815 will be applicable for a resident corporate shareholder, which has a minimum of 90% of fixed financial assets, transferable securities and cash at bank on its balance sheet, except if its accumulated fixed financial assets do in addition not exceed €350,000, in which case it may benefit from a minimum net wealth tax of €535. Items (e.g., real estate properties or assets allocated to a permanent establishment) located in a treaty country, where the latter has the exclusive tax right, are not considered for the calculation of the 90% threshold.
Despite the above mentioned exceptions, the minimum net wealth tax also applies if the resident corporate shareholder is a securitization company governed by the Law of March 22, 2004, on Securitization (as amended) or an investment company in risk capital governed by the Law of June 15, 2004, on Venture Capital Vehicles (as amended) or a pension-saving company as well as a pension-saving association, both governed by the Law of July 13, 2005, (as amended) or a reserved alternative investment fund having the exclusive purpose of investing in risk capital governed by the law of July 23, 2016.
The net wealth tax charge for a given year can be avoided or reduced if a specific reserve, equal to five times the net wealth tax to save, is created before the end of the subsequent tax year and maintained during the five following tax years. The net wealth tax reduction corresponds to one fifth of the reserve created, except that the maximum net wealth tax to be saved is limited to the corporate income tax amount due for the same tax year, including the employment fund surcharge, but before imputation of available tax credits.
Inheritance tax
Where a shareholder is a resident of Luxembourg for tax purposes at the time of his/her death, shares are included in his/her taxable estate for inheritance tax assessment purposes.
Gift tax
Gift tax may be due on a gift or donation of shares if recorded in a Luxembourg notarial deed or otherwise recorded in Luxembourg.
Registration taxes and stamp duties
In principle, neither the issuance of shares nor the disposal of shares is subject to Luxembourg registration tax or stamp duty.
However, a registration duty may be due in the case where (i) the deed acknowledging the issuance/disposal of shares is either attached (
annexé
) to a deed subject to a mandatory registration in Luxembourg (e.g., public deed) or lodged with a notary’s records (
deposé au rang des minutes d’un notaire
), or (ii) in case of a registration of such deed on a voluntary basis.
Material U.S. Federal Income Tax Considerations
The following is a description of material U.S. federal income tax consequences to the U.S. Holders described below of owning and disposing our common shares. It does not describe all tax considerations that may be relevant to a particular person’s decision to hold common shares. This discussion applies only to a U.S. Holder that holds common shares as capital assets for U.S. federal income tax purposes. In addition, it does not describe all of the U.S. federal income tax consequences that may be relevant in light of the U.S. Holder’s particular circumstances, including alternative minimum tax consequences, the potential application of the provisions of the Internal Revenue Code of 1986, as amended (the “Code”) known as the Medicare contribution tax and tax consequences applicable to U.S. Holders subject to special rules, such as:
|
•
|
certain financial institutions;
|
|
•
|
dealers or traders in securities that use a mark-to-market method of tax accounting;
|
|
•
|
persons holding common shares as part of a hedging transaction, straddle, wash sale, conversion transaction or other integrated transaction or persons entering into a constructive sale with respect to the common shares;
|
|
•
|
persons whose functional currency for U.S. federal income tax purposes is not the U.S. dollar;
|
|
•
|
entities classified as partnerships for U.S. federal income tax purposes;
|
|
•
|
tax-exempt entities, “individual retirement account” or “Roth IRA”;
|
|
•
|
persons that own or are deemed to own ten percent or more of our shares, by vote or value;
|
|
•
|
persons who acquired our common shares pursuant to the exercise of an employee stock option or otherwise as compensation; or
|
|
•
|
persons holding common shares in connection with a trade or business conducted outside of the United States.
|
If an entity that is classified as a partnership for U.S. federal income tax purposes owns common shares, the U.S. federal income tax treatment of a partner will generally depend on the status of the partner and the activities of the partnership. Partnerships owning common shares and partners in such partnerships should consult their tax advisers as to the particular U.S. federal income tax consequences of owning and disposing of the common shares.
This discussion is based on the Code, administrative pronouncements, judicial decisions, final, temporary and proposed Treasury regulations, and the income tax treaty between Luxembourg and the United States (the “Treaty”) all as of the date hereof, any of which is subject to change or differing interpretations, possibly with retroactive effect.
A “U.S. Holder” is a person who, for U.S. federal income tax purposes, is a beneficial owner of our common shares and is:
|
•
|
an individual who is a citizen or resident of the United States;
|
|
•
|
a corporation, or other entity taxable as a corporation, created or organized in or under the laws of the United States, any state therein or the District of Columbia; or
|
|
•
|
an estate or trust the income of which is subject to U.S. federal income taxation regardless of its source.
|
U.S. Holders should consult their tax advisers concerning the U.S. federal, state, local and non-U.S. tax consequences of owning and disposing of our common shares in their particular circumstances.
Except as described below, this discussion assumes that we are not, and will not become, a passive foreign investment company (a “PFIC”) for any taxable year.
Taxation of Distributions
Distributions paid on common shares, other than certain pro rata distributions of common shares, will generally be treated as dividends to the extent paid out of our current or accumulated earnings and profits (as determined under U.S. federal income tax principles). Because we do not maintain calculations of our earnings and profits under U.S. federal income tax principles, we expect that distributions generally will be reported to U.S. Holders as dividends. Subject to applicable limitations, dividends paid to certain non-corporate U.S. Holders may be taxable at the favorable tax rate applicable to “qualified dividend income.” U.S. Holders should consult their tax advisers regarding the availability of the favorable tax rate on dividends in their particular circumstances.
Dividends will not be eligible for the dividends-received deduction generally available to U.S. corporations under the Code. Dividends will be included in a U.S. Holder’s income on the date of receipt. The amount of any dividend income paid in euros will be the U.S. dollar amount calculated by reference to the exchange rate in effect on the date of actual or constructive receipt, regardless of whether the payment is in fact converted into U.S. dollars at that time. If the dividend is converted into U.S. dollars on the date of receipt, a U.S. Holder should not be required to recognize foreign currency gain or loss in respect of the dividend income. A U.S. Holder may have foreign currency gain or loss if the dividend is converted into U.S. dollars after the date of receipt.
Dividends will be foreign-source and will include any amount withheld by us in respect of Luxembourg income taxes. Subject to applicable limitations, some of which vary depending upon the U.S. Holder’s particular circumstances, non-refundable Luxembourg income taxes withheld from dividends at a rate not exceeding any applicable rate provided by the Treaty will be creditable against the U.S. Holder’s U.S. federal income tax liability. The rules governing foreign tax credits are complex and U.S. Holders should consult their tax advisers regarding the creditability of foreign taxes in their particular circumstances. In lieu of claiming a foreign tax credit, U.S. Holders may, at their election, deduct foreign taxes, including any Luxembourg income tax, in computing their taxable income, subject to generally applicable limitations under U.S. law. An election to deduct foreign taxes instead of claiming foreign tax credits applies to all foreign taxes paid or accrued in the taxable year.
Sale or Other Disposition of Common Shares
For U.S. federal income tax purposes, gain or loss realized on the sale or other disposition of common shares will be capital gain or loss, and will be long-term capital gain or loss if the U.S. Holder held the common shares for more than one year. The amount of the gain or loss will equal the difference between the U.S. Holder’s tax basis in the common shares disposed of and the amount realized on the disposition, in each case as determined in U.S. dollars. This gain or loss will generally be U.S.-source gain or loss for foreign tax credit purposes. The deductibility of capital losses is subject to limitations.
Passive Foreign Investment Company Rules
We believe that we were not a “passive foreign investment company” (a “PFIC”) for U.S. federal income tax purposes for our taxable year ending December 31, 2019. However, because PFIC status depends on the composition of a company’s income and assets and the market value of its assets from time to time, there can be no assurance that the Company will not be a PFIC for any taxable year. If we are a PFIC for any year during which a U.S. Holder holds common shares, we generally will continue to be treated as a PFIC with respect to that U.S. Holder for all succeeding years during which the U.S. Holder holds common shares, even if we cease to meet the threshold requirements for PFIC status.
If we are a PFIC for any taxable year during which a U.S. Holder holds common shares, gain recognized by a U.S. Holder on a sale or other disposition (including certain pledges) of the common shares will be allocated ratably over the U.S. Holder’s holding period for the common shares. The amounts allocated to the taxable year of the sale or other disposition and to any year before we became a PFIC will be taxed as ordinary income. The amount allocated to each other taxable year will be subject to tax at the highest rate in effect for individuals or corporations, as appropriate, for that taxable year, and an interest charge will be imposed on the resulting tax liability for each such year. Further, to the extent that any distribution received by a U.S. Holder on its common shares exceeds 125% of the average of the annual distributions on the common shares received during the preceding three years or the U.S. Holder’s holding period, whichever is shorter, that distribution will be subject to taxation in the same manner. If we were a PFIC, certain elections (such as mark-to-market election) may be available that would result in alternative tax consequences of owning and disposing the common shares.
In addition, if we are a PFIC or, with respect to particular U.S. Holder, are treated as a PFIC for the taxable year in which we pay a dividend or for the prior taxable year, the preferential dividend rate discussed above with respect to dividends paid to certain non-corporate U.S. Holders will not apply.
If a U.S. Holder owns common shares during any year in which we are a PFIC, the U.S. Holder generally must file annual reports on an IRS Form 8621 (or any successor form) with respect to us, generally with the U.S. Holder’s federal income tax return for that year.
U.S. Holders should consult their tax advisers concerning the potential application of the PFIC rules.
Information Reporting and Backup Withholding
Payments of dividends and sales proceeds that are made within the United States or through certain U.S.-related financial intermediaries generally are subject to information reporting, and may be subject to backup withholding, unless (i) the U.S. Holder is a corporation or other exempt recipient or (ii) in the case of backup withholding, the U.S. Holder provides a correct taxpayer identification number and certifies that it is not subject to backup withholding.
The amount of any backup withholding from a payment to a U.S. Holder will be allowed as a credit against the holder’s U.S. federal income tax liability and may entitle it to a refund, provided that the required information is timely furnished to the IRS.
Certain U.S. Holders who are individuals or specified entities may be required to report information on their U.S. federal income tax returns relating to their ownership of our common shares, subject to certain exceptions (including an
exception for common shares held in a financial account, in which case the account may be reportable if maintained by a non-U.S. financial institution).
U.S. Holders should consult their tax advisers regarding their reporting obligations with respect to their ownership and disposition of common shares.
F. Dividends and Paying Agents
Not applicable to Annual Report filing.
G. Statement by Experts
Not applicable to Annual Report filing.
H. Documents on Display
Upon the effectiveness of this Annual Report, we will become subject to the information requirements of the Exchange Act, except that as a foreign issuer, we will not be subject to the proxy rules or the short-swing profit disclosure rules of the Exchange Act. In accordance with these statutory requirements, we will file or furnish reports and other information with the SEC, which you may inspect and copy at the Public Reference Room at 100 F Street, N.E., Washington, D.C. 20549. Information on the operation of the Public Reference Room may be obtained by calling the SEC at 1-800-SEC-0330. In addition, the SEC maintains an Internet website that contains reports and other information about issuers, like us, that file electronically with the SEC. The address of that website is
www.sec.gov
.
I. Subsidiary Information
Not applicable.
Financial risk management
Millicom regularly performs risk management assessments and reviews to identify its major risks and to take the necessary steps to mitigate such risks. The principal market risks to which we are exposed are interest rate risk, foreign currency exchange risk and non-repatriation. Each year Millicom Group Treasury revisits and presents to the Audit Committee updated Treasury and Financial Risks Management policies. The Millicom Group analyzes each of these financial risks individually as well as on an interconnected basis and defines and implements strategies to manage the economic impact on the Millicom Group’s performance in line with its Financial Risk Management policy. These policies were last reviewed in late 2018.
As part of the annual review of the above mentioned risks, the Millicom Group targets a strategy with respect to the use of derivatives and natural hedging instruments ranging from raising debt in local currency (where the Company targets to reach
40%
of debt in local currency over the medium term) to maintaining a
75/25%
mix between fixed and floating rate debt or agreeing to cover up to six months forward of operating costs and capex denominated in non-functional currencies through a rolling and layering strategy. Millicom’s risk management strategies may include the use of derivatives to the extent a market would exist in the jurisdictions where the Millicom Group operates. Millicom’s policy prohibits the use of such derivatives in the context of speculative trading.
On
December 31, 2019
and
2018
, the fair value of derivatives held by the Millicom Group may be summarized as follows:
|
2019
|
2018
|
||||
|
(US$ millions)
|
|||||
|
Derivatives
|
|||||
|
Cash flow hedge derivatives
|
(17
|
)
|
—
|
|
|
|
Net derivative asset (liability)
|
(17
|
)
|
—
|
|
|
Interest rate risk
Debt and financing issued at floating interest rates expose the Millicom Group to cash flow interest rate risk. Debt and financing issued at fixed rates expose the Millicom Group to fair value interest rate risk. The Millicom Group’s exposure to risk of changes in market interest rates relate to both of the above. To manage this risk, the Millicom Group’s policy is to maintain a combination of fixed and floating rate debt with target that more than
75%
of the debt be at fixed rates. The Millicom Group actively monitors borrowings against this target. The target mix between fixed and floating rate debt is reviewed periodically. The purpose of Millicom’s policy is to achieve an optimal balance between cost of funding and volatility of financial results, while taking into account market conditions as well as our overall business strategy. At
December 31, 2019
, approximately
76%
of the Millicom Group’s borrowings are at a fixed rate of interest or for which variable rates have been swapped for fixed rates with interest rate swaps (
2018
:
68%
).
The table below summarizes, as at
December 31, 2019
, our fixed rate debt and floating rate debt:
|
Amounts due within
|
||||||||||||||
|
1 year
|
1–2 years
|
2–3 years
|
3–4 years
|
4–5 years
|
>5 years
|
Total
|
||||||||
|
(US$ millions)
|
||||||||||||||
|
Financing at December 31, 2019
|
||||||||||||||
|
Fixed rate financing
|
118
|
|
117
|
|
118
|
|
332
|
|
431
|
|
3,428
|
|
4,543
|
|
|
Weighted average nominal interest rate
|
6.32
|
%
|
5.46
|
%
|
5.01
|
%
|
7.24
|
%
|
5.44
|
%
|
5.81
|
%
|
5.86
|
%
|
|
Floating rate financing
|
68
|
|
38
|
|
27
|
|
185
|
|
654
|
|
457
|
|
1,429
|
|
|
Weighted average nominal interest rate
|
2.97
|
%
|
1.77
|
%
|
1.41
|
%
|
3.25
|
%
|
4.26
|
%
|
0.96
|
%
|
1.52
|
%
|
|
Total
|
186
|
|
155
|
|
145
|
|
517
|
|
1,085
|
|
3,884
|
|
5,972
|
|
|
Weighted average nominal interest rate
|
5.10
|
%
|
4.55
|
%
|
4.34
|
%
|
5.81
|
%
|
4.73
|
%
|
5.24
|
%
|
4.82
|
%
|
The table below summarizes, as at
December 31, 2018
, our fixed rate debt and floating rate debt:
|
Amounts due within
|
||||||||||||||
|
1 year
|
1–2 years
|
2–3 years
|
3–4 years
|
4–5 years
|
>5 years
|
Total
|
||||||||
|
(US$ millions)
|
||||||||||||||
|
Financing at December 31, 2018
|
||||||||||||||
|
Fixed rate financing
|
140
|
|
162
|
|
137
|
|
436
|
|
204
|
|
2,036
|
|
3,116
|
|
|
Weighted average nominal interest rate
|
6.35
|
%
|
6.59
|
%
|
6.64
|
%
|
6.61
|
%
|
4.10
|
%
|
6.47
|
%
|
6.34
|
%
|
|
Floating rate financing
|
318
|
|
175
|
|
266
|
|
133
|
|
263
|
|
309
|
|
1,465
|
|
|
Weighted average nominal interest rate
|
10.28
|
%
|
5.89
|
%
|
2.73
|
%
|
0.49
|
%
|
4.41
|
%
|
1.13
|
%
|
1.98
|
%
|
|
Total
|
458
|
|
337
|
|
403
|
|
570
|
|
468
|
|
2,345
|
|
4,580
|
|
|
Weighted average nominal interest rate
|
9.08
|
%
|
6.23
|
%
|
4.06
|
%
|
5.18
|
%
|
4.28
|
%
|
5.76
|
%
|
4.95
|
%
|
A
100
basis point fall or rise in market interest rates for all currencies in which the Group had borrowings at
December 31, 2019
would increase or reduce profit before tax from continuing operations for the year by approximately
US$14 million
(
2018
:
US$15 million
).
From time to time, Millicom enters into currency and interest rate swap contracts to manage its exposure to fluctuations in interest rates and currency fluctuations in accordance with its Financial Risk Management policy. Details of these arrangements are provided below.
Interest rate and currency swaps on SEK denominated debt
The swaps on the previous SEK bond were accounted for as a cash flow hedge as the timing and amounts of the cash flows under the swap agreements matched the cash flows under the SEK bond. Fluctuations were recorded through other
comprehensive income in our financial statements. They matured in April 2018 and were settled against a cash payment of $63 million.
In May 2019, MIC S.A. entered into swap contracts in order to hedge the foreign currency and interest rate risks in relation to the issuance of the SEK 2 billion (approximately $208 million) senior unsecured sustainability bond. These swaps are accounted for as cash flow hedges as the timing and amounts of the cash flows under the swap agreements match the cash flows under the SEK bond. Their maturity date is May 2024. The hedging relationship is highly effective and related fluctuations are recorded through other comprehensive income. At
December 31, 2019
, the fair values of the swaps amount to
a liability
of
$0.2 million
.
Interest rate and currency swaps in Costa Rica and interest rate swaps in El Salvador
Our operations in El Salvador and Costa Rica also entered into several swap agreements in order to hedge foreign currency and interest rate risks on certain long term debts. These swaps are accounted for as cash flow hedges and related fair value changes are recorded through other comprehensive income. At
December 31, 2019
, the fair values of these swaps amount to
liabilities
of
$17 million
.
Interest rate and currency swaps on Euro-denominated debt
In June 2013, Millicom entered into interest rate and currency swaps whereby Millicom will sell Euros and receive USD to hedge against exchange rate fluctuations on an intercompany seven-year Euro 134 million principal and related interest financing of its operation in Senegal. The outstanding 2020 Notes were repaid in August 2017 and as a result these swaps have been settled. The year-to-date revaluation of the swap resulted in a $22 million loss. The Millicom Group finally received $10 million in cash on settlement date.
The above hedge was considered ineffective, with fluctuations in the fair value of the hedge recorded through the statement of income in our consolidated financial statements.
No other financial instruments have a significant fair value at
December 31, 2019
.
Foreign currency risk
The Millicom Group is exposed to foreign exchange risk arising from various currency exposures in the countries in which it operates. Foreign exchange risk arises from future commercial transactions, recognized assets and liabilities and net investments in foreign operations. In the years ended
December 31, 2019
,
2018
and
2017
, foreign currency exchange rate fluctuations resulted in a loss of
$32 million
, a loss of
$40 million
and a gain of
$21 million
, respectively.
Millicom seeks to reduce its foreign currency exposure through a policy of matching, as far as possible, assets and liabilities denominated in foreign currencies, or entering into agreements that limit the risk of exposure to currency fluctuations against the US dollar reporting currency. In some cases, Millicom may also borrow in US dollars where it is either commercially more advantageous for joint ventures and subsidiaries to incur debt obligations in US dollars or where US dollar denominated borrowing is the only funding source available to a joint venture or subsidiary. In these circumstances, Millicom accepts the remaining currency risk associated with financing its joint ventures and subsidiaries, principally because of the relatively high cost of forward cover, when available, in the currencies in which the Millicom Group operates.
The following table summarizes debt denominated in US dollars and other currencies at
December 31, 2019
and
2018
.
|
2019
|
2018
|
||||
|
(US$ millions)
|
|||||
|
Debt denomination at December 31
|
|||||
|
Debt denominated in US dollars
|
3,535
|
|
2,572
|
|
|
|
Debt denominated in currencies of the following countries:
|
|||||
|
Colombia
|
531
|
|
718
|
|
|
|
Chad
|
—
|
|
62
|
|
|
|
Tanzania
|
14
|
|
112
|
|
|
|
Bolivia
|
350
|
|
306
|
|
|
|
Paraguay
|
206
|
|
207
|
|
|
|
El Salvador(i)
|
268
|
|
299
|
|
|
|
Panama(i)
|
918
|
|
261
|
|
|
|
Luxembourg (SEK denominated)
|
43
|
|
43
|
|
|
|
Costa Rica
|
107
|
|
—
|
|
|
|
Total debt denominated in other currencies
|
2,437
|
|
2,008
|
|
|
|
Total debt
|
5,972
|
|
4,580
|
|
|
(i) El Salvador's official unit of currency is the U.S. dollar, while Panama uses the U.S. dollar as legal tender. Our local debt in both countries is therefore denominated in U.S. dollars but presented as local currency (LCY).
At
December 31, 2019
, if the US dollar had weakened/strengthened by
10%
against the other functional currencies of our operations and all other variables held constant, then profit before tax from continuing operations would have increased/decreased by
$17 million
(
2018
:
$53 million
). This increase/decrease in profit before tax would have mainly been as a result of the conversion of the USD-denominated net debts in our operations with functional currencies other than the US dollar.
Non-repatriation risk
Millicom’s operating subsidiaries and joint ventures generate most of the revenue of the Millicom Group and in the currency of the countries in which they operate. Millicom is therefore dependent on the ability of its subsidiaries and joint venture operations to transfer funds to the Company.
Although foreign exchange controls exist in some of the countries in which Millicom Group companies operate, none of these controls currently significantly restrict the ability of these operations to pay interest, dividends, technical service fees, royalties or repay loans by exporting cash, instruments of credit or securities in foreign currencies. However, existing foreign exchange controls may be strengthened in countries where the Millicom Group operates, or foreign exchange controls may be introduced in countries where the Millicom Group operates that do not currently impose such restrictions. If such events were to occur, the Company’s ability to receive funds from the operations could be subsequently restricted, which would impact the Company’s ability to make payments on its interest and loans and, or pay dividends to its shareholders. As a policy, all operations which do not face restrictions to deposit funds offshore and in hard currencies should do so for the surplus cash generated on a weekly basis. The Company and its subsidiaries make use of notional and physical cash pooling arrangements in hard currencies to the extent permitted.
In addition, in some countries it may be difficult to convert large amounts of local currency into foreign currency because of limited foreign exchange markets. The practical effects of this may be time delays in accumulating significant amounts of foreign currency and exchange risk, which could have an adverse effect on the Millicom Group. This is a relatively rare case for the countries in which the Millicom Group operates.
Lastly, repatriation most often gives rise to taxation, which is evidenced in the amount of taxes paid by the Millicom Group relative to the Corporate Income Tax reported in its statement of income.
A. Debt Securities
Not applicable to Annual Report filing.
B. Warrants and Rights
Not applicable to Annual Report filing.
C. Other Securities
Not applicable to Annual Report filing.
D. American Depositary Shares
Not applicable.
A. Defaults
Not applicable.
B. Arrears and Delinquencies
Not applicable.
Not applicable.
A. Disclosure Controls and Procedures
As of
December 31, 2019
, MIC S.A., under the supervision and with the participation of the Millicom Group’s management, including the Company’s Chief Executive Officer and the Chief Financial Officer, performed an evaluation of the effectiveness of the Millicom Group’s disclosure controls and procedures. The Millicom Group’s disclosure controls and procedures are designed to ensure that information required to be disclosed under the Exchange Act is accumulated and communicated to the Millicom Group’s management to allow timely decisions regarding required disclosures. The Millicom Group’s management necessarily applied its judgment in assessing the costs and benefits of such controls and procedures, which by their nature can provide only reasonable assurance regarding management’s control objectives.
Based on this evaluation, the Company’s Chief Executive Officer and the Chief Financial Officer concluded that as of
December 31, 2019
the Millicom Group’s disclosure controls and procedures are effective at the reasonable assurance level for recording, processing, summarizing and reporting the information the Company is required to disclose in the reports it files under the Exchange Act within the time periods specified in the U.S. Securities and Exchange Commission’s (the “SEC”) rules and forms.
B. Management’s Annual Report on Internal Control over Financial Reporting
The Millicom Group’s management is responsible for establishing and maintaining adequate internal control over financial reporting for the Company.
Internal control over financial reporting is a process designed to provide reasonable assurance regarding the reliability of the Company’s financial reporting as well as the preparation of consolidated financial statements for external reporting purposes in accordance with IFRS as issued by the International Accounting Standards Boards.
The Company’s internal control over financial reporting includes those policies and procedures that (1) pertain to the maintenance of records that, in reasonable detail, accurately and fairly reflect the transactions and dispositions of the assets of the Company; (2) provide reasonable assurance that transactions are recorded as necessary to permit the preparation of consolidated financial statements in accordance with IFRS, and that receipts and expenditures of the Company are being made only in accordance with authorizations of management and directors of the Company; and (3) provide reasonable assurance regarding prevention or timely detection of unauthorized acquisition, use or disposition of the Company’s assets that could have a material effect on the Company’s consolidated financial statements. Because of its inherent limitations, internal control over financial reporting may not prevent or detect misstatements and, even when
determined to be effective, can provide only reasonable assurance with respect to consolidated financial statements preparation and presentation. Also, projections of any evaluation of effectiveness to future periods are subject to the risk that controls may become inadequate because of changes in conditions, or that the degree of compliance with policies or procedures may deteriorate.
In May 2019, the Company completed its acquisition of 100% of the shares of Telefonía Celular de Nicaragua, S.A. (“Telefonía Nicaragua”). In August 2019, a 80% owned subsidiary of the Company, Cable Onda S.A., acquired 100% of the shares of Telefonica Moviles Panama, S.A. (“Telefonica Panama”). The Company is in the process of evaluating the existing controls and procedures of Telefonía Nicaragua and Telefonica Panama and integrating them into the Company’s internal control over financial reporting.
In accordance with SEC Staff guidance permitting a company to exclude an acquired business from management’s assessment of the effectiveness of internal control over financial reporting for the year in which the acquisition is completed, the Company has excluded these businesses from its assessment of the effectiveness of internal control over financial reporting as of
December 31, 2019
.
Telefonía Nicaragua represented 4% and 8% of the Company’s total and net assets as of
December 31, 2019
, and 3% of the Company’s revenues and 3% of the Company’s net income for the year ended
December 31, 2019
.
Telefonica Panama represented 6% and 22% of the Company’s total assets as of
December 31, 2019
, and 2% of the Company’s revenues and 4% of the Company’s net income for the year ended
December 31, 2019
.
The Company’s management conducted an assessment of the effectiveness of the Company’s internal control over financial reporting as of
December 31, 2019
, based on the framework in Internal Control - Integrated Framework (2013) issued by the Committee of Sponsoring Organizations of the Treadway Commission.
Based on its assessment, management believes that, as of
December 31, 2019
, the Company’s internal control over financial reporting is effective based on those criteria.
The Company’s internal control over financial reporting as of
December 31, 2019
has been audited by Ernst & Young S.A., the Company’s external independent registered public accounting firm, as stated in its report which follows.
C. Attestation Report of Independent Registered Public Accounting Firm
To the Shareholders and the Board of Directors of
Millicom International Cellular S.A.
Opinion on Internal Control Over Financial Reporting
We have audited Millicom International Cellular S.A.’s internal control over financial reporting as of December 31, 2019, based on criteria established in Internal Control-Integrated Framework issued by the Committee of Sponsoring Organizations of the Treadway Commission (2013 framework) (the COSO criteria). In our opinion, Millicom International Cellular S.A. (the Company) maintained, in all material respects, effective internal control over financial reporting as of December 31, 2019, based on the COSO criteria.
As indicated in the accompanying Management’s Annual Report on Internal Control over Financial Reporting, management’s assessment of and conclusion on the effectiveness of internal control over financial reporting did not include the internal controls of:
|
(1)
|
Telefonia Celular de Nicaragua S.A, which is included in the 2019 consolidated financial statements of the Company and constituted 4% and 8% of total and net assets, respectively, as of December 31, 2019 and 3% and 3% of revenues and net income, respectively, for the year then ended and;
|
|
(2)
|
Telefónica Móviles Panama S.A, which is included in the 2019 consolidated financial statements of the Company and constituted 6% and 22% of total and net assets, respectively, as of December 31, 2019 and 2% and 4% of revenues and net income, respectively, for the year then ended;
|
Our audit of internal control over financial reporting of the Company also did not include an evaluation of the internal control over financial reporting of Telefonia Celular de Nicaragua S.A. and Telefónica Móviles Panama S.A.
We also have audited, in accordance with the standards of the Public Company Accounting Oversight Board (United States) (PCAOB), the 2019 consolidated financial statements of the Company and our report dated February 28, 2020 expressed an unqualified opinion thereon.
Basis for Opinion
The Company’s management is responsible for maintaining effective internal control over financial reporting and for its assessment of the effectiveness of internal control over financial reporting included in the accompanying Management’s Annual Report on Internal Control over Financial Reporting. Our responsibility is to express an opinion on the Company’s internal control over financial reporting based on our audit. We are a public accounting firm registered with the PCAOB and are required to be independent with respect to the Company in accordance with the U.S. federal securities laws and the applicable rules and regulations of the Securities and Exchange Commission and the PCAOB.
We conducted our audit in accordance with the standards of the PCAOB. Those standards require that we plan and perform the audit to obtain reasonable assurance about whether effective internal control over financial reporting was maintained in all material respects.
Our audit included obtaining an understanding of internal control over financial reporting, assessing the risk that a material weakness exists, testing and evaluating the design and operating effectiveness of internal control based on the assessed risk, and performing such other procedures as we considered necessary in the circumstances. We believe that our audit provides a reasonable basis for our opinion.
Definition and Limitations of Internal Control Over Financial Reporting
A company’s internal control over financial reporting is a process designed to provide reasonable assurance regarding the reliability of financial reporting and the preparation of financial statements for external purposes in accordance with generally accepted accounting principles. A company’s internal control over financial reporting includes those policies and procedures that (1) pertain to the maintenance of records that, in reasonable detail, accurately and fairly reflect the transactions and dispositions of the assets of the company; (2) provide reasonable assurance that transactions are recorded as necessary to permit preparation of financial statements in accordance with generally accepted accounting principles, and that receipts and expenditures of the company are being made only in accordance with authorizations of management and directors of the company; and (3) provide reasonable assurance regarding prevention or timely detection of unauthorized acquisition, use, or disposition of the company’s assets that could have a material effect on the financial statements.
Because of its inherent limitations, internal control over financial reporting may not prevent or detect misstatements. Also, projections of any evaluation of effectiveness to future periods are subject to the risk that controls may become inadequate because of changes in conditions, or that the degree of compliance with the policies or procedures may deteriorate.
/s/ Ernst & Young
Société anonyme
Cabinet de révision agréé
Luxembourg,
28 February 2020
D. Changes in Internal Control over Financial Reporting
In May 2019, the Company completed its acquisition of 100 percent of the shares of Telefonía Celular de Nicaragua, S.A. In August 2019, Cable Onda S.A. acquired 100 percent of the shares of Telefonica Moviles Panama, S.A. The Company is engaged in refining and harmonizing the internal controls and processes of the acquired businesses with those of the Company.
MIC S.A.’s Audit Committee is chaired by Mr. Eliasson, and includes Ms. Erenbjerg, Ms. Johnson and Mr. Thompson. MIC S.A.’s Board of Directors has determined that each of Mr. Eliasson, Ms. Erenbjerg, Mr. Thompson and Ms. Johnson have the professional experience and knowledge to qualify as “audit committee financial experts” as defined by SEC rules. MIC S.A.’s Board has also determined that each of Mr. Eliasson, Ms. Erenbjerg, Mr. Thompson and Ms. Johnson are independent within the meaning of the independence requirements contemplated by Rule 10A-3 under the Exchange Act and the applicable Nasdaq listing rules.
Millicom has a Code of Conduct that applies to all employees and management. In May 2019, the Code of Conduct was amended to specify in greater detail our responsibility to regulators and shareholders, and clarify the duty of our employees to report concerns regarding accounting, internal controls, or auditing issues. In the year ended
December 31, 2019
, Millicom did not waive compliance with its Code of Conduct by its principal executive officer,
principal financial officer, principal accounting officer or controller, or persons performing similar functions
. The Code of Conduct is available at https://www.millicom.com/our-responsibility/compliance/millicom-code-of-conduct/.
The following table summarizes the aggregate amounts paid to Millicom’s auditors for the years ended
December 31, 2019
and
2018
.
|
2019
|
2018
|
||||
|
(US$ millions)
|
|||||
|
Audit fees
|
6.8
|
|
6.7
|
|
|
|
Audit related fees
|
1.3
|
|
0.4
|
|
|
|
Tax fees
|
0.1
|
|
0.2
|
|
|
|
Other fees
|
0.6
|
|
0.6
|
|
|
|
Total
|
8.8
|
|
7.7
|
|
|
Audit related services consist principally of consultations related to financial accounting and reporting standards, including making recommendations to management regarding internal controls and the issuance of certifications for debt and bonds. Tax services consist principally of tax planning services and tax compliance services. All other fees are for services not included in the other categories. 100% of the audit related, tax and other fees for
2019
and
2018
were approved by the audit committee.
Audit Committee Pre-approval Policies
The policies and procedures provide that requests for categories of non-audit services by Millicom’s auditors that have been pre-approved by the Audit Committee must be approved by management and subsequently reported to the Audit Committee on at least a quarterly basis, subject to a maximum annual and individual project cap. Other permitted services not listed in the pre-approved services list ratified by the Audit Committee must be pre-approved by the Audit Committee’s Chairman in between the regularly scheduled meetings and subsequently approved by the Audit Committee in full (during scheduled meetings), regardless of the level of fees.
Not applicable.
None.
Not applicable.
As a foreign private issuer incorporated in Luxembourg with its principal stock exchange listing on Nasdaq Stockholm, Millicom follows its “home country” corporate governance practices and the laws of the Grand Duchy of Luxembourg, in lieu of the provisions of the Nasdaq Stock Market’s Marketplace Rule 5600 series that apply to the constitution of a quorum for any meeting of shareholders, the composition and independence requirements of the Nomination Committee and the Compensation Committee and the requirement to have regularly scheduled meetings at which only independent directors are present. The Nasdaq Stock Market’s rules provide for a quorum of no less than 33⅓% of Millicom’s outstanding shares. However, Millicom’s Amended and Restated Articles of Association do not require a quorum. The Nasdaq Stock Market’s rules provide for the involvement of independent directors in the selection of director nominees. However, Millicom relies on its home country practices, in lieu of this requirement, which permit its director nominations committee to be comprised of shareholder representatives. The Nasdaq Stock Market’s rules require each Compensation Committee member to be an independent director for purposes of the Nasdaq Stock Market’s Marketplace Rule 5605(d)(2). However, to preserve greater flexibility in who may be appointed to the Compensation Committee, Millicom relies on its home country practices, in lieu of this requirement, which do not require the Compensation Committee to be comprised solely of directors who qualify as independent for such purposes. The Nasdaq Stock Market’s rules require listed companies to have regularly scheduled meetings at which only independent directors are present. However, Millicom follows its home country practices which do not impose such a requirement.
Not applicable.
We have responded to Item 18 in lieu of this item.
Financial Statements are filed as part of this Annual Report, see page F-1.
|
1.1
*
|
Amended and Restated Articles of Association of Millicom International Cellular S.A.
|
|
2.1
*
|
Description of Share Capital
|
|
Amended and Restated Indenture for the $500,000,000 6.0% Senior Notes due 2025 between Millicom International Cellular S.A., Citibank, N.A., London Branch and Citigroup Global Markets Deutschland AG dated May 30, 2018 (incorporated herein by reference to Exhibit 4.1. to the Company’s Registration Statement on Form 20-F (File No. 001-38763) filed with the SEC on December 13, 2018)
|
|
|
Amended and Restated Indenture for the $500,000,000 5.125% Senior Notes due 2028 between Millicom International Cellular S.A., Citibank, N.A., London Branch and Citigroup Global Markets Deutschland AG dated May 30, 2018 (incorporated herein by reference to Exhibit 4.2. to the Company’s Registration Statement on Form 20-F (File No. 001-38763) filed with the SEC on December 13, 2018)
|
|
|
Multicurrency revolving facility agreement for Millicom International Cellular S.A. arranged by The Bank Of Nova Scotia, BNP Paribas, Citigroup Global Markets Limited and DNB Markets, a part of DNB Bank ASA, Sweden Branch dated January 27, 2017 (incorporated herein by reference to Exhibit 4.2. to the Company’s Registration Statement on Form 20-F (File No. 001-38763) filed with the SEC on December 13, 2018)
|
|
|
Amended and restated stock purchase agreement for the acquisition of interests in Cable Onda S.A. among Millicom International Cellular S.A., Millicom LIH S.A., Medios de Comunicacion LTD, Telecarrier International Limited, IGP Trading Corp. and Tenedora Activa, S.A. dated December 12, 2018 (incorporated herein by reference to Exhibit 4.5. to the Company’s Registration Statement on Form 20-F (File No. 001-38763) filed with the SEC on December 13, 2018)
|
|
|
Indenture for the $500,000,000 6.625% Senior Notes due 2026 between Millicom International Cellular S.A., Citibank, N.A., London Branch and Citigroup Global Markets Europe AG dated October 16, 2018 (incorporated herein by reference to Exhibit 4.6. to the Company’s Registration Statement on Form 20-F (File No. 001-38763) filed with the SEC on December 13, 2018)
|
|
|
4.6
*
|
Indenture for the $750,000,000 6.25% Senior Notes due 2029 between Millicom International Cellular S.A., Citibank, N.A., London Branch and Citigroup Global Markets Europe AG dated March 25, 2019
|
|
4.7
*
|
First Supplemental Indenture to the Amended and Restated Indenture for the $500,000,000 6.0% Senior Notes due 2025 between Millicom International Cellular S.A., Citibank, N.A., London Branch and Citigroup Global Markets Deutschland AG, dated as of May 30, 2018
|
|
4.8
*
|
Term facility agreement for Millicom International Cellular S.A. arranged by DNB Bank ASA, Sweden Branch and Nordea Bank Abp, Filial i Sverige dated April 24, 2019
|
|
4.9
*
|
Terms and Conditions for Millicom International Cellular S.A.’s SEK 2 Billion Floating-Rate Senior Unsecured Sustainability Bond due 2024
|
|
List of significant subsidiaries
|
|
|
12.1
*
|
Certification pursuant to section 302 of the Sarbanes-Oxley Act of 2002
|
|
12.2
*
|
Certification pursuant to section 302 of the Sarbanes-Oxley Act of 2002
|
|
13.1
**
|
Certification pursuant to 18 U.S.C. section 1350, as adopted pursuant to section 906 of the Sarbanes-Oxley Act of 2002
|
|
13.2
**
|
Certification pursuant to 18 U.S.C. section 1350, as adopted pursuant to section 906 of the Sarbanes-Oxley Act of 2002
|
|
15.1
*
|
Consent of Ernst & Young S.A.
|
|
101.INS*
|
XBRL Instance Document
|
|
101.SC*
|
XBRL Taxonomy Extension Schema Document
|
|
101.CA*
|
XBRL Taxonomy Extension Calculation Linkbase Document
|
|
101.DE*
|
XBRL Taxonomy Extension Definition Linkbase Document
|
|
101.LA*
|
XBRL Taxonomy Extension Label Linkbase Document
|
|
101.PRE*
|
XBRL Taxonomy Extension Presentation Linkbase Document
|
______________________
* Filed herewith
** Furnished herewith
SIGNATURES
The registrant hereby certifies that it meets all of the requirements for filing on Form 20-F and that it has duly caused and authorized the undersigned to sign this annual report on its behalf.
|
MILLICOM INTERNATIONAL CELLULAR S.A.
|
|||
|
Date:
|
February 28, 2020
|
By:
|
/s/ Tim Pennington
|
|
Name: Tim Pennington
|
|||
|
Title: Senior Executive Vice President, Chief Financial Officer
|
|||
|
By:
|
/s/ Mauricio Ramos
|
||
|
Name: Mauricio Ramos
|
|||
|
Title: President and Chief Executive Officer
|
|||
INDEX TO FINANCIAL STATEMENTS
|
Audited Consolidated Financial Statements of Millicom International Cellular S.A. at December 31, 2019 and 2018 and for the Years Ended December 31, 2019, 2018 and 2017
|
|
|
Report of independent registered public accounting firm
|
|
|
Consolidated statement of income for the years ended December 31, 2019, 2018 and 2017
|
|
|
Consolidated statement of comprehensive income for the years ended December 31, 2019, 2018 and 2017
|
|
|
Consolidated statement of financial position at December 31, 2019 and 2018
|
|
|
Consolidated statement of cash flows for the years ended December 31, 2019, 2018 and 2017
|
|
|
Consolidated statement of changes in equity for the years ended December 31, 2019, 2018 and 2017
|
|
|
Notes to the audited consolidated financial statements
|
|
F- 1
Report of Independent Registered Public Accounting Firm
To the Shareholders and the Board of Directors of Millicom International Cellular S.A.
Opinion on the Consolidated Financial Statements
We have audited the accompanying consolidated statements of financial position of Millicom International Cellular S.A. (the “Group“) as of December 31, 2019 and 2018, the related consolidated statements of income, comprehensive income, changes in equity, and cash flows, for each of the three years in the period ended December 31, 2019, and the related notes (collectively referred to as the “consolidated financial statements”). In our opinion, the consolidated financial statements present fairly, in all material respects, the financial position of the Group at December 31, 2019 and 2018, and the results of its operations and its cash flows for each of the three years in the period ended December 31, 2019, in conformity with International Financial Reporting Standards (“IFRS”) as issued by the International Accounting Standard Board (“IASB”).
We also have audited, in accordance with the standards of the Public Company Accounting Oversight Board (United States) (PCAOB), the Group's internal control over financial reporting as of December 31, 2019, based on criteria established in Internal Control-Integrated Framework issued by the Committee of Sponsoring Organizations of the Treadway Commission (2013 framework) and our report dated February 28, 2020 expressed an unqualified opinion thereon.
Adoption of IFRS 16 “Leases”
As discussed in the Introduction to the consolidated financial statements, the Group changed its method of accounting for leases, including for their classification and measurement, effective January 1, 2019 due to the adoption of IFRS 16 “Leases”. See below for discussion of our related critical audit matter.
Adoption of IFRS 15 “Revenue from Contracts with Customers” and IFRS 9 “Financial Instruments"
As disclosed in the Introduction to the consolidated financial statements, the Group changed its method of accounting for revenue from contracts with customers and for the classification, measurement, recognition and impairments of financial assets and financial liabilities as well as hedge accounting effective January 1, 2018 due to the adoption of IFRS 15 “Revenue from Contracts with Customers” and IFRS 9 “Financial Instruments”, respectively.
Basis for Opinion
These consolidated financial statements are the responsibility of the Group’s management. Our responsibility is to express an opinion on the Group’s consolidated financial statements based on our audits. We are a public accounting firm registered with the PCAOB and are required to be independent with respect to the Group in accordance with the U.S. federal securities laws and the applicable rules and regulations of the Securities and Exchange Commission and the PCAOB.
We conducted our audits in accordance with the standards of the PCAOB. Those standards require that we plan and perform the audit to obtain reasonable assurance about whether the financial statements are free of material misstatement, whether due to error or fraud. Our audits included performing procedures to assess the risks of material misstatement of the financial statements, whether due to error or fraud, and performing procedures that respond to those risks. Such procedures included examining, on a test basis, evidence regarding the amounts and disclosures in the financial statements. Our audits also included evaluating the accounting principles used and significant estimates made by management, as well as evaluating the overall presentation of the financial statements. We believe that our audits provide a reasonable basis for our opinion.
Critical Audit Matters
The critical audit matters communicated below are matters arising from the current period audit of the financial statements that were communicated or required to be communicated to the audit committee and that: (1) relate to accounts or disclosures that are material to the financial statements and (2) involved our especially challenging, subjective, or complex judgments. The communication of critical audit matters does not alter in any way our opinion on the consolidated financial statements, taken as a whole, and we are not, by communicating the critical audit matters below, providing separate opinions on the critical audit matters or on the accounts or disclosures to which they relate.
F- 2
Revenue recognition
|
Description of the Matter
|
As described in Note B.1.1 of the consolidated financial statements, the Group’s revenue, amongst others, includes bundled offers (e.g., sales of telecom services and sale of handsets) and principal vs. agent considerations (i.e., some arrangements involve two or more unrelated parties that contribute to providing a specified good or service to a customer). Auditing bundled offers was especially challenging and involved complex auditor judgment because these arrangements involve multiple deliverables and elements which require the identification of separate performance obligations and allocation of the transaction price to those obligations, which is recognized in accordance with the transfer of goods or services to customers in an amount that reflects their relative stand-alone selling prices (e.g. the revenue from the sale of telecom services is recognized over time and the revenue from the sale of handsets is recognized at a point in time). In addition, auditing Principal vs. Agent considerations was especially challenging and involved auditor judgment to determine whether the Group has promised to provide the specified good or service itself (as a principal) or to arrange for those specified goods or services to be provided by another party (as an agent). In addition, auditing the information technology infrastructure used by the Group to capture complete and accurate information (e.g. the set-up of customer accounts, pricing data, segregation of duties, reconciliation from billing system to the general ledger) to recognize revenues was especially challenging. There were challenges in obtaining an understanding of the structure of the complex systems and processes used to capture the large volumes of customer data. Furthermore, judgment was required to evaluate the relevant data that was captured and aggregated, and to assess the sufficiency of the audit evidence obtained.
|
|
How We
Addressed the
Matter in Our
Audit
|
Our audit procedures included, among others, obtaining an understanding of and evaluating the design and testing the operating effectiveness of controls over the accounting for bundled offers (including identification of separate performance obligations and allocation of the transaction price to those obligations) and Principal vs. Agent considerations. Our audit procedures also included assessing the overall IT control environment and the IT controls in place, assisted by our information technology professionals. We also evaluated the design and tested the operating effectiveness of controls around access rights, system development, program changes and IT dependent business controls to establish that changes to the system were appropriately authorized, developed, and implemented including those over: set-up of customer accounts, pricing data, segregation of duties and the linkage to usage data that drives revenue recognition. In addition, we tested the end-to-end reconciliation from the billing systems to the general ledger. We also tested journal entries processed between the billing systems and general ledger. We assessed the accounting for credits and discounts and tested the accuracy of customer invoices. We assessed the assumptions used by management to determine the allocation of the transaction price, after consideration of these credits and discounts, to telecom services and handsets and tested the stand-alone selling prices. We obtained a sample of customer contracts, including modifications to the contracts, and compared customer contract terms to the revenue systems. We evaluated management’s Principal vs. Agent considerations and conclusions. We assessed the adequacy of the Group’s disclosures in respect to the accounting policies on revenue recognition.
|
F- 3
Adoption of IFRS 16, leases
|
Description of the Matter
|
As discussed above and in the Introduction and Note C.4 to the consolidated financial statements, the Group adopted IFRS 16, Leases, using the modified retrospective approach. At the transition date, the Group recognized lease liabilities measured at the present value of the remaining lease payments, discounted using the lessee’s incremental borrowing rate as of January 1, 2019. The right-of-use asset was measured at an amount equal to the lease liability, adjusted by the amount of any prepaid or accrued lease payments. Upon adoption, the Group recognized lease liabilities of USD 898 million and right-of-use assets of USD 856 million, including reclassification of liabilities and assets previously recorded under capital leases.
The application of IFRS 16 effective from January 1, 2019 was especially challenging and involved complex auditor judgment particularly regarding assessing management’s determination of a complete population of the Group’s leases, estimation and evaluation of the incremental borrowing rates for each of the leases (including consideration of industry, country and credit risks) and estimation of the useful lives, including consideration of renewal options. These assumptions have a significant effect on the right-of-use asset, on the lease liability and the depreciation and financing costs.
|
|
How We
Addressed the
Matter in Our
Audit
|
Our audit procedures included, among others, obtaining an understanding of and evaluating the design and testing the operating effectiveness of controls over the completeness and accuracy of the Group’s lease population, valuation and recognition of the right-of-use asset and the lease liability and the Group’s determination of their underlying assumptions (including renewal assumptions and estimation of the incremental borrowing rate). In addition, we inspected a sample of the lease agreements, including modifications, and we assessed management’s assumptions regarding lease renewal periods including its determination that it was highly probable that the leases would be renewed. Regarding the incremental borrowing rates, we involved our valuation specialists to assist with our audit procedures to test management’s assumptions and risk considerations as described above used in the measurement process. We also assessed the adequacy of the Group’s disclosures in respect of the adoption of IFRS 16.
|
F- 4
Accounting for Business Combinations
|
Description of the Matter
|
As described in Note A.1.2 of the consolidated financial statements, the Group acquired control over, and therefore consolidated Cable Onda S.A. (“Cable Onda”) in Panama for net consideration of USD 956 million, Telefonica Celular de Nicaragua S.A. in Nicaragua (“Telefonica Nicaragua”) for net consideration of USD 430 million, as adjusted, and Telefonica Moviles Panama S.A. in Panama (“Telefonica Panama”) for net consideration of USD 594 million as of December 13, 2018, May 16, 2019 and August 29, 2019, respectively. These transactions were accounted for as business combinations. The purchase accounting of Cable Onda was provisional as of December 31, 2018 and had been finalized as of December 31, 2019. Management has determined the purchase accounting for Telefonica Nicaragua and Telefonica Panama on a provisional basis as of December 31, 2019.
Auditing the business combinations was especially challenging and involved complex auditor judgment due to the significant estimation required to determine the fair value of the acquired identifiable assets. For example, the fair value estimates associated with the customer lists, determined using estimated cash flows, were sensitive to significant assumptions, such as the discount rate, churn rate and EBITDA margin, which are affected by expectations about future market or economic conditions, particularly those in the emerging markets of Latin America. In addition, auditing the purchase accounting of the acquisitions required the involvement of valuation specialists to assist with our procedures of auditing the fair value of the acquired identifiable assets and the related assumptions.
|
|
How We
Addressed the
Matter in Our
Audit
|
Our audit procedures included, among others, obtaining an understanding of and evaluating the design and testing the operating effectiveness of the Group’s controls over its accounting for business combinations. For example, we tested controls over management’s evaluation of the purchase contracts for terms and conditions that would impact the accounting and the identification, recognition and measurement of the intangible assets, including the controls over the determination of the underlying models and the significant assumptions used to develop estimates of value. Our audit procedures included, among others, inspecting the purchase agreements and evaluating the terms and conditions and management’s accounting for such terms and conditions in its purchase price allocation. We involved our valuation specialists to assist with our audit procedures to test the estimated cash flows and management’s valuation methodologies and assumptions discussed above which were used to determine the fair value of the acquired identifiable assets and assumed liabilities. In addition, our valuation specialists assisted us in assessing whether the underlying assumptions used by management were consistent with publicly available information and external market data. We also assessed the completeness and accuracy of the underlying data through our inspection of and comparison to historical information. We evaluated the adequacy of the related disclosures.
|
F- 5
Uncertain tax positions
|
Description of the Matter
|
As described in Note G.3.2 of the consolidated financial statements, the Group operates in developing countries where the tax systems, regulations and enforcement processes have varying stages of development creating uncertainty regarding the application of the tax law and interpretation of tax treatments. The Group is also subject to regular tax audits in the countries where it operates. When there is uncertainty over whether the taxation authority will accept a specific tax treatment under the local tax law, that tax treatment is therefore uncertain. The resolution of tax positions taken by the Group, through negotiations with relevant tax authorities or through litigation, can take several years to complete and, in some cases, it is difficult to predict the outcome. At December 31, 2019, the tax risks exposure of the Group's subsidiaries is estimated at USD 300 million, for which provisions of USD 50 million have been recorded in tax liabilities. The Group's share of tax exposure and provisions in its joint ventures amounts to USD 49 million and USD 4 million, respectively.
Auditing management’s analysis of the Group’s uncertain tax positions and the related uncertain tax positions was especially challenging because the analysis is complex and involves significant management and auditor judgment and estimation. Each tax position involves unique facts and circumstances that must be evaluated, and there may be many uncertainties around initial recognition and de-recognition of tax positions, including regulatory changes, litigation and examination
|
|
How We
Addressed the
Matter in Our
Audit
|
Our audit procedures included, among others, obtaining an understanding of and evaluating the design and testing the operating effectiveness of the Group’s controls relating to uncertain tax positions. For example, we tested controls over management’s identification of uncertain tax positions and its application of the recognition and measurement principles, including management’s review of the inputs and calculations of uncertain tax positions. Our audit procedures included, among others, evaluating the assumptions the Group used to develop its uncertain tax positions and related unrecognized tax positions by jurisdiction. For example, we compared the estimated liabilities for unrecognized tax positions to similar positions in prior periods and assessed management’s consideration of current tax treatments and litigation and trends in similar positions challenged by tax authorities. We also assessed the historical accuracy of management’s estimates of its unrecognized tax positions by comparing the estimates with the resolution of those positions. In addition, we involved our tax professionals to assist us in evaluating the application of relevant tax laws and the Group’s interpretation of such laws in its recognition determination. We also tested the completeness and accuracy of the underlying data used by the Group to calculate its uncertain tax positions. We also evaluated the adequacy of the Group’s disclosures.
|
/s/ Ernst & Young
Société anonyme
Cabinet de révision agréé
We have served as the Group’s auditor since 2012.
Luxembourg, Grand Duchy of Luxembourg
February 28, 2020
F- 6
|
Consolidated Statement of Income
For the years ended December 31, 2019, 2018 and 2017
|

|
Consolidated statement of income for the years ended
December 31, 2019
,
2018
and
2017
|
Notes
|
2019
|
2018 (i)
|
2017 (i)
|
||||
|
(US$ millions)
|
|||||||
|
Revenue
|
B.1.
|
4,336
|
|
3,946
|
|
3,936
|
|
|
Cost of sales
|
B.2.
|
(1,201
|
)
|
(1,117
|
)
|
(1,169
|
)
|
|
Gross profit
|
3,135
|
|
2,829
|
|
2,767
|
|
|
|
Operating expenses
|
B.2.
|
(1,604
|
)
|
(1,616
|
)
|
(1,531
|
)
|
|
Depreciation
|
E.2.2., E.3.
|
(825
|
)
|
(662
|
)
|
(670
|
)
|
|
Amortization
|
E.1.3.
|
(275
|
)
|
(140
|
)
|
(142
|
)
|
|
Share of profit in the joint ventures in Guatemala and Honduras
|
A.2.
|
179
|
|
154
|
|
140
|
|
|
Other operating income (expenses), net
|
B.2.
|
(34
|
)
|
75
|
|
69
|
|
|
Operating profit
|
B.3.
|
575
|
|
640
|
|
632
|
|
|
Interest and other financial expenses
|
C.3.3., E.3.
|
(564
|
)
|
(367
|
)
|
(389
|
)
|
|
Interest and other financial income
|
20
|
|
21
|
|
16
|
|
|
|
Other non-operating (expenses) income, net
|
B.5., C.7.3.
|
227
|
|
(39
|
)
|
(2
|
)
|
|
Profit (loss) from other joint ventures and associates, net
|
A.3.
|
(40
|
)
|
(136
|
)
|
(85
|
)
|
|
Profit (loss) before taxes from continuing operations
|
218
|
|
119
|
|
172
|
|
|
|
Charge for taxes, net
|
B.6.
|
(120
|
)
|
(112
|
)
|
(162
|
)
|
|
Profit (loss) for the year from continuing operations
|
97
|
|
7
|
|
10
|
|
|
|
Profit (loss) from discontinued operations, net of tax
|
E.4.2.
|
57
|
|
(33
|
)
|
60
|
|
|
Net profit (loss) for the year
|
154
|
|
(26
|
)
|
69
|
|
|
|
Attributable to:
|
|||||||
|
The owners of Millicom
|
149
|
|
(10
|
)
|
87
|
|
|
|
Non-controlling interests
|
A.1.4.
|
5
|
|
(16
|
)
|
(17
|
)
|
|
Earnings (loss) per common share for profit (loss) attributable to the owners of the Company:
|
|||||||
|
Basic (US$ per common share):
|
|||||||
|
— from continuing operations
|
0.92
|
|
0.23
|
|
0.27
|
|
|
|
— from discontinued operations
|
0.56
|
|
(0.33
|
)
|
0.59
|
|
|
|
— total
|
B.7.
|
1.48
|
|
(0.10
|
)
|
0.86
|
|
|
Diluted (US$ per common share):
|
|||||||
|
— from continuing operations
|
0.92
|
|
0.23
|
|
0.27
|
|
|
|
— from discontinued operations
|
0.56
|
|
(0.33
|
)
|
0.59
|
|
|
|
Total
|
B.7.
|
1.48
|
|
(0.10
|
)
|
0.86
|
|
|
(i)
|
Re-presented for discontinued operations (shown in note
A.4.
) 2018 and 2017 were n
ot restated for the application of IFRS 16, and, additionally, 2017 was not restated for the application of IFRS 15 and IFRS 9, as the Group elected the modified retrospective approach.
|
The accompanying notes are an integral part of these consolidated financial statements.
F- 7
|
Consolidated Statement of Comprehensive Income
For the years ended December 31, 2019, 2018 and 2017
|
|
Consolidated statement of comprehensive income for the years ended
December 31, 2019
,
2018
and
2017
|
2019
|
2018 (i)
|
2017 (i)
|
||||
|
(US$ millions)
|
||||||
|
Net profit (loss) for the year
|
154
|
|
(26
|
)
|
69
|
|
|
Other comprehensive income (to be reclassified to statement of income in subsequent periods), net of tax:
|
||||||
|
Exchange differences on translating foreign operations
|
(4
|
)
|
(81
|
)
|
85
|
|
|
Change in value of cash flow hedges, net of tax effects
|
(16
|
)
|
(1
|
)
|
4
|
|
|
Other comprehensive income (not to be reclassified to the statement of income in subsequent periods), net of tax:
|
||||||
|
Remeasurements of post-employment benefit obligations, net of tax effects
|
—
|
|
—
|
|
(2
|
)
|
|
Total comprehensive income (loss) for the year
|
133
|
|
(108
|
)
|
158
|
|
|
Attributable to
|
||||||
|
Owners of the Company
|
131
|
|
(78
|
)
|
173
|
|
|
Non-controlling interests
|
3
|
|
(30
|
)
|
(15
|
)
|
|
Total comprehensive income for the period arises from:
|
||||||
|
Continuing operations
|
76
|
|
(102
|
)
|
105
|
|
|
Discontinued operations
|
57
|
|
(7
|
)
|
52
|
|
|
(i)
|
Re-presented for discontinued operations (shown in note
A.4.
). 2018 and 2017 were n
ot restated for the application of IFRS 16, and , additionally, 2017 was not restated for the application of IFRS 15 and IFRS 9, as the Group elected the modified retrospective approach.
|
The accompanying notes are an integral part of these consolidated financial statements.
F- 8
|
Consolidated Statement of Financial Position
For the year ended December 31, 2019 and 2018
|
|
Consolidated statement of financial position at
December 31, 2019
and
2018
|
Notes
|
December 31
2019 |
December 31
2018 (i) (ii) |
|||
|
(US$ millions)
|
|||||
|
ASSETS
|
|||||
|
NON-CURRENT ASSETS
|
|||||
|
Intangible assets, net
|
E.1.
|
3,219
|
|
2,346
|
|
|
Property, plant and equipment, net
|
E.2.
|
2,883
|
|
3,071
|
|
|
Right of use assets
|
E.3.
|
977
|
|
—
|
|
|
Investments in joint ventures
|
A.2.
|
2,797
|
|
2,867
|
|
|
Investments in associates
|
A.3.
|
25
|
|
169
|
|
|
Contract costs, net
|
F.5.
|
5
|
|
4
|
|
|
Deferred tax assets
|
B.6.
|
200
|
|
202
|
|
|
Other non-current assets
|
G.5.
|
104
|
|
126
|
|
|
TOTAL NON-CURRENT ASSETS
|
10,210
|
|
8,785
|
|
|
|
CURRENT ASSETS
|
|||||
|
Inventories
|
F.2.
|
32
|
|
39
|
|
|
Trade receivables, net
|
F.1.
|
371
|
|
343
|
|
|
Contract assets, net
|
F.5.
|
41
|
|
37
|
|
|
Amounts due from non-controlling interests, associates and joint ventures
|
G.5.
|
29
|
|
34
|
|
|
Prepayments and accrued income
|
156
|
|
129
|
|
|
|
Current income tax assets
|
119
|
|
108
|
|
|
|
Supplier advances for capital expenditure
|
22
|
|
25
|
|
|
|
Equity investments
|
371
|
|
—
|
|
|
|
Other current assets
|
181
|
|
124
|
|
|
|
Restricted cash
|
C.5.
|
155
|
|
158
|
|
|
Cash and cash equivalents
|
C.5.
|
1,164
|
|
528
|
|
|
TOTAL CURRENT ASSETS
|
2,641
|
|
1,525
|
|
|
|
Assets held for sale
|
E.4.2.
|
5
|
|
3
|
|
|
TOTAL ASSETS
|
12,856
|
|
10,313
|
|
|
|
(i)
|
Not restated for the application of IFRS 16 as the Group elected the modified retrospective approach.
|
|
(ii)
|
The consolidated statement of financial position at
December 31, 2018
has been restated after finalization of the Cable Onda purchase accounting (note
A.1.2.
).
|
The accompanying notes are an integral part of these consolidated financial statements.
F- 9
|
Consolidated statement of financial position
For the year ended December 31, 2019 and 2018 (continued)
|
|
|
Notes
|
December 31
2019 |
December 31
2018 (i) (ii) |
|||
|
(US$ millions)
|
|||||
|
EQUITY AND LIABILITIES
|
|||||
|
EQUITY
|
|||||
|
Share capital and premium
|
C.1.
|
633
|
|
635
|
|
|
Treasury shares
|
(51
|
)
|
(81
|
)
|
|
|
Other reserves
|
C.1.
|
(544
|
)
|
(538
|
)
|
|
Retained profits
|
2,222
|
|
2,535
|
|
|
|
Profit (loss) for the year attributable to equity holders
|
149
|
|
(10
|
)
|
|
|
Equity attributable to owners of the Company
|
2,410
|
|
2,542
|
|
|
|
Non-controlling interests
|
A.1.4.
|
271
|
|
251
|
|
|
TOTAL EQUITY
|
2,680
|
|
2,792
|
|
|
|
LIABILITIES
|
|||||
|
NON-CURRENT LIABILITIES
|
|||||
|
Debt and financing
|
C.3.
|
5,786
|
|
4,123
|
|
|
Lease liabilities
|
C.4.
|
967
|
|
—
|
|
|
Derivative financial instruments
|
D.1.2.
|
17
|
|
—
|
|
|
Amounts due to non-controlling interests, associates and joint ventures
|
G.5.
|
337
|
|
135
|
|
|
Provisions and other non-current liabilities
|
F.4.2.
|
383
|
|
351
|
|
|
Deferred tax liabilities
|
B.6.
|
279
|
|
236
|
|
|
TOTAL NON-CURRENT LIABILITIES
|
7,770
|
|
4,845
|
|
|
|
CURRENT LIABILITIES
|
|||||
|
Debt and financing
|
C.3.
|
186
|
|
458
|
|
|
Lease liabilities
|
C.4.
|
97
|
|
—
|
|
|
Put option liability
|
C.7.4.
|
264
|
|
239
|
|
|
Derivative financial instruments
|
D.1.2.
|
—
|
|
—
|
|
|
Payables and accruals for capital expenditure
|
348
|
|
335
|
|
|
|
Other trade payables
|
289
|
|
282
|
|
|
|
Amounts due to non-controlling interests, associates and joint ventures
|
G.5.
|
161
|
|
348
|
|
|
Accrued interest and other expenses
|
432
|
|
381
|
|
|
|
Current income tax liabilities
|
75
|
|
55
|
|
|
|
Contract liabilities
|
F.5.
|
82
|
|
87
|
|
|
Provisions and other current liabilities
|
F.4.1.
|
474
|
|
492
|
|
|
TOTAL CURRENT LIABILITIES
|
2,406
|
|
2,676
|
|
|
|
Liabilities directly associated with assets held for sale
|
E.4.2.
|
—
|
|
—
|
|
|
TOTAL LIABILITIES
|
10,176
|
|
7,521
|
|
|
|
TOTAL EQUITY AND LIABILITIES
|
12,856
|
|
10,313
|
|
|
|
(i)
|
Not restated for the application of IFRS 16 as the Group elected the modified retrospective approach.
|
|
(ii)
|
The consolidated statement of financial position at
December 31, 2018
has been restated after finalization of the Cable Onda purchase accounting (note
A.1.2.
).
|
The accompanying notes are an integral part of these consolidated financial statements.
F- 10
|
Consolidated Statement of Cash Flows
For the years ended December 31, 2019, 2018 and 2017
|
|
|
Notes
|
2019
|
2018(i)
|
2017(i)
|
||||
|
(US$ millions)
|
|||||||
|
Cash flows from operating activities (including discontinued operations)
|
|||||||
|
Profit before taxes from continuing operations
|
218
|
|
119
|
|
172
|
|
|
|
Profit (loss) before taxes from discontinued operations
|
E.4.2.
|
59
|
|
(29
|
)
|
55
|
|
|
Profit before taxes
|
276
|
|
91
|
|
227
|
|
|
|
Adjustments to reconcile to net cash:
|
|||||||
|
(Finance) Lease interest expense
|
157
|
|
91
|
|
64
|
|
|
|
Financial interest expense
|
408
|
|
282
|
|
352
|
|
|
|
Interest and other financial income
|
(20
|
)
|
(21
|
)
|
(16
|
)
|
|
|
Adjustments for non-cash items:
|
|||||||
|
Depreciation and amortization
|
1,111
|
|
830
|
|
879
|
|
|
|
Share of profit in Guatemala and Honduras joint ventures
|
A.2.
|
(179
|
)
|
(154
|
)
|
(140
|
)
|
|
(Gain) on disposal and impairment of assets, net
|
B.2., E.4.2.
|
(40
|
)
|
(37
|
)
|
(99
|
)
|
|
Share based compensation
|
C.1.
|
30
|
|
22
|
|
22
|
|
|
Transaction costs assumed by Cable Onda
|
A.1.2.
|
—
|
|
30
|
|
—
|
|
|
Loss from other joint ventures and associates,net
|
A.3.
|
40
|
|
136
|
|
85
|
|
|
Other non-cash non-operating (income) expenses, net
|
B.5.
|
(227
|
)
|
40
|
|
(2
|
)
|
|
Changes in working capital:
|
|
|
|
|
|
|
|
|
Decrease (increase) in trade receivables, prepayments and other current assets,net
|
(119
|
)
|
(128
|
)
|
5
|
|
|
|
Decrease in inventories
|
11
|
|
2
|
|
16
|
|
|
|
Increase (decrease) in trade and other payables, net
|
(61
|
)
|
69
|
|
(82
|
)
|
|
|
Changes in contract assets, liabilities and costs, net
|
(2
|
)
|
(9
|
)
|
—
|
|
|
|
Total changes in working capital
|
(172
|
)
|
(66
|
)
|
(61
|
)
|
|
|
Interest paid on (finance) leases
|
(141
|
)
|
(89
|
)
|
(84
|
)
|
|
|
Interest paid on debt and other financing
|
(344
|
)
|
(229
|
)
|
(288
|
)
|
|
|
Interest received
|
15
|
|
20
|
|
16
|
|
|
|
Taxes (paid)
|
(114
|
)
|
(153
|
)
|
(132
|
)
|
|
|
Net cash provided by operating activities
|
801
|
|
792
|
|
820
|
|
|
|
Cash flows from (used in) investing activities (including discontinued operations):
|
|||||||
|
Acquisition of subsidiaries, joint ventures and associates, net of cash acquired
|
A.1.
|
(1,014
|
)
|
(953
|
)
|
(22
|
)
|
|
Proceeds from disposal of subsidiaries and associates, net of cash disposed
|
E.4.2., A.3.2.
|
111
|
|
176
|
|
22
|
|
|
Purchase of intangible assets and licenses
|
E.1.4.
|
(171
|
)
|
(148
|
)
|
(133
|
)
|
|
Proceeds from sale of intangible assets
|
—
|
|
—
|
|
4
|
|
|
|
Purchase of property, plant and equipment
|
E.2.3.
|
(736
|
)
|
(632
|
)
|
(650
|
)
|
|
Proceeds from sale of property, plant and equipment
|
C.3.4.
|
24
|
|
154
|
|
179
|
|
|
Proceeds from disposal of equity investment, net of costs
|
25
|
|
—
|
|
—
|
|
|
|
Dividends received from joint ventures
|
A.2.2.
|
237
|
|
243
|
|
203
|
|
|
Settlement of financial derivative instruments
|
—
|
|
(63
|
)
|
—
|
|
|
|
Cash (used in) provided by other investing activities, net
|
D.1.2.
|
20
|
|
24
|
|
31
|
|
|
Net cash used in investing activities
|
(1,502
|
)
|
(1,199
|
)
|
(367
|
)
|
|
F- 11
|
Consolidated statement of cash flows
For the years ended December 31, 2019, 2018 and 2017 (continued)
|
|
|
Notes
|
2019
|
2018(i)
|
2017(i)
|
||||
|
Cash flows from financing activities (including discontinued operations):
|
|||||||
|
Proceeds from debt and other financing
|
C.3.
|
2,900
|
|
1,155
|
|
996
|
|
|
Repayment of debt and other financing
|
C.3.
|
(1,157
|
)
|
(530
|
)
|
(1,176
|
)
|
|
(Finance) Lease capital repayment
|
(107
|
)
|
(17
|
)
|
(19
|
)
|
|
|
Advances for, and dividends paid to non-controlling interests
|
A.1./A.2.
|
(13
|
)
|
(2
|
)
|
—
|
|
|
Dividends paid to owners of the Company
|
C.2.
|
(268
|
)
|
(266
|
)
|
(265
|
)
|
|
Net cash provided by (used in) financing activities
|
1,355
|
|
341
|
|
(464
|
)
|
|
|
Exchange impact on cash and cash equivalents,net
|
(8
|
)
|
(33
|
)
|
4
|
|
|
|
Net (decrease) increase in cash and cash equivalents
|
645
|
|
(98
|
)
|
(8
|
)
|
|
|
Cash and cash equivalents at the beginning of the year
|
528
|
|
619
|
|
646
|
|
|
|
Effect of cash in disposal group held for sale
|
E.4.2.
|
(9
|
)
|
6
|
|
(19
|
)
|
|
Cash and cash equivalents at the end of the year
|
1,164
|
|
528
|
|
619
|
|
|
|
(i)
|
Re-presented for discontinued operations (shown in note
A.4.
and
E.4.2.
). 2018 and 2017 were n
ot restated for the application of IFRS 16, and , additionally,2017 was not restated for the application of IFRS 15 and IFRS 9, as the Group elected the modified retrospective approach
.
|
The accompanying notes are an integral part of these consolidated financial statements.
F- 12
|
Consolidated Statement of Changes in Equity
For the years ended December 31, 2019, 2018 and 2017
|
|
Consolidated statement of changes in equity for the years ended
December 31, 2019
,
2018
and
2017
|
Number of shares (000’s)
|
Number of shares held by the Group (000’s)
|
Share capital(i)
|
Share premium
|
Treasury shares
|
Retained profits(ii)
|
Other reserves (iii)
|
Total
|
Non- controlling interests
|
Total equity
|
|||||||||||
|
(US$ millions)
|
||||||||||||||||||||
|
Balance on January 1, 2017
|
101,739
|
|
(1,395
|
)
|
153
|
|
485
|
|
(123
|
)
|
3,215
|
|
(562
|
)
|
3,167
|
|
201
|
|
3,368
|
|
|
Total comprehensive income for the year
|
—
|
|
—
|
|
—
|
|
—
|
|
—
|
|
86
|
|
87
|
|
173
|
|
(15
|
)
|
158
|
|
|
Dividends (iv)
|
—
|
|
—
|
|
—
|
|
—
|
|
—
|
|
(265
|
)
|
—
|
|
(265
|
)
|
—
|
|
(265
|
)
|
|
Purchase of treasury shares
|
—
|
|
(32
|
)
|
—
|
|
—
|
|
(3
|
)
|
—
|
|
—
|
|
(3
|
)
|
—
|
|
(3
|
)
|
|
Share based compensation (v)
|
—
|
|
—
|
|
—
|
|
—
|
|
—
|
|
—
|
|
22
|
|
22
|
|
—
|
|
22
|
|
|
Issuance of shares under share-based payment schemes
|
—
|
|
233
|
|
—
|
|
(1
|
)
|
21
|
|
1
|
|
(18
|
)
|
1
|
|
—
|
|
1
|
|
|
Balance on December 31, 2017
|
101,739
|
|
(1,195
|
)
|
153
|
|
484
|
|
(106
|
)
|
3,035
|
|
(472
|
)
|
3,096
|
|
185
|
|
3,281
|
|
|
Adjustment on adoption of IFRS 15 and IFRS 9 (net of tax) (viii)
|
—
|
|
—
|
|
—
|
|
—
|
|
—
|
|
10
|
|
—
|
|
10
|
|
(4
|
)
|
6
|
|
|
Total comprehensive income for the year
|
—
|
|
—
|
|
—
|
|
—
|
|
—
|
|
(10
|
)
|
(68
|
)
|
(78
|
)
|
(30
|
)
|
(108
|
)
|
|
Dividends (iv)
|
—
|
|
—
|
|
—
|
|
—
|
|
—
|
|
(266
|
)
|
—
|
|
(266
|
)
|
—
|
|
(266
|
)
|
|
Dividends to non controlling interest
|
—
|
|
—
|
|
—
|
|
—
|
|
—
|
|
—
|
|
—
|
|
—
|
|
(13
|
)
|
(13
|
)
|
|
Purchase of treasury shares
|
—
|
|
(70
|
)
|
—
|
|
—
|
|
(6
|
)
|
—
|
|
—
|
|
(6
|
)
|
—
|
|
(6
|
)
|
|
Share based compensation (v)
|
—
|
|
—
|
|
—
|
|
—
|
|
—
|
|
—
|
|
22
|
|
22
|
|
—
|
|
22
|
|
|
Issuance of shares under share-based payment schemes
|
—
|
|
351
|
|
—
|
|
(2
|
)
|
31
|
|
(5
|
)
|
(22
|
)
|
2
|
|
—
|
|
2
|
|
|
Effect of acquisition of Cable Onda (vii)
|
—
|
|
—
|
|
—
|
|
—
|
|
—
|
|
—
|
|
—
|
|
—
|
|
113
|
|
113
|
|
|
Put option reserve(vii)
|
—
|
|
—
|
|
—
|
|
—
|
|
—
|
|
(239
|
)
|
—
|
|
(239
|
)
|
—
|
|
(239
|
)
|
|
Balance on December 31, 2018
|
101,739
|
|
(914
|
)
|
153
|
|
482
|
|
(81
|
)
|
2,525
|
|
(538
|
)
|
2,542
|
|
251
|
|
2,792
|
|
|
Total comprehensive income for the year
|
—
|
|
—
|
|
—
|
|
—
|
|
—
|
|
149
|
|
(19
|
)
|
131
|
|
3
|
|
133
|
|
|
Dividends (iv)
|
—
|
|
—
|
|
—
|
|
—
|
|
—
|
|
(267
|
)
|
—
|
|
(267
|
)
|
—
|
|
(267
|
)
|
|
Dividends to non controlling interest
|
—
|
|
—
|
|
—
|
|
—
|
|
—
|
|
—
|
|
—
|
|
—
|
|
(1
|
)
|
(1
|
)
|
|
Purchase of treasury shares
|
—
|
|
(132
|
)
|
—
|
|
—
|
|
(12
|
)
|
4
|
|
—
|
|
(8
|
)
|
—
|
|
(8
|
)
|
|
Share based compensation (v)
|
—
|
|
—
|
|
—
|
|
—
|
|
—
|
|
—
|
|
29
|
|
29
|
|
1
|
|
30
|
|
|
Issuance of shares under share-based payment schemes
|
—
|
|
465
|
|
—
|
|
(2
|
)
|
41
|
|
(12
|
)
|
(25
|
)
|
1
|
|
—
|
|
1
|
|
|
Effect of restructuring in Tanzania(vi)
|
—
|
|
—
|
|
—
|
|
—
|
|
—
|
|
(27
|
)
|
9
|
|
(18
|
)
|
18
|
|
—
|
|
|
Balance on December 31, 2019
|
101,739
|
|
(581
|
)
|
153
|
|
480
|
|
(51
|
)
|
2,372
|
|
(544
|
)
|
2,409
|
|
271
|
|
2,680
|
|
|
(i)
|
Share capital and share premium – see note
C.1.
|
|
(ii)
|
Retained profits – includes profit for the year attributable to equity holders, of which
$306 million
(
2018
:
$324 million
;
2017
:
$345 million
) are not distributable to equity holders.
|
|
(iii)
|
Other reserves – see note
C.1.
|
|
(iv)
|
Dividends – see note
C.2.
|
|
(v)
|
Share-based compensation – see note
C.1.
|
|
(vi)
|
Effect of the restructuring in Tanzania
A.1.2.
|
|
(vii)
|
Effect of the acquisition of Cable Onda S.A. See notes
A.1.2.
and
C.7.4.
for further details.
The consolidated statement of changes in equity at
December 31, 2018
has been restated after finalization of the Cable Onda purchase accounting (note
A.1.2.
).
|
|
(viii)
|
“IFRS 15, “Revenue from contracts with customers” and IFRS 9, “Financial Instruments” were adopted effective January 1, 2018 using the modified retrospective method. The impact of adoption was recorded as an adjustment to retained profits.
|
The accompanying notes are an integral part of these consolidated financial statements.
F- 13
|
Notes to the Consolidated Financial Statements
For the years ended December 31, 2019, 2018 and 2017
|
|
Introduction
Corporate Information
Millicom International Cellular S.A. (the “Company” or “MIC S.A.”), a Luxembourg Société Anonyme, and its subsidiaries, joint ventures and associates (the “Group” or “Millicom”) is an international telecommunications and media group providing digital lifestyle services in emerging markets, through mobile and fixed telephony, cable, broadband, Pay-TV in Latin America (Latam) and Africa.
The Company’s shares are traded as Swedish Depositary Receipts on the Stockholm stock exchange under the symbol TIGO SDB (formerly MIC SDB) and, since January 9, 2019, on the Nasdaq Stock Market in the U.S. under the ticker symbol TIGO. The Company has its registered office at 2, Rue du Fort Bourbon, L-1249 Luxembourg, Grand Duchy of Luxembourg and is registered with the Luxembourg Register of Commerce under the number RCS B 40 630.
On November 14, 2019, Millicom's historical principal shareholder, Kinnevik AB, distributed its entire (approximately
37%
of Millicom's outstanding shares) shareholding in Millicom to its own shareholders through a share redemption plan. Since that date, Kinnevik is no longer a related party or shareholder in Millicom.
On
February 24, 2020
, the Board of Directors authorized these consolidated financial statements for issuance.
Business activities
Millicom operates its mobile businesses in Latin America (Bolivia, Colombia, El Salvador, Guatemala, Honduras, Nicaragua, Panama and Paraguay), and in Africa (Ghana and Tanzania).
Millicom operates various cable and fixed line businesses in Latin America (Bolivia, Colombia, Costa Rica, El Salvador, Guatemala, Honduras, Nicaragua, Panama and Paraguay). Millicom also provides direct to home satellite service in most of its Latam countries.
On December 31, 2015, Millicom deconsolidated its operations in Guatemala and Honduras which are, since that date and for accounting purposes, under joint control.
Millicom holds investments in online/e-commerce businesses in several countries in Africa (Jumia), in a tower infrastructure company in Africa (Helios Towers), as well as other small minority investments in other businesses such as micro-insurance (Milvik).
IFRS Consolidated Financial Statements
Basis of preparation
These financial statements have been prepared in accordance with International Financial Reporting Standards as issued by the IASB (IFRS). They are also compliant with International Financial Reporting Standards as adopted by the European Union. This is in accordance with Regulation (EC) No 1606/2002 of the European Parliament and of the Council of July 19, 2002, on the application of international accounting standards for listed companies domiciled in the European Union.
The financial statements have been prepared on an historical cost basis, except for certain items including derivative financial instruments (measured at fair value), financial instruments that contain obligations to purchase own equity instruments (measured at the present value of the redemption price), and, up to December 31, 2018 prior to the adoption of IFRS 16 'Leases', property, plant and equipment under finance leases (initially measured at the lower of fair value and present value of the future minimum lease payments).
This section contains the Group’s significant accounting policies that relate to the financial statements as a whole. Significant accounting policies specific to one note are included within that note. Accounting policies relating to non-material items are not included in these financial statements.
Consolidation
The consolidated financial statements of the Group comprise the financial statements of the Company and its subsidiaries as of December 31 of each year. The financial statements of the subsidiaries are prepared for the same reporting year as the Company, using consistent accounting policies.
All intra-group balances, transactions, income and expenses, and profits and losses resulting from intra-group transactions are eliminated.
Foreign currency
Financial information in these financial statements are shown in the US dollar presentation currency of the Group and rounded to the nearest million (US$ million) except where otherwise indicated. The financial statements of each of the Group’s entities are
F- 14
|
Notes to the Consolidated Financial Statements
For the years ended December 31, 2019, 2018 and 2017 (continued)
|
|
measured using the currency of the primary economic environment in which each entity operates (the functional currency). The functional currency of each subsidiary, joint venture and associate reflects the economic substance of the underlying events and circumstances of these entities. Except for El Salvador where the functional currency is US dollar, the functional currency in other countries is the local currency.
The results and financial position of all Group entities (none of which operate in an economy with a hyperinflationary environment) with functional currency other than the US dollar presentation currency are translated into the presentation currency as follows:
|
(i)
|
Assets and liabilities are translated at the closing rate on the date of the statement of financial position;
|
|
(ii)
|
Income and expenses are translated at average exchange rates (unless this average is not a reasonable approximation of the cumulative effect of the rates prevailing on the transaction dates, in which case income and expenses are translated at the dates of the transactions); and
|
|
(iii)
|
All resulting exchange differences are recognized as a separate component of equity (currency translation reserve), in the caption “Other reserves”.
|
On consolidation, exchange differences arising from the translation of net investments in foreign operations, and of borrowings and other currency instruments designated as hedges of such investments, are recorded in equity. When the Group disposes of or loses control or significant influence over a foreign operation, exchange differences that were recorded in equity are recognized in the consolidated statement of income as part of gain or loss on sale or loss of control and/or significant influence.
Goodwill and fair value adjustments arising on acquisition of a foreign operation are treated as assets and liabilities of the foreign operation and translated at the closing rate.
The following table presents functional currency translation rates for the Group’s locations to the US dollar on
December 31, 2019
,
2018
and
2017
and the average rates for the years ended
December 31, 2019
,
2018
and
2017
.
|
Exchange Rates to the US Dollar
|
Functional Currency
|
2019 Year-end Rate
|
2018 Year-end Rate
|
Change %
|
2019 Average Rate
|
2018 Average Rate
|
Change %
|
2017 Average Rate
|
|||||||
|
Bolivia
|
Boliviano (BOB)
|
6.91
|
|
6.91
|
|
—
|
%
|
6.91
|
|
6.91
|
|
—
|
%
|
6.91
|
|
|
Chad
|
CFA Franc (XAF)
|
n/a
|
|
580
|
|
n/a
|
|
n/a
|
|
571
|
|
n/a
|
|
588
|
|
|
Colombia
|
Peso (COP)
|
3,277
|
|
3,250
|
|
0.8
|
%
|
3,296
|
|
2,973
|
|
10.9
|
%
|
2,961
|
|
|
Costa Rica
|
Costa Rican Colon (CRC)
|
576
|
|
608
|
|
(5.2
|
)%
|
588
|
|
578
|
|
1.8
|
%
|
571
|
|
|
El Salvador
|
US dollar
|
n/a
|
|
n/a
|
|
n/a
|
|
n/a
|
|
n/a
|
|
n/a
|
|
n/a
|
|
|
Ghana
|
Cedi (GHS)
|
5.73
|
|
4.82
|
|
18.9
|
%
|
5.33
|
|
4.63
|
|
15.0
|
%
|
4.36
|
|
|
Guatemala
|
Quetzal (GTQ)
|
7.70
|
|
7.74
|
|
(0.5
|
)%
|
7.71
|
|
7.52
|
|
2.5
|
%
|
7.36
|
|
|
Honduras
|
Lempira (HNL)
|
24.72
|
|
24.42
|
|
1.2
|
%
|
24.59
|
|
23.99
|
|
2.5
|
%
|
23.58
|
|
|
Luxembourg
|
Euro (EUR)
|
0.89
|
|
0.87
|
|
2.5
|
%
|
0.89
|
|
0.85
|
|
5.1
|
%
|
0.89
|
|
|
Nicaragua
|
Cordoba (NIO)
|
33.84
|
|
32.33
|
|
4.7
|
%
|
33.12
|
|
31.55
|
|
5.0
|
%
|
30.05
|
|
|
Panama
|
Balboa (B/.) (i)
|
n/a
|
|
n/a
|
|
n/a
|
|
n/a
|
|
n/a
|
|
n/a
|
|
n/a
|
|
|
Paraguay
|
Guarani (PYG)
|
6,453
|
|
5,961
|
|
8.3
|
%
|
6,232
|
|
5,743
|
|
8.5
|
%
|
5,626
|
|
|
Sweden
|
Krona (SEK)
|
9.365
|
|
8.85
|
|
5.8
|
%
|
9.43
|
|
8.71
|
|
8.3
|
%
|
8.53
|
|
|
Tanzania
|
Shilling (TZS)
|
2,299
|
|
2,299
|
|
—
|
%
|
2,304
|
|
2,274
|
|
1.3
|
%
|
2,233
|
|
|
United Kingdom
|
Pound (GBP)
|
0.75
|
|
0.78
|
|
(3.3
|
)%
|
0.78
|
|
0.75
|
|
4.3
|
%
|
0.77
|
|
(i) the balboa is tied to the United States dollar at an exchange rate of 1:1.
F- 15
|
Notes to the Consolidated Financial Statements
For the years ended December 31, 2019, 2018 and 2017 (continued)
|
|
New and amended IFRS accounting standards
The following changes to standards effective for annual periods starting on January 1, 2018 have been adopted by the Group:
IFRS 15 “Contracts with customers” establishes a five-step model related to revenue recognition from contracts with customers. Under IFRS 15, revenue is recognized at amounts that reflect the consideration that an entity expects to be entitled to in exchange for transferring goods or services to a customer. The Group adopted the accounting standard on January 1, 2018 using the modified retrospective method which had an immaterial impact on its Group financial statements. IFRS 15 mainly affects the timing of recognition of revenue as it introduces more differences between the billing and the recognition of the revenue and, in some cases, the recognition of the revenue as a principal (gross) or as an agent (net). However, it does not affect the cash flows generated by the Group.
As a consequence of adopting this Standard:
1) some revenue is recognized earlier, as a larger portion of the total consideration received in a bundled contract is attributable to the component delivered at contract inception (i.e. typically a subsidized handset). Therefore, this produces a shift from service revenue (which decreases) to the benefit of Telephone and Equipment revenue. This results in the recognition of a Contract Asset on the statement of financial position, as more revenue is recognized upfront, while the cash will be received throughout the subscription period (which is usually between 12 to 36 months). Contract Assets (and liabilities) are reported on a separate line in current assets / liabilities even if their realization period is longer than 12 months. This is because they are realized / settled as part of the normal operating cycle of our core business.
2) the cost incurred to obtain a contract (mainly commissions) is now capitalized in the statement of financial position and amortized over the average contract term. This results in the recognition of Contract Costs being capitalized under non-current assets on the statement of financial position.
3) the Group recognizes revenue from its wholesale carrier business on a net basis as an agent rather than as a principal under the modified retrospective IFRS 15 transition. Except for this effect, there were no other material changes for the purpose of determining whether the Group acts as principal or an agent in the sale of products.
4) the presentation of certain material amounts in the consolidated statement of financial position has been changed to reflect the terminology of IFRS 15:
a. Contract assets recognized in relation to service contracts.
b. Contract costs in relation to capitalized cost incurred to obtain a contract (mainly commissions).
c. Contract liabilities in relation to service contracts were previously included in trade and other payables.
The Group has adopted the standard using the modified retrospective method. Hence, the cumulative effect of initially applying the Standard has been recognized as an adjustment to the opening balance of retained earnings as at January 1, 2018 and comparative financial statements have not been restated in accordance with the transitional provisions in IFRS 15. The impact on the opening balance of retained profits as at January 1, 2018 is summarized in the table set out at the end of this section.
Additionally, the Group has decided to take some of the practical expedients foreseen in the Standard, such as:
|
•
|
No adjustment to the transaction price for the means of a financing component whenever the period between the transfer of a promised good or service to a customer and the associated payment is one year or less; when the period is more than one year the financing component is adjusted, if material.
|
|
•
|
Disclosure in the Group Financial Statements the transaction price allocated to unsatisfied performance obligations only for contracts that have an original expected duration of more than one year (e.g. unsatisfied performance obligations for contracts that have an original duration of one year or less are not disclosed).
|
|
•
|
Application of the practical expedient not to disclose the price allocated to unsatisfied performance obligations, if the consideration from a customer corresponds to the value of the entity’s performance obligation to the customer (i.e, if billing corresponds to accounting revenue).
|
|
•
|
Application of the practical expedient to recognize the incremental costs of obtaining a contract as an expense when incurred if the amortization period of the asset that otherwise would have been recognized is one year or less.
|
|
•
|
Revenue recognition accounting principles are further described in Note B.1.1.
|
|
•
|
IFRS 9 “Financial Instruments” addresses the classification, measurement and recognition and impairments of financial assets and financial liabilities as well as hedge accounting. It replaces the parts of IAS 39 that relate to the classification and measurement of financial instruments. IFRS 9 requires financial assets to be classified into two measurement categories: those measured at fair value and those measured at amortized cost. The determination is made at initial recognition. The
|
F- 16
|
Notes to the Consolidated Financial Statements
For the years ended December 31, 2019, 2018 and 2017 (continued)
|
|
classification depends on the Group’s business model for managing its financial instruments and the contractual cash flow characteristics of the instrument. For financial liabilities, the standard retains most of the IAS 39 requirements. The main change is that, in cases where the fair value option is taken for financial liabilities, the part of a fair value change due to an entity’s own credit risk is recorded in other comprehensive income rather than the income statement, unless this creates an accounting mismatch. A final standard on hedging (excluding macro-hedging) was issued in November 2013 which aligns hedge accounting more closely with risk management and allows to continue hedge accounting under IAS 39. IFRS 9 also clarifies the accounting for certain modifications and exchanges of financial liabilities measured at amortized cost.
The application of IFRS 9 did not have an impact for the Group on classification, measurement and recognition of financial assets and financial liabilities compared to IAS 39, but it has an impact on impairment of trade receivables and contracts assets (IFRS 15) as well as on amounts due from joint ventures and related parties - with the application of the expected credit loss model instead of the current incurred loss model. As permitted under IFRS 9, the Group adopted the standard without restating comparatives for classification, measurement and impairment. Hence, the cumulative effect of initially applying the Standard has been recognized as an adjustment to the opening balance of retained profits at January 1, 2018. The impact on the opening balance of retained profits at January 1, 2018 is summarized in the table set out at the end of this section. Additionally, the Group continues applying IAS 39 rules with respect to hedge accounting. Finally, the clarification introduced by IFRS 9 on the accounting for certain modifications and exchanges of financial liabilities measured at amortized cost did not have an impact for the Group.
Financial instruments accounting principles are further described in Note
C.7.
The application of IFRS 15 and IFRS 9 had the following impact on the Group financial statements at January 1, 2018:
|
FINANCIAL POSITION
$ millions |
As at January 1, 2018 before application
|
Effect of adoption of IFRS 15
|
Effect of adoption of IFRS 9
|
As at January 1, 2018 after application
|
Reason for the change
|
||||
|
ASSETS
|
|||||||||
|
Investment in joint ventures (non-current)
|
2,966
|
|
27
|
|
(4
|
)
|
2,989
|
|
(i)
|
|
Contract costs, net (non-current) NEW
|
—
|
|
4
|
|
—
|
|
4
|
|
(ii)
|
|
Deferred tax asset
|
180
|
|
—
|
|
10
|
|
191
|
|
(viii)
|
|
Other non-current assets
|
113
|
|
—
|
|
(1
|
)
|
113
|
|
(iii)
|
|
Trade receivables, net (current)
|
386
|
|
—
|
|
(47
|
)
|
339
|
|
(iv)
|
|
Contract assets, net (current) NEW
|
—
|
|
29
|
|
(1
|
)
|
28
|
|
(v)
|
|
LIABILITIES
|
|
|
|
|
|
||||
|
Contract liabilities (current) NEW
|
—
|
|
51
|
|
—
|
|
51
|
|
(vi)
|
|
Provisions and other current liabilities
|
425
|
|
(46
|
)
|
—
|
|
379
|
|
(vii)
|
|
Deferred tax liability (non-current)
|
56
|
|
7
|
|
(1
|
)
|
62
|
|
(viii)
|
|
EQUITY
|
|
|
|
|
|
||||
|
Retained profits and loss for the year
|
3,035
|
|
48
|
|
(38
|
)
|
3,045
|
|
(ix)
|
|
Non-controlling interests
|
185
|
|
—
|
|
(5
|
)
|
181
|
|
(ix)
|
(i) Impact of application of IFRS 15 and IFRS 9 for our joint ventures in Guatemala, Honduras and Ghana.
(ii) This mainly represents commissions capitalized and amortized over the average contract term.
(iii) Effect of the application of the expected credit losses required by IFRS 9 on amounts due from joint ventures.
(iv) Effect of the application of the simplified approach permitted by IFRS 9, which requires expected lifetime losses to be recognized from initial recognition of the receivables.
(v) Contract assets mainly represents subsidized handsets as more revenue is recognized upfront while the cash will be received throughout the subscription period (which is usually between
12
to
36
months).
(vi) This mainly represents deferred revenue for goods and services not yet delivered to customers that will be recognized when the goods are delivered and the services are provided to customers. The balance also comprises revenue from the billing of subscription fees or ‘one-time’ fees at the inception of a contract that are deferred and will be recognized over the average customer retention period or the contract term.
(vii) Reclassification of deferred revenue to contract liabilities - see previous paragraph.
(viii) Tax effects of the above adjustments.
(ix) Cumulative catch-up effect.
As of January 1, 2018, IFRS 9 and IFRS 15 implementations had no impact on the statement of cash flows or on EPS.
F- 17
|
Notes to the Consolidated Financial Statements
For the years ended December 31, 2019, 2018 and 2017 (continued)
|
|
The following summarizes the amount by which each financial statement line item is affected in the current reporting year by the application of IFRS 15 as compared to previous standard and interpretations:
|
INCOME STATEMENT
$ millions |
2018
|
||||||
|
As reported
|
Without adoption of IFRS 15
|
Effect of Change Higher/(Lower)
|
Reason for the change
|
||||
|
Total revenue
|
3,946
|
|
4,023
|
|
(77
|
)
|
(i)
|
|
Cost of sales
|
(1,117
|
)
|
(1,165
|
)
|
48
|
|
(ii)
|
|
Operating expenses
|
(1,616
|
)
|
(1,656
|
)
|
40
|
|
(ii)
|
|
Share of profit in the joint ventures in Guatemala and Honduras
|
154
|
|
152
|
|
2
|
|
(iii)
|
|
Tax impact
|
(112
|
)
|
(111
|
)
|
(1
|
)
|
(iv)
|
(i) Mainly for adjustments for "principal vs agent" considerations under IFRS 15 for wholesale carrier business, as well as for the shift in the timing of revenue recognition due to the reallocation of revenue from service (over time) to telephone and equipment revenue (point in time).
(ii) Mainly for the reallocation of cost for selling devices due to shift from service revenue to telephone and equipment revenue, for the capitalization and amortization of contract costs and for adjustments for "principal vs agent" under IFRS 15 for wholesale carrier business.
(iii) Impact of IFRS 15 related to our share of profit in our joint ventures in Guatemala and Honduras.
(iv) Tax effects of the above adjustments.
|
FINANCIAL POSITION
$ millions |
2018
|
||||||
|
As reported
|
Without adoption of IFRS 15
|
Effect of Change Higher/(Lower)
|
Reason for the change
|
||||
|
ASSETS
|
|||||||
|
Investment in joint ventures (non-current)
|
2,867
|
|
2,839
|
|
28
|
|
(i)
|
|
Contract costs, net (non-current)
|
4
|
|
—
|
|
4
|
|
(ii)
|
|
Deferred tax assets
|
202
|
|
200
|
|
2
|
|
(vi)
|
|
Contract assets, net (current)
|
37
|
|
—
|
|
37
|
|
(iii)
|
|
LIABILITIES
|
|
|
|
|
|||
|
Contract liabilities (current)
|
87
|
|
—
|
|
87
|
|
(iv)
|
|
Provisions and other current liabilities
|
492
|
|
574
|
|
(82
|
)
|
(v)
|
|
Current income tax liabilities
|
55
|
|
52
|
|
3
|
|
(vi)
|
|
Deferred tax liabilities (non-current)
|
236
|
|
229
|
|
7
|
|
(vi)
|
|
EQUITY
|
|
|
|
|
|||
|
Retained profits and loss for the year
|
2,525
|
|
2,468
|
|
57
|
|
(vii)
|
|
Non-controlling interests
|
251
|
|
248
|
|
3
|
|
(vii)
|
(i) Impact of application of IFRS 15 for our joint ventures in Guatemala, Honduras and Ghana.
(ii) This mainly represents commissions capitalized and amortized over the average contract term.
(iii) Contract assets mainly represents subsidized handsets as more revenue is recognized upfront while the cash will be received throughout the subscription period (which are usually between
12
to
36
months). Throughout the year ended December 31, 2018 no material impairment loss has been recognized.
(iv) This mainly represents deferred revenue for goods and services not yet delivered to customers that will be recognized when the goods are delivered and the services are provided to customers. The balance also comprises the revenue from the billing of subscription fees or ‘one-time’ fees at the inception of a contract that are deferred and will be recognized over the average customer retention period or the contract term.
(v) Reclassification of deferred revenue to contract liabilities - see previous paragraph.
(vi) Tax effects of the above adjustments.
(vii) Cumulative catch-up effect and IFRS 15 effect in the current year.
F- 18
|
Notes to the Consolidated Financial Statements
For the years ended December 31, 2019, 2018 and 2017 (continued)
|
|
The following changes to standards effective for annual periods starting on
January 1, 2019
have been adopted by the Group:
IFRS 16 "Leases"primarily affects the accounting for the Group’s operating leases. The commitments for operating leases are now recognized as right of use assets and lease liabilities for future payments. As a result, on adoption, on January 1, 2019, an additional lease liability of
$545 million
has been recognized (see note C.4.). The application of the new standard
decreased
operating expenses by
$149 million
, respectively, as compared to what our results would have been if we had continued to follow IAS 17 for year ended
December 31, 2019
. The impact of the adoption of the leasing standard and the new accounting policies are further explained below. The application of this standard also affects the Group’s depreciation, operating and financial expenses, debt and other financing, and leverage ratios see note C.3.. The change in presentation of operating lease expenses has resulted in a corresponding increase in cash flows derived from operating activities and a decline in cash flows from financing activities.
Below you will find further details describing the impact of the adoption of IFRS 16 "Leases" on the Group’s financial statements. The amended accounting policies applied from
January 1, 2019
are further disclosed in note E.3..
Explanation and effect of adoption of IFRS 16
The Group adopted the standard using the modified retrospective approach with the cumulative effect of applying the new Standard recognized in retained profits as of
January 1, 2019
. Its application had no significant impact on the Group's retained profits. Comparatives for the 2018 and 2017 financial statements were not restated.
On adoption of IFRS 16, the Group recognized lease liabilities in relation to leases which had previously been classified as ‘operating leases’ under the principles of IAS 17 Leases. These liabilities were measured at the present value of the remaining lease payments, discounted using the lessee’s incremental borrowing rate as of January 1, 2019.
The right-of-use asset was measured at an amount equal to the lease liability, adjusted by the amount of any prepaid or accrued lease payments relating to the leases recognized in the statement of financial position immediately before the date of initial application.
The weighted average incremental borrowing rate applied to the lease liabilities on January 1, 2019 was
12.3%
. Each lease commitment was individually discounted using a specific incremental borrowing rate, following a build-up approach including: risk-free rates, industry risk, country risk, credit risk at cash generating unit level, currency risk and commitment’s maturity.
For leases previously classified as finance leases Millicom recognized the carrying amount of the lease asset and lease liability immediately before transition as the carrying amount of the right of use asset and the lease liability at the date of initial application. The measurement principles of IFRS 16 are only applied after that date.
|
$ millions
|
2019
|
|
Operating lease commitments disclosed as at December 31, 2018
|
801
|
|
(Plus): Non lease components obligations
|
57
|
|
(Less): Short term leases recognized on a straight line basis as an expense
|
(3)
|
|
(Less): Low value leases recognized on a straight line basis as an expense
|
(2)
|
|
(Less): Contract included in the lease commitments but with starting date in 2019 and not part of the IFRS 16 opening balances
|
(17)
|
|
(Plus/Less): Other
|
(9)
|
|
Gross lease liabilities
|
828
|
|
Discounted using the lessee's incremental borrowing rate at the date of the initial application
|
(283)
|
|
Incremental lease liabilities recognized at January 1, 2019
|
545
|
|
(Plus): Finance lease liabilities recognized at December 31, 2018
|
353
|
|
Lease liabilities recognized at January 1, 2019
|
898
|
|
Of which are:
|
|
|
Current lease liabilities
|
86
|
|
Non-current lease liabilities
|
812
|
F- 19
|
Notes to the Consolidated Financial Statements
For the years ended December 31, 2019, 2018 and 2017 (continued)
|
|
The application of IFRS 16 affected the following items in the statement of financial position on January 1, 2019:
|
FINANCIAL POSITION
$ millions |
As at January 1, 2019 before application
|
Effect of adoption of IFRS 16
|
As at January 1, 2019 after application
|
Reason for the change
|
|
ASSETS
|
|
|
|
|
|
Property, plant and equipment, net
|
3,071
|
(307)
|
2,764
|
(i)
|
|
Right-of-use asset (non-current) NEW
|
—
|
856
|
856
|
(ii)
|
|
Prepayments
|
129
|
(6)
|
123
|
(iii)
|
|
LIABILITIES
|
|
|
|
|
|
Lease liabilities (non-current) NEW
|
—
|
812
|
812
|
(iv)
|
|
Debt and other financing (non-current)
|
4,123
|
(337)
|
3,786
|
(v)
|
|
Lease liabilities (current) NEW
|
—
|
86
|
86
|
(iv)
|
|
Debt and other financing (current)
|
458
|
(16)
|
442
|
(v)
|
|
Other current liabilities
|
492
|
(2)
|
490
|
(vi)
|
(i) Transfer of previously capitalized assets under finance leases to Right-of-Use assets.
|
(ii)
|
Initial recognition of Right-of-Use assets, transfer of previously recognized finance leases and of lease prepayments to the Right-of-Use asset cost at transition.
|
(iii) Transfer of lease prepayments to the Right-of-Use asset cost at transition.
(iv) Initial recognition of lease liabilities and transfer of previously recognized finance lease liabilities.
(v) Transfer of previously recognized finance lease liabilities to new Lease liabilities accounts.
(vi) Reclassification of provisions for onerous contracts to Right-of-Use assets.
The application of IFRS 16 has also impacted classifications within the statement of income, statement of cash flows, segment information and EPS for the period starting from January 1, 2019.
In applying IFRS 16 for the first time, the Group has used the following practical expedients permitted by the standard:
|
◦
|
the use of a single discount rate to a portfolio of leases with reasonably similar characteristics
|
|
◦
|
reliance on previous assessments on whether leases are onerous
|
|
◦
|
the accounting for operating leases with a remaining lease term of less than 12 months as at January 1, 2019 as short-term leases
|
|
◦
|
the exclusion of initial direct costs for the measurement of the right-of-use asset at the date of initial application, and
|
|
◦
|
the use of hindsight in determining the lease term where the contract contains options to extend or terminate the lease.
|
The Group has also elected not to reassess whether a contract is, or contains a lease at the date of initial application. Instead, for contracts entered into before the transition date the Group relied on its assessment made when applying IAS 17 and IFRIC 4 Determining whether an Arrangement contains a Lease.
The following new or amended standards became applicable for the current reporting period and did not have any significant impact on the Group’s accounting policies or disclosures and did not require retrospective adjustments.
|
◦
|
Amendments to IFRS 9 "Financial instruments" on prepayment features with negative compensation.
|
|
◦
|
IFRIC 23 "Uncertainty over Income Tax Treatments" clarifies how the recognition and measurement requirements of IAS 12 Income taxes, are applied where there is uncertainty over income tax treatments.
|
|
◦
|
Amendments to IAS 19 "Employee benefits" on plan amendment, curtailment or settlement.
|
|
◦
|
Amendments to IAS 28 "Investments in associates" on long term interests in associates and joint ventures.
|
|
◦
|
Annual improvements 2015-2017.
|
F- 20
|
Notes to the Consolidated Financial Statements
For the years ended December 31, 2019, 2018 and 2017 (continued)
|
|
The following changes to standards, which are not expected to materially affect the Group, will be effective from
January 1, 2020
:
|
Amendments to the conceptual framework
|
The IASB has revised its conceptual framework. The Framework is not an IFRS standard and does not override any standard, so nothing will change in the short term.The revised Framework will be used in future standard-setting decisions, but no changes will be made to current IFRS. Preparers might also use the Framework to assist them in developing accounting policies where an issue is not addressed by an IFRS.
The Group does not expect these amendments to have a material impact on the consolidated financial statements as such.
|
January 1, 2020
|
|
Amendments to IAS 1, ‘Presentation of financial statements’, and IAS 8, ‘Accounting policies, changes in accounting estimates and errors’
|
These amendments to IAS 1, ‘Presentation of financial statements’, and IAS 8, ‘Accounting policies, changes in accounting estimates and errors’, and consequential amendments to other IFRSs: i) use a consistent definition of materiality throughout IFRSs and the Conceptual Framework for Financial Reporting; ii) clarify the explanation of the definition of material; and iii) incorporate some of the guidance in IAS 1 about immaterial information.
The Group does not expect this amendment to have a material impact on the consolidated financial statements.
|
January 1, 2020
|
|
Amendments to IFRS 3 - 'Business Combinations' - definition of a business
|
This amendment revises the definition of a business. According to feedback received by the IASB, application of the current guidance is commonly thought to be too complex, and it results in too many transactions qualifying as business combinations.
The Group does not expect this amendment to have a material impact on the consolidated financial statements. These amendments have not yet been endorsed by the EU.
|
January 1, 2020
|
|
Amendments to IFRS 9, IAS 39 and IFRS 7 - Interest Rate Benchmark Reform.
|
The IASB has embarked on a two-phase project to consider what, if any, reliefs to give from the effects of IBOR reform. For Phase 1, the IASB has issued amendments to IFRS 9, IAS 39 and IFRS 7 that provide temporary relief from applying specific hedge accounting requirements to hedging relationships directly affected by IBOR reform. The reliefs relate to hedge accounting and have the effect that IBOR reform should not generally cause hedge accounting to terminate. However, any hedge ineffectiveness should continue to be recorded in the income statement. Given the pervasive nature of hedges involving IBOR based contracts, the reliefs will affect companies in all industries.
The Group is currently assessing the impact of these amendments on the consolidated financial statements but do not expect it will have a material effect.
|
January 1, 2020
|
|
IFRS 17, ‘Insurance contracts’
|
This standard replaces IFRS 4, which currently permits a wide variety of practices in accounting for insurance contracts. IFRS 17 will fundamentally change the accounting by all entities that issue insurance contracts and investment contracts with discretionary participation features.
IFRS 17 will not have an impact on the consolidated financial statements. IFRS 17 has not been yet endorsed by the EU.
|
January 1, 2021
|
Judgments and critical estimates
The preparation of IFRS financial statements requires management to use judgment in applying accounting policies. It also requires the use of certain critical accounting estimates and assumptions that affect the reported amounts of assets and liabilities, and disclosure of contingent assets and liabilities at the date of the financial statements, and the reported amounts of revenue and expenses during the reporting period. These estimates are based on management's best knowledge of current events, actions and best estimates as of a specified date, and actual results may ultimately differ from these estimates. Areas involving a higher degree of judgment or complexity, or areas where assumptions and estimates are significant to the financial statements are disclosed in each note and are summarized below:
F- 21
|
Notes to the Consolidated Financial Statements
For the years ended December 31, 2019, 2018 and 2017 (continued)
|
|
Judgments
Management apply judgment in accounting treatment and accounting policies in preparation of these financial statements. In particular, a significant level of judgment is applied regarding the following items:
|
•
|
Acquisitions
– measurement at fair value of existing and newly identified assets, including the measurement of property, plant and equipment and intangible assets (e.g. particularly the customer lists being sensitive to significant assumptions as disclosed in note
A.1.2.
), liabilities, contingent liabilities and remaining goodwill; the assessment of useful lives; as well as the accounting treatment for transaction costs (see notes
A.1.2.
,
E.1.1.
,
E.1.5.
,
E.2.1.
);
|
|
•
|
Impairment testing
– key assumptions related to future business performance, perpetual growth rates and discount rates (see notes
E.1.2.
,
E.1.6.
,
E.2.2.
);
|
|
•
|
Revenue recognition
– whether or not the Group acts as principal or as an agent, when there is one or several performance obligations and the determination of stand alone selling prices (see note
B.1.1.
);
|
|
•
|
Contingent liabilities
– whether or not a provision should be recorded for any potential liabilities (see note
G.3.
);
|
|
•
|
Leases
– In determining the lease term, including the assessment of whether the exercise of extension or termination options is reasonably certain and the corresponding impact on the selected lease term (see note
E.3.
);
|
|
•
|
Control
– whether Millicom, through voting rights and potential voting rights attached to shares held, or by way of shareholders’ agreements or other factors, has the ability to direct the relevant activities of the subsidiaries it consolidates, or jointly direct the relevant activities of its joint ventures (see notes
A.1.
,
A.2.
);
|
|
•
|
Discontinued operations and assets held for sale
– definition, classification and presentation (see notes
A.4.
,
E.4.1.
) as well as measurement of potential provisions related to indemnities;
|
|
•
|
Deferred tax assets
– recognition based on likely timing and level of future taxable profits together with future tax planning strategies (see notes
B.6.3.
and
G.3.2.
);
|
|
•
|
Defined benefit obligations
– key assumptions related to life expectancies, salary increases and leaving rates, mainly related to UNE Colombia (see note
B.4.3.
).
|
Estimates
Estimates are based on historical experience and other factors, including reasonable expectations of future events. These factors are reviewed in preparation of the financial statements although, due to inherent uncertainties in the evaluation process, actual results may differ from original estimates. Estimates are subject to change as new information becomes available and may significantly affect future operating results. Significant estimates have been applied in respect of the following items:
|
•
|
Accounting for property, plant and equipment, and intangible assets in determining fair values at acquisition dates, particularly for assets acquired in business combinations and sale and leaseback transactions (see notes
A.1.
and
E.2.1.
);
|
|
•
|
Useful lives of property, plant and equipment and intangible assets (see notes
E.1.1.
,
E.2.1.
);
|
|
•
|
Provisions, in particular provisions for asset retirement obligations, legal and tax risks (see note
F.4.
);
|
|
•
|
Revenue recognition (see note
B.1.1.
);
|
|
•
|
Impairment testing including weighted average cost of capital (WACC), EBITDA margins, Capex intensity and long term growth rates (see note
E.1.6.
);
|
|
•
|
For leases, estimates in determining the incremental borrowing rate for discounting the lease payments in case interest rate implicit in the lease cannot be determined (see note
E.3.
);
|
|
•
|
Estimates for defined benefit obligations (see note
B.4.3.
);
|
|
•
|
Accounting for share-based compensation in particular estimates of forfeitures and future performance criteria (see notes
B.4.1.
,
B.4.2.
).
|
F- 22
|
Notes to the Consolidated Financial Statements
For the years ended December 31, 2019, 2018 and 2017 (continued)
|
|
A. The Millicom Group
The Group comprises a number of holding companies, operating subsidiaries and joint ventures with various combinations of mobile, fixed-line telephony, cable and wireless Pay TV, Internet and Mobile Financial Services (MFS) businesses. The Group also holds other small minority investments in other businesses such as micro-insurance (Milvik).
A.1. Subsidiaries
Subsidiaries are all entities which Millicom controls. Millicom controls an entity when it is exposed to, or has rights to variable returns from its investment in the entity, and has the ability to affect those returns through its power over the subsidiary. Millicom has power over an entity when it has existing rights that give it the current ability to direct the relevant activities, i.e. the activities that significantly affect the entity’s returns. Generally, control accompanies a shareholding of more than half of the voting rights although certain other factors (including contractual arrangements with other shareholders, voting and potential voting rights) are considered when assessing whether Millicom controls an entity. For example, although Millicom holds less than
50 %
of the shares in its Colombian businesses, it holds more than
50 %
of shares with voting rights. The contrary may also be true (e.g. Guatemala and Honduras). In respect of the joint ventures in Guatemala and Honduras, shareholders’ agreements require unanimous consents for decisions over the relevant activities of these entities (see also note
A.2.2.
). Therefore, the Group has joint control over these entities and accounts for them under the equity method.
Our main subsidiaries are as follows:
|
Entity
|
Country
|
Activity
|
December 31, 2019
|
December 31, 2018
|
December 31, 2017
|
|
Latin America
|
In %
|
In %
|
In %
|
||
|
Telemovil El Salvador S.A. de C.V.
|
El Salvador
|
Mobile, MFS, Cable, DTH
|
100
|
100
|
100
|
|
Millicom Cable Costa Rica S.A.
|
Costa Rica
|
Cable, DTH
|
100
|
100
|
100
|
|
Telefonica Celular de Bolivia S.A.
|
Bolivia
|
Mobile, DTH, MFS, Cable
|
100
|
100
|
100
|
|
Telefonica Celular del Paraguay S.A.
|
Paraguay
|
Mobile, MFS, Cable, PayTV
|
100
|
100
|
100
|
|
Cable Onda S.A (i).
|
Panama
|
Cable, PayTV, Internet, DTH, Fixed-line
|
80
|
80
|
—
|
|
Telefonica Moviles Panama (ii)
|
Panama
|
Mobile
|
80
|
—
|
—
|
|
Telefonia Cellular de Nicaragua sa (ii)
|
Nicaragua
|
Mobile
|
100
|
—
|
—
|
|
Colombia Móvil S.A. E.S.P. (iii)
|
Colombia
|
Mobile
|
50-1 share
|
50-1 share
|
50-1 share
|
|
UNE EPM Telecomunicaciones S.A.(iii)
|
Colombia
|
Fixed-line, Internet, PayTV, Mobile
|
50-1 share
|
50-1 share
|
50-1 share
|
|
Edatel S.A. E.S.P. (iii)
|
Colombia
|
Fixed-line, Internet, PayTV, Cable
|
50-1 share
|
50-1 share
|
50-1 share
|
|
Africa
|
|||||
|
Sentel GSM S.A.(v)
|
Senegal
|
Mobile, MFS
|
—
|
—
|
100
|
|
MIC Tanzania Public Limited Company (vi)
|
Tanzania
|
Mobile, MFS
|
98.5
|
100
|
100
|
|
Millicom Tchad S.A. (v)
|
Chad
|
Mobile, MFS
|
—
|
100
|
100
|
|
Millicom Rwanda Limited (v)
|
Rwanda
|
Mobile, MFS
|
—
|
—
|
100
|
|
Zanzibar Telecom Limited (vi)
|
Tanzania
|
Mobile, MFS
|
98.5
|
85
|
85
|
|
Unallocated
|
|||||
|
Millicom International Operations S.A.
|
Luxembourg
|
Holding Company
|
100
|
100
|
100
|
|
Millicom International Operations B.V.
|
Netherlands
|
Holding Company
|
100
|
100
|
100
|
|
Millicom LIH S.A.
|
Luxembourg
|
Holding Company
|
100
|
100
|
100
|
|
MIC Latin America B.V.
|
Netherlands
|
Holding Company
|
100
|
100
|
100
|
|
Millicom Africa B.V.
|
Netherlands
|
Holding Company
|
100
|
100
|
100
|
|
Millicom Holding B.V.
|
Netherlands
|
Holding Company
|
100
|
100
|
100
|
|
Millicom International Services LLC
|
USA
|
Services Company
|
100
|
100
|
100
|
|
Millicom Services UK Ltd (vii)
|
UK
|
Services Company
|
100
|
100
|
100
|
|
Millicom Spain S.L.
|
Spain
|
Holding Company
|
100
|
100
|
100
|
F- 23
|
Notes to the Consolidated Financial Statements
For the years ended December 31, 2019, 2018 and 2017 (continued)
|
|
|
(i)
|
Acquisition completed on December 13, 2018. Cable Onda S.A. is fully consolidated as Millicom has the majority of voting shares to direct the relevant activities. See note A.1.2..
|
|
(ii)
|
Companies acquired during the year. See note A.1.2.
|
|
(iii)
|
Fully consolidated as Millicom has the majority of voting shares to direct the relevant activities.
|
(iv) Merged with Airtel Ghana in October 2017 and classified as discontinued operations for the year then ended (see note
E.4.2.
). Merged entity is accounted for as a joint venture as from merger date (see note
A.2.2.
).
|
(v)
|
Companies disposed of in 2018 or 2019. See note
A.1.3.
|
|
(vi)
|
Change in ownership percentages as a result of the in-country restructuring . See note
A.1.2.
|
(vii) Millicom Services UK Ltd with registered number 08330497 will take advantage of an audit exemption to prepare stand alone financial statements for the year ended December 31, 2019 as set out within section 479A of the Companies Act 2006.
A.1.1. Accounting for subsidiaries and non-controlling interests
Subsidiaries are fully consolidated from the date on which control is transferred to Millicom. If facts and circumstances indicate that there are changes to one or more of the elements of control, a reassessment is performed to determine if control still exists. Subsidiaries are de-consolidated from the date that control ceases. Transactions with non-controlling interests are accounted for as transactions with equity owners of the Group. Gains or losses on disposals of non-controlling interests are recorded in equity. For purchases from non-controlling interests, the difference between any consideration paid and the relevant share acquired of the carrying value of net assets of the subsidiary is also recorded in equity.
A.1.2. Acquisition of subsidiaries and changes in non-controlling interests in subsidiaries
Scope changes 2019
1. Telefonica CAM Acquisitions
On February 20, 2019, MIC S.A., Telefonica Centroamerica and Telefonica S.A. entered into 3 separate share purchase agreements (the “Telefonica CAM Acquisitions”) pursuant to which, subject to the terms and conditions contained therein, Millicom agreed to purchase
100%
of the shares of Telefonica Moviles Panama, S.A., a company incorporated under the laws of Panama, from Telefonica Centroamerica (the “Panama Acquisition”),
100%
of the shares of Telefonica de Costa Rica TC, S.A., a company incorporated under the laws of Costa Rica, from Telefonica (the “Costa Rica Acquisition”) and
100%
of the shares of Telefonia Celular de Nicaragua, S.A., a company incorporated under the laws of Nicaragua, from Telefonica Centroamerica (the “Nicaragua Acquisition”). The Telefonica CAM Acquisitions Share Purchase Agreements contain customary representations and warranties and termination provisions. The consummation of the Costa Rica Acquisition is still subject to regulatory approvals and is expected to close in H1 2020.
Acquisition related costs for Nicaragua and Panama acquisitions included in the statement of income under operating expenses were approximately
$16 million
for the year.
The aggregate purchase price for the Telefonica CAM Acquisitions is
$1.65 billion
, subject to potential purchase price adjustments.
a) Nicaragua Acquisition
This transaction closed on May 16, 2019 after receipt of the necessary approvals and, since that date, Millicom holds all voting rights into Telefonia Celular de Nicaragua ("Nicaragua") and controls it. On the same day, Millicom paid an original cash consideration of
$437 million
, provisionally adjusted to
$430 million
as of
December 31, 2019
and still subject to final price adjustment expected in Q1 2020. The purchase consideration also includes potential indemnifications from the sellers (
including
potential tax contingencies and litigations). For the purchase accounting, Millicom determined the provisional fair values of Nicaragua's identifiable assets and liabilities based on transaction and relative fair values. The purchase accounting is still provisional at
December 31, 2019
, particularly in respect of the final price adjustment and the evaluation of the right-of-use assets and lease liabilities. Management expects to finalize the purchase accounting in Q1 2020.
F- 24
|
Notes to the Consolidated Financial Statements
For the years ended December 31, 2019, 2018 and 2017 (continued)
|
|
The provisional purchase accounting as at
December 31, 2019
is as follows
|
Provisional Fair values (100%)
|
||
|
(US$ millions)
|
||
|
Intangible assets (excluding goodwill) (i)
|
131
|
|
|
Property, plant and equipment (ii)
|
149
|
|
|
Right of use assets (iii)
|
131
|
|
|
Other non-current assets
|
2
|
|
|
Current assets (excluding cash) (iv)
|
23
|
|
|
Trade receivables (v)
|
17
|
|
|
Cash and cash equivalents
|
7
|
|
|
Total assets acquired
|
459
|
|
|
Lease liabilities (iii)
|
131
|
|
|
Other liabilities (vi)
|
118
|
|
|
Total liabilities assumed
|
249
|
|
|
Fair value of assets acquired and liabilities assumed, net
|
210
|
|
|
Acquisition price
|
430
|
|
|
Provisional Goodwill
|
220
|
|
|
(i)
|
Intangible assets not previously recognized at the date of acquisition, are mainly customer lists for an amount of
$81 million
, with estimated useful lives ranging from
4
to
10
years. In addition, a fair value step-up of
$39 million
on the spectrum held by Nicaragua has been recognized, with a remaining useful life of
14
years.
|
|
(ii)
|
A fair value step-up of
$39 million
has been recognized on property, plant and equipment, mainly on the core network (
$25 million
) and owned land and buildings (
$8 million
). The expected remaining useful lives were estimated at
6
-
7
years on average.
|
|
(iii)
|
The Group measured the lease liability at the present value of the remaining lease payments (as defined in IFRS 16) as if the acquired lease were a new lease at the acquisition date.
The right-of-use assets have been adjusted by
$7 million
to be measured at the same amount as the lease liabilities.
|
|
(iv)
|
Current assets include indemnification assets for tax contingencies at fair value for an amount of
$11 million
- see (v) below.
|
|
(v)
|
The fair value of trade receivables acquired was
$17 million
.
|
|
(vi)
|
Other liabilities include the fair value of certain possible tax contingent liabilities for
$1 million
and a deferred tax liability of
$50 million
resulting from the above adjustments
|
The goodwill is currently not expected to be tax deductible, and is attributable to expected synergies and convergence with our legacy fixed business in the country, as well as to the fair value of the assembled work force. For convenience purposes, the acquisition date was set on May 1, 2019 as there were no material transactions from this date to May 16, 2019. From May 1, 2019 to
December 31, 2019
, Nicaragua contributed
$144 million
of revenue and a net profit of
$5 million
to the Group. If the acquisition had occurred on January 1, 2019 incremental revenue for the year ended
December 31, 2019
for the Group would have been
$219 million
and incremental net loss for that period would have been
$16 million
, including amortization of assets not previously recognized of
$12 million
(net of tax).
Key assumptions used in fixed assets valuation
The following valuation methods and key estimates were used for the valuation of the main classes of fixed assets:
F- 25
|
Notes to the Consolidated Financial Statements
For the years ended December 31, 2019, 2018 and 2017 (continued)
|
|
|
Major class of assets
|
Valuation method
|
Key assumption 1
|
Key assumption 2
|
Key assumption 3
|
|
Spectrum
|
Market approach - Market comparable transactions
|
Discount rate : 14%
|
Terminal growth rate: 2.5%
|
Estimated duration: 14 years
|
|
Customer lists
|
Income approach - Multi-Period
Excess Earnings Method
|
Discount rate: 14-15%
|
Monthly Churn rate: From 1.2% for B2B to 2.9% for B2C
|
EBITDA margin: ~ 36% to 41%
|
|
Land and buildings
|
Market approach
|
Economic useful life (range): 10-30 years
|
Price per square meter: from $2 to $57
|
N/A
|
|
Core network
|
Cost approach
|
Economic useful life (range): 5-27 years
|
Remaining useful life (minimum) : 1.7 years
|
N/A
|
b) Panama Acquisition
This transaction closed on August 29, 2019 after receipt of the necessary approvals and, since that date, Cable Onda, which is
80%
owned by Millicom, holds all voting rights in Telefonica Moviles Panama, S.A. ("Panama") and controls it. On the same day, Cable Onda paid an original cash consideration of
$594 million
to acquire
100%
of the shares of Panama, subject to a final price adjustment expected in Q1 2020. The purchase consideration also includes potential indemnifications from the sellers (
including
potential tax contingencies and litigations). For the purchase accounting, Millicom determined the fair value of Panama's identifiable assets and liabilities based on transaction and relative fair values. The purchase accounting is still provisional at
December 31, 2019
, particularly in respect of the evaluation of property, plant and equipment, right-of-use assets and lease liabilities, final price adjustment and their resulting impact on the current valuation of intangible assets. Management expects to finalize the purchase accounting during the first half of 2020. No non-controlling interests are recognized at acquisition date as Cable Onda acquired
100%
of the shares of Panama. Though, non-controlling interests are recognized in Panama's results from the date of acquisition.
F- 26
|
Notes to the Consolidated Financial Statements
For the years ended December 31, 2019, 2018 and 2017 (continued)
|
|
The provisional purchase accounting as at
December 31, 2019
is as follows:
|
Provisional Fair values (100%)
|
||
|
(US$ millions)
|
||
|
Intangible assets (excluding goodwill) (i)
|
169
|
|
|
Property, plant and equipment
|
110
|
|
|
Right of use assets
|
57
|
|
|
Other non-current assets
|
3
|
|
|
Current assets (excluding cash)
|
23
|
|
|
Trade receivables (ii)
|
21
|
|
|
Cash and cash equivalents
|
10
|
|
|
Total assets acquired
|
391
|
|
|
Lease liabilities
|
48
|
|
|
Other debt and financing
|
74
|
|
|
Other liabilities (iii)
|
101
|
|
|
Total liabilities assumed
|
224
|
|
|
Fair value of assets acquired and liabilities assumed, net
|
167
|
|
|
Acquisition price
|
594
|
|
|
Provisional Goodwill
|
426
|
|
|
(i)
|
Intangible assets not previously recognized at the date of acquisition, are mainly customer lists for an amount of
$58 million
, with estimated useful lives ranging from
3
to
17
years. In addition, a fair value step-up of
$3 million
on the spectrum held by Panama has been recognized, with a remaining useful life of
17
years.
|
|
(ii)
|
The fair value of trade receivables acquired was
$21 million
.
|
|
(iii)
|
Other liabilities include a deferred tax liability of
$15 million
resulting from the above adjustments
|
The goodwill is currently not expected to be tax deductible and is attributable to expected synergies and convergence with Cable Onda, as well as to the fair value of the assembled work force. For convenience purposes, the acquisition date was set on September 1, 2019. From September 1, 2019 to
December 31, 2019
, Panama contributed
$80 million
of revenue and a net profit of
$6 million
to the Group. If Panama had been acquired on January 1, 2019 incremental revenue for the twelve-month period ended
December 31, 2019
for the Group would have been
$158 million
and incremental net profit for that period would have been
$1 million
, including amortization of assets not previously recognized of
$3 million
(net of tax).
Key assumptions used in fixed assets valuation
The following valuation methods and key estimates were used for the valuation of the main classes of fixed assets:
|
Major class of assets
|
Valuation method
|
Key assumption 1
|
Key assumption 2
|
Key assumption 3
|
|
Spectrum
|
Market approach - Market comparable transactions
|
Discount rate: 9.8%
|
Terminal growth rate: 2.9%
|
Estimated duration: 17 years
|
|
Customer lists
|
Income approach - Multi-Period
Excess Earnings Method
|
Discount rate: 9.8-11%
|
Monthly Churn rate: From 0.4% for B2C postpaid to 3.9% for B2C prepaid
|
EBITDA margin: ~ 35% to 39%
|
2. Tanzania restructuring
In October 2019, with the view of listing the shares of MIC Tanzania Public Limited Company ('MIC Tanzania') on the local stock exchange (see note H), Millicom completed the restructuring of its investments in different operations in the country. Mainly, MIC Tanzania acquired all the shares of Zantel, which was partially held by the Government of Zanzibar (
15%
). In exchange of the contribution of its
15%
shares in Zantel to MIC Tanzania, the Government of Zanzibar received
1.5%
of newly issued shares in MIC Tanzania. This restructuring did not result in the Group losing control in Zantel nor MIC Tanzania, and has therefore been recognized as an equity transaction. As a consequence, the Group owners’ equity decreased by a net amount of
$18 million
as a result of the derecognition of the
15%
non-controlling interests in Zantel and the recognition of
1.5%
non-controlling interests in MIC Tanzania.
F- 27
|
Notes to the Consolidated Financial Statements
For the years ended December 31, 2019, 2018 and 2017 (continued)
|
|
3. Others
During the year ended
December 31, 2019
, the Group also completed minor additional acquisitions.
Scope changes 2018
1. Cable Onda acquisition
On October 7, 2018, the Company signed an agreement to acquire a controlling
80%
stake in Cable Onda, the largest cable and fixed telecommunications services provider in Panama. The selling shareholders retained a
20%
equity stake in the company. The transaction closed on December 13, 2018 after receipt of necessary approvals, for final cash consideration of
$956 million
. Millicom concluded that it controls Cable Onda since closing date and therefore fully consolidates it in its financial statements with a
20%
non-controlling interest. The deal also includes certain liquidity rights such as call and put options that have been amended as a result of the acquisition of Telefonica Moviles Panama, S.A.. See note C.7.4. for further details on the accounting treatment of these options.
For the purchase accounting, Millicom determined the fair value of Cable Onda identifiable assets and liabilities based on transaction and relative values. The non-controlling interest was measured based on the proportionate share of the fair value of the net assets of Cable Onda. The exercise has been finalized in December 2019. The main adjustments compared to the provisional fair values relate to the final valuation of the property, plant and equipment for a net increase of
$30 million
, as well as its related impact on the customer list fair value (a decrease of
$20 million
) and deferred tax liabilities (net increase of
$3 million
). The remaining adjustments are linked to reassessment of contingent liabilities and corresponding indemnification assets. As a result, goodwill decreased by
$8 million
as follows:
.
.
|
|
Provisional Fair values (100%)
|
Final Fair values (100%)
|
Changes
|
|||
|
|
(US$ millions)
|
(US$ millions)
|
(US$ millions)
|
|||
|
Intangible assets (excluding goodwill) (i)
|
673
|
|
653
|
|
(20
|
)
|
|
Property, plant and equipment (ii)
|
348
|
|
378
|
|
30
|
|
|
Current assets (excluding cash)(iii)
|
54
|
|
50
|
|
(4
|
)
|
|
Cash and cash equivalents
|
12
|
|
12
|
|
—
|
|
|
Total assets acquired
|
1,088
|
|
1,094
|
|
6
|
|
|
Non-current liabilities(iv)
|
422
|
|
425
|
|
3
|
|
|
Current liabilities
|
141
|
|
134
|
|
(7
|
)
|
|
Total liabilities assumed
|
563
|
|
559
|
|
(4
|
)
|
|
Fair value of assets acquired and liabilities assumed, net
|
525
|
|
535
|
|
10
|
|
|
Transaction costs assumed by Cable Onda (v)
|
30
|
|
30
|
|
—
|
|
|
Fair value of non-controlling interest in Cable Onda (20%)
|
111
|
|
113
|
|
2
|
|
|
Millicom’s interest in the fair value of Cable Onda (80%)
|
444
|
|
452
|
|
8
|
|
|
Acquisition price
|
956
|
|
956
|
|
0
|
|
|
Final Goodwill
|
512
|
|
504
|
|
(8
|
)
|
|
(i)
|
Intangible assets not previously recognized (or partially recognized as a result of previous acquisitions) are trademarks for an amount of
$280 million
, with estimated useful lives of
3 years
, a customer list for an amount of
$350 million
, with estimated useful life of
20 years
and favorable content contracts for
$19 million
, with a useful life of
10 years
.
|
|
(ii)
|
A net fair value step-up of
$30 million
has been recognized on property, plant and equipment, mainly on the core network (
$11 million
). The expected remaining useful lives were estimated at
5
years on average.
|
|
(iii)
|
Current assets include trade receivables amounting to a fair value of
$34 million
.
|
|
(iv)
|
Non-current liabilities include the deferred tax liability of
$161 million
resulting from the above adjustments.
|
|
(v)
|
Transaction costs of
$30 million
have been assumed and paid by Cable Onda before the acquisition or by Millicom on the closing date. Because of their relationship with the acquisition, these costs have been accounted for as post-acquisition costs in the Millicom Group statement of income. These, together with acquisition-related costs of
$11 million
, have been recorded under operating expenses in the statement of income of the year.
|
The completion of the purchase price allocation did not result in any material impact on the statement of income for the years ended
December 31, 2018
and
December 31, 2019
, respectively, in respect of values previously recorded in the provisional purchase accounting.
F- 28
|
Notes to the Consolidated Financial Statements
For the years ended December 31, 2019, 2018 and 2017 (continued)
|
|
The goodwill, which is not expected to be tax deductible, is attributable to Cable Onda’s strong market position and profitability, as well as to the fair value of the assembled work force. From December 13, 2018 to December 31, 2018, Cable Onda contributed
$17 million
of revenue and a net loss of
$7 million
to the Group. If Cable Onda had been acquired on 1 January 2018 incremental revenue for the 2018 year would have been
$403 million
and incremental net loss for that period of
$59 million
, including amortization of assets not previously recognized of
$85 million
(net of tax).
Key assumptions used in fixed assets valuation
The following valuation methods and key estimates were used for the valuation of the main classes of fixed assets:
|
Major class of assets
|
Valuation method
|
Key assumption 1
|
Key assumption 2
|
Key assumption 3
|
|
Brands
|
Income approach - Relief-from-Royalty approach
|
Discount rate: 10%
|
Royalty rate: 4.5%
|
Tax rate: 25%
|
|
Customer lists
|
Income approach - Multi-Period
Excess Earnings Method
|
Discount rate: 10%
|
Yearly Churn rate: 5.8% in average
|
EBITDA margin: ~ 48%
|
|
Property, plant & equipment
|
Cost approach
|
Economic useful life (range): 5-15 years
|
Remaining useful life (minimum): 2-8 years
|
N/A
|
F- 29
|
Notes to the Consolidated Financial Statements
For the years ended December 31, 2019, 2018 and 2017 (continued)
|
|
A.1.3. Disposal of subsidiaries and decreases in non-controlling interests of subsidiaries
Chad
On June 26, 2019, the Group completed the disposal of its operations in Chad for a final cash consideration of
$110 million
. In accordance with Group practices, the Chad operation has been classified as assets held for sale and discontinued operations as from June 5, 2019 and prior periods restated. On June 26, 2019, Chad was deconsolidated and a gain on disposal of
$77 million
was recognized (see also note
E.4.
).
Rwanda
On December 19, 2017, Millicom announced that it has signed an agreement for the sale of its Rwanda operations to subsidiaries of Bharti Airtel Limited for a final cash consideration of
$51 million
, including a deferred cash payment due in January 2020 for an amount of
$18 million
. The transaction also included earn-outs for
$7 million
that were not recognized by the Group as management does not believe these will be triggered. The sale was completed on January 31, 2018. In accordance with Group practices, Rwanda operations’ assets and liabilities were classified as held for sale on January 23, 2018. Rwanda’s operations also represented a separate geographical area and did qualify for discontinued operations presentation; results were therefore shown on a single line in the statements of income under ‘Profit (loss) for the year from discontinued operations, net of tax’ (see also note
E.4.
).
Senegal
On July 28, 2017, Millicom announced that it had agreed to sell its Senegal business to a consortium consisting of NJJ, Sofima (managed by the Axian Group) and Teylium Group. In accordance with Group practices, Senegal operations’ assets and liabilities were classified as held for sale on February 2, 2017. Senegal’s operations also represented a separate geographical area and did qualify for discontinued operations. The sale was completed on April 27, 2018 in exchange of a cash consideration of
$151 million
. (see also note
E.4.
)
Ghana merger
On March 3, 2017, Millicom and Bharti Airtel Limited (Airtel) announced that they had entered into an agreement for Tigo Ghana Limited and Airtel Ghana Limited to combine their operations in Ghana. In accordance with Group practices, Ghana operations’ assets and liabilities were classified as held for sale on September 30, 2017. Ghana’s operations also represented a separate geographical area and did qualify for discontinued operations. The transaction was completed on October 12, 2017 (see also note
E.4.
).
Other disposals
For the years ended
December 31, 2019
,
2018
and
2017
, Millicom did not dispose of any other significant investments.
A.1.4. Summarized financial information relating to significant subsidiaries with non-controlling interests
At
December 31, 2019
and
2018
, Millicom’s subsidiaries with material non-controlling interests were the Group’s operations in Colombia and Panama.
Balance sheet – non-controlling interests
|
December 31,
|
||||
|
2019
|
2018(i)
|
|||
|
(US$ millions)
|
||||
|
Colombia
|
170
|
|
161
|
|
|
Panama
|
99
|
|
105
|
|
|
Others
|
2
|
|
(16
|
)
|
|
Total
|
271
|
|
251
|
|
(i) Restated as a result of the finalization of Cable Onda purchase accounting, see note
A.1.2.
F- 30
|
Notes to the Consolidated Financial Statements
For the years ended December 31, 2019, 2018 and 2017 (continued)
|
|
Profit (loss) attributable to non-controlling interests
|
2019
|
2018
|
2017
|
||||
|
(US$ millions)
|
||||||
|
Colombia
|
11
|
|
(5
|
)
|
(13
|
)
|
|
Panama
|
(6
|
)
|
(8
|
)
|
—
|
|
|
Others
|
—
|
|
(3
|
)
|
(4
|
)
|
|
Total
|
5
|
|
(16
|
)
|
(17
|
)
|
The summarized financial information for material non-controlling interests in our operations in Colombia and Panama is provided below. This information is based on amounts before inter-company eliminations.
Colombia
|
2019
|
2018
|
2017
|
||||
|
(US$ millions)
|
||||||
|
Revenue
|
1,532
|
|
1,661
|
|
1,739
|
|
|
Total operating expenses
|
(543
|
)
|
(667
|
)
|
(647
|
)
|
|
Operating profit
|
164
|
|
147
|
|
106
|
|
|
Net (loss) for the year
|
23
|
|
(10
|
)
|
(25
|
)
|
|
50% non-controlling interest in net (loss)
|
11
|
|
(5
|
)
|
(13
|
)
|
|
Total assets (excluding goodwill)
|
2,256
|
|
1,966
|
|
2,193
|
|
|
Total liabilities
|
1,891
|
|
1,620
|
|
1,771
|
|
|
Net assets
|
365
|
|
346
|
|
422
|
|
|
50% non-controlling interest in net assets
|
183
|
|
173
|
|
211
|
|
|
Consolidation adjustments
|
(13
|
)
|
(12
|
)
|
(15
|
)
|
|
Total non-controlling interest
|
170
|
|
161
|
|
197
|
|
|
Dividends and advances paid to non-controlling interest
|
(12
|
)
|
(2
|
)
|
0
|
|
|
Net cash from operating activities
|
363
|
|
348
|
|
331
|
|
|
Net cash from (used in) investing activities
|
(260
|
)
|
(270
|
)
|
(209
|
)
|
|
Net cash from (used in) financing activities
|
(67
|
)
|
(75
|
)
|
(46
|
)
|
|
Exchange impact on cash and cash equivalents, net
|
—
|
|
(18
|
)
|
3
|
|
|
Net increase in cash and cash equivalents
|
36
|
|
(15
|
)
|
80
|
|
F- 31
|
Notes to the Consolidated Financial Statements
For the years ended December 31, 2019, 2018 and 2017 (continued)
|
|
Panama
|
2019 (ii)
|
2018 (i)
|
|||
|
(US$ millions)
|
||||
|
Revenue
|
475
|
|
17
|
|
|
Total operating expenses
|
(148
|
)
|
(8
|
)
|
|
Operating profit
|
(15
|
)
|
(39
|
)
|
|
Net (loss) for the year
|
(31
|
)
|
(39
|
)
|
|
20% non-controlling interest in net (loss)
|
(6
|
)
|
(8
|
)
|
|
Total assets (excluding Millicom's goodwill in Cable Onda)
|
1,866
|
|
1,082
|
|
|
Total liabilities
|
1,372
|
|
556
|
|
|
Net assets
|
494
|
|
526
|
|
|
20% non-controlling interest in net assets
|
99
|
|
105
|
|
|
Consolidation adjustments
|
—
|
|
—
|
|
|
Total non-controlling interest
|
99
|
|
105
|
|
|
Dividends and advances paid to non-controlling interest
|
—
|
|
—
|
|
|
Net cash from operating activities
|
167
|
|
(2
|
)
|
|
Net cash from (used in) investing activities (iii)
|
(693
|
)
|
12
|
|
|
Net cash from (used in) financing activities (iii)
|
580
|
|
(3
|
)
|
|
Exchange impact on cash and cash equivalents, net
|
—
|
|
—
|
|
|
Net increase in cash and cash equivalents
|
54
|
|
7
|
|
|
(i)
|
Cable Onda was acquired on December 13, 2018 and 2018 figures therefore only include results and cash flows from the date of acquisition.
|
|
(ii)
|
2019 figures include the full year results and cash flows of Cable Onda, as well as 4 months of Telefonica Panama which was consolidated from September 1, 2019.
|
|
(iii)
|
In 2019, Cable Onda acquired Telefonica Panama for
$594 million
(note A.1.2.), financed by issuing a
$600 million
Senior Notes due 2030 (note C.3.1.)
|
F- 32
|
Notes to the Consolidated Financial Statements
For the years ended December 31, 2019, 2018 and 2017 (continued)
|
|
A.2. Joint ventures
Joint ventures are businesses over which Millicom exercises joint control as decisions over the relevant activities of each require unanimous consent of shareholders. Millicom determines the existence of joint control by reference to joint venture agreements, articles of association, structures and voting protocols of the board of directors of those ventures.
At
December 31, 2019
, the equity accounted net assets of our joint ventures in Guatemala, Honduras and Ghana totaled
$3,346 million
(
December 31, 2018
:
$3,405 million
for Guatemala and Honduras only). These net assets do not necessarily represent statutory reserves available for distribution as these include consolidation adjustments (such as goodwill and identified assets and assumed liabilities recognized as part of the purchase accounting). Out of these reserves,
$142 million
(
December 31, 2018
:
$133 million
) represent statutory reserves that are unavailable to be distributed to the Group. During the year ended
December 31, 2019
, Millicom’s joint ventures paid
$237 million
(
December 31, 2018
:
$243 million
) as dividends or dividend advances to the Company.
Our main joint ventures are as follows:
|
Entity
|
Country
|
Activity
|
December 31, 2019 % holding
|
December 31, 2018 % holding
|
|
Comunicaciones Celulares S.A(i).
|
Guatemala
|
Mobile, MFS
|
55
|
55
|
|
Navega.com S.A.(i)
|
Guatemala
|
Cable, DTH
|
55
|
55
|
|
Telefonica Celular S.A(i).
|
Honduras
|
Mobile, MFS
|
66.7
|
66.7
|
|
Navega S.A. de CV(i)
|
Honduras
|
Cable
|
66.7
|
66.7
|
|
Bharti Airtel Ghana Holdings B.V.
|
Ghana
|
Mobile, MFS
|
50
|
50
|
|
(i)
|
Millicom owns more than
50%
of the shares in these entities and has the right to nominate a majority of the directors of each of these entities. However, key decisions over the relevant activities must be taken by a supermajority vote. This effectively gives either shareholder the ability to veto any decision and therefore neither shareholder has sole control over the entity. Therefore, the operations of these joint ventures are accounted for under the equity method.
|
The carrying values of Millicom’s investments in joint ventures were as follows:
Carrying value of investments in joint ventures at December 31
|
%
|
2019
|
2018
|
|||
|
(US$ millions)
|
|||||
|
Honduras operations(i)
|
66.7
|
708
|
|
730
|
|
|
Guatemala operations(i)
|
55
|
2,089
|
|
2,104
|
|
|
AirtelTigo Ghana operations
|
50
|
—
|
|
32
|
|
|
Total
|
2,797
|
|
2,867
|
|
|
|
(i)
|
Includes all the companies under the Honduras and Guatemala groups.
|
The table below summarizes the movements for the year in respect of the Group’s joint ventures carrying values:
F- 33
|
Notes to the Consolidated Financial Statements
For the years ended December 31, 2019, 2018 and 2017 (continued)
|
|
|
Guatemala(i)
|
Honduras (i)
|
Ghana(ii)
|
||||
|
(US$ millions)
|
||||||
|
Opening balance at January 1, 2018
|
2,145
|
|
726
|
|
96
|
|
|
Adjustments on adoption of IFRS 15 and IFRS 9 (net of tax)
|
18
|
|
5
|
|
0
|
|
|
Change in scope
|
—
|
|
—
|
|
0
|
|
|
Results for the year
|
131
|
|
23
|
|
(68
|
)
|
|
Capital increase
|
—
|
|
3
|
|
—
|
|
|
Dividends declared during the year
|
(177
|
)
|
—
|
|
—
|
|
|
Currency exchange differences
|
(14
|
)
|
(26
|
)
|
3
|
|
|
Closing balance at December 31, 2018
|
2,104
|
|
730
|
|
32
|
|
|
Accounting policy changes
|
—
|
|
—
|
|
—
|
|
|
Capital increase
|
—
|
|
—
|
|
5
|
|
|
Results for the year
|
152
|
|
27
|
|
(40
|
)
|
|
Utilization of past recognized losses
|
—
|
|
—
|
|
(5
|
)
|
|
Dividends declared during the year
|
(170
|
)
|
(37
|
)
|
—
|
|
|
Currency exchange differences
|
2
|
|
(12
|
)
|
8
|
|
|
Closing balance at December 31, 2019
|
2,089
|
|
708
|
|
—
|
|
|
(i)
|
Share of profit (loss) is recognized under ‘Share of profit in the joint ventures in Guatemala and Honduras’ in the statement of income.
|
|
(ii)
|
Share of profit (loss) is recognized under ‘Income (loss) from other joint ventures and associates, net’ in the statement of income.
|
At
December 31, 2019
and
2018
the Group had not incurred obligations, nor made payments on behalf of the Guatemala, Honduras or Ghana operations.
A.2.1. Accounting for joint ventures
Joint ventures are accounted for using the equity method of accounting and are initially recognized at cost (calculated at fair value if it was a subsidiary of the Group before becoming a joint venture). The Group’s investments in joint ventures include goodwill (net of any accumulated impairment loss) on acquisition.
The Group’s share of post-acquisition profits or losses of joint ventures is recognized in the consolidated statement of income and its share of post-acquisition movements in reserves is recognized in reserves. Cumulative post-acquisition movements are adjusted against the carrying amount of the investments. When the Group’s share of losses in a joint venture equals or exceeds its interest in the joint venture, including any other unsecured receivables, the Group does not recognize further losses, unless the Group has incurred obligations or made payments on behalf of the joint ventures.
Gains on transactions between the Group and its joint ventures are eliminated to the extent of the Group’s interest in the joint ventures. Losses are also eliminated unless the transaction provides evidence of an impairment of the asset transferred. Accounting policies of joint ventures have been changed where necessary to ensure consistency with the policies adopted by the Group. Dilution gains and losses arising in investments in joint ventures are recognized in the statement of income.
After application of the equity method, including recognizing the joint ventures’ losses, the Group applies IFRS 9 to determine whether it is necessary to recognize any additional impairment loss with respect to its net investment in the joint venture.
A.2.2. Material joint ventures – Guatemala, Honduras and Ghana operations
Summarized financial information for the years ended
December 31, 2019
,
2018
and
2017
of the Guatemala and Honduras operations is as follows. This information is based on amounts before inter-company eliminations.
F- 34
|
Notes to the Consolidated Financial Statements
For the years ended December 31, 2019, 2018 and 2017 (continued)
|
|
Guatemala
|
2019
|
2018
|
2017
|
||||
|
(US$ millions)
|
||||||
|
Revenue
|
1,434
|
|
1,373
|
|
1,328
|
|
|
Depreciation and amortization
|
(313
|
)
|
(283
|
)
|
(295
|
)
|
|
Operating profit(i)
|
429
|
|
387
|
|
352
|
|
|
Financial income (expenses), net
|
(66
|
)
|
(56
|
)
|
(60
|
)
|
|
Profit before taxes
|
356
|
|
309
|
|
305
|
|
|
Charge for taxes, net
|
(79
|
)
|
(69
|
)
|
(74
|
)
|
|
Profit for the year
|
277
|
|
240
|
|
230
|
|
|
Net profit for the year attributable to Millicom
|
152
|
|
131
|
|
126
|
|
|
Dividends and advances paid to Millicom
|
209
|
|
211
|
|
162
|
|
|
Total non-current assets (excluding goodwill)
|
2,517
|
|
2,280
|
|
2,406
|
|
|
Total non-current liabilities
|
1,216
|
|
981
|
|
1,052
|
|
|
Total current assets
|
717
|
|
718
|
|
756
|
|
|
Total current liabilities
|
251
|
|
221
|
|
220
|
|
|
Total net assets
|
1,767
|
|
1,796
|
|
1,890
|
|
|
Group's share in %
|
55
|
%
|
55
|
%
|
55
|
%
|
|
Group's share in USD millions
|
972
|
|
988
|
|
1,040
|
|
|
Goodwill and consolidation adjustments
|
1,117
|
|
1,116
|
|
1,106
|
|
|
Carrying value of investment in joint venture
|
2,089
|
|
2,104
|
|
2,145
|
|
|
Cash and cash equivalents
|
189
|
|
217
|
|
303
|
|
|
Debt and financing – non-current
|
1,152
|
|
928
|
|
995
|
|
|
Debt and financing – current
|
21
|
|
—
|
|
—
|
|
|
Net cash from operating activities
|
588
|
|
545
|
|
498
|
|
|
Net cash from (used in) investing activities
|
(205
|
)
|
(173
|
)
|
(171
|
)
|
|
Net cash from (used in) financing activities
|
(412
|
)
|
(455
|
)
|
(315
|
)
|
|
Exchange impact on cash and cash equivalents, net
|
1
|
|
(3
|
)
|
2
|
|
|
Net increase in cash and cash equivalents
|
(28
|
)
|
(86
|
)
|
14
|
|
|
(i)
|
In 2017, operating profit included a provision for impairment of
$10 million
on the fixed assets related to video surveillance contracts with the Civil National Police.
|
Guatemala financing
In 2014, Intertrust SPV (Cayman) Limited, acting as trustee of the Comcel Trust, a trust established and consolidated by Comcel for the purposes of the transaction, issued
$800 million
6.875%
Senior Notes to refinance existing local and MIC S.A. corporate debt. The bond was issued at
98.233%
of the principal and has an effective interest rate of
7.168%
. The bond is guaranteed by Comcel and listed on the Luxembourg Stock Exchange.
F- 35
|
Notes to the Consolidated Financial Statements
For the years ended December 31, 2019, 2018 and 2017 (continued)
|
|
Honduras
|
2019
|
2018
|
2017
|
||||
|
(US$ millions)
|
||||||
|
Revenue
|
594
|
|
586
|
|
585
|
|
|
Depreciation and amortization
|
(132
|
)
|
(133
|
)
|
(156
|
)
|
|
Operating profit
|
102
|
|
91
|
|
70
|
|
|
Financial income (expenses), net
|
(37
|
)
|
(29
|
)
|
(27
|
)
|
|
Profit before taxes
|
60
|
|
52
|
|
41
|
|
|
Charge for taxes, net
|
(21
|
)
|
(18
|
)
|
(18
|
)
|
|
Profit for the year
|
39
|
|
34
|
|
23
|
|
|
Net profit for the year attributable to Millicom
|
27
|
|
23
|
|
15
|
|
|
Dividends and advances paid to Millicom
|
28
|
|
32
|
|
40
|
|
|
Total non-current assets (excluding goodwill)
|
516
|
|
506
|
|
576
|
|
|
Total non-current liabilities
|
469
|
|
386
|
|
407
|
|
|
Total current assets
|
312
|
|
304
|
|
208
|
|
|
Total current liabilities
|
183
|
|
226
|
|
282
|
|
|
Total net assets
|
176
|
|
198
|
|
95
|
|
|
Group's share in %
|
66.7
|
%
|
66.7
|
%
|
66.7
|
%
|
|
Group's share in USD millions
|
117
|
|
132
|
|
63
|
|
|
Goodwill and consolidation adjustments
|
591
|
|
598
|
|
663
|
|
|
Carrying value of investment in joint venture
|
708
|
|
730
|
|
726
|
|
|
Cash and cash equivalents
|
40
|
|
25
|
|
16
|
|
|
Debt and financing – non-current
|
384
|
|
298
|
|
308
|
|
|
Debt and financing – current
|
39
|
|
85
|
|
80
|
|
|
Net cash from operating activities
|
169
|
|
147
|
|
152
|
|
|
Net cash from (used in) investing activities
|
(77
|
)
|
(87
|
)
|
(74
|
)
|
|
Net cash from (used in) financing activities
|
(77
|
)
|
(50
|
)
|
(74
|
)
|
|
Net (decrease) increase in cash and cash equivalents
|
15
|
|
9
|
|
3
|
|
Honduras financing
On September 19, 2019, Telefónica Celular, S.A. de C.V. entered into a new credit agreement with Banco Industrial S.A. and Banco Pais S.A for an amount up to
$185 million
, in tranches of
$100 million
,
$60 million
and
$25 million
. The Loan Agreement has a
10
-year maturity and an interest rate of LIBOR plus
3.80%
per annum, subject to a floor of minimum
5.25%
. The new credit agreement has been used to consolidate the portion of a syndicated
$250 million
facility with Scotiabank dated March 27, 2015, and
$90 million
credit agreement with Banco Industrial S.A. dated March 20, 2018.
On September 19, 2019, Navega S.A. de C.V., entered into new facility agreement with Banco Industrial S.A. for an amount of
$20 million
and a duration of
10 years
. The new agreement bears an annual interest of LIBOR plus
3.80%
, subject to a floor of
5.25%
. and will be used to refinance the portion corresponding to it as borrower under the
$250 million
facility with Scotiabank dated March 27, 2015.
Ghana
As mentioned in note A.1.3., in 2017 Millicom and Airtel signed a Combination Agreement, whereby both investors decided to combine their respective subsidiaries in Ghana, namely Tigo Ghana Limited and Airtel Ghana Limited under an existing company – Bharti Airtel Ghana Holdings B.V. (the ‘JV’ or ‘AirtelTigo Ghana’) both Millicom and Airtel each owning
50%
. As part of the transaction, the government of Ghana retained an option to acquire a
25%
stake in the newly combined entity for a period of
two years
. This option has never been material and expired unexercised in September 2019.
On October 12, 2017, both parties announced the completion of the transaction. As consideration received, each party owns
50%
of the equity capital and voting rights of the JV, and Millicom holds a
$40 million
loan against Tigo Ghana (the “Millicom
F- 36
|
Notes to the Consolidated Financial Statements
For the years ended December 31, 2019, 2018 and 2017 (continued)
|
|
Note”), which shall rank in priority to all other obligations of the joint venture owed to its shareholders. The Millicom Note bears interest and is classified under ‘other non-current assets’ in the statement of financial position.
Decisions about the relevant activities require the unanimous consent of the parties sharing control. Therefore, based on IFRS 11, this agreement results in Millicom and Airtel having joint control over the combined entity, which is a joint venture. Millicom therefore uses the equity method to account for its investment in the combined entity since October 12, 2017.
As a consequence, on
October 12, 2017
, Millicom deconsolidated its investments in Ghana operations and accounted for its investment in the combined entity under the equity method, initially at fair value of
$102 million
, resulting in a net gain on the deconsolidation of these operations amounting to
$36 million
, including recycling of foreign currency exchange losses accumulated in equity of
$79 million
. The net gain has been recognized under ‘Profit (loss) for the year from discontinued operations, net of tax’.
AirtelTigo Ghana
|
2019
|
2018
|
2017
|
||||
|
(US$ millions)
|
(US$ millions)
|
(US$ millions)
|
||||
|
Revenue
|
142
|
|
187
|
|
58
|
|
|
Depreciation and amortization
|
(69
|
)
|
(110
|
)
|
(11
|
)
|
|
Operating loss
|
(72
|
)
|
(100
|
)
|
(1
|
)
|
|
Financial income (expenses), net
|
(77
|
)
|
(42
|
)
|
(10
|
)
|
|
Loss before taxes
|
(123
|
)
|
(135
|
)
|
(12
|
)
|
|
Charge for taxes, net
|
—
|
|
—
|
|
—
|
|
|
Loss for the period
|
(123
|
)
|
(135
|
)
|
(12
|
)
|
|
Net loss for the period attributable to Millicom
|
(40
|
)
|
(68
|
)
|
(6
|
)
|
|
Dividends and advances paid to Millicom
|
—
|
|
—
|
|
—
|
|
|
Total non-current assets (excluding goodwill)
|
168
|
|
277
|
|
184
|
|
|
Total non-current liabilities
|
245
|
|
277
|
|
214
|
|
|
Total current assets
|
42
|
|
71
|
|
60
|
|
|
Total current liabilities
|
187
|
|
134
|
|
106
|
|
|
Total net assets
|
(223
|
)
|
(63
|
)
|
(76
|
)
|
|
Group's share in %
|
50
|
%
|
50
|
%
|
50
|
%
|
|
Group's share in USD millions
|
(111
|
)
|
(31
|
)
|
(38
|
)
|
|
Goodwill and consolidation adjustments
|
90
|
|
63
|
|
134
|
|
|
Unrecognised losses
|
(22
|
)
|
0
|
|
0
|
|
|
Carrying value of investment in joint venture
|
—
|
|
32
|
|
96
|
|
|
Cash and cash equivalents
|
5
|
|
19
|
|
15
|
|
|
Debt and financing – non-current
|
245
|
|
276
|
|
145
|
|
|
Debt and financing – current
|
27
|
|
17
|
|
—
|
|
|
Net cash from operating activities
|
(5
|
)
|
(19
|
)
|
13
|
|
|
Net cash from (used in) investing activities
|
—
|
|
(8
|
)
|
—
|
|
|
Net cash from (used in) financing activities
|
(6
|
)
|
42
|
|
(3
|
)
|
|
Net increase in cash and cash equivalents
|
(11
|
)
|
15
|
|
10
|
|
A.2.3. Impairment of investment in joint ventures
While no impairment triggers were identified for the Group’s investments in joint ventures in
2019
, according to its policy, management have completed an impairment test for its joint ventures in Guatemala, Honduras and Ghana (up to 2018 for Ghana as investment is nil as of
December 31, 2019
).
The Group’s investments in Guatemala and Honduras operations were tested for impairment by assessing their recoverable amount (using a value in use model based on discounted cash flows) against their carrying amounts. The cash flow projections
F- 37
|
Notes to the Consolidated Financial Statements
For the years ended December 31, 2019, 2018 and 2017 (continued)
|
|
used were extracted from financial budgets approved by management and the Board covering a period of five years. In respect of Guatemala and Honduras, cash flows beyond this period have been extrapolated using a perpetual growth rate of
1.1%–1.2%
(
2018
:
3.2%–3.0%
). Discount rates used in determining recoverable amounts were
9.5%
and
9.7%
, respectively (
2018
:
11.0%
and
10.3%
). For Ghana, in 2018, management used a perpetual growth rate of
3.8%
and a discount rate of
14.4%
.
For the year ended
December 31, 2019
and
2018
, and as a result of the impairment testing described above, management concluded that none of the Group’s investments in joint ventures should be impaired.
Sensitivity analysis was performed on key assumptions within the impairment tests. The sensitivity analysis determined that sufficient headroom exists from realistic changes to the assumptions that would not impact the overall results of the testing.
F- 38
|
Notes to the Consolidated Financial Statements
For the years ended December 31, 2019, 2018 and 2017 (continued)
|
|
A.3. Investments in associates
Millicom’s investments in Helios Towers Africa Ltd (HTA) and in the African online business (AIH) became listed companies during 2019, and Millicom resigned from its board of directors' positions in both companies, having as an effect the loss of its significant influence. Both investments are now accounted for as equity instruments (see note
C.7.3.
). Millicom has significant influence over other immaterial associates as shown below.
The Group’s associates are as follows:
|
December 31, 2019
|
December 31, 2018
|
|||
|
Entity
|
Country
|
Activity(ies)
|
% holding
|
% holding
|
|
Africa
|
||||
|
Helios Towers Africa Ltd (HTA)(i)
|
Mauritius
|
Holding of Tower infrastructure company
|
—
|
22.83
|
|
Africa Internet Holding GmbH (AIH)(i)
|
Germany
|
Online marketplace, retail and services
|
—
|
10.15
|
|
West Indian Ocean Cable Company Limited (WIOCC)
|
Republic of Mauritius
|
Telecommunication carriers’ carrier
|
9.1
|
9.1
|
|
Latin America
|
||||
|
MKC Brilliant Holding GmbH (LIH)
|
Germany
|
Online marketplace, retail and services
|
35.0
|
35.0
|
|
Unallocated
|
||||
|
Milvik AB
|
Sweden
|
Other
|
11.4
|
12.3
|
(i) See note
C.7.3.
.
At
December 31, 2019
and
2018
, the carrying value of Millicom’s main associates was as follows:
Carrying value of investments in associates at December 31
|
2019
|
2018
|
|||
|
(US$ millions)
|
||||
|
African Internet Holding GmbH (AIH)
|
—
|
|
38
|
|
|
Helios Tower Africa Ltd (HTA)
|
—
|
|
105
|
|
|
Milvik AB
|
11
|
|
13
|
|
|
West Indian Ocean Cable Company Limited (WIOCC)
|
14
|
|
14
|
|
|
Total
|
25
|
|
169
|
|
The summarized financial information for the Group’s main material associates is provided below.
Summary of statement of financial position of associates at December 31,
|
2018 (i)
|
||
|
Total current assets
|
473
|
|
|
Total non-current assets
|
717
|
|
|
Total assets
|
1,190
|
|
|
Total current liabilities
|
343
|
|
|
Total non-current liabilities
|
627
|
|
|
Total liabilities
|
969
|
|
|
Total net assets
|
221
|
|
|
Millicom’s carrying value of its investment in HTA and AIH
|
142
|
|
|
Millicom’s carrying value of its investment in other associates
|
27
|
|
|
Millicom’s carrying value of its investment in associates
|
169
|
|
F- 39
|
Notes to the Consolidated Financial Statements
For the years ended December 31, 2019, 2018 and 2017 (continued)
|
|
(i) The summarized financial information in 2018 includes HTA and AIH. For 2019, Millicom does not disclose such information as its remaining associates are immaterial to the Group.
Profit (loss) from other joint ventures and associates
In 2019, the loss shown under this caption in the statement of income mainly relates to the net losses recognised by our joint venture in Ghana. For further details refer to note
A.2.
.
|
2018 (i)
|
2017 (i)
|
|||
|
Revenue
|
511
|
|
449
|
|
|
Operating expenses
|
(459
|
)
|
(321
|
)
|
|
Operating profit (loss)
|
(214
|
)
|
(148
|
)
|
|
Net loss for the year
|
(327
|
)
|
(220
|
)
|
|
Millicom’s share of results from HTA and AIH
|
(66
|
)
|
(34
|
)
|
|
Millicom’s share of results from other associates
|
(2
|
)
|
(45
|
)
|
|
Millicom’s share of results from other joint ventures (Ghana)
|
(68
|
)
|
(6
|
)
|
|
Millicom’s share of results from other joint ventures and associates
|
(136
|
)
|
(85
|
)
|
(i) The summarized financial information in 2018 and 2017 includes HTA and AIH. For 2019, Millicom does not disclose such information as its remaining associates are immaterial to the Group.
A.3.1. Accounting for investments in associates
The Group accounts for associates in the same way as it accounts for joint ventures.
A.3.2. Acquisitions and disposals of interests in associates
Milvik AB (BIMA)
On December 19, 2017, Millicom announced that it had sold a portion of its ownership stake in BIMA - a leading emerging market insurance player - (from
20.4%
to
12.0%
– on a fully diluted basis) to Kinnevik and a new investor, with the latter contributing
$97 million
in the micro-insurance business. As a result of the transaction, Millicom received
$24 million
in cash and recognized a gain on disposal of
$21 million
. In addition, and as a consequence of the subsequent capital increase made by the new investor, the Group recognized a gain on dilution of
$11 million
. Both gains have been recorded under the caption "Income (loss) from other joint ventures and associates, net", in the statement of income for the year ended
December 31, 2017
. Both transactions were carried out at the same fair value on an arm’s length basis.
MKC Brilliant Holding GmbH (LIH)
Millicom’s
35.0%
investment in LIH has been fully impaired in two stages (by
$40 million
in 2016 and
$48 million
in 2017) mainly as a result of the decrease in fair value of LIH’s investment in the Global Fashion Group and the results the annual impairment test conducted in 2017. The impairment test performed in 2019 confirms this conclusion. These losses were recorded under the caption 'Income (loss) from other joint ventures and associates, net' in the year ended December 31, 2017.
A.4. Discontinued operations
A.4.1. Classification of discontinued operations
Discontinued operations are those which have identifiable operations and cash flows (for both operating and management purposes) and represent a major line of business or geographic area which has been disposed of, or are held for sale. Revenue and expenses associated with discontinued operations are presented retrospectively in a separate line in the consolidated statement of income. Millicom determined that the loss of path to control of operations by the termination of a contractual arrangement (e.g. termination without exercise of an unconditional call option agreement giving path to control, as occurred with the Guatemala and Honduras operations) does not require presentation as a discontinued operation.
A.4.2. Millicom’s discontinued operations
In accordance with IFRS 5, the Group’s businesses in Chad, Senegal, Tigo Ghana and Tigo Rwanda have been classified as assets held for sale (respectively on June 5, 2019, February 2, 2017, September 28, 2017 and January 23, 2018) and their results were
F- 40
|
Notes to the Consolidated Financial Statements
For the years ended December 31, 2019, 2018 and 2017 (continued)
|
|
showed as discontinued operations for all years presented in these financial statements. The statement of income comparative figures presented in the notes to these consolidated financial statements have therefore been restated accordingly and when necessary. For further details, refer to note
E.4.
B. Performance
B.1. Revenue
Millicom’s revenue comprises sale of services from its mobile business (including Mobile Financial Services - MFS) and its cable and other fixed services, as well as related devices and equipment. Recurring revenue consists of monthly subscription fees, airtime and data usage fees, interconnection fees, roaming fees, TV services, B2B contracts, MFS commissions and fees from other telecommunications services such as data services, short message services and other value added services.
Revenue from continuing operations by category
|
2019
|
2018
|
2017
|
||||
|
(US$ millions)
|
||||||
|
Mobile
|
2,150
|
|
2,126
|
|
2,147
|
|
|
Cable and other fixed services
|
1,928
|
|
1,565
|
|
1,551
|
|
|
Other
|
52
|
|
43
|
|
38
|
|
|
Service revenue
|
4,130
|
|
3,734
|
|
3,737
|
|
|
Telephone and equipment and other
|
206
|
|
212
|
|
199
|
|
|
Total revenue
|
4,336
|
|
3,946
|
|
3,936
|
|
Revenue from continuing operations by country or operation (i)
|
2019
|
2018
|
2017
|
||||
|
(US$ millions)
|
||||||
|
Colombia
|
1,532
|
|
1,661
|
|
1,739
|
|
|
Paraguay
|
609
|
|
679
|
|
662
|
|
|
Bolivia
|
639
|
|
614
|
|
555
|
|
|
El Salvador
|
386
|
|
405
|
|
422
|
|
|
Tanzania
|
382
|
|
399
|
|
384
|
|
|
Nicaragua
|
157
|
|
13
|
|
13
|
|
|
Costa Rica
|
153
|
|
155
|
|
153
|
|
|
Panama
|
475
|
|
17
|
|
—
|
|
|
Other operations
|
2
|
|
5
|
|
7
|
|
|
Total
|
4,336
|
|
3,946
|
|
3,936
|
|
(i) The revenue figures above are shown after intercompany eliminations.
B.1.1. Accounting for revenue
Revenue recognition
Revenue is recognized at an amount that reflects the consideration to which the Group expects to be entitled in exchange for transferring goods or services to a customer.
The Group applies the following practical expedients foreseen in IFRS 15:
|
•
|
No adjustment to the transaction price for the means of a financing component whenever the period between the transfer of a promised good or service to a customer and the associated payment is one year or less; when the period is more than one year the financing component is adjusted, if material.
|
F- 41
|
Notes to the Consolidated Financial Statements
For the years ended December 31, 2019, 2018 and 2017 (continued)
|
|
|
•
|
Disclosure in the Group Financial Statements the transaction price allocated to unsatisfied performance obligations only for contracts that have an original expected duration of more than one year (e.g. unsatisfied performance obligations for contracts that have an original duration of one year or less are not disclosed).
|
|
•
|
Application of the practical expedient not to disclose the price allocated to unsatisfied performance obligations, if the consideration from a customer corresponds to the value of the entity’s performance obligation to the customer (i.e, if billing corresponds to accounting revenue).
|
|
•
|
Application of the practical expedient to recognize the incremental costs of obtaining a contract as an expense when incurred if the amortization period of the asset that otherwise would have been recognized is one year or less.
|
Post-paid connection fees are derived from the payment of a non-refundable / one-time fee charged to customer to connect to the network (e.g. connection / installation fee). Usually, it does not represent a distinct good or service, and therefore does not give rise to a separate performance obligation and revenue is recognized over the minimum contract duration. However, if the fee is paid by a customer to get the right to receive goods or services without having to pay this fee again over his tenure with the Group (e.g. the customer can readily extend his contract without having to pay the same fee again), it is accounted for as a material right and revenue should be recognized over the customer retention period.
Post-paid mobile / cable subscription fees are recognized over the relevant enforceable/subscribed service period (recurring monthly access fees that do not vary based on usage). The service provision is usually considered as a series of distinct services that have the same pattern of transfer to the customer. Remaining unrecognized subscription fees, which are not refunded to the customers, are fully recognized once the customer has been disconnected.
Prepaid scratch / SIM cards are services where customers purchase a specified amount of airtime or other credit in advance. Revenue is recognized as the credit is used. Unused credit is carried in the statement of financial position as a contract liability. Upon expiration of the validity period, the portion of the contract liability relating to the expiring credit is recognized as revenue, since there is no longer an obligation to provide those services.
Telephone and equipment sales are recognized as revenue once the customer obtains control of the good. That criteria is fulfilled when the customer has the ability to direct the use and obtain substantially all of the remaining benefits from that good.
Revenue from provision of Mobile Financial Services (MFS) is recognized once the primary service has been provided to the customer.
Customer premise equipment (CPE) are provided to customers as a prerequisite to receive the subscribed Home services and shall be returned at the end of the contract duration. Since CPEs provided over the contract term do not provide benefit to the customer on their own, they do not give rise to separate performance obligations and therefore are accounted for as part of the service provided to the customers.
Bundled offers are considered arrangements with multiple deliverables or elements, which can lead to the identification of separate performance obligations. Revenue is recognized in accordance with the transfer of goods or services to customers in an amount that reflects the relative standalone selling price of the performance obligation (e.g. sale of telecom services, revenue over time + sale of handset, revenue at a point in time).
Principal-Agent, some arrangements involve two or more unrelated parties that contribute to providing a specified good or service to a customer. In these instances, the Group determines whether it has promised to provide the specified good or service itself (as a principal) or to arrange for those specified goods or services to be provided by another party (as an agent). For example, performance obligations relating to services provided by third-party content providers (i.e., mobile Value Added Services or “VAS”) or service providers (i.e., wholesale international traffic) where the Group neither controls a right to the provider’s service nor controls the underlying service itself are presented net because the Group is acting as an agent. The Group generally acts as a principal for other types of services where the Group is the primary obligor of the arrangement. In cases the Group determines that it acts as a principal, revenue is recognized in the gross amount, whereas in cases the Group acts as an agent revenue is recognized in the net amount.
Revenue from the sale of cables, fiber, wavelength or capacity contracts, when part of the ordinary activities of the operation, is recognized as recurring revenue. Revenue is recognized when the cable, fiber, wavelength or capacity has been delivered to the customer, based on the amount expected to be received from the customer.
Revenue from operating lease of tower space is recognized over the period of the underlying lease contracts. Finance leases revenue is apportioned between lease of tower space and interest income.
Significant judgments
The determination of the standalone selling price for contracts that involve more than one performance obligation may require significant judgment, such as when the selling price of a good or service is not readily observable.
F- 42
|
Notes to the Consolidated Financial Statements
For the years ended December 31, 2019, 2018 and 2017 (continued)
|
|
The Group determines the standalone selling price of each performance obligation in the contract in accordance to the prices that the Group would apply when selling the same services and/or telephone and equipment included in the obligation to a similar customer on a standalone basis. When standalone selling price of services and/or telephone and equipment are not directly observable, the Group maximizes the use of external input and uses the expected cost plus margin approach to estimate the standalone selling price.
B.2. Expenses
The cost of sales and operating expenses incurred by the Group can be summarized as follows:
Cost of sales
|
2019
|
2018
|
2017
|
||||
|
(US$ millions)
|
||||||
|
Direct costs of services sold
|
(878
|
)
|
(799
|
)
|
(881
|
)
|
|
Cost of telephone, equipment and other accessories
|
(230
|
)
|
(229
|
)
|
(217
|
)
|
|
Bad debt and obsolescence costs
|
(93
|
)
|
(90
|
)
|
(71
|
)
|
|
Cost of sales
|
(1,201
|
)
|
(1,117
|
)
|
(1,169
|
)
|
Operating expenses, net
|
2019
|
2018
|
2017
|
||||
|
(US$ millions)
|
||||||
|
Marketing expenses
|
(402
|
)
|
(391
|
)
|
(448
|
)
|
|
Site and network maintenance costs
|
(245
|
)
|
(192
|
)
|
(178
|
)
|
|
Employee related costs (B.4.)
|
(496
|
)
|
(500
|
)
|
(434
|
)
|
|
External and other services
|
(204
|
)
|
(181
|
)
|
(163
|
)
|
|
Rentals and (operating) leases (i)
|
(1
|
)
|
(152
|
)
|
(151
|
)
|
|
Other operating expenses
|
(257
|
)
|
(201
|
)
|
(156
|
)
|
|
Operating expenses, net
|
(1,604
|
)
|
(1,616
|
)
|
(1,531
|
)
|
|
(i)
|
Decrease is due to IFRS 16 application - see further explanations above in "New and amended IFRS accounting standards" section
|
The other operating income and expenses incurred by the Group can be summarized as follows:
Other operating income (expenses), net
|
Notes
|
2019
|
2018
|
2017
|
||||
|
(US$ millions)
|
|||||||
|
Income from tower deal transactions
|
C.3.4.
|
5
|
|
61
|
|
63
|
|
|
Impairment of intangible assets and property, plant and equipment
|
E.1., E.2.
|
(8
|
)
|
(6
|
)
|
(12
|
)
|
|
Gain (loss) on disposals of intangible assets and property, plant and equipment
|
—
|
|
7
|
|
1
|
|
|
|
Loss on disposal of equity investments
|
C.7.3.
|
(32
|
)
|
—
|
|
—
|
|
|
Other income (expenses)
|
1
|
|
13
|
|
17
|
|
|
|
Other operating income (expenses), net
|
(34
|
)
|
75
|
|
69
|
|
|
B.2.1. Accounting for cost of sales and operating expenses
Cost of sales
Cost of sales is recorded on an accrual basis.
F- 43
|
Notes to the Consolidated Financial Statements
For the years ended December 31, 2019, 2018 and 2017 (continued)
|
|
Incremental costs of obtaining a contract
Incremental costs of obtaining a contract, including dealer commissions, are capitalized as Contract Costs in the statement of financial position and amortized in operating expenses over the expected benefit period, which is based on the average duration of contracts with customer (see practical expedient in note
B.1.1.
).
Operating leases - until 2018 year-end
Operating leases were all leases that did not qualify as finance leases. Operating lease payments were recognized as expenses in the consolidated statement of income on a straight-line basis over the lease term.
B.3. Segmental information
Management determines operating and reportable segments based on information used by the chief operating decision maker (CODM) to make strategic and operational decisions from both a business and geographic perspective. The Group’s risks and rates of return are predominantly affected by operating in different geographical regions. The Group has businesses in
two
main regions: Latin America ("Latam") and Africa. The Latam figures below include Honduras and Guatemala as if they are fully consolidated by the Group, as this reflects the way management reviews and uses internally reported information to make decisions. Honduras and Guatemala are shown under the Latam segment. The joint venture in Ghana is not reported as if fully consolidated. Revenue, operating profit (loss), EBITDA and other segment information for the years ended
December 31, 2019
,
2018
and
2017
, were as follows:
|
Latin America
|
Africa
|
Unallocated
|
Guatemala and Honduras(vii)
|
Eliminations and
Transfers |
Total
|
|||||||
|
(US$ millions)
|
||||||||||||
|
Year ended December 31, 2019
|
||||||||||||
|
Mobile revenue
|
3,258
|
|
372
|
|
—
|
|
(1,480
|
)
|
—
|
|
2,150
|
|
|
Cable and other fixed services revenue
|
2,197
|
|
9
|
|
—
|
|
(277
|
)
|
—
|
|
1,928
|
|
|
Other revenue
|
60
|
|
1
|
|
—
|
|
(8
|
)
|
—
|
|
52
|
|
|
Service revenue (i)
|
5,514
|
|
382
|
|
—
|
|
(1,766
|
)
|
—
|
|
4,130
|
|
|
Telephone and equipment and other revenue (i)
|
449
|
|
—
|
|
—
|
|
(243
|
)
|
—
|
|
206
|
|
|
Revenue
|
5,964
|
|
382
|
|
—
|
|
(2,009
|
)
|
—
|
|
4,336
|
|
|
Operating profit (loss)
|
1,006
|
|
24
|
|
(94
|
)
|
(540
|
)
|
179
|
|
575
|
|
|
Add back:
|
||||||||||||
|
Depreciation and amortization
|
1,435
|
|
99
|
|
9
|
|
(444
|
)
|
—
|
|
1,100
|
|
|
Share of profit in joint ventures in Guatemala and Honduras
|
—
|
|
—
|
|
—
|
|
—
|
|
(179
|
)
|
(179
|
)
|
|
Other operating income (expenses), net
|
2
|
|
(2
|
)
|
42
|
|
(8
|
)
|
—
|
|
34
|
|
|
EBITDA (ii)
|
2,443
|
|
122
|
|
(43
|
)
|
(992
|
)
|
—
|
|
1,530
|
|
|
EBITDA from discontinued operations
|
—
|
|
(3
|
)
|
—
|
|
—
|
|
—
|
|
(3
|
)
|
|
EBITDA incl discontinued operations
|
2,443
|
|
119
|
|
(43
|
)
|
(992
|
)
|
—
|
|
1,527
|
|
|
Capital expenditure (iii)
|
(1,040
|
)
|
(58
|
)
|
(9
|
)
|
261
|
|
—
|
|
(846
|
)
|
|
Changes in working capital and others (iv)
|
(86
|
)
|
14
|
|
(52
|
)
|
(18
|
)
|
—
|
|
(143
|
)
|
|
Taxes paid
|
(225
|
)
|
(10
|
)
|
(8
|
)
|
129
|
|
—
|
|
(114
|
)
|
|
Operating free cash flow (v)
|
1,093
|
|
64
|
|
(112
|
)
|
(619
|
)
|
—
|
|
425
|
|
|
Total Assets (vi)
|
13,821
|
|
936
|
|
3,715
|
|
(5,465
|
)
|
(151
|
)
|
12,856
|
|
|
Total Liabilities
|
8,374
|
|
909
|
|
3,977
|
|
(2,119
|
)
|
(965
|
)
|
10,176
|
|
F- 44
|
Notes to the Consolidated Financial Statements
For the years ended December 31, 2019, 2018 and 2017 (continued)
|
|
|
Latin America
|
Africa
|
Unallocated
|
Guatemala and Honduras(vii)
|
Eliminations and
Transfers |
Total
|
|||||||
|
(US$ millions)
|
||||||||||||
|
Year ended December 31, 2018 (viii)
|
||||||||||||
|
Mobile revenue
|
3,214
|
|
388
|
|
—
|
|
(1,475
|
)
|
—
|
|
2,126
|
|
|
Cable and other fixed services revenue
|
1,808
|
|
10
|
|
—
|
|
(253
|
)
|
—
|
|
1,565
|
|
|
Other revenue
|
48
|
|
1
|
|
—
|
|
(6
|
)
|
—
|
|
43
|
|
|
Service revenue (i)
|
5,069
|
|
398
|
|
—
|
|
(1,734
|
)
|
—
|
|
3,734
|
|
|
Telephone and equipment revenue (i)
|
415
|
|
—
|
|
—
|
|
(203
|
)
|
—
|
|
212
|
|
|
Revenue
|
5,485
|
|
399
|
|
—
|
|
(1,937
|
)
|
—
|
|
3,946
|
|
|
Operating profit (loss)
|
995
|
|
25
|
|
(47
|
)
|
(488
|
)
|
154
|
|
640
|
|
|
Add back:
|
|
|
|
|
|
|
||||||
|
Depreciation and amortization
|
1,133
|
|
80
|
|
5
|
|
(416
|
)
|
—
|
|
803
|
|
|
Share of profit in joint ventures in Guatemala and Honduras
|
—
|
|
—
|
|
—
|
|
—
|
|
(154
|
)
|
(154
|
)
|
|
Other operating income (expenses), net
|
(51
|
)
|
(3
|
)
|
(2
|
)
|
(19
|
)
|
—
|
|
(75
|
)
|
|
EBITDA (ii)
|
2,077
|
|
102
|
|
(44
|
)
|
(922
|
)
|
—
|
|
1,213
|
|
|
EBITDA from discontinued operations
|
—
|
|
44
|
|
—
|
|
—
|
|
—
|
|
44
|
|
|
EBITDA incl discontinued operations
|
2,077
|
|
146
|
|
(44
|
)
|
(922
|
)
|
—
|
|
1,257
|
|
|
Capital expenditure (iii)
|
(872
|
)
|
(59
|
)
|
(2
|
)
|
225
|
|
—
|
|
(708
|
)
|
|
Changes in working capital and others (iv)
|
(42
|
)
|
28
|
|
13
|
|
(12
|
)
|
—
|
|
(13
|
)
|
|
Taxes paid
|
(264
|
)
|
(24
|
)
|
(6
|
)
|
142
|
|
—
|
|
(153
|
)
|
|
Operating free cash flow (v)
|
899
|
|
91
|
|
(39
|
)
|
(568
|
)
|
—
|
|
383
|
|
|
Total Assets (vi)
|
11,751
|
|
839
|
|
2,752
|
|
(5,219
|
)
|
190
|
|
10,313
|
|
|
Total Liabilities
|
6,127
|
|
905
|
|
2,953
|
|
(1,814
|
)
|
(650
|
)
|
7,521
|
|
F- 45
|
Notes to the Consolidated Financial Statements
For the years ended December 31, 2019, 2018 and 2017 (continued)
|
|
|
Latin America
|
Africa
|
Unallocated
|
Guatemala and Honduras(vii)
|
Eliminations and
Transfers |
Total
|
|||||||
|
(US$ millions)
|
||||||||||||
|
Year ended December 31, 2017 (viii)
|
||||||||||||
|
Mobile revenue
|
3,283
|
|
374
|
|
—
|
|
(1,510
|
)
|
—
|
|
2,147
|
|
|
Cable and other fixed services revenue
|
1,755
|
|
9
|
|
—
|
|
(213
|
)
|
—
|
|
1,551
|
|
|
Other revenue
|
40
|
|
2
|
|
—
|
|
(4
|
)
|
—
|
|
38
|
|
|
Service revenue (i)
|
5,078
|
|
385
|
|
—
|
|
(1,727
|
)
|
—
|
|
3,737
|
|
|
Telephone and equipment revenue (i)
|
363
|
|
1
|
|
—
|
|
(165
|
)
|
—
|
|
199
|
|
|
Total Revenue
|
5,441
|
|
386
|
|
—
|
|
(1,892
|
)
|
—
|
|
3,936
|
|
|
Operating profit (loss)
|
899
|
|
28
|
|
(5
|
)
|
(431
|
)
|
140
|
|
632
|
|
|
Add back:
|
||||||||||||
|
Depreciation and amortization
|
1,174
|
|
81
|
|
6
|
|
(450
|
)
|
—
|
|
812
|
|
|
Share of profit in joint ventures in Guatemala and Honduras
|
—
|
|
—
|
|
—
|
|
—
|
|
(140
|
)
|
(140
|
)
|
|
Other operating income (expenses), net
|
(49
|
)
|
(11
|
)
|
10
|
|
(18
|
)
|
—
|
|
(69
|
)
|
|
EBITDA (ii)
|
2,024
|
|
97
|
|
12
|
|
(898
|
)
|
—
|
|
1,236
|
|
|
EBITDA from discontinued operations
|
—
|
|
115
|
|
—
|
|
—
|
|
—
|
|
115
|
|
|
EBITDA incl discontinued operations
|
2,024
|
|
212
|
|
12
|
|
(898
|
)
|
—
|
|
1,351
|
|
|
Capital expenditure (iii)
|
(855
|
)
|
(99
|
)
|
(1
|
)
|
237
|
|
—
|
|
(718
|
)
|
|
Changes in working capital and others (iv)
|
(53
|
)
|
(6
|
)
|
(10
|
)
|
27
|
|
—
|
|
(43
|
)
|
|
Taxes paid
|
(239
|
)
|
(18
|
)
|
1
|
|
124
|
|
—
|
|
(132
|
)
|
|
Operating free cash flow (v)
|
877
|
|
89
|
|
2
|
|
(511
|
)
|
1
|
|
459
|
|
|
Total Assets (vi)
|
10,411
|
|
1,482
|
|
598
|
|
(5,420
|
)
|
2,393
|
|
9,464
|
|
|
Total Liabilities
|
5,484
|
|
1,673
|
|
1,465
|
|
(1,961
|
)
|
(478
|
)
|
6,183
|
|
|
(i)
|
Service revenue is Group revenue related to the provision of ongoing services such as monthly subscription fees, airtime and data usage fees, interconnection fees, roaming fees, mobile finance service commissions and fees from other telecommunications services such as data services, SMS and other value-added services excluding telephone and equipment sales. Revenues from other sources comprises rental, sub-lease rental income and other non recurring revenues. The Group derives revenue from the transfer of goods and services over time and at a point in time. Refer to the table below.
|
|
(ii)
|
EBITDA is operating profit excluding impairment losses, depreciation and amortization and gains/losses on the disposal of fixed assets. EBITDA is used by the management to monitor the segmental performance and for capital management.
For the year ended
December 31, 2019
, the application of IFRS 16 had a positive impact on EBITDA as compared to what our results would have been if we had continued to follow the IAS 17 standard
.
|
|
(iii)
|
Cash spent for capex excluding spectrum and licenses of
$59 million
(
2018
:
$61 million
;
2017
:
$53 million
) and cash received on tower deals of
$22 million
(
2018
:
$141 million
;
2017
:
$161 million
).
|
|
(iv)
|
Changes in working capital and others include changes in working capital as stated in the cash flow statement, as well as share-based payments expense and non-cash bonuses.
|
|
(v)
|
Operating Free Cash Flow is EBITDA less cash capex (excluding spectrum and license costs) less change in working capital, other non-cash items (share-based payment expense and non-cash bonuses) and taxes paid.
|
|
(vi)
|
Segment assets include goodwill and other intangible assets.
|
|
(vii)
|
Including eliminations for Guatemala and Honduras as reported in the Latam segment.
|
|
(viii)
|
Restated as a result of classification of certain of our African operations as discontinued operations (see notes
A.4.
and
E.4.
).
|
F- 46
|
Notes to the Consolidated Financial Statements
For the years ended December 31, 2019, 2018 and 2017 (continued)
|
|
Revenue from contracts with customers from continuing operations:
|
Twelve months ended December 31, 2019
|
Twelve months ended December 31, 2018
|
||||||||||||
|
$ millions
|
Timing of revenue recognition
|
Latin America
|
Africa
|
Total Group
|
Latin America
|
Africa
|
Total Group
|
||||||
|
Mobile
|
Over time
|
1,747
|
|
261
|
|
2,007
|
|
1,701
|
|
280
|
|
1,981
|
|
|
Mobile Financial Services
|
Point in time
|
31
|
|
112
|
|
143
|
|
37
|
|
108
|
|
145
|
|
|
Cable and other fixed services
|
Over time
|
1,919
|
|
9
|
|
1,928
|
|
1,556
|
|
10
|
|
1,565
|
|
|
Other
|
Over time
|
51
|
|
1
|
|
52
|
|
42
|
|
1
|
|
43
|
|
|
Service Revenue
|
|
3,748
|
|
382
|
|
4,130
|
|
3,336
|
|
398
|
|
3,734
|
|
|
Telephone and equipment
|
Point in time
|
206
|
|
—
|
|
206
|
|
212
|
|
—
|
|
212
|
|
|
Revenue from contracts with customers
|
3,954
|
|
382
|
|
4,336
|
|
3,548
|
|
399
|
|
3,946
|
|
|
B.4. People
Number of permanent employees
|
2019
|
2018
|
2017
|
||||
|
Continuing operations(i)
|
17,687
|
|
16,725
|
|
14,134
|
|
|
Joint ventures (Guatemala, Honduras and Ghana)
|
4,688
|
|
4,416
|
|
4,326
|
|
|
Discontinued operations
|
—
|
|
262
|
|
667
|
|
|
Total
|
22,375
|
|
21,403
|
|
19,127
|
|
|
(i)
|
Emtelco headcount are excluded from this disclosure and any internal reporting because their costs are classified as direct costs and not employee related costs.
|
|
Notes
|
2019
|
2018
|
2017
|
||||
|
(US$ millions)
|
|||||||
|
Wages and salaries
|
(358
|
)
|
(346
|
)
|
(308
|
)
|
|
|
Social security
|
(68
|
)
|
(60
|
)
|
(56
|
)
|
|
|
Share based compensation
|
B.4.1.
|
(27
|
)
|
(21
|
)
|
(22
|
)
|
|
Pension and other long-term benefit costs
|
B.4.2.
|
(4
|
)
|
(7
|
)
|
(8
|
)
|
|
Other employees related costs
|
(39
|
)
|
(67
|
)
|
(41
|
)
|
|
|
Total
|
(496
|
)
|
(500
|
)
|
(434
|
)
|
|
B.4.1. Share-based compensation
Millicom shares granted to management and key employees includes share-based compensation in the form of long-term share incentive plans. Since 2016, Millicom has
two
types of annual plans, a performance share plan and a deferred share plan. The different plans are further detailed below.
F- 47
|
Notes to the Consolidated Financial Statements
For the years ended December 31, 2019, 2018 and 2017 (continued)
|
|
Cost of share based compensation
|
2019
|
2018
|
2017
|
||||
|
(US$ millions)
|
||||||
|
2016 incentive plans
|
—
|
|
(4
|
)
|
(6
|
)
|
|
2017 incentive plans
|
(7
|
)
|
(8
|
)
|
(12
|
)
|
|
2018 incentive plans
|
(8
|
)
|
(11
|
)
|
—
|
|
|
2019 incentive plans
|
(14
|
)
|
—
|
|
—
|
|
|
Total share based compensation
|
(27
|
)
|
(21
|
)
|
(22
|
)
|
Deferred share plan (unchanged since 2014, except for vesting schedule)
Until 2018 deferred awards plan, participants were granted shares based on past performance, with
16.5%
of the shares vesting on January 1 of each of year one and two, and the remaining
67%
on 1 January of year
three
. Beginning with the 2019 plan, while all other guidelines remain the same, shares vest with
30%
on January 1 of each of year one and two, and the remaining
40%
on 1 January of year
three
. Vesting is conditional upon the participant remaining employed with Millicom at each vesting date. The cost of this long-term incentive plan, which is not conditional on performance conditions, is calculated as follows:
Fair value (share price) of Millicom’s shares at grant date x number of shares expected to vest.
Performance share plan (issued in 2015)
Under this plan, shares granted did vest in full in
2019
, subject to performance conditions,
62.5%
based on Absolute Total Shareholder Return (TSR) and
37.5%
based on actual vs budgeted EBITDA minus CAPEX minus Change in Working Capital (Free Cash Flow). As the TSR measure is a market condition, the fair value of the shares in the performance share plan requires consideration of potential adjustments for future market-based conditions at grant date.
For this, a specific valuation had been performed at grant date based on the probability of the TSR conditions being met (and to which extent) and the expected payout based upon leaving conditions.
The Free Cash Flows (FCF) condition is a non-market measure which had been considered together with the leaving estimate and based initially on a
100%
fulfillment expectation. The reference share price for 2015 performance share plan is the same share price as the share price for the deferred share plan.
Performance share plan (for plans issued in 2016 and 2017)
Shares granted under this performance share plan vest at the end of the
three
-year period, subject to performance conditions,
25%
based on Positive Absolute Total Shareholder Return (Absolute TSR),
25%
based on Relative Total Shareholder Return (Relative TSR) and
50%
based on budgeted Earnings Before Interest Tax Depreciation and Amortization (EBITDA) minus Capital Expenditure (Capex) minus Change in Working Capital (CWC) (Free Cash Flow).
As the TSRs measures are market conditions, the fair value of the shares in the performance share plan requires consideration of potential adjustments for future market-based conditions at grant date.
For this, a specific valuation had been performed at grant date based on the probability of the TSR conditions being met (and to which extent) and the expected payout based upon leaving conditions.
The Free Cash Flows (FCF) condition is a non-market measure which had been considered together with the leaving estimate and based initially on a
100%
fulfillment expectation. The reference share price for this condition is the same share price as the share price for the deferred share plan above.
Performance share plan (for plans issued from 2018)
Shares granted under this performance share plan vest at the end of the
three
-year period, subject to performance conditions,
25%
based on Relative Total Shareholder Return (“Relative TSR”),
25%
based on the achievement of the Service Revenue target measured on a 3-year CAGRs from year one to year three of the plan (“Service Revenue”) and
50%
based on the achievement of the Operating Free Cash Flow (“Operating Free Cash Flow”) target measured on a 3-year CAGRs from year one to year three of the plan.
For the performance share plans, and in order to calculate the fair value of the TSR portion of those plans, it is necessary to make a number of assumptions which are set out below. The assumptions have been set based on an analysis of historical data as at grant date.
F- 48
|
Notes to the Consolidated Financial Statements
For the years ended December 31, 2019, 2018 and 2017 (continued)
|
|
Assumptions and fair value of the shares under the TSR portion(s)
|
Risk-free
rate % |
Dividend yield %
|
Share price volatility(i) %
|
Award term (years)
|
Share fair value (in US$)
|
||||
|
Performance share plan 2019 (Relative TSR)
|
(0.24
|
)
|
3.01
|
26.58
|
2.93
|
|
49.79
|
|
|
Performance share plan 2018 (Relative TSR)
|
(0.39
|
)
|
3.21
|
30.27
|
2.93
|
|
57.70
|
|
|
Performance share plan 2017 (Relative TSR)
|
(0.40
|
)
|
3.80
|
22.50
|
2.92
|
|
27.06
|
|
|
Performance share plan 2017 (Absolute TSR)
|
(0.40
|
)
|
3.80
|
22.50
|
2.92
|
|
29.16
|
|
|
Performance share plan 2016 (Relative TSR)
|
(0.65
|
)
|
3.49
|
30.00
|
2.61
|
|
43.35
|
|
|
Performance share plan 2016 (Absolute TSR)
|
(0.65
|
)
|
3.49
|
30.00
|
2.61
|
|
45.94
|
|
|
Performance share plan 2015 (Absolute TSR)
|
(0.32
|
)
|
2.78
|
23.00
|
2.57
|
|
32.87
|
|
|
Executive share plan 2015 – Component A
|
(0.32
|
)
|
N/A
|
23.00
|
2.57
|
|
53.74
|
|
|
Executive share plan 2015 – Component B
|
(0.32
|
)
|
N/A
|
23.00
|
2.57
|
|
29.53
|
|
|
(i)
|
Historical volatility retained was determined on the basis of a three-year historic average.
|
The cost of the long-term incentive plans which are conditional on market conditions is calculated as follows:
Fair value (market value) of shares at grant date (as calculated above) x number of shares expected to vest.
The cost of these plans is recognized, together with a corresponding increase in equity (share compensation reserve), over the period in which the performance and/or employment conditions are fulfilled, ending on the date on which the relevant employees become fully entitled to the award. Adjustments are made to the expense recorded for forfeitures, mainly due to management and employees leaving Millicom. Non-market performance conditions are not taken into account when determining the grant date fair value of awards, but the likelihood of the conditions being met is assessed as part of the Group’s best estimate of the number of equity instruments that will ultimately vest.
No expense is recognized for awards that do not ultimately vest, except for awards where vesting is conditional upon a market condition. These are treated as vested, regardless of whether or not the market conditions
are
satisfied, provided that all other performance conditions are satisfied. Where the terms of an equity-settled award are modified, as a minimum an expense is recognized as if the terms had not been modified. In addition, an expense is recognized for any modification that increases the total fair value of the share based payment arrangement, or is otherwise beneficial to the employee as measured at the date of modification.
Plan awards and shares expected to vest
|
2019 plans
|
2018 plans
|
2017 plans
|
2016 plans
|
|||||||||||||
|
Performance plan
|
Deferred plan
|
Performance plan
|
Deferred plan
|
Performance plan
|
Deferred plan
|
Performance plan
|
Deferred plan
|
|||||||||
|
(number of shares)
|
||||||||||||||||
|
Initial shares granted
|
257,601
|
|
320,840
|
|
237,196
|
|
262,317
|
|
279,807
|
|
438,505
|
|
200,617
|
|
287,316
|
|
|
Additional shares granted(i)
|
—
|
|
20,131
|
|
—
|
|
3,290
|
|
2,868
|
|
29,406
|
|
—
|
|
—
|
|
|
Revision for forfeitures
|
(17,182
|
)
|
(9,198
|
)
|
(27,494
|
)
|
(26,860
|
)
|
(40,946
|
)
|
(88,437
|
)
|
(49,164
|
)
|
(78,253
|
)
|
|
Revision for cancellations
|
—
|
|
—
|
|
(4,728
|
)
|
—
|
|
—
|
|
—
|
|
—
|
|
—
|
|
|
Total before issuances
|
240,419
|
|
331,773
|
|
204,974
|
|
238,747
|
|
241,729
|
|
379,474
|
|
151,453
|
|
209,063
|
|
|
Shares issued in 2017
|
—
|
|
—
|
|
—
|
|
—
|
|
—
|
|
(2,686
|
)
|
(1,214
|
)
|
(1,733
|
)
|
|
Shares issued in 2018
|
—
|
|
—
|
|
(97
|
)
|
(18,747
|
)
|
(2,724
|
)
|
(99,399
|
)
|
(752
|
)
|
(43,579
|
)
|
|
Shares issued in 2019
|
(150
|
)
|
(24,294
|
)
|
(3,109
|
)
|
(54,971
|
)
|
(19,143
|
)
|
(82,486
|
)
|
(149,487
|
)
|
(163,751
|
)
|
|
Shares still expected to vest
|
240,269
|
|
307,479
|
|
201,768
|
|
165,029
|
|
219,862
|
|
194,903
|
|
—
|
|
—
|
|
|
Estimated cost over the vesting period (US$ millions)
|
11
|
|
18
|
|
12
|
|
14
|
|
10
|
|
20
|
|
8
|
|
12
|
|
|
(i)
|
Additional shares granted represent grants made for new joiners and/or as per CEO contractual arrangements.
|
F- 49
|
Notes to the Consolidated Financial Statements
For the years ended December 31, 2019, 2018 and 2017 (continued)
|
|
B.4.2. Pension and other long-term employee benefit plans
Pension plans
The pension plans apply to employees who meet certain criteria (including years of service, age and participation in collective agreements).
Pension and other similar employee related obligations can result from either defined contribution plans or defined benefit plans. A defined contribution plan is a pension plan under which the Group pays fixed contributions into a separate entity. No further payment obligations exist once the contributions have been paid. The contributions are recognized as employee benefit expenses when they are due. Prepaid contributions are recognized as assets to the extent that a cash refund or a reduction in future payments is available.
Defined benefit pension plans define an amount of pension benefit that an employee will receive on retirement, usually dependent on one or more factors such as age, years of service and compensation. The liability recognized in the statement of financial position in respect of the defined benefit pension plan is the present value of the defined benefit obligation at the statement of financial position date less the fair value of plan assets, together with adjustments for unrecognized actuarial gains or losses and past service costs. The defined benefit obligation is calculated annually by independent actuaries. The present value of the defined benefit obligation is determined by discounting the estimated future cash outflows, using an appropriate discount rate based on maturities of the related pension liability.
Re-measurement of net defined benefit liabilities are recognized in other comprehensive income and not reclassified to the statement of income in subsequent years.
Past service costs are recognized in the statement of income on the earlier of the date of the plan amendment or curtailment, and the date that the Group recognizes related restructuring costs.
Net interest is calculated by applying the discount rate to the net defined benefit asset/liability.
Long-service plans
Long-service plans apply for Colombian subsidiary UNE employees with more than
five years
of service whereby additional bonuses are paid to employees that reach each incremental length of service milestone (from
five
to
40 years
).
Termination plans
In addition, UNE has a number of employee defined benefit plans. The level of benefits provided under the plans depends on collective employment agreements and Colombian labor regulations. There are no defined assets related to the plans, and UNE make payments to settle obligations under the plans out of available cash balances.
At
December 31, 2019
, the defined benefit obligation liability amounted to
$59 million
(
2018
:
$60 million
) and payments expected in the plans in future years totals
$106 million
(
2018
:
$111 million
). The average duration of the defined benefit obligation at
December 31, 2019
is
6
years (
2018
:
7
years). The termination plans apply to employees that joined UNE prior to December 30, 1996. The level of payments depends on the number of years in which the employee has worked before retirement or termination of their contract with UNE.
Except for the UNE pension plan described above, there are no other significant defined benefits plans in the Group.
B.4.3. Directors and executive management
The remuneration of the members of the Board of Directors comprises an annual fee and shares. Director remuneration is proposed by the Nomination Committee and approved by the shareholders at their Annual General Meeting (AGM).
Remuneration charge for the Board (gross of withholding tax)
|
2019
|
2018
|
2017
|
||||
|
(US$ ’000)
|
||||||
|
Chairperson
|
366
|
|
169
|
|
233
|
|
|
Other members of the Board
|
1,557
|
|
774
|
|
889
|
|
|
Total (i)
|
1,923
|
|
943
|
|
1,122
|
|
|
(i)
|
Cash compensation converted from SEK to USD at exchange rates on payment dates for 2017 and 2018, in 2019 cash compensation was denominated in USD. Share based compensation based on the market value of Millicom shares on the corresponding AGM date (
2019
: in total
19,483
shares;
2018
: in total
6,591
shares;
2017
: in total
8,731
shares). Net remuneration comprised
73%
in shares and
27%
in cash (SEK) (
2018
:
51%
in shares and
49%
in cash;
2017
:
52%
in shares and
48%
in cash).
|
F- 50
|
Notes to the Consolidated Financial Statements
For the years ended December 31, 2019, 2018 and 2017 (continued)
|
|
Shares beneficially owned by the Directors
|
2019
|
2018
|
|||
|
(number of shares)
|
||||
|
Chairperson
|
5,814
|
|
8,554
|
|
|
Other members of the Board
|
32,279
|
|
15,333
|
|
|
Total (i)
|
38,093
|
|
23,887
|
|
The remuneration of executive management of Millicom comprises an annual base salary, an annual bonus, share based compensation, social security contributions, pension contributions and other benefits. Bonus and share based compensation plans (see note
B.4.1.
) are based on actual and future performance. Share based compensation is granted once a year by the Compensation Committee of the Board.
If the employment of Millicom’s senior executives is terminated, severance of up to 12 months’ salary is potentially payable.
The annual base salary and other benefits of the Chief Executive Officer (CEO) and the Executive Vice Presidents (Executive team) are proposed by the Compensation Committee and approved by the Board.
Remuneration charge for the Executive Team
|
CEO
|
CFO
|
Executive Team (8 members)(iii)
|
||||
|
(US$ ’000)
|
||||||
|
2019
|
||||||
|
Base salary
|
1,167
|
|
654
|
|
3,498
|
|
|
Bonus
|
1,428
|
|
626
|
|
2,098
|
|
|
Pension
|
279
|
|
98
|
|
798
|
|
|
Other benefits
|
50
|
|
260
|
|
1,521
|
|
|
Termination benefits
|
—
|
|
—
|
|
863
|
|
|
Total before share based compensation
|
2,924
|
|
1,639
|
|
8,779
|
|
|
Share based compensation(i)(ii) in respect of 2019 LTIP
|
5,625
|
|
1,576
|
|
5,965
|
|
|
Total
|
8,549
|
|
3,215
|
|
14,743
|
|
Remuneration charge for the Executive Team
|
CEO
|
CFO
|
Executive Team (9 members)
|
||||
|
(US$ ’000)
|
||||||
|
2018
|
||||||
|
Base salary
|
1,112
|
|
673
|
|
3,930
|
|
|
Bonus
|
1,492
|
|
557
|
|
2,445
|
|
|
Pension
|
247
|
|
101
|
|
962
|
|
|
Other benefits
|
66
|
|
63
|
|
805
|
|
|
Termination benefits
|
—
|
|
—
|
|
301
|
|
|
Total before share based compensation
|
2,918
|
|
1,393
|
|
8,444
|
|
|
Share based compensation(i)(ii) in respect of 2018 LTIP
|
5,027
|
|
1,567
|
|
4,957
|
|
|
Total
|
7,945
|
|
2,960
|
|
13,401
|
|
F- 51
|
Notes to the Consolidated Financial Statements
For the years ended December 31, 2019, 2018 and 2017 (continued)
|
|
Remuneration charge for the Executive team
|
CEO
|
CFO
|
Executive team
(9 members) |
||||
|
(US$ ’000)
|
||||||
|
2017
|
||||||
|
Base salary
|
1,000
|
|
648
|
|
3,822
|
|
|
Bonus
|
707
|
|
455
|
|
1,590
|
|
|
Pension
|
150
|
|
97
|
|
628.5
|
|
|
Other benefits
|
64
|
|
15
|
|
1,192.5
|
|
|
Total before share based compensation
|
1,921
|
|
1,215
|
|
7,233
|
|
|
Share based compensation(i)(ii) in respect of 2017 LTIP
|
2,783
|
|
1,492
|
|
5,202
|
|
|
Total
|
4,704
|
|
2,707
|
|
12,435
|
|
|
(i)
|
See note B.4.1.
|
|
(ii)
|
Share awards of
102,122
and
135,480
were granted in
2019
under the 2019 LTIPs to the CEO, and Executive Team (
2018
:
80,264
and
112,472
, respectively;
2017
:
61,724
and
167,371
, respectively).
|
|
(iii)
|
Other Executives’ compensation includes Daniel Loria, former CHRO and Rodrigo Diehl, EVP Strategy.
|
Share ownership and unvested share awards granted from Company equity plans to the Executive team
|
CEO
|
Executive team
|
Total
|
||||
|
(number of shares)
|
||||||
|
2019
|
||||||
|
Share ownership (vested from equity plans and otherwise acquired)
|
190,577
|
|
136,306
|
|
326,883
|
|
|
Share awards not vested
|
236,211
|
|
334,193
|
|
570,404
|
|
|
2018
|
||||||
|
Share ownership (vested from equity plans and otherwise acquired)
|
122,310
|
|
84,782
|
|
207,092
|
|
|
Share awards not vested
|
172,485
|
|
339,726
|
|
512,211
|
|
B.5. Other non-operating (expenses) income, net
Non-operating items mainly comprise changes in fair value of derivatives and the impact of foreign exchange fluctuations on the results of the Group.
|
Year ended December 31,
|
||||||
|
2019
|
2018
|
2017
|
||||
|
(US$ millions)
|
||||||
|
Change in fair value of derivatives (see note C.7.2.)
|
—
|
|
(1
|
)
|
(22
|
)
|
|
Change in fair value in investment in Jumia (C.7.3.)
|
(38
|
)
|
—
|
|
—
|
|
|
Change in fair value in investment in HT (C.7.3.)
|
312
|
|
—
|
|
—
|
|
|
Change in value of put option liability (C.7.4.)
|
(25
|
)
|
—
|
|
—
|
|
|
Exchange gains (losses), net
|
(32
|
)
|
(40
|
)
|
21
|
|
|
Other non-operating income (expenses), net
|
10
|
|
2
|
|
—
|
|
|
Total
|
227
|
|
(39
|
)
|
(2
|
)
|
Foreign exchange gains and losses
Transactions denominated in a currency other than the functional currency are translated into the functional currency using exchange rates prevailing at the transaction dates. Foreign exchange gains and losses resulting from the settlement of such transactions, and on translation of monetary assets and liabilities denominated in currencies other than the functional currency at
F- 52
|
Notes to the Consolidated Financial Statements
For the years ended December 31, 2019, 2018 and 2017 (continued)
|
|
year-end exchange rates, are recognized in the consolidated statement of income, except when deferred in equity as qualifying cash flow hedges.
B.6. Taxation
B.6.1. Income tax expense
Tax mainly comprises income taxes of subsidiaries and withholding taxes on intragroup dividends and royalties for use of Millicom trademarks and brands. Millicom operations are in jurisdictions with income tax rates of
10% to 35%
levied on either revenue or profit before income tax (
2018
:
10% to 37%
;
2017
:
10% to 40%
). Income tax relating to items recognized directly in equity is recognized in equity and not in the consolidated statement of income.
Income tax charge
|
2019
|
2018
|
2017
|
||||
|
(US$ millions)
|
||||||
|
Income tax (charge) credit
|
||||||
|
Withholding tax
|
(56
|
)
|
(64
|
)
|
(74
|
)
|
|
Other income tax relating to the current year
|
(88
|
)
|
(82
|
)
|
(81
|
)
|
|
Adjustments in respect of prior years
|
(7
|
)
|
1
|
|
(21
|
)
|
|
Total
|
(151
|
)
|
(145
|
)
|
(176
|
)
|
|
Deferred tax (charge) credit
|
||||||
|
Origination and reversal of temporary differences
|
58
|
|
32
|
|
15
|
|
|
Effect of change in tax rates
|
(8
|
)
|
(10
|
)
|
19
|
|
|
Tax income (expense) before valuation allowances
|
50
|
|
22
|
|
34
|
|
|
Effect of valuation allowances
|
(9
|
)
|
(8
|
)
|
(28
|
)
|
|
Total
|
41
|
|
14
|
|
6
|
|
|
Adjustments in respect of prior years
|
(10
|
)
|
19
|
|
8
|
|
|
31
|
|
33
|
|
14
|
|
|
|
Tax (charge) credit on continuing operations
|
(120
|
)
|
(112
|
)
|
(162
|
)
|
|
Tax (charge) credit on discontinuing operations
|
(2
|
)
|
(4
|
)
|
4
|
|
|
Total tax (charge) credit
|
(122
|
)
|
(116
|
)
|
(158
|
)
|
F- 53
|
Notes to the Consolidated Financial Statements
For the years ended December 31, 2019, 2018 and 2017 (continued)
|
|
Reconciliation between the tax expense and tax at the weighted average statutory tax rate is as follows:
Income tax calculation
|
2019
|
2018
|
2017
|
||||||||||||||||
|
Continuing operations
|
Discontinued operations
|
Total
|
Continuing operations
|
Discontinued operations
|
Total
|
Continuing operations
|
Discontinued operations
|
Total
|
||||||||||
|
(US$ millions)
|
||||||||||||||||||
|
Profit before tax
|
218
|
|
59
|
|
277
|
|
119
|
|
(29
|
)
|
90
|
|
171
|
|
56
|
|
227
|
|
|
Tax at the weighted average statutory rate
|
(37
|
)
|
(11
|
)
|
(48
|
)
|
(1
|
)
|
—
|
|
(1
|
)
|
(10
|
)
|
(12
|
)
|
(22
|
)
|
|
Effect of:
|
||||||||||||||||||
|
Items taxed at a different rate
|
(1
|
)
|
—
|
|
(1
|
)
|
7
|
|
—
|
|
7
|
|
(11
|
)
|
—
|
|
(11
|
)
|
|
Change in tax rates on deferred tax balances
|
(8
|
)
|
—
|
|
(8
|
)
|
(10
|
)
|
—
|
|
(10
|
)
|
19
|
|
—
|
|
19
|
|
|
Expenditure not deductible and income not taxable
|
(37
|
)
|
9
|
|
(28
|
)
|
(59
|
)
|
(2
|
)
|
(61
|
)
|
(64
|
)
|
5
|
|
(59
|
)
|
|
Unrelieved withholding tax
|
(56
|
)
|
—
|
|
(56
|
)
|
(64
|
)
|
—
|
|
(64
|
)
|
(73
|
)
|
—
|
|
(73
|
)
|
|
Accounting for associates and joint ventures
|
36
|
|
—
|
|
36
|
|
5
|
|
—
|
|
5
|
|
17
|
|
—
|
|
17
|
|
|
Movement in deferred tax on unremitted earnings
|
9
|
|
—
|
|
9
|
|
(2
|
)
|
—
|
|
(2
|
)
|
1
|
|
—
|
|
1
|
|
|
Unrecognized deferred tax assets
|
(20
|
)
|
—
|
|
(20
|
)
|
(8
|
)
|
(2
|
)
|
(10
|
)
|
(29
|
)
|
(12
|
)
|
(41
|
)
|
|
Recognition of previously unrecognized deferred tax assets
|
11
|
|
—
|
|
11
|
|
—
|
|
—
|
|
—
|
|
1
|
|
13
|
|
14
|
|
|
Adjustments in respect of prior years
|
(17
|
)
|
—
|
|
(17
|
)
|
20
|
|
—
|
|
20
|
|
(13
|
)
|
10
|
|
(3
|
)
|
|
Total tax (charge) credit
|
(120
|
)
|
(2
|
)
|
(122
|
)
|
(112
|
)
|
(4
|
)
|
(116
|
)
|
(162
|
)
|
4
|
|
(158
|
)
|
|
Weighted average statutory tax rate
|
17.0
|
%
|
17.3
|
%
|
0.8
|
%
|
1.1
|
%
|
5.8
|
%
|
9.7
|
%
|
||||||
|
Effective tax rate
|
55.0
|
%
|
44.0
|
%
|
94.1
|
%
|
128.9
|
%
|
94.7
|
%
|
69.6
|
%
|
||||||
B.6.2. Current tax assets and liabilities
Current tax assets and liabilities for current and prior periods are measured at the amount expected to be recovered from or paid to the taxation authorities. The tax rate and tax laws used to compute the amount are those enacted or substantively enacted by the statement of financial position date.
B.6.3. Deferred tax
Deferred tax is calculated using the liability method on temporary differences at the statement of financial position date between the tax base of assets and liabilities and their carrying amount for financial reporting purposes.
Deferred tax liabilities are recognized for all taxable temporary differences, except where the deferred tax liability arises from the initial recognition of goodwill or of an asset or liability in a transaction that is not a business combination and, at the time of the transaction, affects neither accounting, nor taxable profit or loss.
Deferred tax assets are recognized for all temporary differences including unused tax credits and tax losses, to the extent that it is probable that taxable profit will be available against which the deductible temporary differences can be utilized, except where the deferred tax assets relate to deductible temporary differences from initial recognition of an asset or liability in a transaction that
F- 54
|
Notes to the Consolidated Financial Statements
For the years ended December 31, 2019, 2018 and 2017 (continued)
|
|
is not a business combination, and, at the time of the transaction, affects neither accounting, nor taxable profit or loss. It is probable that taxable profit will be available when there are sufficient taxable temporary differences relating to the same tax authority and the same taxable entity which are expected to reverse in the same period as the expected reversal of the deductible temporary difference.
The carrying amount of deferred tax assets is reviewed at each statement of financial position date and reduced to the extent that it is no longer probable that sufficient taxable profit will be available to utilize them. Unrecognized deferred tax assets are reassessed at each statement of financial position date and are recognized to the extent it is probable that future taxable profit will enable the asset to be recovered.
Deferred tax assets and liabilities are measured at the tax rate expected to apply in the year when the assets are realized or liabilities settled, based on tax rates and tax laws that have been enacted or substantively enacted at the statement of financial position date. Deferred tax assets and deferred tax liabilities are offset where legally enforceable set off rights exist and the deferred taxes relate to the same taxable entity and the same taxation authority.
Deferred tax
|
Fixed assets
|
Unused tax losses
|
Unremitted earnings
|
Other
|
Offset
|
Total
|
|||||||
|
(US$ millions)
|
||||||||||||
|
Balance at December 31, 2017
|
32
|
|
52
|
|
(32
|
)
|
72
|
|
—
|
|
124
|
|
|
(Charge)/credit to income statement
|
(18
|
)
|
(3
|
)
|
(2
|
)
|
56
|
|
—
|
|
33
|
|
|
Change in scope
|
(192
|
)
|
—
|
|
—
|
|
8
|
|
—
|
|
(184
|
)
|
|
Accounting policy changes
|
—
|
|
—
|
|
—
|
|
4
|
|
—
|
|
4
|
|
|
Exchange differences
|
—
|
|
(5
|
)
|
—
|
|
(6
|
)
|
—
|
|
(11
|
)
|
|
Balance at December 31, 2018
|
(178
|
)
|
44
|
|
(34
|
)
|
134
|
|
—
|
|
(34
|
)
|
|
Deferred tax assets
|
76
|
|
44
|
|
—
|
|
134
|
|
(52
|
)
|
202
|
|
|
Deferred tax liabilities
|
(254
|
)
|
—
|
|
(34
|
)
|
—
|
|
52
|
|
(236
|
)
|
|
Balance at December 31, 2018
|
(178
|
)
|
44
|
|
(34
|
)
|
134
|
|
—
|
|
(34
|
)
|
|
(Charge)/credit to income statement
|
41
|
|
(15
|
)
|
8
|
|
(3
|
)
|
—
|
|
31
|
|
|
Change in scope
|
(82
|
)
|
5
|
|
—
|
|
4
|
|
—
|
|
(73
|
)
|
|
Transfers to assets held for sale
|
—
|
|
—
|
|
—
|
|
(3
|
)
|
—
|
|
(3
|
)
|
|
Exchange differences
|
2
|
|
—
|
|
—
|
|
(2
|
)
|
—
|
|
—
|
|
|
Balance at December 31, 2019
|
(217
|
)
|
34
|
|
(26
|
)
|
130
|
|
—
|
|
(79
|
)
|
|
Deferred tax assets
|
84
|
|
34
|
|
—
|
|
134
|
|
(52
|
)
|
200
|
|
|
Deferred tax liabilities
|
(301
|
)
|
—
|
|
(26
|
)
|
(4
|
)
|
52
|
|
(279
|
)
|
|
Balance at December 31, 2019
|
(217
|
)
|
34
|
|
(26
|
)
|
130
|
|
—
|
|
(79
|
)
|
Deferred tax assets have not been recognized in respect of the following deductible temporary differences:
|
Fixed assets
|
Unused tax losses
|
Other
|
Total
|
|||||
|
(US$ millions)
|
||||||||
|
At December 31, 2019
|
92
|
|
4,705
|
|
126
|
|
4,923
|
|
|
At December 31, 2018
|
92
|
|
4,886
|
|
134
|
|
5,112
|
|
F- 55
|
Notes to the Consolidated Financial Statements
For the years ended December 31, 2019, 2018 and 2017 (continued)
|
|
Unrecognized tax losses carryforward related to continuing operations expire as follows:
|
2019
|
2018
|
2017
|
||||
|
(US$ millions)
|
||||||
|
Expiry:
|
||||||
|
Within one year
|
1
|
|
0
|
|
39
|
|
|
Within one to five years
|
2
|
|
3
|
|
494
|
|
|
After five years
|
493
|
|
493
|
|
—
|
|
|
No expiry
|
4,209
|
|
4,390
|
|
4,311
|
|
|
Total
|
4,705
|
|
4,886
|
|
4,844
|
|
With effect from 2017, Luxembourg tax losses incurred may be carried forward for a maximum of 17 years. Losses incurred before 2017 may be carried forward without limitation of time.
At
December 31, 2019
, Millicom had
$697 million
of unremitted earnings of Millicom operating subsidiaries for which
no
deferred tax liabilities were recognized (
2018
:
$584 million
;
2017
:
$842 million
). Except for intragroup dividends to be paid out of
2019
profits in
2020
for which deferred tax of
$26 million
(
2018
:
$34 million
;
2017
$32 million
) has been provided, it is anticipated that intragroup dividends paid in future periods will be made out of profits of future periods.
B.7. Earnings per share
Basic earnings (loss) per share are calculated by dividing net profit for the year attributable to equity holders of the Company by the weighted average number of ordinary shares outstanding during the year.
Diluted earnings (loss) per share are calculated by dividing the net profit for the year attributable to equity holders of the Company by the weighted average number of ordinary shares outstanding during the year, plus the weighted average number of dilutive potential shares.
Net profit/(loss) used in the earnings (loss) per share computation
|
2019
|
2018
|
2017
|
||||
|
(US$ millions)
|
||||||
|
Basic and Diluted
|
||||||
|
Net profit (loss) attributable to equity holders from continuing operations
|
93
|
|
23
|
|
28
|
|
|
Net profit (loss) attributable to equity holders from discontinuing operations
|
57
|
|
(33
|
)
|
59
|
|
|
Net profit attributable to all equity holders to determine the basic earnings (loss) per share
|
149
|
|
(10
|
)
|
87
|
|
Weighted average number of shares in the earnings (loss) per share computation
|
2019
|
2018
|
2017
|
||||
|
(thousands of shares)
|
||||||
|
Weighted average number of ordinary shares (excluding treasury shares) for basic earnings (loss) per share
|
101,144
|
|
100,793
|
|
100,384
|
|
|
Potential incremental shares as a result of share options
|
|
—
|
|
—
|
|
|
|
Weighted average number of ordinary shares (excluding treasury shares) adjusted for the effect of dilution
|
101,144
|
|
100,793
|
|
100,384
|
|
C. Capital structure and financing
C.1. Share capital, share premium and reserves
Common shares are classified as equity. Incremental costs directly attributable to the issue of new shares are shown in equity as a deduction from the proceeds.
Where any Group company purchases the Company’s share capital, the consideration paid, including any directly attributable incremental costs, is shown under Treasury shares and deducted from equity attributable to the Company’s equity holders until
F- 56
|
Notes to the Consolidated Financial Statements
For the years ended December 31, 2019, 2018 and 2017 (continued)
|
|
the shares are canceled, reissued or disposed of. Where such shares are subsequently sold or reissued, any consideration received, net of any directly attributable incremental costs and the related income tax effects is included in equity attributable to the Company’s equity holders.
Share capital, share premium
|
2019
|
2018
|
|||
|
Authorized and registered share capital (number of shares)
|
133,333,200
|
|
133,333,200
|
|
|
Subscribed and fully paid up share capital (number of shares)
|
101,739,217
|
|
101,739,217
|
|
|
Par value per share
|
1.50
|
|
1.50
|
|
|
Share capital (US$ millions)
|
153
|
|
153
|
|
|
Share premium (US$ millions)
|
480
|
|
482
|
|
|
Total (US$ millions)
|
633
|
|
635
|
|
Other equity reserves
|
Legal reserve
|
Equity settled transaction reserve
|
Hedge reserve
|
Currency translation reserve
|
Pension obligation reserve
|
Total
|
|||||||
|
(US$ millions)
|
||||||||||||
|
As of January 1, 2017
|
16
|
|
43
|
|
(4
|
)
|
(616
|
)
|
(1
|
)
|
(562
|
)
|
|
Share based compensation
|
—
|
|
22
|
|
—
|
|
—
|
|
—
|
|
22
|
|
|
Issuance of shares – 2014, 2015, 2016 LTIPs
|
—
|
|
(18
|
)
|
—
|
|
—
|
|
—
|
|
(18
|
)
|
|
Remeasurements of post-employment benefit obligations
|
—
|
|
—
|
|
—
|
|
—
|
|
(2
|
)
|
(2
|
)
|
|
Cash flow hedge reserve movement
|
—
|
|
—
|
|
4
|
|
—
|
|
—
|
|
4
|
|
|
Currency translation movement
|
—
|
|
—
|
|
—
|
|
85
|
|
—
|
|
85
|
|
|
As of December 31, 2017
|
16
|
|
46
|
|
—
|
|
(531
|
)
|
(3
|
)
|
(472
|
)
|
|
Share based compensation
|
—
|
|
22
|
|
—
|
|
—
|
|
—
|
|
22
|
|
|
Issuance of shares –2015, 2016, 2017 LTIPs
|
—
|
|
(22
|
)
|
—
|
|
—
|
|
—
|
|
(22
|
)
|
|
Cash flow hedge reserve movement
|
—
|
|
—
|
|
(1
|
)
|
—
|
|
—
|
|
1
|
|
|
Currency translation reserved recycled to statement of income
|
—
|
|
—
|
|
—
|
|
—
|
|
—
|
|
—
|
|
|
Currency translation movement
|
—
|
|
—
|
|
—
|
|
(68
|
)
|
—
|
|
(67
|
)
|
|
As of December 31, 2018
|
16
|
|
47
|
|
(1
|
)
|
(599
|
)
|
(3
|
)
|
(538
|
)
|
|
Share based compensation
|
—
|
|
29
|
|
—
|
|
—
|
|
—
|
|
29
|
|
|
Issuance of shares –2016, 2017, 2018, 2019 LTIPs
|
—
|
|
(25
|
)
|
—
|
|
—
|
|
—
|
|
(25
|
)
|
|
Cash flow hedge reserve movement
|
—
|
|
—
|
|
(16
|
)
|
—
|
|
—
|
|
(16
|
)
|
|
Currency translation movement
|
—
|
|
—
|
|
—
|
|
(2
|
)
|
—
|
|
(2
|
)
|
|
Effect of restructuring in Tanzania
|
—
|
|
—
|
|
—
|
|
9
|
|
—
|
|
9
|
|
|
As of December 31, 2019
|
16
|
|
52
|
|
(18
|
)
|
(593
|
)
|
(2
|
)
|
(544
|
)
|
F- 57
|
Notes to the Consolidated Financial Statements
For the years ended December 31, 2019, 2018 and 2017 (continued)
|
|
C.1.1. Legal reserve
If Millicom International Cellular S.A. reports an annual net profit on a non-consolidated basis, Luxembourg law requires appropriation of an amount equal to at least
5%
of the annual net profit to a legal reserve until such reserve equals
10%
of the issued share capital. This reserve is not available for dividend distribution. No appropriation was required in
2018
or
2019
as the
10%
minimum level was reached in 2011 and maintained each subsequent year.
C.1.2. Equity settled transaction reserve
The cost of LTIPs is recognized as an increase in the equity-settled transaction reserve over the period in which the performance and/or service conditions are rendered. When shares under the LTIPs vest and are issued the corresponding reserve is transferred to share premium.
C.1.3. Hedge reserve
The effective portions of changes in value of cash flow hedges are recorded in the hedge reserve (see note
C.1.
).
C.1.4. Currency translation reserve
In the financial statements, the relevant captions in the statements of financial position of subsidiaries without US dollar functional currencies are translated to US dollars using the closing exchange rate. Statements of income or statement of income captions (including those of joint ventures and associates) are translated to US dollars at monthly average exchange rates during the year. The currency translation reserve includes foreign exchange gains and losses arising from these translations. When the Group disposes of or loses control or significant influence over a foreign operation, exchange differences that were recorded in equity are recognized in the consolidated statement of income as part of gain or loss on sale or loss of control and/or significant influence.
C.2. Dividend distributions
On May 2, 2019, a dividend distribution of
$2.64
per share from Millicom’s retained profits at December 31, 2018, was approved by the shareholders at the AGM and paid in equal portions in May and November 2019.
On May 4, 2018, a dividend distribution of
$2.64
per share from Millicom’s retained profits at December 31, 2017, was approved by the shareholders at the AGM and paid in equal portions in May and November 2018.
On May 4, 2017, a dividend distribution of
$2.64
per share from Millicom’s retained profits at December 31, 2016, was approved by the shareholders at the AGM and distributed in May 2017.
The ability of the Company to make dividend payments is subject to, among other things, the terms of indebtedness, legal restrictions and the ability to repatriate funds from Millicom’s various operations. At
December 31, 2019
,
$306 million
(
December 31, 2018
:
$324 million
;
December 31, 2017
:
$345 million
) of Millicom’s retained profits represent statutory reserves that are unavailable to be distributed to owners of the Company.
F- 58
|
Notes to the Consolidated Financial Statements
For the years ended December 31, 2019, 2018 and 2017 (continued)
|
|
C.3. Debt and financing
Debt and financing by type (i)
|
Note
|
2019
|
2018
|
|||
|
(US$ millions)
|
|||||
|
Debt and financing due after more than one year
|
|||||
|
Bonds
|
C.3.1.
|
4,067
|
|
2,501
|
|
|
Banks
|
C.3.2.
|
1,805
|
|
1,324
|
|
|
Finance leases (ii)
|
C.3.4.
|
—
|
|
353
|
|
|
Other financing (iii)
|
43
|
|
113
|
|
|
|
Total non-current financing
|
5,915
|
|
4,291
|
|
|
|
Less: portion payable within one year
|
(129
|
)
|
(168
|
)
|
|
|
Total non-current financing due after more than one year
|
5,786
|
|
4,123
|
|
|
|
Debt and financing due within one year
|
|||||
|
Bonds
|
C.3.1.
|
46
|
|
—
|
|
|
Banks
|
C.3.2.
|
11
|
|
289
|
|
|
Total current debt and financing
|
57
|
|
289
|
|
|
|
Add: portion of non-current debt payable within one year
|
129
|
|
168
|
|
|
|
Total
|
186
|
|
458
|
|
|
|
Total debt and financing
|
5,972
|
|
4,580
|
|
|
|
(i)
|
See note D.1.1 for further details on maturity profile of the Group debt and financing.
|
(ii) Finance lease liabilities were included in Debt and Financing until 31 December 2018, but were reclassified to lease liabilities on January 1, 2019 when adopting the new leasing standard. See above in the "New and amended IFRS accounting standards" and below in notes C.4. and E.4. for further information about the change in accounting policy for leases.
|
(iii)
|
In July 2018, the Company issued a COP
144,054.5 million
/
$50 million
bilateral facility with IIC (Inter-American Development Bank) for a USD indexed to COP Note. The note bears interest at
9.450%
p.a.. This COP Note is used as net investment hedge of the net assets of our operations in Colombia.
|
Debt and financing by location
|
2019
|
2018
|
|||
|
(US$ millions)
|
||||
|
Millicom International Cellular S.A. (Luxembourg)
|
2,773
|
|
1,770
|
|
|
Colombia
|
827
|
|
1,016
|
|
|
Paraguay
|
502
|
|
504
|
|
|
Bolivia
|
350
|
|
317
|
|
|
Panama
|
918
|
|
261
|
|
|
Tanzania
|
186
|
|
201
|
|
|
Chad
|
—
|
|
64
|
|
|
Costa Rica
|
148
|
|
148
|
|
|
El Salvador
|
268
|
|
299
|
|
|
Total debt and financing
|
5,972
|
|
4,580
|
|
Debt and financings are initially recognized at fair value, net of directly attributable transaction costs. They are subsequently measured at amortized cost using the effective interest rate method or at fair value. Amortized cost is calculated by taking into account any discount or premium on acquisition and any fees or costs that are an integral part of the effective interest rate. Any difference between the initial amount and the maturity amount is recognized in the consolidated statement of income over the period of the borrowing. Borrowings are classified as current liabilities, unless the Group has an unconditional right to defer settlement of the liability for at least 12 months from the statement of financial position date.
F- 59
|
Notes to the Consolidated Financial Statements
For the years ended December 31, 2019, 2018 and 2017 (continued)
|
|
C.3.1. Bond financing
Bond financing
|
Note
|
Country
|
Maturity
|
Interest Rate %
|
2019
|
2018
|
||||
|
(US$ millions)
|
|||||||||
|
SEK Variable Rate Notes
|
1
|
Luxembourg
|
2024
|
STIBOR (i) + 2.350%
|
|
211
|
|
—
|
|
|
USD 6.625% Senior Notes
|
2
|
Luxembourg
|
2026
|
6.625
|
%
|
495
|
|
495
|
|
|
USD 6.000% Senior Notes
|
3
|
Luxembourg
|
2025
|
6.000
|
%
|
492
|
|
491
|
|
|
USD 6.250% Senior Notes
|
4
|
Luxembourg
|
2029
|
6.250
|
%
|
742
|
|
—
|
|
|
USD 5.125% Senior Notes
|
5
|
Luxembourg
|
2028
|
5.125
|
%
|
492
|
|
493
|
|
|
USD 6.750% Senior Notes
|
6
|
Paraguay
|
2022
|
6.750
|
%
|
—
|
|
297
|
|
|
USD 5.875% Senior Notes
|
6
|
Paraguay
|
2027
|
5.875
|
%
|
296
|
|
—
|
|
|
PYG 9.250% Notes
|
6
|
Paraguay
|
2026
|
9.250
|
%
|
2
|
|
—
|
|
|
PYG 8.750% Notes (tranche A)
|
6
|
Paraguay
|
2024
|
8.750
|
%
|
18
|
|
—
|
|
|
PYG 9.250% Notes (tranche B)
|
6
|
Paraguay
|
2026
|
9.250
|
%
|
8
|
|
—
|
|
|
PYG 10.000% Notes (tranche C)
|
6
|
Paraguay
|
2029
|
10.000
|
%
|
10
|
|
—
|
|
|
PYG 10.000% Notes
|
6
|
Paraguay
|
2029
|
10.000
|
%
|
4
|
|
—
|
|
|
BOB 4.750% Notes
|
7
|
Bolivia
|
2020
|
4.750
|
%
|
30
|
|
59
|
|
|
BOB 4.050% Notes
|
7
|
Bolivia
|
2020
|
4.050
|
%
|
4
|
|
7
|
|
|
BOB 4.850% Notes
|
7
|
Bolivia
|
2023
|
4.850
|
%
|
57
|
|
71
|
|
|
BOB 3.950% Notes
|
7
|
Bolivia
|
2024
|
3.950
|
%
|
36
|
|
43
|
|
|
BOB 4.300% Notes
|
7
|
Bolivia
|
2029
|
4.300
|
%
|
21
|
|
23
|
|
|
BOB 4.300% Notes
|
7
|
Bolivia
|
2022
|
4.300
|
%
|
26
|
|
30
|
|
|
BOB 4.700% Notes
|
7
|
Bolivia
|
2024
|
4.700
|
%
|
32
|
|
35
|
|
|
BOB 5.300% Notes
|
7
|
Bolivia
|
2026
|
5.300
|
%
|
13
|
|
13
|
|
|
BOB 5.000% Notes
|
7
|
Bolivia
|
2026
|
5.000
|
%
|
61
|
|
0
|
|
|
BOB 4.600% Notes
|
7
|
Bolivia
|
2024
|
4.600
|
%
|
40
|
|
0
|
|
|
UNE Bond 1 (tranches A and B)
|
8
|
Colombia
|
2020
|
CPI + 5.10%
|
|
46
|
|
46
|
|
|
UNE Bond 2 (tranches A and B)
|
8
|
Colombia
|
2023
|
CPI + 4.76%
|
|
46
|
|
46
|
|
|
UNE Bond 3 (tranche A)
|
8
|
Colombia
|
2024
|
9.350
|
%
|
49
|
|
49
|
|
|
UNE Bond 3 (tranche B)
|
8
|
Colombia
|
2026
|
CPI+4.15%
|
|
78
|
|
78
|
|
|
UNE Bond 3 (tranche C)
|
8
|
Colombia
|
2036
|
CPI+4.89%
|
|
38
|
|
39
|
|
|
USD 4.500% Senior Notes
|
9
|
Panama
|
2030
|
4.500
|
%
|
584
|
|
—
|
|
|
Cable Onda Bonds 5.750%
|
9
|
Panama
|
2025
|
5.750
|
%
|
184
|
|
184
|
|
|
Total bond financing
|
4,113
|
|
2,501
|
|
|||||
|
(i)
|
STIBOR – Swedish Interbank Offered Rate.
|
|
(1)
|
SEK Notes
|
On May 15, 2019, MIC S.A. completed its offering of a SEK
2 billion
floating rate senior unsecured sustainability bond due 2024. The bond carries a floating coupon of 3-month Stibor+235bps which we swapped with various banks to hedge its interest rate exposure, pursuant to which it will effectively pay fixed-rate coupons in US dollars between
4.990%
and
4.880%
(see
D.1.2.
). The bond has been listed and commenced trading on the Nasdaq Stockholm sustainable bond list on June 12, 2019. Millicom is using the net proceeds of the bond in accordance with the Sustainability Bond Framework which includes both environmental and social investments such as in energy efficiencies, and the expansion of its fixed and mobile networks. Cost of issuance of
$2.4 million
is amortized over the
five
year life of the bond (the effective interest rate is
0.200%
)
|
(2)
|
USD 6.625% Senior Notes
|
On October 16, 2018, the MIC S.A. issued
$500 million
aggregate principal amount of
6.625%
Senior Notes due 2026. The Notes bear interest at
6.625%
p.a., payable semiannually in arrears on each interest payment date. Proceeds were used to finance Cable
F- 60
|
Notes to the Consolidated Financial Statements
For the years ended December 31, 2019, 2018 and 2017 (continued)
|
|
Onda’s acquisition (Note
A.1.2.
). Costs of issuance of
$6 million
is amortized over the
eight
-year life of the notes (the effective interest rate is
6.750%
).
|
(3)
|
USD 6.000% Senior Notes
|
On March 17, 2015, MIC S.A. issued a
$500 million
6.000%
fixed interest rate notes repayable in
ten
years, to repay the El Salvador
8.000%
senior notes and for general corporate purposes. The notes have an effective interest rate of
6.132%
. A total amount of
$8.6 million
of withheld and upfront costs are being amortized over the
ten
-year life of the bond.
On April 8, 2019, the Group obtained consents from the holders of its
$500 million
6.000%
notes to amend certain provisions of the indenture governing the notes. MIC S.A. paid a cash payment of
$1 million
(equal to
$2.50
per $1,000 principal amount of Notes to holders of the Notes).
|
(4)
|
USD 6.250% Senior Notes
|
On March 25, 2019, MIC S.A. issued
$750 million
of
6.250%
notes due 2029. The notes bear interest at
6.250%
p.a., payable semi-annually in arrears on March 25 and September 25 of each year, starting on September 25, 2019. The net proceeds were used to finance, in part, the completed Telefonica CAM Acquisitions (see note
A.1.2.
). Costs of issuance of
$8.2 million
are amortized over the
ten
-year life of the notes (the effective interest rate is
6.360%
).
|
(5)
|
USD
5.125%
Senior Notes
|
On September 20, 2017, MIC S.A. issued a
$500 million
,
ten
-year bond due January 2028, with an interest rate of
5.125%
. Costs of issuance of
$7 million
are amortized over the
ten
year life of the notes (effective interest rate is
5.240%
).
|
(6)
|
PYG Notes
|
In April 2019, Telefónica Celular del Paragua S.A.E. issued
$300 million
5.875%
senior notes due 2027. The notes bear interest at
5.875%
p.a., payable semi-annually in arrears on April 15 and October 15 of each year, starting on October 15, 2019. The net proceeds were used to finance the purchase of the Telecel
6.750%
2022 notes. Costs of issuance of
$4 million
are amortized over the
eight
-year life of the notes (the effective interest rate is
6.000%
).
In June, 2019, Telefónica Celular del Paraguay S.A.E. issued notes in three series under its PYG
300 billion
program as follows: Series A for PYG
115 billion
(approximately
$18 million
), with a fixed annual interest rate of
8.750%
, maturing in June 2024, series B for PYG
50 billion
(approximately
$8 million
) with a fixed annual interest rate of
9.250%
, maturing in May 2026 and series C for PYG
65 billion
(approximately
$10 million
) with a fixed annual interest rate of
10.000%
, maturing in May 2029. On December 27, 2019, under the same program, they issued PYG.
35 billion
(Approximately
$5.4 million
) in two tranches: (i) PYG
10 billion
(approximately
$1.5 million
) which bears a fixed annual interest rate of
9.250%
and matures on December 30, 2026; and (ii) PYG
25 billion
(approximately
$3.9 million
) which bears a fixed annual interest rate of
10.000%
and matures on December 24, 2029.
|
(7)
|
BOB Notes
|
In May 2012, Telefónica Celular de Bolivia S.A. issued BOB
1.36 billion
of notes repayable in installments until April 2, 2020. Distribution and other transaction fees of BOB
5 million
reduced the total proceeds from issuance to BOB
1.32 billion
(
$191 million
). The bond has a
4.750%
per annum coupon with interest payable semi-annually in arrears in May and November each year. The effective interest rate is
4.790%
. These bonds are listed on the Bolivia Stock Exchange.
In November 2015, they issued BOB
696 million
(approximately
$100 million
) of notes in two series, series A for BOB
104.4 million
(approximately
$15 million
), with a fixed annual interest rate of
4.050%
, maturing in August 2020 and series B for BOB
591.6 million
(approximately
$85 million
) with a fixed annual interest rate of
4.850%
, maturing in August 2023. The bond has coupon with interest payable semi-annually in arrears in March and September during the first two years, thereafter each February and August. The effective interest rate is
4.840%
. These bonds are listed on the Bolivia Stock Exchange.
On August 11, 2016, Telefónica Celular de Bolivia S.A.. issued a new bond for a total amount of BOB
522 million
consisting of two tranches (approximately
$50 million
and
$25 million
, respectively). Tranche A and B bear fixed interest at
3.950%
and
4.300%
, and will mature in June 2024 and June 2029, respectively. These bonds are listed on the Bolivia Stock Exchange.
On October 12, 2017, they placed approximately
$80 million
of local currency bonds in three tranches, which will mature in 2022, 2024 and 2026 with a
4.300%
,
4.700%
and
5.300%
respectively. These bonds are listed on the Bolivia Stock Exchange.
On July 3, 2019 they issued two bonds one for BOB
420 million
(approximately
$61 million
) with a
5.000%
coupon maturing on August 2026 and another one for BOB
280 million
(approximately
$40 million
) with a
4.600%
coupon maturing on August 2024. Interest payments is semiannual and both bonds are listed on the Bolivia Stock Exchange.
|
(8)
|
UNE Bonds
|
In March 2010, UNE issued a COP
300 billion
(approximately
$126 million
) bond consisting of two tranches with
five
and
ten
-year maturities. Interest rates are either fixed or variable depending on the tranche. Tranche A bears variable interest, based on CPI, in Colombian peso and paid in Colombian peso. Tranche B bears variable interest, based on fixed term deposits, in Colombian peso
F- 61
|
Notes to the Consolidated Financial Statements
For the years ended December 31, 2019, 2018 and 2017 (continued)
|
|
and paid in Colombian peso. UNE applied the proceeds to finance its investment plan. Tranche A matured in March 2015 and tranche B will mature in March 2020.
In May 2011, UNE issued a COP
300 billion
(approximately
$126 million
) bond consisting of two equal tranches with
five
and
twelve
-year maturities. Interest rates are variable and depend on the tranche. Tranche A had variable interest, based on CPI, in Colombian peso and paid in Colombian peso. Tranche B bears variable interest, based on CPI, in Colombian peso and paid in Colombian peso. UNE applied the proceeds to finance its investment plan. Tranche A matured in October 2016 and tranche B will mature in October 2023.
In May 2016, UNE issued a COP
540 billion
bond (approximately
$176 million
) consisting of three tranches (approximately
$52 million
,
$83 million
and
$41 million
respectively). Interest rates are either fixed or variable depending on the tranche. Tranche A bears fixed interest at
9.350%
, while tranche B and C bear variable interest, based on CPI, (respective margins of CPI +
4.150%
and CPI +
4.890%
), in Colombian peso. UNE applied the proceeds to finance its investment plan and repay one bond (COP
150 billion
tranche). Tranches A, B and C will mature in May 2024, May 2026 and May 2036, respectively.
(9) Cable Onda Bonds
On August 4, 2015, Cable Onda issued local bonds in Panama for a total amount of
$185 million
. These bonds are listed on the Panama Stock Exchange and bear a fixed annual interest of
5.750%
and are due on August 4, 2025. The bonds were assumed by Millicom as part of the acquisition of Cable Onda. See note
A.1.2.
for further details on the acquisition.
On November 1, 2019, Cable Onda issued
$600 million
aggregate principal amount of
4.500%
senior notes due 2030 payable in U.S. dollars, registered with the Superintendencia del Mercado de Valores de Panamá and listed on the Luxembourg Stock Exchange and on the Panamá Stock Exchange. The Notes bear interest from November 1, 2019 at a rate of
4.500%
per annum, payable on January 30, 2020 for the first payment and thereafter semiannually in arrears on each interest payment date. The proceeds were used to fund the Panama Acquisition and to refinance certain local financing. Costs of issuance of
$16 million
, which include an original issue discount (OID) is amortized over the
ten
-year life of the notes (the effective interest rate is
4.690%
).
C.3.2. Bank and Development Financial Institution financing
|
Note
|
Country
|
Maturity range
|
Interest rate
|
2019
|
2018
|
|||
|
(US$ millions)
|
||||||||
|
Fixed rate loans
|
||||||||
|
PYG Long-term loans
|
1
|
Paraguay
|
2020-2026
|
Fixed
|
166
|
|
180
|
|
|
USD - Long-term loans
|
2
|
Panama
|
2024
|
Fixed
|
150
|
|
24
|
|
|
BOB Long-term loans
|
3
|
Bolivia
|
2023-2025
|
Fixed
|
31
|
|
20
|
|
|
Variable rate loans
|
||||||||
|
USD Long-term loans
|
4
|
Costa Rica
|
2023
|
Variable
|
148
|
|
148
|
|
|
USD Long-term loans
|
Chad
|
2019
|
Variable
|
—
|
|
1
|
|
|
|
USD Long-term loans
|
5
|
Tanzania
|
2020-2025
|
Variable
|
171
|
|
90
|
|
|
TZS Long-term loans
|
5
|
Tanzania
|
2025
|
Variable
|
14
|
|
—
|
|
|
USD Short-term loans
|
8
|
Luxembourg
|
2019
|
Variable
|
—
|
|
250
|
|
|
USD Long-term loans
|
8
|
Luxembourg
|
2024
|
Libor + 3.00%
|
298
|
|
—
|
|
|
COP Long-term loans
|
6
|
Colombia
|
2025-2030
|
Variable
|
274
|
|
277
|
|
|
USD Long-term loans
|
6
|
Colombia
|
2024
|
Variable
|
295
|
|
298
|
|
|
USD Credit Facility / Senior Unsecured Term Loan Facility
|
7
|
El Salvador
|
2021-2023
|
Variable
|
268
|
|
274
|
|
|
Other Long-term loans
|
Various
|
Various
|
—
|
|
51
|
|
||
|
Total Bank and Development Financial Institution financing
|
1,817
|
|
1,613
|
|
||||
|
1.
|
Paraguay
|
In October 2015, Telefónica Celular del Paraguay S.A.E. entered into a
five
-year loan facility with Banco Itau for PGY
257,700 million
(approximately
$40 million
) which bears a fixed annual interest rate. The final maturity of the loan is on September 10, 2020.
On July 4, 2017, Telefónica Celular del Paraguay S.A.E executed a
five
-year loan agreement with the IPS (Instituto de Prevision Social) and the Inter-American Development Bank, who acts as a guarantor, for a total amount of PYG
$367,000 million
F- 62
|
Notes to the Consolidated Financial Statements
For the years ended December 31, 2019, 2018 and 2017 (continued)
|
|
(approximately
$66 million
). The loan, denominated in PYG with the final maturity in 2022. The guarantee under this facility is counter-guaranteed by MICSA.
In July 2018, Telefónica Celular del Paraguay S.A.E. executed a
seven
-year loan with Regional Bank for PYG
115,000 million
(approximately
$18 million
with a final maturity in 2025.
On January 2, 2019, Telefónica Celular del Paraguay S.A.E. obtained a
seven
-year loan from BBVA Bank for PYG
177,000 million
which is due on November, 26, 2025.
On September 25, 2019, Telefónica Celular del Paraguay S.A.E. executed an amended and restated agreement with Banco Continental S.A.E.C.A., to consolidate three existing loans, for a PYG
370,000 million
(approximately
$57 million
). The new loan has a maturity of
7
years.
|
2.
|
Panama
|
On August 27, 2019, Cable Onda S.A entered into two credit agreements, one with Banco Nacional de Panama S.A , for
$75 million
which bears a fixed interest and has a
5
year duration and another one with the Bank of Nova Scotia (Sucursal Panama) for
$75 million
with a fixed interest and a
five
year duration to finance and refinance working capital and capital expenditures.
|
3.
|
Bolivia
|
In June 2018, Telefónica Celular de Bolivia S.A.. entered into a two tranche loan agreement with Banco BISA S.A for BOB
69.6 million
(approximately
$10 million
) each, with a fixed interest rate. The loans have a term of
7
years.
In November 19, they executed a new loan with Banco de Crédito de Bolivia S.A for Bs.
78,000,000
(approximately
$11 million
), with semiannual payments and a fixed interest rate. The loan has a term of
4
years.
|
4.
|
Costa Rica
|
In April 2018, Millicom Cable Costa Rica S.A. entered into a
$150 million
variable rate syndicated loan with Citibank as agent.
In June 2018, Millicom Cable Costa Rica S.A. entered into a cross currency swap to hedge part of the principal of the loan against interest rate and currency risks. Interest rate and currency swap agreements had been made on
$35 million
of the principal amount and interest rate swaps for an additional
$35 million
.
|
5.
|
Tanzania
|
On June 4, 2019, MIC Tanzania Public Limited Company entered into a syndicated loan facility agreement with the Standard Bank of South Africa acting as an agent and a consortium of banks acting as the original lenders, for
$174.75 million
(tranche A) and TZS
103,000 million
(tranche B - approximately
$45 million
) which bears variable interests: for Tranche A Libor plus a margin and for Trance B T-Bill rate plus a margin. The facility agreement has an all asset debenture securing the whole amount, as well as a pledge over the shares of the immediate holding company of the borrower. The Facility was amended and restated on December 12, 2019 and has a maturity of
66
months. It is a stand-alone facility with an all asset debenture and a pledge on the shares of the immediate holding company of the borrower. .Margin and balance between USD and TSZ tranches may vary depending on the syndication demands.
6. Colombia
In December 20, 2019, our operation in Colombia executed an amendment to the
$300 million
loan between Colombia Móvil S.A. E.S.P. as borrower and UNE EPM Telecomunicaciones S.A., as guarantor with a consortium of banks to extend the maturity for
5
years (now due on December 20, 2024) and lower the applicable margin.
7. EL Salvador
On April 15, 2016, Telemovil El Salvador, S.A. de C.V. executed a senior unsecured term loan facility up to
$50 million
maturing in April 2021 and bearing variable interest per annum, which was restated and amended as of May 30, 2017, for a second tranche of
$50 million
. This facility is guaranteed by MICSA.. Later on, in January 2018, Telemovil El Salvador entered into a second amended and restated agreement with Scotiabank for a third tranche of
$50 million
with variable rate and with a
5
-year bullet repayment, also guaranteed by MICSA.
In addition, they executed an interest rate swap with Scotiabank to fix interest rates for up to
$100 million
of the outstanding debt.
On June 3, 2016, Telemovil El Salvador, S.A. de C.V. executed a
$30 million
credit facility with Citibank N.A., for general corporate purposes maturing in June 2021 and bearing variable interest rate per annum. The facility is guaranteed by MICSA..
In March 2018, Telemovil El Salvador executed a
$100 million
credit facility with DNB at a variable rate facility with DNB and Nordea with a
5
-year bullet repayment.The facility is guaranteed by MICSA..
F- 63
|
Notes to the Consolidated Financial Statements
For the years ended December 31, 2019, 2018 and 2017 (continued)
|
|
8. Luxembourg
On April 24, 2019, MICSA. entered into a
$300 million
term facility agreement arranged by DNB Bank ASA, Sweden Branch and Nordea Bank Abp, Filial i Sverige. This facility has a variable interest rate and is fully drawn as at December 31, 2019 and is due on April 2024.
Right of set-off and derecognition
Financial assets and financial liabilities are offset and the net amount is reported in the consolidated statement of financial position if there is a currently enforceable legal right to offset the recognized amounts and an intention to settle on a net basis, or to realize the assets and settle the liabilities simultaneously.
A financial asset (or a part of a financial asset or part of a group of similar financial assets) is derecognized when:
|
•
|
Rights to receive cash flows from the asset have expired; or
|
|
•
|
Rights to receive cash flows from the asset or obligations to pay the received cash flows in full without material delay have been transferred to a third party under a “pass-through” arrangement; and the Group has either transferred substantially all the risks and rewards of the asset or the control of the asset.
|
When rights to receive cash flows from an asset have been transferred or a pass-through arrangement concluded, an evaluation is made if and to what extent the risks and rewards of ownership have been retained. When the Group has neither transferred nor retained substantially all of the risks and rewards of the asset, nor transferred control of the asset, the asset is recognized to the extent of the Group’s continuing involvement in the asset. In that case, the Group also recognizes an associated liability. The transferred asset and the associated liability are measured on a basis that reflects the rights and obligations that the Group has retained. Continuing involvement that takes the form of a guarantee over the transferred asset is measured at the lower of the original carrying amount of the asset and the maximum amount of consideration that the Group could be required to repay.
A financial liability is derecognized when the obligation under the liability is discharged or canceled, or expires. When an existing financial liability is replaced by another from the same lender on substantially different terms, or the terms of an existing liability are substantially modified, such an exchange or modification is treated as the derecognition of the original liability and the recognition of a new liability. The difference in the respective carrying amounts is recognized in the statement of income.
C.3.3. Interest and other financial expenses
The Group’s interest and other financial expenses comprised the following:
|
Year ended December 31,
|
||||||
|
2019
|
2018
|
2017
|
||||
|
(US$ millions)
|
||||||
|
Interest expense on bonds and bank financing
|
(348
|
)
|
(234
|
)
|
(246
|
)
|
|
Interest expense on (finance) leases
|
(157
|
)
|
(91
|
)
|
(65
|
)
|
|
Early redemption charges
|
(10
|
)
|
(4
|
)
|
(43
|
)
|
|
Others
|
(47
|
)
|
(37
|
)
|
(35
|
)
|
|
Total interest and other financial expenses
|
(564
|
)
|
(367
|
)
|
(389
|
)
|
C.3.4. Finance leases - until December 31, 2018
As at December 31, 2018, Millicom’s finance leases mainly consisted of long-term lease of tower space from tower companies or competitors on which Millicom locates its network equipment.
Finance lease liabilities were included in Debt and Financing until December 31, 2018, but were reclassified to lease liabilities on January 1, 2019 in the process of adopting the new lease standard: IFRS 16. See above in the "New and amended IFRS accounting standards" and notes C.4. and E.4. for further information.
Finance lease liabilities
Under IAS 17, leases which transferred substantially all risks and benefits incidental to ownership of the leased item to the lessee were capitalized at the inception of the lease. The amount capitalized was the lower of the fair value of the asset or the present value of the minimum lease payments.
F- 64
|
Notes to the Consolidated Financial Statements
For the years ended December 31, 2019, 2018 and 2017 (continued)
|
|
Lease payments were allocated between finance charges (interest) and reduction of the lease liability so as to achieve a constant rate of interest on the remaining balance of the liability. Finance charges were recorded as interest expenses in the statement of income.
The sale and leaseback of towers and related site operating leases and service contracts were accounted for in accordance with the underlying characteristics of the assets, and the terms and conditions of the lease agreements. When sale and leaseback agreements were concluded, the portions of assets that will not be leased back by Millicom were classified as assets held for sale as completion of their sale was highly probable. Asset retirement obligations related to the towers were classified as liabilities directly associated with assets held for sale. On transfer to the tower companies, the portion of the towers leased back were accounted for as operating leases or finance leases according to the criteria set out above. The portion of towers being leased back represented the dedicated part of each tower on which Millicom’s equipment was located and was derived from the average technical capacity of the towers. Rights to use the land on which the towers were located were accounted for as operating leases, and costs of services for the towers were recorded as operating expenses. The gain on disposal was recognized upfront for the portion of towers that is not leased back, and was deferred and recognized over the term of the lease for the portion leased back.
Finance lease liabilities at December 31, 2018
|
Country
|
Maturity
|
2018
|
||
|
(US$ millions)
|
||||
|
Lease of tower space
|
Tanzania
|
2029/2030
|
112
|
|
|
Lease of tower space
|
Colombia Movil
|
2032
|
83
|
|
|
Lease of poles
|
Colombia (UNE)
|
2032
|
99
|
|
|
Lease of tower space
|
Paraguay
|
2030
|
27
|
|
|
Lease of tower space
|
El Salvador
|
2026
|
26
|
|
|
Other finance lease liabilities
|
various
|
various
|
6
|
|
|
Total finance lease liabilities
|
353
|
|
||
Tower Sale and Leaseback
In
2017
and
2018
, the Group announced agreements to sell and leaseback wireless communications towers in Paraguay, Colombia and El Salvador.
Total gain on sale recognized in
2019
was
$5 million
(
2018
:
$61 million
,
2017
:
$63 million
) and c
ash received from these sales were
$22 million
,
$141 million
and
$161 million
, respectively.
C.3.5. Guarantees and pledged assets
Guarantees
Financial guarantee contracts issued by the Group are those contracts that require a payment to be made to reimburse the holder for a loss it incurs because the specified debtor fails to make payment when due in accordance with the terms of a debt instrument. Financial guarantee contracts are recognized initially as a liability at fair value, adjusted for transaction costs that are directly attributable to the issuance of the guarantee. Subsequently, the liability is measured at the higher of the best estimate of the expenditure required to settle the present obligation at the reporting date and the amount recognized, less cumulative amortization.
Liabilities to which guarantees are related are recorded in the consolidated statement of financial position under Debt and financing, and liabilities covered by supplier guarantees are recorded under Trade payables or Debt and financing, depending on the underlying terms and conditions.
F- 65
|
Notes to the Consolidated Financial Statements
For the years ended December 31, 2019, 2018 and 2017 (continued)
|
|
Maturity of guarantees
|
At December 31, 2019
|
At December 31, 2018
|
|||||||
|
Terms
|
Outstanding exposure(i)
|
Maximum exposure(ii)
|
Outstanding exposure(i)
|
Maximum exposure(ii)
|
||||
|
(US$ millions)
|
||||||||
|
0-1 year
|
29
|
|
29
|
|
133
|
|
133
|
|
|
1-3 years
|
134
|
|
134
|
|
281
|
|
281
|
|
|
3-5 years
|
300
|
|
300
|
|
212
|
|
212
|
|
|
Total
|
464
|
|
464
|
|
626
|
|
626
|
|
|
(i)
|
The outstanding exposure represents the carrying amount of the related liability at December 31.
|
|
(ii)
|
The maximum exposure represents the total amount of the Guarantee at December 31.
|
Pledged assets
As at
December 31, 2019
, the Group’s share of total debt and financing secured by either pledged assets, pledged deposits issued to cover letters of credit, or guarantees issued was
$464 million
(
December 31, 2018
:
$626 million
). Assets pledged by the Group over these debts and financings amounted to
$1 million
at
December 31, 2019
(
December 31, 2018
:
$2 million
). The remainder represented primarily guarantees issued by Millicom S.A. to guarantee financings raised by other Group operating entities.
In addition to the above, on June 4, 2019, MIC Tanzania Public Limited Company entered into a loan facility agreement which was further amended and restated in December 12, 2019, with the Standard Bank of South Africa acting as an agent and a consortium of banks acting as the original lenders. The facility agreement, maturing in 2025, has an all asset debenture securing the whole amount, as well as a pledge over the shares of the immediate holding company of the borrower.
C.3.6. Covenants
Millicom’s financing facilities are subject to a number of covenants including net leverage ratio, debt service coverage ratios, or debt to earnings ratios, among others. In addition, certain of its financings contain restrictions on sale of businesses or significant assets within the businesses. At
December 31, 2019
, there were no breaches of financial covenants.
C.4. Lease liability
As a result of the adoption of IFRS 16 'Leases', and as of December 31, 2019 (see above in the "New and amended IFRS accounting standards") lease liabilities are presented in the statement of financial position as follows:
|
December 31, 2019
|
||
|
(US$ millions)
|
||
|
Current
|
97
|
|
|
Non Current
|
967
|
|
|
Total Lease liability
|
1,063
|
|
As permitted under IFRS 16, Millicom has elected not to recognize a lease liability for short term leases (leases with an expected term of 12 months or less) or for leases of low value assets. Payments associated with short-term leases of equipment and vehicles and all leases of low-value assets are rather recognized on a straight-line basis as an expense in the statement of income. Short-term leases are leases with a lease term of 12 months or less. Low-value assets comprise IT equipment and small items of office furniture. In addition, certain variable lease payments are not permitted to be recognized as lease liabilities and are expensed as incurred.
The expenses relating to payments not included in the measurement of the lease liability are disclosed in operating expenses (note B.3.) and are as follows:
|
2019
(US$ millions)
|
||
|
Expense relating to short-term leases (included in cost of sales and operating expenses)
|
(5
|
)
|
F- 66
|
Notes to the Consolidated Financial Statements
For the years ended December 31, 2019, 2018 and 2017 (continued)
|
|
The total cash outflow for leases in
2019
was
$236 million
. Lease liabilities split by maturity and future cash outflows are disclosed in note D.5..
At
December 31, 2019
, the Group has not committed to any material leases which had not yet commenced and has no material lease contracts with variable lease payments.
The Group's leasing activities and how these are accounted for
The Group leases various lands, sites, towers (including those related to towers sold and leased back), offices, warehouses, retail stores, equipment and cars. Rental contracts are typically made for fixed periods but may have extension options as described below. Lease terms are negotiated on an individual basis and contain a wide range of different terms and conditions. The lease agreements do not impose any covenants, but leased assets may not be used as security for borrowing purposes.
Through December 31, 2018, leases of property, plant and equipment were classified as either finance or operating leases. See note C.3.4. for further details on existing finance leases as of December 31, 2018. Payments made under operating leases (net of any incentives received from the lessor) were charged to the statement of income on a straight-line basis over the period of the lease.
From January 1, 2019, leases are recognized as a right-of-use asset and a corresponding liability at the date at which the leased asset is available for use by the Group. Each lease payment is allocated between the reduction of the liability and finance cost. The finance cost is charged to the statement of income over the lease period so as to produce a constant periodic rate of interest on the remaining balance of the liability for each period. The right-of-use asset is depreciated over the shorter of the asset's useful life and the lease term on a straight-line basis.
Assets and liabilities arising from a lease are initially measured on a present value basis. Lease liabilities include the net present value of the following lease payments:
|
•
|
fixed payments (including in-substance fixed payments), less any lease incentives receivable
|
|
•
|
variable lease payment that are based on an index or a rate
|
|
•
|
amounts expected to be payable by the lessee under residual value guarantees
|
|
•
|
the exercise price of a purchase option if the lessee is reasonably certain to exercise that option, and
|
|
•
|
payments of penalties for terminating the lease, if the lease term reflects the lessee exercising that option.
|
The lease payments are discounted using the interest rate implicit in the lease. As it is generally impracticable to determine that rate, the Group uses the lessee’s incremental borrowing rate, being the rate that the lessee would have to pay to borrow the funds necessary to obtain an asset of similar value in a similar economic environment with similar terms and conditions. The incremental borrowing rate applied can have a significant impact on the net present value of the lease liability recognized under IFRS 16.
The Group determines the incremental borrowing rate by country and by considering the risk-free rate, the country risk, the industry risk, the credit risk and the currency risk, as well as the lease and payment terms and dates.
The Group is also exposed to potential future increases in variable lease payments based on an index or rate, which are not included in the lease liability until they take effect. When adjustments to lease payments based on an index or rate take effect, the lease liability is adjusted against the right-of-use asset by discounting the revised lease payments using either the initial discount rate or a revised discount rate. The initial discount rate is used if future lease payments are reflecting market or index rates or if they are in substance fixed. The discount rate is revised, if a change in floating interest rates occurs. The Group reassess the variable payment only when there is a change in cash flows resulting from a change in the reference index or rate and not at each reporting date.
According to IFRS 16, lease term is defined as the non-cancellable period for which a lessee has the right to use an underlying asset, together with both: (a) periods covered by an option to extend the lease if the lessee is reasonably certain to exercise that option; and (b) periods covered by an option to terminate if the lessee is reasonably certain not to exercise that option. The assessment of such options is performed at the commencement of a lease. As part of the assessment, Millicom introduced the 'time horizon concept': the reasonable term under which the company expects to use a leased asset considering economic incentives, management decisions, business plans and the fast-paced industry Millicom operates in. The assessment must be focused on the economic incentives for Millicom to exercise (or not) an option to early terminate/extend a contract. The Group has decided to work on the basis the lessor will generally accept a renewal/not early terminate a contract, as there is an economic incentive to maintain the contractual relationship.
Millicom considered the specialized nature of most of its assets under lease, the low likelihood the lessor can find a third party to substitute Millicom as a lessee and past practice to conclude that, the lease term can go beyond the notice period when there is more than an insignificant penalty for the lessor not to renew the lease. This analysis requires judgment and has a significant impact on the lease liability recognized under IFRS 16.
F- 67
|
Notes to the Consolidated Financial Statements
For the years ended December 31, 2019, 2018 and 2017 (continued)
|
|
Under IFRS 16, the accounting for sale and leaseback transactions has changed as the underlying sale transaction needs to be first analyzed using the guidance of IFRS 15. The seller/lessee recognizes a right-of-use asset in the amount of the proportional original carrying amount that relates to the right of use retained. Accordingly, only the proportional amount of gain or loss from the sale must be recognized. The impact from sale and leaseback transactions was not material for Millicom Group as of the date of initial application.
Finally, the Group has taken the additional following decisions when adopting the standard:
|
•
|
Non-lease components are capitalized (IFRS16.15)
|
|
•
|
Intangible assets are out of IFRS 16 scope (IFRS16.4)
|
C.5. Cash and deposits
C.5.1. Cash and cash equivalents
|
2019
|
2018
|
|||
|
(US$ millions)
|
||||
|
Cash and cash equivalents in USD
|
834
|
|
229
|
|
|
Cash and cash equivalents in other currencies
|
330
|
|
299
|
|
|
Total cash and cash equivalents
|
1,164
|
|
528
|
|
Cash and cash equivalents include cash in hand, deposits held at call with banks and other short-term highly liquid investments with original maturities of three months or less.
Cash deposits with bank with maturities of more than three months that generally earn interest at market rates are classified as time deposits.
C.5.2. Restricted cash
|
2019
|
2018
|
|||
|
(US$ millions)
|
||||
|
Mobile Financial Services
|
150
|
|
155
|
|
|
Others
|
5
|
|
3
|
|
|
Restricted cash
|
155
|
|
158
|
|
Cash held with banks related to MFS which is restricted in use due to local regulations is denoted as restricted cash.
F- 68
|
Notes to the Consolidated Financial Statements
For the years ended December 31, 2019, 2018 and 2017 (continued)
|
|
C.5.3. Pledged deposits
Pledged deposits represent contracted cash deposits with banks that are held as security for debts at corporate or operational entity level. Millicom is unable to access these funds until either the relevant debt is repaid or alternative security is arranged with the lender.
At
December 31, 2019
, there were
no
non-current pledged deposits (
2018
:
nil
).
At
December 31, 2019
, current pledged deposits amounted to
$1 million
(
2018
:
$2 million
).
C.6. Net financial obligations
Net financial obligations (i)
|
2019
|
2018
|
|||
|
(US$ millions)
|
||||
|
Total debt and financing (i)
|
5,972
|
|
4,580
|
|
|
Lease liabilities (i)
|
1,063
|
|
—
|
|
|
Gross financial obligations
|
7,036
|
|
4,580
|
|
|
Less:
|
||||
|
Cash and cash equivalents
|
(1,164
|
)
|
(528
|
)
|
|
Pledged deposits
|
(1
|
)
|
(2
|
)
|
|
Time deposits related to bank borrowings
|
(1
|
)
|
—
|
|
|
Net financial obligations at the end of the year
|
5,870
|
|
4,051
|
|
|
Add (less) derivatives related to debt (note D.1.2.)
|
(17
|
)
|
—
|
|
|
Net financial obligations including derivatives related to debt
|
5,853
|
|
4,051
|
|
|
(i)
|
As at
December 31, 2018
, Debt and financing included finance lease liabilities of
$353 million
. As at
December 31, 2019
, and as a result of the application of IFRS 16, these are now shown in a separate line under Lease liabilities.
|
|
Assets
|
Liabilities from financing activities
|
|||||||||||
|
Cash and cash equivalents
|
Other
|
Bond and bank debt and financing
|
Finance lease liabilities(i)
|
Lease liabilities(i)
|
Total
|
|||||||
|
Net financial obligations as at January 1, 2018
|
619
|
|
2
|
|
3,420
|
|
365
|
|
—
|
|
3,164
|
|
|
Cash flows
|
(72
|
)
|
—
|
|
621
|
|
(17
|
)
|
—
|
|
676
|
|
|
Scope Changes
|
7
|
|
—
|
|
267
|
|
—
|
|
—
|
|
260
|
|
|
Additions/ acquisitions
|
—
|
|
—
|
|
—
|
|
44
|
|
—
|
|
44
|
|
|
Interest accretion
|
—
|
|
—
|
|
11
|
|
—
|
|
—
|
|
11
|
|
|
Foreign exchange movements
|
(33
|
)
|
—
|
|
(84
|
)
|
(21
|
)
|
—
|
|
(72
|
)
|
|
Transfers to/from assets held for sale
|
6
|
|
—
|
|
9
|
|
(8
|
)
|
—
|
|
(4
|
)
|
|
Transfers
|
—
|
|
—
|
|
3
|
|
(11
|
)
|
—
|
|
(9
|
)
|
|
Other non-cash movements
|
—
|
|
—
|
|
(19
|
)
|
—
|
|
—
|
|
(19
|
)
|
|
Net financial obligations as at December 31, 2018
|
528
|
|
2
|
|
4,227
|
|
353
|
|
—
|
|
4,051
|
|
|
Cash flows
|
638
|
|
—
|
|
1,743
|
|
—
|
|
(107
|
)
|
998
|
|
|
Scope changes
|
16
|
|
—
|
|
74
|
|
—
|
|
178
|
|
236
|
|
|
Recognition / Remeasurement
|
—
|
|
—
|
|
—
|
|
—
|
|
109
|
|
109
|
|
|
Change in accounting policy
|
—
|
|
—
|
|
—
|
|
—
|
|
545
|
|
545
|
|
|
Interest accretion
|
—
|
|
—
|
|
8
|
|
—
|
|
—
|
|
8
|
|
|
Foreign exchange movements
|
(8
|
)
|
—
|
|
(16
|
)
|
—
|
|
(6
|
)
|
(14
|
)
|
|
Transfers to/from assets held for sale
|
(9
|
)
|
—
|
|
(53
|
)
|
—
|
|
(8
|
)
|
(52
|
)
|
|
Transfers
|
—
|
|
—
|
|
3
|
|
(353
|
)
|
353
|
|
3
|
|
|
Other non-cash movements
|
—
|
|
—
|
|
(14
|
)
|
—
|
|
—
|
|
(14
|
)
|
|
Net financial obligations as at December 31, 2019
|
1,164
|
|
2
|
|
5,972
|
|
—
|
|
1,063
|
|
5,870
|
|
(i) As from January 1, 2019 and as a result of the application of IFRS 16, finance leases are now shown under lease liabilities.
F- 69
|
Notes to the Consolidated Financial Statements
For the years ended December 31, 2019, 2018 and 2017 (continued)
|
|
C.7. Financial instruments
i) Equity and debt instruments
Classification
From January 1, 2018, and the application of IFRS 9, the Group classifies its financial assets in the following measurement categories:
|
•
|
those to be measured subsequently at fair value either through Other Comprehensive Income (OCI), or through profit or loss, and
|
|
•
|
those to be measured at amortized cost.
|
The classification depends on the Group’s business model for managing the financial assets and the contractual terms of the cash flows.
For assets measured at fair value, gains and losses will either be recorded in profit or loss or OCI. For investments in equity instruments that are not held for trading, this will depend on whether the Group has made an irrevocable election at the time of initial recognition to account for the equity investment at fair value through other comprehensive income (FVOCI).
The Group reclassifies debt investments when and only when its business model for managing those assets changes.
Measurement
At initial recognition, the Group measures a financial asset at its fair value plus, in the case of a financial asset not at fair value through profit or loss (FVPL), transaction costs that are directly attributable to the acquisition of the financial asset. Transaction costs of financial assets carried at FVPL are expensed in profit or loss.
Financial assets with embedded derivatives are considered in their entirety when determining whether their cash flows are solely payment of principal and interest.
Debt instruments
Subsequent measurement of debt instruments depends on the Group’s business model for managing the asset and the cash flow characteristics of the asset. There are three measurement categories into which the group classifies its debt instruments:
|
•
|
Amortized cost: Assets that are held for collection of contractual cash flows where those cash flows represent solely payments of principal and interest are measured at amortized cost. Interest income from these financial assets is included in finance income using the effective interest rate method. Any gain or loss arising on derecognition is recognized directly in profit or loss and presented in other gains / (losses), together with foreign exchange gains and losses. Impairment losses are presented as a separate line item in the consolidated statement of income.
|
|
•
|
FVOCI: Assets that are held for collection of contractual cash flows and for selling the financial assets, where the assets’ cash flows represent solely payments of principal and interest, are measured at FVOCI. Movements in the carrying amount are taken through OCI, except for the recognition of impairment gains or losses, interest revenue and foreign exchange gains and losses which are recognized in profit or loss. When the financial asset is derecognised, the cumulative gain or loss previously recognized in OCI is reclassified from equity to profit or loss and recognized in ‘Other non-operating (expenses) income, net’. Interest income from these financial assets is included in finance income using the effective interest rate method. Foreign exchange gains and losses and impairment expenses are presented as ‘Other non-operating (expenses) income, net’ in the consolidated statement of income.
|
|
•
|
FVPL: Assets that do not meet the criteria for amortized cost or FVOCI are measured at FVPL. A gain or loss on a debt investment that is subsequently measured at FVPL is recognized in profit or loss and presented net within ‘Other non-operating (expenses) income, net’ in the period in which it arises.
|
Equity instruments
The Group subsequently measures all equity investments at fair value. The Group does not hold equity instruments for trading. Where the Group’s management has elected to present fair value gains and losses on equity investments in OCI, there is no subsequent reclassification of fair value gains and losses to profit or loss following the derecognition of the investment. Dividends from such investments continue to be recognized in profit or loss as other income when the Group’s right to receive payments is established.
Otherwise, changes in the fair value of financial assets at FVPL are recognized in ‘Other non-operating (expenses) income, net’ in the consolidated statement of income as applicable. Impairment losses (and reversal of impairment losses) on equity investments measured at FVOCI are not reported separately from other changes in fair value.
F- 70
|
Notes to the Consolidated Financial Statements
For the years ended December 31, 2019, 2018 and 2017 (continued)
|
|
Impairment
From January 1, 2018, the Group assesses on a forward looking basis the expected credit losses associated with its financial assets carried at amortized cost and FVOCI. The impairment methodology applied depends on whether there has been a significant increase in credit risk.
For trade receivables, the Group applies the simplified approach permitted by IFRS 9, which requires expected lifetime losses to be recognized from initial recognition of the trade receivables.
The provision is recognized in the consolidated statement of income within Cost of sales.
|
ii)
|
Derivative financial instruments and hedging activities
|
Derivatives are initially recognized at fair value on the date a derivative contract is entered into and are subsequently re-measured at fair value at each subsequent closing date. The method of recognizing the resulting gain or loss depends on whether the derivative is designated as a hedging instrument and, if so, the nature of the item being hedged. The Group designates certain derivatives as either:
|
a)
|
Hedges of the fair value of recognized assets or liabilities or a firm commitment (fair value hedge); or
|
|
b)
|
Hedges of a particular risk associated with a recognized asset or liability or a highly probable forecast transaction (cash flow hedge).
|
For transactions designated and qualifying for hedge accounting, at the inception of the transaction, the Group documents the relationship between hedging instruments and hedged items, as well as its risk management objectives and strategy for undertaking various hedging transactions. This is done in reference to the Group Financial Risk Management Policy as last updated and approved by the Audit Committee in late 2018. The Group also documents its assessment, both at hedge inception and on an ongoing basis (quarterly), of whether the derivatives that are used in hedging transactions are highly effective in offsetting changes in fair values or cash flows of hedged items.
The full fair value of a hedging instrument is classified as a non-current asset or liability when the period to maturity of the hedged item is more than 12 months and as a current asset or liability when the remaining maturity of the hedged item is less than 12 months. Trading derivatives are classified as a current asset or liability when the remaining period to maturity of the hedged item is less than 12 months.
The change in fair value of hedging instruments that are designed and qualify as fair value hedges is recognized in the statement of income as finance costs or income. The change in fair value of the hedged item attributable to the risk hedged is recorded as part of the carrying value of the hedged item and is also recognized in the statement of income as finance costs or income.
The effective portion of changes in the fair value of derivatives that are designated and qualify as cash flow hedges is recognized in other comprehensive income. Gains or loss relating to any ineffective portion is recognized immediately in the statement of income within Other non-operating (expenses) income, net. Amounts accumulated in equity are reclassified to the statement of income in the periods when the hedged item affects profit or loss.
When a hedging instrument expires or is sold, or when a hedge no longer meets the criteria for hedge accounting, any cumulative gain or loss existing in equity at that time is recycled to the statement of income within Other non-operating (expenses) income, net.
When a forecast transaction is no longer expected to occur, the cumulative gain or loss that was reported in equity is immediately transferred to the statement of income within Other non-operating (expenses) income, net.
C.7.1. Fair value measurement hierarchy
Millicom uses the following fair value measurement hierarchy:
Level 1 – Quoted prices (unadjusted) in active markets for identical assets or liabilities.
Level 2 – Inputs other than quoted prices included within Level 1 that are observable for the asset or liability, either directly (that is, as prices) or indirectly (that is, derived from prices).
Level 3 – Inputs for the asset or liability that are not based on observable market data (that is, unobservable inputs).
The Group enters into derivative financial instruments with various counterparties, principally financial institutions with investment grade ratings. Interest rate swaps and foreign exchange forward contracts are valued using valuation techniques, which employ the use of markets observable data. The most frequently applied valuation techniques include forward pricing and swap models using present value calculations. The models incorporate various inputs including the credit quality of
F- 71
|
Notes to the Consolidated Financial Statements
For the years ended December 31, 2019, 2018 and 2017 (continued)
|
|
counterparties, foreign exchange spot and forward rates, yield curves of the respective currencies, interest rate curves and forward curves.
C.7.2. Fair value of financial instruments
The fair value of Millicom’s financial instruments are shown at amounts at which the instruments could be exchanged in a current transaction between willing parties, other than in a forced or liquidation sale. The fair value of all financial assets and all financial liabilities, except debt and financing approximate their carrying value largely due to the short-term maturities of these instruments. The fair values of all debt and financing have been estimated by the Group, based on discounted future cash flows at market interest rates.
Fair values of financial instruments at December 31,
|
Carrying value
|
Fair value(i)
|
||||||||
|
Note
|
2019
|
2018 (ii) (iii)
|
2019
|
2018 (ii) (iii)
|
|||||
|
(US$ millions)
|
|||||||||
|
Financial assets
|
|||||||||
|
Derivative financial instruments
|
—
|
|
—
|
|
—
|
|
—
|
|
|
|
Other non-current assets
|
66
|
|
87
|
|
66
|
|
87
|
|
|
|
Trade receivables, net
|
371
|
|
343
|
|
371
|
|
343
|
|
|
|
Amounts due from non-controlling interests, associates and joint venture partners
|
G.5.
|
68
|
|
73
|
|
68
|
|
73
|
|
|
Prepayments and accrued income
|
156
|
|
129
|
|
156
|
|
129
|
|
|
|
Supplier advances for capital expenditures
|
22
|
|
25
|
|
22
|
|
25
|
|
|
|
Equity Investment
|
371
|
|
—
|
|
371
|
|
—
|
|
|
|
Other current assets
|
181
|
|
124
|
|
181
|
|
124
|
|
|
|
Restricted cash
|
C.5.2.
|
155
|
|
158
|
|
155
|
|
158
|
|
|
Cash and cash equivalents
|
C.5.1.
|
1,164
|
|
528
|
|
1,164
|
|
528
|
|
|
Total financial assets
|
2,554
|
|
1,467
|
|
2,554
|
|
1,467
|
|
|
|
Current
|
2,449
|
|
1,341
|
|
2,449
|
|
1,341
|
|
|
|
Non-current
|
104
|
|
126
|
|
104
|
|
126
|
|
|
|
Financial liabilities
|
|||||||||
|
Debt and financing(i)
|
C.3.
|
5,972
|
|
4,580
|
|
6,229
|
|
4,418
|
|
|
Lease liabilities
|
1,063
|
|
—
|
|
1,063
|
|
—
|
|
|
|
Trade payables
|
289
|
|
282
|
|
289
|
|
282
|
|
|
|
Payables and accruals for capital expenditure
|
348
|
|
335
|
|
348
|
|
335
|
|
|
|
Derivative financial instruments
|
17
|
|
—
|
|
17
|
|
(1
|
)
|
|
|
Put option liability
|
C.7.4.
|
264
|
|
239
|
|
264
|
|
239
|
|
|
Amounts due to non-controlling interests, associates and joint venture partners
|
G.5.
|
498
|
|
483
|
|
498
|
|
483
|
|
|
Accrued interest and other expenses
|
432
|
|
381
|
|
432
|
|
381
|
|
|
|
Other liabilities
|
399
|
|
399
|
|
399
|
|
399
|
|
|
|
Total financial liabilities
|
9,282
|
|
6,698
|
|
9,538
|
|
6,536
|
|
|
|
Current
|
2,045
|
|
2,330
|
|
2,045
|
|
2,329
|
|
|
|
Non-current
|
7,237
|
|
4,370
|
|
7,493
|
|
4,208
|
|
|
|
(i)
|
Fair values are measured with reference to Level 1 (for listed bonds) or 2.
|
(ii) As at
December 31, 2018
, Debt and financing included finance lease liabilities of
$353 million
. As at
December 31, 2019
, and as a result of the application of IFRS 16, these are now shown in a separate line under Lease liabilities.
(iii) The consolidated statement of financial position at
December 31, 2018
has been restated after finalization of the Cable Onda purchase accounting (note
A.1.2.
).
F- 72
|
Notes to the Consolidated Financial Statements
For the years ended December 31, 2019, 2018 and 2017 (continued)
|
|
C.7.3. Equity investments
As at
December 31, 2019
, Millicom has the following investments in equity instruments:
|
2019
|
2018
|
|||
|
(US$ millions)
|
||||
|
Investment in Jumia
|
32
|
|
—
|
|
|
Investment in HT
|
338
|
|
—
|
|
|
Equity investment - total
|
371
|
|
—
|
|
Jumia Technologies AG (“Jumia”)
Jumia indirectly owns a number of companies that provide online services and online marketplaces in certain countries in Africa.
In January 2019, Millicom was diluted in the capital of the company following the entry of a new investor. This triggered the recognition of a net dilution gain of
$7 million
in January 2019. In addition, during Q1 2019, in preparation of Jumia's IPO, Millicom relinquished its seat on the board of directors, which resulted in the loss of the Group's significant influence over Jumia. As a result, Millicom derecognized its investment in associate in Jumia and recognized it as a financial asset (equity instrument) at fair value under IFRS 9. On April 11, 2019, Jumia completed its IPO at the offer price per share of
$14.5
and shares started trading on the NYSE on April 12, 2019.
As a result, as of March 31, 2019, a net gain of
$30 million
had been recognized and reported under ‘Income (loss) from associates, net’. Post IPO, Millicom holds
6.31%
of the outstanding shares of Jumia.
At
December 31, 2019
, the closing price of a Jumia share was
$6.73
, which values Millicom's investment at
$32 million
(level 1). The changes in fair value of
$(38) million
for the year ended
December 31, 2019
is shown under 'Other non-operating (expenses) income, net' (see note B.5).
Helios Towers plc (“HT”)
In October 2019, Helios Towers plc (a company inserted as the holding company of HTA just prior to IPO) completed its IPO on the London Stock Exchange at a price of GBP
1.15
per share valuing the company at enterprise value of approximately
$2.0 billion
and a market capitalization of
$1.45 billion
.
As part of the listing process, on October 17, 2019, Millicom first was diluted as HT management exercised their IPO option rights (~
4%
). This event triggered the recognition of a non-cash dilution loss of
$3 million
recorded under ‘Income/(loss) from other joint ventures and associates’.
On the same day, Millicom resigned from its board of directors seats, which resulted in the loss of the Group's significant influence over HT. As a result, as from that date, Millicom derecognized its investment in associate in HT and recognized it as a financial asset at fair value under IFRS 9. The derecognition of the investment in associate and recognition of the equity investment in HT at a fair value of
$292 million
triggered the recognition of a net non-cash P&L gain of
$208 million
recorded under ‘Other non-operating income (expense), net’. Fair value was determined using the IPO reference share price of GBP
1.15
.
As a result of the IPO and the subsequent exercise of the overallotment option, Millicom disposed of a portion of its ownership (in total ~
20%
) yielding
$57 million
in gross proceeds and
$25 million
in net proceeds after fees and Millicom's share in tax escrow of
$30 million
which has been deducted in full from the gain given the high level of uncertainties used in assessing the potential tax liability. These disposals did trigger a loss of
$32 million
, as a result of the tax escrow and transaction fees, and are recorded under ‘Other operating income (expenses), net’.
Post-IPO and overallotment option exercise, Millicom holds a
16.2%
stake which, as at
December 31, 2019
, is valued at
$338 million
(level 1) using a closing share price of
GBP 1.58
. The gain on derecognition and changes in fair value of
$312 million
for the year ended
December 31, 2019
is shown under 'Other non-operating (expenses) income, net' (see note B.5).
F- 73
|
Notes to the Consolidated Financial Statements
For the years ended December 31, 2019, 2018 and 2017 (continued)
|
|
C.7.4. Call and put options
Cable Onda call and put options
As part of the acquisition of Cable Onda, shareholders agreed on certain put and call options as follows:
The put option to acquire the remaining
20%
non-controlling interest in Cable Onda became exercisable
42
months after the closing date (December 13, 2018) or earlier upon the occurrence of certain events. In that respect, Millicom determined that, as the put option could be exercised under certain change of control events which could be outside the control of Millicom, the option meets the criteria under IAS 32 for recognition as a liability and corresponding equity decrease. The put option liability was payable in Millicom's shares or in cash at the discretion of the partner. Therefore, Millicom recorded a liability for the put option at acquisition completion date of
$239 million
representing the present value of the redemption amount. As of December 31, 2018, the redemption price has been valued as being
20%
of the equity value implied by the transaction. Any future change in the redemption price will be recorded in the Group's statement of income.
Millicom also received an unconditional call option which became exercisable either
42
months after December 13, 2018 closing date or if Millicom's partners’ shareholdings fall below
10%
. The call option exercise price was at fair market value. Finally, Millicom received an unconditional call option exercisable until December 13, 2019, at a price equal to the purchase price in the transaction, plus interest at
10%
per annum. The fair values of both call options were assessed as not material at December 31, 2018.
As a consequence of the Telefonica Panama acquisition, on August 29, 2019 the shareholders agreed to amend the call and put options in respect of the remaining
20%
non-controlling interest that were set as part of the acquisition of Cable Onda.
First, the parties agreed to new unconditional call and put options to acquire the remaining
20%
non-controlling interest in Cable Onda becoming exercisable at any time from July 2022, both, at fair market value.
Second, they also agreed on 'Transaction Price' call and put options conditional to the occurrence of certain events, such as change of control of Millicom or at any time if Millicom's non-controlling partners’ shareholdings fall below
10%
, and becoming exercisable on the date of the Telefonica Panama closing (August 29, 2019) and extending until July 2022. The put and call options are exercisable at the purchase price in the Cable Onda transaction (enterprise value of
$1.46 billion
), plus interest at
5%
per annum (put) and at
10%
per annum (call), respectively.
Millicom determined that, both the new unconditional put option and 'Transaction Price' put option could be exercised under events which are outside the control of Millicom. The options are payable in Millicom's shares or in cash at the discretion of the partner and therefore also meet the criteria under IAS 32 for recognition as a liability and a corresponding equity decrease - which is the same conclusion as for previous put option for which a liability had already been recognized at acquisition date in 2018. The put option liability is now valued at the higher of fair market value and Transaction Price plus interest at
5%
per annum and is payable in Millicom's shares or in cash at the discretion of the partner.
As of
December 31, 2019
, the value of the 'Transaction Price' put option is lower than fair market value, and therefore the Group recognized the put option liability at the higher of both valuations at
$264 million
(see note B.5). The Group is required to re-value the liability each reporting date and any further change in the value of the put option liability will be recorded in the Group's statement of income. Both call options are currently not exercisable and therefore no value at
December 31, 2019
.
D. Financial risk management
Exposure to interest rate, foreign currency, non-repatriation, liquidity, capital management and credit risks arise in the normal course of Millicom’s business. Each year Group Treasury revisits and presents to the Audit committee updated Treasury and Financial Risks Management policies. The Group analyzes each of these financial risks individually as well as on an interconnected basis and defines and implements strategies to manage the economic impact on the Group’s performance in line with its Financial Risk Management policy. These policies were last reviewed in late 2018. As part of the annual review of the above mentioned risks, the Group agrees to a strategy over the use of derivatives and natural hedging instruments ranging from raising debt in local currency (where the Company targets to reach
40%
of debt in local currency over the medium term) to maintain a combination of up to
75/25%
mix between fixed and floating rate debt or agreeing to cover up to six months forward of operating costs and capex denominated in non-functional currencies through a rolling and layering strategy. Millicom’s risk management strategies may include the use of derivatives to the extent a market would exist in the jurisdictions where the Group operates. Millicom’s policy prohibits the use of such derivatives in the context of speculative trading.
Accounting policies for derivatives is further detailed in note
C.7.
On
December 31, 2019
and
2018
fair value of derivatives held by the Group can be summarized as follows:
F- 74
|
Notes to the Consolidated Financial Statements
For the years ended December 31, 2019, 2018 and 2017 (continued)
|
|
|
2019
|
2018
|
|||
|
(US$ millions)
|
||||
|
Derivatives
|
||||
|
Cash flow hedge derivatives
|
(17
|
)
|
—
|
|
|
Net derivative asset (liability)
|
(17
|
)
|
—
|
|
D.1. Interest rate risk
Debt and financing issued at floating interest rates expose the Group to cash flow interest rate risk. Debt and financing issued at fixed rates expose the Group to fair value interest rate risk. The Group’s exposure to risk of changes in market interest rates relate to both of the above. To manage this risk, the Group’s policy is to maintain a combination of fixed and floating rate debt with target that more than
75%
of the debt be at fixed rate. The Group actively monitors borrowings against this target. The target mix between fixed and floating rate debt is reviewed periodically. The purpose of Millicom’s policy is to achieve an optimal balance between cost of funding and volatility of financial results, while taking into account market conditions as well as our overall business strategy. At
December 31, 2019
, approximately
76%
of the Group’s borrowings are at a fixed rate of interest or for which variable rates have been swapped for fixed rates with interest rate swaps (
2018
:
68%
).
D.1.1. Fixed and floating rate debt
Financing at
December 31, 2019
|
Amounts due within:
|
||||||||||||||
|
1 year
|
1–2 years
|
2–3 years
|
3–4 years
|
4–5 years
|
>5 years
|
Total
|
||||||||
|
(US$ millions)
|
||||||||||||||
|
Fixed rate financing
|
118
|
|
117
|
|
118
|
|
332
|
|
431
|
|
3,428
|
|
4,543
|
|
|
Weighted average nominal interest rate
|
6.32
|
%
|
5.46
|
%
|
5.01
|
%
|
7.24
|
%
|
5.44
|
%
|
5.81
|
%
|
5.86
|
%
|
|
Floating rate financing
|
68
|
|
38
|
|
27
|
|
185
|
|
654
|
|
457
|
|
1,429
|
|
|
Weighted average nominal interest rate
|
2.97
|
%
|
1.77
|
%
|
1.41
|
%
|
3.25
|
%
|
4.26
|
%
|
0.96
|
%
|
1.52
|
%
|
|
Total
|
186
|
|
155
|
|
145
|
|
517
|
|
1,085
|
|
3,884
|
|
5,972
|
|
|
Weighted average nominal interest rate
|
5.10
|
%
|
4.55
|
%
|
4.34
|
%
|
5.81
|
%
|
4.73
|
%
|
5.24
|
%
|
4.82
|
%
|
Financing at
December 31, 2018
|
Amounts due within:
|
||||||||||||||
|
1 year
|
1–2 years
|
2–3 years
|
3–4 years
|
4–5 years
|
>5 years
|
Total
|
||||||||
|
(US$ millions)
|
||||||||||||||
|
Fixed rate financing
|
140
|
|
162
|
|
137
|
|
436
|
|
204
|
|
2,036
|
|
3,116
|
|
|
Weighted average nominal interest rate
|
6.35
|
%
|
6.59
|
%
|
6.64
|
%
|
6.61
|
%
|
4.10
|
%
|
6.47
|
%
|
6.34
|
%
|
|
Floating rate financing
|
318
|
|
175
|
|
266
|
|
133
|
|
263
|
|
309
|
|
1,465
|
|
|
Weighted average nominal interest rate
|
10.28
|
%
|
5.89
|
%
|
2.73
|
%
|
0.49
|
%
|
4.41
|
%
|
1.13
|
%
|
1.98
|
%
|
|
Total
|
458
|
|
337
|
|
403
|
|
570
|
|
468
|
|
2,345
|
|
4,580
|
|
|
Weighted average nominal interest rate
|
9.08
|
%
|
6.23
|
%
|
4.06
|
%
|
5.18
|
%
|
4.28
|
%
|
5.76
|
%
|
4.95
|
%
|
A
100
basis point fall or rise in market interest rates for all currencies in which the Group had borrowings at
December 31, 2019
would increase or reduce profit before tax from continuing operations for the year by approximately
$14 million
(
2018
:
$15 million
).
F- 75
|
Notes to the Consolidated Financial Statements
For the years ended December 31, 2019, 2018 and 2017 (continued)
|
|
D.1.2. Interest rate swap contracts
From time to time, Millicom enters into currency and interest rate swap contracts to manage its exposure to fluctuations in interest rates and currency fluctuations in accordance with its Financial Risk Management policy. Details of these arrangements are provided below.
Currency and interest rate swap contracts
MIC S.A. entered into swap contracts in order to hedge the foreign currency and interest rate risks in relation to the SEK
2 billion
(~
$211 million
) senior unsecured sustainability bond issued in May 2019 (note C.3.1.). These swaps are accounted for as cash flow hedges as the timing and amounts of the cash flows under the swap agreements match the cash flows under the SEK bond. Their maturity date is May 2024. The hedging relationship is highly effective and related fluctuations are recorded through other comprehensive income. At
December 31, 2019
, the fair values of the swaps amount to
a liability
of
$0.2 million
.
Our operations in El Salvador and Costa Rica also entered into several swap agreements in order to hedge foreign currency and interest rate risks on certain long term debts. These swaps are accounted for as cash flow hedges and related fair value changes are recorded through other comprehensive income. At
December 31, 2019
, the fair values of these swaps amount to
liabilities
of
$17 million
.
Interest rate and currency swaps are measured with reference to Level 2 of the fair value hierarchy
There are no other derivative financial instruments with a significant fair value at
December 31, 2019
.
F- 76
|
Notes to the Consolidated Financial Statements
For the years ended December 31, 2019, 2018 and 2017 (continued)
|
|
D.2. Foreign currency risks
The Group is exposed to foreign exchange risk arising from various currency exposures in the countries in which it operates. Foreign exchange risk arises from future commercial transactions, recognized assets and liabilities and net investments in foreign operations.
Millicom seeks to reduce its foreign currency exposure through a policy of matching, as far as possible, assets and liabilities denominated in foreign currencies, or entering into agreements that limit the risk of exposure to currency fluctuations against the US dollar reporting currency. In some cases, Millicom may also borrow in US dollars where it is either commercially more advantageous for joint ventures and subsidiaries to incur debt obligations in US dollars or where US dollar denominated borrowing is the only funding source available to a joint venture or subsidiary. In these circumstances, Millicom accepts the remaining currency risk associated with financing its joint ventures and subsidiaries, principally because of the relatively high cost of forward cover, when available, in the currencies in which the Group operates.
D.2.1. Debt denominated in US dollars and other currencies
Debt denomination at December 31
|
2019
|
2018
|
|||
|
(US$ millions)
|
||||
|
Debt denominated in US dollars
|
3,535
|
|
2,572
|
|
|
Debt denominated in currencies of the following countries
|
||||
|
Colombia
|
531
|
|
718
|
|
|
Chad
|
—
|
|
62
|
|
|
Tanzania
|
14
|
|
112
|
|
|
Bolivia
|
350
|
|
306
|
|
|
Paraguay
|
206
|
|
207
|
|
|
El Salvador(i)
|
268
|
|
299
|
|
|
Panama(i)
|
918
|
|
261
|
|
|
Luxembourg (COP denominated)
|
43
|
|
43
|
|
|
Costa Rica
|
107
|
|
—
|
|
|
Total debt denominated in other currencies
|
2,437
|
|
2,008
|
|
|
Total debt
|
5,972
|
|
4,580
|
|
(i) El Salvador's official unit of currency is the U.S. dollar, while Panama uses the U.S. dollar as legal tender. Our local debt in both countries is therefore denominated in U.S. dollars but presented as local currency (LCY).
At
December 31, 2019
, if the US dollar had weakened/strengthened by
10%
against the other functional currencies of our operations and all other variables held constant, then profit before tax from continuing operations would have increased/decreased by
$17 million
(
2018
:
$53 million
)
. This increase/decrease in profit before tax would have mainly been as a result of the conversion of the USD-denominated net debts in our operations with functional currencies other than the US dollar.
D.2.2. Foreign currency swaps
See note
D.1.2.
Interest rate swap contracts.
D.3. Non-repatriation risk
Most of Millicom’s operating subsidiaries and joint ventures generate most of the revenue of the Group and in the currency of the countries in which they operate. Millicom is therefore dependent on the ability of its subsidiaries and joint venture operations to transfer funds to the Company.
Although foreign exchange controls exist in some of the countries in which Millicom Group companies operate, none of these controls currently significantly restrict the ability of these operations to pay interest, dividends, technical service fees, royalties or repay loans by exporting cash, instruments of credit or securities in foreign currencies. However, existing foreign exchange controls may be strengthened in countries where the Group operates, or foreign exchange controls may be introduced in countries where the Group operates that do not currently impose such restrictions. If such events were to occur, the Company’s ability to receive funds from the operations could be subsequently restricted, which would impact the Company’s ability to make payments on its interest and loans and, or pay dividends to its shareholders. As a policy, all operations which do not face restrictions to
F- 77
|
Notes to the Consolidated Financial Statements
For the years ended December 31, 2019, 2018 and 2017 (continued)
|
|
deposit funds offshore and in hard currencies should do so for the surplus cash generated on a weekly basis. The Company and its subsidiaries make use of notional and physical cash pooling arrangements in hard currencies to the extent permitted.
In addition, in some countries it may be difficult to convert large amounts of local currency into foreign currency because of limited foreign exchange markets. The practical effects of this may be time delays in accumulating significant amounts of foreign currency and exchange risk, which could have an adverse effect on the Group. This is a relatively rare case for the countries in which the Group operates.
Lastly, repatriation most often gives raise to taxation, which is evidenced in the amount of taxes paid by the Group relative to the Corporate Income Tax reported in its statement of income.
D.4. Credit and counterparty risk
Financial instruments that subject the Group to credit risk include cash and cash equivalents, pledged deposits, letters of credit, trade receivables, amounts due from joint venture partners and associates, supplier advances and other current assets and derivatives. Counterparties to agreements relating to the Group’s cash and cash equivalents, pledged deposits and letters of credit are significant financial institutions with investment grade ratings. Management does not believe there are significant risks of non-performance by these counterparties and maintain a diversified portfolio of banking partners. Allocation of deposits across banks are managed such that the Group’s counterparty risk with a given bank stays within limits which have been set, based on each bank’s credit rating.
A large portion of revenue of the Group is comprised of prepaid products and services. For postpaid customers, the Group follows risk control procedures to assess the credit quality of the customer, taking into account its financial position, past experience and other factors. Accounts receivable also comprise balances due from other telecom operators. Credit risk of other telecom operators is limited due to the regulatory nature of the telecom industry, in which licenses are normally only issued to credit-worthy companies. The Group maintains a provision for expected credit losses of trade receivables based on its historical credit loss experience.
As the Group has a large number of internationally dispersed customers, there is generally no significant concentration of credit risk with respect to trade receivables, except for certain B2B customers (mainly governments). See note
F.1.
D.5. Liquidity risk
Liquidity risk is the risk that an entity will encounter difficulty in meeting obligations associated with financial liabilities. The Group has significant indebtedness but also has significant cash balances. Millicom evaluates its ability to meet its obligations on an ongoing basis using a recurring liquidity planning tool. This tool considers the operating net cash flows generated from its operations and the future cash needs for borrowing, interest payments, dividend payments and capital and operating expenditures required in maintaining and developing its operating businesses.
The Group manages its liquidity risk through use of bank overdrafts, bank loans, bonds, vendor financing, Export Credit Agencies and Development Finance Institutions (DFI) loans. Millicom believes that there is sufficient liquidity available in the markets to meet ongoing liquidity needs. Additionally, Millicom is able to arrange offshore funding. Millicom has a diversified financing portfolio with commercial banks representing about
26%
of its gross financing (
2018
:
34%
), bonds
58%
(
2018
:
54%
), Development Finance Institutions
1%
(
2018
:
4%
) and leases
15%
(
2018
:
8%
).
F- 78
|
Notes to the Consolidated Financial Statements
For the years ended December 31, 2019, 2018 and 2017 (continued)
|
|
Maturity profile of net financial liabilities at
December 31, 2019
|
Less than 1 year
|
1 to 5 years
|
>5yrs
|
Total
|
|||||
|
(US$ millions)
|
||||||||
|
Total debt and financing
|
(186
|
)
|
(1,902
|
)
|
(3,884
|
)
|
(5,972
|
)
|
|
Lease liability
|
(97
|
)
|
(490
|
)
|
(476
|
)
|
(1,063
|
)
|
|
Cash and equivalents
|
1,164
|
|
—
|
|
—
|
|
1,164
|
|
|
Pledged deposits (related to back borrowings)
|
1
|
|
—
|
|
—
|
|
1
|
|
|
Refundable deposit
|
—
|
|
—
|
|
—
|
|
—
|
|
|
Derivative financial instruments
|
(17
|
)
|
—
|
|
—
|
|
(17
|
)
|
|
Net cash (debt) including derivatives related to debt
|
865
|
|
(2,392
|
)
|
(4,361
|
)
|
(5,888
|
)
|
|
Future interest commitments related to debt and financing
|
(308
|
)
|
(1,088
|
)
|
(106
|
)
|
(1,502
|
)
|
|
Future interest commitments related to leases
|
(157
|
)
|
(476
|
)
|
(295
|
)
|
(928
|
)
|
|
Trade payables (excluding accruals)
|
(510
|
)
|
—
|
|
—
|
|
(510
|
)
|
|
Other financial liabilities (including accruals)
|
(1,052
|
)
|
(337
|
)
|
—
|
|
(1,388
|
)
|
|
Derivative instruments
|
(17
|
)
|
—
|
|
—
|
|
(17
|
)
|
|
Put option liability
|
(264
|
)
|
—
|
|
—
|
|
(264
|
)
|
|
Trade receivables
|
371
|
|
—
|
|
—
|
|
371
|
|
|
Other financial assets
|
602
|
|
104
|
|
—
|
|
707
|
|
|
Net financial liabilities
|
(469
|
)
|
(4,189
|
)
|
(4,762
|
)
|
(9,420
|
)
|
Maturity profile of net financial liabilities at
December 31, 2018
|
Less than 1 year
|
1 to 5 years
|
>5yrs
|
Total
|
|||||
|
(US$ millions)
|
||||||||
|
Total debt and financing(i)
|
(458
|
)
|
(1,778
|
)
|
(2,345
|
)
|
(4,580
|
)
|
|
Cash and equivalents
|
528
|
|
—
|
|
—
|
|
528
|
|
|
Pledged deposits (related to back borrowings)
|
2
|
|
—
|
|
—
|
|
2
|
|
|
Net cash (debt) including derivatives related to debt
|
72
|
|
(1,778
|
)
|
(2,345
|
)
|
(4,051
|
)
|
|
Future interest commitments related to debt and financing
|
(248
|
)
|
(786
|
)
|
(77
|
)
|
(1,111
|
)
|
|
Trade payables (excluding accruals)
|
(478
|
)
|
—
|
|
—
|
|
(478
|
)
|
|
Other financial liabilities (including accruals)
|
(1,212
|
)
|
(135
|
)
|
—
|
|
(1,347
|
)
|
|
Put option liability
|
(239
|
)
|
—
|
|
—
|
|
(239
|
)
|
|
Trade receivables
|
343
|
|
—
|
|
—
|
|
343
|
|
|
Other financial assets
|
181
|
|
126
|
|
—
|
|
306
|
|
|
Net financial liabilities
|
(1,582
|
)
|
(2,573
|
)
|
(2,422
|
)
|
(6,577
|
)
|
|
(i)
|
As at
December 31, 2018
, Debt and financing included finance lease liabilities of
$353 million
. As at
December 31, 2019
, and as a result of the application of IFRS 16, these are now shown in a separate line under Lease liabilities.
|
D.6. Capital management
The primary objective of the Group’s capital management is to ensure a strong credit rating and solid capital ratios in order to support its business and maximize shareholder value.
The Group manages its capital structure with reference to local economic conditions and imposed restrictions such as debt covenants. To maintain or adjust its capital structure, the Group may make dividend payments to shareholders, return capital to shareholders through share repurchases or issue new shares. At
December 31, 2019
, Millicom is rated at one notch below investment grade by the independent rating agencies Moody’s (Ba1 negative) and Fitch (BB+ stable). The Group primarily monitors capital using net financial obligations to EBITDA.
F- 79
|
Notes to the Consolidated Financial Statements
For the years ended December 31, 2019, 2018 and 2017 (continued)
|
|
The Group reviews its gearing ratio (net financial obligations divided by total capital plus net financial obligations) periodically. Net financial obligations includes interest bearing debt and lease liabilities, less cash and cash equivalents (included restricted cash) and pledged and time deposits related to bank borrowings. Capital represents equity attributable to the equity holders of the parent.
Net financial obligations to EBITDA
|
Note
|
2019
|
2018
|
|||
|
(US$ millions)
|
|||||
|
Net financial obligations (i)
|
C.6.
|
5,870
|
|
4,051
|
|
|
EBITDA
|
B.3.
|
1,530
|
|
1,213
|
|
|
Net financial obligations to EBITDA (ii)
|
3.84
|
|
3.34
|
|
|
|
(i)
|
As at
December 31, 2018
, Net financial obligations included finance lease liabilities of
$353 million
. As at
December 31, 2019
, Net financial obligations also include Lease liabilities recognized under IFRS 16.
|
(ii) Ratio is above 3x on an IFRS basis. However, covenants are calculated on proportionate net financial obligations/EBITDA, including Guatemala and Honduras, which show results below 3x.
Gearing ratio
|
Note
|
2019
|
2018
|
|||
|
(US$ millions)
|
|||||
|
Net financial obligations (i)
|
C.6.
|
5,870
|
|
4,051
|
|
|
Equity
|
C.1.
|
2,410
|
|
2,542
|
|
|
Net financial obligations and equity
|
8,280
|
|
6,593
|
|
|
|
Gearing ratio
|
0.71
|
|
0.61
|
|
|
|
(i)
|
Same comment as (i) in the table above
.
|
E. Long-term assets
E.1. Intangible assets
Millicom’s intangible assets mainly consist of goodwill arising from acquisitions, customer lists acquired through acquisitions, licenses and rights to operate and use spectrum.
E.1.1. Accounting for intangible assets
Intangible assets acquired in business acquisitions are initially measured at fair value at the date of acquisition, and those which are acquired separately are measured at cost. Internally generated intangible assets, excluding capitalized development costs, are not capitalized but expensed to the statement of income in the expense category consistent with the function of the intangible assets. Subsequently intangible assets are carried at cost, less any accumulated amortization and any accumulated impairment losses.
Intangible assets with finite useful lives are amortized over their estimated useful economic lives using the straight-line method and assessed for impairment whenever there is an indication that the intangible asset may be impaired. The amortization period and the amortization method for intangible assets with finite useful lives are reviewed at least at each financial year end. Changes in expected useful lives or the expected beneficial use of the assets are accounted for by changing the amortization period or method, as appropriate, and treated as changes in accounting estimates.
Amortization expense on intangible assets with finite lives is recognized in the consolidated statement of income in the expense category consistent with the function of the intangible assets.
Goodwill
Goodwill represents the excess of cost of an acquisition over the Group’s share in the fair value of identifiable assets less liabilities and contingent liabilities of the acquired subsidiary, at the date of the acquisition. If the fair value or the cost of the acquisition can only be determined provisionally, then goodwill is initially accounted for using provisional values. Within 12 months of the acquisition date, any adjustments to the provisional values are recognized. This is done when the fair values and the cost of the acquisition have been finally determined. Adjustments to provisional fair values are made as if the adjusted fair
F- 80
|
Notes to the Consolidated Financial Statements
For the years ended December 31, 2019, 2018 and 2017 (continued)
|
|
values had been recognized from the acquisition date. Goodwill on acquisition of subsidiaries is included in intangible assets, net. Goodwill on acquisition of joint ventures or associates is included in investments in joint ventures and associates. Following initial recognition, goodwill is measured at cost, less any accumulated impairment losses. Gains or losses on the disposal of an entity include the carrying amount of goodwill relating to the entity sold.
Where goodwill forms part of a cash-generating unit (or group of cash-generating units) and part of the operation within that unit is disposed of, the goodwill associated with the operation disposed of is included in the carrying amount of the operation when determining the gain or loss on disposal. Goodwill disposed of in this manner is measured, based on the relative values of the operation disposed and the portion of the cash-generating unit retained.
Licenses
Licenses are recorded at either historical cost or, if acquired in a business combination, at fair value at the date of acquisition. Cost includes cost of acquisition and other costs directly related to acquisition and retention of licenses over the license period. These costs may include estimates related to fulfillment of terms and conditions related to the licenses such as service or coverage obligations, and may include up-front and deferred payments.
Licenses have a finite useful life and are carried at cost less accumulated amortization and any accumulated impairment losses. Amortization is calculated using the straight-line method to allocate the cost of the licenses over their estimated useful lives.
The terms of licenses, which have been awarded for various periods, are subject to periodic review for, among other things, rate setting, frequency allocation and technical standards. Licenses are initially measured at cost and are amortized from the date the network is available for use on a straight-line basis over the license period. Licenses held, subject to certain conditions, are usually renewable and generally non-exclusive. When estimating useful lives of licenses, renewal periods are included only if there is evidence to support renewal by the Group without significant cost.
Trademarks and customer lists
Trademarks and customer lists are recognized as intangible assets only when acquired or gained in a business combination. Their cost represents fair value at the date of acquisition. Trademarks and customer lists have indefinite or finite useful lives. Indefinite useful life trademarks are tested for impairment annually. Finite useful life trademarks are carried at cost, less accumulated amortization. Amortization is calculated using the straight-line method to allocate the cost of the trademarks and customer lists over their estimated useful lives. The estimated useful lives for trademarks and customer lists are based on specific characteristics of the market in which they exist. Trademarks and customer lists are included in Intangible assets, net.
Estimated useful lives are:
|
Years
|
|
|
Estimated useful lives
|
|
|
Trademarks
|
1 to 15
|
|
Customer lists
|
4 to 20
|
Programming and content rights
Programming and content master rights which are purchased or acquired in business combinations which meet certain criteria are recorded at cost as intangible assets. The rights must be exclusive, related to specific assets which are sufficiently developed, and probable to bring future economic benefits and have validity for more than one year. Cost includes consideration paid or payable and other costs directly related to the acquisition of the rights, and are recognized at the earlier of payment or commencement of the broadcasting period to which the rights relate.
Programming and content rights capitalized as intangible assets have a finite useful life and are carried at cost, less accumulated amortization and any accumulated impairment losses. Amortization is calculated using the straight-line method to allocate the cost of the rights over their estimated useful lives.
Non-exclusive and programming and content rights for periods less than
one
year are expensed over the period of the rights.
Indefeasible rights of use
There is no universally-accepted definition of an indefeasible rights of use (IRU). These agreements come in many forms. However, the key characteristics of a typical arrangement include:
|
•
|
The right to use specified network infrastructure or capacity;
|
|
•
|
For a specified term (often the majority of the useful life of the relevant assets);
|
|
•
|
Legal title is not transferred;
|
F- 81
|
Notes to the Consolidated Financial Statements
For the years ended December 31, 2019, 2018 and 2017 (continued)
|
|
|
•
|
A number of associated service agreements including operations and maintenance (O&M) and co-location agreements. These are typically for the same term as the IRU; and
|
|
•
|
Any payments are usually made in advance.
|
IRUs are accounted for either as a lease, or service contract based on the substance of the underlying agreement.
IRU arrangements will qualify as a lease if, and when:
|
•
|
The purchaser has an exclusive right for a specified period and has the ability to resell (or sublet) the capacity; and
|
|
•
|
The capacity is physically limited and defined; and
|
|
•
|
The purchaser bears all costs related to the capacity (directly or not) including costs of operation, administration and maintenance; and
|
|
•
|
The purchaser bears the risk of obsolescence during the contract term.
|
If all of these criteria are not met, the IRU is treated as a service contract.
An IRU of network infrastructure (cables or fiber) is accounted for as a right of use asset (see
E.3.
), while capacity IRU (wavelength) is accounted for as an intangible asset.
The costs of an IRU recognized as service contract is recognized as prepayment and amortized in the statement of income as incurred over the duration of the contract.
E.1.2. Impairment of non-financial assets
At each reporting date Millicom assesses whether there is an indication that a non-financial asset may be impaired. If any such indication exists, or when annual impairment testing for a non-financial asset is required, an estimate of the asset’s recoverable amount is made. The recoverable amount is determined based on the higher of its fair value less cost to sell, and its value in use, for individual assets, unless the asset does not generate cash inflows that are largely independent of those from other assets or groups of assets.
Where the carrying amount of an asset exceeds its recoverable amount, the asset is considered impaired and is written down to its recoverable amount. Where no comparable market information is available, the fair value, less cost to sell, is determined based on the estimated future cash flows discounted to their present value using a discount rate that reflects current market conditions for the time value of money and risks specific to the asset. The foregoing analysis also evaluates the appropriateness of the expected useful lives of the assets. Impairment losses related to assets of continuing operations are recognized in the consolidated statement of income in expense categories consistent with the function of the impaired asset.
At each reporting date an assessment is made as to whether there is any indication that previously recognized impairment losses may no longer exist or may have decreased. If such indication exists, the recoverable amount is estimated. Other than for goodwill, a previously recognized impairment loss is reversed if there has been a change in the estimate used to determine the asset’s recoverable amount since the last impairment loss was recognized. If so, the carrying amount of the asset is increased to its recoverable amount. The increased amount cannot exceed the carrying amount that would have been determined, net of depreciation, had no impairment loss been recognized for the asset in prior years. Such reversal is recognized in profit or loss.
After such a reversal, the depreciation charge is adjusted in future periods to allocate the asset’s revised carrying amount, less any residual value, on a systematic basis over its remaining useful life.
E.1.3. Movements in intangible assets
On May 20, 2019 the Group renewed 10MHz of the 1900 MHz spectrum in Colombia for a period of
10 years
for an amount of
$47 million
(payable in
five
installments from June 2019 to February 2023) and an obligation to build
45
sites during the
20
-month period following the renewal (approximately
$20 million
cost, that will be capitalized once the sites are built). In December 2019, the company substituted its coverage obligation by agreeing to pay the corresponding amount of
$20 million
in cash in
6
installments between January to June 2020. As a result, Management recognized an addition to spectrum assets and a liability for
$20 million
.
On July 9, 2019, the Tanzania Communications Regulatory Authority ('TCRA') issued a notice to cancel the license of Telesis, a subsidiary of Millicom in Tanzania that shared its 4G spectrum with Tigo and Zantel operations in the country. The net carrying value of the Telesis' license amounting to
$8 million
has therefore been impaired during Q3 2019. As a consequence and in order to continue providing 4G services in the country, our operation in Tanzania had to purchase spectrum in the 800MHz band from the TCRA for a period of
15 years
and for an amount of
$12 million
.
F- 82
|
Notes to the Consolidated Financial Statements
For the years ended December 31, 2019, 2018 and 2017 (continued)
|
|
In December 2019,
Millicom's wholly-owned subsidiary Telemovil El Salvador S.A. de C.V. ('Telemovil') acquired spectrum in 50Mhz AWS band and paid an advance of
$14 million
. On January 8, 2020, Telemovil made a final payment of
$20 million
and started operating the spectrum.
In December 2019, Tigo Colombia participated in an auction launched by the Ministerio de Tecnologias de la Informacion y las Comunicaciones (MINTIC), and acquired licenses granting the right to use a total of 40 MHz in the 700 MHz band. The
20
-year license will expire in 2040. As a result of this auction,Tigo Colombia has strengthened its spectrum position, which also includes 55 MHz in the 1900 band and 30 MHz of AWS. Tigo Colombia agreed to a total notional consideration of COP
$2.45 billion
(equivalent to approximately US
$736 million
), of which approximately
45%
is to be met by coverage obligations implemented by 2025.
The remaining
55%
is payable in cash with an initial payment of approximately US
$39 million
to be made in Q1 2020, with the remainder payable in 12 annual installments beginning in 2026 and ending in 2037. The final permission to operate in 700 MHz will be given in February 2020
.
Movements in intangible assets in
2019
|
Goodwill
|
Licenses
|
Customer Lists
|
IRUs
|
Trademark
|
Other (i)
|
Total
|
||||||||
|
(US$ millions)
|
||||||||||||||
|
Opening balance, net
|
1,069
|
|
318
|
|
371
|
|
89
|
|
282
|
|
218
|
|
2,346
|
|
|
Change in scope
|
650
|
|
139
|
|
141
|
|
10
|
|
—
|
|
20
|
|
959
|
|
|
Additions
|
—
|
|
101
|
|
—
|
|
—
|
|
—
|
|
101
|
|
202
|
|
|
Amortization charge
|
—
|
|
(55
|
)
|
(37
|
)
|
(14
|
)
|
(99
|
)
|
(67
|
)
|
(272
|
)
|
|
Impairment
|
—
|
|
(8
|
)
|
—
|
|
—
|
|
—
|
|
—
|
|
(8
|
)
|
|
Disposals, net
|
—
|
|
—
|
|
—
|
|
—
|
|
—
|
|
—
|
|
—
|
|
|
Transfers
|
—
|
|
(5
|
)
|
—
|
|
23
|
|
—
|
|
15
|
|
33
|
|
|
Transfer to/from held for sale (see note E.3)
|
—
|
|
(18
|
)
|
—
|
|
—
|
|
—
|
|
(3
|
)
|
(21
|
)
|
|
Exchange rate movements
|
(7
|
)
|
(8
|
)
|
(1
|
)
|
—
|
|
—
|
|
(4
|
)
|
(21
|
)
|
|
Closing balance, net
|
1,711
|
|
465
|
|
473
|
|
107
|
|
183
|
|
279
|
|
3,219
|
|
|
Cost or valuation
|
1,711
|
|
922
|
|
691
|
|
214
|
|
325
|
|
806
|
|
4,670
|
|
|
Accumulated amortization and impairment
|
—
|
|
(458
|
)
|
(218
|
)
|
(107
|
)
|
(142
|
)
|
(527
|
)
|
(1,451
|
)
|
|
Net
|
1,711
|
|
465
|
|
473
|
|
107
|
|
183
|
|
279
|
|
3,219
|
|
Movements in intangible assets in
2018
|
Goodwill
|
Licenses
|
Customer Lists
|
IRUs
|
Trademark
|
Other (i)
|
Total
|
||||||||
|
(US$ millions)
|
||||||||||||||
|
Opening balance, net
|
599
|
|
324
|
|
33
|
|
105
|
|
10
|
|
194
|
|
1,265
|
|
|
Change in scope
|
504
|
|
—
|
|
350
|
|
—
|
|
280
|
|
23
|
|
1,157
|
|
|
Additions
|
—
|
|
66
|
|
—
|
|
2
|
|
—
|
|
91
|
|
158
|
|
|
Amortization charge
|
—
|
|
(48
|
)
|
(11
|
)
|
(14
|
)
|
(8
|
)
|
(65
|
)
|
(145
|
)
|
|
Impairment
|
(6
|
)
|
—
|
|
—
|
|
—
|
|
—
|
|
—
|
|
(6
|
)
|
|
Disposals, net
|
—
|
|
—
|
|
—
|
|
—
|
|
—
|
|
—
|
|
—
|
|
|
Transfers
|
—
|
|
—
|
|
—
|
|
1
|
|
—
|
|
(16
|
)
|
(15
|
)
|
|
Transfer to/from held for sale (iii)
|
—
|
|
(12
|
)
|
—
|
|
—
|
|
—
|
|
—
|
|
(12
|
)
|
|
Exchange rate movements
|
(28
|
)
|
(12
|
)
|
(1
|
)
|
(5
|
)
|
—
|
|
(9
|
)
|
(55
|
)
|
|
Closing balance, net
|
1,069
|
|
318
|
|
371
|
|
89
|
|
282
|
|
218
|
|
2,346
|
|
|
Cost or valuation
|
1,069
|
|
646
|
|
561
|
|
176
|
|
325
|
|
646
|
|
3,423
|
|
|
Accumulated amortization and impairment
|
—
|
|
(328
|
)
|
(190
|
)
|
(87
|
)
|
(43
|
)
|
(428
|
)
|
(1,077
|
)
|
|
Net
|
1,069
|
|
318
|
|
371
|
|
89
|
|
282
|
|
218
|
|
2,346
|
|
|
(i)
|
Other includes mainly software costs
|
F- 83
|
Notes to the Consolidated Financial Statements
For the years ended December 31, 2019, 2018 and 2017 (continued)
|
|
E.1.4. Cash used for the purchase of intangible assets
Cash used for intangible asset additions
|
2019
|
2018
|
2017
|
||||
|
(US$ millions)
|
||||||
|
Additions
|
202
|
|
158
|
|
130
|
|
|
Change in accruals and payables for intangibles
|
(32
|
)
|
(10
|
)
|
3
|
|
|
Cash used for additions
|
171
|
|
148
|
|
133
|
|
E.1.5. Goodwill
Allocation of Goodwill to cash generating units (CGUs), net of exchange rate movements and after impairment
|
2019
|
2018
|
|||
|
(US$ millions)
|
||||
|
Panama (see note A.1.2.)(i)
|
930
|
|
504
|
|
|
El Salvador
|
194
|
|
194
|
|
|
Costa Rica
|
123
|
|
116
|
|
|
Paraguay
|
50
|
|
54
|
|
|
Colombia
|
181
|
|
183
|
|
|
Tanzania (see note E.1.6.)
|
12
|
|
12
|
|
|
Nicaragua (see note A.1.2)
|
217
|
|
4
|
|
|
Other
|
3
|
|
3
|
|
|
Total
|
1,711
|
|
1,069
|
|
(i) Restated
as a result of the finalization of the Cable Onda purchase accounting. (note
A.1.2.
).
E.1.6. Impairment testing of goodwill
Goodwill from CGUs is tested for impairment at least each year and more frequently if events or changes in circumstances indicate that the carrying value may be impaired. Impairment losses on goodwill are not reversed.
Goodwill arising on business combinations is allocated to each of the Group’s CGUs or groups of CGUs that are expected to benefit from the synergies of the combination, irrespective of whether other assets or liabilities of the Group are assigned to those units or groups of units. Each unit or group of units to which the goodwill is allocated:
|
•
|
Represents the lowest level within the Group at which the goodwill is monitored for internal management purposes; and
|
|
•
|
Is not larger than an operating segment.
|
Impairment is determined by assessing the value-in-use and, if appropriate, the fair value less costs to sell of the CGU (or group of CGUs), to which goodwill relates.
Impairment testing at
December 31, 2019
Goodwill was tested for impairment by assessing the recoverable amount against the carrying amount of the CGU based on discounted cash flows. The recoverable amounts are based on value-in-use. The value-in-use is determined based on the method of discounted cash flows. The cash flow projections used (operating profit margins, income tax, working capital, capex and license renewal cost) are extracted from business plans approved by management and presented to the Board, usually covering a period of five years. This planning horizon reflects industry practice in the countries where the Group operates and stage of development or redevelopment of the business in those countries. Cash flows beyond this period are extrapolated using a perpetual growth rate. When value-in-use results are lower than the carrying values of the CGUs, management determines the recoverable amount by using the fair value less cost of disposal (FVLCD) of the CGUs. FVLCD is usually determined by using recent offers received from third parties (Level 1).
For the year ended December 31, 2019, management concluded no impairment should be recorded in the Group consolidated financial statements.
F- 84
|
Notes to the Consolidated Financial Statements
For the years ended December 31, 2019, 2018 and 2017 (continued)
|
|
Impairment testing at
December 31, 2018
For the year ended
December 31, 2018
, management concluded that our previously independent Zantel CGU, part of the Africa segment, should be impaired. Hence, in accordance with IAS 36, an impairment loss of
$6 million
has been allocated to the amount of goodwill allocated to the CGU to reduce the carrying amount of this operation to its value in use. The impairment has been classified within the caption "Other operating income (expenses), net", in the Group’s statement of income.
Key assumptions used in value in use calculations
The process of preparing the cash flow projections considers the current market condition of each CGU, analyzing the macroeconomic, competitive, regulatory and technological environments, as well as the growth opportunities of the CGUs. Therefore, a growth target is defined for each CGU, based on the appropriate allocation of operating resources and the capital investments required to achieve the target. The foregoing forecasts could differ from the results obtained through time; however, the Company prepares its estimates based on the current situation of each of the CGUs. Relevance of budgets used for the impairment test is also reviewed annually, management performing regressive analysis between actual figures and budget/5YP used for previous year impairment test.
The cash flow projections for all CGUs is most sensitive to the following key assumptions:
|
•
|
EBITDA margin is determined by dividing EBITDA by total revenues.
|
|
•
|
CAPEX intensity is determined by dividing CAPEX by total revenues.
|
|
•
|
Gross Domestic Product (“GDP”) less inflation rates are used as perpetual growth rate.
|
|
•
|
Weighted average cost of capital (“WACC”) is used to discount the projected cash flows.
|
The most significant estimates used for the 2019 and 2018 impairment test are shown below:
|
CGU
|
Average EBITDA margin (%) (i)
|
Average CAPEX intensity (%) (i)
|
Perpetual growth rate (%)
|
WACC rate after tax (%)
|
||||
|
2019
|
2018
|
2019
|
2018
|
2019
|
2018
|
2019
|
2018
|
|
|
Bolivia
|
42.0
|
43.1
|
18.4
|
17.0
|
1.5
|
3.0
|
10.7
|
10.2
|
|
Chad (see note A.1.3)
|
n/a
|
26.7
|
n/a
|
15.9
|
n/a
|
2.6
|
n/a
|
14.8
|
|
Colombia
|
34.1
|
32.1
|
17.7
|
19.3
|
1.9
|
2.9
|
8.6
|
8.9
|
|
Costa Rica
|
36.3
|
41.2
|
23.3
|
19.9
|
1.9
|
3.1
|
10.1
|
10.2
|
|
El Salvador
|
33.4
|
42.2
|
15.2
|
15.7
|
0.8
|
1.6
|
10.7
|
11.7
|
|
Nicaragua (see note A.1.2)
|
33.7
|
41.0
|
16.2
|
49.6
|
2.0
|
3.6
|
10.9
|
10.1
|
|
Panamá (see note A.1.2)
|
42.6
|
n/a
|
14.8
|
n/a
|
1.5
|
n/a
|
8.3
|
n/a
|
|
Paraguay
|
46.9
|
50.4
|
16.0
|
17.3
|
1.6
|
3.0
|
9.0
|
9.8
|
|
Tanzania
|
31.2
|
37.1
|
12.2
|
18.5
|
1.5
|
4.6
|
14.4
|
14.4
|
(i) Average is computed over the period covered by the plan (5 years)
Sensitivity analysis to changes in assumptions
Management performed a sensitivity analysis on key assumptions within the test. The following maximum increases or decreases, expressed in percentage points, were considered for all CGUs:
|
Reasonable changes in key assumptions (%)
|
|
|
Financial variables
|
|
|
WACC rates
|
+/-1
|
|
Perpetual growth rates
|
+/-1
|
|
Operating variables
|
|
|
EBITDA margin
|
+/-2
|
|
CAPEX intensity
|
+/-1
|
F- 85
|
Notes to the Consolidated Financial Statements
For the years ended December 31, 2019, 2018 and 2017 (continued)
|
|
The sensitivity analysis shows a comfortable headroom between the recoverable amounts and the carrying values for all CGUs at
December 31, 2019
, except of our Nicaragua CGU.
In respect of Nicaragua CGU, taken individually, the below changes in key assumptions would trigger a potential impairment, which would mainly be due to the under-performance of our legacy fixed business in the country as well as the current political and economic turmoil:
|
Sensitivity analysis
|
Potential impairment
|
|
|
|
In %
|
US$ millions
|
|
Financial variables
|
|
|
|
WACC rate
|
+1
|
32
|
|
Perpetual growth rate
|
-1
|
18
|
|
Operating variables
|
|
|
|
EBITDA margin
|
-2
|
1
|
|
Combining changes in variables
|
|
|
|
WACC rate and Perpetual growth rate
|
+1 and -1
|
63
|
E.2. Property, plant and equipment
E.2.1. Accounting for property, plant and equipment
Items of property, plant and equipment are stated at either historical cost, or the lower of fair value and present value of the future minimum lease payments for assets under finance leases, less accumulated depreciation and accumulated impairment. Historical cost includes expenditure that is directly attributable to acquisition of items. The carrying amount of replaced parts is derecognized.
Depreciation is calculated using the straight-line method over the shorter of the estimated useful life of the asset and the remaining life of the license associated with the assets, unless the renewal of the license is contractually possible.
|
Estimated useful lives
|
Duration
|
|
Buildings
|
40 years or lease period, if shorter
|
|
Networks (including civil works)
|
5 to 15 years or lease period, if shorter
|
|
Other
|
2 to 7 years
|
The carrying values of property, plant and equipment are reviewed for impairment when events or changes in circumstances indicate that the carrying value may not be recoverable. The assets’ residual value and useful life is reviewed, and adjusted if appropriate, at each statement of financial position date. An asset’s carrying amount is written down immediately to its recoverable amount if its carrying amount is greater than its estimated recoverable amount.
Construction in progress consists of the cost of assets, labor and other direct costs associated with property, plant and equipment being constructed by the Group, or purchased assets which have yet to be deployed. When the assets become operational, the related costs are transferred from construction in progress to the appropriate asset category and depreciation commences.
Subsequent costs are included in the asset’s carrying amount or recognized as a separate asset, as appropriate, when it is probable that future economic benefits associated with the item will flow to the Group and the cost of the item can be measured reliably. Ongoing routine repairs and maintenance are charged to the statement of income in the financial period in which they are incurred.
Costs of major inspections and overhauls are added to the carrying value of property, plant and equipment and the carrying amount of previous major inspections and overhauls is derecognized.
Equipment installed on customer premises which is not sold to customers is capitalized and amortized over the customer contract period.
A liability for the present value of the cost to remove an asset on both owned and leased sites (for example cell towers) and for assets installed on customer premises (for example set-top boxes), is recognized when a present obligation for the removal exists.
F- 86
|
Notes to the Consolidated Financial Statements
For the years ended December 31, 2019, 2018 and 2017 (continued)
|
|
The corresponding cost of the obligation is included in the cost of the asset and depreciated over the useful life of the asset, or lease period if shorter.
Borrowing costs that are directly attributable to the acquisition or construction of a qualifying asset are capitalized as part of the cost of that asset when it is probable that such costs will contribute to future economic benefits for the Group and the costs can be measured reliably.
E.2.2. Movements in tangible assets
Movements in tangible assets in
2019
|
Network Equipment (ii)
|
Land and Buildings
|
Construction in Progress
|
Other(i)
|
Total
|
||||||
|
(US$ millions)
|
||||||||||
|
Opening balance, net
|
2,455
|
|
175
|
|
284
|
|
156
|
|
3,071
|
|
|
Change in scope
|
190
|
|
44
|
|
14
|
|
7
|
|
255
|
|
|
Change in accounting policy
|
(307
|
)
|
—
|
|
—
|
|
(1
|
)
|
(307
|
)
|
|
Additions
|
87
|
|
4
|
|
612
|
|
16
|
|
719
|
|
|
Impairments/reversal of impairment, net
|
—
|
|
—
|
|
—
|
|
1
|
|
1
|
|
|
Disposals, net
|
(8
|
)
|
(1
|
)
|
(6
|
)
|
(3
|
)
|
(19
|
)
|
|
Depreciation charge
|
(588
|
)
|
(13
|
)
|
—
|
|
(110
|
)
|
(711
|
)
|
|
Asset retirement obligations
|
14
|
|
5
|
|
—
|
|
—
|
|
19
|
|
|
Transfers
|
444
|
|
4
|
|
(537
|
)
|
64
|
|
(24
|
)
|
|
Transfer from/(to) assets held for sale (see note E.4)
|
(61
|
)
|
(14
|
)
|
(7
|
)
|
(5
|
)
|
(88
|
)
|
|
Exchange rate movements
|
(25
|
)
|
(2
|
)
|
(5
|
)
|
(1
|
)
|
(34
|
)
|
|
Closing balance, net
|
2,201
|
|
202
|
|
355
|
|
125
|
|
2,883
|
|
|
Cost or valuation
|
6,644
|
|
360
|
|
355
|
|
476
|
|
7,834
|
|
|
Accumulated amortization and impairment
|
(4,443
|
)
|
(158
|
)
|
—
|
|
(351
|
)
|
(4,952
|
)
|
|
Net at December 31, 2019
|
2,201
|
|
202
|
|
355
|
|
125
|
|
2,883
|
|
Movements in tangible assets in
2018
|
Network equipment(ii)
|
Land and buildings
|
Construction in progress
|
Other(i)
|
Total
|
||||||
|
(US$ millions)
|
||||||||||
|
Opening balance, net
|
2,399
|
|
147
|
|
206
|
|
128
|
|
2,880
|
|
|
Change in Scope (iii)
|
253
|
|
41
|
|
32
|
|
60
|
|
386
|
|
|
Additions
|
62
|
|
1
|
|
626
|
|
7
|
|
696
|
|
|
Impairments/reversal of impairment, net
|
1
|
|
—
|
|
—
|
|
—
|
|
1
|
|
|
Disposals, net
|
(24
|
)
|
(2
|
)
|
(2
|
)
|
—
|
|
(29
|
)
|
|
Depreciation charge
|
(631
|
)
|
(11
|
)
|
—
|
|
(43
|
)
|
(685
|
)
|
|
Asset retirement obligations
|
14
|
|
1
|
|
—
|
|
—
|
|
15
|
|
|
Transfers
|
551
|
|
9
|
|
(568
|
)
|
14
|
|
6
|
|
|
Transfers from/(to) assets held for sale
(see note E.4.)(iv) |
(45
|
)
|
(3
|
)
|
(2
|
)
|
(2
|
)
|
(52
|
)
|
|
Exchange rate movements
|
(124
|
)
|
(8
|
)
|
(8
|
)
|
(7
|
)
|
(147
|
)
|
|
Closing balance, net
|
2,455
|
|
175
|
|
284
|
|
156
|
|
3,071
|
|
|
Cost or valuation
|
6,663
|
|
270
|
|
284
|
|
573
|
|
7,790
|
|
|
Accumulated amortization and impairment
|
(4,207
|
)
|
(95
|
)
|
—
|
|
(417
|
)
|
(4,719
|
)
|
|
Net at December 31, 2018
|
2,455
|
|
175
|
|
284
|
|
156
|
|
3,071
|
|
|
(i)
|
Other mainly includes office equipment and motor vehicles.
|
F- 87
|
Notes to the Consolidated Financial Statements
For the years ended December 31, 2019, 2018 and 2017 (continued)
|
|
|
(ii)
|
As a result of the application of IFRS 16 finance leases were reclassified to lease liabilities on January 1, 2019. See above in the "New and amended IFRS accounting standards" and notes C.4. and E.4. for further information. The net carrying amount of network equipment under finance leases at
December 31, 2018
were
$307 million
.
|
(iii) Restated after finalization of the Cable Onda purchase accounting. See note
A.1.2.
Borrowing costs capitalized for the years ended December 31,
2019
,
2018
and
2017
were not significant.
E.2.3. Cash used for the purchase of tangible assets
Cash used for property, plant and equipment additions
|
2019
|
2018
|
2017
|
||||
|
(US$ millions)
|
||||||
|
Additions
|
719
|
|
698
|
|
824
|
|
|
Change in advances to suppliers
|
1
|
|
2
|
|
(8
|
)
|
|
Change in accruals and payables for property, plant and equipment
|
17
|
|
(25
|
)
|
26
|
|
|
Finance leases(i)
|
(1
|
)
|
(43
|
)
|
(192
|
)
|
|
Cash used for additions
|
736
|
|
632
|
|
650
|
|
|
(i)
|
As a result of the application of IFRS 16 finance leases were reclassified to lease liabilities on January 1, 2019. See above in the "New and amended IFRS accounting standards" and notes C.4. and E.4. for further information.
|
E.3. Right of use assets (as from January 1, 2019 after the application of IFRS 16)
Right-of-use assets are measured at cost comprising the following:
|
•
|
the amount of the initial measurement of lease liability
|
|
•
|
any lease payments made at or before the commencement date less any lease incentives received
|
|
•
|
any initial direct costs, and
|
|
•
|
restoration costs
|
Refer to note C.4. for further details on lease accounting policies.
Movements in right of use assets in
2019
F- 88
|
Notes to the Consolidated Financial Statements
For the years ended December 31, 2019, 2018 and 2017 (continued)
|
|
|
Right-of-use assets
|
Land and buildings
|
Sites rental
|
Tower rental
|
Other network equipment
|
Capacity
|
Other
|
Total
|
|||||||
|
(US$ millions)
|
||||||||||||||
|
Opening balance, net
|
154
|
|
67
|
|
623
|
|
9
|
|
—
|
|
4
|
|
856
|
|
|
Change in scope
|
—
|
|
43
|
|
121
|
|
1
|
|
12
|
|
—
|
|
177
|
|
|
Additions
|
25
|
|
4
|
|
67
|
|
1
|
|
2
|
|
1
|
|
102
|
|
|
Modifications
|
6
|
|
(2
|
)
|
7
|
|
—
|
|
—
|
|
—
|
|
11
|
|
|
Impairments
|
(1
|
)
|
—
|
|
—
|
|
—
|
|
—
|
|
—
|
|
(1
|
)
|
|
Disposals
|
(4
|
)
|
(4
|
)
|
(1
|
)
|
—
|
|
—
|
|
—
|
|
(10
|
)
|
|
Depreciation
|
(35
|
)
|
(16
|
)
|
(86
|
)
|
(2
|
)
|
—
|
|
(2
|
)
|
(141
|
)
|
|
Transfers
|
—
|
|
—
|
|
1
|
|
—
|
|
—
|
|
—
|
|
1
|
|
|
Transfers to/from assets held for sale
|
(1
|
)
|
(5
|
)
|
(3
|
)
|
—
|
|
—
|
|
—
|
|
(9
|
)
|
|
Exchange rate movements
|
—
|
|
(2
|
)
|
(7
|
)
|
—
|
|
—
|
|
—
|
|
(10
|
)
|
|
Closing balance, net
|
145
|
|
87
|
|
720
|
|
8
|
|
14
|
|
3
|
|
977
|
|
|
Cost of valuation
|
177
|
|
103
|
|
900
|
|
11
|
|
16
|
|
8
|
|
1,216
|
|
|
Accumulated depreciation and impairment
|
(32
|
)
|
(16
|
)
|
(180
|
)
|
(3
|
)
|
(2
|
)
|
(5
|
)
|
(238
|
)
|
|
Net at December 31, 2019
|
145
|
|
87
|
|
720
|
|
8
|
|
14
|
|
3
|
|
977
|
|
F- 89
|
Notes to the Consolidated Financial Statements
For the years ended December 31, 2019, 2018 and 2017 (continued)
|
|
E.4. Assets held for sale
If Millicom decides to sell subsidiaries, investments in joint ventures or associates, or specific non-current assets in its businesses, these items qualify as assets held for sale if certain conditions are met.
E.4.1. Classification of assets held for sale
Non-current assets (or disposal groups) are classified as assets held for sale and stated at the lower of carrying amount and fair value less costs to sell if their carrying amount is expected to be recovered principally through sale, not through continuing use. Liabilities of disposal groups are classified as Liabilities directly associated with assets held for sale.
E.4.2. Millicom’s assets held for sale
The following table summarizes the nature of the assets and liabilities reported under assets held for sale and liabilities directly associated with assets held for sale as at
December 31, 2019
and
2018
:
|
As at December 31,
|
||||
|
2019
|
2018
|
|||
|
(US$ millions)
|
||||
|
Assets and liabilities reclassified as held for sale ($ millions)
|
||||
|
Towers Paraguay (see note E.4.1.)
|
—
|
|
2
|
|
|
Towers Colombia (see note E.4.1.)
|
2
|
|
—
|
|
|
Towers El Salvador (see note E.4.1.)
|
1
|
|
1
|
|
|
Towers Zantel
|
1
|
|
—
|
|
|
Other
|
—
|
|
—
|
|
|
Total assets of held for sale
|
5
|
|
3
|
|
|
Towers Paraguay
|
—
|
|
—
|
|
|
Total liabilities directly associated with assets held for sale
|
—
|
|
—
|
|
|
Net assets held for sale / book value
|
5
|
|
3
|
|
Chad
As mentioned in note
A.1.3.
, on June 26, 2019, the Group completed the disposal of its operations in Chad for a cash consideration of
$110 million
. On the same date, Chad was deconsolidated and a gain on disposal of
$77 million
, net of costs of disposal of
$4 million
, was recognized. Foreign currency exchange losses accumulated in equity of
$8 million
have also been recycled in the statement of income accordingly. The resulting net gain of
$70 million
has been recognized under ‘Profit (loss) for the period from discontinued operations, net of tax’. The operating net loss of the operation for the period from January 1, 2019 to June 26, 2019 was
$5 million
.
The assets and liabilities deconsolidated on the date of the disposal were as follows:
|
Assets and liabilities held for sale ($ millions)
|
June 26, 2019
|
|
Intangible assets, net
|
18
|
|
Property, plant and equipment, net
|
89
|
|
Right of use assets
|
9
|
|
Other non-current assets
|
8
|
|
Current assets
|
34
|
|
Cash and cash equivalents
|
9
|
|
Total assets of disposal group held for sale
|
168
|
|
Non-current financial liabilities
|
8
|
|
Current liabilities
|
131
|
|
Total liabilities of disposal group held for sale
|
140
|
|
Net assets held for sale at book value
|
28
|
F- 90
|
Notes to the Consolidated Financial Statements
For the years ended December 31, 2019, 2018 and 2017 (continued)
|
|
Senegal
As mentioned in note
A.1.3.
Millicom announced that it had agreed to sell its Senegal business to a consortium consisting of NJJ, Sofima (managed by the Axian Group) and Teylium Group. The sale was completed on April 27, 2018 in exchange of a final cash consideration of
$151 million
. The operations in Senegal were deconsolidated from that date resulting in a net gain on disposal of
$6 million
, including the recycling of foreign currency exchange losses accumulated in equity since the creation of the local operations. This gain has been recognized under ‘Profit (loss) for the year from discontinued operations, net of tax’.
The assets and liabilities were transferred to assets held for sale in relation to our operations in Senegal as at February 7, 2017 and therefore classified as held for sale as at December 31, 2017.
The table below shows the assets and liabilities deconsolidated at the date of the disposal:
|
April 27, 2018
|
||
|
Assets and liabilities held for sale
|
(US$ millions)
|
|
|
Intangible assets, net
|
40
|
|
|
Property, plant and equipment, net
|
126
|
|
|
Other non-current assets
|
2
|
|
|
Current assets
|
56
|
|
|
Cash and cash equivalents
|
3
|
|
|
Total assets of disposal group held for sale
|
227
|
|
|
Non-current financial liabilities
|
8
|
|
|
Current liabilities
|
73
|
|
|
Total liabilities of disposal group held for sale
|
81
|
|
|
Net assets / book value
|
146
|
|
Rwanda
As mentioned in note
A.1.3.
on December 19, 2017, Millicom announced that it has signed an agreement for the sale of its Rwanda operations to subsidiaries of Bharti Airtel Limited.for a final cash consideration of
$51 million
, including a deferred cash payment due in January 2020 for an amount of
$18 million
. The transaction also included earn-outs for
$7 million
that were not recognized by the Group. The sale was completed on January 31, 2018. On that day, Millicom's operations in Rwanda have been deconsolidated and no material loss on disposal was recognized (its carrying value was aligned to its fair value less costs of disposal as of December 31, 2017). However, a loss of
$32 million
was recognized in
2018
corresponding to the recycling of foreign currency exchange losses accumulated in equity since the creation of the local operation. This loss has been recognized under ‘Profit (loss) for the year from discontinued operations, net of tax’.
The table below shows the assets and liabilities deconsolidated at the date of the disposal:
|
January 31, 2018
|
||
|
Assets and liabilities reclassified as held for sale
|
(US$ millions)
|
|
|
Intangible assets, net
|
12
|
|
|
Property, plant and equipment, net
|
53
|
|
|
Other non-current assets
|
4
|
|
|
Current assets
|
14
|
|
|
Cash and cash equivalents
|
2
|
|
|
Total assets of disposal group held for sale
|
85
|
|
|
Non-current financial liabilities
|
11
|
|
|
Current liabilities
|
28
|
|
|
Total liabilities of disposal group held for sale
|
40
|
|
|
Net assets / book value
|
46
|
|
F- 91
|
Notes to the Consolidated Financial Statements
For the years ended December 31, 2019, 2018 and 2017 (continued)
|
|
In accordance with IFRS 5, the Group’s businesses in Chad(Q2 2018), Rwanda (Q1 2018), Ghana (Q3 2017) and Senegal (Q1 2017) had been classified as assets held for sale and their results were classified as discontinued operations. Comparative figures of the statement of income have therefore been represented accordingly. Financial information relating to the discontinued operations for the year ended
December 31, 2019
,
2018
and
2017
is set out below. Figures shown below are after intercompany eliminations.
Results from discontinued operations
|
Year ended December 31,
|
||||||
|
2019
|
2018
|
2017
|
||||
|
(US$ millions)
|
||||||
|
Revenue
|
50
|
|
189
|
|
440
|
|
|
Cost of sales
|
(14
|
)
|
(51
|
)
|
(130
|
)
|
|
Operating expenses
|
(29
|
)
|
(83
|
)
|
(188
|
)
|
|
Other expenses linked to the disposal of discontinued operations
|
(10
|
)
|
(10
|
)
|
(7
|
)
|
|
Depreciation and amortization
|
(11
|
)
|
(27
|
)
|
(67
|
)
|
|
Other operating income (expenses), net
|
—
|
|
(9
|
)
|
(4
|
)
|
|
Gain/(loss) on disposal of discontinued operations
|
74
|
|
(29
|
)
|
38
|
|
|
Operating profit (loss)
|
61
|
|
(21
|
)
|
81
|
|
|
Interest income (expense), net
|
(2
|
)
|
(6
|
)
|
(28
|
)
|
|
Other non-operating (expenses) income, net
|
—
|
|
(2
|
)
|
4
|
|
|
Profit (loss) before taxes
|
59
|
|
(29
|
)
|
56
|
|
|
Credit (charge) for taxes, net
|
(2
|
)
|
(4
|
)
|
4
|
|
|
Net Profit/(loss) from discontinuing operations
|
57
|
|
(33
|
)
|
60
|
|
Cash flows from discontinued operations
|
Year ended December 31,
|
||||||
|
2019
|
2018
|
2017
|
||||
|
(US$ millions)
|
||||||
|
Cash from (used in) operating activities, net
|
(8
|
)
|
(38
|
)
|
(1
|
)
|
|
Cash from (used in) investing activities, net
|
5
|
|
8
|
|
(25
|
)
|
|
Cash from (used in) financing activities, net
|
7
|
|
11
|
|
8
|
|
F. Other assets and liabilities
F.1. Trade receivables
Millicom’s trade receivables mainly comprise interconnect receivables from other operators, postpaid mobile and residential cable subscribers, as well as B2B customers. The nominal value of receivables adjusted for impairment approximates the fair value of trade receivables.
|
2019
|
2018
|
|||
|
(US$ millions)
|
||||
|
Gross trade receivables
|
636
|
|
592
|
|
|
Less: provisions for expected credit losses
|
(265
|
)
|
(249
|
)
|
|
Trade receivables, net
|
371
|
|
343
|
|
F- 92
|
Notes to the Consolidated Financial Statements
For the years ended December 31, 2019, 2018 and 2017 (continued)
|
|
Aging of trade receivables
|
Neither past due nor impaired
|
Past due (net of impairments)
|
|||||||
|
30–90 days
|
>90 days
|
Total
|
||||||
|
(US$ millions)
|
||||||||
|
2019:
|
||||||||
|
Telecom operators
|
23
|
|
9
|
|
8
|
|
40
|
|
|
Own customers
|
177
|
|
63
|
|
29
|
|
270
|
|
|
Others
|
40
|
|
15
|
|
5
|
|
60
|
|
|
Total
|
241
|
|
88
|
|
43
|
|
371
|
|
|
2018:
|
||||||||
|
Telecom operators
|
17
|
|
9
|
|
14
|
|
39
|
|
|
Own customers
|
158
|
|
69
|
|
19
|
|
246
|
|
|
Others
|
36
|
|
17
|
|
5
|
|
58
|
|
|
Total
|
210
|
|
95
|
|
37
|
|
343
|
|
Trade receivables are initially recognized at fair value and subsequently measured at amortized cost using the effective interest method, less provision for expected credit losses. The Group recognizes an allowance for expected credit losses (ECLs) applying a simplified approach in calculating the ECLs. Therefore, the Group does not track changes in credit risk, but instead recognizes a loss allowance based on lifetime of ECLs at each reporting date. The Group has established a provision matrix that is based on its historical credit loss experience, adjusted for forward-looking factors specific to the debtors and the economic environment. The provision for expected credit losses is recognized in the consolidated statement of income within Cost of sales.
Loans and receivables are non-derivative financial assets with fixed or determinable payments that are not quoted in an active market. They are included in current assets, except for those maturing more than 12 months after the end of the reporting period. These are classified within non-current assets. Loans and receivables are carried at amortized cost using the effective interest method. Gains and losses are recognized in the statement of income when the loans and receivables are derecognized or impaired, as well as through the amortization process.
F.2. Inventories
Inventories are stated at the lower of cost and net realizable value. Cost is determined using the first-in, first-out method. Net realizable value is the estimated selling price in the ordinary course of business, less applicable variable selling expenses.
Inventories
|
2019
|
2018
|
|||
|
(US$ millions)
|
||||
|
Telephone and equipment
|
18
|
|
26
|
|
|
SIM cards
|
3
|
|
4
|
|
|
IRUs
|
3
|
|
3
|
|
|
Other
|
9
|
|
6
|
|
|
Inventory at December 31,
|
32
|
|
39
|
|
F.3. Trade payables
Trade payables are initially recognized at fair value and subsequently measured at amortized cost using the effective interest method where the effect of the passage of time is material.
From time to time, the Group enters into agreements to extend payment terms with various suppliers, and with factoring companies when such payments are discounted. The corresponding amount pending payment as of
December 31, 2019
, is recognized in Trade payables for an amount of
$40 million
(
2018
:
$26 million
).
F- 93
|
Notes to the Consolidated Financial Statements
For the years ended December 31, 2019, 2018 and 2017 (continued)
|
|
F.4. Current and non-current provisions and other liabilities
Provisions are recognized when the Group has a present obligation (legal or constructive) as a result of a past event, if it is probable that an outflow of resources embodying economic benefits will be required to settle the obligation and a reliable estimate can be made of the amount of the obligation. Where the Group expects some or all of a provision to be reimbursed, for example under an insurance contract, the reimbursement is recognized as a separate asset, but only when the reimbursement is virtually certain.
The expense relating to any provision is presented in the statement of income net of any reimbursement. If the effect of the time value of money is material, provisions are discounted using a current pre-tax rate that reflects, where appropriate, risks specific to the liability. Where discounting is used, increases in the provision due to the passage of time are recognized as interest expenses.
F.4.1. Current provisions and other liabilities
Current
|
2019
|
2018
|
|||
|
(US$ millions)
|
||||
|
Deferred revenue
|
77
|
|
85
|
|
|
Customer deposits
|
14
|
|
15
|
|
|
Current legal provisions
|
36
|
|
27
|
|
|
Tax payables
|
74
|
|
68
|
|
|
Customer and MFS distributor cash balances
|
141
|
|
147
|
|
|
Withholding tax on payments to third parties
|
15
|
|
17
|
|
|
Other provisions
|
3
|
|
7
|
|
|
Other current liabilities(i)
|
113
|
|
126
|
|
|
Total
|
474
|
|
492
|
|
(i) Includes
36 million
(2018:
36 million
) of tax risk liabilities not related to income tax.
F.4.2. Non-current provisions and other liabilities
Non-current
|
2019
|
2018
|
|||
|
(US$ millions)
|
||||
|
Non-current legal provisions
|
18
|
|
8
|
|
|
Long-term portion of asset retirement obligations
|
96
|
|
77
|
|
|
Long-term portion of deferred income on tower sale and leasebacks recognized under IAS 17
|
68
|
|
85
|
|
|
Long-term employment obligations
|
71
|
|
68
|
|
|
Accruals and payables in respect of spectrum and license acquisitions
|
61
|
|
41
|
|
|
Other non-current liabilities
|
68
|
|
71
|
|
|
Total
|
383
|
|
351
|
|
F- 94
|
Notes to the Consolidated Financial Statements
For the years ended December 31, 2019, 2018 and 2017 (continued)
|
|
F.5. Assets and liabilities related to contract with customers
Contract assets, net
|
2019
|
2018
|
|||
|
(US$ millions)
|
||||
|
Long-term portion
|
6
|
|
3
|
|
|
Short-term portion
|
37
|
|
35
|
|
|
Less: provisions for expected credit losses
|
(2
|
)
|
(1
|
)
|
|
Total
|
41
|
|
37
|
|
Contract liabilities
|
2019
|
2018
|
|||
|
(US$ millions)
|
||||
|
Long-term portion
|
1
|
|
1
|
|
|
Short-term portion
|
81
|
|
86
|
|
|
Total
|
82
|
|
87
|
|
The Group recognized revenue for
$87 million
in
2019
(
2018
:
$45 million
) that was included in the contract liability balance at the beginning of the year.
The transaction price allocated to the remaining performance obligations (unsatisfied or partially unsatisfied) as at
December 31, 2019
is
$61 million
(
$60 million
is expected to be recognized as revenue in the 2020 financial year and the remaining
$1 million
in the 2021 financial year or later) (i).
(i) This amount does not consider contracts that have an original expected duration of one year or less, neither contracts in which consideration from a customer corresponds to the value of the entity’s performance obligation to the customer (i.e. billing corresponds to accounting revenue).
Contract costs, net (i)
|
2019
|
2018
|
|||
|
(US$ millions)
|
||||
|
Net at January 1
|
4
|
|
4
|
|
|
Contract costs capitalized
|
7
|
|
4
|
|
|
Amortisation of contract costs
|
(6
|
)
|
(4
|
)
|
|
Net at December 31
|
5
|
|
4
|
|
|
(i)
|
Incremental costs of obtaining a contract are expensed when incurred if the amortization period of the asset that Millicom otherwise would have recognized is one year or less.
|
G. Additional disclosure items
G.1. Fees to auditors
|
2019
|
2018
|
2017
|
||||
|
(US$ millions)
|
||||||
|
Audit fees
|
6.8
|
|
6.7
|
|
4.7
|
|
|
Audit related fees
|
1.3
|
|
0.4
|
|
0.3
|
|
|
Tax fees
|
0.1
|
|
0.2
|
|
0.2
|
|
|
Other fees
|
0.6
|
|
0.6
|
|
0.7
|
|
|
Total
|
8.8
|
|
7.7
|
|
5.9
|
|
F- 95
|
Notes to the Consolidated Financial Statements
For the years ended December 31, 2019, 2018 and 2017 (continued)
|
|
G.2. Capital and operational commitments
Millicom has a number of capital and operational commitments to suppliers and service providers in the normal course of its business. These commitments are mainly contracts for acquiring network and other equipment, and leases for towers and other operational equipment.
G.2.1. Capital commitments
At
December 31, 2019
, the Company and its subsidiaries had fixed commitments to purchase network equipment, land and buildings, other fixed assets and intangible assets of
$122 million
of which
$102 million
are due within one year (
December 31, 2018
:
$88 million
of which
$71 million
were due within one year). The Group’s share of commitments from the joint ventures is, respectively
$52 million
and
$51 million
. (
December 31, 2018
:
$66 million
of which
$56 million
were due within one year).
G.2.2. Lease commitments - until December 31, 2018
The determination of whether an arrangement is, or contains, a lease is based on the substance of the arrangement and involves an assessment of whether the fulfillment of the arrangement is dependent on the use of a specific asset or assets and whether or not the arrangement conveys a right to use the asset. The sale and leaseback of towers and related site operating leases and service contracts are accounted for in accordance with the underlying characteristics of the assets, and the terms and conditions of the lease agreements. On transfer to the tower companies, the portion of the towers leased back are accounted for as operating leases or finance leases according to the criteria set out above. The portion of towers being leased back represents the dedicated part of each tower on which Millicom’s equipment is located and was derived from the average technical capacity of the towers. Rights to use the land on which the towers are located are accounted for as operating leases, and costs of services for the towers are recorded as operating expenses.
From January 1, 2019, the Group has recognized right of use assets for these leases, except for short term or low value leases. See above in the "New and amended IFRS accounting standards", note C.4.and
E.3.
for further information.
Operating leases
Operating leases are all other leases that are not finance leases. Operating lease payments are recognized as expenses in the consolidated statement of income on a straight-line basis over the lease term.
Operating leases mainly comprise land in which cell towers are located (including those related to towers sold and leased back) and buildings. Total operating lease expense from continuing operations for the year ended
2018
was
$152 million
–see note
B.2.
Annual operating lease commitments from continuing operations
|
2018 (i)
|
||
|
(US$ millions)
|
||
|
Within one year
|
127
|
|
|
Between one and five years
|
412
|
|
|
After five years
|
262
|
|
|
Total
|
801
|
|
(i) The Group’s share in joint ventures operating lease commitments in 2018 amount to
$312 million
and are excluded from the table above.
Finance leases
Finance leases, which transfer substantially all risks and benefits incidental to ownership of the leased item to the lessee, are capitalized at the inception of the lease at the fair value of the leased asset or, if lower, at the present value of the minimum lease payments. Lease payments are apportioned between finance charges and reduction of the lease liability so as to achieve a constant rate of interest on the remaining balance of the liability. Finance charges are charged directly against income. Where a finance lease results from a sale and leaseback transaction, any excess of sales proceeds over the carrying amount of the assets is deferred and amortized over the lease term. Capitalized leased assets are depreciated over the shorter of the estimated useful lives of the assets, or the lease term if there is no reasonable certainty that the Group will obtain ownership by the end of the lease term.
Finance leases mainly comprise lease of tower space in El Salvador, Paraguay, Tanzania and Colombia (see note
C.3.4.
), lease of poles in Colombia and tower sharing in other countries. Other financial leases mainly consist of lease agreements relating to vehicles and IT equipment.
F- 96
|
Notes to the Consolidated Financial Statements
For the years ended December 31, 2019, 2018 and 2017 (continued)
|
|
Annual minimum finance lease commitments from continuing operations
|
2018 (i)
|
||
|
(US$ millions)
|
||
|
Within one year
|
99
|
|
|
Between one and five years
|
400
|
|
|
After five years
|
415
|
|
|
Total
|
914
|
|
|
(i)
|
The Group’s share in joint ventures finance lease commitments in 2018 amounted to
$1 million
and are excluded from the table above.
|
The corresponding finance lease liabilities at December 31, 2018, were
$353 million
. Interest expense on finance lease liabilities amounted to
$91 million
for the year 2018.
G.3. Contingent liabilities
G.3.1. Litigation and legal risks
The Company and its operations are contingently liable with respect to lawsuits, legal, regulatory, commercial and other legal risks that arise in the normal course of business. As of
December 31, 2019
, the total exposure for claims and litigation risks against Millicom and its subsidiaries is
$204 million
(
December 31, 2018
:
$683 million
). The decrease is mainly due to Colombia where some significant cases were closed or became time barred during the year. The Group's share of the comparable exposure for joint ventures is
$4 million
(
December 31, 2018
:
$5 million
).
As at
December 31, 2019
,
$30 million
has been provided by its subsidiaries for these risks in the consolidated statement of financial position (
December 31, 2018
:
$22 million
). The Group’s share of provisions made by the joint ventures was
$3 million
(
December 31, 2018
:
$4 million
). While it is not possible to ascertain the ultimate legal and financial liability with respect to these claims and risks, the ultimate outcome is not anticipated to have a material effect on the Group’s financial position and operations.
Ongoing investigation by the International Commission Against Impunity in Guatemala (CICIG)
Between 2017 and 2019, the CICIG and Guatemalan prosecutors have pursued investigations that have included the country’s telecommunications sector and Comcel, our Guatemalan joint venture. On September 3, 2019, the CICIG’s activities in Guatemala were discontinued, after the Guatemalan government did not renew the CICIG’s mandate, and it is unclear whether the investigations will continue. As at
December 31, 2019
, Management is not able to assess the potential impact on these consolidated financial statements of any remedial actions that may need to be taken as a result of the investigations, or penalties that may be imposed by law enforcement authorities. Accordingly, no provision has been recorded as of
December 31, 2019
.
Other
At
December 31, 2019
, Millicom has various other less significant claims which are not disclosed separately in these consolidated financial statements because they are either not material or the related risk is remote.
F- 97
|
Notes to the Consolidated Financial Statements
For the years ended December 31, 2019, 2018 and 2017 (continued)
|
|
G.3.2. Tax related risks and uncertain tax position
The Group operates in developing countries where the tax systems, regulations and enforcement processes have varying stages of development creating uncertainty regarding the application of the tax law and interpretation of tax treatments. The Group is also subject to regular tax audits in the countries where it operates. When there is uncertainty over whether the taxation authority will accept a specific tax treatment under the local tax law, that tax treatment is therefore uncertain. The resolution of tax positions taken by the Group, through negotiations with relevant tax authorities or through litigation, can take several years to complete and, in some cases, it is difficult to predict the ultimate outcome. Therefore, judgment is required to determine provisions for taxes.
In assessing whether and how an uncertain tax treatment affects the determination of taxable profit (tax loss), tax bases, unused tax losses, unused tax credits and tax rates, the Group assumes that a taxation authority with the right to examine amounts reported to it will examine those amounts and have full knowledge of all relevant information when making those examinations.
The Group has a process in place, and applies significant judgment, in identifying uncertainties over income tax treatments. Management considers whether or not it is probable that a taxation authority will accept an uncertain tax treatment. On that basis, the identified risks are split into three categories (i) remote risks (risk of outflow of tax payments are up to
20%
), (ii) possible risks (risk of outflow of tax payments assessed from
21%
to
49%
) and probable risks (risk of outflow is more than
50%
). The process is repeated every quarter by the Group.
If the Group concludes that it is probable or certain that the taxation authority will accept the tax treatment, the risks are categorized either as possible or remote, and it determines the taxable profit (tax loss), tax bases, unused tax losses, unused tax credits or tax rates consistently with the tax treatment used or planned to be used in its income tax filings. The risks considered as possible are not provisioned but disclosed as tax contingencies in the Group consolidated financial statements while remote risks are neither provisioned nor disclosed.
If the Group concludes that it is probable that the taxation authority will not accept the Group’s interpretation of the uncertain tax treatment, the risks are categorized as probable, and are presented to reflect the effect of uncertainty in determining the related taxable profit (tax loss), tax bases, unused tax losses, unused tax credits or tax rates by generally using the most likely amount method – the single most likely amount in a range of possible outcomes.
If an uncertain tax treatment affects both deferred tax and current tax, the Group makes consistent estimates and judgments for both. For example, an uncertain tax treatment may affect both taxable profits used to determine the current tax and tax bases used to determine deferred tax.
If facts and circumstances change, the Group reassesses the judgments and estimates regarding the uncertain tax position taken.
At
December 31, 2019
, the tax risks exposure of the Group's subsidiaries is estimated at
$300 million
, for which provisions of
$50 million
have been recorded in tax liabilities; representing the probable amount of eventual claims and required payments related to those risks (
2018
:
$226 million
of which provisions of
$44 million
were recorded). The Groups' share of comparable tax exposure and provisions in its joint ventures amounts to
$49 million
(
2018
:
$29 million
) and
$4 million
(
2018
:
$2 million
), respectively.
G.4. Non-cash investing and financing activities
Non-cash investing and financing activities from continuing operations
|
Note
|
2019
|
2018
|
2017
|
||||
|
(US$ millions)
|
|||||||
|
Investing activities
|
|||||||
|
Acquisition of property, plant and equipment, including (finance) leases
|
E.2.2.
|
17
|
|
(65
|
)
|
(174
|
)
|
|
Asset retirement obligations
|
E.2.2.
|
19
|
|
15
|
|
(20
|
)
|
|
Acquisition of subsidiaries, joint ventures and associates, net of cash acquired
|
A.1.2.
|
—
|
|
30
|
|
—
|
|
|
Financing activities
|
|||||||
|
(Finance) Leases
|
C.3.4.
|
1
|
|
(43
|
)
|
192
|
|
|
Share based compensation
|
B.4.1.
|
27
|
|
21
|
|
22
|
|
F- 98
|
Notes to the Consolidated Financial Statements
For the years ended December 31, 2019, 2018 and 2017 (continued)
|
|
G.5. Related party balances and transactions
The Group’s significant related parties are:
|
•
|
Kinnevik AB (Kinnevik) and subsidiaries, Millicom’s previous principal shareholder - until November 14, 2019, date on which Millicom SDRs were paid out to the shareholders of Kinnevik (see 'Introduction' note);
|
|
•
|
Helios Towers Africa Ltd (HTA), in which Millicom held a direct or indirect equity interest - until October 15, 2019, date on which Millicom lost significant influence on HTA and started accounting for its investments at fair value under IFRS 9 (see note
A.3.1.
and
C.7.3.
|
|
•
|
EPM and subsidiaries (EPM), the non-controlling shareholder in our Colombian operations (see note
A.1.4.
);
|
|
•
|
Miffin Associates Corp and subsidiaries (Miffin), our joint venture partner in Guatemala.
|
|
•
|
Cable Onda partners and subsidiaries, the non-controlling shareholders in our Panama operations (see note
A.1.2.
).
|
Kinnevik
Until November 14, 2019, Kinnevik was Millicom's principal shareholder, owning approximately
37%
of Millicom (December 31,
2018
:
37%
). Kinnevik is a Swedish holding company with interests in the telecommunications, media, publishing, paper and financial services industries. During
2019
,
2018
and
2017
, Kinnevik did not purchase any Millicom shares. There were no significant loans made by Millicom to or for the benefit of Kinnevik or Kinnevik controlled entities.
During
2019
,
2018
and
2017
, the Company purchased services from Kinnevik subsidiaries including fraud detection, procurement and professional services. Transactions and balances with Kinnevik Group companies are disclosed under 'Other' in the tables below.
Helios Towers
Millicom sold its tower assets and leased back a portion of space on the towers in several African countries and contracted for related operation and management services with HTA. The Group has future lease commitments in respect of the tower companies (see note E.4.). As mentioned above, Helios Towers ceased to be a related party to the Group from October 15, 2019.
Empresas Públicas de Medellín (EPM)
EPM is a state-owned, industrial and commercial enterprise, owned by the municipality of Medellin, and provides electricity, gas, water, sanitation, and telecommunications. EPM owns
50%
of our operations in Colombia.
Miffin Associates Corp (Miffin)
The Group purchases and sells products and services from and to the Miffin Group. Transactions with Miffin represent recurring commercial operations such as purchase of handsets, and sale of airtime.
Cable Onda Partners
Our partners in Panama are the non-controlling shareholders of Cable Onda and own
20%
of the company, and indirectly
20%
of Telefonica Moviles Panama, S.A., which has been acquired by Cable Onda in August 2019. Additionally, they also hold interests in several entities which have purchasing and selling recurring commercial operations with Cable Onda (such as the sale of content costs, delivery of broadband services, etc.). Transactions and balances with Cable Onda Partners companies are disclosed under 'Other' in the tables below.
|
Expenses from transactions with related parties
|
2019
|
2018
|
2017
|
|||
|
|
(US$ millions)
|
|||||
|
Purchases of goods and services from Miffin
|
(209
|
)
|
(173
|
)
|
(181
|
)
|
|
Purchases of goods and services from EPM
|
(42
|
)
|
(40
|
)
|
(36
|
)
|
|
Lease of towers and related services from HTA(i)
|
(146
|
)
|
(28
|
)
|
(28
|
)
|
|
Other expenses
|
(15
|
)
|
(3
|
)
|
(4
|
)
|
|
Total
|
(412
|
)
|
(244
|
)
|
(250
|
)
|
(i) HTA ceased to be a related party on October 15, 2019. See note
C.7.3.
for further details.
F- 99
|
Notes to the Consolidated Financial Statements
For the years ended December 31, 2019, 2018 and 2017 (continued)
|
|
|
Income and gains from transactions with related parties
|
2019
|
2018
|
2017
|
|||
|
(US$ millions)
|
||||||
|
Sale of goods and services to Miffin
|
306
|
|
284
|
|
277
|
|
|
Sale of goods and services to EPM
|
13
|
|
17
|
|
18
|
|
|
Other revenue
|
3
|
|
2
|
|
1
|
|
|
Total
|
322
|
|
303
|
|
295
|
|
As at December 31, the Company had the following balances with related parties:
|
Year ended December 31
|
||||
|
2019
|
2018
|
|||
|
(US$ millions)
|
||||
|
Non-current and current liabilities
|
||||
|
Payables to Guatemala joint venture(i)
|
361
|
|
315
|
|
|
Payables to Honduras joint venture(ii)
|
133
|
|
143
|
|
|
Payables to EPM
|
37
|
|
14
|
|
|
Other accounts payable
|
—
|
|
9
|
|
|
Sub-total
|
531
|
|
482
|
|
|
(Finance) Lease liabilities to HTA (iii)
|
—
|
|
99
|
|
|
Total
|
531
|
|
580
|
|
|
(i)
|
Shareholder loans bearing interest. Out of the amount above,
$337 million
are due over more than one year.
|
|
(ii)
|
Amount payable mainly consist of dividend advances for which dividends are expected to be declared later in 2020 and/or shareholder loans.
|
|
(iii)
|
HTA ceased to be a related party on October 15, 2019. See note
C.7.3.
for further details.
|
.
|
Year ended December 31
|
||||
|
2019
|
2018
|
|||
|
(US$ millions)
|
||||
|
Non-current and current assets
|
||||
|
Receivables from EPM
|
3
|
|
5
|
|
|
Receivables from Guatemala and Honduras joint ventures
|
23
|
|
20
|
|
|
Advance payments to Helios Towers Tanzania(ii)
|
—
|
|
6
|
|
|
Receivables from Panama
|
—
|
|
—
|
|
|
Receivable from AirtelTigo Ghana (i)
|
43
|
|
41
|
|
|
Other accounts receivable
|
4
|
|
1
|
|
|
Total
|
73
|
|
73
|
|
|
(i)
|
Disclosed under Other non-current assets in the statement of financial position. See note
A.2.2.
|
(ii) Helios Towers ceased to be to be a related party on October 15, 2019.
H. IPO – Millicom’s operations in Tanzania
In June 2016, an amendment to the Electronic and Postal Communications Act (“EPOCA”) in the Finance Act 2016 required all Tanzanian licensed telecom operators to sell
25%
of the authorised share capital in a public offering on the Dar Es Salaam Stock Exchange. In December 2019, the Group filed the draft prospectus with the Tanzania Capital Market and Securities Authority with the view to initiate the listing process in H1 2020.
F- 100
|
Notes to the Consolidated Financial Statements
For the years ended December 31, 2019, 2018 and 2017 (continued)
|
|
I. Subsequent events
Pivot in shareholder remuneration
On February 24, 2020, Millicom’s Board approved to the Annual General Meeting of the shareholders a share buyback program to repurchase at least
$500 million
over the next
three years
. The current shareholder authorization, which expires on May 5, 2020, allows for the repurchase of up to
5%
of the outstanding share capital. In addition, the Board approved to the Annual General Meeting of the shareholders a dividend distribution of
$1.00
per share to be paid in 2020. The Annual General Meeting to vote on these matters is scheduled for May 5, 2020.
On February 25, 2020, Millicom announced a
three
year
$500 million
share repurchase plan and on February 28, 2020 it initiated the first phase of this program comprising the purchase of not more than
350,000
shares and not more than a maximum total amount of SEK
107 million
(approximately
$11 million
). The purpose of the repurchase program is to reduce Millicom's share capital, or to use the repurchased shares for meeting obligations arising under Millicom´s employee share based incentive programs. The repurchase program may take place during the period between February 28, 2020 and May 5, 2020. Payment for the shares will be made in cash.
Paraguay bond
On January 28, 2020, Millicom’s wholly-owned subsidiary Telefónica Celular del Paraguay S.A.E ("Telecel"), closed a
$250 million
re-tap to its senior unsecured notes due 2027, representing an additional issuance of Telecel's outstanding
$300 million
5.875%
senior notes due 2027 issued on April 5, 2019. The new notes will be treated as a single class with the initial notes, and they were priced at
106.375
for an implied yield to maturity of
4.817%
.
F- 101
TABLE OF CONTENTS
Part IItem 1. Identity Of Directors, Senior Management and AdvisersItem 2. Offer Statistics and Expected TimetableItem 3. Key InformationItem 4. Information on The CompanyItem 4A. Unresolved Staff CommentsItem 5. Operating and Financial Review and ProspectsItem 6. Directors, Senior Management and EmployeesItem 7. Major Shareholders and Related Party TransactionsItem 8. Financial InformationItem 9. The Offer and ListingItem 10. Additional InformationItem 11. Quantitative and Qualitative Disclosures About RiskItem 12. Description Of Securities Other Than Equity SecuritiesPart IIItem 13. Defaults, Dividend Arrearages and DelinquenciesItem 14. Material Modifications To The Rights Of Security Holders and Use Of ProceedsItem 15. Controls and ProceduresItem 16. [reserved]Item 16A. Audit Committee Financial ExpertItem 16B. Code Of EthicsItem 16C. Principal Accountant Fees and ServicesItem 16D. Exemptions From The Listing Standards For Audit CommitteesItem 16E. Purchases Of Equity Securities By The Issuer and Affiliated PurchasersItem 16F. Change in Registrant S Certifying AccountantItem 16G. Corporate GovernanceItem 16H. Mine Safety DisclosurePart IIIItem 17. Financial StatementsItem 18. Financial StatementsItem 19. Exhibits