TIPTREE INC.
10-Ks and 10-Qs
|
|
|
|
|
|
|
|
|
|
|
|
|
|
|
|
|
|
|
|
|
|
|
|
|
|
|
|
|
|
|
|
|
|
|
|
|
|
|
|
|
|
|
|
|
|
|
|
|
|
|
|
|
|
|
|
|
|
|
E
UNITED STATES
SECURITIES AND EXCHANGE COMMISSION
Washington, D.C. 20549
FORM 10-K
|
(Mark One)
|
|
|
x
|
Annual Report Pursuant to Section 13 or 15(d) of the Securities Exchange Act of 1934
|
For the fiscal year ended December 31, 2013
OR
|
o
|
Transition Report Pursuant to Section 13 or 15(d) of the Securities Exchange Act of 1934
|
For the transition period from to
Commission File Number: 001-33549
Tiptree Financial Inc.
(Exact name of Registrant as Specified in Its Charter)
|
Maryland
|
38-3754322
|
|
(State or Other Jurisdiction of
|
(IRS Employer
|
|
Incorporation of Organization)
|
Identification No.)
|
|
780 Third Avenue, 21st Floor, New York, New York
|
10017
|
|
(Address of Principal Executive Offices)
|
(Zip Code)
|
(212) 446-1400
(Registrant’s Telephone Number, Including Area Code)
Securities Registered Pursuant to Section 12(b) of the Act: Class A Common Stock, par value $0.001 per share
Securities Registered Pursuant to Section 12(g) of the Act: None
Indicate by check mark if the registrant is a well-known seasoned issuer, as defined in Rule 405 of the Securities Act. Yes
¨
No
x
Indicate by check mark if the registrant is not required to file reports pursuant to Section 13 or Section 15(d) of the Act. Yes
¨
No
x
Indicate by check mark whether the registrant: (1) has filed all reports required to be filed by Section 13 or 15(d) of the Securities Exchange Act of 1934 during the preceding 12 months (or for such shorter period that the registrant was required to file such reports), and (2) has been subject to such filing requirements for the past 90 days. Yes
x
No
¨
Indicate by check mark whether the registrant has submitted electronically and posted on its corporate Web site, if any, every Interactive Data File required to be submitted and posted pursuant to Rule 405 of Regulation S-T (§232.405 of this chapter) during the preceding 12 months (or for such shorter period that the registrant was required to submit and post such files). Yes
x
No
¨
Indicate by check mark if disclosure of delinquent filers pursuant to Item 405 of Regulation S-K (§ 229.405) is not contained herein, and will not be contained, to the best of registrant’s knowledge, in definitive proxy or information statements incorporated by reference in Part III of this Form 10-K or any amendment to this Form 10-K.
¨
Indicate by check mark whether the registrant is a large accelerated filer, an accelerated filer, a non-accelerated filer or a smaller reporting company. See the definitions of “large accelerated filer,” “accelerated filer” and “smaller reporting company” in Rule 12b-2 of the Exchange Act. (Check one):
Large accelerated filer
¨
Accelerated filer
¨
Non-accelerated filer
¨
Smaller reporting company
x
Indicate by check mark whether the registrant is a shell company (as defined in Rule 12b-2 of the Exchange Act.) Yes
¨
No
x
As of June 28, 2013, the last business day of the registrant’s most recently completed second fiscal quarter, the aggregate market value of the registrant’s voting and non-voting common equity held by non-affiliates of the registrant was
$1,177,400
, based upon the closing sales price of $7.00 per share as
E
reported on the OTCQX Capital market. For purposes of this calculation, all of the registrant’s directors and executive officers were deemed to be affiliates of the registrant. Since August 9, 2013, the registrant’s Class A common stock has traded on the NASDAQ Capital Market under the symbol “TIPT.”
As of March 17, 2014, there were
10,610,281
shares, par value $0.001, of the registrant’s Class A common stock outstanding and
30,968,877
shares, par value $0.001, of the registrant’s Class B common stock outstanding.
Documents Incorporated by Reference
Certain information in the registrant’s definitive proxy statement to be filed with the Commission relating to the registrant’s 2014 Annual Meeting of Stockholders is incorporated by reference into Part III.
Tiptree Financial Inc.
INDEX
Forward-Looking Statements
Except for the historical information included and incorporated by reference in this Annual Report on Form 10-K, the information included and incorporated by reference herein are “forward-looking statements” within the meaning of Section 27A of the Securities Act of 1933 (the “Securities Act”) and Section 21E of the Securities Exchange Act of 1934 (the “Exchange Act”). Forward-looking statements provide our current expectations or forecasts of future events and are not statements of historical fact. These forward-looking statements include information about possible or assumed future events, including, among other things, discussion and analysis of our future financial condition, results of operations and our strategic plans and objectives. When we use words such as “anticipate,” “believe,” “estimate,” “expect,” “intend,” “may,” “might,” “plan,” “project,” “should,” “target,” “will,” or similar expressions, we intend to identify forward-looking statements.
The forward-looking statements are not guarantees of future performance and are subject to risks, uncertainties and other factors, many of which are beyond our control, are difficult to predict and could cause actual results to differ materially from those expressed or forecasted in the forward-looking statements. Our actual results could differ materially from those anticipated in these forward-looking statements as a result of various factors, including, but not limited to, those described in the section entitled “Risk Factors” in this Annual Report on Form 10-K.
The factors described herein are not necessarily all of the important factors that could cause actual results or developments to differ materially from those expressed in any of our forward-looking statements. Other unknown or unpredictable factors also could affect our forward-looking statements. Consequently, our actual performance could be materially different from the results described or anticipated by our forward-looking statements. Given these uncertainties, you should not place undue reliance on these forward-looking statements. Except as required by the federal securities laws, we undertake no obligation to update any forward-looking statements.
Note to Reader
In reading this Annual Report on Form 10-K, references to:
“Administrative Services Agreement” means the Administrative Services Agreement between Operating Company (as assignee of TFP) and BackOffice Services Group, Inc., dated as of June 12, 2007.
“AUM” means assets under management.
“Care Inc.” means Care Investment Trust Inc. prior to the Contribution Transactions.
“Care LLC” means Care Investment Trust LLC.
“Care” means Care Inc. and Care LLC, collectively.
“CLOs” means collateralized loan obligations.
“COLI/ BOLI” means company owned life insurance and bank owned life insurance.
“Contribution Transactions” means the closing on July 1, 2013 of the transactions pursuant to the Contribution Agreement by and between the Company, Operating Company and TFP, dated as of December 31, 2012.
“Luxury” means Luxury Mortgage Corp.
“Mariner” means Mariner Investment Group LLC.
“MCM” means Muni Capital Management, LLC.
“MFCA” means Muni Funding Company of America LLC.
“NPPF I” means Non-Profit Preferred Funding Trust I.
“Operating Company” means Tiptree Operating Company, LLC.
1
“PFAS” means Philadelphia Financial Administration Services Company, LLC.
“PFAS Transaction” means PFG’s purchase of assets and administrative servicing rights of COLI/BOLI business from The Hartford in 2012.
“PFG” means Philadelphia Financial Group, Inc.
“Siena” means Siena Capital Finance LLC.
“Star Asia Entities” means collectively Star Asia Finance, Limited, Star Asia Opportunity, LLC and Star Asia Opportunity II, LLC.
“TAMCO” means Tiptree Asset Management Company, LLC.
“Telos” means Telos Asset Management, LLC.
“TFP” means Tiptree Financial Partners, L.P.
“Tiptree”, the “Company”, “we”, “its”, “us” and “our” means Tiptree Financial Inc. and its consolidated subsidiaries.
“Tiptree Direct” means Tiptree Direct Holdings LLC.
“Transition Services Agreement” means the Transition Services Agreement among TAMCO, Tricadia and Operating Company (as assignee of TFP), dated as of June 30, 2012.
“Tricadia” means Tricadia Holdings, L.P.
OVERVIEW
Tiptree is a diversified holding company engaged through its consolidated subsidiaries in a number of businesses and is an active acquirer of new businesses. Tiptree, whose operations date back to 2007, currently has subsidiaries that operate in four industry segments: insurance and insurance services, specialty finance, asset management and real estate.
We operate our business through Operating Company, which directly or indirectly owns all of our assets. Operating Company is owned 25% by Tiptree Financial Inc. and 75% by Tiptree Financial Partners, L.P. This report is being filed by Tiptree Financial Inc. but includes information of Operating Company that may be of interest to partners of Tiptree Financial Partners, L.P. Beginning on July 1, 2014, partnership units of Tiptree Financial Partners, L.P. are redeemable for Class A common stock of Tiptree Financial Inc. For more information on our ownership and structure see “—Structure” and Notes 1 and 15 within the accompanying consolidated financial statements.
Strategy
Tiptree’s primary strategy is to acquire controlling interests in a diversified group of businesses. We look for companies that offer sustainable, long-term and stable financial performance. We may also make investments that are not controlling acquisitions, and or invest in debt instruments, and have done so in the past.
Our structure allows us to focus on being long term investors in our companies as some of our companies may require operational turnaround to build shareholder value. We provide managerial assistance to our companies as needed, which at times has included developing growth strategies and providing strategic advice regarding complimentary acquisitions and new business initiatives, as well as providing incremental capital.
As part of our strategy we may also seed new opportunities, which may include new product launches by our existing companies, new asset management products and new businesses to take advantage of market disruptions. Accordingly, over time our mix of businesses may change as a result of new initiatives and new investments.
Business Segments
Tiptree’s activities are organized, for management and financial reporting purposes, into four business segments.
2
|
Segment
|
Subsidiaries
|
|
Insurance and insurance services
|
Philadelphia Financial Group, Inc. and Philadelphia Financial Administration Services Company, LLC
|
|
Specialty finance
|
Muni Funding Company of America, LLC, Siena Capital Finance LLC, Luxury Mortgage Corp. and Tiptree Direct Holdings LLC
|
|
Asset management
|
Tiptree Asset Management Company, LLC, Telos Asset Management, LLC and Muni Capital Management, LLC
|
|
Real estate
|
Care LLC and the Star Asia Entities
|
For additional financial information regarding Tiptree’s operating segments see “Management’s Discussion and Analysis of Financial Condition and Results of Operations - Segment Reporting”.
BUSINESS SEGMENTS
Insurance and Insurance Services
Tiptree’s insurance operations include PFG, a life insurance and annuity company and PFAS, a third party administrator of COLI/BOLI policies.
Philadelphia Financial Group
PFG provides annuity and life insurance products within the U.S. and internationally. PFG’s principal insurance activity is the structuring, underwriting, marketing and administration of life insurance and annuity products. PFG’s life insurance products are primarily targeted to high net worth individuals and its annuity products are targeted to both the individual and institutional markets. PFAS, a subsidiary of PFG, also provides administration services of life insurance products in the institutional bank owned and corporate owned life insurance markets. In August 2012, PFG launched its international operations with the establishment of two Bermuda domiciled subsidiaries.
PFG distributes its products through a select network of intermediaries who work directly with individuals, institutions and families or in concert with family offices, wealth managers, private bankers or other professionals.
PFG’s life insurance products are generally marketed to high net worth individuals and families in the form of variable life insurance policies, which give flexibility in investment choices. In variable life products, the premiums are held in separate accounts that may be invested into a variety of investment options. PFG does not receive or participate in management fees on the performance of separate accounts. PFG’s annuity products are marketed to both the individual and institutional markets, in the form of individual and group variable annuities. Variable annuities allow for the contract holder to make deposits into various investment options in a separate account, as determined by the contract holder. In all of PFG’s annuity products, the investment risks associated with such investment options are borne entirely by the contract holder.
PFAS is a third party administrator of group life insurance policies, primarily in the COLI/BOLI market. Employers looking for tax-efficient ways to fund their employee benefit programs have accomplished this goal through the use of COLI/BOLI, by purchasing life insurance policies on employees. The employer pays the premium, owns the cash value of the policy and is the designated beneficiary. PFAS does not structure, underwrite or distribute COLI/BOLI policies. It provides policy service and administration services on behalf of the insurance company issuing the policy.
Reinsurance
PFG reinsures a significant portion of its mortality risk exposure and in connection therewith, pays to the reinsurers a portion of the premiums received. Insurance is ceded principally to reduce the net exposure to mortality risk and protect against large losses. PFG, unlike traditional life insurance companies, reinsures substantially all of its exposure to mortality risk. Reinsurance does not relieve PFG of its obligations to its policyholders and exposes PFG to credit risk with respect to its reinsurers.
Competition
Competition faced by PFG is based on a variety of factors, including service, product features, scale, price, financial strength, rating and name recognition. PFG competes with private and public insurance companies many of whom are significantly larger and
have greater access to capital and other resources that may provide competitive advantages. PFG’s ability to compete depends on its ability to develop profitable products, maintain relationships with intermediaries who distribute its products, maintain adequate ratings from ratings agencies, and provide a high quality of service to its customers.
Regulation
3
Insurance companies are subject to supervision and regulation in the states in which they transact business. Such supervision and regulation relate to numerous aspects of an insurance company’s business and financial condition. The purpose of such supervision and regulation is the protection of policyholders. The extent of such supervision and regulation varies, but generally derives from state statutes which delegate regulatory, supervisory and administrative authority to state insurance departments. Accordingly, the authority of the state insurance departments typically includes the establishment of standards of solvency which must be met and maintained by insurers, the licensing to do business of insurers and agents, the nature of and limitations on investments, the approval process for premium rates, the provisions which insurers must make for current losses and future liabilities, the deposit of securities for the benefit of policyholders and the approval of policy forms. Such insurance departments also conduct periodic examinations of the affairs of insurance companies and require the filing of annual and other reports relating to the financial condition of insurance companies. PFG is primarily domiciled in Pennsylvania and is subject to regulation by the Pennsylvania Insurance Department, among other regulatory authorities, with respect to statutory capital and reserve requirements. Certain other subsidiaries are subject to regulation by the New York State Department of Financial Services and the Bermuda Monetary Authority.
PFG’s insurance subsidiaries are generally restricted by the insurance laws of their respective domiciles as to the amount of dividends they may pay to their shareholders without the prior approval of the respective regulatory authorities. Generally, the maximum dividend that may be paid by an insurance subsidiary during any year without prior regulatory approval is limited to a stated percentage of that subsidiary’s statutory surplus as of a certain date, or adjusted net income of the subsidiary for the preceding year.
Employees
PFG and PFAS had 111 employees as of December 31, 2013.
Asset Management
Tiptree’s asset management operations are conducted through TAMCO, an SEC-registered investment adviser that is primarily a holding company for all of Tiptree’s asset management subsidiaries, which include among others, Telos and MCM. Tiptree, through these subsidiaries, manages assets within a variety of investment vehicles, including CLOs, managed accounts and other investment funds. Tiptree seeks to grow its asset management operations through acquisitions and through investments in new products launched and managed by its subsidiaries.
Telos Asset Management
Telos is an investment manager that establishes and manages investment products for various types of investors, including pension funds, hedge funds and other asset management firms, banks, insurance companies and other types of institutional investors. Its core investment products are primarily in the form of collateralized loan obligations ("CLOs") and managed accounts. The term CLO generally refers to a special purpose vehicle that owns a portfolio of senior secured loans and issues various tranches of debt and subordinated note securities to finance the purchase of those investments. The investment activities of a CLO are governed by extensive investment guidelines, generally contained within a CLO’s “indenture” and other governing documents which limit, among other things, the CLO’s maximum exposure to any single industry or obligor and limit the ratings of the CLO’s assets. Most CLOs have a defined investment period during which they are allowed to make investments and reinvest capital as it becomes available. Telos, as investment advisor/ manager of CLOs, selects and actively manages the underlying assets to achieve target investment performance, while seeking to avoid losses.
The investment advisory fees paid to Telos by these investment products are its primary source of revenue and are generally paid on a quarterly basis and are ongoing as long as Telos manages the products. Investment advisory fees typically consist of senior and subordinated management fees based on the amount of assets held in the investment product and, in certain cases, include incentive fees based on the returns generated for certain investors.
Telos is currently the manager of four CLOs: Telos CLO 2006-1, Ltd. (“Telos 1”), Telos CLO 2007‑2, Ltd. (“Telos 2”), Telos CLO 2013-3, Ltd. (“Telos 3”) and Telos CLO 2013-4, Ltd. (“Telos 4”).
Muni Capital Management - MCM
MCM is a manager of investments in securities exempt from U.S. federal income taxes. MCM currently manages Non-Profit Preferred Funding Trust I (“NPPF I”), a structured tax-exempt pass-through (“STEP”) vehicle. Interests in NPPF I are held solely by third parties unaffiliated with Tiptree. MCM is also the external manager and advisor to Tiptree’s subsidiary MFCA, which currently does not invest third party capital.
Competition
4
TAMCO and its subsidiaries compete for asset management clients and assets under management (“AUM”) with numerous other asset managers, including those affiliated with major commercial or investment banks and other financial institutions. Many of these organizations offer products and services that are similar to, or compete with, those TAMCO and its subsidiaries may offer, and many of these organizations have substantially more personnel and greater financial resources. Some of these competitors have proprietary products and distribution channels that make it more difficult for TAMCO and its subsidiaries to compete with them. Some competitors have greater portfolio management resources, have managed client accounts for longer periods of time, have greater experience over a wider range of products or have other competitive advantages. The factors considered by clients in choosing TAMCO and its subsidiaries or a competitor include the past performance of the products managed, the background and experience of key personnel, the experience in managing a particular product, and reputation, investment advisory fees and the structural features of the investment products offered.
Regulation
The asset management industry in the U.S. is subject to extensive regulation under federal and state securities laws as well as the rules of self-regulatory organizations. The Securities and Exchange Commission (“SEC”) is the federal agency charged with administration of federal securities laws. Each of TAMCO, Telos and MCM (collectively, the “Advisers”) are registered with the SEC as investment advisers, and are required to make notice filings in certain states. Virtually all aspects of the asset management business, including related sales and distribution activities, are subject to various federal and state laws and regulations and self-regulatory organization rules. These laws, rules and regulations are primarily intended to protect the asset management clients and generally grant supervisory agencies and bodies broad administrative powers, including the power to limit or restrict an investment advisor from conducting its asset management business in the event that it fails to comply with such laws and regulations. Possible sanctions that may be imposed include the suspension of individual employees, the imposition of limitations on engaging in the asset management business for specified periods of time, the requirement to hire independent compliance consultants, the revocation of licenses or registrations, and imposition of censures and fines. In addition, investment vehicles managed by the Advisers are subject to various securities laws and other laws.
Employees
TAMCO had 19 employees as of December 31, 2013, 8 of whom are dedicated to Telos, 3 dedicated to MCM, and 8 to Tiptree’s corporate activities.
Specialty Finance
Tiptree’s specialty finance operations include: Muni Funding Company of America, which provides financing to tax-exempt organizations; Siena Lending Group, which provides asset-based loans to smaller U.S. businesses; Luxury Mortgage Corp., a residential mortgage lender that originates agency, prime jumbo and super jumbo mortgages; and Tiptree Direct, which holds our principal investments and all non-consolidated minority investments. Tiptree intends to continue to grow its specialty finance operations through acquisitions and by exploring strategic alternatives with respect to new financing products which may provide attractive returns to Tiptree.
Muni Funding Company of America - MFCA
MFCA is a specialty finance company that acquires and invests in the debt and securities of tax-exempt organizations, primarily in the healthcare, educational and social services sectors. MFCA operates in the tax advantaged finance sector, which may include holding or acquiring tax-exempt obligations, mortgage-related holdings, interests in structured credit entities, taxable municipal bonds, derivative instruments, equity interests in real estate (such as affordable housing partnerships), other equity investments, investments in “taxable tails” or tax credits, investments in leases with municipal borrowers and other assets. MFCA derives income from interest on the assets held by it and its subsidiaries and from any gains on the sale or prepayment of assets.
Competition
MFCA competes with mutual funds, closed-end funds, specialty finance companies, hedge funds, insurance companies, institutional investors, investment banking firms and other financial entities specifically focused on acquiring tax-exempt assets many of whom may be significantly larger,
have greater access to capital and other resources and may possess other competitive advantages.
Employees
MFCA is externally managed by MCM, a subsidiary of TAMCO, so it does not have any employees. Three TAMCO employees were dedicated to MFCA as of December 31, 2013.
Siena Lending Group
5
Siena is a commercial finance company providing financing solutions to small and medium sized U.S. companies. Siena originates, structures, underwrites and services senior, secured asset-based loans for companies with sales typically between $5 million and $50 million operating across a range of industry sectors. Its core financing solutions include revolving lines of credit and term loans, which may collectively be referred to as asset-based loans and typically range in size from $1 million to $20 million. Siena also has the ability to arrange significantly larger transactions that may be syndicated to others or Siena may participate in large syndications itself.
Siena’s asset-based loans are typically used to fund working capital needs and are secured by eligible, margined collateral, including accounts receivable, inventories, and, to a lesser extent, other long-term assets. In determining a borrowers’ ability and willingness to repay loans, Siena conducts a detailed due diligence investigation to assess financial reporting accuracy and capabilities as well as to verify the values of business assets among other things. Siena employs third parties to conduct field exams to audit financial reporting and to appraise the value of certain types of collateral in order to estimate its liquidation value. Financing arrangements with customers also typically include substantial controls over the application of borrowers’ cash and Siena retains discretion over collateral advance rates and eligibility among other key terms and conditions.
Siena also offers a servicing platform which provides asset based lending solutions for community and regional banks that do not have the expertise or capacity to underwrite or service asset-based loans.
Competition
Siena’s market is competitive, based on factors that vary by product, customer, and geographic region. Competitors include global and domestic commercial and investment banks, regional and community banks, captive finance companies, and other niche specialty finance companies. Many of the larger competitors have greater financial, technological, and marketing resources than Siena.
Employees
Siena had 7 employees as of December 31, 2013.
Luxury Mortgage Corp.
Tiptree completed the acquisition of 67.5% of Luxury in January 2014 and Luxury will be consolidated within Tiptree’s financial statements beginning with the first quarter of 2014. Luxury’s operations include the origination, packaging and sale of agency, prime jumbo and super jumbo mortgage loans into the secondary market through whole loan sales. The loans are typically sold shortly after origination into a liquid secondary market. Loans sold into the secondary market may be sold “servicing-retained” or “servicing-released,” referring to whether the rights to service the mortgage are retained by the originator or released to the secondary market investor at the time of sale. Luxury currently sells all of its loans on a servicing released basis.
Luxury offers a variety of residential adjustable and fixed rate mortgage products . Luxury currently uses two production channels to originate or acquire mortgage loans: retail sales offices (commonly referred to as “retail”), as well as a broker (commonly referred to as “wholesale”). Each production channel produces similar mortgage loan products and generally applies the same underwriting standards. Luxury leverages technology to streamline the mortgage origination process and bring service and convenience to both channels. Brokers are able to register and lock loans, check the status of the loan, and deliver documents in electronic format through the internet and are supported by a sales support team assists brokers where Luxury is licensed to do business.
In the retail channel, loans are originated by mortgage loan originators employed by Luxury. When loans are originated on a retail basis, the origination documentation is completed internally inclusive of customer disclosures and other aspects of the lending process and the funding of the transactions. In the wholesale channel, an unaffiliated bank, mortgage bank, or mortgage brokerage company completes much of the loan paperwork. All loans are underwritten on a loan-level basis to
Luxury’s underwriting standards.
The wholesale channel also includes correspondent transactions, where an unaffiliated bank or mortgage company completes the loan paperwork and also supplies the funding for the loan at closing. Luxury does not currently participate in this channel but may choose to do so in the future.
Luxury’s revenues include interest income earned for the period the loans are on Luxury’s balance sheet, gain on sale income representing the difference between the origination value and the sale value of the loan and fee income earned at origination.
Competition
6
The market for origination of residential mortgages is highly competitive. There are a large number of institutions offering mortgage loans, including many that operate on a national scale, as well as local savings banks, commercial banks, and other lenders. With respect to those products that Luxury offers, the company competes by offering competitive interest rates, fees, and other loan terms and services and by offering efficient and rapid service. Many of Luxury’s competitors are larger and have access to greater financial resources, which can place Luxury at a competitive disadvantage. In addition, many of the largest competitors are banks or are affiliated with banking institutions, the advantages of which include, but are not limited to, the ability to hold mortgage loan originations in an investment portfolio and having access to financing with more favorable terms, including lower interest rate bank deposits as a favorable source of funding.
Regulation
Luxury is subject to extensive regulation by federal, state and local governmental authorities, including the Consumer Financial Protection Bureau, the Federal Trade Commission and various state agencies that license, audit and conduct examinations. Luxury is licensed or qualified to do business in 19 states in the U.S. Luxury must comply with a number of federal, state and local consumer protection laws including, among others, the Gramm-Leach-Bliley Act, the Fair Debt Collection Practices Act, the Real Estate Settlement Procedures Act, the Truth in Lending Act, the Fair Credit Reporting Act, the Servicemembers Civil Relief Act, Homeowners Protection Act, the Federal Trade Commission Act and, more recently, the Dodd-Frank Wall Street Reform and Consumer Protection Act (“Dodd-Frank Act”) and state foreclosure laws. These statutes apply to loan origination, debt collection, use of credit reports, safeguarding of non−public personally identifiable information about customers, foreclosure and claims handling, investment of and interest payments on escrow balances and escrow payment features, and mandate certain disclosures and notices to borrowers. These requirements can and do change as statutes and regulations are enacted, promulgated or amended. Over the past few years, state and federal lawmakers and regulators have adopted a variety of new or expanded laws and regulations, including the Dodd-Frank Act.
Employees
Luxury had 103 employees as of December 31, 2013.
Tiptree Direct
Tiptree Direct primarily holds our principal investments, which includes the positions we own in the subordinate notes of CLOs managed by Telos. In addition, Tiptree Direct holds the Company’s non-consolidated investments.
Real Estate
Tiptree’s real estate operations include Care, a real estate investment company, and interests in the Star Asia Entities, which are Tokyo based real estate holding companies formed to invest predominately in Asian properties and real estate related debt instruments. Tipree intends to continue to grow its real estate operations through new acquisitions and investments by Care.
Care LLC
Care is a real estate investment company that primarily acquires and owns senior housing properties within the U.S. Care’s focus is on acquisitions ranging in size from $5 to $200 million in the senior housing and care industry that provide attractive returns. Care’s overall strategy is to identify strong and experienced managers or operators of senior housing facilities who are looking to expand and diversify their operations by entering into strategic relationships with capital partners. Through joint ventures, Care may also operate senior housing properties and hire experienced managers to run the day to day operations at the properties.
Care’s senior housing communities currently include senior apartments, independent and assisted living communities, and communities providing care for individuals with Alzheimer’s disease and other forms of dementia or memory loss. Rent payments and services provided in these facilities are primarily paid for by the residents directly or through private insurance and are less reliant on government reimbursement programs such as Medicaid and Medicare. Care intends to continue to grow its portfolio primarily through the acquisition of senior housing properties, utilizing investments structures such as leases and joint ventures. As Care acquires additional properties and expands its portfolio, it intends to further diversify its concentrations by tenant, asset class and geography within the senior housing sector, including further investments in senior apartments, independent and assisted living communities, memory care communities and skilled nursing facilities.
Competition
Care competes for investments in the senior housing and care sector with other real estate investment companies and real estate investment trusts, real estate partnerships, private equity firms and hedge funds, finance/investment companies, taxable and tax-exempt bond funds, health care operators and developers. Care competes for investments based on a number of factors including
7
investment structures, underwriting criteria and reputation. Care’s ability to successfully compete is impacted by economic and demographic trends, availability of acceptable investment opportunities, ability to negotiate beneficial investment terms, availability and cost of capital and new and existing laws and regulations.
The operators/managers/lessees of Care’s properties compete on a local and regional basis with those of properties that provide comparable services. Operators/managers/lessees compete for residents based on a number of factors including quality of service, reputation, physical appearance of properties, location, services offered, family preferences, physicians, staff and price. Care also faces competition from other health care facilities for tenants, such as physicians and other health care providers that provide comparable facilities and services.
Regulation
Tenants and operators of healthcare properties are typically subject to federal, state and local laws and regulations relating to environmental protection and human health and safety. Federal laws such as the National Environmental Policy Act, the Comprehensive Environmental Response, Compensation, and Liability Act, the Resource Conservation and Recovery Act, the Federal Water Pollution Control Act, the Federal Clean Air Act, the Toxic Substances Control Act, the Emergency Planning and Community Right to Know Act and the Hazard Communication Act govern such matters as wastewater discharges, air emissions, the operation and removal of underground and above-ground storage tanks, the use, storage, treatment, transportation and disposal of solid and hazardous materials and the remediation of contamination associated with disposals. Some of these laws and regulations impose joint and several liabilities on tenants, owners or operators for the costs to investigate or remediate contaminated properties, regardless of fault or whether the acts causing the contamination were legal. In addition, there are various federal, state and local fire, health, life-safety and similar regulations applicable to healthcare properties.
Care’s properties may be affected by Care’s operators’, managers’ and lessees’ operations, the existing condition of land when acquired, operations in the vicinity of our properties, such as the presence of underground storage tanks, or activities of unrelated third parties. The presence of hazardous substances, or the failure to properly remediate these substances, may make it difficult or impossible to sell or rent such property.
In addition, the healthcare industry is highly regulated by federal, state and local licensing requirements, facility inspections, reimbursement policies, regulations concerning capital and other expenditures, certification requirements and other laws, regulations and rules. In addition, regulators require compliance by our tenants and third party operators with a variety of safety, health, staffing and other requirements relating to the design and conditions of the licensed facility and quality of care provided. The failure of any tenant, manager or operator to comply with such laws, requirements and regulations could affect a tenant’s, manager’s or operator’s ability to operate the facilities that Care owns.
Private, federal and state payment programs, including Medicaid and Medicare, and the effect of laws and regulations may also have a significant influence on the profitability of the properties and their tenants.
Employees
Tiptree had 4 employees dedicated to Care as of December 31, 2013.
STRUCTURE
On July 1, 2013, in exchange for interests in the Operating Company, TFP and Care Inc. contributed substantially all of their assets to the Operating Company, which we refer to as the “Contribution Transactions.” Approximately 75% of Operating Company is owned by TFP and the remaining approximately 25% is owned by Tiptree. In connection with the Contribution Transactions, Care Inc. changed its name to “Tiptree Financial Inc.”
TFP was organized in May 2007 and completed a private placement of approximately $139 million in June 2007. From 2007 until the Contribution Transactions, TFP pursued the strategy described above as a private partnership. Prior to June 30, 2012, TFP was externally managed by an affiliate of Tricadia. Care Inc. was incorporated as Care Investment Trust Inc. in Maryland in March 2007 and completed its initial public offering in June 2007. From 2007 until the Contribution Transactions, Care Inc. operated as a real estate investment trust investing in healthcare related real estate assets.
The following chart shows a simplified version of our organizational structure:
8
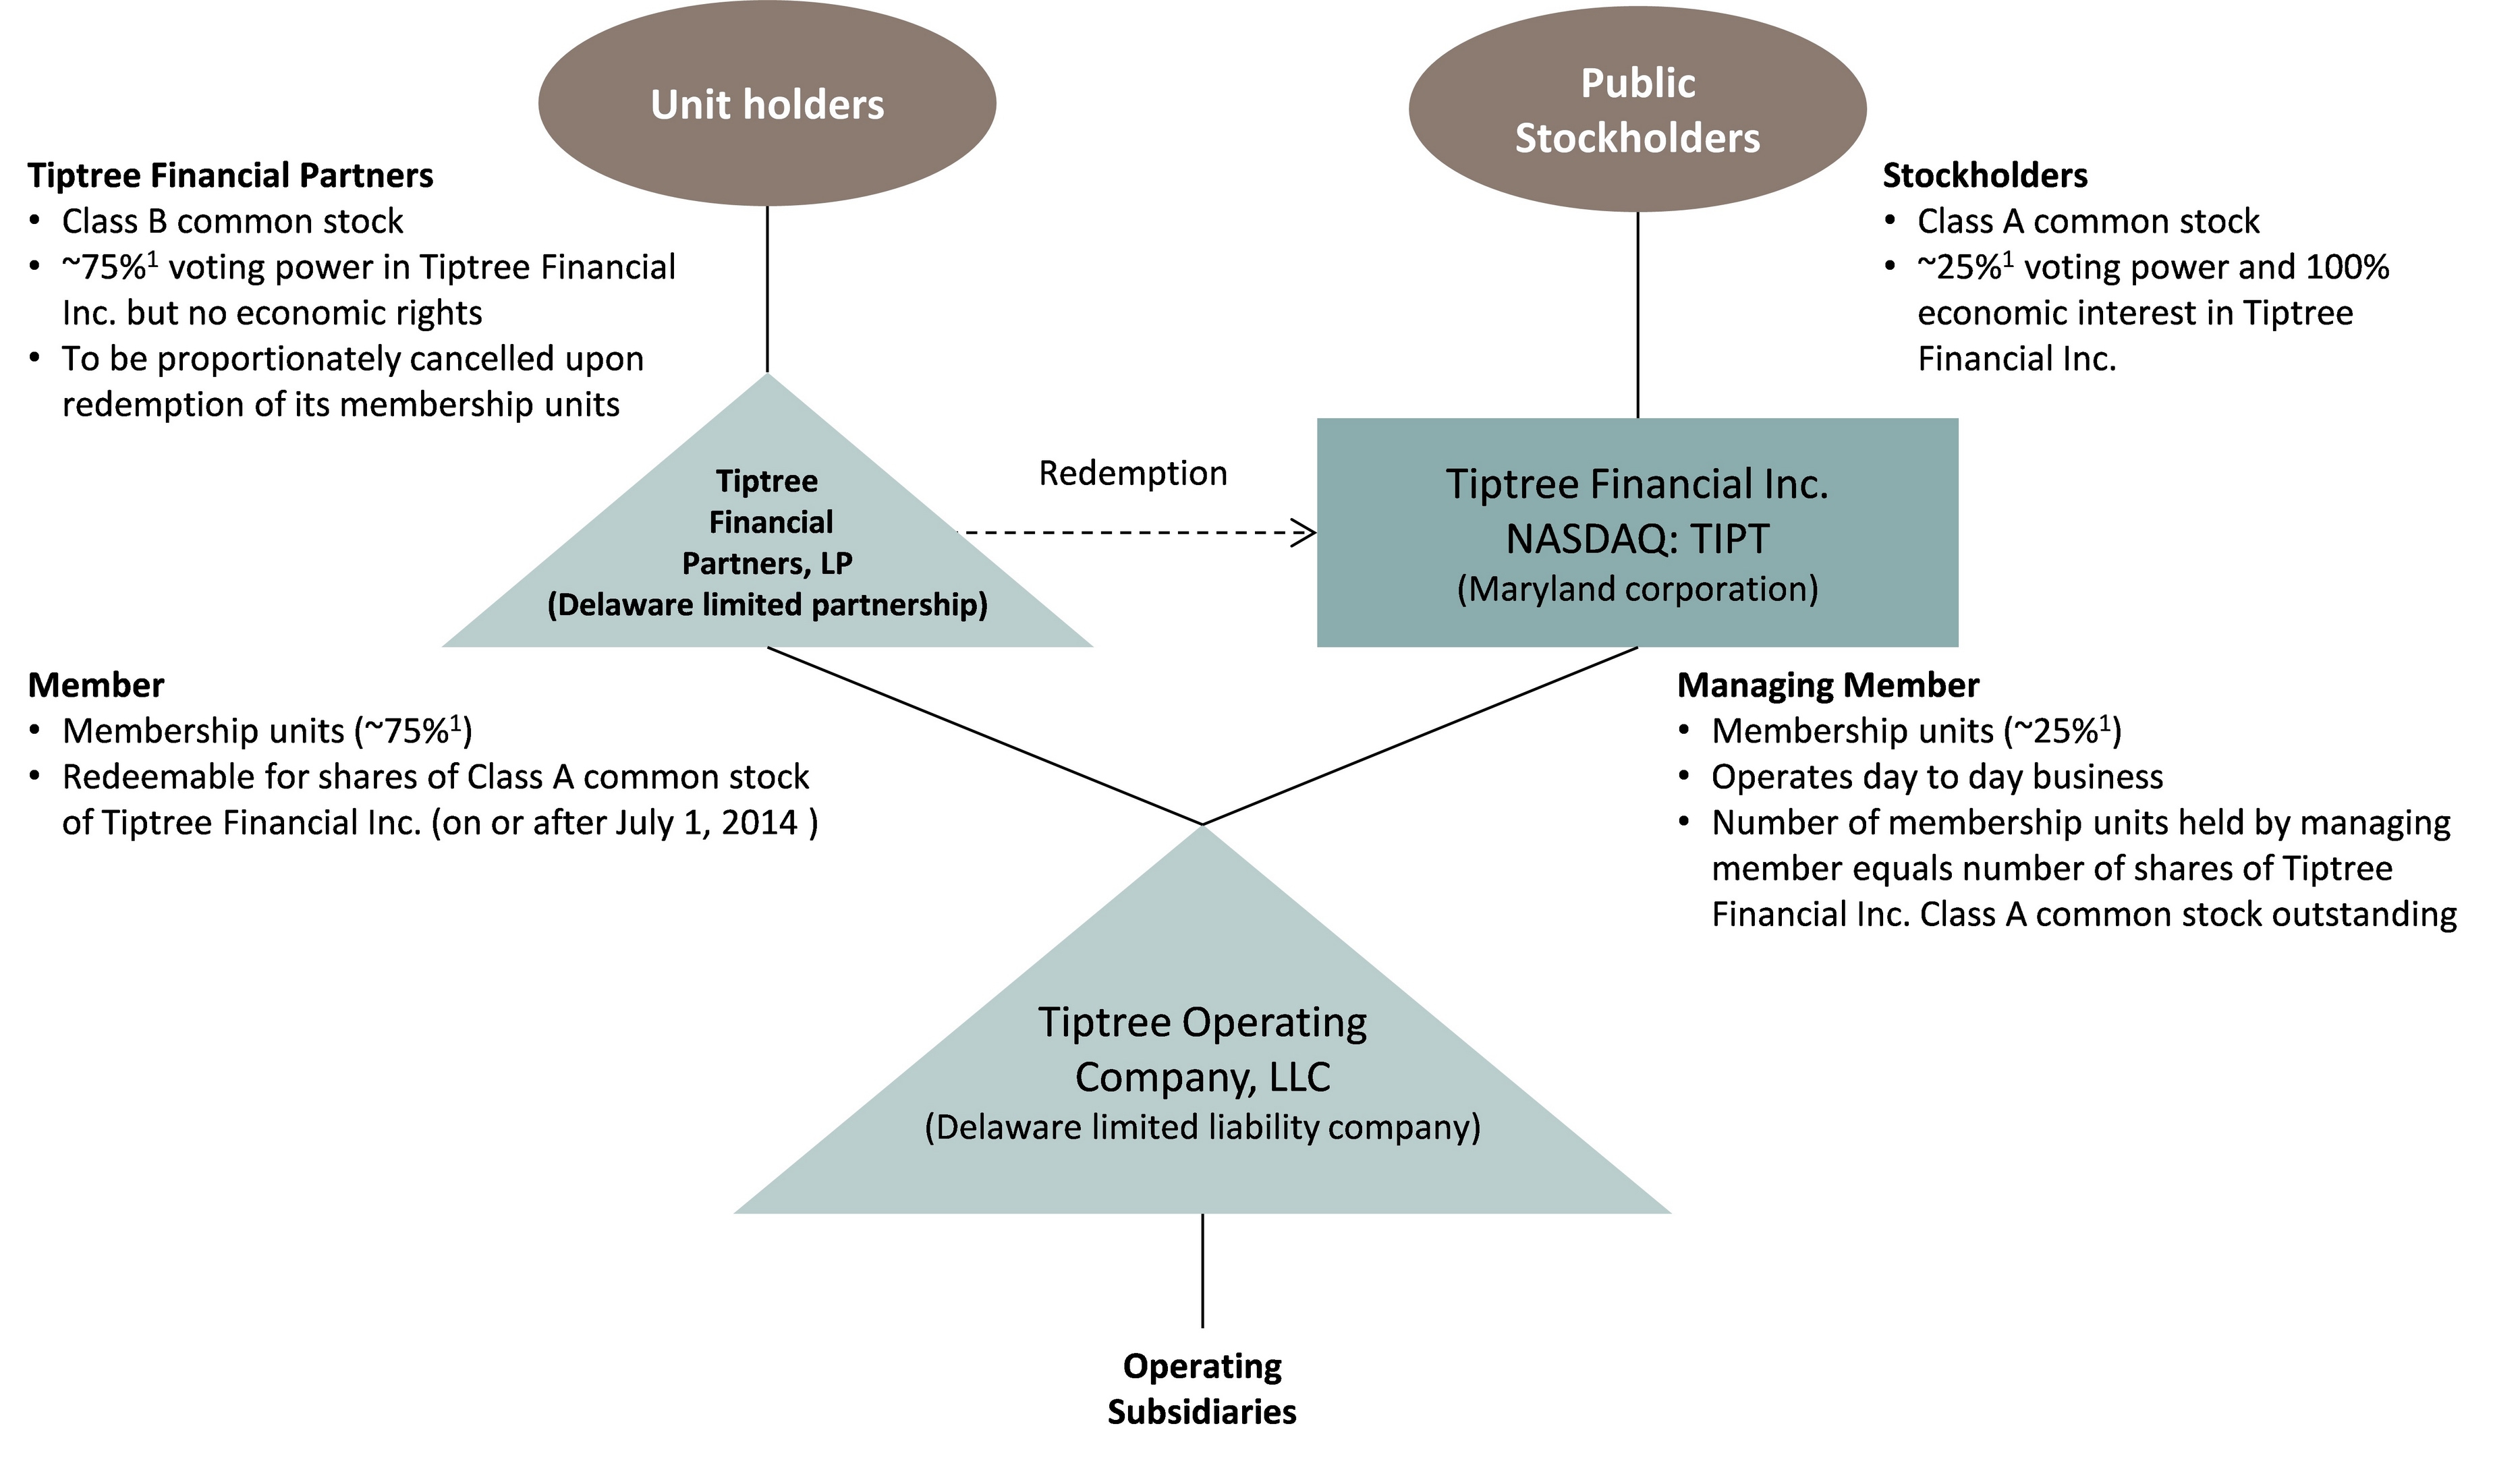
1
Percentages shown are approximate as of December 31, 2013 and will change accordingly as membership units are redeemed for Class A common stock of Tiptree Financial Inc.
Competition
In addition to the competition our businesses face, we are subject to significant competition in identifying, evaluating and pursuing acquisition opportunities. Many of these competitors are of varying sizes and compete with us to make the types of acquisitions that we plan to make, including strategic corporate buyers, banks, mortgage companies, specialty finance companies, insurance companies, asset managers, private equity funds, hedge funds, family offices, real estate investment trusts, limited partnerships, business development companies and special purpose acquisition vehicles. Many of our competitors are significantly larger, have greater access to capital and other resources and may possess other competitive advantages. We believe that Tiptree’s position as a public company may provide a competitive advantage over privately held entities that may compete to acquire certain target businesses, and unlike private buyers of companies such as private equity firms, Tiptree is able to pay for acquisitions with cash or equity securities.
Employees
As of December 31, 2013, 18 persons provided services to Tiptree (as employees or pursuant to a services agreement) at the holding company and on a consolidated basis, including all of Tiptree’s consolidated subsidiaries, Tiptree had 250 employees.
AVAILABLE INFORMATION
We are required to file annual, quarterly and current reports, proxy statements and other information with the SEC. The public may read and copy any materials that we file with the SEC at the SEC’s Public Reference Room at 100 F Street, N.E., Washington, D.C. 20549. Information on the operation of the Public Reference Room may be obtained by calling the SEC at 1-800-SEC-0330. In addition, the SEC maintains an Internet site that contains reports, proxy and information statements, and other information regarding issuers that file electronically with the SEC at
http://www.sec.gov
.
Our Annual Reports on Form 10-K, Quarterly Reports on Form 10-Q, Current Reports on Form 8-K, proxy statements and amendments to those reports filed or furnished pursuant to Section 13(a) or 15(d) of the Exchange Act, as amended (the Exchange Act), are also available free of charge on our Internet site at
www.tiptreefinancial.com
as soon as reasonably practicable after such reports are electronically filed with or furnished to the SEC. The information on our website is not, and shall not be deemed to be, a part hereof or incorporated into this or any of our other filings with the SEC.
9
Our Investor Relations Department can be contacted at Tiptree Financial Inc., 780 Third Avenue, 21st Floor, New York, NY, 10017, Attn: Investor Relations, telephone: (212) 446-1400, email: IR@tiptreefinancial.com.
We are a holding company with multiple lines of business, which may adversely impact the market price of our Class A common stock and our ability to raise equity and debt capital.
Operating Company holds and manages multiple lines of business. Research analysts, investors and lenders may have difficulty analyzing and valuing a company with multiple lines of business, which could adversely impact the market price of our Class A common stock and our ability to raise equity and debt capital. Moreover, our management is required to make decisions regarding the allocation of capital among the different lines of business, and such decisions could materially and adversely affect our business.
Because we are a holding company, our ability to make distributions to stockholders will depend on distributions from our subsidiaries that may be subject to restrictions.
Because we are a holding company, our ability to make distributions to stockholders will depend on distributions from our subsidiaries. The amount of dividends that our subsidiaries may distribute to us may be subject to restrictions imposed by state law, restrictions that may be imposed by state regulators and restrictions imposed by the terms of any current or future indebtedness that these subsidiaries may incur. For example, PFG, an insurance holding company in which we own a controlling interest, is required to maintain minimum capital and surplus requirements and is subject to laws and regulations that limit the amount of dividends that PFG can pay to us. PFG may also be required to limit the amount of dividends paid to us to maintain a risk-based capital ratio to maintain or improve its ratings by rating agencies.
We may be limited in the future in utilizing net operating losses incurred during prior periods to offset taxable income.
Care and PFG previously incurred net operating losses. In the event that we experience an “ownership change” within the meaning of Section 382 of the Internal Revenue Code of 1986, as amended, which we refer to as the “Code”, including as a result of the Contribution Transactions, our ability to use those net operating losses to offset taxable income would be subject to an annual limitation. The annual limitation would be equal to a percentage of our equity value at the time the ownership change occurred. In general, such an “ownership change” would occur if the percentage of our stock owned by one or more 5% stockholders were to increase by 50 percentage points during any three-year period. A 5% stockholder is a person (including certain groups of persons acting in concert) that owns at least 5% of our stock. All stockholders that own less than 5% of our stock are treated as a single 5% stockholder. In addition, the Treasury Regulations under Section 382 of the Internal Revenue Code contain additional rules the effect of which is to make it more likely that an ownership change could be deemed to occur. Accordingly, our ability to use prior net operating losses to offset future taxable income would be subject to a limitation if we experience an ownership change.
Compliance with existing and new regulations affecting our businesses in regulated industries may increase costs and limit our ability to pursue business opportunities.
We are subject to extensive laws and regulations administered and enforced by a number of different federal and state governmental authorities. For example, PFG’s insurance subsidiaries are subject to regulation by the Pennsylvania Insurance Department, among other regulatory authorities, with respect to statutory capital and reserve requirements and certain of its subsidiaries are subject to regulation by the New York State Department of Financial Services and the Bermuda Monetary Authority. TAMCO, is an asset management holding company registered with the SEC as an investment advisor and the properties held by our subsidiary Care LLC, are regulated by state and federal laws regarding healthcare facilities. Luxury is subject to extensive regulation by federal, state and local governmental authorities, including the Consumer Financial Protection Bureau, the Federal Trade Commission and various state agencies that license, audit and conduct examinations. Regulation of the industries in which we operate is expected to increase. In the past several years there has been significant legislation affecting financial services, insurance and health care, including the Dodd-Frank Wall Street Reform and Consumer Protection Act and the Patient Protection and Affordable Care Act, and many of the regulations associated with these laws have yet to be written. Accordingly, we cannot predict the impact that any new laws and regulations will have on us. The costs to comply with these laws and regulations may be substantial and could have a significant negative impact on us and limit our ability to pursue business opportunities.
10
A portion of our assets are illiquid or have limited liquidity, which may limit our ability to sell those assets at favorable prices or at all and creates uncertainty in connection with valuing such assets.
Our assets include real estate, non-controlling interests in credit assets and related equity interests which may be illiquid or have limited liquidity. It may be difficult for us to dispose of assets with limited liquidity rapidly, or at favorable prices, if at all. In addition, assets with limited liquidity may be more difficult to value and may be sold at a substantial discount or experience more volatility than more liquid assets. We may not be able to dispose of assets at the carrying value reflected in our financial statements. Our results of operations and cash flows may be materially and adversely affected if our determinations regarding the fair value of our illiquid assets are materially higher than the values ultimately realized upon their disposal.
Certain of our assets are subject to credit risk, market risk, interest rate risk, credit spread risk, selection risk, call and redemption risk and/or tax risk, and any one of these risks may materially and adversely affect the value of our assets, our results of operations and our financial condition.
Some of our specialty finance assets are subject to credit risk, market risk, interest rate risk, credit spread risk, selection risk, call and redemption risk and/or tax risk.
Credit risk is the risk that the obligor will be unable to pay scheduled principal and/or interest payments. In this regard, investing in non-investment grade obligations is riskier than investing in higher quality instruments. In addition, market value fluctuations may be larger and more frequent. Changes in the underlying obligor’s financial results may affect the credit rating or the market’s perception of its creditworthiness, which may affect the market value of the credit assets of that obligor. The degree of credit risk depends on the terms of the obligation as well as on the financial condition of the obligor in respect thereof.
Market risk is the risk that one or more markets to which the assets relate will decline in value, including the possibility that such markets will deteriorate sharply and unpredictably, which will likely impair the market value of the related obligations.
With respect to fixed-rate obligations, interest rate risk is the risk that the market value of these obligations will change in response to changes in the interest rate environment or other developments that may affect the fixed income market generally. When market interest rates go up, the market value of existing fixed rate obligations goes down and obligations with longer maturities are typically affected more by changes in interest rates than obligations with shorter maturities. Because market interest rates continue to be near their lowest levels in many years, there is a greater risk that prevailing interest rates increase in the future and, as a result, that these obligations may decline in market value. With respect to floating-rate obligations, interest rate risk is the risk that defaults on these obligations will increase during periods of rising interest rates and, during periods of declining interest rates, that obligors may exercise their option to prepay principal earlier than scheduled.
Credit spread risk is the risk that the market value of fixed income obligations will change in response to changes in perceived or actual credit risk beyond changes that would be attributable to changes, if any, in interest rates.
Call and redemption risk is the risk that debt instruments will be called or redeemed prior to maturity at a time when yields on other debt instruments in which the call or redemption proceeds could be invested are lower than the yield on the called or redeemed instrument. Any one of these risks may materially and adversely affect the value of our assets, results of operations and financial condition.
We leverage our assets and a decline in the fair value of such assets may adversely affect our financial condition and results of operations.
We leverage our assets, including through borrowings, generally through warehouse facilities, secured loans, derivative instruments such as total return swaps, securitizations (including the issuance of CLOs) and other borrowings. A rapid decline in the fair value of our leveraged assets, such as the declines experienced in the fourth quarter of 2007 and the first quarter of 2008, may adversely affect us. Lenders may require us to post additional collateral to support the borrowing. If we cannot post the additional collateral, we may have to rapidly liquidate assets, which we may be unable to do on favorable terms or at all. Even after liquidating assets, we may still be unable to post the required collateral, further harming our liquidity and subjecting us to liability to lenders for the declines in the fair values of the collateral. A reduction in credit availability may adversely affect our business, financial condition and results of operations.
A reduction in administrative fees paid to PFAS could adversely affect our financial condition and results of operations.
PFAS generates revenue from administrative fees collected from a portfolio of company-owned life insurance policies and bank-owned life insurance policies issued and underwritten by affiliates of The Hartford pursuant to a servicing agreement. A reduction
11
in administrative fees paid to PFAS, due to the lapse or surrender of policies administered or termination of PFAS’s servicing agreement with a subsidiary of The Hartford, could adversely affect our financial condition and results of operations.
The amount of PFG’s required statutory capital can increase because of factors outside of PFG’s control.
PFG’s insurance subsidiaries are subject to statutory capital and reserve requirements established by the applicable insurance regulators based on risk-based capital formulas. As of December 31, 2013, PFG’s insurance subsidiaries maintained statutory capital and reserves of $20.1 million. In any particular year, these requirements may increase or decrease depending on a variety of factors, most of which are outside PFG’s control, such as the amount of statutory income or losses generated, changes in equity market levels, the value of fixed-income and equity securities in PFG’s investment portfolio, changes in interest rates and foreign currency exchange rates, as well as changes to the risk-based capital formulas used by insurance regulators. Increases in the amount of additional statutory reserves that PFG is required to hold can adversely affect our financial condition and results of operations.
A downgrade in PFG’s claims paying ability or financial strength ratings could increase policy surrenders or withdrawals, adversely affecting relationships with distributors and reducing new policy sales.
Claims paying ability ratings, sometimes referred to as financial strength ratings, indicate a rating agency’s view of an insurance company’s ability to meet its obligations to its policy holders. These ratings are therefore key factors underlying the competitive position of life insurers. Some non-affiliated distributors of PFG’s life insurance products may choose not to do business with insurance companies that are rated below certain financial strength ratings. PFG currently has ratings of “A-” from A.M. Best Company, Inc. A ratings downgrade or the potential for such a downgrade in its rating could materially increase the number of policy surrenders or withdrawals by policyholders of cash values from their policies, adversely affect relationships with distributors of PFG’s annuity and life insurance products, reduce new annuity policy sales and adversely affect our ability to compete in the life insurance industry.
A change in law or regulation applicable to PFG’s annuity and insurance products could adversely affect our financial condition and results of operations.
PFG generates revenue from the sale and administration of variable annuity and variable life insurance products. These products enjoy favorable U.S. federal income tax benefits that are conferred by statute or regulation. Should such benefits be curtailed or eliminated by changes in statute or regulation, PFG’s continuing issuance of variable annuity and variable life insurance products could be adversely affected. Any retroactive application of changes could result in surrenders by holders of PFG’s existing variable annuity and variable life insurance products and reduce PFG’s revenues, which could adversely affect our financial condition and results of operations.
PFG may incur losses if its reinsurers are unwilling or unable to meet their obligations under reinsurance contracts.
PFG uses reinsurance to reduce the severity and incidence of claims costs, and to provide relief with regard to certain reserves. As of December 31, 2013, substantially all of the mortality risk on the insurance policies issued by PFG was reinsured by third parties. Under these reinsurance arrangements, other insurers assume a portion of PFG’s losses and related expenses; however, PFG remains liable as the direct insurer on all risks reinsured. Consequently, reinsurance arrangements do not eliminate PFG’s obligation to pay claims and PFG assumes credit risk with respect to its ability to recover amounts due from its reinsurers. The inability or unwillingness of any reinsurer to meet its financial obligations could negatively affect our financial condition and results of operations.
A reduction in fees paid to TAMCO could adversely affect our profitability.
TAMCO generates management, servicing and advisory fees based on the amount of assets managed and, in certain cases, on the returns generated by the assets managed. A reduction in fees paid to TAMCO, due to termination of management agreements, reduction in assets managed or lower than expected returns, could adversely affect our results of operations.
The nature of the assets owned by MFCA presents risks related to the special nature of such assets.
MFCA’s assets may also include certain tax-exempt lease obligations, which may be subject to annual appropriation by the municipality. Failure to appropriate would result in MFCA having to exercise remedies, including repossession of equipment or foreclosure on property, which could result in losses by MFCA, which may materially and adversely affect our results of operations and financial condition.
Prepayment rates on MFCA’s assets could negatively affect the value of MFCA’s assets.
12
The value of MFCA’s assets and derivative arrangements related to its assets, if any, may be adversely affected by prepayment rates of the underlying assets. Prepayment rates are influenced by changes in interest rates and a variety of economic, political, geographic and other factors beyond our control. Consequently, our results of operations may be adversely affected if the underlying obligors prepay the assets at higher-than-projected or estimated rates.
Liability relating to environmental matters may decrease the value of our real estate assets.
Under various federal, state and local laws, an owner or operator of real property may become liable for the costs of cleanup of certain hazardous substances released on or under its property. Such laws often impose liability without regard to whether the owner or operator knew of, or was responsible for, the release of such hazardous substances. The presence of hazardous substances may adversely affect an owner’s ability to sell real estate or borrow using real estate as collateral. To the extent that any of our owned real estate encounters environmental issues, it may adversely affect the value of that real estate. Further, in regard to any mortgage investment, if the owner of the underlying property becomes liable for cleanup costs, the ability of the owner to make debt payments may be reduced, which in turn may adversely affect the value of the relevant mortgage asset held by us. In addition, in certain instances, we may be liable for the cost of any required remediation or clean up.
Violation of fraud and abuse laws applicable to our real estate tenants, lessees and operators may jeopardize a tenant’s, lessee’s or operator’s ability to make payments to us.
The federal government and numerous state governments have passed laws and regulations that attempt to eliminate healthcare fraud and abuse by prohibiting business arrangements that induce patient referrals or inappropriately influence the ordering of specific ancillary services. In addition, numerous federal laws have continued to strengthen the federal fraud and abuse laws to provide for broader interpretations of prohibited conduct and stiffer penalties for violations. Violations of these laws may result in the imposition of criminal and civil penalties, including possible exclusion from federal and state healthcare programs. Imposition of any of these penalties upon any of our tenants, lessees or operators could jeopardize their ability to operate a facility or to make payments to us, thereby potentially adversely affecting us, or our financial condition and results of operations.
In the past several years, federal and state governments have significantly increased investigation and enforcement activity to detect and eliminate fraud and abuse in the Medicare and Medicaid programs. In addition, legislation and regulations have been adopted at state and federal levels, which severely restricts the ability of physicians to refer patients to entities in which they have a financial interest. It is anticipated that the trend toward increased investigation and enforcement activity in the area of fraud and abuse, as well as self-referrals, will continue in future years and could adversely affect our prospective tenants, lessees or operators and their operations, and in turn their ability to make payments to us.
Our real estate operating entities expose us to various operational risks, liabilities and claims that could adversely affect our ability to generate revenues or increase our costs and could adversely affect our financial condition and results of operations.
Our ownership of real estate operating entities exposes us to various operational risks, liabilities and claims that could increase our costs or adversely affect our ability to generate revenues, thereby reducing our profitability. These operational risks include fluctuations in occupancy levels, the inability to achieve economic resident fees (including anticipated increases in those fees), rent control regulations, increases in the cost of food, materials, energy, labor (as a result of unionization or otherwise) or other services, national and regional economic conditions, the imposition of new or increased taxes, capital expenditure requirements, professional and general liability claims, and the availability and cost of professional and general liability insurance. Any one or a combination of these factors could result in operating deficiencies in our operating assets, which could adversely affect our financial condition and results of operations.
Our use of joint ventures may limit our flexibility with respect to such jointly owned investments and could, thereby, have a material adverse affect on our business, results of operations and financial condition and our ability to sell these joint venture interests.
We have invested in joint ventures with other persons or entities when circumstances warrant the use of these structures and may invest in additional joint ventures. Our participation in joint ventures is subject to the risks that:
|
•
|
we could experience an impasse on certain decisions because we do not have sole decision-making authority, which could require us to expend additional resources on resolving such impasses or potential disputes;
|
|
•
|
our joint venture partners could have investment goals that are not consistent with our investment objectives, including the timing, terms and strategies for any investments;
|
13
|
•
|
our joint venture partners might become bankrupt, fail to fund their share of required capital contributions or fail to fulfill their obligations as joint venture partners, which may require us to infuse our own capital into such venture(s) on behalf of the joint venture partner(s) despite other competing uses for such capital;
|
|
•
|
our joint venture partners may have competing interests in our markets that could create conflict of interest issues;
|
|
•
|
any sale or other disposition of our interest in a joint venture may require lender consents which we may not be able to obtain;
|
|
•
|
such transactions may also trigger other contractual rights held by a joint venture partner, lender or other third party depending on how the transaction is structured; and
|
|
•
|
there may be disagreements as to whether consents and/or approvals are required in connection with the consummation of a particular transaction with a joint venture partner, lender and/or other third party, or whether such transaction triggers other contractual rights held by a joint venture partner, lender and/or other third party, and in either case, those disagreements may result in litigation.
|
We incur increased costs as a result of operating as a public company, and our management will be required to devote substantial time to new compliance initiatives.
As a public company, we incur additional legal, accounting and other costs that we did not incur prior to the Contribution Transactions. Although we are currently unable to estimate these costs with any degree of certainty, they may be material in amount. In addition, the Sarbanes-Oxley Act of 2002, or the “Sarbanes-Oxley Act,” the Dodd-Frank Wall Street Reform and Consumer Protection Act and the rules of the SEC, and Nasdaq, have imposed various requirements on public companies. Our management and other personnel will need to devote a substantial amount of time to these compliance initiatives as well as investor relations. Moreover, these rules and regulations will increase our legal and financial compliance costs and will make some activities more time-consuming and costly.
Furthermore, if we are not able to comply with the requirements of Section 404 of the Sarbanes-Oxley Act in a timely manner, the market price of our common stock could decline and we could be subject to potential delisting by Nasdaq and review by such exchange, the SEC, or other regulatory authorities, which would require the expenditure by us of additional financial and management resources. As a result, our stockholders could lose confidence in our financial reporting, which would harm our business and the market price of our common stock.
Some of our officers and directors currently or may in the future act as members, managers, officers, directors or employees of entities with conflicting business strategies.
Some of our officers and directors currently or may in the future act as members, managers, officers, directors or employees of entities with business strategies that may conflict with our business strategies. Michael Barnes, our Executive Chairman, is a founding partner and Co-Chief Investment Officer of Tricadia Holdings, L.P., an asset management holding company which we refer to as “Tricadia”, and Executive Chairman and a member of the board of directors of TFP. Tricadia’s subsidiaries include, and Mr. Barnes is co-chief investment officer of, companies that manage hedge funds and structured vehicles with business strategies that may compete with ours. Furthermore, Geoffrey Kauffman, our President, Chief Executive Officer and Vice Chairman, is the Chief Executive Officer of TFP and is a limited partner of Tricadia. Julia Wyatt, our Chief Financial Officer is the Chief Financial Officer of Tricadia and TFP and is also a limited partner of Tricadia. Such positions may give rise to actual or potential conflicts of interest, which may not be resolved in a manner that is in the best interests of the Company or the best interests of its stockholders.
Our duties as managing member of Operating Company may come into conflict with the duties that our directors and officers have to the Company and its stockholders.
We and TFP are the sole members of Operating Company, and we are the managing member of Operating Company. Our directors and officers have duties to us and our stockholders under applicable Maryland law in connection with our management. At the same time, we, as managing member of Operating Company, have fiduciary duties and obligations to Operating Company and its members (including TFP) under Delaware law and the Amended and Restated Limited Liability Company Agreement of Operating Company. Our duties as managing member of Operating Company may come into conflict with the duties that our directors and officers have to us and our stockholders. These conflicts may be resolved in a manner that is not in the best interests of the Company or the best interests of its stockholders.
We operate in highly competitive markets for business opportunities and personnel, which could impede our growth and negatively impact our results of operations.
14
We operate in highly competitive markets for business opportunities in each of our operating segments. Many of our competitors have financial, personnel and other resources that are greater than ours and may be better able to react to market conditions. These factors may place us at a competitive disadvantage in successfully competing for future business opportunities and personnel, which could impede our growth and negatively impact our business, financial condition and results of operations.
Maintenance of our 1940 Act exemption will impose limits on our operations.
We intend to continue to conduct our operations so that we are not required to register as an investment company under the 1940 Act. Therefore, we must limit the types and nature of businesses in which we may engage and assets that we may acquire.
Section 3(a)(1)(C) of the 1940 Act defines an investment company as any issuer that is engaged or proposes to engage in the business of investing, reinvesting, owning, holding or trading in securities, and owns or proposes to acquire “investment securities” having a value exceeding 40% of the value of the issuer’s total assets (exclusive of U.S. government securities and cash items) on an unconsolidated basis. Assets that would generally be excluded from the term “investment securities,” include securities issued by majority-owned subsidiaries that are not themselves investment companies and are not relying on certain exceptions from the definition of investment company set forth in the 1940 Act. Assets that generally would constitute “investment securities” include loans, debt securities, preference shares and subordinated notes issued by CLOs.
We monitor our compliance with the 1940 Act on an ongoing basis and may be compelled to take or refrain from taking actions, to acquire additional income or loss generating assets or to forego opportunities that might otherwise be beneficial or advisable, including, but not limited to selling assets that are considered to be investment securities or forgoing the sale of assets that are not investment securities, in order to ensure that we (or a subsidiary) may continue to rely on the applicable exceptions or exemptions. These limitations on our freedom of action could have a material adverse effect on our financial condition and results of operations.
If we fail to maintain an exemption, exception or other exclusion from registration as an investment company, we could, among other things, be required to substantially change the manner in which we conduct our operations either to avoid being required to register as an investment company or to register as an investment company. If we were required to register as an investment company under the 1940 Act, we would become subject to substantial regulation with respect to, among other things, our capital structure (including our ability to use leverage), management, operations, transactions with affiliated persons (as defined in the 1940 Act), portfolio composition, including restrictions with respect to diversification and industry concentration, and our financial condition and results of operations may be adversely affected. If we did not register despite being required to do so, criminal and civil actions could be brought against us, our contracts would be unenforceable unless a court was to require enforcement, and a court could appoint a receiver to take control of us and liquidate our business
Termination of the Transition Services Agreement or the Administrative Services Agreement could materially increase our costs, which could adversely affect our financial condition and results of operations.
Pursuant to the Transition Services Agreement, we pay fees to Tricadia for the services of Michael G. Barnes, our Executive Chairman, Julia Wyatt, our Chief Financial Officer, and for certain back office, administrative, information technology, insurance, legal and accounting services. A portion of the services that Tricadia provides to us are in turn provided to Tricadia by Mariner pursuant to a services agreement that may be terminated by Tricadia or Mariner without our consent. In addition, pursuant to an Administrative Services Agreement, a subsidiary of Mariner provides certain back office services to us directly for a fee. If the Transition Services Agreement is terminated, Tricadia’s services agreement with Mariner is terminated or the Administrative Services Agreement is terminated, we would be required to make alternative arrangements for the performance of these services. We may not be able to obtain these services promptly or at reasonable rates or at all, and our costs of obtaining such services could materially increase, which could adversely affect our results of operations.
Some provisions of our charter may delay, deter or prevent takeovers and business combinations that stockholders consider in their best interests.
Our charter restricts any person that owns 9.8% or more of our capital stock, other than TFP and its affiliates or another stockholder approved by applicable state insurance regulators, from voting in excess of 9.8% of our voting securities. This provision is intended to satisfy the requirements of applicable state regulators in connection with insurance laws and regulations that prohibit any person from acquiring control of a regulated insurance company without the prior approval of the insurance regulators. In addition, our charter provides for the classification of our board of directors into three classes, one of which is to be elected each year. These provisions may delay, deter or prevent takeovers and business combinations that stockholders consider in their best interests.
15
Maryland takeover statutes may prevent a change of our control, which could depress our stock price.
Maryland law provides that “control shares” of a corporation acquired in a “control share acquisition” will have no voting rights except to the extent approved by a vote of two-thirds of the votes entitled to be cast on the matter under the Maryland Control Share Acquisition Act. “Control shares” means voting shares of stock that, if aggregated with all other shares of stock owned by the acquiror or in respect of which the acquiror is able to exercise or direct the exercise of voting power (except solely by virtue of a revocable proxy), would entitle the acquiror to exercise voting power in electing directors within one of the following ranges of voting power: one-tenth or more but less than one-third; one-third or more but less than a majority; or a majority or more of all voting power. A “control share acquisition” means the acquisition of issued and outstanding control shares, subject to certain exceptions.
Under Maryland law, “business combinations” between a Maryland corporation and an interested stockholder or an affiliate of an interested stockholder are prohibited for five years after the most recent date on which such stockholder became an interested stockholder. These business combinations include a merger, consolidation, share exchange or, in circumstances specified in the statute, an asset transfer or issuance or reclassification of equity securities.
Our bylaws contain a provision exempting from the control share statute any and all acquisitions by any person of our shares of stock. Our board of directors has also adopted a resolution which provides that any business combination between us and any other person is exempted from the provisions of the business combination statute, provided that the business combination is first approved by the board of directors. However, our board of directors may amend or eliminate this provision in our bylaws regarding the control share statute or amend or repeal this resolution regarding the business combination statute. If our board takes such action in the future, the control share and business combination statutes may prevent or discourage others from trying to acquire control of us and increase the difficulty of consummating any offer, including potential acquisitions that might involve a premium price for our common stock or otherwise be in the best interest of our stockholders.
Under our charter, as long as TFP owns more than 50% of our then-outstanding voting stock, it will be able to take action by written consent, without prior notice to and without a vote of other stockholders.
Until the date on which TFP, its affiliates and any person who is an express assignee or designee of TFP cease to own, in the aggregate, more than 50% of our then-outstanding voting stock, TFP may take any action required or permitted to be taken at any annual or special meeting of stockholders by written consent, without prior notice, and without a vote, if a consent or consents in writing setting forth the action so taken are signed by holders of the minimum number of votes necessary to authorize or take such action at a meeting at which all outstanding shares of common stock entitled to vote on the action were present and voted. As of the December 31, 2013, TFP and its affiliates owned common stock representing approxim
ately 79.6% of the
combined voting power of our stock.
None.
Administrative Offices
Our principal executive offices are located at 780 Third Avenue, 21st Floor, New York, New York 10017. The table below outlines the Company’s leased properties as of December 31, 2013, all of which are used as administrative offices. All facilities are considered adequate and suitable for the Company’s current level of operations. We do not own any properties for administrative purposes.
16
|
|
||
|
Leased Properties
|
||
|
Location
|
Square Footage
|
Purpose or Segment Used In
|
|
New York, NY
|
3,064
|
Corporate Offices
|
|
Philadelphia, PA
|
17,269
|
Insurance
|
|
Florham Park, NJ
|
31,075
|
Insurance Services
|
|
Stamford, CT
|
2,140
|
Specialty Finance
|
|
New York, NY
|
2,750
|
Asset Management
|
|
New York, NY
|
1,532
|
Real Estate
|
On January 31, 2014, the Company completed a transaction resulting in our 67.5% ownership interest in Luxury Mortgage Corp., which operates out of leased office space of 22,450 square feet located in Stamford, CT.
Investment Properties
The Company’s real estate segment also owns the properties below.
|
Portfolio
|
Location
|
Square Feet
|
Senior Apartment Units
|
Independent Living Units
|
Assisted Living Units
|
Total Units
|
|
Calamar
|
Wheatfield, NY
|
96,819
|
110
|
—
|
—
|
110
|
|
Calamar
|
Wheatfield, NY
|
115,260
|
92
|
—
|
—
|
92
|
|
Terraces
|
Baldwinsville, NY
|
34,535
|
—
|
—
|
51*
|
51
|
|
Terraces
|
Geneva, NY
|
38,334
|
—
|
—
|
48*
|
48
|
|
Heritage
|
Weatherly, PA
|
48,829
|
—
|
—
|
69*
|
69
|
|
Heritage
|
Sewell, NJ
|
168,000
|
—
|
104
|
98
|
202
|
|
Greenfield
|
Fredericksburg, VA
|
16,322
|
—
|
—
|
27
|
27
|
|
Greenfield
|
Stafford, VA
|
29,436
|
—
|
—
|
44*
|
44
|
|
Greenfield
|
Berryville, VA
|
28,708
|
—
|
—
|
48*
|
48
|
*Certain units are permitted to be used as memory care/Alzheimer’s units.
Tiptree and its subsidiaries are parties to legal proceedings in the ordinary course of business. Although Tiptree’s legal and financial liability with respect to such proceedings cannot be estimated with certainty, Tiptree does not believe that these proceedings, either individually or in the aggregate, are likely to have a material adverse effect on Tiptree’s financial position or results of operations.
Not applicable.
17
Market Information
Our Class A common stock has traded on the NASDAQ Capital Market under the ticker symbol “TIPT” since August 9, 2013. Prior to that, our common stock was quoted on the OTCQX market under the ticker symbol “CVTR” since January 31, 2011.
Holders
As of March 17, 2014, there were 114 Class A common stockholders of record.
Dividends and Distribution Policy
The following table sets forth the high and low sales prices per share of our Class A common stock and the distributions declared and paid per share on our Class A common stock for the periods indicated.
|
2013
|
High Price
|
Low Price
|
Dividends
|
||||||
|
First Quarter
|
$
|
7.60
|
|
$
|
5.80
|
|
$
|
0.135
|
|
|
Second Quarter
|
$
|
7.25
|
|
$
|
5.90
|
|
$
|
0.020
|
|
|
Third Quarter
|
$
|
10.00
|
|
$
|
5.00
|
|
$
|
0.020
|
|
|
Fourth Quarter
|
$
|
8.00
|
|
$
|
6.71
|
|
$
|
—
|
|
|
2012
|
High Price
|
Low Price
|
Dividends
|
||||||
|
First Quarter
|
$
|
7.10
|
|
$
|
6.08
|
|
$
|
—
|
|
|
Second Quarter
|
$
|
7.50
|
|
$
|
6.60
|
|
$
|
0.270
|
|
|
Third Quarter
|
$
|
7.49
|
|
$
|
5.38
|
|
$
|
0.135
|
|
|
Fourth Quarter
|
$
|
7.50
|
|
$
|
6.60
|
|
$
|
0.135
|
|
The following table sets forth certain selected historical financial information for the periods and as of the dates presented and should be read in conjunction with the Company’s accompanying consolidated financial statements and the related notes thereto referenced in Item 8 of this report and with “Management’s Discussion and Analysis of Financial Condition and Results of Operations” included in Item 7 of this report. All amounts are in thousands, except for per share amounts.
|
Year ended December 31,
|
||||||||
|
2013
|
2012
|
|||||||
|
Selected Income Statement Data:
|
||||||||
|
Revenues:
|
||||||||
|
Net realized and unrealized gains on investments
|
$
|
5,388
|
|
$
|
12,814
|
|
||
|
Investment income
|
95,519
|
|
57,395
|
|
||||
|
Total revenue
|
$
|
100,907
|
|
$
|
70,209
|
|
||
|
Expenses:
|
||||||||
|
Other expenses
|
99,077
|
|
67,288
|
|
||||
|
Total expense
|
$
|
99,077
|
|
$
|
67,288
|
|
||
|
Income before taxes from Continuing Operations and results of Consolidated CLOs
|
$
|
1,830
|
|
$
|
2,921
|
|
||
|
Results of consolidated CLOs:
|
||||||||
18
|
Income attributable to consolidated CLOs
|
$
|
52,687
|
|
$
|
71,412
|
|
||
|
Expenses attributable to consolidated CLOs
|
48,268
|
|
37,883
|
|
||||
|
Net income attributable to consolidated CLOs
|
$
|
4,419
|
|
$
|
33,529
|
|
||
|
Income before taxes from continuing operations
|
$
|
6,249
|
|
$
|
36,450
|
|
||
|
Less: provision for income taxes
|
6,941
|
|
|
(321
|
)
|
|||
|
Discontinued operations, net
|
17,110
|
|
2,882
|
|
||||
|
Net Income
|
$
|
16,418
|
|
$
|
39,653
|
|
||
|
Less: net income attributable to non-controlling interest & VIE subordinated noteholders
|
7,573
|
|
30,924
|
|
||||
|
Net income available to Class A common stockholders
|
$
|
8,845
|
|
$
|
8,729
|
|
||
|
Per Share Data:
|
||||||||
|
Net income per Class A common share:
|
||||||||
|
Basic
|
$
|
0.86
|
|
|
$
|
0.85
|
|
|
|
Diluted
|
$
|
0.86
|
|
|
$
|
0.85
|
|
|
|
Weighted average Class A common shares outstanding:
|
||||||||
|
Basic
|
10,250,438
|
|
10,286,412
|
|
||||
|
Diluted
|
10,250,438
|
|
10,286,412
|
|
||||
|
Selected Financial Data (1):
|
||||||||
|
Operating Company:
|
||||||||
|
GAAP net assets of Operating Company
|
$
|
454,935
|
|
$
|
419,909
|
|
||
|
Economic net assets of Operating Company (before dilutive adjustments)
|
432,635
|
|
390,105
|
|
||||
|
Economic Net Income of Operating Company
|
34,744
|
|
36,325
|
|
||||
|
Units outstanding of Operating Company
|
41,525,267
|
|
41,048,789
|
|
||||
|
Economic Operating Company book value per share
|
$
|
10.42
|
|
$
|
9.50
|
|
||
|
Tiptree Financial Inc.:
|
||||||||
|
Economic Net Income of Tiptree
|
$
|
9,029
|
|
$
|
9,049
|
|
||
|
Economic Tiptree Class A book value per share
|
$
|
10.42
|
|
$
|
9.50
|
|
||
(1) Financial data presented within this selected financial data section for Tiptree and Operating Company include non-GAAP measures which Tiptree uses to evaluate the performance of its core business. For further discussion and a comparison and reconciliation of these measures to corresponding GAAP measures, see Item 7 of this report.
Overview
Tiptree is a diversified holding company engaged through its consolidated subsidiaries in a number of businesses and is an active acquirer of new businesses. Tiptree, whose operations date back to 2007, currently has subsidiaries that operate in four industry segments:
|
•
|
insurance and insurance services,
|
|
•
|
specialty finance,
|
19
|
•
|
asset management, and
|
|
•
|
real estate.
|
Our insurance operations are conducted through PFG, of which we own 93.58%, with the remainder owned by management and employees of PFG. PFG develops and administers private placement insurance and annuities for high net worth and institutional clients. As of December 31, 2013, PFAS, a subsidiary of PFG, administered $35 billion of company-owned and bank-owned life insurance and the total separate account assets for policies written by PFG was $4.6 billion.
Our specialty finance operations include MFCA, a wholly-owned business which provides financing for tax-exempt organizations, a 62% ownership interest in Siena, a recently formed asset-based lender that offers asset-based loans to small and mid-sized U.S. businesses, and a debt interest and a 67.5% ownership interest in Luxury, a residential mortgage lender that originates conforming prime jumbo and super jumbo mortgages for sale to institutional investors. As of December 31, 2013, MFCA's investments had an aggregate principal balance of $37.1 million and a fair value of $31.0 million. As of December 31, 2013, Siena has funded 11 loans with an aggregate principal balance of $16.5 million of aggregate principal amount outstanding.
Our asset management operations include TAMCO, an SEC-registered investment adviser that, among other managerial and advisory entities, wholly-owns Telos Asset Management LLC (“Telos”), an asset manager focused on investing in corporate credit through managed accounts and structured investment vehicles, such as CLOs. As of December 31, 2013, Telos had approximately $1.5 billion of AUM. Our asset management operations also include MCM which manages NPPF I, a structured tax-exempt pass-through entity that holds tax-exempt bonds for the benefit of its investors. Interests in NPPF I in the form of tranched trust certificates are held solely by third parties unaffiliated with Tiptree. As of December 31, 2013, the underlying tax-exempt bonds held by NPPF I had an aggregate principal balance of $213.0 million.
Our real estate operations include Care LLC, a wholly-owned real estate investment company that invests in senior housing properties, and interests in the Star Asia Entities, which are all Tokyo based real estate holding companies formed to invest predominately in Asian properties and real estate related debt instruments. As of December 31, 2013, Care LLC had total assets of $160.7 million.
Tiptree intends to continue to invest in its existing businesses and to opportunistically acquire majority control of new businesses, both in existing financial service sectors and complementary sectors; make seed investments in funds or products managed by TAMCO; and make minority debt or equity investments similar to those investments that Tiptree has made in the past. Accordingly, changes in the mix of Tiptree’s businesses, assets and investments should be expected. Management intends to take a disciplined approach by focusing on investing for the long-term in stable, cash flow positive businesses.
For additional information about our operating segments, see Note 4 to the financial statements.
Recent Developments
The year ended December 31, 2013 was a transformative period for Tiptree. The following highlights certain developments during this period, which are described in more detail elsewhere in this report.
|
•
|
Contribution Transactions.
We completed a transaction we refer to as the Contribution Transactions, creating Tiptree's current capital and ownership structure on July 1, 2013. TFP and Care Inc. each contributed substantially all of their assets to Operating Company in exchange for ownership in Operating Company. We operate our business through Operating Company, which directly or indirectly owns all of our assets. Operating Company is owned 25% by Tiptree and 75% by TFP. Beginning on July 1, 2014, partnership units of TFP are redeemable for Class A common stock of Tiptree. See Notes 1 and 15 to the financial statements for further details.
|
|
•
|
Acquisitions and dispositions.
|
|
◦
|
Care Inc. sold its membership interests in an entity that owned fourteen senior living facilities, which we refer to as the Bickford Portfolio, on June 28, 2013 for cash of $44 million and a net gain of approximately $15.5 million.
|
|
◦
|
We purchased an aggregate of approximately 66.7% of the voting equity interests of Siena for an aggregate of $10 million in two stages on April 2013 and July 2013. A scheduled capital contribution by another investor in Siena diluted our interest in Siena to approximately 62% in October 2013.
|
|
◦
|
We made a $5 million term loan to Luxury in April 2013 and in January 2014 completed a strategic transaction resulting in Tiptree owning 67.5% of the equity of Luxury.
|
20
|
•
|
Asset Management Activity.
Telos 3 and Telos 4 became effective on June 5, 2013 and September 23, 2013, respectively. In anticipation of issuing CLO notes for another CLO, Telos entered into a $100 million warehouse credit agreement on August 6, 2013, which was increased to $140 million on September 25, 2013.
|
|
•
|
Debt Financing.
Operating Company borrowed $50 million under a credit agreement entered into with Fortress Credit Corp. (“Fortress”) on September 18, 2013. The Credit Agreement includes an option for Operating Company to borrow up to an additional $125 million, subject to satisfaction of certain customary conditions.
|
|
•
|
Equity Activity.
Our Class A common stock began trading on the Nasdaq Capital Market under the symbol “TIPT” on August 9, 2013. A registration statement facilitating public resales of approximately 7.2 million shares of our Class A common stock owned by TFP prior to the Contribution Transactions became effective on October 18, 2013.
|
Trends in Our Business and Outlook
Our results of operations are affected by a variety of factors, including general economic conditions and the resulting trends and market conditions specific to our businesses, some of which are discussed below.
A significant portion of Tiptree’s 2013 revenues were generated from administrative fees from our servicing of COLI/BOLI policies. We expect the amount of administrative fees to remain relatively constant in 2014 unless significant policy holders terminate policies, in which case our revenues could decline.
After several quiet years in the CLO market, there was increased issuance of CLOs in 2013, which led to new entrants and greater supply. We issued two new CLOs in 2013 and initiated a warehouse facility for a third CLO. More recently, uncertainties regarding regulatory guidance in the banking sector resulted in some institutional investors curtailing purchases of CLO liabilities. This has had a negative effect on CLO issuances. Credit spreads on AAA tranches have widened and, if not offset by contracting spreads on other liability tranches, could lead to lower returns on the subordinated notes on new CLOs. It is uncertain whether we will continue to sponsor the same volume of CLOs as in 2013.
The decrease in realized and unrealized gains we experienced from 2012 to 2013 was primarily driven by the assets of our tax-exempt business. These assets, which consist primarily of fixed coupon instruments with long durations, are highly sensitive to changes in interest rates. The large decline in interest rates throughout 2012 significantly increased the value and unrealized gains of the tax-exempt assets. Because interest rates remained relatively flat in 2013, the tax-exempt portfolio value remained flat.
Our expenses increased significantly in 2013 primarily from additional payroll expense associated with our acquisition of the administrative services business in our insurance and insurance services segment. We expect to incur additional expenses to relocate the administrative servicing business from New Jersey to Pennsylvania in 2014, although we expect that relocation to improve the profitability of our insurance servicing operations over time. Our operating expenses also increased in 2013 as a result of operating as a newly public company.
As a result of the $50 million borrowed under the credit agreement with Fortress and the $44 million of proceeds from the sale of the Bickford Portfolio in our real estate segment during 2013, we maintained a relatively larger cash balance. In 2014, we intend to deploy a significant amount of our cash balance to purchase assets, sponsor CLOs, support our existing business and invest in new products. To the extent we are unable to deploy cash effectively, we could experience lower returns than we would expect from the deployment of cash into higher returning assets.
As a result of the Contribution Transactions, the assets of Operating Company are held by an entity taxable as a C corporation, rather than flow through entities for tax purposes, resulting in a one-time increase in our provision for income taxes in 2013.
Our asset based lending business was acquired in 2013 and continues to ramp up its operations. This start-up business was a negative contributor to net income in 2013 and we intend to reverse this trend as the company achieves profitable scale in 2014 although we cannot assure you that will be the case.
The mortgage market in which we operate is sensitive to interest rates and expected changes in interest rates. For example, in the late summer and fall of 2013, the volume of mortgages dropped sharply because of changes and expected changes in interest rates. In addition, it is unclear what impact the Consumer Finance Protection Bureau's new mortgage rules on qualified mortgages may have on volume and profitability in 2014.
Tiptree Selected Consolidated Financial Data
21
The results presented in the table below are the consolidated results of Tiptree, which include its majority-owned subsidiaries, PFG, Care, MFCA, Siena, and TAMCO, as well as principal investments. Due to acquisitions and dispositions during the periods discussed below, it may be difficult to compare Tiptree’s results of operations from period to period as a result of purchase accounting adjustments, which only reflect the financial results of an acquisition from that point forward.
The Contribution Transactions were accounted for as a combination of entities under common control. As a result, the comparative financial information has been retrospectively adjusted to furnish comparative combined financial information from August 2010 (the date of common control). The application of this “as-if-pooling of interests” required the previously issued consolidated financial statements of Tiptree to be recast to reflect such activity.
The acquisition of TAMCO was accounted for as a combination of entities under common control and, as a result, the consolidated results of operations for all periods presented have been retrospectively adjusted to furnish comparative combined financial information as if TAMCO was part of the consolidated group as of January 1, 2010. The application of this “as-if-pooling of interests” required the previously issued consolidated financial statements of Tiptree to be recast to reflect such activity.
GAAP requires the consolidation of a VIE into the financial statements of the entity that is considered the VIE’s primary beneficiary. Generally, TAMCO’s contractual relationship as collateral manager of the CLOS satisfies the criteria for TAMCO to be deemed the primary beneficiary of the CLOs that it manages. As a result, Tiptree is required to consolidate the CLOs into its financial statements
.
As of December 31, 2013 the fair value of Tiptree’s direct investments in the subordinated notes of the CLOs is $61.1 million.
Income and expenses attributable to consolidated CLOs reflect all of the components of CLOs: the interest income, interest expense, other related expenses, and most significantly, the mark-to-market of the underlying collateral assets. The unrealized gains and losses of the collateral assets are most affected by credit risk on the individual loans held by the CLOs. If, as a result of movement in the credit market, new loans are made at credit spreads wider than those held by the CLOs, the market value of loans held by the CLOs would decrease and could result in realized and unrealized losses. Since, under GAAP, we do not value the debt issued by the CLOs at market value, we would not recognize an offsetting decrease in the liabilities from such a change in credit spreads, which could make the reported realized and unrealized gains and losses appear larger or smaller than the economic impact on our results of operations. For economic purposes, we reverse the impact of the CLO consolidation and focus on the mark-to-market value of our underlying subordinated note positions. See “— Economic Net Income and Economic Book Value.”
22
|
Year ended December 31,
|
2013 vs 2012
|
|||||||||||||
|
2013
|
2012
|
$ Variance
|
% Variance
|
|||||||||||
|
Revenues:
|
||||||||||||||
|
Net realized and unrealized gains
|
$
|
5,388
|
|
$
|
12,814
|
|
$
|
(7,426
|
)
|
(58.0
|
)%
|
|||
|
Interest income
|
16,477
|
|
9,938
|
|
6,539
|
|
65.8
|
|
||||||
|
Separate account fees
|
22,248
|
|
19,875
|
|
2,373
|
|
11.9
|
|
||||||
|
Administrative service fees
|
49,489
|
|
22,995
|
|
26,494
|
|
115.2
|
|
||||||
|
Rental revenue
|
5,760
|
|
1,717
|
|
4,043
|
|
235.5
|
|
||||||
|
Other income
|
1,545
|
|
2,870
|
|
(1,325
|
)
|
(46.2
|
)
|
||||||
|
Total revenue
|
$
|
100,907
|
|
$
|
70,209
|
|
$
|
30,698
|
|
43.7
|
%
|
|||
|
Expenses:
|
||||||||||||||
|
Interest expense
|
$
|
17,517
|
|
$
|
8,096
|
|
$
|
9,421
|
|
116.4
|
%
|
|||
|
Payroll expense
|
35,552
|
|
21,437
|
|
14,115
|
|
65.8
|
|
||||||
|
Professional fees
|
8,555
|
|
11,873
|
|
(3,318
|
)
|
(27.9
|
)
|
||||||
|
Change in future policy benefits
|
4,710
|
|
4,040
|
|
670
|
|
16.6
|
|
||||||
|
Mortality expenses
|
10,476
|
|
9,924
|
|
552
|
|
5.6
|
|
||||||
|
Commission expense
|
2,344
|
|
1,960
|
|
384
|
|
19.6
|
|
||||||
|
Depreciation and amortization expense
|
4,467
|
|
2,238
|
|
2,229
|
|
99.6
|
|
||||||
|
Other expenses
|
15,456
|
|
7,720
|
|
7,736
|
|
100.2
|
|
||||||
|
Total expenses
|
$
|
99,077
|
|
$
|
67,288
|
|
$
|
31,789
|
|
47.2
|
%
|
|||
|
Net income before taxes and income attributable to consolidated CLOs from continuing operations
|
$
|
1,830
|
|
$
|
2,921
|
|
$
|
(1,091
|
)
|
(37.4
|
)%
|
|||
|
Results of consolidated CLOs:
|
||||||||||||||
|
Income attributable to consolidated CLOs
|
$
|
52,687
|
|
$
|
71,412
|
|
$
|
(18,725
|
)
|
(26.2
|
)%
|
|||
|
Expenses attributable to the consolidated CLOs
|
48,268
|
|
37,883
|
|
10,385
|
|
27.4
|
|
||||||
|
Net income attributable to consolidated CLOs
|
$
|
4,419
|
|
$
|
33,529
|
|
$
|
(29,110
|
)
|
(86.8
|
)
|
|||
|
Income before taxes from continuing operations
|
$
|
6,249
|
|
$
|
36,450
|
|
$
|
(30,201
|
)
|
(82.9
|
)
|
|||
|
Less provision for income taxes
|
6,941
|
|
(321
|
)
|
7,262
|
|
NM
|
|
||||||
|
(Loss) income from continuing operations
|
$
|
(692
|
)
|
$
|
36,771
|
|
$
|
(37,463
|
)
|
(101.9
|
)%
|
|||
|
Discontinued operations:
|
|
|
||||||||||||
|
Gain on sale of Bickford portfolio, net
|
$
|
15,463
|
|
$
|
—
|
|
$
|
15,463
|
|
100.0
|
|
|||
|
Income from discontinued operations, net
|
1,647
|
|
2,882
|
|
(1,235
|
)
|
(42.9
|
)
|
||||||
|
Discontinued operations, net
|
$
|
17,110
|
|
$
|
2,882
|
|
$
|
14,228
|
|
493.7
|
|
|||
|
Net income
|
$
|
16,418
|
|
$
|
39,653
|
|
$
|
(23,235
|
)
|
(58.6
|
)%
|
|||
|
Less net income attributable to noncontrolling interest
|
25,617
|
|
26,883
|
|
(1,266
|
)
|
(4.7
|
)%
|
||||||
|
Less net (loss) income attributable to VIE subordinated noteholders
|
(18,044
|
)
|
4,041
|
|
(22,085
|
)
|
NM
|
|
||||||
|
Net income available to Class A common stockholders
|
$
|
8,845
|
|
$
|
8,729
|
|
$
|
116
|
|
1.3
|
%
|
|||
NM indicates the metric is not meaningful.
23
Statements of Operations Information - Year Ended December 31, 2013 compared to 2012
Total revenue
Total revenue for the year ended December 31, 2013 was $100.9 million, compared to $70.2 million for 2012, an increase of $30.7 million, or 43.7%. This increase was primarily due to an increase in administrative service fees of $26.5 million, interest income of $6.5 million, and rental revenue of $4.0 million, partially offset by a decrease in realized and unrealized gains of $7.4 million.
Net realized and unrealized gains and losses
Realized and unrealized gains decreased by $7.4 million, or 58%, for the year ended December 31, 2013 over 2012 levels. The decrease from 2012 to 2013 was primarily driven by the assets of our tax-exempt business. These assets, which consist primarily of fixed coupon instruments with long durations, are highly sensitive to changes in interest rates. The large decline in interest rates throughout 2012 resulted in $10.1 million of unrealized gains in 2012, whereas interest rates remained relatively flat in 2013 therefore the tax-exempt portfolio value remained relatively flat with $0.8 million of losses in 2013. The lower realized and unrealized gains in 2013 were partially offset by a $3.9 million change in unrealized gain related to interest rate swaps and increased value in loans in the Telos 5 warehouse credit facility and a $0.9 million net increase in the investment in the Star Asia portfolio due to improvement in the Japanese commercial real estate market in 2013.
Interest income
Interest income on loan and security portfolios increased $6.5 million, or 65.8%, for the year ended December 31, 2013 compared to the prior year, primarily due to $5.2 million of interest income from loans held by warehouse credit agreements in 2013 in connection with the formation of Telos 3, Telos 4 and Telos 5 and additional interest income of $1.5 million primarily from real estate operations in 2013.
Separate account fees
Separate account fees increased $2.4 million, or 11.9%, for the year ended December 31, 2013 compared to the prior year. This increase is the result of better performance of, and an increases in, separate account assets under administration within PFG’s life insurance portfolio.
Administrative service fees
Administrative service fees increased $26.5 million, or 115.2%, for the year ended December 31, 2013 compared to the prior year. This was primarily due to a full year of administrative service fees from the acquisition of administrative services rights from The Hartford Financial Services Group, Inc. (“The Hartford”) by PFG in July 2012 (the “PFAS Transaction”).
Rental revenue
Rental revenues for 2013 from Care LLC were $5.8 million, an increase over the comparable period in 2012, due to Care LLC’s acquisition of additional properties, including Calamar, Heritage and the Premier properties in 2013.
Total expenses
Total expenses for 2013 were $99.1 million compared to $67.3 million for 2012, an increase of $31.8 million, or 47.2%. The primary drivers of this increase were $9.4 million of increased interest expense, a $14.1 million increase in payroll expenses, a $2.2 million increase in depreciation and amortization expense, and a $7.7 million increase in other expenses.
Interest expense
The $9.4 million increase in interest expense is a result of increased interest expense related to the CLO warehouse credit agreements and interest expense associated with the Company’s credit facility which closed in September 2013.
Payroll expense
The $14.1 million increase in payroll expense consists of a $5.9 million increase associated with additional employees as a result of the PFAS Transaction in July 2012. The remaining $8.2 million largely is a result of a full year of payroll expense incurred in 2013 at TAMCO, compared to 2012, as TAMCO was acquired June 30, 2012.
24
Depreciation and amortization expense
The $2.2 million increase in depreciation and amortization expense relates to an increase in amortization expense due to the PFAS Transaction in July 2012 and the Care properties acquired in 2013.
Other expenses
The $7.7 million increase in other expenses primarily consists of $3.7 million related to the PFAS Transaction and $1.7 million related to Care property acquisitions.
Income attributable to consolidated CLOs
Income attributable to consolidated CLOs was $52.7 million in 2013 compared to $71.4 million in 2012, a decrease of $18.7 million, or 26.2%. This decrease resulted from an increase in net realized and unrealized losses in the CLOs of $33 million compared to realized and unrealized gains of $12.8 million in 2012, partially offset by an increase of $15.9 million in additional interest income attributable to the addition of Telos 3 and Telos 4 in 2013.
Expenses attributable to the consolidated CLOs
The $10.4 million increase in expenses attributable to the consolidated CLOs consists of interest payments made by Telos 3 and Telos 4 in 2013.
Provision for income taxes
The provision for income taxes increased $7.3 million in 2013 from an income tax benefit of $0.3 million in the prior year to an income tax expense of $6.9 million in the current year. The effective tax rate on income available to common stockholders for the year ended December 31, 2013 was approximately 15.1%. Prior periods do not have comparable effective tax rates as the Company, as a REIT, was not subject to income taxes.
Discontinued operations, net
Discontinued operations, net increased $14.2 million, or 493.7%, for the year ended December 31, 2013 compared to the prior year. This is comprised of the gain on sale of the Bickford portfolio, net of $15.5 million recognized in 2013 along with a decline of $1.2 million, or 42.9%, of income related to Bickford in 2013. For more detail on the Bickford sale see Note 22—Dispositions, Assets Held for Sale and Discontinued Operations within the accompanying consolidated financial statements.
Net income attributable to noncontrolling interest
Net income attributable to noncontrolling interest represents the portion of net income generated by consolidated entities that are not attributable to Tiptree’s ownership interest in those entities. Net income attributable to the noncontrolling interest was relatively flat in 2013 compared to 2012.
Net (loss) income attributable to VIE subordinated noteholders
Because Tiptree consolidates the VIEs, all of the net income and expense of the VIEs is included in its consolidated results, even though Tiptree only benefits from the net income and suffers the net loss of the portion of the VIEs owned by it. Net (loss) income attributable to the VIE subordinated noteholders represents net (loss) income not attributable to Tiptree’s ownership interest in the VIEs. Therefore higher net losses attributable to VIE subordinated noteholders increases net income available to Tiptree Class A stockholders. Conversely, higher income attributable to VIE subordinated noteholders decreases net income available to Tiptree Class A stockholders. The net loss attributable to the VIE subordinated noteholders for 2013 was $18.0 million, compared to net income of $4.0 million for 2012, a decrease of $22.1 million. This decrease was primarily due to losses of $20.8 million in the performance of Telos 1 in which Tiptree has a small ownership, partially offset by gains in the performance of Telos 3 and Telos 4 of $3.1 million.
Net income available to Class A common stockholders
Net income available to Class A common stockholders for 2013 was $8.8 million compared to $8.7 million for 2012, a increase of $0.1 million, or 1.3%. This increase was primarily due to the $29.1 million decrease representing the net impact of the consolidated CLOs on our net income available to Class A common stockholders offset in part by increases in revenue from administrative service fees of $26.5 million and the gain on the sale of the Bickford portfolio of $15.5 million.
25
Balance Sheet Information - Year Ended December 31, 2013 compared to December 31, 2012
Tiptree’s total assets increased $1.3 billion, or 24.3%, at December 31, 2013 compared to year end December 31, 2012. This increase was driven primarily by an increase in separate account assets of $590.0 million from PFG as well as an increase of $563.0 million due to the increased assets of the consolidated CLOs related to the addition of Telos 3 and Telos 4 in 2013.
Total liabilities increased over the prior year end primarily due to an increase in separate account liabilities of $590.0 million and an increase in liabilities of consolidated CLOs of $555.3 million (consisting primarily of notes payable from Telos 3 and Telos 4). Total stockholders’ equity of Tiptree increased as of December 31, 2013 to $565.9 million, compared to $535.6 million at December 31, 2012, primarily due to an increase in retained earnings.
Segment Reporting
Tiptree has four reportable operating segments: insurance and insurance services, specialty finance, asset management and real estate (see Note 4 of the consolidated financial statements for a more detailed description of our segments). Tiptree’s operating segments are organized in a manner that reflects how management views its operations.
Intersegment revenues refers to those items of revenue which will be eliminated upon consolidation. Included in revenue, expense, interest revenue, interest expense, segment profit/(loss), and segment assets are items which are eliminated upon consolidation as well as adjustments for discontinued operations, reclassifications, assets of consolidated CLOs and non-controlling interest. These items are classified as “corporate eliminations and other” in the tables below.
The material components of “corporate eliminations and other” are as follows: (i) for total revenue, rental revenue from discontinued operations as well as Tiptree’s portion of interest income from the consolidated CLOs, (ii) for total expense, interest expense and depreciation/amortization expense associated with discontinued operations, and (iii) for total assets, the assets of the consolidated CLOs.
Each reportable segment’s measure of profit (loss) is reported before income taxes and includes discontinued operations and non-controlling interest as this is how management views its segments.
26
|
Year ended December 31, 2013
|
|||||||||||||||||||||||
|
Insurance and insurance services
|
Specialty finance
|
Asset management
|
Real estate
|
Corporate eliminations and other
|
Totals
|
||||||||||||||||||
|
Fee income
|
$
|
71,737
|
|
(1)
|
$
|
—
|
|
|
$
|
—
|
|
$
|
—
|
|
$
|
—
|
|
|
$
|
71,737
|
|
||
|
Rental revenue
|
—
|
|
|
—
|
|
|
—
|
|
|
11,680
|
|
(5,920
|
)
|
|
5,760
|
|
|||||||
|
Interest income
|
4,946
|
|
|
24,629
|
|
|
—
|
|
|
2,316
|
|
(15,414
|
)
|
|
16,477
|
|
|||||||
|
Other revenue
|
89
|
|
|
2,783
|
|
|
350
|
|
(2)
|
19,834
|
|
(16,123
|
)
|
|
6,933
|
|
|||||||
|
Intersegment revenues
|
—
|
|
|
81
|
|
|
16,215
|
|
(2)
|
—
|
|
(16,296
|
)
|
|
—
|
|
|||||||
|
Total revenue
|
$
|
76,772
|
|
|
$
|
27,493
|
|
|
$
|
16,565
|
|
|
$
|
33,830
|
|
$
|
(53,753
|
)
|
|
$
|
100,907
|
|
|
|
Interest expense
|
$
|
12,430
|
|
|
$
|
3,425
|
|
|
$
|
—
|
|
|
$
|
4,452
|
|
$
|
(2,790
|
)
|
|
$
|
17,517
|
|
|
|
Payroll expense
|
18,820
|
|
|
1,797
|
|
|
12,228
|
|
|
2,707
|
|
—
|
|
|
35,552
|
|
|||||||
|
Professional fee expense
|
1,858
|
|
|
3,463
|
|
|
1,277
|
|
|
1,957
|
|
—
|
|
|
8,555
|
|
|||||||
|
Other expense
|
29,663
|
|
|
2,641
|
|
|
1,119
|
|
|
9,373
|
|
(5,343
|
)
|
|
37,453
|
|
|||||||
|
Total expense
|
62,771
|
|
|
11,326
|
|
|
14,624
|
|
|
18,489
|
|
(8,133
|
)
|
|
99,077
|
|
|||||||
|
Segment profit/(loss)
|
$
|
14,001
|
|
|
$
|
16,167
|
|
|
$
|
1,941
|
|
|
$
|
15,341
|
|
$
|
(45,620
|
)
|
|
$
|
1,830
|
|
|
|
Net income attributable to consolidated CLOs
|
4,419
|
|
|||||||||||||||||||||
|
Less: non-controlling interest and net income attributable to the VIE subordinated noteholders
|
$
|
7,573
|
|
||||||||||||||||||||
|
Discontinued operations
|
17,110
|
|
|||||||||||||||||||||
|
Income taxes
|
6,941
|
|
|||||||||||||||||||||
|
Net income available to common stockholders
|
$
|
8,845
|
|
||||||||||||||||||||
|
Segment assets
|
$
|
4,949,262
|
|
|
$
|
385,987
|
|
|
$
|
7,896
|
|
|
$
|
170,683
|
|
$
|
1,366,620
|
|
|
$
|
6,880,448
|
|
|
(1) Includes separate account and administrative service fees
(2) Includes management fees
27
|
Year ended December 31, 2012
|
|||||||||||||||||||||||
|
Insurance
|
Specialty finance
|
Asset management
|
Real estate
|
Corporate eliminations and other
|
Totals
|
||||||||||||||||||
|
Fee income
|
$
|
42,870
|
|
(1)
|
$
|
—
|
|
|
$
|
—
|
|
$
|
—
|
|
$
|
—
|
|
|
$
|
42,870
|
|
||
|
Rental revenue
|
—
|
|
|
—
|
|
|
—
|
|
13,769
|
|
(12,052
|
)
|
|
1,717
|
|
||||||||
|
Interest income
|
4,498
|
|
|
20,846
|
|
|
—
|
|
802
|
|
(16,208
|
)
|
|
9,938
|
|
||||||||
|
Other revenue
|
542
|
|
|
9,945
|
|
|
1,184
|
|
(2)
|
3,860
|
|
153
|
|
|
15,684
|
|
|||||||
|
Intersegment revenues
|
—
|
|
|
181
|
|
|
16,243
|
|
(2)
|
—
|
|
(16,424
|
)
|
|
—
|
|
|||||||
|
Total revenue
|
$
|
47,910
|
|
|
$
|
30,972
|
|
|
$
|
17,427
|
|
|
$
|
18,431
|
|
$
|
(44,531
|
)
|
|
$
|
70,209
|
|
|
|
|
|
|
|
|
|
|
|
|
|
|
|
|
|
|
|
||||||||
|
Interest expense
|
$
|
6,083
|
|
|
$
|
1,458
|
|
|
$
|
—
|
|
|
$
|
6,310
|
|
$
|
(5,755
|
)
|
|
$
|
8,096
|
|
|
|
Payroll expense
|
12,477
|
|
|
—
|
|
|
7,341
|
|
|
1,619
|
|
—
|
|
|
21,437
|
|
|||||||
|
Professional fee expense
|
2,800
|
|
|
3,430
|
|
|
3,062
|
|
|
2,581
|
|
—
|
|
|
11,873
|
|
|||||||
|
Other expense
|
23,202
|
|
|
2,834
|
|
|
—
|
|
|
6,447
|
|
(6,601
|
)
|
|
25,882
|
|
|||||||
|
Total expense
|
44,562
|
|
|
7,722
|
|
|
10,403
|
|
|
16,957
|
|
(12,356
|
)
|
|
67,288
|
|
|||||||
|
Segment profit/(loss)
|
$
|
3,348
|
|
|
$
|
23,250
|
|
|
$
|
7,024
|
|
|
$
|
1,474
|
|
$
|
(32,175
|
)
|
|
$
|
2,921
|
|
|
|
Net income attributable to consolidated CLOs
|
33,529
|
|
|||||||||||||||||||||
|
Less: non-controlling interest and net income attributable to the VIE subordinated noteholders
|
30,924
|
|
|||||||||||||||||||||
|
Discontinued operations
|
2,882
|
|
|||||||||||||||||||||
|
Income taxes
|
(321
|
)
|
|||||||||||||||||||||
|
Net income available to common stockholders
|
$
|
8,729
|
|
||||||||||||||||||||
|
Segment assets
|
$
|
4,354,945
|
|
|
$
|
139,471
|
|
|
$
|
4,242
|
|
|
$
|
191,693
|
|
$
|
843,451
|
|
|
$
|
5,533,802
|
|
|
(1) Includes separate account and administrative service fees
(2) Includes management fees
Segment Results - Year ended December 31, 2013 compared to 2012
Insurance and Insurance Services Operations
Total revenues for insurance operations were $76.8 million for fiscal 2013, compared to $47.9 million for 2012, an increase of $28.9 million, or 60.3%. This increase was primarily the result of a full year of administrative service fees from the PFAS Transaction in July 2012.
Total expenses for insurance operations for fiscal 2013 were $62.8 million, compared to $44.6 million for 2012, an increase of $18.2 million, or 40.8%. This increase was primarily the increase in other expense of $6.5 million which was largely the result of a full year of expenses associated with the PFAS Transaction in 2013 as compared to 2012. Also included in the increase in total expenses was the $6.3 million increase in interest expense on the note used to finance the PFAS transaction.
Total operating profit for insurance operations for fiscal 2013 was $14.0 million, compared to $3.3 million for 2012, an increase of $10.7 million, or 324.2%. This increase was primarily the result of the additional profit from the PFAS Transaction, which offset an increase in related expenses.
Specialty Finance Operations
Total revenues for specialty finance operations for fiscal 2013 were $27.5 million, compared to $31.0 million for 2012, a decrease of $3.5 million, or 11.2%. The decline was primarily attributable to a decline in unrealized gains of $6.2 million due to declines
28
in market values in 2013, primarily related to Telos 1, Telos 2 and MFCA. This decline was partially offset by an increase in interest income of $3.8 million due to the revenue from the additional positions in Telos 3, Telos 4 and Telos 5, related to the warehouses.
Total expenses for specialty finance operations for fiscal 2013 were $11.3 million, compared to $7.7 million for 2012, an increase of $3.6 million, or 46.7%. The increase was primarily the result of the inclusion of Siena in results for 2013.
Total operating profit for specialty finance operations for fiscal 2013 was $16.2 million, compared to a profit of $23.3 million for 2012, a decrease of $7.1 million, or 30.5%. This decrease was driven primarily by the decline in the underlying value of our investments as well as the inclusion of Siena as a start-up entity in our results.
Asset Management Operations
Total revenues for asset management were $16.6 million for fiscal 2013, relatively flat when compared to $17.4 million for 2012. The lower revenue in 2013 was primarily attributable to lower management fees received from third parties offset in part by the addition of Telos 3 and Telos 4 and the associated management fees.
Total expenses for asset management were $14.6 million for fiscal 2013 compared to $10.4 million for 2012. This increase of $4.2 million was primarily attributable to the inclusion of payroll expense resulting from the acquisition of TAMCO in June 2012 for a full year in 2013 compared to six months in 2012.
Total operating profit for asset management was $1.9 million for fiscal 2013 compared to $7.0 million in 2012. This was primarily attributable to the aforementioned increase in payroll expense.
Real Estate Operations
Total revenues for real estate operations for fiscal 2013 were $33.8 million, compared to $18.4 million for 2012, an increase of $15.4 million, or 83.7%. This increase was primarily due to the gain on sale of the Bickford Portfolio.
Total expenses for real estate operations for fiscal 2013 were $18.5 million, compared to $17.0 million for 2012. This increase was primarily due to the addition of the Calamar and Heritage joint ventures in 2013.
Total operating profit for real estate operations for fiscal 2013 was $15.3 million, compared to a profit of $1.5 million in 2012, an increase of $13.8 million, or 920%. The gain on sale of the Bickford Portfolio was the primary driver of this increase.
Economic Net Income and Economic Book Value
Economic Net Income
Economic Net Income (“ENI”) is a non-GAAP financial measure of profitability which Tiptree uses to measure the performance of its core business. Management believes that ENI reflects the nature and substance of the economic results of Tiptree’s businesses. Management also uses ENI as a measurement for determining incentive compensation. ENI as used by Tiptree may not be comparable to similar measures presented by other companies as it is a non-GAAP financial measure that is not based on a comprehensive set of accounting rules or principles and therefore may be defined differently by other companies. ENI should be considered in addition to, not as a substitute for, financial measures determined in accordance with GAAP.
Economic Net Income Components
The following table details the individual revenue and expense components of the non-GAAP measure ENI for the periods indicated (in thousands):
29
|
Year Ended December 31,
|
||||||||
|
2013
|
2012
|
|||||||
|
Revenues:
|
||||||||
|
Interest income
|
$
|
510
|
|
$
|
527
|
|
||
|
Dividend/distribution income
|
22,844
|
|
20,436
|
|
||||
|
Realized gains (losses)
|
(1,024
|
)
|
414
|
|
||||
|
Unrealized gains
|
20,572
|
|
27,355
|
|
||||
|
Management fee income
|
16,165
|
|
6,974
|
|
||||
|
Total revenues
|
59,067
|
|
55,706
|
|
||||
|
Expenses:
|
||||||||
|
Compensation expense
|
12,480
|
|
6,568
|
|
||||
|
Distribution expense (convertible preferred)
|
1,747
|
|
2,789
|
|
||||
|
Interest expense
|
3,261
|
|
|
1,276
|
|
|||
|
Professional fees and other
|
6,835
|
|
|
4,359
|
|
|||
|
Total expense
|
24,323
|
|
14,992
|
|
||||
|
Economic Net Income (loss) before management fee expenses and waivers and incentive allocation
|
34,744
|
|
40,714
|
|
||||
|
Less: Management fee expenses (1)
|
—
|
|
1,996
|
|
||||
|
Less: Management fee expenses waived (1)
|
—
|
|
(1,066
|
)
|
||||
|
Economic Net Income before incentive allocation
|
34,744
|
|
39,784
|
|
||||
|
Less: Incentive allocation (1)
|
—
|
|
3,459
|
|
||||
|
Economic Net Income of Operating Company
|
34,744
|
|
|
36,325
|
|
|||
|
Less: Economic net income attributable to TFP
|
25,911
|
|
|
27,276
|
|
|||
|
Economic Net Income of Tiptree before tax provision
|
8,833
|
|
|
9,049
|
|
|||
|
Less: Tax provision attributable to Tiptree
|
(197
|
)
|
|
—
|
|
|||
|
Economic Net Income of Tiptree
|
$
|
9,030
|
|
$
|
9,049
|
|
||
(1) Following TFP’s acquisition of TAMCO in June 2012 described in Note 1 to the financial statements, TAMCO no longer pays management or incentive fees.
Reconciliation of GAAP Net Income to Economic Net Income
In addition to the other adjustments indicated in the table below, ENI includes the following adjustments: (i) adjustment to results from real estate to eliminate non-cash items similar to adjusted funds from operations (“AFFO”) which is a non-GAAP financial measure widely used in the real estate industry, (ii) in our insurance segment, adjustment for fair value on available for sale securities, which is a non-GAAP measure frequently used throughout the insurance industry, and (iii) in our specialty finance segment, VIEs are shown as if not consolidated.
The following is a reconciliation of GAAP Net Income attributable to Tiptree to ENI for the years ended December 31, 2013 and 2012 (in thousands):
30
|
Year Ended December 31,
|
|||||||
|
2013
|
2012
|
||||||
|
GAAP Net Income of Tiptree
|
$
|
8,845
|
|
$
|
8,729
|
|
|
|
Plus: Tax provision attributable to Tiptree
|
(197
|
)
|
—
|
|
|||
|
Plus: Portion of NCI held by TFP
|
26,164
|
|
26,423
|
|
|||
|
GAAP net income of Operating Company
|
34,812
|
|
35,152
|
|
|||
|
Adjustments:
|
|||||||
|
Adjustments to results from real estate operations (1)
|
(1,929
|
)
|
2,937
|
|
|||
|
Effect of change in majority ownership of subsidiaries (2)
|
(1,811
|
)
|
3,018
|
|
|||
|
Fair value adjustments to carrying value (3)
|
(3,135
|
)
|
5,813
|
|
|||
|
Reversal of VIEs net losses (gains) attributable to TFI (4)
|
7,380
|
|
(3,752
|
)
|
|||
|
Reversal of TAMCO net gains for periods prior to acquisition of TAMCO (5)
|
—
|
|
(2,760
|
)
|
|||
|
TFP convertible preferred reclass of distributions to expense (6)
|
(1,747
|
)
|
(2,790
|
)
|
|||
|
Foreign exchange reserve (7)
|
1,174
|
|
(1,174
|
)
|
|||
|
Amortization of start-up expenses (8)
|
—
|
|
(119
|
)
|
|||
|
Economic Net Income of Operating Company
|
34,744
|
|
36,325
|
|
|||
|
Less: Economic Net Income attributable to TFP
|
25,911
|
|
27,276
|
|
|||
|
Economic Net Income of Tiptree before tax provision
|
8,833
|
|
9,049
|
|
|||
|
Less: Tax provision attributable to Tiptree
|
(197
|
)
|
—
|
|
|||
|
Economic Net Income of Tiptree
|
$
|
9,030
|
|
$
|
9,049
|
|
|
|
(1)
|
Adjustments to results from real estate operations includes the effects of straight lining lease revenue, expenses associated with depreciation and amortization, certain transaction expenses, non-cash equity compensation expenses, other non-cash charges, and incentive compensation adjustments for unconsolidated partnerships and joint ventures.
|
|
(2)
|
Effect of change in majority ownership of subsidiaries is the dilutive effect of Care Inc.’s issuance of shares related to the Contribution Transactions and stock-based compensation, the effect of Tiptree’s increased ownership of PFG due to the accretion of preferred shares, and the increase in ownership of Siena.
|
|
(3)
|
Adjustment is to account at fair value the CLO subordinated notes held by Tiptree and PFG’s available-for-sale securities. Fair values are obtained from independent third party pricing sources.
|
|
(4)
|
Reversal of VIEs net losses/(gains) attributable to Tiptree (see reconciliation table below in thousands):
|
31
|
Year Ended December 31, 2013
|
||||||||||
|
Tiptree pro rata portion of Net Income
|
Net Income (net of 1% NCI)
|
Tiptree’s ownership %
|
||||||||
|
Telos 1
|
$
|
(1,588
|
)
|
$
|
(22,341
|
)
|
7.11%
|
|||
|
Telos 2
|
(7,934
|
)
|
(8,312
|
)
|
95.45%
|
|||||
|
Telos 3
|
549
|
|
2,988
|
|
18.38%
|
|||||
|
Telos 4
|
1,593
|
|
2,241
|
|
71.08%
|
|||||
|
Total
|
$
|
(7,380
|
)
|
$
|
(25,424
|
)
|
||||
|
Year Ended December 31, 2012
|
||||||||||
|
Tiptree pro rata portion of Net Income
|
Net Income (net of 1% NCI)
|
Tiptree’s ownership %
|
||||||||
|
Telos 1
|
$
|
297
|
|
$
|
4,173
|
|
7.11%
|
|||
|
Telos 2
|
3,455
|
|
3,620
|
|
95.45%
|
|||||
|
Total
|
$
|
3,752
|
|
$
|
7,793
|
|
||||
|
(5)
|
The purchase of TAMCO on June 30, 2012 was accounted for as a combination of entities under common control. As a result, the assets and liabilities of TAMCO were presented as if TAMCO had been consolidated by Tiptree on January 1, 2010. For non-controlling interest, we are reversing the effect of this recasting of financial information for prior periods.
|
|
(6)
|
Convertible preferred distribution reclassified as expense for purposes of ENI so as to reflect a cost of capital charge for outstanding convertible preferred. This class automatically converted to common shares effective July 1, 2013.
|
|
(7)
|
Reflects the timing difference on the recognition of yen exposure GAAP versus ENI.
|
|
(8)
|
Amortization of expenses associated with the start-up of Tiptree in 2007. The amortization period ended on June 30, 2012.
|
Economic Book Value
Economic Book Value (“EBV”) is a non-GAAP financial measure which Tiptree uses to evaluate the performance of its core business. Management believes that EBV provides greater transparency and enhanced visibility into the underlying profitability drivers of our business and provides a useful, alternative view of the economic results of Tiptree’s businesses. EBV includes the following adjustments: (i) reversal of GAAP value for TAMCO and CLO VIEs and replacement with fair value, (ii) addition of life to date AFFO adjustments for real estate operations, (iii) reclassification of convertible preferred distributions to expense and (iv) foreign exchange timing adjustment.
EBV as used by Tiptree may not be comparable to similar measures presented by other companies as it is a non-GAAP financial measure that is not based on a comprehensive set of accounting rules or principles and therefore may be defined differently by other companies. EBV should be considered in addition to, not as a substitute for, financial measures determined in accordance with GAAP. The following is a reconciliation of GAAP book value attributable to Tiptree to EBV as of December 31, 2013 and 2012 (in thousands except share data):
32
|
Year Ended December 31,
|
|||||||
|
Economic Book Value
|
2013
|
2012
|
|||||
|
GAAP TFI Total Capital
|
$
|
565,856
|
|
$
|
535,588
|
|
|
|
Less: Non-controlling Interest in TFI
|
361,354
|
|
324,595
|
|
|||
|
Less: Retained Earnings of consolidated TAMCO
|
84,591
|
|
102,635
|
|
|||
|
GAAP Net Assets to Tiptree Class A Stockholders
|
119,911
|
|
108,358
|
|
|||
|
Less net assets held directly at Tiptree
|
4,259
|
|
4,089
|
|
|||
|
Plus portion of NCI held by TFP
|
339,283
|
|
315,640
|
|
|||
|
GAAP Net Assets of Operating Company
|
454,935
|
|
419,909
|
|
|||
|
Reversal of consolidation of TAMCO (including VIEs)(1)
|
(144,817
|
)
|
(120,513
|
)
|
|||
|
Fair values of CLOs (2)
|
61,145
|
|
30,737
|
|
|||
|
Value of TAMCO (3)
|
57,661
|
|
56,353
|
|
|||
|
Adjustments to results from real estate operations (4)
|
3,711
|
|
5,603
|
|
|||
|
TFP convertible preferred reclass of distributions to expense (5)
|
—
|
|
(810
|
)
|
|||
|
Foreign exchange reserve (6)
|
—
|
|
(1,174
|
)
|
|||
|
Total Adjustments
|
(22,300
|
)
|
(29,804
|
)
|
|||
|
Economic Operating Company Net Assets
|
$
|
432,635
|
|
$
|
390,105
|
|
|
|
Units outstanding (7)
|
41,525
|
|
41,049
|
|
|||
|
Economic Tiptree Book Value Per Class A Share
|
$
|
10.42
|
|
|
$
|
9.50
|
|
|
(1)
|
Under GAAP, Tiptree is required to consolidate all of the assets and liabilities of the VIEs managed by TAMCO on Tiptree’s balance sheet regardless of Tiptree’s economic interest. See Note 2(c) to the consolidated financial statements. Adjustment is reversal of consolidation of TAMCO and VIEs.
|
|
(2)
|
Adjustment is to include the fair value of our ownership position in the VIEs which has been reversed as described in note (1) above.
|
|
(3)
|
Values TAMCO at the lower of cost or market, and reflects the valuation of the purchase price based on the value of the partnership units issued in consideration for TAMCO.
|
|
(4)
|
Adjustments to results from real estate operations reverses the amounts, since inception, related to the effects of straight lining lease revenue, expenses associated with depreciation and amortization, certain transaction expenses, non-cash transactions expenses, non-cash equity compensation expenses, other non-cash charges, and incentive compensation adjustment for unconsolidated partnerships and joint ventures.
|
|
(5)
|
Convertible preferred distribution was reclassified as expense for purposes of ENI. This adjustment conforms the reclassification for EBV purposes.
|
|
(6)
|
A reserve was established for EBV purposes as of December 31, 2012 reflecting a timing difference relative to GAAP recognition of yen foreign exchange. Such reserve was subsequently reversed.
|
|
(7)
|
Assumes full redemption of Operating Company units for Class A common stock. Operating Company is owned approximately 25% by Tiptree and approximately 75% by TFP. Tiptree’s ownership is equal to the number of shares of Class A common stock and pursuant to Operating Company’s limited liability agreement this ratio will remain 1:1. TFP’s
|
33
ownership is equal to 2.798 times the number of TFP partnership units outstanding and this ratio is expected to remain 2.798:1. There were 11,068 and 11,016 partnership units outstanding as of December 31, 2013 and 2012, respectively. The basic EBV per partnership unit was $29.16 and $26.58 as of December 31, 2013 and 2012, respectively.
Liquidity and Capital Resources
Tiptree is a holding company and conducts all of its operations through Operating Company. Dividends and distributions from our subsidiaries to Operating Company and investments are the principal source of cash to make acquisitions, invest in existing businesses, pay employee compensation, dividends, professional fees (including advisory services, legal and accounting fees), office rent, insurance costs, and certain support services (including under the Transition Services Agreement and Administrative Services Agreement). Tiptree’s current source of liquidity is its cash, cash equivalents and investments and distributions from operating subsidiaries and principal investments, including subordinated notes of CLOs managed by Telos. At December 31, 2013, Tiptree had unrestricted cash of $120.6 million. As a result of the $50.0 million borrowed under the credit agreement with Fortress and the $44.0 million of proceeds from the sale of the Bickford Portfolio in our real estate segment during 2013, we maintained a relatively larger cash balance. In 2014 we intend to deploy a significant amount of our cash balance to purchase assets, sponsor CLOs, support our existing business and invest in new products. Tiptree intends to opportunistically acquire majority control of new businesses both in its existing financial services sectors and complementary sectors. Accordingly, Tiptree’s cash needs will differ over time from Tiptree’s historical cash needs and Tiptree may seek additional sources of cash to fund acquisitions or investments. These additional sources of cash may take the form of debt or equity and may be at the parent, subsidiary or asset level.
The ability of Tiptree’s subsidiaries to generate sufficient net income and cash flows to make cash distributions to us will be subject to numerous business and other factors, including restrictions contained in our subsidiaries’ financing agreements, regulatory restrictions, availability of sufficient funds at such subsidiaries, general economic and business conditions, tax considerations, strategic plans, financial results and other factors such as target capital ratios and ratio levels anticipated by rating agencies to maintain or improve current ratings. For example, Telos will require additional capital in order to form future CLOs, and PFG may require additional capital to meet regulatory capital requirements.
Consolidated Comparison of Cash Flows
Summary Consolidated Statements of Cash Flows
(in thousands)
|
Year ended December 31,
|
|||||||
|
2013
|
2012
|
||||||
|
Net cash provided by/(used in):
|
|||||||
|
Operating activities
|
$
|
(18,386
|
)
|
|
$
|
36,686
|
|
|
Investing activities
|
(689,182
|
)
|
(144,214
|
)
|
|||
|
Financing activities
|
739,562
|
|
|
99,082
|
|
||
|
Net increase in cash and cash equivalents
|
$
|
31,994
|
|
$
|
(8,446
|
)
|
|
Operating Activities
Cash used in operating activities for the period ended December 31, 2013 was $18.4 million, compared to $36.7 million cash provided for the comparable period in 2012, a decrease of $55.1 million. Cash used in operating activities from VIEs for the year ended December 31, 2013 was $19.5 million, an increase of $13.6 million from cash used of $5.9 million for the year ended December 31, 2012. Also included in cash used in operating activities was $15.5 million from the net realized gain on sale of properties related to the Bickford sale. Excluding the activity attributable to the VIEs and this one time gain related to Bickford, cash provided by operating activities declined $26.0 million. The decrease was largely attributable to the decline in net income.
Investing Activities
Cash used in investing activities for the period ended December 31, 2013 was $689.2 million, compared to $144.2 million for the comparable period in 2012, an increase of $545.0 million. Cash used in investing activities from VIEs was $537.9 million for the year ended December 31, 2013, an increase of $534.7 million from cash used of $3.2 million for the year
34
ended December 31, 2012. This increase was primarily related to the formation of Telos 3 and Telos 4 in 2013. Excluding the activity attributable to the VIEs, cash used in investing activities increased $10.3 million. This increase was largely attributable to the increase in the purchases of trading securities and loans carried at fair value of $166.2 million offset against the decline in cash used in acquisitions of $109.7 million compared to the prior year and proceeds from sales of real estate of $44.0 million received in 2013. The increase in the purchases of trading securities and loans relate to the Telos 5 warehouse activity during the year and the decline in cash used in acquisitions relate to the PFAS Transaction in 2012.
Financing Activities
Cash provided by financing activities for the year ended December 31, 2013 was $739.6 million, compared to $99.1 million in cash provided for the comparable period in 2012, an increase of $640.5 million. Cash provided by financing activities for VIEs was $545.0 million for the year ended December 31, 2013 and cash used in financing activities for VIEs was $3.9 million for the comparable period in 2012. Excluding the activity attributable to VIEs, cash provided by financing activities increased $91.6 million. The increase was largely attributable to the increase in the proceeds from loans of $70.4 million and the proceeds from borrowings under mortgage notes payables of $16.0 million. The increase in proceeds from loans was a result of borrowings related to the Telos 5 warehouse activity and net proceeds from Tiptree’s credit facility. Borrowings under mortgage notes payable were used to fund Care’s acquisition of real estate.
On September 18, 2013, Operating Company entered into a Credit Agreement with Fortress and borrowed $50.0 million under the Credit Agreement. The Credit Agreement also includes an option for Operating Company to borrow additional amounts up to a maximum aggregate of $125.0 million, subject to satisfaction of certain customary conditions. The principal of, and all accrued and unpaid interest on, all loans under the Credit Agreement shall become immediately due and payable on September 18, 2018. Loans under the Credit Agreement bear interest at a variable rate per annum equal to the one-month London interbank offering rate (LIBOR), with a minimum LIBOR rate of 1.25%, plus a margin of 6.50% per annum. The principal amounts of the loans are to be repaid in consecutive quarterly installments, which installments may be adjusted based on the Net Leverage Ratio (as defined in the Credit Agreement) at the end of each fiscal quarter. The obligations of Operating Company under the Credit Agreement are secured by liens on substantially all of the assets of Operating Company. As of December 31, 2013, $49.5 million was outstanding on this obligation. The weighted average interest rate for 2013 was 7.75%. See Note 12 to the consolidated financial statements for a discussion of other debt instruments of our operating segments.
Contractual Obligations
The table below summarizes Tiptree’s contractual obligations by period for payments that are due as of December 31, 2013 (in thousands):
|
Less than 1 year
|
1-3 years
|
3-5 years
|
More than 5 years
|
Total
|
||||||||||||||||
|
Mortgage notes payable and related interest (1)
|
$
|
5,232
|
|
$
|
10,702
|
|
$
|
11,105
|
|
$
|
80,666
|
|
$
|
107,705
|
|
|||||
|
Note payable (2)
|
7,667
|
|
20,000
|
|
21,417
|
|
41,931
|
|
91,015
|
|
||||||||||
|
Notes payable CLOs (3)
|
—
|
|
—
|
|
—
|
|
1,341,701
|
|
1,341,701
|
|
||||||||||
|
Credit Agreement (4)
|
2,000
|
|
4,000
|
|
43,500
|
|
—
|
|
49,500
|
|
||||||||||
|
Operating lease obligations (5)
|
1,518
|
|
1,813
|
|
1,798
|
|
1,308
|
|
6,437
|
|
||||||||||
|
Revolving line of credit (6)
|
—
|
|
—
|
|
5,371
|
|
—
|
|
5,371
|
|
||||||||||
|
Total
|
$
|
16,417
|
|
$
|
36,515
|
|
$
|
83,191
|
|
$
|
1,465,606
|
|
$
|
1,601,729
|
|
|||||
|
(1)
|
Mortgage notes payable include mortgage notes entered into by Care LLC in connection with its acquisition of several properties (see Note 12
—
Debt).
|
|
(2)
|
Note payable relates to the PFAS Transaction and TFP payment for Series A Preferred stock and common shares of PFG. (see Note 12
—
Debt).
|
|
(3)
|
Non-recourse CLO notes payable principal is payable at stated maturity, 2021 for Telos 1, 2022 for Telos 2, 2024 for Telos 3 and Telos 4.
|
35
|
(4)
|
On September 18, 2013, Operating Company entered into a Credit Agreement with Fortress and borrowed $50.0 million under the Credit Agreement. The Credit Agreement also includes an option for Operating Company to borrow additional amounts up to a maximum aggregate of $125.0 million, subject to satisfaction of certain customary conditions.
|
|
(5)
|
Minimum rental obligation for Care, Siena and PFG office lease. The total rent expense for the Company for fiscal 2013 and 2012 was $1.5 million and $0.9 million, respectively.
|
|
(6)
|
On July 25, 2013, Tiptree’s subsidiary Siena closed on a line of credit with Wells Fargo Bank. This non-recourse revolving line is for $65.0 million with an interest rate of LIBOR plus 250 basis points and a maturity date of January 25, 2017. As of December 31, 2013 there was $5.4 million outstanding on this line.
|
Critical Accounting Policies and Estimates
The Company’s significant accounting policies are described in Note 2—Summary of Significant Accounting Policies. Tiptree’s critical accounting policies and estimates are those related to principles of consolidation, variable interest entities, fair value of financial instruments, goodwill and other intangibles and income taxes. Further information can be found in the Notes to Consolidated Financial Statements related to the following: variable interest entities can be found in Note 3; valuation of assets where quoted market prices are not available can be found under “Fair Value Measurement” in Note 6; policies related to goodwill and intangible assets can be found in Note 2—Summary of Significant Accounting Policies—Goodwill and Identifiable Intangible Assets; and additional information on income taxes can be found under Note 13—Income Taxes. The consolidated financial statements prepared under GAAP for all periods presented include retroactive adjustments to comparative periods to reflect the combinations under common control described in Note 1 related to TAMCO and the Contribution Transactions. All intercompany items have been eliminated for these periods.
Principles of Consolidation
The consolidated financial statements reflect the consolidated accounts of Tiptree and (i) its wholly-owned subsidiaries, (ii) subsidiaries in which it has a controlling interest, and (iii) certain VIEs in which Tiptree, through its subsidiaries is deemed to be the primary beneficiary. All significant intercompany accounts and transactions have been eliminated in the consolidated financial statements. This consolidation, particularly with respect to the VIEs, significantly impacts these subsidiaries’ financial statements.
Variable Interest Entities
ASC Topic 810,
Consolidations,
requires the consolidation of a VIE into the financial statements of the entity that is considered the VIE’s primary beneficiary. ASC Topic 810 provides a framework for determining whether an entity should be considered a VIE and accordingly evaluated for consolidation. If an entity is a VIE, it would then need to be determined whether Tiptree’s relationship, direct or indirect through subsidiaries to the VIE (whether contractual, through direct investments in the entity, or otherwise) results in a variable interest. If Tiptree does have a variable interest in the entity, it would then need to be determined whether Tiptree is deemed to be the primary beneficiary. For VIEs, if Tiptree is deemed to (i) have the power to direct the activities of the VIE that most significantly impact the economic performance and (ii) either the obligation to absorb losses or the right to receive benefits that could be significant to the VIE, then Tiptree would be deemed to be the primary beneficiary of the VIE and would be required to consolidate the VIE. Generally, TAMCO’s contractual relationship as collateral manager of the CLO described herein satisfies criteria (i) of the prior sentence, and its ownership interests in and/or ability to earn certain incentive or other management fees in certain CLOs can typically satisfy criteria (ii).
Prior to the closing of the acquisition of TAMCO, it was established that TAMCO was the primary beneficiary of two CLOs that it managed at that time. As such, the financial statements of these two CLOs were included in the consolidated financial statements of Tiptree. See Note 1 under “Acquisition of Businesses” for additional details regarding this transaction.
The consolidation of the CLOs required the initial recognition of the assets and liabilities at fair value as of January 1, 2010 for Telos 1 and Telos 2 and at inception for subsequent CLOs (Telos 3 and Telos 4). Since the assets are solely for the benefit of the beneficial interest holders (liability holders) and no residual value from their liquidation is available to TAMCO, the difference between the fair value of the assets of the CLOs and its liabilities upon consolidation have been reflected as appropriated retained earnings. Given the nature and activity of the CLOs, TAMCO has applied the investment company accounting guidance to the CLOs’ financial statements and as such recognizes changes in fair value of the assets of the CLOs and accreted the fair value adjustment to the liabilities of the CLOs (recorded upon consolidation) in the consolidated statement of operations.
The following table summarizes the Company’s consolidated assets and non-recourse liabilities of the consolidated CLOs included in the Condensed Balance Sheets (in thousands):
36
|
As of December 31,
|
|||||||||
|
2013
|
2012
|
||||||||
|
Restricted Cash
|
$
|
67,604
|
|
$
|
75,105
|
|
|||
|
Investment in loans
|
1,298,155
|
741,743
|
|||||||
|
Other assets
|
48,857
|
34,812
|
|||||||
|
Total assets
|
$
|
1,414,616
|
|
$
|
851,660
|
|
|||
|
Notes payable-nonrecourse
|
$
|
1,154,097
|
|
$
|
571,752
|
|
|||
|
Other liabilities
|
21,509
|
48,558
|
|||||||
|
Total liabilities
|
$
|
1,175,606
|
|
$
|
620,310
|
|
|||
Net income attributable to the VIE subordinated noteholders (“non-Tiptree ownership” presented in the table below) represents the portion of net income generated by the consolidated CLOs that are not attributable to Tiptree’s ownership interest in those entities.
Total net results of consolidated CLOs included in the Company’s Consolidated Statements of Operations were as follows:
|
Year ended December 31,
|
|||||||||||
|
2013
|
2012
|
||||||||||
|
Consolidated CLOs (1)
|
$
|
(25,424
|
)
|
$
|
7,793
|
||||||
|
Less Non-Tiptree portion
|
(18,044
|
)
|
4,041
|
||||||||
|
Tiptree portion (2)
|
$
|
(7,380
|
)
|
$
|
3,752
|
||||||
|
(1)
|
Before elimination of management fee expense of $13.2 million and interest expense of $16.9 million as of December 31, 2013 and $16.1 million and $9.6 million as of December 31, 2012, respectively.
|
|
(2)
|
Net income of the CLOs to the Company as a result of its investments in the CLOs.
|
Fair Value of Financial Instruments
ASC Topic 820, Fair Value Measurements and Disclosures, defines fair value, describes the framework for measuring fair value, and addresses fair value measurement disclosures. Fair value is defined as the price that would be received to sell an asset or paid to transfer a liability in an orderly transaction between market participants at the measurement date.
ASC Topic 820 establishes a three level valuation hierarchy for disclosure of fair value measurements. The valuation hierarchy is based upon the transparency of inputs to the valuation of an asset or liability as of the measurement date. The three levels, from highest to lowest, are defined as follows:
Level 1 - Unadjusted, quoted prices in active markets for identical assets or liabilities that Tiptree has the ability to access at the measurement date.
Level 2 - Significant inputs other than quoted prices that are observable for the asset or liability, either directly or indirectly through corroboration with observable market data. Level 2 inputs include quoted prices for similar instruments in active markets, and inputs other than quoted prices that are observable for the asset or liability.
The types of financial assets and liabilities carried at Level 2 are valued based on one or more of the following:
|
a)
|
Quoted prices for similar assets or liabilities in active markets;
|
|
b)
|
Quoted prices for identical or similar assets or liabilities in nonactive markets;
|
|
c)
|
Pricing models whose inputs are observable for substantially the full term of the asset or liability; and
|
|
d)
|
Pricing models whose inputs are derived principally from or corroborated by observable market data through correlation or other means for substantially the full term of the asset or liability.
|
37
|
|
Level 3 - Significant inputs that are unobservable inputs for the asset or liability, including Tiptree’s own data and assumptions that are used in pricing the asset or liability.
|
The availability of observable inputs can vary depending on the financial asset or liability and is affected by a wide variety of factors, including, for example, the type of product, whether the product is new, whether the product is traded on an active exchange or in the secondary market, and the current market conditions. To the extent that valuation is based on models or inputs that are less observable or unobservable in the market, the determination of fair value requires more judgment. Accordingly, the degree of judgment exercised by Tiptree in determining fair value is greatest for instruments categorized within Level 3 of the fair value hierarchy. In certain cases, the inputs used to measure fair value may fall into different levels of the fair value hierarchy. In such cases, for disclosure purposes, the level in the fair value hierarchy within which the fair value measurement in its entirety falls is determined based on the lowest level input that is significant to the fair value measurement in its entirety. Tiptree’s assessment of the significance of a particular input to the fair value measurement in its entirety requires judgment and the consideration of factors specific to the asset. From time to time, Tiptree’s assets and liabilities will transfer between one level to another level. It is Tiptree’s policy to recognize transfers between different levels at the end of each reporting period.
The following is a description of the valuation methodologies used for financial assets and liabilities measured at fair value, as well as the general classification of such assets and liabilities pursuant to the valuation hierarchy. Tiptree’s fair value measurement is based on a market approach, which utilizes prices and other relevant information generated by market transactions involving identical or comparable financial instruments. Sources of inputs to the market approach include a third-party pricing service, independent broker quotations or pricing matrices. Management analyzes the third party valuation methodologies and its related inputs to perform assessments to determine the appropriate level within the fair value hierarchy. Further, management has a process in place to review all changes in fair value from measurement period to measurement period. Any discrepancies or unusual observations are followed through to resolution through the source of the pricing as well as utilizing comparisons, if applicable, to alternate pricing sources. Tiptree utilizes observable and unobservable inputs into its valuation methodologies. Observable inputs include benchmark yields, reported trades, broker-dealer quotes, issuer spreads, benchmark securities, bids, offers and reference data. In addition, specific issuer information and other market data is used. For broker quotes, quotes are obtained from sources recognized to be market participants. Unobservable inputs may include expected cash flow streams, default rates, supply and demand considerations and market volatility.
Trading Securities
: Trading securities consist primarily of privately held equity securities, exchange-traded equity securities, U.S. Treasury securities (“USTs”), CLOs, collateralized debt obligations (“CDOs”), asset backed securities (“ABSs”), loans, and tax exempt securities. The fair value of privately held equity securities are either valued based on quotes obtained from dealers or internally developed valuation models. Because significant inputs used to determine the dealer quotes or model values are not observable, such as projected future earnings and price volatility, Tiptree has classified them within Level 3 of the fair value hierarchy. Exchange-traded equity securities are valued based on quoted prices from the exchange. These securities are actively traded and valuation adjustments are not applied. Accordingly, they are categorized in Level 1 of the fair value hierarchy. USTs are actively traded and valuation adjustments are not applied. They are categorized in Level 1 of the fair value hierarchy. Positions in securitized products such as CLOs, CDOs, and ABSs are based on quotes obtained from dealers. When these quotes are based directly or indirectly on observable inputs such as quoted prices for similar assets exchanged in an active or inactive market, Tiptree has classified them within Level 2 of the fair value hierarchy. If these quotes are based on valuation models using unobservable inputs such as expected future cash flows, default rates, supply and demand considerations, and market volatility, Tiptree has classified them within Level 3 of the fair value hierarchy.
The fair value of tax exempt securities is determined by obtaining quotations from independent pricing services. In most cases, quotes are obtained from two pricing services and the average of both quotes is used. The independent pricing services determine their quotes using observable inputs such as current interest rates, specific issuer information and other market data for such securities. Therefore, the estimate of fair value is subject to a high degree of variability based upon market conditions, the availability of issuer information and the assumptions made. The valuation inputs used to arrive at fair value for such debt obligations are generally classified within Level 2 or Level 3 of the fair value hierarchy.
Available for Sale Securities:
Available for sale securities consist primarily of obligations of states and political subdivisions, USTs, certificates of deposit, ABSs, and corporate bonds. These securities will generally be classified within either Level 1 or Level 2 of the fair value hierarchy. The fair value of fixed maturity securities is based on quoted market prices obtained from an independent pricing service, where available. If listed prices or quotes are not available, fair value is based upon internally developed models that use primarily market-based or independently sourced market parameters, including interest rate yield curves, option volatilities, and currency rates.
Derivative Assets and Liabilities:
Derivative assets and liabilities consist of credit default swaps (“CDS”), index credit default swaps (“CDX”) and interest rate swaps (“IRS”). The fair value of derivative assets and liabilities is based upon valuation pricing models, which represent what the Company would expect to receive or pay at the balance sheet date if the contracts were canceled. In general, the fair value of CDSs and CDXs are based on dealer quotes. These derivatives will generally be classified
38
within either Level 2 or Level 3 of the fair value hierarchy. The fair value of IRSs is determined by obtaining broker or counterparty quotes. Because there were observable inputs used to arrive at these quotes, Tiptree has classified the IRSs within Level 2 of the fair value hierarchy.
Separate Account Assets:
Separate account assets are primarily invested in alternative investments (which include investments in limited partnerships, private equity funds, hedge funds, and fund of funds), mutual funds, fixed maturity securities, and equity securities. The alternative investments are valued at estimated fair value with the assistance of investment managers of the underlying alternative investments. Since the entities underlying these alternative investments are investment companies for accounting purposes, as a practical expedient, Tiptree utilizes the separate account’s proportionate interest in the fair value of the underlying net assets to determine the fair value of these investments. The fair value of the underlying net assets of each alternative investment is determined from financial information provided by the investment manager. These alternative investments are generally classified within Level 3 of the fair value hierarchy. Most hedge fund investments are classified as Level 3. However, some alternative asset investments with minimal liquidity restrictions such as no lockup period, redemption notification of 35 days or less, withdrawal frequency greater than annually, and withdrawal payouts within 30 days are classified within Level 2. Mutual funds and equity securities are exchange-traded and are value based on quoted market prices from independent pricing services and are classified within Level 1 of the fair value hierarchy. U.S. Treasury securities are classified within Level 1 of the fair value hierarchy and all other fixed maturity securities are classified within Level 2.
In times of illiquid markets and financial stress, actual prices and valuations may significantly diverge from results predicted by models. In addition, other factors can affect Tiptree’s estimate of fair value, including market dislocations, incorrect model assumptions, and unexpected correlations. These valuation methods could expose Tiptree to materially different results should the models used or underlying assumptions be inaccurate.
Income Taxes
The Company accounts for income taxes under the asset and liability method. Deferred tax assets and liabilities are recognized for the future tax consequences attributable to the differences between the financial statement carrying amounts of existing assets and liabilities and their respective tax bases. Deferred tax assets and liabilities are measured using enacted tax rates expected to apply to taxable income in the years in which the temporary differences are expected to be recovered or settled.
The effect on deferred tax assets and liabilities of a change in the tax rates is recognized in earnings in the period that includes the enactment date. Additionally, taxing jurisdictions could retroactively disagree with our tax treatment of certain items, and some historical transactions have income tax effects going forward. Accounting guidance requires these future effects to be evaluated using current laws, rules and regulations, each of which can change at any time and in an unpredictable manner.
In accordance with ASC 740, the Company establishes valuation allowances for deferred tax assets when, in its judgment, it concludes that it is more likely than not that the deferred tax assets will not be realized. These judgments are based on projections of future income, including tax-planning strategies, by individual tax jurisdiction. Changes in economic conditions and the competitive environment may impact the accuracy of the Company’s projections. In accordance with ASC 740, on a quarterly basis, the Company assesses the likelihood that its deferred tax assets will be realized and determines if adjustments to the Company’s valuation allowance is appropriate. As a result of this assessment, as of December 31, 2013, the consolidated valuation allowance for Tiptree was $1.5 million. The increase and/or decrease in valuation allowance could have a significant negative or positive impact on our current and future earnings. In 2013, the Company recorded a net reduction of valuation allowances of $6.8 million. In 2012, the Company recorded net changes in valuation allowances of $1.8 million.
The total income tax expense of $6.9 million for the period ended December 31, 2013 is reflected as a component of net income (loss) from continuing operations. This tax expense represents a consolidated total of all of Tiptree’s subsidiaries and includes $6.4 million related to PFG. In addition, Tiptree incurred approximately $2.1 million current federal and state income tax expense as a result of the gain on sale of the Bickford Portfolio (see Notes 10 and 22). A significant portion of the gain was reduced by available net operating loss carryforwards that were previously unrecorded as a result of Care, Inc.’s historical 0% statutory income tax rate in effect as of December 31, 2012 and June 30, 2013, prior to the Contribution Transaction. The tax associated with the Bickford portfolio gain is included with tax expense from continuing operations, rather than with discontinued operations because it arose as a result of Tiptree’s termination of REIT status, described below.
As a result of the Contribution Transaction on July 1, 2013, Tiptree no longer qualifies as a REIT, therefore Tiptree is no longer eligible to deduct the amount of distributions paid to shareholders and became a fully taxable corporation. Pursuant to the Internal Revenue Code, when a corporation loses REIT status within a tax year it becomes taxable retroactively to the first day of the tax year. As of July 1, 2013, an adjustment of $2.6 million was made to the Company’s deferred tax assets as a result of the Company no longer qualifying as a REIT.
For the year ended December 31, 2013, the Company’s effective tax rate on income from continuing operations is equal to 111.1%, which does not bear a customary relationship to statutory income tax rates. Differences from the statutory income tax
39
rates are primarily the result of: (i) income and (loss) attributable to noncontrolling interests and to the VIE subordinated noteholders which do not result in income tax expense or (benefit) to the Company, (ii) the one-time effect of the Company’s change from nontaxable to taxable status which must be reported as part of the income tax provision on continuing operations, and (iii) the effect of changes in valuation allowance on net operating losses reported by Siena, MFCA and a portion of net operating losses reported by PFG. Prior periods do not have comparable effective tax rates as the Company, as a REIT, was not subject to income taxes.
The Company’s primary tax jurisdiction is the U.S., which currently has a statutory income tax rate of 35%. The Company also operates in several state jurisdictions that have an average combined statutory rate of approximately 6%. The Company is a holding company and several of the subsidiaries file separate federal and state income tax returns, rather than filing tax returns as a single consolidated group with the Company. The U.S. federal and state income tax returns are subject to examination by the Internal Revenue Service and the various state departments of revenue where filings are required.
Goodwill and Intangible Assets
The Company initially records all assets and liabilities acquired in purchase acquisitions, including goodwill, indefinite lived intangibles and other intangibles, in accordance with ASC 805
Business Combinations.
Goodwill, indefinite-lived intangibles and other intangibles are subsequently accounted for in accordance with ASC 350
Intangibles-Goodwill and Other
and ASC 360
Impairment or Disposal of Long-Lived Assets.
The initial measurement of goodwill and intangibles requires judgment concerning estimates of the fair value of the acquired assets and liabilities. Goodwill ($4.3 million at December 31, 2013) and indefinite-lived intangible assets ($2.5 million at December 31, 2013) are not amortized but subject to tests for impairment annually or if events or circumstances indicate it is more likely than not they may be impaired. Other intangible assets are amortized over their estimated useful lives and are subject to impairment if events or circumstances indicate a possible inability to realize the carrying amount.
GAAP also requires that an interim test be done whenever events or circumstances occur that may indicate that it is more likely than not that the fair value of any reporting unit might be less than its carrying value. No such events or circumstances have occurred during 2013.
Key judgments in accounting for intangibles include useful life and classification between goodwill and indefinite-lived intangibles or other intangibles requiring amortization. Indefinite-lived intangible assets are evaluated for impairment at least annually by comparing their fair values, estimated using discounted cash flow analyses, to their carrying values. Other amortizing intangible assets ($152.2 million at December 31, 2013) are evaluated for impairment if events and circumstances indicate a possible impairment. Such evaluation of other intangible assets is initially based on undiscounted cash flow projections. See Note 2—Summary of Significant Accounting Policies for further detail.
Off-Balance Sheet Arrangements
Tiptree does not have any off-balance sheet obligations. Other than the consolidation of Telos 1, Telos 2, Telos 3, and Telos 4, Tiptree does not maintain any other relationships with unconsolidated entities or financial partnerships, special purpose or VIEs, established for the purpose of facilitating off-balance sheet arrangements or other contractually narrow or limited purposes. As of December 31, 2013, Tiptree did not guarantee any obligations of unconsolidated entities, enter into any commitments or express intent to provide additional funding to any such entities.
40
As a smaller reporting company, we are not required to provide the information contained in this Item.
Financial Statements Introductory Note
Tiptree is a holding company that is the sole managing member, and owns approximately 25%, of Operating Company. As the sole managing member of Operating Company, Tiptree operates and controls all of the business and affairs of Operating Company and its subsidiaries and consolidates the financial results of Operating Company and its subsidiaries. TFP’s ownership of approximately 75% of Operating Company is reflected as a non-controlling interest in Tiptree’s consolidated financial statements. See “Business—Structure” and Notes 1 and 15 to the consolidated financial statements for further discussion of the Company’s capital and ownership structure.
Index to Consolidated Financial Statements
Report of Independent Registered Public Accounting Firm
Audited Financial Statements
Consolidated Balance Sheet as of December 31, 2013 and 2012
Consolidated Statement of Operations for the years ended December 31, 2013 and 2012
Consolidated Statement of Comprehensive Income for the years ended December 31, 2013 and 2012
Consolidated Statement of Changes in Stockholders’ Equity for the years ended December 31, 2013 and 2012
Consolidated Statement of Cash Flows for the years ended December 31, 2013 and 2012
Notes to Consolidated Financial Statements
41
Report of Independent Registered Public Accounting Firm
The Board of Directors and Stockholders
Tiptree Financial, Inc.:
We have audited the accompanying consolidated balance sheets of Tiptree Financial, Inc. and subsidiaries as of December 31, 2013 and 2012, and the related consolidated statements of operations, comprehensive income, stockholders’ equity, and cash flows for the years then ended. These consolidated financial statements are the responsibility of the Company’s management. Our responsibility is to express an opinion on these consolidated financial statements based on our audits.
We conducted our audits in accordance with the auditing standards of the Public Company Accounting Oversight Board (United States). Those standards require that we plan and perform the audit to obtain reasonable assurance about whether the financial statements are free of material misstatement. An audit also includes examining, on a test basis, evidence supporting the amounts and disclosures in the financial statements, assessing the accounting principles used and significant estimates made by management, as well as evaluating the overall financial statement presentation. We believe that our audits provide a reasonable basis for our opinion.
In our opinion, the consolidated financial statements referred to above present fairly, in all material respects, the financial position of Tiptree Financial, Inc. and subsidiaries as of December 31, 2013 and 2012, and the results of their operations and their cash flows for the years then ended in conformity with U.S. generally accepted accounting principles.
/s/ KPMG LLP
New York, New York
March 18, 2014
42
TIPTREE FINANCIAL INC.
AND SUBSIDIARIES
AND SUBSIDIARIES
Consolidated Balance Sheet
(in thousands, except share and per share data)
|
As of December 31,
|
|||||||
|
|
2013
|
|
2012
|
||||
|
Assets
|
|
|
|
||||
|
Cash and cash equivalents – unrestricted
|
$
|
120,557
|
|
|
$
|
88,563
|
|
|
Cash and cash equivalents – restricted
|
26,395
|
|
|
20,748
|
|
||
|
Trading investments, at fair value
|
35,991
|
|
|
60,816
|
|
||
|
Investments in available for sale securities, at fair value
(amortized cost: $17,708 and $15,693 in 2013 and 2012, respectively)
|
17,763
|
|
|
16,303
|
|
||
|
Investments in loans, at fair value
|
171,087
|
|
|
20,423
|
|
||
|
Loans owned, at amortized cost – net of allowance
|
40,260
|
|
|
5,467
|
|
||
|
Investments in partially-owned entities
|
9,972
|
|
|
8,388
|
|
||
|
Real estate
|
105,061
|
|
|
118,827
|
|
||
|
Policy loans
|
102,147
|
|
|
99,123
|
|
||
|
Deferred tax assets
|
3,310
|
|
|
5,342
|
|
||
|
Intangible assets
|
154,695
|
|
|
162,412
|
|
||
|
Goodwill
|
4,294
|
|
|
3,088
|
|
||
|
Other assets
|
49,201
|
|
|
37,589
|
|
||
|
Separate account assets
|
4,625,099
|
|
|
4,035,053
|
|
||
|
Assets of consolidated CLOs
|
1,414,616
|
|
|
851,660
|
|
||
|
Total assets
|
$
|
6,880,448
|
|
|
$
|
5,533,802
|
|
|
Liabilities and Stockholders’ Equity
|
|
|
|
||||
|
Liabilities:
|
|
|
|
||||
|
Derivative financial instruments, at fair value
|
$
|
598
|
|
|
$
|
3,172
|
|
|
U.S. Treasuries, short position
|
18,493
|
|
|
20,175
|
|
||
|
Debt
|
360,609
|
|
|
195,648
|
|
||
|
Policy liabilities
|
112,358
|
|
|
108,868
|
|
||
|
Other liabilities and accrued expenses
|
21,829
|
|
|
14,988
|
|
||
|
Separate account liabilities
|
4,625,099
|
|
|
4,035,053
|
|
||
|
Liabilities of consolidated CLOs
|
1,175,606
|
|
|
620,310
|
|
||
|
Total liabilities
|
$
|
6,314,592
|
|
|
$
|
4,998,214
|
|
|
|
|
|
|
||||
|
Stockholders’ Equity:
|
|
|
|
||||
|
Preferred stock: $0.001 par value, 100,000,000 shares authorized, none issued or outstanding
|
$
|
—
|
|
|
$
|
—
|
|
|
Common stock - Class A: $0.001 par value, 200,000,000 shares authorized, 10,556,390 and 10,226,250 shares issued and outstanding respectively
|
11
|
|
|
11
|
|
||
|
Common stock - Class B: $0.001 par value, 50,000,000 shares authorized, 30,968,877 and 0 shares issued and outstanding respectively
|
31
|
|
|
—
|
|
||
|
Additional paid-in capital
|
100,903
|
|
|
96,144
|
|
||
|
Accumulated other comprehensive income
|
33
|
|
|
311
|
|
||
43
|
Retained earnings
|
18,933
|
|
|
11,892
|
|
||
|
Total stockholders’ equity of Tiptree Financial Inc.
|
119,911
|
|
|
108,358
|
|
||
|
Non-controlling interest
|
361,354
|
|
|
324,595
|
|
||
|
Appropriated retained earnings of consolidated TAMCO
|
84,591
|
|
|
102,635
|
|
||
|
Total stockholders’ equity
|
565,856
|
|
|
535,588
|
|
||
|
Total liabilities and stockholders’ equity
|
$
|
6,880,448
|
|
|
$
|
5,533,802
|
|
See accompanying notes to consolidated financial statements.
44
TIPTREE FINANCIAL INC.
AND SUBSIDIARIES
AND SUBSIDIARIES
Consolidated Statement of Operations
(in thousands, except share and per share data)
|
|
Year ended December 31,
|
|||||||
|
|
|
2013
|
|
2012
|
||||
|
Net realized (loss) gain on investments
|
|
$
|
(833
|
)
|
|
$
|
1,377
|
|
|
Change in unrealized appreciation on investments
|
|
2,971
|
|
|
9,129
|
|
||
|
Income from investments in partially owned entities
|
|
3,250
|
|
|
2,308
|
|
||
|
Net realized and unrealized gains
|
|
5,388
|
|
|
12,814
|
|
||
|
Investment income:
|
|
|
|
|
||||
|
Interest income
|
|
16,477
|
|
|
9,938
|
|
||
|
Separate account fees
|
|
22,248
|
|
|
19,875
|
|
||
|
Administrative service fees
|
|
49,489
|
|
|
22,995
|
|
||
|
Rental revenue
|
|
5,760
|
|
|
1,717
|
|
||
|
Other income
|
|
1,545
|
|
|
2,870
|
|
||
|
Total investment income
|
|
95,519
|
|
|
57,395
|
|
||
|
Total net realized and unrealized gains and investment income
|
|
100,907
|
|
|
70,209
|
|
||
45
TIPTREE FINANCIAL INC.
AND SUBSIDIARIES
AND SUBSIDIARIES
Consolidated Statement of Operations
(in thousands, except share and per share data)
|
|
Year ended December 31,
|
|||||||
|
|
|
2013
|
|
2012
|
||||
|
Expenses:
|
|
|
|
|
||||
|
Interest expense
|
|
17,517
|
|
|
8,096
|
|
||
|
Payroll expense
|
|
35,552
|
|
|
21,437
|
|
||
|
Professional fees
|
|
8,555
|
|
|
11,873
|
|
||
|
Change in future policy benefits
|
|
4,710
|
|
|
4,040
|
|
||
|
Mortality expenses
|
|
10,476
|
|
|
9,924
|
|
||
|
Commission expense
|
|
2,344
|
|
|
1,960
|
|
||
|
Depreciation and amortization expenses
|
|
4,467
|
|
|
2,238
|
|
||
|
Other expenses
|
|
15,456
|
|
|
7,720
|
|
||
|
Total expenses
|
|
99,077
|
|
|
67,288
|
|
||
|
Net income before taxes and income attributable to consolidated CLOs from continuing operations
|
|
1,830
|
|
|
2,921
|
|
||
|
Results of consolidated CLOs:
|
||||||||
|
Income attributable to consolidated CLOs
|
|
52,687
|
|
|
71,412
|
|
||
|
Expenses attributable to consolidated CLOs
|
|
48,268
|
|
|
37,883
|
|
||
|
Net Income attributable to consolidated CLOs
|
|
4,419
|
|
|
33,529
|
|
||
|
Income before taxes from continuing operations
|
|
6,249
|
|
36,450
|
|
|||
|
Provision for income taxes
|
|
6,941
|
|
|
(321
|
)
|
||
|
(Loss) income from continuing operations
|
|
(692
|
)
|
|
36,771
|
|
||
|
Discontinued operations:
|
|
|
|
|
||||
|
Gain on sale of Bickford portfolio, net
|
|
15,463
|
|
|
—
|
|
||
|
Income from discontinued operations, net
|
|
1,647
|
|
|
2,882
|
|
||
|
Provision for income taxes
|
|
—
|
|
|
—
|
|
||
|
Discontinued operations, net
|
|
17,110
|
|
|
2,882
|
|
||
|
Net income
|
|
16,418
|
|
|
39,653
|
|
||
|
Less net income attributable to noncontrolling interest
|
|
25,617
|
|
|
26,883
|
|
||
|
Less net (loss) income attributable to VIE subordinated noteholders
|
|
(18,044
|
)
|
|
4,041
|
|
||
|
Net income available to common stockholders
|
|
$
|
8,845
|
|
|
$
|
8,729
|
|
|
Net income (loss) per Class A common share:
|
|
|
|
|
||||
|
Basic, continuing operations, net
|
(0.81
|
)
|
|
0.57
|
|
|||
|
Basic, discontinued operations, net
|
|
1.67
|
|
|
0.28
|
|
||
|
Net income basic
|
|
0.86
|
|
|
0.85
|
|
||
|
Diluted, continuing operations, net
|
|
(0.81
|
)
|
|
0.57
|
|
||
|
Diluted, discontinued operations, net
|
|
1.67
|
|
|
0.28
|
|
||
|
Net income dilutive
|
|
$
|
0.86
|
|
|
$
|
0.85
|
|
46
TIPTREE FINANCIAL INC.
AND SUBSIDIARIES
AND SUBSIDIARIES
Consolidated Statement of Operations
(in thousands, except share and per share data)
|
|
Year ended December 31,
|
|||||||
|
|
|
2013
|
|
2012
|
||||
|
Weighted average number of Class A common shares:
|
|
|
|
|
||||
|
Basic
|
|
10,250,438
|
|
|
10,286,412
|
|
||
|
Diluted
|
|
10,250,438
|
|
|
10,286,412
|
|
||
See accompanying notes to consolidated financial statements.
47
TIPTREE FINANCIAL INC.
AND SUBSIDIARIES
AND SUBSIDIARIES
Consolidated Statement of Comprehensive Income
(in thousands, except share and per share data)
|
Year ended December 31,
|
||||||||
|
2013
|
2012
|
|||||||
|
Net income:
|
16,418
|
|
39,653
|
|
||||
|
Other comprehensive income:
|
||||||||
|
Net unrealized holding (losses)/gains on securities available for sale net of tax (benefit)/expense of ($121) and $154
|
(224
|
)
|
285
|
|
||||
|
Less: reclassification adjustment for net gains included in net income net of tax expense of $29 and $188
|
54
|
|
348
|
|
||||
|
Total comprehensive income:
|
16,140
|
|
39,590
|
|
||||
|
Less: comprehensive income (loss) attributable to non-controlling interests and VIE subordinated noteholders
|
$
|
7,573
|
|
|
$
|
(30,924
|
)
|
|
|
Total comprehensive income available to common stockholders
|
$
|
8,567
|
|
$
|
70,514
|
|
||
See accompanying notes to consolidated financial statements
48
TIPTREE FINANCIAL INC.
AND SUBSIDIARIES
AND SUBSIDIARIES
Consolidated Statement of Changes in Stockholders’ Equity
(in thousands, except share and per share data)
|
Class A Common Stock
|
Class B Common Stock
|
||||||||||||||||||||||||||||||||||||
|
Number of
shares
|
Common stock
|
Number of
shares
|
Common stock
|
Additional paid-in capital
|
Accumulated
other
comprehensive
income
|
Appropriated
retained earnings
of consolidated
CLO vehicles
|
Retained
earnings
|
Noncontrolling
interest
|
Total
|
||||||||||||||||||||||||||||
|
Balance at December 31, 2011
|
10,171,550
|
|
$
|
11
|
|
—
|
|
$
|
—
|
|
$
|
94,841
|
|
$
|
374
|
|
$
|
98,594
|
|
$
|
8,729
|
|
$
|
318,860
|
|
$
|
521,409
|
|
|||||||||
|
Stock-based compensation to directors for services rendered
|
15,127
|
|
—
|
|
—
|
|
—
|
|
108
|
|
—
|
|
—
|
|
—
|
|
—
|
|
108
|
|
|||||||||||||||||
|
Issuance of shares
|
—
|
|
—
|
|
—
|
|
—
|
|
344
|
|
—
|
|
—
|
|
—
|
|
—
|
|
344
|
|
|||||||||||||||||
|
Net unrealized gains and losses on available for sale securities (net of tax of $34)
|
—
|
|
—
|
|
—
|
|
—
|
|
—
|
|
(63
|
)
|
—
|
|
—
|
|
(35
|
)
|
(98
|
)
|
|||||||||||||||||
|
Dividends paid
|
—
|
|
—
|
|
—
|
|
—
|
|
—
|
|
—
|
|
—
|
|
(5,566
|
)
|
—
|
|
(5,566
|
)
|
|||||||||||||||||
|
Repurchased shares
|
(10,000
|
)
|
—
|
|
—
|
|
—
|
|
(71
|
)
|
—
|
|
—
|
|
—
|
|
—
|
|
(71
|
)
|
|||||||||||||||||
|
Net changes in non-controlling interest
|
—
|
|
—
|
|
—
|
|
—
|
|
772
|
|
—
|
|
—
|
|
—
|
|
(21,113
|
)
|
(20,341
|
)
|
|||||||||||||||||
|
Stock-based compensation to employees
|
49,573
|
|
—
|
|
—
|
|
—
|
|
150
|
|
—
|
|
—
|
|
—
|
|
—
|
|
150
|
|
|||||||||||||||||
|
Net income
|
—
|
|
—
|
|
—
|
|
—
|
|
—
|
|
—
|
|
4,041
|
|
8,729
|
|
26,883
|
|
39,653
|
|
|||||||||||||||||
|
Balance at December 31, 2012
|
10,226,250
|
|
$
|
11
|
|
—
|
|
$
|
—
|
|
$
|
96,144
|
|
$
|
311
|
|
$
|
102,635
|
|
$
|
11,892
|
|
$
|
324,595
|
|
$
|
535,588
|
|
|||||||||
|
Stock-based compensation to directors for services rendered
|
10,834
|
|
—
|
|
—
|
|
—
|
|
78
|
|
—
|
|
—
|
|
—
|
|
—
|
|
78
|
|
|||||||||||||||||
|
Net Issuance of shares
|
—
|
|
—
|
|
30,968,877
|
|
31
|
|
—
|
|
—
|
|
—
|
|
—
|
|
—
|
|
31
|
|
|||||||||||||||||
|
Net unrealized gains and losses on available for sale securities (net of tax of $150)
|
—
|
|
—
|
|
—
|
|
—
|
|
—
|
|
(278
|
)
|
—
|
|
—
|
|
(83
|
)
|
(361
|
)
|
|||||||||||||||||
|
Dividends paid
|
—
|
|
—
|
|
—
|
|
—
|
|
—
|
|
—
|
|
—
|
|
(1,804
|
)
|
—
|
|
(1,804
|
)
|
|||||||||||||||||
|
Repurchased shares
|
(302
|
)
|
—
|
|
—
|
|
—
|
|
(2
|
)
|
—
|
|
—
|
|
—
|
|
—
|
|
(2
|
)
|
|||||||||||||||||
|
Net changes in non-controlling interest
|
—
|
|
—
|
|
—
|
|
—
|
|
2,279
|
|
—
|
|
—
|
|
—
|
|
11,225
|
|
13,504
|
|
|||||||||||||||||
|
Stock-based compensation to employees
|
319,608
|
|
—
|
|
—
|
|
—
|
|
2,404
|
|
—
|
|
—
|
|
—
|
|
—
|
|
2,404
|
|
|||||||||||||||||
|
Net income
|
—
|
|
—
|
|
—
|
|
—
|
|
—
|
|
—
|
|
(18,044
|
)
|
8,845
|
|
25,617
|
|
16,418
|
|
|||||||||||||||||
|
Balance at December 31, 2013
|
10,556,390
|
|
$
|
11
|
|
30,968,877
|
|
$
|
31
|
|
$
|
100,903
|
|
$
|
33
|
|
$
|
84,591
|
|
$
|
18,933
|
|
$
|
361,354
|
|
$
|
565,856
|
|
|||||||||
See accompanying notes to consolidated financial statements
49
TIPTREE FINANCIAL INC.
AND SUBSIDIARIES
AND SUBSIDIARIES
Consolidated Statement of Cash Flows
(in thousands)
|
Year ended December 31,
|
|||||||
|
2013
|
2012
|
||||||
|
Cash flows from operating activities:
|
|||||||
|
Net income available to common stockholders
|
$
|
8,845
|
|
$
|
8,729
|
|
|
|
Net income attributable to noncontrolling interest
|
25,617
|
|
26,883
|
|
|||
|
Net (loss) income attributable to VIE subordinated note holders
|
(18,044
|
)
|
4,041
|
|
|||
|
Net income
|
16,418
|
|
39,653
|
|
|||
|
Adjustments to reconcile net income to net cash provided by operating activities:
|
|||||||
|
Net realized loss (gain) – trading securities
|
833
|
|
(1,377
|
)
|
|||
|
Net realized gain on sale of properties, net
|
(15,463
|
)
|
—
|
|
|||
|
Increase in other liabilities and accrued expenses
|
6,612
|
|
1,627
|
|
|||
|
Change in unrealized appreciation – trading securities
|
(2,971
|
)
|
(9,129
|
)
|
|||
|
Income from investments in partially-owned entities, net
|
(3,250
|
)
|
(2,308
|
)
|
|||
|
Increase in payment in kind interest
|
—
|
|
333
|
|
|||
|
Deferred tax expense
|
2,227
|
|
690
|
|
|||
|
(Increase)/ decrease in other assets
|
(15,392
|
)
|
1,041
|
|
|||
|
Non cash incentive fee
|
65
|
|
—
|
|
|||
|
Non cash compensation expense
|
2,559
|
|
365
|
|
|||
|
Non cash interest from investments in loans
|
(272
|
)
|
—
|
|
|||
|
Non cash impairment of partially owned entity
|
15
|
|
—
|
|
|||
|
Accretion of discounts and depreciation expense
|
6,521
|
|
6,375
|
|
|||
|
Amortization and write off of deferred financing costs
|
26
|
|
—
|
|
|||
|
Accretion of mortgage note discount
|
(198
|
)
|
—
|
|
|||
|
Increase in policy liabilities
|
3,384
|
|
5,291
|
|
|||
|
Operating activities from VIEs
|
(19,500
|
)
|
(5,875
|
)
|
|||
|
Net cash provided by/ (used in) operating activities
|
(18,386
|
)
|
|
36,686
|
|
||
|
Cash flows from investing activities:
|
|||||||
|
Purchases of subsidiaries
|
—
|
|
|
(29,782
|
)
|
||
|
Purchases of trading securities and loans carried at fair value
|
(204,638
|
)
|
(38,438
|
)
|
|||
|
Purchases of available for sale securities
|
(9,431
|
)
|
(9,034
|
)
|
|||
|
Purchases of derivatives
|
(2,146
|
)
|
—
|
|
|||
|
Purchases of real estate
|
(21,373
|
)
|
—
|
|
|||
|
Purchases of loans
|
(34,802
|
)
|
—
|
|
|||
|
Purchases of fixed assets
|
(13
|
)
|
—
|
|
|||
|
Investment in partially-owned entities
|
(1,519
|
)
|
(4,700
|
)
|
|||
|
Proceeds from principal paydowns of trading securities
|
—
|
|
336
|
|
|||
|
Proceeds from sales of real estate
|
44,038
|
|
—
|
|
|||
|
Increase in restricted cash
|
(5,646
|
)
|
(20,749
|
)
|
|||
|
Acquisitions, net cash
|
(7,232
|
)
|
(116,926
|
)
|
|||
50
TIPTREE FINANCIAL INC.
AND SUBSIDIARIES
AND SUBSIDIARIES
Consolidated Statement of Cash Flows
(in thousands)
|
Proceeds from short U.S. Treasuries
|
—
|
|
19,942
|
|
|||
|
Proceeds from loan repayments
|
9,305
|
|
300
|
|
|||
|
Proceeds from sales of trading securities
|
75,147
|
|
47,795
|
|
|||
|
Proceeds from foreign exchange
|
45
|
|
—
|
|
|||
|
Proceeds from sales of available for sale securities
|
6,812
|
|
12,794
|
|
|||
|
Proceeds from maturities of available for sale securities
|
520
|
|
850
|
|
|||
|
Proceeds from distributions paid by partially owned entities
|
2,706
|
|
5,305
|
|
|||
|
Increase in policy loans
|
(3,023
|
)
|
(8,758
|
)
|
|||
|
Margin posted for foreign exchange trade
|
—
|
|
77
|
|
|||
|
Change due to consolidation of trusts
|
(59
|
)
|
—
|
|
|||
|
Investing activities from VIEs
|
(537,873
|
)
|
(3,226
|
)
|
|||
|
Net cash used in investing activities
|
(689,182
|
)
|
(144,214
|
)
|
|||
|
Cash flows from financing activities:
|
|||||||
|
Capital distributions paid by subsidiaries
|
(2,557
|
)
|
(2,566
|
)
|
|||
|
Dividends paid
|
(366
|
)
|
(555
|
)
|
|||
|
Distribution payable to Tricadia
|
—
|
|
(17,829
|
)
|
|||
|
Proceeds from loan
|
188,586
|
|
118,180
|
|
|||
|
Principal payments under mortgage notes payable
|
(1,071
|
)
|
—
|
|
|||
|
Partial paydown of loan
|
(9,402
|
)
|
(18,461
|
)
|
|||
|
Repurchase of common stock of subsidiary
|
(2
|
)
|
(72
|
)
|
|||
|
Payment of placement costs
|
(38
|
)
|
(525
|
)
|
|||
|
Proceeds from issuance of common units of subsidiaries
|
3,743
|
|
25,000
|
|
|||
|
Proceeds from borrowings
|
15,975
|
|
—
|
|
|||
|
Other
|
(267
|
)
|
(147
|
)
|
|||
|
Financing activities from VIEs
|
544,961
|
|
(3,943
|
)
|
|||
|
Net cash provided by financing activities
|
739,562
|
|
|
99,082
|
|
||
|
Net increase in cash
|
31,994
|
|
(8,446
|
)
|
|||
|
Cash and cash equivalents – unrestricted – beginning of period
|
88,563
|
|
97,009
|
|
|||
|
Cash and cash equivalents – unrestricted – end of period
|
$
|
120,557
|
|
$
|
88,563
|
|
|
|
Supplemental disclosure of cash flow information:
|
|||||||
|
Cash paid for interest
|
$
|
19,965
|
|
$
|
16,914
|
|
|
|
Cash paid for taxes
|
7,725
|
|
1,288
|
|
|||
|
Noncash investing and financing activities:
|
|||||||
|
Capital change due to equity compensation
|
$
|
96
|
|
$
|
517
|
|
|
|
Net assets related to acquisitions
|
(17,318
|
)
|
—
|
|
|||
|
Net liabilities extinguished by sale
|
$
|
(79,117
|
)
|
$
|
—
|
|
|
See accompanying notes to consolidated financial statements.
51
TIPTREE FINANCIAL INC.
AND SUBSIDIARIES
AND SUBSIDIARIES
Notes to Consolidated Financial Statements
(in thousands, except shares and per share data)
December 31, 2013
Basis of Presentation
(1)
Organization
Tiptree Financial Inc. (Tiptree and, together with its consolidated subsidiaries, collectively, the Company) is a Maryland Corporation that was incorporated on March 19, 2007. Until July 1, 2013, Tiptree operated under the name Care Investment Trust Inc. (which, for the period prior to July 1, 2013, we refer to as Care Inc.). Tiptree is a diversified holding company which conducts its operations through its Operating Company, Tiptree Operating Company, LLC (Operating Company). Tiptree’s primary focus is on
four
sectors: insurance and insurance services, specialty finance (including corporate, consumer and tax-exempt credit), asset management and real estate.
Tiptree’s Class A Common Stock is traded on the NASDAQ Capital Market under the symbol “TIPT.”
Contribution Transactions
On July 1, 2013, Care Inc. completed a transaction with Tiptree Financial Partners, L.P. (TFP) in which Care Inc. contributed substantially all of its assets to Operating Company in exchange for common units in Operating Company representing an approximately
25%
interest in Operating Company, and TFP contributed substantially all of its assets (excluding shares of Tiptree’s Class A Common Stock owned by TFP) to Operating Company in exchange for common units in Operating Company representing an approximately
75%
interest in Operating Company and the same number of shares of Tiptree’s newly classified Class B Common Stock (Contribution Transactions).
The Contribution Transactions were accounted for as a combination of entities under common control. As a result, the comparative financial information has been retrospectively adjusted to furnish comparative combined financial information from August 2010 (the date of common control). The application of this “as-if pooling of interests” required the previously issued consolidated financial statements of Tiptree to be recast to reflect such activity.
On July 1, 2013, immediately prior to closing the Contribution Transactions, Care Inc. filed the Fourth Articles of Amendment and Restatement with the Maryland Department of Assessments and Taxation in order to, among other things, (i) change its name from “Care Investment Trust Inc.” to “Tiptree Financial Inc.,” (ii) rename its common stock as “Class A common stock,” with no change to the economic or voting rights of such stock, (iii) reclassify
50,000,000
authorized and unissued shares of its common stock as Class B common stock, and (iv) remove certain provisions related to Care Inc.’s qualification as a real estate investment trust (REIT).
Pursuant to Operating Company’s limited liability operating agreement, at any time after July 1, 2014, TFP will have the right to redeem common units of Operating Company held by it for an equal number of shares of Class A common stock of Tiptree (and an equal number of shares of Class B common stock held by TFP will be canceled). Tiptree may instead, at its election, deliver a cash amount (or combination of cash and Class A common stock) based on the fair market value of the Class A common stock on the redemption date.
As a result of the Contribution Transactions, Tiptree does not qualify to be taxed as a REIT for Federal income tax purposes and became a taxable corporation effective January 1, 2013 due to the nature of the assets and the businesses contributed by TFP. As a REIT, Care Inc. was generally not subject to U.S. federal corporate income tax on its taxable income distributed to stockholders. However, even as a REIT, Care Inc. was subject to U.S. federal income and excise taxes in various situations, such as on Care Inc.’s undistributed income. See Note 13 for a discussion of income taxes.
Acquisition of businesses
The following discussion summarizes the acquisition of businesses by TFP that were contributed to Operating Company as part of the Contribution Transactions on July 1, 2013. As explained in Note 1, due to the Contribution Transactions, comparative financial information has been retrospectively adjusted to furnish comparative combined financial information from August 2010 (the date of common control). The application of this “as-if pooling of interests” required the previously issued consolidated financial statements of Tiptree to be recast to reflect such activity. As a result, any capital transaction activity of TFP related to these acquisitions, such as any increases or decreases in noncontrolling interest, was retroactively
52
TIPTREE FINANCIAL INC.
AND SUBSIDIARIES
AND SUBSIDIARIES
Notes to Consolidated Financial Statements
(in thousands, except shares and per share data)
December 31, 2013
adjusted as an adjustment to Tiptree’s additional paid-in capital. Also, the results of operations of each of the acquisitions that have occurred after August 2010 are included in the consolidated financial statements from the date of acquisition.
TAMCO
On June 30, 2012, TFP acquired a controlling financial interest in Tiptree Asset Management Company, LLC (TAMCO) from Tricadia Holdings, L.P. (Tricadia) which managed the assets of the subsidiaries of TFP as well as other entities such as collateralized loan obligations (CLOs) and trusts. Given Tricadia’s controlling position in relation to both TAMCO and TFP, this combination was accounted for as a combination of entities under common control. As a result, the assets and liabilities of TAMCO, including the CLOs, have been presented as if they had been consolidated by TFP as of January 1, 2010 and their results of operations included in the TFP’s results of operations going forward. The application of this “as-if pooling of interests” required the previously issued consolidated financial statements of TFP to be recast to reflect such activity. In conjunction with this combination, TFP issued
2,197,347
common units and
750,000
warrants, collectively valued at
$57,661
, to Tricadia in return for a
99%
controlling interest in TAMCO. TFP then contributed its interests in TAMCO to the Operating Company in connection with the Contribution Transactions.
The acquisition of controlling interests in each of TFP’s businesses discussed below were accounted for under the purchase method of accounting. The purchase price allocations were based on estimates of fair values of the assets acquired and liabilities assumed at the acquisition date. The fair values of the acquired net assets were determined using observable and unobservable information.
MFCA
In February 2009, TFP acquired a controlling financial interest (approximately
57%
) of the outstanding limited liability company interests of Muni Funding Company of America, LLC (MFCA), a specialty finance holding company that invests directly and indirectly in U.S. federally tax exempt bonds. As of December 31, 2009, TFP had increased its ownership to approximately
75%
of the outstanding limited liability company interests of MFCA as a result of a tender and rights offering. In June 2011, TFP acquired
100%
of the outstanding limited liability company interests of MFCA as a result of a tender offer and merger.
Philadelphia Financial Group, Inc.
On June 23, 2010, TFP acquired all of the outstanding Common Shares of Philadelphia Financial Group, Inc. (PFGI) (formerly known as PFG Holdings, Inc.) and its subsidiaries (collectively, PFG), a provider of private placement life insurance. TFP paid
$28,500
for a
100%
controlling financial interest.
In 2010 and 2011, PFG recapitalized and issued additional equity reducing TFP’s ownership percentage from
100%
to approximately
93.58%
.
On July 13, 2012, Philadelphia Financial Administration Services Company, LLC (PFASC), a newly formed entity capitalized by TFP and PFGI, purchased certain assets of Hartford Life Private Placement, LLC (HLPP) from affiliates of The Hartford Financial Services Group, Inc. (The Hartford) for a purchase price of
$117,500
. PFASC and certain insurance subsidiaries of The Hartford entered into a long-term servicing agreement whereby PFASC administers approximately
$35.0
billion in company owned life insurance (COLI) and bank owned life insurance (BOLI) business previously serviced by HLPP in exchange for a fee. We refer to this transaction as the PFAS Transaction.
Funding for the acquisition was provided in the form of equity of
$23,500
and debt of
$100,000
issued by PFAS. During the measurement period for this acquisition, the total purchase price was adjusted to
$116,000
.
Siena
In April 2013, the Company committed
$10,000
to purchase a majority of the voting equity interests of Siena Capital Finance LLC (Siena). As of June 30, 2013,
$7,310
of the commitment had been funded. This transaction resulted in a
59.38%
controlling interest in Siena and generated
$1,155
in goodwill, which was recorded on the Company’s consolidated balance sheet. On July 24, 2013, the Company funded the remaining commitment amount
$2,690
, which increased its controlling interest to
66.67%
. On October 1, 2013, another investor made a capital commitment to Siena, which decreased the Company’s controlling interest to
62.00%
as of December 31, 2013.
53
TIPTREE FINANCIAL INC.
AND SUBSIDIARIES
AND SUBSIDIARIES
Notes to Consolidated Financial Statements
(in thousands, except shares and per share data)
December 31, 2013
(2)
Summary of Significant Accounting Policies
(a)
Basis of Presentation
The accompanying consolidated financial statements of the Company are prepared in accordance with U.S. generally accepted accounting principles (GAAP). The consolidated financial statements are presented in U.S. dollars, the main operating currency of the Company. The consolidated financial statements prepared under GAAP for all periods presented include retroactive adjustments to comparative periods to reflect the combinations under common control described in Note 1 related to TAMCO and the Contribution Transactions.
(b)
Principles of Consolidation
The consolidated financial statements reflect the consolidated accounts of Tiptree and (i) its wholly-owned subsidiaries, (ii) subsidiaries in which it has a controlling interest, and (iii) certain other entities known as variable interest entities (VIEs) in which Tiptree, through its subsidiaries, is deemed to be the primary beneficiary. All significant intercompany accounts and transactions have been eliminated in the consolidated financial statements. This consolidation, particularly with respect to the VIEs, significantly impacts these consolidated financial statements.
(c)
Variable Interest Entities
Accounting Standards Codification (ASC) Topic 810, Consolidation requires the consolidation of a VIE into the financial statements of the entity that is considered the VIE’s primary beneficiary. ASC Topic 810 provides a framework for determining whether an entity should be considered a VIE and accordingly evaluated for consolidation. If an entity is a VIE, it would then need to be determined whether Tiptree’s relationship, direct or indirect through subsidiaries, to the VIE (whether contractual, through direct investments in the entity, or otherwise) results in a variable interest. If Tiptree does have a variable interest in the entity, it would then need to be determined whether Tiptree is deemed to be the primary beneficiary. For VIEs, if Tiptree is deemed to (i) have the power to direct the activities of the VIE that most significantly impact the economic performance and (ii) either the obligation to absorb losses or the right to receive benefits that could potentially be significant to the VIE, then Tiptree would be deemed to be the primary beneficiary and would be required to consolidate. Generally, TAMCO’s contractual relationship as collateral manager of the CLOs described herein satisfies criteria (i) of the prior sentence, and its ownership interests in and/or ability to earn certain incentive or other management fees in certain CLOs can typically satisfy criteria (ii). As a result, TAMCO has been deemed the primary beneficiary of the CLOs that it manages.
The consolidation of the CLOs upon acquisition of TAMCO (see Note 1) required the initial recognition of the assets and liabilities at fair value. Since the assets are solely for the benefit of the beneficial interest holders (liability holders) and no residual value from their liquidation is available to TAMCO, the difference between the fair value of the assets of the CLOs and its liabilities upon consolidation have been reflected as appropriated retained earnings. Given the nature and activity of the CLOs, TAMCO has applied the investment company accounting guidance to the CLOs’ financial statements and as such, recognizes changes in fair value of the assets of the CLOs and accreted the fair value adjustment to the liabilities of the CLOs (recorded upon consolidation) in the consolidated statements of operations. A portion of the results of operations of the CLOs are reflected as net income (loss) attributable to the VIE subordinated noteholders and as an adjustment to the appropriated retained earnings as that pertains to the amount of subordinated interests of the CLOs not held by Tiptree.
Tiptree has an approximate
25%
ownership interest in Operating Company as of December 31, 2013. Based on the VIE guidance in ASC Topic 810, Operating Company has been determined to be a VIE and Tiptree has been determined to be the primary beneficiary of Operating Company. TFP’s approximate
75%
non-controlling interest in Operating Company is reflected as such in the consolidated balance sheet and statement of operations.
(d)
Use of Estimates
The preparation of consolidated financial statements in conformity with GAAP requires management to make estimates and assumptions that affect the amounts reported in the Company’s consolidated financial statements and accompanying notes. The estimates and assumptions most susceptible to change are the valuation of securities, loans, separate account
54
TIPTREE FINANCIAL INC.
AND SUBSIDIARIES
AND SUBSIDIARIES
Notes to Consolidated Financial Statements
(in thousands, except shares and per share data)
December 31, 2013
assets, derivative positions, deferred income taxes and acquired assets and liabilities. Although these and other estimates and assumptions are based on the best available estimates, actual results could differ materially from management’s estimates.
(e)
New accounting pronouncements
In June 2013, the Financial Accounting Standards Board (FASB) issued Accounting Standards Update (ASU) No. 2013-08, Financial Services-Investment Companies (ASC Topic 946): Amendments to the Scope, Measurement, and Disclosure Requirements. This ASU introduces a new approach for assessing whether an entity is an investment company. To determine whether an entity is an investment company for accounting purposes, Tiptree will now be required to evaluate the fundamental and typical characteristics of the entity including its purpose and design. The amendments in the ASU will be effective for Tiptree in the first quarter of 2014. Earlier application is prohibited. The Company has completed its analysis of ASU No. 2013-08 and believes that adoption of this standard will not have a material effect on the Company’s consolidated financial statements.
In July 2013, the FASB issued ASU 2013-11, Income Taxes (ASC Topic 740): Presentation of an Unrecognized Tax Benefit When a Net Operating Loss Carryforward, a Similar Tax Loss, or a Tax Credit Carryforward Exists (a consensus of the FASB Emerging Issues Task Force) (ASU 2013-11), which provides that a liability related to an unrecognized tax benefit would be offset against a deferred tax asset for a net operating loss carryforward, a similar tax loss or a tax credit carryforward if such settlement is required or expected in the event the uncertain tax position is disallowed. In situations in which a net operating loss carryforward, a similar tax loss or a tax credit carryforward is not available at the reporting date under the tax law of the jurisdiction or the tax law of the jurisdiction does not require, and the entity does not intend to use, the deferred tax asset for such purpose, the unrecognized tax benefit will be presented in the financial statements as a liability and will not be combined with deferred tax assets. The amendments should be applied prospectively to all unrecognized tax benefits that exist at the effective date. Retrospective application is permitted. ASU 2013-11 will be effective for the Company beginning in the first quarter of fiscal 2014. The Company has completed its analysis of ASU 2013-11 and believes that adoption of this standard will not have a material effect on the Company’s consolidated financial statements.
(f)
Cash and Cash Equivalents
The Company considers all highly liquid investments of sufficient credit quality with maturities of three months or less to be cash equivalents. Cash and cash equivalents consist of U.S. denominated cash on hand, cash held in banks and investments in money market funds. The Company’s restricted cash primarily consists of cash held by its consolidated CLOs as well as cash that is collateral for any U.S. Treasury short positions held. The cash held by CLOs is restricted for use by the individual CLOs and cannot be distributed to the Company.
(g)
Fair Value Measurement
ASC Topic 820, Fair Value Measurements and Disclosures, defines fair value, describes the framework for measuring fair value, and addresses fair value measurement disclosures. Fair value is defined as the price that would be received to sell an asset or paid to transfer a liability in an orderly transaction between market participants at the measurement date.
ASC Topic 820 establishes a three‑level valuation hierarchy for disclosure of fair value measurements. The valuation hierarchy is based upon the transparency of inputs to the valuation of an asset or liability as of the measurement date. The three levels, from highest to lowest, are defined as follows:
|
•
|
Level 1 – Unadjusted, quoted prices in active markets for identical assets or liabilities that the Company has the ability to access at the measurement date.
|
|
•
|
Level 2 – Significant inputs other than quoted prices that are observable for the asset or liability, either directly or indirectly through corroboration with observable market data. Level 2 inputs include quoted prices for similar instruments in active markets, and inputs other than quoted prices that are observable for the asset or liability.
|
The types of financial assets and liabilities carried at level 2 are valued based on one or more of the following:
55
TIPTREE FINANCIAL INC.
AND SUBSIDIARIES
AND SUBSIDIARIES
Notes to Consolidated Financial Statements
(in thousands, except shares and per share data)
December 31, 2013
|
a)
|
Quoted prices for similar assets or liabilities in active markets;
|
|
b)
|
Quoted prices for identical or similar assets or liabilities in nonactive markets;
|
|
c)
|
Pricing models whose inputs are observable for substantially the full term of the asset or liability;
|
|
d)
|
Pricing models whose inputs are derived principally from or corroborated by observable market data through correlation or other means for substantially the full term of the asset or liability.
|
|
•
|
Level 3 – Significant inputs that are unobservable inputs for the asset or liability, including the Company’s own data and assumptions that are used in pricing the asset or liability.
|
The availability of observable inputs can vary depending on the financial asset or liability and is affected by a wide variety of factors, including, for example, the type of product, whether the product is new, whether the product is traded on an active exchange or in the secondary market, and the current market conditions. To the extent that valuation is based on models or inputs that are less observable or unobservable in the market, the determination of fair value requires more judgment. Accordingly, the degree of judgment exercised by the Company in determining fair value is greatest for instruments categorized within Level 3 of the fair value hierarchy. In certain cases, the inputs used to measure fair value may fall into different levels of the fair value hierarchy. In such cases, for disclosure purposes, the level in the fair value hierarchy within which the fair value measurement in its entirety falls is determined based on the lowest level input that is significant to the fair value measurement in its entirety. The Company’s assessment of the significance of a particular input to the fair value measurement in its entirety requires judgment and the consideration of factors specific to the asset. From time to time, the Company’s assets and liabilities will transfer between one level to another level. It is the Company’s policy to recognize transfers between different levels at the end of each reporting period.
The following is a description of the valuation methodologies used for financial assets and liabilities measured at fair value, as well as the general classification of such assets and liabilities pursuant to the valuation hierarchy. The Company’s fair value measurement is based on a market approach, which utilizes prices and other relevant information generated by market transactions involving identical or comparable financial instruments. Sources of inputs to the market approach include third-party pricing services, independent broker quotations or pricing matrices. Management analyzes the third party valuation methodologies and its related inputs to perform assessments to determine the appropriate level within the fair value hierarchy and to assess reliability of values. Further, management has a process in place to review all changes in fair value from measurement period to measurement period. Any discrepancies or unusual observations are followed through to resolution through the source of the pricing as well as utilizing comparisons, if applicable, to alternate pricing sources.
The Company utilizes observable and unobservable inputs within its valuation methodologies. Observable inputs include benchmark yields, reported trades, broker-dealer quotes, issuer spreads, benchmark securities, bids, offers and reference data. In addition, specific issuer information and other market data is used. For broker quotes, quotes are obtained from sources recognized to be market participants. Unobservable inputs may include: expected cash flow streams, default rates, supply and demand considerations and market volatility.
Trading Investments:
Trading investments consist primarily of privately held equity securities, exchange-traded equity securities, U.S. Treasury securities (USTs), CLOs, collateralized debt obligations (CDOs), loans, derivative assets and tax exempt securities. The fair value of privately held equity securities are either based on quotes obtained from dealers or internally developed valuation models. Because significant inputs used to determine the dealer quotes or model values are not observable, such as projected future earnings and price volatility, the Company has classified them within Level 3 of the fair value hierarchy.
Exchange-traded equity securities are valued based on quoted prices from the exchange. These securities are actively traded and valuation adjustments are not applied. Accordingly, they are categorized in Level 1 of the fair value hierarchy. USTs are actively traded and valuation adjustments are not applied. They are categorized in Level 1 of the fair value hierarchy.
Positions in securitized products such as CLOs and CDOs are based on quotes obtained from dealers. When these quotes are based directly or indirectly on observable inputs such as quoted prices for similar assets exchanged in an active or inactive market, the Company has classified them within Level 2 of the fair value hierarchy. If these quotes are based on
56
TIPTREE FINANCIAL INC.
AND SUBSIDIARIES
AND SUBSIDIARIES
Notes to Consolidated Financial Statements
(in thousands, except shares and per share data)
December 31, 2013
valuation models using unobservable inputs such as expected future cash flows, default rates, supply and demand considerations, and market volatility, the Company has classified them within Level 3 of the fair value hierarchy.
The fair value of tax exempt securities is determined by obtaining quotes from independent pricing services. In most cases, quotes are obtained from two pricing services and the average of both quotes is used. The independent pricing services determine their quotes using observable inputs such as current interest rates, specific issuer information and other market data for such securities. Therefore, the estimate of fair value is subject to a high degree of variability based upon market conditions, the availability of issuer information and the assumptions made. The valuation inputs used to arrive at fair value for such debt obligations are generally classified within Level 2 or Level 3 of the fair value hierarchy.
Available for sale securities:
Available for sale securities consist primarily of obligations of states and political subdivisions, USTs, certificates of deposit, asset backed securities (ABSs), and corporate bonds. These securities will generally be classified within either Level 1 or Level 2 of the fair value hierarchy. The fair value of fixed maturity securities is based on estimated fair value obtained from an independent pricing service, where available. If listed prices or quotes are not available, fair value is based upon internally developed models that use primarily market‑based or independently sourced market parameters, including interest rate yield curves, option volatilities, and currency rates.
Derivatives
: Derivatives are comprised of credit default swaps (CDS), index credit default swaps (CDX) and interest rate swaps (IRS). The fair value of these instruments is based upon valuation pricing models, which represent what the Company would expect to receive or pay at the balance sheet date to exit the position. In general, the fair value of CDSs and CDXs are based on dealer quotes. Because significant inputs used to determine the dealer quotes are not observable, such as price volatility, the Company has classified them as Level 2. The fair value of IRS is based upon valuation pricing models, which represent what the Company would expect to pay at the balance sheet date if the contracts were exited. The fair value of IRS is determined by obtaining broker or counterparty quotes. Because there are observable inputs used to arrive at these quotes, the Company has classified IRS within Level 2 of the fair value hierarchy.
Separate Account Assets
: Separate account assets are primarily invested in alternative investments (which include investments in limited partnerships, private equity funds, hedge funds, and fund of funds), mutual funds, fixed maturity securities, and equity securities. The alternative investments are valued at estimated fair value with the assistance of the investment managers of the underlying alternative investments. Since the entities underlying these alternative investments are investment companies for accounting purposes, as a practical expedient, the Company utilizes the separate account’s proportionate interest in the fair value of the underlying net assets to determine the fair value of these investments. The fair value of the underlying net assets of each alternative investment is determined from financial information provided by the investment manager. These alternative investments are generally classified within Level 3 of the fair value hierarchy. Most hedge fund investments are classified as Level 3. However, some hedge fund investments with minimal liquidity restrictions such as no lockup period, redemption notification of 35 days or less, withdrawal frequency greater than annually, and withdrawal payouts within 30 days are classified within Level 2. Mutual funds and equity securities are exchange-traded and are valued based on quoted market prices from independent pricing services and are classified within Level 1 of the fair value hierarchy. U.S. Treasury securities are classified within Level 1 of the fair value hierarchy and all other fixed maturity securities are classified within Level 2.
Cash and Cash Equivalents – Unrestricted:
The carrying amounts of cash and cash equivalents - unrestricted are carried at cost which approximates fair value.
Cash and Cash Equivalents – Restricted:
The carrying amounts of cash and cash equivalents - restricted are carried at cost which approximates fair value.
Due from Brokers, Dealers, and Trustees and Due to Brokers, Dealers and Trustees:
The carrying amounts of these assets and liabilities approximate their fair value due to their relatively short‑term nature.
Loans Owned, at Amortized Cost:
The fair value of loans owned, at amortized cost is computed by discounting the expected future cash flows at market rates. Variable rate lines of credit outstanding are assumed to be at fair value.
57
TIPTREE FINANCIAL INC.
AND SUBSIDIARIES
AND SUBSIDIARIES
Notes to Consolidated Financial Statements
(in thousands, except shares and per share data)
December 31, 2013
Mortgage Notes Payable:
The fair value of notes payable is determined based on contractual cash flows discounted at market rates.
Notes Payable:
The fair value of notes payable is determined based on either dealer quotes or contractual cash flows discounted at market rates.
Policy Loans:
The fair value of policy loans is deemed to be the carrying value, which is unpaid principal and accrued interest. Policy loans are not marketable instruments and can only be satisfied by the policy owner for the value carried.
(h)
Investments
The Company records all security transactions on a trade‑date basis. Realized gains/(losses) are generally determined using the specific-identification method. ASC Topic 320, Investments – Debt and Equity Securities, requires the Company to classify its investment assets as trading, available for sale or held to maturity.
(i)
Trading Securities
Debt and equity securities and corporate bonds classified as trading securities are intended to be sold at any time and are recorded at fair value, with unrealized gains/(losses) included in the consolidated statement of operations.
(j)
Available for Sale Securities
Debt securities classified as available for sale are intended to be held for indefinite periods of time and include those debt securities that management may sell as part of its asset/liability management strategy or in response to changes in interest rates, resultant prepayment risk or other factors. Debt securities held as available for sale securities are recorded at fair value, with unrealized gains/(losses), net of related tax effects, excluded from earnings and reported as other comprehensive income.
Realized gains/(losses) on the sale of debt securities are calculated by the specific-identification method. The Company regularly conducts and documents periodic reviews of all securities with unrealized losses to evaluate whether the impairment is other-than-temporary. Under the guidance for debt securities, other-than-temporary impairment (OTTI) is recognized in earnings in the consolidated statement of operations for debt securities that the Company has an intent to sell or that it believes it is more likely than not that it will be required to sell prior to recovery of the amortized cost basis. For those securities that the Company does not intend to sell nor expect to be required to sell, credit-related impairment is recognized in earnings, with the non-credit-related impairment recorded in accumulated other comprehensive income (AOCI). An unrealized loss exists when the current fair value of an individual security is less than its amortized cost basis. Unrealized losses that are determined to be temporary in nature are recorded, net of tax, in AOCI for AFS securities.
Management’s estimate of OTTI includes, among other things: (i) the duration of time and the relative magnitude to which fair value of the security has been below cost; (ii) the financial condition and near‑term prospects of the issuer of the investment; (iii) extraordinary events, including negative news releases and rating agency downgrades, with respect to the issuer of the investment; (iv) the Company’s ability and intent to hold an equity security for a period of time sufficient to allow for any anticipated recovery; (v) whether it is more likely than not that the Company will sell a security before recovery of its amortized cost basis; (vi) whether a debt security exhibits cash flow deterioration; (vii) whether the decline is attributable to specific conditions, such as conditions in an industry or in a geographic location.
(k)
Investments in Loans
The CLOs managed by the Company contain a diversified portfolio of middle market leveraged loans carried at estimated fair value. In general, the fair value of leveraged loans are obtained from an independent pricing service which provides secondary coverage of market participants. The values represent a composite of mark-to-market bid/offer prices and are classified as Level 2. In certain instances the Company will make its own determination of fair value of leveraged loans based on internal models and other unobservable inputs and the Company classified these leveraged loans as Level 3. The changes in fair values of investments in loans are reported in the consolidated statement of operations.
58
TIPTREE FINANCIAL INC.
AND SUBSIDIARIES
AND SUBSIDIARIES
Notes to Consolidated Financial Statements
(in thousands, except shares and per share data)
December 31, 2013
Certain loans held for investment are held at amortized cost. The Company periodically reviews these loans for impairment. Impairment losses are taken for impaired loans based on the fair value of collateral on an individual loan basis for those loans held by Care Investment Trust LLC (Care LLC). When it is probable that the Company will be unable to collect all amounts contractually due, the loan would be considered impaired.
For asset backed loans held by Siena, impairment is recorded when the Company determines that it is probable that principal will not be collected in full.
The allowance for loan losses is a valuation allowance for probable incurred credit losses. Loan losses are charged against the allowance when the Company believes the uncollectibility of a loan balance is confirmed. Management reviews its methodology for its calculation of its loss provision as deemed necessary which is at least on an annual basis.
Interest income is generally recognized using the effective interest method or on a basis approximating a level rate of return over the term of the loan. Nonaccrual loans are those on which the accrual of interest has been suspended. Loans are placed on nonaccrual status and considered nonperforming when full payment of principal and interest is in doubt, or when principal or interest is 90 days or more past due and collateral, if any, is insufficient to cover principal and interest. Interest accrued but not collected at the date a loan is placed on nonaccrual status is reversed against interest income. In addition, the amortization of net deferred loan fees is suspended. Interest income on nonaccrual loans may be recognized only to the extent it is received in cash. However, where there is doubt regarding the ultimate collectability of loan principal, cash receipts on such nonaccrual loans are applied to reduce the carrying value of such loans. Nonaccrual loans may be returned to accrual status when repayment is reasonably assured and there has been demonstrated performance under the terms of the loan or, if applicable, the restructured terms of such loan. The Company did not have any loans on nonaccrual status as of December 31, 2013 or 2012.
The Company defers nonrefundable loan origination and commitment fees collected on originated loans and amortizes the net amount as an adjustment of the yield over the estimated life of the loan. If a loan is prepaid, the net deferred amount is recognized in the consolidated statement of operations at that time. Interest and fees on loans include prepayments fees and late charges collected.
(l)
Derivative Financial Instruments
The Company recognizes all derivatives on the consolidated balance sheets at fair value. The Company has not designated any derivative transactions as accounting hedges, and consequently, has not applied hedge accounting treatment. The changes in the fair values of the derivative financial instruments are reported in the consolidated statement of operations.
(m)
Real Estate
Real estate is carried at cost, net of accumulated depreciation and amortization. Betterments, major renewals and certain costs directly related to the acquisition, improvement and leasing of real estate are capitalized. Maintenance and repairs are charged to operations as incurred. Depreciation is provided on a straight‑line basis over the assets’ estimated useful lives which range from
9
to
40
years.
Upon the acquisition of real estate, management will assess the fair value of acquired assets (including land, buildings and improvements, and identified intangible assets such as above and below market leases and acquired in‑place leases and customer relationships) and acquired liabilities and then allocate purchase price based on these assessments. Management assesses fair value based on estimated cash flow projections that utilize appropriate discount and capitalization rates and available market information. In estimating carrying costs, the Company includes estimates of lost rents at estimated market rates during the hypothetical expected lease-up periods, which are dependent on local market conditions and expected trends.
Real estate properties are reviewed for impairment whenever events or changes in circumstances indicate that the carrying amount of the assets may not be recoverable in accordance with ASC 360, Impairment or Disposal of Long-Lived Assets. If such reviews indicate that the asset is impaired, the asset’s carrying amount is written down to its fair value. An impairment loss is measured based on the excess of the carrying amount over the fair value. The fair value is determined by using a
59
TIPTREE FINANCIAL INC.
AND SUBSIDIARIES
AND SUBSIDIARIES
Notes to Consolidated Financial Statements
(in thousands, except shares and per share data)
December 31, 2013
discounted cash flow model and appropriate discount and capitalization rates. The evaluation of anticipated cash flows is subjective and is based, in part, on assumptions regarding future occupancy, rental rates, and capital requirements that could differ materially from actual results. If anticipated holdings periods change or estimated cash flows decline based on market conditions or otherwise, an impairment loss may be recognized. Long-lived assets to be disposed of are recorded at the lower of carrying value or fair value less estimated costs to sell. There were no material impairments on our wholly-owned real estate investments for the years ended December 31, 2013 and 2012.
(n)
Goodwill and Identifiable Intangible Assets
The Company initially records all assets and liabilities acquired in purchase acquisitions, including goodwill, indefinite lived intangibles and other intangibles, in accordance with ASC 805 Business Combinations. Goodwill, indefinite-lived intangibles and other intangibles are subsequently accounted for in accordance with ASC 350 Intangibles-Goodwill and Other and ASC 360 Impairment or Disposal of Long-Lived Assets. The initial measurement of goodwill and intangibles requires judgment concerning estimates of the fair value of the acquired assets and liabilities. Goodwill (
$4,294
at December 31, 2013) and indefinite-lived intangible assets (
$2,518
at December 31, 2013) are not amortized but subject to tests for impairment annually or if events or circumstances indicate it is more likely than not they may be impaired. Other intangible assets are amortized over their estimated useful lives and are subject to impairment if events or circumstances indicate a possible inability to realize the carrying amount.
Tiptree has two segments of its business which contain goodwill and for which annual goodwill impairment testing is done at a reporting unit level in accordance with ASC 350. These segments are insurance for PFG’s acquisition of The Hartford and specialty finance for its acquisition of Siena. The goodwill impairment testing is performed in two steps. The first step compares the estimated fair value of the reporting unit with its carrying amount, including goodwill. If the estimated fair value of the reporting unit exceeds its carrying amount, goodwill of the reporting unit is considered not impaired. However, if the carrying amount of the reporting unit were to exceed its estimated fair value, a second step would be performed that would compare the implied fair value of the reporting unit’s goodwill with the carrying amount of that goodwill. An impairment loss would be recorded to the extent that the carrying amount exceeds the implied fair value of the reporting unit’s goodwill. A substantial goodwill impairment charge would not have a significant impact on our financial condition, but could have an adverse impact on our results of operations.
GAAP also requires that an interim test be done whenever events or circumstances occur that may indicate that it is more likely than not that the fair value of any reporting unit might be less than its carrying value. No such events or circumstances have occurred during 2013.
Key judgments in accounting for intangibles include useful life and classification between goodwill and indefinite-lived intangibles or other intangibles requiring amortization. Indefinite-lived intangible assets are evaluated for impairment at least annually by comparing their fair values, estimated using discounted cash flow analyses, to their carrying values. Other amortizing intangible assets ($
152,177
at December 31, 2013) are evaluated for impairment if events and circumstances indicate a possible impairment. Such evaluation of other intangible assets is initially based on undiscounted cash flow projections.
The Company carries intangible assets, which represent insurance licensing agreements, insurance servicing agreement, software licenses, leases in place and insurance policies and contracts acquired. Management has deemed the insurance licensing agreements to have indefinite useful life and performs impairment tests on these assets at least annually. The Company recorded an intangible asset related to administration servicing rights acquired in connection with the acquisition of Hartford Life Private Placement LLC. This intangible asset is being amortized in relation to expected gross profits over the life of the serving rights.
In-place lease values are based upon the Company’s evaluation of the specific characteristics of each property acquired and the respective tenant’s lease. Factors considered include estimates of carrying costs during hypothetical expected lease-up periods and market conditions. In estimating carrying costs, the company includes estimates of lost rents at estimated market rates during the hypothetical expected lease-up periods, which are dependent upon local market conditions and expected trends.
60
TIPTREE FINANCIAL INC.
AND SUBSIDIARIES
AND SUBSIDIARIES
Notes to Consolidated Financial Statements
(in thousands, except shares and per share data)
December 31, 2013
Insurance policies and contracts acquired is an intangible asset held by a subsidiary of the Company which reflects the estimated fair value of insurance policies and contracts in force at the time the subsidiary was acquired by the Company. The amount represents the portion of the purchase price of the subsidiary that is allocated to the value of the right to received future cash flows from the policies and contracts. Insurance policies and contracts acquired is based on actuarially determined projections of premiums, future policy and contract charges, mortality, surrenders/withdrawals, separate account investment performance and operating expenses and is maintained by line of business. Actual experience may vary from these projections. The Company amortizes insurance policies and contracts acquired over the estimated lives of the policies and contracts in proportion to actual and estimated future gross profits. Each reporting period, the Company updates the estimated gross profits with actual gross profits for the period. In addition, assumptions are reviewed and updated as necessary. Cumulative amortization is recalculated and adjusted by a cumulative charge or credit to current earnings. Estimated gross profits are regularly reviewed to determine the recoverability of insurance policies and contracts acquired.
The Company tests intangible assets with finite lives for recoverability whenever events or changes in circumstances indicate that the carrying amount may not be recoverable in accordance with ASC 360, and the Company is required to evaluate whether the carrying amount of the amortizable intangible asset is recoverable. If the carrying amount is not recoverable, the Company tests the carrying amount for impairment. Any impairment loss recognized reduces the asset to its new cost basis. There have been no events or changes in circumstances that required an impairment test for amortizing intangible assets. There has been no impairment recognized on the intangible assets.
(o)
Investments in Partially-Owned Entities
The Company invests in real estate‑related equity interests that allow it to participate in a percentage of the underlying property’s cash flows from operations and proceeds from a sale or refinancing. At the inception of the investment, it must be determined whether such investment should be accounted for as a loan, joint venture or as real estate. For the periods ended December 31, 2013, and 2012, the Company held
three
, real estate‑related investments and accounted for such investments under the equity method.
The Company assesses whether there are indicators that the value of its partially-owned entities may be impaired. An investment’s value is impaired if management determines that a decline in the value of the investment below its carrying value is other than temporary. To the extent impairment has occurred, the loss shall be measured as the excess of the carrying amount of the investment over the estimated value of the investment. There were no material impairments on our investments in partially-owned entities for the years ended December 31, 2013 and December 31, 2012.
(p)
Deferred Policy Acquisition Costs
Policy acquisition costs for traditional life insurance products are generally deferred and amortized over the premium paying period of the policy. Deferred policy acquisition costs and policy initiation costs related to universal life and investment‑type products are amortized in relation to expected gross profits over the life of the policies.
(q)
Separate Accounts
Separate account assets and liabilities represent variable annuity and variable universal life contract funds invested primarily in private and public equity securities, fixed maturities and investment partnerships. The separate account assets and liabilities are reported at fair value in the consolidated financial statements.
The assets of the separate accounts are legally segregated and are not subject to the claims that arise out of any other business of the Company or its subsidiaries.
Investment income and investment gains and losses accrue directly to the policyholders and are not included in the results of operations of the Company. Premiums and deposits received and payments made on the policyholder’s accumulated account value are excluded from the amounts reported in the consolidated statement of operations.
(r)
Future Policy Benefits and Policyholder Deposits
61
TIPTREE FINANCIAL INC.
AND SUBSIDIARIES
AND SUBSIDIARIES
Notes to Consolidated Financial Statements
(in thousands, except shares and per share data)
December 31, 2013
Future policy benefit reserves are determined using the net level premium method, which provides for benefits based upon estimated future investment yield, expected mortality and estimated policy lapses. Interest rate assumptions range from
3.0%
to
6.0%
. Mortality has been calculated principally on an experience multiple applied to select and ultimate tables in common usage in the insurance industry. Estimated policy lapses have been determined principally based upon historical experience. Future policy benefit reserves for universal life policies consist of premiums received plus credited interest less accumulated policyholder assessments. These items are included in policy liabilities in the Company’s consolidated balance sheet.
(s)
Rental Revenue
Rental revenue from residential tenants are recognized on a contractual basis, as lease periods for residential tenants are short-term in nature. The Company recognizes rental revenue from triple net leases in accordance with ASC Topic 840, Leases (ASC 840). ASC 840 requires that revenue be recognized on a straight-line basis over the non-cancelable term of the lease unless another systematic and rational basis is more representative of the time pattern in which the use benefit is derived from the leased property. Renewal options in leases with rental terms that are higher than those in the primary term are excluded from the calculation of straight line rent if the renewals are not reasonably assured. The Company commences rental revenue recognition when the tenant takes control of the leased space. The Company recognizes lease termination payments as a component of rental revenue in the period received, provided that there are no further obligations under the lease. Amortization expense of above-market leases reduces rental revenue on a straight-line basis over the non-cancelable term of the lease. Taxes, insurance and reserves collected from tenants are separately shown as reimbursable income and corresponding payments are included in reimbursed property expenses included as components of other income and other expenses respectively in the consolidated statement of operations.
(t)
Earnings Per Share
The Company presents both basic and diluted earnings per common share in its consolidated financial statements and footnotes thereto. Basic earnings per common share (Basic EPS) excludes dilution and is computed by dividing net income or loss allocable to common stock holders by the weighted average number of common shares, including vested restricted share units, outstanding for the period. Diluted earnings per common share (Diluted EPS) reflects the potential dilution that could occur if securities or other contracts to issue common shares were exercised or converted into common shares where such exercise or conversion would result in a lower earnings per share amount.
The Company calculates EPS using the two‑class method, which is an earnings allocation formula that determines EPS for common shares and participating securities. Unvested share‑based payment awards that contain non-forfeitable rights to distributions or distribution equivalents (whether paid or unpaid) are participating securities and shall be included in the computation of EPS using the two‑class method. Accordingly, all earnings (distributed and undistributed) are allocated to common shares and participating securities based on their respective rights to receive distributions.
See Note 21 for EPS computations.
(u)
Stock Based Compensation
The Company accounts for equity‑based compensation issued to employees, nonemployees, directors, and affiliates of the Company using the current fair value based methodology.
The Company has determined that the measurement date for restricted shares and options awarded to nonemployees occurs when the restricted shares and options vest. The Company initially measures the cost of an award of restricted share units and options to nonemployees at the fair value of the restricted share units on the date awarded and subsequently measures the cost of the restricted shares and options at their fair value at each vesting and reporting date throughout the vesting period. The initial compensation cost and subsequent changes thereto are charged to expense over the vesting period with a corresponding credit to capital.
Compensation cost is recognized for stock options issued to employees, based on the fair value of these awards at the date of grant. A Black-Scholes model is utilized to estimate the fair value of stock options. Compensation cost is recognized
62
TIPTREE FINANCIAL INC.
AND SUBSIDIARIES
AND SUBSIDIARIES
Notes to Consolidated Financial Statements
(in thousands, except shares and per share data)
December 31, 2013
over the required service period, generally defined as the vesting period. There were no issuances of new stock option awards during either 2012 or 2013. The Company also issues restricted stock units as compensation to employees with the difference at grant date between the fair market value and the cost basis of the shares recorded as a reduction to retained earnings or an increase to additional paid-in capital, as applicable. The expense is amortized over the vesting period of the awards, generally three years.
(v)
Income Taxes
Deferred tax assets and liabilities are determined using the asset and liability method. Under this method, deferred tax assets and liabilities are established for future tax consequences of temporary differences between the financial statement carrying amounts of assets and liabilities and their tax basis. Deferred tax assets and liabilities are measured using enacted tax rates expected to apply to taxable income in the year in which those temporary differences are expected to reverse. A valuation allowance is established when necessary to reduce a deferred tax asset to the amount expected to be realized. The Company’s subsidiaries PFG, Siena Capital Finance Acquisition Corp., MFCA Funding and Tamco Manager, Inc. file both federal and state returns. These U.S. federal and state income tax returns, when filed, will be subject to examination by the Internal Revenue Service and state departments of revenue. See Note 13.
The Company evaluates tax positions taken or expected to be taken in the course of preparing its tax returns to determine whether the tax positions are “more likely than not” of being sustained by the applicable tax authority. The Company’s tax benefit or tax expense is adjusted accordingly for tax positions not deemed to meet the more likely than not threshold.
(w)
Administrative Fees Revenue and Expenses
The Company earns administrative fee revenue as a third party administrator for insurance contracts. The revenue is recorded as earned. The Company pays fees to a third party in conjunction with the administration of certain insurance contracts. The fees are recorded when incurred by the Company.
(x)
Premium and Fee Revenue and Related Expenses
Amounts assessed to the policyholders for mortality and expense charges, premium loads, charges for cost of insurance, and policy initiation fees are included in revenues. Death benefits and other benefits paid in excess of the policyholder’s accumulated account value are included in expenses. The Company recognizes premiums for life insurance products and other long‑duration life insurance products as revenue when due from policyholders. The Company matches benefits, losses and related expenses with premiums over the related contract periods. These amounts are recorded as a component of fees of separate accounts and mortality expense respectively on the Company’s condensed consolidated statements of operations.
(y)
Reclassifications
Certain prior period amounts have been reclassified to conform to the current year presentation.
(3)
CLOs and Consolidated Variable Interest Entities
The term CLO generally refers to a special purpose vehicle that owns a portfolio of investments and issues various tranches of debt and subordinated note securities to finance the purchase of those investments. The investment activities of a CLO are governed by extensive investment guidelines, generally contained within a CLO’s “indenture” and other governing documents which limit, among other things, the CLO’s exposure to any single industry or obligor and provide that the CLO’s assets satisfy certain ratings requirements. Most CLOs have a defined investment period during which they are allowed to make investments and reinvest capital as it becomes available.
Telos Asset Management LLC (Telos), a subsidiary of the Company acquired in 2012, is a CLO manager of
four
CLOs; namely Telos CLO 2013-4, Ltd. (Telos 4), Telos CLO 2013-3, Ltd. (Telos 3), Telos CLO 2007‑2, Ltd. (Telos 2) and Telos CLO 2006-1, Ltd. (Telos 1). Prior to the acquisition of TAMCO, the Company did not consolidate the then existing CLOs (Telos 1 and Telos 2) as it only held a residual interest which were recorded at fair value. The Company met the requirement
63
TIPTREE FINANCIAL INC.
AND SUBSIDIARIES
AND SUBSIDIARIES
Notes to Consolidated Financial Statements
(in thousands, except shares and per share data)
December 31, 2013
to consolidate when it acquired the management rights of the CLOs. The percentage ownerships of the CLOs as of December 31, 2013 are as follows: Telos 1 (
7.11%
), Telos 2 (
95.45%
), Telos 3 (
15.57%
) and Telos 4 (
71.08%
).
Subordinated debt obligations owned by TFI are not included in the tables below as these amounts are eliminated in consolidation.
The assets of each of the CLOs are held solely as collateral to satisfy the obligations of the CLOs. The Company does not own and has no right to the benefits from, nor does it bear the risks associated with, the assets held by the CLOs, beyond its direct investments in, and investment advisory fees generated from, the CLOs. If the Company were to liquidate, the assets of the CLOs would not be available to its general creditors, and as a result, the Company does not consider them assets available for the benefit of its investors. Additionally, the investors in the CLOs have no recourse to the Company’s general assets for the debt issued by the CLOs. Therefore, this debt is not the Company’s obligation. For this reason the difference between the fair value of the assets and liabilities at initial consolidation and subsequent results attributable to the VIE subordinated noteholders is reflected as appropriated retained earnings. As of December 31, 2013 and 2012, the Company’s maximum exposure to loss related to the CLOs is limited to its investment in the CLOs of
$38,459
and
$6,819
, respectively, as well as the management fees receivable of $
3,616
and $
3,089
as of December 31, 2013 and 2012, respectively. Both the carrying values of the CLOs and management fees receivable are eliminated upon consolidation.
On August 6, 2013, Telos entered into a new
$100,000
warehouse agreement with Telos 2013-5, Ltd. (Telos 5) that was amended on September 25, 2013 to increase the amount to
$140,000
. As of December 31, 2013,
$171,087
is carried as investments in loans at fair value and
$133,715
as loans payable on the consolidated balance sheet of TFI. The Company’s exposure in Telos 5 is limited to its equity investment of
$35,000
.
The table below represents the assets and liabilities of the consolidated CLOs that are included in the Company’s consolidated balance sheet as of the dates indicated:
|
Year Ended December 31,
|
|||||||
|
2013
|
2012
|
||||||
|
Assets:
|
|||||||
|
Restricted cash
|
$
|
67,604
|
|
$
|
75,105
|
|
|
|
Investment in loans
|
1,298,155
|
|
741,743
|
|
|||
|
Investment in trading securities
|
19,366
|
|
18,970
|
|
|||
|
Due from brokers
|
15,945
|
|
9,034
|
|
|||
|
Accrued interest receivable
|
4,108
|
|
6,660
|
|
|||
|
Deferred debt issuance costs
|
9,261
|
|
—
|
|
|||
|
Other assets
|
177
|
|
148
|
|
|||
|
Total assets
|
$
|
1,414,616
|
|
$
|
851,660
|
|
|
|
Liabilities:
|
|||||||
|
Notes payable
|
$
|
1,154,097
|
|
$
|
571,752
|
|
|
|
Due to brokers
|
11,479
|
|
43,396
|
|
|||
|
Accrued interest payable
|
9,745
|
|
4,858
|
|
|||
|
Other liabilities
|
285
|
|
304
|
|
|||
|
Total liabilities
|
$
|
1,175,606
|
|
$
|
620,310
|
|
|
64
TIPTREE FINANCIAL INC.
AND SUBSIDIARIES
AND SUBSIDIARIES
Notes to Consolidated Financial Statements
(in thousands, except shares and per share data)
December 31, 2013
The following table represents revenue and expenses of the consolidated CLOs included in the Company’s consolidated statements of operations for the periods indicated:
|
Year ended December 31,
|
|||||||
|
2013
|
2012
|
||||||
|
Income:
|
|||||||
|
Realized gain (loss) trading securities
|
$
|
—
|
|
$
|
3,158
|
|
|
|
Realized gain (loss) loans
|
(20,491
|
)
|
—
|
|
|||
|
Unrealized gain (loss) loans
|
311
|
|
9,638
|
|
|||
|
Interest income
|
72,867
|
|
56,949
|
|
|||
|
Other income
|
—
|
|
1,667
|
|
|||
|
Total income
|
$
|
52,687
|
|
$
|
71,412
|
|
|
|
Expenses:
|
|||||||
|
Interest expense
|
$
|
46,845
|
|
$
|
36,371
|
|
|
|
Other expense
|
1,423
|
|
1,512
|
|
|||
|
Total expense
|
$
|
48,268
|
|
$
|
37,883
|
|
|
The tables below summarize the debt obligations of the CLOs consolidated by the Company as of December 31, 2013 and 2012:
|
December 31, 2013
|
||||||||||||||
|
Aggregate
Principal amount
|
Spread over three Months LIBOR
|
Unamortized
Discount
|
Carrying Amount
|
|||||||||||
|
Description
|
||||||||||||||
|
Telos 4 (maturity July 2024)
|
||||||||||||||
|
Class A
|
$
|
214,000
|
|
1.30
|
%
|
$
|
962
|
|
$
|
213,038
|
|
|||
|
Class B
|
46,500
|
|
1.80
|
%
|
2,066
|
|
44,434
|
|
||||||
|
Class C
|
29,000
|
|
2.75
|
%
|
1,401
|
|
27,599
|
|
||||||
|
Class D
|
19,250
|
|
3.50
|
%
|
1,562
|
|
17,688
|
|
||||||
|
Class E
|
16,000
|
|
5.00
|
%
|
1,976
|
|
14,024
|
|
||||||
|
Class X
|
3,500
|
|
0.95
|
%
|
—
|
|
3,500
|
|
||||||
|
Subordinated
|
10,700
|
|
N/A
|
|
516
|
|
10,184
|
|
||||||
|
Telos 3 (maturity October 2024)
|
||||||||||||||
|
Class A
|
225,000
|
|
1.42
|
%
|
—
|
|
225,000
|
|
||||||
|
Class B
|
36,500
|
|
2.25
|
%
|
—
|
|
36,500
|
|
||||||
|
Class C
|
26,500
|
|
3.00
|
%
|
570
|
|
25,930
|
|
||||||
|
Class D
|
18,000
|
|
4.25
|
%
|
822
|
|
17,178
|
|
||||||
|
Class E
|
15,000
|
|
5.50
|
%
|
1,512
|
|
13,488
|
|
||||||
65
TIPTREE FINANCIAL INC.
AND SUBSIDIARIES
AND SUBSIDIARIES
Notes to Consolidated Financial Statements
(in thousands, except shares and per share data)
December 31, 2013
|
Class F
|
6,000
|
|
5.50
|
%
|
743
|
|
5,257
|
|
||||||
|
Subordinated
|
29,000
|
|
N/A
|
|
1,322
|
|
27,678
|
|
||||||
|
Telos 2 (maturity April 2022)
|
||||||||||||||
|
Class A-1
|
221,836
|
|
0.26
|
%
|
28,216
|
|
193,620
|
|
||||||
|
Class A-2
|
40,000
|
|
0.40
|
%
|
8,717
|
|
31,283
|
|
||||||
|
Class B
|
27,500
|
|
0.55
|
%
|
7,532
|
|
19,968
|
|
||||||
|
Class C
|
22,000
|
|
0.95
|
%
|
9,473
|
|
12,527
|
|
||||||
|
Class D
|
22,000
|
|
2.20
|
%
|
11,900
|
|
10,100
|
|
||||||
|
Class E
|
16,000
|
|
5.00
|
%
|
13,155
|
|
2,845
|
|
||||||
|
Subordinated
|
2,000
|
|
N/A
|
|
1,654
|
|
346
|
|
||||||
|
Telos 1 (maturity October 2021)
|
||||||||||||||
|
Class A-1D
|
39,270
|
|
0.27
|
%
|
4,867
|
|
34,403
|
|
||||||
|
Class A-1R
|
14,726
|
|
0.29
|
%
|
1,826
|
|
12,900
|
|
||||||
|
Class A-1T
|
53,996
|
|
0.27
|
%
|
6,693
|
|
47,303
|
|
||||||
|
Class A-2
|
60,000
|
|
0.40
|
%
|
12,781
|
|
47,219
|
|
||||||
|
Class B
|
27,200
|
|
0.49
|
%
|
7,277
|
|
19,923
|
|
||||||
|
Class C
|
22,000
|
|
0.85
|
%
|
9,261
|
|
12,739
|
|
||||||
|
Class D
|
22,000
|
|
1.70
|
%
|
11,548
|
|
10,452
|
|
||||||
|
Class E
|
16,000
|
|
4.25
|
%
|
12,861
|
|
3,139
|
|
||||||
|
Subordinated
|
40,223
|
|
N/A
|
|
26,391
|
|
13,832
|
|
||||||
|
$
|
1,341,701
|
|
$
|
187,604
|
|
$
|
1,154,097
|
|
||||||
66
TIPTREE FINANCIAL INC.
AND SUBSIDIARIES
AND SUBSIDIARIES
Notes to Consolidated Financial Statements
(in thousands, except shares and per share data)
December 31, 2013
|
December 31, 2012
|
||||||||||||||
|
Aggregate
Principal amount
|
Spread over three Months LIBOR
|
Unamortized
Discount
|
Carrying Amount
|
|||||||||||
|
Description
|
||||||||||||||
|
Telos 2 (maturity April 2022)
|
||||||||||||||
|
Class A-1
|
$
|
241,000
|
|
0.26
|
%
|
$
|
33,980
|
|
$
|
207,020
|
|
|||
|
Class A-2
|
40,000
|
|
0.40
|
%
|
9,592
|
|
30,408
|
|
||||||
|
Class B
|
27,500
|
|
0.55
|
%
|
8,248
|
|
19,252
|
|
||||||
|
Class C
|
22,000
|
|
0.95
|
%
|
10,223
|
|
11,777
|
|
||||||
|
Class D
|
22,000
|
|
2.20
|
%
|
12,633
|
|
9,367
|
|
||||||
|
Class E
|
16,000
|
|
5.00
|
%
|
13,340
|
|
2,660
|
|
||||||
|
Subordinated
|
2,000
|
|
N/A
|
|
1,719
|
|
281
|
|
||||||
|
Telos 1 (maturity October 2021)
|
||||||||||||||
|
Class A-1D
|
80,000
|
|
0.27
|
%
|
11,097
|
|
68,903
|
|
||||||
|
Class A-1R
|
30,000
|
|
0.29
|
%
|
4,163
|
|
25,837
|
|
||||||
|
Class A-1T
|
110,000
|
|
0.27
|
%
|
15,258
|
|
94,742
|
|
||||||
|
Class A-2
|
60,000
|
|
0.40
|
%
|
14,163
|
|
45,837
|
|
||||||
|
Class B
|
27,200
|
|
0.49
|
%
|
8,026
|
|
19,174
|
|
||||||
|
Class C
|
22,000
|
|
0.85
|
%
|
10,065
|
|
11,935
|
|
||||||
|
Class D
|
22,000
|
|
1.70
|
%
|
12,371
|
|
9,629
|
|
||||||
|
Class E
|
16,000
|
|
4.25
|
%
|
13,148
|
|
2,852
|
|
||||||
|
Subordinated
|
40,223
|
|
N/A
|
|
28,145
|
|
12,078
|
|
||||||
|
$
|
777,923
|
|
$
|
206,171
|
|
$
|
571,752
|
|
||||||
(4)
Operating segment data
The Company has
four
reportable operating segments. The Company’s operating segments are organized in a manner that reflects how management views these strategic business units. A description of each of the reportable segment is as follows:
•
Insurance and Insurance Services
operations are conducted by PFG, a majority owned subsidiary of Tiptree. PFG’s operating subsidiaries consist of Philadelphia Financial Life Assurance Company (PFLAC), Philadelphia Financial Life Assurance Company of New York (PFLACNY), Philadelphia Financial Distribution Company (PFDC), PFASC, and Philadelphia Financial Agency, Inc. (PFA). Philadelphia Financial’s principal insurance activity is the structuring, underwriting, marketing and administration of variable life insurance and variable annuity products to the high net worth market. Total separate account assets for policies written by PFG are
$4,625,099
. PFASC, acquired certain assets and administration rights from The Hartford on July 13, 2012. PFASC administers approximately
$35.0 billion
in COLI and BOLI policies for The Hartford.
•
Specialty Finance
activities are primarily conducted through the Company’s majority-controlled subsidiaries, MFCA and Siena. MFCA is a specialty finance company that owns and manages a portfolio of non-investment grade and non-rated direct and indirect debt obligations of middle-market tax-exempt borrowers. Siena’s business consists of structuring asset-based loan facilities across diversified industries which include manufacturing, distribution, wholesale, and service companies. In addition to MFCA and Siena, Tiptree’s other specialty finance investments include principal investment holdings of CLO subordinated notes and a structured corporate loan portfolio. Tiptree also holds a debt interest and a right
67
TIPTREE FINANCIAL INC.
AND SUBSIDIARIES
AND SUBSIDIARIES
Notes to Consolidated Financial Statements
(in thousands, except shares and per share data)
December 31, 2013
to receive a controlling equity interest in Luxury Mortgage Corp. (Luxury), a residential mortgage lender that originates conforming FHA, prime jumbo and super jumbo mortgages for sale to institutional investors.
•
Asset Management
activities are conducted through TAMCO, an SEC-registered investment advisor. TAMCO’s operating subsidiaries include: (1) Telos, an asset management company that specializes in investing in middle market corporate credit through managed accounts and structured investment vehicles, such as CLOs; (2) Muni Capital Management, LLC (MCM) which in addition to managing its own portfolio of tax-exempt securities, manages Non-Profit Preferred Funding Trust I (NPPF I), a structured tax-exempt pass-through entity that holds tax-exempt bonds for the benefit of unaffiliated investors; (3) Tiptree Capital Management, LLC, the manager of Operating Company; and (4) TREIT, a real estate focused service provider.
•
Real Estate
primarily relates to the activities of Care LLC, a wholly-owned subsidiary of Tiptree which has a geographically diverse portfolio of senior housing properties including assisted-living, independent-living, memory care, skilled nursing and other healthcare‑related services in the U.S. Care LLC operates the business operated by Care Inc. prior to the Contribution Transactions (and this business as operated by Care Inc. and Care LLC is collectively referred to as Care). In addition, Tiptree holds a
17%
interest in Star Asia Finance, Limited (SAF), a
27.59%
interest in Star Asia Opportunity, LLC (SAO) and a
50%
interest in Star Asia Opportunity II, LLC (SAO II). The Star Asia entities are all Tokyo based real estate holding companies formed to invest in Asian properties and real estate related debt instruments.
The tabular information that follows shows components of revenue, expense, and profit or loss, for each of the operating segments for the years ended December 31, 2013 and 2012 and total assets as of December 31, 2013 and 2012.
Revenue is derived from the main income components of each segment. For Insurance and Insurance Services, the main drivers of revenue are fees on separate account assets, and administration service fees. For Specialty Finance, the main sources of revenue are investment interest and realized and unrealized gains/losses on investment securities. For Asset Management, revenue is derived from management fees based on assets under management and, in some cases, incentive fees based on the profits generated. For Real Estate, revenue includes rental revenue and investment interest.
Intersegment revenues refers to those items of revenue which will be eliminated upon consolidation. Included in revenue, expense, interest revenue, interest expense, segment profit/(loss), and segment assets are items which are eliminated upon consolidation as well as adjustments for discontinued operations, reclassifications, assets of consolidated CLOs and non-controlling interest. These items are classified as corporate eliminations and other in the tables below.
Each reportable segment’s measure of profit (loss) is reported before income taxes and includes discontinued operations and non-controlling interest as this is how management views its segments.
68
TIPTREE FINANCIAL INC.
AND SUBSIDIARIES
AND SUBSIDIARIES
Notes to Consolidated Financial Statements
(in thousands, except shares and per share data)
December 31, 2013
|
Year ended December 31, 2013
|
||||||||||||||||||||||
|
Insurance and insurance services
|
Specialty finance
|
Asset management
|
Real estate
|
Corporate eliminations and other
|
Totals
|
|||||||||||||||||
|
Fee income
|
$
|
71,737
|
|
(1)
|
$
|
—
|
|
|
$
|
—
|
|
$
|
—
|
|
$
|
—
|
|
|
$
|
71,737
|
|
|
|
Rental revenue
|
—
|
|
|
—
|
|
|
—
|
|
|
11,680
|
|
(5,920
|
)
|
|
5,760
|
|
||||||
|
Interest income
|
4,946
|
|
|
24,629
|
|
|
—
|
|
|
2,316
|
|
(15,414
|
)
|
|
16,477
|
|
||||||
|
Other revenue
|
89
|
|
|
2,783
|
|
|
350
|
|
(2)
|
19,834
|
|
(16,123
|
)
|
|
6,933
|
|
||||||
|
Intersegment revenues
|
—
|
|
|
81
|
|
|
16,215
|
|
(2)
|
—
|
|
(16,296
|
)
|
|
—
|
|
||||||
|
Total revenue
|
$
|
76,772
|
|
|
$
|
27,493
|
|
|
$
|
16,565
|
|
|
$
|
33,830
|
|
$
|
(53,753
|
)
|
|
$
|
100,907
|
|
|
Interest expense
|
$
|
12,430
|
|
|
$
|
3,425
|
|
|
$
|
—
|
|
|
$
|
4,452
|
|
$
|
(2,790
|
)
|
|
$
|
17,517
|
|
|
Payroll expense
|
18,820
|
|
|
1,797
|
|
|
12,228
|
|
|
2,707
|
|
—
|
|
|
35,552
|
|
||||||
|
Professional fee expense
|
1,858
|
|
|
3,463
|
|
|
1,277
|
|
|
1,957
|
|
—
|
|
|
8,555
|
|
||||||
|
Other expense
|
29,663
|
|
|
2,641
|
|
|
1,119
|
|
|
9,373
|
|
(5,343
|
)
|
|
37,453
|
|
||||||
|
Total expense
|
62,771
|
|
|
11,326
|
|
|
14,624
|
|
|
18,489
|
|
(8,133
|
)
|
|
99,077
|
|
||||||
|
Segment profit/(loss)
|
$
|
14,001
|
|
|
$
|
16,167
|
|
|
$
|
1,941
|
|
|
$
|
15,341
|
|
$
|
(45,620
|
)
|
|
$
|
1,830
|
|
|
Net income attributable to consolidated CLOs
|
4,419
|
|
||||||||||||||||||||
|
Less: non-controlling interest and net income attributable to the VIE subordinated noteholders
|
7,573
|
|
||||||||||||||||||||
|
Discontinued operations
|
17,110
|
|
||||||||||||||||||||
|
Income taxes
|
6,941
|
|
||||||||||||||||||||
|
Net income available to common stockholders
|
$
|
8,845
|
|
|||||||||||||||||||
|
Segment assets
|
$
|
4,949,262
|
|
|
$
|
385,987
|
|
|
$
|
7,896
|
|
|
$
|
170,683
|
|
$
|
1,366,620
|
|
|
$
|
6,880,448
|
|
69
TIPTREE FINANCIAL INC.
AND SUBSIDIARIES
AND SUBSIDIARIES
Notes to Consolidated Financial Statements
(in thousands, except shares and per share data)
December 31, 2013
|
Year ended December 31, 2012
|
||||||||||||||||||||||
|
Insurance
|
Specialty finance
|
Asset management
|
Real estate
|
Corporate eliminations and other
|
Totals
|
|||||||||||||||||
|
Fee income
|
$
|
42,870
|
|
(1)
|
$
|
—
|
|
|
$
|
—
|
|
$
|
—
|
|
$
|
—
|
|
|
$
|
42,870
|
|
|
|
Rental revenue
|
—
|
|
|
—
|
|
|
—
|
|
|
13,769
|
|
(12,052
|
)
|
|
$
|
1,717
|
|
|||||
|
Interest income
|
4,498
|
|
|
20,846
|
|
|
—
|
|
|
802
|
|
(16,208
|
)
|
|
$
|
9,938
|
|
|||||
|
Other revenue
|
542
|
|
|
9,945
|
|
|
1,184
|
|
(2)
|
3,860
|
|
153
|
|
|
15,684
|
|
||||||
|
Intersegment revenues
|
—
|
|
|
181
|
|
|
16,243
|
|
(2)
|
—
|
|
(16,424
|
)
|
|
—
|
|
||||||
|
Total revenue
|
$
|
47,910
|
|
|
$
|
30,972
|
|
|
$
|
17,427
|
|
|
$
|
18,431
|
|
$
|
(44,531
|
)
|
|
$
|
70,209
|
|
|
|
|
|
|
|
|
|
|
|
|
|
|
|
|
|
|
|||||||
|
Interest expense
|
$
|
6,083
|
|
|
$
|
1,458
|
|
|
$
|
—
|
|
|
$
|
6,310
|
|
$
|
(5,755
|
)
|
|
$
|
8,096
|
|
|
Payroll expense
|
12,477
|
|
|
—
|
|
|
7,341
|
|
|
1,619
|
|
—
|
|
|
21,437
|
|
||||||
|
Professional fee expense
|
2,800
|
|
|
3,430
|
|
|
3,062
|
|
|
2,581
|
|
—
|
|
|
11,873
|
|
||||||
|
Other expense
|
23,202
|
|
|
2,834
|
|
|
—
|
|
|
6,447
|
|
(6,601
|
)
|
|
25,882
|
|
||||||
|
Total expense
|
44,562
|
|
|
7,722
|
|
|
10,403
|
|
|
16,957
|
|
(12,356
|
)
|
|
67,288
|
|
||||||
|
Segment profit/(loss)
|
$
|
3,348
|
|
|
$
|
23,250
|
|
|
$
|
7,024
|
|
|
$
|
1,474
|
|
$
|
(32,175
|
)
|
|
$
|
2,921
|
|
|
Net income attributable to consolidated CLOs
|
33,529
|
|
||||||||||||||||||||
|
Less: non-controlling interest and net income attributable to the VIE subordinated noteholders
|
30,924
|
|
||||||||||||||||||||
|
Discontinued operations
|
2,882
|
|
||||||||||||||||||||
|
Income taxes
|
(321
|
)
|
||||||||||||||||||||
|
Net income available to common stockholders
|
$
|
8,729
|
|
|||||||||||||||||||
|
Segment assets
|
$
|
4,354,945
|
|
|
$
|
139,471
|
|
|
$
|
4,242
|
|
|
$
|
191,693
|
|
$
|
843,451
|
|
|
$
|
5,533,802
|
|
(1) Includes separate account and administrative servicing fees
(2) Includes management fees which is a component of other income on the Company’s Consolidated Statements of Operations
70
TIPTREE FINANCIAL INC.
AND SUBSIDIARIES
AND SUBSIDIARIES
Notes to Consolidated Financial Statements
(in thousands, except shares and per share data)
December 31, 2013
(5)
Available for Sale Securities
The amortized cost and fair values of available for sale securities held as of December 31, 2013 and 2012 are as follows:
|
2013
|
|||||||||||||||
|
Amortized
cost
|
Gross
unrealized gains
|
Gross
unrealized losses
|
Fair value
|
||||||||||||
|
U.S. Treasury securities and obligations of
U.S. government authorities and agencies
|
$
|
11,965
|
|
$
|
140
|
|
$
|
(116
|
)
|
$
|
11,989
|
|
|||
|
Corporate securities
|
5,567
|
|
71
|
|
(42
|
)
|
5,596
|
|
|||||||
|
Certificates of deposit
|
100
|
|
—
|
|
—
|
|
100
|
|
|||||||
|
Asset-backed securities
|
76
|
|
2
|
|
—
|
|
78
|
|
|||||||
|
$
|
17,708
|
|
$
|
213
|
|
$
|
(158
|
)
|
$
|
17,763
|
|
||||
|
2012
|
|||||||||||||||
|
Amortized
cost
|
Gross
unrealized gains
|
Gross
unrealized losses
|
Fair value
|
||||||||||||
|
U.S. Treasury securities and obligations of
U.S. government authorities and agencies
|
$
|
8,731
|
|
$
|
412
|
|
$
|
(3
|
)
|
$
|
9,140
|
|
|||
|
Obligations of states and political subdivisions
|
475
|
|
3
|
|
—
|
|
478
|
|
|||||||
|
Corporate securities
|
6,076
|
|
206
|
|
(5
|
)
|
6,277
|
|
|||||||
|
Certificates of deposit
|
100
|
|
—
|
|
—
|
|
100
|
|
|||||||
|
Asset-backed securities
|
311
|
|
5
|
|
(8
|
)
|
308
|
|
|||||||
|
$
|
15,693
|
|
$
|
626
|
|
$
|
(16
|
)
|
$
|
16,303
|
|
||||
71
TIPTREE FINANCIAL INC.
AND SUBSIDIARIES
AND SUBSIDIARIES
Notes to Consolidated Financial Statements
(in thousands, except shares and per share data)
December 31, 2013
The following table summarizes the gross unrealized losses on available for sale securities in an unrealized loss position as of December 31, 2013 and 2012:
|
2013
|
|||||||||||||||
|
Less Than or Equal to One Year
|
More Than One Year
|
||||||||||||||
|
Fair Value
|
Gross
Unrealized Losses
|
Fair Value
|
Gross Unrealized Losses
|
||||||||||||
|
U.S. Treasury securities and obligations of U.S. government authorities and agencies
|
$
|
5,543
|
|
$
|
(102
|
)
|
$
|
854
|
|
$
|
(14
|
)
|
|||
|
Corporate securities
|
2,253
|
|
(42
|
)
|
67
|
|
—
|
|
|||||||
|
Asset-backed securities
|
—
|
|
—
|
|
2
|
|
—
|
|
|||||||
|
Total
|
$
|
7,796
|
|
$
|
(144
|
)
|
$
|
923
|
|
$
|
(14
|
)
|
|||
|
2012
|
|||||||||||||||
|
Less Than or Equal to One Year
|
More Than One Year
|
||||||||||||||
|
Fair Value
|
Gross
Unrealized Losses
|
Fair Value
|
Gross Unrealized Losses
|
||||||||||||
|
U.S. Treasury securities and obligations of U.S. government authorities and agencies
|
$
|
612
|
|
$
|
(3
|
)
|
$
|
—
|
|
$
|
—
|
|
|||
|
Corporate securities
|
540
|
|
(3
|
)
|
149
|
|
(2
|
)
|
|||||||
|
Asset-backed securities
|
—
|
|
—
|
|
194
|
|
(8
|
)
|
|||||||
|
Total
|
$
|
1,152
|
|
$
|
(6
|
)
|
$
|
343
|
|
$
|
(10
|
)
|
|||
At December 31, 2013, the Company held
five
securities which were in an unrealized loss position for more than one year. The total unrealized losses on these securities were
$14
and the fair value was
$923
. At December 31, 2012, the Company had
three
securities that were in an unrealized loss position for more than one year. The total unrealized losses on these securities were
$10
and the fair value was
$343
. The unrealized losses were attributable to changes in interest rates and not credit-related issues. There have been no other‑than‑temporary impairments recorded by the Company in 2013 or 2012.
The amortized cost and fair values of investments of these debt securities at December 31, 2013, by contractual maturity date, are shown below. Expected maturities may differ from contractual maturities because borrowers may have the right to call or prepay obligations with or without call or prepayment penalties.
|
Amortized Cost
|
Fair Value
|
||||||
|
Due in one year or less
|
$
|
1,148
|
|
$
|
1,159
|
|
|
|
Due after one year through five years
|
10,545
|
|
10,608
|
|
|||
|
Due after five years through ten years
|
5,395
|
|
5,384
|
|
|||
|
Due after ten years through twenty years
|
544
|
|
534
|
|
|||
|
Asset-backed securities
|
76
|
|
78
|
|
|||
|
$
|
17,708
|
|
$
|
17,763
|
|
||
Purchases of available for sale debt securities were
$9,431
and
$9,034
for the periods ended December 31, 2013 and 2012, respectively. Proceeds from maturities of available for sale debt securities were
$520
and
$850
for these same periods.
72
TIPTREE FINANCIAL INC.
AND SUBSIDIARIES
AND SUBSIDIARIES
Notes to Consolidated Financial Statements
(in thousands, except shares and per share data)
December 31, 2013
Proceeds from sales of available for sale debt securities for the year ended December 31, 2013 were
$6,812
with associated gains of
$83
. For the same period in 2012, proceeds from sales of available for sale debt securities were
$12,794
with associated gains of
$536
.
73
TIPTREE FINANCIAL INC.
AND SUBSIDIARIES
AND SUBSIDIARIES
Notes to Consolidated Financial Statements
(in thousands, except shares and per share data)
December 31, 2013
(6)
Fair Value of Financial Instruments
The following tables show the fair values and carrying values of the Company’s financial assets and liabilities measured on a recurring basis and the associated fair value hierarchy amounts as of December 31, 2013 and 2012. Included are balances associated with the consolidated CLOs:
|
2013
|
|||||||||||||||||||
|
Assets:
|
Quoted Prices in
active markets
Level 1
|
Other Significant
Observable inputs
Level 2
|
Significant unobservable inputs
Level 3
|
Fair Value
|
Carrying Value
|
||||||||||||||
|
Trading investments:
|
|||||||||||||||||||
|
Privately held equity securities (1)
|
$
|
—
|
|
$
|
—
|
|
$
|
5,306
|
|
$
|
5,306
|
|
$
|
5,306
|
|
||||
|
Tax exempt securities
|
—
|
|
30,707
|
|
273
|
|
30,980
|
|
30,980
|
|
|||||||||
|
CDO
|
—
|
|
—
|
|
520
|
|
520
|
|
520
|
|
|||||||||
|
CLO
|
—
|
|
—
|
|
825
|
|
825
|
|
825
|
|
|||||||||
|
Corporate bonds (2)
|
—
|
|
—
|
|
17,674
|
|
17,674
|
|
17,674
|
|
|||||||||
|
Total trading investments
|
—
|
|
30,707
|
|
24,598
|
|
55,305
|
|
55,305
|
|
|||||||||
|
Derivative assets:
|
|||||||||||||||||||
|
IRS
|
—
|
|
52
|
|
—
|
|
52
|
|
52
|
|
|||||||||
|
Total derivative assets
|
—
|
|
52
|
|
|
—
|
|
52
|
|
52
|
|
||||||||
|
Total trading securities
|
—
|
|
30,759
|
|
24,598
|
|
55,357
|
|
55,357
|
|
|||||||||
|
Corporate loans (3)
|
—
|
|
1,438,699
|
|
30,543
|
|
1,469,242
|
|
1,469,242
|
|
|||||||||
|
Available for sale securities:
|
|||||||||||||||||||
|
U.S. Treasury securities
|
7,751
|
|
—
|
|
—
|
|
7,751
|
|
7,751
|
|
|||||||||
|
Obligations of state and political subdivisions
|
—
|
|
4,238
|
|
—
|
|
4,238
|
|
4,238
|
|
|||||||||
|
Certificates of deposit
|
—
|
|
100
|
|
—
|
|
100
|
|
100
|
|
|||||||||
|
Corporate bonds
|
—
|
|
5,596
|
|
—
|
|
5,596
|
|
5,596
|
|
|||||||||
|
Asset-backed securities
|
—
|
|
78
|
|
—
|
|
78
|
|
78
|
|
|||||||||
|
Total available for sale securities
|
7,751
|
|
10,012
|
|
—
|
|
17,763
|
|
17,763
|
|
|||||||||
74
TIPTREE FINANCIAL INC.
AND SUBSIDIARIES
AND SUBSIDIARIES
Notes to Consolidated Financial Statements
(in thousands, except shares and per share data)
December 31, 2013
|
2013
|
|||||||||||||||||||
|
Quoted Prices in
Active markets
Level 1
|
Other Significant
Level 2
|
Significant
Unobservable inputs
Level 3
|
Fair Value
|
Carrying Value
|
|||||||||||||||
|
Separate Account Assets:
|
|||||||||||||||||||
|
Cash
|
$
|
26,129
|
|
$
|
—
|
|
$
|
—
|
|
$
|
26,129
|
|
$
|
26,129
|
|
||||
|
Short-term investments
|
171,927
|
|
—
|
|
—
|
|
171,927
|
|
171,927
|
|
|||||||||
|
Debt Securities:
|
|||||||||||||||||||
|
U.S. Treasury securities
|
17,634
|
|
—
|
|
—
|
|
17,634
|
|
17,634
|
|
|||||||||
|
U.S. government agencies
|
—
|
|
1,436
|
|
—
|
|
1,436
|
|
1,436
|
|
|||||||||
|
Municipal bonds
|
—
|
|
8,014
|
|
—
|
|
8,014
|
|
8,014
|
|
|||||||||
|
Asset-backed securities
|
—
|
|
8,113
|
|
—
|
|
8,113
|
|
8,113
|
|
|||||||||
|
Corporate bonds
|
—
|
|
18,116
|
|
—
|
|
18,116
|
|
18,116
|
|
|||||||||
|
Preferred stocks
|
1,018
|
|
—
|
|
—
|
|
1,018
|
|
1,018
|
|
|||||||||
|
Common stocks
|
100,630
|
|
—
|
|
—
|
|
100,630
|
|
100,630
|
|
|||||||||
|
Mutual funds
|
195,736
|
|
—
|
|
—
|
|
195,736
|
|
195,736
|
|
|||||||||
|
Real estate funds
|
—
|
|
—
|
|
2,719,387
|
|
2,719,387
|
|
2,719,387
|
|
|||||||||
|
Private equity
|
—
|
|
—
|
|
138
|
|
138
|
|
138
|
|
|||||||||
|
Hedge funds
|
|
|
|||||||||||||||||
|
Multi-strategy
|
—
|
|
66,615
|
|
682,751
|
|
749,366
|
|
749,366
|
|
|||||||||
|
Long/short
|
—
|
|
19,115
|
|
84,315
|
|
103,430
|
|
103,430
|
|
|||||||||
|
Fund of funds
|
—
|
|
2,509
|
|
191,423
|
|
193,932
|
|
193,932
|
|
|||||||||
|
Event driven
|
—
|
|
—
|
|
86,724
|
|
86,724
|
|
86,724
|
|
|||||||||
|
Long only
|
—
|
|
34,787
|
|
20,305
|
|
55,092
|
|
55,092
|
|
|||||||||
|
Global Macro
|
—
|
|
13,157
|
|
8,245
|
|
21,402
|
|
21,402
|
|
|||||||||
|
Fixed income arbitrage
|
—
|
|
—
|
|
8,669
|
|
8,669
|
|
8,669
|
|
|||||||||
|
Master limited partnerships
|
—
|
|
102,394
|
|
28,814
|
|
131,208
|
|
131,208
|
|
|||||||||
|
Fixed income (non-arbitrage)
|
—
|
|
4,117
|
|
2,557
|
|
6,674
|
|
6,674
|
|
|||||||||
|
Other
|
—
|
|
—
|
|
73
|
|
73
|
|
73
|
|
|||||||||
|
Other
|
—
|
|
251
|
|
—
|
|
251
|
|
251
|
|
|||||||||
|
Subtotal - separate account assets
|
513,074
|
|
278,624
|
|
3,833,401
|
|
4,625,099
|
|
4,625,099
|
|
|||||||||
|
Total assets
|
$
|
520,825
|
|
$
|
1,758,094
|
|
$
|
3,888,542
|
|
$
|
6,167,461
|
|
$
|
6,167,461
|
|
||||
|
Liabilities:
|
|||||||||||||||||||
|
Debt Securities:
|
|||||||||||||||||||
|
U.S. Treasury securities
|
$
|
18,493
|
|
$
|
—
|
|
$
|
—
|
|
$
|
18,493
|
|
$
|
18,493
|
|
||||
|
Derivative Liabilities:
|
|||||||||||||||||||
|
Credit Derivatives
|
—
|
|
598
|
|
—
|
|
598
|
|
598
|
|
|||||||||
|
Total liabilities
|
$
|
18,493
|
|
$
|
598
|
|
$
|
—
|
|
$
|
19,091
|
|
$
|
19,091
|
|
||||
75
TIPTREE FINANCIAL INC.
AND SUBSIDIARIES
AND SUBSIDIARIES
Notes to Consolidated Financial Statements
(in thousands, except shares and per share data)
December 31, 2013
(1) Includes
$1,692
related to CLOs classified in Level 3.
(2) Includes
$17,674
related to CLOs classified in Level 3.
(3) Includes
$1,267,612
and
$30,543
classified in Level 2 and Level 3, respectively, related to CLOs.
76
TIPTREE FINANCIAL INC.
AND SUBSIDIARIES
AND SUBSIDIARIES
Notes to Consolidated Financial Statements
(in thousands, except shares and per share data)
December 31, 2013
|
2012
|
|||||||||||||||||||
|
Assets:
|
Quoted Prices in
active markets
Level 1
|
Other Significant
Observable inputs
Level 2
|
Significant unobservable inputs
Level 3
|
Fair Value
|
Carrying Value
|
||||||||||||||
|
Trading Investments:
|
|||||||||||||||||||
|
Exchange-traded equity securities
|
$
|
2,433
|
|
$
|
—
|
|
$
|
—
|
|
$
|
2,433
|
|
$
|
2,433
|
|
||||
|
Privately held equity securities (1)
|
—
|
|
—
|
|
7,809
|
|
7,809
|
|
7,809
|
|
|||||||||
|
Tax exempt securities
|
—
|
|
50,784
|
|
264
|
|
51,048
|
|
51,048
|
|
|||||||||
|
CDO
|
—
|
|
—
|
|
650
|
|
650
|
|
650
|
|
|||||||||
|
CLO
|
—
|
|
—
|
|
525
|
|
525
|
|
525
|
|
|||||||||
|
Corporate bonds (2)
|
—
|
|
—
|
|
16,486
|
|
16,486
|
|
16,486
|
|
|||||||||
|
Total trading investments
|
2,433
|
|
50,784
|
|
25,734
|
|
78,951
|
|
78,951
|
|
|||||||||
|
Derivative assets:
|
|||||||||||||||||||
|
CDS
|
—
|
|
—
|
|
834
|
|
834
|
|
834
|
|
|||||||||
|
Total derivative assets
|
—
|
|
—
|
|
834
|
|
834
|
|
834
|
|
|||||||||
|
Total trading securities
|
2,433
|
|
50,784
|
|
26,568
|
|
79,785
|
|
79,785
|
|
|||||||||
|
Corporate loans (3)
|
—
|
|
756,311
|
|
5,855
|
|
762,166
|
|
762,166
|
|
|||||||||
|
Available for sale securities:
|
|||||||||||||||||||
|
U.S. government obligations
|
—
|
|
3,851
|
|
—
|
|
3,851
|
|
3,851
|
|
|||||||||
|
U.S. Treasury securities
|
5,290
|
|
—
|
|
—
|
|
5,290
|
|
5,290
|
|
|||||||||
|
Obligations of state and political subdivisions
|
—
|
|
478
|
|
—
|
|
478
|
|
478
|
|
|||||||||
|
Certificates of deposit
|
—
|
|
100
|
|
—
|
|
100
|
|
100
|
|
|||||||||
|
Corporate bonds
|
—
|
|
6,277
|
|
—
|
|
6,277
|
|
6,277
|
|
|||||||||
|
Asset-backed securities
|
—
|
|
307
|
|
—
|
|
307
|
|
307
|
|
|||||||||
|
Total available for sale securities
|
5,290
|
|
11,013
|
|
—
|
|
16,303
|
|
16,303
|
|
|||||||||
77
TIPTREE FINANCIAL INC.
AND SUBSIDIARIES
AND SUBSIDIARIES
Notes to Consolidated Financial Statements
(in thousands, except shares and per share data)
December 31, 2013
|
2012
|
|||||||||||||||||||
|
Quoted Prices in
Active markets
Level 1
|
Other Significant
Level 2
|
Significant
Unobservable inputs
Level 3
|
Fair Value
|
Carrying Value
|
|||||||||||||||
|
Separate Account Assets:
|
|||||||||||||||||||
|
Cash
|
$
|
3,771
|
|
$
|
—
|
|
$
|
—
|
|
$
|
3,771
|
|
$
|
3,771
|
|
||||
|
Short-term investments
|
87,409
|
|
—
|
|
—
|
|
87,409
|
|
87,409
|
|
|||||||||
|
Debt Securities:
|
|
|
|||||||||||||||||
|
U.S. Treasury securities
|
19,230
|
|
—
|
|
—
|
|
19,230
|
|
19,230
|
|
|||||||||
|
U.S. government agencies
|
—
|
|
1,625
|
|
—
|
|
1,625
|
|
1,625
|
|
|||||||||
|
Municipal bonds
|
—
|
|
3,034
|
|
—
|
|
3,034
|
|
3,034
|
|
|||||||||
|
Asset-backed securities
|
—
|
|
2,843
|
|
—
|
|
2,843
|
|
2,843
|
|
|||||||||
|
Corporate bonds
|
—
|
|
18,373
|
|
—
|
|
18,373
|
|
18,373
|
|
|||||||||
|
Preferred stocks
|
25
|
|
—
|
|
—
|
|
25
|
|
25
|
|
|||||||||
|
Common stocks
|
97,600
|
|
—
|
|
—
|
|
97,600
|
|
97,600
|
|
|||||||||
|
Mutual funds
|
146,860
|
|
—
|
|
—
|
|
146,860
|
|
146,860
|
|
|||||||||
|
Real estate funds
|
—
|
|
—
|
|
2,563,992
|
|
2,563,992
|
|
2,563,992
|
|
|||||||||
|
Private equity
|
—
|
|
—
|
|
251
|
|
251
|
|
251
|
|
|||||||||
|
Hedge funds
|
|
|
|||||||||||||||||
|
Multi-Strategy
|
—
|
|
58,580
|
|
617,979
|
|
676,559
|
|
676,559
|
|
|||||||||
|
Long/Short
|
—
|
|
32,665
|
|
75,640
|
|
108,305
|
|
108,305
|
|
|||||||||
|
Fund of Funds
|
—
|
|
1,347
|
|
123,793
|
|
125,140
|
|
125,140
|
|
|||||||||
|
Event Driven
|
—
|
|
40,907
|
|
29,230
|
|
70,137
|
|
70,137
|
|
|||||||||
|
Long only
|
—
|
|
31,825
|
|
—
|
|
31,825
|
|
31,825
|
|
|||||||||
|
Global Macro
|
—
|
|
11,562
|
|
7,374
|
|
18,936
|
|
18,936
|
|
|||||||||
|
Fixed Income Arbitrage
|
—
|
|
—
|
|
4,994
|
|
4,994
|
|
4,994
|
|
|||||||||
|
Master limited partnerships
|
—
|
|
—
|
|
42,501
|
|
42,501
|
|
42,501
|
|
|||||||||
|
Fixed Income (Non-Arbitrage)
|
—
|
|
5,013
|
|
4,700
|
|
9,713
|
|
9,713
|
|
|||||||||
|
Other
|
—
|
|
—
|
|
1,746
|
|
1,746
|
|
1,746
|
|
|||||||||
|
Other
|
—
|
|
184
|
|
—
|
|
184
|
|
184
|
|
|||||||||
|
Subtotal - separate account assets
|
354,895
|
|
207,958
|
|
3,472,200
|
|
4,035,053
|
|
4,035,053
|
|
|||||||||
|
Total assets
|
$
|
362,618
|
|
$
|
1,026,066
|
|
$
|
3,504,623
|
|
$
|
4,893,307
|
|
$
|
4,893,307
|
|
||||
|
Liabilities:
|
|||||||||||||||||||
|
Debt Securities:
|
|||||||||||||||||||
|
U.S. Treasury securities
|
$
|
20,175
|
|
$
|
—
|
|
$
|
—
|
|
$
|
20,175
|
|
$
|
20,175
|
|
||||
|
Derivative Liabilities:
|
|||||||||||||||||||
|
IRS
|
—
|
|
3,172
|
|
—
|
|
3,172
|
|
3,172
|
|
|||||||||
|
Total liabilities
|
$
|
20,175
|
|
$
|
3,172
|
|
$
|
—
|
|
$
|
23,347
|
|
$
|
23,347
|
|
||||
(1) Includes
$2,483
related to CLOs classified in Level 3.
(2) Includes
$16,486
related to CLOs classified in Level 3.
(3) Includes
$735,888
and
$5,855
classified in Level 2 and Level 3, respectively, related to CLOs.
78
TIPTREE FINANCIAL INC.
AND SUBSIDIARIES
AND SUBSIDIARIES
Notes to Consolidated Financial Statements
(in thousands, except shares and per share data)
December 31, 2013
The following table represents additional information about assets that are measured at fair value on a recurring basis for which the Company has utilized Level 3 inputs to determine fair value for the year ending December 31, 2013 and 2012:
|
Fair value measurement for the twelve months ended December 31, 2013 using significant unobservable inputs Level 3
|
Fair value measurement for the twelve months ended December 31, 2012 using significant unobservable inputs Level 3
|
||||||
|
Balance at December 31,
|
$
|
3,504,623
|
|
$
|
3,116,455
|
|
|
|
Net realized gains/(losses)
|
(1,830
|
)
|
827
|
|
|||
|
Net unrealized gains/(losses)
|
(144
|
)
|
(2,514
|
)
|
|||
|
Purchases
|
305,336
|
|
409,992
|
|
|||
|
Sales
|
(377,891
|
)
|
(279,103
|
)
|
|||
|
Issuances
|
932
|
|
—
|
|
|||
|
Settlements
|
(1,195
|
)
|
10,454
|
|
|||
|
Transfers into/(out of) Level 3, net
|
53,538
|
|
(30,211
|
)
|
|||
|
Attributable to policyowner
|
405,173
|
|
278,723
|
|
|||
|
Balance at December 31,
|
$
|
3,888,542
|
|
$
|
3,504,623
|
|
|
For the year ended December 31, 2013,
$53,538
was transferred between Level 2 and Level 3 primarily due to the temporary restrictions on the liquidation of hedge funds included in the separate accounts balance. For the year ended December 31 2012,
$30,211
was transferred from Level 3 into Level 2. The majority of these amounts in 2012 were due to tax exempt municipal securities as quoted prices for these assets were obtained from active markets.
ASC Topic 820, as amended by ASU 2011-04, requires disclosure of quantitative information about the significant unobservable inputs used in the valuation of assets and liabilities classified as Level 3 within the fair value hierarchy. Disclosure of this information is not required in circumstances where a valuation (unadjusted) is obtained from a third-party pricing service and the information regarding the unobservable inputs is not reasonably available to the Company. As such, the disclosure provided below provides quantitative information only about the significant unobservable inputs used in the valuation of certain privately held securities, credit default assets and tax-exempt municipal securities.
|
Assets
|
Fair Value at
December 31,
2013
|
Fair Value at
December 31,
2012
|
Valuation Technique
|
Unobservable input(s)
|
December 31, 2013
Range (Weighted average)
|
December 31, 2012
Range (Weighted average)
|
|||||||||||
|
Trading Securities:
|
|||||||||||||||||
|
Privately held equity securities
|
$
|
—
|
|
$
|
1,224
|
|
Discounted cash flow
|
Swap rate
|
—
|
|
0.239%-0.300& (0.270%)
|
||||||
|
CMBS spread
|
—
|
|
34.50
|
%
|
|||||||||||||
|
Expected term
|
—
|
|
1.00-4.79 years (2.90 years)
|
||||||||||||||
|
Expected quarterly cash flow streams
|
—
|
|
$52-$1,574 ($147)
|
||||||||||||||
|
Tax-exempt municipal
|
274
|
|
264
|
|
Discounted cash flow
|
Short and long term cash flows
|
.58% - 33.68%
|
.8435%-37.469%
|
|||||||||
|
Derivative Assets:
|
|||||||||||||||||
|
CDS
|
—
|
|
834
|
|
Market comparable approach
|
Offered quote
|
—
|
|
88.28%-96.66% (93.71%)
|
||||||||
|
Total
|
$
|
274
|
|
$
|
2,322
|
|
|||||||||||
79
TIPTREE FINANCIAL INC.
AND SUBSIDIARIES
AND SUBSIDIARIES
Notes to Consolidated Financial Statements
(in thousands, except shares and per share data)
December 31, 2013
The following tables show the fair values and carrying values of the Company’s financial assets and liabilities and the fair value hierarchy level(s) associated with these assets and liabilities as of December 31, 2013 and 2012:
|
2013
|
|||||||||
|
Level within
Fair Value
Hierarchy
|
Fair Value
|
Carrying Value
|
|||||||
|
Assets:
|
|||||||||
|
Cash and cash equivalents-unrestricted
|
1
|
$
|
120,557
|
|
$
|
120,557
|
|
||
|
Cash and cash equivalents-restricted
|
1
|
26,395
|
|
26,395
|
|
||||
|
Trading securities
|
2,3
|
35,991
|
|
35,991
|
|
||||
|
Due from brokers, dealers, and trustees
|
1
|
6,956
|
|
6,956
|
|
||||
|
Due from separate accounts
|
1
|
1,963
|
|
1,963
|
|
||||
|
Investments in loans
|
2
|
171,087
|
|
171,087
|
|
||||
|
Loans owned
|
2
|
48,212
|
|
40,260
|
|
||||
|
Policy loans
|
3
|
102,147
|
|
102,147
|
|
||||
|
Available for sale securities
|
1,2,3
|
17,763
|
|
17,763
|
|
||||
|
Separate account assets
|
1,2,3
|
4,625,099
|
|
4,625,099
|
|
||||
|
Assets of consolidated CLOs
|
2,3
|
1,414,616
|
|
1,414,616
|
|
||||
|
Total Assets
|
$
|
6,570,786
|
|
$
|
6,562,834
|
|
|||
|
Liabilities:
|
|||||||||
|
Debt securities-U.S. Treasury securities
|
1
|
18,493
|
|
18,493
|
|
||||
|
Debt
|
3
|
376,250
|
|
360,609
|
|
||||
|
Separate account liabilities
|
1,2,3
|
4,625,099
|
|
4,625,099
|
|
||||
|
Due to brokers, dealers and trustees
|
1
|
8,193
|
|
8,193
|
|
||||
|
Derivative liabilities
|
2
|
598
|
|
598
|
|
||||
|
Liabilities of consolidated CLOs
|
2,3
|
1,175,606
|
|
1,175,606
|
|
||||
|
Total Liabilities
|
$
|
6,204,239
|
|
$
|
6,188,598
|
|
|||
80
TIPTREE FINANCIAL INC.
AND SUBSIDIARIES
AND SUBSIDIARIES
Notes to Consolidated Financial Statements
(in thousands, except shares and per share data)
December 31, 2013
|
2012
|
|||||||||
|
Level within
Fair Value
Hierarchy
|
Fair Value
|
Carrying Value
|
|||||||
|
Assets:
|
|||||||||
|
Cash and cash equivalents-unrestricted
|
1
|
$
|
88,563
|
|
$
|
88,563
|
|
||
|
Cash and cash equivalents-restricted
|
1
|
20,748
|
|
20,748
|
|
||||
|
Trading securities
|
1,2,3
|
60,816
|
|
60,816
|
|
||||
|
Due from brokers, dealers, and trustees
|
1
|
8,539
|
|
8,539
|
|
||||
|
Due from separate accounts
|
1
|
2,128
|
|
2,128
|
|
||||
|
Corporate loans
|
2
|
20,423
|
|
20,423
|
|
||||
|
Loans owned
|
2
|
8,104
|
|
5,467
|
|
||||
|
Policy loans
|
3
|
99,123
|
|
99,123
|
|
||||
|
Available for sale securities
|
1,2,3
|
16,303
|
|
16,303
|
|
||||
|
Separate account assets
|
1,2,3
|
4,035,053
|
|
4,035,053
|
|
||||
|
Assets of consolidated CLOs
|
2,3
|
844,852
|
|
844,852
|
|
||||
|
Total Assets
|
$
|
5,204,652
|
|
$
|
5,202,015
|
|
|||
|
Liabilities:
|
|||||||||
|
Debt securities-U.S. Treasury securities
|
1
|
$
|
20,175
|
|
$
|
20,175
|
|
||
|
Derivative liabilities
|
2
|
3,172
|
|
3,172
|
|
||||
|
Debt
|
3
|
182,994
|
|
195,648
|
|
||||
|
Separate account liabilities
|
1,2,3
|
4,035,053
|
|
4,035,053
|
|
||||
|
Liabilities of consolidated CLOs
|
2,3
|
778,925
|
|
620,310
|
|
||||
|
Total Liabilities
|
$
|
5,020,319
|
|
$
|
4,874,358
|
|
|||
(7)
Derivative Financial Instruments
The Company utilizes derivative financial instruments as part of its overall investment activities. Investments in derivative contracts are subject to additional risk that can result in a loss of all or part of an investment. The Company’s derivative activities are primarily classified by underlying credit risk, interest rate risk, and equity price risk. In addition, the Company is also subject to additional counterparty risk should its counterparties fail to meet the contract terms.
Credit Derivatives
Credit derivatives are generally defined as over‑the‑counter contracts between a buyer and seller of protection against the risk of default on a set of obligations issued by a specified reference entity. The Company is exposed to credit risk when there is an unfavorable change in the value of investments as a result of adverse movements in the underlying credit spreads and enters into these contracts as a buyer of protection so as to minimize the credit risk exposure of its investment portfolio.
Credit Default Swap Indices (CDX) are credit derivatives that reference multiple names through underlying baskets or portfolios of single name credit default swaps. The Company entered into this contract as a buyer of protection so as to minimize the credit risk exposure of its investment portfolio.
The Company is required to post cash collateral for this position equal to an initial
7%
of the notional amount with subsequent calls for drops in value of the CDX and had
$2,021
held as collateral as of December 31, 2013.
The Company entered into a CDX contract during December 2013, with a notional amount of
$20,000
. The Company is party to
one
CDS contract with a combined notional amount of
$3,985
at December 31, 2013. The Company held
three
81
TIPTREE FINANCIAL INC.
AND SUBSIDIARIES
AND SUBSIDIARIES
Notes to Consolidated Financial Statements
(in thousands, except shares and per share data)
December 31, 2013
CDS contracts each of which had a notional value of
$5,000
as of December 31, 2012. During 2013,
two
CDS contracts were closed out.
Credit derivatives are included within trading investments on the Company’s Consolidated Balance Sheet.
Interest Rate Swaps
The Company is exposed to interest rate risk when there is an unfavorable change in the value of investments as a result of adverse movements in the market interest rates. The Company enters into interest rate swaps to protect against such adverse movements in the interest rates. The Company is required to post collateral for the benefit of the counterparty. This is included as a component of other assets in the consolidated balance sheet.
On June 24, 2013 the Company terminated an interest rate swap contract with a notional amount of
$20,000
. In November and December 2013, the Company entered into
six
new interest rate swaps with a combined notional amount of
$43,988
in order to hedge interest rate risk associated with its real estate portfolio. All of these swaps have the same counterparty. These swaps are included as a component of trading investments on the Company’s consolidated balance sheet.
The following tables identify the fair value amounts of the derivative instruments as of December 31, 2013 and 2012, categorized by primary underlying risk:
|
2013
|
|||||||||||||||
|
Asset Derivatives
|
|||||||||||||||
|
Credit
risk
|
Interest rate
risk
|
Equity price
risk
|
Total
|
||||||||||||
|
Interest rate swaps
|
$
|
—
|
|
$
|
52
|
|
$
|
—
|
|
$
|
52
|
|
|||
|
Total
|
$
|
—
|
|
$
|
52
|
|
$
|
—
|
|
$
|
52
|
|
|||
|
Liability Derivatives
|
|||||||||||||||
|
Credit
risk
|
Interest rate
risk
|
Equity price
risk
|
Total
|
||||||||||||
|
Credit derivatives
|
$
|
598
|
|
—
|
|
—
|
|
$
|
598
|
|
|||||
|
Total
|
$
|
598
|
|
$
|
—
|
|
$
|
—
|
|
$
|
598
|
|
|||
|
2012
|
|||||||||||||||
|
Asset Derivatives
|
|||||||||||||||
|
Credit
risk
|
Interest rate
risk
|
Equity price
risk
|
Total
|
||||||||||||
|
Credit derivatives
|
$
|
834
|
|
$
|
—
|
|
$
|
—
|
|
$
|
834
|
|
|||
|
Total
|
$
|
834
|
|
$
|
—
|
|
$
|
—
|
|
$
|
834
|
|
|||
|
Liability Derivatives
|
|||||||||||||||
|
Credit
risk
|
Interest rate
risk
|
Equity price
risk
|
Total
|
||||||||||||
|
Interest rate swaps
|
$
|
—
|
|
$
|
3,172
|
|
$
|
—
|
|
$
|
3,172
|
|
|||
|
Total
|
$
|
—
|
|
$
|
3,172
|
|
$
|
—
|
|
$
|
3,172
|
|
|||
82
TIPTREE FINANCIAL INC.
AND SUBSIDIARIES
AND SUBSIDIARIES
Notes to Consolidated Financial Statements
(in thousands, except shares and per share data)
December 31, 2013
The following tables identify the unrealized gain/(loss) amounts included within the change in unrealized (depreciation)/appreciation of the consolidated statement of operations, categorized by primary underlying risk, for the year ended December 31, 2013 and 2012:
|
Change in unrealized (depreciation)/appreciation - derivatives
|
|||||||||||||||
|
2013
|
|||||||||||||||
|
Credit
risk
|
Interest rate
risk
|
Equity price
risk
|
Total
|
||||||||||||
|
Credit derivatives
|
$
|
(1,582
|
)
|
$
|
—
|
|
$
|
—
|
|
$
|
(1,582
|
)
|
|||
|
Interest rate swaps
|
—
|
|
3,222
|
|
—
|
|
3,222
|
|
|||||||
|
Total
|
$
|
(1,582
|
)
|
$
|
3,222
|
|
$
|
—
|
|
$
|
1,640
|
|
|||
|
2012
|
|||||||||||||||
|
Credit
risk
|
Interest rate
risk
|
Equity price
risk
|
Total
|
||||||||||||
|
Credit derivatives
|
$
|
(852
|
)
|
$
|
—
|
|
$
|
—
|
|
$
|
(852
|
)
|
|||
|
Interest rate swaps
|
—
|
|
(519
|
)
|
—
|
|
(519
|
)
|
|||||||
|
Total
|
$
|
(852
|
)
|
$
|
(519
|
)
|
$
|
—
|
|
$
|
(1,371
|
)
|
|||
(8)
Investments in Loans Held at Amortized Cost
The components of the Company’s loan portfolio measured at amortized cost were as follows as of December 31, 2013 and 2012:
|
Year ended December 31,
|
|||||||
|
2013
|
2012
|
||||||
|
Commercial real estate
|
$
|
22,335
|
|
$
|
5,467
|
|
|
|
Asset backed
|
16,493
|
|
—
|
|
|||
|
Other loans
|
1,432
|
|
—
|
|
|||
|
Total loans, net
|
$
|
40,260
|
|
$
|
5,467
|
|
|
Total loans include net deferred loan origination fees of
$686
at December 31, 2013. There were no such fees recorded at December 31, 2012.
Commercial real estate - Westside
As of December 31, 2013 and 2012, the Company, through its subsidiary Care, had a loan investment that was secured by skilled nursing facilities, as well as collateral relating to assisted living facilities and a multifamily property. The properties securing the loan are all located in Louisiana. The loan investment was previously syndicated to
three
lenders (including the Company), each of which owned an approximate one-third interest in the loan at December 31, 2012. In March 2013, the Company purchased the remaining approximately two-thirds interest for
$17,258
. The Company performs a collateral valuation on these properties on an individual basis to determine if any impairment exists. As of both December 31, 2013 and 2012 no impairment existed on these properties.
Asset backed - Siena
Siena structures asset-based loan facilities in the
$1,000
to
$20,000
range across diversified industries which include manufacturing distribution, wholesale, and service companies. As of December 31, 2013, the Company carried
$16,493
83
TIPTREE FINANCIAL INC.
AND SUBSIDIARIES
AND SUBSIDIARIES
Notes to Consolidated Financial Statements
(in thousands, except shares and per share data)
December 31, 2013
in loans receivable on its consolidated balance sheet which is net of a participation interest of
$1,490
. Collateral for asset-backed loan receivables as of December 31, 2013 consisted of inventory, equipment and accounts receivable. Management reviews collateral for these loans on at least a monthly basis or more frequently if a draw is requested and as such has determined that no impairment existed as of December 31, 2013.
As of December 31, 2013, there were no delinquencies in the Siena portfolio and all loans were classified as performing.
Other loans
In August 2013, Care, through indirect subsidiaries of Care, acquired
two
assisted living and memory care facilities located in upstate New York for an aggregate purchase price of
$21,200
(Terraces Portfolio). The properties are leased to affiliates of Premier Senior Living, LLC (Premier), a privately-held owner and operator of senior housing facilities pursuant to a triple net master lease (Premier Master Lease). In connection therewith, an indirect subsidiary of Care, made a loan to the lessees of the properties. The loan is secured by a pledge of outstanding equity interest in the lessees. The cost basis in the loan at December 31, 2013 was approximately
$700
which equals its carrying value. In addition, the Company granted two loans totaling
$732
to two principals of Luxury Mortgage Corp.
Notes Receivable - Calamar Properties
In February 2013, Care acquired a
75%
interest in Care Cal JV LLC, which through
two
subsidiaries, owns what are referred to as the Calamar Properties. Affiliates of Calamar Enterprises, Inc. (Calamar) own a
25%
interest in Care Cal JV LLC. In connection therewith, a subsidiary of Care Cal JV LLC issued notes to affiliates of Calamar. The cost basis of the notes at December 31, 2013 was approximately $
3,561
.
(9)
Investments in Partially-Owned Entities
The following table summarizes the Company’s investments in partially-owned entities at December 31, 2013 and 2012:
|
Year ended December 31,
|
|||||||
|
Investment
|
2013
|
2012
|
|||||
|
Star Asia Opportunity, LLC
|
$
|
17
|
|
$
|
22
|
|
|
|
Star Asia Opportunity II, LLC
|
8,437
|
|
5,874
|
|
|||
|
Senior Management Concepts Senior Living Portfolio
|
—
|
|
2,492
|
|
|||
|
Luxury Mortgage Corp.
|
1,518
|
|
—
|
|
|||
|
$
|
9,972
|
|
$
|
8,388
|
|
||
Star Asia Opportunity, LLC
In August 2011, the Company acquired a
27.59%
interest in Star Asia Opportunity, LLC (SAO). SAO initially held a portfolio of
six
Japanese commercial real estate properties. During 2012, these properties were sold and the Company received distributions totaling
$4,982
. The remaining residual interest in SAO is expected to be distributed in 2014 at which time SAO will be dissolved.
Star Asia Opportunity, LLC II
In September 2012, the Company made a
$4,700
investment in Star Asia Opportunity II, LLC (SAO II), which represented a
20.33%
ownership interest. SAO II was a newly formed single purpose LLC vehicle which directly held a Japanese real estate property as well as a CMBS position. Including the Company, SAO II had a total of
four
investors. On December 20, 2012, SAO II contributed its interest in these assets to Star Asia Japan Special Situations Sub (SAJSS Sub), a newly formed LP. At that time, two of the investors withdrew their membership interests in SAO II so as to retain their interest in SAJSS Sub through a newly formed entity, Star Asia Japan Special Situations LP (SAJSS). As a result of the departure of these
two
investors, the Company and the other remaining investor each held a
50%
interest in SAO II. The Company and the remaining investor share control equitably with no one party having more control or economic interest than the other party. As such, the Company accounts for this investment under the equity method.
84
TIPTREE FINANCIAL INC.
AND SUBSIDIARIES
AND SUBSIDIARIES
Notes to Consolidated Financial Statements
(in thousands, except shares and per share data)
December 31, 2013
Senior Management Concepts Senior Living Portfolio
On December 31, 2013, the Company sold its interest in one independent and assisted living facility located in Utah held by a joint venture with an affiliate of Senior Management Concepts, LLC (SMC), a privately held operator of senior housing facilities. For the year ended December 31, 2013 and 2012, the Company recognized approximately
$333
and
$324
, respectively, in equity income from its interest in SMC.
Luxury Mortgage Corp.
In December 2013, the Company made a
$1,518
investment in Luxury Mortgage Corp. This investment is in the form of
151,875
shares of Series A Preferred Stock with a par value of $10 per share.
(10)
Investment in Real Estate
Acquisitions:
Greenfield Senior Living, Inc.
The Greenfield Senior Living, Inc. (Greenfield) portfolio was acquired by affiliates of Care in September 2011 and is leased pursuant to a Master Lease to affiliates of Greenfield with an initial term of
12
years with
two
renewal options of
10
years each. Rent payments during the first year are approximately
$1,661
, with annual rental increases of
2.75%
during the initial term of the lease. At the end of the initial term, Greenfield, subject to certain conditions, holds a one-time purchase option that provides the right to acquire all three of the properties at the then fair market value. Greenfield has guaranteed the obligations of the tenants under the master lease.
Calamar Properties
In February 2013, affiliates of Care entered into a joint venture with affiliates of Calamar Enterprises, Inc. (Calamar). Care Cal JV LLC is owned
75%
by affiliates of Care. Care Cal JV LLC through
two
subsidiaries owns what are referred to as the Calamar Properties. Calamar is a full service real estate organization with construction, development, management, and finance and investment divisions, developed the properties and owns a
25%
interest in Care Cal JV LLC. Simultaneously with the acquisition, affiliates of Care entered into a management agreement with a term of
10
years with affiliates of Calamar for the management of the properties. Care receives a preference on interim cash flows and sales proceeds. The aggregate purchase price allocated to the two properties was
$23,024
, of which
$18,307
was funded through the assumption of loans with Liberty Bank and the balance with cash on hand. For the year ended December 31, 2013, rental revenue and net income from this acquisition were approximately
$2,282
and
$137
, respectively.
Terraces Portfolio
The Terraces portfolio was acquired by affiliates of Care on August 16, 2013 and is leased pursuant to a Master Lease to affiliates of Premier with an initial term of
12
years with
two
renewal options of
five
years each. Rent payments during the first year are approximately
$1,732
, representing an initial lease rate of approximately
8.17%
, with annual rental increases of
2.75%
during the initial term of the lease commencing on the second anniversary of the closing date. Premier Senior Living, L.L.C. has guaranteed the obligations of the tenants under the Master Lease. The aggregate purchase price for the
two
properties was $
21,200
, which was funded with cash on hand. For the year ended December 31, 2013, rental revenue and net loss from this acquisition were approximately $
895
and $
149
, respectively.
Heritage Portfolio
On November 15, 2013, affiliates of Care entered into joint ventures to own and operate
two
senior housing communities with affiliates of Heritage Senior Properties, LLC and Heritage Senior Living, LLC (Heritage), a privately-held owner and operator of senior housing facilities in the northeast and mid-Atlantic. Affiliates of Care own an
80%
interest in the joint ventures, while affiliates of Heritage own the remaining
20%
interest and continue to provide management services to the communities under a management contract. The aggregate purchase price for the two properties was $
43,100
, of which
85
TIPTREE FINANCIAL INC.
AND SUBSIDIARIES
AND SUBSIDIARIES
Notes to Consolidated Financial Statements
(in thousands, except shares and per share data)
December 31, 2013
$
32,900
was funded through loans with First Niagara Bank and the balance with cash on hand. For the year ended December 31, 2013, rental revenue and net loss from this acquisition were approximately $
1,082
and $
901
, respectively.
We completed a preliminary assessment of the allocation of the fair value of the real estate acquired from Heritage (including land, buildings, and equipment) in accordance with ASC 805
Business Combinations.
The allocation of the purchase price is preliminary pending the receipt of information necessary to identify and measure the real estate acquired. The Company expects to finalize the purchase price allocation by March 31, 2014. These amounts relating to Heritage have been included within the Company’s investment in real estate balance as of December 31, 2013.
The following table contains information regarding the Company’s investment in real estate as of December 31, 2013 and 2012:
|
Year ended December 31,
|
|||||||
|
2013
|
2012
|
||||||
|
Land
|
$
|
9,213
|
|
$
|
10,620
|
|
|
|
Buildings and Improvements
|
97,671
|
|
116,222
|
|
|||
|
Less: Accumulated depreciation and amortization
|
(1,823
|
)
|
(8,015
|
)
|
|||
|
Total real estate, net
|
$
|
105,061
|
|
$
|
118,827
|
|
|
Future minimum annual rental revenue under the noncancelable terms of all operating leases at December 31, 2013 are as follows:
|
2014
|
$
|
3,486
|
|
|
2015
|
3,550
|
|
|
|
2016
|
3,647
|
|
|
|
2017
|
3,748
|
|
|
|
2018
|
3,851
|
|
|
|
Thereafter
|
24,075
|
|
|
|
Total
|
$
|
42,357
|
|
The schedule of minimum future rental revenue excludes residential lease agreements, generally having terms of one year or less. Rental revenue from residential leases was $
3,086
for the year ended December 31, 2013. There was no rental income from residential leases for the year ended December 31, 2012.
Dispositions:
Bickford Portfolio
On June 28, 2013, Care completed the sale of its membership interests in Care YBE Subsidiary LLC (Care YBE), which owns fourteen senior living facilities (Bickford Portfolio) to an affiliate of National Health Investors Inc. (Buyer) for proceeds of $
44,021
and a net gain of
$15,463
, which is classified as a gain on sale from discontinued operations. See Note 22—Dispositions, Assets Held for Sale and Discontinued Operations for further detail. The Bickford Portfolio, developed and managed by affiliates of Bickford Senior Living Group, L.L.C., contained
643
units with
six
properties located in Iowa,
five
in Illinois,
two
in Nebraska and
one
in Indiana.
86
TIPTREE FINANCIAL INC.
AND SUBSIDIARIES
AND SUBSIDIARIES
Notes to Consolidated Financial Statements
(in thousands, except shares and per share data)
December 31, 2013
(11)
Identifiable Intangible Assets and Goodwill
Insurance and Insurance Services
The following table summarizes the insurance and insurance services segment identifiable intangible assets and goodwill at:
|
Year ended December 31,
|
|||||||
|
2013
|
2012
|
||||||
|
Insurance servicing agreement
|
$
|
111,751
|
|
$
|
111,750
|
|
|
|
Accumulated amortization
|
(878)
|
|
(139)
|
|
|||
|
Software licensing
|
588
|
|
588
|
|
|||
|
Accumulated amortization
|
(122)
|
|
—
|
|
|||
|
Insurance policies and contracts acquired
|
44,787
|
|
44,787
|
|
|||
|
Accumulated amortization
|
(5,008)
|
|
(3,408)
|
|
|||
|
Insurance licensing agreements (1)
|
2,518
|
|
2,518
|
|
|||
|
Goodwill
|
3,088
|
|
3,088
|
|
|||
|
Total
|
$
|
156,724
|
|
$
|
159,184
|
|
|
(1) Represents an intangible with an indefinite useful life. Impairment tests are performed at least annually on these assets
.
The following table represents insurance and insurance services segment’s amortization expense on intangible assets for the next five years:
|
2014
|
$
|
3,032
|
|
|
2015
|
3,103
|
|
|
|
2016
|
3,235
|
|
|
|
2017
|
3,669
|
|
|
|
2018
|
3,654
|
|
|
|
Total
|
$
|
16,693
|
|
The insurance and insurance services segment had as of both December 31, 2013 and 2012,
$3,088
recorded as goodwill on its balance sheet. The Company assesses annually for impairment its goodwill and intangibles with indefinite lives, or more often if events and circumstances indicate it is more likely than not that impairment exists.
As of December 31, 2013 and 2012, there was no impairment recorded on this goodwill or intangibles.
Real Estate
The following table summarizes the real estate segment identifiable intangible assets at:
|
Year ended December 31,
|
|||||||
|
2013
|
2012
|
||||||
|
Leases in place (1)
|
$
|
1,254
|
|
$
|
7,673
|
|
|
|
Accumulated amortization (1)
|
(195
|
)
|
(1,357
|
)
|
|||
|
Total
|
$
|
1,059
|
|
$
|
6,316
|
|
|
|
(1)
|
Reflects the reversal of above market leases due to the Bickford properties discontinued operations as of December 31, 2013 (see Notes 10 and 22). As of December 31, 2012, the total above market leases was
$2,674
.
|
87
TIPTREE FINANCIAL INC.
AND SUBSIDIARIES
AND SUBSIDIARIES
Notes to Consolidated Financial Statements
(in thousands, except shares and per share data)
December 31, 2013
The following table represents real estate segment’s amortization expense on intangible assets for the next five years:
|
2014
|
$
|
105
|
|
|
2015
|
105
|
|
|
|
2016
|
105
|
|
|
|
2017
|
105
|
|
|
|
2018
|
105
|
|
|
|
Total
|
$
|
525
|
|
The Company conducts annual impairment tests according to ASC 350
Intangibles-Goodwill and Other.
As of December 31, 2013 and 2012, there was no impairment recorded on intangibles.
Specialty Finance
The specialty finance segment had as of December 31, 2013,
$1,206
recorded as goodwill on its balance sheets. The Company assesses annually, or more often if events and circumstances indicate that it is more likely than not that goodwill may be impaired
.
As of December 31, 2013, there was no impairment recorded on this goodwill.
88
TIPTREE FINANCIAL INC.
AND SUBSIDIARIES
AND SUBSIDIARIES
Notes to Consolidated Financial Statements
(in thousands, except shares and per share data)
December 31, 2013
(12) Debt
The long term debt of Tiptree’s subsidiaries are discussed below:
Operating Company
On December 28, 2012, Operating Company issued a note payable in the amount of
$2,500
with an annual interest rate of
5%
. This note was payment for
6.60%
of the issued and outstanding Series A preferred stock and
8.80%
of the issued and outstanding common shares of PFG. The term of this note is
eighteen
months commencing on December 28, 2012. On December 31, 2013 this note payable was paid in full.
On September 18, 2013, Operating Company entered into a Credit Agreement with Fortress Credit Corp. (Fortress) and borrowed
$50,000
thereunder, with an associated original issue discount of
$1,000
, which is being amortized over the term of the agreement. The Credit Agreement allows Operating Company to borrow additional amounts up to a maximum aggregate of
$125,000
, subject to satisfaction of certain customary conditions. The obligations of Operating Company under the Credit Agreement are secured by liens on substantially all of the assets of Operating Company. The principal of, and all accrued and unpaid interest on, all loans under the Credit Agreement become immediately due and payable on
September 18, 2018
. Loans under the Credit Agreement bear interest at a variable rate per annum equal to one-month
LIBOR
(with a minimum LIBOR rate of
1.25%
), plus a margin of
6.50%
per annum. The weighted average rate paid for 2013 was
7.75%
. The principal amounts of the loan is to be repaid in quarterly installments, the amount of which may be adjusted based on the Net Leverage Ratio (as defined in the Credit Agreement) at the end of each fiscal quarter.
As of December 31, 2013,
$49,500
in principal was outstanding and was recorded as part of debt on the consolidated balance sheet of the Company. The company is obligated to pay interest on a monthly basis and has incurred interest expense of
$1,119
for the year ended December 31, 2013.
The Company capitalized approximately
$1,308
of costs associated with transaction and is amortizing the costs ratably over the life of the facility. The Company recorded approximately
$74
of expense for the year ended December 31, 2013 relating to these capitalized costs.
Also included in debt are any warehouse lines outstanding associated with the Company’s CLOs. As of December 31, 2013 there was
$133,715
outstanding for Telos 5.
Operating Company believes it was in compliance with all of the financial covenants contained in the Credit Agreement as of December 31, 2013.
PFG
In connection with the PFAS Transaction described in Note 1, PFAS issued a note in July 2012 in the amount of
$100,000
to a third party. The note bears an annual interest rate of
12.66%
and provides for monthly interest and principal payments commencing on August 15, 2012, with final payment due on July 15, 2022. Membership interests of PFLAC, the borrower, serve as collateral for the note.
PFG believes it was in compliance with all of the financial covenants contained in the note as of December 31, 2013.
Care
On April 24, 2012, Care refinanced a bridge loan for the acquisition of the Greenfield properties by entering into
three
separate non-recourse loans (each a Greenfield Loan and collectively the Greenfield Loans) with KeyCorp Real Estate Capital Markets, Inc. (KeyCorp) for an aggregate amount of approximately
$15,680
. The Greenfield Loans bear interest at a fixed rate of
4.76%
, amortize over a
thirty
-year period, provide for monthly interest and principal payments commencing on
June 1, 2012
and mature on
May 1, 2022
. The Greenfield Loans are secured by separate cross-collateralized, cross-defaulted first priority deeds of trust on each of the Greenfield properties. The Greenfield Loans
89
TIPTREE FINANCIAL INC.
AND SUBSIDIARIES
AND SUBSIDIARIES
Notes to Consolidated Financial Statements
(in thousands, except shares and per share data)
December 31, 2013
are non-recourse to the Company except for certain non-recourse carveouts (customary for transactions of this type), as provided in the related guaranty agreements for each Greenfield Loan. A breach of the representations or covenants could result in a default under each of the Greenfield Loans, which would result in all amounts owing under each of the Greenfield Loans to become immediately due and payable since all of the Greenfield Loans are cross-defaulted. In June 2012, KeyCorp sold each of the Greenfield Loans to Federal Home Loan Mortgage Corporation (Freddie Mac) under Freddie Mac’s Capital Markets Execution (CME) Program.
Effective February 2013, in connection with Care’s acquisition of the Calamar Properties, affiliates of Care entered into
two
separate loans from Liberty Bank with an aggregate balance of
$18,017
as of December 31, 2013. Both of these loans amortize over a
thirty
year period at a weighted average fixed rate of
4.21%
. These loans are secured by separate first priority mortgages on each of the properties. A breach of representations or covenants could result in a default under each of these loans, which would result in all amounts owing under the applicable loan to become immediately due and payable.
In December 2013, affiliates of Care refinanced an internal bridge loan for the Terraces Portfolio, by entering into
two
separate loans from First Niagara Bank with an aggregate balance of
$15,975
as of December 31, 2013. Both of these loans amortize over a
twenty-five
year period at a weighted average floating rate of LIBOR +
2.50%
. These loans are secured by separate first priority mortgages on each of the properties. A breach of representations or covenants could result in a default under each of these loans, which would result in all amounts owing under applicable loan to become immediately due and payable.
Effective November 2013, in connection with the acquisition of The Heritage Portfolio, the Company entered into
two
separate loans from First Niagara Bank with an aggregate balance of
$32,848
as of December 31, 2013. Both of these loans amortize over a
twenty-five
year period at a floating rate of LIBOR +
2.75%
. These loans are secured by separate first priority mortgages on each of the properties. A breach of representations or covenants could result in a default under each of these loans, which would result in all amounts owing under applicable loan to become immediately due and payable.
Each of these loan transactions described above contains typical representations and covenants for loans of its type. As of December 31, 2013, management believes Care is in compliance with such covenants.
Siena
On July 25, 2013 Siena closed on a line of credit with Wells Fargo Bank. This revolving line is for
$65,000
with an interest rate of LIBOR plus
250
basis points and a maturity date of
January 25, 2017
. As of December 31, 2013 there was
$5,371
outstanding on this line.
90
TIPTREE FINANCIAL INC.
AND SUBSIDIARIES
AND SUBSIDIARIES
Notes to Consolidated Financial Statements
(in thousands, except shares and per share data)
December 31, 2013
The following table summarizes the balance of the Company’s debt holdings excluding notes payable of consolidated VIE CLOs at (See Note 3 for notes payable of the consolidated VIE CLOs):
|
Year ended December 31,
|
|||||||
|
2013
|
2012
|
||||||
|
Operating Company:
|
|||||||
|
Note payable
|
$
|
—
|
|
$
|
2,500
|
|
|
|
Warehouse borrowing
|
133,715
|
|
—
|
|
|||
|
Revolving credit facility
|
49,500
|
|
—
|
|
|||
|
Original issue discount on credit facility
|
(943
|
)
|
—
|
|
|||
|
Subtotal Operating Company
|
182,272
|
|
2,500
|
|
|||
|
PFG:
|
|||||||
|
Note payable
|
91,015
|
|
97,917
|
|
|||
|
Siena:
|
|||||||
|
Revolving line of credit
|
5,371
|
|
—
|
|
|||
|
Care:
|
|||||||
|
Mortgage borrowings
|
82,151
|
|
94,859
|
|
|||
|
Unamortized (discount)/premium
|
(200
|
)
|
372
|
|
|||
|
Subtotal Care
|
81,951
|
|
95,231
|
|
|||
|
Total debt
|
$
|
360,609
|
|
$
|
195,648
|
|
|
Interest expense of
$17,410
and
$8,096
was incurred on the Company’s debt for the year ended December 31, 2013 and 2012 respectively.
Future maturities of the Company’s long-term debt (excluding warehouse borrowing) are as follows as of December 31, 2013:
|
2014
|
$
|
11,252
|
|
|
2015
|
13,665
|
|
|
|
2016
|
13,739
|
|
|
|
2017
|
19,620
|
|
|
|
2018
|
54,423
|
|
|
|
Thereafter
|
115,339
|
|
|
|
Total
|
$
|
228,038
|
|
Consolidated CLOs
The Company includes in its consolidated balance sheets, as part of liabilities of consolidated CLOs, the debt obligations used to finance the investment in corporate loans and other investments owned by the CLOs that it manages. The carrying amount of the notes represents the accreted value from the initial consolidation and is recognized through the measurement date using the effective interest method or a method that approximates the effective interest method. See Note 3 for additional information.
(13) Income Taxes
91
TIPTREE FINANCIAL INC.
AND SUBSIDIARIES
AND SUBSIDIARIES
Notes to Consolidated Financial Statements
(in thousands, except shares and per share data)
December 31, 2013
The Company’s tax expense consists of the following:
|
Year Ended December 31,
|
|||||||
|
2013
|
2012
|
||||||
|
Current tax expense:
|
|||||||
|
Federal
|
$
|
3,080
|
|
$
|
1,353
|
|
|
|
State
|
1,634
|
|
(2,364
|
)
|
|||
|
$
|
4,714
|
|
$
|
(1,011
|
)
|
||
|
Deferred tax expense:
|
|||||||
|
Federal
|
2,866
|
|
389
|
|
|||
|
State
|
(639
|
)
|
301
|
|
|||
|
2,227
|
|
690
|
|
||||
|
Total income tax expense (benefit)
|
$
|
6,941
|
|
$
|
(321
|
)
|
|
The Company's income taxes payable as of December 31, 2013 are
$1,811
.
The total income tax expense of
$6,941
for the period ended December 31, 2013 is reflected as a component of net income (loss) from continuing operations. This tax expense represents a consolidated total of all of Tiptree’s subsidiaries and includes
$6,355
related to PFG. In addition, Tiptree incurred approximately
$2,137
current federal and state income tax expense as a result of the gain on sale of the Bickford Portfolio (see Notes 10 and 22). A significant portion of the gain was reduced by available net operating loss carryforwards that were previously unrecorded as a result of Care, Inc.’s historical 0% statutory income tax rate in effect as of December 31, 2012 and June 30, 2013, prior to the Contribution Transaction. The tax associated with the Bickford portfolio gain is included with tax expense from continuing operations, rather than with discontinued operations because it arose as a result of Tiptree’s termination of REIT status, described below.
As a result of the Contribution Transaction on July 1, 2013, Tiptree no longer qualifies as a REIT, therefore Tiptree is no longer eligible to deduct the amount of distributions paid to shareholders and became a fully taxable corporation. Pursuant to the Internal Revenue Code, when a corporation loses REIT status within a tax year it becomes taxable retroactively to the first day of the tax year. As of July 1, 2013, an adjustment of
$2,583
was made to the Company’s deferred tax assets as a result of the Company no longer qualifying as a REIT.
A reconciliation of the expected federal income tax expense on income from continuing operations using the 35% federal statutory income tax rate to the actual income tax expense and resulting effective income tax rate as of December 31, 2013 is as follows:
|
Income before income taxes from continuing operations
|
$
|
6,249
|
|
|
Federal statutory income tax rate
|
35
|
%
|
|
|
Expected federal income tax expense at 35%
|
2,187
|
|
|
|
State income tax expense, net of federal benefit
|
681
|
|
|
|
Effect of permanent differences
|
(99
|
)
|
|
|
Effect of changes in valuation allowance
|
827
|
|
|
|
Effect of change in tax status
|
677
|
|
|
|
Effect of income allocated to non-taxable entities
|
(3,224
|
)
|
|
|
Effect of tax in net income attributable to the VIE subordinated noteholders
|
6,315
|
|
|
|
Deferred tax true-up and other items
|
(423
|
)
|
|
|
Tax on income from continuing operations
|
$
|
6,941
|
|
|
Effective tax rate
|
111.07
|
%
|
|
92
TIPTREE FINANCIAL INC.
AND SUBSIDIARIES
AND SUBSIDIARIES
Notes to Consolidated Financial Statements
(in thousands, except shares and per share data)
December 31, 2013
For the twelve months ended December 31, 2013, the Company’s effective tax rate on income from continuing operations is equal to
111.07%
, which does not bear a customary relationship to statutory income tax rates. Differences from the statutory income tax rates are primarily the result of: (i) income and (loss) attributable to noncontrolling interests and to the VIE subordinated noteholders which do not result in income tax expense or (benefit) to the Company, (ii) the one-time effect of the Company’s change from nontaxable to taxable status which must be reported as part of the income tax provision on continuing operations, and (iii) the effect of changes in valuation allowance on net operating losses reported by Siena, MFCA and a portion of net operating losses reported by PFG. Prior periods do not have comparable effective tax rates as the Company, as a REIT, was not subject to income taxes.
The table below outlines the Company’s net deferred tax asset as of the respective balance sheet dates:
|
Year Ended December 31,
|
|||||||
|
2013
|
2012
|
||||||
|
Net operating loss carryforward
|
$
|
11,748
|
|
$
|
10,061
|
|
|
|
Capital loss carryforward
|
9
|
|
7,771
|
|
|||
|
Other
|
1,141
|
|
1,291
|
|
|||
|
Total deferred tax assets
|
12,898
|
|
19,123
|
|
|||
|
Valuation allowance
|
(1,511
|
)
|
(8,344
|
)
|
|||
|
Total net deferred tax assets
|
11,387
|
|
10,779
|
|
|||
|
Amortization/depreciation
|
7,531
|
|
5,104
|
|
|||
|
Unrealized gain
|
28
|
|
291
|
|
|||
|
Equity gain/loss
|
321
|
|
—
|
|
|||
|
Distributions
|
178
|
|
—
|
|
|||
|
Other
|
19
|
|
42
|
|
|||
|
Total deferred tax liabilities
|
8,077
|
|
5,437
|
|
|||
|
Net deferred tax asset
|
$
|
3,310
|
|
$
|
5,342
|
|
|
Separate returns are filed for Tiptree and each of the Company’s subsidiaries that are required to file returns (PFG, Siena Capital Finance Acquisition Corp., MFCA Funding, and TAMCO Manager Inc.). These subsidiaries file returns in various state jurisdictions, and as such may have state tax obligations. As needed, the Company will take all necessary steps to comply with any tax withholding requirements.
As of December 31, 2013, the Company had total net operating loss carryforwards (“NOLs”) equal to
$18,665
arising from life insurance operations and
$11,510
arising from non-life insurance operations. The NOLs expire according to the following schedule:
93
TIPTREE FINANCIAL INC.
AND SUBSIDIARIES
AND SUBSIDIARIES
Notes to Consolidated Financial Statements
(in thousands, except shares and per share data)
December 31, 2013
|
Tax Year of Expiration
|
“Life” NOLs
|
“Non-Life” NOLs
|
Total
|
||||||
|
2023-2025
|
$
|
760
|
|
$
|
1,255
|
|
$
|
2,015
|
|
|
2026
|
8,381
|
|
368
|
|
8,749
|
|
|||
|
2027
|
9,281
|
|
1,018
|
|
10,299
|
|
|||
|
2028
|
243
|
|
612
|
|
855
|
|
|||
|
2029
|
—
|
|
304
|
|
304
|
|
|||
|
2030
|
—
|
|
6,365
|
|
6,365
|
|
|||
|
2031
|
—
|
|
150
|
|
150
|
|
|||
|
2032
|
—
|
|
189
|
|
189
|
|
|||
|
2033
|
—
|
|
1,249
|
|
1,249
|
|
|||
|
Total
|
$
|
18,665
|
|
$
|
11,510
|
|
$
|
30,175
|
|
Valuation allowances have been established for net operating loss carryforwards generated by MFCA Management, Siena , and a portion of net operating loss carryforwards generated by PFG, to the extent management has assessed it is more likely than not they will expire unutilized based on existing positive and negative evidence. Management believes it is more likely than not the remaining net operating loss carryforwards will be utilized prior to their expiration dates.
The Company’s primary tax jurisdiction is the United States, which currently has a statutory income tax rate equal to
35%
. The Company also operates in several state jurisdictions that have an average combined statutory rate equal to approximately
6%
. Both the U.S. federal rate and the statutory rates are before the consideration of rate reconciling items. As of December 31, 2013 and 2012, the Company had no material unrecognized tax benefits or accrued interest and penalties. The Company’s policy is to account for interest as a component of interest expense and penalties as a component of other expense. Federal tax years 2010 through 2012 were open for examination as of December 31, 2013.
On September 13, 2013, the Internal Revenue Service issued final Tangible Property Regulations (TPR) under Internal Revenue Code (IRC) Section 162 and IRC Section 263(a), which prescribe the capitalization treatment of certain repair costs, asset betterments and other costs which could affect temporary deferred taxes. Although the regulations are not effective until tax years beginning on or after January 1, 2014, certain portions may require an accounting method change on a retroactive basis, thus requiring an IRC Section 481(a) adjustment related to fixed and real asset deferred taxes. Pursuant to U.S. GAAP, as of the date of the issuance, the release of the regulations is treated as a change in tax law. Therefore, we are required to determine whether there will be an impact on our financial statements as of December 31, 2013. We have analyzed the expected impact of the new regulations on our financial position at October 31, 2013 and determined that such impact is not significant. We will continue to monitor any future changes in the TPR prospectively.
(14)
Separate Accounts
Information regarding the separate accounts as of and for the periods ended December 31, 2013 and 2012 is as follows:
|
Nonguaranteed Separate Accounts
|
|||||||
|
2013
|
2012
|
||||||
|
Premiums, considerations or deposits
|
$
|
407,892
|
|
$
|
363,169
|
|
|
|
Reserves:
For accounts with assets values at fair value
|
4,623,039
|
|
4,032,895
|
|
|||
|
Total reserves
|
4,623,039
|
|
4,032,895
|
|
|||
|
By withdrawal characteristics:
Subject to discretionary withdrawal at fair value
|
4,623,039
|
|
4,032,895
|
|
|||
|
Total reserves
|
$
|
4,623,039
|
|
$
|
4,032,895
|
|
|
94
TIPTREE FINANCIAL INC.
AND SUBSIDIARIES
AND SUBSIDIARIES
Notes to Consolidated Financial Statements
(in thousands, except shares and per share data)
December 31, 2013
(15) Stockholders’ Equity
On July 1, 2013, immediately prior to closing the Contribution Transactions, the Company filed the Fourth Articles of Amendment and Restatement with the Maryland Department of Assessments and Taxation in order to, among other things, rename its common stock as “Class A common stock”, with no change to the economic or voting rights of such stock and reclassify
50,000,000
authorized and unissued shares of its common stock as Class B common stock.
Tiptree’s authorized capital stock consists of
100,000,000
shares of preferred stock,
$0.001
par value,
200,000,000
shares of Class A common stock,
$0.001
par value, and
50,000,000
shares of Class B common stock,
$0.001
par value. As of December 31, 2013 and December 31, 2012, no shares of preferred stock were issued and outstanding. As of December 31, 2013 and December 31, 2012 there were
10,556,390
and
10,226,250
shares of Class A common stock issued and outstanding, respectively. As of December 31, 2013 and December 31, 2012, there were
30,968,877
and no shares of Class B common stock issued and outstanding, respectively.
All shares of our Class A common stock have equal rights as to earnings, assets, dividends and voting. Shares of Class B common stock have equal voting rights but no economic rights (including no right to receive dividends or other distributions upon liquidation, dissolution or otherwise). Distributions may be paid to holders of Class A common stock if, as and when duly authorized by our board of directors and declared out of assets legally available therefor.
On July 1, 2013, in conjunction with the Contribution Transactions, Operating Company issued warrants to TFP, to purchase an aggregate of
2,098,500
shares of Class A common stock at an exercise price of
$8.48
per share which is immediately exercisable and expires on June 12, 2017 and another warrant to purchase
1,510,920
shares of Class A common stock at an exercise price of
$5.36
per share which is immediately exercisable and expires on June 30, 2022. TFP paid
$4,328
and
$6,846
, respectively, for these. Since these warrants were issued by Operating Company, they are not included as a component of stockholders’ equity of the Company. TFP also owns a warrant to purchase 652,500 shares of Class A common stock at $11.33 per share which is immediately exercisable and expires on September 30, 2018.
Pursuant to Operating Company’s limited liability operating agreement, at any time after July 1, 2014, TFP will have the right to redeem common units of Operating Company (including any common units issued upon exercise of the warrants described above) for an equal number of shares of Class A common stock of Tiptree (and an equal number of shares of Class B common stock held by TFP will be canceled). Tiptree may instead, at its election, deliver a cash amount (or combination of cash and Class A common stock) based on the fair market value of the Class A common stock on the redemption date.
For the year ended December 31, 2013, the Company declared and paid quarterly cash dividends in the first three quarters of
$0.135
,
$0.02
and
$0.02
per common share of Class A stock totaling
$1,804
.
(16) Stock Based Compensation
Equity Plans
In June 2007, the Company adopted the Care Investment Trust Inc. Equity Plan (2007 Equity Plan), as amended in December 2011, which provides for the issuance of equity-based awards, including stock options, stock appreciation rights, restricted stock, restricted stock units, unrestricted stock awards and other awards based upon the Company’s Class A common stock that may be made to directors and executive officers, employees and to the Company’s advisors and consultants who are providing services to the Company as of the date of the grant of the award.
The 2007 Equity Plan will automatically expire on the 10th anniversary of the date it was adopted. The Board of Directors may terminate, amend, modify or suspend the 2007 Equity Plan at any time, subject to stockholder approval in the case of certain amendments as required by law, regulation or stock exchange.
As of December 31, 2013, no common shares remain for future issuance.
95
TIPTREE FINANCIAL INC.
AND SUBSIDIARIES
AND SUBSIDIARIES
Notes to Consolidated Financial Statements
(in thousands, except shares and per share data)
December 31, 2013
The following table summarizes changes to the issuances of Restricted Stock Units under the Company’s 2007 Equity Plan for the periods indicated:
|
Number of shares
|
||
|
Unvested units as of December 31, 2011
|
100,153
|
|
|
Granted
|
33,600
|
|
|
Vested
|
—
|
|
|
Forfeited
|
(30,769
|
)
|
|
Unvested units as of December 31, 2012
|
102,984
|
|
|
Granted
|
19,310
|
|
|
Vested
|
(45,263
|
)
|
|
Forfeited
|
(4,728
|
)
|
|
Unvested units as of December 31, 2013
|
72,303
|
|
Included in vested shares for 2013 are
10,159
shares surrendered to pay taxes on behalf of the employees with shares vesting.
Shares of common stock issued to the Company’s independent directors in respect to their annual retainer fees have been issued under the 2007 Equity Plan and the 2013 Equity Plan. During the year ended December 31, 2013, the Company issued
10,834
immediately vested shares of Class A common stock with an aggregate fair value of
$79
to the Company’s independent directors as part of their annual retainer. As of December 31, 2013,
131,190
shares of immediately vested Class A common stock with an aggregate fair market value of
$963
were issued to employees and persons providing services to the Company as incentive compensation under the 2007 Equity Plan.
The Board adopted the Tiptree 2013 Omnibus Incentive Plan (2013 Equity Plan) on August 8, 2013. The general purpose of the 2013 Equity Plan is to attract, motivate and retain selected employees, consultants and directors for the Company, to provide them with incentives and rewards for superior performance and to better align their interests with the interests of the Company’s stockholders. As of December 31, 2013,
150,569
shares of immediately vested Class A common stock with an aggregate fair market value of
$1,105
were issued to employees and persons providing services to the Company as incentive compensation under the 2013 Equity Plan. An additional amount of shares is expected to be issued as incentive compensation for 2013 once 2014 financial information is finalized. The number of shares of Tiptree’s Class A common stock available for award under the 2013 Equity Plan is
1,849,431
shares of Class A common stock. Unless otherwise extended by the Board, the 2013 Equity Plan terminates automatically on August 8, 2023, the tenth anniversary of its adoption by the Board. As of December 31, 2013, there was no restricted stock unit activity associated with the 2013 Equity Plan.
The following table summarizes changes to the issuances under the Company’s 2013 Equity Plan for activity in 2013:
|
Number of shares
|
||
|
Available for issuance as of August 8, 2013
|
2,000,000
|
|
|
Shares Issued
|
(150,569
|
)
|
|
Available for issuance as of December 31, 2013
|
1,849,431
|
|
In June 2007, the Company adopted the Care Investment Trust Inc. Manager Equity Plan, which will automatically expire on the 10th anniversary of the date it was adopted. There were
1,325,635
common shares reserved for future issuances under the Manager Equity Plan. As of December 31, 2013,
134,629
common shares remain available for future issuances. No shares have been issued since March 30, 2012 from this plan.
Restricted share units
96
TIPTREE FINANCIAL INC.
AND SUBSIDIARIES
AND SUBSIDIARIES
Notes to Consolidated Financial Statements
(in thousands, except shares and per share data)
December 31, 2013
A holder of the restricted share units, as per the terms of the restricted stock unit agreement governing the awards, have all of the rights of a share holder, including the right to vote and receive distributions. The restricted share units shall vest and become nonforfeitable with respect to one‑third of Tiptree shares granted on each of the first, second, and third anniversaries of the date of the grant.
On August 8, 2013 the Company granted
19,310
shares to employees of the Company. These shares have a grant date fair value of
$134
and will vest over a period of three years beginning on January 3, 2014. During 2012 the Company granted
33,600
shares with a grant date fair value of
$252
which vest over a three year period.
As of December 31, 2013, the total unrecognized compensation cost related to restricted units was
$446
, which is expected to be recognized as compensation expense over a weighted average period of
2.5
years.
Restricted unit expense was
$73
and
$31
for the twelve month periods ended December 31, 2013 and 2012, respectively. These expenses are included within payroll expense in the consolidated statement of operations.
Philadelphia Financial Group, Inc.
On October 14, 2010, the PFG board of directors adopted the PFG Plan. A total of
546,136
shares of common stock of PFG were reserved and available for issuance under the PFG Plan. The number of shares of PFG stock was increased to
583,300
during 2012. As of December 31, 2013,
564,092
shares have been granted to PFG employees.
Under the terms of the PFG Plan, the common stock shares shall vest and become nonforfeitable with respect to one-third of the shares initially granted on each of the first, second, and third anniversaries of the grant date. Grant dates were April 16, 2012, December 19, 2012 and March 8, 2013.
The Company has determined that the measurement date for shares granted under the PFG Plan awarded to employees occurs when the PFG common stock vests. The fair value of the unvested common stock granted is initially estimated based on the fair value of the individual assets and liabilities of PFG on the date of grant, and subsequently re-measured on each reporting date throughout the vesting period with changes in fair value during the requisite service period recognized as compensation cost through that period. The per unit fair value of unvested PFG common stock was
$2.03
and
$4.05
as of December 31, 2013 and December 31, 2012, respectively.
As of December 31, 2013 the total unrecognized compensation cost related to PFG common stock was
$89
, which is expected to be recognized as compensation expense over a weighted average period of
1.4
years. Total unrecognized compensation cost was
$155
as of December 31, 2012.
Expense incurred for PFG stock issued under the plan for the years ended December 31, 2013 and 2012, respectively, was
$65
and
$42
.
(17)
Related Party Transactions
(a) Tricadia Holdings, L.P.
On June 30, 2012, TAMCO, TFP and Tricadia entered into a Transition Services Agreement in connection with the internalization of the management of Tiptree. Pursuant to this agreement, Tricadia provides TAMCO and its affiliates, including TFP, with the services of designated officers as well as certain back office, administrative, information technology, insurance, legal and accounting services. The Transition Services Agreement was assigned to the Company in connection with the Contribution Transactions. The Company pays Tricadia specified prices per service. TFP paid Tricadia
$1,684
and
$817
for 2013 and 2012, respectively. For the six months ended December 31, 2012, TFP issued
37,500
TFP units which were redeemed for
104,925
shares of Class A common stock under the Transition Services Agreement. For the year ended December 31, 2013, the Company issued
194,868
shares of Class A common stock to Tricadia under the Transition Services Agreement.
(b) Mariner Investment Group LLC
TFP and BackOffice Services Group, Inc. (BOSG) entered into an Administrative Services Agreement on June 12, 2007 (Administrative Services Agreement), which was assigned to the Operating Company on July 1, 2013 in connection with
97
TIPTREE FINANCIAL INC.
AND SUBSIDIARIES
AND SUBSIDIARIES
Notes to Consolidated Financial Statements
(in thousands, except shares and per share data)
December 31, 2013
the Contribution Transactions, under which BOSG provides the services of Patrick Huvane, our Chief Accounting Officer, and certain back office, administrative and accounting services to the Company. BOSG is an affiliate of Mariner Investment Group (Mariner). Under the Administrative Services Agreement, the Company pays BOSG a quarterly fee of
0.025%
of the Company’s Net Assets, defined as the Company’s total assets less total liabilities, including accrued income and expense, calculated in accordance with GAAP. This fee totaled
$379
and
$321
in 2013 and 2012, respectively. The Administrative Services Agreement has successive
one year
terms but may be terminated by the Company or BOSG upon
60
days prior notice.
(18)
Concentration of Credit Risk
(a) Counterparties
The Company is subject to certain inherent credit risks arising from its transactions involving counterparties to CDS and CDX and IRS positions.
As of December 31, 2013, the CDS and CDX positions have a notional amount of
$3,985
and
$20,000
and a fair value of
$4
and
$594
. The counterparty for the CDS and CDX positions are Bank of America, N.A. and Morgan Stanley.
As of December 31, 2013, the IRS positions have an aggregate notional amount of
$43,988
and a fair value of
$52
. The counterparty for the IRS positions is First Niagara Bank.
The Company’s policy is to monitor its market exposure and counterparty risk through the use of various credit exposure reporting and control procedures.
(b) Transactions with Custodians and Trustees
Tiptree, TAMCO and Care maintain unrestricted cash and cash equivalents and certain financial positions in accounts held by J.P. Morgan Securities Inc., its custodian pursuant to a custodial agreement. MFCA held substantially all of its cash and cash equivalents with U.S. Bank. PFG held substantially all of its cash and cash equivalents with Wilmington Trust. If these and other agents do not fulfill their obligations, the Company may be exposed to risk. The risk of default depends on the creditworthiness of the agent. The Company limits its credit risk by selecting financial institutions considered to be highly creditworthy.
(19)
Reinsurance
PFG reinsures portions of its insurance risks with other insurers as is customary in the industry. The following table provides additional information on PFG’s direct and ceded business as of December 31, 2013 and 2012:
|
Direct
amount
|
Ceded
to other
companies
|
Net
amount
|
|||||||||
|
December 31, 2013:
|
|||||||||||
|
Life insurance in force
|
$
|
4,768,385
|
|
$
|
3,483,656
|
|
$
|
1,284,729
|
|
||
|
Deposits
|
409,498
|
|
11,068
|
|
398,430
|
|
|||||
|
December 31, 2012:
|
|||||||||||
|
Life insurance in force
|
$
|
4,717,279
|
|
$
|
3,587,345
|
|
$
|
1,129,934
|
|
||
|
Deposits
|
342,244
|
|
10,537
|
|
331,707
|
|
|||||
PFG participates in reinsurance arrangements with third parties as a means of limiting mortality risks and providing capacity for growth. The reinsurance is accomplished primarily with yearly renewable term treaties, which account for ceded life insurance in force of
$3,396,361
as of December 31, 2013. Reserves in the amount of
$1,675
are ceded to these reinsurers at December 31, 2013. The remaining ceded life insurance in force of
$87,296
at December 31, 2013 relates to coinsurance
98
TIPTREE FINANCIAL INC.
AND SUBSIDIARIES
AND SUBSIDIARIES
Notes to Consolidated Financial Statements
(in thousands, except shares and per share data)
December 31, 2013
arrangements explained below. Reserves in the amount of
$7,459
at December 31, 2013 were ceded under these coinsurance agreements.
PFG through its subsidiaries, PFLAC and PFLACNY, is a party to
two
reinsurance agreements with a reinsurance company (the reinsurer). Under the first reinsurance agreement, the reinsurer assumed as direct obligations approximately
90%
of PFLAC’s in force ordinary life and annuity business and
100%
of PFLAC’s accident and health business.
Under the second reinsurance agreement PFLAC reinsured all of its remaining in-force ordinary life and annuity business to the reinsurer. The amount coinsured with the reinsurer is
100%
of the policy obligations relating to the business. During December 31, 2013 and 2012, PFG ceded premiums of
$11,068
and
$10,537
respectively, to reinsurers and reported ceded death benefits of
$542
and $
2,385
for the twelve month period ended December 31, 2013 and 2012, respectively.
Should any reinsurer be unable to fulfill its obligation at the time of a claim, the ultimate liability remains with PFG as primary insurer. PFG evaluates the financial condition of its reinsurers and monitors concentrations of credit risk arising from activities or economic characteristics of the reinsurers in order to minimize exposure to significant loss from reinsurer insolvencies.
(20)
Commitments and Contingencies
Contractual Obligations
The table below summarizes the Company’s contractual obligations by period that payments are due as of December 31, 2013:
|
Less than one year
|
1-3 years
|
3-5 years
|
More than 5 years
|
Total
|
|||||||||||||||
|
Mortgage notes payable
and related interest (1)
|
$
|
5,232
|
|
$
|
10,702
|
|
$
|
11,105
|
|
$
|
80,666
|
|
$
|
107,705
|
|
||||
|
Notes payable (2)
|
7,667
|
|
20,000
|
|
21,417
|
|
41,931
|
|
91,015
|
|
|||||||||
|
Notes payable CLOs (3)
|
—
|
|
—
|
|
—
|
|
1,341,701
|
|
1,341,701
|
|
|||||||||
|
Fortress Credit Agreement (4)
|
2,000
|
|
4,000
|
|
43,500
|
|
—
|
|
49,500
|
|
|||||||||
|
Operating lease obligations (5)
|
1,518
|
|
1,813
|
|
1,798
|
|
1,308
|
|
6,437
|
|
|||||||||
|
Revolving line of credit (6)
|
—
|
|
—
|
|
5,371
|
|
—
|
|
5,371
|
|
|||||||||
|
Total
|
$
|
16,417
|
|
$
|
36,515
|
|
$
|
83,191
|
|
$
|
1,465,606
|
|
$
|
1,601,729
|
|
||||
|
(1)
|
Mortgage notes payable include mortgage notes entered into by the Company in connection with its acquisition of several properties (See Note 12—Debt).
|
|
(2)
|
Note payable relates to PFG’s acquisition of the administrative services rights from The Hartford and TFP payment for Series A preferred stock and common shares of PFG (See Note 12—Debt).
|
|
(3)
|
CLO notes payable principal is payable at stated maturity, 2021 for Telos 1, 2022 for Telos 2, 2024 for Telos 3 and 2024 for Telos 4 (See Note 3—CLOs and Consolidated Variable Interest Entities).
|
|
(4)
|
On September 18, 2013 Operating Company entered into a Credit Agreement with Fortress and borrowed
$50,000
under the Credit Agreement. The Credit Agreement also includes an option for Operating Company to borrow additional amounts up to a maximum aggregate of
$125,000
, subject to satisfaction of certain customary conditions (See Note 12—Debt).
|
|
(5)
|
Minimum rental obligations for Care, Siena and PFG office leases. For the twelve month periods ended December 31, 2013 and 2012, rent expense for the Company’s office leases were
$1,530
and
$935
, respectively.
|
|
(6)
|
On July 25, 2013, TFI’s subsidiary Siena closed on a line of credit with Wells Fargo Bank. This revolving line is for
$65,000
with an interest rate of LIBOR plus 250 basis points and a maturity date of January 25, 2017. As of December 31, 2013 there was
$5,371
outstanding on this line (See Note 12—Debt).
|
Litigation
99
TIPTREE FINANCIAL INC.
AND SUBSIDIARIES
AND SUBSIDIARIES
Notes to Consolidated Financial Statements
(in thousands, except shares and per share data)
December 31, 2013
Tiptree and its subsidiaries are parties to legal proceedings in the ordinary course of their business. Although Tiptree’s legal and financial liability with respect to such proceedings cannot be estimated with certainty, Tiptree does not believe that these proceedings, either individually or in the aggregate, are likely to have a material adverse effect on Tiptree’s financial position or results of operations.
(21)
Earnings Per Share
The Company calculates basic net income per common share based on the Company’s common stock outstanding as well as its unvested restricted share units. The unvested restricted share units are included because they are eligible to receive dividends. Diluted net income for the period takes into account the effect of dilutive instruments, such as any options on common shares, but uses the average share price for the period in determining the number of incremental shares that are to be added to the weighted average number of common shares outstanding. Diluted net income also includes the minimal dilutive impact of the
3,609,420
Operating Company warrants held by TFP as part of the Contribution Transactions as summarized in Note 1. Earnings per share data excludes Tiptree’s Class B common stock, as the Class B common stock evidences a voting right without any economic interest.
The following table presents a reconciliation of basic and diluted net income per common share for the years ended December 31, 2013 and 2012:
|
Year Ended December 31,
|
||||||||
|
2013
|
2012
|
|||||||
|
Basic:
|
||||||||
|
Net income
|
$
|
8,845
|
|
$
|
8,729
|
|
||
|
Weighted average number of Class A common shares outstanding (basic)
|
10,250,438
|
|
10,286,412
|
|
||||
|
Basic earnings per share
|
$
|
0.86
|
|
$
|
0.85
|
|
||
|
Diluted:
|
||||||||
|
Net income
|
$
|
8,807
|
|
$
|
8,729
|
|
||
|
Weighted average number Class A common shares outstanding (diluted)
|
10,250,438
|
|
10,286,412
|
|
||||
|
Diluted earnings per share
|
$
|
0.86
|
|
$
|
0.85
|
|
||
The above table excludes the anti-dilutive effect of the 2008 warrant convertible into
652,500
shares because the exercise price of
$11.33
was greater than the average market price during such periods.
(22)
Dispositions, Assets Held for Sale and Discontinued Operations
The Company has reclassified the income and expenses attributable to all properties sold prior to December 31, 2013 to discontinued operations related to its real estate segment. Expenses include an allocation of interest expense based on property carrying values and cost of debt. The following illustrates the reclassification impact as a result of classifying properties as discontinued operations for the periods presented:
100
TIPTREE FINANCIAL INC.
AND SUBSIDIARIES
AND SUBSIDIARIES
Notes to Consolidated Financial Statements
(in thousands, except shares and per share data)
December 31, 2013
|
Year Ended December 31,
|
||||||||
|
2013
|
2012
|
|||||||
|
Revenues:
|
||||||||
|
Rental revenue
|
$
|
5,920
|
|
$
|
12,052
|
|
||
|
Reimbursable income
|
655
|
|
1,329
|
|
||||
|
Expenses:
|
||||||||
|
Reimbursable expense
|
550
|
|
1,304
|
|
||||
|
Interest expense
|
2,627
|
|
5,573
|
|
||||
|
Other expenses
|
43
|
|
—
|
|
||||
|
Depreciation and amortization
|
1,708
|
|
3,622
|
|
||||
|
Income (loss) from discontinued operations, net
|
$
|
1,647
|
|
$
|
2,882
|
|
||
(23)
Accumulated Other Comprehensive Income
Activity in accumulated other comprehensive income/(loss) (AOCI), net of tax, for the year ended December 31, 2013 and 2012, was as follows:
|
Unrealized gains/ (losses) on securities
|
Total
|
||||||
|
Balance at December 31, 2011
|
$
|
374
|
|
$
|
374
|
|
|
|
Period change
|
(63
|
)
|
(63
|
)
|
|||
|
Balance at December 31, 2012
|
$
|
311
|
|
$
|
311
|
|
|
|
Balance at December 31, 2012
|
$
|
311
|
|
$
|
311
|
|
|
|
Other comprehensive loss before reclassification
|
(224
|
)
|
(224
|
)
|
|||
|
Amounts reclassified from AOCI
|
54
|
|
54
|
|
|||
|
Period change
|
(278
|
)
|
(278
|
)
|
|||
|
Balance at December 31, 2013
|
$
|
33
|
|
$
|
33
|
|
|
101
TIPTREE FINANCIAL INC.
AND SUBSIDIARIES
AND SUBSIDIARIES
Notes to Consolidated Financial Statements
(in thousands, except shares and per share data)
December 31, 2013
The following table presents the reclassification adjustments out of AOCI included in net income and the impacted line items on the income statement for the period ended December 31, 2013:
|
Components of AOCI
|
Amount reclassified from AOCI
|
Affected line item in statement where net income is presented
|
||||
|
Unrealized gains/ (losses) on available for sale securities
|
||||||
|
$
|
83
|
|
Net realized gains on investments
|
|||
|
83
|
|
Net change before tax
|
||||
|
29
|
|
Provision for income tax
|
||||
|
$
|
54
|
|
Net change after tax
|
|||
(24) Subsequent Events
On January 31, 2014, the Company completed a strategic transaction with Luxury, a residential lender that originates conforming, FHA, prime jumbo and super jumbo mortgages for sale to institutional investors. The Company owns
67.5%
of the equity of Luxury and will consolidate the operations of Luxury beginning in the first quarter of 2014.
On March 14, 2014,
28,869
shares of immediately vested Class A Common Stock with an aggregate market value of
$216
were issued to employees and persons providing services to the Company as incentive compensation for 2013 under the 2013 Equity Plan.
The Company has evaluated events that have occurred from December 31, 2013 through March 18, 2014 (the date this Form 10-K was filed), and except as already included in the notes to the consolidated financial statements, it believes that no events have occurred that would require recognition or additional disclosures in these audited consolidated financial statements.
102
Not applicable.
Tiptree completed the Contribution Transactions on July 1, 2013, and as a result is disclosing a change to internal control over financial reporting related thereto. The businesses contributed by TFP in the Contribution Transactions are excluded from management’s annual certifications pursuant to Section 906 and Section 302 of the Sarbanes-Oxley Act of 2002. Management is in the process of evaluating internal control over financial reporting for the businesses contributed by TFP and expects that the assessment will be completed with Tiptree’s December 31, 2014 Annual Report on Form 10-K.
The Company’s management, with the participation of its Chief Executive Officer and Chief Financial Officer, has evaluated the effectiveness of the design and operation of our disclosure controls and procedures (as defined in Rule 13a-15(e) or 15d-15(e) of the Exchange Act) as of December 31, 2013. Based upon that evaluation the Company’s Chief Executive Officer and Chief Financial Officer have concluded that as of December 31, 2013, the Company’s disclosure controls and procedures were effective in causing material information relating to the Company to be recorded, processed, summarized and reported by management in a timely basis and ensuring the quality and timeliness of the Company’s public disclosures with SEC disclosure obligations.
Management’s Annual Report on Internal Control over Financial Reporting
The Company’s management is responsible for establishing and maintaining adequate internal control over financial reporting for Tiptree. The Company’s internal control over financial reporting is designed to provide reasonable assurance regarding the reliability of financial reporting and the preparation of consolidated financial statements for external purposes in accordance with generally accepted accounting principles. The Company’s internal control over financial reporting includes those policies and procedures that:
(i) pertain to the maintenance of records that, in reasonable detail, accurately and fairly reflect the transactions and dispositions of the assets of the Company;
(ii) provide reasonable assurance that transactions are recorded as necessary to permit preparation of consolidated financial statements in accordance with generally accepted accounting principles, and that receipts and expenditures of the Company are being made only in accordance with authorizations of management and directors of the Company; and
(iii) provide reasonable assurance regarding prevention or timely detection of unauthorized acquisition, use or disposition of the Company’s assets that could have a material effect on the consolidated financial statements.
Because of its inherent limitations, internal control over financial reporting may not prevent or detect misstatements. Also, projections of any evaluation of the effectiveness to future periods are subject to the risk that controls may become inadequate because of changes in conditions, or that the degree of compliance with the policies and procedures included in such controls may deteriorate.
The Company conducted an evaluation of the effectiveness of its internal control over financial reporting based upon the framework in Internal Control - Integrated Framework issued by the Committee of Sponsoring Organizations of the Treadway Commission. Based upon such evaluation, Tiptree’s management concluded that internal control over financial reporting was effective as of December 31, 2013.
The Company’s independent auditor did not conduct an audit of or render any report with respect to internal control over financial reporting as of December 31, 2013 because the Company is neither an accelerated filer nor a large accelerated filer.
None.
103
Information concerning our executive officers is incorporated herein by reference to information included in the Proxy Statement for the Company’s 2014 Annual Meeting of Stockholders.
Information with respect to our directors and the nomination process is incorporated herein by reference to information included in the Proxy Statement for the Company’s 2014 Annual Meeting of Stockholders.
Information regarding our audit committee and our audit committee financial experts is incorporated herein by reference to information included in the Proxy Statement for the Company’s 2014 Annual Meeting of Stockholders.
Information required by Item 405 of Regulation S-K is incorporated herein by reference to information included in the Proxy Statement for the Company’s 2014 Annual Meeting of Stockholders.
Information with respect to executive compensation is incorporated herein by reference to information included in the Proxy Statement for the Company’s 2014 Annual Meeting of Stockholders.
Information with respect to security ownership of certain beneficial owners and management is incorporated herein by reference to information included in the Proxy Statement for the Company’s 2014 Annual Meeting of Stockholders.
Information with respect to such contractual relationships and independence is incorporated herein by reference to the information in the Proxy Statement for our 2014 Annual Meeting of Stockholders.
Information with respect to principal accounting fees and services and pre-approval policies are incorporated herein by reference to information included in the Proxy Statement for the Company’s 2014 Annual Meeting of Stockholders.
104
|
The following documents are filed as a part of this Form 10-K:
|
|
|
|
|
|
Financial Statements:
|
|
|
Consolidated Balance Sheet as of December 31, 2013 and 2012
|
|
|
Consolidated Statement of Operations for the years ended December 31, 2013 and 2012
|
|
|
Consolidated Statement of Other Comprehensive Income for the years ended December 31, 2013 and 2012
|
|
|
Consolidated Statement of Stockholders' Equity for the years ended December 31, 2013 and 2012
|
|
|
Consolidated Statement of Cash Flows for the years ended December 31, 2013 and 2012
|
|
|
Notes to Consolidated Financial Statements
|
|
|
|
|
|
Exhibits:
|
|
|
The Exhibits listed in the Index of Exhibits, which appears immediately following the signature page and is incorporated herein by reference, as filed as part of this Form 10-K.
|
|
SIGNATURES
Pursuant to the requirements of Section 13 or 15(d) of the Securities Exchange Act of 1934, Tiptree Financial, Inc. has duly caused this report to be signed on its behalf by the undersigned, there unto duly authorized.
Tiptree Financial Inc.
Date:
March 18, 2014
By:
/s/ Geoffrey N. Kauffman
Geoffrey N. Kauffman
Chief Executive Officer
Pursuant to the requirements of the Securities Act, this Annual Report on Form 10-K, has been signed by the following persons in the capacities and on the dates indicated:
|
Signature
|
|
Title
|
|
Date
|
|
/s/ Geoffrey N. Kauffman
Geoffrey N. Kauffman
|
|
President and Chief Executive Officer and Director (Principal Executive Officer)
|
|
March 18, 2014
|
|
/s/ Julia Wyatt
Julia Wyatt
|
|
Chief Financial Officer (Principal Financial Officer)
|
|
March 18, 2014
|
|
/s/ Patrick Huvane
Patrick Huvane
|
|
Chief Accounting Officer (Principal Accounting Officer)
|
|
March 18, 2014
|
|
/s/ Michael G. Barnes
Michael G. Barnes
|
|
Executive Chairman and Director
|
|
March 18, 2014
|
|
/s/ William A. Houlihan
William A. Houlihan
|
|
Director
|
|
March 18, 2014
|
|
/s/ Jonathan Ilany
Jonathan Ilany
|
|
Director
|
|
March 18, 2014
|
|
/s/ Richard Price
Richard Price
|
|
Director
|
|
March 18, 2014
|
|
/s/ Bradley E. Smith
Bradley E. Smith
|
|
Director
|
|
March 18, 2014
|
105
E
EXHIBIT INDEX
Exhibit No.
Description
|
2.1
|
Contribution Agreement by and between the Registrant, Tiptree Operating Company, LLC and Tiptree Financial Partners, L.P., dated December 31, 2012 (previously filed as Exhibit 2.1 to the Registrant’s Current Report on Form 8-K (File No. 001-33549), filed on January 3, 2013 and herein incorporated by reference).
|
|
3.1
|
Fourth Articles of Amendment and Restatement of the Registrant, effective July 1, 2013 (previously filed as Exhibit 3.1 to the Registrant’s Current Report on Form 8-K (File No. 001-33549), filed on July 2, 2013 and herein incorporated by reference).
|
|
3.2
|
Third Amended and Restated Bylaws of the Registrant (previously filed as Exhibit 3.1 to the Registrant’s Current Report on Form 8-K (File No. 001-33549), filed on November 8, 2010 and herein incorporated by reference).
|
|
4.1
|
Form of Certificate for Class A Common Stock (previously filed as Exhibit 4.1 to the Registrant’s Registration Statement on Form 8-A/A, as amended (File No. 001-33549), filed on August 8, 2013 and herein incorporated by reference).
|
|
4.2
|
Amended and Restated Limited Liability Company Agreement of Tiptree Operating Company, LLC, dated July 1, 2013 (previously filed as Exhibit 4.2 to the Registrant’s Current Report on Form 8-K (File No. 001-33549), filed on July 2, 2013 and herein incorporated by reference).
|
|
4.3
|
Registration Rights Agreement, dated July 1, 2013, between the Registrant and Tiptree Financial Partners, L.P. (previously filed as Exhibit 4.1 to the Registrant’s Current Report on Form 8-K (File No. 001-33549), filed on July 2, 2013 and herein incorporated by reference).
|
|
4.4
|
Registration Rights Agreement by and between the Registrant and Tiptree Financial Partners, L.P., dated as of March 16, 2010 (previously filed as Exhibit 10.2 to the Registrant’s Current Report on Form 8-K (File No. 001-33549), filed on March 16, 2010 and herein incorporated by reference).
|
|
10.1
|
Warrant to Purchase Common Stock, dated as of September 30, 2008 (previously filed as Exhibit 10.2 to the Registrant’s Current Report on Form 8-K (File No. 001-33549), filed on October 2, 2008 and herein incorporated by reference).
|
|
10.2
|
Care Investment Trust Inc. Equity Plan (previously filed as Exhibit 10.4 to the Registrant’s Quarterly Report on Form 10-Q (File No. 001-33549), filed on August 14, 2007 and herein incorporated by reference).**
|
|
10.3
|
Care Investment Trust Inc. Manager Equity Plan (previously filed as Exhibit 10.5 to the Registrant’s Quarterly Report on Form 10-Q (File No. 001-33549), filed on August 14, 2007 and herein incorporated by reference).**
|
|
10.4
|
Form of Restricted Stock Agreement under the 2007 Care Investment Trust Inc. Equity Plan (previously filed as Exhibit 10.5 to the Registrant’s Registration Statement on Form S-11, as amended (File No. 333-141634), filed on June 7, 2007 and herein incorporated by reference).**
|
|
10.5
|
Form of Restricted Stock Agreement under the 2007 Care Investment Trust Inc. Equity Plan (previously filed as Exhibit 10.6 to the Registrant’s Registration Statement on Form S-11, as amended (File No. 333-141634), filed on June 7, 2007 and herein incorporated by reference).**
|
|
10.6
|
Form of Restricted Stock Agreement under the 2007 Care Investment Trust Inc. Manager Equity Plan (previously filed as Exhibit 10.8 to the Registrant’s Registration Statement on Form S-11, as amended (File No. 333-141634), filed on June 7, 2007 and herein incorporated by reference).**
|
|
10.7
|
Form of Amended and Restated Performance Share Award Agreement under the Care Investment Trust Inc. Equity Plan (previously filed as Exhibit 10.30 to the Registrant’s Annual Report on Form 10-K (File No. 001-33549), filed on March 16, 2010 and herein incorporated by reference).**
|
|
10.8
|
Tiptree Financial Inc. 2013 Omnibus Incentive Plan (previously filed as Exhibit 10.1 to the Registrant’s Current Report on Form 8-K (File No. 001-33549), filed on November 12, 2013 and herein incorporated by reference). **
|
|
10.9
|
Form of Indemnification Agreement (previously filed as Exhibit 10.9 to the Registrant’s Registration Statement on Form S-11, as amended (File No. 333-141634), filed on June 7, 2007 and herein incorporated by reference).
|
106
E
|
10.10
|
Amended and Restated Executive Employment Agreements, dated as of July 1, 2013, among the Registrant, Tiptree Asset Management, LLC and Geoffrey Kauffman (previously filed as Exhibit 10.1 to the Registrant’s Quarterly Report on Form 10-Q (File No. 001-33549), filed on August 13, 2013 and herein incorporated by reference). **
|
|
10.11
|
Master Transaction Agreement, dated as of November 22, 2011, among Hartford Life Insurance Company, Hartford Life and Annuity Insurance Company and Philadelphia Financial Administration Services Company (previously filed as Exhibit 10.3 to the Registrant’s Quarterly Report on Form 10-Q (File No. 001-33549), filed on August 13, 2013 and herein incorporated by reference).
|
|
10.12
|
Administrative Services Agreement by and among Hartford Life Insurance Company, Hartford Life and Annuity Insurance Company, Hartford Fire Insurance Company and Philadelphia Financial Administration Services Company, LLC effective July 14, 2012 (previously filed as Exhibit 10.4 to the Registrant’s Quarterly Report on Form 10-Q (File No. 001-33549), filed on August 13, 2013 and herein incorporated by reference).
|
|
10.13
|
Senior Note Purchase Agreement by and among Philadelphia Financial Administration Services Company, LLC, as the Issuer and Fiscal Agent, RGA Worldwide Reinsurance Company, Ltd., as Noteholder, RGA Reinsurance Company, as Collateral Agent, PFASC Holdings, LLC and Philadelphia Financial Group, Inc., dated as July 13, 2012 (previously filed as Exhibit 10.5 to the Registrant’s Quarterly Report on Form 10-Q (File No. 001-33549), filed on August 13, 2013 and herein incorporated by reference).
|
|
10.14
|
Transition Services Agreement, dated as of June 30, 2012, among Tiptree Asset Management Company, LLC, Tricadia Holdings, L.P. and Tiptree Operating Company, LLC (as assignee of Tiptree Financial Partners, L.P.) (previously filed as Exhibit 10.6 to the Registrant’s Quarterly Report on Form 10-Q (File No. 001-33549), filed on August 13, 2013 and herein incorporated by reference).
|
|
10.15
|
Credit Agreement, dated as of September 18, 2013, between Tiptree Operating Company, LLC and Fortress Credit Corp. as Lender, Administrative Agent, Collateral Agent and Lead Arranger (previously filed as Exhibit 10.1 to Form 8-K (File No. 001-33549), filed September 20, 2013 and herein incorporated by reference).
|
21.1 Subsidiaries of the Registrant (filed herewith).
23.1 Consent of Independent Registered Public Accounting Firm (filed herewith).
31.1 Certification of Chief Executive Officer pursuant to Section 302 of the Sarbanes-Oxley Act of 2002 (filed herewith).
31.2 Certification of Chief Financial Officer pursuant to Section 302 of the Sarbanes-Oxley Act of 2002 (filed herewith).
32.1 Certification of Chief Executive Officer pursuant to Section 906 of the Sarbanes-Oxley Act of 2002 (furnished
herewith).
|
32.2
|
Certification of Chief Financial Officer pursuant to Section 906 of the Sarbanes-Oxley Act of 2002 (furnished herewith).
|
101.INS XBRL Instance Document*
101.SCH XBRL Taxonomy Extension Schema Document*
101.CAL XBRL Taxonomy Extension Calculation Linkbase Document*
101.LAB XBRL Taxonomy Extension Label Linkbase Document*
101.PRE XBRL Taxonomy Extension Presentation Linkbase Document*
101.DEF XBRL Taxonomy Extension Definition Linkbase Document*
* Attached as Exhibit 101 to this Annual Report on Form 10-K are the following materials, formatted in XBRL (eXtensible Business Reporting Language): (i) the Consolidated Balance Sheet (audited) for December 31, 2013 and December 31, 2012, (ii) the Consolidated Statement of Operations (audited) for the years ended December 31, 2013 and 2012, (iii) the Consolidated Statement of Comprehensive Income (audited) for the years ended December 31, 2013 and 2012, (iv) the Consolidated Statement of Changes in Stockholders’ Equity (audited) for the years ended December 31, 2013 and 2012, (v) the Consolidated Statement of Cash Flows (audited) for the years ended December 31, 2013 and 2012 and (vi) the Notes to the Consolidated Financial Statements (audited).
107
E
** Denotes a management contract or compensatory plan, contract or arrangement.
108
TABLE OF CONTENTS
Part IItem 1. BusinessItem 1A. Risk FactorsItem 1B. Unresolved Staff CommentsItem 2. PropertiesItem 3. Legal ProceedingsItem 4. Mine Safety DisclosuresPart IIItem 5. Market For Registrant S Common Equity, Related Stockholder Matters and Issuer Purchases Of Equity SecuritiesItem 6. Selected Financial DataItem 7. Management S Discussion and Analysis Of Financial Condition and Results Of OperationsItem 7A. Quantitative and Qualitative Disclosures About Market RiskItem 8. Financial Statements and Supplementary DataItem 9. Changes in and Disagreements with Accountants on Accounting and Financial DisclosureItem 9A. Controls and ProceduresItem 9B. Other InformationPart IIIItem 10. Directors, Executive Officers and Corporate GovernanceItem 11. Executive CompensationItem 12. Security Ownership Of Certain Beneficial Owners and Management and Related Stockholder MattersItem 13. Certain Relationships and Related Transactions, and Director IndependenceItem 14. Principal Accounting Fees and ServicesPart IVItem 15. Exhibits, Financial Statement Schedules