TIPTREE INC.
10-Ks and 10-Qs
|
|
|
|
|
|
|
|
|
|
|
|
|
|
|
|
|
|
|
|
|
|
|
|
|
|
|
|
|
|
|
|
|
|
|
|
|
|
|
|
|
|
|
|
|
|
|
|
|
|
|
|
|
|
|
|
|
|
|
E
UNITED STATES
SECURITIES AND EXCHANGE COMMISSION
Washington, D.C. 20549
FORM 10-K
|
(Mark One)
|
|
|
x
|
Annual Report Pursuant to Section 13 or 15(d) of the Securities Exchange Act of 1934
|
For the fiscal year ended December 31, 2014
OR
|
o
|
Transition Report Pursuant to Section 13 or 15(d) of the Securities Exchange Act of 1934
|
For the transition period from to
Commission File Number: 001-33549
Tiptree Financial Inc.
(Exact name of Registrant as Specified in Its Charter)
|
Maryland
|
38-3754322
|
|
(State or Other Jurisdiction of
|
(IRS Employer
|
|
Incorporation of Organization)
|
Identification No.)
|
|
780 Third Avenue, 21st Floor, New York, New York
|
10017
|
|
(Address of Principal Executive Offices)
|
(Zip Code)
|
(212) 446-1400
(Registrant’s Telephone Number, Including Area Code)
Securities Registered Pursuant to Section 12(b) of the Act: Class A Common Stock, par value $0.001 per share
Securities Registered Pursuant to Section 12(g) of the Act: None
Indicate by check mark if the registrant is a well-known seasoned issuer, as defined in Rule 405 of the Securities Act. Yes
¨
No
x
Indicate by check mark if the registrant is not required to file reports pursuant to Section 13 or Section 15(d) of the Act. Yes
¨
No
x
Indicate by check mark whether the registrant: (1) has filed all reports required to be filed by Section 13 or 15(d) of the Securities Exchange Act of 1934 during the preceding 12 months (or for such shorter period that the registrant was required to file such reports), and (2) has been subject to such filing requirements for the past 90 days. Yes
x
No
¨
Indicate by check mark whether the registrant has submitted electronically and posted on its corporate Web site, if any, every Interactive Data File required to be submitted and posted pursuant to Rule 405 of Regulation S-T (§232.405 of this chapter) during the preceding 12 months (or for such shorter period that the registrant was required to submit and post such files). Yes
x
No
¨
Indicate by check mark if disclosure of delinquent filers pursuant to Item 405 of Regulation S-K (§ 229.405) is not contained herein, and will not be contained, to the best of registrant’s knowledge, in definitive proxy or information statements incorporated by reference in Part III of this Form 10-K or any amendment to this Form 10-K.
¨
Indicate by check mark whether the registrant is a large accelerated filer, an accelerated filer, a non-accelerated filer or a smaller reporting company. See the definitions of “large accelerated filer,” “accelerated filer” and “smaller reporting company” in Rule 12b-2 of the Exchange Act. (Check one):
Large accelerated filer
¨
Accelerated filer
¨
Non-accelerated filer
¨
Smaller reporting company
x
Indicate by check mark whether the registrant is a shell company (as defined in Rule 12b-2 of the Exchange Act.) Yes
¨
No
x
As of June 30, 2014, the last business day of the registrant’s most recently completed second fiscal quarter, the aggregate market value of the registrant’s voting and non-voting common equity held by non-affiliates of the registrant was
$73,895,060
, based upon the closing sales price of $8.70 per share as reported on the NASDAQ Capital Market. For purposes of this calculation, all of the registrant’s directors and executive officers were deemed to be affiliates of the registrant.
As of March 27, 2015, there were
31,992,470
shares, par value $0.001, of the registrant’s Class A common stock outstanding and
9,770,367
shares, par value $0.001, of the registrant’s Class B common stock outstanding.
Documents Incorporated by Reference
Certain information in the registrant’s definitive proxy statement to be filed with the Commission relating to the registrant’s 2015 Annual Meeting of Stockholders is incorporated by reference into Part III.
Tiptree Financial Inc.
Table of Contents
Forward-Looking Statements
Except for the historical information included and incorporated by reference in this Annual Report on Form 10-K, the information included and incorporated by reference herein are “forward-looking statements” within the meaning of Section 27A of the Securities Act and Section 21E of the Exchange Act. Forward-looking statements provide our current expectations or forecasts of future events and are not statements of historical fact. These forward-looking statements include information about possible or assumed future events, including, among other things, discussion and analysis of our future financial condition, results of operations and our strategic plans and objectives. When we use words such as “anticipate,” “believe,” “estimate,” “expect,” “intend,” “seek,” “may,” “might,” “plan,” “project,” “should,” “target,” “will,” or similar expressions, we intend to identify forward-looking statements.
The forward-looking statements are not guarantees of future performance and are subject to risks, uncertainties and other factors, many of which are beyond our control, are difficult to predict and could cause actual results to differ materially from those expressed or forecasted in the forward-looking statements. Our actual results could differ materially from those anticipated in these forward-looking statements as a result of various factors, including, but not limited to, those described in the section entitled “Risk Factors” in this Annual Report on Form 10-K.
The factors described herein are not necessarily all of the important factors that could cause actual results or developments to differ materially from those expressed in any of our forward-looking statements. Other unknown or unpredictable factors also could affect our forward-looking statements. Consequently, our actual performance could be materially different from the results described or anticipated by our forward-looking statements. Given these uncertainties, you should not place undue reliance on these forward-looking statements. Except as required by the federal securities laws, we undertake no obligation to update any forward-looking statements.
Note to Reader
In reading this Annual Report on Form 10-K, references to:
“1940 Act” means the Investment Company Act of 1940, as amended.
“Administrative Services Agreement” means the Administrative Services Agreement between Operating Company (as assignee of TFP) and BackOffice Services Group, Inc., dated as of June 12, 2007.
“AUM” means assets under management.
“Blackstone” means The Blackstone Group L.P.
“Care” means Care Inc. and Care LLC, collectively.
“Care Inc.” means Care Investment Trust Inc. prior to the Contribution Transactions.
“Care LLC” means Care Investment Trust LLC.
“CFPB” means the Consumer Financial Protection Bureau.
“CLOs” means collateralized loan obligations.
“Code” means the Internal Revenue Code of 1986, as amended.
“COLI/ BOLI” means company owned life insurance and bank owned life insurance.
“Contribution Transactions” means the closing on July 1, 2013 of the transactions pursuant to the Contribution Agreement by and between the Company, Operating Company and TFP, dated as of December 31, 2012.
“Dodd-Frank Act” means the Dodd-Frank Wall Street Reform and Consumer Protection Act.
“EBITDA” means earnings before interest, taxes, depreciation and amortization.
1
“Exchange Act” means the Securities Exchange Act of 1934, as amended.
“Fortress” means Fortress Credit Corp., as administrative agent, collateral agent and lead arranger, and affiliates of Fortress that are lenders under the Credit Agreement among the Company, Fortress and the lenders party thereto.
“Fortegra” means Fortegra Financial Corporation.
“GAAP” means U.S. generally accepted accounting principles.
“Gramm-Leach-Bliley Act” means the Gramm-Leach-Bliley Act of 1999.
“HIPAA” means the Health Insurance Portability and Accountability Act of 1996.
“Luxury” means Luxury Mortgage Corp.
“Mariner” means Mariner Investment Group LLC.
“MCM” means Muni Capital Management, LLC.
“MFCA” means Muni Funding Company of America LLC.
“NAIC” means the National Association of Insurance Commissioners.
“NPPF I” means Non-Profit Preferred Funding Trust I.
“Operating Company” means Tiptree Operating Company, LLC.
“PFAS” means Philadelphia Financial Administration Services Company, LLC.
“PFAS Transaction” means PFG’s purchase of assets and administrative servicing rights of COLI/BOLI business from The Hartford in 2012.
“PFG” means Philadelphia Financial Group, Inc.
“PFLAC” means Philadelphia Financial Life Assurance Company.
“PFLAC NY” means Philadelphia Financial Life Assurance Company of New York.
“Reliance” means Reliance First Capital, LLC.
“SEC” means the U.S. Securities and Exchange Commission.
“Securities Act” means the Securities Act of 1933, as amended.
“Siena” means Siena Capital Finance LLC.
“Star Asia Entities” means collectively Star Asia Finance, Limited, Star Asia Opportunity, LLC, Star Asia Opportunity II, LLC and Star Asia SPV, LLC.
“Synovus” means Synovus Bank.
“TAMCO” means Tiptree Asset Management Company, LLC.
“Telos” means Telos Asset Management, LLC.
“Telos 1” means Telos CLO 2006-1, Ltd.
“Telos 2” means Telos CLO 2007-2, Ltd.
“Telos 3” means Telos CLO 2013-3, Ltd.
2
“Telos 4” means Telos CLO 2013-4, Ltd.
“Telos 5” means Telos CLO 2014-5, Ltd.
“Telos 6” means Telos CLO 2014-6, Ltd.
“TFP” means Tiptree Financial Partners, L.P.
“Tiptree”, the “Company”, “we”, “its”, “us” and “our” means, unless otherwise indicated by the context, Operating Company and its consolidated subsidiaries, together with the standalone net assets held by Tiptree Financial.
“Tiptree Direct” means Tiptree Direct Holdings LLC.
“Tiptree Financial” or “TFI”, means Tiptree Financial Inc.
“Transition Services Agreement” means the Transition Services Agreement among TAMCO, Tricadia and Operating Company (as assignee of TFP), dated as of June 30, 2012.
“Tricadia” means Tricadia Holdings, L.P.
“Westside Loan” means that certain loan by Care which was secured by skilled nursing facilities as well as collateral relating to assisted living facilities and a multifamily property.
OVERVIEW
Tiptree Financial is a holding company that primarily acquires and manages control interests of operating businesses. The Company, whose operations date back to 2007, currently owns subsidiaries that operate in the following industries: insurance and insurance services, specialty finance, asset management and real estate. The Company’s principal investments are included in a corporate and other segment. See “Item 1. Business — Operating Businesses” and Note 6 — Operating Segment Data, to the accompanying consolidated financial statements for detailed information regarding our segments. Tiptree Financial’s Class A common stock trades on the NASDAQ Capital Market. Tiptree Financial’s Class B common stock have voting but no economic rights.
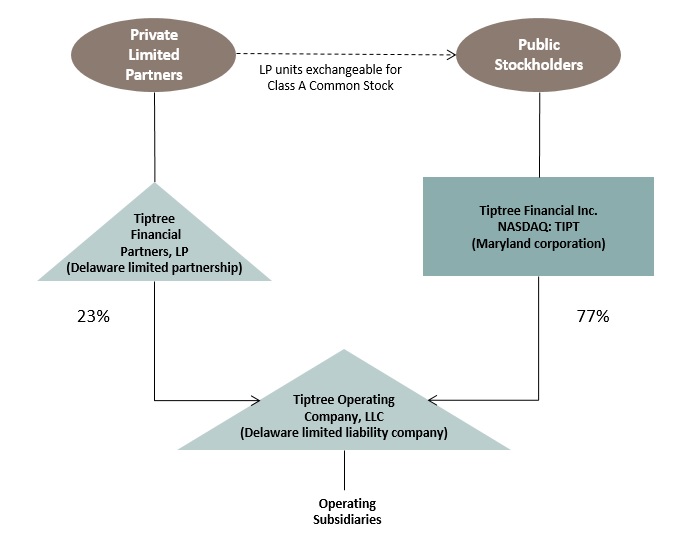
Operating Company owns substantially all of our assets. Operating Company is owned 25% by Tiptree Financial and 75% by TFP, a limited partnership which is currently approximately 68% owned by Tiptree Financial. The effect of this structure is that approximately 77% of the assets of Operating Company were directly or indirectly owned by Tiptree Financial as of December 31, 2014. From July 1, 2014, the limited partners of TFP (other than Tiptree Financial itself) have been provided with the opportunity to exchange TFP partnership units for Tiptree Financial Class A common stock at a rate of 2.798 shares of Class A common stock per partnership unit. The percentage of TFP (and therefore Operating Company) owned by Tiptree Financial may increase in the future to the extent TFP’s limited partners choose to exchange their limited partnership units of TFP for Class A common stock of Tiptree Financial.
3
The following chart shows a simplified version of our organizational structure:
For more information on our ownership and structure, see Notes 1—Organization and Note 18—Stockholders’ Equity, within the accompanying consolidated financial statements.
RECENT TRANSACTIONS
Tiptree acquired its Fortegra subsidiary in December 2014 and this report includes Fortegra’s results from the acquisition. In October 2014, Tiptree entered into a definitive agreement to sell its PFG subsidiary, subject to customary closing conditions, including regulatory approvals. The sale of PFG is expected to close in the third quarter of 2015. PFG has been classified as a discontinued operation in our financial statements.
In November, 2014, Tiptree entered into a Stock Purchase Agreement with the equityholders of Reliance to acquire all of the outstanding equity interests in Reliance for aggregate consideration equal to $7.5 million in cash and 1,625,500 shares of Class A Common Stock of Tiptree Financial, subject to adjustments in respect of net working capital and indebtedness of Reliance. In addition, Tiptree will pay the sellers up to 2,000,000 additional shares of Class A Common Stock of Tiptree Financial, to be paid annually over three years, if Reliance achieves specified performance metrics after the closing and in certain other circumstances. The transaction is subject to customary closing conditions including regulatory approval and is expected to close by the end of the third quarter of 2015.
HOLDING COMPANY
Tiptree’s Strategy
Tiptree Financial is a diversified holding company that draws upon the extensive experience of its management in the areas of insurance, specialty finance, asset management, real estate and credit investing to acquire and grow primarily controlling interests of operating businesses. We believe our business ownership mix of (i) specialty insurance, insurance services and warranty protection companies, (ii) operating companies which principally originate or own tangible assets, and (iii) asset management
4
companies which earn fees from third-party investment vehicles, provides business synergies which generate a higher overall return on shareholder capital.
When making new acquisitions, we strive to identify businesses that: (i) have strong and experienced management, (ii) have the potential to generate attractive and stable returns on capital with limited downside, (iii) complement existing businesses or strategies through clearly identifiable synergies, and (iv) have sustainable and scalable business models. Tiptree’s permanent capital base allows us to view our businesses through a long-term lens, providing competitive advantages relative to alternative capital sources with shorter-term objectives. We will retain a well-performing business for an indefinite period, but will consider selling a business when we believe material shareholder value creation will be achieved.
When we acquire a business, we aim to partner with the management and employees, providing assistance when needed, but relying on their unique expertise to run the business day-to-day. We enhance the value of our businesses by utilizing our experience in capital markets, mergers and acquisitions, capital raising, credit markets, distressed investing, securitization, asset management, corporate governance and government regulatory issues. We also optimize the efficiencies of our business operations by strategically using the resources and talents of our more than 700 employees at our consolidated subsidiaries.
We seek to adopt a prudent approach with regard to our capital structure, the diversification of financial risk and the avoidance of reputational risk. We evaluate our performance primarily by the comparison of our shareholder’s long-term total return on capital (change in book value plus dividends paid), to alternative investment options and major market indices.
We acquired Fortegra in December, 2014. The acquisition is expected to generate a significant portion of our revenue and net income in 2015. For 2014, only the revenues earned and expenses incurred from the date of Fortegra’s acquisition have been incorporated in our financial statements. The net results of Fortegra in this limited period reflects certain closing costs and adjustments which we do not foresee recurring in 2015.
In October, 2014, we entered into an agreement to sell PFG to funds managed by Blackstone. A significant portion of the Company’s 2014 net income was generated from our PFG subsidiary, which has been classified as “discontinued operations” in our financial statements. PFG’s net income for 2013 has also been reclassified as “discontinued operations.” The sale agreement specifies any results generated by PFG in 2015 will remain with PFG when sold and as such, PFG’s 2015 results will be reported in discontinued operations. The sale of PFG to Blackstone is expected to close in the third quarter of 2015. Based on a total purchase price of $165 million, we estimate that the GAAP pretax gain over December 31, 2014 book value will be approximately $35.2 million for the Company. We estimate Tiptree Financial’s incremental tax provision at the time of sale to be approximately $11.1 million. The incremental provision would bring total provisions for PFG related tax to approximately $26.5 million, which includes the deferred tax liability of $15.4 million already recorded as of December 31, 2014.
Tiptree’s Financing
We generally fund our operations and acquisitions with borrowings at the operating subsidiary level or asset level and with cash contributed by Operating Company. Cash at Operating Company is generated from distributions from our subsidiaries and assets, sales of assets, and borrowings at the Operating Company level. For a description of Operating Company’s credit agreement, see Note 15—Debt, in the accompanying consolidated financial statements. For a description of limitations on certain of our subsidiaries’ ability to make distributions to us, see “Risk Factors — Risks Related to our Structure — Because we are a holding company, our ability to meet our obligations and pay dividends to stockholders, when applicable, will depend on distributions from our subsidiaries that may be subject to restrictions.”
Tiptree Regulation
Because Tiptree Financial indirectly owns capital stock in several insurance company subsidiaries, it is subject to the state insurance holding company statutes of states in which it has insurance operations, which limit affiliate transactions and dividends or distributions from our insurance subsidiaries. See “Risk Factors — Risks Related to our Structure
— Because we are a holding company, our ability to meet our obligations and pay dividends to stockholders will depend on distributions from our subsidiaries that may be subject to restrictions.” The holding company statutes, as well as other laws, also require, among other things, prior regulatory approval of an acquisition of control of a domestic insurer, certain transactions between affiliates and payments of extraordinary dividends or distributions. As a holding company, Tiptree Financial is not regulated as an insurance company.
Each of Tiptree’s operating businesses is subject to regulation as described under “— Operating Businesses” below.
The 1940 Act may limit the types and nature of businesses that we engage in and assets that we may acquire. See “Risk Factors — Risks Related to Regulatory and Legal Matters — Maintenance of our 1940 Act exemption will impose limits on our operations.”
5
Tiptree’s Competition
Each of our businesses faces competition, as discussed under “— Operating Businesses” below. In addition to the competition our businesses face, we are subject to significant competition for acquisition opportunities. Many of these competitors are of varying sizes and compete with us to make the types of acquisitions that we plan to make, including from strategic corporate buyers, banks, mortgage companies, specialty finance companies, insurance companies, asset managers, private equity funds, hedge funds, family offices, real estate investment trusts, limited partnerships, business development companies and special purpose acquisition vehicles. Many of our competitors are significantly larger, have greater access to capital and other resources and may possess other competitive advantages. We believe that Tiptree Financial’s position as a public company may provide a competitive advantage over privately held entities that may compete to acquire certain target businesses, and unlike private buyers of companies such as private equity firms, Tiptree is able to pay for acquisitions with cash or its own equity securities.
Tiptree Employees
As of December 31, 2014, Tiptree had 761 employees, which includes 96 employees related to discontinued operations. As of that date, 16 persons provided services to Tiptree (as employees or pursuant to a services agreement) at the holding company.
OPERATING BUSINESSES
Insurance and Insurance Services
Tiptree’s insurance operations consist of Fortegra, which is a specialized insurance and insurance services company offering consumer related protection products, including credit insurance, warranties, service contracts and auto warranty and roadside assistance. Fortegra also offers administration services through a vertically integrated platform as well as providing fronting services for self insured clients.
Fortegra’s products and related services offer protection from life events and uncertainties along with simplified steps to ease consumers’ recovery. Credit insurance and debt protection products offer consumers the option to protect a loan balance in the event of death, disability, job loss or other events that could impair the consumers’ ability to repay a debt and damage their credit. Warranty and other service contracts for mobile handsets, furniture and major appliances provide consumers protection from product failure and loss. Automotive products protect consumers from mechanical failure and provide roadside assistance when needed.
Fortegra’s products are marketed under its Fortegra, Life of the South, ProtectCELL, 4Warranty, United Motor Club, Continental Car Club and Auto Knight brands. Through these brands, Fortegra delivers credit insurance, debt protection, warranty and other service contracts, motor club solutions and membership plans to installment loan companies, retailers, independent wireless dealers, regional banks, community banks, warranty administrators, automobile dealers, vacation ownership developers and credit unions. Fortegra’s clients then offer these complementary products and services to their customers in conjunction with consumer transactions.
Fortegra typically structures agreements with its agents whereby they share in the economic results of the program either through retrospective commission arrangements or fully-collateralized reinsurance companies. Fortegra may selectively assume insurance underwriting risk to meet clients’ needs or to enhance its profitability.
Fortegra generates service and administrative fees for administering payment protection products and fronting arrangements on behalf of its clients. Fortegra also earns ceding commissions for credit insurance that it cedes to reinsurers through coinsurance arrangements. Fortegra elects to cede to reinsurers a significant portion of the credit insurance that it distributes for loss protection and capital management. In addition, Fortegra also generates net investment income from its investment portfolio.
Fortegra generates revenues from net earned premiums consisting of direct and assumed earned premiums generated from the direct sale of payment protection insurance policies by Fortegra’s distributors and premiums written for payment protection insurance policies by another carrier and assumed by Fortegra. The underlying insurance plans primarily relate to credit protection in the event of job loss or disability. Earned premiums are offset by commission expenses and member benefit claims.
Competition
Fortegra operates in several niche markets and we believe that no single competitor competes against it in all of its business lines. The markets in which Fortegra operates are competitive based on many factors, including price, industry knowledge, quality of client service, the effectiveness of sales force, technology platforms and processes, the security and integrity of information systems, financial strength ratings, breadth of products and services, brand recognition and reputation. Fortegra’s
6
credit protection products and warranty service contracts compete with similar products of insurance companies, warranty companies and other insurance service providers. Many of Fortegra’s competitors are significantly larger, have greater access to capital and may possess other competitive advantages. The principal competitors for Fortegra include: The Warranty Group, Inc., Assurant, Inc., eSecuritel Holdings, LLC, Asurion, LLC, AmTrust Financial Services, Inc. and several smaller regional companies.
Regulation
Fortegra’s business is subject to extensive regulation and supervision, including at the federal, state, local and foreign levels. Fortegra’s insurance company, service contract, and motor club subsidiaries are subject to regulation in the various states and jurisdictions in which they transact business. Fortegra’s insurance products and its business are also affected by U.S. federal, state and local tax laws, and the tax laws of non-U.S. jurisdictions.
Fortegra owns and operates insurance company subsidiaries to meet the various requirements of the jurisdictions where it operates. Fortegra’s insurance subsidiaries are generally restricted by the insurance laws of their respective domiciles as to the amount of dividends they may pay to their shareholders without the prior approval of the respective regulatory authorities. Generally, the maximum dividend that may be paid by an insurance subsidiary during any year without prior regulatory approval is limited to a stated percentage of that subsidiary’s statutory surplus as of a certain date, or adjusted net income of the subsidiary for the preceding year. See “Risk Factors — Risks Related to our Structure — Because we are a holding company, our ability to meet our obligations and pay dividends to stockholders, when applicable, will depend on distributions from our subsidiaries that may be subject to restrictions.”
Fortegra’s insurance company subsidiaries are domiciled in California, Delaware, Georgia, Kentucky and Louisiana. The regulation, supervision and administration by state departments of insurance relate, among other things, to:
|
•
|
standards of solvency that must be met and maintained;
|
|
•
|
restrictions on the payment of dividends;
|
|
•
|
changes in control of insurance companies;
|
|
•
|
the licensing of insurers and their agents and other producers;
|
|
•
|
the types of insurance that may be written;
|
|
•
|
privacy practices;
|
|
•
|
the ability to enter and exit certain insurance markets;
|
|
•
|
the nature of and limitations on investments and premium rates, or restrictions on the size of risks that may be insured under a single policy;
|
|
•
|
reserves and provisions for unearned premiums, losses and other obligations;
|
|
•
|
deposits of securities for the benefit of policyholders;
|
|
•
|
payment of sales compensation to third parties;
|
|
•
|
approval of policy forms; and
|
|
•
|
the regulation of market conduct, including underwriting and claims practices.
|
A portion of Fortegra’s business is ceded to its reinsurance company subsidiaries domiciled in Turks and Caicos. Those subsidiaries must satisfy local regulatory requirements, such as filing annual financial statements, filing annual certificates of compliance and paying annual fees.
Fortegra’s insurance company subsidiaries must comply with their respective state of domicile’s laws regulating insurance company investments, which are generally modeled on the standards promulgated by the NAIC. Such investment laws are generally permissive with respect to federal, state and municipal obligations, and more restrictive with respect to corporate obligations, particularly non-investment grade obligations, foreign investment, equity securities and real estate investments. Each insurance company is therefore limited by the investment laws of its state of domicile from making excessive investments in any given security (such as single issuer limitations) or in certain classes or riskier investments (such as aggregate limitation in non-investment grade bonds).
The NAIC has adopted a model act with risk-based capital (“RBC”) formulas to be applied to insurance companies to measure the minimum amount of capital appropriate for an insurance company to support its overall business operations in light of its size and risk profile. State insurance regulators use RBC standards to determine appropriate actions relating to insurers that show signs of weak or deteriorating conditions. The domiciliary states of Fortegra’s insurance company subsidiaries have adopted laws substantially similar to the NAIC’s RBC model act. Under laws adopted by individual states, insurers having total adjusted capital less than that required by the RBC calculation will be subject to varying degrees of regulatory action depending on the level of capital inadequacy.
7
In connection with the Dodd-Frank Act, Congress created the CFPB. While under the Dodd-Frank Act, the CFPB does not have direct jurisdiction over insurance products, it is possible that regulatory actions taken by the CFPB may affect the sales practices related to these products and thereby potentially affect Fortegra’s business or the clients that it serves.
Fortegra is also subject to federal and state laws and regulations related to its administration of insurance products on behalf of other insurers. In order for Fortegra to process and administer insurance products of other companies, it is required to maintain licenses of a third party administrator in the states where those insurance companies operate. Fortegra is also subject to the related federal and state privacy laws and must comply with data protection and privacy laws such as the Gramm-Leach-Bliley Act and HIPAA and certain state data privacy laws. Fortegra is also subject to laws and regulations related to call center services, such as the Telemarketing Consumer Fraud and Abuse Prevention Act and the Telemarketing Sales Rule, the Telephone Consumer Protection Act, the Do-Not-Call Implementation Act and rules promulgated by the Federal Communications Commission and the Federal Trade Commission and the CAN-SPAM Act.
Seasonality
Fortegra’s financial results may be affected by seasonal variations. Revenues associated with its products may fluctuate seasonally based on consumer spending trends. Consumer spending has historically been higher in September and December, corresponding to the back-to-school and holiday seasons. Accordingly, Fortegra’s revenues from its products may be higher in the third and fourth quarters than in the first half of the year. Member benefit claims on mobile device protection are typically more frequent in the summer months, and accordingly, Fortegra’s claims expense from those products may be higher in the second and third quarters than other times of the year.
Employees
At December 31, 2014, Fortegra employed 523 employees, on a full or part time basis.
Intellectual Property
Fortegra owns or licenses a number of trademarks, patents, trade names, copyrights, service marks, trade secrets and other intellectual property rights that relate to its services and products. Although Fortegra believes that these intellectual property rights are, in the aggregate, of material importance to its business, Fortegra believes that its business is not materially dependent upon any particular trademark, trade name, copyright, service mark, license or other intellectual property right. Fortegra has entered into confidentiality agreements with its clients that impose restrictions on its clients’ use of Fortegra’s proprietary software and other intellectual property rights.
Specialty Finance
Tiptree’s specialty finance operations consists of a controlling ownership interest in Siena, which provides asset-based loans to smaller U.S. businesses; and a controlling ownership interest in Luxury, a residential mortgage lender that originates agency, prime jumbo and super jumbo mortgages for sale to institutional investors. The Company intends to continue to grow its specialty finance operations through acquisitions and by exploring strategic alternatives with respect to new financing products which may provide attractive returns.
Siena Lending Group
Siena is a commercial finance company providing financing solutions to small and medium sized U.S. companies. Siena originates, structures, underwrites and services senior secured asset-based loans for companies with sales typically between $5 million and $50 million operating across a range of industry sectors. Its core financing solutions include revolving lines of credit and term loans, which may collectively be referred to as asset-based loans and typically range in size from $1 million to $25 million. Siena also has the ability to arrange significantly larger transactions that may be syndicated to others or Siena may participate in large syndications itself. Siena funds its lending practice from capital contributions by its owners as well as from a $65.0 million revolving credit agreement with Wells Fargo Bank, N.A.
Siena’s asset-based loans are typically used to fund working capital needs and are secured by eligible, margined collateral, including accounts receivable, inventories, and, to a lesser extent, other long-term assets. In determining a borrowers’ ability and willingness to repay loans, Siena conducts a detailed due diligence investigation to assess financial reporting accuracy and capabilities as well as to verify the values of business assets, among other things. Siena employs third parties to conduct field exams to audit financial reporting and to appraise the value of certain types of collateral in order to estimate its liquidation value. Financing arrangements with customers also typically include substantial controls over the application of borrowers’ cash and Siena retains discretion over collateral advance rates and eligibility among other key terms and conditions.
8
Siena also offers a servicing platform which provides asset based lending solutions for community and regional banks that do not have the expertise or capacity to underwrite or service asset-based loans.
Competition
Siena’s market is competitive, based on factors that vary by product, customer, and geographic region. Competitors include global and domestic commercial and investment banks, regional and community banks, captive finance companies, and other niche specialty finance companies. Many of the larger competitors have greater financial, technological, and marketing resources than Siena.
Employees
Siena had 13 employees as of December 31, 2014.
Luxury Mortgage Corp.
Luxury’s operations include the origination, packaging and sale of primarily prime jumbo and super jumbo mortgage loans. The loans are typically sold shortly after origination into a liquid secondary market. Loans sold into the secondary market may be sold “servicing-retained” or “servicing-released,” referring to whether the rights to service the mortgage are retained by the originator or released to the secondary market investor at the time of sale. Luxury currently sells all of its loans on a servicing released basis. Luxury finances its operations using warehouse revolving credit facilities to fund mortgage loans which generate gain on sale of loans, net interest income and loan fee income.
Luxury offers a variety of residential adjustable and fixed rate mortgage products. Luxury currently uses two production channels to originate or acquire mortgage loans: retail sales offices (commonly referred to as “retail”), as well as a broker channel (commonly referred to as “wholesale”). Each production channel produces similar mortgage loan products and generally applies the same underwriting standards. Luxury leverages technology to streamline the mortgage origination process and bring service and convenience to both channels. Brokers are able to register and lock loans, check the status of the loan, and deliver documents in electronic format through the Internet and are supported by a sales support team assists brokers where Luxury is licensed to do business.
In the retail channel, loans are originated by mortgage loan originators employed by Luxury. When loans are originated on a retail basis, the origination documentation is completed internally inclusive of customer disclosures and other aspects of the lending process and the funding of the transactions. In the wholesale channel, an unaffiliated bank, mortgage bank, or mortgage brokerage company completes much of the loan paperwork. All loans are underwritten on a loan-level basis to
Luxury’s underwriting standards.
Competition
The market for origination of residential mortgages is highly competitive. There are a large number of institutions offering mortgage loans, including many that operate on a national scale, as well as local savings banks, commercial banks, and other lenders. With respect to those products that Luxury offers, the Company competes by offering competitive interest rates, fees, and other loan terms and services and by offering efficient and rapid service. Many of Luxury’s competitors are larger and have access to greater financial resources. In addition, many of the largest competitors are banks or are affiliated with banking institutions, the advantages of which include, but are not limited to, the ability to hold mortgage loan originations in an investment portfolio and having access to financing with more favorable terms, including lower interest rate bank deposits as a favorable source of funding.
Regulation
Luxury is subject to extensive regulation by federal, state and local governmental authorities, including the CFPB, the Federal Trade Commission and various state agencies that license, audit and conduct examinations. Luxury is licensed or qualified to do business in 19 states in the U.S. Luxury must comply with a number of federal, state and local consumer protection laws including, among others, the Gramm-Leach-Bliley Act, the Fair Debt Collection Practices Act, the Real Estate Settlement Procedures Act, the Truth in Lending Act, the Fair Credit Reporting Act, the Servicemembers Civil Relief Act, Homeowners Protection Act, the Federal Trade Commission Act, the Dodd-Frank Act and state foreclosure laws. These statutes apply to loan origination, debt collection, use of credit reports, safeguarding of non−public personally identifiable information about customers, foreclosure and claims handling, investment of and interest payments on escrow balances and escrow payment features, and mandate certain disclosures and notices to borrowers.
9
Employees
Luxury had 99 employees as of December 31, 2014.
Asset Management
TAMCO
Tiptree’s asset management operations are conducted through TAMCO, an SEC-registered investment adviser that is primarily a holding company for Tiptree’s asset management subsidiaries, which include Telos and MCM. Telos is primarily a manager of CLOs. MCM currently manages portfolios of tax exempt securities for third parties and the Company. Tiptree seeks to grow its asset management operations through acquisitions and through investments in new products launched and managed by its subsidiaries. As of December 31, 2014, TAMCO had approximately $2.1 billion of AUM for third parties.
The formation of a CLO is funded by a combination of cash from Tiptree and warehouse revolving credit facilities which generate net interest income. At issuance of the new CLO, funding is provided by a combination of cash from Tiptree and from third party investors, creating a CLO that generates management fees to TAMCO and investment income to the Company.
Competition
TAMCO and its subsidiaries compete for business with numerous other asset managers, including those affiliated with major commercial or investment banks and other financial institutions. Many of these organizations offer products and services that are similar to, or compete with, those TAMCO and its subsidiaries may offer, and many of these organizations have substantially more personnel and greater financial resources. Some of these competitors have proprietary products and distribution channels that may make it more difficult for TAMCO and its subsidiaries to compete with them. Some competitors have greater portfolio management resources, greater name recognition, have managed client accounts for longer periods of time, have greater experience over a wider range of products or have other competitive advantages. The factors considered by clients in choosing TAMCO and its subsidiaries or a competitor include the past performance of the products managed, the background and experience of key personnel, the experience in managing a particular product, and reputation, investment advisory fees and the structural features of the investment products offered.
Regulation
The asset management industry in the U.S. is subject to extensive regulation under federal and state securities laws as well as the rules of self-regulatory organizations. TAMCO is registered with the SEC as an investment adviser and Telos and MCM (collectively with TAMCO, the “Advisers”) rely on TAMCO’s registration. The Advisers are also required to make notice filings in certain states. Virtually all aspects of the asset management business, including related sales and distribution activities, are subject to various federal and state laws and regulations and self-regulatory organization rules. These laws, rules and regulations are primarily intended to protect the asset management clients and generally grant supervisory agencies and bodies broad administrative powers, including the power to limit or restrict an investment advisor from conducting its asset management business in the event that it fails to comply with such laws and regulations. In addition, investment vehicles managed by the Advisers are subject to various securities laws and other laws.
Employees
As of December 31, 2014, 10 employees were dedicated to TAMCO.
Telos Asset Management
Telos is an investment manager that establishes and manages investment products for various types of investors, including pension funds, hedge funds and other asset management firms, banks, insurance companies and other types of institutional investors. Its core investment products are primarily in the form of CLOs and managed accounts. The term CLO generally refers to a special purpose vehicle that owns a portfolio of senior secured loans and issues various tranches of debt and subordinated note securities to finance the purchase of those investments. The investment activities of a CLO are governed by extensive investment guidelines, generally contained within a CLO’s indenture and other governing documents which limit, among other things, the CLO’s maximum exposure to any single industry or obligor and limit the ratings of the CLO’s assets. Most CLOs have a defined investment period during which they are allowed to make investments and reinvest capital as it becomes available. Telos, as investment advisor/ manager of CLOs, selects and actively manages the underlying assets to achieve target investment performance, while seeking to avoid losses.
10
The investment advisory fees paid to Telos by the CLOs under management are its primary source of revenue and are generally paid on a quarterly basis. Investment advisory fees typically consist of senior and subordinated management fees based on the amount of assets and, in certain cases, include incentive fees based on the returns generated for certain investors.
Telos is currently the manager of the following CLOs:
|
($ in thousands)
|
Issuance date
|
Fee earning AUM
(1)
|
First optional call date
(2)
|
Termination of reinvestment period
(3)
|
Maturity date
(4)
|
||||||
|
Telos 1
|
11/2006
|
$
|
198,162
|
|
1/2011
|
1/2013
|
10/2021
|
||||
|
Telos 2
|
06/2007
|
252,540
|
|
7/2011
|
7/2013
|
4/2022
|
|||||
|
Telos 3
|
02/2013
|
352,653
|
|
1/2015
|
1/2017
|
1/2024
|
|||||
|
Telos 4
|
08/2013
|
351,945
|
|
7/2015
|
7/2017
|
7/2024
|
|||||
|
Telos 5
|
05/2014
|
400,632
|
|
4/2016
|
4/2018
|
4/2025
|
|||||
|
Telos 6
|
12/2014
|
350,000
|
|
1/2017
|
1/2019
|
1/2027
|
|||||
|
Total CLOs
|
$
|
1,905,932
|
|
||||||||
(1) Fee earning AUM as of the next distribution date after December 31, 2014, except for Telos 6, which is the target par.
|
(2)
|
CLOs are generally callable by equity holders (or the subordinated note holders of the CLO) once per quarter beginning after termination of a non-call period and subject to certain other restrictions.
|
|
(3)
|
Termination of reinvestment period refers to the date after which we can no longer use certain principal collections to purchase additional collateral and such collections are instead used to repay the outstanding amounts of certain debt securities issued by the CLO.
|
(4) Represents the contractual maturity of the CLO. Generally, the actual maturity of the CLO is expected to occur in advance of contractual maturity.
Management fees are reported in the asset management segment. Tiptree owns various amounts of subordinated notes issued by Telos 1 through Telos 6 with an aggregate fair market value of $94.3 million. Distributions earned, realized gains/(losses), and changes in the fair value of subordinated notes owned by Tiptree are reported in our corporate and other segment.
Muni Capital Management - MCM
MCM is a manager of investments in securities exempt from U.S. federal income taxes. MCM currently manages NPPF I, a structured tax-exempt pass-through vehicle. Interests in NPPF I are held solely by third parties unaffiliated with Tiptree. MCM is also the manager of the Company’s portfolio of tax exempt securities. Investment gains and losses on the portfolio of tax-exempt securities are reported in our corporate and other segment. Management fees earned by MCM from the management of NPPF I are reported in our asset management segment. The AUM of NPPF I as of December 31, 2014 was $175.2 million.
Real Estate
Tiptree’s real estate operations consist of Care, a real estate investment company that primarily acquires and owns seniors housing properties within the U.S. Care’s focus is on acquisitions ranging in size from $5 to $200 million in the seniors housing and care industry. Care’s overall strategy is to identify strong and experienced managers or operators of seniors housing facilities who are looking to expand and diversify their operations by entering into strategic relationships with capital partners. Through joint ventures, Care may also own the operations of seniors housing properties and partner with experienced managers to run the day to day operations at the properties. Care is funded by a combination of cash from Tiptree and property specific recourse debt used to acquire properties that generate rental income and gain on sale of assets.
Care’s seniors housing communities currently include senior apartments, independent and assisted living communities, and communities providing care for individuals with Alzheimer’s disease and other forms of dementia or memory loss. Rent payments and services provided in these facilities are primarily paid for by the residents directly or through private insurance and are less reliant on government reimbursement programs such as Medicaid and Medicare. Care intends to continue to grow its portfolio primarily through the acquisition of seniors housing properties, utilizing investments structures such as leases and joint ventures. As Care acquires additional properties and expands its portfolio, it intends to further diversify its concentrations by tenant, asset
11
class and geography within the seniors housing sector, including further investments in senior apartments, independent and assisted living communities, memory care communities and skilled nursing facilities.
Competition
Care competes for investments in the seniors housing and care sector with other real estate investment companies and real estate investment trusts, real estate partnerships, private equity firms and hedge funds, finance/investment companies, taxable and tax-exempt bond funds, health care and seniors housing operators and developers. Care competes for investments based on a number of factors including investment structures, underwriting criteria and reputation. Care’s ability to successfully compete is impacted by economic and demographic trends, availability of acceptable investment opportunities, ability to negotiate beneficial investment terms, availability and cost of capital and new and existing laws and regulations.
The operators/managers/lessees of Care’s properties compete on a local and regional basis with those of properties that provide comparable services. Operators/managers/lessees compete for residents based on a number of factors including quality of service, reputation, physical appearance of properties, location, services offered, family preferences, staff and price.
Regulation
Tenants and operators of healthcare properties are typically subject to federal, state and local laws and regulations relating to environmental protection and human health and safety. Federal laws such as the National Environmental Policy Act, the Comprehensive Environmental Response, Compensation, and Liability Act, the Resource Conservation and Recovery Act, the Federal Water Pollution Control Act, the Federal Clean Air Act, the Toxic Substances Control Act, the Emergency Planning and Community Right to Know Act and the Hazard Communication Act govern such matters as wastewater discharges, air emissions, the operation and removal of underground and above-ground storage tanks, the use, storage, treatment, transportation and disposal of solid and hazardous materials and the remediation of contamination associated with disposals. Some of these laws and regulations impose joint and several liabilities on tenants, owners or operators for the costs to investigate or remediate contaminated properties, regardless of fault or whether the acts causing the contamination were legal. In addition, there are various federal, state and local fire, health, life-safety and similar regulations applicable to healthcare properties.
Care’s properties may be affected by Care’s operators’, managers’ and lessees’ operations, the existing condition of land when acquired, operations in the vicinity of our properties, such as the presence of underground storage tanks, or activities of unrelated third parties. The presence of hazardous substances, or the failure to properly remediate these substances, may make it difficult or impossible to sell or rent such property.
In addition, the healthcare industry is highly regulated by federal, state and local licensing requirements, facility inspections, reimbursement policies, regulations concerning capital and other expenditures, certification requirements and other laws, regulations and rules. In addition, regulators require compliance by our tenants and third party operators with a variety of safety, health, staffing and other requirements relating to the design and conditions of the licensed facility and quality of care provided. The failure of any tenant, manager or operator to comply with such laws, requirements and regulations could affect a tenant’s, manager’s or operator’s ability to operate the facilities that Care owns.
Private, federal and state payment programs, including Medicaid and Medicare, and the effect of laws and regulations may also have a significant influence on the profitability of the properties and their tenants.
Employees
As of December 31, 2014, 4 employees were dedicated to Care.
Principal Investments
The Company’s principal investments consist primarily of the positions in the subordinated notes of CLOs managed by Telos, a portfolio of tax-exempt securities held by MFCA and Tiptree’s interests in the Star Asia Entities, which are Tokyo-based real estate holding companies formed to invest predominately in Asian properties and real estate related debt instruments. The Company has been liquidating its tax exempt securities portfolio.
Discontinued Operations
Tiptree owns approximately 94% of PFG. In October, 2014, Tiptree and the management shareholders of PFG entered into a definitive agreement to sell PFG, a life insurance and annuity company and PFAS, a subsidiary of PFG and third party administrator of COLI/BOLI policies, to funds managed by Blackstone, for approximately $155 million in cash plus additional
12
consideration of approximately $10 million to be paid over two years. Any dividends or distributions from PFG or PFAS are prohibited with the effect that any retained earnings from and after January 1, 2015 will benefit Blackstone. The transaction is subject to customary closing conditions including regulatory approval and is expected to close in the third quarter of 2015. Based on a total purchase price of $165 million, we estimate that the GAAP pretax gain over December 31, 2014 book value will be approximately $35.2 million for the Company. We estimate Tiptree Financial’s incremental tax provision at the time of sale to be approximately $11.1 million. The incremental provision would bring total provisions for PFG related tax to approximately $26.5 million, which includes the deferred tax liability of $15.4 million already recorded as of December 31, 2014. Pursuant to GAAP guidance, the results of PFG have been reclassified as “Discontinued Operations” in this report, having been previously classified as an insurance and insurance services segment. Summary information relating to PFG is presented below.
Philadelphia Financial Group
PFG provides annuity and life insurance products within the U.S. and internationally. PFG’s principal insurance activity is the structuring, underwriting, marketing and administration of life insurance and annuity products. PFG’s life insurance products are primarily targeted to high net worth individuals and its annuity products are targeted to both the individual and institutional markets. PFAS, a subsidiary of PFG, also provides administration services of life insurance products in the COLI/BOLI markets. PFG’s international operations consist of two Bermuda domiciled subsidiaries. PFG distributes its products through a select network of intermediaries who work directly with individuals, institutions and families or in concert with family offices, wealth managers, private bankers or other professionals.
PFAS is a third party administrator of group life insurance policies, primarily in the COLI/BOLI market. Employers looking for tax-efficient ways to fund their employee benefit programs have accomplished this goal through the use of COLI/BOLI, by purchasing life insurance policies on employees. The employer pays the premium, owns the cash value of the policy and is the designated beneficiary. PFAS does not structure, underwrite or distribute COLI/BOLI policies. It provides policy service and administration services on behalf of the insurance company issuing the policy.
Reinsurance
PFG reinsures a significant portion of its mortality risk exposure and, in connection therewith, pays to the reinsurers a portion of the premiums received. Insurance is ceded principally to reduce the net exposure to mortality risk and protect against large losses. PFG, unlike traditional life insurance companies, reinsures substantially all of its exposure to mortality risk. Reinsurance does not relieve PFG of its obligations to its policyholders and exposes PFG to credit risk with respect to its reinsurers.
Competition
Competition faced by PFG is based on a variety of factors, including service, product features, scale, price, financial strength, rating and name recognition. PFG competes with private and public insurance companies. PFG’s ability to compete depends on its ability to develop profitable products, maintain relationships with intermediaries who distribute its products, maintain adequate ratings from ratings agencies, and provide a high quality of service to its customers.
Regulation
PFG is primarily domiciled in Pennsylvania and is subject to regulation by the Pennsylvania Insurance Department, among other regulatory authorities, with respect to statutory capital and reserve requirements. Certain other subsidiaries are subject to regulation by the New York State Department of Financial Services and the Bermuda Monetary Authority.
PFG’s insurance subsidiaries are generally restricted by the insurance laws of their respective domiciles as to the amount of dividends they may pay to their shareholders without the prior approval of the respective regulatory authorities. For a discussion of the regulations to which insurance companies, including PFG, are generally subject, see “Item 1. Business — Operating Businesses — Insurance and Insurance Services — Regulation.”
Employees
PFG and PFAS had 96 employees as of December 31, 2014.
AVAILABLE INFORMATION
We are required to file annual, quarterly and current reports, proxy statements and other information with the SEC. The public may read and copy any materials that we file with the SEC at the SEC’s Public Reference Room at 100 F Street, N.E., Washington, D.C. 20549. Information on the operation of the Public Reference Room may be obtained by calling the SEC at 1-800-SEC-0330. In addition, the SEC maintains an Internet site that contains reports, proxy and information statements, and other information regarding issuers that file electronically with the SEC at
http://www.sec.gov
.
13
Our Annual Reports on Form 10-K, Quarterly Reports on Form 10-Q, Current Reports on Form 8-K, proxy statements and amendments to those reports filed or furnished pursuant to Section 13(a) or 15(d) of the Exchange Act, are also available free of charge on our Internet site at
www.tiptreefinancial.com
as soon as reasonably practicable after such reports are electronically filed with or furnished to the SEC. The information on our website is not, and shall not be deemed to be, a part hereof or incorporated into this or any of our other filings with the SEC.
Our Investor Relations Department can be contacted at Tiptree Financial Inc., 780 Third Avenue, 21st Floor, New York, NY, 10017, Attn: Investor Relations, telephone: (212) 446-1400, email: IR@tiptreefinancial.com.
Tiptree is subject to certain risks and uncertainties in its business operations which are described below. The risks and uncertainties described below are not the only risks we face. Additional risks and uncertainties that are not presently known or are currently deemed immaterial may also impair our business, results of operations and financial condition. In October, 2014, we entered into a definitive agreement to sell PFG and that sale is expected to close during the third quarter of 2015. However, we cannot assure you of the timing of the sale or whether it will occur. Accordingly, the PFG business is discussed in these Risk Factors.
Risks Related to our Businesses
We operate in highly competitive markets for business opportunities and personnel, which could impede our growth and negatively impact our results of operations.
We operate in highly competitive markets for business opportunities in each of our operating segments. Many of our competitors have financial, personnel and other resources that are greater than ours and may be better able to react to market conditions. These factors may place us at a competitive disadvantage in successfully competing for future business opportunities and personnel, which could impede our growth and negatively impact our business, financial condition and results of operations.
Acquisitions may have an adverse effect on us, including due to the failure to successfully integrate the businesses we acquire.
We regularly evaluate opportunities for strategic growth through acquisitions. Acquired companies and operations may result in unforeseen operating difficulties and may require greater than expected financial and other resources. In addition, potential issues associated with acquisitions could include, among other things:
|
•
|
our ability to realize the full extent of the benefits, synergies or cost savings that we expect to realize as a result of the completion of an acquisition within the anticipated time frame, or at all;
|
•
receipt of necessary consents, clearances and approvals in connection with the acquisition;
•
diversion of management’s attention from other strategies and objectives;
•
motivating, recruiting and retaining executives and key employees; and
|
•
|
conforming and integrating financial reporting, standards, controls, procedures and policies, business cultures and compensation structures.
|
If an acquisition is not successfully completed or integrated into our existing operations, our business, results of operations and financial condition could be materially adversely effected.
We may need to raise additional capital in the future or may need to refinance existing indebtedness, but there is no assurance that such capital will be available on a timely basis, on acceptable terms or at all.
We may need to raise additional funds in order to grow our business or fund our strategy or acquisitions. Additional financing may not be available in sufficient amounts or on terms acceptable to us and may be dilutive to existing stockholders if raised through additional equity offerings. Additionally, any securities issued to raise such funds may have rights, preferences and privileges senior to those of our existing stockholders. If adequate funds are not available on a timely basis or on acceptable terms, our ability to expand, develop or enhance our subsidiaries’ services and products, enter new markets, consummate acquisitions or respond to competitive pressures could be materially limited.
14
The amount of required statutory capital of our insurance subsidiaries can increase because of factors outside of our control.
Our insurance subsidiaries are subject to statutory capital and reserve requirements established by the applicable insurance regulators based on risk-based capital formulas. In any particular year, these requirements may increase or decrease depending on a variety of factors, most of which are outside our control, such as the amount of statutory income or losses generated, changes in equity market levels, the value of fixed-income and equity securities in the subsidiary’s investment portfolio, changes in interest rates and foreign currency exchange rates, as well as changes to the risk-based capital formulas used by insurance regulators. Increases in the amount of additional statutory reserves that our insurance subsidiaries are required to hold can adversely affect our financial condition and results of operations.
A downgrade in our insurance subsidiaries’ claims paying ability or financial strength ratings could increase policy surrenders and withdrawals, adversely affecting relationships with distributors and reducing new policy sales.
Claims paying ability ratings, sometimes referred to as financial strength ratings, indicate a rating agency’s view of an insurance company’s ability to meet its obligations to its policy holders. These ratings are therefore key factors underlying the competitive position of insurers. Some distributors of insurance products may choose not to do business with insurance companies that are rated below certain financial strength ratings. Fortegra currently has a rating of “A-” from A.M. Best Company, Inc. Each of PFLAC and PFLAC NY currently have a rating of “A-” from A.M. Best Company, Inc. Rating agencies can be expected to continue to monitor our insurance subsidiaries’ financial strength and claims paying ability, and no assurances can be given that future ratings downgrades will not occur, whether due to changes in their performance, changes in rating agencies’ industry views or ratings methodologies, or a combination of such factors. A ratings downgrade or the potential for such a downgrade in a rating could, to the extent applicable to a particular type of policy, materially increase the number of policy surrenders or withdrawals by policyholders of cash values from their policies, adversely affect relationships with distributors of insurance products, reduce new policy sales and adversely affect our ability to compete in the insurance industry.
Our insurance subsidiaries may incur losses if reinsurers are unwilling or unable to meet their obligations under reinsurance contracts.
Fortegra reinsures a substantial portion of the risks underwritten through third party reinsurance companies. Our insurance subsidiaries use reinsurance to reduce the severity and incidence of claims costs, and to provide relief with regard to certain reserves. As of December 31, 2014, substantially all of the mortality risk on the insurance policies issued by PFG was reinsured by third parties. Under these reinsurance arrangements, other insurers assume a portion of the insurers’ losses and related expenses; however, the insurer remains liable as the direct insurer on all risks reinsured. Consequently, reinsurance arrangements do not eliminate our obligation to pay claims and we assume credit risk with respect to our ability to recover amounts due from reinsurers. The inability or unwillingness of any reinsurer to meet its financial obligations could negatively affect our financial condition and results of operations.
Fortegra’s reinsurance facilities are generally subject to annual renewal. Fortegra may not be able to maintain its current reinsurance facilities and its clients may not be able to continue to operate their captive reinsurance companies. As a result, even where highly desirable or necessary, Fortegra may not be able to obtain other reinsurance facilities in adequate amounts and at favorable rates. If Fortegra is unable to renew its expiring facilities or to obtain or structure new reinsurance facilities, either its net exposures would increase or, if it is unwilling to bear an increase in net exposures, it may have to reduce the level of its underwriting commitments. Either of these potential developments could have a material adverse effect on our results of operations and financial condition.
Our insurance subsidiaries’ actual claims losses may exceed their reserves for claims, which may require them to establish additional reserves that may materially and adversely affect their business, results of operations and financial condition.
Our insurance subsidiaries maintain reserves to cover their estimated ultimate exposure for claims with respect to reported claims and incurred but not reported claims as of the end of each accounting period. Reserves, whether calculated under GAAP or statutory accounting principles, do not represent an exact calculation of exposure. Instead, they represent our insurance subsidiaries’ best estimates, generally involving actuarial projections, of the ultimate settlement and administration costs for a claim or group of claims, based on our assessment of facts and circumstances known at the time of calculation. The adequacy of reserves will be impacted by future trends in claims severity, frequency, judicial theories of liability and other factors. These variables are affected by external factors such as changes in the economic cycle, unemployment, changes in the social perception of the value of work, emerging medical perceptions regarding physiological or psychological causes of disability, emerging health issues, new methods of treatment or accommodation, inflation, judicial trends, legislative changes, as well as changes in claims handling procedures. Many of these items are not directly quantifiable, particularly on a prospective basis. Reserve estimates are refined as experience develops. Adjustments to reserves, both positive and negative, are reflected in the statement
15
of income of the period in which such estimates are updated. Because the establishment of reserves is an inherently uncertain process involving estimates of future losses, we can give no assurances that ultimate losses will not exceed existing claims reserves. In general, future loss development could require reserves to be increased, which could have a material adverse effect on our insurance subsidiaries’ business, results of operations and financial condition.
Fortegra may lose clients or business as a result of consolidation within the financial services industry.
There has been considerable consolidation in the financial services industry, driven primarily by the acquisition of small and mid-size organizations by larger entities. We expect this trend to continue. Fortegra may lose business or suffer decreased revenues if one or more of its significant clients or distributors consolidate or align themselves with other companies. To date, Fortegra’s business has not been materially affected by consolidation. However, it may be affected by industry consolidation that occurs in the future, particularly if any of its significant clients are acquired by organizations that already possess the operations, services and products that it provides.
Fortegra is dependent on independent financial institutions, lenders and retailers for distribution of its products and services, and the loss of these distribution sources, or their failure to sell Fortegra’s products and services could materially and adversely affect its business, results of operations and financial condition.
Fortegra is dependent on financial institutions, lenders and retailers to distribute its products and services and its revenue is dependent on the level of business conducted by such distributors as well as the effectiveness of their sales efforts, each of which is beyond Fortegra’s control because such distributors typically do not have any minimum performance or sales requirements. Further, although its contracts with these distributors are typically exclusive, they can be canceled on relatively short notice. Therefore, Fortegra’s growth is dependent, in part, on its ability to identify and attract new distribution relationships and successfully implement its information systems with those of its new distributors.
The impairment of Fortegra’s distribution relationships, the loss of a significant number of its distribution relationships, the failure to establish new distribution relationships, the failure to offer increasingly competitive products, the increase in sales of competitors’ services and products by these distributors or the decline in their overall business activity or the effectiveness of their sales of Fortegra’s products could materially reduce Fortegra’s sales and revenues and have a material adverse effect on its business, results of operations and financial condition.
Due to the structure of some of Fortegra’s commissions, it is exposed to risks related to the creditworthiness of some of its agents.
Fortegra is subject to the credit risk of some of the agents with which it contracts to sell its products and services. Fortegra typically advances agents’ commissions as part of its product offerings. These advances are a percentage of the premiums charged. If Fortegra over-advances such commissions to agents, the agents may not be able to fulfill their payback obligations, which could have a material adverse effect on Fortegra’s results of operations and financial condition.
Our information systems may fail or their security may be compromised, which could damage our business and materially and adversely affect our results of operations and financial condition.
Our insurance and insurance services business is highly dependent upon the effective operation of our information systems and our ability to store, retrieve, process and manage significant databases and expand and upgrade our information systems. We rely on these systems throughout our businesses for a variety of functions, including marketing and selling our products and services, performing our services, managing our operations, processing claims and applications, providing information to clients, performing actuarial analyses and maintaining financial records. The interruption or loss of our information processing capabilities through the loss of stored data, programming errors, the breakdown or malfunctioning of computer equipment or software systems, telecommunications failure or damage caused by weather or natural disasters or any other significant disruptions could harm our business, ability to generate revenues, client relationships, competitive position and reputation. In addition, our information systems may be vulnerable to physical or electronic intrusions, computer viruses or other attacks which could disable our information systems and our security measures may not prevent such attacks. The failure of our systems as a result of any security breaches, intrusions or attacks could cause significant interruptions to our operations, which could result in a material adverse effect on our business, results of operations and financial condition.
A reduction in fees paid to TAMCO could adversely affect our profitability.
TAMCO generates management, servicing and advisory fees based on the amount of assets managed, and in certain cases, on the returns generated by the assets managed. A reduction in fees paid to TAMCO, due to termination of management agreements, reduction in assets managed (for example as a result of exercise of optional call provisions by subordinated noteholders) or lower than expected returns, could adversely affect our results of operations.
16
Our real estate operating entities expose us to various operational risks, liabilities and claims that could adversely affect our ability to generate revenues or increase our costs and could adversely affect our financial condition and results of operations.
Our ownership of real estate operating entities exposes us to various operational risks, liabilities and claims that could increase our costs or adversely affect our ability to generate revenues, thereby reducing our profitability. These operational risks include fluctuations in occupancy levels, the inability to achieve economic resident fees (including anticipated increases in those fees), rent control regulations, increases in the cost of food, materials, energy, labor (as a result of unionization or otherwise) or other services, national and regional economic conditions, the imposition of new or increased taxes, capital expenditure requirements, professional and general liability claims, and the availability and cost of professional and general liability insurance. Any one or a combination of these factors could result in operating deficiencies in our operating assets, which could adversely affect our financial condition and results of operations.
Liability relating to environmental matters may decrease the value of our real estate assets.
Under various federal, state and local laws, an owner or operator of real property may become liable for the costs of cleanup of certain hazardous substances released on or under its property. Such laws often impose liability without regard to whether the owner or operator knew of, or was responsible for, the release of such hazardous substances. The presence of hazardous substances may adversely affect an owner’s ability to sell real estate or borrow using real estate as collateral. To the extent that any of our owned real estate encounters environmental issues, it may adversely affect the value of that real estate. Further, in regard to any mortgage investment, if the owner of the underlying property becomes liable for cleanup costs, the ability of the owner to make debt payments may be reduced, which in turn may adversely affect the value of the relevant mortgage asset held by us. In addition, in certain instances, we may be liable for the cost of any required remediation or clean up.
Violation of fraud and abuse laws applicable to our real estate tenants, lessees and operators may jeopardize a tenant’s, lessee’s or operator’s ability to make payments to us.
The federal government and numerous state governments have passed laws and regulations that attempt to eliminate healthcare fraud and abuse by prohibiting business arrangements that induce patient referrals or inappropriately influence the ordering of specific ancillary services. In addition, numerous federal laws have continued to strengthen the federal fraud and abuse laws to provide for broader interpretations of prohibited conduct and stiffer penalties for violations. Violations of these laws may result in the imposition of criminal and civil penalties, including possible exclusion from federal and state healthcare programs. Imposition of any of these penalties upon any of our tenants, lessees or operators could jeopardize their ability to operate a facility or to make payments to us, thereby potentially adversely affecting us, or our financial condition and results of operations.
In the past several years, federal and state governments have significantly increased investigation and enforcement activity to detect and eliminate fraud and abuse in the Medicare and Medicaid programs. In addition, legislation and regulations have been adopted at state and federal levels, which severely restricts the ability of physicians to refer patients to entities in which they have a financial interest. It is anticipated that the trend toward increased investigation and enforcement activity in the area of fraud and abuse, as well as self-referrals, will continue in future years and could adversely affect our prospective tenants, lessees or operators and their operations, and in turn their ability to make payments to us.
Our use of joint ventures for investments may limit our flexibility with respect to such jointly owned investments and could, thereby, have a material adverse effect on our business, results of operations and financial condition and our ability to sell these joint venture interests.
We have invested in joint ventures for real estate investments with other persons or entities when circumstances warrant the use of these structures and may form additional joint ventures to invest in real estate and other assets in the future. Our participation in joint ventures is subject to the risks that:
|
•
|
we could experience an impasse on certain decisions because we do not have sole decision-making authority, which could require us to expend additional resources on resolving such impasses or potential disputes;
|
|
•
|
our joint venture partners could have investment goals that are not consistent with our investment objectives, including the timing, terms and strategies for any investments;
|
|
•
|
our joint venture partners might become bankrupt, fail to fund their share of required capital contributions or fail to fulfill their obligations as joint venture partners, which may require us to infuse our own capital into such venture(s) on behalf of the joint venture partner(s) despite other competing uses for such capital;
|
|
•
|
our joint venture partners may have competing interests in our markets that could create conflict of interest issues;
|
|
•
|
any sale or other disposition of our interest in a joint venture may require consents which we may not be able to obtain;
|
17
|
•
|
such transactions may also trigger other contractual rights held by a joint venture partner, lender or other third party depending on how the transaction is structured; and
|
|
•
|
there may be disagreements as to whether consents and/or approvals are required in connection with the consummation of a particular transaction with a joint venture partner, lender and/or other third party, or whether such transaction triggers other contractual rights held by a joint venture partner, lender and/or other third party, and in either case, those disagreements may result in litigation.
|
We may be limited in the future in utilizing net operating losses incurred during prior periods to offset taxable income.
Care and PFG previously incurred net operating losses. In the event that we experience an “ownership change” within the meaning of Section 382 of the Code, including as a result of the Contribution Transactions or the exchange by TFP’s limited partners of their partnership units in TFP for Tiptree Financial Class A common stock in 2014, our ability to use those net operating losses to offset taxable income could be subject to an annual limitation. The annual limitation would be equal to a percentage of our equity value at the time the ownership change occurred. In general, such an “ownership change” would occur if the percentage of our stock owned by one or more 5% stockholders were to increase by 50 percentage points during any three-year period. A 5% stockholder is a person (including certain groups of persons acting in concert) that owns at least 5% of our stock. All stockholders that own less than 5% of our stock are treated as a single 5% stockholder. In addition, the Treasury Regulations under Section 382 of the Code contain additional rules the effect of which is to make it more likely that an ownership change could be deemed to occur. Accordingly, our ability to use prior net operating losses to offset future taxable income would be subject to a limitation if we experience an ownership change.
A portion of our assets are illiquid or have limited liquidity, which may limit our ability to sell those assets at favorable prices or at all and creates uncertainty in connection with valuing such assets.
Our assets include real estate, non-controlling interests in credit assets and related equity interests which may be illiquid or have limited liquidity. It may be difficult for us to dispose of assets with limited liquidity rapidly, or at favorable prices, if at all. In addition, assets with limited liquidity may be more difficult to value and may be sold at a substantial discount or experience more volatility than more liquid assets. We may not be able to dispose of assets at the carrying value reflected in our financial statements. Our results of operations and cash flows may be materially and adversely affected if our determinations regarding the fair value of our illiquid assets are materially higher than the values ultimately realized upon their disposal.
We leverage our assets and a decline in the fair value of such assets may adversely affect our financial condition and results of operations.
We leverage our assets, including through borrowings, generally through warehouse credit facilities, secured loans, derivative instruments such as total return swaps, securitizations (including the issuance of CLOs) and other borrowings. A rapid decline in the fair value of our leveraged assets, such as the declines experienced in the fourth quarter of 2007 and the first quarter of 2008, may adversely affect us. Lenders may require us to post additional collateral to support the borrowing. If we cannot post the additional collateral, we may have to rapidly liquidate assets, which we may be unable to do on favorable terms or at all. Even after liquidating assets, we may still be unable to post the required collateral, further harming our liquidity and subjecting us to liability to lenders for the declines in the fair values of the collateral. A reduction in credit availability may adversely affect our business, financial condition and results of operations.
Certain of our and our subsidiaries’ assets are subject to credit risk, market risk, interest rate risk, credit spread risk, selection risk, call and redemption risk and/or tax risk, and any one of these risks may materially and adversely affect the value of our assets, our results of operations and our financial condition.
Some of our assets, including our direct investments, are subject to credit risk, interest rate risk, market risk, credit spread risk, selection risk, call and redemption risk and refinancing risk.
Credit risk is the risk that the obligor will be unable to pay scheduled principal and/or interest payments. Defaults by third parties in the payment or performance of their obligations could reduce our income and realized gains or result in the recognition of losses. The fair value of our assets may be materially and adversely affected by increases in interest rates, downgrades in our direct investments and by other factors that may result in the recognition of other-than-temporary impairments. Each of these events may cause us to reduce the fair value of our assets.
With respect to fixed-rate instruments, interest rate risk is the risk that the market value of such instruments will change in response to changes in the interest rate environment or other developments that may affect the fixed income market generally. When market interest rates go up, the market value of existing fixed rate instruments goes down and instruments with longer maturities are typically affected more by changes in interest rates than instruments with shorter maturities. Because market interest rates continue to be near their lowest levels in many years, there is a greater risk that prevailing interest rates will increase in the future causing these instruments to decline in market value.
18
With respect to floating-rate instruments, interest rate risk is the risk that defaults on such instruments will increase during periods of rising interest rates and that during periods of declining interest rates, obligors may exercise their option to prepay principal earlier than scheduled.
Market risk is the risk that one or more markets to which the assets relate will decline in value, including the possibility that such markets will deteriorate sharply and unpredictably, which will likely impair the market value of the related instruments.
Credit spread risk is the risk that the market value of fixed income instruments will change in response to changes in perceived or actual credit risk beyond changes that would be attributable to changes, if any, in interest rates.
Call and redemption risk is the risk that debt instruments will be called or redeemed prior to maturity at a time when yields on other debt instruments in which the call or redemption proceeds could be invested are lower than the yield on the called or redeemed instrument.
Refinancing risk is the risk that we will be unable to refinance some or all of our indebtedness or that any refinancing will not be on terms as favorable as those of our existing indebtedness, which could increase our funding costs, limit our ability to borrow, or result in a sale of the leveraged asset on disadvantageous terms. Any one of these risks may materially and adversely affect the value of our assets, our results of operations and our financial condition.
Our risk mitigation or hedging strategies could result in our experiencing significant losses that may materially adversely affect us.
We pursue risk mitigation and hedging strategies to seek to reduce our exposure to losses from adverse credit events, interest rate changes and other risks. These strategies include short Treasury positions, interest rate swaps, credit derivative swaps, CDX derivative index positions, buying and selling credit protection on different tranches of risk in differing CDX indexes and derivative hedging instruments. Since we account for derivatives at fair market value, changes in fair market value are reflected in net income other than derivative hedging instruments which are reflected in accumulated other comprehensive income in stockholders’ equity. Some of these strategies could result in our experiencing significant losses that
may materially adversely affect our business, financial condition and results of operations.
We face risks related to recession, financial and credit market disruptions and other economic conditions.
Demand for our products and services may be impacted by weak economic conditions, recession, equity market, and fixed income volatility or other negative economic factors that are out of our control. Similarly, disruptions in financial and/or credit markets may impact our and our subsidiaries’ ability to manage normal commercial relationships with customers, counterparties and creditors which could negatively impact our business, financial condition and results of operations.
Risks Related to our Structure
Because we are a holding company, our ability to meet our obligations and pay dividends to stockholders will depend on distributions from our subsidiaries that may be subject to restrictions.
We are a holding company and do not have any significant operations of our own. Our ability to meet our obligations will depend on distributions from our subsidiaries. The amount of dividends and other distributions that our subsidiaries may distribute to us may be subject to restrictions imposed by state law, restrictions that may be imposed by state regulators and restrictions imposed by the terms of any current or future indebtedness that these subsidiaries may incur. Such restrictions would also affect our ability to pay dividends to stockholders, if and when we choose to do so. We did not pay any cash dividends on our common stock in fiscal 2014.
Our regulated insurance company subsidiaries are required to satisfy minimum capital and surplus requirements according to the laws and regulations of the states in which they operate, which regulate the amount of dividends and distributions we receive from them. In general, dividends in excess of prescribed limits are deemed “extraordinary” and require insurance regulatory approval. Ordinary dividends, for which no regulatory approval is generally required, are limited to amounts determined by a formula, which varies by state. Some states have an additional stipulation that dividends may only be paid out of earned surplus. States also regulate transactions between our insurance company subsidiaries and us or our other subsidiaries, such as those relating to the shared services, and in some instances, require prior approval of such transactions within the holding company structure. If insurance regulators determine that payment of an ordinary dividend or any other payments by our insurance company subsidiaries to us or our other subsidiaries (such as payments for employee or other services) would be adverse to policyholders or creditors, the regulators may block or otherwise restrict such payments that would otherwise be permitted without prior approval. In addition, there could be future regulatory actions restricting the ability of our insurance company subsidiaries to pay dividends or share services.
19
Termination of our Transition Services Agreement or the Administrative Services Agreement could materially increase our costs, which could adversely affect our financial condition and results of operations.
Pursuant to a Transition Services Agreement, we pay fees to Tricadia for the services of Michael Barnes, our Executive Chairman, Julia Wyatt, our Chief Operating Officer, and for certain back office, administrative, information technology, insurance, legal and accounting services. A portion of the services that Tricadia provides to us are in turn provided to Tricadia by Mariner pursuant to a services agreement that may be terminated by Tricadia or Mariner without our consent. In addition, pursuant to an Administrative Services Agreement, a subsidiary of Mariner provides certain back office services to us directly for a fee. If any of the Transition Services Agreement, Tricadia’s services agreement with Mariner or the Administrative Services Agreement is terminated, we would be required to make alternative arrangements for the performance of these services. We may not be able to obtain these services promptly or at reasonable rates or at all, and our costs of obtaining such services could materially increase, which could adversely affect our results of operations.
Some of our officers and directors currently or may in the future act as members, managers, officers, directors or employees of entities with conflicting business strategies.
Some of our officers and directors currently or may in the future act as members, managers, officers, directors or employees of entities with business strategies that may conflict with our business strategies. Michael Barnes, our Executive Chairman, is a founding partner and Co-Chief Investment Officer of Tricadia Holdings, L.P., an asset management holding company which we refer to as “Tricadia”, and Executive Chairman and a member of the board of directors of TFP. Tricadia’s subsidiaries include, and Mr. Barnes is co-chief investment officer of, companies that manage hedge funds, private equity funds and structured vehicles with business strategies that may compete with ours. Furthermore, Geoffrey Kauffman, our Co-Chief Executive Officer, is the Co-Chief Executive Officer of TFP and is a limited partner of Tricadia. Julia Wyatt, our Chief Operating Officer, is the Chief Financial Officer of Tricadia and the Chief Operating Officer of TFP and is also a limited partner of Tricadia. Jonathan Ilany, our Co-Chief Executive Officer, is a limited partner of Mariner, which is a stockholder of Tiptree Financial and provides certain back office services to Tiptree. Such positions may give rise to actual or potential conflicts of interest, which may not be resolved in a manner that is in the best interests of the Company or the best interests of its stockholders.
Our duties as the managing member of Operating Company may come into conflict with the duties that our directors and officers have to the Company and its stockholders.
We and TFP are currently the sole members of Operating Company, and we are the managing member of Operating Company. Our directors and officers have duties to us and our stockholders under applicable Maryland law in connection with our management. At the same time, we, as managing member of Operating Company, have fiduciary duties and obligations to Operating Company and its members (including TFP) under Delaware law and the Amended and Restated Limited Liability Company Agreement of Operating Company. Our duties as managing member of Operating Company may come into conflict with the duties that our directors and officers have to us and our stockholders. These conflicts may be resolved in a manner that is not in the best interests of the Company or its stockholders.
W
e incur costs as a result of operating as a public company, and our management is required to devote substantial time to these compliance activities.
As a public company, we incur legal, accounting and other costs that we did not incur prior to the Contribution Transactions. In addition, the Sarbanes-Oxley Act of 2002, or the “Sarbanes-Oxley Act,” the Dodd-Frank Act and the rules of the SEC, and NASDAQ, impose various requirements on public companies. Our management and other personnel devote a substantial amount of time to these compliance activities. Moreover, these rules and regulations increase our legal and financial compliance costs and make some activities more time-consuming and costly.
Furthermore, if we are not able to comply with the requirements of Section 404 of the Sarbanes-Oxley Act in a timely manner, the market price of our common stock could decline and we could be subject to potential delisting by NASDAQ and review by such exchange, the SEC, or other regulatory authorities, which would require the expenditure by us of additional financial and management resources. As a result, our stockholders could lose confidence in our financial reporting, which would harm our business and the market price of our common stock.
Some provisions of our charter may delay, deter or prevent takeovers and business combinations that stockholders consider in their best interests.
Our charter restricts any person that owns 9.8% or more of our capital stock, other than TFP and its affiliates or another stockholder approved by applicable state insurance regulators, from voting in excess of 9.8% of our voting securities. This provision is intended to satisfy the requirements of applicable state regulators in connection with insurance laws and regulations that prohibit any person from acquiring control of a regulated insurance company without the prior approval of the insurance
20
regulators. In addition, our charter provides for the classification of our board of directors into three classes, one of which is to be elected each year. Our charter also generally only permits stockholders to act without a meeting by unanimous consent. These provisions may delay, deter or prevent takeovers and business combinations that stockholders consider in their best interests.
Maryland takeover statutes may prevent a change of our control, which could depress our stock price.
Maryland law provides that “control shares” of a corporation acquired in a “control share acquisition” will have no voting rights except to the extent approved by a vote of two-thirds of the votes entitled to be cast on the matter under the Maryland Control Share Acquisition Act. “Control shares” means voting shares of stock that, if aggregated with all other shares of stock owned by the acquirer or in respect of which the acquirer is able to exercise or direct the exercise of voting power (except solely by virtue of a revocable proxy), would entitle the acquirer to exercise voting power in electing directors within one of the following ranges of voting power: one-tenth or more but less than one-third; one-third or more but less than a majority; or a majority or more of all voting power. A “control share acquisition” means the acquisition of issued and outstanding control shares, subject to certain exceptions.
Under Maryland law, “business combinations” between a Maryland corporation and an interested stockholder or an affiliate of an interested stockholder are prohibited for five years after the most recent date on which such stockholder became an interested stockholder. These business combinations include a merger, consolidation, share exchange or, in circumstances specified in the statute, an asset transfer or issuance or reclassification of equity securities.
Our bylaws contain a provision exempting from the control share statute any and all acquisitions by any person of our shares of stock. Our board of directors has also adopted a resolution which provides that any business combination between us and any other person is exempted from the provisions of the business combination statute, provided that the business combination is first approved by the board of directors. However, our board of directors may amend or eliminate this provision in our bylaws regarding the control share statute or amend or repeal this resolution regarding the business combination statute. If our board takes such action in the future, the control share and business combination statutes may prevent or discourage others from trying to acquire control of us and increase the difficulty of consummating any offer, including potential acquisitions that might involve a premium price for our common stock or otherwise be in the best interest of our stockholders.
Our holding company structure with multiple lines of business, may adversely impact the market price of our Class A common stock and our ability to raise equity and debt capital.
Tiptree holds and manages multiple lines of business. Analysts, investors and lenders may have difficulty analyzing and valuing a company with multiple lines of business, which could adversely impact the market price of our Class A common stock and our ability to raise equity and debt capital at a holding company level. Moreover, our management is required to make decisions regarding the allocation of capital among the different lines of business, and such decisions could materially and adversely affect our business or one or more of our lines of business.
Risks Related to Regulatory and Legal Matters
Maintenance of our 1940 Act exemption will impose limits on our operations.
We intend to continue to conduct our operations so that we are not required to register as an investment company under the 1940 Act. Therefore, we must limit the types and nature of businesses in which we may engage and assets that we may acquire. Section 3(a)(1)(C) of the 1940 Act defines an investment company as any issuer that is engaged or proposes to engage in the business of investing, reinvesting, owning, holding or trading in securities, and owns or proposes to acquire “investment securities” having a value exceeding 40% of the value of the issuer’s total assets (exclusive of U.S. government securities and cash items) on an unconsolidated basis. Assets that would generally be excluded from the term “investment securities,” include securities issued by majority-owned subsidiaries that are not themselves investment companies and are not relying on certain exceptions from the definition of investment company set forth in the 1940 Act. Assets that generally would constitute “investment securities” include loans, debt securities, preference shares and subordinated notes issued by CLOs.
We monitor our compliance with the 1940 Act on an ongoing basis and may be compelled to take or refrain from taking actions, to acquire additional income or loss generating assets or to forgo opportunities that might otherwise be beneficial or advisable, including, but not limited to selling assets that are considered to be investment securities or forgoing the sale of assets that are not investment securities, in order to ensure that we (or a subsidiary) may continue to rely on the applicable exceptions or exemptions. These limitations on our freedom of action could have a material adverse effect on our financial condition and results of operations.
If we fail to maintain an exemption, exception or other exclusion from registration as an investment company, we could, among other things, be required to substantially change the manner in which we conduct our operations either to avoid being required to register as an investment company or to register as an investment company. If we were required to register as an investment company under the 1940 Act, we would become subject to substantial regulation with respect to, among other things, our capital structure (including our ability to use leverage), management, operations, transactions with affiliated persons (as
21
defined in the 1940 Act), portfolio composition, including restrictions with respect to diversification and industry concentration, and our financial condition and results of operations may be adversely affected. If we did not register despite being required to do so, criminal and civil actions could be brought against us, our contracts would be unenforceable unless a court were to require enforcement, and a court could appoint a receiver to take control of us and liquidate our business.
A change in law, regulation or regulatory enforcement applicable to insurance products could adversely affect our financial condition and results of operations.
A change in state or U.S. federal tax laws could materially affect our insurance businesses. Currently, Fortegra does not collect sales or other related taxes on its services. Whether sales of Fortegra’s services are subject to state sales and use taxes is uncertain, due in part to the nature of its services and the relationships through which its services are offered, as well as changing state laws and interpretations of those laws. One or more states may seek to impose sales or use tax or other tax collection obligations on Fortegra, whether based on sales by Fortegra or its resellers or clients, including for past sales. A successful assertion that Fortegra should be collecting sales or other related taxes on its services could result in substantial tax liabilities for past sales, discourage customers from purchasing its services, discourage clients from offering or billing for its services, or otherwise cause material harm to its business, financial condition and results of operations.
With regard to Fortegra’s payment protection products, there are federal and state laws and regulations that govern the disclosures related to lenders’ sales of those products. Fortegra’s ability to offer and administer these products on behalf of financial institutions is dependent upon their continued ability to sell such products. To the extent that federal or state laws or regulations change to restrict or prohibit the sale of these products, Fortegra’s revenues would be adversely affected. For example, the Dodd-Frank Act created the CFPB to add new regulatory oversight for the sales practices of such payment protection products. The CFPB’s enforcement actions have resulted in large refunds and civil penalties against financial institutions in connection with their marketing of payment protection and other products. Due to such regulatory actions, some lenders may reduce their sales and marketing of payment protection and other ancillary products, which may adversely affect Fortegra’s revenues. The full impact of the CFPB’s oversight is unpredictable and continues to evolve. With respect to the property and casualty insurance policies Fortegra underwrites, federal legislative proposals regarding national catastrophe insurance, if adopted, could reduce the business need for some of the related products that Fortegra provides. Additionally, as the U.S. Congress continues to respond to the housing foreclosure crisis, it could enact legislation placing additional barriers on creditor-placed insurance.
PFG generates revenue from the sale and administration of variable annuity and variable life insurance products which enjoy favorable U.S. federal income tax benefits that are conferred by statute or regulation. Should such benefits be curtailed or eliminated by changes in statute or regulation, PFG’s continuing issuance of variable annuity and variable life insurance products could be adversely affected. Any retroactive application of changes could result in surrenders by holders of PFG’s existing variable annuity and variable life insurance products and reduce PFG’s revenues which, prior to its sale, could adversely affect our financial condition and results of operations.
Compliance with existing and new regulations affecting our business in regulated industries may increase costs and limit our ability to pursue business opportunities.
We are subject to extensive laws and regulations administered and enforced by a number of different federal and state governmental authorities in the industries in which we operate. Regulation of such industries are expected to increase. In the past several years, there has been significant legislation affecting financial services, insurance and health care, including the Dodd-Frank Act and the Patient Protection and Affordable Care Act, and many of the regulations associated with these laws have yet to be written. Accordingly, we cannot predict the impact that any new laws and regulations will have on us. The costs to comply with these laws and regulations may be substantial and could have a significant negative impact on us and limit our ability to pursue business opportunities. We can give no assurances that with changes to laws and regulations, our businesses can continue to be conducted in each jurisdiction in the manner as we have in the past.
Our insurance subsidiaries are subject to regulation by state and, in some cases, foreign insurance authorities with respect to statutory capital, reserve and other requirements. The laws of the various states in which our insurance businesses operate establish insurance departments and other regulatory agencies with broad powers to preclude or temporarily suspend our insurance subsidiaries from carrying on some or all of their activities or otherwise fine or penalize them in any jurisdiction in which they operate. Such regulation or compliance could reduce our insurance businesses’ profitability or limit their growth by increasing the costs of compliance, limiting or restricting the products or services they sell, or the methods by which they sell their services and products, or subjecting their business to the possibility of regulatory actions or proceedings.
TAMCO is an asset management holding company registered with the SEC as an investment advisor and is subject to various federal and state laws and regulations and rules of various securities regulators and exchanges. These laws and regulations primarily are intended to protect clients and generally grant supervisory agencies broad administrative powers, including the power to limit or restrict the carrying on of business for failure to comply with such laws and regulations. Possible sanctions that may be imposed include the suspension of individual employees, limitations on engaging in business for specific periods, the revocation of the registration as an investment adviser, censures and fines.
22
The properties held by our Care subsidiary are regulated by state and federal laws regarding healthcare facilities. Luxury is subject to extensive regulation by federal, state and local governmental authorities, including the CFPB, the Federal Trade Commission and various state agencies that license, audit and conduct examinations.
Our businesses are subject to risks related to litigation and regulatory actions.
Over the last several years, businesses in many areas of the financial services industry have been subject to increasing amounts of regulatory scrutiny. In addition, there has been an increase in litigation involving firms in the financial services industry and public companies generally, some of which have involved new types of legal claims, particularly in the insurance industry. We may be materially and adversely affected by judgments, settlements, fines, penalties, unanticipated costs or other effects of legal and administrative proceedings now pending or that may be instituted in the future, including from investigations by regulatory bodies or administrative agencies. An adverse outcome of any investigation by, or other inquiries from, any such bodies or agencies also could result in non-monetary penalties or sanctions, loss of licenses or approvals, changes in personnel, increased review and scrutiny of us by our clients, counterparties, regulatory authorities, potential litigants, the media and others, any of which
could have a material adverse effect on us.
Failure to protect our clients’ confidential information and privacy could result in the loss of our reputation and customers, reduction in our profitability and subject us to fines, penalties and litigation and adversely affect our results of operations and financial condition.
We and our subsidiaries retain confidential information in our information systems, and we are subject to a variety of privacy regulations and confidentiality obligations. For example, some of the Company’s subsidiaries are subject to the privacy regulations of the Gramm-Leach-Bliley Act. We and certain of our subsidiaries also have contractual obligations to protect confidential information we obtain from third parties. These obligations generally require us, in accordance with applicable laws, to protect such information to the same extent that we protect our own confidential information. We have implemented physical, administrative and logical security systems with the intent of maintaining the physical security of our facilities and systems and protecting our clients’ and their customers’ confidential information and personally-identifiable information against unauthorized access through our information systems or by other electronic transmission or through misdirection, theft or loss of data. Despite such efforts, we may be subject to a breach of our security systems that results in unauthorized access to our facilities and/or the information we are trying to protect. Anyone who is able to circumvent our security measures and penetrate our information systems could access, view, misappropriate, alter or delete any information in the systems, including personally identifiable customer information and proprietary business information. In addition, most states require that customers be notified if a security breach results in the disclosure of personally-identifiable customer information. Any compromise of the security of our or our subsidiaries’ information systems that results in inappropriate disclosure of such information could result in, among other things, unfavorable publicity and damage to our and our subsidiaries’ reputation, governmental inquiry and oversight, difficulty in marketing our services, loss of clients, significant civil and criminal liability, litigation and the incurrence of significant technical, legal and other expenses, any of which may have a material adverse effect on our results of operations and financial condition.
None.
Administrative Offices
Our principal executive offices are located at 780 Third Avenue, 21st Floor, New York, New York 10017. The table below outlines the Company’s leased properties as of December 31, 2014, all of which are used as administrative offices. All facilities are considered adequate and suitable for the Company’s current level of operations. We do not own any properties for administrative purposes.
|
|
||||
|
Leased Properties
|
||||
|
Location
|
Square Footage
|
Purpose
|
Segment Used In
|
|
|
Jacksonville, FL
|
58,089
|
|
Office Space
|
Insurance
|
|
Jacksonville, FL
|
9,473
|
|
Office Space
|
Insurance
|
|
Marksville, LA
|
3,996
|
|
Office Space
|
Insurance
|
23
|
|
||||
|
Leased Properties
|
||||
|
Location
|
Square Footage
|
Purpose
|
Segment Used In
|
|
|
Rose, LA
|
1,025
|
|
Office Space
|
Insurance
|
|
Paducah, KY
|
2,500
|
|
Office Space
|
Insurance
|
|
Palm Desert, CA
|
6,340
|
|
Office Space
|
Insurance
|
|
Novi, MI
|
20,053
|
|
Office Space
|
Insurance
|
|
Beaverton, OR
|
11,364
|
|
Office Space
|
Insurance
|
|
Boca Raton, FL
|
350
|
|
Office Space
|
Specialty Finance
|
|
Greenwich, CT
|
115
|
|
Office Space
|
Specialty Finance
|
|
Westport, CT
|
2,775
|
|
Office Space
|
Specialty Finance
|
|
Stamford, CT
|
3,500
|
|
Office Space
|
Specialty Finance
|
|
Stamford, CT
|
14,643
|
|
Office Space
|
Specialty Finance
|
|
Los Angeles, CA
|
3,050
|
|
Office Space
|
Specialty Finance
|
|
Newport Beach, CA
|
200
|
|
Office Space
|
Specialty Finance
|
|
Montvale, NJ
|
1,797
|
|
Office Space
|
Specialty Finance
|
|
East Hampton, NY
|
580
|
|
Office Space
|
Specialty Finance
|
|
Garden City, NY
|
2,900
|
|
Office Space
|
Specialty Finance
|
|
New York, NY
|
2,900
|
|
Office Space
|
Specialty Finance
|
|
White Plains, NY
|
3,625
|
|
Office Space
|
Specialty Finance
|
|
New York, NY
|
2,750
|
|
Office Space
|
Asset Management
|
|
New York, NY
|
1,532
|
|
Office Space
|
Real Estate
|
|
New York, NY
|
7,693
|
|
Tiptree Corporate Offices
|
Corporate and Other
|
|
Philadelphia, PA
|
17,269
|
|
Office Space
|
Discontinued Operations
|
Real Estate Owned
The Company’s owned real estate as of December 31, 2014 is listed below. All of the owned real estate consists of properties managed by Care, except the Stamford, CT location, which is owned by Luxury.
|
Owned Properties
|
||||
|
Location
|
Square Feet
|
Purpose
|
Segment Used In
|
|
|
Stamford, CT
|
3,500
|
|
Investment Property
|
Specialty Finance
|
|
Wheatfield, NY
|
212,079
|
|
Seniors Housing
|
Real Estate
|
|
Baldwinsville, NY
|
34,535
|
|
Seniors Housing
|
Real Estate
|
|
Geneva, NY
|
38,334
|
|
Seniors Housing
|
Real Estate
|
|
Sewell, NJ
|
168,000
|
|
Seniors Housing
|
Real Estate
|
|
Milford, PA
|
49,170
|
|
Seniors Housing
|
Real Estate
|
|
Weatherly, PA
|
48,829
|
|
Seniors Housing
|
Real Estate
|
|
Fredericksburg, VA
|
16,322
|
|
Seniors Housing
|
Real Estate
|
|
Richmond, VA
|
19,600
|
|
Seniors Housing
|
Real Estate
|
|
Stafford, VA
|
29,436
|
|
Seniors Housing
|
Real Estate
|
|
Berryville, VA
|
28,708
|
|
Seniors Housing
|
Real Estate
|
|
Oak Ridge, TN
|
105,500
|
|
Seniors Housing
|
Real Estate
|
|
Arlington, TX
|
128,486
|
|
Seniors Housing
|
Real Estate
|
24
Tiptree’s Fortegra subsidiary is a defendant in Mullins v. Southern Financial Life Insurance Co., which was filed on February 2, 2006, in the Pike Circuit Court, in the Commonwealth of Kentucky. A class was certified on June 25, 2010. At issue is the duration or term of coverage under certain policies. The action alleges violations of the Consumer Protection Act and certain insurance statutes, as well as common law fraud. The action seeks compensatory and punitive damages, attorney fees and interest. Plaintiffs filed a Motion for Sanctions on April 5, 2012 in connection with Fortegra's efforts to locate and gather certificates and other documents from Fortegra's agents. While the court did not award sanctions, it did order Fortegra to subpoena certain records from its agents. Although Fortegra appealed the order on numerous grounds, the Kentucky Supreme Court ultimately denied the appeal in April 2014. Consequently, Fortegra has retained a special master to facilitate the collection of certificates and other documents from Fortegra's agents. The parties are currently conducting discovery in preparation for trial on September 8, 2015.
Tiptree considers such litigation customary in Fortegra’s lines of business. In management's opinion, based on information available at this time, the ultimate resolution of such litigation, which it is vigorously defending, should not be materially adverse to the financial position, results of operations or cash flows of Tiptree. It should be noted that large punitive damage awards, bearing little relation to actual damages sustained by plaintiffs, have been awarded in certain states against other companies in the credit insurance business. Tiptree may record loss contingencies as developments warrant.
Tiptree and its subsidiaries are defendants in a consolidated class action in connection with Tiptree’s acquisition of Fortegra, entitled Stein v. Fortegra Financial Corporation, et al., Case No. 16-2014-CA-005825-XXXX-MA in the Circuit Court of the Fourth Judicial Circuit in and for Duval County, State of Florida. The complaint alleges that the merger consideration was inadequate, that the members of Fortegra’s board of directors breached their fiduciary obligations to Fortegra’s stockholders by approving the merger agreement and related agreements, engaging in an unfair sales process and failing to make adequate disclosures to Fortegra’s stockholders, and that the other named defendants aided and abetted the breach of those duties.
On February 6, 2015, the court granted preliminary approval of a disclosure-only settlement pursuant to which the terms of the merger agreement remain unchanged, but Fortegra issued additional supplemental disclosures about the merger to stockholders. We expect the settlement to be finally proved at a hearing on April 20, 2015. Tiptree has provided notice to the class as required. Accordingly, in management's opinion, based on information available at this time, the ultimate resolution of this litigation will not be materially adverse to the financial position, results of operations or cash flows of Tiptree.
Tiptree and its subsidiaries are parties to other legal proceedings in the ordinary course of business. Although Tiptree’s legal and financial liability with respect to such proceedings cannot be estimated with certainty, Tiptree does not believe that these proceedings, either individually or in the aggregate, are likely to have a material adverse effect on Tiptree’s financial position or results of operations.
Not applicable.
Market Information
Tiptree Financial’s Class A common stock has traded on the NASDAQ Capital Market under the ticker symbol “TIPT” since August 9, 2013. Prior to the Contribution Transactions, Care’s common stock was quoted on the OTCQX market under the ticker symbol “CVTR”.
Holders
As of March 27, 2015, there were 119 Class A common stockholders of record.
25
Stock Price and Dividends
The following table sets forth the high and low stock prices per share of our Class A common stock and the dividends declared and paid per share on our Class A common stock for the periods indicated.
|
2014
|
High Price
|
Low Price
|
Dividends
|
||||||
|
First Quarter
|
$
|
8.25
|
|
$
|
6.48
|
|
$
|
—
|
|
|
Second Quarter
|
13.98
|
|
7.05
|
|
—
|
|
|||
|
Third Quarter
|
8.64
|
|
6.67
|
|
—
|
|
|||
|
Fourth Quarter
|
$
|
8.50
|
|
$
|
7.00
|
|
$
|
—
|
|
|
2013
|
High Price
|
Low Price
|
Dividends
|
||||||
|
First Quarter
|
$
|
7.60
|
|
$
|
5.80
|
|
$
|
0.135
|
|
|
Second Quarter
|
7.25
|
|
5.90
|
|
0.020
|
|
|||
|
Third Quarter
|
10.00
|
|
5.00
|
|
0.020
|
|
|||
|
Fourth Quarter
|
$
|
8.00
|
|
$
|
6.71
|
|
$
|
—
|
|
Purchases of Equity Securities by the Issuer and Affiliated Purchasers
Share repurchase activity for the year ended December 31, 2014 was as follows:
|
Period
|
Purchaser
|
Total
Number of
Shares
Purchased
(1)
|
Average
Price
Paid Per
Share
|
Total Number
of Shares
Purchased
as Part of
Publicly
Announced
Plans or
Programs
|
Approximate
Dollar Value of
Shares That
May Yet Be
Purchased
Under the
Plans or
Programs
|
|
December 4, 2014 to December 31, 2014: Open Market Purchases
|
Tiptree Financial
|
5,238
|
$7.56
|
5,238
|
$2,460,399
|
|
Michael Barnes
|
5,024
|
7.56
|
5,024
|
2,462,057
|
|
|
Total
|
10,262
|
$7.56
|
10,262
|
$4,922,456
|
|
Share repurchase activity for the period from January 1, 2015 to March 20, 2015 was as follows:
|
Period
|
Purchaser
|
Total
Number of
Shares
Purchased
(1)
|
Average
Price
Paid Per
Share
|
Total Number
of Shares
Purchased
as Part of
Publicly
Announced
Plans or
Programs
|
Approximate
Dollar Value of
Shares That
May Yet Be
Purchased
Under the
Plans or
Programs
|
|
January 1, 2015 to January 31, 2015: Open Market Purchases
|
Tiptree Financial
|
30,384
|
$7.66
|
30,384
|
$2,227,625
|
|
Michael Barnes
|
29,906
|
7.67
|
29,906
|
2,232,807
|
|
|
Total
|
60,290
|
$7.66
|
60,290
|
$4,460,432
|
|
|
February 1, 2015 to February 28, 2015: Open Market Purchases
|
Tiptree Financial
|
15,635
|
$7.44
|
15,635
|
$2,111,282
|
|
Michael Barnes
|
15,447
|
7.45
|
15,447
|
2,117,706
|
|
|
Total
|
31,082
|
$7.45
|
31,082
|
$4,228,988
|
|
|
March 1, 2015 to March 20, 2015: Open Market Purchases
|
Tiptree Financial
|
15,865
|
$6.73
|
15,865
|
$2,004,559
|
|
Michael Barnes
|
15,848
|
6.72
|
15,848
|
2,011,203
|
|
|
Total
|
31,713
|
$6.72
|
31,713
|
$4,015,762
|
|
26
|
(1)
|
On December 4, 2014, Tiptree Financial engaged a broker in connection with a share repurchase program for the repurchase of up to $2.5 million of its outstanding Class A common stock. In addition, on the same date, Michael Barnes, Tiptree Financial’s Executive Chairman, entered into a Rule 10b5-1 plan pursuant to which he will, for his own account, purchase up to $2.5 million of Tiptree Financial’s outstanding Class A common stock. Repurchases by Tiptree Financial and purchases by Mr. Barnes will be made through a single broker and is anticipated to be allocated equally between Tiptree Financial and Mr. Barnes (or to Tiptree Financial in the case of trades that cannot be split evenly). We expect the share purchases to be made from time to time in the open market or through privately negotiated transactions, or otherwise, subject to applicable laws and regulations. Unless otherwise completed or terminated earlier, the repurchase program will expire on November 18, 2015.
|
As a smaller reporting company, we are not required to provide the information contained in this Item.
Overview
Tiptree Financial is a diversified holding company that draws upon the extensive experience of its management in the areas of insurance, specialty finance, asset management, real estate and credit investing to acquire and grow primarily controlling interests of operating businesses. We believe our business ownership mix of (i) specialty insurance, insurance services and warranty protection companies, (ii) operating companies which principally originate or own tangible assets, and (iii) asset management companies which earn fees from third-party investment vehicles, provides business synergies which generate a higher overall return on shareholder capital.
When making new acquisitions, we strive to identify businesses that: (i) have strong and experienced management, (ii) have the potential to generate attractive and stable returns on capital with limited downside, (iii) complement existing businesses or strategies through clearly identifiable synergies, and (iv) have sustainable and scalable business models. Tiptree’s permanent capital base allows us to view our business through a long-term lens, providing competitive advantages relative to alternative capital sources with shorter-term objectives. We will retain a well-performing business for an indefinite period, but will consider selling a business when we believe material shareholder value creation will be achieved.
When we acquire a business, we aim to partner with the management and employees, providing assistance when needed, but relying on their unique expertise to run the business day-to-day. We enhance the value of our businesses by utilizing our experience in capital markets, mergers and acquisitions, capital raising, credit markets, distressed investing, securitization, asset management, corporate governance and government regulatory issues. We also optimize the efficiencies of our business operations by strategically using the resources and talents of our more than 700 employees at our consolidated subsidiaries. We seek to adopt a prudent approach with regard to our capital structure, the diversification of financial risk and the avoidance of reputational risk. We evaluate our performance primarily by the comparison of our shareholder’s long-term total return on capital (change in book value plus dividends paid), to alternative investment options and major market indices.
The Company, whose operations date back to 2007, currently operates in five reporting segments: insurance and insurance services, specialty finance, asset management, real estate and corporate and other. See “Item 1. Business — Operating Businesses” and Note 6 — Operating Segment Data, to the accompanying consolidated financial statements for detailed information regarding our segments. Since different factors affect the financial condition and results of operation of each segment, the following is presented on both a consolidated and segment basis.
We acquired Fortegra in December, 2014. The acquisition is expected to generate a significant portion of our revenue and net income in 2015. For 2014, only the revenues earned and expenses incurred from the date of Fortegra’s acquisition have been incorporated in our financial statements. The net results of Fortegra in this limited period reflects certain closing costs and adjustments which we do not foresee recurring in 2015.
In October, 2014, we entered into an agreement to sell PFG to Blackstone. A significant portion of the Company’s 2014 net income was generated from our PFG subsidiary, which has been classified as “discontinued operations” in our financial statements. PFG’s net income for 2013 has also been reclassified as “discontinued operations.” The sale of PFG to Blackstone is expected to close in the third quarter of 2015. Based on a total purchase price of $165 million, we estimate that the GAAP pretax gain over December 31, 2014 book value will be approximately $35.2 million for the Company. We estimate Tiptree Financial’s incremental tax provision at the time of sale to be approximately $11.1 million. The incremental provision would bring total provisions for PFG related tax to approximately $26.5 million, which includes the deferred tax liability of $15.4 million already recorded as of December 31, 2014. The sale agreement specifies any results generated by PFG in 2015 will remain with PFG when sold.
27
Tiptree Selected Consolidated Financial Data
|
Year ended December 31,
|
||||||||
|
2014
|
2013 As adjusted
(1)
|
|||||||
|
Revenues:
|
||||||||
|
Net realized and unrealized gains on investments
|
$
|
8,961
|
|
$
|
6,887
|
|
||
|
Interest income
|
14,845
|
|
11,650
|
|
||||
|
Net credit derivative loss
|
(1,606
|
)
|
(1,828
|
)
|
||||
|
Service and administrative fees
|
8,657
|
|
—
|
|
||||
|
Ceding commissions
|
3,737
|
|
—
|
|
||||
|
Earned premiums, net
|
12,827
|
|
—
|
|
||||
|
Gain on sale of loans held for sale, net
|
7,154
|
|
—
|
|
||||
|
Loan fee income
|
3,736
|
|
459
|
|
||||
|
Rental revenue
|
19,747
|
|
5,760
|
|
||||
|
Other income
|
2,255
|
|
815
|
|
||||
|
Total revenue
|
80,313
|
|
23,743
|
|
||||
|
Expenses:
|
||||||||
|
Interest expense
|
12,541
|
|
4,865
|
|
||||
|
Payroll and employee commissions
|
33,788
|
|
16,741
|
|
||||
|
Commission expense
|
4,287
|
|
—
|
|
||||
|
Member benefit claims
|
2,676
|
|
—
|
|
||||
|
Net losses and loss adjustment expenses
|
3,153
|
|
—
|
|
||||
|
Professional fees
|
9,254
|
|
7,137
|
|
||||
|
Depreciation and amortization expenses
|
11,945
|
|
1,988
|
|
||||
|
Acquisition costs
|
6,121
|
|
—
|
|
||||
|
Other expenses
|
15,285
|
|
5,610
|
|
||||
|
Total expense
|
99,050
|
|
36,341
|
|
||||
|
Results of consolidated CLOs:
|
||||||||
|
Income attributable to consolidated CLOs
|
64,681
|
|
61,179
|
|
||||
|
Expenses attributable to consolidated CLOs
|
45,156
|
|
32,314
|
|
||||
|
Net Income attributable to consolidated CLOs
|
19,525
|
|
28,865
|
|
||||
|
Income before taxes from continuing operations
|
788
|
|
16,267
|
|
||||
|
Provision for income taxes
|
4,141
|
|
560
|
|
||||
|
(Loss) income from continuing operations
|
(3,353
|
)
|
15,707
|
|
||||
|
Discontinued operations:
|
||||||||
|
Income from discontinued operations, net
|
7,937
|
|
9,559
|
|
||||
|
Gain on sale of discontinued operations, net
|
—
|
|
15,463
|
|
||||
|
Discontinued operations, net
|
7,937
|
|
25,022
|
|
||||
|
Net income before non-controlling interests
|
4,584
|
|
40,729
|
|
||||
|
Less net income attributable to noncontrolling interest
|
6,294
|
|
30,336
|
|
||||
|
Net (loss) income available to common stockholders
|
$
|
(1,710
|
)
|
$
|
10,393
|
|
||
(1) See Note 3—Out of Period Adjustments, Changes in Accounting Principles and Reclassifications, for detail descriptions of these adjustments.
Consolidated Statements of Operations - Year ended December 31, 2014 compared with Year ended December 31, 2013
Summary of results
Net after tax income of the Company was $4.6 million for 2014 compared with $40.7 million in 2013. Revenues increased to $80.3 million in 2014 from $23.7 million in 2013. Expenses increased to $99.1 million in 2014 from $36.3 million in 2013. Expenses in 2014 include $6.1 million of charges incurred related to our Fortegra acquisition which are not expected to recur. Discussion of the changes in revenues, expenses and net income is presented below and in our segment analysis.
28
Net realized and unrealized gains on investments
The Company’s realized and unrealized gains on investments was $9.0 million in 2014, compared to $6.9 million in 2013. The majority of the gains in 2014 were realized by the Company’s Care subsidiary as the result of the repayment in full of a loan that had been held at a discounted value.
Interest income
Interest income is earned on the Company’s holdings of bonds and loans. Consolidated interest income was $14.8 million in 2014, compared to $11.7 million in 2013. Interest income was primarily earned from loans made by the Company’s specialty finance and real estate segments and from assets held in our corporate and other segment. Increased interest income in 2014 was attributable primarily to higher interest income from Siena’s expanded lending activities in 2014, which earned an additional $2.1 million of interest income in 2014 and at Luxury, which was acquired in 2014 and earned $1.0 million in 2014.
Net credit derivative revenue
The Company’s net credit derivative income/(loss) is earned on its credit swap and credit derivative index (CDX) positions. Net credit derivative revenue is the net total of premium income earned and premium expense incurred on our credit derivatives and net unrealized gains and losses from changes in the fair value of our credit derivative transactions. The net credit derivative loss of $1.6 million in 2014 was consistent with the net credit derivative loss of $1.8 million in 2013.
Service and administrative fees
Service and administrative fees were $8.7 million in 2014 and represent fees earned by Fortegra, since its acquisition, from a number of different activities, but principally from the provision of warranty protection on furniture, equipment and cell phones. Service fees are also earned through Fortegra’s car club program, offering road side assistance to motorists and car damage protection plans. Fortegra also earns administrative fees paid by reinsurance companies for insurance policies ceded by Fortegra to the reinsurer. The fee covers Fortegra’s administrative cost for issuing the policies plus a profit margin.
Ceding commissions
Ceding commissions were $3.7 million in 2014 and represent commissions earned by Fortegra, since its acquisition, under coinsurance agreements with third party insurers that are based on contractual formulas that take into account, in part, underwriting performance and investment returns experienced by companies assuming the insurance risks. As experience changes, adjustments to ceding commissions are reflected in the period and are based on the claim and investment experience of the related polices.
Earned premium, net
Earned premium, net, was $12.8 million in 2014 and represent direct and assumed earned premiums generated by Fortegra, since its acquisition, from the direct sale of payment protection insurance policies by Fortegra’s distributors and premiums written for payment protection insurance policies by another carrier and assumed by Fortegra. The underlying insurance plans primarily relate to credit protection in the event of job loss or disability.
Further discussion of service and administrative fee income, ceding fees and commissions and net earned premium earned by Fortegra in the period since acquisition is presented in our insurance and insurance services segment analysis, see “— Segment Reporting — Segment Results - year ended December 31, 2014 compared to year ended December 31, 2013 —Insurance and Insurance Services.”
Gain on sale of loans held for sale, net
Gain on sale of loans held for sale, net, were $7.2 million which was earned by Luxury from the origination and sale of loans, primarily residential mortgages, since its acquisition in January 2014.
Loan fee income
Siena and Luxury earn fees associated with their lending activities which are classified as loan fee income. Loan fee income was $3.7 million in 2014 and $459 thousand in 2013. Siena’s loan fee income was $1.9 million in 2014 and $459 thousand in 2013. The increase in loan fee income in 2014 was attributable to Siena’s increased lending activity in 2014. Luxury earned $1.8 million in loan fees since its acquisition in January 2014.
29
Rental revenue
Rental revenues are primarily earned from the properties owned by our Care subsidiaries. Rental revenue was $19.7 million in 2014 and $5.8 million in 2013. The higher revenue earned in 2014 was attributable to the increased number of properties owned by Care in 2014. Further discussion of rental income in 2014 and 2013 is presented in our real estate segment analysis.
Interest expense
The Company incurs interest expense on its borrowings. Interest expense was $12.5 million in 2014 and $4.9 million in 2013. The increase in interest expense was attributable to higher borrowings by the Company in 2014 and 2013. Further discussion of interest expenses in 2013 and 2014 is presented in our segment analysis. Further information relating to our borrowings may be found in “— Liquidity and Capital Resources” and in Note 15—Debt, in the accompanying consolidated financial statements.
Payroll and employee commissions
Payroll expense was $33.8 million in 2014, compared to $16.7 million in 2013. Payroll expenses increased in 2014 due to three primary factors: the acquisition of Luxury in January 2014, which added $8.2 million in payroll and employee commission expense; an increase in the number of Care joint ventures in 2014, which added $5.3 million in payroll expenses; and Fortegra’s payroll expense of $3.5 million for the period since its acquisition. Payroll expense at the corporate level also increased as the Company expanded its management and accounting resources to match the increased scope of its operations.
Commission expense
Commission expense was $4.3 million in 2014 and was incurred by Fortegra, since its acquisition, on most of its revenue classes, including commissions paid to distributors and retailers selling credit insurance policies, motor club memberships, mobile device protection and warranty service contracts. Credit insurance commission rates are, in many instances, set by state regulators and are also impacted by market conditions.
Member benefit claims
Member benefit claims were $2.7 million in 2014 and were incurred by Fortegra in the period since its acquisition. Member benefit claims represent costs of services and replacement devices incurred on Motor Club and ProtectCELL warranty protection programs.
Net losses and loss adjustment expenses
Net losses and loss adjustment expenses were $3.2 million in 2014 and were incurred by Fortegra in the period since its acquisition. Net losses and loss adjustment expenses represent actual insurance claims paid, changes in unpaid claim reserves, net of amounts ceded, and the costs of administering said claims. Incurred claims are impacted by loss frequency, which is a measure of the number of claims per unit of insured exposure and loss severity, which is based on the average size of claims. Factors affecting loss frequency and loss severity include changes in claims reporting patterns, claims settlement patterns, judicial decisions, economic conditions, morbidity patterns and the attitudes of claimants towards settlements.
Professional fees
Professional fees include audit, legal, tax advice, consultancy and other professional fees. Professional fee expenses are incurred by our subsidiary companies and Tiptree and Operating Company. Consolidated professional fee expense was $9.3 million in 2014, compared to $7.1 million in 2013. The increase in professional fees is primarily attributable to higher audit and legal fees associated with the acquisition and sale of subsidiaries.
Depreciation and amortization expense
Depreciation and amortization expense relates to the depreciation and amortization of the Company’s fixed assets, including buildings, leasehold improvements and other fixed assets. The Company also incurs amortization expense on the intangible assets acquired as a result of the purchase of subsidiary companies. Depreciation and amortization expense was $11.9 million in 2014, compared to $2.0 million in 2013. The increase in depreciation and amortization expense in 2014 was attributable primarily to $4.4 million in amortization of intangible assets acquired in conjunction with the expansion in Care joint ventures and due to $4.2 million in amortization of intangible assets acquired with the purchase of Fortegra.
30
Acquisition costs
The Company incurred costs of $6.1 million in connection with its acquisition of Fortegra, including consultancy fees and accelerated stock vesting expenses, which are not expected to be recurring, and have been classified as acquisition costs.
Other expenses
Other expenses were $15.3 million in 2014 and $5.6 million in 2013. Other expenses are incurred by all our segments and primarily consist of office and rent expenses, together with other expenses specific to each of the Company’s operating segments. The increase in other expenses in 2014 was primarily attributable to the expansion in the Company’s business activities including the acquisition of Luxury in 2014 which added $2.9 million of other expenses and Fortegra’s other expenses of $4.0 million incurred in the period since its acquisition.
Net Income attributable to consolidated CLOs
ASC Topic 810,
Consolidations,
requires the consolidation of a Variable Interest Entity (“VIE”) into the financial statements of the entity that is considered the VIE’s primary beneficiary (for further discussion, see Note 13—CLOs and Consolidated Variable Interest Entities of the accompanying financial statements). The Company has reviewed the CLOs it manages and determined that these CLOs should be consolidated into the Company’s financial statements.
New accounting guidance (ASU 2014-13,
Consolidation (Topic 810):
Measuring the Financial Assets and the Financial Liabilities of a Consolidated Collateralized Financing Entity
), enables the Company to recognize the value of the financial liabilities of the CLOs as the residual value of: (i) the sum of the fair value of the financial assets and the carrying value of any non-financial assets held temporarily, less (ii) the sum of the fair value of any beneficial interests in the CLOs held by the Company, including the fair value of subordinated debt and interest-only positions issued by the CLOs and unpaid compensation for management services provided by the Company. The Company has elected to early adopt this new accounting guidance and has also elected to apply it retrospectively for all relevant prior periods.
Previously, the Company did not elect to fair value the debt issued by the CLOs, which resulted in potentially significant movements in the net income attributable to CLOs as a result of the mark-to-market valuation of the assets of the CLOs but not the mark-to-market valuation of the debt issued by the CLOs.
The impact of the early adoption of the change in accounting guidance is that the net income attributed to consolidated CLOs now represents the Company’s economic interests in the CLOs, which includes realized and unrealized gains and losses on the subordinated debt and interest-only positions of the CLOs held by the Company, distributions earned on such debt and positions and the CLO management fees earned by the Company.
Both income and expenses attributable to consolidated CLOs increased over the prior year, primarily due to the increased number of CLOs managed by the Company. On December 31, 2014, the Company managed six CLOs, compared to four CLOs on December 31, 2013. The net income attributable to CLOs was $19.5 million in 2014, compared to $28.9 million in 2013. The decrease in net income in 2014 was primarily attributable to the decline in the net value of subordinated notes held by the Company in 2014 and by a reduction in management fees earned by the Company in 2014. The components of net income attributable to the consolidated CLOs are tabulated below:
|
Net Income attributable to CLOs managed by the Company
|
|||||||
|
Year ended December 31,
|
|||||||
|
2014
|
2013
|
||||||
|
Management fees paid by the CLOs to the Company
|
$
|
11,770
|
|
$
|
13,192
|
|
|
|
Distributions from the subordinated notes held by the Company
|
15,720
|
|
15,333
|
|
|||
|
Realized and unrealized gains on subordinated notes held by the Company
|
(7,965
|
)
|
340
|
|
|||
|
Net income attributable to the consolidated CLOs
|
$
|
19,525
|
|
$
|
28,865
|
|
|
The net income attributable to consolidated CLOs has been allocated to the asset management segment (representing the fees earned from the management of CLOs) and to the corporate and other segment (representing the distributions earned on the CLO subordinated debt and interest-only positions held by the Company and realized and unrealized gains and losses on such
31
debt and positions). The expenses the Company incurs in connection with the management of the CLOs have also been allocated to the asset management segment.
For further discussion of the Company’s CLO income and the costs the Company incurs associated with the management of the CLOs, which are not included in the table above, see “— Segment Reporting — Segment Results - year ended December 31, 2014 compared to year ended December 31, 2013 —Asset Management” and “— Segment Reporting — Segment Results - year ended December 31, 2014 compared to year ended December 31, 2013 — Corporate and Other”.
Provision for income taxes
The provision for income taxes increased in 2014 over the prior year primarily due to state income taxes, non-deductible transaction costs incurred on the Fortegra transaction and the effect of changes in valuation allowance on net operating losses reported by Tiptree Financial, Siena, Luxury and MFCA. The effective tax rate on income from continuing operations for the year ended December 31, 2014 was approximately 525.5% compared to 3.44% for the prior year end (which does not bear a customary relationship to statutory income tax rates). Differences from the statutory income tax rates are primarily the result of: (i) non-deductible transaction costs incurred in the Fortegra transactions (ii) the effect of changes in valuation allowance on net operating losses reported by Tiptree Financial, Siena, Luxury, and MFCA, and (iii) the effect of state income taxes required to be reported on a separate legal entity basis resulting in higher aggregate state taxable income than the consolidated pre-tax income from continuing operations.
Discontinued operations, net
Discontinued operations, net totaled $7.9 million in 2014, compared to $25.0 million in 2013. The components of discontinued operations in 2014 and 2013 are tabulated below:
|
Discontinued Operations
|
|||||||
|
Year ended December 31,
|
|||||||
|
2014
|
2013
|
||||||
|
Net income from Bickford discontinued operations
|
—
|
|
1,647
|
|
|||
|
Gain on sale from Bickford discontinued operations
|
—
|
|
15,463
|
|
|||
|
Net income from PFG discontinued operations
|
7,937
|
|
7,912
|
|
|||
|
Discontinued operations, net
|
$
|
7,937
|
|
|
$
|
25,022
|
|
In 2013, the Company had a $15.5 million net gain from the sale of the Bickford Portfolio of properties which had been owned by Care. There was no comparable gain on sale earned in 2014.
Net income from discontinued operations decreased to $7.9 million in 2014 from $9.6 million in 2013. The decline in net income from discontinued operations in 2014 is principally due to the absence of income from Bickford operations as noted below. Net income from discontinued operations at PFG increased slightly in 2014, principally due to increased separate account fees of $1.1 million, resulting from increased assets held in separate accounts and higher account management fee rates. Fees from the administration of Hartford policies increased in 2014 by $1.1 million due to higher assets under administration. Interest expense on PFAS’s notes declined by $1.0 million due to the amortization of the principal amount outstanding. These gains were largely offset by an increase in depreciation and amortization expense of $1.4 million, principally due to the increase in depreciation expense incurred in 2014 in connection with the move of PFAS’s physical location from New Jersey to Philadelphia and amortization expense relating to PFG’s intangible assets. Other expenses in 2014 also increased as a result of the move. There were no comparable move-related expenses in 2013. PFG incurred tax expense of $6.1 million in 2013 and $5.5 million in 2014.
Included in income from discontinued operations in 2013 was net income of $1.6 million from the Bickford Portfolio which did not recur in 2014. For further information relating to the sale of PFG see the discussion of discontinued operations in Part I of this document and Note 5—Dispositions, Assets Held for Sale and Discontinued Operations, in the accompanying consolidated financial statements.
Net loss available to Class A common stockholders
Net loss available to Class A common stockholders for the year ended December 31, 2014 was $1.7 million compared to net income of $10.4 million for the same period in 2013. The decline in net income available to Class A common stockholders was primarily due to the decline in the Company’s net income from $40.7 million in 2013 to $4.6 million in 2014.
32
Balance Sheet Information - Year Ended December 31, 2014 compared to December 31, 2013
The Company’s total assets were $8.2 billion as of December 31, 2014, compared to $6.9 billion as of December 31, 2013. The $1.3 billion increase in assets is primarily attributable to $760.2 million of assets acquired as a result of the purchase of Fortegra in 2014 and an increase of $572 million in the assets of the consolidated CLOs as a result of the issuance of two new CLOs under management in 2014. Total stockholders’ equity of the Company increased to $401.7 million as of December 31, 2014 compared to $396.9 million as of December 31, 2013. Total stockholders’ equity of Tiptree Financial rose to $284.5 million as of December 31, 2014 compared to $99.0 million as of December 31, 2013. The primary reason for the change in Tiptree Financial Inc. stockholders’ equity was the increased proportion of the Company owned by Class A stockholders as of December 31, 2014 compared with December 31, 2013, coupled with an increase in the Company’s total stockholder equity, as noted above.
Segment Reporting
During the year ended December 31, 2014, management changed its reportable operating segments. The Company now has five reportable operating segments, organized in a manner that reflects how management views the strategic business units.
The Company’s five operating segments are: insurance and insurance services, specialty finance, asset management, real estate and our corporate and other segment. See Note 6—Operating Segment Data, of the accompanying consolidated financial statements for a more detailed description of our segments.
The principal changes made to the operating segments in 2014 are summarized below:
|
•
|
Fortegra, which was acquired in December, 2014, was added to the insurance and insurance services segment. PFG, which the Company had agreed to sell in October, 2014, was reclassified as a discontinued operation and removed from the insurance and insurance services segment.
|
|
•
|
Luxury, a mortgage loan originator, which the Company acquired in January, 2014, was incorporated in the specialty finance segment. The Company had previously included MFCA and Tiptree Direct, which hold the Company’s principal investments, in the specialty finance segment. The results of the principal investments are now included in the corporate and other segment. The Company’s principal investments include CLO subordinated notes, risk mitigation transactions, warehouse holdings, holdings in the Star Asia entities and other corporate investments.
|
|
•
|
The real estate segment previously included investments in Star Asia entities. These investments are now reported in the corporate and other segment.
|
|
•
|
The net income attributable to consolidated CLOs has been allocated to the asset management segment (representing the fees earned from the management of CLOs) and to the corporate and other segment (representing the distributions earned on the CLO subordinated notes and interest-only positions held by the Company and realized and unrealized gains and losses on such debt and positions). The expenses the Company incurs in connection with the management of the CLOs have also been allocated to the asset management segment.
|
Each reportable segment’s profit/(loss) is reported before income taxes, discontinued operations and non-controlling interests. Intersegment revenue and expense relate to interest paid and received on loans and interest rate swaps between segments.
33
Segment results - year ended December 31, 2014
($ in thousands)
|
Year ended December 31, 2014
|
|||||||||||||||||||||||
|
Insurance and insurance services
|
Specialty finance
|
Asset management
|
Real estate
|
Corporate and other
|
Totals
|
||||||||||||||||||
|
Net realized and unrealized gains on investments
|
$
|
5
|
|
$
|
664
|
|
$
|
—
|
|
$
|
7,006
|
|
$
|
1,286
|
|
$
|
8,961
|
|
|||||
|
Interest income
|
196
|
|
3,611
|
|
—
|
|
1,529
|
|
9,509
|
|
14,845
|
|
|||||||||||
|
Net credit derivative loss
|
—
|
|
—
|
|
—
|
|
—
|
|
(1,606
|
)
|
(1,606
|
)
|
|||||||||||
|
Service and administrative fees
|
8,657
|
|
—
|
|
—
|
|
—
|
|
—
|
|
8,657
|
|
|||||||||||
|
Ceding commissions
|
3,737
|
|
—
|
|
—
|
|
—
|
|
—
|
|
3,737
|
|
|||||||||||
|
Earned premiums, net
|
12,827
|
|
—
|
|
—
|
|
—
|
|
—
|
|
12,827
|
|
|||||||||||
|
Gain on sale of loans held for sale, net
|
—
|
|
7,154
|
|
—
|
|
—
|
|
—
|
|
7,154
|
|
|||||||||||
|
Loan fee income
|
—
|
|
3,736
|
|
—
|
|
—
|
|
—
|
|
3,736
|
|
|||||||||||
|
Rental revenue
|
—
|
|
52
|
|
—
|
|
19,695
|
|
—
|
|
19,747
|
|
|||||||||||
|
Other income
|
753
|
|
6
|
|
278
|
|
1,051
|
|
167
|
|
2,255
|
|
|||||||||||
|
Total revenue
|
$
|
26,175
|
|
$
|
15,223
|
|
$
|
278
|
|
$
|
29,281
|
|
$
|
9,356
|
|
$
|
80,313
|
|
|||||
|
Interest expense
|
$
|
637
|
|
$
|
1,530
|
|
$
|
—
|
|
$
|
4,111
|
|
$
|
6,263
|
|
$
|
12,541
|
|
|||||
|
Payroll and employee commissions
|
3,483
|
|
10,690
|
|
5,117
|
|
8,056
|
|
6,442
|
|
33,788
|
|
|||||||||||
|
Commission expense
|
4,287
|
|
—
|
|
—
|
|
—
|
|
—
|
|
4,287
|
|
|||||||||||
|
Member benefit claims
|
2,676
|
|
—
|
|
—
|
|
—
|
|
—
|
|
2,676
|
|
|||||||||||
|
Net losses and loss adjustment expenses
|
3,153
|
|
—
|
|
—
|
|
—
|
|
—
|
|
3,153
|
|
|||||||||||
|
Professional fees
|
690
|
|
842
|
|
294
|
|
873
|
|
6,555
|
|
9,254
|
|
|||||||||||
|
Depreciation and amortization expenses
|
4,265
|
|
499
|
|
—
|
|
7,181
|
|
—
|
|
11,945
|
|
|||||||||||
|
Acquisition costs
|
6,121
|
|
—
|
|
—
|
|
—
|
|
—
|
|
6,121
|
|
|||||||||||
|
Other expenses
|
4,034
|
|
3,624
|
|
480
|
|
5,889
|
|
1,258
|
|
15,285
|
|
|||||||||||
|
Total expense
|
29,346
|
|
17,185
|
|
5,891
|
|
26,110
|
|
20,518
|
|
99,050
|
|
|||||||||||
|
Net intersegment revenue/(expense)
|
—
|
|
(341
|
)
|
—
|
|
—
|
|
341
|
|
—
|
|
|||||||||||
|
Net income attributable to consolidated CLOs (1)
|
—
|
|
—
|
|
11,770
|
|
—
|
|
7,755
|
|
19,525
|
|
|||||||||||
|
Segment profit/(loss)
|
$
|
(3,171
|
)
|
$
|
(2,303
|
)
|
$
|
6,157
|
|
$
|
3,171
|
|
$
|
(3,066
|
)
|
$
|
788
|
|
|||||
|
Less: Provision for income taxes
|
4,141
|
|
|||||||||||||||||||||
|
Discontinued operations
|
7,937
|
|
|||||||||||||||||||||
|
Net income before non-controlling interests
|
$
|
4,584
|
|
||||||||||||||||||||
|
Less: Net income attributable to non-controlling interest from continuing operations and discontinued operations
|
6,294
|
|
|||||||||||||||||||||
|
Net income available to common stockholders
|
$
|
(1,710
|
)
|
||||||||||||||||||||
|
Segment assets
|
$
|
760,149
|
|
$
|
79,075
|
|
$
|
2,871
|
|
$
|
179,822
|
|
$
|
65,570
|
|
$
|
1,087,487
|
|
|||||
|
Assets of consolidated CLOs
|
1,978,094
|
|
|||||||||||||||||||||
|
Assets held for sale
|
5,129,745
|
|
|||||||||||||||||||||
|
Total Assets
|
$
|
8,195,326
|
|
||||||||||||||||||||
(1)
Net income attributable to CLO’s represents the Company’s interest in the CLOs it manages. These interests have been allocated to asset management fees of $11.8 million earned by the Company and net realized and unrealized gains/losses and distributions of $7.8 million received from the subordinated notes and interest-only positions of the CLOs held by the Company.
34
Segment results - year ended December 31, 2013
($ in thousands)
|
Year ended December 31, 2013
|
|||||||||||||||||||||||
|
Insurance and insurance services
|
Specialty finance
|
Asset management
|
Real estate
|
Corporate and other
|
Totals
|
||||||||||||||||||
|
Net realized and unrealized gains on investments
|
$
|
—
|
|
$
|
—
|
|
$
|
—
|
|
$
|
385
|
|
$
|
6,502
|
|
$
|
6,887
|
|
|||||
|
Interest income
|
—
|
|
498
|
|
—
|
|
2,316
|
|
8,836
|
|
11,650
|
|
|||||||||||
|
Net credit derivative loss
|
—
|
|
—
|
|
—
|
|
—
|
|
(1,828
|
)
|
(1,828
|
)
|
|||||||||||
|
Service and administrative fees
|
—
|
|
—
|
|
—
|
|
—
|
|
—
|
|
—
|
|
|||||||||||
|
Ceding commissions
|
—
|
|
—
|
|
—
|
|
—
|
|
—
|
|
—
|
|
|||||||||||
|
Earned premiums, net
|
—
|
|
—
|
|
—
|
|
—
|
|
—
|
|
—
|
|
|||||||||||
|
Gain on sale of loans held for sale, net
|
—
|
|
—
|
|
—
|
|
—
|
|
—
|
|
—
|
|
|||||||||||
|
Loan fee income
|
—
|
|
459
|
|
—
|
|
—
|
|
—
|
|
459
|
|
|||||||||||
|
Rental revenue
|
—
|
|
—
|
|
—
|
|
5,760
|
|
—
|
|
5,760
|
|
|||||||||||
|
Other income
|
—
|
|
12
|
|
350
|
|
413
|
|
40
|
|
815
|
|
|||||||||||
|
Total revenue
|
$
|
—
|
|
$
|
969
|
|
$
|
350
|
|
$
|
8,874
|
|
$
|
13,550
|
|
$
|
23,743
|
|
|||||
|
Interest expense
|
$
|
—
|
|
$
|
24
|
|
$
|
—
|
|
$
|
1,825
|
|
$
|
3,016
|
|
$
|
4,865
|
|
|||||
|
Payroll and employee commissions
|
—
|
|
1,732
|
|
6,006
|
|
2,707
|
|
6,296
|
|
16,741
|
|
|||||||||||
|
Commission expense
|
—
|
|
—
|
|
—
|
|
—
|
|
—
|
|
—
|
|
|||||||||||
|
Member benefit claims
|
—
|
|
—
|
|
—
|
|
—
|
|
—
|
|
—
|
|
|||||||||||
|
Net losses and loss adjustment expenses
|
—
|
|
—
|
|
—
|
|
—
|
|
—
|
|
—
|
|
|||||||||||
|
Professional fees
|
—
|
|
292
|
|
242
|
|
1,957
|
|
4,646
|
|
7,137
|
|
|||||||||||
|
Depreciation and amortization expenses
|
—
|
|
96
|
|
—
|
|
1,892
|
|
—
|
|
1,988
|
|
|||||||||||
|
Acquisition costs
|
—
|
|
—
|
|
—
|
|
—
|
|
—
|
|
—
|
|
|||||||||||
|
Other expenses
|
—
|
|
529
|
|
402
|
|
3,702
|
|
977
|
|
5,610
|
|
|||||||||||
|
Total expense
|
—
|
|
2,673
|
|
6,650
|
|
12,083
|
|
14,935
|
|
36,341
|
|
|||||||||||
|
Net intersegment revenue/(expense)
|
—
|
|
—
|
|
—
|
|
—
|
|
—
|
|
|||||||||||||
|
Net income attributable to consolidated CLOs (1)
|
—
|
|
13,192
|
|
—
|
|
15,673
|
|
28,865
|
|
|||||||||||||
|
Segment profit/(loss)
|
$
|
—
|
|
$
|
(1,704
|
)
|
$
|
6,892
|
|
$
|
(3,209
|
)
|
$
|
14,288
|
|
$
|
16,267
|
|
|||||
|
Less: Provision for income taxes
|
560
|
|
|||||||||||||||||||||
|
Discontinued operations
|
25,022
|
|
|||||||||||||||||||||
|
Net income before non-controlling interests
|
$
|
40,729
|
|
||||||||||||||||||||
|
Less: Net income attributable to non-controlling interest from continuing operations and discontinued operations
|
30,336
|
|
|||||||||||||||||||||
|
Less: non-controlling interest on discontinued operations
|
—
|
|
|||||||||||||||||||||
|
Net income available to common stockholders
|
$
|
10,393
|
|
||||||||||||||||||||
|
Segment assets
|
$
|
—
|
|
$
|
21,338
|
|
$
|
176
|
|
$
|
160,328
|
|
$
|
334,347
|
|
$
|
516,189
|
|
|||||
|
Assets of consolidated CLOs
|
1,405,355
|
|
|||||||||||||||||||||
|
Assets held for sale
|
4,950,727
|
|
|||||||||||||||||||||
|
Total Assets
|
$
|
6,872,271
|
|
||||||||||||||||||||
(1)
Net income attributable to CLO’s represents the Company’s interest in the CLOs it manages. These interests have been allocated to asset management fees of $13.2 million earned by the Company and the net realized and unrealized gains/losses and distributions of $15.7 million received from the subordinated notes of the CLOs and interest-only positions held by the Company.
35
Segment Results - year ended December 31, 2014 compared to year ended December 31, 2013
Insurance and Insurance Services
The financial results of our insurance and insurance services segment are comprised of the revenues and expenses of our Fortegra subsidiary since the entity was acquired. The incorporation of full year Fortegra operations will result in a substantial increase in reported segment revenue and expense in 2015. For further discussion of the purchase of Fortegra and the effect of purchase price accounting adjustments made as a result of the acquisition, see Note 4—Business Acquisitions, of the accompanying consolidated financial statements.
Results of the Company’s PFG subsidiary, which had previously been presented in the insurance and insurance services segment have been reclassified as discontinued operations for 2014 and 2013.
Fortegra revenues earned from the date of acquisition totaled $26.2 million, comprised primarily of service and administrative fees of $8.7 million, ceding commissions of $3.7 million and net earned premiums of $12.8 million.
Fortegra earned $196 thousand of interest income in the period on its $171 million investment portfolio, comprised primarily of U.S. Treasury securities, obligations of U.S. government authorities and agencies and municipal and corporate securities. The average remaining maturity of this portfolio was 4.2 years and the average annualized yield on the portfolio was 2%.
Service and administrative fees for the period totaled $8.7 million. These fees include service and administrative fees of $7.7 million earned on Fortegra’s warranty programs for furniture and appliances, the ProtectCELL program for cell phone protection and car club memberships providing roadside assistance and car damage protection. Fortegra also earned fees of $1.0 million related to the administration of insurance policies ceded to reinsurance companies.
Ceding commissions of $3.7 million is revenue earned under reinsurance agreements with third party insurers who co-insure risks with Fortegra. The agreements with the third party insurers take into account the underwriting performance and investment returns experienced by the assuming companies. Ceding commission income is computed based upon the earned premium and investment income from the assets held in trust for Fortegra’s benefit, less earned commissions, incurred claims and the reinsurer’s fee for coverage.
Fortegra’s expenses for the period totaled $29.3 million, comprised primarily of interest expense of $637 thousand, payroll and employee commissions expense of $3.5 million, commission expenses of $4.3 million, member benefit claims of $2.7 million, net losses and loss adjustment expense of $3.2 million,
depreciation and amortization expenses of $4.3 million and other expenses of $4.0 million.
Fortegra’s interest expense was $637 thousand for the period, which consisted of $582 thousand related to the borrowings under bank lines and the trust preferred security issued by Fortegra and $55 thousand of other interest expense. For further information relating to Fortegra’s debt and interest expenses, please refer to our Liquidity and Capital Resources discussion and analysis and to Note 15—Debt, of the accompanying consolidated financial statements.
Fortegra’s payroll and employee commissions expense of $3.5 million includes base salaries, employee commissions and accruals for employee paid time off and bonuses. As of December 31, 2014, Fortegra employed 523 full and part time employees.
Depreciation and amortization expense of $4.3 million related primarily to the amortization of the intangible assets acquired as a result of Tiptree’s purchase of Fortegra. The most significant of these expenses is the amortization of the insurance policies and contracts acquired, which had a value of $36.5 million as of the acquisition date and which has a steep amortization curve. Amortization of this intangible asset cost approximately $4.0 million in the period.
Other expenses of $4.0 million included deferred administrative costs of $1.7 million, an accrual of $500 thousand related to the potential settlement cost of outstanding legal claims, bank and credit card processing fees of $220 thousand, technology expenses of $180 thousand and filing and licensing fees of $129 thousand. Also included in other expenses is Fortegra’s rent expense for its offices of $194 thousand for the period.
During the period, the Company incurred $6.1 million of costs, including consultancy fees and accelerated stock vesting costs, in connection with the Company’s purchase of Fortegra which are not expected to recur. These costs have been included in the insurance and insurance services segment results.
36
Specialty Finance
Our specialty finance segment is comprised of Siena, a commercial finance company, which is 62% owned by the Company and Luxury, a mortgage originator which is 67.5% owned by the Company. Siena commenced its operations in April 2013, and Luxury was acquired by the Company in January 2014. Segment results incorporate the revenues and expenses of these subsidiaries since they commenced operations or were acquired.
Total revenues of our specialty finance segment were $15.2 million in 2014, compared to $969 thousand for 2013. Total segment expenses were $17.2 million in 2014 and $2.7 million in 2013. Net losses for the segment before taxes and non-controlling interests were $2.3 million in 2014 and $1.7 million in 2013.
The Company manages Siena and Luxury as a single operating segment. However, for additional analysis, the revenues and expenses of Siena and Luxury have been tabulated below:
|
Siena
|
Luxury
|
||||||||||
|
Year ended December 31, 2014
|
9 month period ended December 31, 2013
|
11 month period ended December 31, 2014
|
|||||||||
|
Net realized and unrealized gains on investments
|
$
|
—
|
|
$
|
—
|
|
$
|
664
|
|
||
|
Interest income
|
2,566
|
|
498
|
|
1,045
|
|
|||||
|
Gain on sale of loans held for sale, net
|
—
|
|
—
|
|
7,154
|
|
|||||
|
Loan fee income
|
1,931
|
|
459
|
|
1,805
|
|
|||||
|
Rental revenue
|
—
|
|
—
|
|
53
|
|
|||||
|
Other income
|
5
|
|
12
|
|
—
|
|
|||||
|
Total revenue
|
4,502
|
|
969
|
|
10,721
|
|
|||||
|
Interest expense
|
497
|
|
24
|
|
1,033
|
|
|||||
|
Payroll and employee commissions
|
2,468
|
|
1,732
|
|
8,222
|
|
|||||
|
Professional fees
|
448
|
|
292
|
|
394
|
|
|||||
|
Depreciation and amortization expenses
|
244
|
|
96
|
|
254
|
|
|||||
|
Other expenses
|
726
|
|
529
|
|
2,899
|
|
|||||
|
Total expense
|
4,383
|
|
2,673
|
|
12,802
|
|
|||||
|
Intersegment expense
|
—
|
|
—
|
|
(341
|
)
|
|||||
|
Segment profit/(loss)
|
$
|
119
|
|
$
|
(1,704
|
)
|
$
|
(2,422
|
)
|
||
Siena - year ended December 31, 2014 and nine month period ending December 31, 2013
Siena earned net pre-tax income of $119 thousand in 2014 and incurred a net pre-tax loss of $1.7 million in 2013. The improvement in results was chiefly attributable to significant increases in interest income and loan fee income in 2014. Siena’s expenses also increased in 2014 but not to the same extent as the increase in revenues. Revenues earned by Siena totaled $4.5 million in 2014 and $969 thousand in 2013. Siena’s revenues are primarily from interest on its loans to small and medium sized U.S. companies and fees charged in connection with those loans. Siena’s expenses were $4.4 million in 2014 and $2.7 million in 2013. Siena’s expenses are comprised primarily of interest expense on the Company’s borrowings, payroll and employee commissions, professional fees, depreciation and amortization and other expenses.
Siena’s interest income totaled $2.6 million in 2014, compared to $498 thousand in 2013. Total interest income in 2014 consisted of interest income on loans of $1.9 million and amortized origination income of $1.0 million, partly offset by amortization of loan origination expenses of $357 thousand. Interest income in 2013 consisted of interest income on loans of $379 thousand and amortized origination income of $119 thousand. Siena’s average outstanding loan balance was $29.3 million in 2014 and $6.0 million in 2013. The average interest rate earned on the outstanding loans was 6.48% in 2014 and 6.67% in 2013.
Siena’s loan fee income was $1.9 million in 2014, compared to $459 thousand in 2013. Loan fee income in 2014 principally comprised unused line of credit fees of $289 thousand, loan monitoring fees of $491 thousand, collection fees of $213 thousand, consulting fees of $256 thousand and facility cancellation and other fees of $381 thousand. The increase in net interest income and loan fee income was attributable chiefly to the increased volume of loans made in 2014.
37
Siena’s interest expense was $497 thousand in 2014, compared to $24 thousand in 2013. Interest expense was incurred on drawings under Siena’s $65 million line of credit facility, of which an average of $18.0 million was drawn down in 2014 and $1.8 million in 2013. The increase in interest expense in 2014 was due both to higher average borrowings and a full year of operations.
Siena’s payroll and employee commission expense was $2.5 million in 2014, compared to $1.7 million in 2013. These expenses were chiefly comprised of wages of $1,253 thousand in 2014 and $904 thousand in 2013, together with bonus expenses of $770 thousand in 2014 and $683 thousand in 2013. Other payroll expenses totaled $445 thousand in 2014 and $145 thousand in 2013, consisting of payroll taxes and employee benefits. The number of Siena employees increased from 7 at the end of 2013 to 13 at the end of 2014.
Professional fees at Siena totaled $448 thousand in 2014 and $292 thousand in 2013. Professional fees included audit, legal, contractor fees, director fees and other professional fees. Siena’s other expenses were $726 thousand in 2014 and $529 thousand in 2013. Other expenses include bad debt expense, bank fees, line of credit fees, technology expense, insurance expense and miscellaneous other offices charges.
Luxury - 11 month period ended December 31, 2014
Luxury incurred a pre-tax loss of $2.4 million during the year. Revenues earned by Luxury during the eleven months period ended December 31, 2014 were chiefly comprised of gains on loans held for sale of $7.2 million, interest income of $1.0 million on the loans held pending sale to investors and fee income and other income of $1.8 million. Luxury also recorded unrealized gains totaling $664 thousand on derivative and other transactions designed to mitigate the interest rate risk associated with holding mortgages prior to sale to investors.
Interest expense was $809 thousand in the period, representing interest paid on drawings under Luxury’s warehouse lines of credit. Luxury has entered into three warehouse lines of credit agreements totaling $82.5 million. As of December 31, 2014, $27.4 million was outstanding under these lines of credit.
Expenses of Luxury totaled $12.8 million in the period, primarily payroll and commission costs of $8.2 million, of which $4.8 million was employee salaries, incentive compensation and employee benefits and $3.3 million in commissions paid to Luxury’s loan officers. Employee commissions are based on the volume of mortgage transactions originated. For the eleven month period ended December 31, 2014, Luxury originated mortgage loans with a total face value of $538.7 million.
Professional fees at Luxury were chiefly comprised of design consulting fees of $230 thousand associated with recruiting initiatives and the build-out of new branches, together with audit and legal fees of $75 thousand. Other expenses of $2.9 million included mortgage origination related fees and mortgage recording taxes of $793 thousand, branch occupancy expense of $1.1 million and $472 thousand in office related expenses. Luxury’s intersegment expense of $341 thousand represented interest on a subordinated loan from Tiptree that was converted into preferred equity in October 2014.
Asset Management
The asset management segment generates fee income from the CLOs under management and from its management of NPPF 1, a portfolio of tax-exempt securities owned by third-party investors.
CLO asset management fees totaled $11.8 million in 2014, compared to $13.2 million in 2013. Although the number of CLOs under management increased from four CLOs as of December 31, 2013 to six CLOs as of December 31, 2014, management fee income declined between 2013 and 2014. The decrease was due principally to the reduction in management fees earned on Telos 1 and Telos 2, which have passed their re-investment period and whose assets are declining, generally resulting in reduced management fees. Fees on Telos 5 and Telos 6, both new in 2014, were earned at a lower rate than the fees generated from Telos 1 and Telos 2. In addition, Telos 5 was launched in May 2014 and Telos 6 in December 2014 which meant that fees from the new CLOs were earned for only a portion of 2014.
Total expenses for asset management were $5.9 million for 2014, compared to $6.7 million for 2013. The expenses were comprised primarily of the payroll expense for the asset managers, together with professional fees and other office expenses. The decrease in expenses of $759 thousand in 2014 was primarily attributable to a reduction in staff bonuses for 2014.
Total pre-tax income for the asset management segment was $6.2 million for 2014, compared to $6.9 million in 2013. The decline in net segment income in 2014 was primarily attributable to lower CLO management fees earned in 2014, somewhat offset by lower expenses in 2014.
38
Real Estate
The real estate segment consists of our Care subsidiary, which primarily acquires and owns seniors housing properties. As of the issuance date of this report, Care’s portfolio consists of 24 properties across 9 states primarily in the Mid-Atlantic and Southern United States. Care’s portfolio is comprised of 5 triple net lease properties, 13 joint venture properties and 6 hybrid triple net lease properties, which are properties where Care owns the real estate and the operator owns the operating company, with the operator paying a contractual annual minimum rent and Care and the operator both sharing in the upside of the property’s net operating income based on agreed metrics.
Care’s investment strategy targets properties and portfolios ranging from $5 million to $250 million with a profile mix of stabilized properties, turnaround properties and development properties. Care’s operating and growth strategy is focused on strategic partnerships with regional operators who are looking for a capital base to grow their current portfolio. This partnership model builds long-term relationships over multiple property transactions and allows operators to focus on facility management while Care focuses on managing capital structure.
Total revenues for real estate operations were $29.3 million for 2014, compared with $8.9 million for 2013, an increase of $20.4 million. The increase in revenues was partly due to realized and unrealized gains of $7.0 million attributable to the net gain of $7.9 million from the 2014 repayment of the Westside Loan, which had previously been carried at lower carrying value, offset by $0.9 million in unrealized losses on interest rate swaps. Rental income increased to $19.7 million for 2014 compared with $5.8 million for 2013. The significant increase in rental income was principally due to the increase in number of the properties owned by Care in 2014, compared to 2013. As of December 31, 2014, Care owned properties with a total area of approximately 879,000 square feet compared with 576,000 square feet as of December 31, 2013.
Interest income earned by Care was $1.5 million in 2014, compared to $2.3 million in 2013. The interest income was primarily from the Westside Loan which ceased upon repayment of the Westside Loan during the third quarter in 2014. Care has also earned interest income on a secured loan to the lessees of one of its properties. The carrying value of the loan was $700 thousand as of December 31, 2014.
Other revenues earned by Care were $1.1 million in 2014, compared to $413 thousand in 2013. Revenues in 2014 included resident fees of $547 thousand and reimbursable escrow earnings of $507 thousand. In 2013, resident fees exclusive of rental revenue were $95 thousand and reimbursable escrow earnings were $319 thousand. The increase in other revenues in 2014 was due to the increased number of properties owned by Care.
Total expenses for the real estate segment were $26.1 million in 2014, compared to $12.1 million in 2013. Segment expenses are comprised of interest expenses on Care’s borrowings, payroll expenses, professional fees, depreciation and amortization of properties and leases acquired and other expenses.
Interest expense was $4.1 million in 2014, compared to $1.8 million in 2013. The increase in 2014 was due to additional secured loans financing Care’s purchases of additional properties in 2014. The total amount of loans outstanding under these secured loans was $108.3 million as of December 31, 2014, compared with $82.0 million as of December 31, 2013. Further details of Care’s borrowings are provided in our Liquidity and Capital discussion and in Note 15—Debt, in the accompanying consolidated financial statements.
Payroll expense, which includes the payroll expenses of managers which are allocated to the operators of the properties owned by Care’s joint venture subsidiaries as well as the expense of Care’s management team, was $8.1 million in 2014, compared to $2.7 million in 2013. The increase in payroll expense is attributable to the expansion in the number of Care joint venture acquisitions during 2013 and 2014.
Professional fee expense was $873 thousand in 2014, compared to $2.0 million in 2013. Professional fees in 2014 were comprised of legal expenses of $686 thousand, chiefly incurred as a result of acquisitions and dispositions of properties in the year, and audit and tax preparation expenses totaling $130 thousand. Professional fees were higher in 2013 principally due to significant expenses incurred in connection with the Contribution Transaction on July 1, 2013.
Depreciation and amortization expenses were $7.2 million in 2014, compared to $1.9 million in 2013. Depreciation and amortization expense chiefly relates to the depreciation of Care’s buildings and improvements and the amortization of the fair value attributed to leases in place upon the acquisition of joint ventures. The increase in 2014 was attributable to Care’s acquisition of properties during 2013 and 2014 and a $3.8 million increase in the amortization of intangible lease assets resulting from new joint ventures.
39
Other expenses were $5.9 million in 2014, compared to $3.7 million in 2013. Other expenses include property operating expenses, rent and facilities of office premises, office related expenses, management fees to third parties, escrow fees related to mortgage notes payable, property taxes, insurance, and travel related expenses. In 2014, property operating expenses and other office expenses were $2.5 million, rent and facilities expense was $929 thousand, management fees to third parties were $699 thousand, escrow fees were $508 thousand, property taxes were $501 thousand, insurance expense was $308 thousand, start-up costs were $274 thousand, and travel expenses were $118 thousand. In 2013, property operating expenses and other office expenses were $2.5 million, escrow fees were $314 thousand, rent and facilities were $229 thousand, insurance was $212 thousand, and property operating expenses were $131 thousand. The increase in other expenses in 2014 was generally attributable to the expansion in the number of Care’s owned properties in 2013 and 2014.
Corporate and Other
Revenues and expenses of the corporate and other segment for the year ended December 31, 2014 and 2013, are tabulated below:
|
Year ended December 31, 2014
|
|||||||||||||||||||||||||||
|
CLO subordinated notes
|
Tax exempt portfolio
|
Risk mitigation transactions
|
Warehouse credit facilities
|
Star Asia entities
|
Corporate
|
Total
|
|||||||||||||||||||||
|
Net realized and unrealized gains on investments
|
$
|
—
|
|
$
|
1,047
|
|
$
|
(1,153
|
)
|
$
|
(1,584
|
)
|
$
|
3,200
|
|
$
|
(224
|
)
|
$
|
1,286
|
|
||||||
|
Interest income
|
—
|
|
1,667
|
|
—
|
|
7,315
|
|
—
|
|
527
|
|
9,509
|
|
|||||||||||||
|
Net credit derivative loss
|
—
|
|
—
|
|
(1,606
|
)
|
—
|
|
—
|
|
—
|
|
(1,606
|
)
|
|||||||||||||
|
Other income
|
—
|
|
—
|
|
—
|
|
—
|
|
168
|
|
(1
|
)
|
167
|
|
|||||||||||||
|
Total revenue
|
—
|
|
2,714
|
|
(2,759
|
)
|
5,731
|
|
3,368
|
|
302
|
|
9,356
|
|
|||||||||||||
|
Interest expense
|
—
|
|
—
|
|
386
|
|
1,595
|
|
—
|
|
4,282
|
|
6,263
|
|
|||||||||||||
|
Payroll and employee commissions
|
—
|
|
665
|
|
—
|
|
—
|
|
—
|
|
5,777
|
|
6,442
|
|
|||||||||||||
|
Professional fees
|
—
|
|
75
|
|
—
|
|
42
|
|
—
|
|
6,438
|
|
6,555
|
|
|||||||||||||
|
Depreciation and amortization expenses
|
—
|
|
—
|
|
—
|
|
—
|
|
—
|
|
—
|
|
—
|
|
|||||||||||||
|
Other expenses
|
—
|
|
183
|
|
—
|
|
—
|
|
—
|
|
1,075
|
|
1,258
|
|
|||||||||||||
|
Total expense
|
—
|
|
923
|
|
386
|
|
1,637
|
|
—
|
|
17,572
|
|
20,518
|
|
|||||||||||||
|
Intersegment revenue
|
—
|
|
—
|
|
—
|
|
—
|
|
—
|
|
341
|
|
341
|
|
|||||||||||||
|
Distributions received and realized and unrealized gains and losses on the subordinated notes and interest-only positions held by the Company, net
|
7,755
|
|
—
|
|
—
|
|
—
|
|
—
|
|
—
|
|
7,755
|
|
|||||||||||||
|
Segment profit/(loss)
|
$
|
7,755
|
|
|
$
|
1,791
|
|
|
$
|
(3,145
|
)
|
|
$
|
4,094
|
|
|
$
|
3,368
|
|
|
$
|
(16,929
|
)
|
|
$
|
(3,066
|
)
|
|
Year ended December 31, 2013
|
|||||||||||||||||||||||||||
|
CLO Subordinated notes
|
|
Tax exempt portfolio
|
Risk mitigation transactions
|
Warehouse credit facilities
|
Star Asia entities
|
Corporate
|
Totals
|
||||||||||||||||||||
|
Net realized and unrealized gains on investments
|
$
|
—
|
|
$
|
(863
|
)
|
$
|
2,610
|
|
$
|
1,571
|
|
$
|
3,343
|
|
$
|
(159
|
)
|
$
|
6,502
|
|
||||||
|
Interest income
|
—
|
|
2,656
|
|
85
|
|
5,311
|
|
—
|
|
784
|
|
8,836
|
|
|||||||||||||
|
Net credit derivative loss
|
—
|
|
—
|
|
(1,828
|
)
|
—
|
|
—
|
|
—
|
|
(1,828
|
)
|
|||||||||||||
|
Other income
|
—
|
|
(3
|
)
|
—
|
|
—
|
|
43
|
|
40
|
|
|||||||||||||||
|
Total revenue
|
—
|
|
1,790
|
|
867
|
|
6,882
|
|
3,343
|
|
668
|
|
13,550
|
|
|||||||||||||
|
Interest expense
|
—
|
|
—
|
|
695
|
|
943
|
|
—
|
|
1,378
|
|
3,016
|
|
|||||||||||||
|
Payroll and employee commissions
|
—
|
|
990
|
|
—
|
|
—
|
|
—
|
|
5,306
|
|
6,296
|
|
|||||||||||||
|
Professional fees
|
—
|
|
132
|
|
—
|
|
—
|
|
—
|
|
4,514
|
|
4,646
|
|
|||||||||||||
|
Depreciation and amortization expenses
|
—
|
|
—
|
|
—
|
|
—
|
|
—
|
|
—
|
|
—
|
|
|||||||||||||
|
Other expenses
|
—
|
|
201
|
|
—
|
|
—
|
|
—
|
|
776
|
|
977
|
|
|||||||||||||
40
|
Year ended December 31, 2013
|
|||||||||||||||||||||||||||
|
CLO Subordinated notes
|
|
Tax exempt portfolio
|
Risk mitigation transactions
|
Warehouse credit facilities
|
Star Asia entities
|
Corporate
|
Totals
|
||||||||||||||||||||
|
Total expense
|
—
|
|
1,323
|
|
695
|
|
943
|
|
—
|
|
11,974
|
|
14,935
|
|
|||||||||||||
|
Intersegment revenue
|
—
|
|
(213
|
)
|
—
|
|
—
|
|
—
|
|
213
|
|
—
|
|
|||||||||||||
|
Distributions received and realized and unrealized gains and losses on the subordinated note and interest-only positions held by the Company, net
|
15,673
|
|
—
|
|
—
|
|
—
|
|
—
|
|
—
|
|
15,673
|
|
|||||||||||||
|
Segment profit/(loss)
|
$
|
15,673
|
|
|
$
|
254
|
|
|
$
|
172
|
|
|
$
|
5,939
|
|
|
$
|
3,343
|
|
|
$
|
(11,093
|
)
|
|
$
|
14,288
|
|
Revenues of the corporate and other segment were comprised of realized and unrealized gains on the Company’s principal investments, including: holdings of subordinated notes and interest-only positions issued by CLOs managed by the Company; distributions on those subordinated notes; realized and unrealized gains and losses and interest income from the Company’s portfolio of tax exempt securities; net loss from the short Treasury position and credit derivative risk mitigation transactions; unrealized gain from the Star Asia entities and revenues from the loan warehouse credit facilities established by the Company in anticipation of launching new CLOs.
As of December 31, 2014 and 2013, the Company held total investments at fair value of $97.9 million and $65.4 million respectively, in subordinated notes and interest-only positions issued primarily by CLOs managed by the Company. In 2014, the Company earned a net total of $7.8 million from distributions received and realized and unrealized gains and losses on its holdings of CLO subordinated notes. In 2013, the Company earned a net total of $15.7 million from distributions received and realized and unrealized gains and losses on its holdings of CLO subordinated notes.
As of December 31, 2014 and 2013, the Company held investments at fair value of $13.2 million and $31.0 million, respectively, in portfolios of tax-exempt securities managed by the Company. The Company earned realized and unrealized gains of $1.0 million in 2014 and incurred realized and unrealized losses of $863 thousand in 2013 from these portfolios. Interest income earned from these securities was $1.7 million in 2014, compared to $2.7 million in 2013. The decline in interest income in 2014 was due to reduced size of the securities portfolio.
The Company has entered into a short Treasury position, and in 2013 also held an interest rate swap position to mitigate the potential negative impact of a general rise in interest rates. The Company has also entered into a credit derivative swap and CDX derivative index positions, buying and selling credit protection on different tranches of risk in differing CDX indices. The credit swap and CDX transactions are designed to mitigate the potential impact of a general deterioration in corporate credit risk.
Net pre-tax results from the risk mitigation transactions was a pre-tax loss of $3.1 million in 2014, compared to a pre-tax gain of $172 thousand in 2013. The Company incurred realized and unrealized losses of $1.2 million in 2014 from its short Treasury and interest rate swap positions and earned realized and unrealized gains of $2.6 million in 2013. Net credit derivative losses on its credit swap and CDX transactions were $1.6 million in 2014, compared to $1.8 million in 2013. Interest expenses incurred in connection with these risk mitigation transactions were $386 thousand in 2014, compared to $695 thousand in 2013.
Corporate realized and unrealized gains and losses and interest income on investments were $302 thousand in 2014 and $668 thousand in 2013. The gain in 2014 comprised of $485 thousand of interest earned on a collateralized debt obligation (“CDO”) asset held by the Company and distributions on CLO subordinated notes managed by a third party, and bank and loan interest of $42 thousand offset by unrealized losses of $224 thousand on the CDO asset. The gain in 2013 comprised of $613 thousand of interest earned on the CDO assets and distributions on CLO subordinated notes managed by a third party and $170 thousand of interest earned on loans to two senior executives of Luxury made by the Company offset by a realized loss of $84 thousand on an equity investment and unrealized losses totaling $75 thousand on the CDO and the subordinated notes of the CLOs under third party management.
In 2013 and in 2014, the Company established loan warehouse credit facilities which were designed to hold loans until new CLOs could be formed. The warehouse loans were used to seed Telos 3 and Telos 4 in 2013 and Telos 5 and Telos 6 in 2014, which are all CLOs managed by the Company. Net pre-tax income from the warehouse loans was $4.1 million in 2014, compared to $5.9 million in 2013. Interest income earned from the warehouse loans was $7.3 million partially offset by unrealized losses of $1.6 million in 2014, compared to interest income of $5.3 million and unrealized gains of $1.6 million in 2013. Interest expense incurred in the funding of the warehouse loans was $1.6 million in 2014, compared to $943 thousand in 2013.
41
The Corporate and other segment revenues include income from the Company’s investments in the Star Asia Entities. The Star Asia Entities are Tokyo-based real estate holding companies formed to invest in Asian properties and real estate related debt instruments. The Company earned a total of $3.4 million in 2014, compared to $3.3 million in 2013 from its investments in these entities. The Star Asia Entities revenues in 2014 primarily comprised gains of $2.6 million from Star Asia Opportunity II, LLC’s sale of a property and unrealized gains of $556 thousand from the appreciation in Star Asia Finance, Limited’s shares held by the Company. The Star Asia Entities’ revenue of $3.3 million in 2013 chiefly comprised mark-to-market gains from the Company’s interests in Star Asia Opportunity II, LLC.
Corporate interest expense was $4.3 million in 2014, compared to $1.4 million in 2013. This expense includes the amortization of capitalized costs associated with the Company’s credit agreement with Fortress. Interest expense incurred on the Company’s borrowings under the Fortress line of credit was $4.3 million in 2014, compared to $1.3 million in 2013. Interest expense in 2013 also included $126 thousand paid on a note which was redeemed prior to the end of 2013. Further details of the Company’s borrowings under the Fortress credit agreement are provided in our Liquidity and Capital Resources discussion and analysis and in Note 15—Debt, in the accompanying consolidated financial statements. Corporate operating expenses include payroll, professional fees and other expenses. Payroll expenses, which include salaries, bonuses and benefits totaled $6.4 million in 2014, compared to $6.3 million in 2013
.
Corporate payroll expense in 2014 was comprised of $665 thousand for the staff and management of the Company’s tax exempt portfolio and $5.8 million of corporate payroll expenses, primarily associated with the head office management, legal and accounting staff. Payroll expenses increased in 2014 as the Company expanded its staff to match the increased scope of its activities.
Corporate professional fees include external legal and audit costs as well as fees paid to affiliate companies for the provision of professional services. Corporate professional fees totaled $6.4 million in 2014 and chiefly comprised audit expenses of $1.3 million, legal expenses of $1.3 million, taxation advice and tax filing preparation fees of $775 thousand, consulting and other professional fees of $1.4 million and director fees and expenses of $503 thousand. Also included in corporate professional fees in 2014 are amounts paid to Tricadia and Mariner of $1.2 million for the provision of senior management and finance staff services, legal compliance and information technology services. For further information relating to the payment of fees to Mariner and Tricadia, see Note 21—Related Party Transactions, in the accompanying consolidated financial statements.
Corporate professional fees totaled $4.6 million in 2013 and primarily consisted of audit expenses of $1.2 million, legal expenses of $743 thousand, taxation advice and tax filing preparation fees of $437 thousand, consulting fees of $485 thousand and director fees and expenses of $322 thousand. Also included in corporate professional fees in 2013 are amounts paid to Mariner and Tricadia of $1.4 million for the provision of senior management and finance staff services, legal compliance and information technology services.
Other expenses were $1.3 million in 2014 and $977 thousand in 2013. The other expenses primarily consisted of insurance, shareholder support, office rent and other office costs and travel expenses
.
In 2014, there were slight increases in these items largely driven by an increase of $0.2 million in insurance and $0.1 million in office rent.
Non-GAAP Financial Measure
Management uses EBITDA and Adjusted EBITDA, which are non-GAAP financial measures. We believe that EBITDA and Adjusted EBITDA provide supplemental information useful to investors as it is frequently used by the financial community to analyze performance period to period, to analyze a company’s ability to service its debt and to facilitate comparison among companies. EBITDA and Adjusted EBITDA are not a measurement of financial performance or liquidity under GAAP; therefore, EBITDA and Adjusted EBITDA should not be considered as an alternative or substitute for GAAP. Our presentation of EBITDA and Adjusted EBITDA may differ from similarly titled non-GAAP financial measures used by other companies. We define EBITDA as GAAP net income of the Company adjusted to add consolidated interest expense, consolidated income taxes and consolidated depreciation and amortization expense as presented in our financial statements and Adjusted EBITDA as EBITDA adjusted to (i) subtract interest expense on asset-specific debt incurred in the ordinary course of our subsidiaries business operations and (ii) add significant non-recurring costs.
42
|
Reconciliation from the Company’s GAAP net income to Non-GAAP financial measures - EBITDA and Adjusted EBITDA
|
||||||||
|
($ in thousands)
|
Year ended
|
Year ended
|
||||||
|
December 31, 2014
|
December 31, 2013
|
|||||||
|
Net income (loss) available to Class A common stockholders
|
|
$
|
(1,710
|
)
|
$
|
10,393
|
|
|
|
Add net income attributable to noncontrolling interest
|
|
6,294
|
|
|
30,336
|
|
||
|
Less net income from discontinued operations
|
|
(7,937
|
)
|
|
(25,022
|
)
|
||
|
Income (loss) from Continuing Operations of the Company
|
|
$
|
(3,353
|
)
|
|
$
|
15,707
|
|
|
Consolidated interest expense
|
|
12,541
|
|
|
4,865
|
|
||
|
Consolidated income taxes
|
|
4,141
|
|
|
560
|
|
||
|
Consolidated depreciation and amortization expense
|
|
11,945
|
|
|
1,988
|
|
||
|
EBITDA for Continuing Operations
|
|
$
|
25,274
|
|
|
$
|
23,120
|
|
|
Consolidated non-corporate and non-acquisition related interest expense
(1)
|
|
(7,236
|
)
|
|
(2,792
|
)
|
||
|
Significant non-recurring costs
(2)
|
|
6,121
|
|
|
—
|
|
||
|
Subtotal Adjusted EBITDA for Continuing Operations of the Company
|
|
$
|
24,159
|
|
|
$
|
20,328
|
|
|
|
|
|
|
|
||||
|
|
|
|
|
|
||||
|
Income from Discontinued Operations of the Company
(3)
|
|
$
|
7,937
|
|
|
$
|
25,022
|
|
|
Consolidated interest expense
|
|
11,475
|
|
|
15,057
|
|
||
|
Consolidated income taxes
|
|
5,525
|
|
|
6,090
|
|
||
|
Consolidated depreciation and amortization expense
|
|
4,379
|
|
|
4,705
|
|
||
|
EBITDA for Discontinued Operations
|
|
$
|
29,316
|
|
|
$
|
50,874
|
|
|
Consolidated non-corporate and non-acquisition related interest expense
|
|
—
|
|
|
(2,627
|
)
|
||
|
Significant non-recurring costs
(4)
|
|
5,477
|
|
|
—
|
|
||
|
Subtotal Adjusted EBITDA for Discontinued Operations of the Company
|
|
$
|
34,793
|
|
|
$
|
48,247
|
|
|
|
|
|
|
|
||||
|
Total Adjusted EBITDA of the Company
|
|
$
|
58,952
|
|
|
$
|
68,575
|
|
|
(1)
|
The consolidated non-corporate and non-acquisition related interest expense subtracted from Adjusted EBITDA includes interest expense associated with asset-specific debt at subsidiaries in the Specialty Finance, Real Estate and Corporate and Other segments. For the year ended December 31, 2014, interest expense for the asset-specific debt was $1.5 million for Specialty Finance, $4.1 million for Real Estate, and $1.6 million for Corporate and Other, totaling $7.2 million (as adjusted above). For the year ended December 31, 2013, interest expense for the asset-specific debt was $24 thousand for Specialty Finance, $1.8 million for Real Estate, and $943 thousand for Corporate and Other segments, totaling $2.8 million (as adjusted above).
|
|
(2)
|
Significant non-recurring costs for continuing operations included $6.1 million associated with the Fortegra transaction for the year ended December 31, 2014.
|
|
(3)
|
See Note 5—Dispositions, Asset Held for Sale and Discontinued Operations, in the accompanying consolidated financial statements for further discussion of discontinued operations.
|
|
(4)
|
Significant non-recurring costs for discontinued operations included expenses incurred in connection with the move of PFAS’s physical location from New Jersey to Philadelphia for the year ended December 31, 2014.
|
Liquidity and Capital Resources
The Company’s principal sources of liquidity are its holdings of cash, cash equivalents and investments and distributions from operating subsidiaries and principal investments, including subordinated notes of CLOs. At December 31, 2014, the Company had unrestricted cash of $52.9 million. We expect to receive a total of approximately $151.5 million of cash (prior to payment of taxes and transaction expenses) upon the sale of PFG. We are required to use $25 million of the proceeds of the sale of PFG to repay borrowings from Fortress described below.
43
The Company intends to use its cash resources to continue to grow its businesses. Tiptree may seek additional sources of cash to fund acquisitions or investments. These additional sources of cash may take the form of debt or equity and may be at the parent, subsidiary or asset level.
The ability of Tiptree’s subsidiaries to generate sufficient net income and cash flows to make cash distributions will be subject to numerous business and other factors, including restrictions contained in our subsidiaries’ financing agreements, regulatory restrictions, availability of sufficient funds at such subsidiaries, general economic and business conditions, tax considerations, strategic plans, financial results and other factors such as target capital ratios and ratio levels anticipated by rating agencies to maintain or improve current ratings.
A summary of the long term debt of the Company as of December 31, 2014 is presented below:
|
Summary of the Company's Long Term Debt
|
||||||||||||||||
|
($ in thousands)
|
||||||||||||||||
|
Tiptree Entity and Facility or Debt Type
|
Facility Amount as of December 31, 2014
|
Amount outstanding as of December 31, 2014
|
Maturity of Facility or Debt
|
Interest basis
|
Interest expense in 2014
(1)
|
|||||||||||
|
Operating Company
|
||||||||||||||||
|
Fortress credit agreement
|
$
|
50,000
|
|
$ 47,500
(2)
|
|
September 2018
|
1 month LIBOR (minimum 1.25%) plus 6.50%
|
$
|
4,282
|
|
||||||
|
Fortegra
|
||||||||||||||||
|
Revolving credit facility
|
$
|
90,000
|
|
$
|
60,000
|
|
December 2019
|
1 month LIBOR plus 3.00%
|
$
|
191
|
|
|||||
|
Secured term loan
|
$
|
50,000
|
|
$
|
50,000
|
|
December 2019
(3)
|
1 month LIBOR plus 3.00%
|
$
|
138
|
|
|||||
|
Revolving line of credit
|
$
|
15,000
|
|
$
|
7,649
|
|
April 2017
|
90 day LIBOR plus 3.00%
|
$
|
25
|
|
|||||
|
Trust preferred security
|
$
|
35,000
|
|
$
|
35,000
|
|
June 2037
|
3 month LIBOR plus 4.1%
(4)
|
$
|
228
|
|
|||||
|
Siena
|
||||||||||||||||
|
Revolving line of credit
|
$
|
65,000
|
|
$
|
25,700
|
|
October 2016
|
3 month LIBOR plus 2.50%
|
$
|
497
|
|
|||||
|
Luxury
|
||||||||||||||||
|
Warehouse Facility 1
|
$
|
37,500
|
|
$
|
12,520
|
|
May 2015
|
1 month LIBOR plus 2.75%
|
$
|
360
|
|
|||||
|
Warehouse Facility 2
|
$
|
30,000
|
|
$
|
7,035
|
|
February 2016
|
1 month LIBOR plus 2.75%
|
$
|
264
|
|
|||||
|
Warehouse Facility 3
|
$
|
15,000
|
|
$
|
7,851
|
|
June 2015
|
1 month LIBOR plus 2.75%
|
$
|
185
|
|
|||||
|
Note payable
|
$
|
1,688
|
|
$
|
1,688
|
|
January 2021
|
Stated rate 12.00%
(5)
|
$
|
—
|
|
|||||
|
Mortgage borrowing
|
$
|
734
|
|
$
|
734
|
|
January 2024
|
Prime plus 1.00%
|
$
|
32
|
|
|||||
|
Care
(6)
|
||||||||||||||||
|
Greenfield mortgage loans
|
$
|
15,063
|
|
$
|
15,063
|
|
May 2022
|
4.76% fixed rate
|
$
|
728
|
|
|||||
|
|
||||||||||||||||
|
Calamar mortgage loans
|
$
|
7,457
|
|
$
|
7,457
|
|
February 2020
|
4.50% fixed rate
|
$
|
339
|
|
|||||
|
|
||||||||||||||||
|
Calamar mortgage loans
|
$
|
10,231
|
|
$
|
10,231
|
|
August 2019
|
4.00% fixed rate
|
$
|
414
|
|
|||||
44
|
Summary of the Company's Long Term Debt
|
||||||||||||||||
|
($ in thousands)
|
||||||||||||||||
|
Tiptree Entity and Facility or Debt Type
|
Facility Amount as of December 31, 2014
|
Amount outstanding as of December 31, 2014
|
Maturity of Facility or Debt
|
Interest basis
|
Interest expense in 2014
(1)
|
|||||||||||
|
|
||||||||||||||||
|
Terraces portfolio mortgage loans
|
$
|
7,343
|
|
$
|
7,343
|
|
December 2020
|
1 month LIBOR plus 2.50%
|
$
|
205
|
|
|||||
|
|
||||||||||||||||
|
Terraces portfolio mortgage loans
|
$
|
8,298
|
|
$
|
8,298
|
|
December 2020
|
1 month LIBOR plus 2.50%
|
$
|
230
|
|
|||||
|
|
||||||||||||||||
|
Heritage portfolio mortgage loans
|
$
|
25,230
|
|
$
|
25,230
|
|
November 2020
|
1 month LIBOR plus 2.75%
|
$
|
752
|
|
|||||
|
|
||||||||||||||||
|
Heritage portfolio mortgage loans
|
$
|
6,943
|
|
$
|
6,943
|
|
November 2020
|
1 month LIBOR plus 2.75%
|
$
|
207
|
|
|||||
|
|
||||||||||||||||
|
Heritage portfolio mortgage loans
|
$
|
6,069
|
|
$
|
6,069
|
|
May 2040
|
4.72% fixed rate
|
$
|
—
|
|
|||||
|
|
||||||||||||||||
|
Greenfield joint venture
|
$
|
21,595
|
|
$
|
21,595
|
|
October 2019
|
1 month LIBOR plus 3.20%
|
$
|
189
|
|
|||||
(1)
“Interest expense in 2014” refers to the periods the subsidiary entity's results have been incorporated into the consolidated financial statements. Interest expense includes the amortization of capitalized debt costs, where applicable.
(2) The debt outstanding of $47.5 million, net of $743 thousand original issue discount, is $46.8 million.
(3)
Fortegra is required to repay the $50 million term loan facility in consecutive quarterly installments of $1.25 million commencing in March 2015.
(4)
Fortegra has entered into an interest rate swap agreement that exchanges the floating rate on the trust preferred securities for a fixed rate of 3.47%. Fortegra may redeem the trust preferred securities in whole or part, at a price equal to the full outstanding principal amount plus accrued and unpaid interest.
(5) The payment of interest on Luxury's note due January 2021 is contingent upon Luxury’s performance.
(6)
The Care mortgage loans amortize over periods beyond dates due for repayment. Care has also entered into interest rate swap agreements (see Note 14—Derivative Financial Instruments and Hedging).
The Company has a senior secured credit agreement with Fortress. As of December 31, 2014, $47.5 million of the facility was outstanding. The proceeds were used to partially fund the acquisition of Fortegra. On January 27, 2015, the Company and Fortress amended the credit facility and the Company borrowed an additional $25 million under the credit agreement with Fortress, the proceeds of which will be used for general corporate purposes to grow our business. Loans under the credit agreement bear interest at a variable rate per annum equal to one-month LIBOR (with a minimum LIBOR rate of 1.25%), plus a margin of 6.0% per annum. The weighted average interest rate for 2014 for borrowings under the Fortress facility was 7.75%.
On December 4, 2014 Fortegra entered into a $140.0 million secured credit agreement with a number of bank lenders, led by Wells Fargo bank, which also acts as administrative agent. The credit agreement provides for a $50 million term loan facility and a $90 million revolving credit facility. As of December 31, 2014, there was $50 million outstanding under the secured term loan and $60 million under the revolving credit facility. The proceeds from the credit agreement were used to complete Tiptree’s acquisition of Fortegra.
Synovus Bank has provided a subsidiary of Fortegra with a $15.0 million revolving credit agreement, of which $7.6 million was outstanding as of December 31, 2014. The proceeds of this facility are used to fund Fortegra’s premium financing business.
Fortegra has issued $35 million of trust preferred securities outstanding, due June 15, 2037. The trust preferred pay interest at a floating rate of 3-month LIBOR plus 4.10%. Fortegra has entered into an interest rate swap that exchanges the floating rate for a fixed rate of 3.47%.
45
Siena has a $65.0 million senior secured revolving line of credit with Wells Fargo Bank with a maturity date of January 25, 2017. The interest rate on this line of credit is LIBOR plus 250 basis points. Drawings under this line of credit are used to finance Siena’s loans to its customers. As of December 31, 2014, there was $25.7 million outstanding under this line of credit.
Luxury has entered into three credit agreements totaling $82.5 million. Drawings under these agreements are used to finance Luxury’s portfolio of mortgage loans pending the sale to investors. As of December 31, 2014, $27.4 million was outstanding under these lines of credit.
Care has obtained secured mortgage loans provided by a number of different banks. The total outstanding on these mortgage loans was $108.2 million as of December 31, 2014. The loans were used to purchase specific properties and are secured by mortgages on those properties.
Further discussion of the Company’s debt financing arrangements is contained in Note 15—Debt, of the accompanying consolidated financial statements.
Consolidated Comparison of Cash Flows
Summary Consolidated Statements of Cash Flows
|
($ in thousands)
|
Year ended December 31,
|
||||||
|
2014
|
2013
|
||||||
|
Net cash provided by/(used in):
|
|||||||
|
Operating activities
|
$
|
91,048
|
|
$
|
(3,034
|
)
|
|
|
Investing activities
|
(494,165
|
)
|
(689,182
|
)
|
|||
|
Financing activities
|
363,908
|
|
724,210
|
|
|||
|
Net increase in cash and cash equivalents
|
$
|
(39,209
|
)
|
$
|
31,994
|
|
|
The amounts associated with operating, investing and financing activities for each of the periods ending December 31, 2014 and 2013 from discontinued operations are presented as a component of the Company’s consolidated statements of cash flows.
Operating Activities
Cash provided by operating activities was $91.0 million for the year ended December 31, 2014, compared to cash used of $3.0 million for the year ended December 31, 2013. Cash provided by operating activities from VIEs for the period ended December 31, 2014 was $105.9 million, compared to cash used of $28.6 million for the year ended December 31, 2013, a change of $134.5 million. Cash provided by discontinued operations was $16.0 million for the year ended December 31, 2014, compared to cash provided of $18.5 million for the year ended December 31, 2013. Excluding the activity attributable to the VIEs and discontinued operations, cash used by operating activities was $30.9 million for the year ended December 31, 2014, compared to cash provided of $7.1 million for the period ended December 31, 2013, a decline of $38.0 million. The change was primarily driven by increases in assets and declines in liabilities of the Company as of December 31, 2014, as compared with balances as of December 31, 2013, together with increased depreciation and amortization expenses in 2014 and increases in Fortegra’s unearned premiums of $9.8 million in the period since its acquisition. The increases in assets held by the Company at December 31, 2014, included loans originated for sale of $6.9 million held by Luxury and an increase in other assets of $27.0 million, which principally consisted of reinsurance receivables and deferred acquisition costs at Fortegra. The decline in in the liabilities included a decrease in amounts due to brokers, dealers and trustees of $7.9 million which was attributable to a reduction in loan warehouse activity at year end. Amortization and depreciation expense was $11.9 million in the year ended December 31, 2014, compared to $2.0 million in the year ended December 31, 2013, an increase of $10.9 million, which was primarily due to increased amortization of intangible assets acquired in conjunction with the expansion of Care joint ventures and amortization of intangible assets acquired with the purchase of Fortegra.
Investing Activities
Cash used in investing activities for the period ended December 31, 2014 was $494.2 million, compared to cash used of $689.2 million for the year ended December 31, 2013, an increase of $195.0 million. Cash used in VIE investing activities was $635.5 million for the period ended December 31, 2014, compared with cash used of $537.9 million for the period ended December 31, 2013. Excluding the VIE investing activity, cash provided by investing activities was $141.3 million at December 31, 2014 compared to cash used of $151.3 million for the year ended December 31, 2013, an increase of $292.6 million. Cash provided
46
by investing activities in 2014 was largely comprised of proceeds from sales of trading securities, proceeds from loans repaid, and distributions received from partially owned entities. These proceeds were partly offset by purchases of trading securities and loans carried at fair value, cash outlays related to the acquisitions of Fortegra and Luxury, purchases of derivatives and purchases of available for sale securities. Proceeds from sales of trading securities were $589.3 million in 2014, compared with $75.1 million in 2013, an increase of $514.2 million. The increase in the sales of trading securities were largely the result of increased loan warehouse activity in 2014 as compared to 2013. Proceeds from loan repayments were $38.9 million in 2014, which primarily comprised repayments of loans held by Care. Distributions received from partially owned entities were $7.2 million received from Star Asia entities in 2014, compared with $2.7 million received from Care and Star Asia entities in 2013. Purchases of trading securities and loans carried at fair value were $405.5 million in 2014, compared with purchases of $204.6 million in 2013, an increase of $200.9 million. The increase in purchases of trading securities and loans carried at fair value was attributable to increased loan warehouse activity in 2014, as compared to 2013. Cash outlays related to the acquisitions of Fortegra and Luxury totaled $70.5 million in 2014, compared to net amounts of $7.2 million related to acquisitions at Care and the acquisition of Siena in the prior year. Payments related to the purchases of derivatives were $12.5 million in 2014 compared with $2.1 million in 2013. Purchases of available for sale securities were $7.0 million in 2014 and relate to activity at Fortegra.
Financing Activities
Cash provided by financing activities for the year ended December 31, 2014 was $363.9 million, compared to $724.2 million in cash provided for the year ended December 31, 2013, a decline of $360.3 million. Cash provided by VIE financing activities was $492.7 million for the period ended December 31, 2014 and $529.6 million for the year ended December 31, 2013. Excluding the activity attributable to VIEs, cash used in financing activities in 2014 was $128.8 million compared to cash provided by financing activities of $194.6 million in 2013, a decline of $323.4 million. The cash used in financing activities in 2014 was largely due to the pay down of loans and mortgage notes payable of $150.3 million, partly offset by proceeds from new loans of $29.1 million. The Company’s warehouse paid down approximately $135.7 million with remaining amounts reflecting the pay down of loans by Tiptree subsidiaries. The $29.1 million in proceeds from loans was largely related to borrowings of $20.5 million and $6.8 million at Tiptree’s subsidiaries Siena and Luxury, respectively.
Contractual Obligations
The table below summarizes Tiptree’s consolidated contractual obligations by period for payments that are due as of December 31, 2014:
|
($ in thousands)
|
Less than 1 year
|
1-3 years
|
3-5 years
|
More than 5 years
|
Total
|
||||||||||||||
|
Mortgage notes payable and related interest (1)
|
$
|
6,567
|
|
$
|
13,528
|
|
$
|
45,753
|
|
$
|
75,554
|
|
$
|
141,402
|
|
||||
|
Trust Preferred Securities (2)
|
—
|
|
—
|
|
—
|
|
35,000
|
|
35,000
|
|
|||||||||
|
Notes payable CLOs (3)
|
—
|
|
—
|
|
—
|
|
1,992,466
|
|
1,992,466
|
|
|||||||||
|
Credit agreement/Revolving line of credit (4)
|
52,298
|
|
39,700
|
|
136,500
|
|
—
|
|
228,498
|
|
|||||||||
|
Operating lease obligations (5)
|
3,246
|
|
6,193
|
|
5,100
|
|
3,834
|
|
18,373
|
|
|||||||||
|
Total
|
$
|
62,111
|
|
$
|
59,421
|
|
$
|
187,353
|
|
$
|
2,106,854
|
|
$
|
2,415,739
|
|
||||
|
(1)
|
Mortgage notes payable include mortgage notes entered into by Care LLC in connection with its acquisition of several properties and the mortgage note entered into by Luxury Mortgage Corp with the Bank of Danbury (see Note 15
—
Debt, in the accompanying consolidated financial statements).
|
|
(2)
|
Fortegra has $35.0 million of fixed/floating rate trust preferred securities due June 15, 2037. The trust preferred securities bear interest at a floating rate of 3-month LIBOR plus the annual base rate of 4.10%. Interest is payable quarterly. In 2012, Fortegra entered into an interest rate swap that exchanges the floating rate for a fixed rate, as further described in Note 14—Derivative Financial Instruments and Hedging. The Company may redeem the trust preferred securities, in whole or in part, at a price equal to the full outstanding principal amount of such trust preferred securities outstanding plus accrued and unpaid interest.
|
|
(3)
|
Non-recourse CLO notes payable principal is payable at stated maturity, 2021 for Telos 1, 2022 for Telos 2, 2024 for Telos 3 and Telos 4, 2025 for Telos 5 and 2027 for Telos 6.
|
|
(4)
|
On September 18, 2013, Operating Company entered into a credit agreement with Fortress and borrowed $50.0 million under the credit agreement. The credit agreement also included an option for Operating Company to borrow additional amounts up to a maximum aggregate of $125.0 million, subject to satisfaction of certain customary conditions. On January 26, 2015, Tiptree entered into a First Amendment to its existing Fortress credit agreement (the “Amendment”). The Amendment provides for additional term loans in an aggregate principal amount of $25.0 million to Tiptree and will have the same maturity date, margin above LIBOR, principal repayment terms, and conditions and covenants as the existing term loans under the existing Fortress credit agreement, subject to certain exceptions in the Amendment. Tiptree is required to prepay $25.0 million of the loan upon the closing of the PFG sale (see Note 15
—
Debt, in the accompanying consolidated financial statements, and Note 25
—
Subsequent Events, in the accompanying consolidated financial statements, for further detail).
|
47
On July 25, 2013, TFI’s subsidiary Siena closed on a line of credit with Wells Fargo Bank. This revolving line is for $65.0 million with an interest rate of LIBOR plus 250 basis points and a maturity date of January 25, 2017. As of December 31, 2014, there was $25.7 million outstanding on this line (see Note 15—Debt, in the accompanying consolidated financial statements).
On December 4, 2014, Fortegra entered into an amended and restated $140.0 million secured credit agreement (the “Credit Agreement”) among: (i) Fortegra and its wholly owned subsidiary LOTS Intermediate Co. (“LOTS”), as borrowers (Fortegra and LOTS, collectively, the “Borrowers”); (ii) the initial lenders named therein; and (iii) Wells Fargo Bank, National Association, as administrative agent, swingline lender, and issuing lender. The Credit Agreement provides for a $50.0 million term loan facility and a $90.0 million revolving credit facility. Subject to earlier termination, the Credit Agreement terminates on December 4, 2019. The weighted average rate paid for 2014 was 3.69%.The Borrowers are required to repay the aggregate outstanding principal amount of the initial $50.0 million term loan facility in consecutive quarterly installments of $1.25 million commencing March 2015.
Fortegra has a $15.0 million revolving line of credit agreement (the “Line of Credit”) with Synovus Bank, entered into on October 9, 2013, with a maturity date of April 30, 2017. The Line of Credit bears interest at a rate of 300 basis points plus 90-day LIBOR, and is available specifically for the South Bay premium financing product. The weighted average rate paid for 2014 was 3.23%.
|
(5)
|
Minimum rental obligation for Tiptree, Care, MFCA, Siena, Luxury and Fortegra office lease. The total rent expense for the Company for fiscal 2014 and 2013 was $1.5 million and $1.5 million, respectively.
|
Tiptree’s subsidiary Siena, issues standby letters of credit for credit enhancements that are required by their borrower’s respective businesses. As of December 31, 2014 there was $5.5 million outstanding relating to these letters of credit.
Critical Accounting Policies and Estimates
The Company’s significant accounting policies are described in Note 2—Summary of Significant Accounting Policies. Further information can be found in the notes to the consolidated financial statements related to the following: variable interest entities can be found in Note 3—Out of Period Adjustments, Changes in Accounting Principles and Reclassifications; valuation of assets where quoted market prices are not available can be found under “Fair Value Measurement” in Note 2—Summary of Significant Accounting Policies; policies related to goodwill and intangible assets can be found in Note 2—Summary of Significant Accounting Policies—Goodwill and Identifiable Intangible Assets; and additional information on income taxes can be found under Note 23—Income Taxes. The consolidated financial statements prepared under GAAP for all periods presented include retroactive adjustments to comparative periods to reflect the combinations under common control described in Note 1—Organization, related to TAMCO and the Contribution Transactions. All intercompany items have been eliminated for these periods.
Principles of Consolidation
The consolidated financial statements reflect the consolidated accounts of the Company and (i) its wholly-owned subsidiaries, (ii) subsidiaries in which it has a controlling interest, and (iii) certain VIEs in which Tiptree, through its subsidiaries, is deemed to be the primary beneficiary. All significant intercompany accounts and transactions have been eliminated in the consolidated financial statements. This consolidation, particularly with respect to the VIEs, significantly impacts these subsidiaries’ financial statements.
Fair Value of Financial Instruments
ASC Topic 820, Fair Value Measurements and Disclosures, defines fair value, describes the framework for measuring fair value, and addresses fair value measurement disclosures. Fair value is defined as the price that would be received to sell an asset or paid to transfer a liability in an orderly transaction between market participants at the measurement date.
ASC Topic 820 establishes a three level valuation hierarchy for disclosure of fair value measurements. The valuation hierarchy is based upon the transparency of inputs to the valuation of an asset or liability as of the measurement date. The three levels, from highest to lowest, are defined as follows:
Level 1 - Unadjusted, quoted prices in active markets for identical assets or liabilities that Tiptree has the ability to access at the measurement date.
Level 2 - Significant inputs other than quoted prices that are observable for the asset or liability, either directly or indirectly through corroboration with observable market data. Level 2 inputs include quoted prices for similar instruments in active markets, and inputs other than quoted prices that are observable for the asset or liability.
The types of financial assets and liabilities carried at Level 2 are valued based on one or more of the following:
a) Quoted prices for similar assets or liabilities in active markets;
b) Quoted prices for identical or similar assets or liabilities in nonactive markets;
c) Pricing models whose inputs are observable for substantially the full term of the asset or liability; and
48
d) Pricing models whose inputs are derived principally from or corroborated by observable market data through correlation or other means for substantially the full term of the asset or liability.
Level 3 - Significant inputs that are unobservable inputs for the asset or liability, including Tiptree’s own data and assumptions that are used in pricing the asset or liability.
The availability of observable inputs can vary depending on the financial asset or liability and is affected by a wide variety of factors, including, for example, the type of product, whether the product is new, whether the product is traded on an active exchange or in the secondary market, and the current market conditions. To the extent that valuation is based on models or inputs that are less observable or unobservable in the market, the determination of fair value requires more judgment. Accordingly, the degree of judgment exercised by the Company in determining fair value is greatest for instruments categorized within Level 3 of the fair value hierarchy. In certain cases, the inputs used to measure fair value may fall into different levels of the fair value hierarchy. In such cases, for disclosure purposes, the level in the fair value hierarchy within which the fair value measurement in its entirety is determined based on the lowest level input that is significant to the fair value measurement in its entirety. Tiptree’s assessment of the significance of a particular input to the fair value measurement in its entirety requires judgment and the consideration of factors specific to the asset. From time to time, Tiptree’s assets and liabilities will transfer between one level to another level. It is Tiptree’s policy to recognize transfers between different levels at the end of each reporting period.
Tiptree utilizes both observable and unobservable inputs into its valuation methodologies. Observable inputs include benchmark yields, reported trades, broker-dealer quotes, issuer spreads, benchmark securities, bids, offers and reference data. In addition, specific issuer information and other market data is used. For broker quotes, quotes are obtained from sources recognized to be market participants. Unobservable inputs may include expected cash flow streams, default rates, supply and demand considerations and market volatility.
Reinsurance
Reinsurance receivables include amounts related to paid benefits and estimated amounts related to unpaid policy and contract claims, future policyholder benefits and policyholder contract deposits. The cost of reinsurance is accounted for over the terms of the underlying reinsured policies using assumptions consistent with those used to account for the underlying policies. Amounts recoverable from reinsurers are estimated in a manner consistent with claim and claim adjustment expense reserves or future policy benefits reserves and are reported in our consolidated balance sheets. In the ordinary course of business, we are involved in both the assumption and cession of reinsurance with non-affiliated companies, including reinsurance companies owned by our clients.
We
utilize reinsurance for loss protection and capital management.
Deferred Acquisition Costs - Insurance Related
We defer certain costs of acquiring new and renewal business. These costs are limited to direct costs that resulted from successful contract transactions and would not have been incurred by our insurance entities had the transactions not occurred. These capitalized costs are amortized as the related premium is earned.
We evaluate whether deferred acquisition costs-insurance related are recoverable at year-end, and periodically if deemed necessary, and consider investment income in the recoverability analysis. As a result of our evaluations, no write-offs for unrecoverable deferred acquisition costs were recognized during the year ended December 31, 2014.
Deferred Acquisition Costs - Non-insurance Related
We defer certain costs of acquiring new and renewal business related to non-insurance subsidiary transactions. These costs are limited to prepaid direct costs, typically commissions and contract transaction fees, that resulted from successful contract transactions and would not have been incurred by us had the transactions not occurred. These capitalized costs are amortized as the related service and administrative fees are earned.
We evaluate whether deferred acquisition costs - non-insurance related are recoverable at year-end, and periodically if deemed necessary. As a result of our evaluations, no write-offs for unrecoverable deferred acquisition costs were recognized during the year ended December 31, 2014.
Unpaid Claims
Unpaid claims are reserve estimates that are established in accordance with U.S. GAAP using generally accepted actuarial methods. Credit life and AD&D unpaid claims reserves include claims in the course of settlement and incurred but not reported ("IBNR"). Credit disability unpaid claims reserves also include continuing claim reserves for open disability claims. For all other product lines, unpaid claims reserves are bulk reserves and are entirely IBNR. The Company uses a number of algorithms
49
in establishing its unpaid claims reserves. These algorithms are used to calculate unpaid claims as a function of paid losses, earned premium, target loss ratios, in-force amounts, unearned premium reserves, industry recognized morbidity tables or a combination of these factors.
In arriving at the unpaid claims reserves, the Company conducts an actuarial analysis on a basis gross of reinsurance. The same estimates used as a basis in calculating the gross unpaid claims reserves are then used as the basis for calculating the net unpaid claims reserves, which take into account the impact of reinsurance. Anticipated future loss development patterns form a key assumption underlying these analyses. Our claims are generally reported and settled quickly, resulting in consistent historical loss development patterns. From the anticipated loss development patterns, a variety of actuarial loss projection techniques are employed, such as the chain ladder method, the Bornhuetter-Ferguson method and expected loss ratio method.
The unpaid claims reserves represent the Company's best estimates, generally involving actuarial projections at a given time. Actual claim costs are dependent upon a number of complex factors such as changes in doctrines of legal liabilities and damage awards. These factors are not directly quantifiable, particularly on a prospective basis. The Company periodically reviews and updates its methods of making such unpaid claims reserve estimates and establishing the related liabilities based on our actual experience. The Company has not made any changes to its methodologies for determining unpaid claims reserves in the periods presented.
Unearned Premiums
Premiums written are earned over the life of the respective policy using the Rule of 78's, pro rata, or other actuarial methods as appropriate for the type of business. Unearned premiums represent the portion of premiums that will be earned in the future. A premium deficiency reserve is recorded if anticipated losses, loss adjustment expenses, deferred acquisition costs - insurance related and policy maintenance costs exceed the recorded unearned premium reserve and anticipated investment income. As of December 31, 2014, no such reserve was recorded.
Deferred Revenues
Deferred revenues represent the portion of income that will be earned in the future attributable to motor club memberships, mobile device protection plans, and other non-insurance service contracts that are earned over the respective contract periods using Rule of 78's, modified Rule of 78's, pro rata, or other methods as appropriate for the contract. A deficiency reserve would be recorded if anticipated contract benefits, deferred acquisition costs and contract service costs exceed the recorded deferred revenues and anticipated investment income. As of December 31, 2014, no deficiency reserve was recorded.
Service and Administrative Fees
We earn service and administrative fees from a variety of activities. Such fees are typically positively correlated with transaction volume and are recognized as revenue as they become both realized and earned.
Service Fees.
Service fee revenue is recognized as the services are performed. These services include fulfillment, software development, and claims handling for our customers. Collateral tracking fee income is recognized when the service is performed and billed. Management reviews the financial results under each significant contract on a monthly basis. Any losses that may occur due to a specific contract would be recognized in the period in which the loss occurs. During the year ended December 31, 2014, we have not incurred a loss with respect to a specific significant service fee contract.
Administrative Fees.
Administrative service revenue includes the administration of credit insurance, debt cancellation programs, motor club programs, and warranty programs. Related administrative fee revenue is recognized consistent with the earnings recognition pattern of the underlying insurance policies, debt cancellation contracts and motor club memberships being administered, using Rule of 78's, modified Rule of 78's, pro rata, or other methods as appropriate for the contract. Management selects the appropriate method based on available information, and periodically reviews the selections as additional information becomes available.
Our payment protection products are sold as complementary products to consumer retail and credit transactions and are thus subject to the volatility of volume of consumer purchase and credit activities. We receive service and administrative fees for administering payment protection products that are sold by our clients, such as credit insurance, debt protection, motor club and warranty solutions. We earn administrative fees for administering debt cancellation plans, facilitating the distribution and administration of warranty or extended service contracts, providing motor club membership benefits and providing related services for our clients. For credit insurance products, our clients typically retain the risk associated with credit insurance products that they sell to their customers through economic arrangements with us. Our payment protection revenue includes revenue earned from reinsurance arrangements with producer owned reinsurance companies ("PORCs") owned by our clients. Our clients
50
own PORCs that assume the credit insurance premiums and associated risk that they originate in exchange for fees paid to us for ceding the premiums.
In addition, our revenue includes administrative fees charged by us under retrospective commission arrangements with producers, where the commissions paid are adjusted based on actual losses incurred compared to premium earned after a specified net allowance retained by us. Under these arrangements, our insurance companies receive the insurance premiums and administer the policies that are distributed by our clients. The producer of the credit insurance policies receives a retrospective commission if the premium generated by that producer in the accounting period exceeds the costs associated with those polices, which includes our administrative fees, incurred claims, reserves and premium taxes. If the net result is negative, we either offset that negative amount against future retrospective commission payments, reduce the producer's up-front commission on a prospective basis to increase the likelihood that it will return to a positive position or request payment of the negative amount from the producer. Revenues in our business may fluctuate seasonally based on consumer spending trends, where consumer spending has historically been higher in September and December, corresponding to back-to-school and the holiday season. Accordingly, our payment protection revenues may reflect higher third and fourth quarters than in the first half of the year.
Ceding Commissions
We earn ceding commissions on our credit insurance products. Ceding commissions earned under coinsurance agreements are based on contractual formulas that take into account, in part, underwriting performance and investment returns experienced by the assuming companies. As experience changes, adjustments to the ceding commissions are reflected in the period incurred. Experience adjustments are based on the claim experience of the related policy. The adjustment is calculated by adding the earned premium and investment income from the assets held in trust for our benefit less earned commissions, incurred claims and the reinsurer's fee for the coverage.
We elect to cede to reinsurers under coinsurance arrangements a significant portion of the credit insurance that we distribute on behalf of our clients. We continue to provide all policy administration for credit insurance that we cede to reinsurers. Ceding commissions primarily represent the fees we charge the reinsurers for that administration service. In addition, a portion of the ceding commissions is determined based on the underwriting profits of the ceded credit insurance. The credit insurance that we distribute has historically generated attractive underwriting profits. Ceding commissions also include investment income earned on reserves maintained in trust accounts on the balance sheets of the reinsurers.
Ceding commissions are generally positively correlated with our credit insurance transaction and premium volumes. The portion of our ceding commissions that is related to the underwriting profits of the ceded credit insurance also fluctuates based on the claims made on such policies. The portion of our ceding commissions that is related to investment income can be impacted by the amount of reserves that are maintained in trust accounts and changes in interest rates. Ceding commissions are earned over the life of the policy.
Earned Premiums, net
Earned premiums, net is from direct and assumed earned premium consisting of revenue generated from the direct sale of payment protection insurance policies by our distributors and premiums written for payment protection insurance policies by another carrier and assumed by us. Whether direct or assumed, the premium is earned over the life of the respective policy using methods appropriate to the pattern of losses for the type of business. Methods used include the Rule of 78's, pro rata, and other actuarial methods. Management selects the appropriate method based on available information, and periodically reviews the selections as additional information becomes available. Direct and assumed premiums are offset by premiums ceded to our reinsurers, including PORCs, which are earned in the same manner. The amount ceded is proportional to the amount of risk assumed by the reinsurer.
The principal factors affecting earned premiums, net are: (i) the proportion of the risk assumed by our reinsurers as defined in the applicable reinsurance treaty; (ii) increases and decreases in written premium; (iii) the pattern of losses by type of business, (iv) increases and decreases in policy cancellation rates; (v) the average duration of the policies written; and (vi) changes in regulation that would modify the earning patterns for the policies underwritten and administered.
We limit the underwriting risk we take in our payment protection insurance policies. When we do assume risk in our payment protection insurance policies, we utilize both reinsurance (e.g., quota share and excess of loss) and retrospective commission agreements to manage and mitigate our risk.
Commissions
51
Commissions are paid to distributors selling credit insurance policies, motor club memberships, and warranty service contracts, and are generally deferred and expensed in proportion to the earning of related revenue. Credit insurance commission rates, in many instances, are set by state regulators and are also impacted by market conditions. In certain instances, our commissions are subject to retrospective adjustment based on the profitability of the related policies. These retrospective commission adjustments are payments made or adjustments to future commission expense based on prior claims experience. Under these retrospective commission arrangements, the producer of the credit insurance policies, which is typically our client, receives a retrospective commission if the premium generated by that producer in the accounting period exceeds the costs associated with those policies, which includes our administrative fees, claims, reserves and premium taxes. If the net result is negative, we either offset that negative amount against future retrospective commission payments, reduce the producer's up-front commission on a prospective basis to increase the likelihood that it will return to a positive position or request payment of the negative amount from the producer.
Income Taxes
The Company accounts for income taxes under the asset and liability method. Deferred tax assets and liabilities are recognized for the future tax consequences attributable to the differences between the financial statement carrying amounts of existing assets and liabilities and their respective tax bases. Deferred tax assets and liabilities are measured using enacted tax rates expected to apply to taxable income in the years in which the temporary differences are expected to be recovered or settled.
The effect on deferred tax assets and liabilities of a change in the tax rates is recognized in earnings in the period that includes the enactment date. Additionally, taxing jurisdictions could retroactively disagree with our tax treatment of certain items, and some historical transactions have income tax effects going forward. Accounting guidance requires these future effects to be evaluated using current laws, rules and regulations, each of which can change at any time and in an unpredictable manner.
In accordance with ASC 740, the Company establishes valuation allowances for deferred tax assets when, in its judgment, it concludes that it is more likely than not that the deferred tax assets will not be realized. These judgments are based on projections of future income, including tax-planning strategies, by individual tax jurisdiction. Changes in economic conditions and the competitive environment may impact the accuracy of the Company’s projections. In accordance with ASC 740, on a quarterly basis, the Company assesses the likelihood that its deferred tax assets will be realized and determines if adjustments to the Company’s valuation allowance is appropriate. As a result of this assessment, as of December 31, 2014, the consolidated valuation allowance for Tiptree was $2.7 million. The increase and/or decrease in valuation allowance could have a significant negative or positive impact on our current and future earnings. In 2014, the Company recorded a net increase of valuation allowances of $1.5 million as compared to a decrease of $6.8 million in 2013.
The total income tax expense of $4.1 million for the period ended December 31, 2014 is reflected as a component of net income (loss) from continuing operations. This tax expense represents a consolidated total of all of Tiptree’s subsidiaries and excludes $5.5 million related to PFG, which is included in discontinued operations.
As a result of the Contribution Transaction on July 1, 2013, Tiptree no longer qualifies as a REIT, therefore Tiptree is no longer eligible to deduct the amount of distributions paid to shareholders and became a fully taxable corporation. Pursuant to the Internal Revenue Code, when a corporation loses REIT status within a tax year it becomes taxable retroactively to the first day of the tax year. As of July 1, 2013, an adjustment of $2.6 million was made to the Company’s deferred tax assets as a result of the Company no longer qualifying as a REIT.
For the year ended December 31, 2014, the Company’s effective tax rate on income from continuing operations is equal to 525.5%, which does not bear a customary relationship to statutory income tax rates. Differences from the statutory income tax rates are primarily the result of: (i) non-deductible transaction costs incurred in the Fortegra transactions (ii) the effect of changes in valuation allowance on net operating losses reported by Tiptree Financial, Siena, Luxury, and MFCA, and (iii) the effect of state income taxes required to be reported on a separate legal entity basis resulting in higher aggregate state taxable income than the consolidated pre-tax income from continuing operations.
The Company’s primary tax jurisdiction is the U.S., which currently has a statutory income tax rate of 35%. The Company also operates in several state jurisdictions that have an average combined statutory rate of approximately 5%. The Company is a holding company and several of the subsidiaries file separate federal and state income tax returns, rather than filing tax returns as a single consolidated group with the Company. The U.S. federal and state income tax returns are subject to examination by the Internal Revenue Service and the various state departments of revenue where filings are required.
Goodwill and Intangible Assets
The Company initially records all assets and liabilities acquired in purchase acquisitions, including goodwill, indefinite lived intangibles and other intangibles, in accordance with ASC 805
Business Combinations.
Goodwill, indefinite-lived intangibles
52
and other intangibles are subsequently accounted for in accordance with ASC 350
Intangibles-Goodwill and Other
and ASC 360
Impairment or Disposal of Long-Lived Assets.
The initial measurement of goodwill and intangibles requires judgment concerning estimates of the fair value of the acquired assets and liabilities. Goodwill ($95.3 million at December 31, 2014) and indefinite-lived intangible assets ($13.0 million at December 31, 2014) are not amortized but subject to tests for impairment annually or if events or circumstances indicate it is more likely than not they may be impaired. Other intangible assets are amortized over their estimated useful lives and are subject to impairment if events or circumstances indicate a possible inability to realize the carrying amount.
GAAP also requires that an interim test be done whenever events or circumstances occur that may indicate that it is more likely than not that the fair value of any reporting unit might be less than its carrying value. No such events or circumstances have occurred during 2014.
Key judgments in accounting for intangibles include useful life and classification between goodwill and indefinite-lived intangibles or other intangibles requiring amortization. Indefinite-lived intangible assets are evaluated for impairment at least annually by comparing their fair values, estimated using discounted cash flow analyses, to their carrying values. Other amortizing intangible assets ($106.9 million at December 31, 2014) are evaluated for impairment if events and circumstances indicate a possible impairment. Such evaluation of other intangible assets is initially based on undiscounted cash flow projections. See Note 2—Summary of Significant Accounting Policies, in the accompanying consolidated financial statements for further detail.
Recently Issued Accounting Standards
For a discussion of recently issued accounting standards see Note 2—Summary of Significant Accounting Policies, in the accompanying consolidated financial statements.
Off-Balance Sheet Arrangements
Luxury enters into contractual commitments to extend credit, normally with fixed expiration dates or termination clauses, at specified rates and for specific purposes, as well as commitments to sell real estate loans to various investors. Substantially all of Luxury’s commitments to extend credit are contingent upon customers maintaining specific credit standards at the time of loan funding. In addition, Siena issues standby letters of credit to customers which generally guarantee the borrower’s performance. Other than these commitments to originate and sell loans and letters of credit, the Company did not guarantee any obligations of unconsolidated entities, or express intent to provide additional funding to any such entities. Other than the consolidation of Telos 1, Telos 2, Telos 3, Telos 4, Telos 5 and Telos 6, Tiptree does not maintain any other relationships with unconsolidated entities or financial partnerships, special purpose or VIEs, established for the purpose of facilitating off-balance sheet arrangements or other contractually narrow or limited purposes. As of December 31, 2014, Tiptree did not guarantee any obligations of unconsolidated entities, enter into any commitments or express intent to provide additional funding to any such entities.
As a smaller reporting company, we are not required to provide the information contained in this Item.
Financial Statements Introductory Note
Tiptree Financial is a holding company that is the sole managing member, and owns approximately 25%, of Operating Company. As the sole managing member of Operating Company, Tiptree Financial operates and controls all of the business and affairs of Operating Company and its subsidiaries and consolidates the financial results of Operating Company and its subsidiaries. TFP owns approximately 75% of Operating Company. As of December 31, 2014, Tiptree Financial owned approximately 68% of TFP. As a result, Tiptree Financial’s combined direct and indirect ownership of Operating Company is approximately 77% as of December 31, 2014. The remainder is reflected as a non-controlling interest in Tiptree Financial’s consolidated financial statements. See “Item 1. Business — Overview” and Notes 1—Organization and Note 18—Stockholders’ Equity, within the accompanying consolidated financial statements for further discussion of the Company’s capital and ownership structure.
53
Index to Consolidated Financial Statements
|
Page
|
|
54
Report of Independent Registered Public Accounting Firm
The Board of Directors and Stockholders
Tiptree Financial Inc.:
We have audited the accompanying consolidated balance sheets of Tiptree Financial Inc. and subsidiaries as of December 31, 2014 and 2013, and the related consolidated statements of operations, comprehensive income, stockholders’ equity, and cash flows for years then ended. These consolidated financial statements are the responsibility of the Company’s management. Our responsibility is to express an opinion on these consolidated financial statements based on our audits.
We conducted our audits in accordance with the standards of the Public Company Accounting Oversight Board (United States). Those standards require that we plan and perform the audit to obtain reasonable assurance about whether the financial statements are free of material misstatement. An audit includes examining, on a test basis, evidence supporting the amounts and disclosures in the financial statements. An audit also includes assessing the accounting principles used and significant estimates made by management, as well as evaluating the overall financial statement presentation. We believe that our audits provide a reasonable basis for our opinion.
In our opinion, the consolidated financial statements referred to above present fairly, in all material respects, the financial position of Tiptree Financial Inc. and subsidiaries as of December 31, 2014 and 2013, and the results of their operations and their cash flows for the years then ended in conformity with U.S. generally accepted accounting principles.
As discussed in Note 3 to the consolidated financial statements, the Company has changed its method of accounting for measuring financial liabilities of its Collateralized Loan Obligations in December 31, 2014 and 2013 due to early adopting ASU 2014-13,
Consolidation (Topic 810): Measuring the Financial Assets and the Financial Liabilities of a Consolidated Collateralized Financing Entity
.
/s/ KPMG LLP
New York, New York
March 31, 2015
F-1
TIPTREE FINANCIAL INC. AND SUBSIDIARIES
Consolidated Balance Sheets
(in thousands, except share and per share data)
|
As of December 31,
|
|||||||
|
|
2014
|
|
2013
|
||||
|
As adjusted
|
|||||||
|
Assets
|
|
|
|
||||
|
Cash and cash equivalents – unrestricted
|
$
|
52,987
|
|
|
$
|
97,645
|
|
|
Cash and cash equivalents – restricted
|
28,045
|
|
|
26,395
|
|
||
|
Trading assets, at fair value
|
30,163
|
|
|
35,991
|
|
||
|
Investments in available for sale securities, at fair value (amortized cost: $171,679 at December 31, 2014)
|
171,128
|
|
—
|
|
|||
|
Mortgage loans held for sale, at fair value ($28,049 pledged as collateral at December 31, 2014)
|
28,661
|
|
—
|
|
|||
|
Investments in loans, at fair value
|
2,601
|
|
171,087
|
|
|||
|
Loans owned, at amortized cost – net of allowance
|
36,095
|
|
|
40,260
|
|
||
|
Notes receivable, net
|
21,916
|
|
8,561
|
|
|||
|
Accounts and premiums receivable, net
|
39,666
|
|
—
|
|
|||
|
Reinsurance receivables
|
255,556
|
|
—
|
|
|||
|
Investments in partially-owned entities
|
2,451
|
|
|
9,972
|
|
||
|
Real estate
|
131,308
|
|
|
97,395
|
|
||
|
Deferred tax assets
|
—
|
|
|
2,973
|
|
||
|
Intangible assets
|
119,894
|
|
|
8,299
|
|
||
|
Other receivables
|
34,755
|
|
—
|
|
|||
|
Goodwill
|
95,347
|
|
|
1,206
|
|
||
|
Other assets
|
36,914
|
|
|
16,405
|
|
||
|
Assets of consolidated CLOs
|
1,978,094
|
|
|
1,405,355
|
|
||
|
Assets held for sale
|
5,129,745
|
|
4,950,727
|
|
|||
|
Total assets
|
$
|
8,195,326
|
|
|
$
|
6,872,271
|
|
|
Liabilities and Stockholders’ Equity
|
|
|
|
||||
|
Liabilities:
|
|
|
|
||||
|
Trading liabilities, at fair value
|
$
|
22,573
|
|
|
$
|
19,091
|
|
|
Debt
|
363,199
|
|
|
269,594
|
|
||
|
Unearned premiums
|
299,826
|
|
—
|
|
|||
|
Policy liabilities
|
63,365
|
|
—
|
|
|||
|
Deferred revenue
|
45,393
|
|
—
|
|
|||
|
Deferred tax liabilities
|
45,638
|
|
—
|
|
|||
|
Commissions payable
|
11,670
|
|
—
|
|
|||
|
Other liabilities and accrued expenses
|
57,658
|
|
13,899
|
|
|||
|
Liabilities of consolidated CLOs
|
1,877,377
|
|
1,336,380
|
|
|||
|
Liabilities held for sale and discontinued operations
|
5,006,901
|
|
4,836,411
|
|
|||
|
Total liabilities
|
$
|
7,793,600
|
|
|
$
|
6,475,375
|
|
|
Commitments and contingencies (Note 16)
|
|
|
|
||||
|
|
|
|
|
||||
|
Stockholders’ Equity:
|
|
|
|
||||
|
Preferred stock: $0.001 par value, 100,000,000 shares authorized, none issued or outstanding
|
$
|
—
|
|
|
$
|
—
|
|
|
Common stock - Class A: $0.001 par value, 200,000,000 shares authorized, 31,830,174 and 10,556,390 shares issued and outstanding respectively
|
32
|
|
|
11
|
|
||
|
Common stock - Class B: $0.001 par value, 50,000,000 shares authorized, 9,770,367 and 30,968,877 shares issued and outstanding respectively
|
10
|
|
|
31
|
|
||
|
Additional paid-in capital
|
271,090
|
|
|
83,815
|
|
||
|
Accumulated other comprehensive income
|
(49
|
)
|
|
33
|
|
||
|
Retained earnings
|
13,379
|
|
|
15,089
|
|
||
|
Total stockholders’ equity of Tiptree Financial Inc.
|
284,462
|
|
|
98,979
|
|
||
|
Non-controlling interest
|
117,264
|
|
|
297,917
|
|
||
|
Total stockholders’ equity
|
401,726
|
|
|
396,896
|
|
||
|
Total liabilities and stockholders’ equity
|
$
|
8,195,326
|
|
|
$
|
6,872,271
|
|
See accompanying notes to consolidated financial statements.
F-2
TIPTREE FINANCIAL INC. AND SUBSIDIARIES
Consolidated Statements of Operations
(in thousands, except share and per share data)
|
|
Year ended December 31,
|
|||||||
|
|
|
2014
|
|
2013
|
||||
|
As adjusted
|
||||||||
|
Revenues:
|
||||||||
|
Net realized and unrealized gains on investments
|
|
$
|
8,961
|
|
|
$
|
6,887
|
|
|
Interest income
|
14,845
|
|
11,650
|
|
||||
|
Net credit derivative loss
|
(1,606
|
)
|
(1,828
|
)
|
||||
|
Service and administrative fees
|
8,657
|
|
—
|
|
||||
|
Ceding commissions
|
3,737
|
|
—
|
|
||||
|
Earned premiums, net
|
12,827
|
|
—
|
|
||||
|
Gain on sale of loans held for sale, net
|
7,154
|
|
—
|
|
||||
|
Loan fee income
|
3,736
|
|
459
|
|
||||
|
Rental revenue
|
19,747
|
|
5,760
|
|
||||
|
Other income
|
2,255
|
|
815
|
|
||||
|
Total revenue
|
80,313
|
|
23,743
|
|
||||
|
|
|
|
||||||
|
Expenses:
|
|
|
|
|
||||
|
Interest expense
|
|
12,541
|
|
4,865
|
|
|||
|
Payroll and employee commissions
|
|
33,788
|
|
16,741
|
|
|||
|
Commission expense
|
4,287
|
|
—
|
|
||||
|
Member benefit claims
|
2,676
|
|
—
|
|
||||
|
Net losses and loss adjustment expenses
|
|
3,153
|
|
—
|
|
|||
|
Professional fees
|
|
9,254
|
|
7,137
|
|
|||
|
Depreciation and amortization expenses
|
|
11,945
|
|
1,988
|
|
|||
|
Acquisition costs
|
6,121
|
|
—
|
|
||||
|
Other expenses
|
|
15,285
|
|
5,610
|
|
|||
|
Total expense
|
|
99,050
|
|
|
36,341
|
|
||
|
Results of consolidated CLOs:
|
||||||||
|
Income attributable to consolidated CLOs
|
64,681
|
|
61,179
|
|
||||
|
Expenses attributable to consolidated CLOs
|
45,156
|
|
32,314
|
|
||||
|
Net Income attributable to consolidated CLOs
|
19,525
|
|
28,865
|
|
||||
|
Income before taxes from continuing operations
|
788
|
|
16,267
|
|
||||
|
Provision for income taxes
|
|
4,141
|
|
560
|
|
|||
|
(Loss) income from continuing operations
|
|
(3,353
|
)
|
|
15,707
|
|
||
|
Discontinued operations:
|
|
|
|
|
||||
|
Income from discontinued operations, net
|
|
7,937
|
|
9,559
|
|
|||
|
Gain on sale of discontinued operations, net
|
|
—
|
|
15,463
|
|
|||
|
Discontinued operations, net
|
|
7,937
|
|
|
25,022
|
|
||
|
Net income before non-controlling interests
|
|
4,584
|
|
40,729
|
|
|||
|
Less net income attributable to noncontrolling interest
|
|
6,294
|
|
|
30,336
|
|
||
|
Net (loss) income available to common stockholders
|
|
$
|
(1,710
|
)
|
|
$
|
10,393
|
|
|
Net income (loss) per Class A common share:
|
|
|
|
|
||||
|
Basic, continuing operations, net
|
$
|
(0.31
|
)
|
$
|
0.41
|
|
||
|
Basic, discontinued operations, net
|
|
0.21
|
|
0.60
|
|
|||
|
Net income basic
|
|
(0.10
|
)
|
1.01
|
|
|||
|
Diluted, continuing operations, net
|
|
(0.31
|
)
|
0.41
|
|
|||
|
Diluted, discontinued operations, net
|
|
0.21
|
|
0.60
|
|
|||
|
Net income dilutive
|
|
$
|
(0.10
|
)
|
$
|
1.01
|
|
|
|
Weighted average number of Class A common shares:
|
|
|
|
|||||
|
Basic
|
|
16,771,980
|
|
10,250,438
|
|
|||
|
Diluted
|
|
16,771,980
|
|
10,250,438
|
|
|||
See accompanying notes to consolidated financial statements.
F-3
TIPTREE FINANCIAL INC. AND SUBSIDIARIES
Consolidated Statements of Comprehensive Income
(in thousands, except share and per share data)
|
Year ended December 31,
|
||||||||
|
2014
|
2013
|
|||||||
|
As adjusted
|
||||||||
|
Net income before non-controlling interests
|
$
|
4,584
|
|
$
|
40,729
|
|
||
|
Other comprehensive income (loss), net of tax:
|
||||||||
|
Unrealized gains (losses) on available-for-sale securities:
|
||||||||
|
Unrealized holding (losses) arising during the period
|
(313
|
)
|
(345
|
)
|
||||
|
Related tax benefit
|
116
|
|
121
|
|
||||
|
Reclassification of (gains) included in net income
|
(50
|
)
|
(83
|
)
|
||||
|
Related tax expense
|
19
|
|
29
|
|
||||
|
Unrealized (losses) on available-for-sale securities, net of tax
|
(228
|
)
|
(278
|
)
|
||||
|
Interest rate swap:
|
||||||||
|
Unrealized gain on interest rate swap
|
128
|
|
—
|
|
||||
|
Related tax (expense)
|
(45
|
)
|
—
|
|
||||
|
Reclassification of losses included in net income
|
97
|
|
—
|
|
||||
|
Related tax (benefit)
|
(34
|
)
|
—
|
|
||||
|
Unrealized gain on interest rate swap, net of tax
|
146
|
|
—
|
|
||||
|
Other comprehensive (loss), net of tax
|
(82
|
)
|
(278
|
)
|
||||
|
Comprehensive income
|
4,502
|
|
40,451
|
|
||||
|
Less: comprehensive income attributable to non-controlling interests
|
6,294
|
|
30,336
|
|
||||
|
Total comprehensive (loss) income available to common stockholders
|
$
|
(1,792
|
)
|
$
|
10,115
|
|
||
See accompanying notes to consolidated financial statements
F-4
TIPTREE FINANCIAL INC. AND SUBSIDIARIES
Consolidated Statements of Changes in Stockholders’ Equity
(in thousands, except share and per share data)
|
Number of Shares
|
Par Value
|
|||||||||||||||||||||||||||||||||||||
|
Class A
|
Class B
|
Class A
|
Class B
|
Additional paid in capital
|
Accumulated
other comprehensive income |
Appropriated retained earnings of consolidated TAMCO
|
Retained
earnings (deficit) |
Non-controlling
interests |
Total
|
|||||||||||||||||||||||||||||
|
As adjusted
|
As adjusted
|
As adjusted
|
As adjusted
|
As adjusted
|
||||||||||||||||||||||||||||||||||
|
Balance at December 31, 2012, as previously reported
|
10,226,250
|
|
—
|
|
$
|
11
|
|
$
|
—
|
|
$
|
96,144
|
|
$
|
311
|
|
$
|
102,635
|
|
$
|
11,892
|
|
$
|
324,595
|
|
$
|
535,588
|
|
||||||||||
|
Cumulative effect of adjustment from adoption of new accounting guidance
|
—
|
|
—
|
|
—
|
|
—
|
|
(16,591
|
)
|
(1
|
)
|
—
|
|
(102,635
|
)
|
(5,677
|
)
|
(69,586
|
)
|
(194,489
|
)
|
||||||||||||||||
|
Cumulative effect of out of period adjustments
|
—
|
|
—
|
|
—
|
|
—
|
|
—
|
|
—
|
|
—
|
|
284
|
|
935
|
|
1,219
|
|
||||||||||||||||||
|
Balance at December 31, 2012, as adjusted
|
10,226,250
|
|
—
|
|
11
|
|
—
|
|
79,553
|
|
311
|
|
—
|
|
6,499
|
|
255,944
|
|
342,318
|
|
||||||||||||||||||
|
Stock-based compensation to directors, employees and other persons for services rendered
|
330,442
|
|
—
|
|
—
|
|
—
|
|
2,482
|
|
—
|
|
—
|
|
—
|
|
—
|
|
2,482
|
|
||||||||||||||||||
|
Issuance of shares
|
—
|
|
30,968,877
|
|
—
|
|
31
|
|
—
|
|
—
|
|
—
|
|
—
|
|
—
|
|
31
|
|
||||||||||||||||||
|
Other comprehensive loss, net of tax
|
—
|
|
—
|
|
—
|
|
—
|
|
—
|
|
(278
|
)
|
—
|
|
—
|
|
(83
|
)
|
(361
|
)
|
||||||||||||||||||
|
Dividends paid
|
—
|
|
—
|
|
—
|
|
—
|
|
—
|
|
—
|
|
—
|
|
(1,803
|
)
|
—
|
|
(1,803
|
)
|
||||||||||||||||||
|
Repurchased shares
|
(302
|
)
|
—
|
|
—
|
|
—
|
|
(2
|
)
|
—
|
|
—
|
|
—
|
|
—
|
|
(2
|
)
|
||||||||||||||||||
|
Net changes in non-controlling interest
|
—
|
|
—
|
|
—
|
|
—
|
|
1,782
|
|
—
|
|
—
|
|
—
|
|
11,720
|
|
13,502
|
|
||||||||||||||||||
|
Net income
|
—
|
|
—
|
|
—
|
|
—
|
|
—
|
|
—
|
|
—
|
|
10,393
|
|
30,336
|
|
40,729
|
|
||||||||||||||||||
|
Balance at December 31, 2013, as adjusted
|
10,556,390
|
|
30,968,877
|
|
$
|
11
|
|
$
|
31
|
|
$
|
83,815
|
|
$
|
33
|
|
$
|
—
|
|
$
|
15,089
|
|
$
|
297,917
|
|
$
|
396,896
|
|
||||||||||
|
Stock-based compensation to directors, employees and other persons for services rendered
|
80,512
|
|
—
|
|
—
|
|
—
|
|
748
|
|
—
|
|
—
|
|
—
|
|
—
|
|
748
|
|
||||||||||||||||||
|
Non-controlling interest contributions to Care subsidiary
|
—
|
|
—
|
|
—
|
|
—
|
|
—
|
|
—
|
|
—
|
|
—
|
|
2,733
|
|
2,733
|
|
||||||||||||||||||
|
Class A shares issued and Class B shares redeemed due to TFP unit redemptions
|
21,198,510
|
|
(21,198,510
|
)
|
21
|
|
(21
|
)
|
—
|
|
—
|
|
—
|
|
—
|
|
—
|
|
—
|
|
||||||||||||||||||
|
Other comprehensive loss, net of tax
|
—
|
|
—
|
|
—
|
|
—
|
|
—
|
|
(82
|
)
|
—
|
|
—
|
|
—
|
|
(82
|
)
|
||||||||||||||||||
|
Non-controlling interest distributions from Care subsidiary
|
—
|
|
—
|
|
—
|
|
—
|
|
—
|
|
—
|
|
—
|
|
—
|
|
(294
|
)
|
(294
|
)
|
||||||||||||||||||
|
Non-controlling interest resulting from acquisitions
|
—
|
|
—
|
|
—
|
|
—
|
|
—
|
|
—
|
|
—
|
|
—
|
|
7,265
|
|
7,265
|
|
||||||||||||||||||
|
Shares purchased under stock purchase plan
|
(5,238
|
)
|
—
|
|
—
|
|
—
|
|
(39
|
)
|
—
|
|
—
|
|
—
|
|
—
|
|
(39
|
)
|
||||||||||||||||||
|
Net changes in non-controlling interest
|
—
|
|
—
|
|
—
|
|
—
|
|
186,566
|
|
—
|
|
—
|
|
—
|
|
(196,651
|
)
|
(10,085
|
)
|
||||||||||||||||||
|
Net (loss) income
|
—
|
|
—
|
|
—
|
|
—
|
|
—
|
|
—
|
|
—
|
|
(1,710
|
)
|
6,294
|
|
4,584
|
|
||||||||||||||||||
|
Balance at December 31, 2014
|
31,830,174
|
|
9,770,367
|
|
$
|
32
|
|
$
|
10
|
|
$
|
271,090
|
|
$
|
(49
|
)
|
$
|
—
|
|
$
|
13,379
|
|
$
|
117,264
|
|
$
|
401,726
|
|
||||||||||
(1) Amount results from a common control transaction and subsequent reclass.
See accompanying notes to consolidated financial statements
F-5
TIPTREE FINANCIAL INC. AND SUBSIDIARIES
Consolidated Statements of Cash Flows
(in thousands)
|
Year ended December 31,
|
|||||||
|
2014
|
2013
|
||||||
|
As adjusted
|
|||||||
|
Cash flows from operating activities:
|
|||||||
|
Net income (loss) available to common stockholders
|
$
|
(1,710
|
)
|
$
|
10,393
|
|
|
|
Net income attributable to noncontrolling interest
|
6,294
|
|
30,336
|
|
|||
|
Net income
|
4,584
|
|
40,729
|
|
|||
|
(Earnings) from discontinued operations
|
(7,937
|
)
|
(9,559
|
)
|
|||
|
Adjustments to reconcile net income to net cash provided by (used in) operating activities:
|
|||||||
|
Net realized and unrealized (gains) – trading assets
|
(5,045
|
)
|
(2,055
|
)
|
|||
|
Net realized (gain) on sale of properties, net
|
—
|
|
(15,463
|
)
|
|||
|
Non cash compensation expense
|
—
|
|
2,559
|
|
|||
|
Decrease (increase) in non cash interest from investments in loans
|
358
|
|
(272
|
)
|
|||
|
Depreciation and amortization expense
|
10,866
|
|
3,783
|
|
|||
|
Provision for loan losses
|
161
|
|
—
|
|
|||
|
Amortization and write off of deferred financing costs
|
403
|
|
26
|
|
|||
|
Accretion of mortgage note discount
|
(112
|
)
|
(198
|
)
|
|||
|
Increase in unearned premiums from acquisitions
|
9,796
|
|
—
|
|
|||
|
Increase in other liabilities and accrued expenses
|
723
|
|
6,172
|
|
|||
|
Income from investments in partially-owned entities, net
|
(2,643
|
)
|
(3,250
|
)
|
|||
|
Net change in loans originated for sale
|
(6,945
|
)
|
—
|
|
|||
|
(Decrease) in due to brokers, dealers, and trustees
|
(7,932
|
)
|
—
|
|
|||
|
Deferred tax expense
|
(249
|
)
|
(2,973
|
)
|
|||
|
(Increase) in other assets
|
(26,962
|
)
|
(12,448
|
)
|
|||
|
Operating activities from CLOs
|
105,937
|
|
(28,556
|
)
|
|||
|
Cash provided by (used in) operating activities - continuing operations
|
75,003
|
|
(21,505
|
)
|
|||
|
Cash provided by operating activities - discontinued operations
|
16,045
|
|
18,471
|
|
|||
|
Net cash provided by/ (used in) operating activities
|
91,048
|
|
(3,034
|
)
|
|||
|
Cash flows from investing activities:
|
|||||||
|
Purchases of trading securities and loans carried at fair value
|
(405,472
|
)
|
(204,638
|
)
|
|||
|
Purchases of available for sale securities
|
(7,026
|
)
|
—
|
|
|||
|
Purchases of derivatives
|
(12,493
|
)
|
(2,146
|
)
|
|||
|
Purchases of real estate
|
(541
|
)
|
(20,939
|
)
|
|||
|
Purchases of loans
|
(1,500
|
)
|
(34,802
|
)
|
|||
|
Purchases of fixed assets
|
(245
|
)
|
(13
|
)
|
|||
|
Investments in partially-owned entities
|
—
|
|
(1,519
|
)
|
|||
|
Proceeds from loan repayments/disposal of loans
|
38,917
|
|
9,305
|
|
|||
|
Proceeds from sales of real estate
|
—
|
|
44,021
|
|
|||
|
Increase/ (decrease) in restricted cash
|
5,262
|
|
(5,646
|
)
|
|||
|
Acquisitions, net cash
|
(70,500
|
)
|
(7,232
|
)
|
|||
|
Change in noncontrolling interest
|
(658
|
)
|
—
|
|
|||
|
Proceeds from sales of trading securities and loans carried at fair value
|
589,313
|
|
75,147
|
|
|||
|
Proceeds from foreign exchange
|
—
|
|
45
|
|
|||
|
Proceeds from sales and maturities of available for sale securities
|
1,975
|
|
—
|
|
|||
|
Proceeds from distributions paid by partially owned entities
|
7,209
|
|
2,706
|
|
|||
|
Change due to consolidation of trusts
|
—
|
|
(59
|
)
|
|||
|
Investing activities from CLOs
|
(635,477
|
)
|
(537,873
|
)
|
|||
|
Cash (used for) investing activities - continuing operations
|
(491,236
|
)
|
(683,643
|
)
|
|||
|
Cash (used for) investing activities from discontinued operations
|
(2,929
|
)
|
(5,539
|
)
|
|||
|
Net cash used in investing activities
|
(494,165
|
)
|
|
(689,182
|
)
|
||
F-6
TIPTREE FINANCIAL INC. AND SUBSIDIARIES
Consolidated Statements of Cash Flows
(in thousands)
|
Cash flows from financing activities:
|
|||||||
|
Capital distributions paid by subsidiaries
|
—
|
|
(2,824
|
)
|
|||
|
Dividends paid
|
(370
|
)
|
(366
|
)
|
|||
|
Proceeds from loans
|
29,118
|
|
204,561
|
|
|||
|
Principal paydowns of loans and mortgage notes payable
|
(150,347
|
)
|
(3,571
|
)
|
|||
|
Proceeds from issuance of common units of subsidiaries
|
524
|
|
3,741
|
|
|||
|
Financing activities from CLOs
|
492,650
|
|
529,571
|
|
|||
|
Cash provided by financing activities - continuing operations
|
371,575
|
|
731,112
|
|
|||
|
Cash (used in) financing activities - discontinued operations
|
(7,667
|
)
|
(6,902
|
)
|
|||
|
Net cash provided by financing activities
|
363,908
|
|
724,210
|
|
|||
|
Net (decrease) increase in cash
|
(39,209
|
)
|
31,994
|
|
|||
|
Cash and cash equivalents – unrestricted – beginning of period
|
120,557
|
|
88,563
|
|
|||
|
Cash and cash equivalents – unrestricted – end of period
|
81,348
|
|
120,557
|
|
|||
|
Less: Reclassification of cash to assets held for sale
|
28,361
|
|
22,912
|
|
|||
|
Cash and cash equivalents of continuing operations – unrestricted – end of period
|
$
|
52,987
|
|
|
$
|
97,645
|
|
|
Supplemental disclosure of cash flow information:
|
|||||||
|
Cash paid for interest
|
$
|
65,104
|
|
$
|
43,433
|
|
|
|
Cash paid for taxes
|
5,167
|
|
7,725
|
|
|||
|
Noncash investing and financing activities:
|
|||||||
|
Capital change due to equity compensation
|
$
|
748
|
|
$
|
2,482
|
|
|
|
Net assets related to acquisitions
|
109,941
|
|
(17,318
|
)
|
|||
|
Net liabilities extinguished by sale
|
—
|
|
(79,117
|
)
|
|||
See accompanying notes to consolidated financial statements.
F-7
TIPTREE FINANCIAL INC. AND SUBSIDIARIES
Notes to Consolidated Financial Statements
(in thousands, except shares and per share data)
December 31, 2014
Basis of Presentation
(1)
Organization
Tiptree Financial Inc. (Tiptree and, together with its consolidated subsidiaries, collectively, the Company) is a Maryland Corporation that was incorporated on March 19, 2007. Until July 1, 2013, Tiptree previously operated under the name Care Investment Trust Inc. (which, for the period prior to July 1, 2013, we refer to as Care Inc.). Tiptree is a diversified holding company which conducts its operations through Tiptree Operating Company, LLC (the Company). Tiptree’s primary focus is on
five
sectors: insurance and insurance services, specialty finance, asset management, real estate, and corporate and other.
Tiptree’s Class A Common Stock is traded on the NASDAQ Capital Market under the symbol “TIPT”.
2014 Transactions
Fortegra Financial Corporation
In December 2014, the Company completed the acquisition of Fortegra Financial Corporation (Fortegra), paying
$211,740
for
100%
ownership. Fortegra is consolidated within the Company’s insurance and insurance services segment since the closing date. Assets acquired were
$763,794
, including
$114,500
of intangible assets and
$93,442
of goodwill.
Luxury Mortgage Corp.
The Company completed the acquisition of
67.5%
of Luxury in January 2014; therefore, Luxury is consolidated within the Company’s financial statements beginning with the first quarter of 2014 and reported in Tiptree’s specialty finance segment.
2013 Transactions
Contribution Transactions
In July 2013, Care Inc. completed a transaction with Tiptree Financial Partners, L.P. (TFP) in which Care Inc. contributed substantially all of its assets to Operating Company in exchange for common units in Operating Company representing an approximately
25%
interest in Operating Company, and TFP contributed substantially all of its assets (excluding shares of Tiptree’s Class A Common Stock owned by TFP) to Operating Company in exchange for common units in Operating Company representing an approximately
75%
interest in Operating Company and the same number of shares of Tiptree’s newly classified Class B Common Stock (Contribution Transactions).
The Contribution Transactions were accounted for as a combination of entities under common control. As a result, the comparative financial information has been retrospectively adjusted to furnish comparative combined financial information from August 2010 (the date of common control). The application of this “as-if pooling of interests” required the previously issued consolidated financial statements of Tiptree to be recast to reflect such activity. As a result, any capital transaction activity of TFP related to these acquisitions, such as any increases or decreases in noncontrolling interest, was retroactively adjusted as an adjustment to Tiptree’s additional paid-in capital. Also, the results of operations of each of the acquisitions that have occurred after August 2010 are included in the consolidated financial statements from the date of acquisition.
F-8
TIPTREE FINANCIAL INC. AND SUBSIDIARIES
Notes to Consolidated Financial Statements
(in thousands, except shares and per share data)
December 31, 2014
(2)
Summary of Significant Accounting Policies
Basis of Presentation
The accompanying consolidated financial statements of the Company are prepared in accordance with U.S. generally accepted accounting principles (GAAP). The consolidated financial statements are presented in U.S. dollars, the main operating currency of the Company. The consolidated financial statements prepared under GAAP for all periods presented include retroactive adjustments to comparative periods to reflect the combinations under common control described in Note 1—Organization, related to the Contribution Transactions.
Reclassifications
Certain prior period amounts have been reclassified to conform to the current year presentation.
Principles of Consolidation
The consolidated financial statements reflect the consolidated accounts of Tiptree and (i) its wholly-owned subsidiaries, (ii) subsidiaries in which it has a controlling interest, and (iii) certain other entities known as variable interest entities (VIEs) in which Tiptree, through its subsidiaries, is deemed to be the primary beneficiary. All significant intercompany accounts and transactions have been eliminated in the consolidated financial statements. This consolidation, particularly with respect to the VIEs, significantly impacts these consolidated financial statements.
Use of Estimates
The preparation of consolidated financial statements in conformity with GAAP requires management to make estimates and assumptions that affect the amounts reported in the Company’s consolidated financial statements and accompanying notes. The estimates and assumptions most susceptible to change are the valuation of securities, loans, derivative positions, deferred income taxes and acquired assets and liabilities. Although these and other estimates and assumptions are based on the best available estimates, actual results could differ materially from management’s estimates.
Business Combinations and Purchase Price Adjustments
Business Combinations:
Business combinations are accounted for using the purchase method with the related net assets and results of operations included in the Company’s consolidated financial statements as of the respective acquisition date. The assets acquired may consist of a book of business, management contracts, customer relationships, non-compete agreements, trade names, and the excess of purchase price over the fair value of identifiable net assets acquired, or goodwill. The determination of estimated useful lives and the allocation of the purchase price to the intangible assets requires significant judgment and affects the amount of future amortization and possible impairment charges.
In certain instances, the Company may acquire less than 100% ownership of an entity, resulting in the recording of a non-controlling interest. The non-controlling interest is initially established at a preliminary estimate of fair value, which may be adjusted during the measurement period based upon the results of a valuation study applicable to the business combination. See "Purchase Price Adjustments" below for more information on measurement period adjustments.
Purchase Price Adjustments:
The values of certain assets and liabilities acquired in acquisitions are preliminary in nature, and are subject to adjustment as additional information is obtained, including, but not limited to, the valuation of separately identifiable intangibles, fixed assets, deferred taxes and deferred revenue. The valuations will be finalized as soon as practicable after the close of the acquisition. When the valuations are finalized, any changes to the preliminary valuation of assets acquired or liabilities assumed may result in adjustments to separately identifiable intangible assets and goodwill. A change to the acquisition date value of the identifiable net assets during the measurement period (up to one year from the acquisition date) affects the amount of the purchase price allocated to goodwill.
F-9
TIPTREE FINANCIAL INC. AND SUBSIDIARIES
Notes to Consolidated Financial Statements
(in thousands, except shares and per share data)
December 31, 2014
Discontinued Operations
The results of operations of a
business of the Company that have either been disposed of or are classified as held-for-sale are reported in discontinued operations if: (i) the operations and cash flows of the component have been or will be eliminated from the ongoing operations of the Company as a result of the disposal transaction; and (ii) the Company will not have any significant continuing involvement in the operations of the component after the disposal transaction. The Company presents the operations of business that meet the criteria for reporting as discontinued operations, and retrospectively reclassifies operating results for all prior periods presented. The Company carries assets and liabilities held for sale at the lower of carrying value on the date the asset is initially classified as held for sale or fair value less costs to sell. At the time of reclassification to held for sale, the Company ceased depreciation on assets transferred.
Variable Interest Entities
Accounting Standards Codification (ASC) Topic 810,
Consolidation
requires the consolidation of a VIE into the financial statements of the entity that is considered the VIE’s primary beneficiary. ASC Topic 810 provides a framework for determining whether an entity should be considered a VIE and accordingly evaluated for consolidation. If an entity is a VIE, it would then need to be determined whether Tiptree’s relationship, direct or indirect through subsidiaries, to the VIE (whether contractual, through direct investments in the entity, or otherwise) results in a variable interest. If Tiptree does have a variable interest in the entity, it would then need to be determined whether Tiptree is deemed to be the primary beneficiary. For VIEs, if Tiptree is deemed to (i) have the power to direct the activities of the VIE that most significantly impact the economic performance and (ii) either the obligation to absorb losses or the right to receive benefits that could potentially be significant to the VIE, then Tiptree would be deemed to be the primary beneficiary and would be required to consolidate. Generally, TAMCO’s contractual relationship as collateral manager of the CLOs described herein satisfies criteria (i) of the prior sentence, and its ownership interests in and/or ability to earn certain incentive or other management fees in certain CLOs can typically satisfy criteria (ii). As a result, TAMCO has been deemed the primary beneficiary of the CLOs that it manages.
Cash and Cash Equivalents
The Company considers all highly liquid investments of sufficient credit quality with maturities of three months or less to be cash equivalents. Cash and cash equivalents consist of U.S. denominated cash on hand, cash held in banks and investments in money market funds. The Company’s restricted cash primarily consists of cash that is collateral for any U.S. Treasury short position held as well as unremitted premiums received from agents and insurers, fiduciary cash for reinsurers and pledged assets for the protection of policy holders in various state jurisdictions. The cash held by CLOs is restricted for use by the individual CLOs and cannot be distributed to the Company.
Investments
The Company records all security transactions on a trade‑date basis. Realized gains/(losses) are generally determined using the specific-identification method. ASC Topic 320,
Investments – Debt and Equity Securities
, requires the Company to classify its investment assets as trading, available for sale or held to maturity.
Trading Securities
Debt and equity securities and corporate bonds classified as trading are intended to be sold at any time and are recorded at fair value, with unrealized gains/(losses) included in the consolidated statements of operations.
Available for Sale Securities
Securities classified as available for sale are intended to be held for indefinite periods of time and include those debt and equity securities that management may sell as part of its asset/liability management strategy or in response to changes in interest rates, resultant prepayment risk or other factors. Securities held as available for sale securities are recorded at fair value, with unrealized gains/(losses), net of related tax effects, reported as other comprehensive income.
Realized gains/(losses) on the sale of debt securities are calculated by the specific-identification method. The Company regularly conducts and documents periodic reviews of all securities with unrealized losses in order to evaluate whether the impairment is other-than-temporary. Under the guidance for debt securities, other-than-temporary impairment (OTTI) is recognized in earnings in the consolidated statements of operations for debt securities that the Company has an intent to sell or that it believes it is more likely than not that it will be required to sell prior to recovery of the amortized cost basis.
F-10
TIPTREE FINANCIAL INC. AND SUBSIDIARIES
Notes to Consolidated Financial Statements
(in thousands, except shares and per share data)
December 31, 2014
For those securities that the Company does not intend to sell nor expect to be required to sell, credit-related impairment is recognized in earnings, with the non-credit-related impairment recorded in accumulated other comprehensive income (AOCI). An unrealized loss exists when the current fair value of an individual security is less than its amortized cost basis. Unrealized losses that are determined to be temporary in nature are recorded, net of tax, in AOCI for AFS securities.
Management’s estimate of OTTI includes, among other things: (i) the duration of time and the relative magnitude to which fair value of the security has been below cost; (ii) the financial condition and near‑term prospects of the issuer of the investment; (iii) extraordinary events, including negative news releases and rating agency downgrades, with respect to the issuer of the investment; (iv) the Company’s ability and intent to hold an equity security for a period of time sufficient to allow for any anticipated recovery; (v) whether it is more likely than not that the Company will sell a security before recovery of its amortized cost basis; (vi) whether a debt security exhibits cash flow deterioration; and (vii) whether the security’s decline is attributable to specific conditions, such as conditions in an industry or in a geographic location.
Derivative Financial Instruments and Hedging
The Company recognizes all stand-alone derivatives on the consolidated balance sheets at fair value. The changes in the fair values of the derivative financial instruments are reported in the consolidated statements of operations. The Company uses interest rate swaps and credit derivatives as part of its risk management strategy to manage interest rate risk and cash flow risk that may arise in connection with the variable interest rate provision of the Company's preferred trust securities and accounts for this derivative as a cash flow hedge. The Company is exposed to certain risks in connection with its mortgage banking operations at Luxury. The Company is exposed to interest rate risk for certain interest rate lock commitments (IRLCs) until a purchaser for the related underlying loans is identified. The fair value of IRLCs is subject to change primarily due to changes in market interest rates.
Changes in fair value associated with the effective portion of a derivative instrument designated as a qualifying cash flow hedge are recognized initially in other comprehensive income (loss). When the cash flows for which the derivative is hedging materialize and are recorded in income or expense, the associated gain or (loss) from the hedging derivative previously recorded in AOCI is recognized in earnings. If a cash flow hedge is de-designated because it is no longer highly effective, or if the hedge relationship is terminated, the cumulative gain or loss on the hedging derivative to that date will continue to be reported in AOCI unless the hedged forecasted transaction is no longer expected to occur, at which time the cumulative gain or loss is recorded into earnings.
The Company records the fair value of the respective derivative instrument in trading assets at fair value or trading liabilities, at fair value. To the extent a derivative is an effective hedge of the cash flow risk of the hedged debt obligation, any change in the derivative's fair value is recorded in AOCI, net of income tax. To the extent the derivative is an ineffective hedge, that portion of the change in fair value is recorded in other operating expenses or interest expense as appropriate. The Company is not a party to leveraged derivatives and does not enter into derivative financial instruments for speculative purposes.
Mortgage Loans Held for Sale
Substantially all loans originated by the Company are held for sale to permanent investors. The Company has elected to record all mortgage loans held for sale at fair value. The fair value of loans held for sale is determined using quoted prices (level 2 inputs) and is determined on a loan by loan basis. These loans are considered sold when the Company surrenders control of the loans to the purchaser, with standard representations and warranties. Losses related to recourse provisions, if any, are accrued as a liability at the time such losses are determined. The Company does not retain any rights or obligations to service the loans following the closing of sales. Interest income on mortgage loans held for sale is recognized as earned and is only accrued if deemed collectible. Gain on sale income from these loans, represents the difference between the fair value and the selling price of the related loan sold as well as any fee income earned at origination.
Investments in Loans
Loans at fair value
The CLOs managed by the Company contain a diversified portfolio of middle market leveraged loans carried at estimated fair value. In general, the fair value of leveraged loans are obtained from an independent pricing service which provides secondary coverage of market participants. The values represent a composite of mark-to-market bid/offer prices and are classified as Level 2. In certain instances the Company will make its own determination of fair value of leveraged loans
F-11
TIPTREE FINANCIAL INC. AND SUBSIDIARIES
Notes to Consolidated Financial Statements
(in thousands, except shares and per share data)
December 31, 2014
based on internal models and other unobservable inputs and the Company classified these leveraged loans as Level 3. The changes in fair values of investments in loans are reported in the consolidated statements of operations.
Loans held at amortized cost
Certain loans held for investment are held at amortized cost. The Company periodically reviews these loans for impairment. Impairment losses are taken for impaired loans based on the fair value of collateral on an individual loan basis. When it is probable that the Company will be unable to collect all amounts contractually due, the loan would be considered impaired.
For asset backed loans held by Siena, impairment is recorded when the Company determines that it is probable that principal will not be collected in full.
The allowance for loan losses is a valuation allowance for probable incurred credit losses. Loan losses are charged against the allowance when the Company believes the uncollectibility of a loan balance is confirmed. Management reviews its methodology for its calculation of its loss provision as deemed necessary which is at least on an annual basis.
Interest income is generally recognized using the effective interest method or on a basis approximating a level rate of return over the term of the loan. Nonaccrual loans are those on which the accrual of interest has been suspended. Loans are placed on nonaccrual status and considered nonperforming when full payment of principal and interest is in doubt, or when principal or interest is 90 days or more past due and collateral, if any, is insufficient to cover principal and interest. Interest accrued but not collected at the date a loan is placed on nonaccrual status is reversed against interest income. In addition, the amortization of net deferred loan fees is suspended. Interest income on nonaccrual loans may be recognized only to the extent it is received in cash. However, where there is doubt regarding the ultimate collectability of loan principal, cash receipts on such nonaccrual loans are applied to reduce the carrying value of such loans. Nonaccrual loans may be returned to accrual status when repayment is reasonably assured and there has been demonstrated performance under the terms of the loan or, if applicable, the restructured terms of such loan. The Company did not have any loans on nonaccrual status as of December 31, 2014 or 2013.
The Company defers nonrefundable loan origination and commitment fees collected on originated loans and amortizes the net amount as an adjustment of the yield over the estimated life of the loan. If a loan is prepaid, the net deferred amount is recognized in the consolidated statements of operations at that time. Interest and fees on loans include prepayment fees and late charges collected.
Notes Receivable, net
The Company has notes receivable from commercial businesses for its premium financing program and from consumers for its pay us later financing program at Fortegra and its real estate partners at Care. From time to time, the Company issues notes receivable to business partners to solidify relationships and grow its business.
The Company accrues interest income on its notes receivable based on the contractual terms of the respective note. The Company monitors all notes receivable for delinquency and provides for estimated losses for specific receivables that are not likely to be collected. In addition to allowances for bad debt for specific notes receivable, a general provision for bad debt is estimated for the Company’s notes receivable based on historical trends. Account balances are generally charged against the allowance when the Company believes it is probable that the note receivable will not be recovered, and has exhausted its contractual and legal remedies. The Company continually reviews its allowance for doubtful accounts.
Generally, receivables overdue more than 120 days are written off when the Company determines it has exhausted reasonable collection efforts and remedies.
Accounts and Premiums Receivable, Net
Accounts and premiums receivable from the Company’s insurance services business are presented net of the allowance for doubtful accounts and consist primarily of advance commissions and agents' balances in course of collection and billed but not collected policy premiums. For policy premiums that have been billed but not collected, the Company records a receivable on its balance sheet for the full amount of the premium billed, with a corresponding liability, net of its commission, to insurance carriers. The Company earns interest on the premium cash during the period of time between receipt of the funds and payment of these funds to insurance carriers. The Company maintains an allowance for doubtful accounts based on an estimate of uncollectible accounts. The allowance for doubtful accounts totaled
$296
at December 31, 2014.
F-12
TIPTREE FINANCIAL INC. AND SUBSIDIARIES
Notes to Consolidated Financial Statements
(in thousands, except shares and per share data)
December 31, 2014
Reinsurance Receivables
Fortegra has various reinsurance agreements in place whereby the amount of risk in excess of Fortegra’s retention goals is reinsured by unrelated domestic and foreign insurance companies. Fortegra remains liable to policyholders in the event that the assuming companies are unable to meet their obligations. Reinsurance receivables include amounts related to paid benefits, unpaid benefits and prepaid reinsurance premiums. Reinsurance receivables are based upon estimates and are reported on the consolidated balance sheets separately as assets, as reinsurance does not relieve Fortegra of its legal liability to policyholders. Fortegra is required to pay losses even if a reinsurer fails to meet its obligations under the applicable reinsurance agreement. Management continually monitors the financial condition and agency ratings of Fortegra's reinsurers and believes that the reinsurance receivables accrued are collectible. Balances recoverable from reinsurers and amounts ceded to reinsurers relating to the unexpired portion of reinsured policies are presented as assets. Experience refunds from reinsurers are recognized based on the underwriting experience of the underlying contracts.
Investments in Partially-Owned Entities
The Company invests in real estate‑related equity interests that allow it to participate in a percentage of the underlying property’s cash flows from operations and proceeds from a sale or refinancing. At the inception of the investment, it must be determined whether such investment should be accounted for as a loan, joint venture or as real estate. For the years ended December 31, 2014 and 2013, the Company held
one
real estate-related investment and accounted for such investment under the equity method.
The Company assesses whether there are indicators that the value of its partially-owned entities may be impaired. An investment’s value is impaired if management determines that a decline in the value of the investment below its carrying value is other than temporary. To the extent impairment has occurred, the loss shall be measured as the excess of the carrying amount of the investment over the estimated value of the investment. There were no material impairments on our investments in partially-owned entities for the years ended December 31, 2014 and December 31, 2013.
Real Estate
Real estate is carried at cost, net of accumulated depreciation and amortization. Betterments, major renewals and certain costs directly related to the acquisition, improvement and leasing of real estate are capitalized. Maintenance and repairs are charged to operations as incurred. Depreciation is calculated on a straight‑line basis over the assets’ estimated useful lives which range from
9
to
40
years.
Upon the acquisition of real estate, management will assess the fair value of acquired assets (including land, buildings and improvements, and identified intangible assets such as above and below market leases and acquired in‑place leases and customer relationships) and acquired liabilities and then allocate purchase price based on these assessments. Management assesses fair value based on estimated cash flow projections that utilize appropriate discount and capitalization rates and available market information. In estimating carrying costs, the Company includes estimates of lost rents at estimated market rates during the hypothetical expected lease-up periods, which are dependent on local market conditions and expected trends.
Real estate properties are reviewed for impairment whenever events or changes in circumstances indicate that the carrying amount of the assets may not be recoverable in accordance with ASC 360,
Impairment or Disposal of Long-Lived Assets
. If such reviews indicate that the asset is impaired, the asset’s carrying amount is written down to its fair value. An impairment loss is measured based on the excess of the carrying amount over the fair value. The fair value is determined by using a discounted cash flow model and appropriate discount and capitalization rates. The evaluation of anticipated cash flows is subjective and is based, in part, on assumptions regarding future occupancy, rental rates, and capital requirements that could differ materially from actual results. If anticipated holdings periods change or estimated cash flows decline based on market conditions or otherwise, an impairment loss may be recognized. Long-lived assets to be disposed of are recorded at the lower of carrying value or fair value less estimated costs to sell. There were no material impairments on the Company’s real estate investments for the years ended December 31, 2014 and 2013.
F-13
TIPTREE FINANCIAL INC. AND SUBSIDIARIES
Notes to Consolidated Financial Statements
(in thousands, except shares and per share data)
December 31, 2014
Goodwill and Identifiable Intangible Assets
The Company initially records all assets and liabilities acquired in purchase acquisitions, including goodwill, indefinite lived intangibles and other intangibles, in accordance with ASC 805,
Business Combinations
. Goodwill, indefinite-lived intangibles and other intangibles are subsequently accounted for in accordance with ASC 350,
Intangibles-Goodwill
and Other and ASC 360,
Impairment or Disposal of Long-Lived Assets
. The initial measurement of goodwill and intangibles requires judgment concerning estimates of the fair value of the acquired assets and liabilities. Goodwill (
$95,347
at December 31, 2014) and indefinite-lived intangible assets (
$13,000
at December 31, 2014) are not amortized but subject to tests for impairment annually or if events or circumstances indicate it is more likely than not they may be impaired. Other intangible assets are amortized over their estimated useful lives and are subject to impairment if events or circumstances indicate a possible inability to realize the carrying amount.
Tiptree has two segments of its business which contain goodwill and for which annual goodwill impairment testing is done at a reporting unit level in accordance with ASC 350. These segments are insurance and insurance services for Tiptree’s acquisition of Fortegra and specialty finance for its acquisition of Siena and Luxury. The goodwill impairment testing is performed in two steps. The first step compares the estimated fair value of the reporting unit with its carrying amount, including goodwill. If the estimated fair value of the reporting unit exceeds its carrying amount, goodwill of the reporting unit is considered not impaired. However, if the carrying amount of the reporting unit were to exceed its estimated fair value, a second step would be performed that would compare the implied fair value of the reporting unit’s goodwill with the carrying amount of that goodwill. An impairment loss would be recorded to the extent that the carrying amount exceeds the implied fair value of the reporting unit’s goodwill. A substantial goodwill impairment charge would not have a significant impact on the Company’s financial condition, but could have an adverse impact on our results of operations.
GAAP also requires that an interim test be done whenever events or circumstances occur that may indicate that it is more likely than not that the fair value of any reporting unit might be less than its carrying value. No such events or circumstances have occurred during 2014.
Key judgments in accounting for intangibles include useful life and classification between goodwill and indefinite-lived intangibles or other intangibles requiring amortization. Indefinite-lived intangible assets are evaluated for impairment at least annually by comparing their fair values, estimated using discounted cash flow analyses, to their carrying values. Other amortizing intangible assets (
$106,894
at December 31, 2014) are evaluated for impairment if events and circumstances indicate a possible impairment. Such evaluation of other intangible assets is initially based on undiscounted cash flow projections.
The Company carries intangible assets, which represent customer and agent relationships, trade names, insurance licenses (certificates of authority granted by individual state departments of insurance), the value of in-force insurance policies acquired, software acquired or internally developed, and leases in place. Management has deemed the insurance licenses to have indefinite useful life, and performs impairment tests on these assets at least annually. Costs incurred to renew or maintain these licenses are recorded as operating costs in the period in which they arise.
In-place lease values attributable to the Company’s real estate segment are based upon the evaluation of the specific characteristics of each property acquired and the respective tenant’s lease. Factors considered include estimates of carrying costs during hypothetical expected lease-up periods and market conditions. In estimating carrying costs, the Company includes estimates of lost rents at estimated market rates during the hypothetical expected lease-up periods, which are dependent upon local market conditions and expected trends.
The Company’s intangible assets related to the insurance and insurance services segment are assets of Fortegra Financial acquired in December 2014. The carried amounts are based on preliminary valuations developed applying generally accepted valuation practices. These preliminary valuations are subject to review and finalization within the 12-month measurement period subsequent to the acquisition date. The Company amortizes finite-lived intangible assets in a manner consistent with the discounted cash flow models that support their initial values, using estimated weighted average lives for each asset type.
The Company tests intangible assets with finite lives for recoverability whenever events or changes in circumstances indicate that the carrying amount may not be recoverable in accordance with ASC 360, and the Company is required to evaluate whether the carrying amount of the amortizable intangible asset is recoverable. If the carrying amount is not recoverable, the Company tests the carrying amount for impairment. Any impairment loss recognized reduces the asset to its new cost
F-14
TIPTREE FINANCIAL INC. AND SUBSIDIARIES
Notes to Consolidated Financial Statements
(in thousands, except shares and per share data)
December 31, 2014
basis. There have been no events or changes in circumstances that required an impairment test for amortizing intangible assets. There has been no impairment recognized on the intangible assets.
Other Receivables
Other receivables primarily represent amounts due to the Company from its business partners for retrospective commissions, net of allowance and for motor club membership fees.
The Company defers certain debt issuance costs associated with its debt. These costs are classified as an asset and are amortized over the life of the particular debt instrument.
Notes Payable CLOs
In accordance with ASU 2014-13, the Company can elect to measure both the financial assets and the financial liabilities of its CLOs in its consolidated financial statements using the more observable of the fair value of the financial assets or the fair value of the financial liabilities. The notes payable of the Company’s CLOs are measured using the fair value of the financial assets. Upon adoption of ASU 2014-13, the notes are measured as (i) the sum of the fair value of the financial assets and the carrying value of any nonfinancial assets held temporarily, less (ii) the sum of the fair value of any beneficial interests retained by the Company (other than those that represent compensation for services) and the Company’s carrying value of any beneficial interests that represent compensation for services.
Unearned Premiums
Premiums written are earned over the life of the respective policy using the Rule of 78's, pro rata, or other actuarial methods as appropriate for the type of business. Unearned premiums represent the portion of premiums that will be earned in the future. A premium deficiency reserve is recorded if anticipated losses, loss adjustment expenses, deferred acquisition costs and policy maintenance costs exceed the recorded unearned premium reserve and anticipated investment income. As of December 31, 2014, no deficiency reserve was recorded.
Policy Liabilities
Policyholder account balances relate to investment-type individual annuity contracts in the accumulation phase. Policyholder account balances are carried at accumulated account values, which consist of deposits received, plus interest credited, less withdrawals and assessments. Minimum guaranteed interest credited to these contracts ranges from
3.0%
to
4.0%
.
Deferred Revenues
Deferred revenues represent the portion of income that will be earned in the future attributable to motor club memberships, mobile device protection plans, and other non-insurance service contracts that are earned over the respective contract periods using Rule of 78's, modified Rule of 78's, pro rata, or other methods as appropriate for the contract. A deficiency reserve would be recorded if anticipated contract benefits, deferred acquisition costs and contract service costs exceed the recorded deferred revenues and anticipated investment income. As of December 31, 2014, no deficiency reserve was recorded.
Deferred Acquisition Costs - Insurance Related
The Company defers certain costs of acquiring new and renewal business. These costs are limited to direct costs that resulted from successful contract transactions and would not have been incurred by the Company's insurance company subsidiaries had the transactions not occurred. These capitalized costs are amortized as the related premium is earned.
The Company evaluates whether deferred acquisition costs-insurance related are recoverable at year-end, and considers investment income in the recoverability analysis. As a result of the Company's evaluations, no write-offs for unrecoverable deferred acquisition costs were recognized during the year ended December 31, 2014.
F-15
TIPTREE FINANCIAL INC. AND SUBSIDIARIES
Notes to Consolidated Financial Statements
(in thousands, except shares and per share data)
December 31, 2014
Deferred Acquisition Costs - Non-insurance Related
The Company defers certain costs of acquiring new and renewal business related to non-insurance subsidiary transactions. These costs are limited to prepaid direct costs, typically commissions and contract transaction fees, that resulted from successful contract transactions and would not have been incurred by the Company had the transactions not occurred. These capitalized costs are amortized as the related service and administrative fees are earned.
The Company evaluates whether deferred acquisition costs - non-insurance related are recoverable at year-end. As a result of the Company's evaluations, no write-offs for unrecoverable deferred acquisition costs were recognized during the year ended December 31, 2014.
Revenue Recognition
The Company earns revenues from a variety of sources:
Service and Administrative Fees
The Company earns service and administrative fees from a variety of activities. Such fees are typically positively correlated with transaction volume and are recognized as revenue as they become both realized and earned.
Service Fees.
S
ervice fee revenue is recognized as the services are performed. These services include fulfillment, software development, and claims handling for our customers. Collateral tracking fee income is recognized when the service is performed and billed. Management reviews the financial results under each significant contract on a monthly basis. Any losses that may occur due to a specific contract would be recognized in the period in which the loss is determined probable. During the year ended December 31, 2014, the Company has not incurred a loss with respect to a specific significant service fee contract.
Administrative Fees.
Administrative fee revenue includes the administration of credit insurance, debt cancellation programs, motor club programs, and warranty programs. Related administrative fee revenue is recognized consistent with the earnings recognition pattern of the underlying insurance policies, debt cancellation contracts and motor club memberships being administered, using Rule of 78's, modified Rule of 78's, pro rata, or other methods as appropriate for the contract. Management selects the appropriate method based on available information, and periodically reviews the selections as additional information becomes available.
Ceding Commissions
Ceding commissions earned under coinsurance agreements are based on contractual formulas that take into account, in part, underwriting performance and investment returns experienced by the assuming companies. As experience changes, adjustments to the ceding commissions are reflected in the period incurred and are based on the claim experience of the related policy.
The adjustment is calculated by adding the earned premium and investment income from the assets held in trust for the Company's benefit less earned commissions, incurred claims and the reinsurer's fee for the coverage.
Net Earned Premium
Net earned premium is from direct and assumed earned premium consisting of revenue generated from the direct sale of payment protection insurance policies by the Company's distributors and premiums written for payment protection insurance policies by another carrier and assumed by the Company. Whether direct or assumed, the premium is earned over the life of the respective policy using methods appropriate to the pattern of losses for the type of business. Methods used include the Rule of 78's, pro rata, and other actuarial methods. Management selects the appropriate method based on available information, and periodically reviews the selections as additional information becomes available. Direct and assumed premiums are offset by premiums ceded to the Company's reinsurers, including producer owned reinsurance companies ("PORCs"), earned in the same manner. The amount ceded is proportional to the amount of risk assumed by the reinsurer.
Rental Revenue
Rental revenue from residential tenants are recognized on a contractual basis, as lease periods for residential tenants are short-term in nature. The Company recognizes rental revenue from triple net leases in accordance with ASC Topic 840,
Leases
(ASC 840). ASC 840 requires that revenue be recognized on a straight-line basis over the non-cancelable term of the lease unless another systematic and rational basis is more representative of the time pattern in which the use benefit is derived from the leased property. Renewal options in leases with rental terms that are higher than those in the primary term are excluded from the calculation of straight line rent if the renewals are not reasonably assured. The Company commences rental revenue recognition when the tenant takes control of the leased space. The Company recognizes lease
F-16
TIPTREE FINANCIAL INC. AND SUBSIDIARIES
Notes to Consolidated Financial Statements
(in thousands, except shares and per share data)
December 31, 2014
termination payments as a component of rental revenue in the period received, provided that there are no further obligations under the lease. Amortization expense of above-market leases reduces rental revenue on a straight-line basis over the non-cancelable term of the lease. Taxes, insurance and reserves collected from tenants are separately shown as reimbursable income and corresponding payments are included in reimbursed property expenses included as components of other income and other expenses respectively in the consolidated statements of operations.
Fair Value Measurement
ASC Topic 820,
Fair Value Measurements and Disclosures
, defines fair value, describes the framework for measuring fair value, and addresses fair value measurement disclosures. Fair value is defined as the price that would be received to sell an asset or paid to transfer a liability in an orderly transaction between market participants at the measurement date.
ASC Topic 820 establishes a three‑level valuation hierarchy for disclosure of fair value measurements. The valuation hierarchy is based upon the transparency of inputs to the valuation of an asset or liability as of the measurement date. The three levels, from highest to lowest, are defined as follows:
|
•
|
Level 1 – Unadjusted, quoted prices in active markets for identical assets or liabilities that the Company has the ability to access at the measurement date.
|
|
•
|
Level 2 – Significant inputs other than quoted prices that are observable for the asset or liability, either directly or indirectly through corroboration with observable market data. Level 2 inputs include quoted prices for similar instruments in active markets, and inputs other than quoted prices that are observable for the asset or liability.
|
The types of financial assets and liabilities carried at level 2 are valued based on one or more of the following:
|
a)
|
Quoted prices for similar assets or liabilities in active markets;
|
|
b)
|
Quoted prices for identical or similar assets or liabilities in nonactive markets;
|
|
c)
|
Pricing models whose inputs are observable for substantially the full term of the asset or liability;
|
|
d)
|
Pricing models whose inputs are derived principally from or corroborated by observable market data through correlation or other means for substantially the full term of the asset or liability.
|
|
•
|
Level 3 – Significant inputs that are unobservable inputs for the asset or liability, including the Company’s own data and assumptions that are used in pricing the asset or liability.
|
The availability of observable inputs can vary depending on the financial asset or liability and is affected by a wide variety of factors, including, for example, the type of product, whether the product is new, whether the product is traded on an active exchange or in the secondary market, and the current market conditions. To the extent that valuation is based on models or inputs that are less observable or unobservable in the market, the determination of fair value requires more judgment. Accordingly, the degree of judgment exercised by the Company in determining fair value is greatest for instruments categorized within Level 3 of the fair value hierarchy. In certain cases, the inputs used to measure fair value may fall into different levels of the fair value hierarchy. In such cases, for disclosure purposes, the level in the fair value hierarchy within which the fair value measurement in its entirety falls is determined based on the lowest level input that is significant to the fair value measurement in its entirety. The Company’s assessment of the significance of a particular input to the fair value measurement in its entirety requires judgment and the consideration of factors specific to the asset or liability. From time to time, the Company’s assets and liabilities will be transferred between one level to another level. It is the Company’s policy to recognize transfers between different levels at the end of each reporting period.
The following is a description of the valuation methodologies used for financial assets and liabilities measured at fair value, as well as the general classification of such assets and liabilities pursuant to the valuation hierarchy. The Company’s fair value measurement is based on a market approach, which utilizes prices and other relevant information generated by market transactions involving identical or comparable financial instruments. Sources of inputs to the market approach include third-party pricing services, independent broker quotations or pricing matrices. Management analyzes the third party valuation methodologies and its related inputs to perform assessments to determine the appropriate level within the fair value hierarchy and to assess reliability of values. Further, management has a process in place to review all changes in fair value from measurement period to measurement period. Any discrepancies or unusual observations are followed through to resolution through the source of the pricing as well as utilizing comparisons, if applicable, to alternate pricing sources.
F-17
TIPTREE FINANCIAL INC. AND SUBSIDIARIES
Notes to Consolidated Financial Statements
(in thousands, except shares and per share data)
December 31, 2014
The Company utilizes observable and unobservable inputs within its valuation methodologies. Observable inputs include benchmark yields, reported trades, broker-dealer quotes, issuer spreads, benchmark securities, bids, offers and reference data. In addition, specific issuer information and other market data is used. For broker quotes, quotes are obtained from sources recognized to be market participants. Unobservable inputs may include: expected cash flow streams, default rates, supply and demand considerations and market volatility.
Trading Assets:
Trading assets consist primarily of privately held equity securities, exchange-traded equity securities, CLOs, collateralized debt obligations (CDOs), loans, derivative assets and tax exempt securities. The fair value of privately held equity securities are either based on quotes obtained from dealers or internally developed valuation models. Because significant inputs used to determine the dealer quotes or model values are not observable, such as projected future earnings and price volatility, the Company has classified them within Level 3 of the fair value hierarchy.
Positions in securitized products such as CLOs and CDOs are based on quotes obtained from dealers and valuation models. When these quotes are based directly or indirectly on observable inputs such as quoted prices for similar assets exchanged in an active or inactive market, the Company has classified them within Level 2 of the fair value hierarchy. If these quotes are based on valuation models using unobservable inputs such as expected future cash flows, default rates, supply and demand considerations, and market volatility, the Company has classified them within Level 3 of the fair value hierarchy.
The fair value of tax exempt securities is determined by obtaining quotes from independent pricing services. In most cases, quotes are obtained from two pricing services and the average of both quotes is used. The independent pricing services determine their quotes using observable inputs such as current interest rates, specific issuer information and other market data for such securities. Therefore, the estimate of fair value is subject to a high degree of variability based upon market conditions, the availability of issuer information and the assumptions made. The valuation inputs used to arrive at fair value for such debt obligations are generally classified within Level 2 or Level 3 of the fair value hierarchy.
Available for sale securities:
Available for sale securities consist primarily of U.S. Treasury securities and obligations of U.S. government authorities and agencies, municipal securities, corporate securities, certificates of deposit and equity securities.
Available for sale securities are generally classified within either Level 1 or Level 2 of the fair value hierarchy. The estimated fair values presented for the Company's available for sale investment portfolio are based on prices provided by an independent pricing service and a third party investment manager. The prices provided by these services are based on quoted market prices, when available, non-binding broker quotes, or matrix pricing. The independent pricing service and the third party investment manager provide a single price or quote per security. The Company obtains an understanding of the methods, models and inputs used by the independent pricing service and the third party investment manager, and has controls in place to validate that the amounts provided represent fair values.
The following details the methods and assumptions used to estimate the fair value of each class of available for sale securities and the applicable level each security falls within the fair value hierarchy:
U.S Treasury securities:
Fair values were obtained from an independent pricing service and a third party investment manager. The prices provided by the independent pricing service are based on quoted market prices, when available, non-binding broker quotes, or matrix pricing and fall under Level 2 of the fair value hierarchy.
Obligations of U.S. government authorities and agencies:
Fair values were obtained from an independent pricing service and a third party investment manager. The prices provided by the independent pricing service are based on quoted market prices, when available, non-binding broker quotes, or matrix pricing and fall under Level 2 of the fair value hierarchy.
Municipal securities:
Fair values were obtained from an independent pricing service and a third party investment manager. The prices provided by the independent pricing service are based on quoted market prices, when available, non-binding broker quotes, or matrix pricing and fall under Level 2 of the fair value hierarchy.
Certificates of deposit:
The estimated fair value of certificates of deposit approximates their carrying value and fall under Level 1 of the fair value hierarchy.
F-18
TIPTREE FINANCIAL INC. AND SUBSIDIARIES
Notes to Consolidated Financial Statements
(in thousands, except shares and per share data)
December 31, 2014
Corporate securities:
Fair values were obtained from an independent pricing service and a third party investment manager. The prices provided by the independent pricing service are based on quoted market prices, when available, non-binding broker quotes, or matrix pricing and fall under Level 2 of the fair value hierarchy.
Equity securities:
The fair values of publicly traded common and preferred stocks were obtained from market value quotations provided by an independent pricing service and fall under Level 1 of the fair value hierarchy. The fair values of non-publicly traded common and preferred stocks were based on prices obtained from an independent pricing service using unobservable inputs and fall under Level 3 of the fair value hierarchy.
Obligations of foreign governments:
Fair values were obtained from an independent pricing service and a third party investment manager. The prices provided by the independent pricing service are based on quoted market prices, when available, non-binding broker quotes, or matrix pricing and fall under Level 2 of the fair value hierarchy.
Derivative assets and liabilities:
Derivatives are comprised of credit default swaps (CDS), index credit default swaps (CDX), interest rate lock commitments (IRLC), interest rate swaps (IRS) and U.S. Treasury short positions. The fair value of these instruments is based upon valuation pricing models, which represent what the Company would expect to receive or pay at the balance sheet date to exit the position. In general, the fair value of CDSs and CDXs are based on dealer quotes. Because significant inputs used to determine the dealer quotes, such as price volatility, the Company has classified them as Level 2 of the fair value hierarchy. The fair value of IRS is based upon valuation pricing models, which represent what the Company would expect to pay at the balance sheet date if the contracts were exited or is determined by obtaining broker or counterparty quotes. Because there are observable inputs used to arrive at these prices, the Company has classified IRS within Level 2 of the fair value hierarchy. Luxury issues IRLC to its customers, which are carried at estimated fair value on the Company’s consolidated balance sheet. The estimated fair values of these commitments are generally calculated by reference to the value of the underlying loan associated with the IRLC net of an expected fall out assumption. The fair values of these commitments generally result in a Level 3 classification. Luxury manages its exposure by entering into best efforts delivery commitments with loan investors referred to as “best efforts lock”. For loans not locked with investors on a best efforts basis, the Company enters into hedge instruments, utilizing to be announced mortgage-backed securities, to protect against movements in interest rates. The fair values of these hedge instruments generally result in a Level 2 classification.
The Company uses certain of its IRS as part of its risk management strategy to manage interest rate risk and cash flow risk that may arise in connection with the variable interest rate provision of the Company's preferred trust securities. These derivatives are classified as cash flow hedges. The Company’s U.S. Treasury short position is priced through dealer indicative quotes and as such is classified as Level 2.
Cash and Cash Equivalents – Unrestricted:
The carrying amounts of cash and cash equivalents - unrestricted are carried at cost which approximates fair value.
Cash and Cash Equivalents – Restricted:
The carrying amounts of cash and cash equivalents - restricted are carried at cost which approximates fair value.
Due from Brokers, Dealers, and Trustees and Due to Brokers, Dealers and Trustees:
The carrying amounts of these assets and liabilities approximate their fair value due to their relatively short‑term nature.
Notes receivable:
The carrying amounts approximate fair value because the interest rates charged approximate current market rates for similar credits.
Accounts and premiums receivable, net, and other receivables:
The carrying amounts approximate fair value since no interest rate is charged on these short duration assets.
Loans Owned, at Amortized Cost:
The fair value of loans owned, at amortized cost is computed by discounting the expected future cash flows at market rates. Variable rate lines of credit outstanding are assumed to be at fair value.
Debt:
The fair value of notes payable is determined based on contractual cash flows discounted at market rates for mortgage notes payable and either dealer quotes or contractual cash flows discounted at market rates for other notes payable.
F-19
TIPTREE FINANCIAL INC. AND SUBSIDIARIES
Notes to Consolidated Financial Statements
(in thousands, except shares and per share data)
December 31, 2014
Stock Based Compensation
The Company accounts for equity‑based compensation issued to employees, nonemployees, directors, and affiliates of the Company using the current fair value based methodology.
The Company has determined that the measurement period for restricted shares awarded to employees occurs at grant date. The Company initially measures the cost of an award of restricted shares as the fair value of the restricted shares on the date awarded and subsequently measures the cost of the restricted shares over the vesting period, which is generally three years. The compensation costs are charged to expense over the vesting period with a corresponding credit to capital.
Compensation cost is recognized for stock options issued to employees, based on the fair value of these awards at the date of grant. A Black-Scholes model is utilized to estimate the fair value of stock options. Compensation cost is recognized over the required service period, generally defined as the vesting period. There were no issuances of stock option awards during either 2014 or 2013. The Company also issues restricted stock units as compensation to employees with the difference at grant date between the fair market value and the cost basis of the shares recorded as a reduction to retained earnings or an increase to additional paid-in capital, as applicable. The expense is amortized over the vesting period of the awards, generally three years.
Member Benefit Claims
Member benefit claims represent claims paid on behalf of contract holders directly to third party providers for roadside assistance and for the repair or replacement of covered products. Claims can also be paid directly to contract holders as a reimbursement payment, provided supporting documentation of loss is submitted to the Company. Claims are recognized as expense when incurred.
Net Losses and Loss Adjustment Expenses
Net losses and loss adjustment expenses include actual claims paid and the change in unpaid claim reserves, net of amounts ceded. Incurred claims are impacted by loss frequency, which is the measure of the number of claims per unit of insured exposure, and loss severity, which is based on the average size of claims. Factors affecting loss frequency and loss severity include changes in claims reporting patterns, claims settlement patterns, judicial decisions, legislation, economic conditions, morbidity patterns and the attitudes of claimants towards settlements.
Actual claims paid are claims payments made to the policyholder or beneficiary during the accounting period. The change in unpaid claim reserve is an increase or reduction to the unpaid claim reserve in the accounting period to maintain the unpaid claim reserve at the levels evaluated by our actuaries.
Unpaid claims are reserve estimates that are established in accordance with U.S. GAAP using generally accepted actuarial methods. Credit life and AD&D unpaid claims reserves include claims in the course of settlement and incurred but not reported ("IBNR"). Credit disability unpaid claims reserves also include continuing claim reserves for open disability claims. For all other product lines, unpaid claims reserves are bulk reserves and are entirely IBNR. The Company uses a number of algorithms in establishing its unpaid claims reserves. These algorithms are used to calculate unpaid claims as a function of paid losses, earned premium, target loss ratios, in-force amounts, unearned premium reserves, industry recognized morbidity tables or a combination of these factors.
In arriving at the unpaid claims reserves, the Company conducts an actuarial analysis on a basis gross of reinsurance. The same estimates used as a basis in calculating the gross unpaid claims reserves are then used as the basis for calculating the net unpaid claims reserves, which take into account the impact of reinsurance. Anticipated future loss development patterns form a key assumption underlying these analyses. Our claims are generally reported and settled quickly, resulting in consistent historical loss development patterns. From the anticipated loss development patterns, a variety of actuarial loss projection techniques are employed, such as the chain ladder method, the Bornhuetter-Ferguson method and expected loss ratio method.
The unpaid claims reserves represent the Company's best estimates, generally involving actuarial projections at a given time. Actual claim costs are dependent upon a number of complex factors such as changes in doctrines of legal liabilities and damage awards. These factors are not directly quantifiable, particularly on a prospective basis. The Company periodically reviews and updates its methods of making such unpaid claims reserve estimates and establishing the related liabilities
F-20
TIPTREE FINANCIAL INC. AND SUBSIDIARIES
Notes to Consolidated Financial Statements
(in thousands, except shares and per share data)
December 31, 2014
based on our actual experience. The Company has not made any changes to its methodologies for determining unpaid claims reserves in the periods presented.
Income Taxes
Deferred tax assets and liabilities are determined using the asset and liability method. Under this method, deferred tax assets and liabilities are established for future tax consequences of temporary differences between the financial statement carrying amounts of assets and liabilities and their tax basis. Deferred tax assets and liabilities are measured using enacted tax rates expected to apply to taxable income in the year in which those temporary differences are expected to reverse. A valuation allowance is established when necessary to reduce a deferred tax asset to the amount expected to be realized. The Company’s subsidiaries PFG, Siena Capital Finance Acquisition Corp., Luxury Mortgage Corp., MFCA Funding, Fortegra and TAMCO Manager, Inc. file both federal and state returns. These U.S. federal and state income tax returns, when filed, will be subject to examination by the Internal Revenue Service and state departments of revenue. See Note 23—Income Taxes.
The Company evaluates tax positions taken or expected to be taken in the course of preparing its tax returns to determine whether the tax positions are “more likely than not” of being sustained by the applicable tax authority. The Company’s tax benefit or tax expense is adjusted accordingly for tax positions not deemed to meet the more likely than not threshold.
Earnings Per Share
The Company presents both basic and diluted earnings per common share in its consolidated financial statements and footnotes thereto. Basic earnings per common share (Basic EPS) excludes dilution and is computed by dividing net income or loss allocable to common stock holders by the weighted average number of common shares, including vested restricted share units, outstanding for the period. Diluted earnings per common share (Diluted EPS) reflects the potential dilution that could occur if securities or other contracts to issue common shares were exercised or converted into common shares where such exercise or conversion would result in a lower earnings per share amount.
The Company calculates EPS using the two‑class method, which is an earnings allocation formula that determines EPS for common shares and participating securities. Unvested share‑based payment awards that contain non-forfeitable rights to distributions or distribution equivalents (whether paid or unpaid) are participating securities and shall be included in the computation of EPS using the two‑class method. Accordingly, all earnings (distributed and undistributed) are allocated to common shares and participating securities based on their respective rights to receive distributions.
See Note 24—Earnings Per Share, for EPS computations.
Recent Accounting Standards
Recently Adopted Accounting Pronouncements
In August, 2014, the FASB issued ASU 2014-13,
Consolidation (Topic 810): Measuring the Financial Assets and the Financial Liabilities of a Consolidated Collateralized Financing Entity
. This pronouncement is effective for annual and interim periods after December 15, 2014, with early adoption permitted. ASU 2014-13 provides for a measurement alternative whereby a Company can measure both the financial assets and financial liabilities of its CLOs using the more observable of the fair value of the financial assets and the fair value of the financial liabilities. The Company has elected to early adopt this new accounting guidance as it pertains to the CLOs it consolidates and has elected to apply it retrospectively to all relevant prior periods. Please see Note 13—CLOs and Consolidated Variable Interest Entities, for more details.
Recently Issued Accounting Pronouncements
The following recently issued accounting standards are applicable to the Company and have not yet been implemented:
In April 2014, the FASB issued ASU 2014-08,
Presentation of Financial Statements (Topic 205) and Property, Plant and Equipment (Topic 360)-Reporting Discontinued Operations and Disclosures of Disposals of Components of an Entity.
These
amendments change the criteria for reporting discontinued operations while enhancing disclosures in this area. Under the
new guidance, only disposals representing a strategic shift in operations should be presented as discontinued operations. In
addition, the new guidance requires expanded disclosures about discontinued operations that will provide financial statement
F-21
TIPTREE FINANCIAL INC. AND SUBSIDIARIES
Notes to Consolidated Financial Statements
(in thousands, except shares and per share data)
December 31, 2014
users with more information. ASU 2014-08 is effective for the first quarter of 2015 for the Company, and the Company is
evaluating the effect upon its financial statements.
In May 2014, the FASB issued ASU 2014-09,
Revenue from Contracts with Customers (Topic 606).
The amendments in this standard affects any entity that either enters into contracts with customers to transfer goods and services or enters into contracts for the transfer of nonfinancial assets unless those contracts are within the scope of other standards. The core principle of the guidance is that an entity should recognize revenue to depict the transfer of goods or services to customers in an amount that reflects the consideration to which the entity expects to be entitled in exchange for those goods and services. This standard is effective for the Company January 1, 2017 and the Company is evaluating the effect upon its financial statements.
In June 2014, the FASB issued ASU 2014-10,
Development Stage Entities (Topic 915) - Elimination of Certain Financial Reporting Requirements, Including an Amendment to Variable Interest Entities Guidance in Topic 810, Consolidation.
The
amendments in ASU 2014-10 affect reporting entities that have interests in entities that are development stage entities as
there will be an elimination of the exception to the sufficiency-of-equity-at-risk criterion, allowing the reporting entities to
apply consistent guidance for transactions that are economically similar. The guidance applied will be the same for
determining whether an entity is a variable interest entity and whether the variable interest entity should be consolidated.
ASU 2014-10 is effective for the first quarter of 2015 for the Company, and the Company is evaluating the effect upon its
financial statements.
In June 2014, the FASB issued ASU 2014-12
Compensation - Stock Compensation (Topic 718) - Accounting for Share-Based Payments when the Terms of an Award Provide That a Performance Target Could Be Achieved after the Requisite Service Period.
The amendments require that a performance target that affects vesting and that could be achieved after the requisite service period be treated as a performance condition. ASU 2014-12 is effective for annual periods and interim periods within those annual periods beginning after December 15, 2015 for the Company and the Company is evaluating the effect upon its financial statements.
F-22
TIPTREE FINANCIAL INC. AND SUBSIDIARIES
Notes to Consolidated Financial Statements
(in thousands, except shares and per share data)
December 31, 2014
(3) Out of Period Adjustments, Changes in Accounting Principles and Reclassifications
Management is presenting these tables to provide a clear understanding of out of period adjustments, the adoption of accounting principles and reclassifications to the Company’s historical results for 2013.
We have revised our prior year financial statements for previously uncorrected misstatements that affected periods prior to 2013 through the third quarter of 2014. The corrections are immaterial to our financial statements for the period ended December 31, 2013. Accordingly, we have revised our previously issued financial statements within these consolidated financials as presented in the schedule below. The first revision, related to our real estate segment, affected the balance sheet by increasing intangible assets by
$7,240
, decreasing real estate by
$7,666
, increasing deferred tax assets for
$45
and decreasing equity by
$381
. This revision also affected the income statement by increasing depreciation and amortization expense by
$426
, decreasing provision for income taxes, and decreasing net income attributable to noncontrolling interest. The second correction, related to discontinued operations, affected the balance sheet by increasing assets held for sale by
$1,465
, increasing retained earnings by
$341
, and increasing non-controlling interest by
$1,124
. This revision also increased each of income from discontinued operations and net income attributable to noncontrolling interest.
In August 2014, ASU 2014-13,
Consolidation (Topic 810): Measuring the Financial Assets and the Financial Liabilities of a Consolidated Collateralized Financing Entity
was issued. Management believes this change in accounting principle is justified since the measurement approach prescribed by this new guidance will better align the consolidated CLO asset values with the consolidated CLO liability values. The Company has elected to measure both the financial assets and the financial liabilities of the CLOs using the more observable fair value measurement of the financial assets. As such, the notes payable of the CLOS are measured as (1) the sum of the fair value of the financial assets and the carrying value of any nonfinancial assets held temporarily, less (2) the sum of the fair value of any beneficial interests retained by the Company and the Company’s carrying value of any beneficial interests that represent compensation for services. The application of this new guidance results in adjustments to certain balances in the previously issued consolidated balance sheets, consolidated statements of operations, and consolidated statements of cash flows for the year ended December 31, 2013 as well as the interim periods ending March 31, 2014, June 30, 2014, and September 30, 2014. The effects of these adjustments are presented below by line item for the year ended December 31, 2013. In addition, the cumulative effect of the change in retained earnings and other components of equity is presented in the consolidated statements of stockholders’ equity.
Also presented as re-classifications are those items associated with PFG, which have been classified as held for sale as of December 31, 2014. Further, this transaction qualifies to be treated as discontinued operations (see Note 5—Dispositions, Assets Held for Sale and Discontinued Operations).
Certain prior period amounts have been reclassified to conform to the current year presentation. These amounts are identified under the reclassification heading in the tables below.
|
As of December 31, 2013
|
|||||||||||||||||||||||||||
|
As previously filed
|
Out of period adjustments
|
ASU-2014-13 adoption
|
Discontinued operations
|
Reclassifications
|
As adjusted
|
Notes
|
|||||||||||||||||||||
|
Assets
|
|||||||||||||||||||||||||||
|
Cash and cash equivalents – unrestricted
|
$
|
120,557
|
|
$
|
—
|
|
$
|
—
|
|
$
|
(22,912
|
)
|
$
|
—
|
|
$
|
97,645
|
|
|||||||||
|
Cash and cash equivalents – restricted
|
26,395
|
|
—
|
|
—
|
|
—
|
|
—
|
|
26,395
|
|
|||||||||||||||
|
Trading investments, at fair value
|
35,991
|
|
—
|
|
—
|
|
—
|
|
(35,991
|
)
|
—
|
|
(1
|
)
|
|||||||||||||
|
Trading assets, at fair value
|
—
|
|
—
|
|
—
|
|
—
|
|
35,991
|
|
35,991
|
|
(1
|
)
|
|||||||||||||
|
Investments in available for sale securities, at fair value
|
17,763
|
|
—
|
|
—
|
|
(17,763
|
)
|
—
|
|
—
|
|
|||||||||||||||
|
Investments in loans, at fair value
|
171,087
|
|
—
|
|
—
|
|
—
|
|
—
|
|
171,087
|
|
|||||||||||||||
|
Loans owned, at amortized cost – net of allowance
|
40,260
|
|
—
|
|
—
|
|
—
|
|
—
|
|
40,260
|
|
|||||||||||||||
F-23
TIPTREE FINANCIAL INC. AND SUBSIDIARIES
Notes to Consolidated Financial Statements
(in thousands, except shares and per share data)
December 31, 2014
|
As of December 31, 2013
|
|||||||||||||||||||||||||||
|
As previously filed
|
Out of period adjustments
|
ASU-2014-13 adoption
|
Discontinued operations
|
Reclassifications
|
As adjusted
|
Notes
|
|||||||||||||||||||||
|
Notes receivable, net
|
—
|
|
—
|
|
—
|
|
—
|
|
8,561
|
|
8,561
|
|
(1
|
)
|
|||||||||||||
|
Investments in partially-owned entities
|
9,972
|
|
—
|
|
—
|
|
—
|
|
—
|
|
9,972
|
|
|||||||||||||||
|
Real estate
|
105,061
|
|
(7,666
|
)
|
—
|
|
—
|
|
—
|
|
97,395
|
|
|||||||||||||||
|
Policy loans
|
102,147
|
|
—
|
|
—
|
|
(102,147
|
)
|
—
|
|
—
|
|
|||||||||||||||
|
Deferred tax assets
|
3,310
|
|
45
|
|
—
|
|
(382
|
)
|
—
|
|
2,973
|
|
(4
|
)
|
|||||||||||||
|
Intangible assets
|
154,695
|
|
7,240
|
|
—
|
|
(153,636
|
)
|
—
|
|
8,299
|
|
(4
|
)
|
|||||||||||||
|
Goodwill
|
4,294
|
|
—
|
|
—
|
|
(3,088
|
)
|
—
|
|
1,206
|
|
(4
|
)
|
|||||||||||||
|
Other assets
|
49,201
|
|
—
|
|
—
|
|
(24,235
|
)
|
(8,561
|
)
|
16,405
|
|
(1
|
)
|
|||||||||||||
|
Separate account assets
|
4,625,099
|
|
—
|
|
—
|
|
(4,625,099
|
)
|
—
|
|
—
|
|
|||||||||||||||
|
Assets of consolidated CLOs
|
1,414,616
|
|
—
|
|
(9,261
|
)
|
—
|
|
—
|
|
1,405,355
|
|
|||||||||||||||
|
Assets held for sale
|
—
|
|
1,465
|
|
—
|
|
4,949,262
|
|
—
|
|
4,950,727
|
|
(4
|
)
|
|||||||||||||
|
Total assets
|
$
|
6,880,448
|
|
|
$
|
1,084
|
|
$
|
(9,261
|
)
|
|
$
|
—
|
|
|
$
|
—
|
|
$
|
6,872,271
|
|
|
|||||
|
Liabilities and Stockholders’ Equity
|
|||||||||||||||||||||||||||
|
Liabilities:
|
|||||||||||||||||||||||||||
|
Derivative financial instruments, at fair value
|
$
|
598
|
|
$
|
—
|
|
$
|
—
|
|
$
|
—
|
|
$
|
(598
|
)
|
$
|
—
|
|
(1
|
)
|
|||||||
|
U.S. Treasuries, short position
|
18,493
|
|
—
|
|
—
|
|
—
|
|
(18,493
|
)
|
—
|
|
(1
|
)
|
|||||||||||||
|
Trading liabilities, at fair value
|
—
|
|
—
|
|
—
|
|
—
|
|
19,091
|
|
19,091
|
|
(1
|
)
|
|||||||||||||
|
Debt
|
360,609
|
|
—
|
|
—
|
|
(91,015
|
)
|
—
|
|
269,594
|
|
|||||||||||||||
|
Policy liabilities
|
112,358
|
|
—
|
|
—
|
|
(112,358
|
)
|
—
|
|
—
|
|
|||||||||||||||
|
Other liabilities and accrued expenses
|
21,829
|
|
—
|
|
9
|
|
(7,939
|
)
|
—
|
|
13,899
|
|
|||||||||||||||
|
Separate account liabilities
|
4,625,099
|
|
—
|
|
—
|
|
(4,625,099
|
)
|
—
|
|
—
|
|
|||||||||||||||
|
Liabilities of consolidated CLOs
|
1,175,606
|
|
—
|
|
160,774
|
|
—
|
|
—
|
|
1,336,380
|
|
|||||||||||||||
|
Liabilities of discontinued operations and held for sale
|
—
|
|
—
|
|
—
|
|
4,836,411
|
|
—
|
|
4,836,411
|
|
|||||||||||||||
|
Total liabilities
|
6,314,592
|
|
|
—
|
|
160,783
|
|
|
—
|
|
|
—
|
|
6,475,375
|
|
|
|||||||||||
|
Stockholders’ Equity:
|
|||||||||||||||||||||||||||
|
Preferred stock: $0.001 par value, 100,000,000 shares authorized, none issued or outstanding
|
—
|
|
—
|
|
—
|
|
—
|
|
—
|
|
—
|
|
|||||||||||||||
|
Common stock - Class A: $0.001 par value, 200,000,000 shares authorized, 10,556,390 shares issued and outstanding respectively
|
11
|
|
—
|
|
—
|
|
—
|
|
—
|
|
11
|
|
|||||||||||||||
F-24
TIPTREE FINANCIAL INC. AND SUBSIDIARIES
Notes to Consolidated Financial Statements
(in thousands, except shares and per share data)
December 31, 2014
|
As of December 31, 2013
|
|||||||||||||||||||||||||||
|
As previously filed
|
Out of period adjustments
|
ASU-2014-13 adoption
|
Discontinued operations
|
Reclassifications
|
As adjusted
|
Notes
|
|||||||||||||||||||||
|
Common stock - Class B: $0.001 par value, 50,000,000 shares authorized, 30,968,877 shares issued and outstanding respectively
|
31
|
|
—
|
|
—
|
|
—
|
|
—
|
|
31
|
|
|||||||||||||||
|
Additional paid-in capital
|
100,903
|
|
—
|
|
(17,088
|
)
|
—
|
|
—
|
|
83,815
|
|
|||||||||||||||
|
Accumulated other comprehensive income
|
33
|
|
—
|
|
—
|
|
—
|
|
—
|
|
33
|
|
|||||||||||||||
|
Retained earnings
|
18,933
|
|
302
|
|
(4,146
|
)
|
—
|
|
—
|
|
15,089
|
|
(4
|
)
|
|||||||||||||
|
Total stockholders’ equity of Tiptree Financial Inc.
|
119,911
|
|
302
|
|
(21,234
|
)
|
—
|
|
—
|
|
98,979
|
|
(4
|
)
|
|||||||||||||
|
Non-controlling interest
|
361,354
|
|
782
|
|
(64,219
|
)
|
—
|
|
—
|
|
297,917
|
|
(4
|
)
|
|||||||||||||
|
Appropriated retained earnings of consolidated TAMCO
|
84,591
|
|
—
|
|
(84,591
|
)
|
—
|
|
—
|
|
—
|
|
|||||||||||||||
|
Total stockholders’ equity
|
565,856
|
|
1,084
|
|
(170,044
|
)
|
—
|
|
—
|
|
396,896
|
|
|||||||||||||||
|
Total liabilities and stockholders’ equity
|
$
|
6,880,448
|
|
$
|
1,084
|
|
$
|
(9,261
|
)
|
$
|
—
|
|
$
|
—
|
|
$
|
6,872,271
|
|
|||||||||
|
For the year ended December 31, 2013
|
|||||||||||||||||||||||||||
|
As previously filed
|
Out of period adjustments
|
ASU 2014-13 adoption
|
Discontinued Operations
|
Reclassifications
|
As adjusted
|
Notes
|
|||||||||||||||||||||
|
Revenues:
|
|||||||||||||||||||||||||||
|
Net realized (loss) gain on investments
|
$
|
(833
|
)
|
$
|
—
|
|
$
|
—
|
|
$
|
(83
|
)
|
$
|
916
|
|
$
|
—
|
|
|||||||||
|
Change in unrealized appreciation on investments
|
2,971
|
|
—
|
|
—
|
|
—
|
|
(2,971
|
)
|
—
|
|
|||||||||||||||
|
Income from investments in partially owned entities
|
3,250
|
|
—
|
|
—
|
|
—
|
|
(3,250
|
)
|
—
|
|
|||||||||||||||
|
Net realized and unrealized gains
|
5,388
|
|
—
|
|
—
|
|
(83
|
)
|
(5,305
|
)
|
—
|
|
|||||||||||||||
|
Investment income:
|
|||||||||||||||||||||||||||
|
Net realized and unrealized gains from investments
|
—
|
|
—
|
|
—
|
|
—
|
|
6,887
|
|
6,887
|
|
(2), (3)
|
|
|||||||||||||
|
Interest income
|
16,477
|
|
—
|
|
—
|
|
(4,946
|
)
|
119
|
|
11,650
|
|
(1
|
)
|
|||||||||||||
|
Net Credit derivative revenue (loss)
|
—
|
|
—
|
|
—
|
|
—
|
|
(1,828
|
)
|
(1,828
|
)
|
(3
|
)
|
|||||||||||||
|
Separate account fees
|
22,248
|
|
—
|
|
—
|
|
(22,248
|
)
|
—
|
|
—
|
|
|||||||||||||||
|
Administrative service fees
|
49,489
|
|
—
|
|
—
|
|
(49,489
|
)
|
—
|
|
—
|
|
|||||||||||||||
|
Loan fee income
|
—
|
|
—
|
|
—
|
|
—
|
|
459
|
|
459
|
|
(1
|
)
|
|||||||||||||
|
Rental revenue
|
5,760
|
|
—
|
|
—
|
|
—
|
|
—
|
|
5,760
|
|
|||||||||||||||
|
Other income
|
1,545
|
|
—
|
|
—
|
|
(6
|
)
|
(724
|
)
|
815
|
|
(1
|
)
|
|||||||||||||
|
Total investment income
|
95,519
|
|
—
|
|
—
|
|
(76,689
|
)
|
4,913
|
|
23,743
|
|
|||||||||||||||
|
Total net realized and unrealized gains and investment income
|
100,907
|
|
—
|
|
—
|
|
(76,772
|
)
|
(392
|
)
|
23,743
|
|
|||||||||||||||
F-25
TIPTREE FINANCIAL INC. AND SUBSIDIARIES
Notes to Consolidated Financial Statements
(in thousands, except shares and per share data)
December 31, 2014
|
For the year ended December 31, 2013
|
|||||||||||||||||||||||||||
|
As previously filed
|
Out of period adjustments
|
ASU 2014-13 adoption
|
Discontinued Operations
|
Reclassifications
|
As adjusted
|
Notes
|
|||||||||||||||||||||
|
Total revenue
|
100,907
|
|
—
|
|
—
|
|
(76,772
|
)
|
(392
|
)
|
23,743
|
|
|||||||||||||||
|
Expenses:
|
|||||||||||||||||||||||||||
|
Interest expense
|
17,517
|
|
—
|
|
—
|
|
(12,430
|
)
|
(222
|
)
|
4,865
|
|
(3
|
)
|
|||||||||||||
|
Payroll expense
|
35,552
|
|
—
|
|
—
|
|
(18,819
|
)
|
8
|
|
16,741
|
|
(1
|
)
|
|||||||||||||
|
Professional fees
|
8,555
|
|
—
|
|
—
|
|
(1,858
|
)
|
440
|
|
7,137
|
|
(1
|
)
|
|||||||||||||
|
Change in future policy benefits
|
4,710
|
|
—
|
|
—
|
|
(4,710
|
)
|
—
|
|
—
|
|
|||||||||||||||
|
Mortality expenses
|
10,476
|
|
—
|
|
—
|
|
(10,476
|
)
|
—
|
|
—
|
|
|||||||||||||||
|
Commission expense
|
2,344
|
|
—
|
|
—
|
|
(2,344
|
)
|
—
|
|
—
|
|
|||||||||||||||
|
Depreciation and amortization expenses
|
4,467
|
|
426
|
|
—
|
|
(2,997
|
)
|
92
|
|
1,988
|
|
(4), (1)
|
|
|||||||||||||
|
Other expenses
|
15,456
|
|
—
|
|
—
|
|
(9,136
|
)
|
(710
|
)
|
5,610
|
|
(1
|
)
|
|||||||||||||
|
Total expenses
|
99,077
|
|
426
|
|
—
|
|
(62,770
|
)
|
(392
|
)
|
36,341
|
|
|||||||||||||||
|
Net income before taxes and income attributable to consolidated CLOs from continuing operations
|
1,830
|
|
|
(426
|
)
|
|
—
|
|
|
(14,002
|
)
|
|
—
|
|
|
(12,598
|
)
|
||||||||||
|
Results of consolidated CLOs:
|
|||||||||||||||||||||||||||
|
Income attributable to consolidated CLOs
|
52,687
|
|
—
|
|
8,492
|
|
—
|
|
—
|
|
61,179
|
|
|||||||||||||||
|
Expenses attributable to consolidated CLOs
|
48,268
|
|
—
|
|
(15,954
|
)
|
—
|
|
—
|
|
32,314
|
|
|||||||||||||||
|
Net Income attributable to consolidated CLOs
|
4,419
|
|
—
|
|
24,446
|
|
—
|
|
—
|
|
28,865
|
|
|||||||||||||||
|
Income before taxes from continuing operations
|
6,249
|
|
|
(426
|
)
|
|
24,446
|
|
|
(14,002
|
)
|
|
—
|
|
|
16,267
|
|
||||||||||
|
Provision for income taxes
|
6,941
|
|
(45
|
)
|
—
|
|
(6,336
|
)
|
—
|
|
560
|
|
(4
|
)
|
|||||||||||||
|
(Loss) income from continuing operations
|
(692
|
)
|
(381
|
)
|
24,446
|
|
(7,666
|
)
|
—
|
|
15,707
|
|
|
||||||||||||||
|
Discontinued operations:
|
|||||||||||||||||||||||||||
|
Gain (loss)on sale of discontinued operations, net
|
15,463
|
|
—
|
|
—
|
|
—
|
|
—
|
|
15,463
|
|
|||||||||||||||
|
Income from discontinued operations, net
|
1,647
|
|
246
|
|
—
|
|
7,666
|
|
—
|
|
9,559
|
|
(4
|
)
|
|||||||||||||
|
Discontinued operations, net
|
17,110
|
|
246
|
|
—
|
|
7,666
|
|
—
|
|
25,022
|
|
|||||||||||||||
|
Net income before noncontrolling interest
|
16,418
|
|
(135
|
)
|
24,446
|
|
—
|
|
—
|
|
40,729
|
|
|||||||||||||||
|
Less net income attributable to noncontrolling interest
|
25,617
|
|
(153
|
)
|
4,872
|
|
—
|
|
—
|
|
30,336
|
|
(4
|
)
|
|||||||||||||
|
Less net (loss) income attributable to VIE subordinated noteholders
|
(18,044
|
)
|
—
|
|
18,044
|
|
—
|
|
—
|
|
—
|
|
|||||||||||||||
F-26
TIPTREE FINANCIAL INC. AND SUBSIDIARIES
Notes to Consolidated Financial Statements
(in thousands, except shares and per share data)
December 31, 2014
|
For the year ended December 31, 2013
|
|||||||||||||||||||||||||||
|
As previously filed
|
Out of period adjustments
|
ASU 2014-13 adoption
|
Discontinued Operations
|
Reclassifications
|
As adjusted
|
Notes
|
|||||||||||||||||||||
|
Net income available to common stockholders
|
$
|
8,845
|
|
|
$
|
18
|
|
|
$
|
1,530
|
|
|
$
|
—
|
|
|
$
|
—
|
|
|
$
|
10,393
|
|
||||
|
Basic, continuing operations, net
|
$
|
(0.81
|
)
|
$
|
—
|
|
$
|
0.16
|
|
$
|
(0.75
|
)
|
$
|
1.81
|
|
$
|
0.41
|
|
|||||||||
|
Basic, discontinued operations, net
|
1.67
|
|
—
|
|
—
|
|
0.75
|
|
(1.82
|
)
|
0.60
|
|
|||||||||||||||
|
Net income basic
|
$
|
0.86
|
|
$
|
—
|
|
$
|
0.16
|
|
$
|
—
|
|
$
|
(0.01
|
)
|
$
|
1.01
|
|
|||||||||
|
Diluted, continuing operations, net
|
$
|
(0.81
|
)
|
$
|
—
|
|
$
|
0.16
|
|
$
|
(0.75
|
)
|
$
|
1.81
|
|
$
|
0.41
|
|
|||||||||
|
Diluted, discontinued operations, net
|
1.67
|
|
—
|
|
—
|
|
0.75
|
|
(1.82
|
)
|
0.60
|
|
|||||||||||||||
|
Net income, diluted
|
$
|
0.86
|
|
$
|
—
|
|
$
|
0.16
|
|
$
|
—
|
|
$
|
(0.01
|
)
|
$
|
1.01
|
|
|||||||||
Notes:
(1) Prior period information reclassified to conform to the current year presentation.
(2) Collapse of line items presented individually in 2013.
(3) Net credit derivative income (loss) associated with master netting agreement (see Note 14—Derivative Financial Instruments).
(4) Adjustment relates to out of period adjustments.
(4)
Business Acquisitions
In accordance with ASC Topic 805, “Business Combinations”, the Company accounts for acquisitions by applying the acquisition method of accounting. The acquisition method requires, among other things, that the assets acquired and liabilities assumed in a business combination be measured at fair value as of the closing date of the acquisition.
Fortegra Financial Corporation
In December 2014, the Company completed the acquisition of Fortegra, paying
$211,740
for
100%
ownership. Fortegra’s products include payment protection products, motor club memberships, service contracts, device and warranty services, as well as administration services to business partners, including insurance companies, retailers, dealers, insurance brokers and agents and financial services companies. For disclosure purposes this transaction is considered a significant acquisition and as such the Company is providing enhanced disclosures. The primary reason for the Company’s acquisition of Fortegra is to expand its insurance and insurance services operations.
Fortegra’s results will be included in the Company’s insurance and insurance services segment. The Company did not issue shares of its common stock in connection with the acquisition of Fortegra.
Actual and Pro Forma Impact of Acquisition
The financial results of Fortegra have been included in the Company's results as of the acquisition date of December 4, 2014. The following table presents the actual revenue and net income for the Fortegra acquisition included in the Company's Consolidated Statements of Operations for the year ended December 31, 2014:
|
Total
|
|||
|
Total revenue
|
$
|
26,174
|
|
|
Net income from continuing operations *
|
$
|
1,461
|
|
|
* Includes acquisition costs of:
|
$
|
272
|
|
The following unaudited supplemental pro forma information as of December 31, 2014 and 2013 in the table below presents the Company's consolidated financial information as if Fortegra had been acquired on January 1, 2013. The unaudited
F-27
TIPTREE FINANCIAL INC. AND SUBSIDIARIES
Notes to Consolidated Financial Statements
(in thousands, except shares and per share data)
December 31, 2014
supplemental pro forma results were prepared for comparative purposes only and do not purport to be indicative of the results of operations which may have actually resulted had the acquisition of Fortegra occurred at January 1, 2013, nor is it indicative of any future operating results of the Company.
|
Unaudited Pro Forma
|
|||||||
|
Consolidated Results for the
|
|||||||
|
Years Ended December 31,
|
|||||||
|
2014
|
2013
|
||||||
|
Total revenue
|
$
|
463,143
|
|
$
|
349,043
|
|
|
|
Net income from continuing operations
|
$
|
12,723
|
|
$
|
(1,454
|
)
|
|
|
Diluted earnings per share from continuing operations
|
$
|
0.76
|
|
$
|
(0.14
|
)
|
|
The amounts in the unaudited supplemental pro forma results in the above table have been calculated after applying the Company's accounting policies and adjusting the results of the acquired company to reflect certain adjustments. The unaudited supplemental pro forma consolidated results reflect the historical financial information of the Company and Fortegra, adjusted for discontinued operations from PFG and the effect of change in accounting principle in 2013 (see Note 3 -Out of Period Adjustments, Change in Accounting Principles and Re-classifications. The unaudited pro forma results are adjusted for the following pre-tax amounts:
•
There were no adjustments made to net realized gains for the year ended December 31, 2014. Net realized gains decreased by
$2,646
for the year ended December 31, 2013 for the revision of investment cost basis to market value as of the assumed acquisition date, affecting the calculation of realized gain or loss on subsequent sales of investments held.
•
Administrative service fees decreased by
$6,733
and
$19,921
for the years ending December 31, 2014 and 2013, respectively, related to the downward adjustment of deferred revenue from book value to fair value for the liability assumed on the January 1, 2013 acquisition date. This reduction results in a decrease in revenue to be earned over the period.
•
Interest expense increased
$4,090
and
$4,248
for the years ending December 31, 2014 and 2013, respectively, attributable to the carrying of an additional
$120,000
in debt under the Credit Agreement, reduced quarterly by
$1,250
mandatory principal payments, using an estimated annual interest rate of 3.16%. In addition, interest expense included
$515
for each of the years ending December 31, 2014 and 2013, respectively, of annual amortization of deferred loan origination costs. The Credit Agreement provides for variable interest; a 1/8
th
percentage point change in the interest rate would have resulted in an adjustment to pre-tax income of approximately
$141
and
$148
for the years ending December 31, 2014 and 2013, respectively.
•
Payroll decreased by
$611
and
$823
for the years ending December 31, 2014 and 2013, respectively, to reflect the elimination of historically recognized Fortegra stock based compensation expense.
•
Commission expense decreased by
$14,605
and
$52,387
for the years ending December 31, 2014 and 2013, respectively, as a result of the elimination of deferred acquisition costs assumed on the January 1, 2013 acquisition date. This elimination results in no commission expense to be amortized into the income statement for the policies and memberships in effect as of the acquisition date.
•
Depreciation and amortization decreased by
$2,769
and increased by
$28,502
for the years ending December 31, 2014 and 2013, respectively, to reflect the amortization of intangibles and depreciation of capitalized assets acquired.
•
Other expenses decreased by
$3,592
and
$6,694
for the years ending December 31, 2014 and 2013 respectively, adjustment reflects the elimination of changes in deferred premium taxes and deferred administrative costs, a direct result of the elimination of deferred costs assumed on January 1, 2013 and the elimination of director fees and stock based compensation for Fortegra’s directors due to the elimination of these director positions as the result of the acquisition.
•
For the year ended December 31, 2014, the Company adjusted supplemental proforma earnings by
$8,895
to exclude acquisition related costs.
F-28
TIPTREE FINANCIAL INC. AND SUBSIDIARIES
Notes to Consolidated Financial Statements
(in thousands, except shares and per share data)
December 31, 2014
Recording of the Preliminary Value of Assets Acquired and Liabilities Assumed
Total consideration for the acquisition of Fortegra was funded through parent's cash on hand of
$91,740
and borrowings of
$120,000
. The purchase price of Fortegra was largely determined on the basis of management’s expectations of future earnings and cash flows, resulting in the recognition of goodwill. The preliminary purchase price allocation below has been developed based on preliminary estimates of fair value using the historical financial statements of Fortegra as of the acquisition date. In addition, the allocation of the purchase price to intangible assets is based on preliminary fair value estimates and subject to the completion of management’s final analysis.
Management’s preliminary allocation of the purchase price to the net assets acquired resulted in the recording of intangible assets. Because valuations of acquired assets and liabilities are still in process, information may become available within the measurement period which may or may not change these valuations and, accordingly, the purchase price allocation is subject to adjustment. The residual amount of the purchase price after preliminary allocation to net assets acquired and identifiable intangibles has been allocated to goodwill. This goodwill is included in the insurance and insurance services segment.
The following table presents the preliminary determination of the fair value amounts for the identifiable assets acquired, liabilities assumed, and goodwill recorded as of the acquisition date of Fortegra:
|
Preliminary Fair Values
|
|||
|
Assets:
|
|||
|
Cash and cash equivalents – unrestricted
|
$
|
24,906
|
|
|
Cash and cash equivalents – restricted
|
6,693
|
|
|
|
Investments in available for sale securities, at fair value
|
166,839
|
|
|
|
Notes receivable, net
|
17,775
|
|
|
|
Accounts and premiums receivable, net
|
40,762
|
|
|
|
Reinsurance receivables
|
248,959
|
|
|
|
Other assets
|
49,918
|
|
|
|
Intangible assets
|
114,500
|
|
|
|
Liabilities:
|
|||
|
Debt
|
43,548
|
|
|
|
Unearned premiums
|
290,029
|
|
|
|
Policy liabilities
|
63,435
|
|
|
|
Deferred revenue
|
39,122
|
|
|
|
Deferred tax liability
|
37,921
|
|
|
|
Other liabilities and accrued expenses
(1)
|
71,644
|
|
|
|
Net assets acquired
|
124,653
|
|
|
|
Non-controlling interests
|
(6,355
|
)
|
|
|
Goodwill
|
93,442
|
|
|
|
$
|
211,740
|
|
|
|
Consideration:
|
|||
|
Cash
|
91,740
|
|
|
|
Debt
|
120,000
|
|
|
|
Total consideration paid
|
$
|
211,740
|
|
(1)
Includes
$809
of unsettled liabilities associated with Fortegra’s previous discontinued operations, which is included as a component of liabilities held for sale and discontinued operations within the Company’s consolidated balance sheet.
As of the acquisition date, the fair values of notes receivable, accounts and premiums receivable, and reinsurance receivables approximated their book values. The gross contractual amounts for notes receivable totaled
$19,957
and
$41,170
for accounts and premiums receivable. The Company estimates that contractual amounts receivable of
$1,957
of notes receivable and
$408
of accounts and premiums receivable may not be collected.
F-29
TIPTREE FINANCIAL INC. AND SUBSIDIARIES
Notes to Consolidated Financial Statements
(in thousands, except shares and per share data)
December 31, 2014
The following table shows the preliminary values recorded by the Company, as of the acquisition date, for finite-lived intangible assets, included in the insurance and insurance services segment, and the range of their estimated amortization period associated with the Fortegra acquisition:
|
Weighted Average Amortization Period (in Years)
|
Gross Carrying Amount
|
||||||
|
Customer relationships
|
8.2
|
$
|
50,500
|
|
|||
|
Trade names
|
6.6
|
6,000
|
|
||||
|
Software
|
5.0
|
8,500
|
|
||||
|
Value of business acquired
|
2.2
|
36,500
|
|
||||
|
Total acquired finite-lived other intangible assets
|
5.7
|
$
|
101,500
|
|
|||
The following table shows the preliminary values recorded by the Company, as of the acquisition date, for indefinite-lived intangible assets included in the Insurance and Insurance Services segment, not subject to amortization, associated with the Fortegra acquisition:
|
Total
|
|||
|
Insurance licenses
|
$
|
13,000
|
|
Tax Deductible Goodwill Associated with the Fortegra Acquisition
The acquisition of Fortegra is being treated as a stock purchase for tax purposes and any goodwill and identified intangible assets recorded by the Company in connection with the acquisition will not be deductible for tax purposes.
Luxury Mortgage Corporation
The Company completed the acquisition of
67.5%
of Luxury in January 2014; therefore, Luxury’s financials are consolidated within the Company’s financial statements beginning with the first quarter of 2014 and reported in Tiptree’s specialty finance segment. The primary reason for the Company’s acquisition of a controlling interest in Luxury is to enter the mortgage origination business. Management has completed an assessment of the allocation of the fair value of the assets acquired and liabilities assumed from the Luxury acquisition in accordance with ASC 805,
Business Combinations
.
F-30
TIPTREE FINANCIAL INC. AND SUBSIDIARIES
Notes to Consolidated Financial Statements
(in thousands, except shares and per share data)
December 31, 2014
The following table presents the final determination of fair value amounts for the identifiable assets acquired, liabilities assumed, and goodwill recorded for Luxury:
|
(in thousands)
|
|||
|
Assets:
|
|||
|
Cash
|
$
|
7,213
|
|
|
Mortgages held for sale
|
21,845
|
|
|
|
Property, plant and equipment
|
1,536
|
|
|
|
Other assets
|
1,111
|
|
|
|
Liabilities:
|
|||
|
Warehouse line of credit
|
20,604
|
|
|
|
Subordinated Debt
|
5,000
|
|
|
|
Other liabilities
|
1,735
|
|
|
|
Net assets acquired
|
4,366
|
|
|
|
Removal of deferred financing costs
|
(428
|
)
|
|
|
|
|||
|
Liability adjustment selling shareholder note
|
(1,686
|
)
|
|
|
Present value of 50% of management contract
|
(1,036
|
)
|
|
|
Luxury adjusted net assets
|
1,216
|
|
|
|
Goodwill
|
699
|
|
|
|
$
|
1,915
|
|
|
|
Consideration Paid:
|
|||
|
Purchase of preferred stock
|
1,519
|
|
|
|
Fair value of NCI component
|
396
|
|
|
|
Total consideration paid
|
$
|
1,915
|
|
The fair value of the NCI component was calculated by determining the fair value of Luxury’s tangible net assets on the acquisition date and multiplying it by the NCI’s proportional ownership in Luxury of
32.5%
.
Tax Deductible Goodwill Associated with the Luxury Acquisition
The acquisition of Luxury is being treated as a stock purchase for tax purposes and goodwill recorded by the Company in connection with the acquisition will not be deductible for tax purposes.
(5) Dispositions, Assets Held for Sale and Discontinued Operations
The Company has classified its PFG subsidiary as held for sale as of December 31, 2014 as the transaction meets all the requirements to be classified in this manner according to ASC 360 -
Property, Plant and Equipment
. This transaction is described in further detail in Note 2—Summary of Significant Accounting Policies. The pending sale of PFG further meets the requirements of ASC 205-
Presentation of Financial Statements
to be classified as discontinued operations. The Company has as a result reclassified the income and expense attributable to PFG to income from discontinued operations, net for the years ended December 31, 2014 and 2013.
F-31
TIPTREE FINANCIAL INC. AND SUBSIDIARIES
Notes to Consolidated Financial Statements
(in thousands, except shares and per share data)
December 31, 2014
The following table represents detail of the assets and liabilities of PFG categorized as held for sale on the Company’s consolidated balance sheets:
|
As of December 31,
|
|||||||
|
2014
|
2013
|
||||||
|
Assets:
|
|||||||
|
Cash and cash equivalents - unrestricted
|
$
|
28,361
|
|
$
|
22,912
|
|
|
|
Investments in available for sale securities, at fair value
|
17,409
|
|
17,763
|
|
|||
|
Policy loans
|
99,102
|
|
102,147
|
|
|||
|
Intangible assets
|
149,932
|
|
153,636
|
|
|||
|
Goodwill
|
3,088
|
|
3,088
|
|
|||
|
Other assets
|
22,982
|
|
16,940
|
|
|||
|
Separate account assets
|
4,799,429
|
|
4,625,099
|
|
|||
|
Reinsurance receivables
|
9,442
|
|
9,142
|
|
|||
|
Total assets held for sale
|
$
|
5,129,745
|
|
|
$
|
4,950,727
|
|
|
Liabilities:
|
|||||||
|
Debt
|
$
|
83,348
|
|
$
|
91,015
|
|
|
|
Policy liabilities
|
108,455
|
|
112,358
|
|
|||
|
Deferred tax liabilities
|
801
|
|
—
|
|
|||
|
Other liabilities and accrued expenses
|
14,060
|
|
7,938
|
|
|||
|
Separate account liabilities
|
4,799,429
|
|
4,625,099
|
|
|||
|
Total liabilities held for sale
|
$
|
5,006,093
|
|
$
|
4,836,410
|
|
|
The Company has reclassified income and expenses from discontinued operations related to the PFG transaction and the sale of the Bickford property. Expenses related to Bickford include an allocation of interest expense based on property carrying values and cost of debt. The following table represents detail revenues and expenses of discontinued operations in the consolidated statements of operations for the periods presented:
|
Year Ended December 31,
|
||||||||||||
|
2014
|
2013
|
|||||||||||
|
PFG
|
PFG
|
Bickford
|
||||||||||
|
Revenues:
|
||||||||||||
|
Net realized gain on investments
|
$
|
45
|
|
$
|
83
|
|
$
|
—
|
|
|||
|
Interest income
|
4,649
|
|
4,946
|
|
—
|
|
||||||
|
Separate account fees
|
23,390
|
|
22,248
|
|
—
|
|
||||||
|
Administrative service fees
|
50,600
|
|
49,489
|
|
—
|
|
||||||
|
Rental revenue reimbursable income
|
—
|
|
—
|
|
5,920
|
|
||||||
|
Reimbursable income
|
—
|
|
—
|
|
655
|
|
||||||
|
Other income
|
2
|
|
6
|
|
—
|
|
||||||
|
Total Revenues
|
78,686
|
|
|
76,772
|
|
6,575
|
|
|||||
|
Expenses:
|
||||||||||||
|
Reimbursable expense
|
—
|
|
—
|
|
550
|
|
||||||
|
Interest expense
|
11,475
|
|
12,430
|
|
2,627
|
|
||||||
|
Payroll expense
|
19,697
|
|
18,819
|
|
—
|
|
||||||
|
Professional fees
|
1,800
|
|
1,858
|
|
—
|
|
||||||
|
Change in future policy benefits
|
4,363
|
|
4,710
|
|
—
|
|
||||||
|
Mortality expenses
|
10,710
|
|
10,476
|
|
—
|
|
||||||
|
Commission expense
|
2,825
|
|
2,344
|
|
—
|
|
||||||
|
Depreciation and amortization expenses
|
4,379
|
|
2,997
|
|
1,708
|
|
||||||
|
Other expenses
|
9,975
|
|
9,136
|
|
43
|
|
||||||
|
Total expenses
|
65,224
|
|
|
62,770
|
|
|
4,928
|
|
||||
|
Non-controlling interest associated with discontinued operations
|
—
|
|
—
|
|
||||||||
|
Less: Provision for income taxes
|
5,525
|
|
6,090
|
|
—
|
|
||||||
|
Income from discontinued operations, net
|
$
|
7,937
|
|
|
$
|
7,912
|
|
|
$
|
1,647
|
|
|
F-32
TIPTREE FINANCIAL INC. AND SUBSIDIARIES
Notes to Consolidated Financial Statements
(in thousands, except shares and per share data)
December 31, 2014
Refer to Note 17—Fair Value of Financial Instruments, for information regarding the leveling of assets and liabilities held for sale.
Available for sale securities associated with assets held for sale of
$17,409
, had an amortized cost of
$17,154
as of December 31, 2014. These securities had unrealized gains of
$285
and unrealized losses of
$30
. There were
twenty-four
securities that were in an unrealized loss position for more than one year with a fair value of
$2,828
, an amortized cost of
$2,843
and associated unrealized losses of
$15
as of December 31, 2014.
Debt associated with liabilities held for sale was
$83,348
. This debt carries a weighted average interest rate of
12.66%
and matures on
July 13, 2022
. During the years ended December 31, 2014 and 2013, interest expense of
$11,475
and
$12,430
was recorded, respectively.
The following table represents cash flows from discontinued operations for the periods indicated:
|
Year ended December 31,
|
|||||||
|
|
2014
|
2013
|
|||||
|
Cash Flows from:
|
|||||||
|
Operating activities
|
16,045
|
|
18,471
|
|
|||
|
Investing activities
|
(2,929
|
)
|
(5,539
|
)
|
|||
|
Financing activities
|
(7,667
|
)
|
(6,902
|
)
|
|||
|
Net cash flows
|
$
|
5,449
|
|
$
|
6,030
|
|
|
The absence of cash flows from discontinued operations, on a going forward basis, is not expected to have a material impact upon the Company’s future liquidity and capital resources as the acquisition of Fortegra is expected to provide future liquidity.
As of December 31, 2014, the Company has
$809
classified as liabilities from discontinued operations associated with Fortegra’s dispositions as of December 31, 2013.
(6) Operating Segment Data
During the year ended December 31, 2014, management changed its reportable operating segments. The Company now has
five
reportable operating segments. The Company’s five operating segments are: insurance and insurance services, specialty finance, asset management, real estate and our corporate and other segment. The Company’s operating segments are organized in a manner that reflects how management views these strategic business units.
The principal changes made to the operating segments in 2014 are summarized below:
|
•
|
Fortegra, which was acquired in December, 2014, was added to the insurance and insurance services segment. In October 2014, the Company entered into an agreement to sell PFG. Accordingly, the results of the Company’s PFG subsidiary, which had previously been presented in the Insurance and Insurance Services segment have been reclassified as discontinued operations for 2013 and 2014.
|
|
•
|
Luxury, a mortgage loan originator, which the Company acquired in January, 2014, was incorporated in the specialty finance segment. The Company had previously included Tiptree Direct and MFCA in the specialty finance segment, The results of Tiptree Direct and MFCA are now included in the corporate and other segment.
|
|
•
|
The real estate segment previously included investments in Star Asia entities. These investments are now reported in the corporate and other segment. The net income attributable to consolidated CLOs has been allocated to the asset management segment (representing the fees earned from the management of CLOs) and to the corporate and other segment (representing the distributions earned on the CLO subordinated notes and interest-only positions held by the Company and realized and unrealized gains and losses on such debt and positions). The expenses the Company incurs in connection with the management of the CLOs have also been allocated to the asset management segment. For further discussion of the Company’s interests in the CLOs its manages, please refer to Note 13—CLOs and Consolidated Variable Interest Entities, in the accompanying consolidated financial statements.
|
F-33
TIPTREE FINANCIAL INC. AND SUBSIDIARIES
Notes to Consolidated Financial Statements
(in thousands, except shares and per share data)
December 31, 2014
Each reportable segment’s profit/(loss) is reported before income taxes, discontinued operations and non-controlling interests. Intersegment revenue and expense relate to interest paid and received on loans and interest rate swaps between segments.
Descriptions of each of the reportable segments are as follows:
Insurance and Insurance Services
operations are conducted through a wholly owned subsidiary, Fortegra, which the Company acquired on December 4, 2014. Fortegra is a specialized insurance company that offers a wide array of consumer related protection products, including credit-related insurance, mobile device protection, and warranty and service contracts. Fortegra also provides third party administration services to insurance companies, retailers, automobile dealers, insurance brokers and agents and financial services companies.
For Insurance and Insurance Services, the main drivers of revenue are earned premiums, net and service and administrative fees.
For the period ended December 31, 2014, the Company incurred
$6,121
of charges, including consultancy fees and accelerated stock vesting costs, in connection with the Company’s purchase of Fortegra and which are not expected to recur. These charges have been included in the insurance and insurance services segment results.
Specialty Finance
is comprised of Siena, which commenced operations in April 2013, and Luxury, which was acquired in January 2014. Segment results incorporate the revenues and expenses of these subsidiaries since they commenced operations or were acquired.
Siena’s business consists of structuring asset-based loan facilities across diversified industries which include manufacturing, distribution, wholesale, and service companies. Luxury is a residential mortgage lender that originates loans, primarily FHA, prime jumbo and super jumbo mortgages for sale to institutional investors.
For Specialty Finance, the main drivers of revenue are gain on the sale of loans held for sale, net, loan fees earned and investment interest.
Asset Management
operations primarily comprise Telos Asset Management’s (TLAM) management of CLOs and Muni Capital Management’s (MCM) management of Non-Profit Preferred Funding Trust I (NPPF I). Both TLAM and MCM are subsidiaries of TAMCO, an SEC-registered investment advisor owned by the Company. NPPF I is a structured tax-exempt pass-through entity that holds tax-exempt bonds for the benefit of unaffiliated investors
The asset management segment generates fee income from the CLOs under management and from its management of NPPF I, a portfolio of tax-exempt securities owned by third-party investors.
Real Estate
operations include Care LLC, a wholly-owned subsidiary of Tiptree which has a geographically diverse portfolio of seniors housing properties including assisted-living, independent-living, memory care and skilled nursing in the U.S.
Revenue for this segment includes largely rental revenue and investment interest.
Corporate and other
operations include Tiptree Direct and MFCA. Tiptree Direct holds the Company’s principal investments, which consist of CLO subordinated notes, risk mitigation transactions, warehouse holdings, holdings in the Star Asia entities and other corporate investments. MFCA is a specialty finance company that owns and manages a portfolio of non-investment grade and non-rated direct and indirect debt obligations of middle-market tax-exempt borrowers.
For corporate and other, the main drivers of revenue include investment interest, net realized and unrealized gains on investments, distributions earned on the subordinated CLO debt and interest-only positions held by the Company and realized and unrealized gains and losses on such debt and positions.
The tabular information that follows shows components of revenue, expense, and profit or loss, for each of the operating segments for the years ended December 31, 2014 and 2013 and total assets as of December 31, 2014 and 2013.
Intersegment revenues/expenses refers to those items of revenue/expense which are eliminated upon consolidation. Intersegment revenue and expense between the specialty finance segment and corporate and other segment largely relate to interest paid and received on subordinated debt and interest-only positions. Management made estimates to allocate a
F-34
TIPTREE FINANCIAL INC. AND SUBSIDIARIES
Notes to Consolidated Financial Statements
(in thousands, except shares and per share data)
December 31, 2014
proportionate share of MCM’s expenses to the asset management segment relating to its management of NPPF I. The remaining expenses not allocated are related to MFCA and have been allocated to the corporate and other segment.
|
Year ended December 31, 2014
|
|||||||||||||||||||||||
|
Insurance and insurance services
|
Specialty finance
|
Asset management
|
Real estate
|
Corporate and other
|
Totals
|
||||||||||||||||||
|
Net realized and unrealized gains on investments
|
$
|
5
|
|
$
|
664
|
|
$
|
—
|
|
$
|
7,006
|
|
$
|
1,286
|
|
$
|
8,961
|
|
|||||
|
Interest income
|
196
|
|
3,611
|
|
—
|
|
1,529
|
|
9,509
|
|
14,845
|
|
|||||||||||
|
Net credit derivative loss
|
—
|
|
—
|
|
—
|
|
—
|
|
(1,606
|
)
|
(1,606
|
)
|
|||||||||||
|
Service and administrative fees
|
8,657
|
|
—
|
|
—
|
|
—
|
|
—
|
|
8,657
|
|
|||||||||||
|
Ceding commissions
|
3,737
|
|
—
|
|
—
|
|
—
|
|
—
|
|
3,737
|
|
|||||||||||
|
Earned premiums, net
|
12,827
|
|
—
|
|
—
|
|
—
|
|
—
|
|
12,827
|
|
|||||||||||
|
Gain on sale of loans held for sale, net
|
—
|
|
7,154
|
|
—
|
|
—
|
|
—
|
|
7,154
|
|
|||||||||||
|
Loan fee income
|
—
|
|
3,736
|
|
—
|
|
—
|
|
—
|
|
3,736
|
|
|||||||||||
|
Rental revenue
|
—
|
|
52
|
|
—
|
|
19,695
|
|
—
|
|
19,747
|
|
|||||||||||
|
Other income
|
753
|
|
6
|
|
278
|
|
1,051
|
|
167
|
|
2,255
|
|
|||||||||||
|
Total revenue
|
$
|
26,175
|
|
$
|
15,223
|
|
$
|
278
|
|
$
|
29,281
|
|
$
|
9,356
|
|
$
|
80,313
|
|
|||||
|
Interest expense
|
$
|
637
|
|
$
|
1,530
|
|
$
|
—
|
|
$
|
4,111
|
|
$
|
6,263
|
|
$
|
12,541
|
|
|||||
|
Payroll and employee commissions
|
3,483
|
|
10,690
|
|
5,117
|
|
8,056
|
|
6,442
|
|
33,788
|
|
|||||||||||
|
Commission expense
|
4,287
|
|
—
|
|
—
|
|
—
|
|
—
|
|
4,287
|
|
|||||||||||
|
Member benefit claims
|
2,676
|
|
—
|
|
—
|
|
—
|
|
—
|
|
2,676
|
|
|||||||||||
|
Net losses and loss adjustment expenses
|
3,153
|
|
—
|
|
—
|
|
—
|
|
—
|
|
3,153
|
|
|||||||||||
|
Professional fees
|
690
|
|
842
|
|
294
|
|
873
|
|
6,555
|
|
9,254
|
|
|||||||||||
|
Depreciation and amortization expenses
|
4,265
|
|
499
|
|
—
|
|
7,181
|
|
—
|
|
11,945
|
|
|||||||||||
|
Acquisition costs
|
6,121
|
|
—
|
|
—
|
|
—
|
|
—
|
|
6,121
|
|
|||||||||||
|
Other expenses
|
4,034
|
|
3,624
|
|
480
|
|
5,889
|
|
1,258
|
|
15,285
|
|
|||||||||||
|
Total expense
|
29,346
|
|
17,185
|
|
5,891
|
|
26,110
|
|
20,518
|
|
99,050
|
|
|||||||||||
|
Net intersegment revenue/(expense)
|
—
|
|
(341
|
)
|
—
|
|
—
|
|
341
|
|
—
|
|
|||||||||||
|
Net income attributable to consolidated CLOs
|
—
|
|
—
|
|
11,770
|
|
—
|
|
7,755
|
|
19,525
|
|
|||||||||||
|
Segment profit/(loss)
|
$
|
(3,171
|
)
|
$
|
(2,303
|
)
|
$
|
6,157
|
|
$
|
3,171
|
|
$
|
(3,066
|
)
|
$
|
788
|
|
|||||
|
Less: Provision for income taxes
|
4,141
|
|
|||||||||||||||||||||
|
Discontinued operations
|
7,937
|
|
|||||||||||||||||||||
|
Net income before non-controlling interests
|
$
|
4,584
|
|
||||||||||||||||||||
|
Less: Net income attributable to non-controlling interest from continuing operations and discontinued operations
|
6,294
|
|
|||||||||||||||||||||
|
Net income available to common stockholders
|
$
|
(1,710
|
)
|
||||||||||||||||||||
|
Segment assets
|
$
|
760,149
|
|
$
|
79,075
|
|
$
|
2,871
|
|
$
|
179,822
|
|
$
|
65,570
|
|
$
|
1,087,487
|
|
|||||
|
Assets of consolidated CLOs
|
1,978,094
|
|
|||||||||||||||||||||
|
Assets held for sale
|
5,129,745
|
|
|||||||||||||||||||||
|
Total Assets
|
$
|
8,195,326
|
|
||||||||||||||||||||
F-35
TIPTREE FINANCIAL INC. AND SUBSIDIARIES
Notes to Consolidated Financial Statements
(in thousands, except shares and per share data)
December 31, 2014
|
Year ended December 31, 2013
|
|||||||||||||||||||||||
|
Insurance and insurance services
|
Specialty finance
|
Asset management
|
Real estate
|
Corporate and other
|
Totals
|
||||||||||||||||||
|
Net realized and unrealized gains on investments
|
$
|
—
|
|
|
$
|
—
|
|
|
$
|
—
|
|
$
|
385
|
|
|
$
|
6,502
|
|
|
$
|
6,887
|
|
|
|
Interest income
|
—
|
|
|
498
|
|
|
—
|
|
|
2,316
|
|
|
8,836
|
|
|
11,650
|
|
||||||
|
Net credit derivative loss
|
—
|
|
|
—
|
|
|
—
|
|
|
—
|
|
|
(1,828
|
)
|
|
(1,828
|
)
|
||||||
|
Service and administrative fees
|
—
|
|
|
—
|
|
|
—
|
|
—
|
|
|
—
|
|
|
—
|
|
|||||||
|
Ceding commissions
|
—
|
|
—
|
|
—
|
|
—
|
|
—
|
|
—
|
|
|||||||||||
|
Earned premiums, net
|
—
|
|
—
|
|
—
|
|
—
|
|
—
|
|
—
|
|
|||||||||||
|
Gain on sale of loans held for sale, net
|
—
|
|
—
|
|
—
|
|
—
|
|
—
|
|
—
|
|
|||||||||||
|
Loan fee income
|
—
|
|
459
|
|
—
|
|
—
|
|
—
|
|
459
|
|
|||||||||||
|
Rental revenue
|
—
|
|
—
|
|
—
|
|
5,760
|
|
—
|
|
5,760
|
|
|||||||||||
|
Other income
|
—
|
|
12
|
|
350
|
|
413
|
|
40
|
|
815
|
|
|||||||||||
|
Total revenue
|
—
|
|
969
|
|
350
|
|
8,874
|
|
13,550
|
|
23,743
|
|
|||||||||||
|
Interest expense
|
—
|
|
24
|
|
—
|
|
1,825
|
|
3,016
|
|
4,865
|
|
|||||||||||
|
Payroll and employee commissions
|
—
|
|
1,732
|
|
6,006
|
|
2,707
|
|
6,296
|
|
16,741
|
|
|||||||||||
|
Commission expense
|
—
|
|
—
|
|
—
|
|
—
|
|
—
|
|
—
|
|
|||||||||||
|
Member benefit claims
|
—
|
|
—
|
|
—
|
|
—
|
|
—
|
|
—
|
|
|||||||||||
|
Net losses and loss adjustment expenses
|
—
|
|
—
|
|
—
|
|
—
|
|
—
|
|
—
|
|
|||||||||||
|
Professional fees
|
—
|
|
292
|
|
242
|
|
1,957
|
|
4,646
|
|
7,137
|
|
|||||||||||
|
Depreciation and amortization expenses
|
—
|
|
96
|
|
—
|
|
1,892
|
|
—
|
|
1,988
|
|
|||||||||||
|
Acquisition costs
|
—
|
|
|
—
|
|
|
—
|
|
|
—
|
|
|
—
|
|
|
—
|
|
||||||
|
Other expenses
|
—
|
|
|
529
|
|
|
402
|
|
|
3,702
|
|
|
977
|
|
|
5,610
|
|
||||||
|
Total expense
|
—
|
|
|
2,673
|
|
|
6,650
|
|
|
12,083
|
|
|
14,935
|
|
|
36,341
|
|
||||||
|
Net intersegment revenue/(expense)
|
—
|
|
—
|
|
—
|
|
—
|
|
—
|
|
—
|
|
|||||||||||
|
Net income attributable to consolidated CLOs
|
—
|
|
|
—
|
|
|
13,192
|
|
|
—
|
|
|
15,673
|
|
|
28,865
|
|
||||||
|
Segment profit/(loss)
|
—
|
|
|
(1,704
|
)
|
|
6,892
|
|
|
(3,209
|
)
|
|
14,288
|
|
|
16,267
|
|
||||||
|
Less: Provision for income taxes
|
|
|
|
|
|
|
|
|
|
|
|
|
|
|
|
560
|
|
||||||
|
Discontinued operations
|
|
|
|
|
|
|
|
|
|
|
|
|
|
|
|
25,022
|
|
||||||
|
Net income before non-controlling interests
|
|
|
|
|
|
|
|
|
|
|
|
|
|
|
|
$
|
40,729
|
|
|||||
|
Less: Net income attributable to non-controlling interest from continuing operations and discontinued operations
|
|
|
|
|
|
|
|
|
|
|
|
|
|
|
|
30,336
|
|
||||||
|
Net income available to common stockholders
|
|
$
|
10,393
|
|
|||||||||||||||||||
|
|
|||||||||||||||||||||||
|
Segment assets
|
$
|
—
|
|
$
|
21,338
|
|
$
|
176
|
|
$
|
160,328
|
|
$
|
334,347
|
|
$
|
516,189
|
|
|||||
|
Assets of consolidated CLOs
|
1,405,355
|
|
|||||||||||||||||||||
|
Assets held for sale
|
4,950,727
|
|
|||||||||||||||||||||
|
Total Assets
|
$
|
6,872,271
|
|
||||||||||||||||||||
(7) Investment in Available for Sale Securities
Investments in available for sale securities as of December 31, 2014 are held by Fortegra. Available for sale securities held by PFG as of December 31, 2014 and 2013 have been transferred into assets held for sale.
F-36
TIPTREE FINANCIAL INC. AND SUBSIDIARIES
Notes to Consolidated Financial Statements
(in thousands, except shares and per share data)
December 31, 2014
The following table presents the Company's available for sale securities as of:
|
As of December 31, 2014
|
|||||||||||||||
|
Amortized
cost
|
Gross
unrealized gains
|
Gross
unrealized losses
|
Fair value
|
||||||||||||
|
U.S. Treasury securities and obligations of U.S. government authorities and agencies
|
$
|
58,319
|
|
$
|
28
|
|
$
|
(108
|
)
|
$
|
58,239
|
|
|||
|
Municipal securities
|
35,920
|
|
45
|
|
(93
|
)
|
35,872
|
|
|||||||
|
Corporate securities
|
67,795
|
|
28
|
|
(347
|
)
|
67,476
|
|
|||||||
|
Certificates of deposit
|
871
|
|
—
|
|
—
|
|
871
|
|
|||||||
|
Equity securities
|
7,138
|
|
8
|
|
(96
|
)
|
7,050
|
|
|||||||
|
Obligations of foreign governments
|
1,636
|
|
—
|
|
(16
|
)
|
1,620
|
|
|||||||
|
Total
|
$
|
171,679
|
|
$
|
109
|
|
$
|
(660
|
)
|
$
|
171,128
|
|
|||
The following table summarizes the gross unrealized losses on available for sale securities in an unrealized loss position as of:
|
As of December 31, 2014
|
|||||||||||||||||||||
|
Less Than or Equal to One Year
|
More Than One Year
|
||||||||||||||||||||
|
Fair value
|
Gross
unrealized losses
|
# of Securities
|
Fair value
|
Gross unrealized losses
|
# of Securities
|
||||||||||||||||
|
U.S. Treasury securities and obligations of U.S. government authorities and agencies
|
$
|
38,972
|
|
$
|
(108
|
)
|
151
|
|
$
|
—
|
|
$
|
—
|
|
—
|
|
|||||
|
Municipal securities
|
25,611
|
|
(93
|
)
|
58
|
|
—
|
|
—
|
|
—
|
|
|||||||||
|
Corporate securities
|
59,013
|
|
(347
|
)
|
280
|
|
—
|
|
—
|
|
—
|
|
|||||||||
|
Equity securities
|
5,443
|
|
(96
|
)
|
18
|
|
—
|
|
—
|
|
—
|
|
|||||||||
|
Obligations of foreign governments
|
1,620
|
|
(16
|
)
|
5
|
|
—
|
|
—
|
|
—
|
|
|||||||||
|
Total
|
$
|
130,659
|
|
$
|
(660
|
)
|
512
|
|
$
|
—
|
|
$
|
—
|
|
—
|
|
|||||
The Company does not intend to sell the investments that were in an unrealized loss position at December 31, 2014, and management believes that it is more likely than not that the Company will be able to hold these securities until full recovery of their amortized cost basis for fixed maturity securities or cost for equity securities. The unrealized losses were attributable to changes in interest rates and not credit-related issues. As of December 31, 2014, based on the Company's review, none of the fixed maturity or equity securities were deemed to be other-than-temporarily impaired based on the Company's analysis of the securities and its intent to hold the securities until recovery. There have been no other‑than‑temporary impairments recorded by the Company in 2014.
The amortized cost and fair values of investments of these debt securities, by contractual maturity date, are shown below. Expected maturities may differ from contractual maturities because borrowers may have the right to call or prepay obligations with or without call or prepayment penalties. Excluded from this table are equity securities as they have no contractual maturity as well as certificates of deposit, all of which have maturities of less than one year.
|
As of December 31, 2014
|
|||||||
|
Amortized Cost
|
Fair Value
|
||||||
|
Due in one year or less
|
$
|
14,239
|
|
$
|
14,230
|
|
|
|
Due after one year through five years
|
73,476
|
|
73,176
|
|
|||
|
Due after five years through ten years
|
54,325
|
|
54,151
|
|
|||
|
Due after ten years
|
21,630
|
|
21,650
|
|
|||
|
Total
|
$
|
163,670
|
|
$
|
163,207
|
|
|
F-37
TIPTREE FINANCIAL INC. AND SUBSIDIARIES
Notes to Consolidated Financial Statements
(in thousands, except shares and per share data)
December 31, 2014
Purchases of available for sale securities were
$7,026
for the year ended December 31, 2014. Proceeds from maturities of available for sale securities were
$1,192
for the year ended December 31, 2014. Proceeds from the sale of available for sale securities for the year ended December 31, 2014 were
$783
with associated gains of
$4
.
(8)
Loans Owned
The following table presents the Company’s loan portfolio, measured at amortized costs:
|
Year ended December 31,
|
|||||||
|
2014
|
2013
|
||||||
|
Commercial real estate
|
$
|
—
|
|
$
|
22,335
|
|
|
|
Asset backed
|
35,395
|
|
16,493
|
|
|||
|
Other loans
|
700
|
|
1,432
|
|
|||
|
Total loans, net
|
$
|
36,095
|
|
$
|
40,260
|
|
|
Total loans owned include net deferred loan origination fees of
$2,308
and
$686
at December 31, 2014 and 2013, respectively. Asset backed loans are net of an allowance for loan losses of
$189
and
$9
at December 31, 2014 and 2013, respectively.
Commercial real estate - Westside
On July 25, 2014, the Company’s Care subsidiary received principal proceeds of
$29,846
resulting in a gain of approximately
$7,891
on repayment in full of a loan that was secured by skilled nursing facilities as well as collateral relating to assisted living facilities and a multifamily property (the Westside Loan).
Asset backed - Siena
Siena structures asset-based loan facilities in the
$1,000
to
$25,000
range across diversified industries which include manufacturing distribution, wholesale, and service companies. As of December 31, 2014, the Company carried
$35,395
in loans receivable on its consolidated balance sheet which is net of a participation interest of
$14,511
. Collateral for asset-backed loan receivables, as of December 31, 2014 consisted of inventory, equipment and accounts receivable. Management reviews collateral for these loans on at least a monthly basis or more frequently if a draw is requested and as such has determined that no impairment existed as of December 31, 2014. As of December 31, 2014, there were no delinquencies in the Siena portfolio and all loans were classified as performing.
Other loans
Care, through indirect subsidiaries of Care, made a loan to the lessees of one of its properties. The loan is secured by a pledge of outstanding equity interest in the entities that are the lessees. The cost basis of the loan at December 31, 2014 was approximately
$700
, which equals its carrying value.
(9) Notes Receivable
Calamar Properties
In February 2013, Care acquired a
75%
interest in Care Cal JV LLC, which through
two
subsidiaries, owns what are referred to as the Calamar Properties. Affiliates of Calamar Enterprises, Inc. (Calamar) own a
25%
interest in Care Cal JV LLC. In connection therewith, a subsidiary of Care Cal JV LLC issued notes to affiliates of Calamar. The cost basis of the notes at December 31, 2014 and 2013 was approximately
$3,865
and $
3,561
, respectively. As of December 31, 2014, these notes were all performing.
F-38
TIPTREE FINANCIAL INC. AND SUBSIDIARIES
Notes to Consolidated Financial Statements
(in thousands, except shares and per share data)
December 31, 2014
Fortegra
As of December 31, 2014, Fortegra held
$18,053
in notes receivable. The majority of these notes totaling
$11,900
consist of receivables from Fortegra’s premium financing program. A total of
$2,381
was for notes receivable under its Pay us Later Program, which allows customers to finance the cost of electronic mobile devices and or protection programs on these devices. The remaining
$3,772
represents unsecured notes receivable issued to various business partners in order to solidify relationships and grow its business. The Company has established a valuation allowance against its notes receivable of
$34
as of December 31, 2014. As of December 31, 2014, there were
$709
in balances classified as 90 day plus past due.
(10)
Reinsurance
The following table presents the effect of reinsurance on premiums written and earned by Fortegra for the following period:
|
Premiums
|
Year Ended December 31,
|
|||||
|
2014
|
||||||
|
Written
|
Earned
|
|||||
|
Direct and assumed
|
$
|
55,923
|
|
$
|
46,127
|
|
|
Ceded
|
(41,994
|
)
|
(33,300
|
)
|
||
|
Net
|
$
|
13,929
|
|
$
|
12,827
|
|
The following table presents the effect of reinsurance on losses and loss adjustment expenses ("LAE") incurred by Fortegra for the following period:
|
Losses and LAE incurred
|
Year Ended December 31,
|
||
|
2014
|
|||
|
Direct and assumed
|
$
|
10,687
|
|
|
Ceded
|
(7,534
|
)
|
|
|
Net losses and LAE incurred
|
$
|
3,153
|
|
The following table presents the components of the reinsurance receivables:
|
As of
|
|||
|
December 31, 2014
|
|||
|
Prepaid reinsurance premiums:
|
|||
|
Life
(1)
|
$
|
52,574
|
|
|
Accident and health
(1)
|
44,968
|
|
|
|
Property
|
126,669
|
|
|
|
Total
|
224,211
|
|
|
|
Ceded claim reserves:
|
|||
|
Life
|
1,868
|
|
|
|
Accident and health
|
7,971
|
|
|
|
Property
|
18,325
|
|
|
|
Total ceded claim reserves recoverable
|
28,164
|
|
|
|
Other reinsurance settlements recoverable
|
3,181
|
|
|
|
Reinsurance receivables
|
$
|
255,556
|
|
(1)
Including policyholder account balances ceded.
The following table presents the aggregate amount included in reinsurance receivables that is comprised of the three largest receivable balances from unrelated reinsurers:
|
As of
|
|||
|
December 31, 2014
|
|||
|
Total of the three largest receivable balances from unrelated reinsurers
|
$
|
151,563
|
|
F-39
TIPTREE FINANCIAL INC. AND SUBSIDIARIES
Notes to Consolidated Financial Statements
(in thousands, except shares and per share data)
December 31, 2014
At December 31, 2014, the three unrelated reinsurers from whom Fortegra has the largest receivable balances were: London Life Reinsurance Company (A. M. Best Rating: A); London Life International Reinsurance Corporation (A. M. Best Rating: not rated); and Great Western Insurance Company (A. M. Best Rating: B++). The related receivables of London Life International Reinsurance Corporation are collateralized by assets held in trust accounts and letters of credit due to their offshore relationships. At December 31, 2014, Fortegra does not believe there is a risk of loss as a result of the concentration of credit risk in the reinsurance program.
(11)
Real Estate
The following table contains information regarding the Company’s investment in real estate as of the following periods:
|
December 31, 2014
|
|||||||||||||||
|
Land
|
Buildings
|
Accumulated depreciation
|
Total
|
||||||||||||
|
Greenfield Portfolio - Triple net lease
|
$
|
5,600
|
|
$
|
14,220
|
|
$
|
(1,319
|
)
|
$
|
18,501
|
|
|||
|
Calamar Properties - JV
|
840
|
|
22,230
|
|
(1,161
|
)
|
21,909
|
|
|||||||
|
Terraces Portfolio - Triple Net lease
|
803
|
|
20,123
|
|
(778
|
)
|
20,148
|
|
|||||||
|
Heritage Portfolio - JV
|
3,605
|
|
39,535
|
|
(1,055
|
)
|
42,085
|
|
|||||||
|
Greenfield Portfolio - JV
|
2,690
|
|
24,827
|
|
(198
|
)
|
27,319
|
|
|||||||
|
Other real estate owned
|
—
|
|
1,675
|
|
(329
|
)
|
1,346
|
|
|||||||
|
Total
|
$
|
13,538
|
|
$
|
122,610
|
|
$
|
(4,840
|
)
|
$
|
131,308
|
|
|||
|
December 31, 2013
|
|||||||||||||||
|
Land
|
Buildings
|
Accumulated depreciation
|
Total
|
||||||||||||
|
Greenfield Portfolio - Triple net lease
|
$
|
5,600
|
|
$
|
14,220
|
|
$
|
(917
|
)
|
$
|
18,903
|
|
|||
|
Calamar Properties - JV
|
840
|
|
22,197
|
|
(556
|
)
|
22,481
|
|
|||||||
|
Terraces Portfolio - Triple Net lease
|
803
|
|
20,123
|
|
(212
|
)
|
20,714
|
|
|||||||
|
Heritage Portfolio - JV
|
1,970
|
|
33,441
|
|
(114
|
)
|
35,297
|
|
|||||||
|
Total
|
$
|
9,213
|
|
$
|
89,981
|
|
$
|
(1,799
|
)
|
$
|
97,395
|
|
|||
2014 Acquisitions
Heritage Portfolio - JV
Affiliates of Care entered into a joint venture to own and operate an additional seniors housing community with affiliates of Heritage. Affiliates of Care own an
80%
interest in the joint venture, while affiliates of Heritage own the remaining
20%
interest and continue to provide management services to the communities under a management contract. For the year ended December 31, 2014, rental revenue and net income from this acquisition were
$224
and
$3
, respectively.
Greenfield Portfolio - JV
Affiliates of Care entered into a joint venture to own and operate three seniors housing communities with affiliates of Greenfield. Care owns an
80%
interest in the joint venture, while affiliates of Greenfield own the remaining
20%
interest and provide management services to the communities under a management contract. For the year ended December 31, 2014, rental revenue and net income/(loss) were approximately
$1,792
and
$(629)
, respectively.
During the fourth quarter of 2014, the Company completed its assessment of the allocation of the fair value of the real estate acquired in the Heritage and Greenfield joint ventures (including land, buildings, equipment, and intangibles) in accordance with ASC
805 Business Combinations
.
Other Real Estate Owned
The other real estate owned represents a single family residential property that is being rented through the Company's subsidiary, Luxury. The property is located in Connecticut.
F-40
TIPTREE FINANCIAL INC. AND SUBSIDIARIES
Notes to Consolidated Financial Statements
(in thousands, except shares and per share data)
December 31, 2014
The following table presents the future minimum annual rental revenue under the noncancelable terms of all operating leases as of:
|
December 31, 2014
|
||
|
2015
|
3,550
|
|
|
2016
|
3,647
|
|
|
2017
|
3,748
|
|
|
2018
|
3,851
|
|
|
2019
|
3,956
|
|
|
Thereafter
|
20,118
|
|
|
Total
|
38,870
|
|
The schedule of minimum future rental revenue excludes residential lease agreements, generally having terms of one year or less. Rental revenue from residential leases was
$15,803
and
$3,086
for the years ended December 31, 2014 and 2013, respectively.
Dispositions
Bickford Portfolio
On June 28, 2013, Care completed the sale of its membership interests in Care YBE Subsidiary LLC (Care YBE), which owned fourteen senior living facilities (Bickford Portfolio) to an affiliate of National Health Investors Inc. (Buyer) for proceeds of
$44,021
and a net gain of
$15,463
, which is classified as a gain on sale from discontinued operations. See Note 5—Dispositions, Assets Held for Sale and Discontinued Operations, for further detail. The Bickford Portfolio, developed and managed by affiliates of Bickford Senior Living Group, L.L.C., contained
643
units with
six
properties located in Iowa,
five
in Illinois,
two
in Nebraska and
one
in Indiana.
(12)
Identifiable Intangible Assets and Goodwill
The following table presents identifiable intangible assets, accumulated amortization, and goodwill by segment:
|
As of December 31,
|
|||||||||||||||||||||||
|
2014
|
2013
|
||||||||||||||||||||||
|
Insurance and insurance services
|
Real estate
|
Specialty Finance
|
Insurance and insurance services
|
Real estate
|
Specialty Finance
|
||||||||||||||||||
|
Customer relationships
|
$
|
50,500
|
|
$
|
—
|
|
$
|
—
|
|
$
|
—
|
|
$
|
—
|
|
$
|
—
|
|
|||||
|
Trade names
|
6,000
|
|
—
|
|
—
|
|
—
|
|
—
|
|
—
|
|
|||||||||||
|
Accumulated amortization
|
(55
|
)
|
—
|
|
—
|
|
—
|
|
—
|
|
—
|
|
|||||||||||
|
Software licensing
|
8,500
|
|
—
|
|
—
|
|
—
|
|
—
|
|
—
|
|
|||||||||||
|
Accumulated amortization
|
(142
|
)
|
—
|
|
—
|
|
—
|
|
—
|
|
—
|
|
|||||||||||
|
Insurance policies and contracts acquired
|
36,500
|
|
—
|
|
—
|
|
|
|
—
|
|
—
|
|
|||||||||||
|
Accumulated amortization
|
(3,956
|
)
|
—
|
|
—
|
|
|
|
—
|
|
—
|
|
|||||||||||
|
Insurance licensing agreements
(1)
|
13,000
|
|
—
|
|
—
|
|
—
|
|
—
|
|
—
|
|
|||||||||||
|
Leases in place
(2)
|
—
|
|
14,604
|
|
—
|
|
—
|
|
8,944
|
|
—
|
|
|||||||||||
|
Accumulated amortization
|
—
|
|
(5,057
|
)
|
—
|
|
—
|
|
(645
|
)
|
—
|
|
|||||||||||
|
Intangible assets, net
|
110,347
|
|
9,547
|
|
—
|
|
—
|
|
8,299
|
|
—
|
|
|||||||||||
|
Goodwill
(3)
|
93,443
|
|
—
|
|
1,904
|
|
—
|
|
—
|
|
1,206
|
|
|||||||||||
|
Total
|
$
|
203,790
|
|
$
|
9,547
|
|
$
|
1,904
|
|
$
|
—
|
|
$
|
8,299
|
|
$
|
1,206
|
|
|||||
(1) Represents an intangible with an indefinite useful life. Impairment tests are performed at least annually on these assets
.
(2) Reflects the reversal of above market leases due to the Bickford properties discontinued operations as of December 31, 2013 (see Note 5 —Dispositions, Assets Held for Sale and Discontinued Operations).
(3) For further information regarding goodwill associated with the Fortegra acquisition see Note 4—Business Acquisitions.
F-41
TIPTREE FINANCIAL INC. AND SUBSIDIARIES
Notes to Consolidated Financial Statements
(in thousands, except shares and per share data)
December 31, 2014
Balances as of December 31, 2014 and 2013, for intangible assets (
$149,932
and
$153,636
respectively) and goodwill (
$3,088
and
$3,088
respectively) associated with PFG, have been classified as held for sale. The insurance and insurance services segment as of December 31, 2014, relates solely to those amounts associated with Fortegra which the Company acquired on December 4, 2014.
The following table presents the amortization expense on intangible assets for the next five years by segment:
|
Insurance and insurance services
|
Real estate
|
||||||
|
2015
|
$
|
26,922
|
|
$
|
6,785
|
|
|
|
2016
|
12,654
|
|
2,015
|
|
|||
|
2017
|
11,070
|
|
105
|
|
|||
|
2018
|
9,496
|
|
105
|
|
|||
|
2019
|
7,680
|
|
105
|
|
|||
|
Total
|
$
|
67,822
|
|
$
|
9,115
|
|
|
The Company recorded
$8,566
and
$540
in amortization expense associated with its intangibles for each of the periods ended December 31, 2014 and 2013, respectively.
The Company conducts annual impairment tests according to ASC 350
Intangibles-Goodwill and Other.
As of December 31, 2014 and 2013, there was no impairment recorded on either its goodwill or intangibles.
(13) CLOs and Consolidated Variable Interest Entities
The term CLO generally refers to a special purpose vehicle that owns a portfolio of investments and issues various tranches of debt and subordinated note securities to finance the purchase of those investments. The investment activities of a CLO are governed by extensive investment guidelines, generally contained within a CLO’s “indenture” and other governing documents which limit, among other things, the CLO’s exposure to any single industry or obligor and provide that the CLO’s assets satisfy certain ratings requirements. Most CLOs have a defined investment period during which they are allowed to make investments and reinvest capital as it becomes available.
Telos Asset Management LLC (Telos), a subsidiary of the Company acquired in 2012, is a CLO manager of
six
CLOs; namely Telos CLO 2014-6, Ltd. (Telos 6), Telos CLO 2014-5, Ltd. (Telos 5), Telos CLO 2013-4, Ltd. (Telos 4), Telos CLO 2013-3, Ltd. (Telos 3), Telos CLO 2007‑2, Ltd. (Telos 2) and Telos CLO 2006-1, Ltd. (Telos 1). Prior to the acquisition of TAMCO, the Company did not consolidate the then existing CLOs (Telos 1 and Telos 2) as it only held a residual interest which was recorded at fair value. The Company met the requirement to consolidate when it acquired the management rights of the CLOs. Tiptree owns various amounts of Telos 1, Telos 2, Telos 4, Telos 5 and Telos 6 with an aggregate fair market value of
$94,342
.
The assets of each of the CLOs are held solely as collateral to satisfy the obligations of the CLOs. The Company does not own and has no right to the benefits from, nor does it bear the risks associated with, the assets held by the CLOs, beyond its direct investments in, and investment advisory fees generated from, the CLOs. If the Company were to liquidate, the assets of the CLOs would not be available to its general creditors, and as a result, the Company does not consider them assets available for the benefit of its investors. Additionally, the investors in the CLOs have no recourse to the Company’s general assets for the debt issued by the CLOs. Therefore, this debt is not the Company’s obligation. As of December 31, 2014 and 2013, the Company’s maximum exposure to loss related to the CLOs is limited to its investment in the CLOs of
$97,935
and
$65,359
, respectively, as well as the management fees receivable of
$2,782
and $
3,616
as of December 31, 2014 and 2013, respectively. Both the carrying values of the CLOs and management fees receivable are eliminated upon consolidation.
F-42
TIPTREE FINANCIAL INC. AND SUBSIDIARIES
Notes to Consolidated Financial Statements
(in thousands, except shares and per share data)
December 31, 2014
The table below represents the assets and liabilities of the consolidated CLOs that are included in the Company’s consolidated balance sheet as of the dates indicated:
|
As of December 31,
|
|||||||
|
2014
|
2013
|
||||||
|
Assets:
|
|||||||
|
Cash and cash equivalents – restricted
|
$
|
146,281
|
|
$
|
67,604
|
|
|
|
Investment in loans, at fair value
|
1,803,205
|
|
1,298,155
|
|
|||
|
Investment in trading securities, at fair value
|
21,858
|
|
19,366
|
|
|||
|
Due from brokers
|
2,138
|
|
15,945
|
|
|||
|
Accrued interest receivable
|
4,496
|
|
4,108
|
|
|||
|
Other assets
|
116
|
|
177
|
|
|||
|
Total assets
|
$
|
1,978,094
|
|
$
|
1,405,355
|
|
|
|
Liabilities:
|
|||||||
|
Notes payable
|
$
|
1,785,207
|
|
$
|
1,314,871
|
|
|
|
Due to brokers
|
81,623
|
|
11,479
|
|
|||
|
Accrued interest payable
|
10,098
|
|
9,745
|
|
|||
|
Other liabilities
|
449
|
|
285
|
|
|||
|
Total liabilities
|
$
|
1,877,377
|
|
$
|
1,336,380
|
|
|
|
Net
|
$
|
100,717
|
|
$
|
68,975
|
|
|
As described in Note 2—Summary of Significant Accounting Policies, Tiptree has elected to adopt ASU 2014-13,
Consolidation (Topic 810): Measuring the Financial Assets and the Financial Liabilities of a Consolidated Collateralized Financing Entity.
This update prescribes a measurement alternative for valuing the notes payable of the CLOs. Specifically, since management has determined that the fair value of the financial liabilities are less observable than the fair value of the financial assets, ASU 2014-13 allows Tiptree to value the notes payable as (1) the sum of the fair value of the financial assets and the carrying value of any nonfinancial assets held temporarily, less (2) the sum of the fair value of any beneficial interests retained by Tiptree.
The beneficial interests retained by Tiptree includes (i) ownership in the subordinated notes and interest-only positions of the CLOs and (ii) accrued management fees. Although these beneficial interests are eliminated upon consolidation, the application of this measurement alternative results in the net amount of the CLOs shown above to be equivalent to the beneficial interests retained by Tiptree as illustrated in the below table:
|
Beneficial interests:
|
As of December 31,
|
||||||
|
2014
|
2013
|
||||||
|
Subordinated notes and interest-only positions
|
$
|
97,935
|
|
$
|
65,359
|
|
|
|
Accrued management fees
|
2,782
|
|
3,616
|
|
|||
|
Total beneficial interests
|
$
|
100,717
|
|
$
|
68,975
|
|
|
The tables below provide further details regarding the notes payable amounts of
$1,785,207
and
$1,314,871
as of December 31, 2014 and 2013, respectively:
|
As of December 31, 2014
|
As of December 31, 2013
|
||||||||||||||
|
Description
|
Aggregate
principal amount |
Spread over three months LIBOR
|
Aggregate
principal amount |
Spread over three months LIBOR
|
|||||||||||
|
Telos 6 (maturity January 2027)
|
|||||||||||||||
|
Class A-1
|
$
|
161,500
|
|
1.50
|
%
|
$
|
—
|
|
$
|
—
|
|
||||
|
Class A-2
|
60,000
|
|
N/A
|
|
(1
|
)
|
—
|
|
—
|
|
|||||
|
Class B-1
|
8,000
|
|
2.10
|
%
|
—
|
|
—
|
|
|||||||
F-43
TIPTREE FINANCIAL INC. AND SUBSIDIARIES
Notes to Consolidated Financial Statements
(in thousands, except shares and per share data)
December 31, 2014
|
As of December 31, 2014
|
As of December 31, 2013
|
||||||||||||||
|
Description
|
Aggregate
principal amount |
Spread over three months LIBOR
|
Aggregate
principal amount |
Spread over three months LIBOR
|
|||||||||||
|
Class B-2
|
34,000
|
|
N/A
|
|
(2
|
)
|
—
|
|
—
|
|
|||||
|
Class C
|
22,000
|
|
3.00
|
%
|
—
|
|
—
|
|
|||||||
|
Class D
|
20,500
|
|
3.90
|
%
|
—
|
|
—
|
|
|||||||
|
Class E
|
16,500
|
|
5.00
|
%
|
—
|
|
—
|
|
|||||||
|
Subordinated
|
12,400
|
|
N/A
|
|
—
|
|
—
|
|
|||||||
|
Mark to market adjustment
|
(14,772
|
)
|
|||||||||||||
|
Telos 6 Fair Value
|
320,128
|
|
|||||||||||||
|
Telos 5 (maturity April 2025)
|
|||||||||||||||
|
Class A
|
$
|
252,000
|
|
1.55
|
%
|
$
|
—
|
|
$
|
—
|
|
||||
|
Class B-1
|
39,000
|
|
N/A
|
|
(3
|
)
|
—
|
|
—
|
|
|||||
|
Class B-2
|
7,500
|
|
2.15
|
%
|
—
|
|
—
|
|
|||||||
|
Class C
|
32,750
|
|
3.00
|
%
|
—
|
|
—
|
|
|||||||
|
Class D
|
19,750
|
|
3.65
|
%
|
—
|
|
—
|
|
|||||||
|
Class E
|
18,000
|
|
5.00
|
%
|
—
|
|
—
|
|
|||||||
|
Class F
|
7,750
|
|
5.50
|
%
|
—
|
|
—
|
|
|||||||
|
Subordinated
|
10,500
|
|
N/A
|
|
—
|
|
—
|
|
|||||||
|
Mark to market adjustment
|
(15,078
|
)
|
|||||||||||||
|
Telos 5 Fair Value
|
372,172
|
|
|||||||||||||
|
Telos 4 (maturity July 2024)
|
|||||||||||||||
|
Class A
|
$
|
214,000
|
|
1.30
|
%
|
$
|
214,000
|
|
1.30
|
%
|
|||||
|
Class B
|
46,500
|
|
1.80
|
%
|
46,500
|
|
1.80
|
%
|
|||||||
|
Class C
|
29,000
|
|
2.75
|
%
|
29,000
|
|
2.75
|
%
|
|||||||
|
Class D
|
19,250
|
|
3.50
|
%
|
19,250
|
|
3.50
|
%
|
|||||||
|
Class E
|
16,000
|
|
5.00
|
%
|
16,000
|
|
5.00
|
%
|
|||||||
|
Class X
|
1,750
|
|
0.95
|
%
|
3,500
|
|
0.95
|
%
|
|||||||
|
Subordinated
|
10,700
|
|
N/A
|
|
10,700
|
|
N/A
|
|
|||||||
|
Mark to market adjustment
|
(14,023
|
)
|
(9,887
|
)
|
|||||||||||
|
Telos 4 Fair Value
|
323,177
|
|
329,063
|
|
|||||||||||
|
Telos 3 (maturity October 2024)
|
|||||||||||||||
|
Class A
|
$
|
225,000
|
|
1.42
|
%
|
225,000
|
|
1.42
|
%
|
||||||
|
Class B
|
36,500
|
|
2.25
|
%
|
36,500
|
|
2.25
|
%
|
|||||||
|
Class C
|
26,500
|
|
3.00
|
%
|
26,500
|
|
3.00
|
%
|
|||||||
|
Class D
|
18,000
|
|
4.25
|
%
|
18,000
|
|
4.25
|
%
|
|||||||
|
Class E
|
15,000
|
|
5.50
|
%
|
15,000
|
|
5.50
|
%
|
|||||||
|
Class F
|
6,000
|
|
5.50
|
%
|
6,000
|
|
5.50
|
%
|
|||||||
|
Subordinated
|
34,350
|
|
N/A
|
|
29,000
|
|
N/A
|
|
|||||||
|
Mark to market adjustment
|
(13,995
|
)
|
(6,357
|
)
|
|||||||||||
|
Telos 3 Fair Value
|
347,355
|
|
349,643
|
|
|||||||||||
|
Telos 2 (maturity April 2022)
|
|||||||||||||||
|
Class A-1
|
$
|
97,181
|
|
0.26
|
%
|
221,836
|
|
0.26
|
%
|
||||||
|
Class A-2
|
40,000
|
|
0.40
|
%
|
40,000
|
|
0.40
|
%
|
|||||||
|
Class B
|
27,500
|
|
0.55
|
%
|
27,500
|
|
0.55
|
%
|
|||||||
|
Class C
|
22,000
|
|
0.95
|
%
|
22,000
|
|
0.95
|
%
|
|||||||
|
Class D
|
22,000
|
|
2.20
|
%
|
22,000
|
|
2.20
|
%
|
|||||||
|
Class E
|
16,000
|
|
5.00
|
%
|
16,000
|
|
5.00
|
%
|
|||||||
|
Subordinated
|
2,000
|
|
N/A
|
|
2,000
|
|
N/A
|
|
|||||||
|
Mark to market adjustment
|
(142
|
)
|
273
|
|
|||||||||||
|
Telos 2 Fair Value
|
226,539
|
|
351,609
|
|
|||||||||||
|
Telos 1 (maturity October 2021)
|
|||||||||||||||
|
Class A-1D
|
$
|
2,927
|
|
0.27
|
%
|
39,270
|
|
0.27
|
%
|
||||||
|
Class A-1R
|
7,805
|
|
0.29
|
%
|
14,726
|
|
0.29
|
%
|
|||||||
|
Class A-1T
|
10,732
|
|
0.27
|
%
|
53,996
|
|
0.27
|
%
|
|||||||
|
Class A-2
|
60,000
|
|
0.40
|
%
|
60,000
|
|
0.40
|
%
|
|||||||
F-44
TIPTREE FINANCIAL INC. AND SUBSIDIARIES
Notes to Consolidated Financial Statements
(in thousands, except shares and per share data)
December 31, 2014
|
As of December 31, 2014
|
As of December 31, 2013
|
||||||||||||||
|
Description
|
Aggregate
principal amount |
Spread over three months LIBOR
|
Aggregate
principal amount |
Spread over three months LIBOR
|
|||||||||||
|
Class B
|
27,200
|
|
0.49
|
%
|
27,200
|
|
0.49
|
%
|
|||||||
|
Class C
|
22,000
|
|
0.85
|
%
|
22,000
|
|
0.85
|
%
|
|||||||
|
Class D
|
22,000
|
|
1.70
|
%
|
22,000
|
|
1.70
|
%
|
|||||||
|
Class E
|
16,000
|
|
4.25
|
%
|
16,000
|
|
4.25
|
%
|
|||||||
|
Subordinated
|
40,223
|
|
N/A
|
|
40,223
|
|
N/A
|
|
|||||||
|
Mark to market adjustment
|
(13,051
|
)
|
(10,859
|
)
|
|||||||||||
|
Telos 1 Fair Value
|
195,836
|
|
284,556
|
|
|||||||||||
|
$
|
1,785,207
|
|
$
|
1,314,871
|
|
||||||||||
(1) Tranche A-2 Notes in Telos 6 have a fixed rate of
3.46%
over the life of the CLO.
(2) Tranche B-2 Notes in Telos 6 have a fixed rate of
4.78%
over the life of the CLO.
(3) Tranche B-1 Notes in Telos 5 have a fixed rate of
4.45%
over the life of the CLO.
The following table represents revenue and expenses of the consolidated CLOs included in the Company’s consolidated statements of operations for the periods indicated:
|
Year ended December 31,
|
|||||||
|
2014
|
2013
|
||||||
|
Income:
|
|||||||
|
Net realized and unrealized gain (loss) loans
|
$
|
(15,797
|
)
|
$
|
(11,688
|
)
|
|
|
Interest income
|
80,478
|
|
72,867
|
|
|||
|
Total revenue
|
$
|
64,681
|
|
|
$
|
61,179
|
|
|
Expenses:
|
|||||||
|
Interest expense
|
$
|
43,639
|
|
$
|
31,455
|
|
|
|
Other expense
|
1,517
|
|
859
|
|
|||
|
Total expense
|
45,156
|
|
|
32,314
|
|
||
|
Net income
|
$
|
19,525
|
|
$
|
28,865
|
|
|
As summarized in the table below, the application of the measurement alternative results in the consolidated net income summarized above to be equivalent to Tiptree’s own economic interests in the CLOs which are eliminated upon consolidation:
|
Economic interests:
|
Year ended December 31,
|
||||||
|
2014
|
2013
|
||||||
|
Distributions received and realized and unrealized gains and losses on the subordinated notes held by the Company, net
|
$
|
7,755
|
|
$
|
15,673
|
|
|
|
Management fee income
|
11,770
|
|
13,192
|
|
|||
|
Total economic interests
|
$
|
19,525
|
|
$
|
28,865
|
|
|
(14) Derivative Financial Instruments and Hedging
The Company utilizes derivative financial instruments as part of its overall investment activities. Investments in derivative contracts are subject to additional risk that can result in a loss of all or part of an investment. The Company’s derivative activities are primarily classified by underlying credit risk, interest rate risk, and equity price risk. In addition, the Company is also subject to additional counterparty risk should its counterparties fail to meet the contract terms.
F-45
TIPTREE FINANCIAL INC. AND SUBSIDIARIES
Notes to Consolidated Financial Statements
(in thousands, except shares and per share data)
December 31, 2014
Derivatives, at fair value
Credit Derivatives
Credit derivatives are generally defined as over‑the‑counter contracts between a buyer and seller of protection against the risk of default on a set of obligations issued by a specified reference entity. The Company is exposed to credit risk when there is an unfavorable change in the value of investments as a result of adverse movements in the underlying credit spreads and enters into these contracts as a buyer of protection so as to minimize the credit risk exposure of its investment portfolio.
Credit Default Swap Indices (CDX) are credit derivatives that reference multiple names through underlying baskets or portfolios of single name credit default swaps.
The Company held four CDX contracts as of December 31, 2014, with a notional amount of
$599,308
(
$299,608
of sold protection and
$299,700
of bought protection).
The Company enters into these contracts as both a buyer of protection and seller of protection to manage the credit risk exposure of its investment portfolio. The Company is required to deposit cash collateral for these positions equal to an initial
2.25%
of the notional amount of the sold protection side, subject to increase based on additional maintenance margin as a result of decreases in value. As of December 31, 2014, total margin was
$6,750
. The Company entered into a CDX contract during December 2013, with a notional amount of
$20,000
. During June 2014, the Company sold the position and recognized a loss of
$1,136
.
Credit Default Swaps (CDS) are generally defined as over-the-counter contracts between a buyer and seller of protection against the risk of default on a set of obligations issued by a specified reference entity. The Company is party to
one
CDS contract with a notional amount of
$2,652
at December 31, 2014. The Company was party to
one
CDS contract which had a notional value of
$3,985
as of December 31, 2013.
Credit derivatives are included as a component of trading assets, at fair value, and are shown net of any right to reclaim cash collateral or obligation to return cash collateral.
Interest Rate Lock Commitments
The Company is exposed to certain risks in connection with its mortgage banking operations at Luxury. The Company is exposed to interest rate risk for certain interest rate lock commitments (IRLCs) until a purchaser for the related underlying loans is identified. The fair value of IRLCs is subject to change primarily due to changes in market interest rates. The notional amount of the Company’s IRLCs that were matched with best efforts lock commitments with investors was
$79,627
and the notional amount of the Company’s IRLCs that were matched with mandatory forward sales contracts was
$7,772
as of December 31, 2014, with a combined associated fair value of
$793
. The Company hedges the mandatory forward sales contracts with TBA Mortgage Backed Security instruments. The notional amount of these open hedge instruments was
$6,500
and the notional amount of the closed not yet settled hedge instruments was
$2,500
as of December 31, 2014. As of December 31, 2014, the IRLCs were included as a component of trading assets, at fair value, on the Company’s consolidated balance sheet.
Interest Rate Swaps
The Company is exposed to interest rate risk when there is an unfavorable change in the value of investments as a result of adverse movements in the market interest rates. The Company enters into interest rate swaps to protect against such adverse movements in interest rates. The Company is required to post collateral for the benefit of the counterparty. This is included as a component of other assets in the consolidated balance sheet.
On June 24, 2013 the Company terminated an interest rate swap contract with a notional amount of
$20,000
. In November and December 2013, the Company entered into
six
new interest rate swaps with a combined notional amount of
$43,988
in order to hedge interest rate risk associated with its real estate portfolio. All of these swaps have the same counterparty. These swaps are included as a component of trading liabilities, at fair value on the Company’s consolidated balance sheet as of December 31, 2014 and a component of trading assets as of December 31, 2013. The fair value of these interest rate swaps at December 31, 2014 and 2013 were
$(833)
and
$52
, respectively.
F-46
TIPTREE FINANCIAL INC. AND SUBSIDIARIES
Notes to Consolidated Financial Statements
(in thousands, except shares and per share data)
December 31, 2014
The following tables identify the fair value amounts of the Company’s stand-alone derivative instruments, categorized by primary underlying risk:
|
As of December 31, 2014
|
|||||||||||
|
Asset Derivatives
|
|||||||||||
|
Credit
risk
|
Interest rate
risk
|
Total
|
|||||||||
|
Credit derivatives
|
$
|
10,833
|
|
$
|
—
|
|
$
|
10,833
|
|
||
|
Interest rate lock commitments
|
—
|
|
793
|
|
793
|
|
|||||
|
Total
|
$
|
10,833
|
|
|
$
|
793
|
|
|
$
|
11,626
|
|
|
Liability Derivatives
|
|||||||||||
|
Credit
risk
|
Interest rate
risk
|
Total
|
|||||||||
|
Interest rate swaps
|
$
|
—
|
|
$
|
833
|
|
$
|
833
|
|
||
|
Total
|
$
|
—
|
|
$
|
833
|
|
$
|
833
|
|
||
|
As of December 31, 2013
|
|||||||||||
|
Asset Derivatives
|
|||||||||||
|
Credit
risk
|
Interest rate
risk
|
Total
|
|||||||||
|
Interest rate swaps
|
$
|
—
|
|
$
|
52
|
|
$
|
52
|
|
||
|
Total
|
$
|
—
|
|
$
|
52
|
|
$
|
52
|
|
||
|
Liability Derivatives
|
|||||||||||
|
Credit
risk
|
Interest rate
risk
|
Total
|
|||||||||
|
Credit derivatives
|
598
|
|
—
|
|
598
|
|
|||||
|
Total
|
598
|
|
—
|
|
598
|
|
|||||
The following tables identify the unrealized gain/(loss) amounts, categorized by primary underlying risk, for the following periods:
|
Change in unrealized (depreciation)/appreciation - derivatives
|
|||||||||||||
|
December 31, 2014
|
|||||||||||||
|
Credit
risk
|
Interest rate
risk
|
Total
|
Location in consolidated statements of operations
|
||||||||||
|
Credit derivatives
|
$
|
75
|
|
$
|
—
|
|
$
|
75
|
|
net credit derivative loss
|
|||
|
Interest rate lock commitments
|
—
|
|
364
|
|
364
|
|
net realized and unrealized gains on investments
|
||||||
|
Interest rate swaps
|
—
|
|
(885
|
)
|
(885
|
)
|
net realized and unrealized gains on investments
|
||||||
|
Total
|
$
|
75
|
|
$
|
(521
|
)
|
$
|
(446
|
)
|
||||
|
December 31, 2013
|
|||||||||||||
|
Credit
risk
|
Interest rate
risk
|
Total
|
Location in consolidated statements of operations
|
||||||||||
|
Credit derivatives
|
$
|
(1,582
|
)
|
$
|
—
|
|
$
|
(1,582
|
)
|
net credit derivative loss
|
|||
|
Interest rate swaps
|
—
|
|
3,222
|
|
3,222
|
|
net realized and unrealized gains on investments
|
||||||
|
Total
|
$
|
(1,582
|
)
|
$
|
3,222
|
|
$
|
1,640
|
|
||||
F-47
TIPTREE FINANCIAL INC. AND SUBSIDIARIES
Notes to Consolidated Financial Statements
(in thousands, except shares and per share data)
December 31, 2014
The Company nets these credit derivative assets and liabilities as these credit derivatives are subject to legally enforceable netting arrangements with the same party. The Company did not have any derivative instruments subject to enforceable netting arrangements at December 31, 2013. There are no derivative instruments subject to a netting agreement for which we are not currently netting. The following table present derivative instruments that are subject to offset by a master netting agreement as of:
|
Offsetting of derivative assets
|
December 31, 2014
|
||
|
Derivatives subject to netting arrangements:
|
|||
|
Credit default swap indices sold protection
|
$
|
52,513
|
|
|
Credit default swap indices bought protection
|
(40,147
|
)
|
|
|
Gross assets recognized
|
12,366
|
|
|
|
Collateral payable
|
(1,632
|
)
|
|
|
Net assets recognized
|
$
|
10,734
|
|
Net Credit Derivative Revenue/(Loss)
Below is a table identifying the components of the net credit derivative revenue/(loss) as shown on the Company’s consolidated statements of operations for following periods:
|
Year Ended December 31,
|
|||||||
|
2014
|
2013
|
||||||
|
Realized (loss)
|
$
|
(1,136
|
)
|
$
|
—
|
|
|
|
Unrealized gain/(loss)
|
75
|
|
(1,582
|
)
|
|||
|
Premium income
|
6,699
|
|
—
|
|
|||
|
Premium (expense)
|
(7,244
|
)
|
(246
|
)
|
|||
|
Net credit derivative revenue/(loss)
|
$
|
(1,606
|
)
|
$
|
(1,828
|
)
|
|
Derivatives designated as cash flow hedging instruments
Fortegra has an interest rate swap with a counterparty pursuant to which Fortegra swapped the floating rate portion of its outstanding preferred trust securities to a fixed rate. This swap is designated as a cash flow hedge and expires in June 2017.
As of December 31, 2014, the notional amount of this instrument was
$35,000
, with a fair value of
$(2,081)
, an unrealized loss net of tax of
$1,353
, a variable rate of interest of
0.24%
and a fixed rate of
3.47%
.
As of December 31, 2014, the gain recognized in AOCI on the derivative-effective portion was
$127
, with a loss reclassified from AOCI into income-effective portion of
$97
. The amount estimated to be reclassified to earnings from AOCI during the next 12 months is
$1,077
. These net losses reclassified into earnings are primarily expected to increase net interest expense related to the respective hedged item.
F-48
TIPTREE FINANCIAL INC. AND SUBSIDIARIES
Notes to Consolidated Financial Statements
(in thousands, except shares and per share data)
December 31, 2014
(15) Debt
The following table summarizes the balance of the Company’s debt holdings excluding notes payable of consolidated CLOs at (See Note 13—CLOs and Consolidated Variable Interest Entities, for notes payable of the consolidated CLOs):
|
As of December 31,
|
|||||||
|
2014
|
2013
|
||||||
|
Operating Company:
|
|||||||
|
CLO warehouse borrowing
|
$
|
—
|
|
$
|
133,715
|
|
|
|
Credit facility
|
47,500
|
|
49,500
|
|
|||
|
Original issue discount on credit facility
|
(743
|
)
|
(943
|
)
|
|||
|
Subtotal Operating Company
|
46,757
|
|
182,272
|
|
|||
|
Siena:
|
|||||||
|
Revolving line of credit
|
25,700
|
|
5,371
|
|
|||
|
Care:
|
|||||||
|
Mortgage borrowings
|
108,229
|
|
82,151
|
|
|||
|
Unamortized (discount)/premium on mortgage borrowings
|
36
|
|
(200
|
)
|
|||
|
Subtotal Care
|
108,265
|
|
81,951
|
|
|||
|
Luxury:
|
|||||||
|
Mortgage warehouse borrowing
|
27,406
|
|
—
|
|
|||
|
Preferred notes payable
|
1,688
|
|
—
|
|
|||
|
Mortgage borrowing
|
734
|
|
—
|
|
|||
|
Subtotal Luxury
|
29,828
|
|
—
|
|
|||
|
Fortegra:
|
|||||||
|
Secured credit agreement- revolving credit facility
|
60,000
|
|
—
|
|
|||
|
Secured credit agreement- term loan
|
50,000
|
|
—
|
|
|||
|
Revolving line of credit
|
7,649
|
|
—
|
|
|||
|
Preferred trust securities
|
35,000
|
|
—
|
|
|||
|
Subtotal Fortegra
|
152,649
|
|
—
|
|
|||
|
Total debt
|
$
|
363,199
|
|
$
|
269,594
|
|
|
Interest expense of
$11,898
and
$4,160
was incurred on the Company’s debt for the year ended December 31, 2014 and 2013, respectively.
The following table present the future maturities of the Company’s long-term debt (excluding Preferred Notes Payable) as of:
|
December 31, 2014
|
|||
|
2015
|
$
|
43,866
|
|
|
2016
|
8,892
|
|
|
|
2017
|
34,798
|
|
|
|
2018
|
49,030
|
|
|
|
2019
|
113,243
|
|
|
|
Thereafter
|
112,389
|
|
|
|
Total
|
$
|
362,218
|
|
F-49
TIPTREE FINANCIAL INC. AND SUBSIDIARIES
Notes to Consolidated Financial Statements
(in thousands, except shares and per share data)
December 31, 2014
The long term debt of Tiptree’s subsidiaries are discussed below:
Operating Company
Credit facility - Fortress Credit Corp
On September 18, 2013, Operating Company entered into a Credit Agreement with Fortress Credit Corp. (Fortress) and borrowed
$50,000
thereunder, with an associated original issue discount of
$1,000
, which is being amortized over the term of the agreement. The Credit Agreement allows Operating Company to borrow additional amounts up to a maximum aggregate of
$125,000
, subject to satisfaction of certain customary conditions. The obligations of Operating Company under the Credit Agreement are secured by liens on substantially all of the assets of Operating Company. The principal of, and all accrued and unpaid interest on, all loans under the Credit Agreement become immediately due and payable on
September 18, 2018
. Loans under the Credit Agreement bear interest at a variable rate per annum equal to
one-month LIBOR
(with a minimum LIBOR rate of
1.25%
), plus a margin of
6.50%
per annum. The weighted average rate paid for 2014 was
7.75%
. The principal amounts of the loan is to be repaid in quarterly installments, the amount of which may be adjusted based on the Net Leverage Ratio (as defined in the Credit Agreement) at the end of each fiscal quarter.
The Company is obligated to pay interest on a monthly basis and has incurred interest expense of
$3,830
and
$1,119
for the years ended December 31, 2014 and 2013, respectively. The amortization of the original issue discount totaled
$743
and
$943
for the years ended December 31, 2014 and 2013.
The Company capitalized approximately
$1,272
of costs associated with the transaction and is amortizing the costs ratably over the life of the facility. The Company recorded approximately
$254
and
$74
of expense for the years ended December 31, 2014 and 2013, respectively, related to these capitalized costs.
Also included in debt are any warehouse lines outstanding associated with the Company’s CLOs. As of December 31, 2013 there was
$133,715
outstanding for Telos 5. There were no warehouse lines outstanding as of December 31, 2014.
Operating Company believes it was in compliance with all of the financial covenants contained in the Credit Agreement as of December 31, 2014.
Siena
Revolving line of credit - Wells Fargo Bank
On July 25, 2013 Siena closed on a line of credit with Wells Fargo Bank. This revolving line is for
$65,000
with an interest rate of LIBOR plus
250 basis points
and a maturity date of
October 17, 2016
.
Care
Mortgage borrowings
On April 24, 2012, Care refinanced a bridge loan for the acquisition of the Greenfield VA Lease properties by entering into
three
separate non-recourse loans (each, a Greenfield VA Lease Loan and collectively, the Greenfield VA Lease Loans) with KeyCorp Real Estate Capital Markets, Inc. (KeyCorp) for an aggregate amount of approximately
$15,680
. As of December 31, 2014, the aggregate balance was
$15,063
. The Greenfield VA Lease Loans bear interest at a fixed rate of
4.76%
, amortize over a
thirty
-year period, provide for monthly interest and principal payments and mature on
May 1, 2022
. The Greenfield VA Lease Loans are secured by separate cross-collateralized, cross-defaulted first priority deeds of trust on each of the Greenfield VA Lease properties.
Effective February 2013, in connection with Care’s acquisition of the Calamar Properties, affiliates of Care entered into
two
separate loans from Liberty Bank with an aggregate balance of
$17,688
as of December 31, 2014. Both of these loans amortize over a
thirty
year period at a weighted average fixed rate of
4.21%
. These loans are secured by separate first priority mortgages on each of the properties.
In December 2013, affiliates of Care refinanced an internal bridge loan for the Terraces Portfolio, by entering into
two
separate loans from First Niagara Bank with an aggregate balance of
$15,641
as of December 31, 2014. Both of these loans
F-50
TIPTREE FINANCIAL INC. AND SUBSIDIARIES
Notes to Consolidated Financial Statements
(in thousands, except shares and per share data)
December 31, 2014
amortize over a
twenty-five
year period at a floating rate of LIBOR plus
2.50%
. These loans are secured by separate first priority mortgages on each of the properties.
Effective November 2013, in connection with the acquisition of The Heritage Portfolio, the Company entered into
two
separate loans from First Niagara Bank with an aggregate balance of
$32,173
as of December 31, 2014. Both of these loans amortize over a
twenty-five
year period at a floating rate of LIBOR plus
2.75%
. These loans are secured by separate first priority mortgages on each of the properties.
Effective October 2014, in connection with the acquisition of The Greenfield Portfolio - JV, the Company entered into a loan from Synovus Bank with an aggregate balance of
$21,595
as of December 31, 2014. The loan includes
thirty six
months of interest only payments and amortizes over a
thirty
year period at a floating rate of LIBOR plus
3.20%
. The loan is secured by first priority mortgages on each of the properties.
Effective December 2014, in connection with the additional acquisition of an additional seniors housing community property to The Heritage Portfolio, the Company assumed a HUD loan from Red Mortgage Capital with an aggregate balance of
$6,069
as of December 31, 2014. The loan amortizes over a
thirty
year period at a fixed rate of
4.72%
. The loan is secured by a first priority mortgage on the property.
Each of these loan transactions described above contains typical representations and covenants for loans of its type. As of December 31, 2014, management believes Care is in compliance with such covenants.
Luxury
Mortgage Warehouse Borrowing
As of December 31, 2014, Luxury has
three
separate warehouse lines of credit in place and the total maximum aggregate amount Luxury may borrow on these three warehouse lines of credit is
$82,500
. The credit agreements pay a floating rate of LIBOR plus
2.75%
(with a minimum LIBOR rate of
3.00%
). Luxury’s
three
credit agreements contain customary financial covenants that require, among other items, minimum amounts of tangible net worth, profitability, maximum indebtedness ratios, and minimum liquid assets. As of December 31, 2014, Luxury believes it was in compliance or had received waivers of compliance with certain financial covenants. Luxury’s ability to borrow under the warehouse line of credit agreements is not adversely affected by the waivers. The waivers are valid through and including December 31, 2014.
Preferred Notes Payable
On January 31, 2014, Luxury issued a series of notes to pay several former shareholders of Luxury as part of the acquisition of Luxury by Tiptree. Although the notes accrue interest at a rate of
12.0%
per annum, payments to former shareholders are subject to cash available for distribution based on the profitability of Luxury subject to stipulations governed by the note agreements. The notes all mature on the
7
th anniversary of the acquisition on January 31, 2021.
Mortgage Borrowing
In December 2013, Luxury entered into a mortgage note agreement with the Bank of Danbury. The mortgage note has a term of ten years and the monthly payments are based upon a
twenty-five
year amortization schedule. The mortgage note has a floating rate of Prime plus
1.00%
. The mortgage note is secured by the underlying rental property, a guaranty by Luxury, and a personal guaranty of one of the shareholders of Luxury.
Fortegra
Secured Credit Agreement - Wells Fargo Bank, N.A.
On
December 4, 2014
, Fortegra entered into an amended and restated
$140,000
secured credit agreement (the “Credit Agreement”) among: (i) Fortegra and its wholly owned subsidiary LOTS Intermediate Co. (“LOTS”), as borrowers (Fortegra and LOTS, collectively, the “Borrowers”); (ii) the initial lenders named therein; and (iii) Wells Fargo Bank, National Association, as administrative agent, swingline lender, and issuing lender. The Credit Agreement provides for a
$50,000
term loan facility and a
$90,000
revolving credit facility. Subject to earlier termination, the Credit Agreement terminates on
December 4, 2019
. The weighted average rate paid for 2014 was
3.69%
.The Borrowers are required to repay the aggregate outstanding principal amount of the initial
$50,000
term loan facility in consecutive quarterly installments of
$1,250
commencing
March 2015
.
F-51
TIPTREE FINANCIAL INC. AND SUBSIDIARIES
Notes to Consolidated Financial Statements
(in thousands, except shares and per share data)
December 31, 2014
Fortegra was in compliance with the covenants required by the respective Credit Agreement in effect at December 31, 2014.
Revolving Line of Credit - Synovus Bank
Fortegra has a
$15,000
revolving line of credit agreement (the “Line of Credit”) with Synovus Bank, entered into on
October 9, 2013
, with a maturity date of
April 30, 2017
. The Line of Credit bears interest at a rate of
300
basis points plus 90-day LIBOR, and is available specifically for the South Bay premium financing product. The weighted average rate paid for 2014 was
3.23%
.
At December 31, 2014, Fortegra believes it was in compliance with the covenants required by the Line of Credit.
Preferred Trust Securities
Fortegra has
$35,000
of fixed/floating rate preferred trust securities due
June 15, 2037
. The preferred trust securities bear interest at a floating rate of
3-month LIBOR
plus the annual base rate of
4.10%
. Interest is payable quarterly. In 2012, Fortegra entered into an interest rate swap that exchanges the floating rate for a fixed rate, as further described in Note 14—Derivative Financial Instruments and Hedging. The Company may redeem the preferred trust securities, in whole or in part, at a price equal to the full outstanding principal amount of such preferred trust securities outstanding plus accrued and unpaid interest.
PFG
As of December 31, 2014 and 2013, the debt of PFG was transferred into liabilities held for sale. See Note 5—Dispositions, Assets Held for Sale and Discontinued Operations for additional information.
Consolidated CLOs
The Company includes in its consolidated balance sheets, as part of liabilities of consolidated CLOs, the debt obligations used to finance the investment in corporate loans and other investments owned by the CLOs that it manages. The carrying amount of the notes represents the accreted value from the initial consolidation and is recognized through the measurement date using the effective interest method or a method that approximates the effective interest method. See Note 13—CLOs and Consolidated Variable Interest Entities, for additional information.
(16)
Commitments and Contingencies
Contractual Obligations
The table below summarizes the Company’s contractual obligations by period that payments are due as of:
|
December 31, 2014
|
|||||||||||||||||||
|
Less than one year
|
1-3 years
|
3-5 years
|
More than 5 years
|
Total
|
|||||||||||||||
|
Operating lease obligations
(1)
|
3,246
|
|
6,193
|
|
5,100
|
|
3,834
|
|
18,373
|
|
|||||||||
|
Other
(2)
|
25,000
|
|
—
|
|
—
|
|
—
|
|
25,000
|
|
|||||||||
|
Total
|
$
|
28,246
|
|
$
|
6,193
|
|
$
|
5,100
|
|
$
|
3,834
|
|
$
|
43,373
|
|
||||
|
(1)
|
Minimum rental obligations for Tiptree, Care, MFCA, Siena, Luxury and Fortegra office leases. For the twelve month periods ended December 31, 2014 and 2013, rent expense for the Company’s office leases were
$1,508
and
$283
, respectively.
|
|
(2)
|
On January 26, 2015, Tiptree entered into a First Amendment to its existing Fortress credit agreement (the Amendment). The Amendment provides for additional term loans in an aggregate principal amount of
$25,000
to Tiptree and will have the same maturity date, margin above LIBOR, principal repayment terms, and conditions and covenants as the existing term loans under the existing Fortress credit agreement, subject to certain exceptions in the Amendment. Tiptree is required to prepay
$25,000
of the loan upon the closing of the PFG sale. See Note 25—Subsequent Events, for further detail.
|
In addition, Tiptree’s subsidiary Siena issues standby letters of credit for credit enhancements that are required by their borrower’s respective businesses. As of December 31, 2014 there was
$5,453
outstanding relating to these letters of credit.
F-52
TIPTREE FINANCIAL INC. AND SUBSIDIARIES
Notes to Consolidated Financial Statements
(in thousands, except shares and per share data)
December 31, 2014
Refer to Note 15—Debt, for information regarding the Company’s debt obligations.
Litigation
Tiptree’s Fortegra subsidiary is a defendant in Mullins v. Southern Financial Life Insurance Co., which was filed on February 2, 2006, in the Pike Circuit Court, in the Commonwealth of Kentucky. A class was certified on June 25, 2010. At issue is the duration or term of coverage under certain policies. The action alleges violations of the Consumer Protection Act and certain insurance statutes, as well as common law fraud. The action seeks compensatory and punitive damages, attorney fees and interest. Plaintiffs filed a Motion for Sanctions on April 5, 2012 in connection with Fortegra's efforts to locate and gather certificates and other documents from Fortegra's agents. While the court did not award sanctions, it did order Fortegra to subpoena certain records from its agents. Although Fortegra appealed the order on numerous grounds, the Kentucky Supreme Court ultimately denied the appeal in April 2014. Consequently, Fortegra has retained a special master to facilitate the collection of certificates and other documents from Fortegra's agents. The parties are currently conducting discovery in preparation for trial on September 8, 2015.
Tiptree considers such litigation customary in Fortegra’s lines of business. In management's opinion, based on information available at this time, the ultimate resolution of such litigation, which it is vigorously defending, should not be materially adverse to the financial position, results of operations or cash flows of Tiptree. It should be noted that large punitive damage awards, bearing little relation to actual damages sustained by plaintiffs, have been awarded in certain states against other companies in the credit insurance business. Tiptree may record loss contingencies as developments warrant.
Tiptree and its subsidiaries are defendants in a purported consolidated class action in connection with Tiptree’s acquisition of Fortegra, entitled Stein v. Fortegra Financial Corporation, et al., Case No. 16-2014-CA-005825-XXXX-MA in the Circuit Court of the Fourth Judicial Circuit in and for Duval County, State of Florida. The complaint alleges that the merger consideration is inadequate, that the members of Fortegra’s board of directors breached their fiduciary obligations to Fortegra’s stockholders by approving the merger agreement and related agreements, engaging in an unfair sales process and failing to make adequate disclosures to Fortegra’s stockholders, and that the other named defendants aided and abetted the breach of those duties.
On February 6, 2015, the court granted preliminary approval of a disclosure-only settlement pursuant to which the terms of the merger agreement remain unchanged, but Fortegra issued additional supplemental disclosures about the merger to stockholders. We expect the settlement to be finally proved at a hearing on April 20, 2015. Tiptree has provided notice to the class as required. Accordingly, in management's opinion, based on information available at this time, the ultimate resolution of this litigation will not be materially adverse to the financial position, results of operations or cash flows of Tiptree.
Tiptree and its subsidiaries are parties to legal proceedings in the ordinary course of their business. Although Tiptree’s legal and financial liability with respect to such proceedings cannot be estimated with certainty, Tiptree does not believe that these proceedings, either individually or in the aggregate, are likely to have a material adverse effect on Tiptree’s financial position or results of operations.
F-53
TIPTREE FINANCIAL INC. AND SUBSIDIARIES
Notes to Consolidated Financial Statements
(in thousands, except shares and per share data)
December 31, 2014
(17)
Fair Value of Financial Instruments
The following tables show the fair values and carrying values of the Company’s financial assets and liabilities measured on a recurring basis and the associated fair value hierarchy amounts as of: (included are balances associated with the consolidated CLOs):
|
December 31, 2014
|
|||||||||||||||||||
|
Quoted prices in
active markets
Level 1
|
Other significant
observable inputs
Level 2
|
Significant unobservable inputs
Level 3
|
Fair value
|
Carrying value
|
|||||||||||||||
|
Assets:
|
|||||||||||||||||||
|
Trading assets:
|
|||||||||||||||||||
|
Privately held equity securities
|
$
|
—
|
|
$
|
—
|
|
$
|
4,171
|
|
$
|
4,171
|
|
$
|
4,171
|
|
||||
|
Privately held equity securities
(1)
|
—
|
|
91
|
|
3,012
|
|
3,103
|
|
3,103
|
|
|||||||||
|
Tax exempt securities
|
—
|
|
11,230
|
|
2,011
|
|
13,241
|
|
13,241
|
|
|||||||||
|
CDO
|
—
|
|
—
|
|
180
|
|
180
|
|
180
|
|
|||||||||
|
CLO
|
—
|
|
—
|
|
945
|
|
945
|
|
945
|
|
|||||||||
|
Investments in CLOs and CDOs
(1)
|
—
|
|
—
|
|
18,755
|
|
18,755
|
|
18,755
|
|
|||||||||
|
Total trading securities
|
—
|
|
11,321
|
|
29,074
|
|
40,395
|
|
40,395
|
|
|||||||||
|
Derivative assets:
|
|||||||||||||||||||
|
IRS
|
—
|
|
—
|
|
—
|
|
—
|
|
—
|
|
|||||||||
|
IRLC
|
—
|
|
17
|
|
776
|
|
793
|
|
793
|
|
|||||||||
|
Credit derivatives
|
—
|
|
10,833
|
|
—
|
|
10,833
|
|
10,833
|
|
|||||||||
|
Total derivative assets
|
—
|
|
|
10,850
|
|
|
776
|
|
11,626
|
|
11,626
|
|
|||||||
|
Total trading assets
|
—
|
|
22,171
|
|
29,850
|
|
52,021
|
|
52,021
|
|
|||||||||
|
Mortgage loans held for sale
|
—
|
|
28,661
|
|
—
|
|
28,661
|
|
28,661
|
|
|||||||||
|
Investments in loans
|
—
|
|
154
|
|
2,447
|
|
2,601
|
|
2,601
|
|
|||||||||
|
Investments in loans
(1)
|
—
|
|
1,248,161
|
|
555,044
|
|
1,803,205
|
|
1,803,205
|
|
|||||||||
|
Available for sale securities:
|
|||||||||||||||||||
|
Equity securities
|
6,003
|
|
—
|
|
1,047
|
|
7,050
|
|
7,050
|
|
|||||||||
|
U.S. Treasury securities and U.S. Government agencies
|
—
|
|
58,239
|
|
—
|
|
58,239
|
|
58,239
|
|
|||||||||
|
Obligations of state and political subdivisions
|
—
|
|
35,872
|
|
—
|
|
35,872
|
|
35,872
|
|
|||||||||
|
Obligations of foreign governments
|
—
|
|
1,620
|
|
—
|
|
1,620
|
|
1,620
|
|
|||||||||
|
Certificates of deposit
|
871
|
|
—
|
|
—
|
|
871
|
|
871
|
|
|||||||||
|
Corporate bonds
|
—
|
|
67,476
|
|
—
|
|
67,476
|
|
67,476
|
|
|||||||||
|
Total available for sale securities
|
6,874
|
|
|
163,207
|
|
|
1,047
|
|
171,128
|
|
171,128
|
|
|||||||
|
Assets held for sale:
|
|||||||||||||||||||
|
Available for sale securities
|
100
|
|
17,309
|
|
—
|
|
17,409
|
|
17,409
|
|
|||||||||
|
Separate account assets
|
292,398
|
|
735,528
|
|
3,771,503
|
|
4,799,429
|
|
4,799,429
|
|
|||||||||
|
Total assets held for sale
|
292,498
|
|
752,837
|
|
3,771,503
|
|
4,816,838
|
|
4,816,838
|
|
|||||||||
|
Total assets
|
$
|
299,372
|
|
|
$
|
2,215,191
|
|
|
$
|
4,359,891
|
|
|
$
|
6,874,454
|
|
|
$
|
6,874,454
|
|
|
Liabilities:
|
|
|
|||||||||||||||||
|
Trading Liabilities:
|
|||||||||||||||||||
|
U.S. Treasury securities
|
$
|
—
|
|
$
|
19,660
|
|
$
|
—
|
|
$
|
19,660
|
|
$
|
19,660
|
|
||||
|
IRS
(1)
|
—
|
|
126
|
|
—
|
|
126
|
|
126
|
|
|||||||||
|
IRS
|
—
|
|
2,913
|
|
—
|
|
2,913
|
|
2,913
|
|
|||||||||
|
Notes payable of CLOs
|
—
|
|
—
|
|
1,785,207
|
|
1,785,207
|
|
1,785,207
|
|
|||||||||
|
Total liabilities
|
$
|
—
|
|
$
|
22,699
|
|
$
|
1,785,207
|
|
$
|
1,807,906
|
|
$
|
1,807,906
|
|
||||
(1) Indicates assets and liabilities related to consolidated CLOs.
F-54
TIPTREE FINANCIAL INC. AND SUBSIDIARIES
Notes to Consolidated Financial Statements
(in thousands, except shares and per share data)
December 31, 2014
|
December 31, 2013
|
|||||||||||||||||||
|
Quoted prices in
active markets
Level 1
|
Other significant
observable inputs
Level 2
|
Significant unobservable inputs
Level 3
|
Fair value
|
Carrying value
|
|||||||||||||||
|
Assets:
|
|||||||||||||||||||
|
Trading assets:
|
|||||||||||||||||||
|
Privately held equity securities
(1)
|
$
|
—
|
|
$
|
—
|
|
$
|
5,306
|
|
$
|
5,306
|
|
$
|
5,306
|
|
||||
|
Tax exempt securities
|
—
|
|
30,707
|
|
273
|
|
30,980
|
|
30,980
|
|
|||||||||
|
CDO
|
—
|
|
—
|
|
520
|
|
520
|
|
520
|
|
|||||||||
|
CLO
|
—
|
|
—
|
|
825
|
|
825
|
|
825
|
|
|||||||||
|
Investments in CLOs and CDOs
(2)
|
—
|
|
—
|
|
17,674
|
|
17,674
|
|
17,674
|
|
|||||||||
|
Total trading assets
|
—
|
|
30,707
|
|
24,598
|
|
55,305
|
|
55,305
|
|
|||||||||
|
Derivative assets:
|
|||||||||||||||||||
|
IRS
|
—
|
|
52
|
|
—
|
|
52
|
|
52
|
|
|||||||||
|
Total trading assets
|
—
|
|
30,759
|
|
|
24,598
|
|
|
55,357
|
|
55,357
|
|
|||||||
|
Investments in loans
(3)
|
—
|
|
1,438,699
|
|
30,543
|
|
1,469,242
|
|
1,469,242
|
|
|||||||||
|
Assets held for sale:
|
|||||||||||||||||||
|
Available for sale securities
|
100
|
|
17,663
|
|
—
|
|
17,763
|
|
17,763
|
|
|||||||||
|
Separate account assets
|
513,074
|
|
278,624
|
|
3,833,401
|
|
4,625,099
|
|
4,625,099
|
|
|||||||||
|
Total assets held for sale
|
513,174
|
|
|
296,287
|
|
|
3,833,401
|
|
|
4,642,862
|
|
|
4,642,862
|
|
|||||
|
Total assets
|
$
|
513,174
|
|
$
|
1,765,745
|
|
$
|
3,888,542
|
|
$
|
6,167,461
|
|
$
|
6,167,461
|
|
||||
|
Liabilities:
|
|||||||||||||||||||
|
Debt Securities:
|
|||||||||||||||||||
|
U.S. Treasury securities
|
$
|
—
|
|
$
|
18,493
|
|
$
|
—
|
|
$
|
18,493
|
|
$
|
18,493
|
|
||||
|
Derivative Liabilities:
|
|||||||||||||||||||
|
Credit derivatives
|
—
|
|
598
|
|
—
|
|
598
|
|
598
|
|
|||||||||
|
Notes payable of CLOs
|
—
|
|
—
|
|
1,314,871
|
|
1,314,871
|
|
1,314,871
|
|
|||||||||
|
Total liabilities
|
$
|
—
|
|
$
|
19,091
|
|
$
|
1,314,871
|
|
$
|
1,333,962
|
|
$
|
1,333,962
|
|
||||
(1) Includes
$1,692
related to CLOs classified in Level 3.
(2) Includes
$17,674
related to CLOs classified in Level 3.
(3) Includes
$1,267,612
and
$30,543
related to CLOs classified in Level 2 and Level 3, respectively.
F-55
TIPTREE FINANCIAL INC. AND SUBSIDIARIES
Notes to Consolidated Financial Statements
(in thousands, except shares and per share data)
December 31, 2014
The following table represents additional information about assets that are measured at fair value on a recurring basis for which the Company has utilized Level 3 inputs to determine fair value for the following periods:
|
Year ended December 31,
|
|||||||||||||||||||||||
|
2014
|
2013
|
||||||||||||||||||||||
|
Non-CLO assets
|
CLO assets
|
Assets held for sale
|
Non-CLO assets
|
CLO assets
|
Assets held for sale
|
||||||||||||||||||
|
Balance at December 31,
|
$
|
5,231
|
|
$
|
49,910
|
|
$
|
3,833,401
|
|
$
|
7,596
|
|
$
|
24,826
|
|
$
|
3,472,201
|
|
|||||
|
Net realized gains/(losses)
|
5
|
|
2,621
|
|
—
|
|
(426
|
)
|
(1,404
|
)
|
—
|
|
|||||||||||
|
Net unrealized gains/(losses)
|
(1,231
|
)
|
(10,424
|
)
|
—
|
|
(821
|
)
|
677
|
|
—
|
|
|||||||||||
|
Purchases
|
—
|
|
18,652
|
|
225,158
|
|
71
|
|
1,818
|
|
303,447
|
|
|||||||||||
|
Sales
|
(4,056
|
)
|
(161,086
|
)
|
(902,870
|
)
|
—
|
|
(5,828
|
)
|
(372,063
|
)
|
|||||||||||
|
Issuances
|
7
|
|
2,616
|
|
—
|
|
6
|
|
926
|
|
—
|
|
|||||||||||
|
Settlements
|
—
|
|
—
|
|
—
|
|
(1,195
|
)
|
—
|
|
—
|
|
|||||||||||
|
Transfers into Level 3
|
9,796
|
|
974,261
|
|
—
|
|
—
|
|
43,896
|
|
24,643
|
|
|||||||||||
|
Transfers (out of) Level 3
|
—
|
|
(299,739
|
)
|
—
|
|
—
|
|
(15,001
|
)
|
—
|
|
|||||||||||
|
Attributable to policyowner
|
1
|
|
—
|
|
615,769
|
|
—
|
|
—
|
|
405,173
|
|
|||||||||||
|
Transfers into Level 3 Luxury
|
776
|
|
—
|
|
—
|
|
—
|
|
—
|
|
—
|
|
|||||||||||
|
Transfers into Level 3 Fortegra
|
1,048
|
|
—
|
|
—
|
|
—
|
|
—
|
|
—
|
|
|||||||||||
|
Balance at December 31,
|
$
|
11,577
|
|
$
|
576,811
|
|
$
|
3,771,458
|
|
|
$
|
5,231
|
|
$
|
49,910
|
|
$
|
3,833,401
|
|
||||
|
Changes in unrealized gains included in earnings related to assets still held at period end
|
$
|
(1,231
|
)
|
$
|
(10,424
|
)
|
$
|
—
|
|
$
|
(821
|
)
|
$
|
677
|
|
$
|
—
|
|
|||||
For the year ended December 31, 2014,
$9,796
was transferred into Level 3 for non-CLO assets and were related to investments in loans and tax exempt securities. For the year ended December 31, 2014, CLO assets of
$974,261
were transferred from Level 2 to Level 3. This was primarily due to the limited depth underlying the prices of corporate loans as well as changes to the depth supporting those prices at different measurement dates. For the year ended December 31, 2013,
$43,896
was transferred from Level 2 to Level 3 for CLO assets and were primarily corporate loans. For assets held for sale
$24,643
was transferred related to hedge funds held in separate accounts. For the year ended December 31, 2014, there were no transfers between Level 1 and Level 2 of the fair value hierarchy
ASC Topic 820, as amended by ASU 2011-04, requires disclosure of quantitative information about the significant unobservable inputs used in the valuation of assets and liabilities classified as Level 3 within the fair value hierarchy. Disclosure of this information is not required in circumstances where a valuation (unadjusted) is obtained from a third-party pricing service and the information regarding the unobservable inputs is not reasonably available to the Company. As such, the disclosure provided below provides quantitative information only about the significant unobservable inputs used in the valuation of certain tax-exempt municipal securities.
|
Fair Value as of
|
Range (Weighted average)
|
||||||||||||||
|
Assets
|
December 31,
2014
|
December 31,
2013
|
Valuation Technique
|
Unobservable input(s)
|
December 31, 2014
|
December 31, 2013
|
|||||||||
|
Trading Securities:
|
|||||||||||||||
|
Tax-exempt municipal
|
199
|
|
274
|
|
Discounted cash flow
|
Short and long term cash flows
|
.58% - 33.32%
|
.58% - 33.68%
|
|||||||
|
Total
|
$
|
199
|
|
$
|
274
|
|
|||||||||
F-56
TIPTREE FINANCIAL INC. AND SUBSIDIARIES
Notes to Consolidated Financial Statements
(in thousands, except shares and per share data)
December 31, 2014
The following tables show the fair values and carrying values of the Company’s financial assets and liabilities and the fair value hierarchy level(s) associated with these assets and liabilities as of:
|
December 31, 2014
|
|||||||||
|
Level within
Fair Value
Hierarchy
|
Fair Value
|
Carrying Value
|
|||||||
|
Assets:
|
|||||||||
|
Cash and cash equivalents-unrestricted
|
1
|
$
|
52,987
|
|
$
|
52,987
|
|
||
|
Cash and cash equivalents-restricted
|
1
|
28,045
|
|
28,045
|
|
||||
|
Trading assets
|
2,3
|
30,163
|
|
30,163
|
|
||||
|
Available for sale securities
|
1,2,3
|
171,128
|
|
171,128
|
|
||||
|
Mortgage loans held for sale
|
2
|
28,661
|
|
28,661
|
|
||||
|
Investments in loans
|
2,3
|
2,601
|
|
2,601
|
|
||||
|
Loans owned
|
2
|
36,095
|
|
36,095
|
|
||||
|
Notes receivable, net
|
2
|
21,916
|
|
21,916
|
|
||||
|
Accounts and premiums receivable, net
|
2
|
39,666
|
|
39,666
|
|
||||
|
Other receivables
|
2
|
34,755
|
|
34,755
|
|
||||
|
Assets of consolidated CLOs
|
1,2,3
|
1,978,094
|
|
1,978,094
|
|
||||
|
Assets held for sale
|
1,2,3
|
5,129,745
|
|
5,129,745
|
|
||||
|
Total Assets
|
$
|
7,553,856
|
|
$
|
7,553,856
|
|
|||
|
Liabilities:
|
|||||||||
|
Trading liabilities
|
1,2
|
22,573
|
|
22,573
|
|
||||
|
Debt
|
3
|
364,756
|
|
363,199
|
|
||||
|
Liabilities of consolidated CLOs
|
2,3
|
1,877,377
|
|
1,877,377
|
|
||||
|
Liabilities of discontinued operations and held for sale
|
1,2,3
|
5,006,901
|
|
5,006,901
|
|
||||
|
Total Liabilities
|
$
|
7,271,607
|
|
$
|
7,270,050
|
|
|||
|
December 31, 2013
|
|||||||||
|
Level within
Fair Value
Hierarchy
|
Fair Value
|
Carrying Value
|
|||||||
|
Assets:
|
|||||||||
|
Cash and cash equivalents-unrestricted
|
1
|
$
|
97,645
|
|
$
|
97,645
|
|
||
|
Cash and cash equivalents-restricted
|
1
|
26,395
|
|
26,395
|
|
||||
|
Trading assets
|
2,3
|
35,991
|
|
35,991
|
|
||||
|
Due from brokers, dealers, and trustees
|
1
|
—
|
|
—
|
|
||||
|
Investments in loans
|
2
|
171,087
|
|
171,087
|
|
||||
|
Loans owned
|
2
|
48,212
|
|
40,260
|
|
||||
|
Assets of consolidated CLOs
|
1,2,3
|
1,405,355
|
|
1,405,355
|
|
||||
|
Assets held for sale
|
1,2,3
|
4,950,727
|
|
4,950,727
|
|
||||
|
Total Assets
|
$
|
6,735,412
|
|
6,727,460
|
|
||||
|
Liabilities:
|
|||||||||
|
Trading liabilities
|
1,2
|
19,091
|
|
19,091
|
|
||||
|
Debt
|
3
|
266,581
|
|
269,594
|
|
||||
|
Due to brokers, dealers and trustees
|
1
|
8,193
|
|
8,193
|
|
||||
|
Liabilities of consolidated CLOs
|
2,3
|
1,336,380
|
|
1,336,380
|
|
||||
|
Liabilities held for sale
|
1,2,3
|
4,836,411
|
|
4,836,411
|
|
||||
|
Total Liabilities
|
$
|
6,466,656
|
|
$
|
6,469,669
|
|
|||
(18) Stockholders’ Equity
Tiptree’s authorized capital stock consists of
100,000,000
shares of preferred stock,
$0.001
par value,
200,000,000
shares of Class A common stock,
$0.001
par value, and
50,000,000
shares of Class B common stock,
$0.001
par value. As of
F-57
TIPTREE FINANCIAL INC. AND SUBSIDIARIES
Notes to Consolidated Financial Statements
(in thousands, except shares and per share data)
December 31, 2014
December 31, 2014 and December 31, 2013, no shares of preferred stock were issued and outstanding. As of December 31, 2014 and December 31, 2013, there were
31,830,174
and
10,556,390
shares of Class A common stock issued and outstanding, respectively. As of December 31, 2014 and December 31, 2013, there were
9,770,367
and
30,968,877
shares of Class B common stock issued and outstanding, respectively.
All shares of our Class A common stock have equal rights as to earnings, assets, dividends and voting. Shares of Class B common stock have equal voting rights but no economic rights (including no right to receive dividends or other distributions upon liquidation, dissolution or otherwise). Distributions may be paid to holders of Class A common stock if, as and when duly authorized by our board of directors and declared out of assets legally available therefor.
On July 1, 2013, immediately prior to closing the Contribution Transactions, the Company filed the Fourth Articles of Amendment and Restatement with the Maryland Department of Assessments and Taxation in order to, among other things, rename its common stock as “Class A common stock”, with no change to the economic or voting rights of such stock and reclassify
50,000,000
authorized and unissued shares of its common stock as Class B common stock.
On July 1, 2013, in conjunction with the Contribution Transactions, Operating Company issued warrants to TFP, to purchase an aggregate of
2,098,500
shares of Class A common stock at an exercise price of
$8.48
per share, which are immediately exercisable and expire on June 12, 2017, and another warrant to purchase
1,510,920
shares of Class A common stock at an exercise price of
$5.36
per share, which is immediately exercisable and expires on June 30, 2022. TFP paid
$4,328
and
$6,846
, respectively, for these. Since these warrants were issued by Operating Company, they are not included as a component of stockholders’ equity of the Company. TFP also owns a warrant to purchase
652,500
shares of Class A common stock at
$11.33
per share which is immediately exercisable and expires on September 30, 2018.
Pursuant to Operating Company’s limited liability operating agreement, TFP has the right to redeem common units of Operating Company (including any common units issued upon exercise of the warrants described above) for an equal number of shares of Class A common stock of Tiptree (and an equal number of shares of Class B common stock held by TFP will be canceled). Tiptree may instead, at its election, deliver a cash amount (or combination of cash and Class A common stock) based on the fair market value of the Class A common stock on the redemption date. On July 18, 2014, TFP notified its limited partners that the Company will allow them to directly exchange TFP units for Class A common stock (at a rate of
2.798
shares of Class A common stock per TFP partnership unit). As of December 31, 2014, an aggregate of
21,198,510
Class A shares have been issued in exchange for
7,576,308
TFP units. The issuance of Tiptree Financial Inc. Class A shares and corresponding cancellation of Class B shares in exchange for the TFP units was accounted for as a
$258,096
adjustment within non-controlling interest and a net
$249,515
within additional paid-in capital after adjustments to taxable basis are applied.
For the year ended December 31, 2014, the Company did not declare or pay any cash dividends.
For the year ended December 31, 2013, the Company declared and paid quarterly cash dividends in the first three quarters of
$0.135
,
$0.02
and
$0.02
per common share of Class A stock totaling
$1,803
.
F-58
TIPTREE FINANCIAL INC. AND SUBSIDIARIES
Notes to Consolidated Financial Statements
(in thousands, except shares and per share data)
December 31, 2014
(19)
Accumulated Other Comprehensive Income
Activity in accumulated other comprehensive income/(loss) (AOCI), net of tax, for the year ended December 31, 2014 and 2013, was as follows:
|
Unrealized gains/ (losses) on securities
|
Unrealized gains/(losses) on interest rate swap
|
Total
|
|||||||||
|
Balance at December 31, 2012
|
$
|
311
|
|
$
|
—
|
|
$
|
311
|
|
||
|
Other comprehensive loss before reclassification
|
(224
|
)
|
—
|
|
(224
|
)
|
|||||
|
Amounts reclassified from AOCI
|
(54
|
)
|
—
|
|
(54
|
)
|
|||||
|
Period change
|
(278
|
)
|
—
|
|
(278
|
)
|
|||||
|
Balance at December 31, 2013
|
33
|
|
—
|
|
33
|
|
|||||
|
Other comprehensive gain before reclassification
|
(197
|
)
|
83
|
|
(114
|
)
|
|||||
|
Amounts reclassified from AOCI
|
(31
|
)
|
63
|
|
32
|
|
|||||
|
Period change
|
(228
|
)
|
146
|
|
(82
|
)
|
|||||
|
Balance at December 31, 2014
|
$
|
(195
|
)
|
$
|
146
|
|
$
|
(49
|
)
|
||
The table above includes activity for the year ended December 31, 2013 that relates to discontinued operations of PFG. For the year ended December 31, 2014,
$123
of the period change related to discontinued operations of PFG and the remainder related to other activity at Tiptree.
The following table presents the reclassification adjustments out of AOCI included in net income and the impacted line items on the income statement for the following period:
|
For the Year ended December 31, 2014
|
||||||
|
Components of AOCI
|
Amount reclassified from AOCI
|
Affected line item in statement where net income is presented
|
||||
|
Unrealized gains/(losses) on available for sale securities
|
$
|
50
|
|
Net realized gains on investments
|
||
|
Related tax (expense) benefit
|
(19
|
)
|
Provision for income tax
|
|||
|
$
|
31
|
|
Net change after tax
|
|||
|
Unrealized gains/ (losses) on interest rate swap
|
(97
|
)
|
Interest expense
|
|||
|
Related tax benefit (expense)
|
34
|
|
Provision for income tax
|
|||
|
$
|
(63
|
)
|
Net change after tax
|
|||
(
20
) Stock Based Compensation
Equity Plans
In June 2007, the Company adopted the Care Investment Trust Inc. Equity Plan (2007 Equity Plan), as amended in December 2011, which provides for the issuance of equity-based awards, including stock options, stock appreciation rights, restricted stock, restricted stock units, unrestricted stock awards and other awards based upon the Company’s Class A common stock that may be made to directors and executive officers, employees and to the Company’s advisors and consultants who are providing services to the Company as of the date of the grant of the award.
The 2007 Equity Plan will automatically expire on the 10th anniversary of the date it was adopted. The Board of Directors may terminate, amend, modify or suspend the 2007 Equity Plan at any time, subject to stockholder approval in the case of certain amendments as required by law, regulation or stock exchange.
The Board adopted the Tiptree 2013 Omnibus Incentive Plan (2013 Equity Plan) on August 8, 2013. The general purpose of the 2013 Equity Plan is to attract, motivate and retain selected employees, consultants and directors for the Company, to
F-59
TIPTREE FINANCIAL INC. AND SUBSIDIARIES
Notes to Consolidated Financial Statements
(in thousands, except shares and per share data)
December 31, 2014
provide them with incentives and rewards for superior performance and to better align their interests with the interests of the Company’s stockholders. As of December 31, 2014,
28,869
shares of immediately vested Class A common stock with an aggregate fair market value of
$223
were issued to employees and persons providing services to the Company as incentive compensation under the 2013 Equity Plan. As of December 31, 2014, the number of shares of Tiptree’s Class A common stock available for award under the 2013 Equity Plan is
1,793,274
shares of Class A common stock. Unless otherwise extended by the Board, the 2013 Equity Plan terminates automatically on August 8, 2023, the tenth anniversary of its adoption by the Board. As of December 31, 2014, there was no restricted stock unit activity associated with the 2013 Equity Plan.
As of December 31, 2014, no common shares remain for future issuance under the 2007 Equity Plan.
Included in vested shares for 2014 are
9,323
shares surrendered to pay taxes on behalf of the employees with shares vesting.
Immediately vested shares of common stock issued to the Company’s independent directors in respect to their annual retainer fees have been issued under the 2007 Equity Plan and the 2013 Equity Plan. During the year ended December 31, 2014, the Company issued
27,288
immediately vested shares of Class A common stock with an aggregate fair value of
$208
to the Company’s independent directors as part of their annual retainer. In addition, during the year ended December 31, 2014, the Company issued an aggregate of
28,869
shares of immediately vested shares to executives and service providers as incentive compensation.
The following table summarizes changes to the issuances under the Company’s 2013 Equity Plan for activity in 2014:
|
Number of shares issued
|
||
|
Available for issuance as of December 31, 2013
|
1,849,431
|
|
|
Shares Issued
|
(56,157
|
)
|
|
Available for issuance as of December 31, 2014
|
1,793,274
|
|
In June 2007, the Company adopted the Care Investment Trust Inc. Manager Equity Plan, which will automatically expire on the 10th anniversary of the date it was adopted. As of December 31, 2014,
134,629
common shares remain available for future issuances. No shares have been issued since March 30, 2012 from this plan.
Restricted share units
A holder of the restricted share units, as per the terms of the restricted stock unit agreement governing the awards, have all of the rights of a shareholder, including the right to vote and receive distributions. The restricted share units shall vest and become nonforfeitable with respect to one‑third of Tiptree shares granted on each of the first, second, and third anniversaries of the date of the grant.
The following table summarizes changes to the issuances of Restricted Stock Units under the Company’s 2007 and 2013 Equity Plan for the periods indicated:
|
Number of shares issuable in respect of RSUs
|
||
|
Unvested units as of December 31, 2012
|
102,984
|
|
|
Granted
|
19,310
|
|
|
Vested
|
(45,263
|
)
|
|
Forfeited
|
(4,728
|
)
|
|
Unvested units as of December 31, 2013
|
72,303
|
|
|
Granted
|
—
|
|
|
Vested
|
(33,678
|
)
|
|
Forfeited
|
—
|
|
|
Unvested units as of December 31, 2014
|
38,625
|
|
F-60
TIPTREE FINANCIAL INC. AND SUBSIDIARIES
Notes to Consolidated Financial Statements
(in thousands, except shares and per share data)
December 31, 2014
On August 8, 2013, the Company granted
19,310
shares to employees of the Company. These shares have a grant date fair value of
$134
and will vest over a period of three years beginning on January 3, 2014.
As of December 31, 2014, the total unrecognized compensation cost related to restricted units granted was
$103
, which is expected to be recognized as compensation expense over a weighted average period of approximately
one
year.
Restricted stock unit expense was
$233
and
$73
for the years ended December 31, 2014 and 2013, respectively. These expenses are included within payroll expense in the consolidated statements of operations.
Philadelphia Financial Group, Inc.
On October 14, 2010, the PFG board of directors adopted an equity incentive plan (the PFG Plan) in which a total of
546,136
shares of common stock of PFG were reserved and available for issuance under the PFG Plan. The number of shares of PFG stock was increased to
583,300
during 2012. As of December 31, 2014,
564,092
shares have been granted to PFG employees.
Under the terms of the PFG Plan, the common stock shares shall vest and become nonforfeitable with respect to one-third of the shares initially granted on each of the first, second, and third anniversaries of the grant date. Grant dates were April 16, 2012, December 19, 2012 and March 8, 2013.
The Company has determined that the measurement date for shares granted under the PFG Plan awarded to employees occurs when the PFG common stock vests. The fair value of the unvested common stock granted is initially estimated based on the fair value of the individual assets and liabilities of PFG on the date of grant, and subsequently re-measured on each reporting date throughout the vesting period with changes in fair value during the requisite service period recognized as compensation cost through that period. The per unit fair value of unvested PFG common stock was
$0.00
and
$2.03
as of December 31, 2014 and December 31, 2013, respectively.
As of December 31, 2014 the total unrecognized compensation cost related to PFG common stock was
$24
, which is expected to be recognized as compensation expense over a weighted average period of less than
one
year. Total unrecognized compensation cost was
$89
as of December 31, 2013.
Expense incurred for PFG stock issued under the plan for the years ended December 31, 2014 and 2013, respectively, was
$66
and
$65
.
(21)
Related Party Transactions
Tricadia Holdings, L.P.
On June 30, 2012, TAMCO, TFP and Tricadia entered into a Transition Services Agreement in connection with the internalization of the management of Tiptree. Pursuant to this agreement, Tricadia provides TAMCO and its affiliates, including TFP, with the services of designated officers as well as certain back office, administrative, information technology, insurance, legal and accounting services. The Transition Services Agreement was assigned to the Company in connection with the Contribution Transactions. The Company pays Tricadia specified prices per service. The Company owed a total fee to Tricadia of
$1,329
and
$1,684
for 2014 and 2013, respectively. For the years ended December 31, 2014 and 2013, the Company accrued for
154,044
shares and issued
194,868
shares of Class A common stock to Tricadia under the Transition Services Agreement in respect of services rendered.
Mariner Investment Group LLC
TFP and BackOffice Services Group, Inc. (BOSG) entered into an Administrative Services Agreement on June 12, 2007 (Administrative Services Agreement), which was assigned to the Operating Company on July 1, 2013 in connection with the Contribution Transactions, under which BOSG provides the services of certain back office, administrative and accounting services to the Company. BOSG is an affiliate of Mariner Investment Group (Mariner). Under the Administrative Services Agreement, the Company pays BOSG a quarterly fee of
0.025%
of the Company’s Net Assets, defined as the Company’s total assets less total liabilities, including accrued income and expense, calculated in accordance with GAAP. This fee totaled
$413
and
$379
in 2014 and 2013, respectively. The Administrative Services Agreement has successive
one year
terms but may be terminated by the Company or BOSG upon
60
days prior notice.
F-61
TIPTREE FINANCIAL INC. AND SUBSIDIARIES
Notes to Consolidated Financial Statements
(in thousands, except shares and per share data)
December 31, 2014
(22)
Concentration of Credit Risk
Counterparties
The Company is subject to certain inherent credit risks arising from its transactions involving counterparties to CDS, CDX and IRS positions.
As of December 31, 2014, the CDS and CDX positions have a notional amount of
$2,652
and net notional amount
$92
and a fair value of
$99
and
$10,734
. The counterparty for the CDS and CDX positions are Bank of America, N.A. and Morgan Stanley.
As of December 31, 2014, the IRS positions have an aggregate notional amount of
$78,988
and a fair value of
$(2,914)
. The counterparty for the IRS positions are First Niagara Bank and Wells Fargo Bank, N.A.
The Company’s policy is to monitor its market exposure and counterparty risk through the use of various credit exposure reporting and control procedures.
See Note 14—Derivative Financial Instruments and Hedging, for further detail.
(23) Income Taxes
The Company’s provision for income taxes consists of the following:
|
Year Ended December 31,
|
|||||||
|
2014
|
2013
|
||||||
|
Current tax expense:
|
|||||||
|
Federal
|
$
|
3,459
|
|
$
|
2,779
|
|
|
|
State
|
931
|
|
754
|
|
|||
|
Total current tax expense
|
$
|
4,390
|
|
$
|
3,533
|
|
|
|
Deferred tax expense:
|
|||||||
|
Federal
|
(1,043
|
)
|
(1,069
|
)
|
|||
|
State
|
794
|
|
(1,904
|
)
|
|||
|
Total deferred tax expense
|
(249
|
)
|
(2,973
|
)
|
|||
|
Total income tax expense (benefit)
|
$
|
4,141
|
|
$
|
560
|
|
|
The Company's income taxes (receivable) payable as of December 31, 2014 and 2013 were
$(1,691)
and
$1,811
, respectively.
The total income tax expense of
$4,141
for the period ended December 31, 2014 was reflected as a component of net income (loss) from continuing operations. This tax expense represented a consolidated total of all of Tiptree’s subsidiaries, but excludes
$5,525
related to PFG which is included in discontinued operations.
As a result of the issuance of Tiptree Financial Inc. Class A shares and corresponding cancellation of Class B shares in exchange for the TFP units, the company recorded
$8,581
of deferred tax liabilities as a component of additional paid-in capital for taxable basis differences in the net assets acquired (see Note 18 - Stockholders’ Equity for additional information on the exchange).
The total income tax expense of
$560
for the period ended December 31, 2013 was reflected as a component of net income (loss) from continuing operations. This tax expense represented a consolidated total of all of Tiptree’s subsidiaries and excludes
$6,090
related to PFG, which is included in discontinued operations. In addition, Tiptree incurred approximately
$2,137
of current federal and state income tax expense as a result of the gain on sale of the Bickford Portfolio (see Notes 5—Dispositions, Assets Held for Sale and Discontinued Operations and 11—Real Estate). A significant portion of the gain was reduced by available net operating loss carryforwards that were previously unrecorded as a result of Care, Inc.’s historical 0% statutory income tax rate in effect as of December 31, 2012 and June 30, 2013, prior to the Contribution Transaction. The tax associated with the Bickford Portfolio gain is included with tax expense from continuing operations, rather than with discontinued operations because it arose as a result of Tiptree’s termination of REIT status, described below.
As a result of the Contribution Transaction on July 1, 2013, Tiptree is no longer qualified as a REIT. Pursuant to the Internal Revenue Code, when a corporation loses REIT status within a tax year it becomes taxable retroactively to the first day of
F-62
TIPTREE FINANCIAL INC. AND SUBSIDIARIES
Notes to Consolidated Financial Statements
(in thousands, except shares and per share data)
December 31, 2014
the tax year. As of July 1, 2013, an adjustment of
$2,583
was made to the Company’s deferred tax assets as a result of the Company no longer qualifying as a REIT.
A reconciliation of the expected federal income tax expense on income from continuing operations using the
35%
federal statutory income tax rate to the actual income tax expense and resulting effective income tax rate is as follows for the periods indicated below:
|
Year Ended December 31,
|
|||||||
|
2014
|
2013
|
||||||
|
Income before income taxes from continuing operations
|
$
|
788
|
|
$
|
16,267
|
|
|
|
Federal statutory income tax rate
|
35
|
%
|
35
|
%
|
|||
|
Expected federal income tax expense at 35%
|
276
|
|
5,693
|
|
|||
|
State income tax expense, net of federal benefit
|
1,459
|
|
(532
|
)
|
|||
|
Effect of permanent differences
|
(278
|
)
|
(328
|
)
|
|||
|
Effect of changes in valuation allowance
|
1,350
|
|
827
|
|
|||
|
Effect of change in tax status
|
—
|
|
677
|
|
|||
|
Effect of income (loss) allocated to non-taxable entities
|
371
|
|
(5,785
|
)
|
|||
|
Non-deductible transaction costs
|
1,639
|
|
—
|
|
|||
|
Deferred tax true-up and other items
|
(676
|
)
|
8
|
|
|||
|
Tax on income from continuing operations
|
$
|
4,141
|
|
$
|
560
|
|
|
|
Effective tax rate
|
525.5
|
%
|
3.44
|
%
|
|||
For the twelve months ended December 31, 2014, the Company’s effective tax rate on income from continuing operations was equal to
525.5%
, which does not bear a customary relationship to statutory income tax rates. Differences from the statutory income tax rates are primarily the result of: (i) state income taxes; (ii) non-deductible transaction costs incurred on the Fortegra acquisition; and (iii) the effect of changes in valuation allowance on net operating losses reported by TFI, Siena, Luxury and MFCA.
For the twelve months ended December 31, 2013, the Company’s effective tax rate on income from continuing operations was equal to
3.44%
, which does not bear a customary relationship to statutory income tax rates. Differences from the statutory income tax rates are primarily the result of: (i) income and (loss) attributable to non-taxable entities which do not result in income tax expense or (benefit) to the Company; (ii) the one-time effect of the Company’s change from nontaxable to taxable status which must be reported as part of the income tax provision on continuing operations; and (iii) the effect of changes in valuation allowance on net operating losses reported by Siena and MFCA.
F-63
TIPTREE FINANCIAL INC. AND SUBSIDIARIES
Notes to Consolidated Financial Statements
(in thousands, except shares and per share data)
December 31, 2014
The table below outlines the Company’s net deferred tax asset as of the respective balance sheet dates:
|
As of December 31,
|
|||||||
|
2014
|
2013
|
||||||
|
Net operating loss carryforward
|
$
|
4,594
|
|
$
|
4,328
|
|
|
|
Unearned premium
|
7,960
|
|
—
|
|
|||
|
Other
|
2,994
|
|
644
|
|
|||
|
Total deferred tax assets
|
15,548
|
|
4,972
|
|
|||
|
Valuation allowance
|
(2,708
|
)
|
(1,257
|
)
|
|||
|
Total net deferred tax assets
|
12,840
|
|
3,715
|
|
|||
|
Amortization/depreciation
|
31,083
|
|
—
|
|
|||
|
Deferred revenue
|
7,932
|
|
—
|
|
|||
|
Unrealized gain
|
2,552
|
|
243
|
|
|||
|
Equity gain
|
11,487
|
|
321
|
|
|||
|
Distributions
|
1,090
|
|
178
|
|
|||
|
Other
|
4,334
|
|
—
|
|
|||
|
Total deferred tax liabilities
|
58,478
|
|
742
|
|
|||
|
Net deferred tax (liability)/asset
|
$
|
(45,638
|
)
|
$
|
2,973
|
|
|
Separate returns are filed for Tiptree and each of the Company’s subsidiaries that are required to file returns (PFG, Siena Capital Finance Acquisition Corp., Luxury Mortgage Corp., Fortegra Financial Corp., MFCA Funding, Care HSL TRS Holdings, and TAMCO Manager Inc.). These subsidiaries file returns in various state jurisdictions, and as such may have state tax obligations. As needed, the Company will take all necessary steps to comply with any tax withholding requirements.
As of December 31, 2014, the Company had total U. S. Federal net operating loss carryforwards (“NOLs”) equal to
$7,710
arising from continuing operations. The NOLs associated with PFG have been reclassified as discontinued operations and are not reflected in the table below. The following table presents the U.S. Federal NOLs by tax year of expiration as of:
|
December 31, 2014
|
|||||
|
Tax Year of Expiration
|
|||||
|
2027
|
$
|
536
|
|
||
|
2028
|
246
|
|
|||
|
2029
|
119
|
|
|||
|
2030
|
3,035
|
|
|||
|
2031
|
150
|
|
|||
|
2032
|
189
|
|
|||
|
2033
|
1,173
|
|
|||
|
2034
|
2,262
|
|
|||
|
Total
|
$
|
7,710
|
|
||
In addition to the U.S. Federal NOLs, Tiptree and its subsidiaries have NOLs in various state jurisdictions totaling
$47,113
.
Valuation allowances have been established for net operating loss carryforwards and other deferred assets generated by MFCA Management, Siena, and Luxury, to the extent management has assessed it is more likely than not they will expire unutilized based on existing positive and negative evidence. Management believes it is more likely than not the remaining net operating loss carryforwards will be utilized prior to their expiration dates, As a result of this assessment, as of December 31, 2014, the consolidated valuation allowance for Tiptree was
$2,708
. As of December 31, 2013, the consolidated valuation allowance for Tiptree was
$1,257
. In 2014, the company recorded a net increase in its valuation allowances equal to
$1,451
, compared with a decrease in its valuation allowance of
$6,833
in 2013. Note that these valuation allowance totals exclude the valuation allowances recorded at PFG in the amount of
$375
and
$254
for 2014 and 2013, respectively, which are not included due to the re-classification of PFG to assets held for sale.
F-64
TIPTREE FINANCIAL INC. AND SUBSIDIARIES
Notes to Consolidated Financial Statements
(in thousands, except shares and per share data)
December 31, 2014
The Company’s primary tax jurisdiction is the United States, which currently has a statutory income tax rate equal to
35%
. The Company also operates in several state jurisdictions that have an average combined statutory rate equal to approximately
5%
. Both the U.S. federal rate and the statutory rates are before the consideration of rate reconciling items. As of December 31, 2014 and 2013, the Company had no material unrecognized tax benefits or accrued interest and penalties. The Company’s policy is to account for interest as a component of interest expense and penalties as a component of other expense. Federal tax years
2011
through
2013
were open for examination as of December 31, 2014.
(24)
Earnings Per Share
The Company calculates basic net income per common share based on the Company’s common stock outstanding as well as its unvested restricted share units. The unvested restricted share units are included because they are eligible to receive dividends. Diluted net income for the period takes into account the effect of dilutive instruments, such as any options on common shares, but uses the average share price for the period in determining the number of incremental shares that are to be added to the weighted average number of common shares outstanding. Diluted net income also includes the minimal dilutive impact of the
3,609,420
Operating Company warrants held by TFP as part of the Contribution Transactions as summarized in Note 1—Organization. Earnings per share data excludes Tiptree’s Class B common stock, as the Class B common stock evidences a voting right without any economic interest.
The following table presents a reconciliation of basic and diluted net income per common share for the following periods:
|
Year Ended December 31,
|
||||||||
|
2014
|
2013
|
|||||||
|
Net (loss) income from continuing operations
|
$
|
(3,353
|
)
|
$
|
15,707
|
|
||
|
Less:
|
||||||||
|
Net income from continuing operations attributable to non-controlling interests (1)
|
1,939
|
|
11,445
|
|
||||
|
Net (loss) income from continuing operations available to Class A common shares
|
(5,292
|
)
|
4,262
|
|
||||
|
Discontinued operations, net
|
7,937
|
|
25,022
|
|
||||
|
Less:
|
||||||||
|
Net income from discontinued operations attributable to non-controlling interests (1)
|
4,355
|
|
18,891
|
|
||||
|
Net income from discontinued operations available to Class A common shares
|
3,582
|
|
6,131
|
|
||||
|
Net (loss) income available to Class A common shares
|
$
|
(1,710
|
)
|
$
|
10,393
|
|
||
|
Basic:
|
||||||||
|
(Loss) income from continuing operations
|
$
|
(0.31
|
)
|
$
|
0.41
|
|
||
|
(Loss) income from discontinued operations
|
0.21
|
|
0.60
|
|
||||
|
Net (loss) income available to Class A common shares
|
$
|
(0.10
|
)
|
|
$
|
1.01
|
|
|
|
Diluted:
|
||||||||
|
(Loss) income from continuing operations
|
$
|
(0.31
|
)
|
$
|
0.41
|
|
||
|
Income (loss) from discontinued operations
|
0.21
|
|
0.60
|
|
||||
|
Net (loss) income available to Class A common shares
|
$
|
(0.10
|
)
|
$
|
1.01
|
|
||
|
Weighted average Class A common shares outstanding:
|
||||||||
|
Basic
|
16,771,980
|
|
10,250,438
|
|
||||
|
Diluted
|
16,771,980
|
|
10,250,438
|
|
||||
(1) For the year ended December 31, 2014, the total net income attributable to non-controlling interest was
$6,294
, comprised of
$1,939
due to continuing operations and
$4,355
attributable to discontinued operations. For the year ended December 31, 2013, the total net income attributable to non-controlling interest was
$30,336
, comprised of
$11,445
due to continuing operations and
$18,891
attributable to discontinued operations.
F-65
TIPTREE FINANCIAL INC. AND SUBSIDIARIES
Notes to Consolidated Financial Statements
(in thousands, except shares and per share data)
December 31, 2014
The above table excludes the anti-dilutive effect of the 2008 warrant convertible into
652,500
shares because the exercise price of
$11.33
was greater than the average market price during such periods.
(25) Subsequent Events
On January 1, 2015, Fortegra exercised an option to purchase the
37.6%
ownership interest in ProtectCELL it did not own. Fortegra made an initial payment of
$3,000
, and will make a final payment later in 2015 for the remainder of the option price, to be calculated based on ProtectCELL's final audited results for the year ended December 31, 2014.
On January 26, 2015, Tiptree entered into a First Amendment to its existing Fortress credit agreement (the Amendment). The Amendment provides for additional term loans in an aggregate principal amount of
$25,000
to Tiptree and will have the same maturity date, margin above LIBOR, principal repayment terms, and conditions and covenants as the existing term loans under the existing Fortress credit agreement, subject to certain exceptions in the Amendment. Tiptree is required to prepay
$25,000
of the loan upon the closing of the PFG sale. In addition, Tiptree is required to pay a prepayment premium of
2%
of the outstanding loan amount if Tiptree voluntarily prepays the loan prior to June 30, 2016.
On February 9, 2015, affiliates of Care formed a joint venture to own and operate
five
seniors housing communities with affiliates of Royal Senior Care Management LLC (“Royal”). Care owns an
80%
interest in the joint venture, while affiliates of Royal own the remaining
20%
interest and provide management services to the communities under a management contract. In connection with the acquisition, Care and Royal secured a
$22,500
,
5
year loan, (subject to a holdback) which includes
36
months of interest only payments and a
$2,000
earn out feature.
On March 30, 2015, affiliates of Care acquired
six
seniors housing communities for
$54.5 million
. The properties are leased to affiliates of Greenfield Holdings, LLC who will operate the properties. In connection with the acquisition, Care secured a
$39.5 million
, 10 year loan (subject to a holdback), which includes
18
months of interest only payments.
The Company has evaluated events that have occurred from December 31, 2014 through
March 31, 2015
(the date this Form 10-K was filed), and except as already included in the notes to the consolidated financial statements, it believes that no events have occurred that would require recognition or additional disclosures in these audited consolidated financial statements.
F-66
Not applicable.
Management evaluated internal control over financial reporting for the businesses contributed by TFP and this assessment has been completed with this December 31, 2014 Annual Report on Form 10-K. The Company’s acquisition of Luxury Mortgage was completed in January 2014 and this business is excluded from management’s annual certifications pursuant to Section 906 and Section 302 of the Sarbanes-Oxley Act of 2002 for December 31, 2014. Management anticipates completing the assessment for Luxury with its December 31, 2015 Annual Report on Form 10-K.
The Company’s management, with the participation of its Co-Chief Executive Officer and Chief Operating Officer, has evaluated the effectiveness of the design and operation of our disclosure controls and procedures (as defined in Rule 13a-15(e) or 15d-15(e) of the Exchange Act) as of December 31, 2014. Based upon that evaluation the Company’s Co-Chief Executive Officer and Chief Operating Officer have concluded that, as of December 31, 2014, the Company’s disclosure controls and procedures were effective in causing material information relating to the Company to be recorded, processed, summarized and reported by management in a timely basis and ensuring the quality and timeliness of the Company’s public disclosures with SEC disclosure obligations.
Management’s Annual Report on Internal Control over Financial Reporting
The Company’s management is responsible for establishing and maintaining adequate internal control over financial reporting for Tiptree. The Company’s internal control over financial reporting is designed to provide reasonable assurance regarding the reliability of financial reporting and the preparation of consolidated financial statements for external purposes in accordance with generally accepted accounting principles. The Company’s internal control over financial reporting includes those policies and procedures that:
(i) pertain to the maintenance of records that, in reasonable detail, accurately and fairly reflect the transactions and dispositions of the assets of the Company;
(ii) provide reasonable assurance that transactions are recorded as necessary to permit preparation of consolidated financial statements in accordance with generally accepted accounting principles, and that receipts and expenditures of the Company are being made only in accordance with authorizations of management and directors of the Company; and
(iii) provide reasonable assurance regarding prevention or timely detection of unauthorized acquisition, use or disposition of the Company’s assets that could have a material effect on the consolidated financial statements.
Because of its inherent limitations, internal control over financial reporting may not prevent or detect misstatements. Also, projections of any evaluation of the effectiveness to future periods are subject to the risk that controls may become inadequate because of changes in conditions, or that the degree of compliance with the policies and procedures included in such controls may deteriorate.
The Company conducted an evaluation of the effectiveness of its internal control over financial reporting based upon the framework in the 2013 Internal Control - Integrated Framework issued by the Committee of Sponsoring Organizations of the Treadway Commission. Based upon such evaluation, Tiptree’s management concluded that internal control over financial reporting was effective as of December 31, 2014.
The Company’s independent auditor did not conduct an audit of or render any report with respect to internal control over financial reporting as of December 31, 2014 because the Company is neither an accelerated filer nor a large accelerated filer.
None.
55
Information concerning our executive officers is incorporated herein by reference to information included in the Proxy Statement for the Company’s 2015 Annual Meeting of Stockholders.
Information with respect to our directors and the nomination process is incorporated herein by reference to information included in the Proxy Statement for the Company’s 2015 Annual Meeting of Stockholders.
Information regarding our audit committee and our audit committee financial experts is incorporated herein by reference to information included in the Proxy Statement for the Company’s 2015 Annual Meeting of Stockholders.
Information required by Item 405 of Regulation S-K is incorporated herein by reference to information included in the Proxy Statement for the Company’s 2015 Annual Meeting of Stockholders.
Information with respect to executive compensation is incorporated herein by reference to information included in the Proxy Statement for the Company’s 2015 Annual Meeting of Stockholders.
Information with respect to security ownership of certain beneficial owners and management is incorporated herein by reference to information included in the Proxy Statement for the Company’s 2015 Annual Meeting of Stockholders.
Information with respect to such contractual relationships and independence is incorporated herein by reference to the information in the Proxy Statement for the Company’s 2015 Annual Meeting of Stockholders.
Information with respect to principal accounting fees and services and pre-approval policies are incorporated herein by reference to information included in the Proxy Statement for the Company’s 2015 Annual Meeting of Stockholders.
|
The following documents are filed as a part of this Form 10-K:
|
|
|
|
|
|
Financial Statements:
|
|
|
|
|
|
Exhibits:
|
|
|
The Exhibits listed in the Index of Exhibits, which appears immediately following the signature page and is incorporated herein by reference, as filed as part of this Form 10-K.
|
|
E
SIGNATURES
Pursuant to the requirements of Section 13 or 15(d) of the Securities Exchange Act of 1934, Tiptree Financial Inc. has duly caused this report to be signed on its behalf by the undersigned, there unto duly authorized.
Tiptree Financial Inc.
Date:
March 31, 2015
By:
/s/ Geoffrey N. Kauffman
Geoffrey N. Kauffman
Co-Chief Executive Officer
Pursuant to the requirements of the Securities Act, this Annual Report on Form 10-K, has been signed by the following persons in the capacities and on the dates indicated:
|
Signature
|
|
Title
|
|
Date
|
|
/s/ Geoffrey N. Kauffman
Geoffrey N. Kauffman
|
|
Co-Chief Executive Officer and Director (Principal Executive Officer)
|
|
March 31, 2015
|
|
/s/ Julia Wyatt
Julia Wyatt
|
|
Chief Operating Officer (Principal Financial Officer)
|
|
March 31, 2015
|
|
/s/ Patrick Huvane
Patrick Huvane
|
|
Chief Accounting Officer (Principal Accounting Officer)
|
|
March 31, 2015
|
|
/s/ Michael G. Barnes
Michael G. Barnes
|
|
Executive Chairman and Director
|
|
March 31, 2015
|
|
/s/ Jonathan Ilany
Jonathan Ilany
|
|
Co-Chief Executive Officer and Director
|
|
March 31, 2015
|
|
/s/ Lesley Goldwasser
Lesley Goldwasser
|
|
Director
|
|
March 31, 2015
|
|
/s/ William A. Houlihan
William A. Houlihan
|
|
Director
|
|
March 31, 2015
|
|
/s/ Richard Price
Richard Price
|
|
Director
|
|
March 31, 2015
|
|
/s/ Bradley E. Smith
Bradley E. Smith
|
|
Director
|
|
March 31, 2015
|
57
E
EXHIBIT INDEX
Exhibit No.
Description
|
3.1
|
Fourth Articles of Amendment and Restatement of the Registrant, effective July 1, 2013 (previously filed as Exhibit 3.1 to the Registrant’s Current Report on Form 8-K (File No. 001-33549), filed on July 2, 2013 and herein incorporated by reference).
|
|
3.2
|
Third Amended and Restated Bylaws of the Registrant (previously filed as Exhibit 3.1 to the Registrant’s Current Report on Form 8-K (File No. 001-33549), filed on May 14, 2014 and herein incorporated by reference).
|
|
3.3
|
Articles Supplementary of Tiptree Financial Inc., dated December 29, 2014 (previously filed as Exhibit 3.1 to the Registrant’s Current Report on Form 8-K (File No. 001-33549), filed on December 29, 2014 and herein incorporated by reference).
|
|
4.1
|
Form of Certificate for Class A Common Stock (previously filed as Exhibit 4.1 to the Registrant’s Registration Statement on Form 8-A/A, as amended (File No. 001-33549), filed on August 8, 2013 and herein incorporated by reference).
|
|
4.2
|
Amended and Restated Limited Liability Company Agreement of Tiptree Operating Company, LLC, dated July 1, 2013 (previously filed as Exhibit 4.2 to the Registrant’s Current Report on Form 8-K (File No. 001-33549), filed on July 2, 2013 and herein incorporated by reference).
|
|
4.3
|
Registration Rights Agreement, dated July 1, 2013, between the Registrant and Tiptree Financial Partners, L.P. (previously filed as Exhibit 4.1 to the Registrant’s Current Report on Form 8-K (File No. 001-33549), filed on July 2, 2013 and herein incorporated by reference).
|
|
4.4
|
Registration Rights Agreement by and between the Registrant and Tiptree Financial Partners, L.P., dated as of March 16, 2010 (previously filed as Exhibit 10.2 to the Registrant’s Current Report on Form 8-K (File No. 001-33549), filed on March 16, 2010 and herein incorporated by reference).
|
|
10.1
|
Warrant to Purchase Common Stock, dated as of September 30, 2008 (previously filed as Exhibit 10.2 to the Registrant’s Current Report on Form 8-K (File No. 001-33549), filed on October 2, 2008 and herein incorporated by reference).
|
|
10.2
|
Care Investment Trust Inc. Equity Plan (previously filed as Exhibit 10.4 to the Registrant’s Quarterly Report on Form 10-Q (File No. 001-33549), filed on August 14, 2007 and herein incorporated by reference).**
|
|
10.3
|
Care Investment Trust Inc. Manager Equity Plan (previously filed as Exhibit 10.5 to the Registrant’s Quarterly Report on Form 10-Q (File No. 001-33549), filed on August 14, 2007 and herein incorporated by reference).**
|
|
10.4
|
Form of Restricted Stock Agreement under the 2007 Care Investment Trust Inc. Equity Plan (previously filed as Exhibit 10.5 to the Registrant’s Registration Statement on Form S-11, as amended (File No. 333-141634), filed on June 7, 2007 and herein incorporated by reference).**
|
|
10.5
|
Form of Restricted Stock Agreement under the 2007 Care Investment Trust Inc. Equity Plan (previously filed as Exhibit 10.6 to the Registrant’s Registration Statement on Form S-11, as amended (File No. 333-141634), filed on June 7, 2007 and herein incorporated by reference).**
|
|
10.6
|
Form of Restricted Stock Agreement under the 2007 Care Investment Trust Inc. Manager Equity Plan (previously filed as Exhibit 10.8 to the Registrant’s Registration Statement on Form S-11, as amended (File No. 333-141634), filed on June 7, 2007 and herein incorporated by reference).**
|
|
10.7
|
Form of Amended and Restated Performance Share Award Agreement under the Care Investment Trust Inc. Equity Plan (previously filed as Exhibit 10.30 to the Registrant’s Annual Report on Form 10-K (File No. 001-33549), filed on March 16, 2010 and herein incorporated by reference).**
|
|
10.8
|
Tiptree Financial Inc. 2013 Omnibus Incentive Plan (previously filed as Exhibit 10.1 to the Registrant’s Current Report on Form 8-K (File No. 001-33549), filed on November 12, 2013 and herein incorporated by reference).**
|
|
10.9
|
Form of Indemnification Agreement (previously filed as Exhibit 10.9 to the Registrant’s Registration Statement on Form S-11, as amended (File No. 333-141634), filed on June 7, 2007 and herein incorporated by reference).
|
58
E
|
10.10
|
Amended and Restated Executive Employment Agreements, dated as of July 1, 2013, among the Registrant, Tiptree Asset Management, LLC and Geoffrey Kauffman (previously filed as Exhibit 10.1 to the Registrant’s Quarterly Report on Form 10-Q (File No. 001-33549), filed on August 13, 2013 and herein incorporated by reference).**
|
|
10.11
|
Master Transaction Agreement, dated as of November 22, 2011, among Hartford Life Insurance Company, Hartford Life and Annuity Insurance Company and Philadelphia Financial Administration Services Company (previously filed as Exhibit 10.3 to the Registrant’s Quarterly Report on Form 10-Q (File No. 001-33549), filed on August 13, 2013 and herein incorporated by reference).
|
|
10.12
|
Administrative Services Agreement by and among Hartford Life Insurance Company, Hartford Life and Annuity Insurance Company, Hartford Fire Insurance Company and Philadelphia Financial Administration Services Company, LLC effective July 14, 2012 (previously filed as Exhibit 10.4 to the Registrant’s Quarterly Report on Form 10-Q (File No. 001-33549), filed on August 13, 2013 and herein incorporated by reference).
|
|
10.13
|
Senior Note Purchase Agreement by and among Philadelphia Financial Administration Services Company, LLC, as the Issuer and Fiscal Agent, RGA Worldwide Reinsurance Company, Ltd., as Noteholder, RGA Reinsurance Company, as Collateral Agent, PFASC Holdings, LLC and Philadelphia Financial Group, Inc., dated as of July 13, 2012 (previously filed as Exhibit 10.5 to the Registrant’s Quarterly Report on Form 10-Q (File No. 001-33549), filed on August 13, 2013 and herein incorporated by reference).
|
|
10.14
|
Transition Services Agreement, dated as of June 30, 2012, among Tiptree Asset Management Company, LLC, Tricadia Holdings, L.P. and Tiptree Operating Company, LLC (as assignee of Tiptree Financial Partners, L.P.) (previously filed as Exhibit 10.6 to the Registrant’s Quarterly Report on Form 10-Q (File No. 001-33549), filed on August 13, 2013 and herein incorporated by reference).
|
|
10.15
|
Credit Agreement, dated as of September 18, 2013, between Tiptree Operating Company, LLC and Fortress Credit Corp. as Lender, Administrative Agent, Collateral Agent and Lead Arranger (previously filed as Exhibit 10.1 to Form 8-K (File No. 001-33549), filed September 20, 2013 and herein incorporated by reference).
|
|
10.16
|
First Amendment to Credit Agreement, dated January 26, 2015, by and among Tiptree Operating Company, LLC, Fortress Credit Corp. as Administrative Agent, Collateral Agent and Lead Arranger, and the lenders party thereto (previously filed as Exhibit 10.1 to Form 8-K (File No. 001-33549), filed January 27, 2015 and herein incorporated by reference).
|
|
10.17
|
Executive Employment Agreement between Tiptree Asset Management Company, LLC and Jonathan Ilany dated as of October 1, 2014 (previously filed as Exhibit 10.1 to the Registrant’s Current Report on Form 8-K (File No. 001-33549), filed on October 3, 2014 and herein incorporated by reference).**
|
|
10.18
|
Agreement and Plan of Merger, dated August 11, 2014, among Tiptree Operating Company, LLC, Caroline Holdings LLC, Caroline Merger Sub, Inc. and Fortegra Financial Corporation (previously filed as Exhibit 10.1 to the Registrant’s Current Report on Form 8-K (File No. 001-33549), filed on August 12, 2014 and herein incorporated by reference).
|
|
10.19
|
Stock Purchase Agreement, dated as of October 29, 2014, among Tiptree Operating Company, LLC, each of the person’s identified as a Seller on the Signature Pages thereto and PFG Acquisition Corp. (previously filed as Exhibit 10.1 to the Registrant’s Quarterly Report on Form 10-Q (File No. 001-33549), filed on November 12, 2014 and herein incorporated by reference).
|
|
10.20
|
Stock Purchase Agreement by and among Reliance Holdings, LLC, Tiptree Operating Company, LLC, Tiptree Financial Inc., Reliance First Capital, LLC and each equityholder of Reliance First Capital, LLC, dated as of November 24, 2014 (filed herewith).
|
|
10.21
|
Employment Letter between Tiptree Asset Management Company, LLC and Neil C. Rifkind dated as of June 17, 2013 (filed herewith).**
|
|
21.1
|
Subsidiaries of the Registrant (filed herewith).
|
|
23.1
|
Consent of Independent Registered Public Accounting Firm (filed herewith).
|
|
31.1
|
Certification of Co-Chief Executive Officer pursuant to Section 302 of the Sarbanes-Oxley Act of 2002 (filed herewith).
|
|
31.2
|
Certification of Chief Operating Officer pursuant to Section 302 of the Sarbanes-Oxley Act of 2002 (filed herewith).
|
59
E
|
32.1
|
Certification of Co-Chief Executive Officer pursuant to Section 906 of the Sarbanes-Oxley Act of 2002 (furnished
|
herewith).
|
32.2
|
Certification of Chief Operating Officer pursuant to Section 906 of the Sarbanes-Oxley Act of 2002 (furnished herewith).
|
101.INS XBRL Instance Document*
101.SCH XBRL Taxonomy Extension Schema Document*
101.CAL XBRL Taxonomy Extension Calculation Linkbase Document*
101.LAB XBRL Taxonomy Extension Label Linkbase Document*
101.PRE XBRL Taxonomy Extension Presentation Linkbase Document*
101.DEF XBRL Taxonomy Extension Definition Linkbase Document*
* Attached as Exhibit 101 to this Annual Report on Form 10-K are the following materials, formatted in XBRL (eXtensible Business Reporting Language): (i) the Consolidated Balance Sheets (audited) for December 31, 2014 and December 31, 2013, (ii) the Consolidated Statements of Operations (audited) for the years ended December 31, 2014 and 2013, (iii) the Consolidated Statements of Comprehensive Income (audited) for the years ended December 31, 2014 and 2013, (iv) the Consolidated Statements of Changes in Stockholders’ Equity (audited) for the years ended December 31, 2014 and 2013, (v) the Consolidated Statements of Cash Flows (audited) for the years ended December 31, 2014 and 2013 and (vi) the Notes to the Consolidated Financial Statements (audited).
** Denotes a management contract or compensatory plan, contract or arrangement.
60
TABLE OF CONTENTS
Part IItem 1. BusinessItem 1A. Risk FactorsItem 1B. Unresolved Staff CommentsItem 2. PropertiesItem 3. Legal ProceedingsItem 4. Mine Safety DisclosuresPart IIItem 5. Market For Registrant S Common Equity, Related Stockholder Matters and Issuer Purchases Of Equity SecuritiesItem 6. Selected Financial DataItem 7. Management S Discussion and Analysis Of Financial Condition and Results Of OperationsItem 7A. Quantitative and Qualitative Disclosures About Market RiskItem 8. Financial Statements and Supplementary DataItem 9. Changes in and Disagreements with Accountants on Accounting and Financial DisclosureItem 9A. Controls and ProceduresItem 9B. Other InformationPart IIIItem 10. Directors, Executive Officers and Corporate GovernanceItem 11. Executive CompensationItem 12. Security Ownership Of Certain Beneficial Owners and Management and Related Stockholder MattersItem 13. Certain Relationships and Related Transactions, and Director IndependenceItem 14. Principal Accounting Fees and ServicesPart IVItem 15. Exhibits, Financial Statement Schedules