TIPTREE INC.
10-Ks and 10-Qs
|
|
|
|
|
|
|
|
|
|
|
|
|
|
|
|
|
|
|
|
|
|
|
|
|
|
|
|
|
|
|
|
|
|
|
|
|
|
|
|
|
|
|
|
|
|
|
|
|
|
|
|
|
|
|
|
|
|
|
UNITED STATES
SECURITIES AND EXCHANGE COMMISSION
Washington, D.C. 20549
FORM 10-K
|
(Mark One)
|
|
|
x
|
Annual Report Pursuant to Section 13 or 15(d) of the Securities Exchange Act of 1934
|
For the fiscal year ended
December 31, 2016
OR
|
o
|
Transition Report Pursuant to Section 13 or 15(d) of the Securities Exchange Act of 1934
|
For the transition period from to
Commission File Number: 001-33549
Tiptree Inc.
(Exact name of Registrant as Specified in Its Charter)
|
Maryland
|
38-3754322
|
|
(State or Other Jurisdiction of
|
(IRS Employer
|
|
Incorporation of Organization)
|
Identification No.)
|
|
780 Third Avenue, 21st Floor, New York, New York
|
10017
|
|
(Address of Principal Executive Offices)
|
(Zip Code)
|
(212) 446-1400
(Registrant’s Telephone Number, Including Area Code)
Securities Registered Pursuant to Section 12(b) of the Act: Class A Common Stock, par value $0.001 per share
Securities Registered Pursuant to Section 12(g) of the Act: None
Indicate by check mark if the registrant is a well-known seasoned issuer, as defined in Rule 405 of the Securities Act. Yes
¨
No
x
Indicate by check mark if the registrant is not required to file reports pursuant to Section 13 or Section 15(d) of the Act. Yes
¨
No
x
Indicate by check mark whether the registrant: (1) has filed all reports required to be filed by Section 13 or 15(d) of the Securities Exchange Act of 1934 during the preceding 12 months (or for such shorter period that the registrant was required to file such reports), and (2) has been subject to such filing requirements for the past 90 days. Yes
x
No
¨
Indicate by check mark whether the registrant has submitted electronically and posted on its corporate Web site, if any, every Interactive Data File required to be submitted and posted pursuant to Rule 405 of Regulation S-T (§232.405 of this chapter) during the preceding 12 months (or for such shorter period that the registrant was required to submit and post such files). Yes
x
No
¨
Indicate by check mark if disclosure of delinquent filers pursuant to Item 405 of Regulation S-K (§ 229.405) is not contained herein, and will not be contained, to the best of registrant’s knowledge, in definitive proxy or information statements incorporated by reference in Part III of this Form 10-K or any amendment to this Form 10-K.
¨
Indicate by check mark whether the registrant is a large accelerated filer, an accelerated filer, a non-accelerated filer or a smaller reporting company. See the definitions of “large accelerated filer,” “accelerated filer” and “smaller reporting company” in Rule 12b-2 of the Exchange Act. (Check one):
Large accelerated filer
¨
Accelerated filer
x
Non-accelerated filer
¨
Smaller reporting company
¨
Indicate by check mark whether the registrant is a shell company (as defined in Rule 12b-2 of the Exchange Act.) Yes
¨
No
x
As of June 30, 2016, the last business day of the registrant’s most recently completed second fiscal quarter, the aggregate market value of the registrant’s voting and non-voting common equity held by non-affiliates of the registrant was approximately $139,742,466, based upon the closing sales price of $5.48 per share as reported on the NASDAQ Capital Market. For purposes of this calculation, all of the registrant’s directors and executive officers were deemed to be affiliates of the registrant.
As of March 9, 2017, there were
34,988,864
shares, par value $0.001, of the registrant’s Class A common stock outstanding (including
6,514,768
shares of Class A common stock held by subsidiaries of the registrant) and
8,049,029
shares, par value $0.001, of the registrant’s Class B common stock outstanding.
Documents Incorporated by Reference
Certain information in the registrant’s definitive proxy statement to be filed with the Commission relating to the registrant’s 2017 Annual Meeting of Stockholders is incorporated by reference into Part III.
TIPTREE INC.
Table of Contents
Annual Report on Form 10-K
December 31, 2016
|
ITEM
|
Page Number
|
|
2
TIPTREE INC.
Table of Contents
Annual Report on Form 10-K
December 31, 2016
|
ITEM
|
Page Number
|
|
3
TIPTREE INC.
Table of Contents
Annual Report on Form 10-K
December 31, 2016
4
Forward-Looking Statements
Except for the historical information included and incorporated by reference in this Annual Report on Form 10-K, the information included and incorporated by reference herein are “forward-looking statements” within the meaning of Section 27A of the Securities Act and Section 21E of the Exchange Act. Forward-looking statements provide our current expectations or forecasts of future events and are not statements of historical fact. These forward-looking statements include information about possible or assumed future events, including, among other things, discussion and analysis of our future financial condition, results of operations and our strategic plans and objectives. When we use words such as “anticipate,” “believe,” “estimate,” “expect,” “intend,” “seek,” “may,” “might,” “plan,” “project,” “should,” “target,” “will,” or similar expressions, we intend to identify forward-looking statements.
Forward-looking statements are not guarantees of future performance and are subject to risks, uncertainties and other factors, many of which are beyond our control, are difficult to predict and could cause actual results to differ materially from those expressed or forecasted in the forward-looking statements. Our actual results could differ materially from those anticipated in these forward-looking statements as a result of various factors, including, but not limited to, those described in the section entitled “Risk Factors” and elsewhere in this Annual Report on Form 10-K and in our other public filings with the SEC.
The factors described herein are not necessarily all of the important factors that could cause actual results or developments to differ materially from those expressed in any of our forward-looking statements. Other unknown or unpredictable factors also could affect our forward-looking statements. Consequently, our actual performance could be materially different from the results described or anticipated by our forward-looking statements. Given these uncertainties, you should not place undue reliance on these forward-looking statements. Except as required by the applicable law, we undertake no obligation to update any forward-looking statements.
Market and Industry Data
Certain market data and industry data included in this Annual Report on Form 10-K were obtained from reports of governmental agencies and industry publications and surveys. We believe the data from third-party sources to be reliable based upon our management’s knowledge of the industry, but have not independently verified such data and as such, make no guarantees as to its accuracy, completeness or timeliness.
Note to Reader
In reading this Annual Report on Form 10-K, references to:
“1940 Act” means the Investment Company Act of 1940, as amended.
“Administrative Services Agreement” means the Administrative Services Agreement between Operating Company (as assignee of TFP) and BackOffice Services Group, Inc., dated as of June 12, 2007.
“AUM” means assets under management.
“Care” means Care Investment Trust LLC.
“CFPB” means the Consumer Financial Protection Bureau.
“CLOs” means collateralized loan obligations.
“Code” means the Internal Revenue Code of 1986, as amended.
“consolidated CLOs” means Telos 5, Telos 6 and Telos 7.
“Contribution Transactions” means the closing on July 1, 2013 of the transactions pursuant to the Contribution Agreement by and between the Company, Operating Company and TFP, dated as of December 31, 2012.
“Dodd-Frank Act” means the Dodd-Frank Wall Street Reform and Consumer Protection Act.
“EBITDA” means earnings before interest, taxes, depreciation and amortization.
“Exchange Act” means the Securities Exchange Act of 1934, as amended.
“Fortress” means Fortress Credit Corp., as administrative agent, collateral agent and lead arranger, and affiliates of Fortress that are lenders under the Credit Agreement among the Company, Fortress and the lenders party thereto.
“Fortegra” means Fortegra Financial Corporation.
“GAAP” means U.S. generally accepted accounting principles.
“Luxury” means Luxury Mortgage Corp.
“Mariner” means Mariner Investment Group LLC.
“MFCA” means Muni Funding Company of America LLC.
“NAIC” means the National Association of Insurance Commissioners.
“NPL” means nonperforming residential real estate mortgage loans.
“Operating Company” means Tiptree Operating Company, LLC.
“PFG” means Philadelphia Financial Group, Inc.
“Reliance” means Reliance First Capital, LLC.
5
“REO” means real estate owned.
“SEC” means the U.S. Securities and Exchange Commission.
“Securities Act” means the Securities Act of 1933, as amended.
“Siena” means Siena Capital Finance LLC.
“TAMCO” means Tiptree Asset Management Company, LLC.
“Telos” means Telos Asset Management, LLC.
“Telos 1” means Telos CLO 2006-1, Ltd.
“Telos 2” means Telos CLO 2007-2, Ltd.
“Telos 3” means Telos CLO 2013-3, Ltd.
“Telos 4” means Telos CLO 2013-4, Ltd.
“Telos 5” means Telos CLO 2014-5, Ltd.
“Telos 6” means Telos CLO 2014-6, Ltd.
“Telos 7” means Telos CLO 2016-7, Ltd.
“TFP” means Tiptree Financial Partners, L.P.
“Tiptree”, the “Company”, “we”, “its”, “us” and “our” means, unless otherwise indicated by the context, Operating Company and its consolidated subsidiaries, together with the standalone net assets held by Tiptree Inc. (formerly known as Tiptree Financial Inc.)
“Transition Services Agreement” means the Transition Services Agreement among TAMCO, Tricadia and Operating Company (as assignee of TFP), dated as of June 30, 2012.
“Tricadia” means Tricadia Holdings, L.P.
OVERVIEW
Our Business
Tiptree is focused on enhancing shareholder value by generating consistent growth and profitability at our operating companies. Our consolidated subsidiaries currently operate in the following businesses - specialty insurance, asset management, senior living and specialty finance.
We aim to:
|
•
|
be a leading provider of specialty insurance products, while maintaining our strong underwriting performance;
|
|
•
|
continue to grow and expand our seniors housing and asset management businesses; and
|
|
•
|
generate enhanced, risk adjusted investment returns.
|
When assessing potential acquisitions, we look for opportunities that:
|
•
|
have strong and experienced management teams;
|
|
•
|
generate attractive and stable cash returns;
|
|
•
|
complement existing businesses or strategies; and
|
|
•
|
have sustainable and scalable business models.
|
We evaluate our performance primarily by our shareholders’ total return, as measured by Adjusted EBITDA, growth in book value per share and dividends received.
As of December 31, 2016, Tiptree and its consolidated subsidiaries had 1,068 employees, 26 of which were at corporate headquarters.
Our Competitive Advantage
We believe our structure as a public company gives us the ability to have a long-term perspective focused on maximizing returns to our shareholders. We believe our long-term perspective provides us the flexibility to focus on strategy and profitability through multiple market cycles, including those that may negatively affect the value of our holdings in the short term. In addition, we have the flexibility to assess and evaluate complex situations, which we believe gives us advantages over competitors with limited capital allocation parameters and fixed time horizons.
6
Competition
Our businesses face competition, as discussed under “Operating Businesses” below. In addition to the competition our businesses face, we are subject to competition for acquisition opportunities. Our competitors for acquisitions include commercial and investment banks, mortgage companies, specialty finance companies, insurance companies, asset managers, private equity funds, hedge funds, family offices, real estate investment trusts, limited partnerships, business development companies and special purpose acquisition vehicles. Many of our competitors are significantly larger, have greater access to capital and other resources and may possess other competitive advantages.
Our businesses are subject to regulation as described under “Operating Businesses” below. The 1940 Act may limit the types and nature of businesses that we engage in and assets that we may acquire. See “Risk Factors-Risks Related to Regulatory and Legal Matters-Maintenance of our 1940 Act exemption will impose limits on our operations.”
OPERATING BUSINESSES
Specialty Insurance
Our specialty insurance segment is conducted through Fortegra Financial Corporation (together with its subsidiaries, “Fortegra”), an insurance holding company incorporated in 1981. Through its subsidiaries, Fortegra underwrites and administers specialty insurance products, primarily in the United States, and is a leading provider of credit and asset protection products and administration services. Our diverse range of products and services include credit protection insurance, warranty and service contract products, and insurance programs which front and underwrite niche personal and commercial lines of insurance. We also offer various other insurance related products and services throughout the U.S. through our non-regulated subsidiaries.
Products and Services
Credit Protection Insurance Products
- Our credit protection insurance products are designed to offer consumers protection from life events that limit a borrower’s ability to make payments on outstanding loan balances. These products offer consumers the option to protect credit card and installment loan balances or payments in the event of death, involuntary unemployment or disability.
Warranty and Service Contract Products
- Our warranty and service contract products provide consumers with coverage on automobiles, recreation vehicles, mobile devices, consumer electronics, appliances and furniture and bedding protecting them from certain covered losses. These products offer replacement, service or repair coverage in the event of mechanical breakdown, accidental damage, theft and water damage. Some of our warranty and service contract products are extensions of warranty coverage originally provided by original equipment manufacturers.
Programs
- Our program business is focused on fronting and underwriting certain niche commercial and personal lines insurance coverages for general agents and other program managers that require broad licensure, an “A-” or better A.M. Best rating, and specialized knowledge and expertise to distribute their products. We grant these general agents and program managers authority to produce, underwrite and administer policies subject to our underwriting and pricing guidelines. We typically transfer all or a substantial portion of the underwriting risk on these programs to third-party reinsurers for which we are paid a fee. We have a particular focus on “short-tail” lines of business where the time between the issuance of a policy or contract and reporting and payment of the claim tends to be shorter.
Services and Other -
We have several non-insurance products which provide value-add services to Fortegra customers, including premium finance and business processing services.
Marketing and Distribution
Our credit protection and warranty products are marketed through financial services companies, retailers, automobile dealerships and mobile device service providers. Our program insurance products are generally marketed through a network of independent insurance brokers and managing general agencies. In each case, we pay a commission-based fee to our marketing partners. A significant portion of our marketing partnership commission agreements are on a retrospective commission basis, which allows us to adjust commissions on the basis of claims experience. Under these types of arrangements, the compensation to our marketing partners is based upon the actual losses incurred compared to premiums earned. We believe these types of contractual arrangements align their economic interests with ours, help us to better manage our risk exposure and deliver more consistent profit margins with respect to these types of arrangements.
7
Investment Portfolio
Our investment strategy is designed to achieve attractive risk-adjusted returns across select asset classes, sectors and geographies while maintaining adequate liquidity to meet our claims payment obligations. We rely on conservative underwriting practices to generate investable funds while minimizing our underwriting risk. We invest a majority of our investable assets in high quality corporate, government and municipal bonds with relatively short durations, designed to deliver sufficient liquidity to meet claims as incurred. The balance of our investable assets are invested in asset classes that we believe will produce higher risk- adjusted returns over the long term, a significant portion of which are managed by other Tiptree subsidiaries.
Risk Management
Consistent with standard industry practice for most insurance companies, we use reinsurance to manage our underwriting risk and efficiently utilize capital. For example, a significant portion of our distribution partners of credit protection insurance products have created captive reinsurance companies to assume the insurance risk on the products they distribute. These captive reinsurance companies are known as producer owned reinsurance companies (“PORC”) and in most instances each PORC assumes almost all of the underwriting risk associated with the insurance products they distribute. In these instances we act in a fronting and administrative capacity on behalf of each PORC, providing underwriting and claims management services. We receive an administration fee that compensates us for our expenses associated with underwriting and servicing the underlying policies. We generally require cash collateral to secure the reinsurance recoverable in the event that a PORC is unable to pay the claims it has assumed. In our insurance program business, our reinsurers tend to be highly rated, well-capitalized professional third-party reinsurers.
Competitive Strengths
Specialty Focus
- We have a history of operating in niche markets that require specialized knowledge and expertise to profitably service and/or underwrite. Our expertise and focus, developed over our thirty five year history in credit insurance, has contributed to our position as one of the leading providers of credit insurance products in the United States. In addition, our “A-” (Excellent) A.M. Best rating provides us the opportunity to write niche commercial and personal lines insurance programs through general agents and other program managers. We believe these specialty markets tend to have fewer competitors and higher barriers to entry than other segments of the insurance market, providing us with greater flexibility on pricing and terms, and better, more consistent underwriting margins. We expect to continue to expand into other niche markets where we can capitalize on opportunities presented by our underwriting expertise.
Broad Service Delivery Expertise
- Over the years, Fortegra has developed the expertise to provide a variety of products and services for our marketing and distribution partners, including policy underwriting and issuance, back office processing and administration, claims management. Integrated, proprietary technology delivers low cost, highly automated services to our clients, while our scalable technology infrastructure affords Fortegra the opportunity to add new clients and services without significant additional expense.
The Company believes its capabilities are a key contributor to its high client retention rates. In our credit products our annual renewal rates are consistently in excess of 90%, which we believe distinguishes us from many of our peers.
Significant Fee-based Revenue
- We seek to complement our underwriting income with substantial fee-based revenues from the various value-added services we provide our marketing and distribution partners. As a result, a significant portion of our revenues are derived from fees, and are not solely dependent upon the underwriting performance of our insurance products, resulting in more diversified and consistent earnings. Our fee based revenues are primarily generated in both our regulated insurance entities as well as non-regulated service companies. We believe fees generated outside of regulated insurance entities afford us greater financial flexibility than traditional insurance carriers.
Superior Investment Capabilities
- Our specialty insurer’s affiliation with Tiptree provides access to extensive investment expertise and investment opportunities. We believe our specialty insurer’s ability to source investments through Tiptree allows it to better select assets that meet its liability profile, and provides the opportunity to generate superior risk-adjusted investment returns over the long term compared to what our specialty insurer could produce on its own, which we believe distinguishes our specialty insurer from many other insurance companies.
Competition
We operate in several markets, and believe that no single competitor competes against us in all of our business lines. The competition in the markets in which we operate is a function of many factors, including price, industry knowledge, quality of client service, sales force effectiveness, technology platforms and processes, the security and integrity of information systems, financial strength ratings, breadth of products and services, brand recognition and reputation. Our credit protection products and warranty service contracts compete with similar products of insurance companies, warranty companies and other insurance service providers. Many of our competitors are significantly larger, have greater access to capital and may possess other competitive advantages. These products
8
compete with several multi-national and regional property and casualty companies that may have expertise in our niche products. Our competitors include: The Warranty Group, Inc., Assurant, Inc., eSecuritel Holdings, LLC, Asurion, LLC, AmTrust Financial Services, Inc., State National Companies Inc. and several smaller regional companies.
Regulation
We are subject to federal, state, local and foreign regulation and supervision. Our insurance subsidiaries are generally restricted by the insurance laws of their respective domiciles as to the amount of dividends they may pay without the prior approval of the respective regulatory authorities. Generally, the maximum dividend that may be paid by an insurance subsidiary during any year without prior regulatory approval is limited to a stated percentage of that subsidiary’s statutory surplus as of a certain date, or net income of the subsidiary for the preceding year.
Our insurance company subsidiaries are domiciled in California, Delaware, Georgia, Kentucky and Louisiana. The regulation, supervision and administration by state departments of insurance relate, among other things, to: standards of solvency that must be met and maintained, restrictions on the payment of dividends, changes in control of insurance companies, the licensing of insurers and their agents and other producers, the types of insurance that may be written, privacy practices, the ability to enter and exit certain insurance markets, the nature of and limitations on investments and premium rates, or restrictions on the size of risks that may be insured under a single policy, reserves and provisions for unearned premiums, losses and other obligations, deposits of securities for the benefit of policyholders, payment of sales compensation to third parties, approval of policy forms and the regulation of market conduct, including underwriting and claims practices. As part of their routine regulatory oversight process, state insurance departments conduct periodic detailed examinations of the books, records, accounts and operations of insurance companies that are domiciled in their states.
Our insurance company subsidiaries are also subject to certain state regulations which require diversification of our investment portfolios and limits on the amount of our investments in certain categories. Failure to comply with these regulations would cause non-conforming investments to be treated as non-admitted assets in the states in which we are licensed to sell insurance policies for purposes of measuring statutory surplus and, in some instances, would require us to sell those investments. Such investment laws are generally permissive with respect to federal, state and municipal obligations, and more restrictive with respect to corporate obligations, particularly non-investment grade obligations, foreign investment, equity securities and real estate investments. Each insurance company is therefore limited by the investment laws of its state of domicile from making excessive investments in any given security (such as single issuer limitations) or in certain classes or riskier investments (such as aggregate limitation in non-investment grade bonds).
The NAIC provides model insurance laws and regulations for adoption by the states and standardized insurance industry accounting and reporting guidance. However, model insurance laws and regulations are only effective when adopted by the states, and statutory accounting and reporting principles continue to be established by individual state laws, regulations and permitted practices. The NAIC has adopted a model act with risk-based capital (“RBC”) formulas to be applied to insurance companies to measure the minimum amount of capital appropriate for an insurance company to support its overall business operations in light of its size and risk profile. State insurance regulators use RBC standards to determine appropriate actions relating to insurers that show signs of weak or deteriorating conditions. The domiciliary states of our insurance company subsidiaries have adopted laws substantially similar to the NAIC’s RBC model act.
Fortegra is subject to the state insurance holding company statutes which may require prior regulatory approval or non-disapproval of material transactions between an insurance company and an affiliate or of an acquisition of control of a domestic insurer and payments of extraordinary dividends or distributions.
We own reinsurance company subsidiaries that are domiciled in Turks and Caicos. These subsidiaries must satisfy local regulatory requirements, such as filing annual financial statements, filing annual certificates of compliance and paying annual fees.
We are also subject to federal and state laws and regulations related to the administration of insurance products on behalf of other insurers. In order for us to process and administer insurance products of other companies, we are required to maintain licenses of a third party administrator in the states where those insurance companies operate. We are also subject to the related federal and state privacy laws and must comply with federal and state data protection and privacy laws. We are also subject to laws and regulations related to call center services.
Seasonality
Our financial results historically have been, and we expect to continue to be, affected by seasonal variations. Revenues may fluctuate seasonally based on consumer spending, which has historically been higher in September and December, corresponding to the back-to-school and holiday seasons. Accordingly, our revenues have historically been higher in the third and fourth quarters than in the first half of the year. Member benefit claims on mobile device protection are typically more frequent in the summer months, and
9
accordingly, claims expense from those products have historically been higher in the second and third quarters than other times of the year.
Intellectual Property
We own or license a number of trademarks, patents, trade names, copyrights, service marks, trade secrets and other intellectual property rights that relate to our services and products. Although we believe that these intellectual property rights are, in the aggregate, of material importance to our business, we also believe that our business is not materially dependent upon any particular trademark, trade name, copyright, service mark, license or other intellectual property right. Our insurance subsidiaries have entered into confidentiality agreements with their clients that impose restrictions on client use of our proprietary software and other intellectual property rights.
Employees
At December 31, 2016, our specialty insurance segment employed 433 employees, on a full or part time basis.
Asset Management
Our asset management segment is conducted through TAMCO, an SEC-registered investment adviser that is primarily a holding company for our asset management subsidiaries. We specialize in managing credit related assets, on behalf of pension funds, hedge funds, other asset management firms, banks, insurance companies and other types of institutional investors. We earn management fees based on the amount of assets under management (“AUM”) that we manage, incentive income based on the performance of our funds or investment vehicles, and investment income from investments we make in our own funds and investment vehicles. Our fee paying AUM is primarily comprised of CLOs.
Our strategy is focused on growing our AUM and expanding our products by executing on the following objectives:
|
•
|
Retain and attract talented investment professionals;
|
|
•
|
Expand our investment products to diversify our product mix and attract new clients; and
|
|
•
|
Pursue strategic opportunities that we believe can expand our product capabilities and strengthen our distribution capabilities.
|
As of December 31, 2016, TAMCO had approximately $1.9 billion of fee earning AUM.
Investment Products
CLOs
: We currently manage $1.8 billion of fee earning AUM in CLOs. The term “CLO” generally refers to a special purpose vehicle that owns a portfolio of senior secured loans and issues various tranches of debt and subordinated note securities to finance the purchase of those investments. Most CLOs have a defined investment period during which they are allowed to make investments and reinvest capital as it becomes available. Several of our CLOs have passed their reinvestment period dates.
Other
: We plan to grow our fee earning AUM, and to the extent that market conditions warrant, to grow our business by offering new investment products. In 2015, we seeded a credit fund focused on investing in leveraged loans. We seed capital for new investment products to enable the portfolio manager to begin building an investment performance history in advance of the product receiving sustainable client assets. The length of time we hold our seed capital investment will vary for each new investment product as it is highly dependent on how long it takes to generate cash flows into the portfolio from unrelated investors.
Investments
Historically, we have made investments in funds managed by us including CLOs and seed capital for new investment strategies. The length of time we hold these investments varies and is generally based on market conditions. As of December, 31 2016, we had investments in our CLO subordinated notes and related participations in management fees with a fair market value of approximately $56.8 million.
Competitive Strengths
Experience
- We have a history of hiring talented and experienced investment professionals. The depth and breadth of experience of our management team enables us to source, structure, execute and monitor our investment products.
Alignment of Interests
- We have approximately $56.8 million invested in our own funds, which we believe aligns our interests with that of investors in our funds and investment vehicles. Additionally, senior members of our investment teams have significant investments in some of the funds they manage.
10
Competition
We compete for business with other asset managers, including those affiliated with major commercial or investment banks and other financial institutions. Many of these organizations offer products and services that are similar to, or compete with, those Tiptree and its asset management subsidiaries may offer, and many of these organizations have substantially more personnel and greater financial resources. Some of these competitors have proprietary products and distribution channels that may make it more difficult for us to compete with them. Some competitors also have greater portfolio management resources, greater name recognition, have had managed client accounts for longer periods of time, have greater experience over a wider range of products or have other competitive advantages. The factors considered by clients in choosing us or a competitor include the past performance of the products managed, the background and experience of key personnel, the experience in managing a particular product, overall reputation, investment advisory fees and the structural features of the investment products offered.
Regulation
The asset management industry in the U.S. is subject to extensive regulation under federal and state securities laws as well as the rules of self-regulatory organizations. TAMCO (collectively with Telos, the “Advisors”), is registered with the SEC as an investment adviser, and its subsidiaries rely on TAMCO’s registration. The Advisers are also required to make notice filings in certain states. Virtually all aspects of the asset management business, including related sales and distribution activities, are subject to various federal and state laws and regulations and self-regulatory organization rules. These laws, rules and regulations are primarily intended to protect the asset management clients and generally grant supervisory agencies and bodies broad administrative powers, including the power to limit or restrict an investment advisor from conducting its asset management business in the event that it fails to comply with such laws and regulations. In addition, investment vehicles managed by the Advisers are subject to various securities laws and other laws.
Employees
As of December 31, 2016, our asset management segment employed 9 employees on a full or part time basis.
Senior Living
Our senior living segment is conducted through Care, a real estate investment company focused on the acquisition, ownership and leasing of senior housing properties. We own senior apartments, independent living, assisted living, skilled nursing, and memory care facilities. Some properties may combine more than one type of service in a single building or campus. The rental and related services income paid by our residents is substantially all private pay, with limited reimbursement exposure to Medicare and Medicaid. As of December 31, 2016, our portfolio is comprised of 13 Triple Net Lease Properties and 16 Managed Properties. Our 29 properties are located across 11 states.
In Triple Net Lease Properties, we own the real estate and enter into a long term lease with an operator who is typically responsible for bearing property level operating costs, including maintenance, utilities, taxes, insurance, repairs and capital improvements. The property level operating costs of Triple Net Lease Properties are not consolidated since we do not own or manage the underlying operations. We earn rental income from the lease and substantially all expenses are passed through to the tenant.
In Managed Properties, we generally own between 65-90% of both the real estate and the operations, with affiliates of the management company owning the remainder. As a result, we consolidate all of the assets, liabilities, income and expense of the Managed Properties operations in our financial results. We partner with experienced managers to run the day-to-day operations at the properties while affiliates of the managers own the remaining percentage of the properties and operations.
Our strategy is to identify strong and experienced managers and operators of senior housing facilities who are looking to expand and diversify their operations by partnering with a capital provider. We intend to continue to grow our portfolio primarily through acquisitions and further diversify by tenant, asset class and geography.
Competitive Strengths
Strong Relationships with Operators:
We have developed strong relationships with a network of local and regional operators. Several of our operators have entered into multiple transactions with us. These types of repeat transactions help support our future growth potential by providing additional investment opportunities.
Structuring Flexibility:
We believe our non-REIT status provides us the ability to be flexible in transaction and investment structures which we believe enhances our ability to source acquisition opportunities and attract new operator relationships.
Stable Occupancy Rates:
The average annual occupancy rate of our portfolio of properties has remained stable between 86-88% over the past three years.
11
Competition
We compete for property acquisitions with other real estate investment companies and real estate investment trusts, real estate partnerships, private equity firms and hedge funds, finance/investment companies, taxable and tax-exempt bond funds, health care and senior living operators and developers. We compete for investments based on a number of factors including investment structures, underwriting criteria and reputation. Our ability to successfully grow is impacted by economic and demographic trends, availability of acceptable investment opportunities, ability to negotiate beneficial investment terms, availability and cost of capital and new and existing laws and regulations.
All of our properties compete with other properties that provide comparable services on both a local and regional basis. The competition to attract and maintain residents at our properties is based on a number of factors including the perceived quality of service, reputation, physical appearance of properties, location, services offered, family preferences, staff and price.
Regulation
The senior living and healthcare industry is highly regulated by federal, state and local licensing requirements, facility inspections, reimbursement policies, regulations concerning capital and other expenditures, certification requirements and other laws, regulations and rules. In addition, regulators require compliance by our tenants and third party operators with a variety of safety, health, staffing and other requirements relating to the design and conditions of the licensed facility and quality of care provided. The failure of any tenant, manager or operator to comply with such laws, requirements and regulations could affect a tenant’s, manager’s or operator’s ability to operate the facilities that we own. Some of these laws and regulations impose joint and several liabilities on tenants, owners or operators for the costs to investigate or remediate contaminated properties, regardless of fault or whether the acts causing the contamination were legal.
Our properties may be affected by our operators’, managers’ and lessees’ operations, the existing condition of land when acquired, operations in the vicinity of our properties, such as the presence of underground storage tanks, or activities of unrelated third parties. The presence of hazardous substances, or the failure to properly remediate these substances, may make it difficult or impossible to sell or rent a property.
Employees
At December 31, 2016, our senior living segment employed 5 full time employees. We do not include the employees of the managers or the affiliates of our Managed Properties in our employee totals.
Specialty Finance
Our specialty finance segment consists of our mortgage origination operations, and our controlling ownership interest in a finance company that provides asset-based loans. The growth in our specialty finance operations is expected primarily to come from increased origination volume, new products, and, to a lesser extent, through acquisition.
Our mortgage business originates residential mortgage loans which are typically sold to secondary market investors. Revenues are generated from gain on sale of loans, net interest income and loan fee income. We currently use two production channels to originate or acquire mortgage loans: loan officers in retail sales offices (commonly referred to as “retail”); and a broker channel (commonly referred to as “wholesale”).
Our commercial finance lending business originates, structures, underwrites and services senior secured asset-based loans for small to medium sized companies operating across a range of industry sectors. Our core product offerings include revolving lines of credit and term loans. The loans we offer our clients are typically used to fund working capital needs and are secured by eligible, margined collateral, including accounts receivable, inventories, and, to a lesser extent, other long-term assets.
Competition
The residential mortgage and commercial loan markets are highly competitive. There are a large number of institutions offering these products, including many that operate on a national scale, as well as local savings banks, commercial banks, and other lenders. Many of our competitors are larger and have access to greater financial resources. In addition, many of the largest competitors are banks or are affiliated with banking institutions, the advantages of which include, but are not limited to, having access to financing with more favorable terms, including lower interest rate bank deposits as a favorable source of funding.
12
Regulation
We are subject to extensive regulation by federal, state and local governmental authorities, including the CFPB, the Federal Trade Commission and various state agencies that license, audit and conduct examinations. Our mortgage operations must comply with a number of federal, state and local consumer protection and privacy laws including laws that apply to to loan origination, fair lending, debt collection, use of credit reports, safeguarding of non-public personally identifiable information about customers, foreclosure and claims handling, investment of and interest payments on escrow balances and escrow payment features, and mandate certain disclosures and notices to borrowers.
Employees
At December 31, 2016, our Specialty Finance segment employed 595 people.
STRUCTURE
On an as exchanged basis, we had 36,436,645 shares of Class A common stock as of December 31, 2016 (which excludes 6,596,000 shares of Class A common stock held by consolidated subsidiaries of the Company). “As exchanged” assumes the full exchange of the limited partnership units of TFP for Tiptree Class A common stock.
Tiptree’s Class A common stock trades on the NASDAQ Capital Market. All of Tiptree’s Class B common stock is owned by TFP on behalf of limited partners of TFP. Tiptree’s Class B common stock has voting but no economic rights. The limited partners of TFP (other than Tiptree itself) are able to exchange TFP partnership units for Tiptree Class A common stock at a rate of 2.798 shares of Class A common stock per partnership unit.
The following chart is a simplified version of our organizational structure:
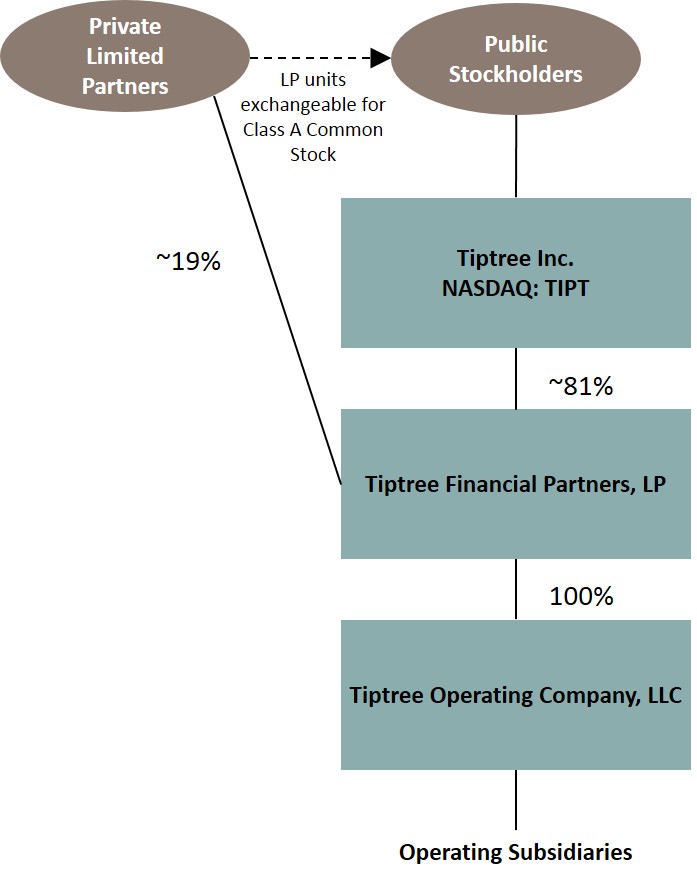
We were incorporated in Maryland in 2007. For more information on our ownership and structure, see Note-(1) Organization and Note-(18) Stockholders’ Equity, within the accompanying consolidated financial statements.
AVAILABLE INFORMATION
We are required to file annual, quarterly and current reports, proxy statements and other information with the SEC. The public may read and copy any materials that we file with the SEC at the SEC’s Public Reference Room at 100 F Street, N.E., Washington, D.C. 20549. Information on the operation of the Public Reference Room may be obtained by calling the SEC at 1-800-SEC-0330. In addition, the SEC maintains an Internet site that contains reports, proxy and information statements, and other information regarding issuers that file electronically with the SEC at
http://www.sec.gov
.
13
Our Annual Reports on Form 10-K, Quarterly Reports on Form 10-Q, Current Reports on Form 8-K, proxy statements and amendments to those reports filed or furnished pursuant to Section 13(a) or 15(d) of the Exchange Act, are also available free of charge on our Internet site at
www.tiptreeinc.com
as soon as reasonably practicable after such reports are electronically filed with or furnished to the SEC. The information on our website is not, and shall not be deemed to be, a part hereof or incorporated into this or any of our other filings with the SEC.
Our Investor Relations Department can be contacted at Tiptree Inc., 780 Third Avenue, 21st Floor, New York, NY, 10017, Attn: Investor Relations, telephone: (212) 446-1400, email:
IR@tiptreeinc.com
.
We are subject to certain risks and uncertainties in our business operations which are described below. The risks and uncertainties described below are not the only risks we face. Additional risks and uncertainties that are not presently known or are currently deemed immaterial may also impair our business, results of operations and financial condition.
Risks Related to our Businesses
We operate in highly competitive markets for business opportunities and personnel, which could impede our growth and negatively impact our results of operations.
We operate in highly competitive markets for business opportunities in each of our areas of focus. Many of our competitors have financial, personnel and other resource advantages relative to us and may be better able to react to market conditions. These factors may place us at a competitive disadvantage in successfully competing for future business opportunities and personnel, which could impede our growth and negatively impact our business, financial condition and results of operations.
Acquisitions may have unforeseen operating difficulties and may require greater than expected financial and other resources and we may fail to successfully integrate the businesses we acquire which would have an adverse effect on our business results of operation and financial condition.
We regularly evaluate opportunities for strategic growth through acquisitions. Acquired companies and operations may have unforeseen operating difficulties and may require greater than expected financial and other resources. In addition, potential issues associated with acquisitions could, among other things include:
|
•
|
our ability to realize the full extent of the benefits, synergies or cost savings that we expect to realize as a result of the completion of an acquisition within the anticipated time frame, or at all;
|
|
•
|
receipt of necessary consents, clearances and approvals in connection with the acquisition;
|
|
•
|
diversion of management’s attention from other strategies and objectives;
|
|
•
|
motivating, recruiting and retaining executives and key employees; and
|
|
•
|
conforming and integrating financial reporting, standards, controls, procedures and policies, business cultures and compensation structures.
|
If an acquisition is not successfully completed or integrated into our existing operations, our business, results of operations and financial condition could be materially adversely effected.
The amount of statutory capital and reserve requirements applicable to our insurance subsidiaries can increase due to factors outside of our control.
Our insurance subsidiaries are subject to statutory capital and reserve requirements established by applicable insurance regulators based on risk-based capital formulas. In any particular year, these requirements may increase or decrease depending on a variety of factors, most of which are outside our control, such as the amount of statutory income or losses generated, changes in equity market levels, the value of fixed-income and equity securities in the subsidiary’s investment portfolio, changes in interest rates and foreign currency exchange rates, as well as changes to the risk-based capital formulas used by insurance regulators. Increases in the amount of additional statutory reserves that our insurance subsidiaries are required to hold may adversely affect our financial condition and results of operations.
Our insurance subsidiaries’ actual claims losses may exceed their reserves for claims, which may require them to establish additional reserves that may materially and adversely affect their business, results of operations and financial condition.
Our insurance subsidiaries maintain reserves to cover their estimated ultimate exposure for claims with respect to reported claims, and incurred, but not reported, claims as of the end of each accounting period. Reserves, whether calculated under GAAP or statutory
14
accounting principles, do not represent an exact calculation of exposure. Instead, they represent our insurance subsidiaries’ best estimates, generally involving actuarial projections, of the ultimate settlement and administration costs for a claim or group of claims, based on our assessment of facts and circumstances known at the time of calculation. The adequacy of reserves will be impacted by future trends in claims severity, frequency, judicial theories of liability and other factors. These variables are affected by external factors such as changes in the economic cycle, unemployment, inflation, judicial trends, legislative changes, as well as changes in claims handling procedures. Many of these items are not directly quantifiable, particularly on a prospective basis. Reserve estimates are refined as experience develops. Adjustments to reserves, both positive and negative, are reflected in the statement of income of the period in which such estimates are updated. Because the establishment of reserves is an inherently uncertain process involving estimates of future losses, we can give no assurances that ultimate losses will not exceed existing claims reserves. In general, future loss development could require reserves to be increased, which could have a material adverse effect on our insurance subsidiaries’ business, results of operations and financial condition.
We may need to raise additional capital in the future or may need to refinance existing indebtedness, but there is no assurance that such capital will be available on a timely basis, on acceptable terms or at all.
We may need to raise additional funds in order to grow our business or fund our strategy or acquisitions. Additional financing may not be available in sufficient amounts, if at all, or on terms acceptable to us and may be dilutive to existing stockholders. Additionally, any securities issued to raise such funds may have rights, preferences and privileges senior to those of our existing stockholders. If adequate funds are not available on a timely basis, if at all, or on acceptable terms, our ability to expand, develop or enhance our subsidiaries’ services and products, enter new markets, consummate acquisitions or respond to competitive pressures could be materially limited.
Our information systems may fail or their security may be compromised, which could damage our specialty insurance business and materially and adversely affect our results of operations and financial condition.
Our specialty insurance business is highly dependent upon the effective operation of our information systems and our ability to store, retrieve, process and manage significant databases and expand and upgrade our information systems. Our specialty insurance business relies on these systems for a variety of functions, including marketing and selling our products and services, performing our services, managing our operations, processing claims and applications, providing information to clients, performing actuarial analyses and maintaining financial records. The interruption or loss of our information processing capabilities through the loss of stored data, programming errors, the breakdown or malfunctioning of computer equipment or software systems, telecommunications failure or damage caused by weather or natural disasters or any other significant disruptions could harm our specialty insurance business by hampering its ability to generate revenues and could negatively affect client relationships, competitive position and reputation. In addition, our information systems may be vulnerable to physical or electronic intrusions, computer viruses or other attacks which could disable our information systems and our security measures may not prevent such attacks. The failure of our systems as a result of any security breaches, intrusions or attacks could cause significant interruptions to our operations, which could result in a material adverse effect on our business, results of operations and financial condition.
Fortegra is dependent on independent financial institutions, lenders and retailers for distribution of its products and services, and the loss of these distribution sources, or their failure to sell Fortegra’s products and services could materially and adversely affect its business, results of operations and financial condition.
Fortegra is dependent on financial institutions, lenders and retailers to distribute its products and services and its revenue is dependent on the level of business conducted by such distributors as well as the effectiveness of their sales efforts, each of which is beyond Fortegra’s control because such distributors typically do not have any minimum performance or sales requirements. Further, although its contracts with these distributors are typically exclusive, they can be canceled on relatively short notice. Therefore, Fortegra’s growth is dependent, in part, on its ability to identify and attract new distribution relationships and successfully implement its information systems with those of its new distributors.
The impairment of Fortegra’s distribution relationships, the loss of a significant number of its distribution relationships, the failure to establish new distribution relationships, the failure to offer increasingly competitive products, the increase in sales of competitors’ services and products by these distributors or the decline in their overall business activity or the effectiveness of their sales of Fortegra’s products could materially reduce Fortegra’s sales and revenues and have a material adverse effect on its business, results of operations and financial condition.
Fortegra may lose clients or business as a result of consolidation within the financial services industry.
There has been considerable consolidation in the financial services industry, driven primarily by the acquisition of small and mid-size organizations by larger entities. We expect this trend to continue. Fortegra may lose business or suffer decreased revenues if one or more of its significant clients or distributors consolidate or align themselves with other companies. While Fortegra’s business has not been materially affected by consolidation to date, it may be affected by industry consolidation that occurs in the future, particularly if any of its significant clients are acquired by organizations that already possess the operations, services and products that it provides.
15
A downgrade in our insurance subsidiaries’ claims paying ability or financial strength ratings could increase policy surrenders and withdrawals, adversely affecting relationships with distributors and reducing new policy sales.
Claims paying ability ratings, sometimes referred to as financial strength ratings, indicate a rating agency’s view of an insurance company’s ability to meet its obligations to its policy holders. These ratings are therefore key factors underlying the competitive position of insurers. Some distributors of insurance products may choose not to do business with insurance companies that are rated below certain financial strength ratings. Our insurance subsidiaries currently have a rating of “A-” from A.M. Best Company, Inc. Rating agencies can be expected to continue to monitor our insurance subsidiaries’ financial strength and claims paying ability, and no assurances can be given that future ratings downgrades will not occur, whether due to changes in their performance, changes in rating agencies’ industry views or ratings methodologies, or a combination of such factors. A ratings downgrade or the potential for such a downgrade in a rating could, to the extent applicable to a particular type of policy, adversely affect relationships with distributors of insurance products, reduce new policy sales and adversely affect our ability to compete in the insurance industry.
Our insurance subsidiaries may incur losses if reinsurers are unwilling or unable to meet their obligations under reinsurance contracts.
Our insurance subsidiaries use reinsurance to reduce the severity and incidence of claims costs, and to provide relief with regard to certain reserves. Under these reinsurance arrangements, other insurers assume a portion of our losses and related expenses; however, we remain liable as the direct insurer on all risks reinsured. Consequently, reinsurance arrangements do not eliminate our obligation to pay claims and we assume credit risk with respect to our ability to recover amounts due from reinsurers. The inability or unwillingness of any reinsurer to meet its financial obligations could negatively affect our financial condition and results of operations.
Fortegra’s reinsurance facilities are generally subject to annual renewal. Fortegra may not be able to maintain its current reinsurance facilities and its clients may not be able to continue to operate their captive reinsurance companies. As a result, even where highly desirable or necessary, Fortegra may not be able to obtain other reinsurance facilities in adequate amounts and at favorable rates. If Fortegra is unable to renew its expiring facilities or to obtain or structure new reinsurance facilities, either its net exposures would increase or, if it is unwilling to bear an increase in net exposures, it may have to reduce the level of its underwriting commitments. Either of these potential developments could have a material adverse effect on our results of operations and financial condition.
Due to the structure of some of Fortegra’s commissions, it is exposed to risks related to the creditworthiness of some of its agents.
Fortegra is subject to the credit risk of some of the agents with which it contracts to sell its products and services. Fortegra typically advances agents’ commissions as part of its product offerings. These advances are a percentage of the premiums charged. If Fortegra over-advances such commissions to agents, the agents may not be able to fulfill their payback obligations, which could have a material adverse effect on Fortegra’s results of operations and financial condition.
Our investable assets include NPLs, which have inherent risks that may be exacerbated due to geographic concentrations and reliance on third parties.
We acquire NPLs where the borrower has failed to make timely payments of principal and/or interest. We purchase these loans at a discount to face value of the loan, relying on the underlying value of the property as collateral for recovery of our investment. If actual results are different from our assumptions in determining the prices for such loans, particularly if the market value of the underlying property decreases significantly, we may incur a loss.
Furthermore, our acquisition of NPLs are not subject to any geographic diversification or concentration limitations. Accordingly, our portfolio of NPLs may be concentrated by geography and borrower demographics, increasing the risk of loss to us if the particular concentration in our NPL portfolio is subject to greater risks or undergoes adverse developments. A material decline in the demand for housing in the areas where we will own assets may materially and adversely affect us. Lack of diversification can increase the correlation of non-performance and foreclosure risks among our investments in NPLs.
In addition, we rely on various third parties to help us effectively run our NPL business. For example, we use a third party asset manager to identify, evaluate and coordinate our NPL acquisitions as well as to manage our NPL portfolio, including loan modifications and conversion to REO. Furthermore, we rely on third party servicers to service our NPLs, including managing collections. If the servicers are not vigilant in encouraging borrowers to make their monthly payments, the borrowers may be far less likely to make these payments. We also rely on our servicers to provide all of our property management and renovation management services associated with the real properties we acquire upon conversion of NPLs to REO. If our agreements with any such third party terminates and we are unable to obtain a suitable replacement at attractive costs, our ability to acquire, resolve or dispose of our NPLs could be adversely affected.
16
Changes in CLO spreads and an adverse market environment could make it difficult for us to launch new CLOs thereby reducing management fees paid to Telos, which could adversely affect our profitability.
Telos generates management and advisory fees based on the amount of assets managed, and, in certain cases, on the returns generated by the assets managed. The ability to issue new CLOs is dependent, in part, on the amount of excess interest earned on a new CLO’s investments over interest payable on its debt obligations. If the spread is not attractive to potential CLO equity investors we may not be able to sponsor the issuance of new CLOs, which could have a material adverse impact on Telos’ business. A reduction in fees paid to Telos, due to an inability to issue new CLOs at attractive terms, termination of existing management agreements, reduction in assets managed (for example, as a result of exercise of optional call provisions by subordinated noteholders) or lower than expected returns could adversely affect our results of operations.
In advance of issuing and managing a new CLO, we expect to enter into warehouse agreements which may expose us to substantial risks.
In connection with our potential investment in and management of new CLOs, we expect to enter into warehouse lending agreements with warehouse loan providers to finance the purchase of investments that will be ultimately included in a CLO. We typically select the investments in the warehouse subject to the approval of the warehouse provider. If the relevant CLO transaction is not issued, the warehouse investments may be liquidated, and we may experience a loss if the aggregate sale price of the collateral is less than the warehouse loan amount. In addition, regardless of whether the CLO is issued or consummated, if any of the warehoused investments are sold before such issuance or consummation, we may have to bear any resulting loss on the sale. The amount at risk in connection with a warehouse agreement will vary and may not be limited to the amount, if any, that we invest in the related CLO upon its issuance. Although we would expect to complete the issuance of a particular CLO within six to nine months after establishing a related warehouse, we may not be able to complete the issuance within such expected time period or at all.
Our real estate operating entities expose us to various operational risks, liabilities and claims that could adversely affect our ability to generate revenues or could increase our costs and could adversely affect our financial condition and results of operations.
Our ownership of real estate operating entities exposes us to various operational risks, liabilities and claims that could increase our costs or adversely affect our ability to generate revenues, thereby reducing our profitability. These operational risks include fluctuations in occupancy levels, the inability to achieve economic resident fees (including anticipated increases in those fees), rent control regulations, increases in the cost of food, materials, energy, labor (as a result of unionization or otherwise) or other services, national and regional economic conditions, the imposition of new or increased taxes, capital expenditure requirements, professional and general liability claims, and the availability and cost of professional and general liability insurance. Any one or a combination of these factors could result in operating deficiencies in our operating assets, which could adversely affect our financial condition and results of operations.
Liability relating to environmental matters may decrease the value of our real estate assets.
Under various federal, state and local laws, an owner or operator of real property may become liable for the costs of cleanup of certain hazardous substances released on or under its property. Such laws often impose liability without regard to whether the owner or operator knew of, or was responsible for, the release of such hazardous substances. The presence of hazardous substances may adversely affect an owner’s ability to sell real estate or borrow using real estate as collateral. To the extent that any of our owned real estate encounters environmental issues, it may adversely affect the value of that real estate. Further, in regard to any mortgage investment, if the owner of the underlying property becomes liable for cleanup costs, the ability of the owner to make debt payments may be reduced, which in turn may adversely affect the value of the relevant mortgage asset held by us. In addition, in certain instances, we may be liable in part or in full for the cost of any required remediation or clean up.
Violation of fraud and abuse laws applicable to our real estate tenants, lessees and operators may jeopardize a tenant’s, lessee’s or operator’s ability to make payments to us.
The federal government and numerous state governments have passed laws and regulations that attempt to eliminate healthcare fraud and abuse by prohibiting business arrangements that induce patient referrals or inappropriately influence the ordering of specific ancillary services. In addition, numerous federal laws have continued to strengthen the federal fraud and abuse laws to provide for broader interpretations of prohibited conduct and stiffer penalties for violations. Violations of these laws may result in the imposition of criminal and civil penalties, including possible exclusion from federal and state healthcare programs. Imposition of any of these penalties upon any of our tenants, lessees or operators could jeopardize their ability to operate a facility or to make payments to us, thereby potentially adversely affecting us, or our financial condition and results of operations.
In the past several years, federal and state governments have significantly increased investigation and enforcement activity to detect and eliminate fraud and abuse in the Medicare and Medicaid programs. In addition, legislation and regulations have been
17
adopted at state and federal levels, which severely restricts the ability of physicians to refer patients to entities in which they have a financial interest. It is anticipated that the trend toward increased investigation and enforcement activity in the area of fraud and abuse, as well as self-referrals, will continue in future years and could adversely affect our prospective tenants, lessees or operators and their operations, and in turn their ability to make payments to us.
Some of our investments are made jointly with other persons or entities, which may limit our flexibility with respect to such jointly owned investments and could, thereby, have a material adverse effect on our business, results of operations and financial condition and our ability to sell these investments.
Some of our investments are made jointly with other persons or entities when circumstances warrant the use of such structures and we may continue to do so in the future. Our participation in such joint investments is subject to the risks that:
|
•
|
we could experience an impasse on certain decisions because we do not have sole decision-making authority, which could require us to expend additional resources on resolving such impasses or potential disputes;
|
|
•
|
our partners could have investment goals that are not consistent with our investment objectives, including the timing, terms and strategies for any investments;
|
|
•
|
our partners might become bankrupt, fail to fund their share of required capital contributions or fail to fulfill their obligations as partners, which may require us to infuse our own capital into such venture(s) on behalf of the partner(s) despite other competing uses for such capital;
|
|
•
|
our partners may have competing interests in our markets that could create conflict of interest issues;
|
|
•
|
any sale or other disposition of our interest in such a venture may require consents which we may not be able to obtain;
|
|
•
|
such transactions may also trigger other contractual rights held by a partner, lender or other third party depending on how the transaction is structured; and
|
|
•
|
there may be disagreements as to whether consents and/or approvals are required in connection with the consummation of a particular transaction with a partner, lender and/or other third party, or whether such transaction triggers other contractual rights held by a partner, lender and/or other third party, and in either case, those disagreements may result in litigation.
|
The volume of our mortgage loan originations is subject to a variety of factors, which include the level of interest rates, overall conditions in the housing market and general economic trends.
Changes in interest rates and the level of interest rates are key drivers that impact the volatility of our mortgage loan originations. The historically low interest rate environment over the last several years has created strong demand for mortgages. The Federal Reserve recently raised rates and has indicated an intention to continue raising rates in the near future. Further increases in interest rates could result in us having lower revenue or profitability. The overwhelming majority of our mortgage loan originations have historically been refinancing existing homeowner’s mortgage loans. With rates at or near historically low levels, we have been able to continue to grow our mortgage loan originations by focusing on refinances. With rising interest rates, we may not be able to continue to do so in the future.
Our mortgage business is highly dependent upon programs administered by GSEs, such as Fannie Mae and Freddie Mac, and Ginnie Mae, to generate revenues through mortgage loan sales to institutional investors. Any changes in existing U.S. government-sponsored mortgage programs could materially and adversely affect our mortgage businesses, financial condition and results of operations.
There is uncertainty regarding the future of Fannie Mae and Freddie Mac, including with respect to how long they will continue to be in existence, the extent of their roles in the market and what forms they will have. The future roles of Fannie Mae and Freddie Mac could be reduced or eliminated and the nature of their guarantees could be limited or eliminated relative to historical measurements. The elimination or modification of the traditional roles of Fannie Mae or Freddie Mac could adversely affect our mortgage businesses, financial condition and results of operations. Furthermore, any discontinuation of, or significant reduction in, the operation of these GSEs and Ginnie Mae, or any significant adverse change in the level of activity of these agencies in the primary or secondary mortgage markets or in the underwriting criteria of these agencies could materially and adversely affect our business, financial condition and results of operations.
We may be unable to obtain sufficient capital to meet the financing requirements of our mortgage business.
We fund substantially all of the loans which we originate through borrowings under warehouse financing and repurchase facilities. Our borrowings are in turn repaid with the proceeds we receive from selling such loans through whole loan sales. As we expand our operations, we will require increased financing.
There can be no assurance that such financing will be available on terms reasonably satisfactory to us or at all. An event of default, an adverse action by a regulatory authority or a general deterioration in the economy that constricts the availability of credit-similar to the market conditions experienced in recent years-may increase our cost of funds and make it difficult for us to obtain new,
18
or retain existing, warehouse financing facilities. If we fail to maintain, renew or obtain adequate funding under these warehouse financing facilities or other financing arrangements, or there is a substantial reduction in the size of or increase in the cost of such facilities, we would have to curtail our mortgage loan production activities, which could have a material adverse effect on our business, financial condition and operating results in specialty finance.
In our mortgage business, we may sustain losses and/or be required to indemnify or repurchase loans we originated, or will originate, if, among other things, our loans fail to meet certain criteria or characteristics.
The contracts with purchasers of our whole loans contain provisions that require us to indemnify or repurchase the related loans under certain circumstances. While our contracts vary, they contain provisions that require us to repurchase loans if:
|
•
|
our representations and warranties concerning loan quality and loan circumstances are inaccurate, including representations concerning the licensing of a mortgage broker;
|
|
•
|
we fail to secure adequate mortgage insurance within a certain period after closing;
|
|
•
|
a mortgage insurance provider denies coverage; or
|
|
•
|
we fail to comply, at the individual loan level or otherwise, with regulatory requirements in the current dynamic regulatory environment.
|
We maintain reserves that we believe are appropriate to cover potential loan repurchase or indemnification losses, but there can be no assurance that such reserves will, in fact, be sufficient to cover future repurchase and indemnification claims. If we are required to indemnify or repurchase loans that we originate and sell that result in losses that exceed our reserve, this could adversely affect our business, financial condition and results of operations.
Furthermore, in the ordinary course of our mortgage business, we are subject to claims made against us by borrowers and private investors arising from, among other things, losses that are claimed to have been incurred as a result of alleged breaches of fiduciary obligations, misrepresentations, errors and omissions of our employees, officers and agents (including our appraisers), incomplete documentation and our failure to comply with various laws and regulations applicable to our business.
In addition, should the mortgage loans we originate sustain higher levels of delinquencies and/or defaults, we may lose the ability to originate and/or sell FHA loans, or to do so profitably and investors to whom we currently sell our mortgage loans may refuse to continue to do business with us, or may reduce the prices they are willing to purchase our mortgage loans and it may be difficult or impossible to sell any of our mortgage loans in the future. Any of the foregoing risks could adversely affect our business, financial condition and results of operations in our mortgage business.
We may be limited in the future in utilizing net operating losses incurred during prior periods to offset taxable income.
We previously incurred net operating losses. In the event that we experience an “ownership change” within the meaning of Section 382 of the Code, including as a result of the contribution transactions that occurred on July 1, 2013, which we refer to as the “Contribution Transactions”, or the exchange by TFP’s limited partners of their partnership units in TFP for Tiptree Class A common stock, our ability to use those net operating losses to offset taxable income could be subject to an annual limitation. The annual limitation would be equal to a percentage of our equity value at the time the ownership change occurred. In general, such an “ownership change” would occur if the percentage of our stock owned by one or more 5% stockholders (including certain groups or persons acting in concert) were to increase by 50 percentage points during any three-year period. All stockholders that own less than 5% of our stock are treated as a single 5% stockholder. In addition, the Treasury Regulations under Section 382 of the Code contain additional rules the effect of which is to make it more likely that an ownership change could be deemed to occur. Accordingly, our ability to use prior net operating losses to offset future taxable income would be subject to a limitation if we experience an ownership change.
A portion of our assets are illiquid or have limited liquidity, which may limit our ability to sell those assets at favorable prices or at all and creates uncertainty in connection with valuing such assets.
Our assets include real estate, non-controlling interests in credit assets and related equity interests which may be illiquid or have limited liquidity. It may be difficult for us to dispose of assets with limited liquidity rapidly, or at favorable prices, if at all. In addition, assets with limited liquidity may be more difficult to value and may be sold at a substantial discount or experience more volatility than more liquid assets. We may not be able to dispose of assets at the carrying value reflected in our financial statements. Our results of operations and cash flows may be materially and adversely affected if our determinations regarding the fair value of our illiquid assets are materially higher than the values ultimately realized upon their disposal.
19
We leverage our assets and a decline in the fair value of such assets may adversely affect our financial condition and results of operations.
We leverage our assets, including through borrowings, generally through warehouse credit facilities, secured loans, derivative instruments such as total return swaps, securitizations (including the issuance of CLOs) and other borrowings. A rapid decline in the fair value of our leveraged assets may adversely affect us. Lenders may require us to post additional collateral to support the borrowing. If we cannot post the additional collateral, we may have to rapidly liquidate assets, which we may be unable to do on favorable terms or at all. Even after liquidating assets, we may still be unable to post the required collateral, further harming our liquidity and subjecting us to liability to lenders for the declines in the fair values of the collateral. A reduction in credit availability may adversely affect our business, financial condition and results of operations.
Certain of our and our subsidiaries’ assets are subject to credit risk, market risk, interest rate risk, credit spread risk, call and redemption risk and/or tax risk, and any one of these risks may materially and adversely affect the value of our assets, our results of operations and our financial condition.
Some of our assets, including our direct investments, are subject to credit risk, interest rate risk, market risk, credit spread risk, selection risk, call and redemption risk and refinancing risk.
Credit risk is the risk that the obligor will be unable to pay scheduled principal and/or interest payments. Defaults by third parties in the payment or performance of their obligations could reduce our income and realized gains or result in the recognition of losses. The fair value of our assets may be materially and adversely affected by increases in interest rates, downgrades in our direct investments and by other factors that may result in the recognition of other-than-temporary impairments. Each of these events may cause us to reduce the fair value of our assets.
Interest rate risk is the risk that general interest rates will rise or that the risk spread used in our financings will increase. Although interest rates have been at historically low levels for the last several years, the Federal Reserve recently raised rates and has indicated an intention to continue raising rates in the coming months, and a period of sharply rising interest rates could have an adverse impact on our business by negatively impacting demand for mortgages, corporate loans and value of our CLO subordinated notes and increasing our cost of borrowing to finance operations as well as acquisitions in our real estate segment.
Market risk is the risk that one or more markets to which the assets relate will decline in value, including the possibility that such markets will deteriorate sharply and unpredictably, which will likely impair the market value of the related instruments.
Credit spread risk is the risk that the market value of fixed income instruments will change in response to changes in perceived or actual credit risk beyond changes that would be attributable to changes, if any, in interest rates.
Call and redemption risk is the risk that debt instruments will be called or redeemed prior to maturity at a time when yields on other debt instruments in which the call or redemption proceeds could be invested are lower than the yield on the called or redeemed instrument.
Refinancing risk is the risk that we will be unable to refinance some or all of our indebtedness or that any refinancing will not be on terms as favorable as those of our existing indebtedness, which could increase our funding costs, limit our ability to borrow, or result in a sale of the leveraged asset on disadvantageous terms. Any one of these risks may materially and adversely affect the value of our assets, our results of operations and our financial condition.
Our risk mitigation or hedging strategies could result in our experiencing significant losses that may materially adversely affect us.
We pursue risk mitigation and hedging strategies to seek to reduce our exposure to losses from adverse credit events, interest rate changes and other risks. These strategies include short Treasury positions, interest rate swaps, credit derivative swaps, CDX derivative index positions, buying and selling credit protection on different tranches of risk in differing CDX indexes and derivative hedging instruments. Since we account for derivatives at fair market value, changes in fair market value are reflected in net income other than derivative hedging instruments which are reflected in accumulated other comprehensive income in stockholders’ equity. Some of these strategies could result in our experiencing significant losses that
may materially adversely affect our business, financial condition and results of operations.
20
The values we record for certain investments and liabilities are based on estimates of fair value made by our management, which may cause our operating results to fluctuate and may not be indicative of the value we can realize on a sale.
Some of our investments and liabilities, including CLO subordinated notes and NPLs, are not actively traded and the fair value of such investments and liabilities are not readily determinable. Each of these carrying values is based on an estimate of fair value by our management. Management reports the estimated fair value of these investments and liabilities quarterly, which may cause our quarterly operating results to fluctuate. Therefore, our past quarterly results may not be indicative of our performance in future quarters. In addition, because such valuations are inherently uncertain, and in some cases based on internal models and unobservable inputs, may fluctuate over short periods of time and may be based on estimates, our determinations of fair value may differ materially from the values that would have been used if a ready market for these investments and liabilities existed and we may be unable to realize the carrying value upon a sale of these investments.
Risks Related to our Structure
Because we are a holding company, our ability to meet our obligations and pay dividends to stockholders will depend on distributions from our subsidiaries that may be subject to restrictions.
We are a holding company and do not have any significant operations of our own, other than our principal investments. Our ability to meet our obligations will depend on distributions from our subsidiaries. The amount of dividends and other distributions that our subsidiaries may distribute to us may be subject to restrictions imposed by state law, restrictions that may be imposed by state regulators and restrictions imposed by the terms of any current or future indebtedness that these subsidiaries may incur. Such restrictions would also affect our ability to pay dividends to stockholders, if and when we choose to do so.
Our regulated insurance company subsidiaries are required to satisfy minimum capital and surplus requirements according to the laws and regulations of the states in which they operate, which regulate the amount of dividends and distributions we receive from them. In general, dividends in excess of prescribed limits are deemed “extraordinary” and require insurance regulatory approval. Ordinary dividends, for which no regulatory approval is generally required, are limited to amounts determined by a formula, which varies by state. Some states have an additional stipulation that dividends may only be paid out of earned surplus. States also regulate transactions between our insurance company subsidiaries and us or our other subsidiaries, such as those relating to the shared services, and in some instances, require prior approval of such transactions within the holding company structure. If insurance regulators determine that payment of an ordinary dividend or any other payments by our insurance company subsidiaries to us or our other subsidiaries (such as payments for employee or other services) would be adverse to policyholders or creditors, the regulators may block or otherwise restrict such payments that would otherwise be permitted without prior approval. In addition, there could be future regulatory actions restricting the ability of our insurance company subsidiaries to pay dividends or share services.
Some of our officers and directors currently or may in the future act as members, managers, officers, directors or employees of entities with conflicting business strategies.
Some of our officers and directors currently or may in the future act as members, managers, officers, directors or employees of entities with business strategies that may conflict with our business strategies. Michael Barnes, our Executive Chairman, is a founding partner and Co-Chief Investment Officer of Tricadia. Tricadia’s subsidiaries include, and Mr. Barnes is Co-Chief Investment officer of, companies that manage hedge funds, private equity funds and structured vehicles with business strategies that may compete with ours. Jonathan Ilany, our Chief Executive Officer, is a limited partner of Mariner, which is a stockholder of Tiptree and provides information technology services to Tiptree. Such positions may give rise to actual or potential conflicts of interest, which may not be resolved in a manner that is in the best interests of the Company or the best interests of its stockholders.
W
e incur costs as a result of operating as a public company, and our management is required to devote substantial time to these compliance activities.
As a public company, we incur significant legal, accounting and other costs. In addition, the Sarbanes-Oxley Act of 2002, or the “Sarbanes-Oxley Act,” the Dodd-Frank Act and the rules of the SEC, and NASDAQ, impose various requirements on public companies. Our management and other personnel devote a substantial amount of time to these compliance activities. Moreover, these rules and regulations increase our legal and financial compliance costs and make some activities more time-consuming and costly.
Furthermore, if we are not able to comply with the requirements of Section 404 of the Sarbanes-Oxley Act in a timely manner, the market price of our common stock could decline and we could be subject to potential delisting by NASDAQ and review by such exchange, the SEC, or other regulatory authorities, which would require the expenditure by us of additional financial and management resources. As a result, our stockholders could lose confidence in our financial reporting, which would harm our business and the market price of our common stock.
21
Some provisions of our charter may delay, deter or prevent takeovers and business combinations that stockholders consider in their best interests.
Our charter restricts any person that owns 9.8% or more of our capital stock, other than TFP and its affiliates or another stockholder approved by applicable state insurance regulators, from voting in excess of 9.8% of our voting securities. This provision is intended to satisfy the requirements of applicable state regulators in connection with insurance laws and regulations that prohibit any person from acquiring control of a regulated insurance company without the prior approval of the insurance regulators. In addition, our charter provides for the classification of our board of directors into three classes, one of which is to be elected each year. Our charter also generally only permits stockholders to act without a meeting by unanimous consent. These provisions may delay, deter or prevent takeovers and business combinations that stockholders consider in their best interests.
Maryland takeover statutes may prevent a change of our control, which could depress our stock price.
Maryland law provides that “control shares” of a corporation acquired in a “control share acquisition” will have no voting rights except to the extent approved by a vote of two-thirds of the votes entitled to be cast on the matter under the Maryland Control Share Acquisition Act. “Control shares” means voting shares of stock that, if aggregated with all other shares of stock owned by the acquirer or in respect of which the acquirer is able to exercise or direct the exercise of voting power (except solely by virtue of a revocable proxy), would entitle the acquirer to exercise voting power in electing directors within one of the following ranges of voting power: one-tenth or more but less than one-third; one-third or more but less than a majority; or a majority or more of all voting power. A “control share acquisition” means the acquisition of issued and outstanding control shares, subject to certain exceptions.
Under Maryland law, “business combinations” between a Maryland corporation and an interested stockholder or an affiliate of an interested stockholder are prohibited for five years after the most recent date on which such stockholder became an interested stockholder. These business combinations include a merger, consolidation, share exchange or, in circumstances specified in the statute, an asset transfer or issuance or reclassification of equity securities.
Our bylaws contain a provision exempting from the control share statute any and all acquisitions by any person of our shares of stock. Our board of directors has also adopted a resolution which provides that any business combination between us and any other person is exempted from the provisions of the business combination statute, provided that the business combination is first approved by the board of directors. However, our board of directors may amend or eliminate this provision in our bylaws regarding the control share statute or amend or repeal this resolution regarding the business combination statute. If our board takes such action in the future, the control share and business combination statutes may prevent or discourage others from trying to acquire control of us and increase the difficulty of consummating any offer, including potential acquisitions that might involve a premium price for our common stock or otherwise be in the best interest of our stockholders.
Our holding company structure with multiple lines of business, may adversely impact the market price of our Class A common stock and our ability to raise equity and debt capital.
Tiptree holds and manages multiple lines of business. Analysts, investors and lenders may have difficulty analyzing and valuing a company with multiple lines of business, which could adversely impact the market price of our Class A common stock and our ability to raise equity and debt capital at a holding company level. Moreover, our management is required to make decisions regarding the allocation of capital among the different lines of business, and such decisions could materially and adversely affect our business or one or more of our lines of business.
The accounting rules applicable to certain of our transactions are highly complex and require the application of significant judgment and assumptions by our management. In addition, changes in accounting interpretations or assumptions could impact our financial statements.
Accounting rules for consolidations, income taxes, business acquisitions, transfers of financial assets, securitization transactions and other aspects of our operations are highly complex and require the application of judgment and assumptions by our management. In addition, changes in accounting rules, interpretations or assumptions could materially impact the presentation, disclosure and usability of our financial statements. For more information see Item 7. “Management’s Discussion and Analysis of Financial Condition and Results of Operations — Critical Accounting Policies and Estimates”.
Risks Related to Regulatory and Legal Matters
Maintenance of our 1940 Act exemption imposes limits on our operations.
We conduct our operations so that we are not required to register as an investment company under the 1940 Act. Therefore, we must limit the types and nature of businesses in which we engage and assets that we acquire. We monitor our compliance with the 1940 Act on an ongoing basis and may be compelled to take or refrain from taking actions, to acquire additional income or loss
22
generating assets or to forgo opportunities that might otherwise be beneficial or advisable, including, but not limited to selling assets that are considered to be investment securities or forgoing the sale of assets that are not investment securities, in order to ensure that we (or a subsidiary) may continue to rely on the applicable exceptions or exemptions. These limitations on our freedom of action could have a material adverse effect on our financial condition and results of operations.
If we fail to maintain an exemption, exception or other exclusion from registration as an investment company, we could, among other things, be required to substantially change the manner in which we conduct our operations either to avoid being required to register as an investment company or to register as an investment company. If we were required to register as an investment company under the 1940 Act, we would become subject to substantial regulation with respect to, among other things, our capital structure (including our ability to use leverage), management, operations, transactions with affiliated persons (as defined in the 1940 Act), portfolio composition, including restrictions with respect to diversification and industry concentration, and our financial condition and results of operations may be adversely affected. If we did not register despite being required to do so, criminal and civil actions could be brought against us, our contracts would be unenforceable unless a court were to require enforcement, and a court could appoint a receiver to take control of us and liquidate our business.
A change in law, regulation or regulatory enforcement applicable to insurance products could adversely affect our financial condition and results of operations.
A change in state or U.S. federal tax laws could materially affect our insurance businesses. Currently, Fortegra does not collect sales or other related taxes on its services. Whether sales of Fortegra’s services are subject to state sales and use taxes is uncertain, due in part to the nature of its services and the relationships through which its services are offered, as well as changing state laws and interpretations of those laws. One or more states may seek to impose sales or use tax or other tax collection obligations on Fortegra, whether based on sales by Fortegra or its resellers or clients, including for past sales. A successful assertion that Fortegra should be collecting sales or other related taxes on its services could result in substantial tax liabilities for past sales, discourage customers from purchasing its services, discourage clients from offering or billing for its services, or otherwise cause material harm to its business, financial condition and results of operations.
With regard to Fortegra’s payment protection products, there are federal and state laws and regulations that govern the disclosures related to lenders’ sales of those products. Fortegra’s ability to offer and administer these products on behalf of financial institutions is dependent upon their continued ability to sell such products. To the extent that federal or state laws or regulations change to restrict or prohibit the sale of these products, Fortegra’s revenues would be adversely affected. For example, the CFPB’s enforcement actions have resulted in large refunds and civil penalties against financial institutions in connection with their marketing of payment protection and other products. Due to such regulatory actions, some lenders may reduce their sales and marketing of payment protection and other ancillary products, which may adversely affect Fortegra’s revenues. The full impact of the CFPB’s oversight is unpredictable and continues to evolve. With respect to the property and casualty insurance policies Fortegra underwrites, federal legislative proposals regarding national catastrophe insurance, if adopted, could reduce the business need for some of the related products that Fortegra provides.
Compliance with existing and new regulations affecting our business in regulated industries may increase costs and limit our ability to pursue business opportunities.
We are subject to extensive laws and regulations administered and enforced by a number of different federal and state governmental authorities in the industries in which we operate. Regulation of such industries may increase. In the past several years, there has been significant legislation affecting financial services, insurance and health care, including the Dodd-Frank Act and the Patient Protection and Affordable Care Act. In addition, the New York Department of Financial Services has adopted Cybersecurity regulations applicable to our insurance and mortgage operations in New York. Accordingly, we cannot predict the impact that any new laws and regulations will have on us. The costs to comply with these laws and regulations may be substantial and could have a significant negative impact on us and limit our ability to pursue business opportunities. We can give no assurances that with changes to laws and regulations, our businesses can continue to be conducted in each jurisdiction in the manner as we have in the past.
Our insurance subsidiaries are subject to regulation by state and, in some cases, foreign insurance authorities with respect to statutory capital, reserve and other requirements. The laws of the various states in which our insurance businesses operate establish insurance departments and other regulatory agencies with broad powers to preclude or temporarily suspend our insurance subsidiaries from carrying on some or all of their activities or otherwise fine or penalize them in any jurisdiction in which they operate. Such regulation or compliance could reduce our insurance businesses’ profitability or limit their growth by increasing the costs of compliance, limiting or restricting the products or services they sell, or the methods by which they sell their services and products, or subjecting their business to the possibility of regulatory actions or proceedings.
Due to the highly regulated nature of the residential mortgage industry, our mortgage subsidiaries are required to comply with a wide array of federal, state and local laws and regulations that regulate licensing, allowable fees and loan terms, permissible servicing and debt collection practices, limitations on forced-placed insurance, special consumer protections in connection with default
23
and foreclosure, and protection of confidential, nonpublic consumer information. In addition, mortgage servicers must comply with U.S. federal, state and local laws and regulations that regulate, among other things, the manner in which they service our NPL mortgage loans and manage our real property. These laws and regulations are constantly changing and the volume of new or modified laws and regulations has increased in recent years as states and local cities and counties continue to enact laws that either restrict or impose additional obligations in connection with certain loan origination, acquisition and servicing activities in those cities and counties. These laws and regulations are complex and vary greatly among different states and localities, and in some cases, these laws are in conflict with each other or with U.S. federal law. A failure by us or our servicers to comply with applicable laws or regulations could subject our mortgage businesses and/or our mortgage servicers to lawsuits or governmental actions, which could result in the loss or suspension of our licenses in the applicable jurisdictions where such violations occur and/or monetary fines or changes in our mortgage operations. If we were to determine to change servicers, there is no assurance that we could find servicers that satisfy our requirements or with whom we could enter into agreements on satisfactory terms. Any of these outcomes could materially and adversely affect our mortgage businesses.
Changes to consumer protection laws or changes in their interpretation may impede collection efforts in connection with our investments in NPLs, delaying and/or reducing our returns on these investments. The CFPB has specifically focused on servicing and foreclosure practices, especially as it relates to the servicing of delinquent loans. Many of these laws and regulations are focused on sub-prime borrowers and are intended to curtail or prohibit some industry standard practices. While we believe that our practices are in compliance with these changes and enhanced regulations, certain of our collections methods could be prohibited in the future, forcing us to revise our practices and implement more costly or less effective policies and procedures. Federal or state bankruptcy or debtor relief laws could offer additional protection to borrowers seeking bankruptcy protection, providing a court greater leeway to reduce or discharge amounts owed to us. As a result, some of these changes in laws and regulations could impact our expected returns and/or ability to recover some of our investment.
TAMCO is an asset management holding company registered with the SEC as an investment advisor and is subject to various federal and state laws and regulations and rules of various securities regulators and exchanges. These laws and regulations primarily are intended to protect clients and generally grant supervisory agencies broad administrative powers, including the power to limit or restrict the carrying on of business for failure to comply with such laws and regulations. Possible sanctions that may be imposed include the suspension of individual employees, limitations on engaging in business for specific periods, the revocation of the registration as an investment adviser, censures and fines.
The final rules implementing the credit risk retention requirements of the Dodd-Frank Act became effective beginning on December 24, 2016 with respect to CLOs (the “Risk Retention Rules”). The Risk Retention Rules generally require sponsors of asset-backed securities transactions or their affiliates to retain not less than 5% of the credit risk of the assets collateralizing asset-backed securities for the life of the vehicle. The Risk Retention Rules also generally prohibit hedging the credit risk that is required to be retained. The Risk Retention Rules may impact our returns in the business, and thus our ability or desire to manage CLOs in the future. We are exploring multiple alternatives for compliance with the Risk Retention Rules.
While the CFPB does not have direct jurisdiction over insurance products, it is possible that regulatory actions taken by the CFPB may affect the sales practices related to these products and thereby potentially affect Fortegra’s business or the clients that it serves. In March 2015, the CFPB announced it is considering proposing rules under its unfair, deceptive and abusive acts and practices rulemaking authority relating to consumer installment loans, among other things. If and when implemented CFPB rules regarding consumer installment loans could adversely impact Fortegra’s volume of insurance products and services and cost structure. In addition, the CFPB’s enforcement actions and examinations have resulted in large refunds and civil penalties against financial institutions in connection with their marketing of payment protection and other products. Due to such regulatory actions, some lenders may reduce their sales and marketing of payment protection and other ancillary products, which may adversely affect Fortegra’s revenues.
The properties held by our Care subsidiary are regulated by state and federal laws regarding healthcare facilities. Luxury is subject to extensive regulation by federal, state and local governmental authorities, including the CFPB, the Federal Trade Commission and various state agencies that license, audit and conduct examinations.
Our businesses are subject to risks related to litigation and regulatory actions.
Over the last several years, businesses in many areas of the financial services industry have been subject to increasing amounts of regulatory scrutiny. In addition, there has been an increase in litigation involving firms in the financial services industry and public companies generally, some of which have involved new types of legal claims, particularly in the insurance industry. We may be materially and adversely affected by judgments, settlements, fines, penalties, unanticipated costs or other effects of legal and administrative proceedings now pending or that may be instituted in the future, including from investigations by regulatory bodies or administrative agencies. An adverse outcome of any investigation by, or other inquiries from, any such bodies or agencies also could result in non-monetary penalties or sanctions, loss of licenses or approvals, changes in personnel, increased review and scrutiny of us by our clients, counterparties, regulatory authorities, potential litigants, the media and others, any of which
could have a material adverse effect on us.
24
Failure to protect our clients’ confidential information and privacy could result in the loss of our reputation and customers, reduction in our profitability and subject us to fines, penalties and litigation and adversely affect our results of operations and financial condition.
We and our subsidiaries retain confidential information in our information systems, and we are subject to a variety of privacy regulations and confidentiality obligations. For example, some of the Company’s subsidiaries are subject to the privacy regulations of the Gramm-Leach-Bliley Act. We and certain of our subsidiaries also have contractual obligations to protect confidential information we obtain from third parties. These obligations generally require us, in accordance with applicable laws, to protect such information to the same extent that we protect our own confidential information. We have implemented physical, administrative and logical security systems with the intent of maintaining the physical security of our facilities and systems and protecting our clients’ and their customers’ confidential information and personally-identifiable information against unauthorized access through our information systems or by other electronic transmission or through misdirection, theft or loss of data. Despite such efforts, we may be subject to a breach of our security systems that results in unauthorized access to our facilities and/or the information we are trying to protect. Anyone who is able to circumvent our security measures and penetrate our information systems could access, view, misappropriate, alter or delete any information in the systems, including personally identifiable customer information and proprietary business information. In addition, most states require that customers be notified if a security breach results in the disclosure of personally-identifiable customer information. Any compromise of the security of our or our subsidiaries’ information systems that results in inappropriate disclosure of such information could result in, among other things, unfavorable publicity and damage to our and our subsidiaries’ reputation, governmental inquiry and oversight, difficulty in marketing our services, loss of clients, significant civil and criminal liability, litigation and the incurrence of significant technical, legal and other expenses, any of which may have a material adverse effect on our results of operations and financial condition.
None.
Our principal executive office is located at 780 Third Avenue, 21st Floor, New York, New York 10017. We and our subsidiaries lease properties throughout the United States, all of which are used as administrative offices. We believe that the terms of their leases at each of our subsidiaries are sufficient to meet our present needs and we do not anticipate any difficulty in securing additional space, as needed, on acceptable terms.
As of December 31, 2016, the Company’s owned real estate properties consisted of 29 properties in our senior living segment, which are located across 11 states primarily in the Mid-Atlantic and Southern United States and 81 single family properties in our insurance segment consisting of REO properties resulting from our investments in non-performing residential mortgage loans.
Litigation
Fortegra is a defendant in
Mullins v. Southern Financial Life Insurance Co.
, which was filed in February 2006, in the Pike Circuit Court, in the Commonwealth of Kentucky. A class was certified in June 2010. At issue is the duration or term of coverage under certain policies. The action alleges violations of the Consumer Protection Act and certain insurance statutes, as well as common law fraud. The action seeks compensatory and punitive damages, attorney fees and interest. Plaintiffs filed a Motion for Sanctions in April 2012 in connection with Fortegra's efforts to locate and gather certificates and other documents from Fortegra's producers. The court did not award sanctions and Fortegra has retained a special master to facilitate the collection of certificates and other documents from Fortegra's producers. In January 2015, the trial court issued an Order denying Fortegra’s motion to decertify the class, which was upheld on appeal. Following a February 2017 hearing, the court denied Fortegra’s Motion for Summary Judgment as to certain disability insurance policies. The court has not yet ruled on Fortegra’s Motion for Summary Judgment as to certain life insurance policies, and a hearing is currently set for March 2017. No trial or additional hearings are currently scheduled.
Tiptree considers such litigation customary in the insurance industry. In management's opinion, based on information available at this time, the ultimate resolution of such litigation, which it is vigorously defending, should not be materially adverse to the financial position of Tiptree. It should be noted that large punitive damage awards, bearing little relation to actual damages sustained by plaintiffs, have been awarded in certain states against other companies in the credit insurance business. At this time, the Company cannot estimate a range of loss that is reasonably possible.
Tiptree and its subsidiaries are parties to other legal proceedings in the ordinary course of business. Although Tiptree’s legal and financial liability with respect to such proceedings cannot be estimated with certainty, Tiptree does not believe that these proceedings, either individually or in the aggregate, are likely to have a material adverse effect on Tiptree’s financial position.
25
Not applicable.
Item 5. Market for Registrant’s Common Equity, Related Stockholder Matters and Issuer Purchases of Equity Securities
Market Information
Tiptree’s Class A common stock has traded on the NASDAQ Capital Market under the ticker symbol “TIPT” since August 9, 2013.
Holders
As of
December 31, 2016
, there were 104 Class A common stockholders of record.
Stock Price and Dividends
The following table sets forth the high and low stock prices per share of our Class A common stock and the dividends declared and paid per share on our Class A common stock for the periods indicated.
|
2016
|
High Price
|
Low Price
|
Dividends
|
||||||
|
First Quarter
|
$
|
6.78
|
|
$
|
5.33
|
|
$
|
0.025
|
|
|
Second Quarter
|
$
|
6.82
|
|
$
|
4.74
|
|
$
|
0.025
|
|
|
Third Quarter
|
$
|
6.16
|
|
$
|
5.03
|
|
$
|
0.025
|
|
|
Fourth Quarter
|
$
|
7.15
|
|
$
|
5.53
|
|
$
|
0.025
|
|
|
2015
|
High Price
|
Low Price
|
Dividends
|
||||||
|
First Quarter
|
$
|
8.01
|
|
$
|
6.10
|
|
$
|
0.025
|
|
|
Second Quarter
|
$
|
8.19
|
|
$
|
6.17
|
|
$
|
0.025
|
|
|
Third Quarter
|
$
|
7.47
|
|
$
|
5.17
|
|
$
|
0.025
|
|
|
Fourth Quarter
|
$
|
7.50
|
|
$
|
5.48
|
|
$
|
0.025
|
|
Our Class B common stock is not listed nor traded on any stock exchange.
Our payment of dividends in the future will be determined by our Board of Directors and will depend on business conditions, our earnings and other factors.
The following tables set forth our consolidated selected financial data for the periods and as of the dates indicated and are derived from our audited Consolidated Financial Statements. The following consolidated financial data should be read in conjunction with Management's Discussion and Analysis of Financial Condition and Results of Operations ("MD&A") in ITEM 7 of this Form 10-K and the consolidated financial statements and related notes included in Item 8 of this Form 10-K. All amounts pertaining to our results of operations and financial condition are presented on a continuing operations basis. All acquisitions by Tiptree during the five years ended December 31, 2016 are included in results of operations since their respective dates of acquisition.
|
(in thousands, except shares and per share amounts)
|
For the Years Ended December 31,
|
||||||||||||||||||
|
2016
|
2015
(2)
|
2014
(1)(2)
|
2013
(3)
|
2012
(3)
|
|||||||||||||||
|
Total revenues
|
$
|
567,154
|
|
$
|
438,459
|
|
$
|
80,313
|
|
$
|
23,743
|
|
$
|
22,299
|
|
||||
|
Total expenses
|
544,092
|
|
444,009
|
|
99,050
|
|
36,341
|
|
22,726
|
|
|||||||||
|
Net income (loss) attributable to consolidated CLOs
|
20,254
|
|
(6,889
|
)
|
19,525
|
|
28,865
|
|
35,365
|
|
|||||||||
|
Income (loss) before taxes from continuing operations
|
43,316
|
|
(12,439
|
)
|
788
|
|
16,267
|
|
34,938
|
|
|||||||||
|
Less: provision (benefit) for income taxes
|
10,978
|
|
1,377
|
|
4,141
|
|
560
|
|
56
|
|
|||||||||
|
Income (loss) from continuing operations
|
32,338
|
|
(13,816
|
)
|
(3,353
|
)
|
15,707
|
|
34,882
|
|
|||||||||
|
Discontinued operations, net
|
—
|
|
22,618
|
|
7,937
|
|
25,022
|
|
6,607
|
|
|||||||||
|
Net income (loss) before non-controlling interests
|
32,338
|
|
8,802
|
|
4,584
|
|
40,729
|
|
41,489
|
|
|||||||||
|
Less: net income (loss) attributable to non-controlling interests
|
7,018
|
|
3,023
|
|
6,294
|
|
30,336
|
|
31,281
|
|
|||||||||
|
Net income (loss) attributable to Tiptree Inc. Class A common stockholders
|
$
|
25,320
|
|
$
|
5,779
|
|
$
|
(1,710
|
)
|
$
|
10,393
|
|
$
|
10,208
|
|
||||
|
Net income (loss) per Class A common share:
|
|||||||||||||||||||
|
Basic, continuing operations, net
|
$
|
0.79
|
|
$
|
(0.26
|
)
|
$
|
(0.31
|
)
|
$
|
0.41
|
|
$
|
0.35
|
|
||||
|
Basic, discontinued operations, net
|
—
|
|
0.43
|
|
0.21
|
|
0.60
|
|
0.16
|
|
|||||||||
|
Basic earnings per share
|
0.79
|
|
0.17
|
|
(0.10
|
)
|
1.01
|
|
0.51
|
|
|||||||||
|
Diluted, continuing operations, net
|
0.78
|
|
(0.26
|
)
|
(0.31
|
)
|
0.41
|
|
0.35
|
|
|||||||||
|
Diluted, discontinued operations, net
|
—
|
|
0.43
|
|
0.21
|
|
0.60
|
|
0.16
|
|
|||||||||
|
Diluted earnings per share
|
$
|
0.78
|
|
$
|
0.17
|
|
$
|
(0.10
|
)
|
$
|
1.01
|
|
$
|
0.51
|
|
||||
|
Weighted average number of Class A common shares:
|
|||||||||||||||||||
|
Basic
|
31,721,449
|
|
33,202,681
|
|
16,771,980
|
|
10,250,438
|
|
10,286,412
|
|
|||||||||
|
Diluted
|
31,766,674
|
|
33,202,681
|
|
16,771,980
|
|
10,250,438
|
|
10,286,412
|
|
|||||||||
|
Cash dividends paid per common share
|
$
|
0.10
|
|
$
|
0.10
|
|
$
|
—
|
|
$
|
0.175
|
|
$
|
0.54
|
|
||||
|
As of December 31,
|
|||||||||||||||||||
|
Consolidated Balance Sheet Data:
(in thousands)
|
2016
|
2015
|
2014
|
2013
|
2012
|
||||||||||||||
|
Total assets
(4)
|
$
|
2,890,050
|
|
$
|
2,494,970
|
|
$
|
8,202,447
|
|
$
|
6,872,271
|
|
$
|
5,533,802
|
|
||||
|
Debt, net
|
793,009
|
|
666,952
|
|
360,792
|
|
269,594
|
|
195,648
|
|
|||||||||
|
Total Tiptree Inc. stockholders’ equity
|
293,431
|
|
312,840
|
|
284,462
|
|
98,979
|
|
86,374
|
|
|||||||||
|
Total stockholders’ equity
|
$
|
390,144
|
|
$
|
397,694
|
|
$
|
401,621
|
|
$
|
396,896
|
|
$
|
342,318
|
|
||||
|
(1)
|
2014 results reflects the impact of the acquisition of Fortegra in December 2014.
|
|
(2)
|
PFG revenues of $40.5 million and $78.7 million and net income of $7.0 million and $7.9 million for the years ended December 31, 2015 and December 31, 2014, respectively, and gain on sale of $15.6 million for the year ended December 31, 2015 are included in Discontinued operations, net.
|
|
(3)
|
Reflects the combination of Tiptree Inc. and Care. Prior to July 1, 2013 Care was a public REIT and dividends reflect those paid by Care and Tiptree.
|
|
(4)
|
Total assets on December 31, 2016, 2015, 2014, 2013 and 2012 include $989.5 million, $728.8 million, $1,978.1 million, $1,405.4 million and $851.7 million of assets held by consolidated CLO entities, respectively.
|
Our Management’s Discussion and Analysis of Financial Conditions and Results of Operations is presented in this section as follows:
|
•
|
Overview
|
|
•
|
Results of Operations
|
|
•
|
Non-GAAP Reconciliations
|
|
•
|
Liquidity and Capital Resources
|
|
•
|
Critical Accounting Policies and Estimates
|
|
•
|
Off-Balance Sheet Arrangements
|
27
OVERVIEW
Tiptree is a holding company focused on enhancing shareholder value by generating consistent and growing earnings at our operating companies. Our consolidated subsidiaries are currently engaged in the following businesses - specialty insurance, asset management, senior living and specialty finance. We selectively manage our specialty insurance segment investments across multiple asset classes, sectors and geographies, which we believe distinguishes us from many other insurance companies. We evaluate our performance primarily by the comparison of our shareholder’s long-term total return on capital, as measured by Adjusted EBITDA and growth in book value per share plus dividends paid.
In furtherance of our strategy to grow sustainable earnings and Adjusted EBITDA, during 2016, we:
|
•
|
contributed $102.8 million of capital to our specialty insurance company to enhance their A.M. Best rating to an “A-“ (Excellent) group rating and allow for product expansion opportunities,
|
|
•
|
redeployed capital from our non-core assets into our businesses,
|
|
•
|
enhanced the returns on our specialty insurance investment portfolio by managing assets across multiple asset classes, sectors and geographies,
|
|
•
|
re-allocated our principal investments to the specialty insurance and asset management segments, and
|
|
•
|
returned $47.8 million to shareholders and limited partners through $43.8 million of share buy-backs and $4.0 million of dividends paid.
|
We currently have four reporting segments: specialty insurance, asset management, senior living, and specialty finance. Corporate and other primarily contains corporate expenses not allocated to the operating businesses. See Note-(5) Operating Segment Data, in the notes to the accompanying consolidated financial statements for detailed information regarding our segments. Since different factors affect the financial condition and results of operation of each segment, the following discussion is presented on both a consolidated and segment basis.
Our results of operations are affected by a variety of factors including, but not limited to, general economic conditions and GDP growth, market liquidity and volatility, consumer confidence, U.S. demographics, employment and wage growth, business confidence and investment, inflation, interest rates and spreads, the impact of the regulatory environment, and the other factors set forth in Item 1A. “Risk Factors” of this Annual Report on Form 10-K. Generally, our businesses are positively affected by a healthy U.S. consumer, stable to gradually rising interest rates, stable markets and business conditions and the aging U.S. population. Conversely, rising unemployment, volatile markets, rapidly rising interest rates and slowing business conditions can have a material adverse effect on our results of operations or financial condition.
Our specialty insurance results primarily depend on the appropriateness of our pricing, underwriting, risk retension and the accuracy of our methodology for the establishment of reserves for future policyholder benefits and claims, the returns on and values of invested assets, and our ability to estimate contract renewals and run-off. While our insurance operations have historically maintained a high percentage of fees to total revenue and a relatively stable combined ratio which support steady earnings, changing business and economic factors could generate different results than we have historically seen. In our senior living operations, the ability to raise rents and charge for additional services along with the potential impact that inflation may have on the costs of operations could impact margins and the value of the real estate. In our asset management segment, improving business conditions and growing corporate loan demand, especially from small to medium sized businesses has generally supported growth in AUM. Slowing economic growth and/or economic uncertainty could reduce business investment and loan demand, slowing the growth in AUM and associated fees. While economic conditions are generally expected to continue on a positive trend, with interest rates gradually rising as inflation is expected to pick up modestly, and unemployment remaining relatively low, any downward trend or increased volatility and uncertainty in these economic factors could impact our results negatively.
Our profitability is affected by investment income and investment gains and losses. Our invested assets are invested principally in fixed maturity securities, equity securities, loans, CLOs, credit investment funds, and senior living related assets. Many of our investments are held at fair value. Changes in fair value of these assets are reported quarterly as unrealized gains or losses in revenues and can be impacted by changes in both interest rates and credit risk. Credit risk can impact our financial results in a number of ways, including the performance of our corporate loans, mortgage loans, holdings in CLO subordinated notes and other investments. When credit markets are performing well, loans held in our CLOs and credit fund investments may prepay, subjecting those investments to reinvestment risk. In deteriorating credit environments, default risk can impact the performance of our investments, as well as flowing through income as unrealized losses. Disruption in the credit markets can also impact our ability to raise third party funds to invest and grow our asset management fees.
Our business is also impacted in various ways by changes in interest rates. In addition to the impact interest rates can have on the fair value of the assets, interest rates can also impact the volume and revenues in our specialty finance business. In addition, most of our subsidiaries use debt financing to fund their business activities, much of which is floating rate debt, and the majority of which have LIBOR floors, LIBOR floors can result in a reduction in net interest margins in a declining interest rate environment, if earnings on our assets do not have similar floors or are based on different benchmarks than LIBOR, such as treasury rates or the prime rate. Certain
28
of our subsidiaries have also entered into interest rate swap agreements to fix all or a portion of their interest rate exposure which are currently designated as hedging relationships for accounting purposes.
RESULTS OF OPERATIONS
The following is a summary of consolidated financial results for the years ended December 31, 2016, 2015 and 2014. Management uses Adjusted EBITDA and book value per share, as exchanged, as measurements of operating performance which are non-GAAP measures. Management believes the use of Adjusted EBITDA provides supplemental information useful to investors as it is frequently used by the financial community to analyze financial performance, and to analyze a company’s ability to service its debt and to facilitate comparison among companies. Adjusted EBITDA is also used in determining incentive compensation for the Company’s executive officers. Adjusted EBITDA is not a measurement of financial performance or liquidity under GAAP and should not be considered as an alternative or substitute for GAAP net income. Book value per share, as exchanged assumes full exchange of the limited partners units of TFP for Tiptree Class A common stock. Management believes the use of this financial measure provides supplemental information useful to investors as it is frequently used by the financial community to analyze company growth on a relative per share basis.
|
($ in thousands)
|
Year Ended December 31,
|
||||||||||
|
GAAP:
|
2016
|
2015
|
2014
|
||||||||
|
Total revenues
|
$
|
567,154
|
|
$
|
438,459
|
|
$
|
80,313
|
|
||
|
Income (loss) from continuing operations
|
32,338
|
|
(13,816
|
)
|
(3,353
|
)
|
|||||
|
Net income (loss) attributable to Tiptree Inc. Class A common stockholders
|
25,320
|
|
5,779
|
|
(1,710
|
)
|
|||||
|
Diluted earnings per share
|
0.78
|
|
0.17
|
|
(0.10
|
)
|
|||||
|
Cash dividends paid per common share
|
0.10
|
|
|
0.10
|
|
—
|
|
||||
|
Non-GAAP:
(3)
|
|||||||||||
|
Adjusted EBITDA
|
$
|
78,916
|
|
|
$
|
58,419
|
|
|
$
|
58,923
|
|
|
Book Value per share, as exchanged
|
10.14
|
|
|
8.90
|
|
9.00
|
|
||||
|
(1)
|
Reflects the impact of the acquisition of Fortegra in December 2014.
|
|
(2)
|
PFG revenues of
$40.5 million
and
$78.7 million
and net income of
$7.0 million
and
$7.9 million
for the years ended December 31, 2015 and December 31, 2014, respectively, and gain on sale of
$15.6 million
for the year ended December 31, 2015 are included in Discontinued operations, net.
|
|
(3)
|
For further information relating to the Company’s Adjusted EBITDA and book value per share, as exchanged, including a reconciliation to GAAP financials, see “—Non-GAAP Reconciliations.”.
|
Consolidated Results of Operations - 2016 compared to 2015
Revenues
For the
year ended December 31, 2016
, the Company reported revenues of
$567.2 million
, an increase of
$128.7 million
or
29.4%
from the
year ended December 31, 2015
. The primary drivers of the increase in revenues were improvements in earned premiums, service and administrative fees and investment income in our specialty insurance segment, increases in management incentive fees and returns on associated investments in our asset management segment, improvement in rental income attributable to acquisitions of senior housing properties and increased mortgage volume.
Income (loss) from continuing operations
For the
year ended December 31, 2016
, income from continuing operations was
$32.3 million
compared to a loss of
$13.8 million
in 2015. The key drivers of the
$46.2 million
increase were improved profitability in our specialty insurance segment driven by higher revenues and investment income, increased profits from our asset management segment as a result of incentive fees and CLO subordinated note returns, increased rental income in our senior living operations, and increases in mortgage volume and margins due to improving market conditions. This increased income was partially offset by higher corporate expenses from increased performance related incentive compensation and costs associated with our effort to improve our controls and financial reporting infrastructure. Additionally, a tax benefit of $4.0 million was recognized in the first quarter of 2016, which was driven by the tax reorganization effective January 1, 2016. A discussion of the changes in revenues, expenses and net income is presented below and in more detail in our segment analysis.
29
Net Income (Loss) Available to Class A Common Stockholders
For the
year ended December 31, 2016
, net income available to Class A common stockholders was
$25.3 million
, an increase of
$19.5 million
, or
338.1%
, from the prior year period. The key drivers of net income available to Class A common stockholders were the same factors which impacted the positive year-over-year change in income from continuing operations, and which were partially offset by the loss of the
$22.6 million
of earnings from discontinued operations recorded in the
year ended December 31, 2015
, which included the one-time net gain on the sale of PFG of $15.6 million.
Adjusted EBITDA
Total Adjusted EBITDA for the
year ended December 31, 2016
was
$78.9 million
compared to
$58.4 million
for 2015, an increase of $20.5 million or 35.1%. The key drivers of the change in Adjusted EBITDA were the same as those which impacted our income from continuing operations, and which were partially offset by the loss of
$32.5 million
of Adjusted EBITDA in the
year ended December 31, 2015
related to discontinued operations. See “
—
Non-GAAP Reconciliations” for a reconciliation to GAAP net income.
Consolidated Results of Operations - 2015 compared to 2014
Revenues
For the
year ended December 31, 2015
, the Company reported revenues of
$438.5 million
, an increase of
$358.1 million
from the
year ended December 31, 2014
. The primary driver of the increase in revenues was the addition of Fortegra. Other key drivers were the improvement in volume and margins at our specialty finance segment, including from the addition of Reliance, and increased rental income from our real estate segment, offset in part by the elimination of the one-time gain of $7.9 million in 2014 from the repayment of a loan in that segment, and the realized and unrealized losses on CLO subordinated note investments in 2015.
Income (loss) from continuing operations
For the
year ended December 31, 2015
, income from continuing operations was a loss of
$13.8 million
, compared to a loss of
$3.4 million
in 2014. The key drivers of income from continuing operations were higher depreciation and amortization from new investments in our senior living operations, realized and unrealized losses on CLO subordinated note investments of $25.9 million, lower distributions received on CLO subordinated notes due to sales of CLO subordinated notes in the second quarter of 2015, and higher corporate expenses associated with our effort to improve our controls and financial reporting infrastructure, offset in part by improved profitability from the addition of a full year of Fortegra results, growth in specialty finance volumes and margins, and increased rental income in our senior living operations. In addition, in the year ended December 31, 2014, there was a one-time gain of $7.9 million from the repayment of a loan in our senior living segment, which impacted the year over year comparison.
Net Income (Loss) Available to Class A Common Stockholders
For the
year ended December 31, 2015
, net income available to Class A common shareholders was
$5.8 million
compared to a loss of
$1.7 million
in the 2014. The primary drivers of the year-over-year difference were the same factors which impacted income from continuing operations, plus additional factors attributable to the decrease in the provision for income taxes and the positive impact of the gain on sale and lower income from discontinued operations due to our sale of PFG at the end of the second quarter of 2015.
Adjusted EBITDA
For the
year ended December 31, 2015
, total Adjusted EBITDA was
$58.4 million
, a decrease of $0.5 million from 2014. The key drivers of the change in Adjusted EBITDA were the factors impacting income from continuing operations, including unrealized and realized losses on CLO subordinated notes, plus additional depreciation in our senior living segment, both of which were offset by the sale of PFG, which contributed
$32.5 million
of Adjusted EBITDA, including the $15.6 million gain, in the
year ended December 31, 2015
versus
$34.8 million
in the
year ended December 31, 2014
. See “
—
Non-GAAP Reconciliations” for a reconciliation to GAAP net income.
Results by Segment
Effective December 31, 2016, Tiptree realigned the principal investments formerly reported in the corporate and other segment into their new reportable segments to align with the Company’s operating strategy. The table below reflects the credit and equity investments contributed to our insurance subsidiary in the specialty insurance segment and the CLO subordinated notes and related warehouse income in the asset management segment for the years ended December 31, 2016, 2015 and 2014.
30
|
Year Ended December 31,
|
|||||||||||||||||||||||
|
($ in thousands)
|
Revenues
|
|
Pre-tax income (loss)
|
||||||||||||||||||||
|
|
2016
|
|
2015
|
|
2014
|
|
2016
|
|
2015
|
|
2014
|
||||||||||||
|
Specialty insurance
|
$
|
394,170
|
|
|
$
|
330,888
|
|
|
$
|
26,175
|
|
|
$
|
46,804
|
|
|
$
|
32,012
|
|
|
$
|
(3,171
|
)
|
|
Asset management
|
13,114
|
|
|
6,770
|
|
|
7,118
|
|
|
25,264
|
|
|
(6,753
|
)
|
|
18,191
|
|
||||||
|
Senior living
|
60,731
|
|
|
46,128
|
|
|
29,281
|
|
|
(5,824
|
)
|
|
(9,535
|
)
|
|
3,171
|
|
||||||
|
Specialty finance
|
95,431
|
|
|
54,999
|
|
|
15,223
|
|
|
8,170
|
|
|
6,265
|
|
|
(1,962
|
)
|
||||||
|
Corporate and other
|
3,708
|
|
|
(326
|
)
|
|
2,516
|
|
|
(31,098
|
)
|
|
(34,428
|
)
|
|
(15,441
|
)
|
||||||
|
Total
|
$
|
567,154
|
|
|
$
|
438,459
|
|
|
$
|
80,313
|
|
|
$
|
43,316
|
|
|
$
|
(12,439
|
)
|
|
$
|
788
|
|
Adjusted EBITDA by Segment - Non-GAAP
(1)
|
($ in thousands, unaudited)
|
Year Ended December 31,
|
||||||||||
|
|
2016
|
|
2015
|
|
2014
|
||||||
|
Specialty insurance
|
$
|
60,526
|
|
|
$
|
43,349
|
|
|
$
|
7,823
|
|
|
Asset management
|
25,264
|
|
|
(6,753
|
)
|
|
18,191
|
|
|||
|
Senior living
|
10,469
|
|
|
6,590
|
|
|
10,352
|
|
|||
|
Specialty finance
|
10,513
|
|
|
5,895
|
|
|
(1,463
|
)
|
|||
|
Corporate and other
|
(27,856
|
)
|
|
(23,164
|
)
|
|
(10,773
|
)
|
|||
|
Adjusted EBITDA from Continuing Operations
|
$
|
78,916
|
|
|
$
|
25,917
|
|
|
$
|
24,130
|
|
|
Discontinued Operations
|
—
|
|
|
32,502
|
|
|
34,793
|
|
|||
|
Total Adjusted EBITDA
|
$
|
78,916
|
|
|
$
|
58,419
|
|
|
$
|
58,923
|
|
|
(1)
|
For further information relating to the Company’s Adjusted EBITDA, including a reconciliation of the Company’s segments’ Adjusted EBITDA to GAAP pre-tax income, see “—Non-GAAP Reconciliations.”
|
Specialty Insurance
Fortegra is a specialty insurance company that offers asset protection products through niche commercial and personal lines of insurance. We also offer administration and fronting services for our self-insured clients who own captive producer owned reinsurance companies (“PORCs”). Our specialty insurance business generates revenues primarily from net earned premiums, service and administrative fees, ceding commissions and investment portfolio income.
Net earned premiums
Net earned premiums are the earned portion of net written premiums during a certain period. These consist of premiums directly written by us and premiums assumed by us as a result of reinsurance agreements. Whether direct or assumed, the premium is earned over the life of the respective policy using methods appropriate to the pattern of losses for the type of business. Our net earned premiums are partially offset by commission expenses and policy and contract benefits. The principal factors affecting net earned premiums are: the proportion of the risk assumed by our partners and reinsurers as defined in the applicable reinsurance treaty; increases and decreases in written premiums; the pattern of losses by type of business; increases and decreases in policy cancellation rates; the average duration of the policies written; and changes in regulation that would modify the earning patterns for the policies underwritten and administered. We generally limit the underwriting risk we assume through the use of both reinsurance (e.g., quota share and excess of loss) and retrospective commission agreements with our partners (e.g., commissions paid adjusted based on the actual underlying loss incurred), which manage and mitigate our risk.
Service and administrative fees
We earn service and administrative fees for administering specialty insurance and asset protection programs on behalf of our clients. Service fee revenue is recognized as the services are performed and the administrative fees are recognized consistent with the earnings recognition pattern of the underlying policies. Our asset protection products are sold as complementary products to consumer retail and credit transactions and are thus subject to the volatility of the volume of consumer purchase and credit activities.
Ceding commissions
We also earn ceding commissions on our debt protection products through risk sharing agreements. We elect to cede to reinsurers under reinsurance arrangements a significant portion of the credit insurance that we distribute on behalf of our clients. Ceding commissions earned under reinsurance agreements are based on contractual formulas that take into account, in part, underwriting performance and investment returns experienced by the assuming companies. As experience changes, adjustments to the ceding commissions are reflected in the period incurred and are based on the claim experience of the related policy.
31
Investment portfolio income
We generate net investment income and net realized and unrealized gains (losses) from our investment portfolio.
Discontinued Operations
The results of PFG, which was sold on June 30, 2015, are presented in discontinued operations for the years ended December 31, 2015 and 2014, and are not included in the specialty insurance segment results. The following tables present the specialty insurance segment results for the fiscal year ended December 31, 2016, 2015 and 2014. The fiscal year ended December 31, 2014 represents only one month of results for Fortegra, which was acquired in December 2014.
Operating Results
|
($ in thousands)
|
Year Ended December 31,
|
||||||||||
|
2016
|
2015
|
2014
|
|||||||||
|
Revenues:
|
|||||||||||
|
Net earned premiums
|
$
|
229,436
|
|
|
$
|
166,265
|
|
$
|
12,827
|
|
|
|
Service and administrative fees
|
109,348
|
|
|
106,525
|
|
8,657
|
|
||||
|
Ceding commissions
|
24,784
|
|
|
43,217
|
|
3,737
|
|
||||
|
Net investment income
|
12,981
|
|
|
5,455
|
|
|
279
|
|
|||
|
Net realized and unrealized gains
|
14,762
|
|
|
1,065
|
|
5
|
|
||||
|
Other income
|
2,859
|
|
|
8,361
|
|
670
|
|
||||
|
Total revenues
|
$
|
394,170
|
|
|
$
|
330,888
|
|
$
|
26,175
|
|
|
|
Expenses:
|
|
|
|
|
|||||||
|
Policy and contract benefits
|
106,784
|
|
|
86,312
|
|
5,829
|
|
||||
|
Commission expense
|
147,253
|
|
|
105,751
|
|
4,287
|
|
||||
|
Employee compensation and benefits
|
37,937
|
|
|
38,786
|
|
3,483
|
|
||||
|
Interest expense
|
9,244
|
|
|
6,968
|
|
637
|
|
||||
|
Depreciation and amortization expenses
|
13,184
|
|
|
29,673
|
|
4,265
|
|
||||
|
Other expenses
|
32,964
|
|
|
31,386
|
|
10,845
|
|
||||
|
Total expenses
|
$
|
347,366
|
|
|
$
|
298,876
|
|
$
|
29,346
|
|
|
|
Pre-tax income (loss)
|
$
|
46,804
|
|
|
$
|
32,012
|
|
$
|
(3,171
|
)
|
|
Results
Pre-tax income was
$46.8 million
for the
year ended December 31, 2016
, an increase of
$14.8 million
or
46.2%
over the prior year operating results. The primary drivers of the improvement in period-over-period results was an increase in investment income of
$7.5 million
, realized gains of
$5.3 million
and unrealized gains of
$8.4 million
, partially offset by increases in interest expense of $2.3 million and a reduction in underwriting related profits of $4.1 million.
Pre-tax income was
$32.0 million
in the year ended December 31, 2015, an increase over the 2014 operating results of
$35.2 million
. The primary drivers of the improvement in year-over-year results was the addition of Fortegra’s full year results, versus one month of results for 2014. In addition, approximately $6.1 million of acquisition related costs were included in the 2014 results.
Value of Business Acquired (“VOBA”)
The acquisition of Fortegra resulted in purchase price accounting adjustments in the segment giving effect to push-down accounting treatment of the acquisition. These adjustments include setting deferred cost assets to a fair value of zero, modifying deferred revenue liabilities to their respective fair values, and recording a substantial intangible asset representing the VOBA. The application of push-down accounting creates a modest impact to net income, but significantly impacts individual assets, liabilities, revenues, and expenses. Due to acquisition accounting, revenue and expenses related to acquired contracts are recognized differently from those related to newly originated contracts.
32
VOBA impacts
|
($ in thousands)
|
Year Ended December 31,
|
|||||||||||
|
2016
|
2015
|
Variance
|
||||||||||
|
Total revenues
(1)
|
$
|
(6,054
|
)
|
$
|
(22,928
|
)
|
$
|
16,874
|
|
|||
|
Commission expense
(1)
|
(10,745
|
)
|
(45,166
|
)
|
34,421
|
|
||||||
|
Depreciation and amortization expense
(2)
|
3,282
|
|
19,320
|
|
(16,038
|
)
|
||||||
|
Other expenses
(1)
|
(363
|
)
|
(1,928
|
)
|
1,565
|
|
||||||
|
(1)
|
Represents service fee and ceding commission revenues, and additional commissions, premium tax and other expenses that would have been recognized had purchase accounting effects not been recorded. Deferred service fee and ceding commission liabilities and deferred commission assets and deferred acquisitions costs at the acquisition date were reduced to reflect the purchase accounting fair value.
|
|
(2)
|
Represents net additional depreciation and amortization expense that would not have been recorded without purchase accounting; fixed assets and amortizing intangible assets were adjusted in purchase accounting based on fair value analyses.
|
Revenues
Revenues are generated by the sale of the following insurance products: credit protection, warranty, programs, services and other. Credit protection products include credit life, credit disability, credit property, involuntary unemployment, and accidental death and dismemberment. Warranty products include mobile device protection, furniture and appliance service contracts and auto service contracts. Programs are primarily personal and commercial lines and other property-casualty products. Services and other revenues principally represent investment income, unrealized and realized gains and losses, fees for insurance sales and business process outsourcing services, and interest for premium financing, and also include the impact to fee income, ceding commissions, and commissions expense from the purchase accounting effect of VOBA related to the insurance contracts.
Total revenues were
$394.2 million
for the
year ended December 31, 2016
, up
$63.3 million
, or
19.1%
over the prior year period. The increase was primarily driven by an increase in earned premiums of
$63.2 million
, or
38.0%
, an increase of
$2.8 million
, or
2.7%
, in service and administrative fees, which were partially offset by decreases in ceding commissions of
$18.4 million
and other income of
$5.5 million
. The revenues on the investment portfolio, including net investment income and realized and unrealized gains, were
$27.7 million
for the
year ended December 31, 2016
compared to
$6.5 million
in the 2015 period, an increase of
$21.2 million
.
The increase in earned premiums was driven by growth in our credit protection, warranty and program products. The largest driver was the result of a transaction, effective October 1, 2016, where our captive reinsurance subsidiary replaced a third party as reinsurer of certain credit protection products, thus avoiding reinsurance costs and gaining additional investment flexibility. This transaction was consistent with our strategy to grow underwriting and investment profits at our specialty insurance subsidiaries. As a result of this transaction, several income statement line items increased for the year ended December 31, 2016 when compared to prior periods, including earned premiums, commission expense and policy and contract benefits. The decrease in ceding commissions was primarily a result of severe storms in Louisiana and the southeast United States and was largely offset by lower commissions paid to our partners as much of the risk within those products was retained with our partners’ producer owned reinsurance companies or ceded to third party reinsurers.
Total revenues, excluding the impact of VOBA, were up $46.4 million, driven by increases in earned premiums of $63.2 million, and increases in net investment income and gains of $21.2 million, which were partially offset by reductions in service and administrative fees of $11.1 million, reductions in ceding commissions of $21.4 million and a decrease in other income of $5.5 million. Further details by product are provided below.
Expenses
Total expenses include policy and contract benefits, commissions expense and operating expenses. For the
year ended December 31, 2016
, total expenses were
$347.4 million
compared to
$298.9 million
in 2015. The primary drivers of the increase were policy and contract benefits and commission expense as net written premiums increased over 2015.
There are two types of expenses for claims payments under insurance and warranty service contracts which are included in policy and contract benefits: member benefit claims and net losses and loss adjustment expenses. Member benefit claims represent the costs of services and replacement devices incurred in car club and warranty protection service contracts. Net losses and loss adjustment expenses represent actual insurance claims paid, changes in unpaid claim reserves, net of amounts ceded, and the costs of administering claims for credit life and other insurance lines, such as non-standard auto. Incurred claims are impacted by loss frequency, which is a measure of the number of claims per unit of insured exposure, and loss severity, which is based on the average size of claims. Factors affecting loss frequency and loss severity include changes in claims reporting patterns, claims settlement patterns, judicial decisions, economic conditions, morbidity patterns and the attitudes of claimants towards settlements. For 2016, policy and contract benefits
33
were
$106.8 million
, up
$20.5 million
from the prior year primarily as a result of increased net written business in our credit protection and program products.
Commission expense is incurred on most product lines, the majority of which are retrospective commissions paid to distributors and retailers selling our products, including credit insurance policies, motor club memberships, mobile device protection and warranty service contracts. Credit insurance commission rates are, in many cases, set by state regulators and are also impacted by market conditions and retention levels. Total commission expense for
year ended December 31, 2016
was
$147.3 million
compared to
$105.8 million
in 2015. The primary drivers of the increase were VOBA, as highlighted in the table above, along with the commission expense associated with the credit business re-assumed in October.
Operating expenses are composed of employee compensation and benefits, interest expense, depreciation and amortization expenses and other expenses. The primary driver of the period-over-period decrease in operating expenses was attributable to lower depreciation and amortization expense as a result of the decline in VOBA purchase accounting impact from the amortization of the fair value attributed to the insurance policies and contracts acquired, which was
$3.3 million
for the
year ended December 31, 2016
versus
$19.3 million
in the comparable
2015
period. In addition, employee compensation and benefits were
$37.9 million
for 2016, down
$0.8 million
from 2015 as a result of actions taken throughout 2015 to reduce headcount. Interest expense of
$9.2 million
in 2016 increased by
$2.3 million
versus the prior year, primarily from increased asset based borrowings on certain investments within the investment portfolio. Other expenses for the
year ended December 31, 2016
were
$33.0 million
, up
$1.6 million
from 2015 primarily as a result of increased premium taxes as written and earned premiums grew.
Gross & Net Written Premiums
Gross written premiums represents total premiums from insurance policies that we write during a reporting period based on the effective date of the individual policy. Net written premiums are gross written premiums less that portion of premiums that we cede to third party reinsurers or the PORCs under reinsurance agreements. The amount ceded to each reinsurer is based on the contractual formula contained in the individual reinsurance agreements. Net earned premiums are the earned portion of our net written premiums. We earn insurance premiums on a pro-rata basis over the term of the policy. At the end of each reporting period, premiums written that are not earned are classified as unearned premiums, which are earned in subsequent periods over the remaining term of the policy.
Written Premiums
|
|
Year Ended December 31,
|
|||||||||||||||||||||||||||||||||
|
($ in thousands, unaudited)
|
Credit Protection
|
|
Warranty
|
|
Programs
|
|
Services and Other
|
|
Insurance Total
|
|||||||||||||||||||||||||
|
|
2016
|
2015
|
|
2016
|
2015
|
|
2016
|
2015
|
|
2016
|
2015
|
|
2016
|
2015
|
||||||||||||||||||||
|
Gross written premiums
|
$
|
488,183
|
|
$
|
527,452
|
|
|
$
|
62,433
|
|
$
|
50,545
|
|
|
$
|
157,649
|
|
$
|
107,977
|
|
|
$
|
22
|
|
$
|
33
|
|
|
$
|
708,287
|
|
$
|
686,007
|
|
|
Net written premiums
|
257,601
|
|
121,737
|
|
|
46,076
|
|
42,004
|
|
|
33,494
|
|
18,355
|
|
|
—
|
|
—
|
|
|
337,171
|
|
182,096
|
|
||||||||||
Total gross written premiums for the
year ended December 31, 2016
were
$708.3 million
, which represented an increase of
$22.3 million
or
3.2%
from the prior year period. The amount of business retained was
47.6%
, up from
26.5%
in the prior year period as the Company retained more risk in 2016 than 2015. Total net premiums written for the
year ended December 31, 2016
were
$337.2 million
, up
$155.1 million
or
85.2%
from the same period year-over-year. The largest driver of the increase in retention and net written premiums was related to the transaction mentioned earlier where the Company re-assumed contracts of
$138.7 million
which were previously reinsured with a third party. Credit protection net premiums written for the
year ended December 31, 2016
were
$257.6 million
, higher than the previous year period by
$135.9 million
primarily as a result of this assumed business. For 2016, warranty product net written premiums were
$46.1 million
, up
$4.1 million
from 2015 and program products were
$33.5 million
, up
$15.1 million
from 2015. Warranty and programs premium growth is primarily driven by increased policies written for furniture, appliances and non standard auto products. We believe there are additional opportunities to expand our warranty and programs insurance business model to other niche products and markets.
Operating Results - Non-GAAP
Product Underwriting Margin
The following table presents product specific revenue and expenses within the specialty insurance segment for the fiscal years ended December 31, 2016 and 2015. As mentioned above, we generally limit the underwriting risk we assume through the use of both reinsurance (e.g., quota share and excess of loss) and retrospective commission agreements with our partners (e.g., commissions paid adjust based on the actual underlying losses incurred), which manage and mitigate our risk. Period-over-period comparisons of revenues are often impacted by the PORCs and clients’ choice as to whether to retain risk, specifically with respect to the relationship between service and administration expenses and ceding commissions, both components of revenue, and the offsetting policy and contract benefits and commissions paid to our partners and reinsurers. Generally, when losses are incurred, the risk which is retained by our
34
partners and reinsurers is reflected in a reduction in commissions paid. In order to better explain to investors the net financial impact of the risk retained by the Company of the insurance contracts written and the impact on profitability, we use the Non-GAAP metric - As Adjusted Underwriting Margin. For the same reasons that we adjust our combined ratio for the effects of purchase accounting, VOBA impacts can also mask the actual relationship between revenues earned and the offsetting reductions in commissions paid, and thus the period over period net financial impact of the risk retained by the Company. As such, we believe that presenting underwriting margin provides useful information to investors and aligns more closely to how management measures the underwriting performance of the business.
As Adjusted Underwriting Margin - Non-GAAP
|
|
Year Ended December 31,
|
|||||||||||||||||||||||||||||||||
|
($ in thousands, unaudited)
|
Credit Protection
|
|
Warranty
|
|
Programs
|
|
Services and Other
|
|
Insurance Total
|
|||||||||||||||||||||||||
|
|
2016
|
2015
|
|
2016
|
2015
|
|
2016
|
2015
|
|
2016
|
2015
|
|
2016
|
2015
|
||||||||||||||||||||
|
As Adjusted Revenues:
|
|
|
|
|
|
|
|
|
|
|
|
|
|
|
||||||||||||||||||||
|
Net earned premiums
|
$
|
161,480
|
|
$
|
120,936
|
|
|
$
|
36,848
|
|
$
|
29,810
|
|
|
$
|
31,108
|
|
$
|
15,519
|
|
|
$
|
—
|
|
$
|
—
|
|
|
$
|
229,436
|
|
$
|
166,265
|
|
|
Service and administrative fees
|
44,978
|
|
35,380
|
|
|
51,015
|
|
76,373
|
|
|
10,888
|
|
4,719
|
|
|
8,104
|
|
9,572
|
|
|
114,985
|
|
126,044
|
|
||||||||||
|
Ceding commissions
|
25,197
|
|
46,601
|
|
|
2
|
|
26
|
|
|
—
|
|
—
|
|
|
—
|
|
—
|
|
|
25,199
|
|
46,627
|
|
||||||||||
|
Other income
|
283
|
|
280
|
|
|
63
|
|
5,877
|
|
|
5
|
|
115
|
|
|
2,508
|
|
2,089
|
|
|
2,859
|
|
8,361
|
|
||||||||||
|
Less product specific expenses:
|
|
|
|
|
|
|
|
|
|
|
|
|
|
|
||||||||||||||||||||
|
Policy and contract benefits
|
38,966
|
|
27,199
|
|
|
40,339
|
|
46,373
|
|
|
27,470
|
|
12,581
|
|
|
8
|
|
159
|
|
|
106,783
|
|
86,312
|
|
||||||||||
|
Commission expense
|
128,203
|
|
114,645
|
|
|
23,776
|
|
33,868
|
|
|
5,436
|
|
2,233
|
|
|
583
|
|
170
|
|
|
157,998
|
|
150,916
|
|
||||||||||
|
As Adjusted underwriting margin
(1)
|
$
|
64,769
|
|
$
|
61,353
|
|
|
$
|
23,813
|
|
$
|
31,845
|
|
|
$
|
9,095
|
|
$
|
5,539
|
|
|
$
|
10,021
|
|
$
|
11,332
|
|
|
$
|
107,698
|
|
$
|
110,069
|
|
(1) For further information relating to the Company’s adjusted underwriting margin, including a reconciliation to GAAP financials, see “—Non-GAAP Reconciliations.”
As Adjusted Underwriting Margin
As adjusted underwriting margin for the
year ended December 31, 2016
was
$107.7 million
, down from
$110.1 million
in 2015. Credit protection as adjusted underwriting margin was
$64.8 million
, an increase from
2015
results by
$3.4 million
or
5.6%
. Credit protection products continue to provide opportunities for steady growth through a combination of expanded product offerings and new clients. As adjusted underwriting margin for warranty products was
$23.8 million
for 2016, down
$8.0 million
or
25.2%
from
2015
. We continue to experience dampening effects from our mobile protection products given competitive pressures. Programs as adjusted underwriting margin for 2016 was
$9.1 million
, up
64.2%
from 2015, due to increased earned premiums and service and administrative fees. Our programs continue to provide opportunity for growth through expanded product offerings, new clients and geographic expansion. Services and other contributed
$10.0 million
in 2016, down $1.3 million from 2015 as certain business processing services are in run-off.
Policy and contract benefits, which include net losses, loss adjustments and member benefit claims, were
$106.8 million
for the
year ended December 31, 2016
, up
$20.5 million
period-over-period. The increase in net losses over the prior year period was a function of growth in earned premiums in credit and specialty products, partially offset by lower claims in mobile devices consistent with the decline in written premiums.
Commission expense, excluding the impacts of VOBA, was
$158.0 million
for the
year ended December 31, 2016
, up
$7.1 million
, driven by the increase in policies issued in the credit life and specialty auto warranty and insurance products. The increase was driven by growth in earned premiums in credit and specialty products, slightly offset by reduced payments to our distributors and retailers as a result of our partners’ absorption of losses from increased claims activity in the South and Southeast regions of the United States. Additionally, warranty commissions were down $10.1 million as a result of declines in the mobile protection product.
Insurance Operating Ratios
We use the combined ratio as an insurance operating metric to evaluate our underwriting performance, both overall and relative to peers. Expressed as a percentage, it represents the relationship of policy and contract benefits, commission expense (net of ceding commissions), employee compensation and benefits, and other expenses to net earned premiums, service and administrative fees, and other income. Investors use this ratio to evaluate our ability to profitably underwrite the risks we assume over time and manage our operating costs. A combined ratio less than 100% indicates an underwriting profit, while a combined ratio greater than 100% reflects an underwriting loss. Since VOBA purchase accounting adjustments impact revenues and expenses related to acquired contracts differently from newly originated, we also show the combined ratio on an as adjusted basis, eliminating the accounting effects of VOBA. Management believes showing an as adjusted combined ratio provides useful information to investors to compare period over period operating results. Following is a summary of these performance metrics for the years ended December 31, 2016 and 2015.
35
Fiscal year 2014 is not presented given the comparative ratios are less meaningful with only one month of results and the inclusion of acquisition related expenses.
Operating Ratios
|
Year Ended December 31,
|
||||||
|
Insurance operating ratios:
|
2016
|
2015
|
||||
|
Combined ratio
|
87.9
|
%
|
|
77.9
|
%
|
|
|
As adjusted Combined ratio - Non-GAAP
(1)
|
89.5
|
%
|
|
87.4
|
%
|
|
(1) For further information relating to the Company’s as adjusted combined ratio, including a reconciliation to GAAP financials, see “—Non-GAAP Reconciliations.”
The combined ratio for 2016 was
87.9%
which was an increase from
77.9%
in 2015. This increase was primarily driven by VOBA purchase accounting impacts which are outlined by line item in the “VOBA Impacts” table above. These relative changes from 2015 to 2016 included a year-over-year increase in revenues of $16.9 million, which was more than offset by year-over-year increase in commission expense of $34.4 million, both due to the impact of VOBA. The combined impact of these drivers caused the combined ratio to deteriorate. The as adjusted combined ratio, which excludes these purchase accounting impacts, was
89.5%
for 2016, compared to
87.4%
for 2015 with the increase driven primarily by the reduction in underwriting margins mentioned above.
Investment Portfolio
The investment portfolio consists of assets contributed by Tiptree, cash generated from operations, and from insurance premiums written. The investment portfolio of our regulated insurance companies, captive reinsurance company and warranty business are subject to different regulatory considerations, including with respect to types of assets, concentration limits, affiliate transactions and the use of leverage. Our investment strategy is designed to achieve attractive risk-adjusted returns across select asset classes, sectors and geographies while maintaining adequate liquidity to meet our claims payment obligations.
In managing our investment portfolio we analyze net investments and net portfolio income, which are non-GAAP measures. Our presentation of net investments equals total investments plus cash and cash equivalents minus asset based financing of investments. Our presentation of net portfolio income equals net investment income plus realized and unrealized gains and losses and minus interest expense associated with asset based financing of investments. Net investments and net portfolio income are used to calculate average annualized yield, which management uses to analyze the profitability of our investment portfolio. Management believes this information is useful since it allows investors to evaluate the performance of our investment portfolio based on the capital at risk and on a non-consolidated basis. Our calculation of net investments and net portfolio income may differ from similarly titled non-GAAP financial measures used by other companies. Net investments and net portfolio income are not measures of financial performance or liquidity under GAAP and should not be considered a substitute for total investments or net investment income. See “
—
Non-GAAP Reconciliations” for a reconciliation to GAAP total investments and investment income.
Investment Portfolio - Non-GAAP
|
($ in thousands)
|
Year Ended December 31,
|
||||||||||
|
2016
|
2015
|
2014
|
|||||||||
|
Cash and cash equivalents
|
$
|
26,020
|
|
|
$
|
13,909
|
|
|
$
|
11,072
|
|
|
Available for sale securities, at fair value
|
146,171
|
|
184,703
|
|
171,128
|
|
|||||
|
Equity securities, trading, at fair value
|
48,612
|
|
3,786
|
|
—
|
|
|||||
|
Loans, at fair value
(1)
|
103,937
|
|
60,078
|
|
—
|
|
|||||
|
Real estate, net
|
23,579
|
|
2,196
|
|
—
|
|
|||||
|
Other investments
|
3,957
|
|
4,191
|
|
3,772
|
|
|||||
|
Net investments
|
$
|
352,276
|
|
$
|
268,863
|
|
$
|
185,972
|
|
||
|
Net investment income
|
12,981
|
|
|
5,455
|
|
|
279
|
|
|||
|
Realized gains (losses)
|
4,720
|
|
(568
|
)
|
5
|
|
|||||
|
Unrealized gains
|
10,042
|
|
1,633
|
|
—
|
|
|||||
|
Interest expense
|
(3,155
|
)
|
(832
|
)
|
—
|
|
|||||
|
Net portfolio income
|
$
|
24,588
|
|
$
|
5,688
|
|
$
|
284
|
|
||
|
Average Annualized Yield %
(2)
|
8.0
|
%
|
2.5
|
%
|
NM%
|
|
|||||
(1) Loans, at fair value, net of asset based debt, see “—Non-GAAP Reconciliations”, for a reconciliation to GAAP financials.
(2) Average Annualized Yield % represents the ratio of net investment income, realized and unrealized gains (losses) less investment portfolio interest expense to the average of the prior five quarters total investments less investment portfolio debt plus cash. NM% represents “not meaningful” as the results in the table represent one month of Fortegra income.
36
Net investments have grown 31.0% from
$268.9 million
at year ended December 31, 2015 to
$352.3 million
at
year ended December 31, 2016
, through a combination of internal growth, increased retention of premiums written, and assets contributed by the Company to further capitalize Fortegra.
Our net investment income includes interest and dividends earned on our invested assets. We report net realized gains and losses on our investments separately from our net investment income. Net realized gains occur when we sell our investment securities for more than their costs or amortized costs, as applicable. Net realized losses occur when we sell our investment securities for less than their costs or amortized costs, as applicable, or we write down the investment securities as a result of other-than-temporary impairment. We report net unrealized gains (losses) on securities classified as available-for-sale separately within accumulated other comprehensive income on our balance sheet. For loans, at fair value, and equity securities classified as trading securities, we report unrealized gains (losses) within net realized gains (losses) on investment on the consolidated statement of income.
2016 net investment portfolio income was
$24.6 million
compared to
$5.7 million
in 2015. The average annualized yield improvement from
2.5%
in 2015 to
8.0%
in 2016 was primarily driven by increases in net investment income of
$7.5 million
, realized gains of
$5.3 million
, and unrealized gains of
$8.4 million
related to loans and equities.
Adjusted EBITDA
Adjusted EBITDA was
$60.5 million
and
$43.3 million
for the
year ended December 31, 2016
and 2015 respectively. The key drivers of growth were similar to those that impacted pre-tax results and include increased investment income and gains, in addition to increased product revenues, which were offset in part by increased commission expense and policy and contract benefits as written premium grew. See “
—
Non-GAAP Reconciliations” for a reconciliation to GAAP pre-tax income.
Asset Management
The Company’s asset management segment is comprised of TAMCO and its primary subsidiary, Telos, which earns revenues from CLOs under management, including management fees, distributions and realized and unrealized gains on the Company’s holdings of subordinated notes. Also included in the segment are the management fees, investment earnings and costs associated with our legacy tax-exempt securities business, CLO warehouse facilities and our credit hedging strategies. As of
December 31, 2016
, total fee earning AUM was $1.9 billion, which was flat to 2015 fee earning AUM. Total investment in CLO subordinated notes and management fee participation rights, at fair market value, as of
December 31, 2016
was $57.3 million, up $26.4 million from
December 31, 2015
. On January 23, 2017 the Company sold its investment in Telos 5 for consideration of $15.9 million, reducing our investment in CLO subordinated notes and management fee participation rights to $41.4 million subsequent to year end.
Operating Results
|
($ in thousands)
|
Year Ended December 31,
|
||||||||||
|
|
2016
|
|
2015
|
|
2014
|
||||||
|
Revenues:
|
|
|
|
|
|
||||||
|
Net realized and unrealized gains (losses)
|
$
|
66
|
|
|
$
|
(3,599
|
)
|
|
$
|
(2,143
|
)
|
|
Management fee income
|
9,400
|
|
|
6,524
|
|
|
259
|
|
|||
|
Other income
|
3,648
|
|
|
3,845
|
|
|
9,002
|
|
|||
|
Total revenue
|
$
|
13,114
|
|
|
$
|
6,770
|
|
|
$
|
7,118
|
|
|
|
|
|
|
|
|
||||||
|
Expenses:
|
|
|
|
|
|
||||||
|
Employee compensation and benefits
|
6,781
|
|
|
4,910
|
|
|
5,782
|
|
|||
|
Interest expense
|
746
|
|
|
539
|
|
|
1,595
|
|
|||
|
Other expenses
|
577
|
|
|
1,185
|
|
|
1,075
|
|
|||
|
Total expenses
|
$
|
8,104
|
|
|
$
|
6,634
|
|
|
$
|
8,452
|
|
|
Net income attributable to consolidated CLOs
|
20,254
|
|
|
(6,889
|
)
|
|
19,525
|
|
|||
|
Pre-tax income (loss)
|
$
|
25,264
|
|
|
$
|
(6,753
|
)
|
|
$
|
18,191
|
|
Results
Pre-tax income was
$25.3 million
compared with a loss of
$6.8 million
for the
2015
period, an increase of
$32.0 million
. Revenues, comprised primarily of asset management fees, including incentive management fees on unconsolidated CLOs, and warehouse interest income and realized gains, totaled
$13.1 million
in the
year ended December 31, 2016
, compared to
$6.8 million
for the prior year period. The increase was driven by warehouse realized gains in 2016 against losses in 2015, an increase in incentive fees in the second half of 2016 and the launch of Telos 7 in the second quarter of 2016. Expenses for 2016 were
$8.1 million
compared to
$6.6 million
37
for 2015, primarily driven by increases in incentive compensation as a result of higher management and incentive fees. Net income attributable to consolidated CLOs was up
$27.1 million
primarily as unrealized losses from 2015 were recovered through unrealized gains in 2016, as discussed in further detail below.
Pre-tax income for 2015 was a loss of
$6.8 million
, compared to income of
$19.5 million
for 2014. Revenues totaled
$6.8 million
in the year ended December 31, 2015, compared to
$7.1 million
for the prior year period, primarily driven by declines in the legacy tax exempt portfolio offset by management fees from the deconsolidated CLOs. Expenses for 2015 were
$6.6 million
compared to
$8.5 million
for 2014, primarily driven by declines in legacy tax exempt security portfolios and lower incentive compensation given reductions in management and incentive fees. Net income attributable to consolidated CLOs was down $26.4 million from 2014, driven primarily by $17.9 million of higher realized and unrealized losses incurred on the Company’s holdings of CLO subordinated notes and the reclassification to revenue of the management fees on Telos 1-4 as they were deconsolidated when the subordinated notes related to these CLOs were sold.
Operating Results - Non-GAAP
As Adjusted Revenues
Asset management as adjusted revenues include revenues from CLOs, legacy tax-exempt securities business, CLO warehouse facilities and our credit hedging strategies. The Company earns revenues from CLOs under management, whether consolidated or deconsolidated, which include fees earned for managing the CLOs, distributions received from the Company’s holdings of subordinated notes issued by the CLOs and realized and unrealized gains and losses from the Company’s holdings of subordinated notes. The revenue associated with the management fees and distributions earned and gains and losses on the subordinated notes attributable to the consolidated CLOs are reported as “net income (loss) attributable to the consolidated CLOs” in the Company’s financial statements. The table below shows the Company’s share of the results attributable to the CLOs, which were consolidated, on a deconsolidated basis. This presentation is a non-GAAP measure. Management believes this information is helpful for period-over-period comparative purposes as certain of our CLOs were consolidated for only some of the periods presented below. In addition, the Non-GAAP presentation allows investors the ability to calculate management fees as a percent of AUM, a common measure used by investors to evaluate asset managers, and which is one of the performance measures upon which management is compensated. While consolidation versus deconsolidation impacts the presentation of revenues, it does not impact expenses or pre-tax income. See “
—
Non-GAAP Reconciliations” for a reconciliation to GAAP revenues.
As Adjusted Revenues
(1)
|
($ in thousands)
|
Year Ended December 31,
|
||||||||||
|
|
2016
|
|
2015
|
|
2014
|
||||||
|
Assets Under Management:
|
|||||||||||
|
Fee earning AUM
|
$
|
1,911,236
|
|
$
|
1,924,598
|
|
$
|
2,081,179
|
|
||
|
Non fee earning AUM
|
178,955
|
|
247,290
|
|
945
|
|
|||||
|
As Adjusted Revenues:
|
|
|
|
|
|
||||||
|
Management fees
|
$
|
12,152
|
|
|
$
|
10,655
|
|
|
$
|
12,029
|
|
|
Distributions
|
15,725
|
|
|
14,676
|
|
|
15,720
|
|
|||
|
Realized and unrealized gains (losses)
|
2,576
|
|
|
(29,079
|
)
|
|
(10,108
|
)
|
|||
|
Other income
|
2,915
|
|
|
3,629
|
|
|
9,002
|
|
|||
|
Total as adjusted revenues
|
$
|
33,368
|
|
|
$
|
(119
|
)
|
|
$
|
26,643
|
|
|
(1)
|
For further information relating to the Asset Management as adjusted revenues, including a reconciliation to GAAP revenues, see “Non-GAAP Reconciliations” on page
45
.
|
For the
year ended December 31, 2016
, as adjusted revenues were
$33.4 million
compared to a loss of
$0.1 million
in the same period in
2015
. The increases were driven primarily by increased management and incentive fees of $1.5 million, increased distributions of $1.0 million, and a reduction in losses of $31.7 million. The increased management fees and distributions were primarily due to the launch of Telos 7 combined with incentive fees from our older vintage CLOs. The reduction in the realized and unrealized losses were due to a recovery of the marked-to-market position on our CLOs and CLO warehouse in the 2016 period of
$2.6 million
as compared to the unrealized losses taken in 2015 of
$29.1 million
. Given the recovery in CLO values throughout 2016, and the volatility in subordinated notes, management has reduced the Company’s exposure by selling its subordinated notes in Telos 5 on January 23, 2017 for total consideration of $15.9 million.
For
2015
, as adjusted revenues were a loss of
$0.1 million
compared to revenue of
$26.6 million
in 2014. The lower management fees were due to the runoff of Telos 1 and Telos 2, which were past their reinvestment period and lower fees on later CLOs. The Company realized GAAP losses from the sale of its subordinated notes issued by Telos 2 and Telos 4 during 2015, which generated
38
net cash proceeds of $39.7 million and tax losses of approximately $12.5 million. The unrealized loss in 2015 was due to the mark-to-market write-down in our retained CLO subordinated note holdings of
$29.1 million
. The lower distributions from the subordinated notes in 2015 compared to the prior year is primarily due to our sales of CLO subordinated notes in 2015. The other income decline was a result of lower interest income on CLO warehouses and run-off of legacy investments in tax exempt securities.
Adjusted EBITDA
Adjusted EBITDA was
$25.3 million
for the
year ended December 31, 2016
, compared to a loss of
$6.8 million
for the comparable prior year period. The increase was driven by the same factors discussed above under “Results.” Adjusted EBITDA for 2015 declined by
$24.9 million
from 2014 primarily as a result of the unrealized and realized marks on CLO subordinated notes, in addition to the other factors mentioned above. See “
—
Non-GAAP Reconciliations” for a reconciliation to GAAP pre-tax income.
Senior Living
We operate our senior living segment through Care which is focused on investing in seniors housing properties including senior apartments, independent living, assisted living, memory care and, to a lesser extent, skilled nursing facilities. As of
December 31, 2016
, Care’s portfolio consists of 29 properties across 11 states primarily in the Mid-Atlantic and Southern United States comprised of 13 Triple Net Lease (“NNN”) Properties and 16 Managed Properties.
In Triple Net Lease Properties, we own the real estate and enter into a long term lease with an operator who is typically responsible for bearing operating costs, including maintenance, utilities, taxes, insurance, repairs and capital improvements. The operations of the Triple Net Lease Properties are not consolidated since we do not manage or own the underlying operations. For Triple Net Lease Properties’ operations, we recognize primarily rental income from the lease since substantially all expenses are passed through to the tenant. In Managed Properties, we generally own between 65-90% of the real estate and the operations with affiliates of the management company owning the remainder. We therefore consolidate all of the assets, liabilities, income and expense of the Managed Properties operations in segment reporting. For each of the years ended
December 31, 2016
,
2015
and
2014
, operating results present revenues and expenses, which include amounts attributable to non-controlling interests.
Operating Results
|
($ in thousands)
|
Year Ended December 31,
|
||||||||||
|
2016
|
2015
|
2014
|
|||||||||
|
Revenues:
|
|||||||||||
|
Net realized and unrealized gains (losses)
|
—
|
|
(194
|
)
|
7,006
|
|
|||||
|
Rental and related revenue
|
59,636
|
|
45,372
|
|
20,242
|
|
|||||
|
Other income
|
1,095
|
|
950
|
|
2,033
|
|
|||||
|
Total revenue
|
$
|
60,731
|
|
$
|
46,128
|
|
$
|
29,281
|
|
||
|
|
|
|
|||||||||
|
Expenses:
|
|
|
|
||||||||
|
Employee compensation and benefits
|
24,000
|
|
18,479
|
|
8,056
|
|
|||||
|
Interest expense
|
8,691
|
|
6,796
|
|
4,111
|
|
|||||
|
Depreciation and amortization expenses
|
14,166
|
|
14,546
|
|
7,181
|
|
|||||
|
Other expenses
|
19,698
|
|
15,842
|
|
6,762
|
|
|||||
|
Total expenses
|
$
|
66,555
|
|
$
|
55,663
|
|
$
|
26,110
|
|
||
|
Pre-tax income (loss)
|
$
|
(5,824
|
)
|
$
|
(9,535
|
)
|
$
|
3,171
|
|
||
Results
For the
year ended December 31, 2016
, we had a pre-tax loss of
$5.8 million
compared with a pre-tax loss of
$9.5 million
for the same period in
2015
. The properties acquired in 2016 and 2015 have generated higher rental and related revenue in 2016 compared to 2015. However the Company also incurred additional depreciation, amortization and interest expenses as a consequence of the acquisition of these properties. As a result, the lower loss was driven by greater growth in rental income, due to both improvements in the operating performance of the underlying properties and the addition of new properties, relative to the growth in operating expenses, including the depreciation and amortization and interest expense related to the acquired properties.
For 2015, we had a pre-tax loss of $9.5 million, compared with pre-tax income of $3.2 million in 2014. In 2014, we recorded a gain of approximately $7.9 million on the repayment in full to Care of a loan that was secured by real property (the “Westside Loan”). There was no similar gain in 2015. Several properties acquired in 2015 required restructuring and capital expenditures to increase occupancy and rental rates. As a result, we expected a delay in growth in revenue as the properties were in the turnaround phase. As
39
such, the increased number of properties generated higher rental and other income in 2015 compared with 2014, but on a lag relative to the additional depreciation, amortization and interest expenses as a consequence of the growth and additional capital investment in the newer properties.
Revenues
Revenues were
$60.7 million
for the
year ended December 31, 2016
, compared with
$46.1 million
for the comparable 2015 period, an increase of
$14.6 million
or
31.7%
. The increase in rental and related revenue was primarily due to the facilities acquired since the first quarter of
2015
, including five properties acquired in 2016 and eleven properties acquired in 2015.
Our total revenues were $46.1 million for 2015, compared with $29.3 million for 2014, an increase of $16.8 million or 57.3%. Excluding the one-time $7.9 million gain from the repayment of the Westside Loan in 2014, total revenue increased $24.7 million or 115.4% year over year. Rental and related income in 2015 was
$45.4 million
, compared with
$20.2 million
for 2014, an increase of $25.2 million or
124.1%
from the prior year. The increase in rental and related revenue was primarily due to the addition of nine Managed Properties, including five managed properties added in the first quarter of 2015 and four managed properties added in the fourth quarter of 2014.
Expenses
Expenses are comprised of interest expenses on borrowings, payroll expenses (including employees of the managers at each of Care’s Managed Properties), professional fees, depreciation and amortization of properties and leases acquired and other expenses.
Expenses for the
year ended December 31, 2016
were
$66.6 million
, compared with
$55.7 million
for
2015
, an increase of
$10.9 million
or
19.6%
. The primary increases period-over-period include property operating expenses of
$8.2 million
(including employee compensation and benefits and other expenses), interest expense of
$1.9 million
, payroll and other costs of
$1.2 million
, partially offset by a reduction in depreciation and amortization expenses of
$0.4 million
, which also included a decrease in amortization of in-place leases acquired. The increase in property operating expenses was primarily attributable to consolidation of the expenses of the five Managed Properties acquired in the first quarter of 2015, and the three acquired in the first and third quarters of 2016. The Company is party to interest rate swaps in order to hedge interest rate exposure associated with its real estate holdings. These instruments swap fixed to floating rate cash streams in order to maintain the economics on the mortgage debt. As a result of movements in interest rates over the
year ended December 31, 2016
, an unrealized loss was recorded in other expenses for $1.2 million for swaps that had not been previously designated as hedging relationships.
Expenses for 2015 were $55.7 million, compared with $26.1 million for 2014, an increase of
$29.6 million
or
113.2%
. Interest expense was $6.8 million for 2015, compared with $4.1 million for 2014. Payroll expenses were $18.5 million for 2015 compared with $8.1 million for 2014. Depreciation and amortization expenses were $14.5 million in 2015, compared with $7.2 million in 2014. Other expenses, which include property operating expenses, office expenses, property acquisition costs, professional fees and property taxes, were $15.8 million for 2015, compared with $6.8 million for 2014. The increase in expenses was primarily attributable to consolidation of the expenses of the nine Managed Properties added in the fourth quarter of 2014 and first quarter of 2015 and an increase in amortization of in-place leases acquired.
Operating Results - Non-GAAP
Segment NOI
In addition to Adjusted EBITDA, we also evaluate performance of our senior living segment based on net operating income (“NOI”), which is a non-GAAP measure. NOI is a common non-GAAP measure in the real estate industry used to evaluate property level operations. We consider NOI an important supplemental measure to evaluate the operating performance of our senior living segment because it allows investors, analysts and our management to assess our unlevered property-level operating results and to compare our operating results between periods and to the operating results of other senior living companies on a consistent basis. Agreements with our operators are structured such that they are incentivized to grow NOI, and it is a significant component in determining the compensation paid to Care’s management team. We define NOI as rental and related revenue less property operating expense. Property operating expenses and resident fees and services are not relevant to Triple Net Lease Properties since we do not manage the underlying operations and substantially all expenses are passed through to the tenant. Our calculation of NOI may differ from similarly titled non-GAAP financial measures used by other companies. NOI is not a measure of financial performance or liquidity under GAAP and should not be considered a substitute for pre-tax income.
40
Product NOI - Non-GAAP
(1)
|
($ in thousands)
|
Year Ended December 31,
|
||||||||||
|
2016
|
2015
|
2014
|
|||||||||
|
Triple Net Leases
|
$
|
7,663
|
|
$
|
6,515
|
|
$
|
3,892
|
|
||
|
Managed Properties
|
14,471
|
|
9,578
|
|
5,779
|
|
|||||
|
Segment NOI
|
$
|
22,134
|
|
$
|
16,093
|
|
$
|
9,671
|
|
||
|
Managed Property NOI Margin %
(2)
|
27.8
|
%
|
24.6
|
%
|
35.3
|
%
|
|||||
|
(1)
|
For further information relating to the Senior Living NOI, including a reconciliation to GAAP pre-tax income, see “—Non-GAAP Reconciliations.”
|
|
(2)
|
NOI Margin % is the relationship between Managed Property segment NOI and Rental and related revenue.
|
NOI was
$22.1 million
for the
year ended December 31, 2016
, compared with
$16.1 million
in the prior year period, an increase of
$6.0 million
or
37.5%
. The primary drivers of improvement in NOI in both periods was an increase in rental revenue partially offset by increased property operating expenses. As mentioned earlier, several of our recent acquisitions included properties that the Company and its operating partners are enhancing through renovation projects and other capital upgrades in an effort to grow revenue and to allow them to operate more efficiently. As indicated in the table above, NOI margins on Managed Properties improved from
24.6%
in the
year ended December 31, 2015
to
27.8%
for
year ended December 31, 2016
. As the more recently acquired facilities ramp up and stabilize, we expect our results to reflect additional NOI margin improvements.
NOI margin decreased from
35.3%
in 2014 to
24.6%
in 2015 as a result of the lag in revenue growth related to the property acquisitions where the enhancements and capital upgrades were being performed and the increase in mix of Managed Properties.
Adjusted EBITDA
Adjusted EBITDA was
$10.5 million
for the
year ended December 31, 2016
, compared to
$6.6 million
in the
year ended December 31, 2015
, driven primarily increases in NOI partially offset by increased interest expense on new acquisitions.
Adjusted EBITDA was $6.6 million for 2015 compared to $10.4 million in 2014, a decline of
$3.8 million
primarily due to the inclusion of the one-time repayment of the Westside Loan in 2014, partially offset by improved NOI due to property acquisitions. See “
—
Non-GAAP Reconciliations” for a reconciliation to GAAP pre-tax income.
Specialty Finance
The specialty finance segment is comprised of our mortgage origination business, including, Reliance, which is 100% owned and Luxury, which is 67.5% owned by us and the lending operations of Siena, a commercial finance company, which is 62% owned by us. The results of Reliance are included in our specialty finance results from July 1, 2015, the date of acquisition.
Operating Results
|
($ in thousands)
|
Year Ended December 31,
|
|||||||||||
|
|
|
2016
|
|
2015
|
|
2014
|
||||||
|
Revenues:
|
|
|||||||||||
|
Net realized and unrealized gains (losses)
|
68,920
|
|
34,563
|
|
7,818
|
|
||||||
|
Other income
|
26,511
|
|
20,436
|
|
7,405
|
|
||||||
|
Total revenue
|
$
|
95,431
|
|
$
|
54,999
|
|
$
|
15,223
|
|
|||
|
|
||||||||||||
|
Expenses:
|
||||||||||||
|
Employee compensation and benefits
|
57,494
|
|
31,633
|
|
10,690
|
|
||||||
|
Interest expense
|
6,290
|
|
3,558
|
|
1,530
|
|
||||||
|
Depreciation and amortization expenses
|
870
|
|
760
|
|
499
|
|
||||||
|
Other expenses
|
22,607
|
|
12,783
|
|
4,466
|
|
||||||
|
Total expenses
|
$
|
87,261
|
|
$
|
48,734
|
|
$
|
17,185
|
|
|||
|
Pre-tax income (loss)
|
$
|
8,170
|
|
$
|
6,265
|
|
$
|
(1,962
|
)
|
|||
Results
For the
year ended December 31, 2016
, pre-tax income was
$8.2 million
compared with
$6.3 million
for
2015
. Revenues were
$95.4 million
for 2016, compared with
$55.0 million
for
2015
, an increase of
$40.4 million
or
73.5%
. Expenses were
$87.3 million
in 2016,
41
compared with
$48.7 million
in
2015
, an increase of $38.6 million or 79.3%. The increases are primarily driven by the acquisition of Reliance and increased originations volume within our mortgage and commercial finance lending businesses.
Pre-tax income was $6.3 million for 2015, compared with a net loss of $2.0 million for 2014. The key drivers of the increase were higher loan volume, including the impact from the acquisition of Reliance. Revenues were $55.0 million for 2015, compared with $15.2 million for 2014, an increase of $39.8 million or 262%. Expenses were $48.7 million in 2015, compared with $17.2 million in 2014, an increase of $31.5 million or 183%. Higher revenues more than offset higher expenses resulting in improving operating margins.
Revenues
Revenues are comprised of gain on sale of mortgages originated and sold to investors, gains and losses on the mortgage pipeline of interest rate lock commitments and mortgage loans held for sale and their associated hedges, and net interest income and fees associated with our commercial lending products and the mortgage origination business.
Revenues increased from
$55.0 million
in 2015 to
$95.4 million
in 2016, primarily driven by higher volume and the inclusion of Reliance for the full year. Mortgage origination volume improved
49.1%
from
$1.2 billion
for the
year ended December 31, 2015
to
$1.9 billion
for 2016 while realizing
100.3
basis points improvement in revenue margins year-over-year. This was primarily a result of the inclusion of Reliance’s volume for a full year and the change in product mix towards higher margin government and agency products. In addition, commercial lending grew with average earning assets of $80.8 million in 2016, compared with $56.0 million in
2015
, an increase of 44.3%. The improvement was driven by increased loan originations and higher utilization rates of facilities by borrowers which increased interest income and loan fees, reported in other income.
For 2015, total revenues were
$55.0 million
compared to
$15.2 million
in 2014. The increase was primarily driven by a combination of the acquisition of Reliance and increased loan volume at Luxury, which contributed to a year over year improvement in mortgage origination volume of 131%, up from $0.5 billion in 2014 to $1.2 billion in 2015. Revenue margins improved by 81% year over year, primarily as a result of the inclusion of higher margin FHA/VA and agency products. Commercial lending average earning assets were $56.0 million in 2015, compared with $29.3 million in 2014, an increase of 91%. The improved revenues were primarily driven by higher interest income on the loans and fees associated with the Company’s lending activities.
Expenses
Increased revenues were partially offset by higher expenses, which increased from
$48.7 million
for the
year ended December 31, 2015
to
$87.3 million
for 2016. Expenses are composed of payroll and employee commissions, interest expense, professional fees and other expenses. The primary driver of higher expenses for 2016 was a combination of the inclusion of Reliance for the full year, higher payroll and other employee expenses as the Company increased the number of loan officers, plus higher marketing costs to support the higher number of sales personnel. During 2016, the specialty finance headcount increased from 485 to 595, or by 22.7%. In addition to the increase in headcount and marketing expenses, the change in the fair value of the contingent earn-out liability at Reliance represented an increase in expense year-over-year of $2.6 million.
For 2015, total expenses were
$48.7 million
, compared to
$17.2 million
for 2014. The primary driver of higher expenses was a combination of the inclusion of Reliance, higher commissions and loan origination expense as the result of increased volumes within our mortgage and commercial lending products.
Operating Results - Non GAAP
Adjusted EBITDA
Adjusted EBITDA was
$10.5 million
for the
year ended December 31, 2016
compared to
$5.9 million
in 2015. The increases were driven by the same factors that impacted pre-tax income explained above. For 2015, Adjusted EBITDA increased by
$7.4 million
as a result of the drivers that impacted pre-tax income above. See “
—
Non-GAAP Reconciliations” for a reconciliation to GAAP pre-tax income.
Corporate and Other
Corporate and other incorporates revenues from non-core legacy principal investments and expenses including interest expense on the holding company credit facility and employee compensation and benefits, professional fees and other expenses.
42
Operating Results
|
($ in thousands)
|
Year Ended December 31,
|
||||||||||
|
|
2016
|
|
2015
|
|
2014
|
||||||
|
Revenues:
|
|||||||||||
|
Net realized and unrealized gains (losses)
|
3,552
|
|
(560
|
)
|
1,823
|
|
|||||
|
Other income
|
156
|
|
234
|
|
693
|
|
|||||
|
Total revenue
|
$
|
3,708
|
|
$
|
(326
|
)
|
$
|
2,516
|
|
||
|
|
|
|
|
||||||||
|
Expenses:
|
|
|
|
||||||||
|
Employee compensation and benefits
|
13,400
|
|
14,002
|
|
4,529
|
|
|||||
|
Interest expense
|
4,730
|
|
5,630
|
|
4,668
|
|
|||||
|
Depreciation and amortization expenses
|
248
|
|
145
|
|
—
|
|
|||||
|
Other expenses
|
16,428
|
|
14,325
|
|
8,760
|
|
|||||
|
Total expenses
|
$
|
34,806
|
|
$
|
34,102
|
|
$
|
17,957
|
|
||
|
Pre-tax income (loss)
|
$
|
(31,098
|
)
|
$
|
(34,428
|
)
|
$
|
(15,441
|
)
|
||
Results
For the
year ended December 31, 2016
, the Company recorded a loss of
$31.1 million
compared with a loss of
$34.4 million
for the
2015
period, an increase in pre-tax income of
$3.3 million
. The key drivers of year-over-year reduction in loss were
$4.0 million
higher revenues from realized gains on the sale of certain legacy principal investments, which were partially offset by increases in corporate expenses of
$0.7 million
primarily related to professional services.
For the
year ended December 31, 2015
, we recorded a loss of
$34.4 million
compared to
$15.4 million
in 2014, a decrease in pre-tax income of
$19.0 million
. The key drivers of the year-over-year increase in loss were due to increased professional fees and other expenses of
$5.6 million
, primarily as a result of our efforts to improve our reporting and controls infrastructure and increases in employee compensation and benefits of
$9.5 million
, which was primarily driven by a one-time expense for a former executive of $6.5 million.
Revenues
For the
year ended December 31, 2016
, revenues were
$3.7 million
compared to a loss of
$0.3 million
in the
year ended December 31, 2015
. The increase of
$4.0 million
was primarily the result of realized gains on legacy principal investments. From the 2014 to 2015 period revenues decreased from
$2.5 million
to a loss of
$0.3 million
as a result of sales of legacy principal investments and unrealized marks incurred in 2015.
Expenses
Expenses include holding company interest expense, employee compensation and benefits, professional fees and other expenses. Corporate employee compensation and benefits expense includes the expense of management, legal and accounting staff. Other expenses primarily consisted of audit and professional fees, insurance, office rent and other expenses.
Employee compensation and benefits were
$13.4 million
in the
year ended December 31, 2016
, compared to
$14.0 million
in the
year ended December 31, 2015
. Excluding the one-time charge for a former executive of $6.5 million in 2015, payroll expenses increased by $5.9 million in the 2016 period, as the Company expanded its staff as a result of our efforts to improve our reporting and controls infrastructure, as well as higher accrued incentive compensation expense for the
year ended December 31, 2016
as compared to the prior year as a result of higher total Adjusted EBITDA period-over-period. For 2016, 65% of employee compensation was related to business performance.
Interest expense was
$4.7 million
in the
year ended December 31, 2016
, compared to
$5.6 million
in the
year ended December 31, 2015
. Other expenses were
$16.4 million
in the
year ended December 31, 2016
as compared to
$14.3 million
in 2015. The increase of
$2.1 million
was driven by increased corporate compliance costs associated with being an accelerated filer combined with incremental consulting spend to remediate material weaknesses. Other corporate expenses, including audit and consulting fees, have expanded primarily as a result of implementing enhanced infrastructure and controls, which we estimate was approximately $3.5 million of incremental cost for the
year ended December 31, 2016
. For 2016, 58% of other expenses were associated with audit, Sarbanes-Oxley compliance and tax professional fees.
43
From 2014 to 2015, expenses increased by
$16.1 million
driven by
$9.5 million
of employee compensation and benefits,
$1.0 million
of interest expenses and
$5.6 million
of other expenses. Increases in employee compensation was a result of the separation expense mentioned previously, in addition to increasing corporate headcount to improve the reporting and controls infrastructure. The increase in other expenses was primarily driven by incremental consulting spend related to the evaluation and remediation of material weaknesses.
Operating Results - Non-GAAP
Adjusted EBITDA
Adjusted EBITDA was a loss of
$27.9 million
for the
year ended December 31, 2016
compared to a loss of
$23.2 million
in the prior year period. The decrease in Adjusted EBITDA was driven by the same factors that impacted pre-tax income, combined with EBITDA adjustments to reflect the timing of cash outflow for payments to a former executive. See “
—
Non-GAAP Reconciliations” for a reconciliation to GAAP pre-tax income.
Provision for income taxes
The total income tax expense of
$11.0 million
for the
year ended December 31, 2016
,
$1.4 million
for the
year ended December 31, 2015
and
$4.1 million
for the year ended December 31, 2014 is reflected as a component of income (loss) from continuing operations. For the year ended December 31, 2016, the Company’s effective tax rate on income from continuing operations was equal to
25.3%
, which does not bear a customary relationship to statutory income tax rates. The effective tax rate for the year ended December 31, 2016 is lower than the U.S. federal statutory income tax rate of 35.0%, primarily due to $4.0 million of discrete tax benefits for the period, primarily related to the tax restructuring that resulted in a consolidated corporate tax group effective January 1, 2016. See Note-(1) Organization, in the accompanying consolidated financial statements. The Company’s effective tax rate before the restructure benefit was equal to 34.7% for the full year 2016.
For the year ended December 31, 2015, the Company’s effective tax rate on income from continuing operations was equal to (11.1)%, which does not bear a customary relationship to statutory income tax rates. The effective tax rate for the year ended December 31, 2015 is lower than the U.S. statutory income tax rate of 35.0%, primarily due to taxes incurred at certain corporate subsidiaries that do not consolidate with the Company’s taxable income, tax losses generated at certain of our taxable subsidiaries which require a valuation allowance and do not generate an income tax benefit, and state income taxes incurred on a separate legal entity basis.
For the year ended December 31, 2014, the Company’s effective tax rate on income from continuing operations was equal to 525.5%, which does not bear a customary relationship to statutory income tax rates. Differences from the statutory income tax rate are primarily due to state income taxes, non-deductible transaction costs incurred in connection with the Fortegra acquisition, and the effect of changes in valuation allowance on net operating losses reported by Tiptree Inc., Siena Capital Finance Acquisition Corp., Luxury and MFCA Funding, Inc.
Discontinued operations, net
The Company completed the sale of PFG during the second quarter of 2015. As such, there was no income from discontinued operations in the
year ended December 31, 2016
compared to
$22.6 million
and
$7.9 million
for the
year ended December 31, 2015
and 2014, respectively. For further information relating to the sale of PFG see Note—
(4) Dispositions, Assets Held for Sale & Discontinued Operations
, in the accompanying consolidated financial statements.
Balance Sheet Information - as of
December 31, 2016
compared to the year ended
December 31, 2015
Tiptree’s total assets were
$2.9 billion
as of
December 31, 2016
, compared to
$2.5 billion
as of
December 31, 2015
. The
$395.2 million
increase in assets is primarily attributable to increases in assets of consolidated CLOs, acquisitions in our senior living segment, increases in loans at amortized cost, as well as increases in accounts receivable and deferred acquisition costs at Fortegra, offset slightly by a reduction in loans at fair value, securities available for sale and reinsurance receivables.
Total stockholders’ equity of Tiptree was
$293.4 million
as of
December 31, 2016
compared to
$312.8 million
as of
December 31, 2015
. The primary reason for the decrease in Tiptree’s stockholders’ equity was from the repurchase of approximately 16% of the Company’s outstanding Class A shares, and decreases related to dividends paid and stock purchased under the stock purchase plans described in “Part II—
Item 5. Market for Registrant’s Common Equity, Related Stockholder Matters and Issuer Purchases of Equity Securities
. These reductions were partially offset by increases from shares issuance for compensation, changes in non-controlling interests and retained earnings.
44
For the year ended December 31, 2016, the Company re-purchased 6.8 million shares for $43.8 million compared with 0.6 million shares for $4.0 million for 2015.
On June 23, 2016, the Company repurchased 5.6 million shares of Class A common stock of Tiptree for aggregate consideration of $36.4 million. On September 14, 2016, the Company purchased 1.0 million shares of Class A common stock for $6.1 million. Both transactions were accretive to both book value per share in the current quarter and are expected to be accretive to earnings per share on a GAAP basis. The shares acquired are held as treasury shares and are not outstanding for accounting or voting purposes. An additional 0.2 million shares of Class A common stock were repurchased for $1.3 million under the previously approved stock repurchase plan. As of
December 31, 2016
there are
34,983,616
shares of Tiptree Class A common stock outstanding.
NON-GAAP RECONCILIATIONS
EBITDA and Adjusted EBITDA
The Company defines EBITDA as GAAP net income of the Company adjusted to add consolidated interest expense, consolidated income taxes and consolidated depreciation and amortization expense as presented in its financial statements and Adjusted EBITDA as EBITDA adjusted to
(i) subtract interest expense on asset-specific debt incurred in the ordinary course of its subsidiaries’ business operations, (ii) adjust for the effect of purchase accounting, (iii) add back significant acquisition related costs, (iv) adjust for significant relocation costs and (v) any significant one-time expenses.
|
Reconciliation from GAAP net income to Non-GAAP financial measures - EBITDA and Adjusted EBITDA
|
|||||||||||
|
($ in thousands, unaudited)
|
Year Ended December 31,
|
||||||||||
|
|
2016
|
|
2015
|
2014
|
|||||||
|
Net income (loss) available to Class A common stockholders
|
$
|
25,320
|
|
|
$
|
5,779
|
|
$
|
(1,710
|
)
|
|
|
Add: net (loss) income attributable to noncontrolling interests
|
7,018
|
|
|
3,023
|
|
6,294
|
|
||||
|
Less: net income from discontinued operations
|
—
|
|
|
22,618
|
|
$
|
7,937
|
|
|||
|
Income (loss) from Continuing Operations of the Company
|
$
|
32,338
|
|
|
$
|
(13,816
|
)
|
$
|
(3,353
|
)
|
|
|
Consolidated interest expense
|
29,701
|
|
|
23,491
|
|
12,541
|
|
||||
|
Consolidated income taxes
|
10,978
|
|
|
1,377
|
|
4,141
|
|
||||
|
Consolidated depreciation and amortization expense
|
28,468
|
|
|
45,124
|
|
$
|
11,945
|
|
|||
|
EBITDA from Continuing Operations
|
$
|
101,485
|
|
|
$
|
56,176
|
|
$
|
25,274
|
|
|
|
Consolidated non-corporate and non-acquisition related interest expense
(1)
|
(19,183
|
)
|
|
(11,861
|
)
|
(7,265
|
)
|
||||
|
Effects of Purchase Accounting
(2)
|
(5,054
|
)
|
|
(24,166
|
)
|
—
|
|
||||
|
Non-cash fair value adjustments
(3)
|
2,693
|
|
|
(1,300
|
)
|
—
|
|
||||
|
Significant acquisition expenses
(4)
|
711
|
|
|
1,859
|
|
6,121
|
|
||||
|
Separation expense adjustments
(5)
|
(1,736
|
)
|
|
5,209
|
|
—
|
|
||||
|
Adjusted EBITDA from Continuing Operations of the Company
|
$
|
78,916
|
|
|
$
|
25,917
|
|
|
$
|
24,130
|
|
|
|
|
|
|
||||||||
|
Income from Discontinued Operations of the Company
|
$
|
—
|
|
|
$
|
22,618
|
|
$
|
7,937
|
|
|
|
Consolidated interest expense
|
—
|
|
|
5,226
|
|
11,475
|
|
||||
|
Consolidated income taxes
|
—
|
|
|
3,796
|
|
5,525
|
|
||||
|
Consolidated depreciation and amortization expense
|
—
|
|
|
862
|
|
4,379
|
|
||||
|
EBITDA from Discontinued Operations
|
$
|
—
|
|
|
$
|
32,502
|
|
|
$
|
29,316
|
|
|
Significant relocation costs
(6)
|
—
|
|
—
|
|
5,477
|
|
|||||
|
Adjusted EBITDA from Discontinued Operations of the Company
|
$
|
—
|
|
|
$
|
32,502
|
|
$
|
34,793
|
|
|
|
|
|
|
|
||||||||
|
Adjusted EBITDA of the Company
|
$
|
78,916
|
|
|
$
|
58,419
|
|
|
$
|
58,923
|
|
|
(1)
|
The consolidated non-corporate and non-acquisition related interest expense is subtracted from EBITDA to arrive at Adjusted EBITDA. This includes interest expense associated with asset-specific debt at subsidiaries in the specialty insurance, asset management, senior living and specialty finance segments.
|
|
(2)
|
Following the purchase accounting adjustments, current period expenses associated with deferred costs were more favorably stated and current period income associated with deferred revenues were less favorably stated. Thus, the purchase accounting effect related to Fortegra increased EBITDA above what the historical basis of accounting would have generated. The impact of this purchase accounting adjustments have been reversed to reflect an adjusted EBITDA without such purchase accounting effect.
|
|
(3)
|
For our senior living segment, Adjusted EBITDA excludes the impact of the change of fair value of interest rate swaps hedging the debt at the property level. For Reliance, Adjusted EBITDA excludes the impact of changes in contingent earn-outs.
|
|
(4)
|
Acquisition costs include legal, taxes, banker fees and other costs associated with senior living acquisitions in 2016 and 2015 and the Fortegra acquisition in 2014.
|
|
(5)
|
Consists of payments pursuant to a separation agreement, dated as of November 10, 2015.
|
|
(6)
|
Significant relocation costs for discontinued operations included expenses incurred in connection with the move of one of our subsidiaries’ physical location from New Jersey to Philadelphia for the year ended December 31, 2014.
|
45
|
|
|
|
|
|
|
|
|
|
|
|
|
|
|
|
|
|
|
Segment EBITDA and Adjusted EBITDA from continuing operations
|
($ in thousands)
|
Specialty insurance
|
|
Asset management
|
|
Senior living
|
|
Specialty finance
|
|
Corporate and other
|
|
Total
|
||||||||||||||||||||||||||||||
|
|
2016
|
2015
|
2014
|
|
2016
|
2015
|
2014
|
|
2016
|
2015
|
2014
|
|
2016
|
2015
|
2014
|
|
2016
|
2015
|
2014
|
|
2016
|
2015
|
2014
|
||||||||||||||||||
|
Pre-tax income/(loss)
|
46,804
|
|
32,012
|
|
(3,171
|
)
|
|
25,264
|
|
(6,753
|
)
|
18,191
|
|
|
(5,824
|
)
|
(9,535
|
)
|
3,171
|
|
|
8,170
|
|
6,265
|
|
(1,962
|
)
|
|
(31,098
|
)
|
(34,428
|
)
|
(15,441
|
)
|
|
43,316
|
|
(12,439
|
)
|
788
|
|
|
Add back:
|
|
|
|
|
|
|
|
|
|
|
|
|
|
|
|
|
|
|
|
|
|
|
|
||||||||||||||||||
|
Interest expense
|
9,244
|
|
6,968
|
|
637
|
|
|
746
|
|
539
|
|
1,595
|
|
|
8,691
|
|
6,796
|
|
4,111
|
|
|
6,290
|
|
3,558
|
|
1,530
|
|
|
4,730
|
|
5,630
|
|
4,668
|
|
|
29,701
|
|
23,491
|
|
12,541
|
|
|
Depreciation and amortization expenses
|
13,184
|
|
29,673
|
|
4,265
|
|
|
—
|
|
—
|
|
—
|
|
|
14,166
|
|
14,546
|
|
7,181
|
|
|
870
|
|
760
|
|
499
|
|
|
248
|
|
145
|
|
—
|
|
|
28,468
|
|
45,124
|
|
11,945
|
|
|
Segment EBITDA
|
69,232
|
|
68,653
|
|
1,731
|
|
26,010
|
|
(6,214
|
)
|
19,786
|
|
17,033
|
|
11,807
|
|
14,463
|
|
15,330
|
|
10,583
|
|
67
|
|
(26,120
|
)
|
(28,653
|
)
|
(10,773
|
)
|
101,485
|
|
56,176
|
|
25,274
|
|
|||||
|
|
|
|
|
|
|
|
|
|
|
|
|
|
|
|
|
|
|
|
|
|
|
|
|
||||||||||||||||||
|
EBITDA adjustments:
|
|
|
|
|
|
|
|
|
|
|
|
|
|
|
|
|
|
|
|
|
|
|
|
||||||||||||||||||
|
Asset-specific debt interest
|
(3,652
|
)
|
(1,138
|
)
|
(29
|
)
|
|
(746
|
)
|
(539
|
)
|
(1,595
|
)
|
|
(8,691
|
)
|
(6,796
|
)
|
(4,111
|
)
|
|
(6,094
|
)
|
(3,388
|
)
|
(1,530
|
)
|
|
—
|
|
—
|
|
—
|
|
|
(19,183
|
)
|
(11,861
|
)
|
(7,265
|
)
|
|
Effects of purchase accounting
|
(5,054
|
)
|
(24,166
|
)
|
—
|
|
|
—
|
|
—
|
|
—
|
|
|
—
|
|
—
|
|
—
|
|
|
—
|
|
—
|
|
—
|
|
|
—
|
|
—
|
|
—
|
|
|
(5,054
|
)
|
(24,166
|
)
|
—
|
|
|
Non-cash fair value adjustments
|
—
|
|
—
|
|
—
|
|
|
—
|
|
—
|
|
—
|
|
|
1,416
|
|
—
|
|
—
|
|
|
1,277
|
|
(1,300
|
)
|
—
|
|
|
—
|
|
—
|
|
—
|
|
|
2,693
|
|
(1,300
|
)
|
—
|
|
|
Significant acquisition expenses
|
—
|
|
—
|
|
6,121
|
|
|
—
|
|
—
|
|
—
|
|
|
711
|
|
1,579
|
|
—
|
|
|
—
|
|
—
|
|
—
|
|
|
—
|
|
280
|
|
—
|
|
|
711
|
|
1,859
|
|
6,121
|
|
|
Separation expenses
|
—
|
|
—
|
|
—
|
|
|
—
|
|
—
|
|
—
|
|
|
—
|
|
—
|
|
—
|
|
|
—
|
|
—
|
|
—
|
|
|
(1,736
|
)
|
5,209
|
|
—
|
|
|
(1,736
|
)
|
5,209
|
|
—
|
|
|
Segment Adjusted EBITDA
|
60,526
|
|
43,349
|
|
7,823
|
|
|
25,264
|
|
(6,753
|
)
|
18,191
|
|
|
10,469
|
|
6,590
|
|
10,352
|
|
|
10,513
|
|
5,895
|
|
(1,463
|
)
|
|
(27,856
|
)
|
(23,164
|
)
|
(10,773
|
)
|
|
78,916
|
|
25,917
|
|
24,130
|
|
Book Value per share, as exchanged - Non-GAAP
Book value per share, as exchanged assumes full exchange of the limited partners units of TFP for Tiptree Class A common stock. Management believes the use of this financial measure provides supplemental information useful to investors as book value is frequently used by the financial community to analyze company growth on a relative per share basis. The following table provides a reconciliation between total stockholders’ equity and total shares outstanding, net of treasury shares, for the fiscal years ended December 31, 2016, 2015 and 2014.
|
($in thousands, unaudited, except per share information)
|
For the year ended December 31,
|
||||||||||
|
2016
|
2015
|
2014
|
|||||||||
|
Total stockholders’ equity
|
$
|
390,144
|
|
$
|
397,694
|
|
$
|
401,621
|
|
||
|
Less non-controlling interest - other
|
20,636
|
|
15,576
|
|
27,015
|
|
|||||
|
Total stockholders’ equity, net of non-controlling interests - other
|
$
|
369,508
|
|
$
|
382,118
|
|
$
|
374,606
|
|
||
|
Total Class A shares outstanding
(1)
|
28,388
|
|
34,900
|
|
31,830
|
|
|||||
|
Total Class B shares outstanding
|
8,049
|
|
8,049
|
|
9,770
|
|
|||||
|
Total shares outstanding
|
36,437
|
|
42,949
|
|
41,601
|
|
|||||
|
Book value per share, as exchanged
(2)
|
$
|
10.14
|
|
$
|
8.90
|
|
$
|
9.00
|
|
||
(1) As of
December 31, 2016
, excludes 6,596,000 shares of Class A common stock held by consolidated subsidiaries of the Company. See Note 24—Earnings per Share, for further discussion of potential dilution from warrants
|
|
|
|
|
|
|
|
|
|
|
|
|
|
|
|
Specialty Insurance - As Adjusted Underwriting Margin - Non-GAAP
Underwriting margin is a measure of the underwriting profitability of our specialty insurance segment. It represents net earned premiums, service and administrative fees, ceding commissions and other income less policy and contract benefits and commission expense. We use the combined ratio as an insurance operating metric to evaluate our underwriting performance, both overall and relative to peers. Expressed as a percentage, it represents the relationship of policy and contract benefits, commission expense (net of ceding commissions), employee compensation and benefits, and other expenses to net earned premiums, service and administrative fees, and other income. The following table provides a reconciliation between as adjusted underwriting margin and pre-tax income for the fiscal years ended December 31, 2016 and 2015.
46
|
Year Ended December 31,
|
|||||||||||||||||||||||
|
($ in thousands, unaudited)
|
GAAP
|
Non-GAAP adjustments
|
Non-GAAP - As Adjusted
|
||||||||||||||||||||
|
Revenues:
|
2016
|
2015
|
2016
|
2015
|
2016
|
2015
|
|||||||||||||||||
|
Net earned premiums
|
$
|
229,436
|
|
|
$
|
166,265
|
|
$
|
—
|
|
$
|
—
|
|
$
|
229,436
|
|
|
$
|
166,265
|
|
|||
|
Service and administrative fees
|
109,348
|
|
|
106,525
|
|
5,638
|
|
19,518
|
|
114,986
|
|
|
126,043
|
|
|||||||||
|
Ceding commissions
|
24,784
|
|
|
43,217
|
|
416
|
|
3,410
|
|
25,200
|
|
|
46,627
|
|
|||||||||
|
Other income
|
2,859
|
|
|
8,361
|
|
—
|
|
—
|
|
2,859
|
|
|
8,361
|
|
|||||||||
|
Less underwriting expenses:
|
|
|
|
|
|
||||||||||||||||||
|
Policy and contract benefits
|
106,784
|
|
|
86,312
|
|
—
|
|
—
|
|
106,784
|
|
86,312
|
|
||||||||||
|
Commission expense
|
147,253
|
|
|
105,751
|
|
10,745
|
|
45,166
|
|
157,998
|
|
|
150,917
|
|
|||||||||
|
Underwriting Margin - Non-GAAP
|
$
|
112,390
|
|
$
|
132,305
|
|
$
|
(4,691
|
)
|
$
|
(22,238
|
)
|
$
|
107,699
|
|
$
|
110,067
|
|
|||||
|
Less operating expenses:
|
|||||||||||||||||||||||
|
Employee compensation and benefits
|
37,937
|
|
|
38,786
|
|
—
|
|
—
|
|
37,937
|
|
38,786
|
|
||||||||||
|
Other expenses
|
32,964
|
|
|
31,386
|
|
363
|
|
1,928
|
|
33,327
|
|
33,314
|
|
||||||||||
|
Combined Ratio
|
87.9
|
%
|
|
77.9
|
%
|
—
|
|
—
|
|
89.5
|
%
|
|
87.4
|
%
|
|||||||||
|
Plus investment revenues:
|
|||||||||||||||||||||||
|
Net investment income
|
12,981
|
|
|
5,455
|
|
—
|
|
—
|
|
12,981
|
|
|
5,455
|
|
|||||||||
|
Net realized and unrealized gains
|
14,762
|
|
|
1,065
|
|
—
|
|
—
|
|
14,762
|
|
1,065
|
|
||||||||||
|
Less other expenses:
|
|
|
|||||||||||||||||||||
|
Interest expense
|
9,244
|
|
|
6,968
|
|
—
|
|
—
|
|
9,244
|
|
6,968
|
|
||||||||||
|
Depreciation and amortization expenses
|
13,184
|
|
|
29,673
|
|
(3,282
|
)
|
(19,320
|
)
|
9,902
|
|
10,353
|
|
||||||||||
|
Pre-tax income (loss)
|
$
|
46,804
|
|
|
$
|
32,012
|
|
$
|
(1,772
|
)
|
$
|
(4,846
|
)
|
45,032
|
|
27,166
|
|
||||||
Specialty Insurance Investment Portfolio - Non-GAAP
The following table provides a reconciliation between segment total investments and net investments for the fiscal years ended December 31, 2016, 2015 and 2014.
|
($ in thousands, unaudited)
|
Year Ended December 31,
|
||||||||||
|
2016
|
2015
|
2014
|
|||||||||
|
Total Investments
|
$
|
472,800
|
|
$
|
308,965
|
|
$
|
174,900
|
|
||
|
Investment portfolio debt
(1)
|
(146,544
|
)
|
|
(54,011
|
)
|
|
—
|
|
|||
|
Cash and cash equivalents
|
26,020
|
|
|
13,909
|
|
|
11,072
|
|
|||
|
Net investments - Non-GAAP
|
$
|
352,276
|
|
$
|
268,863
|
|
$
|
185,972
|
|
||
(1) Consists of asset-based financing on certain credit investments and NPLs, net of deferred financing costs, see Note 13 - Debt, net for further details.
Senior Living Product NOI - Non-GAAP
The following table provides a reconciliation between segment NOI and pre-tax income (loss) for the fiscal years ended December 31, 2016, 2015 and 2014.
|
($ in thousands, unaudited)
|
Year Ended December 31, 2016
|
Year Ended December 31, 2015
|
Year Ended December 31, 2014
|
||||||||||||||||||||||||||||||||
|
NNN Operations
|
Managed Properties
|
Senior Living Total
|
NNN Operations
|
Managed Properties
|
Senior Living Total
|
NNN Operations
|
Managed Properties
|
Senior Living Total
|
|||||||||||||||||||||||||||
|
Rental and related revenue
|
$
|
7,663
|
|
$
|
51,973
|
|
$
|
59,636
|
|
$
|
6,515
|
|
$
|
38,857
|
|
$
|
45,372
|
|
$
|
3,892
|
|
$
|
16,350
|
|
$
|
20,242
|
|
||||||||
|
Less: Property operating expenses
|
|
37,502
|
|
37,502
|
|
|
29,279
|
|
29,279
|
|
|
10,571
|
|
10,571
|
|
||||||||||||||||||||
|
Segment NOI
|
$
|
7,663
|
|
$
|
14,471
|
|
$
|
22,134
|
|
$
|
6,515
|
|
$
|
9,578
|
|
$
|
16,093
|
|
$
|
3,892
|
|
$
|
5,779
|
|
$
|
9,671
|
|
||||||||
|
Segment NOI Margin %
(1)
|
27.8
|
%
|
24.6
|
%
|
35.3
|
%
|
|
||||||||||||||||||||||||||||
|
Other income
|
$
|
1,095
|
|
$
|
757
|
|
$
|
9,039
|
|
||||||||||||||||||||||||||
|
Less: Expenses
|
|||||||||||||||||||||||||||||||||||
|
Interest expense
|
8,691
|
|
6,796
|
|
4,111
|
|
|||||||||||||||||||||||||||||
|
Payroll and employee commissions
|
2,702
|
|
2,181
|
|
2,185
|
|
|||||||||||||||||||||||||||||
|
Depreciation and amortization
|
14,166
|
|
14,546
|
|
7,182
|
|
|||||||||||||||||||||||||||||
|
Other expenses
|
3,494
|
|
2,862
|
|
2,061
|
|
|||||||||||||||||||||||||||||
|
Pre-tax income (loss)
|
$
|
(5,824
|
)
|
$
|
(9,535
|
)
|
$
|
3,171
|
|
||||||||||||||||||||||||||
(1) NOI Margin % is the relationship between segment NOI and rental and related revenue.
47
Asset Management As Adjusted Revenues
The following table provides a reconciliation between asset management segment revenues and non-GAAP, as adjusted revenues for the fiscal years ended December 31, 2016, 2015 and 2014.
|
|
Year Ended December 31,
|
||||||||||||||||||||||||||||||||||
|
($ in thousands, unaudited)
|
GAAP
|
|
Non-GAAP adjustments
|
|
Non-GAAP - As Adjusted
|
||||||||||||||||||||||||||||||
|
|
2016
|
|
2015
|
|
2014
|
|
2016
|
|
2015
|
|
2014
|
|
2016
|
|
2015
|
|
2014
|
||||||||||||||||||
|
Revenues:
|
|
|
|
|
|
|
|
|
|
|
|
|
|
|
|
|
|
||||||||||||||||||
|
Management fee income
|
$
|
9,400
|
|
|
$
|
6,524
|
|
|
$
|
259
|
|
|
$
|
2,752
|
|
|
$
|
4,131
|
|
|
$
|
11,770
|
|
|
$
|
12,152
|
|
|
$
|
10,655
|
|
|
$
|
12,029
|
|
|
Distributions
|
—
|
|
|
—
|
|
|
—
|
|
|
15,725
|
|
|
14,676
|
|
|
15,720
|
|
|
15,725
|
|
|
14,676
|
|
|
15,720
|
|
|||||||||
|
Net realized and unrealized gains (losses)
|
66
|
|
|
(3,599
|
)
|
|
(2,143
|
)
|
|
2,510
|
|
|
(25,480
|
)
|
|
(7,965
|
)
|
|
2,576
|
|
|
(29,079
|
)
|
|
(10,108
|
)
|
|||||||||
|
Other income
|
3,648
|
|
|
3,845
|
|
|
9,002
|
|
|
(733
|
)
|
|
(216
|
)
|
|
—
|
|
|
2,915
|
|
|
3,629
|
|
|
9,002
|
|
|||||||||
|
Total revenues
|
$
|
13,114
|
|
|
$
|
6,770
|
|
|
$
|
7,118
|
|
|
$
|
20,254
|
|
|
$
|
(6,889
|
)
|
|
$
|
19,525
|
|
|
$
|
33,368
|
|
|
$
|
(119
|
)
|
|
$
|
26,643
|
|
LIQUIDITY AND CAPITAL RESOURCES
Our principal sources of liquidity are our holdings of unrestricted cash, cash equivalents and other liquid investments and distributions from operating subsidiaries, including subordinated notes of CLOs, income from our investment portfolio and sales of assets and investments. We intend to use our cash resources to continue to grow our businesses. We may seek additional sources of cash to fund acquisitions or investments. These additional sources of cash may take the form of debt or equity and may be at the parent, subsidiary or asset level. We are a holding company and our liquidity needs are primarily for interest payments on the Fortress credit facility, compensation, professional fees, office rent and insurance costs.
Our subsidiaries’ ability to generate sufficient net income and cash flows to make cash distributions will be subject to numerous business and other factors, including restrictions contained in our subsidiaries’ financing agreements, regulatory restrictions, availability of sufficient funds at such subsidiaries, general economic and business conditions, tax considerations, strategic plans, financial results and other factors such as target capital ratios and ratio levels anticipated by rating agencies to maintain or improve current ratings. We expect our cash and cash equivalents and distributions from operating subsidiaries and our subsidiaries’ access to financing to be adequate to fund our operations for at least the next 12 months.
As of
December 31, 2016
, we had cash and cash equivalents, excluding restricted cash of
$63.0 million
, compared to
$69.4 million
at
December 31, 2015
, a net decrease of
$6.4 million
, primarily driven by cash used to invest in our investment portfolio.
Our approach to debt is generally to use non-recourse (other than customary carveouts, including fraud and environmental liability), asset specific debt where possible that is amortized by cash flows from the underlying business or assets financed. Our mortgage businesses rely on short term uncommitted sources of financing as a part of their normal course of operations. To date, we have been able to obtain and renew uncommitted warehouse credit facilities. If we were not able to obtain financing, then we may need to draw on other sources of liquidity to fund our mortgage business. See Note—
(13) Debt, net
for additional information regarding our mortgage warehouse borrowings.
Our intermediate holding company has a credit facility with Fortress to provide working capital. Loans under the Fortress credit agreement bear interest at LIBOR (with a minimum LIBOR rate of 1.25%), plus a margin of 6.50% per annum. We are required to make quarterly principal payments of $0.5 million, subject to adjustment based on the Net Leverage Ratio (as defined in the Fortress credit agreement) at the end of each fiscal quarter. All remaining principal, and any unpaid interest, under the Fortress credit agreement is payable on maturity at September 18, 2018. The outstanding debt under the Fortress credit agreement was
$58.5 million
as of
December 31, 2016
compared to
$45.5 million
as
December 31, 2015
. See Note—
(13) Debt, net
for additional information of our debt and that of our subsidiaries.
48
Consolidated Comparison of Cash Flows
Summary Consolidated Statements of Cash Flows -
Year Ended December 31, 2016
,
December 31, 2015
and
December 31, 2014
|
($ in thousands)
|
Year ended December 31,
|
||||||||||
|
2016
|
2015
|
2014
|
|||||||||
|
Net cash (used in) provided by:
|
|||||||||||
|
Operating activities
|
|||||||||||
|
Operating activities - continuing operations (excluding VIEs)
|
$
|
45,274
|
|
|
$
|
(28,265
|
)
|
$
|
(14,382
|
)
|
|
|
Operating activities - VIEs
|
(8,631
|
)
|
25,008
|
|
21,986
|
|
|||||
|
Operating activities - discontinued operations
|
—
|
|
(6,198
|
)
|
16,045
|
|
|||||
|
Total cash provided by (used in) operating activities
|
36,643
|
|
(9,455
|
)
|
23,649
|
|
|||||
|
Investing activities
|
|||||||||||
|
Investing activities - continuing operations (excluding VIEs)
|
(244,491
|
)
|
|
(263,274
|
)
|
(15,196
|
)
|
||||
|
Investing activities - VIEs
|
(75,494
|
)
|
33,613
|
|
(551,526
|
)
|
|||||
|
Investing activities - discontinued operations
|
—
|
|
11,866
|
|
(2,967
|
)
|
|||||
|
Total cash provided by (used in) investing activities
|
(319,985
|
)
|
(217,795
|
)
|
(569,689
|
)
|
|||||
|
Financing activities
|
|||||||||||
|
Financing activities - continuing operations (excluding VIEs)
|
77,525
|
|
|
240,090
|
|
16,700
|
|
||||
|
Financing activities - VIEs
|
199,427
|
|
8,573
|
|
497,798
|
|
|||||
|
Financing activities - discontinued operations
|
—
|
|
(5,000
|
)
|
(7,667
|
)
|
|||||
|
Total cash provided by (used in) financing activities
|
276,952
|
|
243,663
|
|
506,831
|
|
|||||
|
Net increase (decrease) in cash
|
$
|
(6,390
|
)
|
$
|
16,413
|
|
$
|
(39,209
|
)
|
||
The amounts associated with operating, investing and financing activities for the
year ended December 31, 2016
,
2015
and 2014 from discontinued operations are presented as a component of the Company’s Consolidated Statements of Cash Flows.
Year Ended December 31, 2016
Operating Activities
Cash provided by continuing operations (excluding VIEs) was
$45.3 million
for the
year ended December 31, 2016
. The primary sources of cash from continuing operations included mortgage sales outpacing originations, an increase in unearned premiums and policy liabilities in our specialty insurance segment as a result of credit protection and specialty products, and an increase in revenues in our senior living segment as a result of increased investments in properties during the period. The primary uses of cash from continuing operations included increases in notes and accounts receivable and reinsurance receivables in our specialty insurance segment as written policies increased significantly, and a decrease in deferred revenue in our specialty insurance segment.
Cash used in operating activities - VIEs was
$8.6 million
for the
year ended December 31, 2016
. The primary uses of cash from operating activities - VIEs were due to the increases in accrued interest receivable on the loans.
Investing Activities
Cash used in investing activities from continuing operations (excluding VIEs) was
$244.5 million
for the
year ended December 31, 2016
. The primary drivers included investments in NPLs and corporate loans, investments in senior living properties in our specialty insurance and senior living segments, and increases in loans in the specialty finance segment.
Cash used in investing activities - VIEs was
$75.5 million
for the
year ended December 31, 2016
. The primary driver of the cash used in investing activities - VIEs was purchases of loans in Telos 7 during the ramp up period as it converted from a warehouse to a CLO during the second quarter.
Financing Activities
Cash used in financing activities for continuing operations (excluding VIEs) was
$77.5 million
for the
year ended December 31, 2016
. The primary drivers of the cash used included paydown of the Telos 7 warehouse debt and repurchases of Class A common shares. The sources of cash were from borrowings in our senior living segment to fund our investments in real estate, borrowings in our specialty finance segment to fund loan growth, increase in debt in our specialty insurance segment for working capital, an increase
49
in borrowings at the Telos Credit Opportunities Fund to grow the loan portfolio, and a new borrowing to fund additional investment in NPLs.
Cash provided by financing activities - VIEs was
$199.4 million
for the
year ended December 31, 2016
driven primarily by the senior notes issued upon the conversion of Telos 7 from a warehouse to a CLO.
Year Ended December 31, 2015
Operating Activities
Cash used in continuing operations (excluding VIEs) was
$28.3 million
for the
year ended December 31, 2015
. The primary uses of cash from continuing operations included increased balances in mortgage loans held for sale as a result of higher volume in our mortgage segment, and increases in deferred acquisition costs and reinsurance receivables at Fortegra. The primary sources of cash from continuing operations (excluding VIEs) included operating cash generated at Care, increases in unearned premiums, deferred revenue, reinsurance payables and policy liabilities at Fortegra.
Cash provided by operating activities - VIEs was
$25.0 million
for the
year ended December 31, 2015
. The primary source of cash from operating activities - VIEs was the net gains on sale of loans in the CLOs.
Cash used in operating activities - discontinued operations was
$6.2 million
for the
year ended December 31, 2015
. The primary driver of the cash used was a decrease in future policy benefits payable.
Investing Activities
Cash used in investing activities from continuing operations (excluding VIEs) was
$263.3 million
for the
year ended December 31, 2015
. The primary uses of cash from investing activities from continuing operations (excluding VIEs) included the acquisition of senior living properties at Care, purchases of loans in the Telos Credit Opportunities Fund, acquisition of NPLs and increases in outstanding loans at Siena. The cash provided by investing activities was primarily driven by the sale of PFG.
Cash provided by investing activities - VIEs was
$33.6 million
for the
year ended December 31, 2015
. The primary driver of the use of cash in investing activities - VIEs was investments in new loans in the CLOs, more than offset by repayments and sales.
Cash used in investing activities - discontinued operations was
$11.9 million
for the
year ended December 31, 2015
. The primary driver of cash provided from investing activities was the repayment of policy holder loans, partially offset by the purchases of available for sale debt securities.
Financing Activities
Cash provided by financing activities (excluding VIEs) was
$240.1 million
for the
year ended December 31, 2015
. The primary sources of cash included increased borrowings at Siena to fund loan growth, borrowings on mortgage warehouse lines and increases in borrowings at Care to fund property acquisitions.
Cash provided by financing activities - VIEs was
$8.6 million
for the
year ended December 31, 2015
. The primary driver of the sources of cash in financing activities - VIEs was a net increase in debt on the CLOs.
Cash used in financing activities - discontinued operations was
$5.0 million
for the
year ended December 31, 2015
. The primary driver of the cash used was the repayment of debt outstanding.
Year Ended December 31, 2014
Operating Activities
Cash used in continuing operations (excluding VIEs) was $14.4 million for the year ended December 31, 2014. The primary sources of cash from continuing operations (excluding VIEs) were: operating cash generated at Care, a $7.9 million gain on the repayment of a loan, repayments of tax exempt securities, and net proceeds from the issuance of subordinated notes in Telos 5. The primary uses of cash from continuing operations were: loan growth at Siena, increased balances in mortgage loans held for sale as a result of higher volume in our mortgage segment, increase in cash payments for other liabilities and accrued expenses.
Cash provided by operating activities - VIEs was $22.0 million for the year ended December 31, 2014. The primary source of cash from operating activities - VIEs was the net gains on sale of loans in the CLOs.
50
Cash provided by operating activities - discontinued operations was $16.0 million for the year ended December 31, 2014. The primary driver of the cash provided was an increase in payables related to policy terminations and income from operations.
Investing Activities
Cash used in investing activities from continuing operations (excluding VIEs) was $15.2 million for the year ended December 31, 2014. The primary uses of cash from investing activities from continuing operations (excluding VIEs) were: the acquisition of Luxury and Fortegra, offset by net sales and maturities of investments related to new CLO launches.
Cash used in investing activities - VIEs was $551.5 million for the year ended December 31, 2014. The primary driver of the use of cash in investing activities - VIEs was investments in new loans in the CLOs, net of repayments and sales.
Cash used in investing activities - discontinued operations was $3.0 million for the year ended December 31, 2014. The primary driver of cash provided from investing activities - discontinued operations was the repayment of policy holder loans, partially offset by the purchase of property, plant and equipment.
Financing Activities
Cash provided by continuing operations (excluding VIEs) was $16.7 million for the year ended December 31, 2014. The primary sources of cash were: increased borrowings at Siena to fund loan growth, borrowings on mortgage warehouse lines related to the acquisition of Luxury, and repayment of the Telos 5 warehouse, net of new borrowings to fund the Telos 6 warehouse.
Cash provided by financing activities - VIEs was $497.8 million for the year ended December 31, 2014. The primary driver of the sources of cash in financing activities - VIEs was an increase in CLO liabilities.
Cash used in financing activities - discontinued operations was $7.7 million for the year ended December 31, 2014. The primary driver of the cash used was the repayment of debt outstanding.
Contractual Obligations
The table below summarizes Tiptree’s consolidated contractual obligations by period for payments that are due as of
December 31, 2016
:
|
($ in thousands)
|
Less than 1 year
|
1-3 years
|
3-5 years
|
More than 5 years
|
Total
|
||||||||||||||
|
Notes payable CLOs
(1)
|
$
|
—
|
|
$
|
—
|
|
$
|
—
|
|
$
|
924,534
|
|
$
|
924,534
|
|
||||
|
Credit agreement/Revolving line of credit
|
63,480
|
|
237,677
|
|
223,302
|
|
—
|
|
524,459
|
|
|||||||||
|
Mortgage notes payable and related interest
(2)
|
12,854
|
|
59,071
|
|
98,508
|
|
101,306
|
|
271,739
|
|
|||||||||
|
Trust Preferred Securities
|
—
|
|
—
|
|
—
|
|
35,000
|
|
35,000
|
|
|||||||||
|
Operating lease obligations
(3)
|
5,140
|
|
7,827
|
|
4,425
|
|
509
|
|
17,901
|
|
|||||||||
|
Total
|
$
|
81,474
|
|
$
|
304,575
|
|
$
|
326,235
|
|
$
|
1,061,349
|
|
$
|
1,773,633
|
|
||||
|
(1)
|
Non-recourse CLO notes payable principal is payable at stated maturity, 2021 for Telos 1, 2022 for Telos 2, 2024 for Telos 3 and Telos 4, 2025 for Telos 5, 2027 for Telos 6 and 2025 for Telos 7.
|
|
(2)
|
See Note —
(13) Debt, net
, in the accompanying consolidated financial statements for additional information.
|
|
(3)
|
Minimum rental obligation for Tiptree, Care, MFCA, Siena, Reliance, Luxury and Fortegra office leases. The total rent expense for the Company for the
year ended December 31, 2016
,
2015
and 2014 was
$6.4 million
,
$5.8 million
and $1.5 million, respectively.
|
CRITICAL ACCOUNTING POLICIES AND ESTIMATES
The Company’s significant accounting policies are described in Note—
(2) Summary of Significant Accounting Policies
. As disclosed in Note 2, the preparation of financial statements in conformity with generally accepted accounting principles (“GAAP”) requires management to make estimates and assumptions about future events that affect the amounts reported in the financial statements and accompanying notes. Actual results could differ significantly from those estimates. The Company believes that the following discussion addresses the Company’s most critical accounting policies, which are those that are most important to the portrayal of the Company’s financial condition and results of operations and require management’s most difficult , subjective and complex judgments. Further information can be found in the notes to the consolidated financial statements related to the following: valuation of assets where quoted market prices are not available can be found under “Fair Value Measurement” in Note—
(2) Summary of Significant Accounting Policies
; policies related to goodwill and intangible assets can be found in Note—
(2) Summary of Significant Accounting Policies
—Goodwill and Identifiable Intangible Assets, Net; and additional information on income taxes can be found under Note—
(22) Income Taxes
. The consolidated financial statements prepared under GAAP for all periods presented include retroactive adjustments to comparative periods to reflect the combinations under common control described in Note—
(1) Organization
, related to TAMCO and the Contribution Transactions. All intercompany items
51
have been eliminated for these periods.
Fair Value of Financial Instruments
Accounting Standards Codification (ASC) Topic 820, Fair Value Measurements and Disclosures, defines fair value, describes the framework for measuring fair value, and addresses fair value measurement disclosures. Fair value is defined as the price that would be received to sell an asset or paid to transfer a liability in an orderly transaction between market participants at the measurement date.
ASC Topic 820 establishes a three level valuation hierarchy for disclosure of fair value measurements. The valuation hierarchy is based upon the transparency of inputs to the valuation of an asset or liability as of the measurement date. The three levels, from highest to lowest, are defined as follows:
Level 1 - Unadjusted, quoted prices in active markets for identical assets or liabilities that Tiptree has the ability to access at the measurement date.
Level 2 - Significant inputs other than quoted prices that are observable for the asset or liability, either directly or indirectly through corroboration with observable market data. Level 2 inputs include quoted prices for similar instruments in active markets, and inputs other than quoted prices that are observable for the asset or liability.
The types of financial assets and liabilities carried at Level 2 are valued based on one or more of the following:
|
a)
|
Quoted prices for similar assets or liabilities in active markets;
|
|
b)
|
Quoted prices for identical or similar assets or liabilities in nonactive markets;
|
|
c)
|
Pricing models whose inputs are observable for substantially the full term of the asset or liability; and
|
|
d)
|
Pricing models whose inputs are derived principally from or corroborated by observable market data through correlation or other means for substantially the full term of the asset or liability.
|
Level 3 - Significant inputs that are unobservable inputs for the asset or liability, including Tiptree’s own data and assumptions that are used in pricing the asset or liability.
The availability of observable inputs can vary depending on the financial asset or liability and is affected by a wide variety of factors, including, for example, the type of product, whether the product is new, whether the product is traded on an active exchange or in the secondary market, and the current market conditions. To the extent that valuation is based on models or inputs that are less observable or unobservable in the market, the determination of fair value requires more judgment. Accordingly, the degree of judgment exercised by the Company in determining fair value is greatest for instruments categorized within Level 3 of the fair value hierarchy. In certain cases, the inputs used to measure fair value may fall into different levels of the fair value hierarchy. In such cases, for disclosure purposes, the level in the fair value hierarchy within which the fair value measurement in its entirety is determined based on the lowest level input that is significant to the fair value measurement in its entirety. Tiptree’s assessment of the significance of a particular input to the fair value measurement in its entirety requires judgment and the consideration of factors specific to the asset. From time to time, Tiptree’s assets and liabilities will transfer between one level to another level. It is Tiptree’s policy to recognize transfers between different levels at the end of each reporting period.
Tiptree utilizes both observable and unobservable inputs into its valuation methodologies. Observable inputs include benchmark yields, reported trades, broker-dealer quotes, issuer spreads, benchmark securities, bids, offers and reference data. In addition, specific issuer information and other market data is used. For broker quotes, quotes are obtained from sources recognized to be market participants. Unobservable inputs may include expected cash flow streams, default rates, supply and demand considerations and market volatility.
Reserves
Insurance Reserves
Unpaid claims are reserve estimates that are established in accordance with U.S. GAAP using generally accepted actuarial methods. Credit life and AD&D unpaid claims reserves include claims in the course of settlement and incurred but not reported (“IBNR”). Credit disability unpaid claims reserves also include continuing claim reserves for open disability claims. For all other Fortegra product lines, unpaid claims reserves are bulk reserves and are entirely IBNR. The Company uses a number of algorithms in establishing its unpaid claims reserves. These algorithms are used to calculate unpaid claims as a function of paid losses, earned premium, target loss ratios, in-force amounts, unearned premium reserves, industry recognized morbidity tables or a combination of these factors.
52
In arriving at the unpaid claims reserves, the Company conducts an actuarial analysis on a basis gross of reinsurance. The same estimates used as a basis in calculating the gross unpaid claims reserves are then used as the basis for calculating the net unpaid claims reserves, which take into account the impact of reinsurance. Anticipated future loss development patterns form a key assumption underlying these analyses. Our claims are generally reported and settled quickly, resulting in consistent historical loss development patterns. From the anticipated loss development patterns, a variety of actuarial loss projection techniques are employed, such as the chain ladder method, the Bornhuetter-Ferguson method and expected loss ratio method.
The unpaid claims reserves represent the Company's best estimates, generally involving actuarial projections at a given time. Actual claim costs are dependent upon a number of complex factors such as changes in doctrines of legal liabilities and damage awards. These factors are not directly quantifiable, particularly on a prospective basis. The Company periodically reviews and updates its methods of making such unpaid claims reserve estimates and establishing the related liabilities based on our actual experience. The Company has not made any changes to its methodologies for determining unpaid claims reserves in the periods presented.
Loan Reserves
Certain loans originated by the Company within its specialty finance segment are asset backed loans held for investment and are carried at amortized cost. An allowance for loan losses is a valuation allowance for probable incurred credit losses. Loan losses are charged against the allowance when the Company believes the uncollectibility of a loan balance is confirmed. Management reviews its methodology for its calculation of its loss provision as deemed necessary which is at least on an annual basis.
Although we sell substantially all of the loans we originate in our mortgage business, we remain subject to claims for repurchases or indemnities related to mortgage loans we originate in the event of early payment defaults or breaches of representations and warranties regarding loan quality, compliance and certain other loan characteristics. A reserve estimated for probable claims are based on historical experience and is calculated as a reduction to gain on sale on all of the loans we originate. Management reviews its methodology annually or more often if representation and warranty claims patterns change.
Deferred Acquisition Costs
The Company defers certain costs of acquiring new and renewal insurance policies and other products within the Company’s specialty insurance segment.
Insurance Policy Related
Insurance policy related deferred acquisition costs are limited to direct costs that resulted from successful contract transactions and would not have been incurred by the Company's insurance company subsidiaries had the transactions not occurred. These capitalized costs are amortized as the related premium is earned.
The Company evaluates whether insurance related deferred acquisition costs are recoverable at year-end, and considers investment income in the recoverability analysis. As a result of the Company's evaluations, no write-offs for unrecoverable insurance related deferred acquisition costs were recognized during the years ended
December 31, 2016
,
2015
and 2014, respectively.
Non-insurance Policy Related
Other deferred acquisition costs are limited to prepaid direct costs, typically commissions and contract transaction fees, that resulted from successful contract transactions and would not have been incurred by the Company had the transactions not occurred. These capitalized costs are amortized as the related service and administrative fees are earned.
The Company evaluates whether deferred acquisition costs - non-insurance policy related are recoverable at year-end. As a result of the Company's evaluations, no write-offs for unrecoverable deferred acquisition costs were recognized during the years ended
December 31, 2016
,
2015
and 2014, respectively.
53
Revenue Recognition
The Company earns revenues from a variety of sources:
Earned Premiums, net
Net earned premium is from direct and assumed earned premium consisting of revenue generated from the direct sale of insurance policies by the Company's distributors and premiums written for insurance policies by another carrier and assumed by the Company. Whether direct or assumed, the premium is earned over the life of the respective policy using methods appropriate to the pattern of losses for the type of business. Methods used include the Rule of 78's, pro rata, and other actuarial methods. Management selects the appropriate method based on available information, and periodically reviews the selections as additional information becomes available. Direct and assumed premiums are offset by premiums ceded to the Company's reinsurers, including PORCs, earned in the same manner. The amount ceded is proportional to the amount of risk assumed by the reinsurer.
Service and Administrative Fees
The Company earns service and administrative fees from a variety of activities. Such fees are typically positively correlated with transaction volume and are recognized as revenue as they become both realized and earned.
Service Fees.
Service fee revenue is recognized as the services are performed. These services include fulfillment, software development, and claims handling for our customers. Collateral tracking fee income is recognized when the service is performed and billed. Management reviews the financial results under each significant contract on a monthly basis. Any losses that may occur due to a specific contract would be recognized in the period in which the loss is determined probable. During the years ended
December 31, 2016
,
2015
and 2014, respectively, the Company did not incur a loss with respect to a specific significant service fee contract.
Administrative Fees.
Administrative fee revenue includes the administration of premium associated with our producers and their PORCs. In addition, we also earn fee revenue from debt cancellation programs, motor club programs, and warranty programs. Related administrative fee revenue is recognized consistent with the earnings recognition pattern of the underlying insurance policies, debt cancellation contracts and motor club memberships being administered, using Rule of 78's, modified Rule of 78's, pro rata, or other methods as appropriate for the contract. Management selects the appropriate method based on available information, and periodically reviews the selections as additional information becomes available.
Ceding Commissions
Ceding commissions earned under reinsurance agreements are based on contractual formulas that take into account, in part, underwriting performance and investment returns experienced by the assuming companies. As experience changes, adjustments to the ceding commissions are reflected in the period incurred and are based on the claim experience of the related policy.
The adjustment is calculated by adding the earned premium and investment income from the assets held in trust for the Company's benefit less earned commissions, incurred claims and the reinsurer's fee for the coverage.
Rental Revenue
Rental revenue from residents in Managed Properties are recognized monthly as services are provided, as lease periods for residents are short-term in nature. The Company recognizes rental revenue from NNN properties on a straight-line basis over the non-cancelable term of the lease unless another systematic and rational basis is more representative of the time pattern in which the use benefit is derived from the leased property. Renewal options in leases with rental terms that are higher than those in the primary term are excluded from the calculation of straight-line rent if the renewals are not reasonably assured. The Company commences rental revenue recognition when the tenant takes control of the leased space. The Company recognizes lease termination payments as a component of rental revenue in the period received, provided that there are no further obligations under the lease.
Commissions Payable and Expense
Commissions are paid to distributors and retailers selling credit insurance policies, motor club memberships, mobile device protection, and warranty service contracts, and are generally deferred and expensed in proportion to the earning of related revenue. Credit insurance commission rates, in many instances, are set by state regulators and are also impacted by market conditions. In certain instances, credit insurance commissions are subject to retrospective adjustment based on the profitability of the related policies. Under these retrospective commission arrangements, the producer of the credit insurance policies receives
54
a retrospective commission if the premium generated by that producer in the accounting period exceeds the costs associated with those policies, which includes the Company's administrative fees, claims, reserves, and premium taxes. The Company analyzes the retrospective commission calculation periodically for each producer and, based on the analysis associated with each such producer, the Company records a liability for any positive net retrospective commission earned and due to the producer or, conversely, records a receivable, net of allowance, for amounts due from such producer for instances where the net result of the retrospective commission calculation is negative.
Share-Based Compensation
The Company measures compensation cost for share-based awards at fair value and recognizes compensation over the service period for awards expected to vest. The fair value of restricted stock is based on the number of shares granted and the quoted price of our common stock at the time of grant. In addition, the estimation of share-based awards that will ultimately vest requires judgment, and to the extent actual results or updated estimates differ from our current estimates, such amounts will be recorded as a cumulative adjustment in the period that the estimates are revised. The Company considers many factors when estimating expected forfeitures, including types of awards, employee class, and historical experience. Actual results, and future changes in estimates, may differ substantially from our current estimates.
Income Taxes
The Company accounts for income taxes under the asset and liability method. Deferred tax assets and liabilities are recognized for the future tax consequences attributable to the differences between the financial statement carrying amounts of existing assets and liabilities and their respective tax bases. Deferred tax assets and liabilities are measured using enacted tax rates expected to apply to taxable income in the years in which the temporary differences are expected to be recovered or settled.
The effect on deferred tax assets and liabilities of a change in the tax rates is recognized in earnings in the period that includes the enactment date. Additionally, taxing jurisdictions could retroactively disagree with our tax treatment of certain items, and some historical transactions have income tax effects going forward. Accounting guidance requires these future effects to be evaluated using current laws, rules and regulations, each of which can change at any time and in an unpredictable manner.
The Company establishes valuation allowances for deferred tax assets when, in its judgment, it concludes that it is more likely than not that the deferred tax assets will not be realized. These judgments are based on projections of future income, including tax-planning strategies, by individual tax jurisdiction. Changes in economic conditions and the competitive environment may impact the accuracy of the Company’s projections. On a quarterly basis, the Company assesses the likelihood that its deferred tax assets will be realized and determines if adjustments to the Company’s valuation allowance is appropriate. As a result of this assessment, as of December 31, 2016, the consolidated valuation allowance for Tiptree was $0.8 million. The increase and/or decrease in valuation allowance could have a significant negative or positive impact on our current and future earnings. In 2016, the Company recorded a net decrease of valuation allowances of $0.2 million as compared to a decrease of $1.7 million in 2015.
Acquisition Accounting
In connection with our acquisitions, assets acquired and liabilities assumed are recorded at fair value as of the acquisition date. The accounting for acquisitions requires the identification and measurement of all acquired tangible and intangible assets and assumed liabilities at their respective fair values as of the acquisition date. In measuring the fair value of net tangible and identified intangible assets acquired, management uses information obtained as a result of pre-acquisition due diligence, marketing, leasing activities and independent appraisals. The determination of fair value involved the use of significant judgment and estimation.
Goodwill and Intangible Assets
The initial measurement of goodwill and intangibles requires judgment concerning estimates of the fair value of the acquired assets and liabilities. Goodwill (and indefinite-lived intangible assets are not amortized but subject to tests for impairment annually or if events or circumstances indicate it is more likely than not they may be impaired. Other intangible assets are amortized over their estimated useful lives and are subject to impairment if events or circumstances indicate a possible inability to realize the carrying amount.
GAAP also requires that an interim test be done whenever events or circumstances occur that may indicate that it is more likely than not that the fair value of any reporting unit might be less than its carrying value. No such events or circumstances have occurred during the years ended
December 31, 2016
and December 31, 2014, respectively. 2015 had an impairment charge.
55
During the fourth quarter of 2016, the Company changed the date of its annual impairment test of goodwill from December 31 to October 1. The Company believes the change in goodwill impairment date does not result in a material change in the method of applying the accounting principle. This change provides the Company additional time to complete the annual impairment test of goodwill in advance of our year end reporting. The Company will continue to perform interim impairment testing should circumstances or events require. This change does not result in a delay, acceleration, or avoidance of an impairment charge. This change will be applied prospectively beginning in 2017 because it is impracticable to apply it retrospectively due to the difficulty in making estimates and assumptions without using hindsight.
Key judgments in accounting for intangibles include useful life and classification between goodwill and indefinite-lived intangibles or other intangibles requiring amortization. Indefinite-lived intangible assets are evaluated for impairment at least annually by comparing their fair values, estimated using discounted cash flow analyses, to their carrying values. Other amortizing intangible assets are evaluated for impairment if events and circumstances indicate a possible impairment. Such evaluation of other intangible assets is initially based on undiscounted cash flow projections. See Note—
(2) Summary of Significant Accounting Policies
, in the accompanying consolidated financial statements for further detail.
Recently Issued Accounting Standards
For a discussion of recently issued accounting standards see Note—
(2) Summary of Significant Accounting Policies
, in the accompanying consolidated financial statements.
OFF-BALANCE SHEET ARRANGEMENTS
In the normal course of business, we enter into various off-balance sheet arrangements including entering into derivative financial instruments and hedging transactions, operating leases and sponsoring and owning interests in consolidated and non-consolidated variable interest entities.
Further disclosure on our off-balance sheet arrangements as of
December 31, 2016
is presented in the “Notes to Consolidated Financial Statements” in “Part II.
Item 8. Financial Statements and Supplementary Data
” of this filing as follows:
|
•
|
Note —
(11) Derivative Financial Instruments and Hedging
|
|
•
|
Note —
(12) Assets and Liabilities of Consolidated CLOs
|
|
•
|
Note —
(23) Commitments and Contingencies
|
Interest Rate Risk
We are exposed to interest rate risk related to borrowings in various businesses. These risks result primarily from changes in LIBOR rates and the spread over LIBOR rates related to the credit risks of our businesses.
For fixed rate debt, interest rate fluctuations generally affect the fair value of our liabilities, but do not impact our earnings. Therefore, interest rate risk does not have a significant impact on our fixed rate debt obligations until such obligations mature or until we elect to prepay and refinance such obligations. If interest rates have risen at the time our fixed rate debt matures or is refinanced, our future earnings could be adversely affected by additional borrowing costs. Conversely, lower interest rates at the time of maturity or refinancing may lower our overall interest expense.
For general purpose floating rate debt, interest rate fluctuations primarily affect interest expense and cash flows. If market interest rates rise, our earnings could be adversely affected by an increase in interest expense. In contrast, lower interest rates may reduce our interest expense and improve our earnings, except to the extent that our borrowings are subject to interest rate floors. The floating interest rate risk of asset-based financing is generally offset as the financing and the purchased financial asset are generally subject to the same interest rate risk. For floating rate risk of other asset-based financing such as borrowings to finance acquisitions of real estate, we generally hedge our exposure to the variability of the benchmark index with an interest rate swap.
As of December 31, 2016, we had $164 million of general purpose floating rate debt with a weighted average rate of 5.0%. A 100 basis point change in interest rates would increase interest expense by $1.4 million and decrease interest rate expense by $0.8 million (including the effect of applicable floors) on an annualized basis.
56
Credit Risk
For the purposes of the analysis of credit and market risk related to investments in consolidated CLO entities, the Company assesses its risk on its direct investment in such entities. We are exposed to credit risk related to the following investments:
|
Investments
|
Business
|
December 31, 2016
|
||||
|
Subordinated notes and related participations in management fees
|
Asset Management
|
$
|
57,317
|
|
||
|
Levered loan fund
|
Specialty Insurance
|
175,558
|
|
|||
|
Non-performing loans
|
Specialty Insurance
|
74,923
|
|
|||
|
$
|
307,798
|
|
||||
An increase in the default rate by 1% of investments in such loans would result in estimated credit losses, net of anticipated recoveries of approximately $4.7 million. Non-performing loans are collateralized by residential property values which are subject to volatility and may be affected adversely by a number of factors, including, but not limited to, national, regional and local economic conditions and local real estate market conditions. Our specialty insurance business also has exposure to credit risk in the form of fixed income securities which are primarily invested in high-grade government, municipal and corporate debt securities.
We are also exposed to a certain amount of market risk in our asset management business through the purchase of index swaps which are intended to reduce the risk of credit losses related to subordinated notes under certain market distress scenarios. A 100 basis point change in the credit index underlying such swaps would result in income or loss of approximately $0.4 million as of December 31, 2016.
We are exposed to credit risk in the form of lease income in our senior living business.
In addition, our specialty finance business also underwrites mortgage loans for the purpose of selling them into the secondary market. Due to the relatively short holding period, the credit risk associated with mortgage loans held for sale is not expected to be significant.
See Note—
(6) Investments
to the consolidated financial statements for more information regarding our investments in loans by type.
Market Risk
We are primarily exposed to market risk related to the following investments:
|
Investments
|
Business
|
December 31, 2016
|
||||
|
Equity securities
|
Specialty Insurance
|
$
|
48,612
|
|
||
|
Subordinated notes and related participations in management fees
|
Asset Management
|
57,317
|
|
|||
|
Total
|
$
|
105,929
|
|
|||
A 10% increase or decrease in the fair value of such investments would result in $10.6 million of unrealized gains and losses, respectively.
Counterparty Risk
We are subject to counterparty risk to the extent that we engage in derivative activities for hedging or other purposes. As of December 31, 2016, the total fair value of derivatives assets subject to counterparty risk, including the effect of any legal right of offset, totaled
$20.5 million
. We generally manage our counterparty risk to derivative counterparties by entering into contracts with counterparties of high credit quality.
Reinsurance receivables were $296 million as of December 31, 2016. Of those amounts, $165 million relates to contracts where we hold collateral or receive letters of credit in excess of the receivables balance. The remainder is held with high quality reinsurers, substantially all of which have a rating of A or better by A.M. Best. No counterparty constituted more than 10% of any uncollateralized reinsurance receivable exposure as of December 31, 2016.
We were also exposed to counterparty risk of approximately $59 million as of December 31, 2016 related to our retrospective commission arrangements; associated risks are offset by the Company’s contractual ability to withhold future commissions against the retrospective balances. In addition, we are exposed to counterparty risk of approximately $24 million as of December
57
31, 2016 related to our premium financing business. The risk associated with such arrangements is mitigated by the fact that we have the contractual ability to cancel the insurance policy and have premiums refunded to us by the insurer in the event of a counterparty default.
58
TIPTREE INC. AND SUBSIDIARIES
Notes to Consolidated Financial Statements
December 31, 2016
(in thousands, except share data)
Index to Consolidated Financial Statements
|
Page
|
|
F- 1
Report of Independent Registered Public Accounting Firm
The Board of Directors and Stockholders
Tiptree Inc.:
We have audited the accompanying consolidated balance sheets of Tiptree Inc. and subsidiaries as of December 31, 2016 and 2015, and the related consolidated statements of operations, comprehensive income (loss), changes in stockholders’ equity, and cash flows for each of the years in the three‑year period ended December 31, 2016. In connection with our audits of these consolidated financial statements, we also have audited financial statement schedule II. These consolidated financial statements and financial statement schedule are the responsibility of the Company’s management. Our responsibility is to express an opinion on these consolidated financial statements and financial statement schedule based on our audits.
We conducted our audits in accordance with the standards of the Public Company Accounting Oversight Board (United States). Those standards require that we plan and perform the audit to obtain reasonable assurance about whether the financial statements are free of material misstatement. An audit includes examining, on a test basis, evidence supporting the amounts and disclosures in the financial statements. An audit also includes assessing the accounting principles used and significant estimates made by management, as well as evaluating the overall financial statement presentation. We believe that our audits provide a reasonable basis for our opinion.
In our opinion, the consolidated financial statements referred to above present fairly, in all material respects, the financial position of Tiptree Inc. and subsidiaries as of December 31, 2016 and 2015, and the results of their operations and their cash flows for each of the years in the three‑year period ended December 31, 2016, in conformity with U.S. generally accepted accounting principles. Also in our opinion, the related financial statement schedule, when considered in relation to the basic consolidated financial statements taken as a whole, present fairly, in all material respects, the information set forth therein.
We also have audited, in accordance with the standards of the Public Company Accounting Oversight Board (United States), Tiptree Inc.’s internal control over financial reporting as of December 31, 2016, based on criteria established in
Internal Control - Integrated Framework (2013)
issued by the Committee of Sponsoring Organizations of the Treadway Commission (COSO), and our report dated March 13, 2017 expressed an unqualified opinion on the effectiveness of the Company’s internal control over financial reporting.
/s/ KPMG LLP
New York, New York
March 13, 2017
F- 2
Report of Independent Registered Public Accounting Firm
The Board of Directors and Stockholders
Tiptree Inc.:
We have audited Tiptree Inc.’s internal control over financial reporting as of December 31, 2016, based on criteria established in
Internal Control - Integrated Framework (2013)
issued by the Committee of Sponsoring Organizations of the Treadway Commission (COSO). Tiptree Inc.’s management is responsible for maintaining effective internal control over financial reporting and for its assessment of the effectiveness of internal control over financial reporting, included in the accompanying
Management’s Report on Internal Control Over Financial Reporting
. Our responsibility is to express an opinion on the Company’s internal control over financial reporting based on our audit.
We conducted our audit in accordance with the standards of the Public Company Accounting Oversight Board (United States). Those standards require that we plan and perform the audit to obtain reasonable assurance about whether effective internal control over financial reporting was maintained in all material respects. Our audit included obtaining an understanding of internal control over financial reporting, assessing the risk that a material weakness exists, and testing and evaluating the design and operating effectiveness of internal control based on the assessed risk. Our audit also included performing such other procedures as we considered necessary in the circumstances. We believe that our audit provides a reasonable basis for our opinion.
A company’s internal control over financial reporting is a process designed to provide reasonable assurance regarding the reliability of financial reporting and the preparation of financial statements for external purposes in accordance with generally accepted accounting principles. A company’s internal control over financial reporting includes those policies and procedures that (1) pertain to the maintenance of records that, in reasonable detail, accurately and fairly reflect the transactions and dispositions of the assets of the company; (2) provide reasonable assurance that transactions are recorded as necessary to permit preparation of financial statements in accordance with generally accepted accounting principles, and that receipts and expenditures of the company are being made only in accordance with authorizations of management and directors of the company; and (3) provide reasonable assurance regarding prevention or timely detection of unauthorized acquisition, use, or disposition of the company’s assets that could have a material effect on the financial statements.
Because of its inherent limitations, internal control over financial reporting may not prevent or detect misstatements. Also, projections of any evaluation of effectiveness to future periods are subject to the risk that controls may become inadequate because of changes in conditions, or that the degree of compliance with the policies or procedures may deteriorate.
Management excluded the two Care Managed Properties acquired during the quarter ended March 31, 2016 and the one Care Managed Property acquired during the quarter ended September 30, 2016, with total assets of $83.4 million and total revenues of $10.9 million, from its evaluation of internal control over financial reporting for the year ended December 31, 2016. Our audit of internal control over financial reporting of Tiptree Inc. also excluded an evaluation of the internal control over financial reporting of these three Care managed properties.
In our opinion, Tiptree Inc. maintained, in all material respects, effective internal control over financial reporting as of December 31, 2016, based on criteria established in
Internal Control - Integrated Framework (2013)
issued by the Committee of Sponsoring Organizations of the Treadway Commission (COSO).
We also have audited, in accordance with the standards of the Public Company Accounting Oversight Board (United States), the consolidated balance sheets of Tiptree Inc. and subsidiaries as of December 31, 2016 and 2015, and the related consolidated statements of operations, comprehensive income (loss), stockholders’ equity, and cash flows for each of the years in the three-year period ended December 31, 2016 and our report dated March 13, 2017, expressed an unqualified opinion on those consolidated financial statements.
/s/ KPMG LLP
New York, New York
March 13, 2017
F- 3
TIPTREE INC. AND SUBSIDIARIES
Consolidated Balance Sheets
(in thousands, except share data)
|
As of December 31,
|
|||||||
|
2016
|
2015
|
||||||
|
Assets
|
|
||||||
|
Investments:
|
|||||||
|
Available for sale securities, at fair value
|
$
|
146,171
|
|
$
|
184,703
|
|
|
|
Loans, at fair value
|
373,089
|
|
394,395
|
|
|||
|
Loans at amortized cost, net
|
113,838
|
|
52,531
|
|
|||
|
Equity securities, trading, at fair value
|
48,612
|
|
12,727
|
|
|||
|
Real estate, net
|
309,423
|
|
206,158
|
|
|||
|
Other investments
|
25,467
|
|
31,524
|
|
|||
|
Total investments
|
1,016,600
|
|
882,038
|
|
|||
|
Cash and cash equivalents
|
63,010
|
|
69,400
|
|
|||
|
Restricted cash
|
24,472
|
|
18,778
|
|
|||
|
Notes and accounts receivable, net
|
157,500
|
|
136,808
|
|
|||
|
Reinsurance receivables
|
296,234
|
|
352,926
|
|
|||
|
Deferred acquisition costs
|
126,608
|
|
57,858
|
|
|||
|
Goodwill and intangible assets, net
|
178,245
|
|
186,107
|
|
|||
|
Other assets
|
37,886
|
|
62,243
|
|
|||
|
Assets of consolidated CLOs
|
989,495
|
|
728,812
|
|
|||
|
Total assets
|
$
|
2,890,050
|
|
$
|
2,494,970
|
|
|
|
Liabilities and Stockholders’ Equity
|
|||||||
|
Liabilities
|
|||||||
|
Debt, net
|
$
|
793,009
|
|
$
|
666,952
|
|
|
|
Unearned premiums
|
414,960
|
|
389,699
|
|
|||
|
Policy liabilities and unpaid claims
|
103,391
|
|
80,663
|
|
|||
|
Deferred revenue
|
52,254
|
|
63,081
|
|
|||
|
Reinsurance payable
|
70,588
|
|
65,840
|
|
|||
|
Other liabilities and accrued expenses
|
133,735
|
|
132,725
|
|
|||
|
Liabilities of consolidated CLOs
|
931,969
|
|
698,316
|
|
|||
|
Total liabilities
|
$
|
2,499,906
|
|
$
|
2,097,276
|
|
|
|
Commitments and contingencies (see Note 23)
|
|
|
|||||
|
Stockholders’ Equity
|
|||||||
|
Preferred stock: $0.001 par value, 100,000,000 shares authorized, none issued or outstanding
|
$
|
—
|
|
$
|
—
|
|
|
|
Common stock - Class A: $0.001 par value, 200,000,000 shares authorized, 34,983,616 and 34,899,833 shares issued and outstanding, respectively
|
35
|
|
35
|
|
|||
|
Common stock - Class B: $0.001 par value, 50,000,000 shares authorized, 8,049,029 and 8,049,029 shares issued and outstanding, respectively
|
8
|
|
8
|
|
|||
|
Additional paid-in capital
|
297,391
|
|
297,063
|
|
|||
|
Accumulated other comprehensive income (loss), net of tax
|
555
|
|
(111
|
)
|
|||
|
Retained earnings
|
37,974
|
|
15,845
|
|
|||
|
Class A common stock held by subsidiaries, 6,596,000 and 0 shares, respectively
|
(42,524
|
)
|
—
|
|
|||
|
Class B common stock held by subsidiaries, 8,049,029 and 0 shares, respectively
|
(8
|
)
|
—
|
|
|||
|
Total Tiptree Inc. stockholders’ equity
|
293,431
|
|
312,840
|
|
|||
|
Non-controlling interests (including $76,077 and $69,278 attributable to Tiptree Financial Partners, L.P., respectively)
|
96,713
|
|
84,854
|
|
|||
|
Total stockholders’ equity
|
390,144
|
|
397,694
|
|
|||
|
Total liabilities and stockholders’ equity
|
$
|
2,890,050
|
|
$
|
2,494,970
|
|
|
See accompanying notes to consolidated financial statements.
F- 4
TIPTREE INC. AND SUBSIDIARIES
Consolidated Statements of Operations
(in thousands, except share data)
|
|
Year Ended December 31,
|
||||||||||
|
|
2016
|
2015
|
2014
|
||||||||
|
Revenues:
|
|||||||||||
|
Earned premiums, net
|
$
|
229,436
|
|
$
|
166,265
|
|
$
|
12,827
|
|
||
|
Service and administrative fees
|
109,348
|
|
106,525
|
|
8,657
|
|
|||||
|
Ceding commissions
|
24,784
|
|
43,217
|
|
3,737
|
|
|||||
|
Net investment income
|
12,981
|
|
5,455
|
|
279
|
|
|||||
|
Net realized and unrealized gains (losses)
|
87,300
|
|
31,275
|
|
14,509
|
|
|||||
|
Rental and related revenue
|
59,636
|
|
45,372
|
|
20,242
|
|
|||||
|
Other income
|
43,669
|
|
40,350
|
|
20,062
|
|
|||||
|
Total revenues
|
567,154
|
|
438,459
|
|
80,313
|
|
|||||
|
|
|||||||||||
|
Expenses:
|
|||||||||||
|
Policy and contract benefits
|
106,784
|
|
86,312
|
|
5,829
|
|
|||||
|
Commission expense
|
147,253
|
|
105,751
|
|
4,287
|
|
|||||
|
Employee compensation and benefits
|
139,612
|
|
107,810
|
|
32,540
|
|
|||||
|
Interest expense
|
29,701
|
|
23,491
|
|
12,541
|
|
|||||
|
Depreciation and amortization
|
28,468
|
|
45,124
|
|
11,945
|
|
|||||
|
Other expenses
|
92,274
|
|
75,521
|
|
31,908
|
|
|||||
|
Total expenses
|
544,092
|
|
444,009
|
|
99,050
|
|
|||||
|
|
|||||||||||
|
Results of consolidated CLOs:
|
|||||||||||
|
Income attributable to consolidated CLOs
|
53,577
|
|
23,613
|
|
64,681
|
|
|||||
|
Expenses attributable to consolidated CLOs
|
33,323
|
|
30,502
|
|
45,156
|
|
|||||
|
Net income (loss) attributable to consolidated CLOs
|
20,254
|
|
(6,889
|
)
|
19,525
|
|
|||||
|
Income (loss) before taxes from continuing operations
|
43,316
|
|
(12,439
|
)
|
788
|
|
|||||
|
Less: provision (benefit) for income taxes
|
10,978
|
|
1,377
|
|
4,141
|
|
|||||
|
Income (loss) from continuing operations
|
32,338
|
|
(13,816
|
)
|
(3,353
|
)
|
|||||
|
|
|||||||||||
|
Discontinued operations:
|
|||||||||||
|
Income from discontinued operations, net
|
—
|
|
6,999
|
|
7,937
|
|
|||||
|
Gain on sale of discontinued operations, net
|
—
|
|
15,619
|
|
—
|
|
|||||
|
Discontinued operations, net
|
—
|
|
22,618
|
|
7,937
|
|
|||||
|
Net income (loss) before non-controlling interests
|
32,338
|
|
8,802
|
|
4,584
|
|
|||||
|
Less: net income (loss) attributable to non-controlling interests - Tiptree Financial Partners, L.P.
|
6,432
|
|
2,630
|
|
6,790
|
|
|||||
|
Less: net income (loss) attributable to non-controlling interests - Other
|
586
|
|
393
|
|
(496
|
)
|
|||||
|
Net income (loss) attributable to Tiptree Inc. Class A common stockholders
|
$
|
25,320
|
|
$
|
5,779
|
|
$
|
(1,710
|
)
|
||
|
Net income (loss) per Class A common share:
|
|||||||||||
|
Basic, continuing operations, net
|
$
|
0.79
|
|
$
|
(0.26
|
)
|
$
|
(0.31
|
)
|
||
|
Basic, discontinued operations, net
|
—
|
|
0.43
|
|
0.21
|
|
|||||
|
Basic earnings per share
|
0.79
|
|
0.17
|
|
(0.10
|
)
|
|||||
|
|
|||||||||||
|
Diluted, continuing operations, net
|
0.78
|
|
(0.26
|
)
|
(0.31
|
)
|
|||||
|
Diluted, discontinued operations, net
|
—
|
|
0.43
|
|
0.21
|
|
|||||
|
Diluted earnings per share
|
$
|
0.78
|
|
$
|
0.17
|
|
$
|
(0.10
|
)
|
||
|
|
|||||||||||
|
Weighted average number of Class A common shares:
|
|||||||||||
|
Basic
|
31,721,449
|
|
33,202,681
|
|
16,771,980
|
|
|||||
|
Diluted
|
31,766,674
|
|
33,202,681
|
|
16,771,980
|
|
|||||
See accompanying notes to consolidated financial statements.
F- 5
TIPTREE INC. AND SUBSIDIARIES
Consolidated Statements of Comprehensive Income (Loss)
(in thousands)
|
Year Ended December 31,
|
|||||||||||
|
2016
|
2015
|
2014
|
|||||||||
|
Net income (loss) before non-controlling interests
|
$
|
32,338
|
|
$
|
8,802
|
|
$
|
4,584
|
|
||
|
Other comprehensive income (loss), net of tax:
|
|||||||||||
|
Unrealized gains (losses) on available-for-sale securities:
|
|||||||||||
|
Unrealized holding gains (losses) arising during the period
|
289
|
|
(134
|
)
|
(313
|
)
|
|||||
|
Related tax (expense) benefit
|
(103
|
)
|
43
|
|
116
|
|
|||||
|
Reclassification of (gains) losses included in net income
|
(1,026
|
)
|
99
|
|
(50
|
)
|
|||||
|
Related tax expense (benefit)
|
362
|
|
(35
|
)
|
19
|
|
|||||
|
Unrealized gains (losses) on available-for-sale securities, net of tax
|
(478
|
)
|
(27
|
)
|
(228
|
)
|
|||||
|
Interest rate swaps (cash flow hedges):
|
|||||||||||
|
Unrealized gains (losses) on interest rate swaps
|
2,210
|
|
(326
|
)
|
128
|
|
|||||
|
Related tax (expense) benefit
|
(658
|
)
|
112
|
|
(45
|
)
|
|||||
|
Reclassification of (gains) losses included in net income
|
121
|
|
274
|
|
97
|
|
|||||
|
Related tax expense (benefit)
|
(25
|
)
|
(95
|
)
|
(34
|
)
|
|||||
|
Unrealized (losses) gains on interest rate swaps from cash flow hedges, net of tax
|
1,648
|
|
(35
|
)
|
146
|
|
|||||
|
Other comprehensive income (loss), net of tax
|
1,170
|
|
(62
|
)
|
(82
|
)
|
|||||
|
Comprehensive income (loss)
|
33,508
|
|
8,740
|
|
4,502
|
|
|||||
|
Less: Comprehensive income (loss) attributable to non-controlling interests - Tiptree Financial Partners, L.P.
|
6,560
|
|
2,630
|
|
6,790
|
|
|||||
|
Less: Comprehensive income (loss) attributable to non-controlling interests - Other
|
962
|
|
393
|
|
(496
|
)
|
|||||
|
Comprehensive income (loss) attributable to Tiptree Inc. Class A common stockholders
|
$
|
25,986
|
|
$
|
5,717
|
|
$
|
(1,792
|
)
|
||
See accompanying notes to consolidated financial statements.
F- 6
TIPTREE INC. AND SUBSIDIARIES
Consolidated Statements of Changes in Stockholders’ Equity
(in thousands, except shares)
|
Number of Shares
|
Par Value
|
Additional paid in capital
|
Accumulated
other comprehensive income (loss) |
Retained
earnings |
Common Stock held by subsidiaries
|
Total stockholders’ equity to Tiptree Inc.
|
Non-controlling
interests - Tiptree Financial Partners, L.P. |
Non-controlling
interests - Other |
Total stockholders' equity
|
||||||||||||||||||||||||||||||||||||||||||||||||
|
Class A
|
Class B
|
Class A
|
Class B
|
Class A Shares
|
Class A Amount
|
Class B Shares
|
Class B Amount
|
||||||||||||||||||||||||||||||||||||||||||||||||||
|
Balance at December 31, 2013
|
10,556,390
|
|
30,968,877
|
|
$
|
11
|
|
$
|
31
|
|
$
|
83,815
|
|
$
|
33
|
|
$
|
15,089
|
|
$
|
—
|
|
$
|
—
|
|
$
|
—
|
|
$
|
—
|
|
$
|
98,979
|
|
$
|
277,757
|
|
$
|
20,160
|
|
$
|
396,896
|
|
||||||||||||||
|
Stock-based compensation to directors, employees and other persons for services rendered
|
80,512
|
|
—
|
|
—
|
|
—
|
|
748
|
|
—
|
|
—
|
|
—
|
|
—
|
|
—
|
|
—
|
|
748
|
|
—
|
|
—
|
|
748
|
|
|||||||||||||||||||||||||||
|
Non-controlling interest contributions
|
—
|
|
—
|
|
—
|
|
—
|
|
—
|
|
—
|
|
—
|
|
—
|
|
—
|
|
—
|
|
—
|
|
—
|
|
—
|
|
2,733
|
|
2,733
|
|
|||||||||||||||||||||||||||
|
Class A shares issued and Class B shares redeemed due to TFP unit redemptions
|
21,198,510
|
|
(21,198,510
|
)
|
21
|
|
(21
|
)
|
—
|
|
—
|
|
—
|
|
—
|
|
—
|
|
—
|
|
—
|
|
—
|
|
—
|
|
—
|
|
—
|
|
|||||||||||||||||||||||||||
|
Other comprehensive loss, net of tax
|
—
|
|
—
|
|
—
|
|
—
|
|
—
|
|
(63
|
)
|
—
|
|
—
|
|
—
|
|
—
|
|
—
|
|
(63
|
)
|
(19
|
)
|
—
|
|
(82
|
)
|
|||||||||||||||||||||||||||
|
Non-controlling interest distributions
|
—
|
|
—
|
|
—
|
|
—
|
|
—
|
|
—
|
|
—
|
|
—
|
|
—
|
|
—
|
|
—
|
|
—
|
|
—
|
|
(294
|
)
|
(294
|
)
|
|||||||||||||||||||||||||||
|
Non-controlling interest resulting from acquisitions
|
—
|
|
—
|
|
—
|
|
—
|
|
—
|
|
—
|
|
—
|
|
—
|
|
—
|
|
—
|
|
—
|
|
—
|
|
—
|
|
7,265
|
|
7,265
|
|
|||||||||||||||||||||||||||
|
Shares purchased under stock purchase plan
|
(5,238
|
)
|
—
|
|
—
|
|
—
|
|
(39
|
)
|
—
|
|
—
|
|
—
|
|
—
|
|
—
|
|
—
|
|
(39
|
)
|
—
|
|
—
|
|
(39
|
)
|
|||||||||||||||||||||||||||
|
Net changes in non-controlling interest
|
—
|
|
—
|
|
—
|
|
—
|
|
186,566
|
|
(19
|
)
|
—
|
|
—
|
|
—
|
|
—
|
|
—
|
|
186,547
|
|
(194,384
|
)
|
(2,353
|
)
|
(10,190
|
)
|
|||||||||||||||||||||||||||
|
Net income (loss)
|
—
|
|
—
|
|
—
|
|
—
|
|
—
|
|
—
|
|
(1,710
|
)
|
—
|
|
—
|
|
—
|
|
—
|
|
(1,710
|
)
|
6,790
|
|
(496
|
)
|
4,584
|
|
|||||||||||||||||||||||||||
|
Balance at December 31, 2014
|
31,830,174
|
|
9,770,367
|
|
$
|
32
|
|
$
|
10
|
|
$
|
271,090
|
|
$
|
(49
|
)
|
$
|
13,379
|
|
$
|
—
|
|
$
|
—
|
|
$
|
—
|
|
$
|
—
|
|
$
|
284,462
|
|
$
|
90,144
|
|
$
|
27,015
|
|
$
|
401,621
|
|
||||||||||||||
|
Stock-based compensation to directors, employees and other persons for services rendered
|
299,411
|
|
—
|
|
—
|
|
—
|
|
2,357
|
|
—
|
|
—
|
|
—
|
|
—
|
|
—
|
|
—
|
|
2,357
|
|
—
|
|
—
|
|
2,357
|
|
|||||||||||||||||||||||||||
|
Class A shares issued and Class B shares redeemed due to TFP unit redemptions
|
1,721,338
|
|
(1,721,338
|
)
|
2
|
|
(2
|
)
|
—
|
|
—
|
|
—
|
|
—
|
|
—
|
|
—
|
|
—
|
|
—
|
|
—
|
|
—
|
|
—
|
|
|||||||||||||||||||||||||||
|
Other comprehensive loss, net of tax
|
—
|
|
—
|
|
—
|
|
—
|
|
—
|
|
(50
|
)
|
—
|
|
—
|
|
—
|
|
—
|
|
—
|
|
(50
|
)
|
(12
|
)
|
—
|
|
(62
|
)
|
|||||||||||||||||||||||||||
|
Non-controlling interest contributions
|
—
|
|
—
|
|
—
|
|
—
|
|
—
|
|
—
|
|
—
|
|
—
|
|
—
|
|
—
|
|
—
|
|
—
|
|
—
|
|
302
|
|
302
|
|
|||||||||||||||||||||||||||
|
Non-controlling interest distributions
|
—
|
|
—
|
|
—
|
|
—
|
|
—
|
|
—
|
|
—
|
|
—
|
|
—
|
|
—
|
|
—
|
|
—
|
|
(934
|
)
|
(730
|
)
|
(1,664
|
)
|
|||||||||||||||||||||||||||
|
Non-controlling interest tax distributions
|
—
|
|
—
|
|
—
|
|
—
|
|
—
|
|
—
|
|
—
|
|
—
|
|
—
|
|
—
|
|
—
|
|
—
|
|
(5,313
|
)
|
—
|
|
(5,313
|
)
|
|||||||||||||||||||||||||||
|
Purchase of majority ownership of subsidiary
|
1,625,000
|
|
—
|
|
2
|
|
—
|
|
11,958
|
|
—
|
|
—
|
|
—
|
|
—
|
|
—
|
|
—
|
|
11,960
|
|
—
|
|
1,861
|
|
13,821
|
|
|||||||||||||||||||||||||||
|
Shares purchased under stock purchase plan
|
(576,090
|
)
|
—
|
|
(1
|
)
|
—
|
|
(3,981
|
)
|
—
|
|
—
|
|
—
|
|
—
|
|
—
|
|
—
|
|
(3,982
|
)
|
—
|
|
—
|
|
(3,982
|
)
|
|||||||||||||||||||||||||||
F- 7
TIPTREE INC. AND SUBSIDIARIES
Consolidated Statements of Changes in Stockholders’ Equity
(in thousands, except shares)
|
Number of Shares
|
Par Value
|
Additional paid in capital
|
Accumulated
other comprehensive income (loss) |
Retained
earnings |
Common Stock held by subsidiaries
|
Total stockholders’ equity to Tiptree Inc.
|
Non-controlling
interests - Tiptree Financial Partners, L.P. |
Non-controlling
interests - Other |
Total stockholders' equity
|
||||||||||||||||||||||||||||||||||||||||||||||||
|
Class A
|
Class B
|
Class A
|
Class B
|
Class A Shares
|
Class A Amount
|
Class B Shares
|
Class B Amount
|
||||||||||||||||||||||||||||||||||||||||||||||||||
|
Reduction in non-controlling interest due to PFG disposition
|
—
|
|
—
|
|
—
|
|
—
|
|
—
|
|
—
|
|
—
|
|
—
|
|
—
|
|
—
|
|
—
|
|
—
|
|
—
|
|
(7,765
|
)
|
(7,765
|
)
|
|||||||||||||||||||||||||||
|
Net changes in non-controlling interest
|
—
|
|
—
|
|
—
|
|
—
|
|
15,639
|
|
(12
|
)
|
—
|
|
—
|
|
—
|
|
—
|
|
—
|
|
15,627
|
|
(17,237
|
)
|
(5,500
|
)
|
(7,110
|
)
|
|||||||||||||||||||||||||||
|
Dividends declared
|
—
|
|
—
|
|
—
|
|
—
|
|
—
|
|
—
|
|
(3,313
|
)
|
—
|
|
—
|
|
—
|
|
—
|
|
(3,313
|
)
|
—
|
|
—
|
|
(3,313
|
)
|
|||||||||||||||||||||||||||
|
Net income
|
—
|
|
—
|
|
—
|
|
—
|
|
—
|
|
—
|
|
5,779
|
|
—
|
|
—
|
|
—
|
|
—
|
|
5,779
|
|
2,630
|
|
393
|
|
8,802
|
|
|||||||||||||||||||||||||||
|
Balance at December 31, 2015
|
34,899,833
|
|
8,049,029
|
|
$
|
35
|
|
$
|
8
|
|
$
|
297,063
|
|
$
|
(111
|
)
|
$
|
15,845
|
|
—
|
|
$
|
—
|
|
—
|
|
$
|
—
|
|
$
|
312,840
|
|
$
|
69,278
|
|
$
|
15,576
|
|
$
|
397,694
|
|
||||||||||||||||
|
Stock-based compensation to directors and employees
|
197,296
|
|
—
|
|
—
|
|
—
|
|
2,102
|
|
—
|
|
—
|
|
—
|
|
—
|
|
—
|
|
—
|
|
2,102
|
|
—
|
|
—
|
|
2,102
|
|
|||||||||||||||||||||||||||
|
Shares issued to settle contingent consideration
|
101,845
|
|
—
|
|
—
|
|
—
|
|
550
|
|
—
|
|
—
|
|
—
|
|
—
|
|
—
|
|
—
|
|
550
|
|
—
|
|
—
|
|
550
|
|
|||||||||||||||||||||||||||
|
Other comprehensive income, net of tax
|
—
|
|
—
|
|
—
|
|
—
|
|
—
|
|
666
|
|
—
|
|
—
|
|
—
|
|
—
|
|
—
|
|
666
|
|
128
|
|
376
|
|
1,170
|
|
|||||||||||||||||||||||||||
|
Non-controlling interest contributions
|
—
|
|
—
|
|
—
|
|
—
|
|
—
|
|
—
|
|
—
|
|
—
|
|
—
|
|
—
|
|
—
|
|
—
|
|
—
|
|
6,452
|
|
6,452
|
|
|||||||||||||||||||||||||||
|
Non-controlling interest distributions
|
—
|
|
—
|
|
—
|
|
—
|
|
—
|
|
—
|
|
—
|
|
—
|
|
—
|
|
—
|
|
—
|
|
—
|
|
(803
|
)
|
(2,195
|
)
|
(2,998
|
)
|
|||||||||||||||||||||||||||
|
Shares purchased under stock purchase plan
|
(215,358
|
)
|
—
|
|
—
|
|
—
|
|
(1,230
|
)
|
—
|
|
—
|
|
—
|
|
—
|
|
—
|
|
—
|
|
(1,230
|
)
|
—
|
|
—
|
|
(1,230
|
)
|
|||||||||||||||||||||||||||
|
Shares acquired by subsidiaries
|
—
|
|
—
|
|
—
|
|
—
|
|
—
|
|
—
|
|
—
|
|
(6,596,000
|
)
|
(42,524
|
)
|
(8,049,029
|
)
|
(8
|
)
|
(42,532
|
)
|
—
|
|
—
|
|
(42,532
|
)
|
|||||||||||||||||||||||||||
|
Net changes in non-controlling interest
|
—
|
|
—
|
|
—
|
|
—
|
|
(1,094
|
)
|
—
|
|
—
|
|
—
|
|
—
|
|
—
|
|
—
|
|
(1,094
|
)
|
1,042
|
|
(159
|
)
|
(211
|
)
|
|||||||||||||||||||||||||||
|
Dividends declared
|
—
|
|
—
|
|
—
|
|
—
|
|
—
|
|
—
|
|
(3,191
|
)
|
—
|
|
—
|
|
—
|
|
—
|
|
(3,191
|
)
|
—
|
|
—
|
|
(3,191
|
)
|
|||||||||||||||||||||||||||
|
Net income
|
—
|
|
—
|
|
—
|
|
—
|
|
—
|
|
—
|
|
25,320
|
|
—
|
|
—
|
|
—
|
|
—
|
|
25,320
|
|
6,432
|
|
586
|
|
32,338
|
|
|||||||||||||||||||||||||||
|
Balance at December 31, 2016
|
34,983,616
|
|
8,049,029
|
|
$
|
35
|
|
$
|
8
|
|
$
|
297,391
|
|
$
|
555
|
|
$
|
37,974
|
|
(6,596,000
|
)
|
$
|
(42,524
|
)
|
(8,049,029
|
)
|
$
|
(8
|
)
|
|
$
|
293,431
|
|
|
$
|
76,077
|
|
|
$
|
20,636
|
|
|
$
|
390,144
|
|
||||||||||||
See accompanying notes to consolidated financial statements.
F- 8
TIPTREE INC. AND SUBSIDIARIES
Consolidated Statements of Cash Flows
(in thousands)
|
Year ended December 31,
|
|||||||||||
|
2016
|
2015
|
2014
|
|||||||||
|
Operating Activities:
|
|||||||||||
|
Net income (loss) available to common stockholders
|
$
|
25,320
|
|
$
|
5,779
|
|
$
|
(1,710
|
)
|
||
|
Net income (loss) attributable to non-controlling interests - Tiptree Financial Partners, L.P.
|
6,432
|
|
2,630
|
|
6,790
|
|
|||||
|
Net income (loss) attributable to non-controlling interests - Other
|
586
|
|
393
|
|
(496
|
)
|
|||||
|
Net income (loss)
|
32,338
|
|
8,802
|
|
4,584
|
|
|||||
|
Discontinued operations, net
|
—
|
|
(22,618
|
)
|
(7,937
|
)
|
|||||
|
Adjustments to reconcile net income to net cash provided by (used in) operating activities from continuing operations:
|
|||||||||||
|
Net realized and unrealized (gains) losses
|
(87,300
|
)
|
(31,275
|
)
|
(14,509
|
)
|
|||||
|
Net unrealized loss (gain) on interest rate swaps
|
22
|
|
—
|
|
—
|
|
|||||
|
Realized (gain) on cash flow hedge
|
—
|
|
(852
|
)
|
—
|
|
|||||
|
Change in fair value of contingent consideration
|
(313
|
)
|
(2,503
|
)
|
—
|
|
|||||
|
Impairment of goodwill
|
—
|
|
699
|
|
—
|
|
|||||
|
Non cash compensation expense
|
2,584
|
|
423
|
|
748
|
|
|||||
|
Amortization/accretion of premiums and discounts
|
1,386
|
|
2,596
|
|
345
|
|
|||||
|
Depreciation and amortization expense
|
28,543
|
|
45,124
|
|
11,945
|
|
|||||
|
Provision for doubtful accounts
|
1,719
|
|
933
|
|
459
|
|
|||||
|
Amortization of deferred financing costs
|
2,037
|
|
1,441
|
|
702
|
|
|||||
|
Deferred tax expense (benefit)
|
6,447
|
|
(19,553
|
)
|
(249
|
)
|
|||||
|
Changes in operating assets and liabilities:
|
|||||||||||
|
Mortgage loans originated for sale
|
(1,767,622
|
)
|
(1,137,623
|
)
|
(446,048
|
)
|
|||||
|
Proceeds from the sale of mortgage loans originated for sale
|
1,833,273
|
|
1,139,333
|
|
446,802
|
|
|||||
|
(Increase) decrease in notes and accounts receivable
|
(13,692
|
)
|
(33,500
|
)
|
3,708
|
|
|||||
|
(Increase) decrease in reinsurance receivables
|
(35,185
|
)
|
(88,150
|
)
|
(6,597
|
)
|
|||||
|
(Increase) decrease in deferred acquisition costs
|
(3,540
|
)
|
(49,242
|
)
|
(8,616
|
)
|
|||||
|
(Increase) decrease in other assets
|
(253
|
)
|
(7,427
|
)
|
4,384
|
|
|||||
|
Increase (decrease) in unearned premiums
|
25,261
|
|
89,873
|
|
9,797
|
|
|||||
|
Increase (decrease) in policy liabilities and unpaid claims
|
22,728
|
|
17,298
|
|
(70
|
)
|
|||||
|
Increase (decrease) in deferred revenue
|
(7,182
|
)
|
17,099
|
|
6,261
|
|
|||||
|
Increase (decrease) in reinsurance payable
|
4,748
|
|
46,123
|
|
(1,363
|
)
|
|||||
|
Increase (decrease) in other liabilities and accrued expenses
|
(725
|
)
|
(5,266
|
)
|
(18,728
|
)
|
|||||
|
Operating activities from consolidated CLOs
|
(8,631
|
)
|
25,008
|
|
21,986
|
|
|||||
|
Net cash provided by (used in) operating activities - continuing operations
|
36,643
|
|
(3,257
|
)
|
7,604
|
|
|||||
|
Net cash provided by (used in) operating activities - discontinued operations
|
—
|
|
(6,198
|
)
|
16,045
|
|
|||||
|
Net cash provided by (used in) operating activities
|
36,643
|
|
(9,455
|
)
|
23,649
|
|
|||||
|
Investing Activities:
|
|||||||||||
|
Purchases of investments
|
(269,894
|
)
|
(379,163
|
)
|
(426,011
|
)
|
|||||
|
Proceeds from sales and maturities of investments
|
205,141
|
|
82,952
|
|
594,870
|
|
|||||
|
(Increase) decrease in loans owned, at amortized cost, net
|
(62,024
|
)
|
(16,710
|
)
|
(18,351
|
)
|
|||||
|
Purchases of real estate capital expenditures
|
(5,679
|
)
|
(2,165
|
)
|
(739
|
)
|
|||||
|
Proceeds from the sale of real estate
|
5,376
|
|
92
|
|
—
|
|
|||||
|
Purchases of corporate fixed assets
|
(1,480
|
)
|
(3,497
|
)
|
(245
|
)
|
|||||
|
Proceeds from the sale of subsidiaries
|
—
|
|
142,837
|
|
—
|
|
|||||
|
Proceeds from notes receivable
|
36,891
|
|
31,979
|
|
2,986
|
|
|||||
|
Issuance of notes receivable
|
(44,860
|
)
|
(32,645
|
)
|
(2,816
|
)
|
|||||
|
Proceeds from loan repayments
|
—
|
|
—
|
|
30,040
|
|
|||||
|
(Increase) decrease in restricted cash
|
(5,694
|
)
|
(11,047
|
)
|
5,041
|
|
|||||
|
Deposits returned for future real estate acquisitions
|
—
|
|
(125
|
)
|
(2,077
|
)
|
|||||
|
Business and asset acquisitions, net of cash and deposits
|
(102,268
|
)
|
(78,057
|
)
|
(205,102
|
)
|
|||||
|
Distributions from equity method investments
|
—
|
|
2,275
|
|
7,208
|
|
|||||
|
Investing activities from consolidated CLOs
|
(75,494
|
)
|
33,613
|
|
(551,526
|
)
|
|||||
|
Net cash provided by (used in) investing activities - continuing operations
|
(319,985
|
)
|
(229,661
|
)
|
(566,722
|
)
|
|||||
|
Net cash provided by (used in) investing activities from discontinued operations
|
—
|
|
11,866
|
|
(2,967
|
)
|
|||||
|
Net cash provided by (used in) investing activities
|
(319,985
|
)
|
(217,795
|
)
|
(569,689
|
)
|
|||||
F- 9
TIPTREE INC. AND SUBSIDIARIES
Consolidated Statements of Cash Flows (continued)
(in thousands)
|
Year ended December 31,
|
|||||||||||
|
2016
|
2015
|
2014
|
|||||||||
|
Financing Activities:
|
|||||||||||
|
Dividends paid
|
(3,191
|
)
|
(3,313
|
)
|
—
|
|
|||||
|
Non-controlling interest contributions
|
3,339
|
|
2,163
|
|
2,733
|
|
|||||
|
Non-controlling interest distributions
|
(2,998
|
)
|
(6,977
|
)
|
(294
|
)
|
|||||
|
Change in non-controlling interest
|
—
|
|
(2,953
|
)
|
(5,499
|
)
|
|||||
|
Payment of debt issuance costs
|
(3,830
|
)
|
(1,865
|
)
|
(775
|
)
|
|||||
|
Proceeds from borrowings and mortgage notes payable
|
2,085,142
|
|
1,442,756
|
|
828,471
|
|
|||||
|
Principal paydowns of borrowings and mortgage notes payable
|
(1,957,183
|
)
|
(1,185,739
|
)
|
(807,897
|
)
|
|||||
|
Repurchases of common stock
|
(43,754
|
)
|
(3,982
|
)
|
(39
|
)
|
|||||
|
Financing activities from consolidated CLOs
|
199,427
|
|
8,573
|
|
497,798
|
|
|||||
|
Net cash provided by (used in) financing activities - continuing operations
|
276,952
|
|
248,663
|
|
514,498
|
|
|||||
|
Net cash provided by (used in) financing activities - discontinued operations
|
—
|
|
(5,000
|
)
|
(7,667
|
)
|
|||||
|
Net cash provided by (used in) financing activities
|
276,952
|
|
243,663
|
|
506,831
|
|
|||||
|
Net increase (decrease) in cash and cash equivalents
|
(6,390
|
)
|
16,413
|
|
(39,209
|
)
|
|||||
|
Cash and cash equivalents – beginning of period - continuing operations
|
69,400
|
|
52,987
|
|
97,645
|
|
|||||
|
Cash and cash equivalents – beginning of period - discontinued operations
|
—
|
|
—
|
|
22,912
|
|
|||||
|
Cash and cash equivalents – end of period
|
63,010
|
|
69,400
|
|
81,348
|
|
|||||
|
Less: Reclassification of cash to assets held for sale
|
—
|
|
—
|
|
28,361
|
|
|||||
|
Cash and cash equivalents of continuing operations – end of period
|
$
|
63,010
|
|
$
|
69,400
|
|
$
|
52,987
|
|
||
|
Supplemental Disclosure of Cash Flow Information:
|
|||||||||||
|
Cash paid during the period for interest expense
|
$
|
27,164
|
|
$
|
49,875
|
|
$
|
65,104
|
|
||
|
Cash paid during the period for income taxes
|
$
|
6,176
|
|
$
|
36,701
|
|
$
|
5,167
|
|
||
|
Supplemental Schedule of Non-Cash Investing and Financing Activities:
|
|||||||||||
|
Fair value of debt assumed
|
$
|
—
|
|
$
|
52,836
|
|
$
|
72,771
|
|
||
|
Re-issuance of notes payable to third party upon deconsolidation of CLOs
|
$
|
—
|
|
$
|
39,728
|
|
$
|
5,248
|
|
||
|
Recognized contingent consideration at fair value
|
$
|
—
|
|
|
$
|
2,200
|
|
$
|
—
|
|
|
|
Issuance of Common Stock
|
$
|
—
|
|
$
|
11,960
|
|
$
|
—
|
|
||
|
Acquired real estate properties through, or in lieu of, foreclosure of the related loan
|
$
|
15,214
|
|
$
|
2,289
|
|
$
|
—
|
|
||
See accompanying notes to consolidated financial statements.
F- 10
TIPTREE INC. AND SUBSIDIARIES
Notes to Consolidated Financial Statements
December 31, 2016
(in thousands, except share data)
(1) Organization
Tiptree Inc. (formally known as Tiptree Financial Inc., together with its consolidated subsidiaries, collectively, Tiptree or the Company, or we) is a Maryland Corporation that was incorporated on March 19, 2007. Tiptree is a diversified holding company with
four
reporting segments: specialty insurance, asset management, senior living and specialty finance. Tiptree’s Class A common stock is traded on the NASDAQ Capital Market under the symbol “TIPT”. Tiptree’s primary asset is its ownership of Tiptree Financial Partners, L.P. (TFP) an intermediate holding company through which Tiptree operates its businesses. Tiptree reports a non-controlling interest representing the economic interest in TFP held by other limited partners of TFP.
As of January 1, 2016, Tiptree directly owned approximately
81%
of TFP. The remaining
19%
is reported as non-controlling interest. All of Tiptree’s Class B common stock is owned by TFP and is accounted for as treasury stock. Tiptree’s Class B common stock has voting but no economic rights. The limited partners of TFP (other than Tiptree itself) have the ability to exchange TFP partnership units for Tiptree Class A common stock at a rate of
2.798
shares of Class A common stock per partnership unit equal to the number of shares of Class B common stock outstanding. For every share of Class A common stock exchanged in this manner, a share of Class B common stock is canceled. The percentage of TFP owned by Tiptree may increase in the future to the extent TFP’s limited partners exchange their limited partnership units of TFP for Class A common stock of Tiptree. Changes in Tiptree’s ownership of TFP will be accounted for as equity transactions, which increase Tiptree’s ownership of TFP and reduce non-controlling interest in TFP without changing total stockholders’ equity of Tiptree.
(2) Summary of Significant Accounting Policies
Basis of Presentation and Principles of Consolidation
The accompanying consolidated financial statements have been prepared in accordance with generally accepted accounting principles in the United States of America (GAAP) and include the accounts of the Company and its controlled subsidiaries.
Tiptree consolidates those entities in which it has an investment of 50% or more of voting rights or has control over significant operating, financial and investing decisions of the entity as well as variable interest entities (VIEs) in which Tiptree is determined to be the primary beneficiary. VIEs are defined as entities in which equity investors do not have the characteristics of a controlling financial interest or do not have sufficient equity risk for the entity to finance its activities without additional subordinated financial support from other parties.
A VIE is required to be consolidated only by its primary beneficiary, which is defined as the party who has the power to direct the activities of a VIE that most significantly impact its economic performance and who has the obligation to absorb losses or the right to receive benefits from the VIE that could potentially be significant to the VIE. Generally, Tiptree’s consolidated VIEs are entities which Tiptree is considered the primary beneficiary through its controlling financial interest.
Non-controlling interests on the Consolidated Statements of Operations represent the ownership interests in certain consolidated subsidiaries held by entities or persons other than Tiptree. Accounts and transactions between consolidated entities have been eliminated.
The Company’s Consolidated Statements of Cash Flows for the year ended December 31, 2015 has been revised for immaterial corrections and errors related to the presentation of our activities from Discontinued Operations and business acquisitions. These corrections resulted in an overall decrease in cash provided by operating activities of approximately
$4,500
, a net increase in cash used by investing activities of approximately
$1,400
, which consists of an increase in cash used by of approximately
$9,200
in continuing operations and an adjustment of approximately
$7,800
to reflect cash of a disposed business, and an increase in cash provided by financing activities of approximately
$5,900
. Such changes had no impact on the ending cash balance as of December 31, 2015.
As a result of changes in presentation, certain prior year amounts have been reclassified to conform to the current presentation. These reclassifications had no effect on the reported results of operations. The primary difference in the presentation of the Consolidated Financial Statements from the prior year is the aggregation of investments on the Consolidated Balance Sheets and the summation of the net investment income of our specialty insurance business in the Consolidated Statements of Operations. In addition certain immaterial balances have been combined.
F- 11
TIPTREE INC. AND SUBSIDIARIES
Notes to Consolidated Financial Statements
December 31, 2016
(in thousands, except share data)
Use of Estimates
The preparation of consolidated financial statements in conformity with GAAP requires management to make estimates and assumptions that affect the amounts reported in the Company’s consolidated financial statements and accompanying notes. Management makes estimates and assumptions that include but are not limited to the determination of the following significant items:
|
•
|
Fair value of financial assets and liabilities, including, but not limited to, securities, loans and derivatives
|
|
•
|
Value of acquired assets and liabilities
|
|
•
|
Carrying value of goodwill and other intangibles, including estimated amortization period and useful lives
|
|
•
|
Reserves for unpaid losses and loss adjustment expenses, estimated future claims and losses, potential litigation and other claims
|
|
•
|
Valuation of contingent share issuances for compensation and purchase consideration, including estimates of number of shares and vesting schedules
|
|
•
|
Revenue recognition including, but not limited to, the timing and amount of insurance premiums, service, administration fees, and loan origination fees and
|
|
•
|
Other matters that affect the reported amounts and disclosure of contingencies in the consolidated financial statements
|
Although these and other estimates and assumptions are based on the best available estimates, actual results could differ materially from management’s estimates.
Business Acquisition Accounting
The Company accounts for business combinations by applying the acquisition method of accounting. The acquisition method requires, among other things, that the assets acquired and liabilities assumed in a business combination be measured at fair value as of the closing date of the acquisition. The net assets acquired may consist of tangible and intangible assets and the excess of purchase price over the fair value of identifiable net assets acquired, or goodwill. The determination of estimated useful lives and the allocation of the purchase price to the intangible assets requires significant judgment and affects the amount of future amortization and possible impairment charges. Contingent consideration, if any, is measured at fair value on the date of acquisition. The fair value of any contingent consideration liability is remeasured at each reporting date with any change recorded in other income in the Consolidated Statements of Operations. Acquisition and transaction costs are related primarily to completed and potential business combinations and include advisory, legal, accounting, valuation and other professional or consulting fees which are expensed as incurred.
In certain instances, the Company may acquire less than 100% ownership of an entity, resulting in the recording of a non-controlling interest. The measurement of assets and liabilities acquired and non-controlling interest is initially established at a preliminary estimate of fair value, which may be adjusted during the measurement period based upon the results of a valuation study applicable to the business combination.
Acquisitions that do not meet the criteria for the acquisition method of accounting are accounted for as acquisitions of assets.
Discontinued Operations
The results of operations of a
business that has either been disposed of or are classified as held-for-sale are reported in discontinued operations if the disposal of the business represents a strategic shift that has (or will have) a major effect on an entity’s operations and financial results
.
For such businesses that have been disposed of prior to December 15, 2014, the Company presents the operations of the business as discontinued operations, and retrospectively reclassifies operating results for all prior periods presented. The Company carries assets and liabilities held for sale at the lower of carrying value on the date the asset is initially classified as held for sale or fair value less costs to sell. At the time of reclassification to held for sale, the Company ceases the recording of depreciation on assets transferred.
Fair Value Measurement
Fair value is defined as the price that would be received to sell an asset or paid to transfer a liability in an orderly transaction between market participants at the measurement date.
F- 12
TIPTREE INC. AND SUBSIDIARIES
Notes to Consolidated Financial Statements
December 31, 2016
(in thousands, except share data)
The valuation hierarchy is based upon the transparency of inputs to the valuation of an asset or liability as of the measurement date. The three levels, from highest to lowest, are defined as follows:
•
Level 1 – Unadjusted, quoted prices in active markets for identical assets or liabilities that the Company has the ability to access at the measurement date.
•
Level 2 – Significant inputs other than quoted prices that are observable for the asset or liability, either directly or indirectly through corroboration with observable market data. Level 2 inputs include quoted prices for similar instruments in active markets, and inputs other than quoted prices that are observable for the asset or liability. The types of financial assets and liabilities carried at level 2 are valued based on one or more of the following:
a)
Quoted prices for similar assets or liabilities in active markets;
b)
Quoted prices for identical or similar assets or liabilities in nonactive markets;
c)
Pricing models whose inputs are observable for substantially the full term of the asset or liability; and
d)
Pricing models whose inputs are derived principally from or corroborated by observable market data through correlation or other means for substantially the full term of the asset or liability.
•
Level 3 – Significant inputs that are unobservable inputs for the asset or liability, including the Company’s own data and assumptions that are used in pricing the asset or liability.
Fair Value Option
In addition to the financial instruments the Company is required to measure at fair value, the Company has elected to make an irrevocable election to utilize fair value as the initial and subsequent measurement attribute for certain eligible financial assets and liabilities. Unrealized gains and losses on items for which the fair value option has been elected are reported in Net realized and unrealized gains (losses) within the Consolidated Statements of Operations. The decision to elect the fair value option is determined on an instrument-by-instrument basis and must be applied to an entire instrument and is irrevocable once elected. Assets and liabilities measured at fair value pursuant to this guidance are reported separately in our Consolidated Balance Sheets from those instruments using another accounting method.
Derivative Financial Instruments and Hedging
Derivative instruments are used in the overall strategy to manage exposure to market risks primarily related to fluctuations in interest rates. As a matter of policy, derivatives are not used for speculative purposes. Derivative instruments are measured at fair value on a recurring basis and are included in other investments or other liabilities and accrued expenses in the Consolidated Balance Sheets.
Derivative Instruments Designated as Cash Flow Hedging Instruments
The Company uses cash flow hedges to reduce the exposure to variability of cash flows from floating rate borrowings. If a derivative instrument meets certain cash flow hedge accounting criteria, it is recorded on the consolidated balance sheet at its fair value, as either an asset or a liability, with offsetting changes in fair value recognized in accumulated other comprehensive income (AOCI). The effective portion of the changes in fair value of derivatives are reported in AOCI and amounts previously recorded in AOCI are recognized in earnings in the period in which the hedged transaction affects earnings. Any ineffective portions of the change in fair value of the derivative are recognized in current earnings.
Stock Based Compensation
The Company accounts for equity‑based compensation issued to employees, directors, and affiliates of the Company using the current fair value based methodology.
The Company initially measures the cost of restricted stock unit and restricted stock awards at fair value on the date of grant and subsequently recognizes the cost of such awards over the vesting period using the straight-line method. The compensation costs are charged to expense over the vesting period with a corresponding credit to additional paid-in capital.
F- 13
TIPTREE INC. AND SUBSIDIARIES
Notes to Consolidated Financial Statements
December 31, 2016
(in thousands, except share data)
Compensation cost is recognized for stock options issued to employees, based on the fair value of these awards at the date of grant. Compensation cost is recognized over the required service period, generally defined as the vesting period.
Grants of subsidiary RSUs exchangeable into Class A common Stock of the Company are accounted for as liabilities based upon their expected settlement method. Changes in fair value of the awards are recognized in earnings for the relative amount of cumulative compensation cost. The Company uses the straight-line method to recognize compensation expense for the time vesting RSUs over the requisite service periods, beginning on the grant date. The Company uses the graded-vesting method to recognize compensation expense for the performance vesting RSUs. Changes in fair value of shares underlying liability awards are recognized in earnings to the extent of the accumulated amortization. Compensation expense will be recognized to the extent that it is probable that the performance condition will be achieved. The Company reassesses the probability of satisfaction of the performance condition for the performance vesting RSUs for each reporting period.
Income Taxes
Deferred tax assets and liabilities are determined using the asset and liability method. Under this method, deferred tax assets and liabilities are established for future tax consequences of temporary differences between the financial statement carrying amounts of assets and liabilities and their tax basis. Deferred tax assets and liabilities are measured using enacted tax rates expected to apply to taxable income in the year in which those temporary differences are expected to reverse. A valuation allowance is established when necessary to reduce a deferred tax asset to the amount expected to be realized. Several of the Company’s subsidiaries, file both federal and state tax returns on a standalone basis. These U.S. federal and state income tax returns, when filed, will be subject to examination by the Internal Revenue Service and state departments of revenue. See Note —
(22) Income Taxes
.
The Company evaluates tax positions taken or expected to be taken in the course of preparing its tax returns to determine whether the tax positions are “more likely than not” of being sustained by the applicable tax authority. The Company’s tax benefit or tax expense is adjusted accordingly for tax positions not deemed to meet the more likely than not threshold. The Company’s policy is to account for interest as a component of interest expense and penalties as a component of other expense.
Earnings Per Share
The Company presents both basic and diluted earnings per Class A common share in its consolidated financial statements and footnotes thereto. Basic earnings per Class A common share (Basic EPS) excludes dilution and is computed by dividing net income or loss available to common stock holders by the weighted average number of common shares outstanding, including vested restricted share units, for the period. Diluted earnings per Class A common share (Diluted EPS) reflects the potential dilution that could occur if securities or other contracts to issue common shares were exercised or converted into common shares where such exercise or conversion would result in a lower earnings per share amount.
The Company calculates EPS using the two-class method, which is an earnings allocation formula that determines EPS for common shares and participating securities. Unvested restricted share units contain non-forfeitable rights to distributions or distribution equivalents (whether paid or unpaid) and are participating securities that are included in the computation of EPS using the two-class method. Accordingly, all earnings (distributed and undistributed) are allocated to common shares and participating securities based on their respective rights to receive distributions. The participating securities do not have a contractual obligation to absorb losses and are only allocated in periods where there is income from continuing operations.
See Note—
(24) Earnings Per Share
, for EPS computations.
Investments
The Company records all investment transactions on a trade‑date basis. Realized gains (losses) are determined using the specific-identification method. The Company classifies its investments as trading, available-for-sale, or held-to-maturity based on the Company’s intent to sell the security or, for a debt security, the Company’s intent and ability to hold the debt security to maturity. The Company did not have any held-to-maturity securities at
December 31, 2016
and
2015
.
Available for Sale Securities, at Fair Value (AFS)
AFS are securities that are not classified as trading or held-to-maturity and are intended to be held for indefinite periods of time.
F- 14
TIPTREE INC. AND SUBSIDIARIES
Notes to Consolidated Financial Statements
December 31, 2016
(in thousands, except share data)
AFS securities include those debt and equity securities that management may sell as part of its asset/liability management strategy or in response to changes in interest rates, resultant prepayment risk or other factors. AFS securities are held at fair value on the Consolidated Balance Sheet with changes in fair value, net of related tax effects, recorded in the accumulated other comprehensive income (AOCI) component of stockholders’ equity in the period of change. Upon the disposition of an AFS security, the Company reclassifies the gain or loss on the security from accumulated other comprehensive income (loss) to net realized and unrealized gains (losses) on the Consolidated Statements of Operations.
The Company regularly reviews AFS securities, held-to-maturity and cost investments with unrealized losses in order to evaluate whether the impairment is other-than-temporary. Under the guidance for debt securities, other-than-temporary impairment (OTTI) is recognized in earnings in the Consolidated Statements of Operations for debt securities that the Company has an intent to sell or that it believes it is more likely than not that it will be required to sell prior to recovery of the amortized cost basis. For those securities that the Company does not intend to sell nor expect to be required to sell, credit-related impairment is recognized in earnings, with the non-credit-related impairment recorded in accumulated other comprehensive income (AOCI). An unrealized loss exists when the current fair value of an individual security is less than its amortized cost basis. Unrealized losses that are determined to be temporary in nature are recorded, net of tax, in AOCI for AFS securities.
Management’s estimate of OTTI includes, among other things: (i) the duration of time and the relative magnitude to which fair value of the security has been below cost; (ii) the financial condition and near‑term prospects of the issuer of the investment; (iii) extraordinary events, including negative news releases and rating agency downgrades, with respect to the issuer of the investment; (iv) the Company’s ability and intent to hold an equity security for a period of time sufficient to allow for any anticipated recovery; (v) whether it is more likely than not that the Company will sell a security before recovery of its amortized cost basis; (vi) whether a debt security exhibits cash flow deterioration; and (vii) whether the security’s decline is attributable to specific conditions, such as conditions in an industry or in a geographic location.
Loans, at Fair Value
Loans, at fair value is substantially comprised of (i) non-performing residential loans (NPLs), (ii) middle market leveraged loans held by the Company and (iii) loans originated by the Company’s mortgage finance business. Changes in their fair value are reported within net realized and unrealized gains (losses) in our Consolidated Statements of Operations. In addition, substantially all investments within assets of consolidated CLOs consist of loans at fair value.
Corporate Loans
Corporate loans are comprised of diversified portfolio of middle market leveraged loans which are carried at fair value. In general, the fair value of leveraged loans are obtained from an independent pricing service which provides coverage of secondary market participants. The values represent a composite of mark-to-market bid/offer prices. In certain circumstances the Company will make its own determination of fair value of leveraged loans based on internal models and other unobservable inputs.
Mortgage Loans Held for Sale
Mortgage loans held for sale represent loans originated and held until sold to secondary market investors. Such loans are typically warehoused for a period after origination or purchase before sale into the secondary market. Servicing rights are generally released upon sale of mortgage loans in the secondary market. The Company has elected to measure all mortgage loans held for sale at fair value. These loans are considered sold when the Company surrenders control to the purchaser. The gains or losses on sales of such loans, net of any accrual for standard representations and warranties, are reported in operating results as a component of net realized and unrealized gains (losses) in the Consolidated Statement of Operations in the period when the sale occurs.
Non-Performing Loans (NPLs)
The Company has purchased portfolios of NPLs which consist of residential mortgage loans. Such loans are carried at fair value, which is measured on an individual loan basis. We seek to either (i) convert such loans into real estate owned property (REO) through foreclosure or another resolution process that can then be sold, or (ii) modify and resell them at higher prices if circumstances warrant.
F- 15
TIPTREE INC. AND SUBSIDIARIES
Notes to Consolidated Financial Statements
December 31, 2016
(in thousands, except share data)
The Company has elected the fair value option for NPLs as we have concluded that fair value timely reflects the results of our investment performance. As substantially all of our loans were non-performing when acquired, we generally look to the estimated fair value of the underlying property collateral to assess the recoverability of our investments. We primarily utilize the local broker price opinion (BPO) but also consider any other comparable home sales or other market data, as considered necessary, in estimating a property’s fair value. For further discussion on the observable and unobservable inputs to the model and determination of fair value of NPLs, see Note—
(7) Fair Value of Financial Instruments
.
Certain non-performing loans are loans that are delinquent on obligated payments of principal and interest. Certain other non-performing loans are making some payments, generally as a result of a modification or a workout plan.
The fair value of NPLs are determined using a discounted cash flow model. As such, both the changes in fair value and the net periodic cash flows related to NPLs are recorded in net realized and unrealized gains (losses) in the consolidated statement of operations.
Loans, at Amortized Cost, Net
Certain loans originated by the Company’s commercial lending business within its specialty finance business are asset backed loans held for investment and are carried at amortized cost. The Company periodically reviews these loans for impairment. Impairment losses are taken for impaired loans based on the fair value of collateral on an individual loan basis. When it is probable that the Company will be unable to collect all amounts contractually due, the loan would be considered impaired.
An allowance for loan losses is a valuation allowance for probable incurred credit losses. Loan losses are charged against the allowance when the Company believes the uncollectibility of a loan balance is confirmed. Management reviews its methodology for its calculation of its loss provision as deemed necessary which is at least on an annual basis.
Interest income related to loans at amortized cost is generally recognized using the effective interest method or on a basis approximating a level rate of return over the term of the loan. Nonaccrual loans are those on which the accrual of interest has been suspended. Loans are placed on nonaccrual status and considered nonperforming when full payment of principal and interest is in doubt, or when principal or interest is 90 days or more past due and collateral, if any, is insufficient to cover principal and interest. Interest accrued but not collected at the date a loan is placed on nonaccrual status is reversed against interest income. In addition, the amortization of net deferred loan fees is suspended. Interest income on nonaccrual loans may be recognized only to the extent it is received in cash. However, where there is doubt regarding the ultimate collectability of loan principal, cash receipts on such nonaccrual loans are applied to reduce the carrying value of such loans. Nonaccrual loans may be returned to accrual status when repayment is reasonably assured and there has been demonstrated performance under the terms of the loan or, if applicable, the restructured terms of such loan.
The Company defers nonrefundable loan origination and commitment fees collected on originated loans and amortizes the net amount as an adjustment of the interest income over the contractual life of the loan. If a loan is prepaid, the net deferred amount is recognized in loan fee income within the Consolidated Statements of Operations in the period. Loan fee income includes prepayment fees and late charges collected.
Equity Securities, Trading, at Fair Value
Equity securities, trading, at fair value are investments consisting of equity securities that are purchased principally for the purpose of selling them in the near term. Changes in fair value are recorded in net realized and unrealized gains (losses) on investments on the Consolidated Statements of Operations in the period of change.
Real Estate, Net
Investments in real estate, net are carried at cost less accumulated depreciation. Depreciation is calculated on a straight-line basis using estimated useful lives not to exceed
40
years for buildings and
9
years for building improvements and other fixed assets.
Real estate properties are reviewed for impairment whenever events or changes in circumstances indicate that the carrying amount of the assets may not be recoverable. If such reviews indicate that the asset is impaired, the asset’s carrying amount is
F- 16
TIPTREE INC. AND SUBSIDIARIES
Notes to Consolidated Financial Statements
December 31, 2016
(in thousands, except share data)
written down to its fair value. There were no material impairments on the Company’s real estate investments for the years ended December 31, 2016, 2015 and 2014, respectively.
Foreclosed Residential Real Estate Property (REO)
NPLs are reclassified to REO once the Company has obtained legal title to the property upon completion of a foreclosure sale or the borrower has conveyed all interest in the property to satisfy that loan through completion of a deed in lieu of foreclosure. Because the company elected the fair value option for NPLs, upon recognition as REO the property fair value is estimated using market values and, if the property meets held-for-sale criteria, it is initially recorded at fair value less costs to sell as its new cost basis. Subsequently, the property is carried at (i) the fair value of the asset minus the estimated costs to sell the asset or (ii) the initial REO value, whichever is lower. Adjustments to the carrying value of REOs are recorded in net realized and unrealized gains (losses).
Cash and Cash Equivalents
The Company considers all highly liquid investments of sufficient credit quality purchased with an initial maturity of three months or less to be cash equivalents. Cash and cash equivalents consist of U.S. denominated cash on hand, cash held in banks and investments in money market funds.
Restricted Cash
The Company’s restricted cash primarily consists of cash for unremitted premiums received from agents and insurers, fiduciary cash for reinsurers and pledged assets for the protection of policy holders in various state jurisdictions.
Notes and Accounts Receivable, Net
Notes Receivable, Net
The Company’s notes receivable, net includes receivables from its senior living partners and receivables related to the specialty insurance business for its premium financing programs.
The Company accrues interest income on its notes receivable based on the contractual terms of the respective note. The Company monitors all notes receivable for delinquency and provides for estimated losses for specific receivables that are not likely to be collected. In addition to allowances for bad debt for specific notes receivable, a general provision for bad debt is estimated for the Company’s notes receivable based on history. Account balances are generally charged against the allowance when the Company believes it is probable that the note receivable will not be recovered, and has exhausted its contractual and legal remedies.
Generally, receivables overdue more than 120 days are written off when the Company determines it has exhausted reasonable collection efforts and remedies, see Note—
(8) Notes and Accounts Receivable, net
.
Accounts and Premiums Receivable, Net
Accounts and premiums receivable, net are primarily trade receivables from the specialty insurance business that are carried at their approximate fair value. Accounts and premiums receivable from the Company’s specialty insurance business consist primarily of advance commissions and agents' balances in course of collection and billed but not collected policy premiums, presented net of the allowance for doubtful accounts. For policy premiums that have been billed but not collected, the Company records a receivable on its balance sheet for the full amount of the premium billed, with a corresponding liability, net of its commission, to insurance carriers. The Company earns interest on the premium cash during the period of time between receipt of the funds and payment of these funds to insurance carriers. The Company maintains an allowance for doubtful accounts based on an estimate of uncollectible accounts.
Other Receivables
Other receivables primarily represent amounts due to the Company from its business partners for retrospective commissions, net of allowance and for motor club membership fees.
F- 17
TIPTREE INC. AND SUBSIDIARIES
Notes to Consolidated Financial Statements
December 31, 2016
(in thousands, except share data)
Reinsurance Receivables
Through the specialty insurance business, the Company has various reinsurance agreements in place whereby the amount of risk in excess of its retention goals is reinsured by unrelated domestic and foreign insurance companies. The Company is required to pay losses even if a reinsurer fails to meet its obligations under the applicable reinsurance agreement. Reinsurance receivables include amounts related to paid benefits, unpaid benefits and prepaid reinsurance premiums. Reinsurance receivables are based upon estimates and are reported on the Consolidated Balance Sheets separately as assets, as reinsurance does not relieve the Company of its legal liability to policyholders. Management continually monitors the financial condition and agency ratings of the Company’s reinsurers and believes that the reinsurance receivables accrued are collectible. Balances recoverable from reinsurers and amounts ceded to reinsurers relating to the unexpired portion of reinsured policies are presented as assets. Experience refunds from reinsurers are recognized based on the underwriting experience of the underlying contracts.
Deferred Acquisition Costs
The Company defers certain costs of acquiring new and renewal insurance policies and other products within the Company’s specialty insurance business. Amortization of deferred acquisition costs was
$142,337
,
$81,537
and
$1,376
for the years ended
December 31, 2016
,
2015
and 2014, respectively.
Insurance Policy Related
Insurance policy related deferred acquisition costs are limited to direct costs that resulted from successful contract transactions and would not have been incurred by the Company's insurance company subsidiaries had the transactions not occurred. These capitalized costs are amortized as the related premium is earned.
The Company evaluates whether insurance related deferred acquisition costs are recoverable at year-end, and considers investment income in the recoverability analysis. As a result of the Company's evaluations, no write-offs for unrecoverable insurance related deferred acquisition costs were recognized during the years ended
December 31, 2016
,
2015
and 2014, respectively.
Non-insurance Policy Related
Other deferred acquisition costs are limited to prepaid direct costs, typically commissions and contract transaction fees, that resulted from successful contract transactions and would not have been incurred by the Company had the transactions not occurred. These capitalized costs are amortized as the related service and administrative fees are earned.
The Company evaluates whether deferred acquisition costs - non-insurance policy related are recoverable at year-end. As a result of the Company's evaluations, no write-offs for unrecoverable deferred acquisition costs were recognized during the years ended
December 31, 2016
,
2015
and 2014, respectively.
Goodwill and Intangible Assets, Net
The initial measurement of goodwill and intangibles requires judgment concerning estimates of the fair value of the acquired assets and liabilities. Goodwill and indefinite-lived intangible assets are not amortized but subject to tests for impairment annually or if events or circumstances indicate it is more likely than not they may be impaired. Other intangible assets are amortized over their estimated useful lives and are subject to impairment if events or circumstances indicate a possible inability to realize the carrying amount. The Company carries intangible assets, which represent customer and agent relationships, trade names, insurance licenses (certificates of authority granted by individual state departments of insurance), the value of in-force insurance policies acquired, software acquired or internally developed, and leases in-place. Management has deemed the insurance licenses to have indefinite useful life. Costs incurred to renew or maintain insurance licenses are recorded as operating costs in the period in which they arise. See Note —
(10) Goodwill and Intangible Assets, net
.
Other Assets
Other assets consists of prepaid expenses, deposits for future acquisitions, inventory, and furniture, fixtures and equipment, net. See Note—
(15) Other Assets
.
F- 18
TIPTREE INC. AND SUBSIDIARIES
Notes to Consolidated Financial Statements
December 31, 2016
(in thousands, except share data)
Unearned Premiums
Premiums written are earned over the life of the respective policy using the Rule of 78's, pro rata, or other actuarial methods as appropriate for the type of business. Unearned premiums represent the portion of premiums that will be earned in the future. A premium deficiency reserve is recorded if anticipated losses, loss adjustment expenses, deferred acquisition costs and policy maintenance costs exceed the recorded unearned premium reserve and anticipated investment income. As of
December 31, 2016
and
December 31, 2015
, no deficiency reserves were recorded.
Policy Liabilities and Unpaid Claims
Policyholder account balances relate to investment-type individual annuity contracts in the accumulation phase. Policyholder account balances are carried at accumulated account values, which consist of deposits received, plus interest credited, less withdrawals and assessments. Minimum guaranteed interest credited to these contracts ranges from
3.0%
to
4.0%
.
The Company’s claims are generally reported and settled quickly, resulting in consistent historical loss development patterns. The Company’s actuaries apply a variety of generally accepted actuarial methods to the historical loss development patterns, to derive cumulative development factors. These cumulative development factors are applied to reported losses for each accident quarter to compute ultimate losses. The indicated required reserve is the difference between the ultimate losses and the reported losses. The actuarial methods used include but are not limited to the chain ladder method, the Bornhuetter-Ferguson method, and the expected loss ratio method. The actuarial analyses are performed on a basis gross of ceded reinsurance, and the resulting factors and estimates are then used in calculating the net loss reserves which take into account the impact of reinsurance. The Company has not made any changes to its methodologies for determining claim reserves in the periods presented.
Credit life and accidental death and dismemberment (AD&D) unpaid claims reserves include claims in the course of settlement and incurred but not reported (IBNR). Credit disability unpaid claims reserves also include continuing claim reserves for open disability claims. For all other product lines, unpaid claims reserves include case reserves for reported claims and bulk reserves for IBNR claims. The Company uses a number of algorithms in establishing its unpaid claims reserves. These algorithms are used to calculate unpaid claims as a function of paid losses, earned premium, reported incurred losses, target loss ratios, and in-force amounts or a combination of these factors.
Anticipated future loss development patterns form a key assumption underlying these analyses. Generally, unpaid claims reserves, and associated incurred losses, are impacted by loss frequency, which is the measure of the number of claims per unit of insured exposure, and loss severity, which is based on the average size of claims. Factors affecting loss frequency and loss severity may include changes in claims reporting patterns, claims settlement patterns, judicial decisions, legislation, economic conditions, morbidity patterns and the attitudes of claimants towards settlements.
The unpaid claims reserves represent the Company's best estimates at a given time, based on the projections and analyses discussed above. Actual claim costs are dependent upon a number of complex factors such as changes in doctrines of legal liabilities and damage awards. These factors are not directly quantifiable, particularly on a prospective basis. The Company periodically reviews and updates its methods of making such unpaid claims reserve estimates and establishing the related liabilities based on our actual experience. The Company has not made any changes to its methodologies for determining unpaid claims reserves in the periods presented.
In accordance with applicable statutory insurance company regulations, the Company’s recorded unpaid claims reserves are evaluated by appointed independent third-party actuaries, who perform this function in compliance with the Standards of Practice and Codes of Conduct of the American Academy of Actuaries. The independent actuaries perform their actuarial analyses annually and prepare opinions, statements, and reports documenting their determinations. In addition, this documentation and the Company’s actuarial work products are made available to the Company’s independent auditors for their separate review of reserves. For
December 31, 2016
and
2015
, both parties found the Company’s reserves to be adequate.
Deferred Revenue
Deferred revenues represent the portion of income that will be earned in the future attributable to motor club memberships, mobile device protection plans, and other non-insurance service contracts that are earned over the respective contract periods using Rule of 78's, modified Rule of 78's, pro rata, or other methods as appropriate for the contract. A deficiency reserve would
F- 19
TIPTREE INC. AND SUBSIDIARIES
Notes to Consolidated Financial Statements
December 31, 2016
(in thousands, except share data)
be recorded if anticipated contract benefits, deferred acquisition costs and contract service costs exceed the recorded deferred revenues and anticipated investment income. As of
December 31, 2016
and
2015
, respectively, no deficiency reserves were recorded.
Liabilities of Consolidated CLOs
The Company measures both the financial assets and the financial liabilities of its CLOs in its consolidated financial statements using the more observable of the fair value of the financial assets or the fair value of the financial liabilities. The liabilities of consolidated CLOs primarily consist of notes payable which are measured using the fair value of the financial assets. As a result, the notes were measured as (i) the sum of the fair value of the financial assets and the carrying value of any nonfinancial assets held temporarily, less (ii) the sum of the fair value of any beneficial interests retained by the Company (other than those that represent compensation for services) and the Company’s carrying value of any beneficial interests that represent compensation for services.
Revenue Recognition
The Company earns revenues from a variety of sources:
Earned Premiums, Net
Net earned premium is from direct and assumed earned premium consisting of revenue generated from the direct sale of insurance policies by the Company's distributors and premiums written for insurance policies by another carrier and assumed by the Company. Whether direct or assumed, the premium is earned over the life of the respective policy using methods appropriate to the pattern of losses for the type of business. Methods used include the Rule of 78's, pro rata, and other actuarial methods. Management selects the appropriate method based on available information, and periodically reviews the selections as additional information becomes available. Direct and assumed premiums are offset by premiums ceded to the Company's reinsurers, including producer owned reinsurance companies (PORCs), earned in the same manner. The amount ceded is proportional to the amount of risk assumed by the reinsurer.
Service and Administrative Fees
The Company earns service and administrative fees from a variety of activities. Such fees are typically positively correlated with transaction volume and are recognized as revenue as they become both realized and earned.
Service Fees.
S
ervice fee revenue is recognized as the services are performed. These services include fulfillment, software development, and claims handling for our customers. Collateral tracking fee income is recognized when the service is performed and billed. Management reviews the financial results under each significant contract on a monthly basis. Any losses that may occur due to a specific contract would be recognized in the period in which the loss is determined probable. During the years ended
December 31, 2016
,
2015
and 2014, respectively, the Company did not incur a loss with respect to a specific significant service fee contract.
Administrative Fees.
Administrative fee revenue includes the administration of premium associated with our producers and their PORCs. In addition, we also earn fee revenue from debt cancellation programs, motor club programs, and warranty programs. Related administrative fee revenue is recognized consistent with the earnings recognition pattern of the underlying insurance policies, debt cancellation contracts and motor club memberships being administered, using Rule of 78's, modified Rule of 78's, pro rata, or other methods as appropriate for the contract. Management selects the appropriate method based on available information, and periodically reviews the selections as additional information becomes available.
Ceding Commissions
Ceding commissions earned under reinsurance agreements are based on contractual formulas that take into account, in part, underwriting performance and investment returns experienced by the assuming companies. As experience changes, adjustments to the ceding commissions are reflected in the period incurred and are based on the claim experience of the related policy. The adjustment is calculated by adding the earned premium and investment income from the assets held in trust for the Company's benefit less earned commissions, incurred claims and the reinsurer's fee for the coverage.
F- 20
TIPTREE INC. AND SUBSIDIARIES
Notes to Consolidated Financial Statements
December 31, 2016
(in thousands, except share data)
Rental and Related Revenue
Rental revenue from residents in properties owned by Care but managed by a management company pursuant to a management agreement (Managed Properties) are recognized monthly as services are provided, as lease periods for residents are short-term in nature. The Company recognizes rental revenue from triple net leases on a straight-line basis over the non-cancelable term of the lease unless another systematic and rational basis is more representative of the time pattern in which the use benefit is derived from the leased property. Renewal options in leases with rental terms that are higher than those in the primary term are excluded from the calculation of straight-line rent if the renewals are not reasonably assured. The Company commences rental revenue recognition when the tenant takes control of the leased space. The Company recognizes lease termination payments as a component of rental revenue in the period received, provided that there are no further obligations under the lease. Revenue related to rental revenue is primarily attributable to services provided to the occupants of our senior living properties.
Management Fee Income
The Company earns management and incentive fees from the funds it manages. These management fees are paid periodically in accordance with the terms of the individual management agreements for as long as the Company manages the funds. Management fees typically consist of fees based on the amount of assets held in the Funds. Management fees are recognized as revenue when earned. The Company does not recognize incentive fees until all contractual contingencies have been removed. Management fee income is recorded in other income.
Policy and Contract Benefits
Member Benefit Claims
Member benefit claims represent claims paid on behalf of contract holders directly to third party providers for roadside assistance and for the repair or replacement of covered products. Claims can also be paid directly to contract holders as a reimbursement payment, provided supporting documentation of loss is submitted to the Company. Claims are recognized as expense when incurred.
Net Losses and Loss Adjustment Expenses
Net losses and loss adjustment expenses represent losses and related claim adjudication and processing costs on insurance contract claims, net of amounts ceded. Net losses include actual claims paid and the change in unpaid claim reserves.
Commissions Payable and Expense
Commissions are paid to distributors and retailers selling credit insurance policies, motor club memberships, mobile device protection, and warranty service contracts, and are generally deferred and expensed in proportion to the earning of related revenue. Credit insurance commission rates, in many instances, are set by state regulators and are also impacted by market conditions. In certain instances, credit insurance commissions are subject to retrospective adjustment based on the profitability of the related policies. Under these retrospective commission arrangements, the producer of the credit insurance policies receives a retrospective commission if the premium generated by that producer in the accounting period exceeds the costs associated with those policies, which includes the Company's administrative fees, claims, reserves, and premium taxes. The Company analyzes the retrospective commission calculation periodically for each producer and, based on the analysis associated with each such producer, the Company records a liability for any positive net retrospective commission earned and due to the producer or, conversely, records a receivable, net of allowance, for amounts due from such producer for instances where the net result of the retrospective commission calculation is negative. Commissions payable are included in other liabilities and accrued expenses.
Recent Accounting Standards
Recently Adopted Accounting Pronouncements
In January 2014, the FASB issued ASU 2014-04,
Receivables - Troubled Debt Restructurings by Creditors (Subtopic 310-40), Reclassification of Residential Real Estate Collateralized Consumer Mortgage Loans Upon Foreclosure.
This amendment clarifies when an in substance repossession or foreclosure has occurred. Additionally, this amendment requires disclosure of the amount of foreclosed residential real estate property held and the recorded investment in consumer mortgage loans collateralized
F- 21
TIPTREE INC. AND SUBSIDIARIES
Notes to Consolidated Financial Statements
December 31, 2016
(in thousands, except share data)
by residential real estate that are in the process of foreclosure. The adoption of ASU 2014-04 did not have a material impact on the Company's consolidated financial statements.
In April 2014, the Financial Accounting Standards Board (FASB) issued ASU 2014-08,
Presentation of Financial Statements (Topic 205) and Property, Plant and Equipment (Topic 360)
: Reporting Discontinued Operations and Disclosures of Disposals of Components of an Entity. These amendments change the criteria for reporting discontinued operations while enhancing disclosures in this area. Under the new guidance, only disposals representing a strategic shift in operations should be presented as discontinued operations. In addition, ASU 2014-08 requires expanded disclosures about discontinued operations that will provide financial statement users with more information. ASU 2014-08 is effective for the first quarter of 2015 for the Company. The effects of applying the revised guidance will vary based upon the nature and size of future disposal transactions. It is expected that fewer disposal transactions will meet the new criteria to be reported as discontinued operations. The adoption of ASU 2014-08 did not have a material impact on the Company's consolidated financial statements.
In June 2014, the FASB issued ASU 2014-12,
Compensation - Stock Compensation (Topic 718): Accounting for Share-Based Payments when the Terms of an Award Provide That a Performance Target Could Be Achieved after the Requisite Service Period
. The amendments require that a performance target that affects vesting and that could be achieved after the requisite service period shall be treated as a performance condition. The adoption of this standard did not have a material impact on the Company's consolidated financial statements.
In August 2014, the FASB issued ASU 2014-13,
Consolidation (Topic 810): Measuring the Financial Assets and the Financial Liabilities of a Consolidated Collateralized Financing Entity
. This pronouncement was effective for annual and interim periods beginning after December 15, 2015, with early adoption permitted. ASU 2014-13 provides for a measurement alternative whereby a company can measure both the financial assets and financial liabilities of its CLOs using the more observable of the fair value of the financial assets and the fair value of the financial liabilities. The Company elected to early adopt ASU 2014-13 for the year ended December 31, 2014 as it pertains to the CLOs it consolidates and elected to apply it retrospectively to all relevant prior periods. The application of this new guidance resulted in adjustments to certain balances in the previously issued consolidated financial statements for the year ended December 31, 2014, as well as for the interim periods ended March 31, 2014, June 30, 2014, and September 30, 2014.
In January 2015, the FASB issued ASU 2015-01,
Income Statement - Extraordinary and Unusual Items (Subtopic 225-20): Simplifying Income Statement Presentation by Eliminating the Concept of Extraordinary Items
. The pronouncement eliminates the concept of extraordinary items from GAAP. However, the presentation and disclosure guidance for items that are unusual in nature or occur infrequently will be retained and will be expanded to include items that are both unusual in nature and infrequently occurring. ASU 2015-01 was effective for the annual and interim periods beginning after December 15, 2015 with early adoption permitted. The adoption of this standard did not have a material impact on the Company’s consolidated financial statements.
In February 2015, the FASB issued ASU 2015-02,
Consolidation (Topic 810): Amendments to the Consolidation Analysis
, which amends the consolidation requirements in the FASB Accounting Standards Codification 810, Consolidation. ASU 2015-02 makes targeted amendments to the current consolidation guidance for VIEs, which could change consolidation conclusions. This pronouncement was effective on January 1, 2016, with early adoption is permitted. The Company elected to early adopt ASU 2015-02 for the year ended December 31, 2015 as it pertains to the CLOs it consolidates and elected to apply it effective January 1, 2015. The application of this amended guidance resulted in adjustments to certain balances in the previously issued consolidated financial statements for the interim periods ended March 31, 2015, June 30, 2015 and September 30, 2015. See Note
(12) Assets and Liabilities of Consolidated CLOs
.
In April 2015, the FASB issued ASU 2015-03,
Simplifying the Presentation of Debt Issuance Costs
, which requires that debt issuance costs related to a recognized debt liability to be presented in the balance sheet as a direct deduction from the carrying amount of that debt liability and consistent with debt discounts. ASU 2015-03 requires retrospective adoption and was effective for the Company on January 1, 2016. Accordingly, “Debt, net” is reported net of deferred financing costs as of
December 31, 2016
and December 31, 2015, respectively, in the consolidated balance sheets. See Note—
(13) Debt, net
.
In April 2015, the FASB issued ASU 2015-05,
Intangibles -Goodwill and Other -Internal-Use Software (Subtopic 350-40),
which will help entities evaluate the accounting for fees paid by a customer in a cloud computing arrangement by providing guidance as to whether an arrangement includes the sale or license of software. The adoption of this standard did not have a material impact on the consolidated financial statements.
F- 22
TIPTREE INC. AND SUBSIDIARIES
Notes to Consolidated Financial Statements
December 31, 2016
(in thousands, except share data)
In May 2015, the FASB issued ASU 2015-07,
Disclosures for Investments in Certain Entities That Calculate Net Asset Value per Share (or Its Equivalent)
, which eliminates the requirement for entities to categorize within the fair value hierarchy investments for which fair values are measured at net asset value (NAV) per share (FASB ASC Subtopic 820-10). ASU 2015-07 also removes the requirement to make certain disclosures for all investments that are eligible to be measured at fair value using the NAV per share practical expedient, instead limiting disclosures to investments for which the entity has elected the expedient. ASU 2015-07 was effective for the Company on January 1, 2016 and retrospective adoption is required. The adoption of this standard did not have a material impact on the Company’s consolidated financial statements.
In May 2015, the FASB issued ASU 2015-08,
Business Combinations (Topic 805): Pushdown Accounting—Amendments to SEC Paragraphs Pursuant to Staff Accounting Bulletin No. 115 (SEC Update).
ASU 2015-08 removes references to the SEC’s SAB Topic 5.J on pushdown accounting from ASC 805-50. The Commission’s Staff Accounting Bulletin, "SAB" 115 had superseded the guidance in SAB Topic 5.J in connection with the FASB’s November 2014 release of ASU 2014-17. The amendments in ASU 2015-08 therefore conform to the FASB’s guidance on pushdown accounting with the SEC’s. The amendments were effective upon issuance (May 12, 2015). The adoption of this standard did not have a material impact on the Company's consolidated financial statements.
In May 2015, the FASB issued ASU 2015-09,
Financial Services—Insurance (Topic 944): Disclosures about Short-Duration Contracts,
which expands the disclosure requirements for insurance companies that issue short-duration contracts (typically one year or less) to provide users with additional disclosures about the liability for unpaid claims and claim adjustment expenses and to increase the transparency of the significant estimates management makes in measuring those liabilities. In addition, the disclosures will serve to increase insight into an insurance entity’s ability to underwrite and anticipate costs associated with claims as well as provide users of the financial statements a better understanding of the amount and uncertainty of cash flows arising from insurance liabilities, the nature and extent of risks on short-duration contracts and the timing of cash flows arising from insurance liabilities. ASU 2015-09 was effective for the Company for the annual period beginning after December 15, 2015, and for interim periods within annual periods beginning after December 15, 2016. The adoption of this standard did not have a material impact on the Company's consolidated financial statements.
In June 2015, the FASB issued ASU 2015-10,
Technical Corrections and Improvements
, which covers a wide range of Topics in the Codification. The amendments in ASU 2015-10 represent changes to clarify the Codification, correct unintended application of guidance, or make minor improvements to the Codification that are not expected to have a significant effect on current accounting practice or create a significant administrative cost on most entities. Amendments with transition guidance were effective for fiscal years, and interim periods within those fiscal years, beginning after December 15, 2015. All other amendments are effective upon the ASU’s issuance (June 12, 2015). The adoption of this standard did not have a material impact on the Company’s consolidated financial statements.
In September 2015, the FASB issued ASU 2015-16,
Business Combinations (Topic 805):Simplifying the Accounting for Measurement-Period Adjustments
, which eliminates the requirement to restate prior period financial statements for measurement period adjustments following a business combination. ASU 2015-16 requires that the cumulative impact of a measurement period adjustment (including the impact on prior periods) be recognized in the reporting period in which the adjustment is identified. The prior period impact of the adjustment should be either presented separately on the face of the income statement or disclosed in the notes. ASU 2015-16 became effective for fiscal years and interim reporting periods beginning after December 15, 2015, with early adoption permitted for financial statements that have not been issued. The Company elected to early adopt ASU 2015-16 for the year ended December 31, 2015 as it pertains acquisitions in the year ended December 31, 2015. The application of this new guidance did not have a material impact on the Company’s consolidated financial statements for any periods previously reported, though it will impact the recording of measurement period adjustments prospectively.
In October 2016, the FASB issued ASU 2016-16,
Income Taxes (Topic 740) - Intra- Entity Transfers of Assets Other Than Inventory
(ASU 2016-16), which requires that an entity should recognize the income tax consequences of an intra-entity transfer of an asset other than inventory when the transfer occurs. Consequently, the amendments in this standard eliminate the exception for an intra-entity transfer of an asset other than inventory. The amendments in this standard do not include new disclosure requirements; however, existing disclosure requirements might be applicable. ASU 2016-16 is effective for public companies for annual reporting periods beginning after December 15, 2017, including interim reporting periods within those annual reporting periods. The Company elected to early adopt this standard during the quarter ended December 31, 2016. The adoption of this standard did not have a material impact on the Company’s consolidated financial statements.
F- 23
TIPTREE INC. AND SUBSIDIARIES
Notes to Consolidated Financial Statements
December 31, 2016
(in thousands, except share data)
In January 2017, the FASB issued ASU 2017-01,
Business Combinations (Topic 805) Clarifying the Definition of a Business
, which clarifies the definition of a business with the objective of adding guidance to assist entities with evaluating whether transactions should be accounted for as acquisitions (or disposals) of assets or businesses. The definition of a business affects many areas of accounting including the treatment of acquisitions, disposals, goodwill, and consolidation. ASU 2017-01 is effective for public business entities in annual periods beginning after December 15, 2017, including interim periods therein and must be applied prospectively on or after the effective date. There are no disclosures required for a change in accounting principle at transition. Early adoption is permitted for transactions (i.e., acquisitions or dispositions) that occurred before the issuance date or effective date of the standard if the transactions were not reported in financial statements that have been issued or made available for issuance. The Company elected to early adopt this standard, effective for transactions on or after October 1, 2016. See note
(6) Investments
, for a summary of acquisitions entered into by the Company which were accounted for as acquisitions of assets. The adoption of this standard did not have a material impact on the Company’s consolidated financial statements.
Recently Issued Accounting Pronouncements, Not Yet Adopted
In May 2014, the FASB issued ASU 2014-09,
Revenue from Contracts with Customers (Topic 606)
. The amendments in this standard affects any entity that either enters into contracts with customers to transfer goods and services or enters into contracts for the transfer of nonfinancial assets unless those contracts are within the scope of other standards. The core principle of the guidance is that an entity should recognize revenue to depict the transfer of goods or services to customers in an amount that reflects the consideration to which the entity expects to be entitled in exchange for those goods and services. On July 9, 2015, the FASB decided to delay the effective date of ASU 2014-09 by one year. This standard was originally effective for the Company on January 1, 2017. Reporting entities may choose to adopt the standard as of the original effective date. The deferral results in ASU 2014-09 being effective for fiscal years, and interim periods within those fiscal years, beginning after December 15, 2017. The Company is currently evaluating the effect on its consolidated financial statements.
In January 2016, the FASB issued ASU No. 2016-01,
Financial Instruments-Overall (Subtopic 825-10): Recognition and Measurement of Financial Assets and Financial Liabilities
, which makes targeted improvements to the recognition, measurement, presentation and disclosure of certain financial instruments. ASU 2016-01 focuses primarily on the accounting for equity investments, financial liabilities under the fair value option, and the presentation and disclosure requirements for certain financial instruments. Among its provisions for public business entities, ASU 2016-01 eliminates the requirement to disclose the method(s) and significant assumptions used to estimate the fair value of financial instruments measured at amortized cost, requires the use of the exit price notion when measuring the fair value of financial instruments for disclosure purposes, requires the separate presentation in other comprehensive income of the change in fair value of a liability due to instrument-specific credit risk for a liability for which the reporting entity has elected the fair value option, requires separate presentation of financial assets and financial liabilities by measurement category and form of financial asset (that is, securities or loans and receivables) and clarifies guidance related to the valuation allowance assessment when recognizing deferred tax assets resulting from unrealized losses on available-for-sale debt securities. ASU 2016-01 is effective for fiscal years beginning after December 15, 2017, including interim periods within those fiscal years. Early application is permitted for a limited number of provisions. The Company is currently evaluating the effect on its consolidated financial statements.
In February 2016, the FASB issued ASU 2016-02,
Leases (Topic 842)
, which sets out the principles for the recognition, measurement, presentation and disclosure of leases for both parties to a contract (i.e., lessees and lessors). The new standard requires lessees to apply a dual approach, classifying leases as either finance or operating leases based on the principle of whether or not the lease is effectively a financed purchase by the lessee. This classification will determine whether lease expense is recognized based on an effective interest method or on a straight-line basis over the term of the lease. A lessee is also required to record a right-of-use asset and a lease liability for all leases with a term of greater than 12 months regardless of their classification. Leases with a term of 12 months or less will be accounted for similar to existing guidance for operating leases today. The new standard requires lessors to account for leases using an approach that is substantially equivalent to existing guidance for sales-type leases, direct financing leases and operating leases. ASU 2016-02 supersedes the previous leases standard, Leases (Topic 840). The standard is effective on January 1, 2019, with early adoption permitted. The Company is currently evaluating the effect on its consolidated financial statements.
In March 2016, the FASB issued ASU 2016-05,
Derivatives and Hedging (Topic 815): Effect of Derivative Contract Novations on Existing Hedge Accounting Relationships,
which clarifies that a change in the counterparty to a derivative instrument that has been designated as the hedging instrument under Topic 815, does not, in and of itself, require dedesignation of that hedging relationship provided that all other hedge accounting criteria continue to be met. The standard is effective for financial statements
F- 24
TIPTREE INC. AND SUBSIDIARIES
Notes to Consolidated Financial Statements
December 31, 2016
(in thousands, except share data)
issued for fiscal years beginning after December 15, 2016, and interim periods within those fiscal years. The Company is currently evaluating the effect on its consolidated financial statements.
In March 2016, the FASB issued ASU 2016-07
, Investments -Equity Method and Joint Ventures (Topic 323),
which eliminates the requirement in Topic 323 that an entity retroactively adopt the equity method of accounting if an investment qualifies for use of the equity method as a result of an increase in the level of ownership or degree of influence. The amendments require that the equity method investor add the cost of acquiring the additional interest in the investee to the current basis of the investor’s previously held interest and adopt the equity method of accounting as of the date the investment becomes qualified for equity method accounting. The amendments require that the equity method investor add the cost of acquiring the additional interest in the investee to the current basis of the investor’s previously held interest and adopt the equity method of accounting as of the date the investment becomes qualified for equity method accounting. The standard is effective for financial statements issued for fiscal years beginning after December 15, 2016 and should be applied prospectively upon their effective date to increases in the level of ownership interest or degree of influence that result in the adoption of the equity method. Early adoption is permitted. The Company is currently evaluating the effect on its consolidated financial statements.
In March 2016, the FASB issued ASU 2016-08
, Revenue from Contracts with Customers (Topic 606): Principal versus Agent Considerations (Reporting Revenue Gross versus Net),
which clarify the implementation guidance on principal versus net considerations. The effective date and transition requirements for this standard are the same as the effective date and transition requirements of ASU 2014-09. The Company is currently evaluating the effect on its consolidated financial statements.
In March 2016, the FASB issued ASU 2016-09
, Stock Compensation (Topic 718): Improvements to Employee Share-Based Payment Accounting,
which simplifies several aspects of the accounting for employee share-based payment transactions, including the income tax consequences, classification of awards as either equity or liabilities, and classification on the statement of cash flows. Some of the areas for simplification apply only to nonpublic entities. In addition, the amendments in this Update eliminate the guidance in Topic 718 that was indefinitely deferred shortly after the issuance of FASB Statement No. 123 (revised 2004), Share-Based Payment. The standard is effective for financial statements issued for fiscal years beginning after December 15, 2016 and interim periods within those annual periods. Early adoption is permitted. The Company is currently evaluating the effect on its consolidated financial statements.
In April 2016, the FASB issued ASU 2016-10,
Revenue from Contracts with Customers (Topic 606): Identifying Performance Obligations and Licensing,
which clarifies guidance related to identifying performance obligations and licensing implementation guidance contained in the new revenue recognition standard. The Update includes targeted improvements based on input the FASB received from the Transition Resource Group for Revenue Recognition and other stakeholders. The Update seeks to proactively address areas in which diversity in practice potentially could arise, as well as to reduce the cost and complexity of applying certain aspects of the guidance both at implementation and on an ongoing basis. The effective date and transition requirements for the amendments in this Update are the same as the effective date and transition requirements in Topic 606 (and any other Topic amended by Update 2014-09). The Company is currently evaluating the effect on its consolidated financial statements.
In May 2016, the FASB issued ASU 2016-11,
Revenue Recognition (Topic 605) and Derivatives and Hedging (Topic 815): Rescission of SEC Guidance Because of Accounting Standards Updates 2014-09 and 2014-16 Pursuant to Staff Announcements at the March 3, 2016 EITF Meeting,
which rescinds SEC paragraphs pursuant to the SEC Staff Announcement, “Rescission of Certain SEC Staff Observer Comments upon Adoption of Topic 606,” and the SEC Staff Announcement, “Determining Whether the Host Contract in a Hybrid Financial Instrument Issued in the Form of a Share Is More Akin to Debt or Equity,” announced at the March 3, 2016 Emerging Issues Task Force (EITF) meeting. The Company believes that that the adoption of this standard will not have a material impact on the Company’s consolidated financial statements.
In May 2016, the FASB issued ASU 2016-12,
Revenue from Contracts with Customers (Topic 606): Narrow-Scope Improvements and Practical Expedients,
which provides guidance on collectability, noncash consideration, and completed contracts at transition. Additionally, the amendments in this Update provide a practical expedient for contract modifications at transition and an accounting policy election related to the presentation of sales taxes and other similar taxes collected from customers. The effective date and transition requirements for the amendments in this Update are the same as the effective date and transition requirements for Topic 606 (and any other Topic amended by Update 2014-09). The Company is currently evaluating the effect on its consolidated financial statements.
F- 25
TIPTREE INC. AND SUBSIDIARIES
Notes to Consolidated Financial Statements
December 31, 2016
(in thousands, except share data)
In June 2016, the FASB issued ASU 2016-13
Financial Instruments -Credit Losses (Topic 326): Measurement of Credit Losses on Financial Instruments,
which amends guidance on reporting credit losses for assets held at amortized cost basis and available for sale debt securities. For assets held at amortized cost basis, Topic 326 eliminates the probable initial recognition threshold in current GAAP and, instead requires an entity to reflect its current estimate of all expected credit losses. The allowance for credit losses is a valuation account that is deducted from the amortized cost basis of the financial assets to present the net amount expected to be collected. For available for sale debt securities, credit losses should be measured in a manner similar to current GAAP, however Topic 326 will require that credit losses be presented as an allowance rather than as a write-down. This Update affects entities holding financial assets and net investment in leases that are not accounted for at fair value through net income. The amendments in ASU 2016-13 are effective for fiscal years beginning after December 15, 2019, including interim periods within those fiscal years, with early adoption permitted as of the fiscal years beginning after December 15, 2018, including interim periods within those fiscal years. The amendments will affect loans, debt securities, trade receivables, net investments in leases, off balance sheet credit exposures, reinsurance receivables, and any other financial assets not excluded from the scope that have the contractual right to receive cash. The Company is currently evaluating the effect on its consolidated financial statements.
In August 2016, the FASB issued ASU 2016-15,
Statement of Cash Flows (Topic 230): Classification of Certain Cash Receipts and Cash Payments,
which addresses the following eight specific cash flow issues: Debt prepayment or debt extinguishment costs; settlement of zero-coupon debt instruments or other debt instruments with coupon interest rates that are insignificant in relation to the effective interest rate of the borrowing; contingent consideration payments made after a business combination; proceeds from the settlement of insurance claims; proceeds from the settlement of corporate-owned life insurance policies (COLIs) (including bank-owned life insurance policies (BOLIs)); distributions received from equity method investees; beneficial interests in securitization transactions; and separately identifiable cash flows and application of the predominance principle. The standard is effective for financial statements issued for fiscal years beginning after December 15, 2017 and interim periods within those annual periods. Early adoption is permitted, including the adoption in an interim period. The amendments in this Update should be applied using a retrospective transition method to each period presented. The Company is currently evaluating the effect on its consolidated financial statements.
In October 2016, the FASB issued ASU 2016-17, C
onsolidation (Topic 810): Interests Held Through Related Parties that Are Under Common Control,
which amends the consolidation guidance on how a reporting entity, that is the single decision maker of a VIE, evaluates whether it is the primary beneficiary of a VIE. This new guidance is effective for fiscal years beginning after December 15, 2016. Early adoption is permitted. The Company is currently evaluating the effect on its consolidated financial statements.
In November 2016, the FASB issued ASU 2016-18,
Restricted Cash (a consensus of the FASB Emerging Issues Task Force),
which addresses classification and presentation of changes in restricted cash on the statement of cash flows.
ASU 2016-18 requires an entity’s reconciliation of the beginning-of-period and end-of-period total amounts shown on the statement of cash flows to include in cash and cash equivalents amounts generally described as restricted cash and restricted cash equivalents. The ASU does not define restricted cash or restricted cash equivalents, but an entity will need to disclose the nature of the restrictions. ASU 2016-18 is effective for public business entities for annual and interim periods in fiscal years beginning after December 15, 2017. Early adoption is permitted, including adoption in an interim period. The Company is currently evaluating the effect on its consolidated financial statements.
In December 2016, the FASB issued ASU 2016-19,
Technical Corrections and Improvements.
ASU 2016-19 clarifies guidance, corrects errors and makes minor improvements affecting a variety of topics in the ASC. Most of the amendments are not expected to have a significant effect on practice, but some of them could change practice for some entities. The Company is currently evaluating the effect on its consolidated financial statements.
In January 2017, the FASB issued ASU 2017-04,
Simplifying the Test for Goodwill Impairment
. ASU 2016-04 does not change the qualitative assessment; however, it removes “the requirements for any reporting unit with a zero or negative carrying amount to perform a qualitative assessment and, if it fails that qualitative test, to perform Step 2 of the goodwill impairment test.” Instead, all reporting units, even those with a zero or negative carrying amount will apply the same impairment test. Therefore, as the FASB notes in the ASU’s Basis for Conclusions, the goodwill of reporting units with zero or negative carrying values will not be impaired, even when conditions underlying the reporting unit indicate that goodwill is impaired. Entities will, however, be required to disclose any reporting units with zero or negative carrying amounts and the respective amounts of goodwill allocated to those reporting units. The Company is currently evaluating the effect on its consolidated financial statements.
F- 26
TIPTREE INC. AND SUBSIDIARIES
Notes to Consolidated Financial Statements
December 31, 2016
(in thousands, except share data)
(3) Acquisitions
Acquisitions during the
year ended December 31, 2016
Senior Living
Managed Properties
During the
year ended December 31, 2016
, subsidiaries in our senior living business and their partners entered into agreements to acquire and operate
three
senior housing communities for total consideration of
$84,605
(which includes deposits of
$125
paid in the fourth quarter of 2015), of which
$59,817
was financed through mortgage debt issued in connection with the acquisitions,
$4,778
was financed by contributions from partners of our subsidiary, and the remainder was paid with cash on hand. The partners provide management services to the communities under management contracts.
The primary reason for the Company’s acquisition of the senior housing communities is to expand its real estate operations. For the period from acquisition until
December 31, 2016
, revenue and the net loss in the aggregate for the
three
managed properties acquired were
$10,878
and
$2,416
, respectively.
On June 30, 2016 and December 31, 2016, the Company finalized the determination of the fair value of the assets acquired and the liabilities assumed for acquisitions completed in the first and third quarter of 2016, respectively. The adjustments to the amounts recorded in prior periods was an increase of
$132
to real estate, net with an offsetting decrease of
$132
to intangible assets, net related to in-place leases. Additionally, the change to the provisional amounts resulted in a decrease in depreciation and amortization of
$67
.
The following table summarizes the consideration paid and the amounts of the final determination, as described above, for transactions completed in the year ended
December 31, 2016
.
|
2016 Acquisitions
|
|||
|
Senior Living
|
|||
|
Consideration:
|
|||
|
Cash
|
$
|
81,492
|
|
|
Non-cash non-controlling interests contributions
|
3,113
|
|
|
|
Fair value of total consideration
|
$
|
84,605
|
|
|
Acquisition costs
|
$
|
622
|
|
|
Recognized amounts of identifiable assets acquired and liabilities assumed:
|
|||
|
Assets:
|
|||
|
Cash and cash equivalents
|
$
|
184
|
|
|
Real estate, net
|
77,787
|
|
|
|
Intangible assets, net
|
6,838
|
|
|
|
Other assets
|
248
|
|
|
|
Liabilities:
|
|||
|
Deferred revenue
|
(290
|
)
|
|
|
Other liabilities and accrued expenses
|
(162
|
)
|
|
|
Total identifiable net assets assumed
|
$
|
84,605
|
|
The following table shows the values recorded by the Company, as of the acquisition date, for finite-lived intangible assets and their estimated amortization period:
|
Intangible Assets
|
Weighted Average Amortization Period (in Years)
|
Senior Living
|
|||
|
In-place lease
|
1.61
|
$
|
6,838
|
|
|
F- 27
TIPTREE INC. AND SUBSIDIARIES
Notes to Consolidated Financial Statements
December 31, 2016
(in thousands, except share data)
Supplemental pro forma results of operations have not been presented for the above 2016 business acquisitions as they are not material in relation to the Company’s reported results.
Acquisitions during the
year ended December 31, 2015
Specialty Finance
On July 1, 2015, the Company completed the acquisition of Reliance First Capital, LLC (Reliance) for total consideration of
$24,441
, which was comprised of cash of
$10,281
, a total of
1,625,000
shares of its Class A common stock (market value of
$11,960
at the time of issuance), and an earn-out to issue additional shares valued at
$2,200
in exchange for
100%
ownership. The primary reason for the Company’s acquisition of Reliance is to expand its mortgage origination operations. The results of Reliance, from its closing date, are included in the Company’s specialty finance segment and was considered an acquisition of a business in accordance with ASC 805.
For the period from acquisition until
December 31, 2015
, revenue and net income were
$22,934
and
$2,019
, respectively.
Senior Living
Managed Properties
During the
year ended December 31, 2015
, the Company and a partner of a subsidiary in our senior living business entered into agreements to acquire and operate
five
senior housing communities for total consideration of
$29,251
(which includes deposits of
$587
paid in the fourth quarter of 2014), of which
$19,943
was financed through mortgage debt issued in connection with the acquisitions,
$1,861
was financed by a contribution of cash from the partner, and the remainder was paid with cash on hand. Affiliates of the partner provide management services to the communities under a management contract.
Triple Net Lease Properties
During the
year ended December 31, 2015
, the Company acquired the assets of
six
senior living communities for total consideration of
$54,536
(which includes deposits of
$1,490
paid in the fourth quarter of 2014), of which
$39,500
was financed through mortgage debt issued in connection with the acquisitions, and the remainder was paid with cash on hand.
The primary reason for the Company’s acquisition of the senior living communities was to expand its real estate operations. For the period from acquisition until
December 31, 2015
, revenue and the net loss in aggregate for the properties acquired were
$11,802
and
$2,496
, respectively.
F- 28
TIPTREE INC. AND SUBSIDIARIES
Notes to Consolidated Financial Statements
December 31, 2016
(in thousands, except share data)
The following table summarizes the consideration paid and the final determination of amounts of fair value of the assets acquired and the liabilities assumed for the acquisitions completed during the
year ended December 31, 2015
:
|
2015 Acquisitions
|
|||||||||||
|
Specialty Finance
|
Senior Living
|
Total
|
|||||||||
|
Total consideration:
|
|||||||||||
|
Cash
|
$
|
10,281
|
|
$
|
83,787
|
|
$
|
94,068
|
|
||
|
Common stock
|
11,960
|
|
—
|
|
11,960
|
|
|||||
|
Contingent consideration
|
2,200
|
|
—
|
|
2,200
|
|
|||||
|
Fair value of total consideration
|
$
|
24,441
|
|
$
|
83,787
|
|
$
|
108,228
|
|
||
|
Acquisition costs
|
$
|
223
|
|
$
|
1,567
|
|
$
|
1,790
|
|
||
|
Recognized amounts of identifiable assets acquired and liabilities assumed:
|
|||||||||||
|
Assets:
|
|||||||||||
|
Cash and cash equivalents
|
$
|
13,934
|
|
$
|
—
|
|
$
|
13,934
|
|
||
|
Restricted cash
|
919
|
|
—
|
|
919
|
|
|||||
|
Mortgage loans held for sale, at fair value
|
59,308
|
|
—
|
|
59,308
|
|
|||||
|
Accounts and premiums receivable, net
|
2,369
|
|
—
|
|
2,369
|
|
|||||
|
Real estate, net
|
—
|
|
76,003
|
|
76,003
|
|
|||||
|
Goodwill
|
1,708
|
|
—
|
|
1,708
|
|
|||||
|
Intangible assets, net
|
1,440
|
|
8,800
|
|
10,240
|
|
|||||
|
Deferred tax assets
|
150
|
|
—
|
|
150
|
|
|||||
|
Other assets
|
3,712
|
|
92
|
|
3,804
|
|
|||||
|
Liabilities:
|
|||||||||||
|
Fair value of debt assumed
|
(52,836
|
)
|
—
|
|
(52,836
|
)
|
|||||
|
Deferred revenue
|
—
|
|
(589
|
)
|
(589
|
)
|
|||||
|
Other liabilities and accrued expenses
|
(6,263
|
)
|
(519
|
)
|
(6,782
|
)
|
|||||
|
Total identifiable net assets assumed
|
$
|
24,441
|
|
$
|
83,787
|
|
$
|
108,228
|
|
||
Supplemental pro forma results of operations have not been presented for the above 2015 business acquisitions as they were not material in relation to the Company’s reported results.
The following table shows the values recorded by the Company, as of the acquisition date, for finite-lived intangible assets and their estimated amortization period:
|
Intangible Assets
|
Weighted Average Amortization Period (in Years)
|
Specialty Finance
|
Senior Living
|
Total
|
|||||||||
|
Trade names
|
10.0
|
$
|
800
|
|
$
|
—
|
|
$
|
800
|
|
|||
|
Software
|
7.0
|
640
|
|
—
|
|
640
|
|
||||||
|
In-place Lease
|
8.7
|
—
|
|
8,800
|
|
8,800
|
|
||||||
|
Total acquired finite-lived other intangible assets
|
8.7
|
$
|
1,440
|
|
$
|
8,800
|
|
$
|
10,240
|
|
|||
Specialty Insurance - Purchase of Non-controlling Interests
On January 1, 2015, Fortegra Financial Corporation (Fortegra) exercised an option to purchase the remaining
37.6%
ownership interest in ProtectCELL. Upon exercising the option, Fortegra made an initial payment of
$3,000
and made an additional payment of
$4,100
in 2016 which was previously accrued.
F- 29
TIPTREE INC. AND SUBSIDIARIES
Notes to Consolidated Financial Statements
December 31, 2016
(in thousands, except share data)
Acquisitions during the year ended December 31, 2014
Insurance and Insurance Services
On December 4, 2014, the Company completed the acquisition of Fortegra for total consideration of
$211,740
comprised of cash of
$91,740
and borrowings of
$120,000
in exchange for
100%
ownership. Fortegra’s products include payment protection products, motor club memberships, service contracts, device and warranty services, as well as administration services to business partners, including insurance companies, retailers, dealers, insurance brokers and agents and financial services companies. The primary reason for the Company’s acquisition of Fortegra is to expand its insurance and insurance services operations.
For the year ended December 31, 2014, revenue and net income were
$26,174
and
$1,461
, respectively.
The following unaudited supplemental pro forma information as of December 31, 2014 in the table below presents the Company's consolidated financial information as if Fortegra had been acquired on January 1, 2014:
|
For the Year Ended December 31, 2014
|
||||
|
Total revenue
|
$
|
463,143
|
|
|
|
Net income from continuing operations
|
$
|
12,723
|
|
|
|
Diluted earnings per share from continuing operations
|
$
|
0.76
|
|
|
The unaudited supplemental pro forma results were prepared for comparative purposes only and do not purport to be indicative of the results of operations had the acquisition of Fortegra occurred at January 1, 2014, nor is it indicative of any future operating results of the Company.
(4) Dispositions, Assets Held for Sale and Discontinued Operations
The Company classified its Philadelphia Financial Group (PFG) subsidiary as held for sale as of December 31, 2014. At the time of such classification, the pending sale of PFG also met the requirements to be classified as a discontinued operation. The sale of PFG was completed on June 30, 2015.
The Company received total cash of
$142,837
at the time of sale and
two
future payments on the first and second anniversary of closing totaling approximately
$7,341
. The gain on the sale net of tax, was approximately
$15,619
, which is classified as a gain on sale from discontinued operations. As a result, the Company has reclassified the income and expenses attributable to PFG to income from discontinued operations, net for the years ended December 31, 2015 and 2014.
F- 30
TIPTREE INC. AND SUBSIDIARIES
Notes to Consolidated Financial Statements
December 31, 2016
(in thousands, except share data)
The following table represents detail of revenues and expenses of discontinued operations in the Consolidated Statements of Operations for the
year ended December 31, 2015
and 2014:
|
Year Ended December 31,
|
|||||||
|
2015
|
2014
|
||||||
|
Revenues:
|
|||||||
|
Net realized gain
|
$
|
151
|
|
$
|
45
|
|
|
|
Interest income
|
2,215
|
|
4,649
|
|
|||
|
Separate account fees
|
12,706
|
|
23,390
|
|
|||
|
Service and administrative fees
|
25,385
|
|
50,600
|
|
|||
|
Other income
|
2
|
|
2
|
|
|||
|
Total revenues
|
40,459
|
|
78,686
|
|
|||
|
Expenses:
|
|||||||
|
Interest expense
|
5,226
|
|
11,475
|
|
|||
|
Payroll expense
|
9,086
|
|
19,697
|
|
|||
|
Professional fees
|
770
|
|
1,800
|
|
|||
|
Change in future policy benefits
|
2,077
|
|
4,363
|
|
|||
|
Mortality expenses
|
5,688
|
|
10,710
|
|
|||
|
Commission expense
|
1,723
|
|
2,825
|
|
|||
|
Depreciation and amortization
|
862
|
|
4,379
|
|
|||
|
Other expenses
|
4,232
|
|
9,975
|
|
|||
|
Total expenses
|
29,664
|
|
65,224
|
|
|||
|
Less: provision for income taxes
|
3,796
|
|
5,525
|
|
|||
|
Income from discontinued operations, net
|
$
|
6,999
|
|
$
|
7,937
|
|
|
The following table presents the cash flows from discontinued operations for the periods indicated:
|
Year Ended December 31,
|
|||||||
|
|
2015
|
2014
|
|||||
|
Net cash provided by (used in):
|
|||||||
|
Operating activities
|
$
|
(6,198
|
)
|
$
|
16,045
|
|
|
|
Investing activities
(1)
|
11,866
|
|
(2,967
|
)
|
|||
|
Financing activities
|
(5,000
|
)
|
(7,667
|
)
|
|||
|
Net cash flows provided by discontinued operations
|
$
|
668
|
|
$
|
5,411
|
|
|
|
(1)
|
Amount excludes
$7,765
of non-controlling interests sold in connection with the sale of PFG.
|
(5) Operating Segment Data
The Company has
four
reportable operating segments, which are: (i) specialty insurance (formally known as insurance and insurance services), (ii) asset management, (iii) senior living (formally known as real estate), and (iv) specialty finance. The Company’s operating segments are organized in a manner that reflects how the chief operating decision maker, (CODM) views these strategic business units.
Each reportable segment’s income (loss) is reported before income taxes, discontinued operations and non-controlling interests.
Segment results incorporate the revenues and expenses of these subsidiaries since they commenced operations or were acquired.
In the fourth quarter of 2016, the Company made certain segment realignments in order to conform to the way the CODM internally evaluates segment performance. These realignments primarily consisted of the transfer of principal investments from corporate and other to the specialty insurance and asset management operating segments. As a result, corporate and other is no longer deemed to be an operating segment of the Company. For the year ended December 31, 2015,
$(9,914)
of pretax income (loss) previously reported in corporate and other was allocated
$2,234
and
$(12,148)
to the specialty insurance and asset management operating segments, respectively. For the year ended December 31, 2014,
$10,715
of pretax income previously reported in corporate and other was allocated to the asset management operating segment. For the years ended December 31, 2015 and 2014, inclusive of what was allocated to the asset management operating segment was
$(11,020)
and
$7,755
of net income (loss) attributable to consolidated CLOs. The Company has reclassified prior period amounts to provide visibility and
F- 31
TIPTREE INC. AND SUBSIDIARIES
Notes to Consolidated Financial Statements
December 31, 2016
(in thousands, except share data)
comparability. This reclassification had no impact on the allocation of goodwill to reporting units. None of these changes impacts the Company’s previously reported consolidated net income or earnings per share.
Descriptions of each of the reportable segments are as follows:
Specialty Insurance
operations are conducted through Fortegra Financial Corporation (Fortegra), an insurance holding company. Fortegra underwrites and provides specialty insurance products, primarily in the United States, and is a leading provider of credit insurance and asset protection products. Fortegra’s diverse range of products and services include products such as mobile protection, extended warranty and service, debt protection and credit insurance and select niche personal and commercial lines insurance. The specialty insurance segment also includes results related to our corporate loans and non-performing residential mortgage loans.
Asset Management
operations are primarily conducted through Telos Asset Management LLC’s (Telos) management of CLOs. Telos is a subsidiary of Tiptree Asset Management Company, LLC (TAMCO), an SEC-registered investment advisor owned by the Company. Results include net income (loss) from consolidated CLOs.
Senior Living
operations are conducted through Care Investment Trust LLC (Care), a wholly-owned subsidiary of Tiptree, which has a geographically diverse portfolio of seniors housing properties including senior apartments, assisted living, independent living, memory care and skilled nursing facilities in the U.S.
Specialty Finance
operations are conducted through Siena Capital Finance LLC (Siena), which commenced operations in April 2013, and the Company’s mortgage businesses, which consist of Luxury, which was acquired in January 2014, and Reliance, which was acquired in July 2015. The Company’s mortgage origination business originated loans for sale to institutional investors, including GSEs and FHA/VA. Siena’s business consists of structuring asset-based loan facilities across diversified industries.
The tables below present the components of revenue, expense, pre-tax income (loss), and segment assets for each of the operating segments for the following periods:
|
Year Ended December 31, 2016
|
|||||||||||||||||||||||
|
Specialty insurance
|
Asset management
|
Senior living
|
Specialty finance
|
Corporate and other
|
Total
|
||||||||||||||||||
|
Total revenue
|
$
|
394,170
|
|
$
|
13,114
|
|
$
|
60,731
|
|
$
|
95,431
|
|
$
|
3,708
|
|
$
|
567,154
|
|
|||||
|
Total expense
|
347,366
|
|
8,104
|
|
66,555
|
|
87,261
|
|
34,806
|
|
544,092
|
|
|||||||||||
|
Net income (loss) attributable to consolidated CLOs
|
—
|
|
20,254
|
|
—
|
|
—
|
|
—
|
|
20,254
|
|
|||||||||||
|
Income (loss) before taxes from continuing operations
|
$
|
46,804
|
|
$
|
25,264
|
|
$
|
(5,824
|
)
|
$
|
8,170
|
|
$
|
(31,098
|
)
|
$
|
43,316
|
|
|||||
|
Less: provision for income taxes
|
10,978
|
|
|||||||||||||||||||||
|
Net income before non-controlling interests
|
$
|
32,338
|
|
||||||||||||||||||||
|
Less: net income attributable to non-controlling interests from continuing operations and discontinued operations
|
7,018
|
|
|||||||||||||||||||||
|
Net income (loss) attributable to Tiptree Inc. Class A common stockholders
|
$
|
25,320
|
|
||||||||||||||||||||
F- 32
TIPTREE INC. AND SUBSIDIARIES
Notes to Consolidated Financial Statements
December 31, 2016
(in thousands, except share data)
|
Year Ended December 31, 2015
|
|||||||||||||||||||||||
|
Specialty insurance
(1)
|
Asset management
(1)
|
Senior living
|
Specialty finance
|
Corporate and other
(1)
|
Total
|
||||||||||||||||||
|
Total revenue
|
$
|
330,888
|
|
$
|
6,770
|
|
$
|
46,128
|
|
$
|
54,999
|
|
$
|
(326
|
)
|
$
|
438,459
|
|
|||||
|
Total expense
|
298,876
|
|
6,634
|
|
55,663
|
|
48,734
|
|
34,102
|
|
444,009
|
|
|||||||||||
|
Net income (loss) attributable to consolidated CLOs
|
—
|
|
(6,889
|
)
|
—
|
|
—
|
|
—
|
|
(6,889
|
)
|
|||||||||||
|
Income (loss) before taxes from continuing operations
|
$
|
32,012
|
|
$
|
(6,753
|
)
|
$
|
(9,535
|
)
|
$
|
6,265
|
|
$
|
(34,428
|
)
|
$
|
(12,439
|
)
|
|||||
|
Less: (benefit) for income taxes
|
1,377
|
|
|||||||||||||||||||||
|
Discontinued operations
|
22,618
|
|
|||||||||||||||||||||
|
Net income before non-controlling interests
|
$
|
8,802
|
|
||||||||||||||||||||
|
Less: net income attributable to non-controlling interests from continuing operations and discontinued operations
|
3,023
|
|
|||||||||||||||||||||
|
Net income (loss) attributable to Tiptree Inc. Class A common stockholders
|
$
|
5,779
|
|
||||||||||||||||||||
(1) Reclassified to conform to current year presentation
|
Year Ended December 31, 2014
|
|||||||||||||||||||||||
|
Specialty insurance
|
Asset management
(1)
|
Senior living
|
Specialty finance
|
Corporate and other
(1)
|
Total
|
||||||||||||||||||
|
Total revenue
|
$
|
26,175
|
|
$
|
7,118
|
|
$
|
29,281
|
|
$
|
15,223
|
|
$
|
2,516
|
|
$
|
80,313
|
|
|||||
|
Total expense
|
29,346
|
|
8,452
|
|
26,110
|
|
17,185
|
|
17,957
|
|
99,050
|
|
|||||||||||
|
Net income (loss) attributable to consolidated CLOs
|
—
|
|
19,525
|
|
—
|
|
—
|
|
—
|
|
19,525
|
|
|||||||||||
|
Income (loss) before taxes from continuing operations
|
$
|
(3,171
|
)
|
$
|
18,191
|
|
$
|
3,171
|
|
$
|
(1,962
|
)
|
$
|
(15,441
|
)
|
$
|
788
|
|
|||||
|
Less: (benefit) for income taxes
|
4,141
|
|
|||||||||||||||||||||
|
Discontinued operations
|
7,937
|
|
|||||||||||||||||||||
|
Net income before non-controlling interests
|
$
|
4,584
|
|
||||||||||||||||||||
|
Less: net income attributable to non-controlling interests from continuing operations and discontinued operations
|
6,294
|
|
|||||||||||||||||||||
|
Net income (loss) attributable to Tiptree Inc. Class A common stockholders
|
$
|
(1,710
|
)
|
||||||||||||||||||||
(1) Reclassified to conform to current year presentation
|
The following table presents the segment assets for the following periods:
|
|||||||||||||||||||||||
|
Specialty insurance
|
Asset management
|
Senior living
|
Specialty finance
|
Corporate and other
|
Total
|
||||||||||||||||||
|
Segment Assets as of December 31, 2016
|
|||||||||||||||||||||||
|
Segment assets
|
$
|
1,268,152
|
|
$
|
17,427
|
|
$
|
323,169
|
|
$
|
271,795
|
|
$
|
20,012
|
|
$
|
1,900,555
|
|
|||||
|
Assets of consolidated CLOs
|
—
|
|
989,495
|
|
—
|
|
—
|
|
—
|
|
989,495
|
|
|||||||||||
|
Total assets
|
$
|
2,890,050
|
|
||||||||||||||||||||
|
Segment Assets as of December 31, 2015
(1)
|
|||||||||||||||||||||||
|
Segment assets
|
$
|
1,055,524
|
|
$
|
197,290
|
|
$
|
230,546
|
|
$
|
208,201
|
|
$
|
74,597
|
|
$
|
1,766,158
|
|
|||||
|
Assets of consolidated CLOs
|
—
|
|
728,812
|
|
—
|
|
—
|
|
—
|
|
728,812
|
|
|||||||||||
|
Total assets
|
$
|
2,494,970
|
|
||||||||||||||||||||
(1) Reclassified to conform to current year presentation
F- 33
TIPTREE INC. AND SUBSIDIARIES
Notes to Consolidated Financial Statements
December 31, 2016
(in thousands, except share data)
(6) Investments
Available for Sale Securities, at fair value
All of the Company’s investments in available for sale securities as of
December 31, 2016
and
December 31, 2015
are held by a subsidiary in the specialty insurance business. The following tables present the Company's investments in available for sale securities:
|
As of December 31, 2016
|
|||||||||||||||
|
Amortized cost
|
Gross
unrealized gains |
Gross
unrealized losses |
Fair value
|
||||||||||||
|
U.S. Treasury securities and obligations of U.S. government authorities and agencies
|
$
|
27,149
|
|
$
|
27
|
|
$
|
(377
|
)
|
$
|
26,799
|
|
|||
|
Obligations of state and political subdivisions
|
57,425
|
|
107
|
|
(598
|
)
|
56,934
|
|
|||||||
|
Corporate securities
|
58,769
|
|
204
|
|
(402
|
)
|
58,571
|
|
|||||||
|
Asset backed securities
|
1,459
|
|
1
|
|
—
|
|
1,460
|
|
|||||||
|
Certificates of deposit
|
895
|
|
—
|
|
—
|
|
895
|
|
|||||||
|
Equity securities
|
818
|
|
3
|
|
(37
|
)
|
784
|
|
|||||||
|
Obligations of foreign governments
|
733
|
|
3
|
|
(8
|
)
|
728
|
|
|||||||
|
Total
|
$
|
147,248
|
|
$
|
345
|
|
$
|
(1,422
|
)
|
$
|
146,171
|
|
|||
|
As of December 31, 2015
|
|||||||||||||||
|
Amortized cost
|
Gross
unrealized gains |
Gross
unrealized losses |
Fair value
|
||||||||||||
|
U.S. Treasury securities and obligations of U.S. government authorities and agencies
|
$
|
53,274
|
|
$
|
83
|
|
$
|
(221
|
)
|
$
|
53,136
|
|
|||
|
Obligations of state and political subdivisions
|
51,942
|
|
466
|
|
(73
|
)
|
52,335
|
|
|||||||
|
Corporate securities
|
68,400
|
|
89
|
|
(651
|
)
|
67,838
|
|
|||||||
|
Asset backed securities
|
1,525
|
|
4
|
|
—
|
|
1,529
|
|
|||||||
|
Certificates of deposit
|
893
|
|
—
|
|
—
|
|
893
|
|
|||||||
|
Equity securities
|
6,081
|
|
106
|
|
(79
|
)
|
6,108
|
|
|||||||
|
Obligations of foreign governments
|
2,931
|
|
—
|
|
(67
|
)
|
2,864
|
|
|||||||
|
Total
|
$
|
185,046
|
|
$
|
748
|
|
$
|
(1,091
|
)
|
$
|
184,703
|
|
|||
F- 34
TIPTREE INC. AND SUBSIDIARIES
Notes to Consolidated Financial Statements
December 31, 2016
(in thousands, except share data)
The following tables summarize the gross unrealized losses on available for sale securities in an unrealized loss position:
|
As of December 31, 2016
|
|||||||||||||||||||||
|
Less Than or Equal to One Year
|
More Than One Year
|
||||||||||||||||||||
|
Fair value
|
Gross
unrealized losses |
# of Securities
|
Fair value
|
Gross unrealized losses
|
# of Securities
|
||||||||||||||||
|
U.S. Treasury securities and obligations of U.S. government authorities and agencies
|
$
|
20,979
|
|
$
|
(376
|
)
|
115
|
|
$
|
16
|
|
$
|
(1
|
)
|
5
|
|
|||||
|
Obligations of state and political subdivisions
|
41,639
|
|
(597
|
)
|
170
|
|
1,334
|
|
(1
|
)
|
3
|
|
|||||||||
|
Corporate securities
|
29,856
|
|
(400
|
)
|
279
|
|
253
|
|
(2
|
)
|
3
|
|
|||||||||
|
Asset-backed securities
|
706
|
|
—
|
|
1
|
|
—
|
|
—
|
|
—
|
|
|||||||||
|
Equity securities
|
736
|
|
(35
|
)
|
5
|
|
19
|
|
(2
|
)
|
2
|
|
|||||||||
|
Obligations of foreign governments
|
338
|
|
(8
|
)
|
4
|
|
—
|
|
—
|
|
—
|
|
|||||||||
|
Total
|
$
|
94,254
|
|
$
|
(1,416
|
)
|
574
|
|
$
|
1,622
|
|
$
|
(6
|
)
|
13
|
|
|||||
|
As of December 31, 2015
|
|||||||||||||||||||||
|
Less Than or Equal to One Year
|
More Than One Year
|
||||||||||||||||||||
|
Fair value
|
Gross
unrealized losses |
# of Securities
|
Fair value
|
Gross unrealized losses
|
# of Securities
|
||||||||||||||||
|
U.S. Treasury securities and obligations of U.S. government authorities and agencies
|
$
|
35,588
|
|
$
|
(221
|
)
|
146
|
|
$
|
—
|
|
$
|
—
|
|
—
|
|
|||||
|
Obligations of state and political subdivisions
|
18,500
|
|
(59
|
)
|
45
|
|
400
|
|
(14
|
)
|
2
|
|
|||||||||
|
Corporate securities
|
56,373
|
|
(634
|
)
|
302
|
|
267
|
|
(17
|
)
|
6
|
|
|||||||||
|
Equity securities
|
1,998
|
|
(79
|
)
|
8
|
|
—
|
|
—
|
|
—
|
|
|||||||||
|
Obligations of foreign governments
|
2,863
|
|
(67
|
)
|
18
|
|
—
|
|
—
|
|
—
|
|
|||||||||
|
Total
|
$
|
115,322
|
|
$
|
(1,060
|
)
|
519
|
|
$
|
667
|
|
$
|
(31
|
)
|
8
|
|
|||||
The Company does not intend to sell the investments that were in an unrealized loss position at
December 31, 2016
, and management believes that it is more likely than not that the Company will be able to hold these securities until full recovery of their amortized cost basis for fixed maturity securities or cost for equity securities. The unrealized losses were attributable to changes in interest rates and not credit-related issues. As of
December 31, 2016
, based on the Company's review, none of the fixed maturity or equity securities were deemed to be other-than-temporarily impaired based on the Company's analysis of the securities and its intent to hold the securities until recovery. There have been no other-than-temporary impairments recorded by the Company for the three year period ended December 31, 2016.
The amortized cost and fair values of investments in debt securities, by contractual maturity date, are shown below. Expected maturities may differ from contractual maturities because borrowers may have the right to call or prepay obligations with or without call or prepayment penalties. Excluded from this table are equity securities since they have no contractual maturity.
|
As of
|
|||||||||||||||
|
December 31, 2016
|
December 31, 2015
|
||||||||||||||
|
Amortized Cost
|
Fair Value
|
Amortized Cost
|
Fair Value
|
||||||||||||
|
Due in one year or less
|
$
|
22,846
|
|
$
|
22,833
|
|
$
|
20,347
|
|
$
|
20,319
|
|
|||
|
Due after one year through five years
|
66,063
|
|
65,841
|
|
76,967
|
|
76,578
|
|
|||||||
|
Due after five years through ten years
|
49,036
|
|
48,381
|
|
56,133
|
|
56,240
|
|
|||||||
|
Due after ten years
|
7,026
|
|
6,872
|
|
23,993
|
|
23,929
|
|
|||||||
|
Asset backed securities
|
1,459
|
|
1,460
|
|
1,525
|
|
1,529
|
|
|||||||
|
Total
|
$
|
146,430
|
|
$
|
145,387
|
|
$
|
178,965
|
|
$
|
178,595
|
|
|||
F- 35
TIPTREE INC. AND SUBSIDIARIES
Notes to Consolidated Financial Statements
December 31, 2016
(in thousands, except share data)
Pursuant to certain reinsurance agreements and statutory licensing requirements, the Company has deposited invested assets in custody accounts or insurance department safekeeping accounts. The Company cannot remove invested assets from these accounts without prior approval of the contractual party or regulatory authority, as applicable. The following table presents the Company's restricted investments included in the Company's available for sale securities:
|
As of December 31,
|
|||||||
|
2016
|
2015
|
||||||
|
Fair value of restricted investments for special deposits required by state insurance departments
|
$
|
10,111
|
|
$
|
10,250
|
|
|
|
Fair value of restricted investments in trust pursuant to reinsurance agreements
|
7,573
|
|
7,821
|
|
|||
|
Total fair value of restricted investments
|
$
|
17,684
|
|
$
|
18,071
|
|
|
The following table presents additional information on the Company’s available for sale securities:
|
Year Ended December 31,
|
|||||||||||
|
2016
|
2015
|
2014
|
|||||||||
|
Purchases of available for sale securities
|
$
|
24,652
|
|
$
|
75,275
|
|
$
|
7,026
|
|
||
|
Proceeds from maturities, calls and prepayments of available for sale securities
|
$
|
27,859
|
|
$
|
39,062
|
|
$
|
1,192
|
|
||
|
Gains (losses) realized on maturities, calls and prepayments of available for sale securities
|
$
|
87
|
|
$
|
(62
|
)
|
$
|
4
|
|
||
|
Gross proceeds from sales of available for sale securities
|
$
|
66,891
|
|
$
|
20,353
|
|
$
|
783
|
|
||
|
Gains (losses) realized on sales of available for sale securities
|
$
|
938
|
|
$
|
4
|
|
$
|
—
|
|
||
Investment in Loans
The following table presents the Company’s investments in loans, measured at fair value and amortized cost:
|
As of December 31,
|
|||||||
|
2016
|
2015
|
||||||
|
Loans, at fair value
|
|||||||
|
Corporate loans
|
$
|
175,558
|
|
$
|
233,861
|
|
|
|
Mortgage loans held for sale
|
121,439
|
|
120,836
|
|
|||
|
Non-performing loans
|
74,923
|
|
38,289
|
|
|||
|
Other loans receivable
|
1,169
|
|
1,409
|
|
|||
|
Total loans, at fair value
|
$
|
373,089
|
|
$
|
394,395
|
|
|
|
Loans at amortized cost, net
|
|||||||
|
Asset backed loans and other loans, net
|
115,033
|
|
52,994
|
|
|||
|
Less: Allowance for loan losses
|
1,195
|
|
463
|
|
|||
|
Total l
oans at amortized cost, net
|
$
|
113,838
|
|
$
|
52,531
|
|
|
|
Net deferred loan origination fees included in asset backed loans
|
$
|
5,244
|
|
$
|
3,520
|
|
|
Loans, at fair value
Corporate Loans
Corporate loans that have been pledged as collateral totaled
$175,365
at December 31, 2016 and
$240,441
at December 31, 2015. Corporate loans primarily include syndicated leveraged loans held by the Company, which consist of
$175,558
and
$233,861
in loans as of
December 31, 2016
and
December 31, 2015
, respectively. As of
December 31, 2016
and
December 31, 2015
, the unpaid principal balance on these loans was
$176,808
and
$242,693
, respectively.
F- 36
TIPTREE INC. AND SUBSIDIARIES
Notes to Consolidated Financial Statements
December 31, 2016
(in thousands, except share data)
As of
December 31, 2016
and
December 31, 2015
, the difference between fair value of the Corporate loans and the unpaid principal balance was
$1,250
and
$8,832
, respectively.
Mortgage Loans Held for Sale
Mortgage loans held for sale that have been pledged as collateral totaled
$117,734
at
December 31, 2016
and
$112,743
at
December 31, 2015
. As of
December 31, 2016
, the fair value of mortgage loans exceeded the unpaid principal balance of
$118,162
by
$3,277
. The unpaid principal balance and fair value of mortgage loans held for sale that are 90 days or more past due were
$142
and
$66
, respectively, as of
December 31, 2016
. The unpaid principal balance and fair value of mortgage loans held for sale that are 90 days or more past due were
$142
and
$82
, respectively, as of
December 31, 2015
. The Company discontinues accruing interest on all loans that are 90 days or more past due.
Non-Performing Loans (NPLs)
Non-performing loans that have been pledged as collateral totaled
$60,409
at December 31, 2016. As of
December 31, 2016
and
December 31, 2015
, the Company’s investments included
$74,923
and
$38,289
, respectively, of non-performing loans collateralized by real estate of which the unpaid principal balance was
$113,892
and
$61,676
, respectively. As of
December 31, 2016
and
December 31, 2015
, the difference between the fair value of the NPLs and the unpaid principal balance was
$(38,969)
and
$(23,387)
, respectively. Included in real estate, net as of
December 31, 2016
and
December 31, 2015
are
$13,366
and
$2,197
, respectively, of foreclosed residential real estate property resulting from the conversion of an NPL to REO.
Loans at amortized cost, net
Asset Backed Loans
Asset backed loans that have been pledged as collateral totaled
$119,558
at December 31, 2016 and
$55,814
at December 31, 2015. As of
December 31, 2016
and
December 31, 2015
, the Company held
$113,138
and
$51,831
, respectively, of loans receivable, net, attributable to a subsidiary in our specialty finance business. Our subsidiary structures asset-based loan facilities in the
$1,000
to
$25,000
range for small to mid-sized companies. Collateral for asset-backed loan receivables, as of
December 31, 2016
and
December 31, 2015
, consisted primarily of inventory, equipment and accounts receivable. Management reviews collateral for these loans on at least a monthly basis or more frequently if a draw is requested and management has determined that no impairment existed as of
December 31, 2016
. As of
December 31, 2016
, there were no delinquencies in the portfolio and all loans were classified as performing.
Real Estate, net
The following table contains information regarding the Company’s investment in real estate as of the following periods:
|
As of December 31, 2016
|
|||||||||||||||
|
Land
|
Buildings and equipment
|
Accumulated depreciation
|
Total
|
||||||||||||
|
Managed properties
|
$
|
16,347
|
|
$
|
189,463
|
|
$
|
(11,212
|
)
|
$
|
194,598
|
|
|||
|
Triple net lease properties
|
13,778
|
|
94,291
|
|
(6,610
|
)
|
101,459
|
|
|||||||
|
Foreclosed residential real estate property
|
—
|
|
13,366
|
|
—
|
|
13,366
|
|
|||||||
|
Total
|
$
|
30,125
|
|
$
|
297,120
|
|
$
|
(17,822
|
)
|
$
|
309,423
|
|
|||
|
As of December 31, 2015
|
|||||||||||||||
|
Land
|
Buildings and equipment
|
Accumulated depreciation
|
Total
|
||||||||||||
|
Managed properties
|
$
|
9,905
|
|
$
|
113,396
|
|
$
|
(5,842
|
)
|
$
|
117,459
|
|
|||
|
Triple net lease properties
|
12,173
|
|
77,161
|
|
(4,118
|
)
|
85,216
|
|
|||||||
|
Foreclosed residential real estate property
|
—
|
|
2,197
|
|
—
|
|
2,197
|
|
|||||||
|
Other real estate
|
—
|
|
1,675
|
|
(389
|
)
|
1,286
|
|
|||||||
|
Total
|
$
|
22,078
|
|
$
|
194,429
|
|
$
|
(10,349
|
)
|
$
|
206,158
|
|
|||
F- 37
TIPTREE INC. AND SUBSIDIARIES
Notes to Consolidated Financial Statements
December 31, 2016
(in thousands, except share data)
For the
year ended December 31, 2016
, the Company acquired
two
senior living facilities accounted for as asset acquisitions, with
$17,777
of real estate acquired, and
$3,308
of identifiable intangible assets related to in-place leases which will be amortized over approximately
12
years. These
two
properties are in addition to the
three
acquisitions disclosed in Note—
(3) Acquisitions
, which were accounted for as business combinations.
Depreciation expense related to the Company’s real estate investments was
$7,851
,
$5,509
and
$2,768
for the years ended December 31, 2016,
2015
and
2014
, respectively.
Future Minimum Rental Revenue
The following table presents the future minimum rental revenue under the noncancelable terms of all operating leases as of:
|
December 31, 2016
|
|||
|
2017
|
$
|
7,232
|
|
|
2018
|
7,335
|
|
|
|
2019
|
7,441
|
|
|
|
2020
|
7,550
|
|
|
|
2021
|
7,662
|
|
|
|
Thereafter
|
31,042
|
|
|
|
Total
|
$
|
68,262
|
|
The schedule of minimum future rental revenue excludes residential lease agreements, generally having terms of one year or less. Rental revenues from residential leases were
$47,147
,
$36,551
and
$15,803
for the years ended December 31, 2016,
2015
and
2014
, respectively.
Net Investment Income
Net investment income represents income primarily from the following sources:
|
•
|
Interest income, and dividends related to available for sale securities, at fair value.
|
|
•
|
Interest income related to loans, at fair value.
|
|
•
|
Dividend income from equity securities, trading, at fair value
|
|
•
|
Rental and related revenue from real estate, net
|
|
•
|
Earnings from other investments.
|
The following table presents the components of net investment income related to our specialty insurance business recorded on the Consolidated Statements of Operations:
|
Year Ended December 31,
|
|||||||||||
|
Net investment income
|
2016
|
2015
|
2014
|
||||||||
|
Available for sale securities, at fair value
|
$
|
3,075
|
|
$
|
3,166
|
|
$
|
212
|
|
||
|
Loans, at fair value
|
7,999
|
|
2,426
|
|
—
|
|
|||||
|
Equity securities, trading, at fair value
|
2,981
|
|
369
|
|
76
|
|
|||||
|
Real estate, net
|
166
|
|
—
|
|
—
|
|
|||||
|
Other investments
|
302
|
|
286
|
|
30
|
|
|||||
|
Total investment income
|
14,523
|
|
6,247
|
|
318
|
|
|||||
|
Less: investment expenses
|
1,542
|
|
792
|
|
39
|
|
|||||
|
Net investment income
|
$
|
12,981
|
|
$
|
5,455
|
|
$
|
279
|
|
||
F- 38
TIPTREE INC. AND SUBSIDIARIES
Notes to Consolidated Financial Statements
December 31, 2016
(in thousands, except share data)
The following table presents the components of net realized and unrealized gains (losses) recorded on the Consolidated Statements of Operations:
|
Year Ended December 31,
|
|||||||||||
|
Net realized and unrealized gains (losses)
|
2016
|
2015
|
2014
|
||||||||
|
Net realized gains (losses)
|
70,811
|
|
32,088
|
|
13,665
|
|
|||||
|
Net unrealized gains (losses)
|
16,489
|
|
(813
|
)
|
844
|
|
|||||
|
Net realized and unrealized gains (losses)
|
$
|
87,300
|
|
$
|
31,275
|
|
$
|
14,509
|
|
||
Included in net realized gains (losses) is gain on sale of loans held for sale, net of
$68,181
,
$33,849
and
$7,154
for the years ended December 31, 2016, 2015 and 2014, respectively.
Net unrealized gains recognized during the years ended December 31, 2016, 2015 and 2014 on equity securities, trading, at fair value still held at
December 31, 2016
, 2015 and 2014 was
$6,032
,
$256
and
$0
, respectively.
(7) Fair Value of Financial Instruments
The Company maximizes the use of observable inputs and minimizes the use of unobservable inputs to the extent possible to measure a financial instrument’s fair value. Observable inputs reflect the assumptions market participants would use in pricing an asset or liability, and are affected by the type of product, whether the product is traded on an active exchange or in the secondary market, as well as current market conditions. To the extent that valuation is based on models or inputs that are less observable or unobservable in the market, the determination of fair value requires more judgment. In certain cases, the inputs used to measure fair value may fall into different levels of the fair value hierarchy. In such cases, for disclosure purposes, the level in the fair value hierarchy within which the fair value measurement in its entirety falls is determined based on the lowest level input that is significant to the fair value measurement in its entirety. Fair value is estimated by applying the hierarchy discussed in Note—
(2) Summary of Significant Accounting Policies
, which prioritizes the inputs used to measure fair value into three levels and bases the categorization within the hierarchy upon the lowest level of input that is available and significant to the fair value measurement. Accordingly, the degree of judgment exercised by the Company in determining fair value is greatest for instruments categorized within Level 3 of the fair value hierarchy.
The Company’s fair value measurement is based primarily on a market approach, which utilizes prices and other relevant information generated by market transactions involving identical or comparable financial instruments. Sources of inputs to the market approach include third-party pricing services, independent broker quotations and pricing matrices. Management analyzes the third party valuation methodologies and its related inputs to perform assessments to determine the appropriate level within the fair value hierarchy and to assess reliability of values. Further, management has a process in place to review all changes in fair value that occurred during each measurement period. Any discrepancies or unusual observations are followed through to resolution through the source of the pricing as well as utilizing comparisons, if applicable, to alternate pricing sources. In addition, the Company utilizes an income approach to measure the fair value of NPLs, as discussed below.
The Company utilizes observable and unobservable inputs within its valuation methodologies. Observable inputs may include: benchmark yields, reported trades, broker-dealer quotes, issuer spreads, benchmark securities, bids, offers and reference data. In addition, specific issuer information and other market data is used. Broker quotes are obtained from sources recognized to be market participants. Unobservable inputs may include: expected cash flow streams, default rates, supply and demand considerations and market volatility.
Available for Sale Securities
Available for sale securities are generally classified within either Level 1 or Level 2 of the fair value hierarchy and are based on prices provided by an independent pricing service and a third party investment manager who provide a single price or quote per security.
The following details the methods and assumptions used to estimate the fair value of each class of available for sale securities and the applicable level each security falls within the fair value hierarchy:
U.S Treasury Securities, Obligations of U.S. Government Authorities and Agencies, Obligations of State and Political Subdivisions, Corporate Securities, Asset-Backed Securities, and Obligations of Foreign Governments:
Fair values were obtained from an independent pricing service and a third party investment manager. The prices provided by the independent
F- 39
TIPTREE INC. AND SUBSIDIARIES
Notes to Consolidated Financial Statements
December 31, 2016
(in thousands, except share data)
pricing service are based on quoted market prices, when available, non-binding broker quotes, or matrix pricing and fall under Level 2 of the fair value hierarchy.
Certificates of Deposit:
The estimated fair value of certificates of deposit approximate carrying value and fall under Level 1 of the fair value hierarchy.
Equity Securities:
The fair values of publicly traded common and preferred stocks were obtained from market value quotations provided by an independent pricing service and fall under Level 1 of the fair value hierarchy. The fair values of non-publicly traded common and preferred stocks were based on prices obtained from an independent pricing service using unobservable inputs and fall under Level 3 of the fair value hierarchy.
Derivative Assets and Liabilities:
Derivatives are comprised of credit default swaps (CDS), index credit default swaps (CDX), interest rate lock commitments (IRLC), to be announced mortgage backed securities (TBA) and interest rate swaps (IRS). The fair value of these instruments is based upon valuation pricing models, which represent the amount the Company would expect to receive or pay at the balance sheet date to exit the position. In general, the fair value of CDSs and CDXs are based on dealer quotes. Because significant inputs, other than unadjusted quoted prices in active markets are used to determine the dealer quotes, such as price volatility, the Company classifies them as Level 2 in the fair value hierarchy. The fair value of IRS is based upon either valuation pricing models, which represent the amount the Company would expect to pay at the balance sheet date if the contracts were exited, or by obtaining broker or counterparty quotes. Because there are observable inputs used to arrive at these prices, the Company has classified IRS within Level 2 of the fair value hierarchy. Our mortgage origination subsidiaries issue IRLCs to its customers, which are carried at estimated fair value on the Company’s Consolidated Balance Sheet. The estimated fair values of these commitments are generally calculated by reference to the value of the underlying loan associated with the IRLC net of costs to produce and an expected fall out assumption. The fair values of these commitments generally result in a Level 3 classification. Our mortgage origination subsidiaries manage their exposure by entering into forward delivery commitments with loan investors. For loans not locked with investors under a forward delivery commitment, the Company enters into hedge instruments, primarily TBAs, to protect against movements in interest rates. The fair values of TBA mortgage backed securities generally result in a Level 2 classification.
Trading Assets and Liabilities:
Trading assets and liabilities consist primarily of privately held equity securities, exchange-traded equity securities, CLOs, collateralized debt obligations (CDOs), derivative assets and liabilities, tax exempt securities, and U.S. Treasury short positions. The fair value of privately held equity securities are based on quotes obtained from dealers or internally developed valuation models. Because significant inputs used to determine the dealer quotes or model values are not observable, such as projected future earnings and price volatility, the Company has classified them within Level 3 of the fair value hierarchy. The Company’s U.S. Treasury short position is priced through dealer indicative quotes and as such is classified as Level 2. Trading assets are presented in the consolidated balance sheets within equity securities, trading, at fair value and other investments. Trading liabilities are included within other liabilities and accrued expenses.
Positions in securitized products such as CLOs and CDOs are based on quotes obtained from dealers and valuation models. When these quotes are based directly or indirectly on observable inputs such as quoted prices for similar assets exchanged in an active or inactive market, the Company has classified them within Level 2 of the fair value hierarchy. If these quotes are based on valuation models using unobservable inputs such as expected future cash flows, default rates, supply and demand considerations, and market volatility, the Company has classified them within Level 3 of the fair value hierarchy.
The fair value of tax exempt securities is determined by obtaining quotes from independent pricing services. In most cases, quotes are obtained from two pricing services and the average of both quotes is used. The independent pricing services determine their quotes using observable inputs such as current interest rates, specific issuer information and other market data for such securities. Therefore, the estimate of fair value is subject to a high degree of variability based upon market conditions, the availability of issuer information and the assumptions made. The valuation inputs used to arrive at fair value for such debt obligations are generally classified within Level 2 or Level 3 of the fair value hierarchy.
Nonperforming loans and REO:
The Company determines the purchase price for NPLs at the time of acquisition and for each subsequent valuation by using a discounted cash flow valuation model and considering alternate loan resolution probabilities, including modification, liquidation, or conversion to REO. The significant unobservable inputs used in the fair value measurement of our NPLs are discount rates, loan resolution timeline, and the value of underlying properties. The fair values of NPLs which are making payments (generally based on a modification or a workout plan) are primarily based upon secondary market transaction prices, which are expressed as a percentage of unpaid principal balance (UPB). Observable inputs to the model include loan amounts, payment history, and property types. Our NPLs are on nonaccrual status at the time of purchase as it is probable that
F- 40
TIPTREE INC. AND SUBSIDIARIES
Notes to Consolidated Financial Statements
December 31, 2016
(in thousands, except share data)
principal or interest is not fully collectible. NPLs are included in loans, at fair value and fall under Level 3 of the fair value hierarchy.
NPLs that have become REOs were measured at fair value on a non-recurring basis during the
year ended December 31, 2016
(the Company did not have investments in REO status in prior year period). The carrying value of REOs at
December 31, 2016
was
$13,366
. Upon conversion to REO, the fair value is estimated using broker price opinion (BPO). BPOs are subject to judgments of a particular broker formed by visiting a property, assessing general home values in an area, reviewing comparable listings, and reviewing comparable completed sales. These judgments may vary among brokers and may fluctuate over time based on housing market activities and the influx of additional comparable listings and sales. REO is included in real estate, net.
The following tables present the Company’s fair value hierarchies for financial assets and liabilities, including the balances associated with the consolidated CLOs, measured on a recurring basis:
|
As of December 31, 2016
|
|||||||||||||||
|
Quoted prices in
active markets
Level 1
|
Other significant
observable inputs
Level 2
|
Significant unobservable inputs
Level 3
|
Fair value
|
||||||||||||
|
Assets:
|
|||||||||||||||
|
Available for sale securities, at fair value:
|
|||||||||||||||
|
Equity securities
|
$
|
736
|
|
$
|
—
|
|
$
|
48
|
|
$
|
784
|
|
|||
|
U.S. Treasury securities and U.S. government agencies
|
—
|
|
26,799
|
|
—
|
|
26,799
|
|
|||||||
|
Obligations of state and political subdivisions
|
—
|
|
56,934
|
|
—
|
|
56,934
|
|
|||||||
|
Obligations of foreign governments
|
—
|
|
728
|
|
—
|
|
728
|
|
|||||||
|
Certificates of deposit
|
895
|
|
—
|
|
—
|
|
895
|
|
|||||||
|
Asset backed securities
|
—
|
|
1,460
|
|
—
|
|
1,460
|
|
|||||||
|
Corporate bonds
|
—
|
|
58,571
|
|
—
|
|
58,571
|
|
|||||||
|
Total available for sale securities
|
1,631
|
|
144,492
|
|
48
|
|
146,171
|
|
|||||||
|
Loans, at fair value:
|
|
|
|
|
|
|
|
||||||||
|
Corporate loans
|
—
|
|
46,352
|
|
129,206
|
|
175,558
|
|
|||||||
|
Mortgage loans held for sale
|
—
|
|
121,439
|
|
—
|
|
121,439
|
|
|||||||
|
Non-performing loans
|
—
|
|
—
|
|
74,923
|
|
74,923
|
|
|||||||
|
Other loans receivable
|
—
|
|
—
|
|
1,169
|
|
1,169
|
|
|||||||
|
Total loans, at fair value
|
—
|
|
|
167,791
|
|
|
205,298
|
|
|
373,089
|
|
||||
|
Equity securities, trading, at fair value
|
48,612
|
|
—
|
|
—
|
|
48,612
|
|
|||||||
|
Other investments:
|
|||||||||||||||
|
Derivative assets:
|
|||||||||||||||
|
Interest rate swaps
|
—
|
|
1,388
|
|
—
|
|
1,388
|
|
|||||||
|
Interest rate lock commitments
|
—
|
|
—
|
|
4,872
|
|
4,872
|
|
|||||||
|
TBA
–
mortgage backed securities
|
—
|
|
1,678
|
|
—
|
|
1,678
|
|
|||||||
|
Credit derivatives
|
—
|
|
12,598
|
|
—
|
|
12,598
|
|
|||||||
|
Total derivative assets
|
—
|
|
15,664
|
|
4,872
|
|
20,536
|
|
|||||||
|
CLOs
|
—
|
|
—
|
|
974
|
|
974
|
|
|||||||
|
Debentures
|
—
|
|
3,957
|
|
—
|
|
3,957
|
|
|||||||
|
Total other investments
|
—
|
|
19,621
|
|
5,846
|
|
25,467
|
|
|||||||
|
Total financial instruments attributable to non-CLOs included in consolidated assets
|
50,243
|
|
|
331,904
|
|
|
211,192
|
|
|
593,339
|
|
||||
|
Financial instruments included in assets of consolidated CLOs:
|
|||||||||||||||
|
Loans, at fair value
|
—
|
|
342,370
|
|
585,870
|
|
928,240
|
|
|||||||
|
Total financial instruments included in assets of consolidated CLOs
|
—
|
|
342,370
|
|
585,870
|
|
928,240
|
|
|||||||
|
Total
|
$
|
50,243
|
|
|
$
|
674,274
|
|
|
$
|
797,062
|
|
|
$
|
1,521,579
|
|
F- 41
TIPTREE INC. AND SUBSIDIARIES
Notes to Consolidated Financial Statements
December 31, 2016
(in thousands, except share data)
|
As of December 31, 2016
|
|||||||||||||||
|
Quoted prices in
active markets
Level 1
|
Other significant
observable inputs
Level 2
|
Significant unobservable inputs
Level 3
|
Fair value
|
||||||||||||
|
Liabilities:
|
|||||||||||||||
|
Trading liabilities:
|
|||||||||||||||
|
Derivative liabilities:
|
|||||||||||||||
|
Interest rate swaps
|
$
|
—
|
|
$
|
1,042
|
|
$
|
—
|
|
$
|
1,042
|
|
|||
|
Forward delivery contracts
|
—
|
|
84
|
|
—
|
|
84
|
|
|||||||
|
TBA-mortgage backed securities
|
—
|
|
269
|
|
—
|
|
269
|
|
|||||||
|
Foreign currency forward contracts
|
—
|
|
3
|
|
—
|
|
3
|
|
|||||||
|
Total derivative liabilities
|
—
|
|
1,398
|
|
—
|
|
1,398
|
|
|||||||
|
Total trading liabilities (included in other liabilities and accrued expenses)
|
—
|
|
|
1,398
|
|
|
—
|
|
|
1,398
|
|
||||
|
Contingent consideration payable
|
—
|
|
—
|
|
1,852
|
|
1,852
|
|
|||||||
|
Preferred notes payable
|
—
|
|
—
|
|
1,232
|
|
1,232
|
|
|||||||
|
Total financial instruments attributable to Non-CLOs included in consolidated liabilities
|
—
|
|
|
1,398
|
|
|
3,084
|
|
4,482
|
|
|||||
|
Financial instruments included in liabilities of consolidated CLOs:
|
|||||||||||||||
|
Notes payable of CLOs
|
—
|
|
—
|
|
912,034
|
|
912,034
|
|
|||||||
|
Total financial instruments included in liabilities of consolidated CLOs
|
—
|
|
—
|
|
912,034
|
|
912,034
|
|
|||||||
|
Total
|
$
|
—
|
|
|
$
|
1,398
|
|
|
$
|
915,118
|
|
|
$
|
916,516
|
|
|
As of December 31, 2015
|
|||||||||||||||
|
Quoted prices in
active markets
Level 1
|
Other significant
observable inputs
Level 2
|
Significant unobservable inputs
Level 3
|
Fair value
|
||||||||||||
|
Assets:
|
|||||||||||||||
|
Available for sale securities, at fair value:
|
|||||||||||||||
|
Equity securities
|
$
|
6,060
|
|
$
|
—
|
|
$
|
48
|
|
$
|
6,108
|
|
|||
|
U.S. Treasury securities and U.S. government agencies
|
—
|
|
53,136
|
|
—
|
|
53,136
|
|
|||||||
|
Obligations of state and political subdivisions
|
—
|
|
52,335
|
|
—
|
|
52,335
|
|
|||||||
|
Obligations of foreign governments
|
—
|
|
2,864
|
|
—
|
|
2,864
|
|
|||||||
|
Certificates of deposit
|
893
|
|
—
|
|
—
|
|
893
|
|
|||||||
|
Asset backed securities
|
—
|
|
1,529
|
|
—
|
|
1,529
|
|
|||||||
|
Corporate bonds
|
—
|
|
67,838
|
|
—
|
|
67,838
|
|
|||||||
|
Total available for sale securities, at fair value
|
6,953
|
|
|
177,702
|
|
|
48
|
|
|
184,703
|
|
||||
|
Loans, at fair value
|
|||||||||||||||
|
Corporate loans
|
—
|
|
55,956
|
|
177,905
|
|
233,861
|
|
|||||||
|
Mortgage loans held for sale
|
—
|
|
120,836
|
|
—
|
|
120,836
|
|
|||||||
|
Non-performing loans
|
—
|
|
—
|
|
38,289
|
|
38,289
|
|
|||||||
|
Other loans receivable
|
—
|
|
125
|
|
1,284
|
|
1,409
|
|
|||||||
|
Total loans, at fair value
|
—
|
|
|
176,917
|
|
|
217,478
|
|
|
394,395
|
|
||||
|
Equity securities, trading, at fair value
|
3,786
|
|
—
|
|
8,941
|
|
12,727
|
|
|||||||
|
Other investments:
|
|||||||||||||||
|
Derivative assets:
|
|
||||||||||||||
|
Interest rate lock commitments
|
—
|
|
—
|
|
3,384
|
|
3,384
|
|
|||||||
|
TBA - mortgage backed securities
|
—
|
|
179
|
|
—
|
|
179
|
|
|||||||
|
Forward delivery contracts
|
—
|
|
—
|
|
11
|
|
11
|
|
|||||||
|
Credit derivatives
|
—
|
|
11,945
|
|
—
|
|
11,945
|
|
|||||||
|
Total derivative assets
|
—
|
|
12,124
|
|
3,395
|
|
15,519
|
|
|||||||
|
Tax exempt securities
|
—
|
|
1,732
|
|
8,314
|
|
10,046
|
|
|||||||
F- 42
TIPTREE INC. AND SUBSIDIARIES
Notes to Consolidated Financial Statements
December 31, 2016
(in thousands, except share data)
|
As of December 31, 2015
|
|||||||||||||||
|
Quoted prices in
active markets
Level 1
|
Other significant
observable inputs
Level 2
|
Significant unobservable inputs
Level 3
|
Fair value
|
||||||||||||
|
CLOs
|
—
|
|
—
|
|
1,768
|
|
1,768
|
|
|||||||
|
Debentures
|
—
|
|
4,191
|
|
—
|
|
4,191
|
|
|||||||
|
Total other investments
|
—
|
|
18,047
|
|
13,477
|
|
31,524
|
|
|||||||
|
Total financial instruments attributable to non-CLOs included in consolidated assets
|
10,739
|
|
|
372,666
|
|
|
239,944
|
|
|
623,349
|
|
||||
|
Financial instruments included in assets of consolidated CLOs:
|
|||||||||||||||
|
Loans, at fair value
|
—
|
|
159,892
|
|
520,892
|
|
680,784
|
|
|||||||
|
Total financial instruments included in assets of consolidated CLOs
|
—
|
|
|
159,892
|
|
|
520,892
|
|
|
680,784
|
|
||||
|
Total
|
$
|
10,739
|
|
|
$
|
532,558
|
|
|
$
|
760,836
|
|
|
$
|
1,304,133
|
|
|
Liabilities:
|
|||||||||||||||
|
Trading liabilities:
|
|||||||||||||||
|
U.S. Treasury securities
|
$
|
—
|
|
$
|
19,679
|
|
$
|
—
|
|
$
|
19,679
|
|
|||
|
Total trading liabilities
|
—
|
|
|
19,679
|
|
|
—
|
|
|
19,679
|
|
||||
|
Derivative liabilities:
|
|||||||||||||||
|
Interest rate swaps
|
—
|
|
2,310
|
|
—
|
|
2,310
|
|
|||||||
|
Forward delivery contracts
|
—
|
|
8
|
|
—
|
|
8
|
|
|||||||
|
TBA-mortgage backed securities
|
—
|
|
150
|
|
—
|
|
150
|
|
|||||||
|
Foreign currency forward contracts
|
—
|
|
5
|
|
—
|
|
5
|
|
|||||||
|
Total derivative liabilities
|
—
|
|
|
2,473
|
|
|
—
|
|
|
2,473
|
|
||||
|
Total trading liabilities (included in other liabilities and accrued expenses)
|
—
|
|
|
22,152
|
|
|
—
|
|
|
22,152
|
|
||||
|
Contingent consideration payable
|
—
|
|
—
|
|
936
|
|
936
|
|
|||||||
|
Preferred notes payable
|
—
|
|
—
|
|
1,562
|
|
1,562
|
|
|||||||
|
Total financial instruments attributable to Non-CLOs included in consolidated liabilities
|
—
|
|
|
22,152
|
|
|
2,498
|
|
|
24,650
|
|
||||
|
Financial instruments included in liabilities of consolidated CLOs:
|
|||||||||||||||
|
Notes payable of CLOs
|
—
|
|
—
|
|
683,827
|
|
683,827
|
|
|||||||
|
Total financial instruments included in liabilities of consolidated CLOs
|
—
|
|
|
—
|
|
|
683,827
|
|
|
683,827
|
|
||||
|
Total
|
$
|
—
|
|
|
$
|
22,152
|
|
|
$
|
686,325
|
|
|
$
|
708,477
|
|
F- 43
TIPTREE INC. AND SUBSIDIARIES
Notes to Consolidated Financial Statements
December 31, 2016
(in thousands, except share data)
The following table represents additional information about assets that are measured at fair value on a recurring basis for which the Company has utilized Level 3 inputs to determine fair value for the following periods:
|
Year Ended December 31,
|
|||||||||||||||||||
|
2016
|
2015
|
||||||||||||||||||
|
Non-CLO assets
|
CLO assets
|
Non-CLO assets
|
CLO assets
|
Assets held for sale
|
|||||||||||||||
|
Balance at January 1,
|
$
|
239,944
|
|
$
|
520,892
|
|
$
|
11,666
|
|
$
|
576,811
|
|
$
|
3,771,503
|
|
||||
|
Net realized gains (losses)
|
5,440
|
|
159
|
|
98
|
|
841
|
|
—
|
|
|||||||||
|
Net unrealized gains (losses)
|
5,334
|
|
25,994
|
|
661
|
|
(15,247
|
)
|
—
|
|
|||||||||
|
Origination of IRLC
|
53,083
|
|
—
|
|
28,876
|
|
—
|
|
—
|
|
|||||||||
|
Purchases
(2)
|
147,920
|
|
222,218
|
|
44,458
|
|
191,173
|
|
141,247
|
|
|||||||||
|
Sales
|
(76,196
|
)
|
(154,524
|
)
|
(2,040
|
)
|
(85,973
|
)
|
(3,967,798
|
)
|
|||||||||
|
Issuances
|
2,179
|
|
2,074
|
|
3
|
|
787
|
|
—
|
|
|||||||||
|
Transfer into Level 3
(1) (2)
|
23,184
|
|
7,619
|
|
184,409
|
|
241,520
|
|
—
|
|
|||||||||
|
Transfer adjustments (out of) Level 3
(1)
|
(18,872
|
)
|
(142,660
|
)
|
(862
|
)
|
(60,609
|
)
|
—
|
|
|||||||||
|
Adoption of ASU 2015-02
|
—
|
|
—
|
|
1,539
|
|
(328,411
|
)
|
—
|
|
|||||||||
|
Attributable to policyowner
|
—
|
|
—
|
|
—
|
|
—
|
|
55,048
|
|
|||||||||
|
Conversion to real estate owned
|
(15,132
|
)
|
—
|
|
(2,289
|
)
|
—
|
|
—
|
|
|||||||||
|
Conversion to mortgage held for sale
|
(51,594
|
)
|
—
|
|
(26,358
|
)
|
—
|
|
—
|
|
|||||||||
|
Warehouse transfer to CLO
|
(104,098
|
)
|
104,098
|
|
—
|
|
—
|
|
—
|
|
|||||||||
|
Other
|
—
|
|
—
|
|
(217
|
)
|
—
|
|
—
|
|
|||||||||
|
Balance at December 31,
|
$
|
211,192
|
|
$
|
585,870
|
|
$
|
239,944
|
|
$
|
520,892
|
|
$
|
—
|
|
||||
|
Changes in unrealized gains (losses) included in earnings related to assets still held at period end
|
$
|
3,597
|
|
$
|
16,276
|
|
$
|
(3,282
|
)
|
$
|
(28,631
|
)
|
$
|
—
|
|
||||
|
(1)
|
All transfers are deemed to occur at end of period. Transfers between Level 2 and 3 were a result of subjecting third-party pricing on both CLO and Non-CLO assets to various liquidity, depth, bid-ask spread and benchmarking criteria as well as assessing the availability of observable inputs affecting their fair valuation.
|
|
(2)
|
Purchases and transfers into Level 3 for 2015 have been restated to reflect assets purchased during a period as purchased rather than transfered. This change had no impact on the total amount of Level 3 assets.
|
The following table represents additional information about liabilities that are measured at fair value on a recurring basis for which the Company has utilized Level 3 inputs to determine fair value for the following periods:
|
Year Ended December 31,
|
|||||||||||||||
|
2016
|
2015
|
||||||||||||||
|
Non-CLO Liabilities
|
CLO Liabilities
|
Non-CLO Liabilities
|
CLO Liabilities
|
||||||||||||
|
Balance at January 1,
|
$
|
2,498
|
|
$
|
683,827
|
|
$
|
2,802
|
|
$
|
1,785,207
|
|
|||
|
Net unrealized gains (losses)
|
(314
|
)
|
25,823
|
|
(2,504
|
)
|
2,063
|
|
|||||||
|
Purchases
|
—
|
|
—
|
|
2,200
|
|
—
|
|
|||||||
|
Issuances
|
(377
|
)
|
225,000
|
|
—
|
|
(41,272
|
)
|
|||||||
|
Dispositions
|
—
|
|
(22,616
|
)
|
—
|
|
(30,805
|
)
|
|||||||
|
FV adjustment
|
1,277
|
|
—
|
|
—
|
|
—
|
|
|||||||
|
Adoption of ASU 2015-02
|
—
|
|
—
|
|
—
|
|
(1,031,366
|
)
|
|||||||
|
Balance at December 31,
|
$
|
3,084
|
|
$
|
912,034
|
|
$
|
2,498
|
|
$
|
683,827
|
|
|||
|
Changes in unrealized (losses) gains included in earnings related to liabilities still held at period end
|
$
|
(314
|
)
|
$
|
53,880
|
|
$
|
(2,504
|
)
|
$
|
(8,472
|
)
|
|||
F- 44
TIPTREE INC. AND SUBSIDIARIES
Notes to Consolidated Financial Statements
December 31, 2016
(in thousands, except share data)
The following is quantitative information about Level 3 significant unobservable inputs used in fair valuation. Disclosure of this information is not required in circumstances where a valuation (unadjusted) is obtained from a third-party pricing service and the information regarding the unobservable inputs is not readily available to the Company.
|
Fair Value as of
|
Actual or Range
(Weighted average)
|
||||||||||||||
|
Assets
(1)
|
December 31, 2016
|
December 31, 2015
|
Valuation Technique
|
Unobservable input(s)
|
December 31, 2016
|
December 31, 2015
|
|||||||||
|
Tax exempt security
|
$
|
—
|
|
$
|
121
|
|
Discounted cash flow
|
Short term cash flows
|
N/A
|
0.0%
|
|||||
|
Tax exempt security
|
—
|
|
8,193
|
|
Market yield analysis
|
Yield to maturity
|
N/A
|
6.50%
|
|||||||
|
Interest rate lock commitments
|
4,872
|
|
3,384
|
|
Internal model
|
Pull through rate
|
45% - 95%
|
55% - 95%
|
|||||||
|
Forward delivery contracts
|
—
|
|
11
|
|
Internal model
|
Pull through rate
|
N/A
|
80% - 100%
|
|||||||
|
NPLs
|
74,923
|
|
38,289
|
|
Discounted cash flow
|
See table below
(2)
|
See table below
|
See table below
|
|||||||
|
Total
|
$
|
79,795
|
|
$
|
49,998
|
|
|||||||||
|
(1)
|
Financial assets classified as Level 3 and fair valued using significant unobservable inputs classified as Level 3 have not been provided as these are not readily available to the Company (including servicing release premium for interest rate lock commitments and forward delivery contracts).
|
|
(2)
|
Significant changes in any of these inputs in isolation could result in a significant change to the fair value measurement. A decline in the discount rate in isolation would increase the fair value. A decrease in the housing pricing index in isolation would decrease the fair value. Individual loan characteristics, such as location and value of underlying collateral, affect the loan resolution timeline. An increase in the loan resolution timeline in isolation would decrease the fair value. A decrease in the value of underlying properties in isolation would decrease the fair value.
|
The following table sets forth quantitative information about the significant unobservable inputs used to measure the fair value of our NPLs. For NPLs that are not making payments, discount rate, loan resolution time-line, value of underlying properties, holdings costs and liquidation costs are the primary inputs used to measure fair value. For NPLs that are making payments, note rate and secondary market transaction prices/UPB are the primary inputs used to measure fair value.
|
As of December 31, 2016
|
As of December 31, 2015
|
|||||||||||
|
Unobservable inputs
|
High
|
Low
|
Average
(1)
|
High
|
Low
|
Average
(1)
|
||||||
|
Discount rate
|
30.0%
|
16.0%
|
22.9%
|
30.0%
|
15.1%
|
22.0%
|
||||||
|
Loan resolution time-line (Years)
|
2.3
|
0.5
|
1.2
|
2.7
|
0.6
|
1.2
|
||||||
|
Value of underlying properties
|
$1,800
|
$32
|
$234
|
$1,375
|
$40
|
$220
|
||||||
|
Holding costs
|
24.1%
|
5.4%
|
8.3%
|
24.6%
|
5.5%
|
9.6%
|
||||||
|
Liquidation costs
|
25.0%
|
8.5%
|
9.6%
|
21.8%
|
7.5%
|
10.5%
|
||||||
|
Note rate
|
6.0%
|
3.0%
|
4.8%
|
6.0%
|
3.0%
|
4.4%
|
||||||
|
Secondary market transaction prices/UPB
|
88.5%
|
75.5%
|
83.7%
|
88.5%
|
72.0%
|
73.3%
|
||||||
|
(1)
|
Weighted based on value of underlying properties.
|
F- 45
TIPTREE INC. AND SUBSIDIARIES
Notes to Consolidated Financial Statements
December 31, 2016
(in thousands, except share data)
|
Fair Value as of
|
Actual or Range (Weighted average)
|
||||||||||||||
|
Liabilities
(1)
|
December 31, 2016
|
December 31, 2015
|
Valuation Technique
|
Unobservable input(s)
|
December 31, 2016
|
December 31, 2015
|
|||||||||
|
Contingent consideration payable - Reliance
|
$
|
1,800
|
|
$
|
900
|
|
External model
|
Forecast EBITDA
|
$951 - $6,005
|
$1,326 - $3,517
|
|||||
|
Book value growth rate
|
5.0%
|
5.0%
|
|||||||||||||
|
Asset volatility
|
1.4% - 23.7%
|
2.4% - 20.1%
|
|||||||||||||
|
Contingent consideration payable - Luxury
|
52
|
|
36
|
|
Internal model
|
Projected cash available for distribution
|
$1,059 - $1,316
|
$828 - $1,281
|
|||||||
|
Preferred notes payable
|
1,232
|
|
1,562
|
|
Internal model
|
Discount rate
|
12.0%
|
12.0%
|
|||||||
|
Total
|
$
|
3,084
|
|
|
$
|
2,498
|
|
||||||||
|
(1)
|
Not included in this table are the debt obligations of consolidated CLOs, measured and leveled on the basis of the fair value of the (more observable) financial assets of the consolidated CLOs. See Note—
(12) Assets and Liabilities of Consolidated CLOs
.
|
The following table presents the carrying amounts and estimated fair values of financial assets and liabilities that are not recorded at fair value and their respective levels within the fair value hierarchy:
|
As of December 31, 2016
|
As of December 31, 2015
|
||||||||||||||||||
|
Level within
Fair Value
Hierarchy
|
Fair Value
|
Carrying Value
|
Level within
Fair Value
Hierarchy
|
Fair Value
|
Carrying Value
|
||||||||||||||
|
Assets:
|
|||||||||||||||||||
|
Notes and accounts receivable, net
|
2
|
$
|
28,293
|
|
$
|
28,732
|
|
2
|
$
|
20,250
|
|
$
|
21,696
|
|
|||||
|
Total Assets
|
$
|
28,293
|
|
$
|
28,732
|
|
$
|
20,250
|
|
$
|
21,696
|
|
|||||||
|
Liabilities:
|
|||||||||||||||||||
|
Debt, net
|
3
|
$
|
798,806
|
|
$
|
799,828
|
|
3
|
$
|
672,096
|
|
$
|
671,648
|
|
|||||
|
Total Liabilities
|
$
|
798,806
|
|
$
|
799,828
|
|
$
|
672,096
|
|
$
|
671,648
|
|
|||||||
Notes and accounts receivable:
To the extent that carrying amounts differ from fair value, fair value is determined based on contractual cash flows discounted at market rates for similar credits. Categorized as Level 2 of the fair value hierarchy.
Debt:
The fair value of notes payable is determined based on contractual cash flows discounted at market rates for mortgage notes payable and either dealer quotes or contractual cash flows discounted at market rates for other notes payable. Categorized as Level 3 of the fair value hierarchy.
Additionally, the following financial assets and liabilities on the Consolidated Balance Sheets are not carried at fair value, but whose carrying amounts approximate their fair value:
Loans Owned, at Amortized Cost:
The fair value of loans owned, at amortized cost approximates its carrying value because the interest rates on the loans are based on a variable market interest rate. Categorized as Level 3 of the fair value hierarchy.
Cash and Cash Equivalents:
The carrying amounts of cash and cash equivalents are carried at cost which approximates fair value. Categorized as Level 1 of the fair value hierarchy.
Accounts and premiums receivable, net, retrospective commissions receivable and other receivables:
The carrying amounts approximate fair value since no interest rate is charged on these short duration assets. Categorized as Level 2 of the fair value hierarchy. See Note—
(8) Notes and Accounts Receivable, net
.
Due from Brokers, Dealers, and Trustees and Due to Brokers, Dealers and Trustees:
The carrying amounts are included in other assets and other liabilities and accrued expenses and approximate their fair value due to their short‑term nature. Categorized as Level 2 of the fair value hierarchy.
F- 46
TIPTREE INC. AND SUBSIDIARIES
Notes to Consolidated Financial Statements
December 31, 2016
(in thousands, except share data)
(8) Notes and Accounts Receivable, net
The following table summarizes the total Notes and Accounts receivable, net:
|
As of December 31,
|
|||||||
|
2016
|
2015
|
||||||
|
Notes receivable, net
|
$
|
24,775
|
|
$
|
17,505
|
|
|
|
Accounts and premiums receivable, net
|
45,041
|
|
57,056
|
|
|||
|
Retrospective commissions receivable
|
59,175
|
|
39,586
|
|
|||
|
Other receivables
|
28,509
|
|
22,661
|
|
|||
|
Total
|
$
|
157,500
|
|
$
|
136,808
|
|
|
Notes Receivable, net
Specialty insurance
As of
December 31, 2016
and
December 31, 2015
, the Company’s specialty insurance business held
$20,913
and
$13,698
in notes receivable, net, respectively. The majority of these notes totaling
$20,615
and
$12,216
at
December 31, 2016
and
December 31, 2015
, respectively, consist of receivables from specialty insurance business’s premium financing program. At
December 31, 2016
and
December 31, 2015
, respectively, a total of
$298
and
$1,482
was for notes receivable under its Pay us Later Program, which allows customers to finance the purchase of electronic mobile devices and/ or the costs of the protection programs on these devices. The Company has established an allowance for uncollectible amounts against its notes receivable of
$1,444
and
$768
as of
December 31, 2016
and
December 31, 2015
, respectively. As of
December 31, 2016
and
December 31, 2015
, there were
$2,188
and
$1,553
in balances classified as 90 days plus past due, respectively.
Senior living
The Company’s senior living business owns a
75%
interest in a managed property. In connection therewith, subsidiaries of the senior living business received notes from affiliates of the
25%
partner. The cost basis of these notes at
December 31, 2016
and
December 31, 2015
was approximately
$3,862
and
$3,807
, respectively. As of
December 31, 2016
, all of these notes were performing.
Accounts and premiums receivable, net, Retrospective commissions receivable and Other receivables
Accounts and premiums receivable, net, retrospective commissions receivable and other receivables are primarily trade receivables from the specialty insurance segment that are carried at their approximate fair value. The Company has established a valuation allowance against its accounts and premiums receivable of
$225
and
$165
as of
December 31, 2016
and
December 31, 2015
, respectively.
F- 47
TIPTREE INC. AND SUBSIDIARIES
Notes to Consolidated Financial Statements
December 31, 2016
(in thousands, except share data)
(9) Reinsurance Receivables
The following table presents the effect of reinsurance on premiums written and earned by our specialty insurance business for the following periods:
|
Direct Amount
|
Ceded to Other Companies
|
Assumed from Other Companies
|
Net Amount
|
Percentage of Amount - Assumed to Net
|
||||||||||||||
|
For the Year ended December 31, 2016
|
||||||||||||||||||
|
Premiums written:
|
||||||||||||||||||
|
Life insurance
|
$
|
65,152
|
|
$
|
34,044
|
|
$
|
2,522
|
|
$
|
33,630
|
|
7.5
|
%
|
||||
|
Accident and health insurance
|
116,861
|
|
79,396
|
|
3,335
|
|
40,800
|
|
8.2
|
%
|
||||||||
|
Property and liability insurance
|
505,147
|
|
257,677
|
|
15,270
|
|
262,740
|
|
5.8
|
%
|
||||||||
|
Total premiums written
|
687,160
|
|
371,117
|
|
21,127
|
|
337,170
|
|
6.3
|
%
|
||||||||
|
Premiums earned:
|
||||||||||||||||||
|
Life insurance
|
61,921
|
|
30,015
|
|
2,543
|
|
34,449
|
|
7.4
|
%
|
||||||||
|
Accident and health insurance
|
112,847
|
|
79,754
|
|
3,262
|
|
36,355
|
|
9.0
|
%
|
||||||||
|
Property and liability insurance
|
496,418
|
|
343,820
|
|
6,034
|
|
158,632
|
|
3.8
|
%
|
||||||||
|
Total premiums earned
|
$
|
671,186
|
|
$
|
453,589
|
|
$
|
11,839
|
|
$
|
229,436
|
|
5.2
|
%
|
||||
|
For the Year ended December 31, 2015
|
||||||||||||||||||
|
Premiums written:
|
||||||||||||||||||
|
Life insurance
|
$
|
67,416
|
|
$
|
36,826
|
|
$
|
3,000
|
|
$
|
33,590
|
|
8.9
|
%
|
||||
|
Accident and health insurance
|
124,862
|
|
88,342
|
|
3,095
|
|
39,615
|
|
7.8
|
%
|
||||||||
|
Property and liability insurance
|
480,533
|
|
378,744
|
|
7,102
|
|
108,891
|
|
6.5
|
%
|
||||||||
|
Total premiums written
|
672,811
|
|
503,912
|
|
13,197
|
|
182,096
|
|
7.2
|
%
|
||||||||
|
Premiums earned:
|
||||||||||||||||||
|
Life insurance
|
57,203
|
|
25,739
|
|
3,011
|
|
34,475
|
|
8.7
|
%
|
||||||||
|
Accident and health insurance
|
112,474
|
|
78,954
|
|
3,051
|
|
36,571
|
|
8.3
|
%
|
||||||||
|
Property and liability insurance
|
416,986
|
|
325,176
|
|
3,409
|
|
95,219
|
|
3.6
|
%
|
||||||||
|
Total premiums earned
|
$
|
586,663
|
|
429,869
|
|
$
|
9,471
|
|
$
|
166,265
|
|
5.7
|
%
|
|||||
|
For the Year ended December 31, 2014
|
||||||||||||||||||
|
Premiums written:
|
||||||||||||||||||
|
Life insurance
|
$
|
6,034
|
|
$
|
2,842
|
|
$
|
299
|
|
$
|
3,491
|
|
8.6
|
%
|
||||
|
Accident and health insurance
|
11,649
|
|
8,488
|
|
554
|
|
3,715
|
|
14.9
|
%
|
||||||||
|
Property and liability insurance
|
37,173
|
|
30,664
|
|
214
|
|
6,723
|
|
3.2
|
%
|
||||||||
|
Total premiums written
|
54,856
|
|
41,994
|
|
1,067
|
|
13,929
|
|
7.7
|
%
|
||||||||
|
Premiums earned:
|
||||||||||||||||||
|
Life insurance
|
4,625
|
|
1,935
|
|
266
|
|
2,956
|
|
9.0
|
%
|
||||||||
|
Accident and health insurance
|
9,003
|
|
6,195
|
|
497
|
|
3,305
|
|
15.0
|
%
|
||||||||
|
Property and liability insurance
|
31,535
|
|
25,170
|
|
201
|
|
6,566
|
|
3.1
|
%
|
||||||||
|
Total premiums earned
|
$
|
45,163
|
|
$
|
33,300
|
|
$
|
964
|
|
$
|
12,827
|
|
7.5
|
%
|
||||
F- 48
TIPTREE INC. AND SUBSIDIARIES
Notes to Consolidated Financial Statements
December 31, 2016
(in thousands, except share data)
The following table presents the components of policy and contract benefits, including the effect of reinsurance on losses and loss adjustment expenses ("LAE") incurred:
|
Direct Amount
|
Ceded to Other Companies
|
Assumed from Other Companies
|
Net Amount
|
Percentage of Amount - Assumed to Net
|
||||||||||||||
|
For the Year ended December 31, 2016
|
||||||||||||||||||
|
Losses Incurred
|
||||||||||||||||||
|
Life insurance
|
$
|
32,574
|
|
$
|
16,945
|
|
$
|
1,184
|
|
$
|
16,813
|
|
7.0
|
%
|
||||
|
Accident and health insurance
|
19,250
|
|
16,339
|
|
871
|
|
3,782
|
|
23.0
|
%
|
||||||||
|
Property and liability insurance
|
219,538
|
|
158,520
|
|
3,337
|
|
64,355
|
|
5.2
|
%
|
||||||||
|
Total losses incurred
|
271,362
|
|
191,804
|
|
5,392
|
|
84,950
|
|
6.3
|
%
|
||||||||
|
Member benefit claims
(1)
|
21,834
|
|
||||||||||||||||
|
Total policy and contract benefits
|
$
|
106,784
|
|
|||||||||||||||
|
For the Year ended December 31, 2015
|
||||||||||||||||||
|
Losses Incurred
|
||||||||||||||||||
|
Life insurance
|
$
|
27,583
|
|
$
|
12,468
|
|
$
|
1,163
|
|
$
|
16,278
|
|
7.1
|
%
|
||||
|
Accident and health insurance
|
16,613
|
|
13,555
|
|
860
|
|
3,918
|
|
21.9
|
%
|
||||||||
|
Property and liability insurance
|
132,775
|
|
98,700
|
|
2,297
|
|
36,372
|
|
6.3
|
%
|
||||||||
|
Total losses incurred
|
176,971
|
|
124,723
|
|
4,320
|
|
56,568
|
|
7.6
|
%
|
||||||||
|
Member benefit claims
(1)
|
29,744
|
|
||||||||||||||||
|
Total policy and contract benefits
|
$
|
86,312
|
|
|||||||||||||||
|
For the Year ended December 31, 2014
|
||||||||||||||||||
|
Losses Incurred
|
||||||||||||||||||
|
Life insurance
|
$
|
2,125
|
|
$
|
1,138
|
|
$
|
246
|
|
$
|
1,233
|
|
20.0
|
%
|
||||
|
Accident and health insurance
|
729
|
|
472
|
|
55
|
|
312
|
|
17.6
|
%
|
||||||||
|
Property and liability insurance
|
7,419
|
|
5,924
|
|
113
|
|
1,608
|
|
7.0
|
%
|
||||||||
|
Total losses incurred
|
10,273
|
|
7,534
|
|
414
|
|
3,153
|
|
13.1
|
%
|
||||||||
|
Member benefit claims
(1)
|
2,676
|
|
||||||||||||||||
|
Total policy and contract benefits
|
$
|
5,829
|
|
|||||||||||||||
(1) - Member benefit claims are not covered by reinsurance.
F- 49
TIPTREE INC. AND SUBSIDIARIES
Notes to Consolidated Financial Statements
December 31, 2016
(in thousands, except share data)
The following table presents the components of the reinsurance receivables:
|
As of December 31,
|
|||||||
|
2016
|
2015
|
||||||
|
Prepaid reinsurance premiums:
|
|||||||
|
Life
(1)
|
$
|
64,621
|
|
$
|
61,919
|
|
|
|
Accident and health
(1)
|
53,999
|
|
54,357
|
|
|||
|
Property
(2)
|
94,091
|
|
180,236
|
|
|||
|
Total
|
212,711
|
|
296,512
|
|
|||
|
Ceded claim reserves:
|
|||||||
|
Life
|
2,929
|
|
2,664
|
|
|||
|
Accident and health
|
10,435
|
|
8,889
|
|
|||
|
Property
|
49,917
|
|
30,911
|
|
|||
|
Total ceded claim reserves recoverable
|
63,281
|
|
42,464
|
|
|||
|
Other reinsurance settlements recoverable
|
20,242
|
|
13,950
|
|
|||
|
Reinsurance receivables
|
$
|
296,234
|
|
$
|
352,926
|
|
|
|
(1)
|
Including policyholder account balances ceded.
|
|
(2)
|
Includes a non-cash transaction, as part of a reinsurance contract cancellation, that resulted in a reduction of
$92,854
in reinsurance receivable, offset by an increase of
$88,857
in assets and a decrease of
$3,997
in liabilities.
|
The following table presents the aggregate amount included in reinsurance receivables that is comprised of the three largest receivable balances from unrelated reinsurers:
|
As of
|
|||
|
December 31, 2016
|
|||
|
Total of the three largest receivable balances from unrelated reinsurers
|
$
|
77,650
|
|
At
December 31, 2016
, the three unrelated reinsurers from whom our specialty insurance business has the largest receivable balances were: London Life Reinsurance Corporation (A. M. Best Rating: A rated); MFI Insurance Company, LTD (A. M. Best Rating: Not rated) and Frandicso Property and Casualty Insurance Corporation (A. M. Best Rating: Not rated). The related receivables of these reinsurers are collateralized by, assets on hand, assets held in trust accounts and letters of credit. At
December 31, 2016
, the Company does not believe there is a risk of loss due to the concentration of credit risk in the reinsurance program given the collateralization.
F- 50
TIPTREE INC. AND SUBSIDIARIES
Notes to Consolidated Financial Statements
December 31, 2016
(in thousands, except share data)
(10) Goodwill and Intangible Assets, net
The following table presents identifiable finite- and indefinite-lived intangible assets, accumulated amortization, and goodwill by segment:
|
As of December 31, 2016
|
As of December 31, 2015
|
||||||||||||||||||||||||||||||
|
Specialty insurance
|
Senior living
|
Specialty finance
|
Total
|
Specialty insurance
|
Senior living
|
Specialty finance
|
Total
|
||||||||||||||||||||||||
|
Customer relationships
|
$
|
50,500
|
|
$
|
—
|
|
$
|
—
|
|
$
|
50,500
|
|
$
|
50,500
|
|
$
|
—
|
|
$
|
—
|
|
$
|
50,500
|
|
|||||||
|
Accumulated amortization
|
(4,614
|
)
|
—
|
|
—
|
|
(4,614
|
)
|
(1,200
|
)
|
—
|
|
—
|
|
(1,200
|
)
|
|||||||||||||||
|
Trade names
|
6,500
|
|
—
|
|
800
|
|
7,300
|
|
6,500
|
|
—
|
|
800
|
|
7,300
|
|
|||||||||||||||
|
Accumulated amortization
|
(1,484
|
)
|
—
|
|
(120
|
)
|
(1,604
|
)
|
(771
|
)
|
—
|
|
(40
|
)
|
(811
|
)
|
|||||||||||||||
|
Software licensing
|
8,500
|
|
—
|
|
640
|
|
9,140
|
|
8,500
|
|
—
|
|
640
|
|
9,140
|
|
|||||||||||||||
|
Accumulated amortization
|
(3,542
|
)
|
—
|
|
(137
|
)
|
(3,679
|
)
|
(1,842
|
)
|
—
|
|
(46
|
)
|
(1,888
|
)
|
|||||||||||||||
|
Insurance policies and contracts acquired
|
36,500
|
|
—
|
|
—
|
|
36,500
|
|
36,500
|
|
—
|
|
—
|
|
36,500
|
|
|||||||||||||||
|
Accumulated amortization
|
(34,184
|
)
|
—
|
|
—
|
|
(34,184
|
)
|
(28,510
|
)
|
—
|
|
—
|
|
(28,510
|
)
|
|||||||||||||||
|
Insurance licensing agreements
(1)
|
13,000
|
|
—
|
|
—
|
|
13,000
|
|
13,000
|
|
—
|
|
—
|
|
13,000
|
|
|||||||||||||||
|
Leases in place
|
1,317
|
|
32,233
|
|
—
|
|
33,550
|
|
—
|
|
23,404
|
|
—
|
|
23,404
|
|
|||||||||||||||
|
Accumulated amortization
|
(18
|
)
|
(20,413
|
)
|
—
|
|
(20,431
|
)
|
—
|
|
(14,095
|
)
|
—
|
|
(14,095
|
)
|
|||||||||||||||
|
Intangible assets, net
|
72,475
|
|
11,820
|
|
1,183
|
|
85,478
|
|
82,677
|
|
9,309
|
|
1,354
|
|
93,340
|
|
|||||||||||||||
|
Goodwill
|
89,854
|
|
—
|
|
2,913
|
|
92,767
|
|
89,854
|
|
—
|
|
2,913
|
|
92,767
|
|
|||||||||||||||
|
Total goodwill and intangible assets, net
|
$
|
162,329
|
|
$
|
11,820
|
|
$
|
4,096
|
|
$
|
178,245
|
|
$
|
172,531
|
|
$
|
9,309
|
|
$
|
4,267
|
|
$
|
186,107
|
|
|||||||
|
(1)
|
Represents intangible assets with an indefinite useful life. Impairment tests are performed at least annually on these assets
.
|
Goodwill
The following table presents the activity in goodwill, by segment, and includes the retrospective adjustments made to the balance of goodwill to reflect the effect of the final valuation adjustments made for acquisitions, the reduction to goodwill attributable to discontinued operations and any impairment related charges:
|
Specialty insurance
|
Specialty finance
|
Total
|
|||||||||
|
Balance at December 31, 2014
|
$
|
89,854
|
|
$
|
1,904
|
|
$
|
91,758
|
|
||
|
Goodwill acquired in 2015
|
—
|
|
1,708
|
|
1,708
|
|
|||||
|
Goodwill impairment charges
|
—
|
|
(699
|
)
|
(699
|
)
|
|||||
|
Balance at December 31, 2015
|
89,854
|
|
2,913
|
|
$
|
92,767
|
|
||||
|
Balance at December 31, 2016
|
$
|
89,854
|
|
$
|
2,913
|
|
$
|
92,767
|
|
||
The Company conducts annual impairment tests of its goodwill as of December 31
.
For the
year ended December 31, 2016
, no impairment was recorded on the Company’s goodwill or intangibles. As of
December 31, 2015
, the Company recorded an impairment of
$699
associated with Luxury within the Specialty Finance segment as a result of qualitative and quantitative procedures associated with our annual impairment testing. For the year ended December 31, 2014, no impairment was recorded on the Company’s goodwill or intangibles.
During the fourth quarter of 2016, the Company changed the date of its annual impairment test of goodwill from December 31 to October 1. The Company believes the change in goodwill impairment date does not result in a material change in the method of applying the accounting principle. This change provides the Company additional time to complete the annual impairment test of goodwill in advance of our year end reporting. The Company will continue to perform interim impairment testing should circumstances or events require. This change does not result in a delay, acceleration, or avoidance of an impairment charge. This change will be applied prospectively beginning in 2017 because it is impracticable to apply it retrospectively due to the difficulty in making estimates and assumptions without using hindsight.
F- 51
TIPTREE INC. AND SUBSIDIARIES
Notes to Consolidated Financial Statements
December 31, 2016
(in thousands, except share data)
Intangible Assets, Net
The following table presents the activity, by segment, in finite and indefinite-lived other intangible assets and includes the retrospective adjustments made to the balance to reflect the effect of any final valuation adjustments made for acquisitions, the reduction attributable to discontinued operations and any impairment related charges:
|
Specialty insurance
|
Senior living
|
Specialty finance
|
Total
|
||||||||||||
|
Balance at December 31, 2014
|
$
|
110,847
|
|
$
|
9,547
|
|
$
|
—
|
|
$
|
120,394
|
|
|||
|
Intangible assets acquired in 2015
|
—
|
|
8,800
|
|
1,440
|
|
10,240
|
|
|||||||
|
Less: amortization expense
|
(28,170
|
)
|
(9,038
|
)
|
(86
|
)
|
(37,294
|
)
|
|||||||
|
Balance at December 31, 2015
|
82,677
|
|
9,309
|
|
1,354
|
|
93,340
|
|
|||||||
|
Intangible assets acquired in 2016
|
1,317
|
|
8,829
|
|
—
|
|
10,146
|
|
|||||||
|
Less: amortization expense
|
(11,519
|
)
|
(6,318
|
)
|
(171
|
)
|
(18,008
|
)
|
|||||||
|
Balance at December 31, 2016
|
$
|
72,475
|
|
$
|
11,820
|
|
$
|
1,183
|
|
$
|
85,478
|
|
|||
The following table present the amortization expense on finite-lived intangible assets for the following periods:
|
Year Ended December 31,
|
|||||||||||
|
2016
|
2015
|
2014
|
|||||||||
|
Amortization expense on intangible assets
|
$
|
18,008
|
|
$
|
37,294
|
|
$
|
8,566
|
|
||
The following table presents the amortization expense on finite-lived intangible assets for the next five years by segment:
|
As of December 31, 2016
|
|||||||||||||||||||
|
Specialty insurance (VOBA)
|
Specialty insurance (other)
|
Senior living
|
Specialty finance
|
Total
|
|||||||||||||||
|
2017
|
$
|
1,250
|
|
$
|
9,975
|
|
$
|
3,807
|
|
$
|
171
|
|
$
|
15,203
|
|
||||
|
2018
|
465
|
|
9,187
|
|
1,569
|
|
171
|
|
11,392
|
|
|||||||||
|
2019
|
217
|
|
7,619
|
|
787
|
|
171
|
|
8,794
|
|
|||||||||
|
2020
|
123
|
|
5,137
|
|
787
|
|
171
|
|
6,218
|
|
|||||||||
|
2021
|
82
|
|
4,361
|
|
787
|
|
171
|
|
5,401
|
|
|||||||||
|
2022 and thereafter
|
179
|
|
20,880
|
|
4,083
|
|
328
|
|
25,470
|
|
|||||||||
|
Total
|
$
|
2,316
|
|
$
|
57,159
|
|
$
|
11,820
|
|
$
|
1,183
|
|
$
|
72,478
|
|
||||
(11) Derivative Financial Instruments and Hedging
The Company utilizes derivative financial instruments as part of its overall investment and hedging activities. Derivative contracts are subject to additional risk that can result in a loss of all or part of an investment. The Company’s derivative activities are primarily classified by underlying credit risk and interest rate risk. In addition, the Company is also subject to additional counterparty risk should its counterparties fail to meet the contract terms. The derivative financial instruments are located within trading assets at fair value and are reported in other investments. Trading liabilities are reported within other liabilities and accrued expenses.
Derivatives, at fair value
Credit Derivatives
Credit derivatives are generally defined as over‑the‑counter contracts between a buyer and seller of protection against the risk of default on a set of obligations issued by a specified reference entity.
Credit Default Swap Indices (CDX) are credit derivatives that reference multiple names through underlying baskets or portfolios of single name credit default swaps. The Company enters into these contracts as both a buyer of protection and seller of protection to manage the credit risk exposure of its investment portfolio. The Company is required to deposit cash collateral for these positions equal to an initial
2.25%
of the notional amount of the sold protection side, subject to increase based on additional maintenance margin as a result of decreases in value. As of
December 31, 2016
, the total margin was
$6,750
.
F- 52
TIPTREE INC. AND SUBSIDIARIES
Notes to Consolidated Financial Statements
December 31, 2016
(in thousands, except share data)
Foreign Currency Forward Contracts
Foreign currency forward contracts are used as a foreign currency hedge where the Company has an obligation to either make or take a foreign currency payment at a future date. If the date of the foreign currency payment and the last trading date of the foreign currency forwards contract are matched, the Company has in effect “locked in” the exchange rate payment amount. The Company, through its subsidiary Siena, has entered into a foreign exchange forward contract hedge on its foreign loans receivable. The Company has not elected hedge accounting on such transactions.
Interest Rate Lock Commitments
The Company enters into interest rate lock commitments (IRLCs) in connection with its mortgage banking activities to fund residential mortgage loans with certain terms at specified times in the future. IRLCs that relate to the origination of mortgage loans that will be classified as held-for-sale are considered derivative instruments under applicable accounting guidance. As such, these IRLCs are recorded at fair value with changes in fair value typically resulting in recognition of a gain when the Company enters into IRLCs. In estimating the fair value of an IRLC, the Company assigns a probability that the loan commitment will be exercised and the loan will be funded (“pull through”). The fair value of the commitments is derived from the fair value of related mortgage loans, net of estimated costs to complete. Outstanding IRLCs expose the Company to the risk that the price of the loans underlying the commitments might decline from inception of the rate lock to funding of the loan. To manage this risk, the Company utilizes forward delivery contracts and TBA mortgage backed securities to economically hedge the risk of potential changes in the value of the loans that would result from the commitments.
Forward Delivery Contracts
The Company enters into forward delivery contracts with investors to manage the interest rate risk associated with IRLCs and loans held for sale.
TBA Mortgage Backed Securities
The Company enters into to be announced (TBA) mortgage backed securities which facilitate hedging and funding by allowing the Company to prearrange prices for mortgages that are in the process of originating. The Company utilizes these hedging instruments for Agency (Fannie Mae and Freddie Mac) and FHA/VA (Ginnie Mae) eligible IRLCs and typically commit them to investors at prices higher than otherwise available.
Interest Rate Swaps
The Company is exposed to interest rate risk when there is an unfavorable change in the value of investments as a result of adverse movements in the market interest rates. The Company enters into interest rate swaps (IRS) to protect against such adverse movements in interest rates. The Company is required to post collateral for the benefit of the counterparty. This is included in other assets in the Consolidated Balance Sheets.
The Company uses interest rate swaps to hedge the variability of floating rate borrowings. Cash flow hedge accounting was applied to the floating rate borrowings in its specialty insurance business, and during the second quarter of 2016, the Company elected to apply cash flow hedge accounting to such transactions in its senior living business.
F- 53
TIPTREE INC. AND SUBSIDIARIES
Notes to Consolidated Financial Statements
December 31, 2016
(in thousands, except share data)
T
he following table summarizes the gross notional and fair value amounts of derivatives (on a gross basis) categorized by underlying risk:
|
As of December 31, 2016
|
As of December 31, 2015
|
||||||||||||||||||||||
|
Notional
Values |
Asset
Derivatives |
Liability
Derivatives |
Notional
Values |
Asset
Derivatives |
Liability
Derivatives |
||||||||||||||||||
|
Credit risk:
|
|||||||||||||||||||||||
|
Credit derivatives sold protection
|
$
|
297,612
|
|
$
|
28,731
|
|
$
|
—
|
|
$
|
297,612
|
|
$
|
41,126
|
|
$
|
—
|
|
|||||
|
Credit derivatives bought protection
|
298,173
|
|
—
|
|
14,501
|
|
300,529
|
|
106
|
|
27,655
|
|
|||||||||||
|
Sub-total
|
595,785
|
|
28,731
|
|
14,501
|
|
598,141
|
|
41,232
|
|
27,655
|
|
|||||||||||
|
Foreign currency risk:
|
|||||||||||||||||||||||
|
Foreign currency forward contracts
|
965
|
|
—
|
|
3
|
|
683
|
|
—
|
|
5
|
|
|||||||||||
|
Interest rate risk:
|
|||||||||||||||||||||||
|
Interest rate lock commitments
|
203,815
|
|
4,872
|
|
—
|
|
156,309
|
|
3,384
|
|
—
|
|
|||||||||||
|
Forward delivery contracts
|
66,731
|
|
—
|
|
84
|
|
52,054
|
|
11
|
|
8
|
|
|||||||||||
|
TBA mortgage backed securities
|
249,750
|
|
1,678
|
|
269
|
|
136,750
|
|
179
|
|
150
|
|
|||||||||||
|
Interest rate swaps
|
134,343
|
|
1,388
|
|
1,042
|
|
78,988
|
|
—
|
|
2,310
|
|
|||||||||||
|
Sub-total
|
654,639
|
|
|
7,938
|
|
|
1,395
|
|
424,101
|
|
3,574
|
|
|
2,468
|
|
||||||||
|
Total
|
$
|
1,251,389
|
|
|
$
|
36,669
|
|
|
$
|
15,899
|
|
$
|
1,022,925
|
|
$
|
44,806
|
|
|
$
|
30,128
|
|
||
The Company nets the credit derivative assets and liabilities as these credit derivatives are subject to legally enforceable netting arrangements with the same party. The following table presents derivative instruments that are subject to offset by a master netting agreement:
|
As of December 31,
|
|||||||
|
2016
|
2015
|
||||||
|
Derivatives subject to netting arrangements:
|
|||||||
|
Credit default swap indices sold protection
|
$
|
28,731
|
|
$
|
41,126
|
|
|
|
Credit default swap indices bought protection
|
(14,501
|
)
|
(27,549
|
)
|
|||
|
Gross assets recognized
|
14,230
|
|
13,577
|
|
|||
|
Cash collateral
|
(1,632
|
)
|
(1,632
|
)
|
|||
|
Net assets recognized (included in other investments)
|
$
|
12,598
|
|
$
|
11,945
|
|
|
Derivatives designated as cash flow hedging instruments
A subsidiary in our specialty insurance business has
one
IRS with a counterparty, pursuant to which our subsidiary swapped the floating rate portion of its outstanding preferred trust securities to a fixed rate. This IRS is designated as a cash flow hedge and expires in June 2017. As of the December 4, 2014 acquisition date, the IRS was considered a new hedging relationship, and was redesignated as a hedge.
Subsidiaries in our senior living business have
nine
IRSs with the same counterparty as the lender, pursuant to which our subsidiary swapped the floating rate portion of its outstanding debt to a fixed rate. These IRSs are designated as cash flow hedges and expire between November 30, 2017 and August 1, 2023.
F- 54
TIPTREE INC. AND SUBSIDIARIES
Notes to Consolidated Financial Statements
December 31, 2016
(in thousands, except share data)
The following table presents the fair value and the related outstanding notional amounts of the Company's cash flow hedging derivative instruments and indicates where the Company records each amount in its Consolidated Balance Sheets:
|
As of December 31,
|
|||||||||
|
|
2016
|
2015
|
|||||||
|
Derivatives designated as cash flow hedging instruments:
|
|||||||||
|
Notional value
|
$
|
134,343
|
|
$
|
35,000
|
|
|||
|
Fair value of interest rate swaps
|
Other investments
|
$
|
1,388
|
|
$
|
—
|
|
||
|
Fair value of interest rate swaps
|
Other liabilities and accrued expenses
|
$
|
1,042
|
|
$
|
1,283
|
|
||
|
Unrealized gain (loss), net of tax, on the fair value of interest rate swaps
|
AOCI
|
$
|
1,759
|
|
$
|
111
|
|
||
|
Range of variable rates on interest rate swaps
|
0.67% to 0.96%
|
0.51
|
%
|
||||||
|
|
|
||||||||
|
Range of fixed rates on interest rate swaps
|
1.31% to 4.99%
|
3.47
|
%
|
||||||
The following table presents the pretax impact of the cash flow hedging derivative instruments on the Consolidated Financial Statements for the following periods:
|
Year Ended December 31,
|
||||||||
|
2016
|
2015
|
2014
|
||||||
|
Gain (loss) recognized in AOCI on the derivative-effective portion
|
2,210
|
|
(326
|
)
|
128
|
|
||
|
(Gain) loss reclassified from AOCI into income-effective portion
|
121
|
|
274
|
|
97
|
|
||
|
Gain (loss) recognized in income on the derivative-ineffective portion
|
240
|
|
—
|
|
—
|
|
||
The following table presents the estimated amount to be reclassified to earnings from AOCI during the next 12 months. These net losses reclassified into earnings are primarily expected to increase net interest expense related to the respective hedged item.
|
As of
|
|||
|
December 31, 2016
|
|||
|
Estimated (gains) losses to be reclassified to earnings from AOCI during the next 12 months
|
$
|
110
|
|
(12) Assets and Liabilities of Consolidated CLOs
The term CLO generally refers to a special purpose vehicle that owns a portfolio of investments and issues various tranches of debt and subordinated note securities to finance the purchase of those investments. The investment activities of a CLO are governed by extensive investment guidelines, generally contained within a CLO’s indenture and other governing documents which limit, among other things, the CLO’s exposure to any single industry or obligor and provide that the CLO’s assets satisfy certain ratings requirements. Most CLOs have a defined investment period during which they are allowed to make investments and reinvest capital as it becomes available. The CLOs are considered variable interest entities (VIE).
The assets of each of the CLOs, including cash and cash equivalents, are held solely as collateral to satisfy the obligations of the CLOs. The Company does not own and has no right to the benefits from, nor does it bear the risks associated with, the assets held by the CLOs, beyond its direct investments in, and investment advisory fees generated from, the CLOs. If the Company were to liquidate, the assets of the CLOs would not be available to its general creditors, and as a result, the Company does not consider these assets available for the benefit of its investors. Additionally, the investors in the CLOs have no recourse to the Company’s general assets for the debt issued by the CLOs. Therefore, this debt is not the Company’s obligation. The Company consolidates entities when it is determined to be the primary beneficiary under current VIE accounting guidance.
F- 55
TIPTREE INC. AND SUBSIDIARIES
Notes to Consolidated Financial Statements
December 31, 2016
(in thousands, except share data)
The table below represents the assets and liabilities of the consolidated CLOs that are included in the Company’s Consolidated Balance Sheets as of the dates indicated:
|
As of
|
|||||||
|
December 31, 2016
|
December 31, 2015
|
||||||
|
Assets:
|
|||||||
|
Cash and cash equivalents
|
$
|
45,589
|
|
$
|
38,716
|
|
|
|
Loans, at fair value
(1)
|
928,240
|
|
680,784
|
|
|||
|
Other assets
|
15,666
|
|
9,312
|
|
|||
|
Total assets of consolidated CLOs
|
$
|
989,495
|
|
$
|
728,812
|
|
|
|
Liabilities:
|
|||||||
|
Debt
|
$
|
912,034
|
|
$
|
683,827
|
|
|
|
Other liabilities and accrued expenses
|
19,935
|
|
14,489
|
|
|||
|
Total liabilities of consolidated CLOs
|
$
|
931,969
|
|
$
|
698,316
|
|
|
|
Net
|
$
|
57,526
|
|
$
|
30,496
|
|
|
|
(1)
|
The unpaid principal balance for these loans is
$952,225
and
$727,357
and the difference between their fair value and UPB is
$23,985
and
$46,573
at
December 31, 2016
and
December 31, 2015
, respectively.
|
The Company’s beneficial interests and maximum exposure to loss related to the consolidated CLOs are limited to (i) ownership in the subordinated notes and related participations in management fees of the CLOs and (ii) accrued management fees. Although these beneficial interests are eliminated upon consolidation, the application of the measurement alternative results in the net amount of the CLOs shown above to be equivalent to the beneficial interests retained by the Company as illustrated in the below table:
|
Beneficial interests:
|
As of
|
||||||
|
December 31, 2016
|
December 31, 2015
|
||||||
|
Subordinated notes and related participations in management fees
|
$
|
56,820
|
|
$
|
29,857
|
|
|
|
Accrued management fees
|
706
|
|
639
|
|
|||
|
Total beneficial interests
|
$
|
57,526
|
|
$
|
30,496
|
|
|
The following table represents revenue and expenses of the consolidated CLOs included in the Company’s Consolidated Statements of Operations for the periods indicated:
|
Year Ended December 31,
|
|||||||||||
|
2016
|
2015
|
2014
|
|||||||||
|
Income:
|
|||||||||||
|
Net realized and unrealized gains (losses)
|
$
|
1,865
|
|
$
|
(27,569
|
)
|
$
|
(15,797
|
)
|
||
|
Interest income
|
51,712
|
|
51,182
|
|
80,478
|
|
|||||
|
Total revenue
|
53,577
|
|
23,613
|
|
$
|
64,681
|
|
||||
|
Expenses:
|
|||||||||||
|
Interest expense
|
31,033
|
|
29,143
|
|
$
|
43,639
|
|
||||
|
Other expense
|
2,290
|
|
1,359
|
|
1,517
|
|
|||||
|
Total expense
|
33,323
|
|
30,502
|
|
45,156
|
|
|||||
|
Net income (loss) attributable to consolidated CLOs
|
$
|
20,254
|
|
$
|
(6,889
|
)
|
$
|
19,525
|
|
||
F- 56
TIPTREE INC. AND SUBSIDIARIES
Notes to Consolidated Financial Statements
December 31, 2016
(in thousands, except share data)
As summarized in the table below, the application of the measurement alternative results in the consolidated net income summarized above to be equivalent to the Company’s own economic interests in the CLOs which are eliminated upon consolidation:
|
Economic interests:
|
Year Ended December 31,
|
||||||||||
|
2016
|
2015
|
2014
|
|||||||||
|
Distributions received and realized and unrealized gains (losses) on the subordinated notes held by the Company, net
|
$
|
17,335
|
|
$
|
(11,020
|
)
|
$
|
7,755
|
|
||
|
Management fee income
|
2,919
|
|
4,131
|
|
11,770
|
|
|||||
|
Total economic interests
|
$
|
20,254
|
|
$
|
(6,889
|
)
|
$
|
19,525
|
|
||
The following table summarizes the balance of the Company’s debt holdings, net of discounts and deferred financing costs, excluding notes payable of consolidated CLOs. See Note—
(12) Assets and Liabilities of Consolidated CLOs
:
|
Maximum Borrowing Capacity as of
|
As of December 31,
|
|||||||||||||||
|
Debt Type
|
Stated Maturity Date
|
Stated Interest Rate or Range of Rates
|
December 31, 2016
|
2016
|
2015
|
|||||||||||
|
Secured corporate credit agreements
|
September 2018 - December 2019
|
LIBOR + 3.00% to 6.50%
|
$
|
255,000
|
|
$
|
164,000
|
|
$
|
137,000
|
|
|||||
|
Asset based revolving financing
(1) (2)
|
April 2017 - May 2020
|
LIBOR + 2.25% to 5.75%
|
330,000
|
|
250,557
|
|
218,875
|
|
||||||||
|
Residential mortgage warehouse borrowings
(3)
|
April 2017 - August 2017
|
LIBOR + 2.63% to 2.88%
|
188,000
|
|
101,402
|
|
110,314
|
|
||||||||
|
Real estate commercial mortgage borrowings:
|
||||||||||||||||
|
Fixed rate
|
August 2019 - May 2040
|
4.00% to 5.12%
|
82,133
|
|
82,133
|
|
76,818
|
|
||||||||
|
Variable rate (LIBOR based)
|
October 2019 - January 2023
|
LIBOR + 2.05% to 3.20%
|
159,486
|
|
158,618
|
|
89,846
|
|
||||||||
|
Variable rate (Prime rate based)
|
|
Prime Rate + 1.00%
|
—
|
|
—
|
|
717
|
|
||||||||
|
Subordinated debt
|
April 2020
|
12.50%
|
20,000
|
|
8,500
|
|
3,500
|
|
||||||||
|
Preferred trust securities
|
June 2037
|
LIBOR + 4.10%
|
35,000
|
|
35,000
|
|
35,000
|
|
||||||||
|
Preferred notes payable
|
January 2021
|
12.00%
|
1,232
|
|
1,562
|
|
||||||||||
|
Total debt, face value
|
801,442
|
|
673,632
|
|
||||||||||||
|
Unamortized discount, net
|
(382
|
)
|
(422
|
)
|
||||||||||||
|
Unamortized deferred financing costs
|
(8,051
|
)
|
(6,258
|
)
|
||||||||||||
|
Total debt, net
|
$
|
793,009
|
|
$
|
666,952
|
|
||||||||||
(1) Asset based revolving financing is generally recourse only to specific assets and related cash flows.
(2) The weighted average coupon rate for asset based revolving financing was
3.53%
and
2.35%
at
December 31, 2016
and
December 31, 2015
, respectively.
(3) The weighted average coupon rate for residential mortgage warehouse borrowings was
3.51%
and
3.39%
at
December 31, 2016
and
December 31, 2015
, respectively. Includes debt having a maximum borrowing capacity of
$103,000
with a stated interest rate of
LIBOR
+
2.75%
and a floor of
3.00%
.
The table below presents the amount of interest expense the Company incurred on its debt for the following periods:
|
Year Ended December 31,
|
|||||||||||
|
2016
|
2015
|
2014
|
|||||||||
|
Interest expense
|
$
|
29,523
|
|
$
|
23,675
|
|
$
|
11,898
|
|
||
F- 57
TIPTREE INC. AND SUBSIDIARIES
Notes to Consolidated Financial Statements
December 31, 2016
(in thousands, except share data)
The following table presents the future maturities of the unpaid principal balance on the Company’s long-term debt as of:
|
December 31, 2016
|
|||
|
2017
|
$
|
119,294
|
|
|
2018
|
94,040
|
|
|
|
2019
|
216,676
|
|
|
|
2020
|
197,801
|
|
|
|
2021
|
21,855
|
|
|
|
Thereafter
|
151,776
|
|
|
|
Total
|
$
|
801,442
|
|
The following narrative is a summary of certain of the terms of our debt agreements for the years ended
December 31, 2015
and
December 31, 2016
:
Secured Corporate Credit Agreement
On September 18, 2013, Tiptree’s intermediate holding company entered into a corporate Credit Agreement. The obligations under the Credit Agreement are secured by liens on substantially all of the otherwise unencumbered assets of such holding company. The principal amount of the loan is to be repaid in quarterly installments, the amount of which may be adjusted based on the net leverage ratio (as defined in the Credit Agreement) at the end of each fiscal quarter. The Credit Agreement is subject to a LIBOR floor of
1.25%
.
On June 24, 2016, the Company entered into a Fourth Amendment to the Credit Agreement. The Fourth Amendment provides for additional term loans in an aggregate principal amount of
$15,000
with the same maturity date, margin above LIBOR, principal repayment term, and conditions and covenants as the existing term loans under the Credit Agreement. The Fourth Amendment also provides the ability to prepay loans under the Credit Agreement, subject to payment of a make-whole premium until the one year anniversary of the Fourth Amendment. As of December 31, 2016 and 2015, the maximum borrowing capacity under the agreement was
$125,000
and the outstanding amount borrowed was
$58,500
and
$45,500
, respectively.
On December 4, 2014, a subsidiary in our specialty insurance business and its subsidiaries entered into an amended and restated
$140,000
secured credit agreement which is secured by liens on substantially all of the assets of the specialty insurance business. In addition, such credit agreement is subject to certain leverage and distribution covenants. This agreement provides for a
$50,000
term loan facility and a
$90,000
revolving credit facility. Our specialty insurance business and its subsidiaries are required to repay the aggregate outstanding principal amount of the initial
$50,000
term loan facility in consecutive quarterly installments of
$1,250
, which commenced in March 2015. As of December 31, 2016 and 2015 the maximum borrowing capacity under such agreement was
$130,000
and
$135,000
, respectively, and the outstanding amount borrowed was
$105,500
and
$91,500
, respectively.
Asset Based Revolving Financing
The Company has financed purchases of certain investments in commercial loans and NPLs with portfolio-based leverage. These investments are held in our specialty insurance business. Such borrowings are generally recourse only to the specific investments in such portfolios. Repayment of such loans is (i) based upon a specific maturity date of May 5, 2020 (for maximum borrowings of
$150,000
) or (ii) based upon the earlier of September, 2018 or an amount of approximately
120%
of the cash realization events in the portfolio plus an amount dependent on the balance of the interest reserve account (for a maximum borrowing of
$40,000
). As of December 31, 2016 and 2015, a total of
$149,106
and
$54,900
, respectively, was outstanding under such financing agreements. The loan is subject to a LIBOR floor of
0.40%
.
In addition, a subsidiary in the specialty finance business has outstanding borrowings which are recourse to the loan portfolio. Total outstanding borrowings under such facility totaled approximately
$93,627
and
$36,192
as of December 31, 2016 and 2015, respectively. The loan is subject to a LIBOR floor of
0.50%
.
Mortgage Warehouse Borrowing
The Company, through subsidiaries in its specialty finance business has
five
warehouse borrowings with a total borrowing capacity at December 31, 2016 of
$188,000
. Such warehouse facilities are recourse to the assets of the subsidiary and are secured by liens on cash escrow and the loans held for sale in the warehouse. These credit agreements contain customary financial covenants that require, among other items, minimum amounts of tangible net worth, profitability, maximum indebtedness ratios, and minimum liquid assets.
Three
of these credit agreements are subject to a LIBOR floor of
0.25%
.
F- 58
TIPTREE INC. AND SUBSIDIARIES
Notes to Consolidated Financial Statements
December 31, 2016
(in thousands, except share data)
Real Estate Commercial Mortgage Borrowing
In connection with acquisitions and assets acquired in the senior living business, the Company, along with our joint venture partners, have entered into fixed and variable rate mortgage borrowings. The Company’s mortgage borrowings contain various customary financial and other covenants, in some cases including debt service coverage ratios. Generally such loans are secured by separate first priority mortgages on each of the individual properties and certain loans totaling
$20,106
and
$14,801
as of December 31, 2016 and 2015, respectively, are secured by separate cross-collateralized, cross-defaulted first priority deeds of trust on several of the properties. Certain floating rate borrowings have an interest rate floor of
2.05%
to
2.98%
. Floating rate borrowings are generally converted into a fixed rate by entering into interest rate swaps. In 2016, the Company elected to apply hedge accounting to such swaps, as further described in Note—
(11) Derivative Financial Instruments and Hedging
.
Subordinated Debt
A subsidiary in our specialty finance business has a subordinated promissory note with an affiliate who owns the non-controlling interest of our subsidiary.
The note has a maturity date of April 9, 2020 or six months following maturity of the asset based revolving financing held by the same entity.
The note may be prepaid following the first anniversary of issuance but there is a prepayment premium of
3.00%
prior to the second anniversary of issuance,
2.00%
after the second but before the third anniversary and
1.00%
after the third but before the fourth anniversary.
Preferred Trust Securities
A subsidiary in our specialty insurance business has
$35,000
of preferred trust securities due June 15, 2037. Interest is payable quarterly. In 2012, a subsidiary in our specialty insurance business entered into an interest rate swap that exchanges the floating rate for a fixed rate, as further described in Note—
(11) Derivative Financial Instruments and Hedging
. The Company may redeem the preferred trust securities, in whole or in part, at a price equal to the full outstanding principal amount of such preferred trust securities outstanding plus accrued and unpaid interest.
Preferred notes payable
A subsidiary in our specially finance business issued a series of notes to pay several former shareholders as part of the acquisition by the Company. Payments are subject to cash available for distribution based on the profitability of the subsidiary subject to stipulations governed by the note agreements.
Covenant Compliance
As of December 31, 2016, the Company is in compliance with the representations and covenants for outstanding borrowings or has obtained waivers for any events of non-compliance.
(14) Liability for Unpaid Claims and Claim Adjustment Expenses
The following tables present undiscounted information about incurred and paid claims development as of December 31, 2016, net of reinsurance, as well as cumulative claim frequency and the total of incurred-but-not-reported liabilities plus expected development on reported claims included within the net incurred claims amounts.
This information is presented in the aggregate for all short-duration contracts, due to the commonality of claims characteristics. The tables reflect three years of information because historically over
99%
of incurred losses have been paid within
three
years of the accident period.
The information about incurred and paid claims development for the years ended December 31, 2014 and 2015 is presented as supplementary information and is unaudited.
F- 59
TIPTREE INC. AND SUBSIDIARIES
Notes to Consolidated Financial Statements
December 31, 2016
(in thousands, except share data)
Roll forward of Claim Liability
The following table presents the activity in the net liability for unpaid losses and allocated loss adjustment expenses of short-duration contracts:
|
Year Ended December 31,
|
|||||||
|
2016
|
2015
|
||||||
|
Policy liabilities and unpaid claims balance at January 1
|
$
|
80,663
|
|
$
|
63,364
|
|
|
|
Less : liabilities of policy-holder accounts balances, gross
|
(19,037
|
)
|
(21,056
|
)
|
|||
|
Less : non-insurance warranty benefit claim liabilities
|
(116
|
)
|
(171
|
)
|
|||
|
Gross liabilities for unpaid losses and loss adjustment expenses
|
61,510
|
|
42,137
|
|
|||
|
Less : reinsurance recoverable on unpaid losses - short duration
|
(42,341
|
)
|
(28,089
|
)
|
|||
|
Less : other lines, gross
|
(163
|
)
|
(178
|
)
|
|||
|
Net balance at January 1, short duration
|
19,006
|
|
13,870
|
|
|||
|
Incurred (short duration) related to:
|
|||||||
|
Current year
|
84,178
|
|
59,579
|
|
|||
|
Prior years
|
(1,599
|
)
|
(4,152
|
)
|
|||
|
Total incurred
|
82,579
|
|
55,427
|
|
|||
|
Paid (short duration) related to:
|
|||||||
|
Current year
|
62,989
|
|
41,578
|
|
|||
|
Prior years
|
16,033
|
|
8,713
|
|
|||
|
Total paid
|
79,022
|
|
50,291
|
|
|||
|
Net balance at December 31, short duration
|
22,563
|
|
19,006
|
|
|||
|
Plus : reinsurance recoverable on unpaid losses - short duration
|
63,112
|
|
42,341
|
|
|||
|
Plus : other lines, gross
|
208
|
|
163
|
|
|||
|
Gross liabilities for unpaid losses and loss adjustment expenses
|
85,883
|
|
61,510
|
|
|||
|
Plus : liabilities of policy-holder accounts balances, gross
|
17,417
|
|
19,037
|
|
|||
|
Plus : non-insurance warranty benefit claim liabilities
|
91
|
|
116
|
|
|||
|
Policy liabilities and unpaid claims balance at December 31
|
$
|
103,391
|
|
$
|
80,663
|
|
|
The following schedule reconciles the total on short duration contracts per the table above to the amount of total losses incurred as presented in the consolidated statement of operations, excluding the amount for member benefit claims:
|
Year Ended December 31,
|
|||||||
|
2016
|
2015
|
||||||
|
Total incurred
|
$
|
82,579
|
|
$
|
55,427
|
|
|
|
Other lines incurred
|
277
|
|
296
|
|
|||
|
Unallocated loss adjustment expense
|
2,094
|
|
845
|
|
|||
|
Total losses incurred
|
$
|
84,950
|
|
$
|
56,568
|
|
|
F- 60
TIPTREE INC. AND SUBSIDIARIES
Notes to Consolidated Financial Statements
December 31, 2016
(in thousands, except share data)
Incurred and Paid Development
The following table presents information about incurred and paid loss development and average claim duration as of December 31, 2016, net of reinsurance, as well as cumulative claim frequency and the total of incurred-but-not-reported liabilities plus expected development on reported claims included within the net incurred claims amounts. The cumulative number of reported claims represents open claims, claims closed with payment, and claims closed without payment. It does not include an estimated count of unreported claims. The number of claims is measured by claim event. The Company considers a claim that does not result in a liability as a claim closed without payment.
|
Incurred Losses and Allocated Loss Adjustment Expenses, Net of Reinsurance
|
As of December 31, 2016
|
|||||||||||||||
|
For the Years Ended December 31,
|
Total of Incurred-but-Not-Reported Liabilities Plus Expected Development of Reported Claims
|
Cumulative Number of Reported Claims
|
||||||||||||||
|
Accident Year
|
2014
(1)
|
2015
(1)
|
2016
|
|||||||||||||
|
2014
|
$
|
43,449
|
|
$
|
39,614
|
|
$
|
39,914
|
|
$
|
182
|
|
122
|
|
||
|
2015
|
59,579
|
|
57,470
|
|
$
|
132
|
|
176
|
|
|||||||
|
2016
|
84,178
|
|
$
|
16,582
|
|
188
|
|
|||||||||
|
Total
|
|
$
|
181,562
|
|
||||||||||||
|
Cumulative Paid Losses and Allocated Loss Adjustment Expenses, Net of Reinsurance
|
||||||||||||||||
|
For the Years Ended December 31,
|
||||||||||||||||
|
Accident Year
|
2014
(1)
|
2015
(1)
|
2016
|
|||||||||||||
|
2014
|
$
|
30,435
|
|
$
|
38,752
|
|
$
|
39,596
|
|
|||||||
|
2015
|
41,578
|
|
56,445
|
|
||||||||||||
|
2016
|
62,989
|
|
||||||||||||||
|
Total
|
|
$
|
159,030
|
|
||||||||||||
|
All outstanding liabilities before 2014, net of reinsurance
|
31
|
|
||||||||||||||
|
Liabilities for loss and loss adjustment expenses, net of reinsurance
|
$
|
22,563
|
|
|||||||||||||
(1)
- The information presented for the years 2014 and 2015 is presented as unaudited supplemental information.
Duration
The following table presents unaudited supplementary information about average historical claims duration as of December 31, 2016 for short-duration contracts:
|
Average Annual Percentage Payout of Incurred Claims by Age, Net of Reinsurance
|
|||
|
Years
|
1
|
2
|
3
|
|
Short duration
|
75%
|
23%
|
2%
|
F- 61
TIPTREE INC. AND SUBSIDIARIES
Notes to Consolidated Financial Statements
December 31, 2016
(in thousands, except share data)
Reconciliation of Reserves to Balance Sheet
The following table presents a reconciliation of net outstanding liabilities for unpaid loss and loss adjustment expenses of short-duration contracts to the balance sheet value of policy liabilities and unpaid claims:
|
As of
|
|||
|
December 31, 2016
|
|||
|
Net outstanding liabilities:
|
|||
|
Short duration
|
$
|
22,563
|
|
|
Insurance lines other than short-duration
|
40
|
|
|
|
Total liabilities for unpaid losses and loss adjustment expenses, net of reinsurance
|
22,603
|
|
|
|
Reinsurance recoverable on unpaid losses and loss adjustment expenses:
|
|||
|
Short duration
|
63,112
|
|
|
|
Other insurance lines
|
168
|
|
|
|
Total reinsurance recoverable on unpaid losses and loss adjustment expenses
|
63,280
|
|
|
|
Total gross liability for unpaid losses and loss adjustment expenses
|
85,883
|
|
|
|
Liabilities of policy-holder accounts balances, gross
|
17,417
|
|
|
|
Non-insurance warranty benefit claim liabilities
|
91
|
|
|
|
Total policy liabilities and unpaid claims
|
$
|
103,391
|
|
(15) Other Assets
The following table presents the components of other assets as reported in the Consolidated Balance Sheets:
|
As of December 31,
|
|||||||
|
2016
|
2015
|
||||||
|
Due from brokers and trustees
|
$
|
2,027
|
|
$
|
29,052
|
|
|
|
Furnitures, fixtures and equipment, net
|
5,936
|
|
7,024
|
|
|||
|
Prepaid expenses
|
5,020
|
|
2,690
|
|
|||
|
Accrued interest receivable
|
2,052
|
|
2,625
|
|
|||
|
Management fee receivable
|
4,308
|
|
1,767
|
|
|||
|
Other fee receivable
|
5,022
|
|
3,237
|
|
|||
|
Income tax receivable
|
4,842
|
|
5,810
|
|
|||
|
Other
|
8,679
|
|
10,038
|
|
|||
|
Total other assets
|
$
|
37,886
|
|
|
$
|
62,243
|
|
Depreciation expense related to furniture, fixtures and equipment was
$574
,
$370
and
$228
for the years ended
December 31, 2016
,
December 31, 2015
and December 31, 2014, respectively.
(16) Other Liabilities and Accrued Expenses
The following table presents the components of other liabilities and accrued expenses as reported in the Consolidated Balance Sheets:
|
As of December 31,
|
|||||||
|
2016
|
2015
|
||||||
|
Accounts payable and accrued expenses
|
$
|
67,837
|
|
$
|
53,594
|
|
|
|
Deferred tax liabilities, net
|
32,296
|
|
22,699
|
|
|||
|
Due to broker and trustee
|
8,457
|
|
8,622
|
|
|||
|
Commissions payable
|
7,466
|
|
14,866
|
|
|||
|
Accrued interest payable
|
1,729
|
|
1,354
|
|
|||
|
Trading liabilities, at fair value
|
1,398
|
|
22,152
|
|
|||
|
Other liabilities
|
14,552
|
|
9,438
|
|
|||
|
Total other liabilities and accrued expenses
|
$
|
133,735
|
|
$
|
132,725
|
|
|
F- 62
TIPTREE INC. AND SUBSIDIARIES
Notes to Consolidated Financial Statements
December 31, 2016
(in thousands, except share data)
(17) Other Income and Other Expenses
The following table presents the components of other income as reported in the Consolidated Statement of Operations, primarily comprised of interest income and loan fee income related to both loans at fair value and loans at amortized costs, net in our specialty finance business, and management fees from our asset management business:
|
Year Ended December 31,
|
|||||||||||
|
2016
|
2015
|
2014
|
|||||||||
|
Interest income
|
$
|
18,908
|
|
$
|
12,412
|
|
$
|
14,642
|
|
||
|
Loan fee income
|
13,217
|
|
9,373
|
|
3,736
|
|
|||||
|
Management fee income
|
9,400
|
|
6,524
|
|
259
|
|
|||||
|
Other
|
2,144
|
|
12,041
|
|
1,425
|
|
|||||
|
Total other income
|
$
|
43,669
|
|
$
|
40,350
|
|
$
|
20,062
|
|
||
The following table presents the components of other expenses as reported in the Consolidated Statement of Operations:
|
Year Ended December 31,
|
|||||||||||
|
2016
|
2015
|
2014
|
|||||||||
|
Professional fees
|
$
|
22,337
|
|
$
|
20,991
|
|
$
|
10,502
|
|
||
|
Acquisition and transaction costs
|
711
|
|
1,859
|
|
6,121
|
|
|||||
|
General and administrative
|
14,753
|
|
13,044
|
|
3,873
|
|
|||||
|
Premium taxes
|
8,244
|
|
4,468
|
|
135
|
|
|||||
|
Mortgage origination expenses
|
8,079
|
|
3,960
|
|
793
|
|
|||||
|
Property operating expenses
|
7,431
|
|
6,609
|
|
1,582
|
|
|||||
|
Rent and related
|
12,484
|
|
11,056
|
|
3,081
|
|
|||||
|
Other
|
18,235
|
|
13,534
|
|
5,821
|
|
|||||
|
Total other expense
|
$
|
92,274
|
|
$
|
75,521
|
|
$
|
31,908
|
|
||
(18) Stockholders’ Equity
During the
year ended December 31, 2016
, consolidated subsidiaries of Tiptree purchased
6,596,000
shares of Class A common stock of Tiptree for aggregate consideration of
$42,524
. The shares acquired by subsidiaries of Tiptree are accounted for as treasury shares and therefore are not outstanding for accounting or voting purposes.
As of
December 31, 2016
and
December 31, 2015
, there were
34,983,616
(including the shares of Class A common stock held by subsidiaries of Tiptree) and
34,899,833
shares of Class A common stock issued and outstanding, respectively. As of
December 31, 2016
and
December 31, 2015
, there were
8,049,029
shares of Class B common stock issued and outstanding, respectively, all of which are owned by TFP as a fiduciary for the limited partners of TFP. As a result of the tax reorganization on January 1, 2016, these shares of Class B common stock are accounted for as treasury stock in Tiptree’s financial statements.
All shares of our Class A common stock have equal rights as to earnings, assets, dividends and voting. Shares of Class B common stock have equal voting rights but no economic rights (including no right to receive dividends or other distributions upon liquidation, dissolution or otherwise). Distributions may be paid to holders of Class A common stock when duly authorized by our board of directors and declared out of legally available assets.
TFP owns a warrant to purchase
652,500
shares of Class A common stock at
$11.33
per share which is immediately exercisable and expires on September 30, 2018. Such an exercise would be accounted for as treasury stock held at TFP and would have no impact on Tiptree’s financial statements.
Tricadia Capital Management LLC owns an option to purchase
540,000
TFP common units at
$15.00
per common unit which is immediately exercisable and expires on June 12, 2017 (Tricadia Option). The Tricadia Option was amended as of January 31, 2017 solely so that TFP can, at its option, deliver shares of the Company’s Class A common stock on an as exchanged basis of
2.798
shares for each TFP common unit. Such contract is equivalent to an option on
1,510,920
shares of Class A common stock at a strike price of
$5.36
.
F- 63
TIPTREE INC. AND SUBSIDIARIES
Notes to Consolidated Financial Statements
December 31, 2016
(in thousands, except share data)
The Company paid cash dividends per share during the periods presented as follows:
|
Dividends per share for
|
|||||||
|
the Year ended December 31,
|
|||||||
|
2016
|
2015
|
||||||
|
First Quarter
|
$
|
0.025
|
|
$
|
0.025
|
|
|
|
Second Quarter
|
0.025
|
|
0.025
|
|
|||
|
Third Quarter
|
0.025
|
|
0.025
|
|
|||
|
Fourth Quarter
|
0.025
|
|
0.025
|
|
|||
|
Total cash dividends paid
|
$
|
0.100
|
|
$
|
0.100
|
|
|
Statutory Reporting and Insurance Company Subsidiaries Dividend Restrictions
The Company's insurance company subsidiaries may pay dividends to the Company, subject to statutory restrictions. Payments in excess of statutory restrictions (extraordinary dividends) to the Company are permitted only with prior approval of the insurance department of the applicable state of domicile. The Company eliminated all dividends from its subsidiaries in the consolidated financial statements. The following table presents the dividends paid to the Company by its insurance company subsidiaries for the following periods:
|
Year Ended December 31,
|
|||||||
|
2016
|
2015
|
||||||
|
Ordinary dividends
|
$
|
3,081
|
|
$
|
6,800
|
|
|
|
Extraordinary dividends
|
532
|
|
804
|
|
|||
|
Total dividends
|
$
|
3,613
|
|
$
|
7,604
|
|
|
The following table presents the combined statutory capital and surplus of the Company's insurance company subsidiaries, the required minimum statutory capital and surplus, as required by the laws of the states in which they are domiciled, and the combined amount available for ordinary dividends of the Company's insurance company subsidiaries for the following periods:
|
As of December 31,
|
|||||||
|
2016
|
2015
|
||||||
|
Combined statutory capital and surplus of the Company's insurance company subsidiaries
|
$
|
100,920
|
|
$
|
89,500
|
|
|
|
Required minimum statutory capital and surplus
|
$
|
17,200
|
|
$
|
17,200
|
|
|
|
Amount available for ordinary dividends of the Company's insurance company subsidiaries
|
$
|
9,049
|
|
$
|
1,827
|
|
|
At December 31, 2016, the maximum amount of dividends that our regulated insurance company subsidiaries could pay under applicable laws and regulations without regulatory approval was approximately
$9,049
. The Company may seek regulatory approval to pay dividends in excess of this permitted amount, but there can be no assurance that the Company would receive regulatory approval if sought.
Under the National Association of Insurance Commissioners (NAIC) Risk-Based Capital Act of 1995, a company's Risk-Based Capital (RBC) is calculated by applying certain risk factors to various asset, claim and reserve items. If a company's adjusted surplus falls below calculated RBC thresholds, regulatory intervention or oversight is required. The Company's insurance company subsidiaries' RBC levels, as calculated in accordance with the NAIC’s RBC instructions, exceeded all RBC thresholds as of December 31, 2016.
The following table presents the net income of the Company’s statutory insurance companies for the following periods:
|
Year Ended December 31,
|
|||||||
|
2016
|
2015
|
||||||
|
Net income of statutory insurance companies
|
$
|
12,369
|
|
$
|
10,805
|
|
|
F- 64
TIPTREE INC. AND SUBSIDIARIES
Notes to Consolidated Financial Statements
December 31, 2016
(in thousands, except share data)
(19) Accumulated Other Comprehensive Income (Loss)
The following table presents the activity in accumulated other comprehensive income (loss) (AOCI), net of tax, for the following periods:
|
Unrealized gains (losses) on
|
Amount Attributable to Noncontrolling Interests
|
||||||||||||||||||||||
|
Available for sale securities
|
Interest rate swaps
|
Total AOCI
|
TFP
|
Other
|
Total AOCI to Tiptree Inc.
|
||||||||||||||||||
|
Balance at December 31, 2013
|
$
|
33
|
|
$
|
—
|
|
$
|
33
|
|
$
|
—
|
|
$
|
—
|
|
$
|
33
|
|
|||||
|
Other comprehensive (losses) gains before reclassifications
|
(197
|
)
|
83
|
|
(114
|
)
|
—
|
|
—
|
|
(114
|
)
|
|||||||||||
|
Amounts reclassified from AOCI
|
(31
|
)
|
63
|
|
32
|
|
—
|
|
—
|
|
32
|
|
|||||||||||
|
Period change
|
(228
|
)
|
146
|
|
(82
|
)
|
—
|
|
—
|
|
(82
|
)
|
|||||||||||
|
Balance at December 31, 2014
|
$
|
(195
|
)
|
$
|
146
|
|
$
|
(49
|
)
|
$
|
—
|
|
$
|
—
|
|
$
|
(49
|
)
|
|||||
|
Other comprehensive (losses) before reclassifications
|
(91
|
)
|
(214
|
)
|
(305
|
)
|
—
|
|
—
|
|
(305
|
)
|
|||||||||||
|
Amounts reclassified from AOCI
|
64
|
|
179
|
|
243
|
|
—
|
|
—
|
|
243
|
|
|||||||||||
|
Period change
|
(27
|
)
|
(35
|
)
|
(62
|
)
|
—
|
|
—
|
|
(62
|
)
|
|||||||||||
|
Balance at December 31, 2015
|
$
|
(222
|
)
|
$
|
111
|
|
$
|
(111
|
)
|
$
|
—
|
|
$
|
—
|
|
$
|
(111
|
)
|
|||||
|
Other comprehensive income (losses) before reclassifications
|
186
|
|
1,552
|
|
1,738
|
|
(128
|
)
|
(376
|
)
|
1,234
|
|
|||||||||||
|
Amounts reclassified from AOCI
|
(664
|
)
|
96
|
|
(568
|
)
|
—
|
|
—
|
|
(568
|
)
|
|||||||||||
|
Period change
|
(478
|
)
|
1,648
|
|
1,170
|
|
(128
|
)
|
(376
|
)
|
666
|
|
|||||||||||
|
Balance at December 31, 2016
|
$
|
(700
|
)
|
$
|
1,759
|
|
$
|
1,059
|
|
$
|
(128
|
)
|
$
|
(376
|
)
|
$
|
555
|
|
|||||
The following table presents the reclassification adjustments out of AOCI included in net income and the impacted line items on the Consolidated Statement of Operations for the following periods:
|
Year Ended December 31,
|
Affected line item in Consolidated Statement of Operations
|
|||||||||||
|
Components of AOCI
|
2016
|
2015
|
2014
|
|||||||||
|
Unrealized gains (losses) on available for sale securities
|
$
|
1,026
|
|
$
|
(99
|
)
|
$
|
50
|
|
Net realized and unrealized gains (losses)
|
||
|
Related tax (expense) benefit
|
(362
|
)
|
35
|
|
(19
|
)
|
Provision for income tax
|
|||||
|
Net of tax
|
$
|
664
|
|
$
|
(64
|
)
|
31
|
|
|
|||
|
Unrealized gains (losses) on interest rate swaps
|
$
|
(121
|
)
|
$
|
(274
|
)
|
(97
|
)
|
Interest expense
|
|||
|
Related tax (expense) benefit
|
25
|
|
95
|
|
34
|
|
Provision for income tax
|
|||||
|
Net of tax
|
$
|
(96
|
)
|
$
|
(179
|
)
|
(63
|
)
|
|
|||
(20) Stock Based Compensation
Equity Plans
2007 Manager Equity Plan
The Care Investment Trust Inc. Manager Equity Plan was adopted in June 2007 and will automatically expire on June 21, 2017. As of
December 31, 2016
,
134,629
common shares remain available for future issuances. No shares have been issued since March 30, 2012 from this plan.
2013 Omnibus Incentive Plan
The Company adopted the Tiptree 2013 Omnibus Incentive Plan (2013 Equity Plan) on August 8, 2013, which permits the grant of stock units, stock, and stock options up to a maximum of
2,000,000
shares of Class A common stock. The general purpose of the 2013 Equity Plan is to attract, motivate and retain selected employees and directors for the Company, to provide them with incentives and rewards for performance and to better align their interests with the interests of the Company’s stockholders. Unless otherwise extended, the 2013 Equity Plan terminates automatically on the tenth anniversary of its adoption.
F- 65
TIPTREE INC. AND SUBSIDIARIES
Notes to Consolidated Financial Statements
December 31, 2016
(in thousands, except share data)
The table below summarizes changes to the issuances under the Company’s 2013 Equity Plan for the periods indicated:
|
Number of shares
(1)
|
||
|
Available for issuance as of December 31, 2013
|
1,980,690
|
|
|
Shares Issued
|
(49,711
|
)
|
|
Available for issuance as of December 31, 2014
|
1,930,979
|
|
|
Shares issued and granted
|
(354,978
|
)
|
|
Shares forfeited
|
6,338
|
|
|
Available for issuance as of December 31, 2015
|
1,582,339
|
|
|
Shares issued and granted
|
(620,689
|
)
|
|
Available for issuance as of December 31, 2016
|
961,650
|
|
|
(1)
|
Excludes shares granted under the Company’s subsidiary incentive plans that are exchangeable for Tiptree Class A common stock.
|
Restricted stock units and restricted stock
A holder of the restricted stock units (RSUs) receive distributions. Generally, the RSUs shall vest and become nonforfeitable with respect to one-third of Tiptree shares granted on each of the first, second and third anniversaries of the date of the grant, and expensed using the straight-line method over the requisite service period. The restricted stock is subject to forfeiture as set forth in the agreement governing the award and receives distributions and has the right to vote.
The following table summarizes changes to the issuances of Class A common stock, restricted stock, and RSUs under the 2013 Equity Plan for the periods indicated:
|
Number of shares issuable
|
Weighted Average Grant Date Fair Value
|
||||||
|
Unvested units as of December 31, 2013
|
19,310
|
|
$
|
7.00
|
|
||
|
Vested
|
(7,184
|
)
|
7.65
|
|
|||
|
Forfeited
|
—
|
|
—
|
|
|||
|
Unvested units as of December 31, 2014
|
|
12,126
|
|
|
7.18
|
|
|
|
Granted
|
143,599
|
|
7.68
|
|
|||
|
Vested
|
(21,064
|
)
|
7.51
|
|
|||
|
Forfeited
|
(6,338
|
)
|
6.88
|
|
|||
|
Unvested units as of December 31, 2015
|
|
128,323
|
|
|
$
|
7.68
|
|
|
Granted
|
369,452
|
|
5.71
|
|
|||
|
Vested
(1)
|
(197,958
|
)
|
6.13
|
|
|||
|
Unvested units as of December 31, 2016
|
299,817
|
|
$
|
6.27
|
|
||
|
(1)
|
Includes
130,946
of immediately vested Class A common stock with a grant date fair value of approximately
$750
to settle compensation accrued during the year ended December 31, 2015.
|
The Company values RSUs at their grant-date fair value as measured by Tiptree’s common stock price. Included in vested shares for
2016
are
646
shares surrendered to pay taxes on behalf of the employees with shares vesting. During the
year ended December 31, 2016
, the Company granted
218,310
RSUs to employees of the Company, of which
111,759
vest over a period of
three
years that began in January 2016,
33,624
will vest over a period of
two
years beginning February 2016,
55,768
will vest over a period of
two
years beginning April 2016 and the remainder will vest over a period of
three
years beginning April 2016.
Subsidiary Incentive Plans
Certain of Tiptree’s subsidiaries have established RSU programs under which they are authorized to issue RSUs or their equivalents, representing equity of such subsidiaries to certain of their employees. Such awards are accounted for as a liability. These RSUs are subject to performance-vesting criteria based on the performance of the subsidiary (performance vesting RSUs) and time-vesting subject to continued employment (time vesting RSUs). Following the service period, such vested RSUs may be exchanged at fair market value, at the option of the holder, for Tiptree Class A common stock under the 2013 Omnibus Incentive Plan. The Company has the option, but not the obligation to settle the exchange right in shares or cash.
F- 66
TIPTREE INC. AND SUBSIDIARIES
Notes to Consolidated Financial Statements
December 31, 2016
(in thousands, except share data)
The following table summarizes changes to the issuances of subsidiary RSU’s under the subsidiary incentive plans for the periods indicated:
|
Grant date fair value of equity shares issuable
|
||||
|
Unvested balance as of December 31, 2014
|
$
|
—
|
|
|
|
Granted
|
874
|
|
||
|
Unvested balance as of December 31, 2015
|
874
|
|
||
|
Granted
|
7,339
|
|
||
|
Vested
|
(97
|
)
|
||
|
Fair value adjustment
|
119
|
|
||
|
Unearned
|
(146
|
)
|
||
|
Unvested balance as of December 31, 2016
|
$
|
8,089
|
|
|
Stock Options
Option awards have been granted to the Executive Committee with an exercise price equal to the fair market value of our common stock on the date of grant; those option awards have a
10
-year term and are subject the recipient’s continuous service, a market requirement, and generally vest over
five
years beginning on the
3
rd
anniversary of the grant date. Options granted during the year ended December 31, 2016 contained a market requirement that, at any time during the option term, the
20
-day volume weighted average stock price must exceed the December 31, 2015 book value per share. The market requirement may be met any time before the option expires and it only needs to be met once for the option to remain exercisable for the remainder of its term. If the market requirement is not met, but the service condition is met, the full amount of the compensation expense will be recognized over the appropriate vesting period.
The fair value of each option grant was estimated on the date of grant using a Black-Scholes-Merton option pricing formula embedded within a Monte Carlo model used to simulate the future stock prices of the Company, which assumes that the market requirement is achieved. Historical volatility was computed based on historical daily returns of the Company’s stock over a lookback period equal to
2.5
years from the grant date, which represents the time period since the July 1, 2013 business combination through which Tiptree became a public company. The valuation is done under a risk-neutral framework using the 10-year zero-coupon risk-free interest rate derived from the Treasury Constant Maturities yield curve on the grant date. The current quarterly dividend of
$0.025
was used to calculate a spot dividend yield as of the date of grant for use in the model.
The following table presents the assumptions used to estimate the fair values of the stock options granted for the following period:
|
Valuation Input
|
Year Ended December 31, 2016
|
|||||||
|
Range
|
Weighted
|
|||||||
|
Low
|
High
|
Average
|
||||||
|
Historical Volatility
|
50.19
|
%
|
50.46
|
%
|
N/A
|
|||
|
Risk-free Rate
|
1.93
|
%
|
2.28
|
%
|
N/A
|
|||
|
Dividend Yield
|
1.70
|
%
|
1.76
|
%
|
N/A
|
|||
|
Expected term (years)
|
6.5
|
|||||||
The following table presents the Company's stock option activity for the current period:
|
Options Outstanding
|
Weighted Average Exercise Price (in dollars per stock option)
|
Weighted Average Grant Date Value (in dollars per stock option)
|
Options Exercisable
|
||||||||||
|
Balance, December 31, 2015
|
—
|
|
$
|
—
|
|
$
|
—
|
|
—
|
|
|||
|
Granted
|
251,237
|
|
5.69
|
|
2.62
|
|
—
|
|
|||||
|
Balance, December 31, 2016
|
251,237
|
|
$
|
5.69
|
|
$
|
2.62
|
|
—
|
|
|||
|
Weighted average remaining contractual term at December 31, 2016 (in years)
|
9.0
|
|
|||||||||||
F- 67
TIPTREE INC. AND SUBSIDIARIES
Notes to Consolidated Financial Statements
December 31, 2016
(in thousands, except share data)
Stock-based Compensation Expense
The following table presents the total time-based and performance-based stock-based compensation expense and the related income tax benefit recognized on the Consolidated Statements of Operations:
|
Year Ended December 31,
|
|||||||||||
|
2016
|
2015
|
2014
|
|||||||||
|
Payroll and employee commissions
|
$
|
2,441
|
|
$
|
304
|
|
$
|
233
|
|
||
|
Professional fees
(1)
|
143
|
|
133
|
|
210
|
|
|||||
|
Income tax benefit
|
(912
|
)
|
(154
|
)
|
(156
|
)
|
|||||
|
Net stock-based compensation expense
|
$
|
1,672
|
|
$
|
283
|
|
$
|
287
|
|
||
|
(1)
|
Professional fees consist of the value of restricted stock units and options granted to persons providing services to the Company.
|
Additional information on total non-vested stock-based compensation is as follows:
|
At
|
|||||||
|
December 31, 2016
|
|||||||
|
Stock Options
|
Restricted Stock Awards and RSUs
|
||||||
|
Unrecognized compensation cost related to non-vested awards
|
$
|
490
|
|
$
|
7,181
|
|
|
|
Weighted - average recognition period (in years)
|
3.2
|
|
1.9
|
|
|||
(21) Related Party Transactions
Tricadia Holdings, L.P
.
On June 30, 2012, TAMCO, TFP and Tricadia Holdings LP (Tricadia) entered into a transition services agreement (TSA) in connection with the internalization of the management of Tiptree. Pursuant to the TSA, Tricadia provides the Company with the services of its Executive Chairman as well as certain administrative and information technology. The TSA was assigned to the Company in connection with the Contribution Transactions. The Company pays Tricadia specified prices per service which are detailed in the table below.
Mariner Investment Group LLC
TFP and Back Office Services Group, Inc. (BOSG) entered into an administrative services agreement on June 12, 2007 (Administrative Services Agreement), which was assigned to Tiptree on July 1, 2013 in connection with the Contribution Transactions, under which BOSG provides certain back office, administrative and accounting services to the Company and it’s subsidiaries. BOSG is an affiliate of Mariner Investment Group (Mariner). Under the Administrative Services Agreement, the Company pays BOSG a quarterly fee of
0.025%
of the Company’s Net Assets, defined as the Company’s total assets less total liabilities, including accrued income and expense, calculated in accordance with GAAP. The Administrative Services Agreement has successive
one year
terms but may be terminated by either the Company or BOSG upon
60
days prior notice.
As of June 30, 2016, the Company has concluded that Mariner no longer meets the definition of a related party.
F- 68
TIPTREE INC. AND SUBSIDIARIES
Notes to Consolidated Financial Statements
December 31, 2016
(in thousands, except share data)
The following table presents the fees paid to related parties for services provided:
|
Year Ended December 31,
|
|||||||||||
|
2016
|
2015
|
2014
|
|||||||||
|
Services Provided by Tricadia:
|
|||||||||||
|
Personnel, including services of our Executive Chairman and personnel providing accounting services
|
$
|
100
|
|
$
|
450
|
|
$
|
450
|
|
||
|
Incentive compensation for providing services
(1)
|
1,278
|
|
1,250
|
|
1,757
|
|
|||||
|
Legal and compliance services
|
—
|
|
150
|
|
150
|
|
|||||
|
Human resources, information technology and other personnel
|
112
|
|
112
|
|
112
|
|
|||||
|
Office space
|
245
|
|
245
|
|
245
|
|
|||||
|
Total paid to Tricadia
|
1,735
|
|
2,207
|
|
2,714
|
|
|||||
|
Services Provided by Mariner:
|
|
|
|
|
|||||||
|
Personnel, including back office, administrative and accounting services
|
296
|
|
529
|
|
413
|
|
|||||
|
Total fees paid to related parties
|
$
|
2,031
|
|
$
|
2,736
|
|
$
|
3,127
|
|
||
|
(1)
|
Represents cash bonuses and grant date fair value of immediately vested stock granted to Tricadia or its employees providing services to Tiptree pursuant to the TSA.
|
The amount of related party receivables and payables as of the balance sheet date was not material.
ProSight Specialty Insurance Group, Inc.
On June 23, 2016, subsidiaries of Tiptree purchased
5,596,000
shares of Class A common stock of Tiptree from entities affiliated with ProSight Specialty Insurance Group, Inc. (a principal owner of the Company’s Class A common stock prior to the purchase) for aggregate consideration of
$36,374
. The shares acquired by subsidiaries of Tiptree are held as treasury shares and are not outstanding for accounting or voting purposes.
Nomura Securities Co., Ltd.
On September 14, 2016, subsidiaries of Tiptree purchased
1,000,000
shares of Class A common stock of Tiptree from entities affiliated with Nomura Securities Co., Ltd. (a principal owner of the Company’s Class A common stock prior to the purchase) for aggregate consideration of
$6,150
. The shares acquired by subsidiaries of Tiptree are accounted for as treasury shares and are not outstanding for accounting or voting purposes.
TFPLP Holdings I, LLC
On November 8, 2016, TAMCO Manager, Inc., a subsidiary of Tiptree, which owned
99%
of TAMCO, purchased the remaining
1%
of TAMCO from TFPLP Holdings I, LLC (TFPLP I) for
28,977
shares of the Company’s Class A common stock. Tricadia is the managing member of TFPLP I and Michael Barnes, the Company’s Executive Chairman owns an economic interest in TFPLP I. At the time of the transaction, the shares of the Company’s Class A common stock issued to TFPLP had a market value of
$174
based on the closing stock price of
$6.00
per share.
F- 69
TIPTREE INC. AND SUBSIDIARIES
Notes to Consolidated Financial Statements
December 31, 2016
(in thousands, except share data)
(22) Income Taxes
The Company’s provision (benefit) for income taxes is reflected as a component of (loss) from continuing operations and consists of the following:
|
Year Ended December 31,
|
|||||||||||
|
2016
|
2015
|
2014
|
|||||||||
|
Current tax expense:
|
|||||||||||
|
Federal
|
$
|
3,667
|
|
$
|
18,408
|
|
$
|
3,459
|
|
||
|
State
|
864
|
|
2,522
|
|
931
|
|
|||||
|
Total current tax expense
|
4,531
|
|
20,930
|
|
4,390
|
|
|||||
|
Deferred tax expense (benefit):
|
|||||||||||
|
Federal
|
7,563
|
|
(18,492
|
)
|
(1,043
|
)
|
|||||
|
State
|
(1,116
|
)
|
(1,061
|
)
|
794
|
|
|||||
|
Total deferred tax (benefit)
|
6,447
|
|
(19,553
|
)
|
(249
|
)
|
|||||
|
Total income tax expense
|
$
|
10,978
|
|
$
|
1,377
|
|
$
|
4,141
|
|
||
The Company’s income taxes receivable as of December 31, 2016 was
$4,842
, offset with an income tax payable balance of
$1,617
, resulting in a consolidated net receivable of
$3,225
. As of December 31, 2015, there was a net receivable of
$5,810
.
The Company’s primary tax jurisdiction is the United States, which currently has a statutory income tax rate equal to
35%
. The Company also operates in several state jurisdictions that have an average combined statutory rate equal to approximately
2.5%
. Both the U.S. federal rate and the state statutory rates are before the consideration of rate reconciling items. A reconciliation of the expected federal income tax expense on income from continuing operations using the 35% federal statutory income tax rate to the actual income tax expense and resulting effective income tax rate is as follows for the periods indicated below:
|
Year Ended December 31,
|
|||||||||||
|
2016
|
2015
|
2014
|
|||||||||
|
Income (loss) before income taxes from continuing operations
|
$
|
43,316
|
|
$
|
(12,439
|
)
|
$
|
788
|
|
||
|
Federal statutory income tax rate
|
35.0
|
%
|
35.0
|
%
|
35.0
|
%
|
|||||
|
Expected federal income tax expense at 35%
|
15,161
|
|
(4,354
|
)
|
276
|
|
|||||
|
Effect of state income tax expense, net of federal benefit
|
205
|
|
226
|
|
1,459
|
|
|||||
|
Effect of permanent differences
|
232
|
|
(571
|
)
|
(278
|
)
|
|||||
|
Effect of changes in valuation allowance
|
(641
|
)
|
(1,142
|
)
|
1,350
|
|
|||||
|
Effect of change in tax status
|
(4,044
|
)
|
—
|
|
—
|
|
|||||
|
Effect of income (loss) allocated to non-taxable entities
|
(120
|
)
|
3,640
|
|
371
|
|
|||||
|
Effect of non-deductible transaction costs
|
—
|
|
—
|
|
1,639
|
|
|||||
|
Effect of return-to-accrual, deferred tax true-ups, and other items
|
185
|
|
3,578
|
|
(676
|
)
|
|||||
|
Tax on income from continuing operations
|
$
|
10,978
|
|
$
|
1,377
|
|
$
|
4,141
|
|
||
|
Effective tax rate
|
25.3
|
%
|
(11.1
|
)%
|
525.5
|
%
|
|||||
For the year ended December 31, 2016, the Company’s effective tax rate on income from continuing operations was equal to
25.3%
, which does not bear a customary relationship to statutory income tax rates. The effective tax rate for the year ended December 31, 2016 is lower than the U.S. statutory income tax rate of 35.0% primarily due to
$4,044
of discrete tax benefits for the period, primarily related to the tax restructuring that resulted in a U.S. federal consolidated income tax group effective January 1, 2016. The Company’s effective tax rate before the restructure benefit was equal to
34.7%
for the full year 2016.
For the year ended December 31, 2015, the Company’s effective tax rate on income from continuing operations was equal to
(11.1)%
, which does not bear a customary relationship to statutory income tax rates. The effective tax rate for the year ended December 31, 2015 is lower than the U.S. statutory income tax rate of
35%
, primarily due to taxes incurred at certain corporate subsidiaries that do not consolidate with the Company’s taxable income, tax losses generated at certain of our taxable subsidiaries which require a valuation allowance and do not generate an income tax benefit, and state income taxes incurred on a separate legal entity basis.
F- 70
TIPTREE INC. AND SUBSIDIARIES
Notes to Consolidated Financial Statements
December 31, 2016
(in thousands, except share data)
525.5% , which does not bear a customary relationship to statutory income tax rates. Differences from the statutory income tax rate are primarily the result of: (i) state income taxes; (ii) non-deductible transaction costs incurred on the Fortegra acquisition; and (iii) the effect of changes in valuation allowance on net operating losses reported by Tiptree Inc., Siena Capital Finance Acquisition Corp., Luxury and MFCA Funding, Inc.
The table below presents the components of the Company’s net deferred tax assets and liabilities as of the respective balance sheet dates:
|
As of December 31,
|
|||||||
|
2016
|
2015
|
||||||
|
Deferred tax assets:
|
|||||||
|
Net operating loss carryforwards
|
$
|
22,741
|
|
$
|
4,159
|
|
|
|
Unrealized losses
|
8,513
|
|
9,352
|
|
|||
|
Accrued expenses
|
6,790
|
|
3,618
|
|
|||
|
Unearned premiums
|
15,326
|
|
9,082
|
|
|||
|
Deferred revenue
|
5,899
|
|
11,555
|
|
|||
|
Other deferred tax assets
|
3,669
|
|
2,063
|
|
|||
|
Total deferred tax assets
|
62,938
|
|
39,829
|
|
|||
|
Less: Valuation allowance
|
(1,991
|
)
|
(965
|
)
|
|||
|
Total net deferred tax assets
|
60,947
|
|
38,864
|
|
|||
|
Deferred tax liabilities:
|
|||||||
|
Property
|
5,845
|
|
1,762
|
|
|||
|
Unrealized gains
|
10,855
|
|
5,924
|
|
|||
|
Deferred acquisition cost
|
46,425
|
|
24,579
|
|
|||
|
Basis differences in corporate subsidiaries
|
—
|
|
1,500
|
|
|||
|
Advanced commissions
|
16,438
|
|
11,683
|
|
|||
|
Intangibles
|
13,317
|
|
15,155
|
|
|||
|
Other deferred tax liabilities
|
363
|
|
960
|
|
|||
|
Total deferred tax liabilities
|
93,243
|
|
61,563
|
|
|||
|
Net deferred tax liability
|
$
|
32,296
|
|
$
|
22,699
|
|
|
As of January 2016, Tiptree has established a U.S. federal consolidated income tax group and as such files on a consolidated basis, with certain exceptions such a Fortegra life insurance company and Luxury. Tiptree consolidated, and certain subsidiaries on a separate basis, file returns in various state jurisdictions, and as such may have state tax obligations. Additionally, as needed the Company will take all necessary steps to comply with any income tax withholding requirements.
F- 71
TIPTREE INC. AND SUBSIDIARIES
Notes to Consolidated Financial Statements
December 31, 2016
(in thousands, except share data)
As of December 31, 2016, the Company had total U. S. Federal net operating loss carryforwards (NOLs) arising from continuing operations. The following table presents the U.S. Federal NOLs by tax year of expiration:
|
As of December 31,
|
|||
|
2016
|
|||
|
Tax Year of Expiration
|
|||
|
2026
|
$
|
86
|
|
|
2027
|
568
|
|
|
|
2028
|
246
|
|
|
|
2029
|
286
|
|
|
|
2030
|
149
|
|
|
|
2031
|
150
|
|
|
|
2032
|
189
|
|
|
|
2033
|
182
|
|
|
|
2034
|
1,893
|
|
|
|
2035
|
1,629
|
|
|
|
2036
|
47,537
|
|
|
|
Total
|
$
|
52,915
|
|
In addition to the U.S. Federal NOLs, Tiptree and its subsidiaries have NOLs in various state jurisdictions totaling
$3,896
. Included in that amount are NOLs of approximately
$1,991
that management has concluded will expire unutilized based on existing positive and negative evidence. As such, a full valuation allowance for that amount has been established.
Other than the valuation allowance discussed above, management believes it is more likely than not the remaining net operating loss carryforwards will be utilized prior to their expiration dates.
As of December 31, 2015, the consolidated valuation allowance for Tiptree was
$965
. In 2016, the Company recorded a net decrease in its valuation allowances equal to
$1,026
, compared with a decrease in its valuation allowance of
$1,743
in 2015.
As of December 31, 2016, the Company had no material unrecognized tax benefits or accrued interest and penalties. This is consistent with the tax years ending December 31, 2015 and December 31, 2014 as well. Federal tax years
2012
through
2015
were open for examination as of December 31, 2016.
(23) Commitments and Contingencies
Contractual Obligations
The table below summarizes the Company’s contractual obligations by period that payments are due:
|
As of December 31, 2016
|
|||||||||||||||||||
|
Less than one year
|
1-3 years
|
3-5 years
|
More than 5 years
|
Total
|
|||||||||||||||
|
Operating lease obligations
(1)
|
$
|
5,140
|
|
$
|
7,827
|
|
$
|
4,425
|
|
$
|
509
|
|
$
|
17,901
|
|
||||
|
Total
|
$
|
5,140
|
|
$
|
7,827
|
|
$
|
4,425
|
|
$
|
509
|
|
$
|
17,901
|
|
||||
|
(1)
|
Minimum rental obligations for Tiptree, Care, MFCA, Siena, Luxury, Reliance and Fortegra office leases. For the
year ended December 31, 2016
,
2015
and 2014, rent expense for the Company’s office leases were
$6,402
,
$5,784
and
$1,508
, respectively.
|
In addition, Tiptree’s subsidiary Siena issues standby letters of credit for credit enhancements that are required by its borrower’s respective businesses. As of
December 31, 2016
,
there was
$1,611
outstanding relating to these letters of credit.
Litigation
Fortegra is a defendant in Mullins v. Southern Financial Life Insurance Co., which was filed in February 2006, in the Pike Circuit Court, in the Commonwealth of Kentucky. A class was certified in June 2010. At issue is the duration or term of coverage under certain policies. The action alleges violations of the Consumer Protection Act and certain insurance statutes, as well as common
F- 72
TIPTREE INC. AND SUBSIDIARIES
Notes to Consolidated Financial Statements
December 31, 2016
(in thousands, except share data)
law fraud. The action seeks compensatory and punitive damages, attorney fees and interest. Plaintiffs filed a Motion for Sanctions in April 2012 in connection with Fortegra's efforts to locate and gather certificates and other documents from Fortegra's producers. The court did not award sanctions and Fortegra has retained a special master to facilitate the collection of certificates and other documents from Fortegra's producers. In January 2015, the trial court issued an Order denying Fortegra’s motion to decertify the class, which was upheld on appeal. Following a February 2017 hearing, the court denied Fortegra’s Motion for Summary Judgment as to certain disability insurance policies. The court has not yet ruled on Fortegra’s Motion for Summary Judgment as to certain life insurance policies, and a hearing is currently set for March 2017. No trial or additional hearings are currently scheduled.
The Company considers such litigation customary in the insurance industry. In management's opinion, based on information available at this time, the ultimate resolution of such litigation, which it is vigorously defending, should not be materially adverse to the financial position of the Company. It should be noted that large punitive damage awards, bearing little relation to actual damages sustained by plaintiffs, have been awarded in certain states against other companies in the credit insurance business. At this time, the Company cannot estimate a range of loss that is reasonably possible.
The Company and its subsidiaries are parties to other legal proceedings in the ordinary course of business. Although Tiptree’s legal and financial liability with respect to such proceedings cannot be estimated with certainty, the Company does not believe that these proceedings, either individually or in the aggregate, are likely to have a material adverse effect on the Company’s financial position.
(24) Earnings Per Share
The Company calculates basic net income per Class A common share based on the weighted average number of Class A common shares outstanding (inclusive of vested restricted share units). The unvested restricted share units have the non-forfeitable right to participate in dividends declared and paid on the Company’s common stock on an as vested basis and are therefore considered a participating security. The Company calculates basic earnings per share using the “two-class” method, and for the years ended
December 31, 2015
and
December 31, 2014
, the loss from continuing operations available to common stockholders was not allocated to the unvested restricted stock units as those holders do not have a contractual obligation to share in net losses.
Diluted net income per Class A common shares for the period includes the effect of potential equity of Siena, Reliance, and Operating Company as well as potential Class A common stock, if dilutive. For the years ended
December 31, 2015
and
December 31, 2014
, the assumed exercise of all dilutive instruments were anti-dilutive, and therefore, were not included in the diluted net income per Class A common share calculation.
F- 73
TIPTREE INC. AND SUBSIDIARIES
Notes to Consolidated Financial Statements
December 31, 2016
(in thousands, except share data)
The following table presents a reconciliation of basic and diluted net income per common share for the following periods:
|
Year Ended December 31,
|
|||||||||||
|
2016
|
2015
|
2014
|
|||||||||
|
Net income (loss) from continuing operations
|
$
|
32,338
|
|
$
|
(13,816
|
)
|
$
|
(3,353
|
)
|
||
|
Less:
|
|||||||||||
|
Net income (loss) from continuing operations attributable to non-controlling interests
(1)
|
7,018
|
|
(5,321
|
)
|
1,939
|
|
|||||
|
Net income from continuing operations allocated to participating securities
|
224
|
|
—
|
|
—
|
|
|||||
|
Net income (loss) from continuing operations available to Tiptree Inc. Class A common shares
|
25,096
|
|
(8,495
|
)
|
(5,292
|
)
|
|||||
|
Discontinued operations, net
|
—
|
|
22,618
|
|
7,937
|
|
|||||
|
Less:
|
|||||||||||
|
Net income from discontinued operations attributable to non-controlling interests
(1)
|
—
|
|
8,344
|
|
4,355
|
|
|||||
|
Net income from discontinued operations attributable to Tiptree Inc. Class A common shares
|
—
|
|
14,274
|
|
3,582
|
|
|||||
|
Net income (loss) attributable to Tiptree Inc. Class A common shares - basic
|
$
|
25,096
|
|
$
|
5,779
|
|
$
|
(1,710
|
)
|
||
|
Effect of Dilutive Securities:
|
|||||||||||
|
Securities of subsidiaries
|
(279
|
)
|
—
|
|
—
|
|
|||||
|
Adjustments to income relating to exchangeable interests, net of tax
|
—
|
|
—
|
|
—
|
|
|||||
|
Net income (loss) attributable to Tiptree Inc. Class A common shares - diluted
|
$
|
24,817
|
|
$
|
5,779
|
|
$
|
(1,710
|
)
|
||
|
Weighted average number of shares of Tiptree Inc. Class A common stock outstanding - basic
|
31,721,449
|
|
33,202,681
|
|
16,771,980
|
|
|||||
|
Weighted average number of incremental shares of Tiptree Inc. Class A common stock issuable from exchangeable interests and contingent considerations
|
45,225
|
|
—
|
|
—
|
|
|||||
|
Weighted average number of shares of Tiptree Inc. Class A common stock outstanding - diluted
|
31,766,674
|
|
33,202,681
|
|
16,771,980
|
|
|||||
|
Basic:
|
|||||||||||
|
Income (loss) from continuing operations
|
$
|
0.79
|
|
$
|
(0.26
|
)
|
$
|
(0.31
|
)
|
||
|
Income from discontinued operations
|
—
|
|
0.43
|
|
0.21
|
|
|||||
|
Net income (loss) available to Tiptree Inc. Class A common shares
|
$
|
0.79
|
|
$
|
0.17
|
|
$
|
(0.10
|
)
|
||
|
Diluted:
|
|||||||||||
|
Income (loss) from continuing operations
|
$
|
0.78
|
|
$
|
(0.26
|
)
|
$
|
(0.31
|
)
|
||
|
Income from discontinued operations
|
—
|
|
0.43
|
|
0.21
|
|
|||||
|
Net income (loss) attributable to Tiptree Inc. Class A common shares
|
$
|
0.78
|
|
$
|
0.17
|
|
$
|
(0.10
|
)
|
||
|
(1)
|
For the
year ended December 31, 2015
, the total net income (loss) attributable to non-controlling interest was
$3,023
, comprised of
$(5,321)
due to continuing operations and
$8,344
attributable to discontinued operations. For the year ended December 31, 2014, the total net income (loss) attributable to non-controlling interest was
$6,294
, comprised of
$1,939
due to continuing operations and
$4,355
attributable to discontinued operations.
|
F- 74
TIPTREE INC. AND SUBSIDIARIES
Notes to Consolidated Financial Statements
December 31, 2016
(in thousands, except share data)
(25) Summarized Quarterly Information (Unaudited)
|
2016
|
|||||||||||||||
|
First Quarter
|
Second Quarter
|
Third Quarter
|
Fourth Quarter
|
||||||||||||
|
Total revenues
|
$
|
130,738
|
|
$
|
132,161
|
|
$
|
132,160
|
|
$
|
172,095
|
|
|||
|
Total expenses
|
126,868
|
|
126,027
|
|
124,642
|
|
166,555
|
|
|||||||
|
Net income (loss) attributable to consolidated CLOs
|
1,105
|
|
4,912
|
|
4,032
|
|
10,205
|
|
|||||||
|
Income (loss) before taxes from continuing operations
|
4,975
|
|
11,046
|
|
11,550
|
|
15,745
|
|
|||||||
|
Less: provision (benefit) for income taxes
|
(2,439
|
)
|
4,025
|
|
3,712
|
|
5,680
|
|
|||||||
|
Discontinued operations, net
|
—
|
|
—
|
|
—
|
|
—
|
|
|||||||
|
Net income (loss) before non-controlling interests
|
7,414
|
|
7,021
|
|
7,838
|
|
10,065
|
|
|||||||
|
Less: net income (loss) attributable to non-controlling interests
|
1,859
|
|
888
|
|
1,933
|
|
2,338
|
|
|||||||
|
Net income (loss) attributable to Tiptree Inc. Class A common stockholders
|
$
|
5,555
|
|
$
|
6,133
|
|
$
|
5,905
|
|
$
|
7,727
|
|
|||
|
Net (loss) income per Class A common share:
|
|||||||||||||||
|
Basic, continuing operations, net
|
$
|
0.16
|
|
$
|
0.18
|
|
$
|
0.20
|
|
$
|
0.27
|
|
|||
|
Basic, discontinued operations, net
|
—
|
|
—
|
|
—
|
|
—
|
|
|||||||
|
Basic earnings per share
|
$
|
0.16
|
|
$
|
0.18
|
|
$
|
0.20
|
|
$
|
0.27
|
|
|||
|
Diluted, continuing operations, net
|
$
|
0.16
|
|
$
|
0.17
|
|
$
|
0.19
|
|
$
|
0.25
|
|
|||
|
Diluted, discontinued operations, net
|
—
|
|
—
|
|
—
|
|
—
|
|
|||||||
|
Diluted earnings per share
|
$
|
0.16
|
|
$
|
0.17
|
|
$
|
0.19
|
|
$
|
0.25
|
|
|||
|
Weighted average number of Class A common shares:
|
|||||||||||||||
|
Basic
|
34,976,485
|
|
34,456,096
|
|
29,143,470
|
|
28,374,850
|
|
|||||||
|
Diluted
|
35,084,505
|
|
34,528,977
|
|
37,230,650
|
|
36,630,783
|
|
|||||||
F- 75
TIPTREE INC. AND SUBSIDIARIES
Notes to Consolidated Financial Statements
December 31, 2016
(in thousands, except share data)
|
2015
|
|||||||||||||||
|
First Quarter
|
Second Quarter
|
Third Quarter
|
Fourth Quarter
|
||||||||||||
|
Total revenues
|
$
|
89,063
|
|
$
|
100,873
|
|
$
|
120,377
|
|
$
|
128,146
|
|
|||
|
Total expenses
|
94,612
|
|
102,520
|
|
120,734
|
|
126,143
|
|
|||||||
|
Net income (loss) attributable to consolidated CLOs
|
(311
|
)
|
67
|
|
(3,202
|
)
|
(3,443
|
)
|
|||||||
|
Income (loss) before taxes from continuing operations
|
(5,860
|
)
|
(1,580
|
)
|
(3,559
|
)
|
(1,440
|
)
|
|||||||
|
Less: provision (benefit) for income taxes
|
(1,496
|
)
|
(371
|
)
|
2,829
|
|
415
|
|
|||||||
|
Discontinued operations, net
|
2,345
|
|
21,003
|
|
—
|
|
(730
|
)
|
|||||||
|
Net income (loss) before non-controlling interests
|
(2,019
|
)
|
19,794
|
|
(6,388
|
)
|
(2,585
|
)
|
|||||||
|
Less: net income (loss) attributable to non-controlling interests
|
(1,040
|
)
|
4,832
|
|
(1,835
|
)
|
1,066
|
|
|||||||
|
Net income (loss) attributable to Tiptree Inc. Class A common stockholders
|
$
|
(979
|
)
|
$
|
14,962
|
|
$
|
(4,553
|
)
|
$
|
(3,651
|
)
|
|||
|
Net (loss) income per Class A common share:
|
|||||||||||||||
|
Basic, continuing operations, net
|
$
|
(0.08
|
)
|
$
|
(0.03
|
)
|
$
|
(0.13
|
)
|
$
|
(0.01
|
)
|
|||
|
Basic, discontinued operations, net
|
0.05
|
|
0.50
|
|
—
|
|
(0.10
|
)
|
|||||||
|
Basic earnings per share
|
$
|
(0.03
|
)
|
$
|
0.47
|
|
$
|
(0.13
|
)
|
$
|
(0.11
|
)
|
|||
|
Diluted, continuing operations, net
|
$
|
(0.08
|
)
|
$
|
(0.03
|
)
|
$
|
(0.13
|
)
|
$
|
(0.01
|
)
|
|||
|
Diluted, discontinued operations, net
|
0.05
|
|
0.50
|
|
—
|
|
(0.10
|
)
|
|||||||
|
Diluted earnings per share
|
$
|
(0.03
|
)
|
$
|
0.47
|
|
$
|
(0.13
|
)
|
$
|
(0.11
|
)
|
|||
|
Weighted average number of Class A common shares:
|
|||||||||||||||
|
Basic
|
32,138,455
|
|
31,881,904
|
|
33,848,463
|
|
34,970,731
|
|
|||||||
|
Diluted
|
32,138,455
|
|
31,881,904
|
|
33,848,463
|
|
34,970,731
|
|
|||||||
F- 76
TIPTREE INC. AND SUBSIDIARIES
Notes to Consolidated Financial Statements
December 31, 2016
(in thousands, except share data)
(26) Subsequent Events
On March 9, 2017, the Company’s board of directors declared a quarterly cash dividend of
$0.03
per share to Class A stockholders with a record date of March 27, 2017, and a payment date of April 3, 2017.
F- 77
Not applicable.
|
(a)
|
Evaluation of Disclosure Controls and Procedures
|
The Company’s management, with the participation of its Executive Chairman, Chief Executive Officer and Chief Financial Officer, have evaluated the effectiveness of the design and operation of the Company’s disclosure controls and procedures (as defined in Rule 13a-15(e) or 15d-15(e) of the Exchange Act) as of December 31, 2016. Based upon that evaluation, the Company’s Executive Chairman, Chief Executive Officer and Chief Financial Officer have concluded that the Company’s disclosure controls and procedures were effective as of December 31, 2016.
The Company is committed to maintaining a strong internal control environment which is accompanied by management’s ongoing focus on processes and related controls to achieve accurate and reliable financial reporting. However, all systems of internal control, no matter how well designed, have inherent limitations. Therefore, even those systems deemed to be effective can provide only reasonable assurance with respect to financial statement preparation and presentation. Projections of the effectiveness of internal control to future periods are subject to the risk that controls may become inadequate because of changes in conditions, or that the degree of compliance with the policies or procedures may deteriorate.
|
(b)
|
Management’s Report on Internal Control over Financial Reporting
|
Management is responsible for establishing and maintaining adequate internal control over financial reporting, as such term is defined in Rule 13a-15(f) of the Act. The Company conducted an evaluation of the effectiveness of its internal control over financial reporting based upon the framework established in the Internal Control - Integrated Framework (2013) issued by the Committee of Sponsoring Organizations of the Treadway Commission (“COSO”).
Our internal control over financial reporting includes policies and procedures that pertain to the maintenance of records that, in reasonable detail, accurately and fairly reflect transactions and dispositions of assets; provide reasonable assurances that transactions are recorded as necessary to permit preparation of financial statements in accordance with U.S. generally accepted accounting principles, and that receipts and expenditures are made only in accordance with the authorization of management and the Boards of Directors of the Company; and provide reasonable assurance regarding prevention or timely detection of unauthorized acquisition, use, or disposition of the Company’s assets that could have a material effect on our financial statements.
If the Company identifies any material weaknesses, the COSO Framework does not allow the Company to conclude that our internal control over financial reporting is effective. A material weakness is a deficiency, or combination of deficiencies, in internal control over financial reporting, such that there is a reasonable possibility that a material misstatement of the Company’s annual or interim consolidated financial statements will not be prevented or detected on a timely basis.
Consistent with the guidance issued by the Securities and Exchange Commission that an assessment of a recently acquired business may be omitted from management’s report on internal control over financial reporting in the year of acquisition, management excluded the two Care Managed Properties acquired during the quarter ended March 31, 2016 and the one Care Managed Property acquired during the quarter ended September 30, 2016, with total assets of $83.4 million and total revenues of $10.9 million, from its evaluation of internal controls over financial reporting for the year ended December 31, 2016.
As of December 31, 2016, the following material weaknesses in internal control over financial reporting that were reported as of December 31, 2015, have been remediated based on our assessment that the design, implementation, and testing of controls to remedy these weaknesses were operating effectively:
|
•
|
The Company did not design and operate effective process level controls to prevent or detect and correct material misstatements on a timely basis in financial statement accounts at its Care Managed Properties.
|
|
•
|
The Company did not have sufficient knowledgeable resources to operate the Company’s processes and controls at its Care Managed Properties. In addition, the Company failed to establish adequate monitoring activities over its Care Managed Properties to ascertain whether the components of internal control were properly designed and operating effectively.
|
|
•
|
The Company did not design management review controls that operated at a sufficient level of precision over the accounting for and measurement of current and deferred income taxes related to the year-end income tax provision.
|
Based upon its assessment, management concluded that the Company’s internal control over financial reporting as of December 31, 2016 was effective using the COSO Framework.
63
The effectiveness of the Company’s internal control over financial reporting as of December 31, 2016 has been audited by KPMG LLP, an independent registered public accounting firm that audited the Company’s consolidated financial statements as of and for the year ended December 31, 2016, as stated in their report, included in Item 8 of this Form 10-K, which expresses an unqualified opinion on the effectiveness of the Company’s internal control over financial reporting as of December 31, 2016.
|
(c)
|
Changes in Internal Control over Financial Reporting
|
Other than the measures taken to ensure that the design, implementation, and testing of controls over Care’s managed properties and the accounting for and measurement of current and deferred income taxes related to the year-end income tax provision to ensure these controls were operating effectively as of December 31, 2016, there were no other changes in internal control over financial reporting (as such term is defined in Rules 13a-15(f) and 15d-15(f) under the Exchange Act) during the three months ended December 31, 2016 that have materially affected, or are reasonably likely to materially affect, our internal control over financial reporting.
None.
Information concerning our executive officers is incorporated herein by reference to information included in the Proxy Statement for the Company’s 2017 Annual Meeting of Stockholders.
Information with respect to our directors and the nomination process is incorporated herein by reference to information included in the Proxy Statement for the Company’s 2017 Annual Meeting of Stockholders.
Information regarding our audit committee and our audit committee financial experts is incorporated herein by reference to information included in the Proxy Statement for the Company’s 2017 Annual Meeting of Stockholders.
Information required by Item 405 of Regulation S-K is incorporated herein by reference to information included in the Proxy Statement for the Company’s 2017 Annual Meeting of Stockholders.
Information with respect to executive compensation is incorporated herein by reference to information included in the Proxy Statement for the Company’s 2017 Annual Meeting of Stockholders.
Information with respect to security ownership of certain beneficial owners and management is incorporated herein by reference to information included in the Proxy Statement for the Company’s 2017 Annual Meeting of Stockholders.
Information with respect to such contractual relationships and independence is incorporated herein by reference to the information in the Proxy Statement for the Company’s 2017 Annual Meeting of Stockholders.
Information with respect to principal accounting fees and services and pre-approval policies are incorporated herein by reference to information included in the Proxy Statement for the Company’s 2017 Annual Meeting of Stockholders.
64
|
The following documents are filed as a part of this Form 10-K:
|
|
|
(a)(1) All Financial Statements
|
|
|
Index to Financial Statements:
|
Page
|
|
|
|
|
Exhibits:
|
|
|
The Exhibits listed in the Index of Exhibits, which appears immediately following the signature page and is incorporated herein by reference, as filed as part of this Form 10-K.
|
|
(a)(2) Financial Statement Schedules.
Schedule II—“Condensed Financial Information of Registrant”, is filed as part of this Annual Report on Form 10-K and should be read in conjunction with the financial statements and notes thereto contained in Item 8—“Financial Statements and Supplementary Data.”
All other financial statements and financial statement schedules for which provision is made in the applicable accounting regulations of the SEC are not required under the related instruction, are not material or are not applicable and, therefore, have been omitted.
(a)(3) Exhibits.
See the Exhibit Index attached hereto and incorporated by reference herein.
None.
SIGNATURES
Pursuant to the requirements of Section 13 or 15(d) of the Securities Exchange Act of 1934, Tiptree Inc. has duly caused this Report to be signed on its behalf by the undersigned, thereunto duly authorized.
|
Tiptree Inc.
|
||||
|
Date:
|
March 13, 2017
|
By:/s/ Jonathan Ilany
|
||
|
Jonathan Ilany
|
||||
|
Chief Executive Officer
|
||||
Pursuant to the requirements of the Securities Exchange Act of 1934, this Report has been signed by the following persons on behalf of the Registrant and in the capacities and on the dates indicated:
|
Signature
|
|
Title
|
|
Date
|
|
/s/ Jonathan Ilany
Jonathan Ilany
|
|
Chief Executive Officer and Director (Principal Executive Officer)
|
|
March 13, 2017
|
|
/s/ Sandra Bell
Sandra Bell
|
Chief Financial Officer (Principal Financial Officer)
|
March 13, 2017
|
||
|
/s/ Timothy Schott
Timothy Schott
|
|
Principal Accounting Officer (Principal Accounting Officer)
|
|
March 13, 2017
|
|
/s/ Michael G. Barnes
Michael G. Barnes
|
|
Executive Chairman and Director
|
|
March 13, 2017
|
|
/s/ Paul M. Friedman
Paul M. Friedman
|
|
Director
|
|
March 13, 2017
|
|
/s/ Lesley Goldwasser
Lesley Goldwasser |
|
Director
|
|
March 13, 2017
|
|
/s/ John E. Mack
John E. Mack |
|
Director
|
|
March 13, 2017
|
|
/s/ Bradley E. Smith
Bradley E. Smith
|
|
Director
|
|
March 13, 2017
|
66
EXHIBIT INDEX
Exhibit No.
Description
|
3.1
|
Fourth Articles of Amendment and Restatement of the Registrant, effective July 1, 2013 (previously filed as Exhibit 3.1 to the Registrant’s Current Report on Form 8-K (File No. 001-33549), filed on July 2, 2013 and herein incorporated by reference).
|
|
3.2
|
Fourth Amended and Restated Bylaws of the Registrant (previously filed as Exhibit 3.2 to the Registrant’s Current Report on Form 8-K (File No. 001-33549), filed on January 4, 2017 and herein incorporated by reference).
|
|
3.3
|
Articles Supplementary of the Registrant, dated December 29, 2014 (previously filed as Exhibit 3.1 to the Registrant’s Current Report on Form 8-K (File No. 001-33549), filed on December 29, 2014 and herein incorporated by reference).
|
|
3.4
|
Articles of Amendment of the Registrant, effective as of December 30, 2016 (previously filed as Exhibit 3.1 to the Registrant’s Current Report on Form 8-K (File No. 001-33549), filed on January 4, 2017 and herein incorporated by reference).
|
|
4.1
|
Form of Certificate for Class A Common Stock (previously filed as Exhibit 4.1 to the Registrant’s Current Report on Form 8-K (File No. 001-33549), filed on January 4, 2017 and herein incorporated by reference.
|
|
4.2
|
Amended and Restated Limited Liability Company Agreement of Tiptree Operating Company, LLC, dated July 1, 2013 (previously filed as Exhibit 4.2 to the Registrant’s Current Report on Form 8-K (File No. 001-33549), filed on July 2, 2013 and herein incorporated by reference).
|
|
4.3
|
First Amendment to the Amended and Restated Limited Liability Company Agreement of Tiptree Operating Company, LLC, dated January 1, 2016 (previously filed as Exhibit 10.1 to the Registrant’s Current Report on Form 8-K (File No. 001-33549), filed on January 7, 2016 and herein incorporated by reference).
|
|
4.4
|
Registration Rights Agreement, dated July 1, 2013, between the Registrant and Tiptree Financial Partners, L.P. (previously filed as Exhibit 4.1 to the Registrant’s Current Report on Form 8-K (File No. 001-33549), filed on July 2, 2013 and herein incorporated by reference).
|
|
4.5
|
Registration Rights Agreement by and between the Registrant and Tiptree Financial Partners, L.P., dated as of March 16, 2010 (previously filed as Exhibit 10.2 to the Registrant’s Current Report on Form 8-K (File No. 001-33549), filed on March 16, 2010 and herein incorporated by reference).
|
|
10.1
|
Warrant to Purchase Common Stock, dated as of September 30, 2008 (previously filed as Exhibit 10.2 to the Registrant’s Current Report on Form 8-K (File No. 001-33549), filed on October 2, 2008 and herein incorporated by reference).
|
|
10.2
|
Registrant’s 2013 Omnibus Incentive Plan (previously filed as Exhibit 10.1 to the Registrant’s Current Report on Form 8-K (File No. 001-33549), filed on November 12, 2013 and herein incorporated by reference).**
|
|
10.3
|
Form of Non-Qualified Stock Option Agreement under the Registrant’s 2013 Omnibus Incentive Plan (2015) (previously filed as Exhibit 10.18 to the Registrant’s Annual Report on Form 10-K (File No. 001-33549), filed on March 15, 2016 and herein incorporated by reference).**
|
|
10.4
|
Form of Non-Qualified Stock Option Agreement under the Registrant’s 2013 Omnibus Incentive Plan (2016) (filed herewith).**
|
|
10.5
|
Form of Restricted Stock Unit Agreement under the Registrant’s 2013 Omnibus Incentive Plan (filed herewith).**
|
|
10.6
|
Form of Indemnification Agreement (previously filed as Exhibit 10.9 to the Registrant’s Registration Statement on Form S-11, as amended (File No. 333-141634), filed on June 7, 2007 and herein incorporated by reference).
|
|
10.7
|
Transition Services Agreement, dated as of June 30, 2012, among Tiptree Asset Management Company, LLC, Tricadia Holdings, L.P. and Tiptree Operating Company, LLC (as assignee of Tiptree Financial Partners, L.P.) (previously filed as Exhibit 10.6 to the Registrant’s Quarterly Report on Form 10-Q (File No. 001-33549), filed on August 13, 2013 and herein incorporated by reference).
|
|
10.8
|
Credit Agreement, dated as of September 18, 2013, between Tiptree Operating Company, LLC and Fortress Credit Corp. as Lender, Administrative Agent, Collateral Agent and Lead Arranger (previously filed as Exhibit 10.1 to Form 8-K (File No. 001-33549), filed September 20, 2013 and herein incorporated by reference).
|
67
EXHIBIT INDEX
Exhibit No.
Description
|
10.9
|
First Amendment to Credit Agreement, dated January 26, 2015, by and among Tiptree Operating Company, LLC, Fortress Credit Corp. as Administrative Agent, Collateral Agent and Lead Arranger, and the lenders party thereto (previously filed as Exhibit 10.1 to Form 8-K (File No. 001-33549), filed January 27, 2015 and herein incorporated by reference).
|
|
10.10
|
Second Amendment to Credit Agreement, dated August 3, 2015, by and among Tiptree Operating Company, LLC, Fortress Credit Corp. as Administrative Agent, Collateral Agent and Lead Arranger, and the lenders party thereto (previously filed as Exhibit 10.1 to Form 8-K (File No. 001-33549), filed August 7, 2015 and herein incorporated by reference).
|
|
10.11
|
Third Amendment to Credit Agreement, dated January 14, 2016, by and among Tiptree Operating Company, LLC, Fortress Credit Corp. as Administrative Agent, Collateral Agent and Lead Arranger, and the lenders party thereto (previously filed as Exhibit 10.1 to Form 8-K (File No. 001-33549), filed January 14, 2016 and herein incorporated by reference).
|
|
10.12
|
Fourth Amendment to Credit Agreement, dated June 24, 2016, by and among Tiptree Operating Company, LLC, Fortress Credit Corp. as Administrative Agent, Collateral Agent and Lead Arranger, and the lenders party thereto (previously filed as Exhibit 10.1 to Form 8-K (File No. 001-33549), filed June 24, 2016 and herein incorporated by reference).
|
|
10.13
|
Stock Purchase Agreement by and among Reliance Holdings, LLC, Tiptree Operating Company, LLC, the Registrant, Reliance First Capital, LLC and each equityholder of Reliance First Capital, LLC, dated as of November 24, 2014 (previously filed as Exhibit 10.20 to the Registrant’s Annual Report on Form 10-K (File No. 001-33549), filed on March 31, 2015 and herein incorporated by reference).
|
|
10.14
|
Second Amendment to the Securities Purchase Agreement by and among Reliance Holdings, LLC, Tiptree Operating Company, LLC, the Registrant, Reliance First Capital, LLC and each equityholder of Reliance First Capital, LLC, dated as of August 4, 2015 (previously filed as Exhibit 10.2 to the Registrant’s Current Report on Form 8-K (File No. 001-33549), filed on August 7, 2015 and herein incorporated by reference).
|
|
10.15
|
Stock Purchase Agreement, dated June 23, 2016, by and among Caroline Holdings LLC, the Registrant, New York Marine and General Insurance Company, Gotham Insurance Co., South West Marine & General Insurance Co. and ProSight Specialty Insurance Group, Inc. (previously filed as Exhibit 10.1 to the Registrant’s Current Report on Form 8-K (File No. 001-33549), filed on June 23, 2016 and herein incorporated by reference).
|
|
10.16
|
Stock Purchase Agreement, dated September 14, 2016, by and among Caroline Holdings LLC, the Registrant and Nomura Securities Co., Ltd. (previously filed as Exhibit 10.1 to the Registrant’s Current Report on Form 8-K (File No. 001-33549), filed on September 14, 2016 and herein incorporated by reference).
|
|
21.1
|
Subsidiaries of the Registrant (filed herewith).
|
|
23.1
|
Consent of Independent Registered Public Accounting Firm (filed herewith).
|
|
31.1
|
Certification of Executive Chairman pursuant to Section 302 of the Sarbanes-Oxley Act of 2002 (filed herewith).
|
|
31.2
|
Certification of Chief Executive Officer pursuant to Section 302 of the Sarbanes-Oxley Act of 2002 (filed herewith).
|
|
31.3
|
Certification of Chief Financial Officer pursuant to Section 302 of the Sarbanes-Oxley Act of 2002 (filed herewith).
|
|
32.1
|
Certification of Executive Chairman pursuant to Section 906 of the Sarbanes-Oxley Act of 2002 (furnished herewith).
|
|
32.2
|
Certification of Chief Executive Officer pursuant to Section 906 of the Sarbanes-Oxley Act of 2002 (furnished herewith).
|
|
32.3
|
Certification of Chief Financial Officer pursuant to Section 906 of the Sarbanes-Oxley Act of 2002 (furnished herewith).
|
|
101.INS
|
XBRL Instance Document*
|
|
101.SCH
|
XBRL Taxonomy Extension Schema Document*
|
|
101.CAL
|
XBRL Taxonomy Extension Calculation Linkbase Document*
|
|
101.LAB
|
XBRL Taxonomy Extension Label Linkbase Document*
|
|
101.PRE
|
XBRL Taxonomy Extension Presentation Linkbase Document*
|
|
101.DEF
|
XBRL Taxonomy Extension Definition Linkbase Document*
|
68
EXHIBIT INDEX
Exhibit No.
Description
* Attached as Exhibit 101 to this Annual Report on Form 10-K are the following materials, formatted in XBRL (eXtensible Business Reporting Language): (i) the Consolidated Balance Sheets (audited) for
December 31, 2016
and
December 31, 2015
, (ii) the Consolidated Statements of Operations (audited) for the years ended December 31, 2016, 2015 and 2014, (iii) the Consolidated Statements of Comprehensive Income (audited) for the years ended December 31, 2016, 2015 and 2014, (iv) the Consolidated Statements of Changes in Stockholders’ Equity (audited) for the years ended
December 31, 2016
, 2015 and 2014, (v) the Consolidated Statements of Cash Flows (audited) for the years ended December 31, 2016, 2015 and 2014 and (vi) the Notes to the Consolidated Financial Statements (audited).
** Denotes a management contract or compensatory plan, contract or arrangement.
69
Schedule II — Condensed Financial Information of Registrant
* Eliminated in consolidation
* Eliminated in consolidation
|
TIPTREE INC.
|
|||||||||||
|
PARENT COMPANY ONLY CONDENSED STATEMENTS OF INCOME
|
|||||||||||
|
(All Amounts in Thousands)
|
Years Ended December 31,
|
||||||||||
|
2016
|
2015
|
2014
|
|||||||||
|
Revenues
|
|||||||||||
|
Interest income*
|
$
|
29
|
|
$
|
—
|
|
$
|
—
|
|
||
|
Other income
|
—
|
|
118
|
|
—
|
|
|||||
|
Total revenues
|
29
|
|
118
|
|
—
|
|
|||||
|
Expenses
|
|||||||||||
|
Other expenses
|
—
|
|
31
|
|
—
|
|
|||||
|
Total expenses
|
—
|
|
31
|
|
—
|
|
|||||
|
Equity in earnings (losses) of subsidiaries, net of tax*
|
26,176
|
|
(21,383
|
)
|
(6,572
|
)
|
|||||
|
Income (loss) before taxes from continuing operations
|
26,205
|
|
(21,296
|
)
|
(6,572
|
)
|
|||||
|
Less: provision (benefit) for income taxes
|
885
|
|
(8,528
|
)
|
2,518
|
|
|||||
|
Net income (loss) from continuing operations
|
$
|
25,320
|
|
$
|
(12,768
|
)
|
$
|
(9,090
|
)
|
||
|
Discontinued operations:
|
|||||||||||
|
Income from discontinued operations, net of tax and non-controlling interest
|
—
|
|
6,592
|
|
7,380
|
|
|||||
|
Gain on sale of discontinued operations, net of tax and non-controlling interest
|
—
|
|
11,955
|
|
—
|
|
|||||
|
Discontinued operations, net of tax and non-controlling interest
|
—
|
|
18,547
|
|
7,380
|
|
|||||
|
Net income (loss) attributable to Tiptree Inc. Class A common stockholders
|
$
|
25,320
|
|
$
|
5,779
|
|
$
|
(1,710
|
)
|
||
|
TIPTREE INC.
|
|||||||
|
PARENT COMPANY ONLY CONDENSED BALANCE SHEETS
|
|||||||
|
(All Amounts in Thousands)
|
As of December 31,
|
||||||
|
2016
|
2015
|
||||||
|
Assets
|
|||||||
|
Investment in subsidiaries *
|
$
|
286,349
|
|
$
|
300,807
|
|
|
|
Cash and cash equivalents
|
—
|
|
17
|
|
|||
|
Notes receivable*
|
5,306
|
|
—
|
|
|||
|
Other assets
|
3,015
|
|
12,016
|
|
|||
|
Total assets
|
$
|
294,670
|
|
$
|
312,840
|
|
|
|
Liabilities and Stockholders’ Equity
|
|||||||
|
Liabilities
|
|||||||
|
Other liabilities
|
$
|
1,239
|
|
$
|
—
|
|
|
|
Total liabilities
|
$
|
1,239
|
|
$
|
—
|
|
|
|
Stockholders' Equity
|
|||||||
|
Preferred stock: $0.001 par value, 100,000,000 shares authorized, none issued or outstanding
|
$
|
—
|
|
$
|
—
|
|
|
|
Common stock - Class A: $0.001 par value, 200,000,000 shares authorized, 34,983,616 and 34,899,833 shares issued and outstanding, respectively
|
35
|
|
35
|
|
|||
|
Common stock - Class B: $0.001 par value, 50,000,000 shares authorized, 8,049,029 and 8,049,029 shares issued and outstanding, respectively
|
8
|
|
8
|
|
|||
|
Additional paid-in capital
|
297,391
|
|
297,063
|
|
|||
|
Accumulated other comprehensive income (loss), net of tax
|
555
|
|
(111
|
)
|
|||
|
Retained earnings
|
37,974
|
|
15,845
|
|
|||
|
Class A common stock held by subsidiaries, 6,596,000 and 0 shares, respectively
|
(42,524
|
)
|
—
|
|
|||
|
Class B common stock held by subsidiaries, 8,049,029 and 0 shares, respectively
|
(8
|
)
|
—
|
|
|||
|
Total stockholders’ equity
|
293,431
|
|
312,840
|
|
|||
|
Total liabilities and stockholders' equity
|
$
|
294,670
|
|
$
|
312,840
|
|
|
70
|
TIPTREE INC.
|
|||||||||||
|
|
|||||||||||
|
(All Amounts in Thousands)
|
Years Ended December 31,
|
||||||||||
|
2016
|
2015
|
2014
|
|||||||||
|
Operating Activities:
|
|||||||||||
|
Net income (loss) attributable to Tiptree Inc. Class A common stockholders
|
$
|
25,320
|
|
$
|
5,779
|
|
$
|
(1,710
|
)
|
||
|
Adjustments to reconcile net income to net cash provided by operating activities
|
|||||||||||
|
Equity in earnings of subsidiaries*
|
(26,176
|
)
|
21,383
|
|
6,572
|
|
|||||
|
Changes in operating assets and liabilities
|
|||||||||||
|
Changes in other operating assets and liabilities
|
4,030
|
|
(24,113
|
)
|
(5,196
|
)
|
|||||
|
Net cash provided by (used in) operating activities
|
3,174
|
|
3,049
|
|
(334
|
)
|
|||||
|
Financing Activities:
|
|||||||||||
|
Dividends paid
|
(3,191
|
)
|
(3,313
|
)
|
—
|
|
|||||
|
Net cash provided by (used in) financing activities
|
(3,191
|
)
|
(3,313
|
)
|
—
|
|
|||||
|
Net increase (decrease) in cash and cash equivalents
|
(17
|
)
|
(264
|
)
|
(334
|
)
|
|||||
|
Cash and cash equivalents at beginning of period
|
17
|
|
281
|
|
615
|
|
|||||
|
Cash and cash equivalents at end of period
|
$
|
—
|
|
$
|
17
|
|
$
|
281
|
|
||
|
Cash paid for income taxes
|
$
|
14
|
|
$
|
20,510
|
|
$
|
581
|
|
||
Tiptree Inc. (formally known as Tiptree Financial Inc., Tiptree or the Company) is a Maryland Corporation that was incorporated on March 19, 2007. Tiptree is a diversified holding company with four reporting segments: specialty insurance, asset management, senior living, and specialty finance. Tiptree’s Class A common stock is traded on the NASDAQ Capital Market under the symbol “TIPT”. Tiptree’s primary asset is its ownership of Tiptree Financial Partners, L.P. (TFP) an intermediate holding company through which Tiptree operates its businesses.
Pursuant to the terms discussed in Note—
(13) Debt, net
in the notes to Consolidated Financial Statements, a secured corporate credit agreement of a subsidiary of TFP restricts the ability to pay or make any dividend or distribution to Tiptree Inc. In addition, certain other subsidiaries activity are regulated, or subject to specific restriction on transfers as a result of financing arrangements. As a result of these restrictions, these Condensed Financial Statements of the Registrant have been prepared in accordance with Rule 12-04 of Regulation S-X, as restricted net assets of the Company's subsidiaries (as defined in Rule 4-08(e)(3) of Regulation S-X) exceed 25% of the Company's consolidated net assets as of December 31, 2016.
The Company is a holding company without any operations of its own. These condensed financial statements have been prepared on a "parent-only" basis. Under a parent-only presentation, the Parent Company's investments in subsidiaries are presented under the equity method of accounting. Certain information and footnote disclosures normally included in financial statements prepared in accordance with U.S. GAAP have been condensed or omitted. Stock-based compensation expense associated with equity incentive awards issued by the Parent Company and the related tax effects are recorded at the subsidiary level where the employees provide the services. The accompanying condensed financial information should be read in conjunction with the Tiptree, Inc. Consolidated Financial Statements and related Notes thereto.
The Company received dividends of
$3,191
,
$23,559
, and
$250
for the years ended
December 31, 2016
,
2015
and 2014, respectively.
71
TABLE OF CONTENTS
Part IItem 1. BusinessItem 1A. Risk FactorsItem 1B. Unresolved Staff CommentsItem 2. PropertiesItem 3. Legal ProceedingsItem 4. Mine Safety DisclosuresPart IIItem 5. Market For Registrant S Common Equity, Related Stockholder Matters and Issuer Purchases Of Equity SecuritiesItem 6. Selected Financial DataItem 7. Management S Discussion and Analysis Of Financial Condition and Results Of OperationsItem 8. Financial Statements and Supplementary DataItem 7A. Quantitative and Qualitative Disclosures About Market RiskItem 9. Changes in and Disagreements with Accountants on Accounting and Financial DisclosureItem 9A. Controls and ProceduresItem 9B. Other InformationPart IIIItem 10. Directors, Executive Officers and Corporate GovernanceItem 11. Executive CompensationItem 12. Security Ownership Of Certain Beneficial Owners and Management and Related Stockholder MattersItem 13. Certain Relationships and Related Transactions, and Director IndependenceItem 14. Principal Accountant Fees and ServicesPart IVItem 15. Exhibits, Financial Statement SchedulesItem 16. Form 10-k SummaryNote 1. Basis Of PresentationNote 2. Dividends Received