TITAN MACHINERY INC.
10-Ks and 10-Qs
|
|
|
|
|
|
|
|
|
|
|
|
|
|
|
|
|
|
|
|
|
|
|
|
|
|
|
|
|
|
|
|
|
|
|
|
|
|
|
|
|
|
|
|
|
|
|
|
|
|
|
|
|
|
|
|
SECURITIES AND EXCHANGE COMMISSION
Washington, DC 20549
___________________________________________
FORM 10-K
ANNUAL REPORT PURSUANT TO SECTION 13 OR 15(d) OF THE
SECURITIES EXCHANGE ACT OF 1934
FOR THE FISCAL YEAR ENDED
JANUARY 31, 2015
Commission File No. 001-33866
___________________________________________
TITAN MACHINERY INC.
(Exact name of registrant as specified in its charter)
|
Delaware
(State or Other Jurisdiction of
Incorporation or Organization)
|
No. 45-0357838
(IRS Employer
Identification No.)
|
644 East Beaton Drive
West Fargo, ND 58078-2648
(Address of Principal Executive Offices)
(701) 356-0130
(Registrant's telephone number, including area code)
Securities registered pursuant to Section 12(b) of the Act:
Title of each class:
Common Stock, $0.00001 Par Value
Name of each exchange on which registered:
The NASDAQ Stock Market LLC
Securities registered pursuant to Section 12(g) of the Act:
None
___________________________________________
Indicate by check mark if the registrant is a well-known seasoned issuer, as defined in Rule 405 of the Securities Act. Yes
o
No
x
Indicate by check mark if the registrant is not required to file reports pursuant to Section 13 or Section 15(d) of the Act. Yes
o
No
x
Indicate by check mark whether the registrant (1) has filed all reports required to be filed by Section 13 or 15(d) of the Securities Exchange Act of 1934 during the preceding 12 months (or for such shorter period that the registrant was required to file such reports), and (2) has been subject to such filing requirements for the past 90 days. Yes
x
No
o
Indicate by check mark whether the registrant has submitted electronically and posted on its corporate Website, if any, every Interactive Data File required to be submitted and posted pursuant to Rule 405 of Regulation S-T (§232.405 of this chapter) during the preceding 12 months (or for such shorter period that the registrant was required to submit and post such files). Yes
x
No
o
Indicate by check mark if disclosure of delinquent filers pursuant to Item 405 of Regulation S-K is not contained herein, and will not be contained, to the best of registrant's knowledge, in definitive proxy or information statements incorporated by reference in Part III of this Form 10-K or any amendment to this Form 10-K.
x
Indicate by check mark whether the registrant is a large accelerated filer, an accelerated filer, a non-accelerated filer, or a smaller reporting company. See definitions of "large accelerated filer," "accelerated filer," and "smaller reporting company" in Rule 12b-2 of the Exchange Act. (Check one):
|
Large accelerated filer
o
|
Accelerated filer
x
|
Non-accelerated filer
o
(Do not check if a
smaller reporting company)
|
Smaller reporting company
o
|
|||
Indicate by check mark whether the registrant is a shell company (as defined in Rule 12b-2 of the Act). Yes
o
No
x
The aggregate market value of our common stock held by non-affiliates as of
July 31, 2014
was approximately
$255.6 million
(based on the last sale price of
$14.66
per share on such date as reported on the NASDAQ Global Select Market).
The number of shares outstanding of the registrant's common stock as of
April 1, 2015
was
21,397,231
shares.
DOCUMENTS INCORPORATED BY REFERENCE
Portions of the proxy statement for the registrant's
2015
Annual Meeting of Stockholders are incorporated by reference into Items 10, 11, 12, 13 and 14 of Part III of this report.
Table of Contents
|
Page No.
|
||
We make available, free of charge, copies of our annual report on Form 10-K, quarterly reports on Form 10-Q, current reports on Form 8-K and amendments to those reports filed or furnished pursuant to Section 13(a) or 15(d) of the Securities Exchange Act on our web site,
http://www.titanmachinery.com
, as soon as reasonably practicable after filing such material electronically or otherwise furnishing it to the SEC. We are not including the information on our web site as a part of, or incorporating it by reference into, our Form 10-K.
i
Our Company
Overview
We own and operate a network of full service agricultural and construction equipment stores in the United States ("U.S.") and Europe. Based upon information provided to us by CNH Industrial N.V. or its U.S. subsidiary CNH Industrial America, LLC, collectively referred to in this Form 10-K as CNH Industrial, we are the largest retail dealer of Case IH Agriculture equipment in the world, the largest retail dealer of Case Construction equipment in North America and a major retail dealer of New Holland Agriculture and New Holland Construction equipment in the U.S. We have three primary business segments, Agriculture, Construction and International, within which we sell and rent new and used equipment, sell parts, and service equipment.
The agricultural equipment we sell and service includes machinery and attachments for uses ranging from large-scale farming to home and garden purposes. The construction equipment we sell and service includes heavy construction and light industrial machinery for commercial and residential construction, road and highway construction, and mining operations. Within our operating segments, we engage in four principal business activities:
|
•
|
new and used equipment sales;
|
|
•
|
parts sales;
|
|
•
|
repair and maintenance services; and
|
|
•
|
equipment rental and other activities.
|
The new equipment and parts we sell are supplied primarily by CNH Industrial. CNH Industrial is a leading manufacturer and supplier of agricultural and construction equipment, primarily through the Case IH Agriculture, New Holland Agriculture, Case Construction and New Holland Construction brands. The used equipment for resale is acquired through trade-ins from our customers and selective purchases. We sell parts and provide in-store and on-site repair and maintenance services. We also rent equipment and provide ancillary services such as equipment transportation, Global Positioning System ("GPS") signal subscriptions, and finance and insurance products.
We offer our customers a one-stop solution by providing equipment and parts sales, repair and maintenance services, and rental functions in each store. Our full service approach provides us with multiple points of customer contact and substantial cross-selling opportunities. We believe our mix of equipment and recurring parts and service sales enables us to operate effectively throughout economic cycles. We also believe our significant scale, superior customer service, diverse and stable customer base, management reporting system and experienced management team provide us with a competitive advantage in many of our local markets.
Throughout our 35-year operating history we have built an extensive, geographically contiguous network of
92
stores in the U.S., including
two
outlet stores, and
16
stores in Europe. Our Agriculture stores in the U.S. are located in Iowa, Minnesota, Nebraska, North Dakota and South Dakota and include several highly productive farming regions, such as the Red River Valley in eastern North Dakota and northwestern Minnesota, certain portions of the corn belt in Iowa, eastern South Dakota and southern Minnesota, and along the Interstate-80 corridor in Nebraska, which sits on top of the Ogallala Aquifer. Our Construction stores are located in Arizona, Colorado, Iowa, Minnesota, Montana, Nebraska, New Mexico, North Dakota, South Dakota, Wisconsin and Wyoming. Our International stores are located in the European countries of Bulgaria, Romania, Serbia and Ukraine.
Our executives have extensive industry experience. David Meyer, our Board Chair and Chief Executive Officer, founded our company in 1980. In 2002, we acquired two stores owned by C.I. Farm Power, Inc., a business owned by our President and Director, Peter Christianson, which he co-founded in 1988. Based on our collective industry experience, we developed the Titan Operating Model, which combines management accountability and decision-making at the store level with centralized, back-office support and expertise. Our executives work closely with our store managers to develop the managers' industry knowledge and ensure these managers achieve operational excellence consistent with our management philosophy.
We have a history of growth through acquisitions. Since January 1, 2003, we have completed
52
acquisitions consisting of
110
stores operating in
11
states and
three
European countries, including
37
acquisitions consisting of
79
stores completed since our initial public offering on December 11, 2007. We have a well-established track record of integrating acquired stores through the Titan Operating Model, retaining acquired-store employees and maintaining acquired-store
1
customer relationships. We expect that acquisitions will continue to be an important component of our consolidated and segment growth.
Industry Overview
We believe Caterpillar, Inc., Deere & Company ("Deere"), CNH Industrial, Komatsu Ltd., Agco Corporation ("AGCO"), the Volvo Group, Terex Corporation and Ingersoll-Rand Co. Ltd. are the largest global manufacturers of agricultural and construction equipment. These companies generated revenue from their equipment operations of
$52.1 billion
for Caterpillar Inc.,
$33.0 billion
for Deere,
$18.5 billion
for CNH Industrial,
$18.9 billion
for Komatsu Ltd.,
9.7 billion
for AGCO,
$6.8 billion
for Volvo Group and
$7.3 billion
for Terex Corporation, for the most recent fiscal year-ends for which information is currently available.
Agricultural Equipment Industry
Agricultural equipment is purchased primarily for the production of food, fiber, feed grain and feedstock for renewable energy. Certain equipment is also purchased for home and garden applications, and maintenance of commercial, residential and government properties. Deere, CNH Industrial and AGCO are the largest global manufacturers of agricultural equipment and supply a full line of equipment and parts that address the primary machinery requirements of farmers. In addition to the major manufacturers, several short-line manufacturers produce specialized equipment that addresses regional and niche requirements of farmers. Agricultural equipment manufacturers typically grant dealers in the U.S. authorized store locations, not exclusive territories, to distribute their products.
We believe there are many factors that influence demand for agricultural equipment, parts and repair and maintenance services, including commodity markets, interest rates, government policies, tax policies, weather and general economic conditions. Any of these conditions can change materially in a short time period, creating volatility in demand for our products and services at any point in time. Federal legislation, such as the recently enacted Farm Bill, attempts to stabilize the agriculture industry through various policies including (i) commodity programs consisting of direct, counter-cyclical and price support payments to farmers; (ii) conservation programs; (iii) crop insurance programs; and (iv) disaster relief programs. We believe that these various federal policies reduce financial volatility and help ensure that farmers operate their farms and equipment during economic down cycles, thus stabilizing demand for equipment, replacement parts, and repair and maintenance services.
Construction Equipment Industry
Construction equipment is purchased primarily for commercial, residential and infrastructure construction, as well as for demolition, maintenance, mining, energy production and forestry operations. The market for construction equipment is segmented across multiple categories including earth moving, lifting, light industrial, asphalt and paving, and concrete and aggregate equipment. As in the agricultural equipment market, distribution of construction equipment in the U.S. is executed primarily by manufacturer authorized dealers; however, manufacturers' dealership agreements in the construction industry typically assign exclusive distribution territories.
Construction machinery is generally divided into "heavy" and "light" subgroups. Heavy machinery includes large wheel loaders, large tracked excavators, cranes, crawler dozers, motor graders and articulated haul trucks. Light machinery includes backhoe landscape tractors, forklifts, compact excavators and skid steers. Heavy machinery is generally purchased by construction companies, municipalities, local governments, rental fleet owners, quarrying and mining companies, waste management companies and forestry-related organizations. Typically, light machinery is purchased by contractors, rental fleet owners, landscapers, logistics companies, farmers and recreational users. Although demand for construction equipment is affected by weather and seasonal factors, it is usually less susceptible to seasonal changes than the agricultural equipment industry.
CNH Industrial and industry reports show that demand for construction equipment in our markets is driven by several factors, including (i) public spending on roads, highways, sewer and water projects, and other public works projects; (ii) public and private expenditures for the energy and mining industries, which are driven in part by demand for fossil fuels, metals and other commodities; and (iii) general economic and market conditions of the construction sector for residential and commercial buildings.
Titan Operating Model
We believe the Titan Operating Model is a key element to our continued success. Through the Titan Operating Model, we empower leadership and share best practices at the store level while realizing efficiencies and utilizing certain controls at the corporate level. We believe exceptional customer service is most effectively attained through accountable store employees who are supported by centralized administrative, finance and marketing functions. By managing our business as a network of independent stores supported by a centralized, shared resources group, we ensure coordination of the entire enterprise while
2
promoting the development of local business and customer relationships at the store level. We have implemented the Titan Operating Model in our North American stores within our Agriculture and Construction reporting segments.
Strong Store Model
Each of our stores is run by a store manager who is reviewed and compensated based on the store's achievement of revenue, profitability, market share and balance sheet objectives. Also, each store is typically staffed by a parts manager, a service manager and field marketers, and certain of our Construction stores are staffed with rental account managers, all of whom report directly to the store manager. Under our operating model, decision-making for customer-related issues is decentralized, with each store manager responsible for matters such as the type of equipment to stock, equipment pricing, staffing levels and customer satisfaction. This operating model enables each store manager to concentrate on customers' equipment, parts, service and rental needs, while our shared resources group manages the administrative functions of the store. We believe customers in our industry view store managers and sales and service personnel as important partners in operating their businesses. Therefore, we believe developing and supporting strong store managers enables us to grow same-store sales through fostering new customer relationships and further developing existing customer relationships.
Shared Resources
Our shared resources group provides a range of services to support our stores, including service administration, information technology support, administration, marketing campaigns, human resources management, finance and insurance, central purchasing, accounting, legal, data administration and cash management. We believe these functions can be run more efficiently when combined and can provide more sophisticated tools to our store managers than an independent dealership could support alone. We maintain accountability through our management reporting systems, which provide data on certain key operational and financial metrics on a daily basis, as well as a comprehensive review of financial performance on a monthly basis. We believe the services provided by our shared resources group enables our stores to achieve a higher level of customer service by freeing them from certain general and administrative functions and enables a more competitive market presence at a lower cost than if our stores operated independently. Furthermore, as we acquire new stores, we believe the shared services required to support these stores will grow at a lower rate than our overall growth in store count.
Management Development and Succession Planning
Our executives work closely with our regional and store managers and mid-level corporate managers to ensure the managers benefit from our executives' industry knowledge and execute operational excellence in line with our management philosophy. We also conduct formal meetings on a monthly basis with our store managers and regional managers to assess operational and financial objectives, develop near-term strategies and share best practices across the organization. We believe the relationships among our executives, segment managers, regional managers, store managers and mid-level corporate managers will sustain our financial success through continued implementation of our effective operating model, as well as provide a strong pool of capable successors to our current team of executives, regional managers and store managers. Further, we seek to staff our stores with entrepreneurial individuals trained, including through our programs, and motivated to progress to higher level management positions.
Business Strengths
In addition to the Titan Operating Model, we believe the following attributes of our business model and market position are important factors in our ability to compete effectively and achieve our long-term financial objectives:
Leading North American Equipment Provider with Significant Scale
According to CNH Industrial, we are the largest retail dealer of Case IH Agriculture equipment in the world, the largest retail dealer of Case Construction equipment in North America and a major retail dealer of New Holland Agriculture and New Holland Construction equipment in the U.S. We believe our size and large, contiguous geographic market provide us with several competitive advantages including:
|
•
|
our ability to manage inventory through our centralized inventory management system, thus allowing inventory exchanges among the stores, which permits us to maintain only the inventory deemed needed by each store while providing significant breadth of parts and equipment to our customers;
|
|
•
|
our ability to use expanded sales channels, including used equipment listings hosted on our website, which enables us to offer our customers alternative purchasing options; and
|
|
•
|
our ability to sell inventory to customers in a large geographic area covering Arizona, Colorado, Iowa, Minnesota, Montana, Nebraska, New Mexico, North Dakota, South Dakota, Wisconsin and Wyoming, which enables us to
|
3
capitalize on crop diversification and disparate weather throughout this area, as well as local trends in residential, infrastructure and commercial construction.
Customer Focus at the Local Level
As part of the Titan Operating Model, we centralize general and administrative functions and finance resources. This strategy enables our store employees to focus exclusively on customers and eliminates redundant operating expenses. We also centralize our marketing resources to offer our stores and field marketers professional marketing support that includes targeted direct mailings, advertising with targeted local media outlets, participation in and sponsorship of trade shows and industry events, our Titan Trader monthly magazine, and our hosting of open houses, service clinics, equipment demonstrations, product showcases and customer appreciation outings. We believe this operating structure, which focuses on serving our customers on a local level, will allow us to increase market share.
Superior Customer Service to Attract and Retain Customers
We believe our ability to respond quickly to our customers' demands is key to profitable growth. Our executives are committed to maintaining a customer-focused culture. We spend significant time and resources training our employees to effectively service our customers in each of our local markets, which we believe will increase our revenue. Our training program involves active participation in all manufacturer-sponsored training programs and the use of industry experts as consultants for customized training programs and a training team to assist in the integration of newly-acquired operations. We also partner with several technical colleges to sponsor students who we plan to eventually employ. In particular, the following capabilities enable us to better service our customers:
|
•
|
our ability to staff a large number of highly-trained service technicians across our network of stores, which makes it possible to schedule repair services on short notice without affecting our technician utilization rates;
|
|
•
|
our ability to staff and leverage product and application specialists across our network of stores, which makes it possible to offer valuable pre-sale and aftermarket services, including equipment training, best practices education and precision farming technology support; and
|
|
•
|
our ability to innovate and lead our industry through initiatives such as GPS guidance systems to support precision farming in our geographic markets, which provide our customers with the latest advances in technology and operating practices.
|
Unique Entrepreneurial Culture to Attract and Retain Superior Employees
We strive to maintain an entrepreneurial culture that empowers our employees to make decisions and act within the parameters of a proven operating process and system. We believe this culture and our size gives us a competitive advantage in attracting and retaining the best employees in our industry. We developed an operating system and process that provides our employees with defined objectives and frequent feedback of results within an entrepreneurial environment that allows them to work independently yet consistently throughout our company. Through this operating system and process we have established defined financial metrics on a balanced scorecard, which is used monthly with each store manager to assess performance. Each store manager is empowered to operate the individual store as appropriate within the guidelines set by the operating system and process. This balanced management philosophy enables our employees to understand clearly how they succeed in our organization and how to interact with customers who expect a level of autonomy from our employees. Our compensation system focuses on rewarding our employees for high performance, thus enabling us to retain most of those employees who perform at or above expectations. This system also enables us to attract talented individuals outside of our industry and train them to perform at a high level within a relatively short period of time.
Diverse and Stable Customer Base to Avoid Market Volatility
We believe our large and diverse customer base limits our exposure to risks associated with customer concentration and fluctuations in local market conditions. We have long and stable relationships with many of our customers. During fiscal
2015
, none of our customers accounted for more than
1.0%
of our total revenue. Revenue from external customers located outside of the United States is primarily included in our International segment, which totaled approximately
8.8%
,
6.6%
and
3.3%
of total revenue during fiscal
2015
,
2014
and
2013
respectively.
Information Technology Systems
Our management reporting systems provide the data and reports that facilitate our ability to make informed financial and inventory level decisions. We use these systems to actively manage our business and enable each store to access the available inventory of our other stores before ordering additional parts or equipment from our suppliers. As a result, we manage our investment in inventory while promptly satisfying our customers' parts and equipment needs. Our customer relationship
4
management system provides sales, available wholegoods, and customer information and other organizational tools to our field marketers, store managers and regional managers. In addition, utilizing the information provided by the systems assists in the training and development of management personnel.
Experienced Management Team
Our executive team is led by David Meyer, our Board Chair and Chief Executive Officer, and Peter Christianson, our President and Director, who have approximately
40
and
36
years, respectively, of industry experience. Our segment managers, regional managers, store managers and field marketers also have extensive knowledge and experience in our industry. In addition, we compensate, develop and review our regional managers and store managers based on an approach that aligns their incentives with the goals and objectives of our company, including achievement of revenue, profitability, market share and balance sheet objectives. We believe the strength of our management team will help our success in the marketplace.
Growth Strategy
We pursue the following growth strategies:
Increase Market Share and Same-Store Sales
We focus on increasing our share of the equipment sold in our markets because our market share impacts current period revenue and compounds our revenue over the life of the equipment sold through recurring parts and service business. We seek to generate same-store growth and increase market share through:
|
•
|
employing significant marketing and advertising programs, including targeted direct mailings, advertising with targeted local media outlets, participation in and sponsorship of trade shows and industry events, our Titan Trader monthly magazine, and by hosting open houses, service clinics, equipment demonstrations, product showcases and customer appreciation outings;
|
|
•
|
supporting and providing customers with training for evolving technologies, such as precision farming, that are difficult for single-store operators to support;
|
|
•
|
maintaining state-of-the-art service facilities, mobile service trucks and trained service technicians to maximize our customers' equipment uptime through preventative maintenance programs and seasonal 24/7 service support; and
|
|
•
|
utilizing our inventory system to maximize parts and equipment availability for our customers.
|
Pursue Strategic Acquisitions
The agricultural and construction equipment industries are fragmented and consist of many relatively small, independent businesses servicing discrete local markets. We believe a favorable climate for dealership consolidation exists due to several factors, including the competitiveness of our industry, growing dealer capitalization requirements and the lack of succession alternatives for current owners. We intend to continue to evaluate and pursue acquisitions with the objectives of entering new markets, consolidating distribution within our established network and strengthening our competitive position.
We have a track record of completing and integrating acquisitions and have used acquisitions to enter new markets. We look to add stores through acquisitions that offer attractive growth opportunities, high demand for the equipment we sell and services we offer, management strength, and contiguity with our existing geography.
We believe that we are effectively able to identify attractive acquisition candidates due to our leadership position in the industry, our track record of completing and integrating acquisitions, and our contacts in and knowledge of our industry and geographic region. We regularly assess the acquisition landscape, evaluating potential acquisition candidates in terms of their availability and desirability to our long-term growth strategy. In addition, we believe acquisition economics in our industry have been and will continue to be conducive to executing our long-term growth strategy. Typically, we acquire only the working capital and fixed assets we believe are necessary to run an efficient store and assume only the liabilities related to financing the inventory and working capital acquired, although we sometimes acquire all the equity of a company. We, therefore, typically calculate our net purchase price of an acquisition as the value paid for the assets acquired, including intangible assets, less the amount of any liabilities assumed. Upon completion of an acquisition we generally refinance the equipment inventory acquired through our existing floorplan payable financing options.
The consent of CNH Industrial is required to acquire any CNH Industrial dealership. The consent of the group of banks led by Wells Fargo Bank, National Association (collectively referred to as "Wells Fargo") is required for the acquisition of dealerships meeting certain thresholds or other criteria defined in our Senior Secured Credit Facility, as amended and restated (the "Credit Agreement").
5
We have completed the acquisition of
52
dealers, totaling
110
stores, since January 1, 2003. Of these acquisitions,
35
dealers consisting of
60
stores are included in the Agriculture segment,
13
dealers consisting of
40
stores are included in the Construction segment, and
3
dealers consisting of
10
stores are included in the International segment. See Item 2 for more information about our current store locations.
Integrate New Dealers into the Titan Operating Model
Upon consummation of each North American acquisition, we integrate acquired stores into our operations by implementing the Titan Operating Model to enhance each acquired store's performance within its target market. We generally complete integration of a store within 18 months, although it may take longer for acquired stores to fully realize the benefits of the Titan Operating Model. We believe the Titan Operating Model provides us with multiple points of customer contact, creates cross-selling opportunities, fosters strong customer relationships and supports a culture of individual accountability that increases our revenue and provides a strong platform for future growth.
Suppliers
CNH Industrial—Case IH Agriculture, Case Construction, New Holland Agriculture and New Holland Construction
We have a longstanding relationship with CNH Industrial and, according to CNH Industrial, we are the largest retail dealer of Case IH Agriculture equipment in the world, the largest retail dealer of Case Construction equipment in North America, and a major retail dealer of New Holland Agriculture and New Holland Construction equipment in the U.S. Thus, our relationship with CNH Industrial is more than a typical supply relationship; it is strategic for both our company and CNH Industrial. In that regard, it is in our mutual interests to maintain the longstanding strong relationship we share.
We have been an authorized dealer of Case agricultural equipment since our inception in 1980. We added the other CNH Industrial brands as Case grew, acquired other brands and merged with New Holland in 1999. In fiscal
2015
, CNH Industrial supplied approximately
74%
of the new equipment sold in our Agriculture segment,
65%
of the new equipment sold in our Construction segment, and
74%
of the new equipment sold in our International segment.
CNH Industrial is a global leader in the agricultural and construction equipment industries based on the number of units sold. In
2014
, CNH Industrial generated
$18.5 billion
in revenue from their equipment operations. In addition, CNH Industrial provides financing and insurance products and services to its end-user customers and authorized dealers through its CNH Industrial Capital America, LLC ("CNH Industrial Capital") business unit. CNH Industrial is a publicly-traded company.
CNH Industrial is the world's second largest manufacturer of agricultural equipment. CNH Industrial owns and operates the Case IH Agriculture and New Holland Agriculture brands. Case IH Agriculture, recognized by the red color of its equipment, possesses over 170 years of farm equipment heritage. New Holland Agriculture, recognized by the blue color of its tractors and the yellow color of its harvesting and hay equipment, has over 110 years of farm equipment industry experience. CNH Industrial's agricultural equipment dealers are assigned authorized store locations but do not have exclusive territories.
CNH Industrial is one of the world's largest manufacturers of construction equipment in terms of market share, owning and operating the Case Construction and New Holland Construction brands. CNH Industrial's construction equipment dealers are assigned a specific geographic area of responsibility within which the dealers have the right to sell new Case Construction and New Holland Construction equipment.
Dealership Agreements
We have entered into separate dealership agreements with certain CNH Industrial entities to sell the Case IH Agriculture, New Holland Agriculture, Case Construction and New Holland Construction brands (collectively the “CNH Industrial Dealer Agreements”), as required to serve as a distributor for such entities.
The CNH Industrial Dealer Agreements assign to us a geographically defined area of principal responsibility, providing us with distribution and product support rights within the identified territory for specific equipment products of the manufacturer. Although the dealer appointment is non-exclusive, in each territory there is typically only one dealership responsible for retail sales to end-users, as well as after-sales product support of the equipment. If we sell certain Case construction equipment outside of our designated sales and service areas and do not perform the warranty work on such equipment, CNH Industrial has the right to require that we pay sales and service fees for purposes of compensating the dealer assigned to such territory. We are authorized to display and use CNH Industrial trademarks and trade names at our stores, with certain restrictions.
Under our CNH Industrial Dealer Agreements, we have both the right and obligation to sell the manufacturer’s equipment and related parts and products and provide customers with services. The CNH Industrial Dealer Agreements impose various requirements on us regarding the location and appearance of facilities, satisfactory levels of new equipment and parts
6
inventories, the training of personnel, adequate business enterprise and information technology system, adequate working capital, minimum fixed charge coverage ratio, maximum adjusted debt to tangible net worth ratio, development of annual sales and marketing goals, and furnishing of monthly and annual financial information. We must obtain the approval or consent of CNH Industrial in the event of proposed fundamental changes to our ownership, governance or business structure (defined as "change in control" events) including among other things (i) a merger, consolidation or reorganization; (ii) a sale of all or substantially all of our assets; (iii) any transaction or series of transactions resulting in a person or affiliated group acquiring 20% or more of the combined voting power of our securities; (v) a substantial disposition of common shares by certain named executives; (vii) certain significant changes in the composition of the Board of Directors; (vi) replacement of certain named executive officers; and (vii) engaging in material business activities outside of the equipment sales and service industry. The CNH Industrial Dealer Agreements do not establish mandatory minimum or maximum retail pricing for our equipment sales or service/parts.
The CNH Industrial Dealer Agreements do not have a fixed term and remain in effect until either party exercises its termination rights under the agreement. The CNH Industrial entities have the right to terminate their dealer agreements with us immediately in certain circumstances, including in the event of our insolvency, bankruptcy or our material breach of provisions of the agreement, if a direct competitor of CNH Industrial (or an affiliated group of such competitor) acquires 20% or more of the combined voting power of our securities, the failure to secure the consent of CNH Industrial for change in control events, and in some cases, for any reason following 90 days written notice. In the event of termination of any of the CNH Industrial Dealer Agreements, CNH Industrial is obligated to repurchase the inventory of the CNH Industrial brand applicable to the agreement being terminated. The CNH Industrial Dealer Agreements generally do not include specific non-compete provisions that apply during or after the term of such agreements, although our form agreement with Case Construction does include limitations on our ability to sell competing products during the term of such agreement.
The dealership agreements and industry practices generally provide that payment on equipment and parts purchased from CNH Industrial entities is due within 30 days and is typically subject to floorplan payable financing. With respect to sales of equipment, payments from customers, which are typically financed by a third party, are due upon sale. Payments from customers for parts and services are due within 30 days. CNH Industrial makes available to us any floorplans, parts return programs, sales or incentive programs or similar plans or programs it offers to other dealers, and provides us with promotional items and marketing materials.
Other Suppliers
In addition to products supplied by CNH Industrial, we sell a variety of new equipment, parts and attachments supplied by other manufacturers. These products tend to address specialized niche markets and to complement the CNH Industrial products we sell by filling gaps in the CNH Industrial line of products. We believe our offering of products for specialized niche markets supports our goal of being a one-stop solution for equipment needs at each of our stores. Approximately
28%
of our total new equipment sales in fiscal
2015
resulted from sales of products manufactured by companies other than CNH Industrial, with our single largest manufacturer other than CNH Industrial representing approximately
3%
of our total new equipment sales. The terms of our arrangements with these other suppliers vary, but most of the dealership agreements contain termination provisions allowing the supplier to terminate the agreement after a specified notice period, which is typically 30 days. Payment and financing practices with these other suppliers are similar to those practices described above with respect to CNH Industrial entities.
Operating Segments, Products and Services
We operate our business in three reportable segments, Agriculture, Construction and International. Within each of our segments, we have four principal sources of revenue: new and used equipment sales, parts sales, repair and maintenance service, and equipment rental and other business activities. See Note 21 to our consolidated financial statements included elsewhere in this annual report for additional information regarding our segments.
Equipment Sales
We sell new agricultural and construction equipment manufactured under the CNH Industrial family of brands as well as equipment from a variety of other manufacturers. The used equipment we sell is primarily from inventory acquired through trade-ins from our customers and selective purchases. The agricultural equipment we sell and service includes application equipment and sprayers, combines and attachments, hay and forage equipment, planting and seeding equipment, precision farming technology, tillage equipment, and tractors. The construction equipment we sell and service includes articulated trucks, compact track loaders, compaction equipment, cranes, crawler dozers, excavators, forklifts, loader/backhoes, loader/tool carriers, motor graders, skid steer loaders, telehandlers and wheel loaders. We sell new and used equipment through our in-house retail sales force, which is organized by geography and operating segment. We also sell used equipment through our
two
outlet stores, which specialize in the sale of aged used equipment. We believe this organizational structure improves the
7
effectiveness of our sales force, better serves our customers and helps us negotiate advantageous trade-in purchase terms. Equipment sales generate cross-selling opportunities for us by populating our markets with equipment we repair and maintain and for which we sell parts. Equipment revenue represented
73.6%
,
77.4%
and
80.3%
of total revenue for the years ended
January 31, 2015
,
2014
and
2013
, respectively.
Parts Sales
We sell a broad range of maintenance and replacement parts on equipment that we sell, as well as other types of equipment. We maintain an extensive in-house parts inventory to provide timely parts and repair and maintenance support to our customers. We generally are able to acquire out-of-stock parts directly from manufacturers within two business days. Our parts sales provide us with a relatively stable revenue stream that is less sensitive to economic cycles than our equipment sales. Parts revenue represented
14.2%
,
12.4%
and
11.0%
of total revenue for the years ended
January 31, 2015
,
2014
and
2013
, respectively.
Repair and Maintenance Services
We provide repair and maintenance services, including warranty repairs, for our customers' equipment. Each of our stores includes service bays staffed by trained service technicians. Our technicians are also available to make off-site repairs at the customers' locations. In addition, we provide proactive and comprehensive customer service by maintaining service histories for each piece of equipment owned by our customers, maintaining 24/7 service hours in times of peak service usage, providing on-site repair services, scheduling off-season maintenance activities with customers, notifying customers of periodic service requirements and providing training programs to customers to educate them as to standard maintenance requirements. At the time equipment is purchased, we also offer customers the option of purchasing extended warranty protection provided by our suppliers. Our after-market services have historically provided us with a high-margin, relatively stable source of revenue through changing economic cycles. Service revenue represented
7.8%
,
6.7%
,
5.8%
of total revenue for the years ended
January 31, 2015
,
2014
and
2013
, respectively.
Equipment Rental and Other Business Activities
We rent equipment to our customers, primarily in the Construction segment, on a short-term basis for periods ranging from a few days to a few months. We actively manage the size, quality, age and composition of our rental fleet and use our information technology systems to closely monitor and analyze customer demand and rate trends. We maintain the quality of our fleet through our on-site parts and services support and dispose of rental equipment through our retail sales force. Our rental activities create cross-selling opportunities for us in equipment sales. In addition, we provide ancillary equipment support activities such as equipment transportation, GPS signal subscriptions in connection with precision farming and reselling CNH Industrial Capital finance and insurance products. Rental and other revenue represented
4.4%
,
3.5%
and
2.9%
of total revenue for the years ended
January 31, 2015
,
2014
and
2013
, respectively.
Geographic Information
Revenue generated from external customers located in the U.S. totaled approximately
$1.7 billion
,
$2.1 billion
and
$2.1 billion
for the years ended
January 31, 2015
,
2014
and
2013
, respectively. Revenue generated from external customers located outside of the United States is primarily included in our International segment, which totaled approximately
$166.4 million
,
$145.9 million
and
$72.5 million
for the years ended
January 31, 2015
,
2014
and
2013
, respectively. As of
January 31, 2015
,
2014
and
2013
,
$209.4 million
and
$258.6 million
and
$235.5 million
of our long-lived assets were held in the U.S. As of
January 31, 2015
,
2014
and
2013
,
$6.1 million
and
$7.3 million
and
$5.4 million
of our long-lived assets were held in our European subsidiaries, respectively.
Customers
Our Agriculture customers vary from small, single machine owners to large farming operations, primarily in the states of Iowa, Minnesota, Nebraska, North Dakota and South Dakota. In fiscal
2015
, no single customer accounted for more than
1.0%
of our Agriculture revenue.
Our Construction customers include a wide range of construction contractors, public utilities, mining and energy companies, municipalities and maintenance contractors, primarily in the states of Arizona, Colorado, Iowa, Minnesota, Montana, Nebraska, New Mexico, North Dakota, South Dakota, Wisconsin and Wyoming. They vary from small, single machine owners to large firms. In fiscal
2015
, no single customer accounted for more than
1.0%
of our Construction revenue.
Our International customers vary from small, single machine owners to large farming operations, primarily in the European countries of Bulgaria, Romania, Serbia and Ukraine. In fiscal
2015
, there was no single customer for which the loss of such customer would have a significant impact on our International revenue.
8
Our stores enable us to closely service local and regional customers. We believe the Titan Operating Model enables us to satisfy customer requirements and increase revenue through cross-selling opportunities presented by the various products and services that we offer. A significant portion of our U.S. customers finance their equipment purchases through CNH Industrial Capital.
Floorplan Payable Financing
We attempt to maintain at each store, or have readily available at other stores in our network, sufficient inventory to satisfy customer needs. Inventory levels fluctuate throughout the year and tend to increase before the primary sales seasons for agricultural equipment. The cost of financing our inventory is an important factor affecting our financial results.
CNH Industrial Capital
CNH Industrial Capital offers floorplan payable financing to CNH Industrial dealers to finance the purchase of inventory from CNH Industrial and for used equipment inventory purchased on trade-ins from our customers. CNH Industrial Capital provides this financing in part to enable dealers to carry representative inventories of equipment and encourage the purchase of goods by dealers in advance of seasonal retail demand. CNH Industrial Capital charges variable market rates of interest based on the prime rate on balances outstanding after any interest-free periods and receives a security interest in inventory and other assets. The interest-free periods, which CNH Industrial offers periodically in the form of additional incentives or special offers, typically average four months for new and used agriculture equipment and new construction equipment. CNH Industrial Capital also provides financing for used equipment accepted in trade, repossessed equipment and approved equipment from other suppliers, and receives a security interest in such equipment. As of
January 31, 2015
, we had a
$450.0 million
floorplan payable credit facility with CNH Industrial Capital.
Other Financing Sources for Equipment
As of January 31, 2015, we had a Credit Agreement with Wells Fargo, which includes a
$350.0 million
wholesale floorplan payable line of credit, a
$225.0 million
credit facility with Agricredit Acceptance LLC ("Agricredit"), and the U.S. dollar equivalent of
$133.0 million
in credit facilities related to its foreign subsidiaries to finance equipment inventory purchases. The Wells Fargo and Agricredit credit facilities were amended effective April 2015, which reduced the available borrowings to
$275.0 million
and
$200.0 million
, respectively.
In addition, financing also may be available through floorplan payable financing programs offered by other manufacturers and other suppliers from which we purchase equipment inventory, which may be financed by such suppliers themselves or through third party lenders.
Sales and Marketing
As part of the Titan Operating Model, we have centralized sales support and marketing management. All of our stores benefit from our centralized media buys, strategic planning, sales support and training. At the same time, however, we provide our store managers and their sales teams with flexibility to localize sales and marketing.
We currently market our products and services through:
|
•
|
our employee field marketers, who operate out of our network of local stores and call on customers in the markets surrounding each store;
|
|
•
|
parts managers and service managers, who provide our customers with comprehensive after-market support;
|
|
•
|
local and national advertising efforts, including broadcast, cable, print and web-based media; and
|
|
•
|
our remarketing division, which trades and sells used equipment through our outlet store and website.
|
Field Marketers
Our field marketers perform a variety of functions, such as servicing customers at our stores, calling on existing customers and soliciting new business at farming, construction and industrial sites. These field marketers target customers in specific areas, and we develop customized marketing programs for our sales force by analyzing each customer group for profitability, buying behavior and product selection. All members of our sales force are encouraged to participate in internal and external manufacturer-sponsored training sessions to develop product and application knowledge, sales techniques and financial acumen. Our sales force is supported by our corporate marketing department.
9
Parts Managers and Service Managers
Our parts managers and service managers are involved in our uptime service efforts, taking advantage of our seasonal marketing campaigns in parts and service sales. As a group, they have won multiple awards from our suppliers for their efforts benefiting both our customers and our key strategic partners.
Print, Broadcast and Web-Based Advertising Campaigns
Each year we initiate several targeted direct mail, print and broadcast advertising and marketing campaigns. CNH Industrial and other suppliers periodically provide us with advertising funds, which we primarily use to promote new equipment, parts and financing programs. We will continue to explore and launch additional sales channels as appropriate, including, for example, new internet-based efforts.
Remarketing Division
Our remarketing division capitalizes on sales opportunities for aged used equipment transferred out of our retail stores. We have
two
outlet stores that sell used equipment. In addition, we are actively engaged in marketing equipment through our website.
Competition
The agricultural and construction equipment sales and distribution industries are highly competitive and fragmented, with large numbers of companies operating on a regional or local scale. Our competitors range from multi-location, regional operators to single-location, local dealers and include dealers and distributors of competing equipment brands, including Deere, Caterpillar and the AGCO brands, as well as other dealers and distributors of the CNH Industrial family of brands. Competition among equipment dealers, whether they offer agricultural or construction products or both, is primarily based on the price, value, reputation, quality and design of the products offered by the dealer, the customer service and repair and maintenance service provided by the dealer, the availability of equipment and parts, and the accessibility of stores. While we believe we compete favorably on each of the identified competitive factors, our sales and margins may be impacted depending on (i) the extent of aggressive pricing competition through manufacturer discount programs or other competitive pricing tactics, (ii) our ability to obtain higher service gross margins based on our service quality and reputation and (iii) our ability to attract new and maintain existing customers based on the availability and quality of the products we offer and our local relationships and reputation.
The number of agricultural and construction equipment dealers operating on a regional scale is limited and we are one of the principal regional-scale agricultural and construction equipment dealers in the U.S. The primary regional-scale equipment dealers with whom we compete in the U.S. include RDO Equipment Co., Butler Machinery, Ziegler Inc. and Brandt Holdings Co. RDO Equipment Co. is a Deere and Vermeer agricultural and construction equipment dealer with more than
70
dealerships in
nine
states, including North Dakota, South Dakota, Minnesota, Arizona and Montana. Butler Machinery is a Caterpillar construction and AGCO agriculture equipment dealer with
18
locations in North Dakota, South Dakota and Nebraska. Ziegler Inc. is a Caterpillar construction and AGCO agriculture equipment dealer with
26
locations in
four
states, including Minnesota, Iowa and Wisconsin. Brandt Holdings owns Deere, Vermeer and Bobcat construction and agricultural equipment dealers with
25
locations in
eight
states including Iowa, Minnesota, Nebraska, North Dakota, and South Dakota.
Information Technology Systems
Our enterprise resource planning ("ERP") system enables us to closely monitor our performance and actively manage our business on a consolidated and segment basis and includes features that were enhanced to support the Titan Operating Model, including detailed store-based financial reporting, inventory management and customer relationship management.
Through our ERP system we maintain a complete database of parts and equipment inventory and a centralized inventory control system for each segment. Our ERP system enables each store to access the available inventory of our other stores before ordering additional parts or equipment from our suppliers. We are also able to monitor inventory levels and mix at each store and make adjustments in accordance with our operating plan. Finally, our ERP system is externally connected to CNH Industrial, enabling us to locate CNH Industrial equipment and parts from various CNH Industrial depots.
Our customer relationship management ("CRM") system provides sales and customer information and other organizational tools to assist our sales force. We maintain an extensive customer database that allows us to monitor the status and maintenance history of our customers' equipment and enables us to more effectively provide parts and services to meet their needs. We also use our CRM system and customer database to monitor sales information and customer demand.
The data we store in our ERP and CRM systems is backed-up on a daily basis and stored at an off-site location. Thus, if these systems were to become inoperable, we would be able to continue operations through an off-site data center. Further,
10
we own the software and hardware necessary to operate the ERP system and have employees trained to manage and maintain the software without reliance on external support.
Corporate Information
We were incorporated as a North Dakota corporation in 1980 and reincorporated in Delaware in December 2007 prior to our initial public offering. Our executive offices are located at 644 East Beaton Drive, West Fargo, ND 58078-2648. Our telephone number is (701) 356-0130. We maintain a web site at
www.titanmachinery.com
. All of our SEC filings are available on the Investor Relations page of our web site, or at www.sec.gov.
Intellectual Property
We have registered trademarks for certain names and designs used in our business and have trademark applications pending for certain others. We generally operate each of our stores under the Titan Machinery name. Case IH, Case and New Holland are registered trademarks of CNH Industrial, which we use in connection with advertisements and sales as authorized under our dealership agreements. We license trademarks and trade names of new equipment from other suppliers of equipment to us.
Product Warranties
Product warranties for new equipment and parts are provided by our suppliers. The term and scope of these warranties vary greatly by supplier and by product. At the time equipment is purchased, we also offer customers the option of purchasing extended warranty protection provided by our suppliers. Suppliers pay us for repairs we perform to equipment under warranty. We generally sell used equipment "as is" and without manufacturer's warranty, although manufacturers sometimes provide limited warranties if the supplier's original warranty is transferable and has not expired. We also offer extended warranty programs, through various third party warranty providers, on certain used equipment.
Seasonality & Weather
The agricultural and construction equipment businesses are highly seasonal, which causes our quarterly results and our available cash flow to fluctuate during the year. Our customers generally purchase and rent equipment in preparation for, or in conjunction with, their busy seasons, which for farmers are the spring planting and fall harvesting seasons, and for Construction customers is dependent on weather seasons in their respective regions, which is typically the second and third quarters of our fiscal year for much of our Construction footprint. Our parts and service revenues are typically highest during our customers' busy seasons as well, due to the increased use of their equipment during this time, which generates the need for more parts and service work. However, weather conditions impact the timing of our customers' busy times, which may cause our quarterly financial results to differ between fiscal years. In addition, the fourth quarter typically is a significant period for equipment sales in the U.S. because of our customers’ year-end tax planning considerations, the timing of dealer incentives and the increase in availability of funds from completed harvests and construction projects.
Seasonal weather trends, particularly severe wet or dry conditions, can have a significant impact on regional agricultural and construction market performance by affecting crop production and the ability to undertake construction projects. Weather conditions that adversely affect the agricultural or construction markets would have a negative effect on the demand for our products and services.
In addition, numerous external factors such as credit markets, commodity prices, and other circumstances may disrupt normal purchasing practices and buyer sentiment, further contributing to the seasonal fluctuations.
Employees
As of
April 1, 2015
, we employed
2,541
full-time and
241
part-time employees. Our employees are not covered by a collective bargaining agreement. We believe our relations with our employees are good.
Governmental Regulation
We are subject to numerous federal, state, and local rules and regulations, including regulations promulgated by the Environmental Protection Agency and similar state agencies, with respect to storing, shipping, disposing, discharging and manufacturing hazardous materials and hazardous and non-hazardous waste. These activities are associated with the repair and maintenance of equipment at our stores. Currently, none of our stores or operations exceeds small quantity generation status. Compliance with these rules and regulations has not had any material effect on our operations, nor do we expect it to in the future. Further, we have not made, and do not anticipate making, any material capital expenditures related to compliance with environmental regulations. However, there can be no assurance that these expectations are accurate, particularly if regulations
11
change, unforeseen incidents occur or unknown past contamination or non-compliance is discovered, among other similar events.
We are substantially dependent upon CNH Industrial for the supply of our equipment and parts inventory.
The majority of our business involves the distribution and after-market parts and servicing of equipment manufactured by CNH Industrial. In fiscal
2015
, CNH Industrial supplied approximately
74%
of the new equipment sold in our Agriculture segment,
65%
of the new equipment sold in our Construction segment, and
74%
of the new equipment sold in our International segment, and supplied a significant portion of our parts inventory. Our financial performance and future success is highly dependent on the overall reputation and success of CNH Industrial in the agricultural and construction equipment manufacturing industries, including its ability to maintain its competitive position in product innovation, product quality, and product pricing. In the event that CNH Industrial decided to sell, or reduce its commitment to, its equipment manufacturing segments or if CNH Industrial would change its distribution system to our detriment, this would have a material adverse effect on our financial condition and results of operations.
Our ability to successfully compete in our markets is dependent on CNH Industrial providing financing programs for us and our customers, product promotions, and marketing support.
CNH Industrial provides to us the following programs:
|
•
|
Floorplan payable financing for the purchase of a substantial portion of our equipment inventory.
|
|
•
|
A significant percentage of the financing used by our customers to purchase CNH equipment from us.
|
|
•
|
Incentive programs and discount programs from time to time that enable us to price our products more competitively.
|
|
•
|
Promotional and marketing activities on national, regional and local levels.
|
Our financial performance will depend on CNH Industrial’s continued commitment to these programs which enable us to effectively compete in the market.
CNH Industrial may change or terminate our dealer agreements.
We have entered into dealer agreements with CNH Industrial under which we sell CNH Industrial’s branded agricultural and construction equipment, along with after-market parts and repair services. Subject to applicable state statutes that may govern the dealer-manufacturer legal relationship, CNH Industrial may terminate our dealer agreements immediately in certain circumstances and, in some cases, for any reason 90 days following written notice. If CNH Industrial were to terminate all or any of its dealer agreements with us, our business would be severely harmed.
Furthermore, CNH Industrial may unilaterally change the terms of its agreements with us to, among other things, change our sales and service areas, the product offerings, and pricing or delivery terms. Moreover, CNH Industrial may limit or decrease the availability of financing, warranty reimbursements, discounts and rebates, or other marketing incentives. If CNH Industrial were to change the terms of our dealer agreements or its operating practices in a manner that adversely affects us, our business would be harmed.
Our dealer agreements with CNH Industrial impose obligations and restrictions on us.
Under our dealer agreements with CNH Industrial, we are obligated to actively promote the sale of CNH Industrial equipment within our designated geographic areas of responsibility, fulfill the warranty obligations of CNH Industrial, maintain adequate facilities and workforce to service the needs of our customers, maintain sufficient parts inventory to service the needs of our customers, maintain inventory in proportion to the sales potential in each sales and service geographic area of responsibility, maintain adequate working capital, and maintain stores only in authorized locations.
Consent of CNH Industrial is required for fundamental changes in our ownership, governance or business structure, including the acquisition by another party of 20% or more of our outstanding stock.
This requirement may have the effect of discouraging a sale or other change in control of the company, including transactions that our stockholders might deem to be in their best interests.
The acquisition of additional CNH Industrial geographic areas of responsibility and store locations in our Agriculture, Construction and International segments requires the consent of CNH Industrial under our dealer agreements. We can give no assurance that CNH Industrial will consent to any of the acquisitions of dealerships that we may desire to make in the future.
12
Our agricultural equipment sales are affected by numerous market factors outside of our control.
Cyclicality is a common feature in farmers’ capital expenditures. Increased capital investments typically occur during boom cycles spurred by high farm profits and increased farm wealth driven by increased farmland values. Farmers’ capital expenditures are also affected by borrowing costs, with expenditures accelerated by low interest rates.
Net farm income is subject to numerous external factors such as commodity prices, input costs, production yields, animal diseases and crop pests, federal crop insurance and subsidy programs, and limits on agricultural exports/imports. Net farm income also impacts farmland values, which causes overall farm wealth to increase or decrease, impacting farmers’ sentiment to make investments in equipment. The nature of the agricultural equipment industry is such that a downturn in demand can occur suddenly, resulting in declining revenues, reduced profit margins, excess equipment inventories, and increased interest expenses. These downturns may be prolonged and during these periods our revenues and profitability could be harmed.
Our construction equipment sales are affected by numerous market factors outside of our control.
Our construction equipment customers primarily operate in the mining, natural resource development, construction, transportation, manufacturing, industrial processing and utilities industries, which industries generally are capital intensive and cyclical in nature. Many of our construction equipment customers are directly and indirectly affected by fluctuations in commodity prices in the agriculture, forestry, metals and minerals, petroleum and natural gas industries. The recent significant drop in the price of oil, as well as the price declines of other natural resource commodities, may cause reduced activity in these sectors, which will result in decreased demand for our products and services by our customers operating in these industries.
Furthermore, customer demand for our products and services may be affected by economic conditions at both a global and a local level. Economic conditions that negatively affect the construction industry, such as the tightening of credit standards which affect the ability of consumers to obtain financing, could reduce our customers' demand for our construction equipment. The construction industry in certain of our geographical areas has experienced a prolonged economic down cycle as a result of certain local and general economic drivers, which negatively impacts sales of construction equipment in those markets. Reduced demand for our construction equipment could negatively affect our financial performance and cash flow.
Our customers’ ability to obtain affordable financing is an important factor in their purchasing decisions, and directly affects our business.
The ability to finance affordable purchases is an important part of a customer's decision to purchase agricultural or construction equipment. Tight credit markets, a low level of liquidity in many financial markets, and extreme volatility in fixed income, credit, currency and equity markets have the potential to adversely affect available credit for our customers. As net farm income has decreased in recent years, the borrowing capacity of our farmer customers may have also decreased. Moreover, in a tighter credit environment, agricultural lenders may discourage their farmer customers from making non-essential capital expenditures.
Interest rate increases may make equipment purchases less affordable for customers and, as a result, our revenue and profitability may decrease as we manage excess inventory and reduce prices for equipment. Conversely, any decrease in interest rates may positively affect a customer's decision to purchase agricultural or construction equipment. We are unable to anticipate the timing and impact of interest rate adjustments.
Changes in tax incentives may reduce demand for agricultural and construction equipment and cause our revenue to decline.
Our customers in the agriculture and construction segments have benefited in recent years from Internal Revenue Code Section 168(k) accelerated depreciation, known as “bonus depreciation”, and enhanced Internal Revenue Code Section 179 expensing rules. Absent new federal legislation, these tax incentives are eliminated for calendar year 2015. Our customers may reduce their purchases from us as a result of these tax law changes.
Adverse changes in governmental policies may reduce demand for agricultural and construction equipment and cause our revenue to decline.
Changes in governmental agricultural policy could adversely affect sales of agricultural equipment. Government programs and subsidies that reduce economic volatility and enhance farm income positively influence farmers' demand for agricultural equipment. Future farm bills and U.S. Department of Agriculture ("USDA") budgets may reduce the benefit of these programs. To the extent that future funding or farm programs available to individual farmers are reduced, these changes could reduce demand for agricultural equipment and we could experience a decline in revenue. Changes in government spending on infrastructure projects could adversely affect the demand for construction equipment and we could experience a decline in revenue.
13
Our sales and profit margins may also be negatively affected by the final Tier 4B clean diesel emissions standards, which are now in effect. Tier 4 refers to a generation of federal air emissions standards established by the U.S. Environmental Protection Agency (“EPA”) that apply to new diesel engines used in off-road equipment. To satisfy these standards, manufacturers must introduce new cleaner diesel engines which will increase the manufacturing costs of the equipment. To the extent that our suppliers pass on these additional costs to its dealers, as expected, we will pay more for our equipment inventory. We may not be able to pass on these price increases to our customers and maintain our desired margins.
Our financial performance is affected by general industry-wide supply levels of inventory, over which we have no control.
Over-production by one or more manufacturers, or a sudden reduction in demand, can dramatically disrupt the market and cause downward pressure on our equipment profit margins. Short-term lease programs in the agriculture industry and rental companies in the construction industry have expanded significantly in North America in recent years. When this equipment comes off lease or rental fleet is sold, there may be a significant increase in the availability of late-model used equipment, which can worsen the over-supply condition and put added pressure on our equipment sales and margins, and have an adverse effect on residual values for our rental equipment and used equipment.
Conversely, in times of heightened global demand for equipment, which is often driven by external economic and market factors, equipment suppliers may experience difficulty providing all dealerships a reliable supply of new equipment. If our primary supplier, CNH Industrial, cannot supply us with the necessary inventory in response to such demand, then our market share and financial results will suffer.
Our financial performance is dependent on our ability to effectively manage new and used equipment and parts inventories.
Our agricultural and construction equipment dealership network requires substantial inventories of equipment and parts to be maintained at each store to facilitate sales to customers on a timely basis. Our equipment inventory has traditionally represented 50% or more of our total assets. We need to maintain a proper balance of new and used equipment to assure satisfactory inventory turnover and to minimize floorplan financing costs.
Our purchases of new equipment and parts are based in large part on projected demand. Our equipment orders from CNH Industrial typically must be slotted months in advance of actual delivery. If actual sales are materially less than our forecasts, we would experience an over-supply of new equipment inventory. An over-supply of new equipment inventory will generally cause downward pressure on our product sale prices and margins, decrease our inventory turns, and increase our floorplan financing expenses.
Our used equipment is generally acquired as “trade-ins” from customers in connection with equipment sales. In accordance with generally accepted accounting principles, each item of our used equipment inventory is valued at the lower of cost or market. In a down market, our used equipment may not have the value that we attributed to it at the time of the trade and periodic adjustments to those values would be required in accordance with the lower of cost or market accounting principles. The amount of these write-downs of inventory would be included in our cost of goods sold, and reduce our operating income. There can be no assurances that our estimates of market value for our used equipment will prove to be accurate, given the potential for sudden change in market conditions and other factors beyond our control. Further, pricing for and sales of used equipment can be significantly affected by the limited market for certain equipment.
Our international operations expose us to additional risks.
We are currently operating dealership locations in Bulgaria, Romania, Serbia and Ukraine, and also engage in export business to other countries. In fiscal 2015, total International segment revenues were approximately
8.8%
of our consolidated total revenue. As of January 31, 2015, total International segment assets were approximately
11.5%
of our consolidated total assets.
Our operations in international markets subject us to risks related to the differing legal, political, social and regulatory environments and economic conditions present in the countries in which we operate. Risks inherent in our international operations include:
|
•
|
difficulties in implementing our business model in foreign markets;
|
|
•
|
costs and diversion of domestic management attention related to oversight of international operations;
|
|
•
|
unexpected adverse changes in export duties, quotas and tariffs and difficulties in obtaining import licenses;
|
|
•
|
unexpected adverse changes in foreign laws or regulatory requirements;
|
|
•
|
compliance with a variety of tax regulations, foreign laws and regulations which may be burdensome;
|
14
|
•
|
compliance with the Foreign Corrupt Practices Act and other U.S. laws that apply to the international operations of U.S. companies which may be difficult and costly to implement and monitor and which, if violated, may result in substantial financial and reputation harm;
|
|
•
|
fluctuations in foreign currency exchange rates to which we are exposed may adversely affect the results of our operations, the value of our foreign assets and liabilities and our cash flows;
|
|
•
|
political or economic changes or instability.
|
These factors, in addition to others that we have not anticipated, may negatively impact our financial condition and results of operations.
The current political and economic instability in Ukraine could create short-term and long-term disruption in our Ukrainian operations. The current instability is causing liquidity problems for certain of our customers which may result in credit losses on our outstanding receivable balances or cause our customers to delay or reduce their purchases of our products and services. Such reduced purchasing by our customers is causing our inventory levels to be higher than expected, contributing to increased carrying costs and reducing our return on assets. In addition, the current instability may affect our ability to secure new, or to continue existing, working capital loans at desired levels or cause such indebtedness to become more expensive. A reduction in borrowing capacity, absent associated reductions in inventory, could require us to make additional capital contributions to our Ukraine operations. Continued political and economic instability could also cause the Ukrainian government to impose additional currency exchange controls or to otherwise restrict our ability to recover and repatriate our investment in our Ukrainian subsidiary. The stabilization of Ukraine’s economy and political structure will depend in large part on the assistance of the international community, which assistance cannot be assured. Absent this stabilization, our ability to profitably transact business in Ukraine could be adversely affected. Our operations in Ukraine are subject to the risks of further devaluation of the local currency, increased interest rates, and increased inflation.
Floorplan financing for our equipment inventory may not be available on favorable terms, which would adversely affect our growth and results of operations.
We generally purchase our equipment with the assistance of floorplan payable financing programs through CNH Industrial Capital and other credit facilities. In the event that our available financing sources are insufficient to satisfy our future requirements, we would be required to obtain financing from other sources. We may not be able to obtain this additional or alternative financing on commercially reasonable terms or at all. To the extent that this financing cannot be obtained or obtained on commercially reasonable terms or at all, our growth and results of operations would be adversely affected.
Our level of indebtedness could limit our financial and operational flexibility.
As of January 31, 2015, our indebtedness included floorplan payable financing, long-term debt, and senior convertible notes. In addition, we have obligations under our long-term real estate lease agreements for our store locations and corporate headquarters.
Our level of indebtedness could have important consequences. For example, it could:
|
•
|
increase our vulnerability to general adverse economic and industry conditions;
|
|
•
|
limit our flexibility in planning for, or reacting to, changes in our business and the industry in which we operate; and
|
|
•
|
limit our ability to obtain additional financing for working capital, capital expenditures, acquisitions or general corporate purposes.
|
We expect to use cash flow from operations and borrowings under our credit facilities to fund our operations, debt service and capital expenditures. However, our ability to make these payments depends on our future performance, which will be affected by financial, business, economic and other factors, many of which we cannot control.
The credit agreements governing our indebtedness restrict our ability to engage in certain corporate and financial transactions, and require us to satisfy financial covenants.
The credit agreements governing our indebtedness contain certain covenants that, among other things, restrict our ability to:
|
•
|
incur more debt;
|
|
•
|
make investments;
|
|
•
|
create liens;
|
15
|
•
|
merge or consolidate;
|
|
•
|
transfer and sell assets;
|
|
•
|
pay dividends;
|
|
•
|
repurchase shares of stock.
|
Under our credit facilities, we are required to satisfy certain financial covenants on an ongoing basis, measured at the end of each fiscal quarter. The primary financial covenants which we are subject to include: a maximum net leverage ratio, minimum fixed charge coverage ratio, and minimum consolidated income before income taxes. Our ability to borrow under the credit agreements depends upon compliance with the financial covenants.
Consent of our lenders is required for fundamental changes in our ownership, governance or business structure, including the acquisition by another party of 20% or more of our outstanding stock (under the CNH Industrial Capital credit facility) and 35% or more of our outstanding stock (under the Wells Fargo Credit Agreement).
This requirement may have the effect of discouraging a sale or other change in control of the company, including transactions that our stockholders might deem to be in their best interests.
Our failure to satisfy any covenant, absent a waiver or amendment, would cause us to be in default under our credit facilities and would enable our lenders to accelerate payment of the outstanding indebtedness. Moreover, an event of default accompanied by a demand for accelerated payment under any of our credit facilities would also constitute a default under our Senior Convertible Notes. Each of our indebtedness agreements include cross-default provisions which state that certain types of defaults under any other indebtedness agreement will also constitute a default under that credit agreement. If an event of default occurred, and the lender demanded accelerated payment, we may not be able to satisfy such a pay-off request, whether through internal funds or a new financing.
Our variable rate indebtedness exposes us to interest rate risk.
A substantial portion of our borrowings, including the credit facilities with CNH Industrial Capital, Wells Fargo and Agricredit, are at variable rates of interest and expose us to interest rate risk. As such, our results of operations are sensitive to movements in interest rates. There are many economic factors outside our control that have in the past and may, in the future, impact rates of interest including publicly announced indices that underlie the interest obligations related to a certain portion of our debt. Factors that impact interest rates include governmental monetary policies, inflation, recession, changes in unemployment, the money supply, international disorder and instability in domestic and foreign financial markets. Such increases in interest rates could have a material adverse effect on our financial conditions and results of operations.
The agricultural and construction equipment industries are highly seasonal, which can cause significant fluctuations in our results of operations and cash flow.
The agricultural and construction equipment businesses are highly seasonal, which causes our quarterly results to fluctuate during the year. Farmers generally purchase agricultural equipment and service work in preparation for, or in conjunction with, the spring planting and fall harvesting seasons. Construction equipment customers’ purchases of equipment and service work, as well as rental of equipment, are also seasonal in our stores located in colder climates where construction work slows significantly in the winter months. In addition, the fourth quarter typically is a significant period for equipment sales in the U.S. because of our customers’ year-end tax planning considerations, the timing of dealer incentives and the increase in availability of farmers’ funds from completed harvests and construction customers' funds from completed projects. Also, numerous external factors such as credit markets, commodity prices, weather conditions, and other circumstances may disrupt normal purchasing practices and customers’ sentiment, further contributing to the seasonal fluctuations.
Weather conditions may negatively impact the agricultural and construction equipment markets and affect our financial results.
Weather conditions, particularly severe floods and droughts, can have a significant adverse effect on regional agricultural and construction markets. Accordingly, our financial condition and results of operations may be adversely affected by adverse weather conditions.
Our rental operations subject us to risks including increased maintenance costs if our rental fleet ages, increased costs of new replacement equipment we use in our fleet, and losses upon disposition of rental fleet units.
Our rental fleet margins are materially impacted by utilization of fleet assets, which is seasonal and can fluctuate materially due to weather and economic factors. If our rental equipment ages, the costs of maintaining that equipment, if not replaced within a certain period of time, will likely increase. The cost of new equipment for use in our rental fleet could also increase due to increased material costs for our suppliers or other factors beyond our control. Furthermore, changes in customer
16
demand could cause certain of our existing equipment to become obsolete and require us to purchase new equipment at increased costs.
We include in operating income the difference between the sales price and the depreciated value of an item of rental equipment sold. The value of any given piece of rental equipment could be less than its depreciated value at the time it is sold. The market value of used rental equipment depends on several factors, including:
|
•
|
market prices for like new equipment;
|
|
•
|
wear and tear on the equipment;
|
|
•
|
time of year that the equipment is sold;
|
|
•
|
the supply of used equipment on the market; and
|
|
•
|
general economic conditions.
|
Any significant decline in the selling prices for used rental equipment, or increased costs resulting from our rental operations, could have a material adverse effect on our results of operation and cash flow.
Our business is highly competitive.
The agricultural and construction equipment distribution and rental industries are highly competitive and fragmented, with large numbers of companies operating on a regional or local basis. Historically, our competitors have competed aggressively on the basis of pricing or inventory availability, resulting in decreased margins on our sales to the extent we choose to match our competitors' pricing. To the extent we choose not to match or remain within a reasonable competitive distance from our competitors' pricing, we may lose sales volume. In addition, to the extent CNH Industrial's competitors provide their dealers with more innovative or higher quality products, better customer financing, or have more effective marketing programs, our ability to compete and our results of operations could be adversely affected.
If our acquisition plans are unsuccessful, we may not achieve our planned revenue growth.
Our ability to continue to grow through the acquisition of additional CNH Industrial geographic areas of responsibility and store locations or other businesses will be dependent upon the availability of suitable acquisition candidates at acceptable costs, our ability to compete effectively for available acquisition candidates and the availability of capital to complete the acquisitions. We may not successfully identify suitable targets, or if we do, we may not be able to close the transactions, or if we close the transactions, they may not be profitable. In addition, CNH Industrial's consent is required for the acquisition of any CNH Industrial dealership, and the consent of our lenders may be required for certain acquisitions. CNH Industrial typically evaluates management, dealer concentration, and performance and capitalization of a prospective acquirer in determining whether to consent to the sale of a CNH Industrial dealership. There can be no assurance that CNH Industrial or our lenders will consent to any or all acquisitions of dealerships that we may propose.
Our acquisitions may not be successful.
There are risks associated with acquisitions of new dealerships. These risks include incurring significantly higher than anticipated capital expenditures and operating expenses; failing to assimilate the operations and personnel of the acquired dealerships; disrupting our ongoing business; dissipating our management resources; failing to maintain uniform standards, controls and policies; and impairing relationships with employees and customers as a result of changes in management. To the extent we do not successfully avoid or overcome the risks or problems related to acquisitions, our results of operations and financial condition could be adversely affected. Future acquisitions also will have a significant impact on our financial position and capital needs, and could cause substantial fluctuations in our quarterly and yearly results of operations. Acquisitions could include significant goodwill and intangible assets, which may result in future impairment charges that would reduce our stated earnings.
We are exposed to customer credit risks.
We extend credit to our customers for parts and service work in the U.S., and also for some equipment sales in our international operations. If we are unable to manage credit risk issues adequately, or if a large number of customers should have financial difficulties at the same time, our credit losses could increase above historical levels and our operating results would be adversely affected. Delinquencies and credit losses generally would be expected to increase if there was a worsening of economic conditions.
17
Our business success depends on attracting and retaining qualified personnel.
Our success depends in part on the efforts and abilities of our management team and key employees, including the managers of our stores country managers in our International operations. The failure to attract and retain members of our management team and key employees will harm us.
Our outstanding Senior Convertible Notes may cause dilution to our existing stockholders and may negatively affect our financial position and liquidity.
On April 24, 2012, we issued $150 million aggregate principal amount of 3.75% Senior Convertible Notes due May 2019 (the "Senior Convertible Notes") pursuant to an indenture between the Company and Wells Fargo Bank, National Association (the "Indenture"). The Senior Convertible Notes are convertible into common stock at the option of the holders under certain conditions. Upon conversion, we will pay cash up to the aggregate principal amount of converted notes and pay or deliver, as the case may be, cash, shares of our common stock or a combination thereof, at our election, for any conversion obligation in excess thereof. Additionally, in the event of a fundamental change, as defined in the Indenture, the holders of the Senior Convertible Notes may require us to purchase all or a portion of their notes for cash at a purchase price equal to 100% of the principal amount of notes to be purchased, plus accrued and unpaid interest.
The Indenture provides for customary events of default, including, but not limited to, cross acceleration to certain other indebtedness of us and our subsidiaries. In the case of an event of default, all outstanding Senior Convertible Notes may become due and payable immediately without further action or notice.
If we issue shares of our common stock to satisfy conversion obligations under the Senior Convertible Notes, our existing stockholders will experience dilution of their holdings of our stock. Repayment of the principal amount of the Senior Convertible Notes in cash and, if applicable, satisfaction of our conversion obligations in cash may have a significant negative effect on our available capital resources and liquidity which may require us to borrow additional amounts pursuant to terms that are not favorable to us.
In addition, even if holders do not elect to convert their Senior Convertible Notes, we could be required under applicable accounting rules to reclassify all or a portion of the outstanding principal balance of the Senior Convertible Notes as a current rather than long-term liability, which would result in a material reduction of our net working capital.
Selling and renting agricultural and construction equipment, selling parts, and providing repair services subject us to liability risks that could adversely affect our financial condition and reputation.
Products sold, rented or serviced by us may expose us to potential liabilities for personal injury or property damage claims relating to the use of such products. Our product liability insurance may not be adequate to cover product liability claims. Such insurance may not continue to be available on economically reasonable terms. An uninsured or partially insured claim for which indemnification is not provided could have a material adverse effect on our financial condition. Furthermore, if any significant claims are made against us or against CNH Industrial or any of our other suppliers, our business may be adversely affected by any resulting negative publicity.
Our internal control over financial reporting may not be effective and our independent registered public accounting firm may not be able to certify as to its effectiveness, which could have a significant and adverse effect on our business and reputation.
We are required to comply with the requirements of Section 404 of the Sarbanes-Oxley Act of 2002 and rules and regulations of the SEC thereunder. If we fail to maintain the adequacy of our internal control over financial reporting, as such standards are modified, supplemented or amended from time to time we may not be able to ensure that we can conclude on an ongoing basis that we have effective internal control over financial reporting in accordance with Section 404. We cannot be certain as to the timing of completion of our evaluation, testing and any remedial actions or their impact on our operations. If we are not able to comply with the requirements of Section 404, our independent registered public accounting firm may not be able to certify as to the effectiveness of our internal control over financial reporting, we may be unable to report our financial results accurately or in a timely manner and we may be subject to sanctions or investigation by regulatory authorities, such as the SEC. As a result, there could be a negative reaction in the financial markets due to a loss of confidence in the reliability of our financial statements.
Any disruption to or failure of our information systems may negatively affect our ability to monitor and control our operations.
Our business processes, including marketing of equipment and support services, inventory and logistics, and finance largely depend upon the integrity of our information systems. We use an integrated business system for dealers in the construction or agriculture equipment business. Any disruptions to our information systems or the failure of such systems to
18
operate as expected may adversely affect our operating results by limiting our ability to effectively monitor and control our operations.
Security breaches and other disruptions could compromise our information and expose us to liability, which would cause our business and reputation to suffer.
In the ordinary course of our business, we collect and store sensitive data, including intellectual property, our proprietary business information and that of our customers, suppliers and business partners, and personally identifiable information of our customers and employees, in our data centers and on our networks. The secure processing, maintenance and transmission of this information is critical to our operations and business strategy. Despite our security measures, our information technology and infrastructure may be vulnerable to attacks by hackers or breached due to employee error, malfeasance or other disruptions. Any such breach could compromise our networks and the information stored there could be accessed, publicly disclosed, lost or stolen. Any such access, disclosure or other loss of information could result in legal claims or proceedings, liability under laws that protect the privacy of personal information, and regulatory penalties, disrupt our operations and the services we provide to customers, and damage our reputation, and cause a loss of confidence in our products and services, which could adversely affect our business/operating margins, revenues and competitive position.
Failure to comply with applicable laws and regulations could harm our business and financial results.
Our policies and procedures are designed to comply with all applicable laws, accounting and reporting requirements, tax rules and other regulations and requirements, including those imposed by the SEC, NASDAQ, and foreign countries, as well as applicable trade, labor, healthcare, privacy, anti-bribery and corruption and merchandise laws. The complexity of the regulatory environment in which we operate and the related cost of compliance are both increasing due to additional or changing legal and regulatory requirements, our ongoing expansion into new markets and new channels, and the fact that foreign laws occasionally conflict with domestic laws. In addition to potential damage to our reputation and brand, failure to comply with the various laws and regulations as well as changes in laws and regulations or the manner in which they are interpreted or applied, may result in litigation, civil and criminal liability, damages, fines and penalties, increased cost of regulatory compliance and restatements of our financial statements.
None.
Equipment Stores
As of April 2015, we operate
108
agricultural and construction equipment stores in the United States and Europe, including
two
outlet stores, in the following locations. This store count and listing excludes the three Agriculture stores and one Construction store closed in March 2015. Certain stores (those designated with an *) are included in the Agriculture segment but also sell some construction equipment.
19
Agriculture Segment (
65
in United States
)
|
North Dakota (14 stores)
|
Minnesota (14 stores, including 1 outlet)
|
Iowa (13 stores, including 1 outlet)
|
|||||
|
Arthur
|
Lidgerwood
|
Ada
|
Moorhead
|
Anthon
|
Kingsley
|
||
|
Casselton
|
Lisbon
|
Albert Lea*
|
Moorhead (outlet)
|
Avoca
|
Le Mars
|
||
|
Grand Forks*
|
Mandan*
|
Crookston*
|
Pipestone
|
Blairstown
|
Pella
|
||
|
Jamestown
|
Mayville
|
Elbow Lake
|
Redwood Falls
|
Center Point*
|
Sioux City (outlet)
|
||
|
Kintyre
|
Wahpeton (2 stores)
|
Fergus Falls
|
Roseau
|
Cherokee
|
Waverly
|
||
|
Kulm
|
Wishek
|
Graceville
|
Thief River Falls
|
Greenfield
|
Williams
|
||
|
Lamoure
|
Marshall*
|
Winger
|
Grundy Center
|
||||
|
South Dakota (11 stores)
|
Nebraska (13 stores)
|
||||||
|
Aberdeen (2 stores)*
|
Pierre*
|
Broken Bow
|
Lexington*
|
||||
|
Highmore
|
Platte
|
Fremont
|
McCook
|
||||
|
Huron
|
Redfield
|
Grand Island*
|
North Platte*
|
||||
|
Milbank
|
Sioux Falls*
|
Hastings
|
Ord
|
||||
|
Miller
|
Watertown
|
Holdrege
|
Wahoo
|
||||
|
Imperial
|
Wayne
|
||||||
|
Kearney*
|
|||||||
Construction Segment (
27
in United States)
|
North Dakota (6 stores)
|
Montana (3 stores)
|
Minnesota (3 stores)
|
|||||
|
Bismarck
|
Minot
|
Billings
|
Missoula
|
Duluth
|
Shakopee
|
||
|
Dickinson
|
Williston
|
Great Falls
|
|
Rogers
|
|||
|
Fargo (2 stores)
|
|||||||
|
Colorado (3 stores)
|
Iowa (3 stores)
|
Nebraska (2 stores)
|
|||||
|
Colorado Springs
|
Windsor
|
Davenport
|
Sioux City
|
Lincoln
|
Omaha
|
||
|
Denver
|
|
Des Moines
|
|||||
|
South Dakota (2 stores)
|
Arizona (2 stores)
|
Wyoming (1 store)
|
|||||
|
Rapid City
|
Sioux Falls
|
Phoenix
|
Tucson
|
Gillette
|
|
||
|
New Mexico (1 store)
|
Wisconsin (1 store)
|
||||||
|
Albuquerque
|
La Crosse
|
||||||
International Segment (
16
in Europe)
|
Europe (16 stores)
|
||||
|
Burgas, Bulgaria
|
Cluj Napoca, Romania
|
|||
|
Dobrich, Bulgaria
|
Constanta, Romania
|
|||
|
Montana, Bulgaria
|
Oradea, Romania
|
|||
|
Pleven, Bulgaria
|
Roman, Romania
|
|||
|
Ruse, Bulgaria
|
Timisoara, Romania
|
|||
|
Sofia, Bulgaria
|
Novi Sad, Serbia
|
|||
|
Stara Zagora, Bulgaria
|
Kiev, Ukraine
|
|||
|
Bucharest, Romania
|
Vinnitsa, Ukraine
|
|||
Our Agriculture stores are generally located in rural areas on property zoned for commercial use and typically range from
10,000
to
60,000
square feet with
three
to
20
acres of land. Our Construction stores are generally located within city limits in designated industrial parks or areas of similar use and typically range from
10,000
to
25,000
square feet with
three
to
ten
acres of land. Our International stores generally range from
2,000
to
20,000
square feet with
1
to
15
acres of land. We fully
20
utilize the leased space for each of our stores and believe the respective square footage and related acreage is adequate to meet our current and anticipated needs.
Store Lease Arrangements
As of
January 31, 2015
, we leased
141
buildings under operating lease agreements which expire at various dates through
January 2030
. We do not intend to own significant amounts of real estate. Therefore, we anticipate that when we need real estate, including as part of acquiring dealerships, we will lease such real estate from third parties, which may include affiliates of our investors, directors or management. We intend for the terms of all of our leases to be commercially reasonable.
Our store lease agreements contain lease periods primarily ranging from automatically renewable month-to-month terms to
15
years in length. Certain of the lease agreements contain terms such as an option to purchase the property at fair value, renew or extend the lease for an additional period at the conclusion of the original lease term or automatically renew the lease term at the conclusion of the original lease period on a month-to-month or year-to-year basis. A majority of the leases provide for fixed monthly rental payments and require us to pay the real estate taxes on the properties for the lease periods. All of the leases require that we maintain public liability and personal property insurance on each of the leased premises, and a majority of the leases require us to indemnify the lessor in connection with any claims arising from the leased premises during our occupation of the property. Most of the leases prohibit us from assigning the lease agreements or subletting the leased premises without the prior written consent of the lessor. In most of our leases, we have been granted a right of first refusal or other options to purchase the property.
As part of our due diligence review prior to a dealership acquisition, we evaluate the adequacy, suitability and condition of the related real estate. Our evaluation typically includes a Phase I environmental study, and if deemed necessary, a Phase II environmental study, of the real property to determine whether there are any environmental concerns. If any environmental concerns exist, we generally require that such concerns be addressed prior to acquisition of the dealership.
We leased
one
store property pursuant to an operating lease from C.I. Farm Power, Inc., a company affiliated with Peter Christianson, our President and Director, during each of the years ended January 31,
2015
,
2014
and
2013
. The lease expires on
July 31, 2018
, subject to the right of either party to terminate upon 60 days' written notice, We also lease buildings from Dealer Sites, LLC ("Dealer Sites"), an entity in which a minority position is owned by an entity affiliated with David Meyer, the Company's Board Chair and Chief Executive Officer, Peter Christianson, the Company's President and a director, and certain other Christianson family members. An entity affiliated with Tony Christianson, one of the Company's directors, formerly held a minority interest in Dealer Sites, LLC until December, 2012. During the year ended January 31, 2013, Dealer Sites was deemed to be a related party, however, as of January 31, 2013 and through the year ended January 31, 2015, Dealer Sites was not deemed to be a related party as total related party ownership in the entity was less than 10%. The Company leased 48 buildings pursuant to different operating lease agreements with Dealer Sites, LLC ("Dealer Sites") as of January 31, 2013.
Headquarters
We currently lease and occupy approximately
48,000
square feet in West Fargo, North Dakota for our headquarters, which lease expires on
January 31, 2028
. We continually review our location needs, including the adequacy of our headquarters space, to ensure our space is sufficient to support our operations. We believe there is ample opportunity for expansion in the West Fargo area if necessary.
We are, from time to time, subject to claims and suits arising in the ordinary course of business. Such claims have, in the past, generally been covered by insurance. Management believes the resolution of other legal matters will not have a material effect on our financial condition, results of operation or cash flow, although no assurance can be given with respect to the ultimate outcome of any such actions. Furthermore, there can be no assurance that our insurance will be adequate to cover all liabilities that may arise out of claims brought against us. We are not currently a party to any material litigation.
Not applicable.
21
EXECUTIVE OFFICERS OF THE REGISTRANT
The names, ages and positions of our executive officers are as follows:
|
Name
|
Age
|
Position
|
||
|
David Meyer
|
61
|
Board Chair and Chief Executive Officer
|
||
|
Peter Christianson
|
58
|
President and Director
|
||
|
Mark Kalvoda
|
43
|
Chief Financial Officer
|
||
David Meyer
is our Board Chair and Chief Executive Officer. Mr. Meyer worked for JI Case Company in 1975. From 1976 to 1980, Mr. Meyer was a partner in a Case/New Holland Dealership with locations in Lisbon, North Dakota and Wahpeton, North Dakota. In 1980, Mr. Meyer, along with a partner, founded Titan Machinery Inc. Mr. Meyer has served on both the Case CE and CaseIH Agriculture Dealer Advisory Boards. Mr. Meyer is the past chairman and current board member of the North Dakota Implement Dealers Association, and currently serves as a Trustee on the University of Minnesota Foundation.
Peter Christianson
has been our President and a director since January 2003. Currently, Mr. Christianson is leading Titan Machinery in International Operations. From April 2011 to July 2013, Mr. Christianson was the Chief Operating Officer of Titan Machinery Inc and was the Chief Financial Officer from August 2007 to April 2011. Prior to joining Titan Machinery and since 1988, he was a partner and owner of C.I. Farm Power, Inc., the operator of two of the dealership locations acquired by Titan Machinery in 2002. Peter Christianson and Tony Christianson, one of our directors, are brothers.
Mark Kalvoda
became our Chief Financial Officer in April 2011 and previously served as our Chief Accounting Officer since September 2007. Prior to joining us, he held various positions between 2004 and 2007 at American Crystal Sugar Co., including Corporate Controller, Assistant Secretary and Assistant Treasurer. Prior to working for American Crystal Sugar Co., he served in various financial positions within Hormel Foods Corporation.
22
Market Information
Our common stock began trading on December 6, 2007 on the Nasdaq Global Market under the symbol "TITN" in connection with our initial public offering and began trading on the Nasdaq Global Select Market in January 2009. The following table sets forth, for the periods indicated, the high and low sale prices of our common stock as reported by the Nasdaq Global Select Market.
|
High
|
Low
|
||||||
|
Fiscal 2015
|
|||||||
|
First Quarter
|
$
|
20.40
|
|
$
|
14.57
|
|
|
|
Second Quarter
|
18.25
|
|
14.51
|
|
|||
|
Third Quarter
|
14.98
|
|
11.85
|
|
|||
|
Fourth Quarter
|
15.45
|
|
10.69
|
|
|||
|
Fiscal 2014
|
|||||||
|
First Quarter
|
$
|
32.00
|
|
$
|
20.60
|
|
|
|
Second Quarter
|
24.00
|
|
18.68
|
|
|||
|
Third Quarter
|
19.64
|
|
15.75
|
|
|||
|
Fourth Quarter
|
18.96
|
|
14.19
|
|
|||
As of
March 31, 2015
, there were approximately
952
record holders of our common stock, excluding holders whose stock is held either in nominee name and/or street name brokerage accounts.
DIVIDENDS
We have not historically paid any dividends on our common stock and do not expect to pay cash dividends on our common stock in the foreseeable future. Payment of future cash dividends, if any, will be at the discretion of our board of directors after taking into account various factors, including our financial condition, operating results, current and anticipated cash needs, outstanding indebtedness and plans for expansion and restrictions imposed by lenders, if any. Currently, our Credit Agreement with Wells Fargo restricts our ability to make certain cash payments, including cash dividends, except that we are permitted to pay cash dividends in an amount not to exceed 50% of consolidated net income for the then trailing four quarters, so long as no default or event of default exists prior to or immediately following such action or otherwise results from such action.
UNREGISTERED SALES OF EQUITY SECURITIES
We did not have any unregistered sales of equity securities during the fiscal quarter ended
January 31, 2015
.
SECURITIES AUTHORIZED FOR ISSUANCE UNDER EQUITY COMPENSATION PLANS
For information on our equity compensation plans, refer to Item 12, "Security Ownership of Certain Beneficial Owners and Management and Related Stockholder Matters."
REPURCHASES
We did not engage in any repurchases of our Common Stock during the fiscal quarter ended
January 31, 2015
.
23
STOCK PERFORMANCE GRAPH
The following graph compares the cumulative total return for the last trading day of our last five fiscal years on a $100 investment (assuming dividend reinvestment) on January 31, 2008, the last trading day before our fifth preceding fiscal year, in each of our Common Stock, the Russell 2000 Stock Index and the S&P Retailing Group Index.
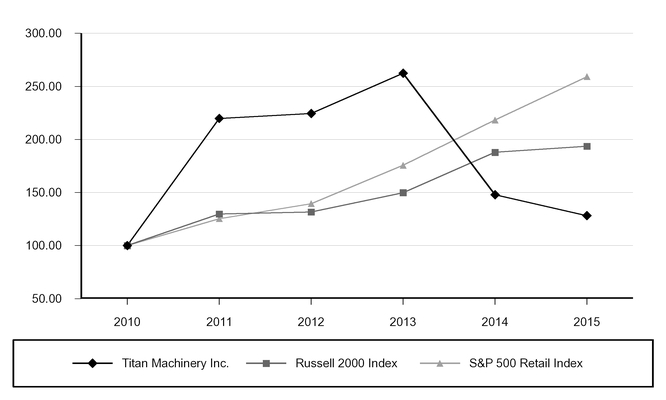
|
January 31,
|
|||||||||||||||||||||||
|
2010
|
2011
|
2012
|
2013
|
2014
|
2015
|
||||||||||||||||||
|
Titan Machinery Inc.
|
$
|
100.00
|
|
$
|
219.87
|
|
$
|
224.50
|
|
$
|
262.34
|
|
$
|
147.91
|
|
$
|
128.22
|
|
|||||
|
Russell 2000 Index
|
100.00
|
|
129.77
|
|
131.69
|
|
149.84
|
|
187.84
|
|
193.57
|
|
|||||||||||
|
S&P 500 Retail Index
|
100.00
|
|
125.29
|
|
139.50
|
|
175.64
|
|
218.28
|
|
259.21
|
|
|||||||||||
The data given below, excluding the store count data, as of and for each of the five years in the period ended
January 31, 2015
, has been derived from our Audited Consolidated Financial Statements. In order to understand the effect of accounting policies and material uncertainties that could affect our presentation of financial information, such data should be read in conjunction with our Consolidated Financial Statements and Notes thereto included under Item 8 to this Form 10-K and in conjunction with Management's Discussion and Analysis of Financial Condition and Results of Operation included under Item 7 to this Form 10-K.
We have a history of growth through acquisitions, which have had a significant impact on the comparability of our statement of operations and balance sheet information. In addition to acquisitions, our store count is also impacted by new store openings and store closings. The table below summarizes the net change in our store count and ending store count for each fiscal year presented.
|
2015
|
2014
|
2013
|
2012
|
2011
|
||||||||||
|
Store Count Data
|
||||||||||||||
|
Net change in store count during fiscal year
|
(7
|
)
|
2
|
|
24
|
|
15
|
|
6
|
|
||||
|
Store count at end of fiscal year
|
112
|
|
119
|
|
117
|
|
93
|
|
78
|
|
||||
24
|
Year Ended January 31,
|
|||||||||||||||||||
|
2015
|
2014
|
2013
|
2012
|
2011
|
|||||||||||||||
|
(in thousands, except per share data)
|
|||||||||||||||||||
|
Statement of Operations Data:
|
|||||||||||||||||||
|
Revenue
|
|||||||||||||||||||
|
Equipment
|
$
|
1,398,195
|
|
$
|
1,722,738
|
|
$
|
1,763,877
|
|
$
|
1,303,900
|
|
$
|
855,443
|
|
||||
|
Parts
|
270,262
|
|
275,750
|
|
242,368
|
|
201,404
|
|
140,982
|
|
|||||||||
|
Service
|
147,356
|
|
149,082
|
|
127,779
|
|
103,474
|
|
74,506
|
|
|||||||||
|
Rental and other
|
84,433
|
|
78,876
|
|
64,396
|
|
50,214
|
|
23,558
|
|
|||||||||
|
Total Revenue
|
1,900,246
|
|
2,226,446
|
|
2,198,420
|
|
1,658,992
|
|
1,094,489
|
|
|||||||||
|
Cost of Revenue
|
|||||||||||||||||||
|
Equipment
|
1,286,148
|
|
1,576,246
|
|
1,600,233
|
|
1,171,618
|
|
773,060
|
|
|||||||||
|
Parts
|
189,540
|
|
192,199
|
|
169,164
|
|
140,096
|
|
100,281
|
|
|||||||||
|
Service
|
53,924
|
|
54,608
|
|
45,748
|
|
37,236
|
|
27,767
|
|
|||||||||
|
Rental and other
|
62,250
|
|
55,319
|
|
43,914
|
|
34,581
|
|
18,813
|
|
|||||||||
|
Total Cost of Revenue
|
1,591,862
|
|
1,878,372
|
|
1,859,059
|
|
1,383,531
|
|
919,921
|
|
|||||||||
|
Gross Profit
|
308,384
|
|
348,074
|
|
339,361
|
|
275,461
|
|
174,568
|
|
|||||||||
|
Operating Expenses
|
273,271
|
|
291,202
|
|
247,557
|
|
193,860
|
|
130,541
|
|
|||||||||
|
Impairment and Realignment Costs
|
34,390
|
|
9,997
|
|
—
|
|
—
|
|
—
|
|
|||||||||
|
Income from Operations
|
723
|
|
46,875
|
|
91,804
|
|
81,601
|
|
44,027
|
|
|||||||||
|
Other Income (Expense)
|
|||||||||||||||||||
|
Interest income and other income (expense)
|
(4,272
|
)
|
2,109
|
|
1,654
|
|
1,643
|
|
1,794
|
|
|||||||||
|
Interest expense
|
(34,791
|
)
|
(30,555
|
)
|
(22,762
|
)
|
(9,670
|
)
|
(8,584
|
)
|
|||||||||
|
Income (Loss) Before Income Taxes
|
(38,340
|
)
|
18,429
|
|
70,696
|
|
73,574
|
|
37,237
|
|
|||||||||
|
Provision for (Benefit from) Income Taxes
|
(4,923
|
)
|
10,325
|
|
28,137
|
|
29,429
|
|
14,895
|
|
|||||||||
|
Net Income (Loss) Including Noncontrolling Interest
|
(33,417
|
)
|
8,104
|
|
42,559
|
|
44,145
|
|
22,342
|
|
|||||||||
|
Less: Net Income (Loss) Attributable to Noncontrolling Interest
|
(1,260
|
)
|
(747
|
)
|
86
|
|
(15
|
)
|
—
|
|
|||||||||
|
Net Income (Loss) Attributable to Titan Machinery Inc.
|
(32,157
|
)
|
8,851
|
|
42,473
|
|
44,160
|
|
22,342
|
|
|||||||||
|
Net (Income) Loss Allocated to Participating Securities
|
559
|
|
(129
|
)
|
(443
|
)
|
(409
|
)
|
(232
|
)
|
|||||||||
|
Net Income (Loss) Attributable to Titan Machinery Inc. Common Stockholders
|
$
|
(31,598
|
)
|
$
|
8,722
|
|
$
|
42,030
|
|
$
|
43,751
|
|
$
|
22,110
|
|
||||
|
Earnings (Loss) per Share
|
|||||||||||||||||||
|
Basic
|
$
|
(1.51
|
)
|
$
|
0.42
|
|
$
|
2.02
|
|
$
|
2.21
|
|
$
|
1.25
|
|
||||
|
Diluted
|
$
|
(1.51
|
)
|
$
|
0.41
|
|
$
|
2.00
|
|
$
|
2.18
|
|
$
|
1.23
|
|
||||
|
Weighted average shares outstanding
|
|||||||||||||||||||
|
Basic
|
20,989
|
|
20,894
|
|
20,787
|
|
19,809
|
|
17,658
|
|
|||||||||
|
Diluted
|
20,989
|
|
21,040
|
|
20,987
|
|
20,110
|
|
17,961
|
|
|||||||||
25
|
January 31,
|
|||||||||||||||||||
|
2015
|
2014
|
2013
|
2012
|
2011
|
|||||||||||||||
|
(in thousands)
|
|||||||||||||||||||
|
Balance Sheet Data:
|
|||||||||||||||||||
|
Cash
|
$
|
127,528
|
|
$
|
74,242
|
|
$
|
124,360
|
|
$
|
79,842
|
|
$
|
76,112
|
|
||||
|
Receivables, net
|
76,382
|
|
97,894
|
|
121,786
|
|
82,518
|
|
44,945
|
|
|||||||||
|
Inventories
|
879,440
|
|
1,075,978
|
|
929,216
|
|
748,047
|
|
429,844
|
|
|||||||||
|
Prepaid expenses and other
|
10,634
|
|
24,740
|
|
8,178
|
|
2,108
|
|
1,003
|
|
|||||||||
|
Income taxes receivable
|
166
|
|
851
|
|
503
|
|
3,140
|
|
—
|
|
|||||||||
|
Deferred income taxes
|
19,025
|
|
13,678
|
|
8,357
|
|
5,370
|
|
3,247
|
|
|||||||||
|
Assets held for sale
|
15,312
|
|
—
|
|
—
|
|
—
|
|
—
|
|
|||||||||
|
Total current assets
|
1,128,487
|
|
1,287,383
|
|
1,192,400
|
|
921,025
|
|
555,151
|
|
|||||||||
|
Goodwill and intangible assets, net
|
5,458
|
|
36,501
|
|
44,992
|
|
35,197
|
|
23,125
|
|
|||||||||
|
Property and Equipment, net of accumulated depreciation
|
208,680
|
|
228,000
|
|
194,641
|
|
126,282
|
|
65,372
|
|
|||||||||
|
Other assets
|
7,122
|
|
12,764
|
|
12,041
|
|
5,568
|
|
5,198
|
|
|||||||||
|
Total Assets
|
$
|
1,349,747
|
|
$
|
1,564,648
|
|
$
|
1,444,074
|
|
$
|
1,088,072
|
|
$
|
648,846
|
|
||||
|
Accounts payable
|
$
|
17,659
|
|
$
|
23,714
|
|
$
|
28,282
|
|
$
|
28,424
|
|
$
|
15,957
|
|
||||
|
Floorplan payable (1)
|
627,249
|
|
750,533
|
|
689,410
|
|
552,428
|
|
320,801
|
|
|||||||||
|
Current maturities of long-term debt
|
7,749
|
|
2,192
|
|
10,568
|
|
4,755
|
|
4,207
|
|
|||||||||
|
Customer deposits
|
35,090
|
|
61,286
|
|
46,775
|
|
49,540
|
|
28,180
|
|
|||||||||
|
Accrued expenses
|
35,496
|
|
36,968
|
|
29,590
|
|
26,735
|
|
16,816
|
|
|||||||||
|
Liabilities held for sale
|
2,835
|
|
—
|
|
—
|
|
—
|
|
—
|
|
|||||||||
|
Income taxes payable
|
3,529
|
|
344
|
|
310
|
|
—
|
|
2,093
|
|
|||||||||
|
Total current liabilities
|
729,607
|
|
875,037
|
|
804,935
|
|
661,882
|
|
388,054
|
|
|||||||||
|
Senior convertible notes
|
132,350
|
|
128,893
|
|
125,666
|
|
—
|
|
—
|
|
|||||||||
|
Long-term debt, less current maturities
|
67,123
|
|
95,532
|
|
56,592
|
|
57,405
|
|
33,409
|
|
|||||||||
|
Deferred income taxes
|
38,996
|
|
47,329
|
|
47,411
|
|
28,592
|
|
9,012
|
|
|||||||||
|
Other long-term liabilities
|
3,312
|
|
6,515
|
|
9,551
|
|
2,854
|
|
3,814
|
|
|||||||||
|
Total stockholders' equity (2)
|
378,359
|
|
411,342
|
|
399,919
|
|
337,339
|
|
214,557
|
|
|||||||||
|
Total Liabilities and Stockholders' Equity
|
$
|
1,349,747
|
|
$
|
1,564,648
|
|
$
|
1,444,074
|
|
$
|
1,088,072
|
|
$
|
648,846
|
|
||||
|
(1) Portion of floorplan payable balance which is interest-bearing as of January 31
|
75
|
%
|
56
|
%
|
61
|
%
|
52
|
%
|
52
|
%
|
|||||||||
|
(2) Company's follow-on offering resulted in an increase in total stockholders' equity of $74,898 in fiscal 2012.
|
|||||||||||||||||||
26
You should read the following discussion and analysis of our financial condition and results of operations together with our financial statements and the related notes appearing under Item 8. Some of the information contained in this discussion and analysis or set forth elsewhere in this annual report, including information with respect to our plans and strategy for our business and expected financial results, includes forward-looking statements that involve risks and uncertainties. You should review the "Risk Factors" under Item 1A for a discussion of important factors that could cause actual results to differ materially from the results described in or implied by the forward-looking statements contained in the following discussion and analysis.
BUSINESS DESCRIPTION
We own and operate a network of full service agricultural and construction equipment stores in the United States and Europe. Based upon information provided to us by CNH Industrial N.V. or its U.S. subsidiary CNH Industrial America, LLC, collectively referred to in this annual report as CNH Industrial, we are the largest retail dealer of Case IH Agriculture equipment in the world, the largest retail dealer of Case Construction equipment in North America and a major retail dealer of New Holland Agriculture and New Holland Construction equipment in the U.S. We operate our business through three reportable segments, Agriculture, Construction and International. Within each segment, we have four principal sources of revenue, new and used equipment sales, parts sales, service, and equipment rental and other activities.
The agricultural equipment we sell and service includes machinery and attachments for uses ranging from large-scale farming to home and garden use. The construction equipment we sell and service includes heavy construction and light industrial machinery for commercial and residential construction, road and highway construction and mining applications. We offer our customers a one-stop solution for their equipment needs through:
|
•
|
new and used equipment sales;
|
|
•
|
parts sales;
|
|
•
|
repair and maintenance services; and
|
|
•
|
equipment rental and other activities.
|
The new equipment and parts we sell are supplied primarily by CNH Industrial. According to public reports filed by CNH Industrial, CNH Industrial is a leading manufacturer and supplier of agricultural and construction equipment based on the number of units sold, primarily through the Case IH Agriculture, New Holland Agriculture, Case Construction and New Holland Construction brands. Sales of new CNH Industrial products accounted for approximately
72%
of our new equipment revenue in fiscal
2015
, with our single largest manufacturer other than CNH Industrial representing approximately
3%
of our total new equipment sales. We acquire used equipment for resale through trade-ins from our customers and selective purchases. We sell parts and provide in-store and on-site repair and maintenance services. We rent equipment and provide other ancillary services such as equipment transportation, GPS signal subscriptions and finance and insurance products.
Throughout our 35-year operating history we have built an extensive, geographically contiguous network of
92
stores, including
two
outlet stores, located in the United States and
16
stores in Europe. We have a history of growth through acquisitions, including
52
acquisitions consisting of
110
stores operating in
11
states and
three
European countries since January 1, 2003. We expect that acquisitions will continue to be an important component of our long-term growth.
Realignment Costs
To better align our cost structure and re-balance staffing levels with the evolving needs of the business, in March 2015, we approved a realignment plan to reduce our headcount by approximately 14%, which includes headcount reductions at stores in each of our operating segments and our Shared Resource Center, as well as from the closing of three Agriculture stores and one Construction store. We expect to substantially complete these efforts by April 30, 2015. Our remaining stores in each of the respective areas will take over the distribution rights for the CNH Industrial brand previously held by the stores which have closed. We will transfer the majority of the assets of the closed stores to other stores. We estimate the total cost of these activities will be approximately $2.0 million, comprised of an accrual for the net present value of remaining lease obligations, employee severance costs, impairment of certain fixed assets and costs associated with relocation of assets from the closed stores. We recognized approximately $0.1 million in severance costs primarily in our International segment in our fourth quarter ended January 31, 2015, and expect to recognize the remaining $1.9 million of these expenses in our first quarter ended April 30, 2015. See Note 19 to the notes to our consolidated financial statements for additional information regarding these exit costs and activities.
27
To better align our Construction business in certain markets, in April 2014, we reduced our Construction-related headcount by approximately
12%
primarily through the closing of
seven
underperforming Construction stores, staff reductions at other dealerships and reductions in support staff at our Shared Resource Center. We also closed one Agriculture store. Our remaining stores in each of the respective areas assumed the majority of the distribution rights for the CNH Industrial brand previously held by the stores which have closed. We recognized
$3.9 million
in exit costs during the year ended
January 31, 2015
. See Note 19 to the notes to our consolidated financial statements for additional information regarding these exit costs and activities. See also the Non-GAAP Financial Measures section below for impact of these costs on non-GAAP Diluted EPS.
Foreign Currency Remeasurement Losses
In February of 2014, the National Bank of Ukraine terminated the currency peg of the Ukrainian hryvnia ("UAH") to the USD; subsequent to the decoupling and as a result of the economic and political conditions present in the country, the UAH has experienced significant devaluation from the date the currency peg was terminated. The functional currency of our Ukrainian subsidiary is the U.S. dollar and, as a result, any currency remeasurement adjustments for non-dollar denominated monetary assets and liabilities held by this subsidiary are reflected in earnings. For the year ended January 31, 2015, we recognized
$5.8 million
in foreign currency remeasurement losses resulting from the devaluation of the UAH. These losses are included in interest income and other income (expense) in our consolidated statements of operations. See also the Non-GAAP Financial Measures section below for impact of these costs on non-GAAP Diluted EPS.
As of January 31, 2015, our Ukrainian subsidiary had $2.4 million of net monetary assets denominated in UAH. We have attempted to minimize our net monetary asset position through reducing overall asset levels in Ukraine and through borrowing in UAH which serves as a natural hedging instrument offsetting our UAH denominated assets. Currency and payment controls imposed by the National Bank of Ukraine have limited our ability to manage our net monetary asset position. Such restrictions, coupled with the continued devaluation of the UAH, may create exposure for our net monetary assets.
Certain External Factors Affecting our Business
We are subject to a number of factors that affect our business as discussed in the sections entitled "Risk Factors" and "Information Regarding Forward- Looking Statements." Certain of the external factors include, but are not limited to, the following:
Industry Factors
Our Agriculture and International businesses are primarily driven by the demand for agricultural equipment for use in the production of food, fiber, feed grain and renewable energy; home and garden applications; and the maintenance of commercial, residential and government properties. Based on USDA data, we believe farmers in the U.S. have experienced historically strong economic fundamentals in several of the recent years, driven by growing global demand for agricultural commodities in part due to growth in renewable energy and the economies of developing countries. However, beginning in February 2014 and throughout calendar year 2014, the USDA published its projections of a decrease in net farm income in the U.S. from calendar year 2013 to 2014. In February 2015, the USDA published its projections of another decrease in net farm income in the U.S. of 31.8% from calendar year 2014 to 2015. We believe our large and diverse customer base within our geographic footprint of five states and four European countries reduces our exposure to negative events that may occur in a particular area or crop. Additionally, we believe a favorable climate for dealership consolidation will continue to exist, which provides for acquisition opportunities.
Our Construction business is primarily impacted by the demand for construction equipment for use in private and government commercial, residential and infrastructure construction; demolition; maintenance; mining; energy and forestry operations.
Seasonality & Weather
The agricultural and construction equipment businesses are highly seasonal, which causes our quarterly results and our available cash flow to fluctuate during the year. Our customers generally purchase and rent equipment in preparation for, or in conjunction with, their busy seasons, which for farmers are the spring planting and fall harvesting seasons, and for Construction customers is dependent on weather seasons in their respective regions, which is typically the second and third quarters of our fiscal year for much of our Construction footprint. Our parts and service revenues are typically highest during our customers' busy seasons as well, due to the increased use of their equipment during this time, which generates the need for more parts and service work. However, weather conditions impact the timing of our customers' busy times, which may cause our quarterly financial results to differ between fiscal years. In addition, the fourth quarter typically is a significant period for equipment sales in the U.S. because of our customers’ year-end tax planning considerations, the timing of dealer incentives and the increase in availability of funds from completed harvests and construction projects.
28
Seasonal weather trends, particularly severe wet or dry conditions, can have a significant impact on regional agricultural and construction market performance by affecting crop production and the ability to undertake construction projects. Weather conditions that adversely affect the agricultural or construction markets have negative effect on the demand for our products and services.
In addition, numerous external factors such as credit markets, commodity prices, and other circumstances may disrupt normal purchasing practices and buyer sentiment, further contributing to the seasonal fluctuations.
Macroeconomic Conditions
Sales of agricultural equipment historically have fluctuated with general farm economic trends, primarily driven by net farm income. Significant factors that affect net farm income include demand for farm products, commodity and livestock prices, crop yields, crop stock levels, and production costs. We use the USDA’s periodic reports of actual and projected net farm income, as well as information on commodity prices and crop yields in the U.S. and worldwide, to analyze and anticipate the impact of our customers’ sentiment on their purchasing trends. Decreases in actual or anticipated net farm income, or in any of the significant components of net farm income, generally cause decreases in equipment revenue. Net farm income has been strong and increasing in several of the recent years, however, as discussed above, net farm income decreased from calendar year 2013 to 2014 and is projected to further decrease in calendar year 2015. We believe these industry expectations had a negative impact on our Agriculture equipment revenue in fiscal 2015 and will continue to negatively impact our Agriculture equipment revenue in fiscal 2016.
Sales of construction equipment historically have fluctuated with general economic cycles. During economic downturns, construction equipment retailers tend to experience similar periods of decline and recession as the general economy. The U.S. Bureau of the Census publishes periodic reports of new residential construction by region in the U.S., which we use to analyze general economic trends in the regions in which we operate and anticipate our customers’ purchasing and rental trends. Decreases in new residential construction generally cause decreases in our equipment revenue.
During economic downturns, and especially in the agriculture industry, equipment revenue generally decreases but parts and service revenue tend to be more stable or even increase as the amount of land in production is unchanged and because farmers may use existing equipment rather than purchasing new equipment. Gross profit margins on equipment are lower than gross profits on parts and service. As a result, this change in mix may cause our gross profit margin to increase even though our overall gross profit dollars may decrease along with the decrease in equipment revenue. Our operating expenses are largely fixed expenses, other than commissions which generally fluctuate with gross profit. When equipment revenue decreases, it may have a negative impact on our ability to leverage these fixed costs, and, as a result, may reduce our operating income.
In addition, oversupply of equipment inventory in the industry, caused by either depressed equipment demand or over-production by suppliers, may have a negative impact on our operating results, particularly equipment gross profit margin.
Dependence on our Primary Supplier
The majority of our business involves the distribution and servicing of equipment manufactured by CNH Industrial. In fiscal
2015
, CNH Industrial supplied approximately
74%
of the new equipment sold in our Agriculture segment,
65%
of the new equipment sold in our Construction segment, and
74%
of the new equipment sold in our International segment, and represented a significant portion of our parts revenue. Thus, we believe the following factors have a significant impact on our operating results:
|
•
|
CNH Industrial’s product offerings, reputation and market share
|
|
•
|
CNH Industrial’s product prices and incentive and discount programs
|
|
•
|
Supply of inventory from CNH Industrial
|
|
•
|
CNH Industrial provides floorplan payable financing for the purchase of a substantial portion of our inventory
|
|
•
|
CNH Industrial provides a significant percentage of the financing used by our customers to purchase CNH Industrial equipment from us.
|
Credit Market Changes
Changes in credit markets can affect our customers' ability and willingness to make capital expenditures, including purchasing our equipment. Tight credit markets, a low level of liquidity in many financial markets, and extreme volatility in fixed income, credit, currency and equity markets have the potential to adversely affect our business. Such disruptions in the overall economy and financial markets and the related reduction in consumer confidence in the economy, slow activity in the capital markets, negatively affect access to credit on commercially acceptable terms, and may adversely impact the access of us
29
or our customers to credit and the terms of any such credit. However, if retail interest rates remain low, our business may be positively affected by customers who find financing purchases of our equipment more attractive due to lower borrowing costs.
Our business is also particularly dependent on our access to credit markets to finance acquisitions and manage inventory. Continued tightened lending standards may make it more difficult for us to obtain financing on commercially reasonable terms. We cannot predict what future changes will occur in credit markets or how these changes will impact our business.
Inflation
Inflation has not had a material impact upon operating results and we do not expect it to have such an impact in the future. To date, in those instances in which we have experienced cost increases, we have been able to increase selling prices to offset such increases.
Acquisitions
Since January 1, 2003, we have completed
52
acquisitions consisting of
110
stores operating in
11
states and
three
European countries, which includes
one
store in fiscal
2015
,
two
stores in fiscal
2014
and
20
stores in fiscal
2013
. These acquisitions have been a significant factor affecting our results of operations and liquidity over the last several years, as noted in the period-to-period comparisons below. We believe a favorable climate for dealership consolidation will continue to exist, which provides for acquisition opportunities. Acquisitions are typically financed with available cash balances, floorplan payables and long-term debt.
Use of Estimates and Critical Accounting Policies
During the preparation of our financial statements, we are required to make estimates, assumptions and judgments that affect reported amounts. These estimates, assumptions and judgments include those related to realization of inventory, initial valuation and impairment analyses of goodwill and other intangible assets, collectability of receivables and income taxes. We update these estimates, assumptions and judgments as appropriate, which in most cases is at least quarterly. We use our technical accounting knowledge, cumulative business experience, judgment and other factors in the selection and application of our accounting policies. While we believe the estimates, assumptions and judgments we use in preparing our financial statements are appropriate, they are subject to factors and uncertainties regarding their outcome and therefore, actual results may materially differ from these estimates. We believe the following describe the significant estimates, assumptions and judgments related to our primary critical accounting policies. See Note 1 in the notes to our consolidated financial statements in this Form 10-K for a comprehensive list of our significant accounting policies, recent accounting guidance and additional information regarding such policies.
Revenue Recognition
Equipment revenue generally is recognized upon receipt of a signed contract and delivery of product to customers. However, in certain circumstances customers request a bill and hold arrangement, in which case equipment revenue is recognized before delivery occurs. Under these bill and hold arrangements, the equipment is available for shipment, the Company has fulfilled all of its pre-delivery performance obligations and received a signed sales contract, and the customer has completed and signed a bill and hold agreement. Credit terms on bill and hold arrangements are consistent with credit terms on all other equipment sales. In addition to outright sales of new and used equipment, certain rental agreements may include rent-to-purchase options. Under these agreements, customers are given a period of time to exercise an option to purchase the related equipment, with a portion of the rental payments being applied to reduce the purchase price. Payments received during the rental period are recorded as rental revenue. Any such equipment is included in inventory until the purchase option is exercised, and the carrying value of the equipment is reduced in accordance with our Inventories policies. Equipment revenue is recognized upon the exercise of the purchase option. Parts revenue is recognized upon delivery of product to customers. Service revenue is recognized at the time the related services are provided. Rental revenue is recognized over the period of the related rental agreement.
Inventories
New and used equipment are stated at the lower of cost (specific identification) or market value with adjustments for decreases in market value on inventory rented but available for sale, estimated as a percentage of the rental income received on such inventory. The majority of our used equipment inventory is acquired through trade-ins from our customers. The acquisition value assigned to each piece of used equipment inventory is determined based on the estimated selling price for that piece of equipment in the applicable market, and estimated reconditioning costs. Various industry resources are used to assist in the valuation, and we consider all factors, such as model year, hours, overall condition and estimated reconditioning costs, other
30
equipment specifications, and the market in which we expect to sell the equipment, when determining the final equipment valuation. Subsequent to the initial valuation, all new and used equipment inventories, including that which has been rented, are subject to periodic lower of cost or market evaluation that considers various factors including aging of equipment and market conditions. Generally, used equipment prices are more volatile and dependent on changes in market conditions than prices for new equipment due to incentive programs that may be offered by manufacturers to assist in the sale of new equipment. We review our equipment inventory values on a monthly basis and adjust them whenever the carrying amount exceeds the estimated market value. Parts inventories are valued at the lower of average cost or market value. We estimate a reserve on our parts inventories based on various factors including aging and sales of each type of parts inventory. Work in process is valued at the retail rates of labor incurred and retail parts inventories used on service work in process at year end.
Goodwill
Goodwill represents the excess of the purchase price over the fair value of the net assets, including identifiable intangible assets, of the businesses acquired. Goodwill is not amortized, but is tested for impairment annually, or more frequently upon the occurrence of certain events or when circumstances indicate that impairment may be present. We perform our annual impairment test as of the end of our fiscal year.
Goodwill is tested for impairment at the reporting unit level. A reporting unit is defined as an operating segment or one level below an operating segment (referred to as a component). A component of an operating segment is a reporting unit if the component constitutes a business for which discrete financial information is available and segment management regularly reviews the operating results of that component. Our Agriculture operating segment is the only reporting unit which carries a material goodwill balance.
The goodwill impairment analysis is performed under a two-step impairment model. Step one of the analysis compares the estimated fair value of a reporting unit to its carrying value. If the fair value of a reporting unit exceeds its carrying amount, goodwill of the reporting unit is considered not impaired and the second step of the impairment test is unnecessary. However, if the carrying amount of a reporting unit exceeds its fair value, the second step of the impairment test is performed to measure the amount of impairment, if any. The second step measures the amount of impairment loss, if any, by comparing the implied fair value of goodwill, which is estimated by comparing the estimated fair value of the reporting unit as a whole to the fair value of the underlying assets and liabilities of the reporting unit. An impairment charge is recognized for any excess of the carrying value of goodwill over the implied fair value.
We estimate the fair value of our reporting unit using both a market approach in which we apply multiples of earnings before interest, taxes, depreciation and amortization of comparable guideline public companies to that of our reporting unit, and an income approach in which we utilize a discounted cash flow analysis which includes a five-year forecast of future operating performance of the reporting unit and a terminal value which estimates sustained long-term growth. The discount rate applied to the estimated future cash flows reflects our estimate of the weighted-average cost of capital of comparable companies.
We performed our annual impairment test as of the end of our fiscal year and concluded that the estimated fair value of our Agriculture reporting unit was less than the carrying value, and thus we performed step two of the impairment test. The results of step two of the impairment analysis indicated that a full impairment charge of the goodwill value was necessary. As a result, we recognized an impairment charge in the fourth quarter of fiscal 2015 of
$24.6 million
.
Our estimate of the fair value of our reporting unit incorporated certain key assumptions, including estimated revenue, gross margin and operating expense levels, working capital investments required to support anticipated revenue amounts, capital spending trends, our estimate of long-term sustained growth, and the discount rate applied to the estimated future cash flows.
The impairment charges recognized in the fourth quarter of fiscal 2015 arose as the result of financial results that were lower than expectations for the year ended January 31, 2015, lowered expectations of future financial performance of our Agriculture segment and a lower market capitalization for our company as a whole. Our assumptions about future financial performance were impacted by the current year operating performance and by the anticipated impact that challenging industry conditions existing as of the assessment date and anticipated to be present over the near-term may have on the future financial performance of this reporting unit.
We recognized an impairment charge in the fourth quarter of fiscal 2014 of
$5.3 million
and
$0.9 million
of the goodwill associated with the Construction and Romanian reporting units, respectively. Following the impairment charges recognized in the fourth quarter of fiscal 2015, no amount of goodwill remains on our consolidated balance sheet as of January 31, 2015.
31
Indefinite-Lived Intangible Assets
Intangible assets with an indefinite life consist of distribution rights with manufacturers. We classify distribution rights as an indefinite-lived intangible asset because our distribution agreements continue indefinitely by their terms, or are routinely awarded or renewed without substantial cost to us or material modifications to the underlying agreements. As such, we believe that our distribution rights intangible assets will contribute to our cash flows for an indefinite period; therefore, the carrying amount of distribution rights is not amortized, but is tested for impairment annually, or more frequently upon the occurrence of certain events or when circumstances indicate that impairment may be present. We perform our annual impairment test as of December 31st of each year. The impairment test is performed by comparing the carrying value of the distribution right asset to its estimated fair value.
Indefinite-lived intangible assets are tested for impairment at the lowest level in which identifiable cash flows can be attributed to the asset. For our distribution rights intangible assets, we have determined that the lowest level of cash flows which can be attributed to the asset is equal to the store, or complex of stores, acquired in the business combination which resulted in the initial recognition of the intangible asset, plus any additional store locations operating within the geographical area of the distribution rights.
Under the impairment test, we estimate the fair value of our distribution rights intangible assets based on a multi-period excess earnings model, an income approach. This model allocates future estimated earnings of the store (complex) amongst working capital, fixed assets and other intangible assets of store (complex) and any remaining earnings (the “excess earnings”) are allocated to the distribution rights intangible assets. The earnings allocated to the distribution rights are then discounted to arrive at the present value of the future estimated excess earnings, which represents the estimated fair value of the distribution rights intangible asset. The discount rate applied reflects our estimate of the weighted-average cost of capital of comparable companies plus an additional risk premium to reflect the additional risk inherent in the distribution right asset.
We performed our annual impairment testing as of December 31, 2014. The results of this testing indicated that the estimated fair value of certain distribution rights assets approximated zero, thus requiring a full impairment charge. In total, we recognized an impairment charge of
$5.5 million
, of which
$4.8 million
arose from stores (complexes) within our Agriculture segment and
$0.7 million
arose from stores (complexes) within our International segment.
The impairment charges recognized within our Agriculture and International segments arose as the result lowered expectations of the future financial performance of these stores (complexes). Our assumptions about future financial performance were impacted by the current year operating performance of these stores (complexes) and by the anticipated impact that challenging industry conditions may have on the future financial performance of these stores (complexes).
Following the aforementioned impairments, we have
$4.9 million
of distribution rights assets recorded on our consolidated balance sheet as of January 31, 2015. The impairment tests performed on these assets as of December 31, 2014 indicated that the estimated fair value of each asset substantially exceeded the carrying value.
We believe that our estimates and assumptions used in deriving the fair value of each of the distribution rights assets are reasonable and based on the best information available. However, adverse changes in macroeconomic or industry conditions or adverse changes in our expectations about the future operating performance of the store (complex) supporting the distribution rights assets could result in an impairment charge in a future period which could materially impact our results of operations and financial position.
Impairment of Long-Lived Assets
Our long-lived assets consist of our intangible assets and property and equipment. We review these assets for potential impairment whenever events or circumstances indicate that the carrying value may not be recoverable. Recoverability is measured by comparing the estimated future undiscounted cash flows of such assets to their carrying values. If the estimated undiscounted cash flows exceed the carrying value, the carrying value is considered recoverable and no impairment recognition is required. However, if the sum of the undiscounted cash flows is less than the carrying value of the asset, the second step of the impairment analysis must be performed to measure the amount of the impairment, if any. The second step of the impairment analysis compares the estimated fair value of the long-lived asset to its carrying value and any amount by which the carrying value exceeds the fair value is recognized as an impairment charge.
As of the end of our 2015 fiscal year we determined that the current period operating loss combined with historical losses and anticipated future operating losses within certain of our stores was an indication that certain long-lived assets of these stores may not be recoverable. The asset types included in our assessment included immovable long-lived assets (e.g., leasehold improvements) and other assets in which it would be impracticable for us to redeploy the assets to other locations (e.g., furniture and fixtures). We performed the impairment analyses for these assets which have a combined carrying value of $6.6 million.
32
In certain cases the analysis indicated that the carrying value is not recoverable. The aggregate carrying value of such assets totaled $1.2 million. Based on this conclusion, we performed step two of the impairment analysis and estimated the fair value of these assets using the estimated selling prices of similar assets. Step two of the analysis indicated that an impairment charge in the amount of $0.4 million was necessary. This impairment charge impacted our Agriculture segment. In all other cases, in which the aggregate carrying value of such assets totaled was $5.4 million, our analyses indicated that the carrying values are recoverable based on our estimates of future undiscounted cash flows under step one of the impairment analysis.
Our analyses incorporated certain key assumptions, including estimated revenue, gross margin and operating expense levels and an assumption about the remaining useful lives of the long-lived assets being evaluated. Our key assumptions were developed for each store tested for impairment and were based on our assumptions about overall industry growth or decline within which each stores operates as well as consideration of historical operating performance and our expectation of changes from such levels.
Our estimates inherently include a degree of uncertainty, but we believe that these estimates and assumptions used in deriving the estimated future cash flows of these store locations are reasonable and based on the best information available. However, adverse changes in macroeconomic or industry conditions, the competitive environment, or adverse changes in our expectations about the future operating performance of the store could result in an impairment charge in a future period which could materially impact our results of operations and financial position.
We performed a similar impairment analysis at the end of our 2014 fiscal year, which indicated that a full impairment charge was necessary, and thus we recognized an impairment loss of
$1.5 million
, all of which impacted our Construction segment.
Income Taxes
In determining taxable income for financial statement purposes, we must make certain judgments and estimates, including an assessment of the realizability of our deferred tax assets. In evaluating our ability to realize the benefit of our deferred tax assets we consider all available positive and negative evidence, including our historical operating results and our expectation of future taxable income, the availability to implement prudent tax-planning strategies, and the carryback, if any, and carryforward periods over which the assets may be realized. These assumptions require significant judgment and estimation.
In reviewing our deferred tax assets as of the end of fiscal 2015 and 2014, respectively, we concluded that a full valuation allowance for the deferred tax assets in certain of our foreign jurisdictions was warranted. In total, we recognized a valuation allowance of
$5.6 million
and
$1.9 million
during the years ended January 31, 2015 and 2014, respectively, which was recorded as an additional provision for income taxes and negatively impacted our effective tax rate. This conclusion was principally based on the presence of historical losses and the anticipated time period over which we may generate taxable income in excess of these historical losses.
Our assessment of the need for and magnitude of the recognized valuation allowances may be impacted by changes in tax laws, our assumptions regarding the ability to generate future taxable income and the availability of tax-planning strategies. Changes in any of these factors could lead to a change in the recognized valuation allowance which may impact our future results of operations and financial position.
Key Financial Metrics
In addition to tracking our sales and expenses to evaluate our operational performance, we also monitor the following key financial metrics. The results of each of these metrics are discussed further throughout the Management's Discussion and Analysis of Financial Condition and Results of Operations section of this Form 10-K.
Inventory Turnover
Inventory turnover measures the rate at which inventory is sold during the year. We calculate it by dividing cost of sales on equipment and parts for the last twelve months divided by the average of the month-end balances of our equipment and parts inventories for the same twelve-month period.
Same-Store Results
Same-store results for any period represent results of operations by stores that were part of our company for the entire comparable period in the preceding fiscal year. We do not distinguish relocated or newly-expanded stores in this same-store analysis. Closed stores are excluded from the same-store analysis. Stores that do not meet the criteria for same-store classification are described as acquisition stores throughout the Results of Operations section in this Annual Report on Form
33
10-K. We believe that tracking this metric is important to evaluating the success of the Titan Operating Model on a comparable basis.
Absorption
Absorption is an industry term that refers to the percentage of an equipment dealer's fixed operating expense covered by the combined gross margin from parts, service and rental fleet activity. We calculate absorption in a given period by dividing our gross profit from sales of parts, service and rental fleet activity (described to as "Gross Profit on Recurring Revenue" when used in reference to absorption discussions) for the period by difference between (i) our operating expenses (including interest on floorplan payable and rental fleet debt balances) and (ii) our variable expense of sales commissions on equipment sales and incentive compensation in the same period (described to as "Fixed Operating Expenses" when used in reference to absorption discussions). We believe that absorption is an important management metric because during economic down cycles our customers tend to postpone new and used equipment purchases while continuing to run, maintain and repair their existing equipment. Thus, operating at a high absorption rate enables us to operate profitably throughout economic down cycles. We measure and track absorption on a company-wide basis as well as on a per store basis.
Dollar Utilization
Dollar utilization is a measurement of asset performance and profitability used in the rental industry. We calculate the dollar utilization of our rental fleet equipment by dividing the rental revenue earned on our rental fleet by the average gross carrying value of our rental fleet (comprised of original equipment costs plus additional capitalized costs) for that period. While our rental fleet has variable expenses related to repairs and maintenance, its primary expense for depreciation is fixed. Low utilization of our rental fleet has a negative impact on gross profit margin and gross profit dollars due to the fixed depreciation component. However, high utilization of our rental fleet has a positive impact on gross profit margin and gross profit dollars.
Adjusted EBITDA
EBITDA is defined as earnings before finance costs, income taxes, depreciation and amortization and is a metric frequently used to assess and evaluate financial performance. EBITDA is commonly regarded as an indirect measure of operating cash flow, without the impact of changes in working capital, a significant indicator of success for many businesses, and is a common valuation metric. Management uses adjusted EBITDA and believes it provides a useful metric for comparability between periods by eliminating the impact of finance costs, income taxes, depreciation, amortization and certain activities that occur outside of the ordinary course of our business. We calculate adjusted EBITDA as our net income (loss) including noncontrolling interest, adjusted for net interest (excluding floorplan interest expense), income taxes, depreciation, amortization, and items included in our non-GAAP reconciliation of earnings, for each of the respective periods. Adjusted EBITDA was $47.6 million, $72.0 million and $109.2 million for the years ended January 31, 2015, 2014 and 2013, respectively.
Key Financial Statement Components
Revenue
|
•
|
Equipment
: We derive equipment revenue from the sale of new and used agricultural and construction equipment.
|
|
•
|
Parts:
We derive parts revenue from the sale of parts for equipment that we sell, as well as for other equipment makes. Our parts sales provide us with a relatively stable revenue stream that is less sensitive to the economic cycles that affect our equipment sales.
|
|
•
|
Service:
We derive services revenue from repair and maintenance services to our customers' equipment. Our repair and maintenance services provide a high-margin, relatively stable source of revenue through changing economic cycles.
|
|
•
|
Rental and other:
We derive other revenue from equipment rentals and ancillary equipment support activities such as equipment transportation, GPS signal subscriptions and reselling finance and insurance products.
|
Cost of Revenue
|
•
|
Equipment:
Cost of equipment revenue is the lower of the acquired cost or the market value of the specific piece of equipment sold.
|
|
•
|
Parts:
Cost of parts revenue is the lower of the acquired cost or the market value of the parts sold, based on average costing.
|
34
|
•
|
Service:
Cost of service revenue represents costs attributable to services provided for the maintenance and repair of customer-owned equipment and equipment then on-rent by customers.
|
|
•
|
Rental and other:
Costs of other revenue represent costs associated with equipment rental, such as depreciation, maintenance and repairs, as well as costs associated providing transportation, hauling, parts freight, GPS subscriptions and damage waivers, including, among other items, drivers' wages, fuel costs, shipping costs and our costs related to damage waiver policies.
|
Operating Expenses
Our operating expenses include sales and marketing expenses, sales commissions (which generally are based upon equipment gross profit margins), payroll and related benefit costs, insurance expenses, professional fees, property rental and related costs, property and other taxes, administrative overhead, and depreciation associated with property and equipment (other than rental equipment).
Floorplan Interest
The cost of financing inventory is an important factor affecting our results of operations. Floorplan payable financing from CNH Industrial Capital, Wells Fargo, Agricredit and various credit facilities related to our foreign subsidiaries represent the primary sources of financing for equipment inventories. CNH Industrial regularly offers interest-free periods as well as additional incentives and special offers. As of
January 31, 2015
, approximately
25.5%
of our floorplan payable was non-interest bearing.
Other Interest Expense
Interest expense represents the interest on our outstanding debt instruments, including our Senior Convertible Notes issued in April 2012, other than floorplan payable financing facilities. Non-cash interest expense from amortization of the debt discount associated with our Senior Convertible Notes is also included in this balance.
35
Results of Operations
Comparative financial data for each of our four sources of revenue for fiscal
2015
,
2014
, and
2013
are expressed below. The results of these periods include the operating results of the acquisitions made during these periods. The period-to-period comparisons included below are not necessarily indicative of future results. Information regarding segment revenue and income (loss) before income taxes is presented for each period following our discussion of the consolidated results of operations. Additional information regarding our segments is included in Note 21 of our audited financial statements.
|
Year Ended January 31,
|
|||||||||||
|
2015
|
2014
|
2013
|
|||||||||
|
(dollars in thousands)
|
|||||||||||
|
Equipment
|
|||||||||||
|
Revenue
|
$
|
1,398,195
|
|
$
|
1,722,738
|
|
$
|
1,763,877
|
|
||
|
Cost of revenue
|
1,286,148
|
|
1,576,246
|
|
1,600,233
|
|
|||||
|
Gross profit
|
$
|
112,047
|
|
$
|
146,492
|
|
$
|
163,644
|
|
||
|
Gross profit margin
|
8.0
|
%
|
8.5
|
%
|
9.3
|
%
|
|||||
|
Parts
|
|||||||||||
|
Revenue
|
$
|
270,262
|
|
$
|
275,750
|
|
$
|
242,368
|
|
||
|
Cost of revenue
|
189,540
|
|
192,199
|
|
169,164
|
|
|||||
|
Gross profit
|
$
|
80,722
|
|
$
|
83,551
|
|
$
|
73,204
|
|
||
|
Gross profit margin
|
29.9
|
%
|
30.3
|
%
|
30.2
|
%
|
|||||
|
Service
|
|||||||||||
|
Revenue
|
$
|
147,356
|
|
$
|
149,082
|
|
$
|
127,779
|
|
||
|
Cost of revenue
|
53,924
|
|
54,608
|
|
45,748
|
|
|||||
|
Gross profit
|
$
|
93,432
|
|
$
|
94,474
|
|
$
|
82,031
|
|
||
|
Gross profit margin
|
63.4
|
%
|
63.4
|
%
|
64.2
|
%
|
|||||
|
Rental and other
|
|||||||||||
|
Revenue
|
$
|
84,433
|
|
$
|
78,876
|
|
$
|
64,396
|
|
||
|
Cost of revenue
|
62,250
|
|
55,319
|
|
43,914
|
|
|||||
|
Gross profit
|
$
|
22,183
|
|
$
|
23,557
|
|
$
|
20,482
|
|
||
|
Gross profit margin
|
26.3
|
%
|
29.9
|
%
|
31.8
|
%
|
|||||
36
The following table sets forth our statements of operations data expressed as a percentage of revenue for the periods indicated.
|
Year Ended January 31,
|
||||||||
|
2015
|
2014
|
2013
|
||||||
|
Revenue
|
||||||||
|
Equipment
|
73.6
|
%
|
77.4
|
%
|
80.3
|
%
|
||
|
Parts
|
14.2
|
%
|
12.4
|
%
|
11.0
|
%
|
||
|
Service
|
7.8
|
%
|
6.7
|
%
|
5.8
|
%
|
||
|
Rental and other
|
4.4
|
%
|
3.5
|
%
|
2.9
|
%
|
||
|
Total Revenue
|
100.0
|
%
|
100.0
|
%
|
100.0
|
%
|
||
|
Total Cost of Revenue
|
83.8
|
%
|
84.4
|
%
|
84.6
|
%
|
||
|
Gross Profit Margin
|
16.2
|
%
|
15.6
|
%
|
15.4
|
%
|
||
|
Operating Expenses
|
14.4
|
%
|
13.1
|
%
|
11.2
|
%
|
||
|
Impairment and Realignment Costs
|
1.8
|
%
|
0.4
|
%
|
—
|
%
|
||
|
Income from Operations
|
—
|
%
|
2.1
|
%
|
4.2
|
%
|
||
|
Other Income (Expense)
|
(2.0
|
)%
|
(1.3
|
)%
|
(1.0
|
)%
|
||
|
Income (Loss) Before Income Taxes
|
(2.0
|
)%
|
0.8
|
%
|
3.2
|
%
|
||
|
Provision for (Benefit from) Income Taxes
|
(0.2
|
)%
|
0.4
|
%
|
1.3
|
%
|
||
|
Net Income (Loss) Including Noncontrolling Interest
|
(1.8
|
)%
|
0.4
|
%
|
1.9
|
%
|
||
|
Less: Net Income (Loss) Attributable to Noncontrolling Interest
|
(0.1
|
)%
|
—
|
%
|
—
|
%
|
||
|
Net Income (Loss) Attributable to Titan Machinery Inc.
|
(1.7
|
)%
|
0.4
|
%
|
1.9
|
%
|
||
Fiscal Year Ended
January 31, 2015
Compared to Fiscal Year Ended
January 31, 2014
Consolidated Results
Revenue
|
Year Ended January 31,
|
Increase/
|
Percent
|
||||||||||||
|
2015
|
2014
|
(Decrease)
|
Change
|
|||||||||||
|
(dollars in thousands)
|
||||||||||||||
|
Equipment
|
$
|
1,398,195
|
|
$
|
1,722,738
|
|
$
|
(324,543
|
)
|
(18.8
|
)%
|
|||
|
Parts
|
270,262
|
|
275,750
|
|
(5,488
|
)
|
(2.0
|
)%
|
||||||
|
Service
|
147,356
|
|
149,082
|
|
(1,726
|
)
|
(1.2
|
)%
|
||||||
|
Rental and other
|
84,433
|
|
78,876
|
|
5,557
|
|
7.0
|
%
|
||||||
|
Total Revenue
|
$
|
1,900,246
|
|
$
|
2,226,446
|
|
$
|
(326,200
|
)
|
(14.7
|
)%
|
|||
The
decrease
in total revenue for fiscal
2015
, as compared to fiscal
2014
, was primarily due to
a decrease
in same-store sales of
14.1%
, mainly driven by
a decrease
in Agriculture same-store sales of
22.0%
and partially offset by
an increase
in Construction same-store sales of
14.9%
. Agriculture same-store sales decreased primarily due to a decrease in equipment revenue and were negatively impacted by challenging industry conditions such as decreases in agricultural commodity prices and projected net farm income, which have a negative effect on customer sentiment. Changes in actual or anticipated net farm income, or in any of the significant components of net farm income, generally have a direct correlation with agricultural equipment purchases by farmers. In February, August and December 2014, the U.S. Department of Agriculture published its projections of a decrease in net farm income from calendar year 2013 to 2014. The commodity price of corn and soybeans during fiscal 2015, which are the predominant crops in our Agriculture store footprint, decreased significantly from prices during fiscal 2014, mainly as a result of increases in U.S. corn and soybean supplies compared to the prior year. The increase in Construction segment revenue, which included increases in all lines of the Construction segment's business, resulted from improved industry conditions and the positive impact of operational initiatives.
37
Gross Profit
|
Year Ended January 31,
|
Increase/
|
Percent
|
||||||||||||
|
2015
|
|
2014
|
(Decrease)
|
Change
|
||||||||||
|
(dollars in thousands)
|
||||||||||||||
|
Gross Profit
|
||||||||||||||
|
Equipment
|
$
|
112,047
|
|
$
|
146,492
|
|
$
|
(34,445
|
)
|
(23.5
|
)%
|
|||
|
Parts
|
80,722
|
|
83,551
|
|
(2,829
|
)
|
(3.4
|
)%
|
||||||
|
Service
|
93,432
|
|
94,474
|
|
(1,042
|
)
|
(1.1
|
)%
|
||||||
|
Rental and other
|
22,183
|
|
23,557
|
|
(1,374
|
)
|
(5.8
|
)%
|
||||||
|
Total Gross Profit
|
$
|
308,384
|
|
$
|
348,074
|
|
$
|
(39,690
|
)
|
(11.4
|
)%
|
|||
|
Gross Profit Margin
|
||||||||||||||
|
Equipment
|
8.0
|
%
|
8.5
|
%
|
(0.5
|
)%
|
(5.9
|
)%
|
||||||
|
Parts
|
29.9
|
%
|
30.3
|
%
|
(0.4
|
)%
|
(1.3
|
)%
|
||||||
|
Service
|
63.4
|
%
|
63.4
|
%
|
—
|
%
|
—
|
%
|
||||||
|
Rental and other
|
26.3
|
%
|
29.9
|
%
|
(3.6
|
)%
|
(12.0
|
)%
|
||||||
|
Total Gross Profit Margin
|
16.2
|
%
|
15.6
|
%
|
0.6
|
%
|
3.8
|
%
|
||||||
|
Gross Profit Mix
|
||||||||||||||
|
Equipment
|
36.3
|
%
|
42.1
|
%
|
(5.8
|
)%
|
(13.8
|
)%
|
||||||
|
Parts
|
26.2
|
%
|
24.0
|
%
|
2.2
|
%
|
9.2
|
%
|
||||||
|
Service
|
30.3
|
%
|
27.1
|
%
|
3.2
|
%
|
11.8
|
%
|
||||||
|
Rental and other
|
7.2
|
%
|
6.8
|
%
|
0.4
|
%
|
5.9
|
%
|
||||||
|
Total Gross Profit Mix
|
100.0
|
%
|
100.0
|
%
|
—
|
%
|
—
|
%
|
||||||
The
decrease
in total gross profit for fiscal
2015
, as compared to fiscal
2014
, was primarily due to lower equipment revenue and equipment gross profit margin. The
increase
in total gross profit margin from
15.6%
in fiscal
2014
to
16.2%
in fiscal
2015
was due to the change in gross profit mix to our higher-margin parts, service and rental and other businesses, and partially offset by the decrease in gross profit margin on equipment. The compression in equipment gross profit margin was primarily caused by the previously discussed Agriculture industry challenges as well as an oversupply of equipment in the Agriculture industry. The decrease in rental and other gross profit margin was reflective of the decrease in dollar utilization of our rental fleet, from
30.3%
in fiscal 2014 to
27.7%
in fiscal 2015, which was primarily caused by the lower oil prices affecting rental demand in our oil producing markets as well as lost rental revenue due to the repositioning of rental equipment from the seven Construction stores closed in the first quarter of fiscal 2015 to other Construction stores. Our company-wide absorption rate remained relatively consistent at
70.7%
and
71.2%
for fiscal
2015
and
2014
, respectively. We expect our absorption rate to improve in fiscal 2016 due to reductions in our Fixed Operating Expenses from cost savings associated with the realignment plan approved in the first quarter of fiscal 2016 and lower floorplan interest expense as a result of reductions in equipment inventory balances in fiscal 2016, as compared to fiscal 2015.
Operating Expenses
|
Year Ended January 31,
|
Increase/
|
Percent
|
||||||||||||
|
2015
|
2014
|
(Decrease)
|
Change
|
|||||||||||
|
(dollars in thousands)
|
||||||||||||||
|
Operating Expenses
|
$
|
273,271
|
|
$
|
291,202
|
|
$
|
(17,931
|
)
|
(6.2
|
)%
|
|||
|
Operating Expenses as a Percentage of Revenue
|
14.4
|
%
|
13.1
|
%
|
1.3
|
%
|
9.9
|
%
|
||||||
The
decrease
in operating expenses was primarily due to decreased commission expense resulting from the decrease in equipment gross profit, and cost savings associated with our realignment activities in the first quarter of fiscal 2015, which included the closing of eight stores and other headcount reductions. These decreases in operating expenses were partially offset by additional costs associated with expanding our International distribution network. The increase in operating expenses as a percentage of total revenue was primarily due to the decrease in equipment revenue in fiscal 2015, as compared to fiscal 2014, which negatively affected our ability to leverage our fixed operating costs.
38
Impairment and Realignment Costs
|
Year Ended January 31,
|
|
Percent
|
||||||||||||
|
2015
|
2014
|
Increase
|
Change
|
|||||||||||
|
(dollars in thousands)
|
||||||||||||||
|
Impairment and Realignment Costs
|
$
|
34,390
|
|
$
|
9,997
|
|
$
|
24,393
|
|
244.0
|
%
|
|||
During our annual impairment tests in the fourth quarter of fiscal 2015, we determined that certain goodwill, other intangible assets and long-lived assets were impaired, primarily in our Agriculture segment, resulting in
$31.2 million
impairment expense recognized in fiscal 2015, as compared to impairment costs totaling
$9.7 million
recognized in fiscal 2014 related to certain goodwill, other intangible assets and long-lived assets in our Construction and International segments. The Company also recognized realignment costs in fiscal 2015 related to the the closing of seven underperforming Construction stores, staff reductions at other dealerships and reductions in support staff at the Company's Shared Resource Center that took place in April 2014. There were no such realignment plans implemented in fiscal 2014. See the Non-GAAP Financial Measures section below for impact of these costs on non-GAAP Diluted EPS.
Other Income (Expense)
|
Year Ended January 31,
|
Increase/
|
Percent
|
||||||||||||
|
2015
|
2014
|
(Decrease)
|
Change
|
|||||||||||
|
(dollars in thousands)
|
||||||||||||||
|
Interest income and other income (expense)
|
$
|
(4,272
|
)
|
$
|
2,109
|
|
$
|
(6,381
|
)
|
(302.6
|
)%
|
|||
|
Floorplan interest expense
|
(20,477
|
)
|
(16,764
|
)
|
3,713
|
|
22.1
|
%
|
||||||
|
Other interest expense
|
(14,314
|
)
|
(13,791
|
)
|
523
|
|
3.8
|
%
|
||||||
The decrease in interest income and other income (expense) was primarily due to foreign currency remeasurement losses in Ukraine, resulting from a devaluation of the Ukrainian hryvnia in fiscal 2015. See the Non-GAAP Financial Measures section below for the impact of these costs on non-GAAP Diluted EPS. The
increase
in floorplan interest expense of
$3.7 million
was primarily due to the increase in average levels of interest-bearing floorplan payable balances.
Provision for (Benefit from) Income Taxes
|
Year Ended January 31,
|
|
Percent
|
||||||||||||
|
2015
|
2014
|
Decrease
|
Change
|
|||||||||||
|
(dollars in thousands)
|
||||||||||||||
|
Provision for (Benefit from) Income Taxes
|
$
|
(4,923
|
)
|
$
|
10,325
|
|
$
|
(15,248
|
)
|
(147.7
|
)%
|
|||
Our effective tax rate changed from
56.0%
in fiscal
2014
to
(12.8)%
in fiscal
2015
, primarily due to losses in both U.S. and foreign jurisdictions. The Company also recorded valuation allowances of
$5.6 million
and
$1.9 million
in fiscal 2015 and 2014, respectively, on deferred tax assets, including net operating loss carryforwards, in the foreign jurisdictions which have historical losses. See Note 13 to our consolidated financial statements for further details on our effective tax rate.
39
Segment Results
|
Year Ended January 31,
|
Increase/
|
Percent
|
||||||||||||
|
2015
|
2014
|
(Decrease)
|
Change
|
|||||||||||
|
(dollars in thousands)
|
||||||||||||||
|
Revenue
|
||||||||||||||
|
Agriculture
|
$
|
1,372,716
|
|
$
|
1,765,821
|
|
$
|
(393,105
|
)
|
(22.3
|
)%
|
|||
|
Construction
|
434,639
|
|
405,822
|
|
28,817
|
|
7.1
|
%
|
||||||
|
International
|
166,379
|
|
145,884
|
|
20,495
|
|
14.0
|
%
|
||||||
|
Segment revenue
|
1,973,734
|
|
2,317,527
|
|
(343,793
|
)
|
(14.8
|
)%
|
||||||
|
Eliminations
|
(73,488
|
)
|
(91,081
|
)
|
17,593
|
|
19.3
|
%
|
||||||
|
Total
|
$
|
1,900,246
|
|
$
|
2,226,446
|
|
$
|
(326,200
|
)
|
(14.7
|
)%
|
|||
|
Income (Loss) Before Income Taxes
|
||||||||||||||
|
Agriculture
|
$
|
(13,429
|
)
|
$
|
59,574
|
|
$
|
(73,003
|
)
|
(122.5
|
)%
|
|||
|
Construction
|
(10,770
|
)
|
(28,083
|
)
|
17,313
|
|
61.6
|
%
|
||||||
|
International
|
(17,248
|
)
|
(5,544
|
)
|
(11,704
|
)
|
(211.1
|
)%
|
||||||
|
Segment income (loss) before income taxes
|
(41,447
|
)
|
25,947
|
|
(67,394
|
)
|
(259.7
|
)%
|
||||||
|
Shared Resources
|
2,144
|
|
(6,650
|
)
|
8,794
|
|
132.2
|
%
|
||||||
|
Eliminations
|
963
|
|
(868
|
)
|
1,831
|
|
210.9
|
%
|
||||||
|
Income (Loss) Before Income Taxes
|
$
|
(38,340
|
)
|
$
|
18,429
|
|
$
|
(56,769
|
)
|
(308.0
|
)%
|
|||
Agriculture
Agriculture segment revenue for fiscal
2015
decreased
22.3%
compared to the same period last year. The revenue decrease was due to
a decrease
in Agriculture same-store sales of
22.0%
as compared to fiscal
2014
. Agriculture same-store sales decreased primarily due to a decrease in equipment revenue and were negatively impacted by challenging industry conditions such as decreases in agricultural commodity prices and projected net farm income, which have a negative effect on customer sentiment. Changes in actual or anticipated net farm income, or in any of the significant components of net farm income, generally have a direct correlation with agricultural equipment purchases by farmers. In February, August and December 2014, the U.S. Department of Agriculture published its projections of a decrease in net farm income from calendar year 2013 to 2014. The commodity price of corn and soybeans during fiscal 2015, which are the predominant crops in our Agriculture store footprint, decreased significantly from the price during fiscal 2014, mainly as a result of a projected increase in U.S. corn and soybean supply compared to the prior year.
Agriculture segment income before income taxes for fiscal
2015
decreased
122.5%
compared to the same period last year, primarily due to the aforementioned decrease in equipment revenue, a decrease in equipment gross profit margin, the aforementioned impairment charges of
$30.0 million
, and partially offset by a decrease in operating expenses. The compression in equipment gross profit margin was primarily caused by the previously discussed Agriculture industry challenges as well as an oversupply of equipment in the Agriculture industry. The decrease in operating expenses was primarily due to lower commissions expense resulting from the decrease in equipment gross profit.
Construction
Construction segment revenue for fiscal
2015
increased
7.1%
compared to the same period last year, primarily due to
an increase
in Construction same-store sales of
14.9%
over fiscal
2014
. The increase in Construction segment revenue, which included increases in all lines of business, resulted from improved industry conditions and the positive impact of operational initiatives.
Our Construction segment loss before income taxes was
$10.8 million
for fiscal
2015
compared to segment loss before income taxes of
$28.1 million
for fiscal
2014
. This improvement was primarily due to the increase in revenue, decreases in operating expenses and impairment costs, and partially offset by realignment costs. Realignment costs totaling
$2.6 million
were recognized during fiscal 2015 related to the headcount reductions and closing of seven Construction stores, which was discussed above. The decrease in operating expenses resulted from the cost savings associated with closing these stores. The dollar utilization of our rental fleet decreased, from
30.3%
in fiscal
2014
to
27.7%
in fiscal
2015
, primarily due to lower oil
40
prices affecting rental demand in our oil producing markets as well as lost rental revenue due to the repositioning of rental equipment from the seven Construction stores closed in the first quarter of fiscal 2015 to other Construction stores.
International
International segment revenue for fiscal
2015
increased
$20.5 million
compared to the same period last year, primarily due to acquisitions and new store openings, and an increase in same-store sales.
Our International segment loss before income taxes was
$17.2 million
for fiscal
2015
compared to segment loss before income taxes of
$5.5 million
for the same period last year. This increased loss was primarily due to increases in operating expenses and floorplan interest expense, and a decrease in interest income and other income (expense), as compared to the same period of the prior year. Operating expenses increased due to expanding our distribution network in Eastern Europe, including opening a new store in Ukraine and establishing a European operations center to support our European stores. We believe the political and economic instability in Ukraine has had a negative impact on our revenue, which reduces our ability to leverage these fixed operating costs. The increase in floorplan interest expense for fiscal 2015, as compared to the same period in the prior year, was primarily due to the increase in floorplan payable and the related equipment inventory balances, and higher interest rates in Ukraine associated with the political and economic instability that is present in the current fiscal year. The decrease in interest income and other income (expense) was primarily due to foreign currency remeasurement losses in Ukraine, resulting from a devaluation of the Ukrainian hryvnia in fiscal 2015.
Shared Resources/Eliminations
We incur centralized expenses/income at our general corporate level, which we refer to as "Shared Resources," and then allocate these net expenses to our segments. Since these allocations are set early in the year, unallocated or over-allocated balances may occur.
Eliminations remove any inter-company revenues or income before income taxes residing in our segment results.
Fiscal Year Ended
January 31, 2014
Compared to Fiscal Year Ended
January 31, 2013
Consolidated Results
Revenue
|
Year Ended January 31,
|
Increase/
|
Percent
|
||||||||||||
|
2014
|
2013
|
(Decrease)
|
Change
|
|||||||||||
|
(dollars in thousands)
|
||||||||||||||
|
Equipment
|
$
|
1,722,738
|
|
$
|
1,763,877
|
|
$
|
(41,139
|
)
|
(2.3
|
)%
|
|||
|
Parts
|
275,750
|
|
242,368
|
|
33,382
|
|
13.8
|
%
|
||||||
|
Service
|
149,082
|
|
127,779
|
|
21,303
|
|
16.7
|
%
|
||||||
|
Rental and other
|
78,876
|
|
64,396
|
|
14,480
|
|
22.5
|
%
|
||||||
|
Total Revenue
|
$
|
2,226,446
|
|
$
|
2,198,420
|
|
$
|
28,026
|
|
1.3
|
%
|
|||
The increase in total revenue for fiscal 2014, as compared to fiscal 2013, was primarily due to acquisitions contributing $157.9 million, offset by a decrease in same-store sales of $129.9 million. This decrease in same-store sales reflected a 6.2% decrease over the prior year and was driven by a decrease in equipment revenue. The decrease in equipment revenue was mainly caused by challenging industry conditions such as decreases in agricultural commodity prices, increased agriculture equipment prices, and continued difficult conditions in the construction industry, which are discussed in more detail in the Segment Reporting section below. Our Agriculture and Construction segments had lower same-store sales in fiscal 2014 compared to fiscal 2013, primarily driven by challenging industry conditions in each of these segments, while our International segment had growth in same-store sales over the comparable period of the prior year.
41
Gross Profit
|
Year Ended January 31,
|
Increase/
|
Percent
|
||||||||||||
|
2014
|
2013
|
(Decrease)
|
Change
|
|||||||||||
|
(dollars in thousands)
|
||||||||||||||
|
Gross Profit
|
||||||||||||||
|
Equipment
|
$
|
146,492
|
|
$
|
163,644
|
|
$
|
(17,152
|
)
|
(10.5
|
)%
|
|||
|
Parts
|
83,551
|
|
73,204
|
|
10,347
|
|
14.1
|
%
|
||||||
|
Service
|
94,474
|
|
82,031
|
|
12,443
|
|
15.2
|
%
|
||||||
|
Rental and other
|
23,557
|
|
20,482
|
|
3,075
|
|
15.0
|
%
|
||||||
|
Total Gross Profit
|
$
|
348,074
|
|
$
|
339,361
|
|
$
|
8,713
|
|
2.6
|
%
|
|||
|
Gross Profit Margin
|
||||||||||||||
|
Equipment
|
8.5
|
%
|
9.3
|
%
|
(0.8
|
)%
|
(8.6
|
)%
|
||||||
|
Parts
|
30.3
|
%
|
30.2
|
%
|
0.1
|
%
|
0.3
|
%
|
||||||
|
Service
|
63.4
|
%
|
64.2
|
%
|
(0.8
|
)%
|
(1.2
|
)%
|
||||||
|
Rental and other
|
29.9
|
%
|
31.8
|
%
|
(1.9
|
)%
|
(6.0
|
)%
|
||||||
|
Total Gross Profit Margin
|
15.6
|
%
|
15.4
|
%
|
0.2
|
%
|
1.3
|
%
|
||||||
|
Gross Profit Mix
|
||||||||||||||
|
Equipment
|
42.1
|
%
|
48.2
|
%
|
(6.1
|
)%
|
(12.7
|
)%
|
||||||
|
Parts
|
24.0
|
%
|
21.6
|
%
|
2.4
|
%
|
11.1
|
%
|
||||||
|
Service
|
27.1
|
%
|
24.2
|
%
|
2.9
|
%
|
12.0
|
%
|
||||||
|
Rental and other
|
6.8
|
%
|
6.0
|
%
|
0.8
|
%
|
13.3
|
%
|
||||||
|
Total Gross Profit Mix
|
100.0
|
%
|
100.0
|
%
|
—
|
%
|
—
|
%
|
||||||
The increase in total gross profit for fiscal 2014, as compared to fiscal 2013, was primarily due to an increase in parts, service and rental and other revenue, and offset mainly by a decrease in gross profit margin on equipment. Acquisitions contributed $22.6 million of the increase in total gross profit, which was offset by a decrease in same-store sale gross profit of $13.9 million. The increase in total gross profit margin from 15.4% in fiscal 2013 to 15.6% in fiscal 2014 was due to the change in gross profit mix to our higher-margin parts and service businesses, and mainly offset by the decrease in gross profit margin on equipment. The decrease in equipment gross profit margin was negatively impacted by the challenging industry conditions such as decreases in commodity prices and increased equipment prices in the agriculture industry, and continued difficult conditions and oversupply of equipment inventory in the construction industry, which factors forced a reduction in equipment prices. These factors are discussed in more detail in the Segment Reporting section below. Our company-wide absorption rate decreased from
77.3%
in fiscal
2014
to
71.2%
in fiscal
2013
primarily due to the increase in our Fixed Operating Expenses associated with our Construction acquisition stores and expanded Construction and International distribution network, as discussed in the Operating Expenses section below.
Operating Expenses
|
Year Ended January 31,
|
|
Percent
|
||||||||||||
|
2014
|
2013
|
Increase
|
Change
|
|||||||||||
|
(dollars in thousands)
|
||||||||||||||
|
Operating Expenses
|
$
|
291,202
|
|
$
|
247,557
|
|
$
|
43,645
|
|
17.6
|
%
|
|||
|
Operating Expenses as a Percentage of Revenue
|
13.1
|
%
|
11.2
|
%
|
1.9
|
%
|
17.0
|
%
|
||||||
The increase in operating expenses was primarily due to the additional costs associated with acquisitions and expanding our distribution network, such as compensation, rent, travel and depreciation. As a percentage of total revenue, operating expenses increased to 13.1% in fiscal 2014 compared to 11.2% in fiscal 2013. The increase in operating expenses as a percentage of revenue was caused by the decrease in same-store sales, which negatively affected our ability to leverage fixed operating costs, the Construction stores acquired in fiscal year 2013 and the first quarter of fiscal 2014, and other ongoing costs of building an expanded Construction and International distribution network in these two segments. Most of the recently acquired Construction stores are currently operating at a higher operating expense ratio than our average Construction store, as they are underperforming in regards to revenue levels in the markets in which they are located.
42
Impairment & Realignment Costs
|
Year Ended January 31,
|
|
Percent
|
||||||||||||
|
2014
|
2013
|
Increase
|
Change
|
|||||||||||
|
(dollars in thousands)
|
||||||||||||||
|
Impairment & Realignment Costs
|
$
|
9,997
|
|
$
|
—
|
|
$
|
9,997
|
|
100.0
|
%
|
|||
During our annual impairment tests in the fourth quarter of fiscal 2014, we determined that certain goodwill, other intangible assets and long-lived assets were impaired in our Construction and International segments, resulting in
$9.7 million
impairment expense recognized in fiscal 2014. No such impairment was recognized in fiscal 2013.
Other Income (Expense)
|
Year Ended January 31,
|
|
Percent
|
||||||||||||
|
2014
|
2013
|
Increase
|
Change
|
|||||||||||
|
(dollars in thousands)
|
||||||||||||||
|
Interest income and other income (expense)
|
$
|
2,109
|
|
$
|
1,654
|
|
$
|
455
|
|
27.5
|
%
|
|||
|
Floorplan interest expense
|
(16,764
|
)
|
(13,297
|
)
|
3,467
|
|
26.1
|
%
|
||||||
|
Other interest expense
|
(13,791
|
)
|
(9,465
|
)
|
4,326
|
|
45.7
|
%
|
||||||
The increase in floorplan interest expense of $3.5 million was due to the increase in floorplan payable balances associated with higher equipment inventory levels in fiscal 2014, as compared to fiscal 2013. The increase in other interest expense of $4.3 million, as compared to the prior year, was primarily due to an increase in long-term debt associated with our rental fleet and our Senior Convertible Notes issued in April 2012.
Provision for Income Taxes
|
Year Ended January 31,
|
|
Percent
|
||||||||||||
|
2014
|
2013
|
Decrease
|
Change
|
|||||||||||
|
(dollars in thousands)
|
||||||||||||||
|
Provision for Income Taxes
|
$
|
10,325
|
|
$
|
28,137
|
|
$
|
(17,812
|
)
|
(63.3
|
)%
|
|||
Our effective tax rate increased from 39.8% in fiscal 2013 to 56.0% in fiscal 2014, primarily due to losses in certain of our International entities with lower statutory tax rates than in the U.S., and recording valuation allowances of $1.9 million on deferred tax assets, including net operating loss carryforwards, in the foreign jurisdictions which have historical losses.
43
Segment Results
|
Year Ended January 31,
|
Increase/
|
Percent
|
||||||||||||
|
2014
|
2013
|
(Decrease)
|
Change
|
|||||||||||
|
(dollars in thousands)
|
||||||||||||||
|
Revenue
|
||||||||||||||
|
Agriculture
|
$
|
1,765,821
|
|
$
|
1,827,023
|
|
$
|
(61,202
|
)
|
(3.3
|
)%
|
|||
|
Construction
|
405,822
|
|
380,295
|
|
25,527
|
|
6.7
|
%
|
||||||
|
International
|
145,884
|
|
72,510
|
|
73,374
|
|
101.2
|
%
|
||||||
|
Segment revenue
|
2,317,527
|
|
2,279,828
|
|
37,699
|
|
1.7
|
%
|
||||||
|
Eliminations
|
(91,081
|
)
|
(81,408
|
)
|
(9,673
|
)
|
(11.9
|
)%
|
||||||
|
Total
|
$
|
2,226,446
|
|
$
|
2,198,420
|
|
$
|
28,026
|
|
1.3
|
%
|
|||
|
Income (Loss) Before Income Taxes
|
||||||||||||||
|
Agriculture
|
$
|
59,574
|
|
$
|
83,256
|
|
$
|
(23,682
|
)
|
(28.4
|
)%
|
|||
|
Construction
|
(28,083
|
)
|
(4,708
|
)
|
(23,375
|
)
|
(496.5
|
)%
|
||||||
|
International
|
(5,544
|
)
|
541
|
|
(6,085
|
)
|
(1,124.8
|
)%
|
||||||
|
Segment income (loss) before income taxes
|
25,947
|
|
79,089
|
|
(53,142
|
)
|
(67.2
|
)%
|
||||||
|
Shared Resources
|
(6,650
|
)
|
(6,902
|
)
|
252
|
|
3.7
|
%
|
||||||
|
Eliminations
|
(868
|
)
|
(1,491
|
)
|
623
|
|
41.8
|
%
|
||||||
|
Income (Loss) Before Income Taxes
|
$
|
18,429
|
|
$
|
70,696
|
|
$
|
(52,267
|
)
|
(73.9
|
)%
|
|||
Agriculture
Agriculture segment revenue for fiscal 2014 decreased 3.3% compared to fiscal 2013. The revenue decrease was due to a decrease in Agriculture same-store sales of 7.1% as compared to fiscal 2013, which primarily resulted from the following factors which negatively impacted customer sentiment in fiscal 2014 as compared to fiscal 2013: challenging agriculture conditions such as decreases in agricultural commodity prices, lower crop yields in the areas in which the Company operates relative to crop yields in other parts of the United States, and increased equipment retail prices. The commodity price of corn, which is the predominant crop in our Agriculture store footprint, decreased significantly from the price during the previous period, mainly as a result of an increase in U.S. corn supply compared to last year. Prices of late-model agriculture equipment with Tier 4A engine emission technology increased in advance of the introduction of equipment with Tier 4B technology. These price increases from our suppliers have been difficult to pass on to our customers as decreased emissions are a lower value proposition to our customers than other equipment improvement price increases, such as increased horsepower or increased fuel efficiency. Higher pricing without perceived additional value puts pressure on our equipment sales and price realization, which also compresses our equipment gross profit margin.
Agriculture segment income before income taxes for fiscal 2014 decreased 28.4% compared to fiscal 2013, primarily due to a decrease in gross profit margin on equipment, an increase in operating expenses and an increase in floorplan interest expense. The gross profit margin on equipment was negatively impacted by the previously discussed industry conditions and pressure on used equipment values. The increase in operating expense as a percentage of revenue was caused by the decrease in Agriculture segment same-store sales, which negatively affected our ability to leverage our fixed operating costs. The increase in floorplan interest expense is primarily due to higher floorplan payable balances than in the same period last year, which resulted from higher equipment inventory levels in fiscal 2014, as compared to fiscal 2013.
Construction
Construction segment revenue for fiscal 2014 increased 6.7% compared to fiscal 2013. The revenue increase was due to acquisitions, offset by a Construction same-store sales decrease of 3.9% over fiscal 2013. The decrease in same-store sales was primarily caused by continued difficult Construction industry conditions, primarily as a result of decreased retail demand combined with an over-supply of equipment inventory throughout the industry and in our footprint. The over-supply in a soft retail environment causes much competition within the retail business and also compresses equipment gross profit margins.
Our Construction segment loss before income taxes was $28.1 million for fiscal 2014 compared to segment loss before income taxes of $4.7 million for fiscal 2013. The increased loss was primarily due to impairment charges, lower gross profit on equipment, an increase in operating expenses, and an increase in floorplan interest expense and other interest expense,
44
as compared to the same period in the prior year. Impairment charges of $8.2 million were recognized in fiscal 2014, primarily related to the impairment of the entire goodwill balance, certain distribution rights and certain long-lived assigned to the Construction segment. Our equipment gross profit margin was compressed due to the previously discussed challenging industry conditions. The increase in operating expense as a percentage of revenue was caused by the decrease in segment same-store sales, which negatively affected our ability to leverage our fixed operating costs, our recently acquired Construction stores and other ongoing costs of building an expanded distribution network. The Construction stores acquired in fiscal 2013 and the first quarter of fiscal 2014 are currently operating at a higher operating expense ratio than our average Construction store, as they are underperforming in regards to revenue levels in the markets in which they are located. The increase in floorplan and other interest expense resulted from higher floorplan payable and long-term debt associated with our rental fleet, respectively, as compared to the same period in the prior year. The dollar utilization of our rental fleet decreased to 30.3% in fiscal 2014, from 31.5% in fiscal 2013.
International
International segment revenue for fiscal 2014 increased $73.4 million compared to the same period last year, primarily due to acquisitions and new store openings, and a same-store sale increase of 17.5%.
Our International segment loss before income taxes was $5.5 million for fiscal 2014 compared to segment income before income taxes of $0.5 million for the same period last year. This decrease was primarily due to impairment charges, a decrease in gross profit margins on equipment and increases in operating expenses and floorplan interest expense. Impairment charges of $1.8 million were recognized in fiscal 2014, related to the impairment of the goodwill balance and distribution rights of one of our International entities. Equipment gross profit margin was negatively impacted by decreases in agricultural commodity prices, which negatively impacted customer sentiment and profitability in fiscal 2014 as compared to the prior year. The increases in operating expenses and floorplan interest expense, primarily reflect costs of building our recently expanded footprint in Eastern Europe, including establishment of an regional operations center to support our European stores.
Shared Resources/Eliminations
We incur centralized expenses/income at our general corporate level, which we refer to as "Shared Resources," and then allocate these net expenses to our segments. Since these allocations are set early in the year, unallocated or over-allocated balances may occur.
Eliminations remove any inter-company revenues or income before income taxes residing in our segment results.
Non-GAAP Financial Measures
To supplement our earnings (loss) per share - diluted ("Diluted EPS") presented on a GAAP basis, we use non-GAAP Diluted EPS, which excludes the impact of impairment costs, our realignment/store closing costs, foreign currency remeasurement losses in Ukraine and income tax valuation allowances, resulting from a devaluation of the Ukrainian hryvnia. We believe that the presentation of non-GAAP Diluted EPS is relevant and useful to our management and investors because it provides a measurement of earnings on activities we consider to occur in the ordinary course of our business. Non-GAAP Diluted EPS should be evaluated in addition to, and not considered a substitute for, or superior to, the GAAP measure of Diluted EPS. In addition, other companies may calculate non-GAAP Diluted EPS in a different manner, which may hinder comparability with other companies.
45
The following table reconciles Diluted EPS, a GAAP measure, to non-GAAP Diluted EPS:
|
Year Ended January 31,
|
|||||||||||
|
2015
|
2014
|
2013
|
|||||||||
|
(dollars in thousands, except per share data)
|
|||||||||||
|
Net Income (Loss) Attributable to Titan Machinery Inc. Common Stockholders
|
|||||||||||
|
Net Income (Loss) Attributable to Titan Machinery Inc. Common Stockholders
|
$
|
(31,598
|
)
|
$
|
8,722
|
|
$
|
42,473
|
|
||
|
Non-GAAP Adjustments
|
|||||||||||
|
Impairment (1)
|
21,614
|
|
6,091
|
|
—
|
|
|||||
|
Realignment / Store Closing Costs (2)
|
2,152
|
|
—
|
|
—
|
|
|||||
|
Ukraine Remeasurement (3)
|
5,653
|
|
—
|
|
—
|
|
|||||
|
Income Tax Valuation Adjustments (4)
|
306
|
|
1,701
|
|
—
|
|
|||||
|
Adjusted Net Income (Loss) Attributable to Titan Machinery Inc. Common Stockholders
|
$
|
(1,873
|
)
|
$
|
16,514
|
|
$
|
42,473
|
|
||
|
Earnings (Loss) per Share - Diluted
|
|||||||||||
|
Earnings (Loss) per Share - Diluted
|
$
|
(1.51
|
)
|
$
|
0.41
|
|
$
|
2.00
|
|
||
|
Non-GAAP Adjustments
|
|||||||||||
|
Impact of Impairment (1)
|
1.03
|
|
0.29
|
|
—
|
|
|||||
|
Impact of Store Closing Costs (2)
|
0.10
|
|
—
|
|
—
|
|
|||||
|
Impact of Ukraine Remeasurement (3)
|
0.27
|
|
—
|
|
—
|
|
|||||
|
Impact of Income Tax Valuation Adjustments (4)
|
0.02
|
|
0.08
|
|
—
|
|
|||||
|
Adjusted Earnings (Loss) per Share - Diluted
|
$
|
(0.09
|
)
|
$
|
0.78
|
|
$
|
2.00
|
|
||
|
(1)
|
See Notes 1 and 5 of the notes to our consolidated financial statements for details of this matter.
|
|
(2)
|
See Note 19 of the notes to our consolidated financial statements for details of this matter.
|
|
(3)
|
See the Foreign Currency Remeasurement Losses section of Management's Discussion and Analysis of Financial Condition and Results of Operations for details of this matter.
|
|
(4)
|
Amount reflects the initial valuation allowance recognized for all deferred tax assets for which no previous valuation allowance existed.
|
Liquidity and Capital Resources
Sources of Liquidity
Our primary sources of liquidity are cash reserves, cash from operations, and borrowings under our floorplan payable and other credit facilities. We expect these sources of liquidity to be sufficient to fund our working capital requirements, acquisitions, capital expenditures and other investments in our business, service our debt, pay our tax obligations and lease and other commitments and contingencies, and meet any seasonal operating requirements for the foreseeable future, provided, however, that our borrowing capacity under our credit agreements is dependent on compliance with various financial covenants as further described in the "Risk Factors" section of this Form 10-K. We have worked in the past, and will continue to work in the future, with our lenders to implement satisfactory modifications to certain financial covenants as appropriate for the business conditions confronted by us.
The non-U.S. subsidiaries for which we have elected to permanently reinvest earnings outside of the U.S. held
$9.7 million
and
$4.9 million
of cash as of
January 31, 2015
and
2014
, respectively. Our current plans do not demonstrate a need to, nor do we have plans to, repatriate the retained earnings from these subsidiaries, as the earnings are permanently reinvested. However, if we determine, in the future, that it is necessary to repatriate these funds or we sell or liquidate any of these subsidiaries, we may be required to pay taxes associated with the repatriation or the sale or liquidation of these subsidiaries. We may also be required to accrue and pay withholding taxes, depending on the foreign jurisdiction from which the funds are repatriated.
46
Equipment Inventory and Floorplan Payable Credit Facilities
Floorplan payable balances reflect the amount owed for new equipment inventory purchased from a manufacturer and used equipment inventory, which is primarily purchased through trade-in on equipment sales. Certain of the manufacturers from which we purchase new equipment inventory offer financing on these purchases, either offered directly from the manufacturer or through the manufacturers’ captive finance subsidiaries. CNH Industrial's captive finance subsidiaries, CNH Industrial Capital, also provides financing of used equipment inventory. We also have floorplan payable balances with non-manufacturer lenders for new and used equipment inventory. Changes in manufacturer floorplan payable are reported as operating cash flows and changes in non-manufacturer floorplan payable are reported as financing cash flows in the Company's consolidated statements of cash flows.
As of
January 31, 2015
, the Company had discretionary floorplan payable lines of credit for equipment purchases totaling approximately
$1.2 billion
, which includes a
$350.0 million
Floorplan Payable Line with Wells Fargo, a
$450.0 million
credit facility with CNH Industrial Capital, a
$225.0 million
credit facility with Agricredit and the U.S. dollar equivalent of
$133.0 million
in credit facilities related to our foreign subsidiaries. Floorplan payable relating to these credit facilities totaled approximately
$594.1 million
of the total floorplan payable balance of
$627.2 million
outstanding as of
January 31, 2015
and
$692.8 million
of the total floorplan payable balance of
$750.5 million
outstanding as of
January 31, 2014
. Available borrowings under these lines of credit are reduced by amounts outstanding, borrowing base calculations and standby letters of credit under the Wells Fargo credit agreement, and certain acquisition-related financing arrangements under the CNH Industrial Capital credit facility. We are in compliance with all financial covenants under our credit agreements, as amended and effective as of
January 31, 2015
. The Wells Fargo and Agricredit credit facilities were amended effective April 2015, which reduced the available borrowings to
$275.0 million
and
$200.0 million
, respectively. As a result of these amendments, and without adjusting the U.S. dollar amount of the Company's credit facilities related to its foreign subsidiaries based on current foreign currency exchange rates, the Company's total discretionary floorplan payable lines of credit for equipment purchases was reduced to approximately
$1.1 billion
as of April 2015. Additional details of each of these credit facilities is disclosed in Note 6 to our consolidated financial statements included in this annual report.
Our equipment inventory turnover was
1.4
for fiscal
2015
compared to
1.6
for fiscal
2014
. While our equipment inventories, including amounts classified as held for sale, decreased
18.0%
from fiscal 2014 to 2015, the decrease in turnover was primarily due to lower equipment sales in fiscal 2015. We expect our equipment inventory balances to decrease in fiscal 2016. Our equity in equipment inventory, which reflects the portion of our equipment inventory balance that is not financed by floorplan payables, remained relatively consistent at
81.3%
and
79.9%
as of
January 31, 2015
and
2014
, respectively.
Long-Term Debt Facilities
The Working Capital Line is used to finance our working capital requirements and fund certain capital expenditures. As of
January 31, 2015
we had
$18.7 million
outstanding on the Working Capital Line. We also finance a portion our rental fleet and other property and equipment purchases with long-term debt agreements with various lenders.
Adequacy of Capital Resources
Our primary uses of cash have been to fund our strategic acquisitions, finance the purchase of inventory, meet debt service requirements and fund operating activities, provide working capital, make payments due under building space operating leases and manufacturer floorplan payable. The primary factors affecting our ability to generate cash and to meet existing, known or reasonably likely cash requirements are the timing and extent of acquisitions and our operating performance as impacted by (i) industry factors, (ii) competition, (iii) general economic conditions and (iv) other business factors as identified in Item 1A "Risk Factors."
In fiscal
2015
, we used
$0.8 million
in cash for rental fleet purchases,
$16.2 million
in cash for property and equipment purchases, and financed
$3.8 million
in property and equipment purchases with long-term debt, accounts payable and accrued liabilities. The fixed asset additions primarily related to store construction projects and development of our ERP system. In fiscal
2014
, we used
$0.8 million
in cash for rental fleet purchases,
$18.2 million
in cash for property and equipment purchases, and financed
$22.2 million
in property and equipment purchases with long-term debt, accounts payable and accrued liabilities. The fixed asset additions primarily related to store construction projects, development of our ERP system and purchases of vehicles, including service trucks. During fiscal 2014, we completed the roll-out of the ERP system to all of our U.S. stores. Historically, and as we've been working to expand our rental business, we have sourced a significant portion of our rental fleet additions from our equipment inventory. These transfers from inventory totaled
$8.1 million
and
$41.6 million
in fiscal
2015
and
2014
, respectively, and are disclosed as supplemental disclosures of noncash investing and financing activities on our consolidated statements of cash flows. We expect our cash expenditures for property and equipment, exclusive of acquisitions and rental fleet, for fiscal
2016
to be approximately
$5.0 million
to
$10.0 million
. The actual amount of our fiscal
2016
property and equipment expenditures will depend upon factors such as general economic conditions, growth prospects for
47
our industry and our acquisition activity. We currently expect to finance property and equipment purchases with borrowings under the existing credit facilities, financing with long-term debt, with available cash or with cash flow from operations. We may need to incur additional debt if we pursue any future acquisitions.
Our ability to service our debt will depend upon our ability to generate the necessary cash. This will depend on our future acquisition activity, operating performance, general economic conditions, and financial, competitive, business and other factors, some of which are beyond our immediate control. Based on our current operational performance, we believe our cash flow from operations, available cash and available borrowings under the existing credit facilities will adequately provide our liquidity needs for, at a minimum, the next 12 months.
There can be no assurances, however, that our business will generate sufficient cash flow from operations or that future borrowings will be available under the credit facilities with Wells Fargo, CNH Industrial Capital and Agricredit in amounts sufficient to allow us to service our indebtedness and to meet our other commitments. If we are unable to generate sufficient cash flow from operations or to obtain sufficient future borrowings, we may be required to seek one or more alternatives such as refinancing or restructuring our indebtedness, selling material assets or operations or seeking to raise additional debt or equity capital. There can be no assurances that we will be able to succeed with one of these alternatives on commercially reasonable terms, if at all. In addition, if we pursue strategic acquisitions, we may require additional equity or debt financing to consummate the transactions, and we cannot assure you that we will succeed in obtaining this financing on favorable terms or at all. If we incur additional indebtedness to finance any of these transactions, this may place increased demands on our cash flow from operations to service the resulting increased debt. Our existing debt agreements contain restrictive covenants that may restrict our ability to adopt any of these alternatives. Any non-compliance by us under the terms of our debt agreements could result in an event of default which, if not cured, could result in the acceleration of our debt. We are in compliance with all financial covenants under these credit agreements, as amended and effective as of
January 31, 2015
. If anticipated operating results create the likelihood of a future covenant violation, we would work with our lenders on an appropriate modification or amendment to our financing arrangements.
Cash Flow
Cash Flow Provided By (Used For) Operating Activities
Net cash provided by operating activities in fiscal
2015
was
$41.1 million
and was primarily attributable to a decrease in our inventories, net income (after non-cash adjustments), and partially offset by a decrease in the manufacturer floorplan payable financing of such inventories. Net cash used for operating activities was
$82.2 million
in fiscal
2014
. The increase in net cash provided by operating activities of
$123.3 million
from fiscal
2014
to fiscal
2015
was primarily due to changes in inventory, net of the related changes in manufacturer floorplan payable balances, in each of the respective years, in which the net of these activities provided cash of
$14.2 million
in fiscal 2015 versus use of cash of
$154.7 million
in fiscal 2014. We evaluate our cash flow from operating activities net of all floorplan payable activity. Taking this adjustment into account, our non-GAAP cash provided by operating activities was
$82.2 million
for fiscal
2015
compared to net cash used for operating activities of
$50.8 million
for fiscal
2014
. This increase from fiscal
2014
to
2015
in non-GAAP cash provided by operating activities was primarily due to the aforementioned decrease in inventories, net of the related changes in floorplan payable balances. For reconciliation of this non-GAAP financial measure, please see the Non-GAAP Cash Flow Reconciliation below.
Net cash used for operating activities was
$82.2 million
in fiscal
2014
and was primarily attributable to an increase in our inventories, net income (after non-cash adjustments), and partially offset by an increase in the floorplan payable financing of such inventories. Net cash used for operating activities was
$115.3 million
in fiscal
2013
. The decrease in net cash used for operating activities of
$33.1 million
from fiscal
2013
to fiscal
2014
was primarily due to changes in working capital, such as a decrease in accounts receivable and increases in customer deposits and accrued expenses, and partially offset by a decrease in net income after non-cash adjustments. We evaluate our cash flow from operating activities net of all floorplan payable activity. Taking this adjustment into account, our non-GAAP cash used for operating activities was
$50.8 million
for fiscal
2014
and
$6.9 million
for fiscal
2013
. This increase from fiscal
2013
to
2014
in non-GAAP cash used for operating activities was due to a lower level of floorplan payable financing on our equipment inventories and a decrease in net income including noncontrolling interest. For reconciliation of this non-GAAP financial measure, please see the Non-GAAP Cash Flow Reconciliation below.
Cash Flow Used For Investing Activities
Net cash used for investing activities is primarily comprised of cash used for property and equipment purchases and in business combinations for purchases of dealerships, and primarily offset by proceeds from the sale of property and equipment. We also have non-cash property and equipment additions through the transfer of inventories to rental fleet and property and equipment purchases financed with long-term debt and other liabilities which are disclosed as supplemental disclosures of noncash investing and financing activities on our consolidated statements of cash flows.
48
Net cash provided by investing activities was
$4.4 million
in fiscal
2015
, compared net cash used for investing activities of
$7.1 million
in fiscal
2014
. In fiscal
2015
, we had cash used for property and equipment purchases, including rental fleet, totaling
$17.0 million
, which primarily related to the building of our rental fleet, store construction projects and development costs of our ERP system. These uses of cash were offset by
$16.8 million
received upon the sale of property and equipment and proceeds exceeding payments from net investment hedge derivatives of
$4.9 million
. The increase in net cash provided by investing activities from fiscal
2014
to fiscal
2015
was primarily due to less business combination activity and impact of the net investment hedge derivatives activity.
Net cash used for investing activities was
$7.1 million
in fiscal
2014
, compared to
$64.1 million
in fiscal
2013
. In fiscal
2014
, we had cash used for property and equipment purchases, including rental fleet, totaling
$19.0 million
, which primarily related to the building of our rental fleet, store construction projects and development costs of our ERP system. We also used
$4.8 million
for two business combinations consisting of two stores. These uses of cash were offset by
$16.7 million
received upon the sale of property and equipment. The decrease in net cash used for investing activities from fiscal 2013 to fiscal
2014
was primarily due to less business combination activity and less cash used for property and equipment purchases.
Cash Flow Provided By Financing Activities
Net cash provided by financing activities was
$9.0 million
in fiscal
2015
and
$39.8 million
in fiscal
2014
. In fiscal
2015
, we had a net increase in our non-manufacturer floorplan payable of
$41.1 million
, which was partially offset by payments on our long-term debt exceeding borrowings by
$27.7 million
. The increase in our non-manufacturer floorplan payable was due to a change in financing of our equipment inventory, in which we increased the utilization of our non-manufacturer floorplan payable lines of credit and decreased the utilization of our balances on our manufacturer floorplan lines of credit during fiscal
2015
, as compared to fiscal
2014
. The decrease in net cash provided by financing activities from fiscal
2014
to fiscal
2015
was primarily due to the pay down of our long-term debt balances in fiscal 2015, using the cash provided by operating activities that we generated during the year, compared to increasing our long-term debt balances during fiscal 2014.
Net cash provided by financing activities was
$39.8 million
in fiscal
2014
and
$224.2 million
in fiscal
2013
. In fiscal
2014
, we had a net increase in our non-manufacturer floorplan payable of
$31.4 million
and proceeds from our long-term debt borrowings exceeding payments by
$10.0 million
. The increase in our non-manufacturer floorplan payable was due to our increase in equipment inventories as of January 31,
2014
, as compared to January 31,
2013
. The decrease in net cash provided by financing activities from fiscal
2013
to fiscal
2014
was primarily due to the net proceeds from Senior Convertible Notes of
$145.2 million
received in fiscal
2013
, and less of an increase in non-manufacturer floorplan payable in fiscal
2014
as compared to fiscal
2013
.
Non-GAAP Cash Flow Reconciliation
We consider our cash flow from operating activities to include all equipment inventory financing activity regardless of whether we obtain the financing from a manufacturer or other source. We consider equipment inventory financing with both manufacturers and other sources to be part of the normal operations of our business and use the adjusted cash flow analysis in the evaluation of our equipment inventory and inventory flooring needs. Non-GAAP net cash provided by (used for) operating activities is a non-GAAP financial measure which is adjusted for non-manufacturer floorplan payable. The adjustment is equal to the net change in non-manufacturer floorplan payable, as shown on the consolidated statements of cash flows. GAAP categorizes non-manufacturer floorplan payable as financing activities in the consolidated statements of cash flows.
49
We believe that the presentation of non-GAAP net cash provided by (used for) operating activities is relevant and useful to our investors because it provides information on activities we consider normal operations of our business, regardless of financing source. The following table reconciles net cash provided by (used for) operating activities, a GAAP measure, to non-GAAP net cash provided by (used for) operating activities and net cash provided by financing activities, a GAAP measure, to non-GAAP cash flow provided by (used for) financing activities.
|
As Reported
|
Adjustment
|
Non-GAAP
Measures
|
|||||||||
|
(in thousands)
|
|||||||||||
|
Year Ended January 31, 2015
|
|||||||||||
|
Net cash provided by operating activities
|
$
|
41,058
|
|
$
|
41,114
|
|
$
|
82,172
|
|
||
|
Net cash provided by (used for) financing activities
|
9,004
|
|
(41,114
|
)
|
(32,110
|
)
|
|||||
|
Year Ended January 31, 2014
|
|||||||||||
|
Net cash used for operating activities
|
$
|
(82,243
|
)
|
$
|
31,395
|
|
$
|
(50,848
|
)
|
||
|
Net cash provided by financing activities
|
39,803
|
|
(31,395
|
)
|
8,408
|
|
|||||
|
Year Ended January 31, 2013
|
|||||||||||
|
Net cash used for operating activities
|
$
|
(115,325
|
)
|
$
|
108,417
|
|
$
|
(6,908
|
)
|
||
|
Net cash provided by financing activities
|
224,227
|
|
(108,417
|
)
|
115,810
|
|
|||||
Certain Information Concerning Off-Balance Sheet Arrangements
As of
January 31, 2015
, we did not have any relationships with unconsolidated entities or financial partnerships, such as entities often referred to as structured finance or special purpose entities, which would have been established for the purpose of facilitating off-balance sheet arrangements or other contractually narrow or limited purposes. We are, therefore, not exposed to any financing, liquidity, market or credit risk that could arise if we had engaged in these relationships. In the normal course of our business activities, we lease real estate, vehicles and equipment under operating leases.
Contractual and Commercial Commitment Summary
Our contractual obligations and commercial commitments as of
January 31, 2015
are summarized below:
|
Payments Due By Period
|
||||||||||||||||||||
|
Contractual Obligations
|
Total
|
Less Than
1 Year
|
1 to 3 Years
|
3 to 5 Years
|
More Than
5 Years
|
|||||||||||||||
|
(in thousands)
|
||||||||||||||||||||
|
Long-term debt obligations (1)
|
$
|
86,528
|
|
$
|
10,659
|
|
$
|
37,802
|
|
$
|
24,632
|
|
$
|
13,435
|
|
|||||
|
Senior convertible note obligations (2)
|
173,906
|
|
5,625
|
|
11,250
|
|
157,031
|
|
—
|
|
||||||||||
|
Operating lease (3)
|
202,558
|
|
23,250
|
|
41,450
|
|
35,951
|
|
101,907
|
|
||||||||||
|
Purchase obligations (4)
|
1,046
|
|
437
|
|
609
|
|
—
|
|
—
|
|
||||||||||
|
Interest rate swap obligations (5)
|
6,970
|
|
1,901
|
|
3,802
|
|
1,267
|
|
—
|
|
||||||||||
|
Other long-term liabilities (6)
|
3,459
|
|
824
|
|
830
|
|
723
|
|
1,083
|
|
||||||||||
|
Total
|
$
|
474,467
|
|
$
|
42,696
|
|
$
|
95,743
|
|
$
|
219,604
|
|
$
|
116,425
|
|
|||||
|
(1)
|
Includes obligations under notes payable issued in favor of our lenders and estimates of interest payable.
|
|
(2)
|
Includes coupon payments of interest on the contractual payment dates and payment of the principal balance on the maturity date of May 2019.
|
|
(3)
|
Includes minimum lease payment obligations under operating leases related to our stores. Amounts do not include insurance or real estate taxes, which we include in our operating expenses and which we estimate will be approximately
$2.7 million
for the less than 1 year period,
$5.2 million
for the 1-3 year period,
$4.7 million
for the 3-5 year period, and
$15.4 million
for the more than 5 years period for a total of approximately
$28.0 million
. See Note 12 to our audited financial statements for a description of our operating lease obligations.
|
|
(4)
|
Primarily represents contracts related to information technology systems.
|
|
(5)
|
Includes scheduled fixed interest payments related to our interest rate swap derivative instrument.
|
|
(6)
|
Includes long-term portion of trade payables.
|
50
Information Regarding Forward-Looking Statements
The Private Securities Litigation Reform Act of 1995 provides a "safe harbor" for forward-looking statements. Such "forward-looking" information is included in this Form 10-K, including this Item 7, as well as in other materials filed or to be filed by us with the Securities and Exchange Commission (as well as information included in oral statements or other written statements made or to be made by us).
This Form 10-K contains forward-looking statements that involve risks and uncertainties. In some cases, you can identify forward-looking statements by the following words: "anticipate," "believe," "continue," "could," "estimate," "expect," "intend," "may," "ongoing," "plan," "potential," "predict," "project," "should," "will," "would," or the negative of these terms or other comparable terminology, although not all forward-looking statements contain these words. These statements involve known and unknown risks, uncertainties and other factors that may cause our or our industry's actual results, levels of activity, performance or achievements to be materially different from the information expressed or implied by these forward-looking statements. Forward-looking statements are only predictions and are not guarantees of performance. These statements are based on our management's beliefs and assumptions, which in turn are based on currently available information. Our forward-looking statements in this Form 10-K generally relate to the following:
|
•
|
our beliefs and intentions with respect to our growth strategy, including growth through acquisitions, the profitability of expansion, the types of acquisition targets we intend to pursue, the availability of suitable acquisition targets, our ability to identify such targets, the industry climate for dealer consolidation, and our ability to implement our growth strategy;
|
|
•
|
our beliefs with respect to factors that will affect demand and seasonality of purchasing in the agricultural and construction industries;
|
|
•
|
our beliefs with respect to our primary supplier (CNH Industrial) of equipment and parts inventory;
|
|
•
|
our beliefs with respect to the equipment market, our competitors and our competitive advantages;
|
|
•
|
our beliefs with respect to the impact of government subsidies on the agriculture economy;
|
|
•
|
our beliefs with respect to the impact of natural resource exploration and related commodity prices in our operating region on our operating results;
|
|
•
|
our beliefs with respect to the impact of government regulations;
|
|
•
|
our beliefs with respect to ERP implementation and continued operations in the event of information system inoperability;
|
|
•
|
our beliefs with respect to our business strengths, including the Titan Operating Model, the diversity of our customer base, and the growth rate of our shared resources expenditures and our marketing efforts;
|
|
•
|
our plans and beliefs with respect to real property used in our business;
|
|
•
|
our plans and beliefs regarding future sales, sales mix, and marketing activities;
|
|
•
|
our beliefs and assumptions regarding the payment of dividends and repatriation of retained earnings from foreign operations;
|
|
•
|
our beliefs and assumptions regarding valuation reserves, equipment inventory balances, fixed operating expenses, and absorption rate;
|
|
•
|
our beliefs and expectations regarding our fiscal 2015 realignment including the amount and recognition of related costs;
|
|
•
|
our beliefs and expectations regarding the effects of the political climate and unstable economy in Ukraine;
|
|
•
|
our beliefs and assumptions with respect to our rental equipment operations;
|
|
•
|
our beliefs with respect to our employee relations and the impact of employee training and management strength on our revenues;
|
|
•
|
our assumptions, beliefs and expectations with respect to past and future market conditions, including interest rates, lending standards and public infrastructure spending, new environmental standards, and the impact these conditions will have on our operating results;
|
|
•
|
our beliefs with respect to the impact of our Credit Agreements, including future interest expense, limits on corporate transactions, financial covenant compliance, and ability to negotiate amendments or waivers;
|
51
|
•
|
our beliefs with respect to the impact of increase or decrease in applicable foreign exchange rates;
|
|
•
|
our beliefs with respect to the adequacy of our capital resources and the funding of debt service obligations and capital expenditures;
|
|
•
|
our plans and assumptions for future capital expenditures;
|
|
•
|
our cash needs, sources of liquidity, and the adequacy of our working capital; and
|
|
•
|
our expectations regarding the impact of inflation.
|
Forward-looking statements are only predictions and are not guarantees of performance. These statements are based on our management's beliefs and assumptions, which in turn are based on currently available information. Important assumptions relating to the forward-looking statements include, among others, assumptions regarding demand for our products, the expansion of product offerings geographically, the timing and cost of planned capital expenditures, competitive conditions and general economic conditions. These assumptions could prove inaccurate. Forward-looking statements also involve known and unknown risks and uncertainties, which could cause actual results that differ materially from those contained in any forward-looking statement. Many of these factors are beyond our ability to control or predict. Such factors include, but are not limited to, the following:
|
•
|
incorrect assumptions regarding our cash needs;
|
|
•
|
general economic conditions and construction activity in the markets where we operate;
|
|
•
|
our relationships with equipment suppliers;
|
|
•
|
our substantial leverage;
|
|
•
|
the risks associated with the expansion of our business;
|
|
•
|
our possible inability to integrate any businesses we acquire;
|
|
•
|
competitive pressures;
|
|
•
|
compliance with laws and regulations; and
|
|
•
|
other factors discussed under "Risk Factors" or elsewhere in this Form 10-K.
|
You should read the risk factors and the other cautionary statements made in this Form 10-K as being applicable to all related forward-looking statements wherever they appear in this Form 10-K. We cannot assure you that the forward-looking statements in this Form 10-K will prove to be accurate. Furthermore, if our forward-looking statements prove to be inaccurate, the inaccuracy may be material. In light of the significant uncertainties in these forward-looking statements, you should not regard these statements as a representation or warranty by us or any other person that we will achieve our objectives and plans in any specified timeframe, if at all. Other than as required by law, we undertake no obligation to update these forward-looking statements, even though our situation may change in the future.
We are exposed to various market risks, including changes in interest rates and foreign currency exchange rates. Market risk is the potential loss arising from adverse changes in market rates and prices such as interest rates and foreign currency exchange rates.
Interest Rate Risk
Exposure to changes in interest rates results from borrowing activities used to fund operations. For fixed rate debt, interest rate changes affect the fair value of financial instruments but do not impact earnings or cash flows. Conversely, for floating rate debt, interest rate changes generally do not affect the fair market value but do impact future earnings and cash flows, assuming other factors are held constant. We have both fixed and floating rate financing. Some of our floating rate credit facilities contain minimum rates of interest to be charged. Based upon our interest-bearing balances and interest rates as of
January 31, 2015
, holding other variables constant, a one percentage point increase in interest rates for the next 12-month period would decrease pre-tax earnings and cash flow by approximately
$4.0 million
. Conversely, a one percentage point decrease in interest rates for the next 12-month period would result in an increase to pre-tax earnings and cash flow of approximately
$4.0 million
. At
January 31, 2015
, we had total floorplan payables of
$627.2 million
, of which
$367.2 million
was interest-bearing at variable interest rates,
$160.1 million
was non-interest bearing and
$100.0 million
was effectively fixed rate due to our interest rate swap instrument. At
January 31, 2015
, we also had variable rate notes payable and long-term debt of
$33.2 million
, and fixed rate notes payable and long-term debt of
$41.7 million
.
52
Foreign Currency Exchange Rate Risk
Our foreign currency exposures arise as the result of our foreign operations. We are exposed to transactional foreign currency exchange rate risk through our foreign entities’ holding assets and liabilities denominated in currencies other than their functional currency. In addition, the Company is exposed to foreign currency transaction risk as the result of certain intercompany financing transactions. The Company attempts to manage its transactional foreign currency exchange rate risk through the use of derivative financial instruments, primarily foreign exchange forward contracts, or through natural hedging instruments. Based upon balances and exchange rates as of January 31, 2015, holding other variables constant, we believe that a hypothetical 10% increase or decrease in all applicable foreign exchange rates would not have a material impact on our results of operations or cash flows. As of January 31, 2015, our Ukrainian subsidiary had $2.4 million of net monetary assets denominated in Ukrainian hryvnia (UAH). We have attempted to minimize our net monetary asset position through reducing overall asset levels in Ukraine and through borrowing in UAH which serves as a natural hedging instrument offsetting our net UAH denominated assets. Currency and payment controls imposed by the National Bank of Ukraine have limited our ability to manage our net monetary asset position. The UAH devalued significantly during the year ended January 31, 2015. Continued and significant devaluation of the UAH could have a material impact on our results of operations and cash flows.
In addition to transactional foreign currency exchange rate risk, we are also exposed to translational foreign currency exchange rate risk as we translate the results of operations and assets and liabilities of our foreign operations from their functional currency to the U.S. dollar. As a result, our results of operations, cash flows and net investment in our foreign operations may be adversely impacted by fluctuating foreign currency exchange rates. We believe that a hypothetical 10% increase or decrease in all applicable foreign exchange rates, holding all other variables constant, would not have a material impact on our results of operations or cash flows.
53
The Consolidated Balance Sheets of the Company as of
January 31, 2015
and
2014
, and the related Consolidated Statements of Operations, Other Comprehensive Income, Stockholders' Equity, and Cash Flows for the years ended
January 31, 2015
and
2014
, and the notes thereto, have been audited by Deloitte & Touche LLP, an independent registered public accounting firm. The Consolidated Statements of Operations, Other Comprehensive Income, Stockholders' Equity, and Cash Flows for the year ended January 31, 2013, and the notes thereto, have been audited by Eide Bailly LLP, an independent registered public accounting firm.
INDEX TO CONSOLIDATED FINANCIAL STATEMENTS
|
Page
|
|
|
Titan Machinery Inc.—Financial Statements
|
|
|
Audited Consolidated Financial Statements
|
|
54
REPORT OF INDEPENDENT REGISTERED PUBLIC ACCOUNTING FIRM
To the Board of Directors and Stockholders of
Titan Machinery Inc.
West Fargo, North Dakota
We have audited the accompanying consolidated balance sheets of Titan Machinery Inc. (the “Company”) as of January 31, 2015 and 2014, and the related consolidated statements of operations, comprehensive income, stockholders’ equity, and cash flows for the fiscal years then ended. Our audits also included the financial statement schedule for the fiscal years ended January 31, 2015 and 2014, listed in the index at Item 15. These consolidated financial statements and financial statement schedule are the responsibility of the Company’s management. Our responsibility is to express an opinion on the consolidated financial statements and financial statement schedule based on our audit. The consolidated financial statements and financial statement schedule of the Company for the fiscal years ended January 31, 2013, were audited by other auditors whose report, dated April 10, 2013, expressed an unqualified opinion on those statements.
We conducted our audits in accordance with the standards of the Public Company Accounting Oversight Board (United States). Those standards require that we plan and perform the audits to obtain reasonable assurance about whether the financial statements are free of material misstatement. An audit includes examining, on a test basis, evidence supporting the amounts and disclosures in the financial statements. An audit also includes assessing the accounting principles used and significant estimates made by management, as well as evaluating the overall financial statement presentation. We believe that our audits provide a reasonable basis for our opinion.
In our opinion, such consolidated financial statements present fairly, in all material respects, the financial position of the Company as of January 31, 2015 and 2014, and the results of its operations and its cash flows for the fiscal years then ended in conformity with accounting principles generally accepted in the United States of America. Also, in our opinion, such financial statement schedule for the fiscal years ended January 31, 2015 and 2014, when considered in relation to the basic consolidated financial statements presented as a whole, present fairly, in all material respects, the information set forth herein.
We have also audited, in accordance with the standards of the Public Company Accounting Oversight Board (United States), the Company’s internal control over financial reporting as of January 31, 2015, based on the criteria established in
Internal Control-Integrated Framework (2013)
issued by the Committee of Sponsoring Organizations of the Treadway Commission and our report dated April 15, 2015, expressed an unqualified opinion on the Company’s internal control over financial reporting.
/s/ Deloitte & Touche LLP
Minneapolis, Minnesota
April 15, 2015
55
REPORT OF INDEPENDENT REGISTERED PUBLIC ACCOUNTING FIRM
To the Board of Directors and Stockholders of
Titan Machinery Inc.
West Fargo, ND
We have audited the internal control over financial reporting of Titan Machinery Inc. (the “Company”) as of January 31, 2015, based on criteria established in
Internal Control-Integrated Framework (2013)
issued by the Committee of Sponsoring Organizations of the Treadway Commission. The Company’s management is responsible for maintaining effective internal control over financial reporting and for its assessment of the effectiveness of internal control over financial reporting, included in the accompanying Management’s Report on Internal Control Over Financial Reporting. Our responsibility is to express an opinion on the Company’s internal control over financial reporting based on our audit.
We conducted our audit in accordance with the standards of the Public Company Accounting Oversight Board (United States). Those standards require that we plan and perform the audit to obtain reasonable assurance about whether effective internal control over financial reporting was maintained, in all material respects. Our audit included obtaining an understanding of internal control over financial reporting, assessing the risk that a material weakness exists, testing and evaluating the design and operating effectiveness of internal control based on the assessed risk, and performing such other procedures as we considered necessary in the circumstances. We believe that our audit provides a reasonable basis for our opinion.
A company’s internal control over financial reporting is a process designed by, or under the supervision of, the company’s principal executive and principal financial officers, or persons performing similar functions, and effected by the company’s board of directors, management, and other personnel to provide reasonable assurance regarding the reliability of financial reporting and the preparation of financial statements for external purposes in accordance with generally accepted accounting principles. A company’s internal control over financial reporting includes those policies and procedures that (1) pertain to the maintenance of records that, in reasonable detail, accurately and fairly reflect the transactions and dispositions of the assets of the company; (2) provide reasonable assurance that transactions are recorded as necessary to permit preparation of financial statements in accordance with generally accepted accounting principles, and that receipts and expenditures of the company are being made only in accordance with authorizations of management and directors of the company; and (3) provide reasonable assurance regarding prevention or timely detection of unauthorized acquisition, use, or disposition of the company’s assets that could have a material effect on the financial statements.
Because of the inherent limitations of internal control over financial reporting, including the possibility of collusion or improper management override of controls, material misstatements due to error or fraud may not be prevented or detected on a timely basis. Also, projections of any evaluation of the effectiveness of the internal control over financial reporting to future periods are subject to the risk that the controls may become inadequate because of changes in conditions, or that the degree of compliance with the policies or procedures may deteriorate.
In our opinion, the Company maintained, in all material respects, effective internal control over financial reporting as of January 31, 2015, based on the criteria established in
Internal Control-Integrated Framework (2013)
issued by the Committee of Sponsoring Organizations of the Treadway Commission.
We have also audited, in accordance with the standards of the Public Company Accounting Oversight Board (United States), the consolidated financial statements and financial statement schedule as of and for the fiscal year ended January 31, 2015, of the Company and our report dated April 15, 2015, expressed an unqualified opinion on those consolidated financial statements and financial statement schedule.
/s/ Deloitte & Touche LLP
Minneapolis, Minnesota
April 15, 2015
56
REPORT OF INDEPENDENT REGISTERED PUBLIC ACCOUNTING FIRM
To the Board of Directors and Stockholders
Titan Machinery Inc.
West Fargo, North Dakota
We have audited the Titan Machinery Inc.’s consolidated statements of operations, comprehensive income, stockholders’ equity, and cash flows for the year ended January 31, 2013, and the financial statement schedule listed in the Index at Item 15. Titan Machinery Inc.’s management is responsible for these consolidated financial statements. Our responsibility is to express an opinion on these financial statements based on our audit.
We conducted our audit in accordance with the standards of the Public Company Accounting Oversight Board (United States). Those standards require that we plan and perform the audit to obtain reasonable assurance about whether the financial statements are free of material misstatement. An audit includes examining, on a test basis, evidence supporting the amounts and disclosures in the financial statements. An audit also includes assessing the accounting principles used and significant estimates made by management, as well as evaluating the overall financial statement presentation. We believe that our audits provide a reasonable basis for our opinion.
In our opinion, the consolidated financial statements referred to above present fairly, in all material respects, the results of Titan Machinery Inc.’s operations and its cash flows for the year ended January 31, 2013, in conformity with accounting principles generally accepted in the United States of America. Also, in our opinion, the financial statement schedule referred to above, when considered in relation to the consolidated financial statements taken as a whole, presents fairly, in all material respects, the information set forth therein.
/s/ Eide Bailly LLP
Minneapolis, Minnesota
April 10, 2013
57
TITAN MACHINERY INC.
JANUARY 31, 2015
AND
2014
(in thousands, except per share data)
|
January 31, 2015
|
January 31, 2014
|
||||||
|
Assets
|
|||||||
|
Current Assets
|
|||||||
|
Cash
|
$
|
127,528
|
|
$
|
74,242
|
|
|
|
Receivables, net
|
76,382
|
|
97,894
|
|
|||
|
Inventories
|
879,440
|
|
1,075,978
|
|
|||
|
Prepaid expenses and other
|
10,634
|
|
24,740
|
|
|||
|
Income taxes receivable
|
166
|
|
851
|
|
|||
|
Deferred income taxes
|
19,025
|
|
13,678
|
|
|||
|
Assets held for sale
|
15,312
|
|
—
|
|
|||
|
Total current assets
|
1,128,487
|
|
1,287,383
|
|
|||
|
Intangibles and Other Assets
|
|||||||
|
Noncurrent parts inventories
|
—
|
|
5,098
|
|
|||
|
Goodwill
|
—
|
|
24,751
|
|
|||
|
Intangible assets, net of accumulated amortization
|
5,458
|
|
11,750
|
|
|||
|
Other
|
7,122
|
|
7,666
|
|
|||
|
Total intangibles and other assets
|
12,580
|
|
49,265
|
|
|||
|
Property and Equipment, net of accumulated depreciation
|
208,680
|
|
228,000
|
|
|||
|
Total Assets
|
$
|
1,349,747
|
|
$
|
1,564,648
|
|
|
|
Liabilities and Stockholders' Equity
|
|||||||
|
Current Liabilities
|
|||||||
|
Accounts payable
|
$
|
17,659
|
|
$
|
23,714
|
|
|
|
Floorplan payable
|
627,249
|
|
750,533
|
|
|||
|
Current maturities of long-term debt
|
7,749
|
|
2,192
|
|
|||
|
Customer deposits
|
35,090
|
|
61,286
|
|
|||
|
Accrued expenses
|
35,496
|
|
36,968
|
|
|||
|
Income taxes payable
|
3,529
|
|
344
|
|
|||
|
Liabilities held for sale
|
2,835
|
|
—
|
|
|||
|
Total current liabilities
|
729,607
|
|
875,037
|
|
|||
|
Long-Term Liabilities
|
|||||||
|
Senior convertible notes
|
132,350
|
|
128,893
|
|
|||
|
Long-term debt, less current maturities
|
67,123
|
|
95,532
|
|
|||
|
Deferred income taxes
|
38,996
|
|
47,329
|
|
|||
|
Other long-term liabilities
|
3,312
|
|
6,515
|
|
|||
|
Total long-term liabilities
|
241,781
|
|
278,269
|
|
|||
|
Commitments and Contingencies (Notes 11 and 12)
|
|
|
|||||
|
Stockholders' Equity
|
|||||||
|
Common stock, par value $.00001 per share, 45,000 shares authorized; 21,406 shares issued and outstanding at January 31, 2015; 21,261 shares issued and outstanding at January 31, 2014
|
—
|
|
—
|
|
|||
|
Additional paid-in-capital
|
240,180
|
|
238,857
|
|
|||
|
Retained earnings
|
137,418
|
|
169,575
|
|
|||
|
Accumulated other comprehensive income (loss)
|
(1,099
|
)
|
339
|
|
|||
|
Total Titan Machinery Inc. stockholders' equity
|
376,499
|
|
408,771
|
|
|||
|
Noncontrolling interest
|
1,860
|
|
2,571
|
|
|||
|
Total stockholders' equity
|
378,359
|
|
411,342
|
|
|||
|
Total Liabilities and Stockholders' Equity
|
$
|
1,349,747
|
|
$
|
1,564,648
|
|
|
See Notes to Consolidated Financial Statements
58
TITAN MACHINERY INC.
YEARS ENDED
JANUARY 31, 2015
,
2014
AND
2013
(in thousands, except per share data)
|
2015
|
2014
|
|
2013
|
||||||||
|
Revenue
|
|||||||||||
|
Equipment
|
$
|
1,398,195
|
|
$
|
1,722,738
|
|
$
|
1,763,877
|
|
||
|
Parts
|
270,262
|
|
275,750
|
|
242,368
|
|
|||||
|
Service
|
147,356
|
|
149,082
|
|
127,779
|
|
|||||
|
Rental and other
|
84,433
|
|
78,876
|
|
64,396
|
|
|||||
|
Total Revenue
|
1,900,246
|
|
2,226,446
|
|
2,198,420
|
|
|||||
|
Cost of Revenue
|
|||||||||||
|
Equipment
|
1,286,148
|
|
1,576,246
|
|
1,600,233
|
|
|||||
|
Parts
|
189,540
|
|
192,199
|
|
169,164
|
|
|||||
|
Service
|
53,924
|
|
54,608
|
|
45,748
|
|
|||||
|
Rental and other
|
62,250
|
|
55,319
|
|
43,914
|
|
|||||
|
Total Cost of Revenue
|
1,591,862
|
|
1,878,372
|
|
1,859,059
|
|
|||||
|
Gross Profit
|
308,384
|
|
348,074
|
|
339,361
|
|
|||||
|
Operating Expenses
|
273,271
|
|
291,202
|
|
247,557
|
|
|||||
|
Impairment and Realignment Costs
|
34,390
|
|
9,997
|
|
—
|
|
|||||
|
Income from Operations
|
723
|
|
46,875
|
|
91,804
|
|
|||||
|
Other Income (Expense)
|
|||||||||||
|
Interest income and other income (expense)
|
(4,272
|
)
|
2,109
|
|
1,654
|
|
|||||
|
Floorplan interest expense
|
(20,477
|
)
|
(16,764
|
)
|
(13,297
|
)
|
|||||
|
Other interest expense
|
(14,314
|
)
|
(13,791
|
)
|
(9,465
|
)
|
|||||
|
Income (Loss) Before Income Taxes
|
(38,340
|
)
|
18,429
|
|
70,696
|
|
|||||
|
Provision for (Benefit from) Income Taxes
|
(4,923
|
)
|
10,325
|
|
28,137
|
|
|||||
|
Net Income (Loss) Including Noncontrolling Interest
|
(33,417
|
)
|
8,104
|
|
42,559
|
|
|||||
|
Less: Net Income (Loss) Attributable to Noncontrolling Interest
|
(1,260
|
)
|
(747
|
)
|
86
|
|
|||||
|
Net Income (Loss) Attributable to Titan Machinery Inc.
|
(32,157
|
)
|
8,851
|
|
42,473
|
|
|||||
|
Net (Income) Loss Allocated to Participating Securities - Note 1
|
559
|
|
(129
|
)
|
(443
|
)
|
|||||
|
Net Income (Loss) Attributable to Titan Machinery Inc. Common Stockholders
|
$
|
(31,598
|
)
|
$
|
8,722
|
|
$
|
42,030
|
|
||
|
Earnings (Loss) per Share - Note 1
|
|||||||||||
|
Earnings (Loss) per Share - Basic
|
$
|
(1.51
|
)
|
$
|
0.42
|
|
$
|
2.02
|
|
||
|
Earnings (Loss) per Share - Diluted
|
$
|
(1.51
|
)
|
$
|
0.41
|
|
$
|
2.00
|
|
||
|
Weighted Average Common Shares - Basic
|
20,989
|
|
20,894
|
|
20,787
|
|
|||||
|
Weighted Average Common Shares - Diluted
|
20,989
|
|
21,040
|
|
20,987
|
|
|||||
See Notes to Consolidated Financial Statements
59
TITAN MACHINERY INC.
CONSOLIDATED STATEMENTS OF COMPREHENSIVE INCOME
YEARS ENDED
JANUARY 31, 2015
,
2014
AND
2013
(in thousands)
|
2015
|
2014
|
2013
|
|||||||||
|
Net Income (Loss) Including Noncontrolling Interest
|
$
|
(33,417
|
)
|
$
|
8,104
|
|
$
|
42,559
|
|
||
|
Other Comprehensive Income (Loss)
|
|||||||||||
|
Foreign currency translation adjustments
|
(3,043
|
)
|
2,314
|
|
(299
|
)
|
|||||
|
Unrealized gain (loss) on net investment hedge derivative instruments, net of tax expense (benefit) of $1,900, $114, and ($325) for the years ended January 31, 2015, 2014, and 2013, respectively
|
2,849
|
|
170
|
|
(509
|
)
|
|||||
|
Unrealized loss on interest rate swap cash flow hedge derivative instrument, net of tax benefit of ($1,038) and ($490) for the years ended January 31, 2015 and 2014, respectively
|
(1,557
|
)
|
(737
|
)
|
—
|
|
|||||
|
Unrealized gain (loss) on foreign currency contract cash flow hedge derivative instruments, net of tax expense (benefit) of $29 and ($85) for the years ended January 31, 2015 and 2014, respectively
|
44
|
|
(126
|
)
|
—
|
|
|||||
|
Reclassification of loss on interest rate swap cash flow hedge derivative instruments included in net income (loss), net of tax benefit of $235 for the year ended January 31, 2015
|
354
|
|
—
|
|
—
|
|
|||||
|
Reclassification of loss on foreign currency contract cash flow hedge derivative instruments included in net income (loss), net of tax benefit of $31 for the year ended January 31, 2015
|
45
|
|
—
|
|
—
|
|
|||||
|
Total Other Comprehensive Income (Loss)
|
(1,308
|
)
|
1,621
|
|
(808
|
)
|
|||||
|
Comprehensive Income (Loss)
|
(34,725
|
)
|
9,725
|
|
41,751
|
|
|||||
|
Comprehensive Income (Loss) Attributable to Noncontrolling Interest
|
(1,130
|
)
|
(200
|
)
|
(57
|
)
|
|||||
|
Comprehensive Income (Loss) Attributable To Titan Machinery Inc.
|
$
|
(33,595
|
)
|
$
|
9,925
|
|
$
|
41,808
|
|
||
See Notes to Consolidated Financial Statements
60
TITAN MACHINERY INC.
CONSOLIDATED STATEMENTS OF STOCKHOLDERS' EQUITY
YEARS ENDED
JANUARY 31, 2015
,
2014
AND
2013
(in thousands)
|
Common Stock
|
Accumulated Other Comprehensive Income (Loss)
|
||||||||||||||||||||||||||||||||||||||||||||
|
Shares Outstanding
|
Amount
|
Additional Paid-In Capital
|
Retained Earnings
|
Foreign Currency Translation Adjustments
|
Unrealized Gains (Losses) on Net Investment Hedges
|
Unrealized Gains (Losses) on Interest Rate Swap Cash Flow Hedges
|
Unrealized Gains (Losses) on Foreign Currency Contract Cash Flow Hedges
|
Total
|
Total Titan Machinery Inc. Stockholders' Equity
|
Noncontrolling Interest
|
Total Stockholders' Equity
|
||||||||||||||||||||||||||||||||||
|
BALANCE, JANUARY 31, 2012
|
20,911
|
|
—
|
|
218,156
|
|
118,251
|
|
(70
|
)
|
—
|
|
—
|
|
—
|
|
(70
|
)
|
336,337
|
|
1,002
|
|
337,339
|
|
|||||||||||||||||||||
|
Senior convertible notes offering
|
—
|
|
—
|
|
15,546
|
|
—
|
|
—
|
|
—
|
|
—
|
|
—
|
|
—
|
|
15,546
|
|
—
|
|
15,546
|
|
|||||||||||||||||||||
|
Common stock issued on grant of restricted stock (net of forfeitures), exercise of stock options and warrants, and tax benefits of equity awards
|
181
|
|
—
|
|
1,189
|
|
—
|
|
—
|
|
—
|
|
—
|
|
—
|
|
—
|
|
1,189
|
|
—
|
|
1,189
|
|
|||||||||||||||||||||
|
Issuance of subsidiary shares to noncontrolling interest holders
|
—
|
|
—
|
|
—
|
|
—
|
|
—
|
|
—
|
|
—
|
|
—
|
|
—
|
|
—
|
|
2,464
|
|
2,464
|
|
|||||||||||||||||||||
|
Stock-based compensation expense
|
—
|
|
—
|
|
1,630
|
|
—
|
|
—
|
|
—
|
|
—
|
|
—
|
|
—
|
|
1,630
|
|
—
|
|
1,630
|
|
|||||||||||||||||||||
|
Comprehensive income (loss):
|
|||||||||||||||||||||||||||||||||||||||||||||
|
Net income
|
—
|
|
—
|
|
—
|
|
42,473
|
|
—
|
|
—
|
|
—
|
|
—
|
|
—
|
|
42,473
|
|
86
|
|
42,559
|
|
|||||||||||||||||||||
|
Other comprehensive loss
|
—
|
|
—
|
|
—
|
|
—
|
|
(156
|
)
|
(509
|
)
|
—
|
|
—
|
|
(665
|
)
|
(665
|
)
|
(143
|
)
|
(808
|
)
|
|||||||||||||||||||||
|
Total comprehensive income (loss)
|
—
|
|
—
|
|
—
|
|
—
|
|
—
|
|
—
|
|
—
|
|
—
|
|
—
|
|
41,808
|
|
(57
|
)
|
41,751
|
|
|||||||||||||||||||||
|
BALANCE, JANUARY 31, 2013
|
21,092
|
|
—
|
|
236,521
|
|
160,724
|
|
(226
|
)
|
(509
|
)
|
—
|
|
—
|
|
(735
|
)
|
396,510
|
|
3,409
|
|
399,919
|
|
|||||||||||||||||||||
|
Common stock issued on grant of restricted stock (net of forfeitures), exercise of stock options and warrants, and tax benefits of equity awards
|
147
|
|
—
|
|
254
|
|
—
|
|
—
|
|
—
|
|
—
|
|
—
|
|
—
|
|
254
|
|
—
|
|
254
|
|
|||||||||||||||||||||
|
Stock-based compensation expense
|
—
|
|
—
|
|
2,131
|
|
—
|
|
—
|
|
—
|
|
—
|
|
—
|
|
—
|
|
2,131
|
|
—
|
|
2,131
|
|
|||||||||||||||||||||
|
Other
|
22
|
|
—
|
|
(49
|
)
|
—
|
|
—
|
|
—
|
|
—
|
|
—
|
|
—
|
|
(49
|
)
|
(638
|
)
|
(687
|
)
|
|||||||||||||||||||||
|
Comprehensive income (loss):
|
|||||||||||||||||||||||||||||||||||||||||||||
|
Net income (loss)
|
—
|
|
—
|
|
—
|
|
8,851
|
|
—
|
|
—
|
|
—
|
|
—
|
|
—
|
|
8,851
|
|
(747
|
)
|
8,104
|
|
|||||||||||||||||||||
|
Other comprehensive income (loss)
|
—
|
|
—
|
|
—
|
|
—
|
|
1,767
|
|
170
|
|
(737
|
)
|
(126
|
)
|
1,074
|
|
1,074
|
|
547
|
|
1,621
|
|
|||||||||||||||||||||
|
Total comprehensive income (loss)
|
—
|
|
—
|
|
—
|
|
—
|
|
—
|
|
—
|
|
—
|
|
—
|
|
—
|
|
9,925
|
|
(200
|
)
|
9,725
|
|
|||||||||||||||||||||
|
BALANCE, JANUARY 31, 2014
|
21,261
|
|
—
|
|
238,857
|
|
169,575
|
|
1,541
|
|
(339
|
)
|
(737
|
)
|
(126
|
)
|
339
|
|
408,771
|
|
2,571
|
|
411,342
|
|
|||||||||||||||||||||
|
Common stock issued on grant of restricted stock (net of forfeitures), exercise of stock options and warrants, and tax benefits of equity awards
|
145
|
|
—
|
|
(310
|
)
|
—
|
|
—
|
|
—
|
|
—
|
|
—
|
|
—
|
|
(310
|
)
|
—
|
|
(310
|
)
|
|||||||||||||||||||||
|
Stock-based compensation expense
|
—
|
|
—
|
|
2,135
|
|
—
|
|
—
|
|
—
|
|
—
|
|
—
|
|
—
|
|
2,135
|
|
—
|
|
2,135
|
|
|||||||||||||||||||||
|
Other
|
—
|
|
—
|
|
(502
|
)
|
—
|
|
—
|
|
—
|
|
—
|
|
—
|
|
—
|
|
(502
|
)
|
419
|
|
(83
|
)
|
|||||||||||||||||||||
|
Comprehensive income (loss):
|
|||||||||||||||||||||||||||||||||||||||||||||
|
Net loss
|
—
|
|
—
|
|
—
|
|
(32,157
|
)
|
—
|
|
—
|
|
—
|
|
—
|
|
—
|
|
(32,157
|
)
|
(1,260
|
)
|
(33,417
|
)
|
|||||||||||||||||||||
|
Other comprehensive income (loss)
|
—
|
|
—
|
|
—
|
|
—
|
|
(3,173
|
)
|
2,849
|
|
(1,203
|
)
|
89
|
|
(1,438
|
)
|
(1,438
|
)
|
130
|
|
(1,308
|
)
|
|||||||||||||||||||||
|
Total comprehensive loss
|
—
|
|
—
|
|
—
|
|
—
|
|
—
|
|
—
|
|
—
|
|
—
|
|
—
|
|
(33,595
|
)
|
(1,130
|
)
|
(34,725
|
)
|
|||||||||||||||||||||
|
BALANCE, JANUARY 31, 2015
|
21,406
|
|
—
|
|
$
|
240,180
|
|
$
|
137,418
|
|
$
|
(1,632
|
)
|
$
|
2,510
|
|
$
|
(1,940
|
)
|
$
|
(37
|
)
|
$
|
(1,099
|
)
|
$
|
376,499
|
|
$
|
1,860
|
|
$
|
378,359
|
|
|||||||||||
See Notes to Consolidated Financial Statements
61
TITAN MACHINERY INC.
YEARS ENDED
JANUARY 31, 2015
,
2014
AND
2013
(in thousands)
|
2015
|
2014
|
2013
|
|||||||||
|
Operating Activities
|
|||||||||||
|
Net income (loss) including noncontrolling interest
|
$
|
(33,417
|
)
|
$
|
8,104
|
|
$
|
42,559
|
|
||
|
Adjustments to reconcile net income including noncontrolling interest to net cash used for operating activities
|
|||||||||||
|
Depreciation and amortization
|
31,768
|
|
30,794
|
|
23,464
|
|
|||||
|
Impairment
|
31,225
|
|
9,997
|
|
—
|
|
|||||
|
Deferred income taxes
|
(14,837
|
)
|
(4,939
|
)
|
6,108
|
|
|||||
|
Stock-based compensation expense
|
2,135
|
|
2,131
|
|
1,630
|
|
|||||
|
Noncash interest expense
|
4,723
|
|
4,537
|
|
3,440
|
|
|||||
|
Unrealized foreign currency (gain) loss on loans to international subsidiaries
|
5,788
|
|
(534
|
)
|
(943
|
)
|
|||||
|
Other, net
|
90
|
|
(515
|
)
|
(228
|
)
|
|||||
|
Changes in assets and liabilities, net of purchase of equipment dealerships assets and assumption of liabilities
|
|||||||||||
|
Receivables, prepaid expenses and other assets
|
25,395
|
|
13,067
|
|
(41,598
|
)
|
|||||
|
Inventories
|
171,595
|
|
(182,374
|
)
|
(169,919
|
)
|
|||||
|
Manufacturer floorplan payable
|
(157,352
|
)
|
27,630
|
|
20,189
|
|
|||||
|
Accounts payable, customer deposits, accrued expenses and other long-term liabilities
|
(29,603
|
)
|
10,173
|
|
(2,739
|
)
|
|||||
|
Income taxes
|
3,548
|
|
(314
|
)
|
2,712
|
|
|||||
|
Net Cash Provided by (Used for) Operating Activities
|
41,058
|
|
(82,243
|
)
|
(115,325
|
)
|
|||||
|
Investing Activities
|
|||||||||||
|
Rental fleet purchases
|
(806
|
)
|
(783
|
)
|
(13,358
|
)
|
|||||
|
Property and equipment purchases (excluding rental fleet)
|
(16,206
|
)
|
(18,227
|
)
|
(26,474
|
)
|
|||||
|
Proceeds from sale of property and equipment
|
16,803
|
|
16,712
|
|
8,422
|
|
|||||
|
Purchase of equipment dealerships, net of cash purchased
|
(584
|
)
|
(4,848
|
)
|
(31,877
|
)
|
|||||
|
Proceeds upon settlement of net investment hedge derivative instruments
|
5,840
|
|
1,108
|
|
—
|
|
|||||
|
Payments upon settlement of net investment hedge derivative instruments
|
(915
|
)
|
(981
|
)
|
(834
|
)
|
|||||
|
Other, net
|
271
|
|
(58
|
)
|
9
|
|
|||||
|
Net Cash Provided by (Used for) Investing Activities
|
4,403
|
|
(7,077
|
)
|
(64,112
|
)
|
|||||
|
Financing Activities
|
|||||||||||
|
Proceeds from senior convertible notes offering, net of direct issuance costs of $4,753
|
—
|
|
—
|
|
145,247
|
|
|||||
|
Net change in non-manufacturer floorplan payable
|
41,114
|
|
31,395
|
|
108,417
|
|
|||||
|
Proceeds from long-term debt borrowings
|
113,000
|
|
143,918
|
|
113,967
|
|
|||||
|
Principal payments on long-term debt
|
(140,728
|
)
|
(133,960
|
)
|
(145,509
|
)
|
|||||
|
Payments on other long-term liabilities
|
(3,748
|
)
|
—
|
|
—
|
|
|||||
|
Proceeds from sale of subsidiary shares to noncontrolling interest holders
|
—
|
|
—
|
|
2,464
|
|
|||||
|
Other, net
|
(634
|
)
|
(1,550
|
)
|
(359
|
)
|
|||||
|
Net Cash Provided by Financing Activities
|
9,004
|
|
39,803
|
|
224,227
|
|
|||||
|
Effect of Exchange Rate Changes on Cash
|
(1,179
|
)
|
(601
|
)
|
(272
|
)
|
|||||
|
Net Change in Cash
|
53,286
|
|
(50,118
|
)
|
44,518
|
|
|||||
|
Cash at Beginning of Period
|
74,242
|
|
124,360
|
|
79,842
|
|
|||||
|
Cash at End of Period
|
$
|
127,528
|
|
$
|
74,242
|
|
$
|
124,360
|
|
||
|
Supplemental Disclosures of Cash Flow Information
|
|||||||||||
|
Cash paid during the period
|
|||||||||||
|
Income taxes, net of refunds
|
$
|
6,369
|
|
$
|
15,729
|
|
$
|
18,625
|
|
||
|
Interest
|
$
|
30,044
|
|
$
|
26,134
|
|
$
|
17,733
|
|
||
|
Supplemental Disclosures of Noncash Investing and Financing Activities
|
|||||||||||
|
Net property and equipment financed with long-term debt, accounts payable and accrued liabilities
|
$
|
3,829
|
|
$
|
22,242
|
|
$
|
36,482
|
|
||
|
Net transfer of assets to property and equipment from inventories
|
$
|
8,128
|
|
$
|
41,582
|
|
$
|
15,374
|
|
||
See Notes to Consolidated Financial Statements
62
TITAN MACHINERY INC.
NOTES TO CONSOLIDATED FINANCIAL STATEMENTS
Nature of Business
Titan Machinery Inc. (the "Company") is engaged in the retail sale, service and rental of agricultural and construction machinery through stores in the United States and Europe. The Company's North American stores are located in Arizona, Colorado, Iowa, Minnesota, Montana, Nebraska, New Mexico, North Dakota, South Dakota, Wisconsin and Wyoming, and its European stores are located in Bulgaria, Romania, Serbia and Ukraine.
Seasonality
The agricultural and construction equipment businesses are highly seasonal, which causes the Company's quarterly results and available cash flow to fluctuate during the year. The Company's customers generally purchase and rent equipment in preparation for, or in conjunction with, their busy seasons, which for farmers are the spring planting and fall harvesting seasons, and for Construction customers is dependent on weather seasons in their respective regions, which is typically the second and third quarters of the Company's fiscal year for much of its Construction footprint. The Company's parts and service revenues are typically highest during its customers' busy seasons as well, due to the increased use of their equipment during this time, which generates the need for more parts and service work. However, weather conditions impact the timing of our customers' busy times, which may cause the Company's quarterly financial results to differ between fiscal years. In addition, the fourth quarter typically is a significant period for equipment sales in the U.S. because of its customers’ year-end tax planning considerations, the timing of dealer incentives and the increase in availability of funds from completed harvests and construction projects.
Principles of Consolidation
The consolidated financial statements include the accounts of the Company and its wholly-owned and majority-owned subsidiaries. All significant accounts, transactions and profits between the consolidated companies have been eliminated in consolidation.
The accounts of the Company's foreign subsidiaries are consolidated as of December 31 of each year. No events occurred related to these subsidiaries in January
2015
that would have materially affected the consolidated financial position, results of operations or cash flows.
Reclassifications
Certain reclassifications of amounts previously reported have been made to the accompanying consolidated statements of cash flows, to maintain consistency and comparability between periods presented. These reclassifications had no impact on previously reported cash flows from operating, investing or financing activities.
Estimates
The preparation of financial statements in conformity with accounting principles generally accepted in the United States of America requires management to make estimates and assumptions that affect the reported amounts of assets and liabilities and disclosure of contingent assets and liabilities at the date of the consolidated financial statements and the reported amounts of revenue and expenses during the reporting period. Actual results could differ from those estimates, particularly related to realization of inventory, initial valuation and impairment of intangible assets and goodwill, collectability of receivables, and income taxes.
Concentrations of Credit Risk
The Company's sales are to agricultural and construction equipment customers principally in the states and European countries in which its stores are located. The Company extends credit to its customers in the ordinary course of business and monitors its customers' financial condition to minimize its risks associated with trade receivables; however, the Company does not generally require collateral on trade receivables.
The Company's cash balances are maintained in bank deposit accounts, which are in excess of federally insured limits.
63
Concentrations in Operations
The Company currently purchases new equipment, rental equipment and the related parts from a limited number of manufacturers. Although no change in suppliers is anticipated, the occurrence of such a change could cause a possible loss of sales and adversely affect operating results. The Company is the holder of authorized dealerships granted by CNH Industrial America, LLC and CNHI International SA (collectively referred to "CNH Industrial") whereby it has the right to act as an authorized dealer for the entities' equipment. The dealership authorizations and floorplan payable facilities can be canceled by the respective entity if the Company does not observe certain established guidelines and covenants.
In addition, the Company believes that the following factors related to concentrations in suppliers, and in particular CNH Industrial, have a significant impact on its operating results:
•
CNH Industrial's product offerings, reputation and market share
•
CNH Industrial's product prices and incentive and discount programs
•
Supply of inventory from CNH Industrial
•
CNH Industrial provides floorplan payable financing for the purchase of a substantial portion of its inventory
|
•
|
CNH Industrial provides a significant percentage of the financing used by its customers to purchase CNH Industrial equipment from the Company.
|
Receivables and Credit Policy
Trade accounts receivable due from customers are uncollateralized customer obligations due under normal trade terms requiring payment within
30 days
from the invoice date. Balances unpaid after 30 days are considered past due and begin to accrue interest. Payments of trade receivables are allocated to the specific invoices identified on the customer's remittance advice or, if unspecified, are applied to the earliest unpaid invoices. Trade accounts receivable due from manufacturers relate to discount programs, incentive programs and repair services performed on equipment with a remaining factory warranty. Trade accounts receivable due from finance companies primarily consist of contracts in transit with finance companies and balances due from credit card companies. These receivables do not generally have established payment terms but are collected in relatively short time periods.
The carrying amount of trade receivables is reduced by a valuation allowance that reflects management's best estimate of the amounts that will not be collected. Management reviews aged receivable balances and estimates the portion, if any, of the balance that will not be collected. Account balances are charged off after all appropriate means of collection have been exhausted and the potential for recovery is considered remote.
Inventories
New and used equipment are stated at the lower of cost (specific identification) or market value with adjustments for decreases in market value on inventory rented but available for sale, estimated as a percentage of the rental income received on such inventory. All new and used equipment inventories, including that which has been rented, are subject to periodic lower of cost or market evaluation that considers various factors including aging of equipment and market conditions. Equipment inventory values are adjusted whenever the carrying amount exceeds the estimated market value. Parts inventories are valued at the lower of average cost or market value. The Company estimates a reserve on its parts inventories based on various factors including aging and sales of each type of parts inventory. Work in process is valued at the retail rates of labor incurred and parts inventories used on service work in process at year end.
64
Property and Equipment
Property and equipment is carried at cost less accumulated depreciation and amortization. Depreciation and amortization are computed on a straight-line basis over the estimated useful life of each asset, as summarized below:
|
Buildings and leasehold improvements
|
Lesser of 10 - 40 years or lease term
|
|
Machinery and equipment
|
3 - 10 years
|
|
Furniture and fixtures
|
3 - 10 years
|
|
Vehicles
|
5 - 10 years
|
|
Rental fleet
|
3 - 10 years
|
Depreciation for income tax reporting purposes is computed using accelerated methods.
Goodwill
Goodwill represents the excess of the purchase price over the fair value of the net assets, including identifiable intangible assets, of the businesses acquired. Goodwill is not amortized, but is tested for impairment annually, or more frequently upon the occurrence of certain events or when circumstances indicate that impairment may be present. The Company performs its annual impairment test as of the end of its fiscal year.
Goodwill is tested for impairment at the reporting unit level. A reporting unit is defined as an operating segment or one level below an operating segment (referred to as a component). A component of an operating segment is a reporting unit if the component constitutes a business for which discrete financial information is available and segment management regularly reviews the operating results of that component. The Company identified
two
reporting units which carried a goodwill balance prior to impairment recorded in the current year: the Agriculture operating segment and the Serbian component within the International operating segment.
The goodwill impairment analysis is performed under a two-step impairment model. Step one of the analysis compares the estimated fair value of a reporting unit to its carrying value. If the fair value of a reporting unit exceeds its carrying amount, goodwill of the reporting unit is considered not impaired and the second step of the impairment test is unnecessary. However, if the carrying amount of a reporting unit exceeds its fair value, the second step of the impairment test is performed to measure the amount of impairment, if any. The second step measures the amount of impairment loss, if any, by comparing the implied fair value of goodwill, which is estimated by comparing the estimated fair value of the reporting unit as a whole to the fair value of the underlying assets and liabilities of the reporting unit. An impairment charge is recognized for any excess of the carrying value of goodwill over the implied fair value. See Note 5 for details and results of the Company's impairment testing in the years ended
January 31, 2015
and
2014
.
Intangible Assets
Intangible assets with a finite life consist of customer relationships and covenants not to compete, and are carried at cost less accumulated amortization. The Company amortizes the cost of identified intangible assets on a straight-line basis over the expected period of benefit, which is
three
years for customer relationships and the contractual term for covenants not to compete, which range from
three
to
ten
years.
Intangible assets with an indefinite life consist of distribution rights with manufacturers. Distribution rights are classified as an indefinite-lived intangible asset because the Company's distribution agreements continue indefinitely by their terms, or are routinely awarded or renewed without substantial cost or material modifications to the underlying agreements. As such, the Company believes that its distribution rights intangible assets will contribute to its cash flows for an indefinite period; therefore, the carrying amount of distribution rights is not amortized, but is tested for impairment annually, or more frequently upon the occurrence of certain events or when circumstances indicate that impairment may be present. The Company performs its annual impairment test as of December 31st of each year. The impairment test is performed by comparing the carrying value to its estimated fair value.
65
Indefinite-lived intangible assets are tested for impairment at the lowest level in which identifiable cash flows can be attributed to the asset. The Company has determined that the lowest level of cash flows which can be attributed to the distribution rights intangible assets is equal to the store, or complex of stores, acquired in the business combination which resulted in the initial recognition of the intangible asset, plus any additional store locations operating within the geographical area of the distribution rights. See Note 5 for details and results of the Company's impairment testing in the years ended
January 31, 2015
and
2014
.
Impairment of Long-Lived Assets
The Company's long-lived assets consist of its intangible assets and property and equipment. These assets are reviewed for potential impairment when events or circumstances indicate that the carrying value may not be recoverable. Recoverability is measured by comparing the estimated future undiscounted cash flows of such assets to their carrying values. If the estimated undiscounted cash flows exceed the carrying value, the carrying value is considered recoverable and no impairment recognition is required. However, if the sum of the undiscounted cash flows is less than the carrying value of the asset, the second step of the impairment analysis must be performed to measure the amount of the impairment, if any. The second step of the impairment analysis compares the estimated fair value of the long-lived asset to its carrying value and any amount by which the carrying value exceeds the fair value is recognized as an impairment charge.
As of January 31, 2015, the Company determined that the current period operating loss combined with historical losses and anticipated future operating losses within certain of its stores was an indication that certain long-lived assets of these stores may not be recoverable. The asset types included in the assessment included immovable long-lived assets (e.g., leasehold improvements) and other assets in which it would be impracticable to redeploy to other locations (e.g., furniture and fixtures). The Company performed the impairment analyses for these assets which have a combined carrying value of
$6.6 million
. In certain cases, the analysis indicated that the carrying value is not recoverable. The aggregate carrying value of such assets totaled
$1.2 million
. Based on this conclusion, we performed step two of the impairment analysis and estimated the fair value of these assets using the estimated selling prices of similar assets. Step two of the analysis indicated than an impairment charge in the amount
$0.4 million
was necessary. This impairment charge impacted the Agriculture segment and is included in the Impairment and Realignment Costs amount in the consolidated statements of operations. In all other cases, in which the aggregate carrying value of such assets totaled
$5.4 million
, the Company's analyses indicated that the carrying values are recoverable based on its estimates of future undiscounted cash flows under step one of the impairment analysis.
In addition, the Company recognized impairment charges of
$1.0 million
for certain long-lived assets associated with store locations closed during the year ended January 31, 2015. The impairment charges are included in the Impairment and Realignment Costs amount in the consolidated statements of operations. Impairment charges recognized for the Agriculture segment totaled
$0.6 million
,
$0.3 million
for the Construction segment and
$0.1 million
for the International segment.
As of January 31, 2014, the Company recognized impairment charges of
$1.5 million
, which is included in the Impairment and Realignment Costs amount in the consolidated statements of operations, for the impairment of Construction segment long-lived assets.
Derivative Instruments
In the normal course of business, the Company is subject to risk from adverse fluctuations in foreign currency exchange rates and benchmark interest rates. The Company manages its market risk exposures through a program that includes the use of derivative instruments, primarily foreign exchange forward contracts and interest rate derivatives. The Company's objective in managing its exposure to market risk is to minimize the impact on earnings, cash flows and the consolidated balance sheet. The Company does not use derivative instruments for trading or speculative purposes.
All outstanding derivative instruments are recognized in the consolidated balance sheet at fair value. The effect on earnings from recognizing the fair value of the derivative instrument depends on its intended use, the hedge designation, and the effectiveness in offsetting the exposure of the underlying hedged item. Changes in fair values of instruments designated to reduce or eliminate fluctuations in the fair values of recognized assets and liabilities and unrecognized firm commitments are reported currently in earnings along with the change in the fair value of the hedged items. Changes in the effective portion of the fair values of derivative instruments used to reduce or eliminate fluctuations in cash flows of forecasted transactions are reported in other comprehensive income, a component of stockholders' equity. Amounts accumulated in other comprehensive income are reclassified to earnings when the related hedged items affect earnings or the anticipated transactions are no longer probable. Changes in the fair value of derivative instruments designated to reduce or eliminate fluctuations in the net investment of a foreign subsidiary are reported in other comprehensive income. Changes in the fair value of derivative
66
instruments that are not designated as hedging instruments or do not qualify for hedge accounting treatment are reported currently in earnings.
For derivative instruments accounted for as hedging instruments, the Company formally designates and documents, at inception, the instrument as a hedge of a specific underlying exposure, the risk management objective and the manner by which the effectiveness of the hedging instrument will be evaluated. At each reporting period after inception, the Company evaluates the hedging instrument's effectiveness in reducing or eliminating the underlying hedged exposure. Any hedge ineffectiveness is recognized in earnings immediately.
Fair Value Measurements
Fair value is defined as the price that would be received for an asset or paid to transfer a liability (an exit price) in the principal or most advantageous market for the asset or liability in an orderly transaction between market participants. Three levels of inputs may be used to measure fair value:
Level 1—Values derived from unadjusted quoted prices in active markets for identical assets and liabilities.
Level 2—Values derived from observable inputs other than quoted prices that are observable for the asset or liability, either directly or indirectly, including quoted prices for similar assets or liabilities in active markets, or quoted prices for identical or similar assets in markets that are not active.
Level 3—Values derived from unobservable inputs for which there is little or no market data available, thereby requiring the reporting entity to develop its own assumptions.
In instances where the determination of the fair value measurement is based on inputs from different levels of the fair value hierarchy, the level in the fair value hierarchy within which the entire fair value measurement falls is based on the lowest level input that is significant to the fair value measurement in its entirety.
Customer Deposits
Customer deposits consist of advance payments from customers, in the form of cash or equipment to be traded-in.
Income Taxes
The Company uses the asset and liability method to account for income taxes. Under this method, deferred tax assets and liabilities are recognized for the expected future tax consequences of differences between the carrying amounts of assets and liabilities and their respective tax bases. Deferred tax assets are reduced by a valuation allowance when it is more likely than not that a portion or all of the deferred tax assets will not be realized. Changes in valuation allowances are included in its provision for income taxes in the period of the change.
The Company recognizes the financial statement benefit of income tax positions only if those positions are more likely than not of being sustained. Recognized income tax positions are measured as the largest amount that has a greater than 50% likelihood of being realized. Changes in the recognition or measurement of such positions are reflected in its provision for income taxes in the period of the change. The Company's policy is to recognize interest and penalties related to income tax matters within its provision for income taxes.
67
Earnings (Loss) Per Share ("EPS")
The Company uses the two-class method to calculate basic and diluted EPS. Unvested restricted stock awards are considered participating securities because they entitle holders to non-forfeitable rights to dividends during the vesting term. Under the two-class method, basic EPS were computed by dividing net income attributable to Titan Machinery Inc. after allocation of income (loss) to participating securities by the weighted-average number of shares of common stock outstanding during the year.
Diluted EPS were computed by dividing net income attributable to Titan Machinery Inc. after allocation of income (loss) to participating securities by the weighted-average shares of common stock outstanding after adjusting for potential dilution related to the conversion of all dilutive securities into common stock. All potentially dilutive securities were included in the computation of diluted EPS. There were approximately
221,000
,
99,000
and
10,000
stock options outstanding as of
January 31, 2015
,
2014
and
2013
, respectively, which were not included in the computation of diluted EPS because they were anti-dilutive. None of the approximately
3,474,000
shares underlying the Company's Senior Convertible Notes were included in the computation of diluted EPS because the Company's average stock price was less than the conversion price of
$43.17
.
The following table sets forth the calculation of the denominator for basic and diluted EPS:
|
2015
|
2014
|
2013
|
|||||||||
|
(in thousands, except per share data)
|
|||||||||||
|
Basic Weighted-Average Common Shares Outstanding
|
20,989
|
|
20,894
|
|
20,787
|
|
|||||
|
Plus: Incremental Shares From Assumed Exercise of Stock Options
|
—
|
|
146
|
|
200
|
|
|||||
|
Diluted Weighted-Average Common Shares Outstanding
|
20,989
|
|
21,040
|
|
20,987
|
|
|||||
|
Earnings (Loss) per Share - Basic
|
$
|
(1.51
|
)
|
$
|
0.42
|
|
$
|
2.02
|
|
||
|
Earnings (Loss) per Share - Diluted
|
$
|
(1.51
|
)
|
$
|
0.41
|
|
$
|
2.00
|
|
||
Revenue Recognition
Equipment revenue is generally recognized upon receipt of a signed sales contract and delivery of product to customers. However, in certain circumstances customers request a bill and hold arrangement, in which case equipment revenue is recognized before delivery occurs. Under these bill and hold arrangements, the equipment is available for shipment, the Company has fulfilled all of its pre-delivery performance obligations and received a signed sales contract, and the customer has completed and signed a bill and hold agreement. Credit terms on bill and hold arrangements are consistent with credit terms on all other equipment sales. In addition to outright sales of new and used equipment, certain rental agreements may include rent-to-purchase options. Under these agreements, customers are given a period of time to exercise an option to purchase the related equipment, with a portion of the rental payments being applied to reduce the purchase price. Payments received during the rental period are recorded as rental revenue. Any such equipment is included in inventory until the purchase option is exercised, and the carrying value of the equipment is reduced in accordance with the Company's aforementioned policy. Equipment revenue is recognized upon the exercise of the purchase option. Parts revenue is recognized upon delivery of product to customers. Service revenue is recognized at the time the related services are provided. Rental revenue is recognized over the period of the related rental agreement.
Sales, Excise and Value Added Taxes
The Company has customers in states and municipalities in which those governmental units impose a sales tax on certain sales. The U.S. federal government imposes excise taxes on certain sales. Certain governments of the foreign countries in which the Company operates impose value added taxes on certain sales. The Company collects those sales and excise taxes from its customers and remits the entire amount to the various governmental units. The Company's accounting policy is to exclude the tax collected and remitted from revenue and cost of revenue.
Shipping and Handling Costs
Shipping and handling costs are recorded as cost of revenue and amounts billed to customers for shipping and handling costs are recorded in revenue.
68
Lessor Accounting
The Company leases equipment from its rental fleet and equipment inventory to customers on operating leases over periods primarily less than
one year
. These leases require a minimum rental payment and contingent rental payment based on machine hours. Rental revenue totaled
$73.7 million
,
$68.6 million
and
$54.6 million
for the years ended
January 31, 2015
,
2014
and
2013
, respectively. As of
January 31, 2015
, the Company had
$148.2 million
of rental fleet included in property and equipment, net of accumulated depreciation of
$40.2 million
. As of
January 31, 2014
, the Company had
$145.0 million
of rental fleet included in property and equipment, net of accumulated depreciation of
$29.1 million
.
Manufacturer Incentives and Discounts
The Company receives various manufacturer incentives and discounts, which are based on a variety of factors. Discounts and incentives related to the purchase of inventory are recognized as a reduction of inventory prices and recognized as a reduction of cost of revenue when the related inventory is sold. Financing-related incentives are recognized as other income when earned. Other incentives, reflecting reimbursement of qualifying expenses, are recognized as a reduction of the related expense when earned.
Advertising Costs
Costs incurred for producing and distributing advertising are expensed as incurred. Advertising expense amounted to
$5.5 million
,
$5.9 million
and
$5.6 million
for the years ended
January 31, 2015
,
2014
and
2013
, respectively.
Comprehensive Income and Foreign Currency Matters
For the Company, comprehensive income represents net income adjusted for foreign currency items, including foreign currency translation adjustments and unrealized gains or losses on net investment hedge, interest rate and cash flow derivative instruments. For its foreign subsidiaries in which their local currency is their functional currency, assets and liabilities are translated into U.S. dollars at the balance sheet date exchange rate. Income and expenses are translated at average exchange rates for the year. Foreign currency translation adjustments are recorded directly as other comprehensive income, a component of stockholders' equity. For its foreign subsidiaries in which the local currency is not the functional currency, prior to translation into U.S. dollars, amounts must first be remeasured from the local currency into the functional currency. Nonmonetary assets and liabilities are remeasured at historical exchange rates and monetary assets and liabilities are remeasured at the balance sheet date exchange rate. Income and expenses are remeasured at average exchange rates for the year. Foreign currency remeasurement adjustments are included in the statement of operations.
The Company recognized a net foreign currency transaction gain (loss) of
$(12.3) million
and
$0.9 million
for the years ended January 31, 2015 and 2013, respectively. The net foreign currency transaction loss for the year ended January 31, 2015 primarily includes
$6.1 million
losses related to intercompany loans to its foreign subsidiaries and
$5.8 million
related to foreign currency remeasurement losses resulting from the devaluation of the Ukrainian hryvnia. The impact of foreign currency transactions was immaterial for the year ended January 31, 2014. The Company hedges its intercompany loan balances; the gains and losses on such instruments are disclosed in Note 9, which substantially offset the related foreign currency gains or losses.
Stock-Based Compensation
The Company accounts for stock-based compensation at the fair value of the related equity instrument over the applicable service or performance period. Additional information regarding stock-based compensation is summarized in Note 15.
Business Combinations
The Company accounts for business combinations by allocating the purchase price amongst the assets acquired, including identifiable intangible assets, and liabilities assumed based on the fair values of the acquired assets and assumed liabilities. The acquisition accounting is finalized during the measurement period, which may not exceed one year from the date of acquisition. During the measurement period the Company's accounting for the business combination transaction may be based on estimates due to various unknown factors present at the date of acquisition.
69
Exit and Disposal Costs
Costs related to exit or disposal activities, including store closures, for the Company primarily include lease termination costs, employee termination costs and other costs associated with moving assets and vacating the stores. The Company records a liability at the net present value of the remaining lease obligations, net of estimated sublease income, as of the date the Company ceases using the property. Any subsequent adjustments to that liability as a result of changes in estimates are recorded in the period incurred. The Company records a liability for employee termination costs at the date the termination benefits were communicated to the employees. Other related costs are expensed as incurred. Information regarding such transactions is disclosed in Note 19.
Held for Sale
The Company accounts for a disposal group as held for sale once a plan to sell the asset has been approved and initiated, the disposal group is being actively marketed and is expected to sell within one year, and is available for immediate sale. The disposal group includes assets expected to be included in the sale and liabilities directly associated with those assets that are expected to be transferred in the sale transaction. Any assets and liabilities associated with the disposal group that are not expected to transfer in a sale transaction are excluded from the disposal group and are therefore presented in the respective line items in the consolidated balance sheets.
Segment Reporting
The Company operates its business in
three
reportable segments, the Agriculture, Construction and International segments. Information regarding these segments is disclosed in Note 21.
Recent Accounting Guidance
In April 2014, the Financial Accounting Standards Board ("FASB") amended authoritative guidance on reporting discontinued operations and disclosures of disposals of components of an entity, codified in Accounting Standard Codification ("ASC") 205-20,
Discontinued Operations
and 360,
Property, Plant, and Equipment
. The amended guidance changed the criteria for reporting discontinued operations, to only include disposals that represent a strategic shift and have a major effect on the entity's operations and financial results. The amended guidance also requires entities to provide additional disclosure of disposals reported as discontinued operations, and for disposals that do not qualify for discontinued operations presentation. The Company adopted this guidance on January 31, 2015. Its adoption did not have a material effect on the Company's consolidated financial statements.
In May 2014, the FASB issued authoritative guidance on accounting for revenue recognition, codified in ASC 606,
Revenue from Contracts with Customers
. This guidance supersedes the revenue recognition requirements in ASC 605,
Revenue Recognition
. This guidance is based on the principle that revenue is recognized to depict the transfer of goods or services to customers in an amount that reflects the consideration to which the entity expects to be entitled in exchange for those goods or services. The guidance also requires additional disclosure about the nature, amount, timing and uncertainty of revenue and cash flows arising from customer contracts, including significant judgments and changes in judgments and assets recognized from costs incurred to obtain or fulfill a contract. The Company will adopt this guidance on February 1, 2017, using one of two retrospective application methods. The Company has not determined the potential effects on the consolidated financial statements.
In August 2014, the FASB issued authoritative guidance on management's responsibility to evaluate whether there is substantial doubt about an entity's ability to continue as a going concern and provide related footnote disclosures, codified in ASC 205-40,
Going Concern
. The guidance provides a definition of the term substantial doubt, requires an evaluation every reporting period including interim periods, provides principles for considering the mitigating effect of management’s plans, requires certain disclosures when substantial doubt is alleviated as a result of consideration of management’s plans, requires an express statement and other disclosures when substantial doubt is not alleviated, and requires an assessment for a period of one year after the date that the financial statements are issued (or available to be issued). The Company will adopt this guidance for the year-ended January 31, 2017, and it will apply to each interim and annual period thereafter. Its adoption is not expected to have a material effect on the Company's consolidated financial statements.
In April 2015, the FASB amended authoritative guidance on debt issuance costs, codified in ASC 835-30, Imputation of Interest. The amended guidance changes the balance sheet presentation of debt issuance costs to be a direct deduction from the related debt liability rather than an asset. This guidance is effective for the Company on February 1, 2016, with early adoption permitted. Its adoption is not expected to have a material effect on the Company's consolidated financial statements.
70
|
January 31, 2015
|
January 31, 2014
|
||||||
|
(in thousands)
|
|||||||
|
Trade accounts receivable
|
|||||||
|
Due from customers
|
$
|
46,526
|
|
$
|
53,870
|
|
|
|
Due from finance companies
|
15,489
|
|
20,154
|
|
|||
|
Due from manufacturers
|
18,480
|
|
26,624
|
|
|||
|
Total trade accounts receivable
|
80,495
|
|
100,648
|
|
|||
|
Other receivables
|
105
|
|
909
|
|
|||
|
80,600
|
|
101,557
|
|
||||
|
Less allowance for doubtful accounts
|
(4,218
|
)
|
(3,663
|
)
|
|||
|
$
|
76,382
|
|
$
|
97,894
|
|
||
|
January 31, 2015
|
January 31, 2014
|
||||||
|
(in thousands)
|
|||||||
|
New equipment
|
$
|
442,984
|
|
$
|
575,518
|
|
|
|
Used equipment
|
318,308
|
|
363,755
|
|
|||
|
Parts and attachments
|
107,893
|
|
126,666
|
|
|||
|
Work in process
|
10,255
|
|
10,039
|
|
|||
|
$
|
879,440
|
|
$
|
1,075,978
|
|
||
As of January 31, 2014, in addition to the above amounts, the Company estimated that a portion of its parts inventory would not be sold in the next year and accordingly presented this amount as noncurrent assets. As of January 31, 2015, no amount is presented as noncurrent assets as the Company expects to sell or otherwise dispose of all of its parts inventories within the next year.
|
January 31, 2015
|
January 31, 2014
|
||||||
|
(in thousands)
|
|||||||
|
Rental fleet equipment
|
$
|
148,198
|
|
$
|
145,007
|
|
|
|
Machinery and equipment
|
24,071
|
|
23,382
|
|
|||
|
Vehicles
|
43,435
|
|
44,200
|
|
|||
|
Furniture and fixtures
|
39,421
|
|
35,860
|
|
|||
|
Land, buildings, and leasehold improvements
|
57,630
|
|
60,470
|
|
|||
|
312,755
|
|
308,919
|
|
||||
|
Less accumulated depreciation
|
(104,075
|
)
|
(80,919
|
)
|
|||
|
$
|
208,680
|
|
$
|
228,000
|
|
||
Depreciation expense amounted to
$31.2 million
,
$30.0 million
and
$22.7 million
for the years ended
January 31, 2015
,
2014
and
2013
, respectively.
71
The following is a summary of intangible assets with finite lives as of
January 31, 2015
and
2014
:
|
January 31, 2015
|
January 31, 2014
|
||||||||||||||||||||||
|
Cost
|
Accumulated
Amortization
|
Net
|
Cost
|
Accumulated
Amortization
|
Net
|
||||||||||||||||||
|
(in thousands)
|
(in thousands)
|
||||||||||||||||||||||
|
Covenants not to compete
|
$
|
2,078
|
|
$
|
(1,521
|
)
|
$
|
557
|
|
$
|
2,498
|
|
$
|
(1,424
|
)
|
$
|
1,074
|
|
|||||
|
Customer relationships
|
1,188
|
|
(1,169
|
)
|
19
|
|
1,330
|
|
(1,119
|
)
|
211
|
|
|||||||||||
|
$
|
3,266
|
|
$
|
(2,690
|
)
|
$
|
576
|
|
$
|
3,828
|
|
$
|
(2,543
|
)
|
$
|
1,285
|
|
||||||
The Company acquired intangible assets with finite lives, consisting of covenants not to compete totaling
$0.2 million
with a weighted-average amortization period of
5.0 years
, as part of the business combinations completed during the year ended
January 31, 2014
. The Company did not acquire intangible assets with finite lives during the year ended January 31, 2015. Amortization expense was
$0.6 million
,
$0.8 million
and
$0.8 million
for the years ended
January 31, 2015
,
2014
and
2013
, respectively.
Future amortization expense, as of
January 31, 2015
, is expected to be as follows:
|
Years ending January 31,
|
Amount
|
||
|
(in thousands)
|
|||
|
2016
|
$
|
322
|
|
|
2017
|
135
|
|
|
|
2018
|
73
|
|
|
|
2019
|
27
|
|
|
|
2020
|
15
|
|
|
|
Thereafter
|
4
|
|
|
|
$
|
576
|
|
|
Changes in the carrying amount of indefinite lived intangible assets, which consisted entirely of distribution rights, during the years ended
January 31, 2015
and
2014
are summarized as follows:
|
Agriculture
|
Construction
|
International
|
Total
|
||||||||||||
|
(in thousands)
|
|||||||||||||||
|
Balance at January 31, 2013
|
$
|
9,584
|
|
$
|
1,045
|
|
$
|
1,577
|
|
$
|
12,206
|
|
|||
|
Arising in completed business combinations
|
—
|
|
149
|
|
—
|
|
149
|
|
|||||||
|
Impairment
|
—
|
|
(1,122
|
)
|
(830
|
)
|
(1,952
|
)
|
|||||||
|
Foreign currency translation adjustment
|
—
|
|
—
|
|
62
|
|
62
|
|
|||||||
|
Balance at January 31, 2014
|
9,584
|
|
72
|
|
809
|
|
10,465
|
|
|||||||
|
Arising in completed business combinations
|
—
|
|
—
|
|
—
|
|
—
|
|
|||||||
|
Impairment
|
(4,774
|
)
|
—
|
|
(724
|
)
|
(5,498
|
)
|
|||||||
|
Foreign currency translation adjustment
|
—
|
|
—
|
|
(85
|
)
|
(85
|
)
|
|||||||
|
Balance at January 31, 2015
|
$
|
4,810
|
|
$
|
72
|
|
$
|
—
|
|
$
|
4,882
|
|
|||
The Company performs the annual impairment testing of its indefinite lived distribution rights intangible assets as of December 31st of each year. Under the impairment test, the fair value of distribution rights intangible assets is estimated based on a multi-period excess earnings model, an income approach. This model allocates future estimated earnings of the store/complex amongst working capital, fixed assets and other intangible assets of the store/complex and any remaining earnings (the “excess earnings”) are allocated to the distribution rights intangible assets. The earnings allocated to the distribution rights are then discounted to arrive at the present value of the future estimated excess earnings, which represents the estimated fair value of the distribution rights intangible asset. The discount rate applied reflects the Company's estimate of the weighted-average cost of capital of comparable companies plus an additional risk premium to reflect the additional risk inherent in the distribution right asset.
72
The results of the Company's impairment testing for each of the years ended
January 31, 2015
and
2014
indicated that the estimated fair value of certain distribution rights assets approximated
zero
, thus requiring a full impairment charge equal to the carrying values of such assets. In total, impairment charges of
$5.5 million
and
$2.0 million
were recognized and included in the Impairment and Realignment Costs amount in the consolidated statements of operations during the years ended
January 31, 2015
and
2014
, respectively. The impairment charges arose as the result lowered expectations of the future financial performance of these stores/complexes. The Company's assumptions about future financial performance were impacted by the current year operating performance of these stores/complexes and by the anticipated impact that challenging industry conditions may have on the future financial performance of these stores/complexes.
Changes in the carrying amount of goodwill during the years ended
January 31, 2015
and
2014
are summarized as follows:
|
Agriculture
|
Construction
|
International
|
Total
|
||||||||||||
|
(in thousands)
|
|||||||||||||||
|
Balance at January 31, 2013
|
$
|
24,642
|
|
$
|
5,267
|
|
$
|
994
|
|
$
|
30,903
|
|
|||
|
Arising in completed business combinations
|
—
|
|
71
|
|
—
|
|
71
|
|
|||||||
|
Impairment
|
—
|
|
(5,338
|
)
|
(923
|
)
|
(6,261
|
)
|
|||||||
|
Foreign currency translation adjustment
|
—
|
|
—
|
|
38
|
|
38
|
|
|||||||
|
Balance at January 31, 2014
|
24,642
|
|
—
|
|
109
|
|
24,751
|
|
|||||||
|
Arising in completed business combinations
|
—
|
|
—
|
|
—
|
|
—
|
|
|||||||
|
Impairment
|
(24,642
|
)
|
—
|
|
(97
|
)
|
(24,739
|
)
|
|||||||
|
Foreign currency translation adjustment
|
—
|
|
—
|
|
(12
|
)
|
(12
|
)
|
|||||||
|
Balance at January 31, 2015
|
$
|
—
|
|
$
|
—
|
|
$
|
—
|
|
$
|
—
|
|
|||
The Company performs its annual impairment testing of goodwill at the end of each fiscal year. Under the impairment test, the fair value of its reporting units is estimated using both a market approach which applies multiples of earnings before interest, taxes, depreciation and amortization of comparable guideline public companies to that of the Company's reporting units, and an income approach in which a discounted cash flow analysis is utilized which includes a
five
-year forecast of future operating performance for each of the reporting units and a terminal value which estimates sustained long-term growth. The discount rate applied to the estimated future cash flows reflects an estimate of the weighted-average cost of capital of comparable companies.
Step one of the goodwill impairment analysis for each of the Company's Agriculture reporting unit and Serbian reporting unit indicated that the estimated fair value of each reporting unit was less than the carrying value, thus requiring the performance of step two of the impairment analysis. In each instance, the second step of the impairment analysis indicated that the implied fair value of the goodwill associated with the reporting unit approximated
zero
, thus requiring a full impairment charge of the goodwill carrying value of each reporting unit. As such, a total goodwill impairment charge of
$24.7 million
was recognized as of January 31, 2015 and included in the Impairment and Realignment Costs amount in the consolidated statements of operations. The impairment charges recognized during the year ended January 31, 2015 within the Agriculture and Serbian reporting units arose as the result of lowered expectations of future financial performance of these reporting units and a lower market capitalization for the Company as a whole. The assumptions about future financial performance were impacted by the current year operating performance and by the anticipated impact that challenging industry conditions existing as of the assessment date and anticipated to be present over the near-term may have on the future financial performance of these reporting units. During the year ended January 31,
2014
, the Company recognized
$6.3 million
of impairment charges associated with goodwill in its Construction and Romanian reporting units.
73
Floorplan payable balances reflect the amount owed for new equipment inventory purchased from a manufacturer and used equipment inventory, which is primarily purchased through trade-in on equipment sales. Certain of the manufacturers from which the Company purchases new equipment inventory offer financing on these purchases, either offered directly from the manufacturer or through the manufacturers’ captive finance subsidiaries. CNH Industrial's captive finance subsidiaries, CNH Industrial Capital, also provides financing of used equipment inventory. The Company also has floorplan payable balances with non-manufacturer lenders for new and used equipment inventory. Changes in manufacturer floorplan payable are reported as operating cash flows and changes in non-manufacturer floorplan payable are reported as financing cash flows in the Company's consolidated statements of cash flows. The Company has three significant floorplan lines of credit, credit facilities related to its foreign subsidiaries, and other floorplan payable balances with non-manufacturer lenders and manufacturers other than CNH Industrial.
As of
January 31, 2015
, the Company had discretionary floorplan payable lines of credit for equipment purchases totaling approximately
$1.2 billion
, which includes a
$350.0 million
Floorplan Payable Line with a group of banks led by Wells Fargo Bank, National Association ("Wells Fargo"), a
$450.0 million
credit facility with CNH Industrial Capital, a
$225.0 million
credit facility with Agricredit Acceptance LLC ("Agricredit") and the U.S. dollar equivalent of
$133.0 million
in credit facilities related to its foreign subsidiaries. Floorplan payable relating to these credit facilities totaled approximately
$594.1 million
of the total floorplan payable balance of
$627.2 million
outstanding as of
January 31, 2015
and
$692.8 million
of the total floorplan payable balance of
$750.5 million
outstanding as of
January 31, 2014
; the remaining outstanding balances relate to equipment inventory financing from manufacturers and non-manufacturer lenders other than the aforementioned lines of credit. These floorplan payables carried various interest rates primarily ranging from
3.05%
to
5.01%
as of
January 31, 2015
, subject to interest-free periods offered by CNH Industrial Capital. As a result of the amendments to the Wells Fargo and Agricredit credit facilities discussed below, and without adjusting the U.S. dollar amount of the Company's credit facilities related to its foreign subsidiaries based on current foreign currency exchange rates, the Company's total discretionary floorplan payable lines of credit for equipment purchases was reduced to approximately
$1.1 billion
as of April 2015. The following provides additional information regarding each of the Company's three significant floorplan lines of credit.
Senior Secured Credit Facility—Operating and Floorplan Payable Lines of Credit
As of
January 31, 2015
, the Company had an amended and restated credit agreement with Wells Fargo, which provided for a
$350.0 million
wholesale floorplan line of credit (the "Floorplan Payable Line") and a
$112.5 million
working capital line of credit (the "Working Capital Line"). The amount available under the Floorplan Payable Line is reduced by amounts outstanding, borrowing base calculations and various standby letters of credit used to guarantee equipment purchases from CNH Industrial by the Company's foreign subsidiaries. The credit agreement has a variable interest rate on outstanding balances of
LIBOR
plus an applicable margin of
1.5%
to
2.875%
per annum, depending upon the Company's consolidated leverage ratio, has a
0.3%
to
0.4%
non-usage fee on the average monthly unused amount and requires monthly payments of accrued interest. The credit agreement is secured by all assets of the Company, requires prior approval of acquisitions exceeding certain thresholds and contains certain financial covenants. The significant financial covenants include a minimum fixed charge coverage ratio of
1.25
: 1.00; a maximum net leverage ratio of
3.00
: 1.00 as of January 31, 2015 and April 30, 2015,
2.75
: 1.00 as of July 31, 2015 and October 31, 2015, and
2.50
: 1.00 for each period thereafter; and a minimum income before income tax covenant of a loss of
$11.0 million
for the three months ended April 30, 2015, a loss of
$9.0 million
for the six months ended July 31, 2015, income of
$1.0 million
for the nine months ended October 31, 2015 and income of
$10.0 million
for the trailing four quarters for each period thereafter. There was
no
minimum consolidated income before income taxes covenant for the fiscal year ended January 31, 2015. The minimum consolidated income before income taxes covenant is calculated as the income before income taxes for the applicable quarters, adjusted for realignment charges recognized in the three months ended April 30, 2015. The credit agreement also restricts the Company's ability to make certain cash payments without prior approval, including payments for stock repurchases and cash dividends, except that it permits paying cash dividends in an amount not to exceed
50%
of consolidated net income for the then trailing
four
quarters, so long as no default or event of default exists prior to or immediately following such action or otherwise results from such action. The credit agreement expires
August 31, 2018
.
Effective April 10, 2015, the Company amended its credit facility with Wells Fargo to change certain financial covenants, reduce the available lines of credit and change the interest rate, among other things. The minimum consolidated income before income taxes covenant was eliminated for the fiscal year ended January 31, 2015, and changed to the aforementioned minimum consolidated income before income taxes covenant amounts, from the previous minimum income before income tax covenants of
$5.0 million
for the period ended January 31, 2015,
$6.0 million
for each of the two periods ended April 30, 2015 and July 31, 2015,
$10.0 million
for each of the two periods ended October 31, 2015 and January 31, 2016, and
$15.0 million
for each period thereafter. The maximum net leverage ratio was changed from
3.0
: 1.00 for all periods
74
to the aforementioned net leverage ratio covenant amounts. The Floorplan Payable Line was reduced from
$350.0 million
to
$275.0 million
and the Working Capital Line was reduced from
$112.5 million
to
$87.5 million
. The interest rate margin was changed from a range of
1.5%
to
2.875%
to a range of
1.5%
to
3.125%
per annum, depending upon results of the Company's consolidated leverage ratio and consolidated income before income taxes. The credit facility with Wells Fargo was previously amended effective October 31, 2014 to replace the consolidated net income financial covenant with a minimum consolidated income before income taxes covenant, modify certain borrowing base advance rates, and change the interest rate margin from
1.5%
to
2.625%
to
1.5%
to
2.875%
per annum, among other things.
The Floorplan Payable Line is used to finance equipment inventory purchases. Amounts outstanding are recorded as floorplan payable, within current liabilities on the consolidated balance sheets, as the Company intends to repay amounts borrowed within one year.
The Working Capital Line is used to finance working capital requirements of the Company. Amounts outstanding are recorded as long-term debt, within long-term liabilities on the consolidated balance sheets, as the Company does not have the intention or obligation to repay amounts borrowed within one year. The balances outstanding on the Working Capital Line as of
January 31, 2015
and
2014
are disclosed in Note 8.
CNH Industrial Capital Floorplan Payable Line of Credit
As of
January 31, 2015
, the Company had a
$450.0 million
credit facility with CNH Industrial Capital. The available borrowings under the CNH Industrial Capital credit facility are reduced by outstanding floorplan payable and other acquisition-related financing arrangements with CNH Industrial Capital. The CNH Industrial Capital credit facility has interest rates equal to the
prime
rate plus
4%
on new borrowings, subject to any interest-free periods offered by CNH Industrial Capital, and automatically renews on August 31 of each year unless earlier terminated by either party. Repayment terms vary by individual notes, but generally payments are made from sales proceeds or rental revenue from the related inventories. The balances outstanding with CNH Industrial Capital are secured by the inventory purchased with the floorplan proceeds. The CNH Industrial Capital credit facility contains certain financial covenants that impose a maximum level of adjusted debt to tangible net worth of
3.0
: 1.0 and minimum fixed charge coverage ratio financial covenant of not less than
1.25
: 1.00. It also contains various restrictive covenants that require prior consent of CNH Industrial Capital if the Company desires to engage in any acquisition of, consolidation or merger with any other business entity in which the Company is not the surviving company; create subsidiaries; move any collateral outside of the U.S.; or sell, rent, lease or otherwise dispose or transfer any of the collateral, other than in the ordinary course of business. CNH Industrial Capital's consent is also required for the acquisition of any CNH Industrial dealership. In addition, the CNH Industrial Capital credit facility restricts the Company's ability to incur any liens upon any substantial part of its assets.
Effective October 31, 2014, the Company amended its credit facility with CNH Industrial Capital. The amendment, among other things, replaced the minimum debt service ratio financial covenant with the aforementioned minimum fixed charge coverage ratio financial covenant, and added or modified related definitions.
Agricredit Floorplan Payable Line of Credit
As of
January 31, 2015
, the Company had a
$225.0 million
credit facility with Agricredit. The Agricredit credit facility may be used to purchase or refinance new and used equipment inventory and has a variable interest rate on outstanding balances of
LIBOR
plus an applicable margin of
4.75%
to
5.25%
per annum, depending upon the Company's average daily outstanding balance. The Agricredit credit facility allows for increase, decrease or termination of the credit facility by Agricredit on
90 days
notice. Under covenants of the Agricredit credit facility, the Company had agreed, among other things, to maintain certain financial covenants that impose a minimum fixed charge coverage ratio of
1.25
: 1.00 and a maximum net leverage ratio of
3.00
: 1.00, to submit certain financial information, and to obtain prior consent from Agricredit if the Company desired to engage in any acquisition meeting certain financial thresholds. The balances outstanding with Agricredit are secured by the inventory purchased with the floorplan proceeds. Repayment terms vary by individual notes, but generally payments are made from sales proceeds or rental revenue from the related inventories.
Effective April 1, 2015, the Company amended its credit facility with Agricredit, which, among other things, decreased its available borrowings under the credit facility from
$225.0 million
to
$200.0 million
.
75
On April 24, 2012, the Company issued through a private offering
$150 million
of 3.75% Senior Convertible Notes (the "Senior Convertible Notes"). The Senior Convertible Notes bear interest at a rate of
3.75%
per year, payable semi-annually in arrears on May 1 and November 1 of each year, commencing on November 1, 2012. The Convertible Notes mature on May 1, 2019, unless earlier purchased by the Company, redeemed or converted.
The Senior Convertible Notes are unsecured and unsubordinated obligations; rank equal in right of payment to the Company's existing and future unsecured indebtedness that is not subordinated; are effectively subordinated in right of payment to the Company's existing and future secured indebtedness; and are structurally subordinated to all existing and future indebtedness and liabilities of the Company's subsidiaries.
The Senior Convertible Notes are initially convertible into the Company's common stock at a conversion rate of 23.1626 shares of common stock per $1,000 principal amount of convertible notes, representing an initial effective conversion price of
$43.17
per share of common stock. The conversion rate may be subject to adjustment upon the occurrence of certain specified events as provided in the indenture governing the Senior Convertible Notes, dated April 24, 2012 between the Company and Wells Fargo Bank, National Association, as trustee (the "Indenture"), but will not be adjusted for accrued but unpaid interest. Upon conversion of a Senior Convertible Note, the Company will settle the conversion obligation in cash up to the aggregate principal amount of the Senior Convertible Note being converted, and any conversion obligation in excess thereof will be settled in cash, shares of the Company's common stock, or a combination thereof, at the Company's election, subject to certain limitations as defined in the Indenture.
Holders of the Senior Convertible Notes may convert their notes at the applicable conversion rate under the following circumstances:
|
i.
|
During any fiscal quarter commencing after July 31, 2012, if for at least 20 trading days (whether or not consecutive) during the
30
consecutive trading day period ending on the last trading day of the immediately preceding fiscal quarter, the last reported sale price of the Company's common stock on such trading day is greater than or equal to
120%
of the applicable conversion price on such trading day.
|
|
ii.
|
During the
five
consecutive business day period immediately following any
five
consecutive trading day period in which, for each trading day of that period, the trading price per $1,000 principal amount of the Senior Convertible Notes is less than
98%
of the product of the last reported sale price of the Company's common stock on such trading day and the applicable conversion rate on such trading day.
|
|
iii.
|
If the Company calls any or all of the Senior Convertible Notes for redemption at any time prior to the close of business on the business day immediately preceding the redemption date.
|
|
iv.
|
Upon the occurrence of corporate transactions specified in the Indenture.
|
|
v.
|
At any time on and after February 1, 2019 until the close of business on the business day immediately preceding the maturity date.
|
Holders of the Senior Convertible Notes who convert their Senior Convertible Notes in connection with a make-whole fundamental change, as defined in the Indenture, may be entitled to a make-whole premium in the form of an increase to the conversion rate. In addition, upon the occurrence of a fundamental change, as defined in the Indenture, holders of the Senior Convertible Notes may require the Company to purchase all or a portion of their Senior Convertible Notes for cash at a price equal to
100%
of the principal amount of the Senior Convertible Notes to be purchased plus any accrued but unpaid interest.
The number of shares the Company may deliver upon conversion of the Senior Convertible Notes will be subject to certain limitations, and the Company is subject to certain other obligations and restrictions related to such share caps, as described in the Indenture. On or after May 6, 2015, the Company may redeem for cash all or a portion of the Senior Convertible Notes if the last reported sale price of the Company's common stock has been at least
120%
of the conversion price then in effect for at least
20
trading days (whether or not consecutive) during any
30
consecutive trading day period ending on, and including, the trading day immediately preceding the date on which the Company provides notice of redemption.
The Indenture provides for customary events of default, including, but not limited to, cross acceleration to certain other indebtedness of the Company and its subsidiaries. In the case of an event of default arising from specified events of bankruptcy or insolvency, all outstanding Senior Convertible Notes will become due and payable immediately without further action or notice. If any other event of default under the Indenture occurs or is continuing, the trustee or holders of at least
25%
76
in aggregate principal amount of the then outstanding Senior Convertible Notes may declare all of the Senior Convertible Notes to be due and payable immediately.
In accounting for the Senior Convertible Notes, the Company segregated the liability component of the instrument from the equity component. The liability component was measured by estimating the fair value of a non-convertible debt instrument that is similar in its terms to the Senior Convertible Notes. Fair value was estimated through discounting future interest and principal payments, an income approach, due under the Senior Convertible Notes at a discount rate of
7.00%
, an interest rate equal to the estimated borrowing rate for similar non-convertible debt. The excess of the aggregate face value of the Senior Convertible Notes over the estimated fair value of the liability component is recognized as a debt discount which will be amortized over the expected life of the Senior Convertible Notes using the effective interest rate method. Amortization of the debt discount is recognized as non-cash interest expense.
The equity component of the Senior Convertible Notes is measured as the residual difference between the aggregate face value of the Senior Convertible Notes and the estimated aggregate fair value of the liability component. The equity component will not be remeasured in subsequent periods provided that the component continues to meet the conditions necessary for equity classification.
The transaction costs incurred in connection with the issuance of the Senior Convertible Notes were allocated to the liability and equity components based on their relative values. Transaction costs allocated to the liability component are being amortized using the effective interest rate method and recognized as non-cash interest expense over the expected term of the Senior Convertible Notes. Transaction costs allocated to the equity component reduced the value of the equity component recognized in stockholders' equity.
Proceeds upon issuance of the Senior Convertible Notes were as follows:
|
April 24, 2012
|
|||
|
(in thousands)
|
|||
|
Principal value
|
$
|
150,000
|
|
|
Less: transaction costs
|
(4,753
|
)
|
|
|
Net proceeds, senior convertible notes
|
$
|
145,247
|
|
|
Amounts recognized at issuance:
|
|||
|
Senior convertible notes, net
|
$
|
123,319
|
|
|
Additional paid-in capital
|
15,546
|
|
|
|
Transaction costs allocated to the liability component
|
(3,907
|
)
|
|
|
Long-term deferred tax liability
|
10,289
|
|
|
|
Net proceeds, senior convertible notes
|
$
|
145,247
|
|
As of
January 31, 2015
and
2014
, the Senior Convertible Notes consisted of the following:
|
January 31, 2015
|
January 31, 2014
|
||||||
|
(in thousands, except conversion rate and conversion price)
|
|||||||
|
Principal value
|
$
|
150,000
|
|
$
|
150,000
|
|
|
|
Unamortized debt discount
|
(17,650
|
)
|
(21,107
|
)
|
|||
|
Carrying value of senior convertible notes
|
$
|
132,350
|
|
$
|
128,893
|
|
|
|
Carrying value of equity component, net of deferred taxes
|
$
|
15,546
|
|
$
|
15,546
|
|
|
|
Conversion rate (shares of common stock per $1,000 principal amount of notes)
|
23.1626
|
|
|||||
|
Conversion price (per share of common stock)
|
$
|
43.17
|
|
||||
77
The Company recognized interest expense associated with its Senior Convertible Notes as follows:
|
2015
|
2014
|
2013
|
|||||||||
|
(in thousands)
|
|||||||||||
|
Cash Interest Expense
|
|||||||||||
|
Coupon interest expense
|
$
|
5,625
|
|
$
|
5,625
|
|
$
|
4,328
|
|
||
|
Noncash Interest Expense
|
|||||||||||
|
Amortization of debt discount
|
3,457
|
|
3,227
|
|
2,347
|
|
|||||
|
Amortization of transaction costs
|
538
|
|
524
|
|
385
|
|
|||||
|
$
|
9,620
|
|
$
|
9,376
|
|
$
|
7,060
|
|
|||
As of
January 31, 2015
, the unamortized debt discount will be amortized over a remaining period of approximately
4.25 years
. The if-converted value as of
January 31, 2015
does not exceed the principal balance of the Senior Convertible Notes. The effective interest rate of the liability component was equal to
7%
for each of the statements of operations periods presented.
The following is a summary of long-term debt as of
January 31, 2015
and
2014
:
|
January 31, 2015
|
January 31, 2014
|
||||||
|
(in thousands)
|
|||||||
|
Fixed rate notes payable to Wells Fargo Bank, N.A., interest rates of 3.96%, monthly interest payments with the principal payment due February 2016, secured by rental fleet equipment
|
$
|
21,333
|
|
$
|
33,982
|
|
|
|
Fixed rate notes payable to various finance companies, interest rates primarily ranging from 2.94% to 10.23%, due in monthly installments including interest and various maturity dates through November 2019, secured by fixed assets
|
18,890
|
|
15,878
|
|
|||
|
Working Capital Line payable to Wells Fargo (see details in Note 6)
|
18,719
|
|
47,823
|
|
|||
|
Variable rate notes payable to GE Commercial Distribution Finance Corporation, interest rate of LIBOR + 3.24%, monthly installment payments including interest, maturity dates from September to December 2018, secured by rental fleet equipment
|
14,489
|
|
—
|
|
|||
|
Other
|
1,441
|
|
41
|
|
|||
|
74,872
|
|
97,724
|
|
||||
|
Less current maturities
|
(7,749
|
)
|
(2,192
|
)
|
|||
|
$
|
67,123
|
|
$
|
95,532
|
|
||
Long-term debt maturities are as follows:
|
Years Ending January 31,
|
Amount
|
||
|
(in thousands)
|
|||
|
2016
|
$
|
7,749
|
|
|
2017
|
29,259
|
|
|
|
2018
|
5,090
|
|
|
|
2019
|
22,008
|
|
|
|
2020
|
807
|
|
|
|
Thereafter
|
9,959
|
|
|
|
$
|
74,872
|
|
|
78
The Company holds derivative instruments for the purpose of minimizing exposure to fluctuations in foreign currency exchange rates and benchmark interest rates to which the Company is exposed in the normal course of its operations.
Net Investment Hedges
To protect the value of the Company's investments in its foreign operations against adverse changes in foreign currency exchange rates, the Company may, from time to time, hedge a portion of its net investment in one or more of its foreign subsidiaries. Gains and losses on derivative instruments that are designated and effective as a net investment hedge are included in other comprehensive income and only reclassified into earnings in the period during which the hedged net investment is sold or liquidated. Any hedge ineffectiveness is recognized in earnings immediately.
Cash Flow Hedges
On
October 9, 2013
, the Company entered into a forward-starting interest rate swap instrument which has a notional amount of
$100.0 million
, an effective date of
September 30, 2014
and a maturity date of
September 30, 2018
. The objective of the instrument is to, beginning on
September 30, 2014
, protect the Company from changes in benchmark interest rates to which the Company is exposed through certain of its variable interest rate credit facilities. The instrument provides for a fixed interest rate of
1.901%
through the instrument's maturity date.
The Company may, from time to time, hedge foreign currency exchange rate risk arising from inventory purchases denominated in Canadian dollars through the use of foreign currency forward contracts. The maximum length of time over which the Company is hedging its exposure to the variability in future cash flows associated with the Canadian dollar purchasing is less than 12 months.
The interest rate swap instrument and foreign currency contracts have been designated as cash flow hedging instruments and accordingly changes in the effective portion of the fair value of the instruments are recorded in other comprehensive income and only reclassified into earnings in the period(s) in which the related hedged item affects earnings or the anticipated underlying hedged transactions are no longer probable of occurring. Any hedge ineffectiveness is recognized in earnings immediately.
Derivative Instruments Not Designated as Hedging Instruments
The Company uses foreign currency forward contracts to hedge the effects of fluctuations in exchange rates on outstanding intercompany loans. The Company does not formally designate and document such derivative instruments as hedging instruments; however, the instruments are an effective economic hedge of the underlying foreign currency exposure. Both the gain or loss on the derivative instrument and the offsetting gain or loss on the underlying intercompany loan are recognized in earnings immediately, thereby eliminating or reducing the impact of foreign currency exchange rate fluctuations on net income.
The following table sets forth the notional value of the Company's derivative instruments outstanding as of
January 31, 2015
and
2014
:
|
Notional Amount as of:
|
|||||||
|
January 31, 2015
|
January 31, 2014
|
||||||
|
(in thousands)
|
|||||||
|
Net investment hedge:
|
|||||||
|
Foreign currency contracts
|
$
|
14,223
|
|
$
|
43,742
|
|
|
|
Cash flow hedges:
|
|||||||
|
Interest rate swap
|
100,000
|
|
100,000
|
|
|||
|
Foreign currency contracts
|
—
|
|
4,754
|
|
|||
|
Derivatives not designated as hedging instruments:
|
|||||||
|
Foreign currency contracts
|
30,030
|
|
44,775
|
|
|||
79
The following table sets forth the fair value of the Company's derivative instruments outstanding as of
January 31, 2015
and
2014
.
|
Fair Value as of:
|
|||||||||
|
January 31, 2015
|
January 31, 2014
|
Balance Sheet Location
|
|||||||
|
(in thousands)
|
|||||||||
|
Asset Derivatives:
|
|||||||||
|
Derivatives designated as hedging instruments:
|
|||||||||
|
Net investment hedges:
|
|||||||||
|
Foreign currency contracts
|
$
|
—
|
|
$
|
157
|
|
Prepaid expenses and other
|
||
|
Derivatives not designated as hedging instruments:
|
|||||||||
|
Foreign currency contracts
|
—
|
|
279
|
|
Prepaid expenses and other
|
||||
|
Total Asset Derivatives
|
$
|
—
|
|
$
|
436
|
|
|||
|
Liability Derivatives:
|
|||||||||
|
Derivatives designated as hedging instruments:
|
|||||||||
|
Net investment hedges:
|
|||||||||
|
Foreign currency contracts
|
$
|
19
|
|
$
|
—
|
|
Accrued expenses
|
||
|
Cash flow hedges:
|
|||||||||
|
Interest rate swap
|
3,233
|
|
1,227
|
|
Accrued expenses
|
||||
|
Foreign currency contracts
|
—
|
|
211
|
|
Accrued expenses
|
||||
|
Derivatives not designated as hedging instruments:
|
|||||||||
|
Foreign currency contracts
|
17
|
|
—
|
|
Accrued expenses
|
||||
|
Total Liability Derivatives
|
$
|
3,269
|
|
$
|
1,438
|
|
|||
The following table sets forth the gains and losses recognized in other comprehensive income (loss) ("OCI") and income (loss) related to the Company’s derivative instruments for the years ended
January 31, 2015
,
2014
and
2013
. All amounts included in income (loss) in the table below from derivatives designated as hedging instruments relate to reclassifications from accumulated other comprehensive income.
|
2015
|
2014
|
2013
|
|||||||||||||||||||||||
|
OCI
|
Income
|
OCI
|
Income
|
OCI
|
Income
|
Statements of Operations Classification
|
|||||||||||||||||||
|
(in thousands)
|
(in thousands)
|
(in thousands)
|
|||||||||||||||||||||||
|
Dervatives Designated as Hedging Instruments:
|
|||||||||||||||||||||||||
|
Net investment hedges:
|
|||||||||||||||||||||||||
|
Foreign currency contracts
|
$
|
4,749
|
|
$
|
—
|
|
$
|
284
|
|
$
|
—
|
|
$
|
(834
|
)
|
$
|
(365
|
)
|
Interest income and other income (expense)
|
||||||
|
Cash flow hedges:
|
|||||||||||||||||||||||||
|
Interest rate swap
|
(2,595
|
)
|
(589
|
)
|
(1,227
|
)
|
—
|
|
—
|
|
—
|
|
Interest income and other income (expense)
|
||||||||||||
|
Foreign currency contracts
|
73
|
|
(76
|
)
|
(211
|
)
|
—
|
|
—
|
|
—
|
|
Cost of revenue - equipment
|
||||||||||||
|
Derivatives Not Designated as Hedging Instruments:
|
|||||||||||||||||||||||||
|
Foreign currency contracts
|
—
|
|
5,683
|
|
—
|
|
(720
|
)
|
—
|
|
(1,430
|
)
|
Interest income and other income (expense)
|
||||||||||||
|
Total Derivatives
|
$
|
2,227
|
|
$
|
5,018
|
|
$
|
(1,154
|
)
|
$
|
(720
|
)
|
$
|
(834
|
)
|
$
|
(1,795
|
)
|
|||||||
80
No components of the Company's net investment or cash flow hedging instruments were excluded from the assessment of hedge ineffectiveness.
As of
January 31, 2015
, the Company had
$3.8 million
and
$0.1 million
in pre-tax net unrealized losses associated with its interest rate swap and foreign currency contract cash flow hedging instruments recorded in accumulated other comprehensive income, respectively. The Company expects that
$1.6 million
and
$0.1 million
of pre-tax unrealized losses associated with its interest rate swap and foreign currency contracts, respectively, will be reclassified into net income over the next 12 months.
|
January 31, 2015
|
January 31, 2014
|
||||||
|
(in thousands)
|
|||||||
|
Compensation
|
$
|
17,289
|
|
$
|
19,533
|
|
|
|
Sales, payroll, real estate and value added taxes
|
4,826
|
|
6,405
|
|
|||
|
Interest
|
2,377
|
|
2,299
|
|
|||
|
Insurance
|
1,607
|
|
2,641
|
|
|||
|
Deferred revenue
|
3,022
|
|
1,115
|
|
|||
|
Derivative liabilities
|
3,269
|
|
1,438
|
|
|||
|
Other
|
3,106
|
|
3,537
|
|
|||
|
$
|
35,496
|
|
$
|
36,968
|
|
||
Guarantees
As of January 31, 2015 and 2014, the Company had approximately
$4.6 million
and
$3.3 million
of guarantees on customer financing with CNH Industrial Capital. In the event that the customer defaulted on the payments owed to CNH Industrial Capital, the Company as the guarantor would be required to make those payments and any accelerated indebtedness to CNH Industrial Capital. Upon such payment, the Company would be entitled to enforce normal creditor rights against the customer including collection action for money damages or re-possession of the collateral if CNH Industrial Capital has a perfected security interest. No liabilities associated with these guarantees are included in the consolidated balance sheets as of January 31, 2015 or 2014 as the Company deems the probability of being required to make such payments to be remote.
Litigation
The Company is engaged in proceedings incidental to the normal course of business. Due to their nature, such legal proceedings involve inherent uncertainties, including but not limited to, court rulings, negotiations between affected parties and governmental intervention. Based upon the information available to the Company and discussions with legal counsel, it is the Company's opinion that the outcome of the various legal actions and claims that are incidental to its business will not have a material impact on the financial position, results of operations or cash flows. Such matters, however, are subject to many uncertainties, and the outcome of any matter is not predictable with assurance.
Other Matters
The Company is the lessee under many real estate leases in which it agrees to indemnify the lessor from certain liabilities arising as a result of the use of the leased premises, including environmental liabilities, or a breach of the lease by the lessee. Additionally, from time to time, the Company enters into agreements with third parties in connection with the sale of assets in which it agrees to indemnify the purchaser from certain liabilities or costs arising in connection with the assets. Also, in the ordinary course of business in connection with purchases or sales of goods and services, the Company enters into agreements that may contain indemnification provisions. In the event that an indemnification claim is asserted, the Company's liability would be limited by the terms of the applicable agreement. See additional information on operating lease commitments in Note 12.
81
The Company leases
141
buildings under operating lease agreements with both related and unrelated parties, as well as office equipment and vehicles under various operating lease agreements. Rent and lease expense under all operating leases totaled
$23.0 million
,
$22.1 million
and
$17.5 million
during the years ended
January 31, 2015
,
2014
and
2013
, respectively. The leases expire at various dates through
January 2030
. Certain leases have fluctuating minimum lease payments. The Company recognizes lease expense on a straight-line basis over the expected term of the lease.
Approximate future minimum lease payment commitments are as follows:
|
Years ending January 31,
|
Amount
|
||
|
(in thousands)
|
|||
|
2016
|
$
|
23,250
|
|
|
2017
|
21,523
|
|
|
|
2018
|
19,927
|
|
|
|
2019
|
18,600
|
|
|
|
2020
|
17,351
|
|
|
|
Thereafter
|
101,907
|
|
|
|
$
|
202,558
|
|
|
The Company's store lease agreements contain lease periods primarily ranging from automatically renewable month-to-month terms to
15
years in length. Certain of the lease agreements contain terms such as an option to purchase the property at fair value, renew or extend the lease for an additional period at the conclusion of the original lease term or automatically renew the lease term at the conclusion of the original lease period on a month-to-month or year-to-year basis. A majority of the leases provide for fixed monthly rental payments and require the Company to pay the real estate taxes on the properties for the lease periods. All of the leases require that the Company maintains public liability and personal property insurance on each of the leased premises, and a majority of the leases require the Company to indemnify the lessor in connection with any claims arising from the leased premises during its occupation of the property. Most of the leases prohibit assigning the lease agreements or subletting the leased premises without the prior written consent of the lessor. In most of the leases, the Company has been granted a right of first refusal or other options to purchase the property.
Rent expense for operating leases with related parties totaled
$0.1 million
,
$0.1 million
and
$7.0 million
for the years ended
January 31, 2015
,
2014
and
2013
, respectively. The Company has leased
one
store property pursuant to an operating lease from C.I. Farm Power, Inc., a company affiliated with Peter Christianson, the Company's President and a director, during each of the years ended
January 31, 2015
,
2014
and
2013
. The lease expires on July 31, 2018, subject to the right of either party to terminate upon
60
days' written notice, The Company also leases buildings from Dealer Sites, LLC ("Dealer Sites"), an entity in which a minority position is owned by an entity affiliated with David Meyer, the Company's Board Chair and Chief Executive Officer, Peter Christianson, the Company's President and a director, and certain other Christianson family members. An entity affiliated with Tony Christianson, one of the Company's directors, formerly held a minority interest in Dealer Sites, LLC until December, 2012. During the year ended January 31, 2013, Dealer Sites was deemed to be a related party, however, as of January 31, 2013 and throughout the years ended
January 31, 2015
and
2014
, Dealer Sites was not deemed to be a related party as total related party ownership in the entity was less than
10%
. The Company leased
48
buildings pursuant to different operating lease agreements with Dealer Sites as of January 31, 2013. As of January 31, 2013, the leases expired on various dates through January 2028, contained purchase options based on fair values at the time of purchase, and provided that the lessee pay all property taxes, utilities, insurance and all expenses necessary for the general maintenance of the respective buildings. During the year ended January 31, 2013, the Company also received
$1.3 million
, pursuant to sale-leaseback agreements with Dealer Sites.
The Company utilizes C.I. Construction, LLC ("C.I. Construction"), an entity owned by the brother-in-law of Peter Christianson and Tony Christianson, to perform construction management services for its building and leasehold improvement projects. Payments to C.I. Construction, which include cost reimbursements of certain building supplies and other construction costs, totaled
$1.9 million
,
$3.9 million
and
$6.7 million
for the years ended
January 31, 2015
,
2014
and
2013
, respectively. The Company also had accounts receivable from C.I. Construction of
$0.1 million
outstanding as of January 31, 2014; no such amounts were outstanding as of January 31, 2015. During the year ended January 31, 2013, the Company also paid a total of
$0.2 million
to Cherry Tree & Associates, LLC, an entity affiliated with Tony Christianson, primarily for services related to the Senior Convertible Notes offering.
82
The components of income (loss) before income taxes for the years ended
January 31, 2015
,
2014
and
2013
consist of the following:
|
2015
|
2014
|
2013
|
|||||||||
|
(in thousands)
|
|||||||||||
|
U.S.
|
$
|
(20,825
|
)
|
$
|
25,713
|
|
$
|
70,788
|
|
||
|
Foreign
|
(17,515
|
)
|
(7,284
|
)
|
(92
|
)
|
|||||
|
Total
|
$
|
(38,340
|
)
|
$
|
18,429
|
|
$
|
70,696
|
|
||
The provision for (benefit from) income taxes charged to income for the years ended
January 31, 2015
,
2014
and
2013
consists of the following:
|
2015
|
2014
|
2013
|
|||||||||
|
(in thousands)
|
|||||||||||
|
Currently payable
|
|||||||||||
|
Federal
|
$
|
8,615
|
|
$
|
13,086
|
|
$
|
17,588
|
|
||
|
State
|
1,245
|
|
2,029
|
|
4,154
|
|
|||||
|
Foreign
|
54
|
|
149
|
|
287
|
|
|||||
|
Total currently payable taxes
|
9,914
|
|
15,264
|
|
22,029
|
|
|||||
|
Deferred
|
|||||||||||
|
Federal
|
(13,372
|
)
|
(4,832
|
)
|
5,996
|
|
|||||
|
State
|
(1,504
|
)
|
(533
|
)
|
553
|
|
|||||
|
Foreign
|
39
|
|
426
|
|
(441
|
)
|
|||||
|
Total deferred taxes
|
(14,837
|
)
|
(4,939
|
)
|
6,108
|
|
|||||
|
$
|
(4,923
|
)
|
$
|
10,325
|
|
$
|
28,137
|
|
|||
The reconciliation of the statutory federal income tax rate to the Company's effective rate is as follows:
|
2015
|
2014
|
2013
|
||||||
|
U.S. statutory rate
|
(35.0
|
)%
|
35.0
|
%
|
35.0
|
%
|
||
|
Foreign statutory rates
|
3.0
|
%
|
2.9
|
%
|
(0.4
|
)%
|
||
|
State taxes on income net of federal tax benefit
|
(4.4
|
)%
|
4.5
|
%
|
4.7
|
%
|
||
|
Valuation allowances
|
14.6
|
%
|
10.3
|
%
|
—
|
%
|
||
|
Impairment of nondeductible goodwill from stock acquisitions
|
6.9
|
%
|
—
|
%
|
—
|
%
|
||
|
All other, net
|
2.1
|
%
|
3.3
|
%
|
0.5
|
%
|
||
|
(12.8
|
)%
|
56.0
|
%
|
39.8
|
%
|
|||
83
Net deferred tax assets and liabilities consist of the following components as of
January 31, 2015
and
2014
:
|
2015
|
2014
|
||||||
|
(in thousands)
|
|||||||
|
Deferred tax assets:
|
|||||||
|
Inventory allowances
|
$
|
11,568
|
|
$
|
8,313
|
|
|
|
Goodwill and other intangibles
|
7,995
|
|
—
|
|
|||
|
Accrued liabilities and other
|
4,980
|
|
2,943
|
|
|||
|
Stock-based compensation
|
1,125
|
|
932
|
|
|||
|
Hedging and derivatives
|
1,286
|
|
396
|
|
|||
|
Receivables
|
994
|
|
1,378
|
|
|||
|
Net operating losses
|
5,888
|
|
1,204
|
|
|||
|
Other
|
631
|
|
492
|
|
|||
|
Total deferred tax assets
|
34,467
|
|
15,658
|
|
|||
|
Valuation allowances
|
(7,545
|
)
|
(1,898
|
)
|
|||
|
Deferred tax assets, net of valuation allowances
|
$
|
26,922
|
|
$
|
13,760
|
|
|
|
Deferred tax liabilities:
|
|||||||
|
Property and equipment
|
$
|
(40,177
|
)
|
$
|
(38,876
|
)
|
|
|
Senior convertible notes
|
(6,716
|
)
|
(8,076
|
)
|
|||
|
Intangibles
|
—
|
|
(459
|
)
|
|||
|
Total deferred tax liabilities
|
$
|
(46,893
|
)
|
$
|
(47,411
|
)
|
|
As of
January 31, 2015
, the Company had accumulated undistributed earnings in non-U.S. subsidiaries of
$1.7 million
. The Company has concluded that such earnings are to be reinvested outside of the United States indefinitely. Accordingly, the Company has not recorded a deferred tax liability associated with these undistributed earnings. The Company estimates that the additional U.S. income taxes to be paid upon the repatriation of these undistributed earnings would be approximately
$0.3 million
.
As of
January 31, 2015
, the Company has recorded
$31.2 million
of net operating loss carryforwards within certain of its foreign jurisdictions which expire at various dates between
2018
and
2021
, with certain jurisdictions having indefinite carryforward periods.
In reviewing the deferred tax assets as of January 31, 2015 and 2014, the Company concluded that a full valuation allowance for the deferred tax assets, including net operating loss carryforwards, in certain of its foreign jurisdictions was warranted. In total, the net change in valuation allowances of
$5.6 million
and
1.9 million
was recognized which was recorded as an additional provision for income taxes and negatively impacted the effective tax rate for the years ending January 31, 2015 and 2014, respectively. This conclusion was principally based on the presence of historical losses and the anticipated time period over which taxable income may be generated in excess of these historical losses.
The Company files income tax returns in the U.S. federal jurisdiction and various states and foreign countries. It is no longer subject to income tax examinations by U.S. federal tax authorities for fiscal years ended on or prior to
January 31, 2011
and state tax authorities for fiscal years ended on or prior to
January 31, 2010
. Due to the short period of time in which the Company has had operations in foreign jurisdictions, all tax years are open for income tax examinations for these entities. The Company's Ukrainian subsidiary is currently undergoing an income tax audit, which it plans to complete during its fiscal year ending January 31, 2016.
84
The Company's certificate of incorporation provides it with the authority to issue
50,000,000
shares of
$0.00001
par value stock, consisting of
45,000,000
shares of common stock and
5,000,000
shares classified as undesignated.
Stock-Based Compensation Plans
The Company has two stock-based compensation plans, the 2014 Equity Incentive Plan and the 2005 Equity Incentive Plan (collectively the "Plans"), to provide incentive compensation to participants for services that have been or will be performed for continuing as employees or members of the Board of Directors of the Company. Under these plans, the Company may grant incentive stock options, non-qualified stock options and restricted stock for up to a maximum shares of common stock under all forms of awards, the amount of which is approved by the stockholders of the Company. The Company accounts for all stock-based awards at the fair value of the related equity instrument over the applicable service or performance period. Shares issued for stock-based awards consist of authorized but unissued shares. Compensation cost charged to operations under the Plan was
$2.1 million
,
$2.1 million
and
$1.6 million
for the years ended
January 31, 2015
,
2014
and
2013
, respectively. The related income tax benefit (net) was
$0.8 million
,
$0.7 million
and
$0.5 million
for the years ended
January 31, 2015
,
2014
and
2013
, respectively.
The Company's 2014 Equity Incentive Plan was implemented during the year ended January 31, 2015 and has a total of
1,650,000
shares available for grant under this plan. The Company has approximately
1,451,000
shares authorized and available for future equity awards under this plan as of
January 31, 2015
.
The Company's 2005 Equity Incentive Plan expired during the year ended
January 31, 2015
. Thus, awards granted under this plan will continue to vest and be exercised, as applicable, from this plan in future years, but no additional awards may be granted out of this plan subsequent to its expiration date.
Stock Options
The Company granted stock options as part of its long-term incentive compensation to employees and members of the Board of Directors of the Company. The fair value of each stock option granted was estimated using the Black-Scholes option pricing model. Stock options vest over a period of
four
to
six
years for employees and immediately for members of the Board of Directors, and have contractual terms of
five
to
ten
years. The Company recognizes the fair value of stock options as compensation expense ratably over the vesting period of the award.
The following table summarizes stock option activity for the year ended
January 31, 2015
:
|
Number of Stock Options
|
Weighted Average Exercise Price
|
Aggregate Intrinsic Value
|
Weighted Average Remaining Contractual Life (Years)
|
|||||||||
|
(in thousands)
|
(in thousands)
|
|||||||||||
|
Outstanding at January 31, 2014
|
376
|
|
$
|
11.72
|
|
$
|
2,336
|
|
3.8
|
|||
|
Granted
|
—
|
|
—
|
|
||||||||
|
Exercised
|
(1
|
)
|
8.50
|
|
||||||||
|
Forfeited
|
—
|
|
—
|
|
||||||||
|
Outstanding at January 31, 2015
|
375
|
|
$
|
11.74
|
|
$
|
1,731
|
|
2.8
|
|||
|
Exercisable at January 31, 2015
|
375
|
|
$
|
11.74
|
|
$
|
1,731
|
|
2.8
|
|||
The aggregate intrinsic value of stock options exercised was
$0.1 million
and
$1.1 million
for the years ended January 31,
2014
and
2013
, respectively, and immaterial for the year ended
January 31, 2015
. As of
January 31, 2015
there was
no
unrecognized compensation cost related to stock options as all awards have fully vested.
85
The following is a summary of information related to stock options outstanding and exercisable at
January 31, 2015
:
|
Stock Options Outstanding and Exercisable
|
|||||||||
|
Range of Exercise Prices
|
Number
|
Weighted Average Remaining Contractual Life (Years)
|
Weighted Average Exercise Price
|
||||||
|
(in thousands)
|
|||||||||
|
$ 4.00-4.50
|
58
|
|
1.3
|
$
|
4.46
|
|
|||
|
7.50-10.20
|
194
|
|
2.8
|
8.35
|
|
||||
|
11.15-14.69
|
24
|
|
3.8
|
12.01
|
|
||||
|
21.21-26.84
|
99
|
|
3.5
|
22.47
|
|
||||
|
|
375
|
|
2.8
|
$
|
11.74
|
|
|||
Restricted Stock Awards ("RSA's")
The Company grants RSA's as part of its long-term incentive compensation to employees and members of the Board of Directors of the Company. The fair value of these awards is determined based on the closing market price of the Company's stock on the date of grant. The restricted stock primarily vests over a period of
three
to
six
years for employees and over
one
year for members of the Board of Directors. The Company recognizes compensation expense ratably over the vesting period of the award. The restricted common stock underlying these awards are deemed issued and outstanding upon grant, and carry the same voting and dividend rights of unrestricted outstanding common stock.
The following table summarizes the activity for RSA's for the year ended
January 31, 2015
:
|
Shares
|
Weighted Average Grant Date Fair Value
|
Weighted Average Remaining Contractual Life (Years)
|
||||||
|
(in thousands)
|
||||||||
|
Nonvested at January 31, 2014
|
321
|
|
$
|
22.05
|
|
3.3
|
||
|
Granted
|
170
|
|
17.90
|
|
||||
|
Forfeited
|
(26
|
)
|
21.73
|
|
||||
|
Vested
|
(83
|
)
|
21.36
|
|
||||
|
Nonvested at January 31, 2015
|
382
|
|
$
|
20.38
|
|
3.3
|
||
The weighted-average grant date fair value of RSA's granted was
$17.90
,
$20.92
and
$26.83
during the years ended
January 31, 2015
,
2014
and
2013
, respectively. The total fair value of RSA's vested was
$1.5 million
,
$1.5 million
and
$1.3 million
during the years ended
January 31, 2015
,
2014
and
2013
, respectively. As of
January 31, 2015
, there was
$5.0 million
of unrecognized compensation cost related to non-vested RSA's that is expected to be recognized over a weighted-average period of
3.3
years.
Restricted Stock Units ("RSU's")
The Company grants RSU's as part of its long-term incentive compensation to certain employees of the Company. The fair value of these awards is determined based on the closing market price of the Company's stock on the date of grant. The restricted stock primarily vests over a period of
three
to
six
years. The Company recognizes compensation expense ratably over the vesting period of the award. Most of the RSU's contain performance conditions, and the related compensation cost on these awards is only accrued if it is probable that the performance conditions will be achieved. The restricted common stock underlying these awards are not deemed issued or outstanding upon grant, and do not carry any voting or dividend rights.
86
The following table summarizes restricted stock unit ("RSU") activity for the year ended
January 31, 2015
:
|
Shares
|
Weighted Average Grant Date Fair Value
|
Weighted Average Remaining Contractual Life (Years)
|
||||||
|
(in thousands)
|
||||||||
|
Nonvested at January 31, 2014
|
—
|
|
$
|
—
|
|
0.0
|
||
|
Granted
|
30
|
|
18.12
|
|
||||
|
Forfeited
|
—
|
|
—
|
|
||||
|
Vested
|
—
|
|
—
|
|
||||
|
Nonvested at January 31, 2015
|
30
|
|
$
|
18.12
|
|
2.2
|
||
As of
January 31, 2015
, the Company did not believe the achievement of the performance conditions related to these awards to be probable and therefore expects the unrecognized compensation cost of RSU's to be immaterial.
The Company has a 401(k) profit-sharing plan ("401(k) Plan") for full-time employees at least
19
years of age. The Company made matching contributions of
50%
of qualifying employee elective contributions to the plan of
$3.5 million
,
$4.0 million
and
$3.6 million
, which were charged to expense for the years ended
January 31, 2015
,
2014
and
2013
, respectively. In addition, the Company may make a discretionary contribution to the 401(k) Plan as determined by the Board of Directors, with a maximum amount equal to the amount allowed under the IRS regulations. The Company did not make any discretionary contributions to the 401(k) Plan for the years ended
January 31, 2015
,
2014
and
2013
. Effective March 1, 2015, the 401(k) Plan was amended to change employer contributions from mandatory matching contributions to discretionary contributions.
The Company continued to implement its strategy of consolidating dealerships in desired market areas. Below is a summary of the acquisitions completed for the years ended
January 31, 2015
,
2014
and
2013
. In certain of the business combination transactions the Company recognized goodwill. Factors contributing to the recognition of goodwill include an evaluation of future and historical financial performance, the value of the workforce acquired and proximity to other existing and future planned Company locations. Pro forma results are not presented as the acquisitions are not considered material, individually or in aggregate, to the Company. The results of operations have been included in the Company's consolidated results of operations since the date of each respective business combination.
Fiscal 2015
Midland Equipment, Inc.
On August 29, 2014, the Company acquired certain assets of Midland Equipment, Inc. The acquired entity consisted of
one
agriculture equipment store in Wayne, Nebraska, which expands the Company's agricultural presence in Nebraska. The acquisition-date fair value of the total consideration transferred for the store was
$0.8 million
.
Fiscal 2014
Tucson Tractor Company
On February 16, 2013, the Company acquired certain assets of Tucson Tractor Company. The acquired entity consisted of
one
construction equipment store in Tucson, Arizona which is contiguous to the Company's existing locations in Phoenix and Flagstaff, Arizona and expands the Company's construction presence in Arizona. The acquisition-date fair value of the total consideration transferred for the store was
$4.1 million
.
Adobe CE, LLC
On March 1, 2013, the Company acquired certain assets of Adobe CE, LLC. The acquired entity consisted of
one
construction equipment store Albuquerque, New Mexico and expands the Company's presence into New Mexico. The acquisition-date fair value of the total consideration transferred for the store was
$1.2 million
.
87
Fiscal 2013
Colorado division of Adobe Truck & Equipment, LLC
On February 27, 2012, the Company acquired certain assets of the Colorado division of Adobe Truck & Equipment, LLC. The acquired entity consisted of
three
construction equipment stores in Denver, Colorado Springs, and Loveland, Colorado. The acquisition establishes the Company's first construction equipment stores in Colorado and allows the Company to have the exclusive Case Construction contract for all of Colorado east of the Rocky Mountains. The acquisition-date fair value of the total consideration transferred for the stores was
$3.4 million
.
Rimex 1-Holding EAD
On March 5, 2012, the Company acquired, through its subsidiary, Titan Machinery Bulgaria AD, certain assets of Rimex 1-Holding EAD. The acquired entity consisted of
seven
agricultural equipment stores in the following cities in Bulgaria: Sofia, Dobrich, Burgas, Pleven, Ruse, Montana, and Stara Zagora. The acquisition expands the Company's operations in Europe and provides a significant opportunity to leverage its domestic operating model and dealership experience into an additional growth platform. The acquisition-date fair value of the total consideration transferred for the stores was
$2.6 million
. Subsequent to the acquisition, Titan Machinery Bulgaria AD issued a
30%
ownership interest to the former owner of the acquired entity for
$2.5 million
. The 30% ownership interest is included in the consolidated financial statements as a noncontrolling interest.
Haberer's Implement, Inc.
On March 30, 2012, the Company acquired certain assets of Haberer's Implement, Inc. The acquired entity consisted of
one
agricultural equipment store in Bowdle, South Dakota which is contiguous to the Company's existing locations in Aberdeen, Redfield and Highmore, South Dakota and Wishek, North Dakota. The acquisition-date fair value of the total consideration transferred for the store was
$1.2 million
.
East Helena Rental, LLC
On April 2, 2012, the Company acquired certain assets of East Helena Rental, LLC. The acquired entity consisted of
one
construction equipment rental store in Helena, Montana which is contiguous to the Company's existing locations in Missoula, Great Falls, Bozeman and Big Sky, Montana. The acquisition-date fair value of the total consideration transferred for the store was
$0.6 million
.
Curly Olney's, Inc.
On July 2, 2012, the Company acquired certain assets of Curly Olney's, Inc. The acquired entity consisted of
two
agricultural equipment stores in McCook and Imperial, Nebraska and expands the Company's agriculture presence in Nebraska. The acquisition-date fair value of the total consideration transferred for the stores was
$5.5 million
.
Toner's, Inc
On November 1, 2012, the Company acquired certain assets of Toner's, Inc. The acquired entity consisted of
three
agricultural equipment stores in Grand Island, Broken Bow and Ord, Nebraska which are contiguous to the Company's existing locations in Kearney, Lexington, North Platte and Hastings, Nebraska. The acquisition-date fair value of the total consideration transferred for the stores was
$13.9 million
. As of January 31, 2013, the final valuation of the intangible assets acquired was not complete. As a result, the recorded intangible asset values were based on provisional estimates of fair value. The valuation of such assets was completed during the year ended January 31, 2014 and resulted in a
$0.1 million
decrease in the value of the distribution rights, a
$0.2 million
decrease in the value of customer relationships and a
$0.3 million
increase in the value of goodwill arising from the acquisition. The comparative information as of January 31, 2013 was retrospectively adjusted to reflect the final values assigned to each of the intangible assets.
Falcon Power Inc.
On November 1, 2012, the Company acquired certain assets of Falcon Power Inc. The acquired entity consisted of
two
construction equipment stores in Phoenix and Flagstaff, Arizona and expands the Company's presence into Arizona. The acquisition-date fair value of the total consideration transferred for the stores was
$1.4 million
.
88
VIAT D.o.o.
On December 12, 2012, the Company acquired, through its subsidiary, Titan Machinery D.o.o., certain assets of VAIT D.o.o. The acquired entity consisted of
one
agricultural equipment store in the Vojvodina region of Serbia which is contiguous to the Company's existing locations in Romania and Bulgaria, and expands the Company's Eastern European operations into Serbia. The acquisition-date fair value of the total consideration transferred for the store was
$2.3 million
.
The allocations of the purchase prices in the above business combinations are presented in the following table:
|
2015
|
2014
|
2013
|
|||||||||
|
(in thousands)
|
|||||||||||
|
Cash
|
$
|
—
|
|
$
|
2
|
|
$
|
3
|
|
||
|
Receivables
|
147
|
|
270
|
|
2,804
|
|
|||||
|
Inventories
|
525
|
|
2,658
|
|
29,120
|
|
|||||
|
Prepaid expenses and other
|
—
|
|
—
|
|
352
|
|
|||||
|
Property and equipment
|
156
|
|
2,119
|
|
4,831
|
|
|||||
|
Intangible assets
|
—
|
|
182
|
|
4,029
|
|
|||||
|
Goodwill
|
—
|
|
71
|
|
6,479
|
|
|||||
|
$
|
828
|
|
$
|
5,302
|
|
$
|
47,618
|
|
|||
|
Accounts payable
|
$
|
—
|
|
$
|
—
|
|
$
|
3,119
|
|
||
|
Floorplan payable
|
—
|
|
—
|
|
7,572
|
|
|||||
|
Customer deposits
|
—
|
|
4
|
|
1,586
|
|
|||||
|
Accrued expenses
|
—
|
|
—
|
|
21
|
|
|||||
|
$
|
—
|
|
$
|
4
|
|
$
|
12,298
|
|
|||
|
Cash consideration
|
584
|
|
4,850
|
|
31,880
|
|
|||||
|
Non-cash consideration: liabilities incurred
|
244
|
|
448
|
|
3,440
|
|
|||||
|
Total consideration
|
$
|
828
|
|
$
|
5,298
|
|
$
|
35,320
|
|
||
|
Goodwill related to the Agriculture operating segment
|
$
|
—
|
|
$
|
—
|
|
$
|
4,877
|
|
||
|
Goodwill related to the Construction operating segment
|
$
|
—
|
|
$
|
71
|
|
$
|
1,500
|
|
||
|
Goodwill related to the International operating segment
|
$
|
—
|
|
$
|
—
|
|
$
|
102
|
|
||
|
Goodwill expected to be deductible for tax purposes
|
$
|
—
|
|
$
|
71
|
|
$
|
6,107
|
|
||
89
The assets and liabilities which are measured at fair value on a recurring basis as of
January 31, 2015
and
2014
are as follows:
|
January 31, 2015
|
January 31, 2014
|
||||||||||||||||||||||||||||||
|
Level 1
|
Level 2
|
Level 3
|
Total
|
Level 1
|
Level 2
|
Level 3
|
Total
|
||||||||||||||||||||||||
|
(in thousands)
|
(in thousands)
|
||||||||||||||||||||||||||||||
|
Financial Assets
|
|||||||||||||||||||||||||||||||
|
Foreign currency contracts
|
$
|
—
|
|
$
|
—
|
|
$
|
—
|
|
$
|
—
|
|
$
|
—
|
|
$
|
436
|
|
$
|
—
|
|
$
|
436
|
|
|||||||
|
Total Financial Assets
|
$
|
—
|
|
$
|
—
|
|
$
|
—
|
|
$
|
—
|
|
$
|
—
|
|
$
|
436
|
|
$
|
—
|
|
$
|
436
|
|
|||||||
|
Financial Liabilities
|
|||||||||||||||||||||||||||||||
|
Interest rate swap
|
$
|
—
|
|
$
|
3,233
|
|
$
|
—
|
|
$
|
3,233
|
|
$
|
—
|
|
$
|
1,227
|
|
$
|
—
|
|
$
|
1,227
|
|
|||||||
|
Foreign currency contracts
|
—
|
|
36
|
|
—
|
|
36
|
|
—
|
|
211
|
|
—
|
|
211
|
|
|||||||||||||||
|
Total Financial Liabilities
|
$
|
—
|
|
$
|
3,269
|
|
$
|
—
|
|
$
|
3,269
|
|
$
|
—
|
|
$
|
1,438
|
|
$
|
—
|
|
$
|
1,438
|
|
|||||||
The valuation for the Company's foreign currency contracts and interest rate swap derivative instruments were valued using discounted cash flow analyses, an income approach, utilizing readily observable market data as inputs.
The Company also valued certain goodwill, other intangible assets and other long-lived assets at fair value on a non-recurring basis during the years ended January 31, 2015 and 2014, as part of its impairment tests. The estimated fair value of other long-lived assets was
$0.8 million
. Fair value was estimated using Level 3 fair value inputs including the estimated selling prices of similar assets. The estimated fair value of goodwill and other intangible assets approximated zero, thus requiring a full impairment charge equal to the carrying values of such assets. The valuation methodologies utilized Level 3 fair value inputs, as described in Note 1 and Note 5.
The Company also has financial instruments that are not recorded at fair value in its consolidated financial statements. The carrying amount of cash, receivables, payables, short-term debt and other current liabilities approximates fair value because of the short maturity and/or frequent repricing of those instruments, which are Level 2 fair value inputs. Based upon current borrowing rates with similar maturities, which are Level 2 fair value inputs, the carrying value of long-term debt approximates the fair value as of
January 31, 2015
and
2014
. The following table provides details on the Senior Convertible Notes as of
January 31, 2015
and
2014
. The difference between the face value and the carrying value of these notes is the result of the allocation between the debt and equity components (see Note 7). Fair value of the Senior Convertible Notes was estimated based on Level 2 fair value inputs.
|
January 31, 2015
|
January 31, 2014
|
||||||||||||||||||||||
|
Estimated Fair Value
|
Carrying Value
|
Face Value
|
Estimated Fair Value
|
Carrying Value
|
Face Value
|
||||||||||||||||||
|
(in thousands)
|
(in thousands)
|
||||||||||||||||||||||
|
Senior convertible notes
|
$
|
111,273
|
|
$
|
132,350
|
|
$
|
150,000
|
|
$
|
128,522
|
|
$
|
128,893
|
|
$
|
150,000
|
|
|||||
To better align the Company's cost structure and re-balance staffing levels with the evolving needs of the business, in March 2015, the Company approved a realignment plan to reduce its headcount by approximately
14%
, which includes headcount reductions at stores in each of its operating segments and its Shared Resource Center, as well as from the closing of
three
Agriculture stores and
one
Construction store. The Company expects to substantially complete these efforts by April 30, 2015. The Company's remaining stores in each of the respective areas will take over the distribution rights for the CNH Industrial brand previously held by the stores which have closed. The Company will transfer the majority of the assets of the closed stores to other stores. The Company estimates the total cost of these activities to be approximately
$2.0 million
, comprised of an accrual for the net present value of remaining lease obligations, employee severance costs, impairment of certain fixed assets and costs associated with relocation of assets from the closed stores. The Company recognized approximately
$0.1 million
in severance costs primarily in its International segment in its fourth quarter ended January 31, 2015, and expects to recognize the remaining amount in its first quarter ended April 30, 2015.
90
To better align its Construction business in certain markets, in April 2014, the Company reduced its Construction-related headcount by approximately
12%
primarily through the closing of
seven
underperforming Construction stores, staff reductions at other dealerships and reductions in support staff at its Shared Resource Center. The Company also closed
one
Agriculture store. The Company's remaining stores in each of the respective areas assumed the majority of the distribution rights for the CNH Industrial brand previously held by the stores which have closed. The majority of the assets of the closed stores were redeployed to other store locations. Certain inventory items which are not sold by any of its remaining stores were sold at auction. The inventory markdown attributable to such items are included in the exit cost summary below. The
$3.8 million
incurred during the year ended January 31, 2015 reflect the total amounts expected to be incurred related to the closing of these stores, exclusive of any changes in lease termination accrual assumptions.
In the year ended January 31, 2014, the Company closed
one
of its Construction stores in Billings, Montana and merged it with the Company's other store in Billings, Montana. The primary cost of closing this location related to accrual of lease payments, which totaled
$0.3 million
, all of which was recognized by the Construction segment.
The following summarizes the exit costs associated with the aforementioned store closings and realignment activities:
|
2015
|
2014
|
Income Statement Classification
|
|||||||
|
(in thousands)
|
|||||||||
|
Construction Segment
|
|||||||||
|
Lease termination costs
|
$
|
1,795
|
|
$
|
282
|
|
Impairment and Realignment Costs
|
||
|
Employee severance costs
|
497
|
|
—
|
|
Impairment and Realignment Costs
|
||||
|
Impairment of fixed assets, net of gains on asset disposition
|
(60
|
)
|
—
|
|
Impairment and Realignment Costs
|
||||
|
Asset relocation and other closing costs
|
379
|
|
—
|
|
Impairment and Realignment Costs
|
||||
|
$
|
2,611
|
|
$
|
282
|
|
||||
|
Agriculture Segment
|
|||||||||
|
Lease termination costs
|
$
|
148
|
|
$
|
—
|
|
Impairment and Realignment Costs
|
||
|
Employee severance costs
|
118
|
|
—
|
|
Impairment and Realignment Costs
|
||||
|
Impairment of fixed assets, net of gains on asset disposition
|
85
|
|
—
|
|
Impairment and Realignment Costs
|
||||
|
Asset relocation and other closing costs
|
84
|
|
—
|
|
Impairment and Realignment Costs
|
||||
|
Inventory cost adjustments
|
471
|
|
—
|
|
Equipment Cost of Sales
|
||||
|
$
|
906
|
|
$
|
—
|
|
||||
|
International
|
|||||||||
|
Employee severance costs
|
$
|
56
|
|
$
|
—
|
|
Impairment and Realignment Costs
|
||
|
$
|
56
|
|
$
|
—
|
|
||||
|
Shared Resource Center
|
|||||||||
|
Employee severance costs
|
$
|
300
|
|
$
|
—
|
|
Impairment and Realignment Costs
|
||
|
$
|
300
|
|
$
|
—
|
|
||||
|
Total
|
|||||||||
|
Lease termination costs
|
$
|
1,943
|
|
$
|
282
|
|
Impairment and Realignment Costs
|
||
|
Employee severance costs
|
971
|
|
—
|
|
Impairment and Realignment Costs
|
||||
|
Impairment of fixed assets, net of gains on asset disposition
|
25
|
|
—
|
|
Impairment and Realignment Costs
|
||||
|
Asset relocation and other closing costs
|
463
|
|
—
|
|
Impairment and Realignment Costs
|
||||
|
Inventory cost adjustments
|
471
|
|
—
|
|
Equipment Cost of Sales
|
||||
|
$
|
3,873
|
|
$
|
282
|
|
||||
91
A reconciliation of the beginning and ending exit cost liability balance, which is included in accrued expenses in the consolidated balance sheets, follows:
|
Amount
|
|||
|
(in thousands)
|
|||
|
Balance, January 31, 2013
|
$
|
344
|
|
|
Exit costs incurred and charged to expense
|
|||
|
Lease termination costs
|
308
|
|
|
|
Exit costs paid
|
|||
|
Lease termination costs
|
(104
|
)
|
|
|
Balance, January 31, 2014
|
548
|
|
|
|
Exit costs incurred and charged to expense
|
|||
|
Lease termination costs
|
1,943
|
|
|
|
Employee severance costs
|
971
|
|
|
|
Exit costs paid
|
|||
|
Lease termination costs
|
(679
|
)
|
|
|
Employee severance costs
|
(971
|
)
|
|
|
Adjustments
|
|||
|
Lease termination costs
|
(106
|
)
|
|
|
Balance, January 31, 2015
|
$
|
1,706
|
|
As of January 31, 2015, certain Agriculture assets and liabilities met the criteria to be classified as held for sale. The Company is working to sell these disposal groups during the year ended January 31, 2016. During the year ended January 31, 2015, the Company impaired its covenants not to compete associated with these disposal groups which had an unamortized value of
$0.1 million
, which is recorded in Impairment and Realignment Costs in the consolidated statements of operations. There were no such assets or liabilities held for sale as of January 31, 2014.
As of January 31, 2015, the Company also had
$3.1 million
of property and equipment held for sale unrelated to the aforementioned disposal groups, which is included in the land, buildings, and leasehold improvements line item of the table below.
92
The assets and liabilities which are held for sale related to the aforementioned disposal groups are presented in the following table:
|
2015
|
|||
|
(in thousands)
|
|||
|
Assets Held for Sale
|
|||
|
Receivables
|
$
|
147
|
|
|
Inventories
|
|||
|
New equipment
|
6,269
|
|
|
|
Used equipment
|
3,973
|
|
|
|
Parts and attachments
|
920
|
|
|
|
Work in process
|
65
|
|
|
|
Total inventories
|
11,227
|
|
|
|
Property and equipment
|
|||
|
Machinery and equipment
|
114
|
|
|
|
Vehicles
|
155
|
|
|
|
Furniture and fixtures
|
57
|
|
|
|
Land, buildings, and leasehold improvements
|
3,612
|
|
|
|
Total property and equipment
|
3,938
|
|
|
|
$
|
15,312
|
|
|
|
Liabilities Held for Sale
|
|||
|
Accounts payable
|
$
|
151
|
|
|
Floorplan payable
|
1,771
|
|
|
|
Customer deposits
|
913
|
|
|
|
$
|
2,835
|
|
|
The Company owns and operates a network of full service agricultural and construction equipment stores in the United States and Europe. As of
January 31, 2015
, the Company has
three
reportable segments: Agriculture, Construction and International. The Company's segments are determined based on management structure, which is organized based on types of products sold and geographic areas, as described in the following paragraphs. The operating results for each segment are reported separately to the Company's Chief Executive Officer and President to make decisions regarding the allocation of resources, to assess the Company's operating performance and to make strategic decisions.
The Company's Agriculture segment sells, services, and rents machinery, and related parts and attachments, for uses ranging from large-scale farming to home and garden use in North America. This segment also includes ancillary sales and services related to agricultural activities and products such as equipment transportation, Global Positioning System ("GPS") signal subscriptions and finance and insurance products.
The Company's Construction segment sells, services, and rents machinery, and related parts and attachments, for uses ranging from heavy construction to light industrial machinery use to customers in North America. This segment also includes ancillary sales and services related to construction activities such as equipment transportation, GPS signal subscriptions and finance and insurance products.
The Company’s International segment sells, services, and rents machinery, and related parts and attachments, for uses ranging from large-scale farming and construction to home and garden use to customers in Eastern Europe. It also includes export sales of equipment and parts to customers outside of the United States.
Revenue generated from sales to customers outside of the United States was
$166.4 million
,
$145.9 million
and
$72.5 million
for the years ended
January 31, 2015
,
2014
and
2013
, respectively. As of
January 31, 2015
and
2014
,
$6.1 million
and
$7.3 million
of the Company's long-lived assets were held in its European subsidiaries, respectively.
93
Revenues, income (loss) before income tax and total assets at the segment level are reported before eliminations. The Company retains various unallocated income/(expense) items and assets at the general corporate level, which the Company refers to as "Shared Resources" in the table below. Shared Resource assets primarily consist of cash and property and equipment. Revenue between segments is immaterial. Revenue amounts included in Eliminations primarily relate to transactions within a segment. See Note 5 for information regarding goodwill by segment.
Certain financial information for each of the Company's business segments is set forth below.
|
January 31, 2015
|
January 31, 2014
|
January 31, 2013
|
|||||||||
|
(in thousands)
|
|||||||||||
|
Revenue
|
|||||||||||
|
Agriculture
|
$
|
1,372,716
|
|
$
|
1,765,821
|
|
$
|
1,827,023
|
|
||
|
Construction
|
434,639
|
|
405,822
|
|
380,295
|
|
|||||
|
International
|
166,379
|
|
145,884
|
|
72,510
|
|
|||||
|
Segment revenue
|
1,973,734
|
|
2,317,527
|
|
2,279,828
|
|
|||||
|
Eliminations
|
(73,488
|
)
|
(91,081
|
)
|
(81,408
|
)
|
|||||
|
Total
|
$
|
1,900,246
|
|
$
|
2,226,446
|
|
$
|
2,198,420
|
|
||
|
Income (Loss) Before Income Taxes
|
|||||||||||
|
Agriculture
|
$
|
(13,429
|
)
|
$
|
59,574
|
|
$
|
83,256
|
|
||
|
Construction
|
(10,770
|
)
|
(28,083
|
)
|
(4,708
|
)
|
|||||
|
International
|
(17,248
|
)
|
(5,544
|
)
|
541
|
|
|||||
|
Segment income (loss) before income taxes
|
(41,447
|
)
|
25,947
|
|
79,089
|
|
|||||
|
Shared Resources
|
2,144
|
|
(6,650
|
)
|
(6,902
|
)
|
|||||
|
Eliminations
|
963
|
|
(868
|
)
|
(1,491
|
)
|
|||||
|
Income (loss) before income taxes
|
$
|
(38,340
|
)
|
$
|
18,429
|
|
$
|
70,696
|
|
||
|
Impairment and Realignment Costs
|
|||||||||||
|
Agriculture
|
$
|
30,348
|
|
$
|
—
|
|
$
|
—
|
|
||
|
Construction
|
2,726
|
|
8,243
|
|
—
|
|
|||||
|
International
|
1,007
|
|
1,754
|
|
—
|
|
|||||
|
Segment impairment
|
34,081
|
|
9,997
|
|
—
|
|
|||||
|
Shared Resources
|
309
|
|
—
|
|
—
|
|
|||||
|
Total
|
$
|
34,390
|
|
$
|
9,997
|
|
$
|
—
|
|
||
|
Interest Income
|
|||||||||||
|
Agriculture
|
$
|
214
|
|
$
|
270
|
|
$
|
181
|
|
||
|
Construction
|
459
|
|
638
|
|
510
|
|
|||||
|
International
|
83
|
|
102
|
|
—
|
|
|||||
|
Segment interest income
|
756
|
|
1,010
|
|
691
|
|
|||||
|
Shared Resources
|
27
|
|
22
|
|
13
|
|
|||||
|
Total
|
$
|
783
|
|
$
|
1,032
|
|
$
|
704
|
|
||
|
Interest Expense
|
|||||||||||
|
Agriculture
|
$
|
16,983
|
|
$
|
16,052
|
|
$
|
13,324
|
|
||
|
Construction
|
12,110
|
|
10,751
|
|
8,634
|
|
|||||
|
International
|
8,002
|
|
4,562
|
|
957
|
|
|||||
|
Segment interest expense
|
37,095
|
|
31,365
|
|
22,915
|
|
|||||
|
Shared Resources
|
(2,304
|
)
|
(810
|
)
|
(153
|
)
|
|||||
|
Total
|
$
|
34,791
|
|
$
|
30,555
|
|
$
|
22,762
|
|
||
94
|
January 31, 2015
|
January 31, 2014
|
January 31, 2013
|
|||||||||
|
(in thousands)
|
|||||||||||
|
Depreciation and Amortization
|
|||||||||||
|
Agriculture
|
$
|
8,666
|
|
$
|
8,196
|
|
$
|
7,056
|
|
||
|
Construction
|
17,647
|
|
18,064
|
|
13,546
|
|
|||||
|
International
|
1,710
|
|
1,110
|
|
340
|
|
|||||
|
Segment depreciation and amortization
|
28,023
|
|
27,370
|
|
20,942
|
|
|||||
|
Shared Resources
|
3,745
|
|
3,424
|
|
2,522
|
|
|||||
|
Total
|
$
|
31,768
|
|
$
|
30,794
|
|
$
|
23,464
|
|
||
|
Capital Expenditures
|
|||||||||||
|
Agriculture
|
$
|
3,324
|
|
$
|
4,634
|
|
$
|
7,470
|
|
||
|
Construction
|
4,779
|
|
2,752
|
|
16,175
|
|
|||||
|
International
|
1,726
|
|
4,015
|
|
1,070
|
|
|||||
|
Segment capital expenditures
|
9,829
|
|
11,401
|
|
24,715
|
|
|||||
|
Shared Resources
|
7,183
|
|
7,609
|
|
15,117
|
|
|||||
|
Total
|
$
|
17,012
|
|
$
|
19,010
|
|
$
|
39,832
|
|
||
|
Total Assets
|
|||||||||||
|
Agriculture
|
$
|
736,239
|
|
$
|
943,212
|
|
|||||
|
Construction
|
394,236
|
|
308,525
|
|
|||||||
|
International
|
155,150
|
|
195,534
|
|
|||||||
|
Segment assets
|
1,285,625
|
|
1,447,271
|
|
|||||||
|
Shared Resources
|
68,693
|
|
120,335
|
|
|||||||
|
Eliminations
|
(4,571
|
)
|
(2,958
|
)
|
|||||||
|
Total
|
$
|
1,349,747
|
|
$
|
1,564,648
|
|
|||||
The following reflects selected quarterly financial information for fiscal years
2015
and
2014
.
|
Revenue
|
Gross Profit
|
Net Income (Loss) Including Noncontrolling Interest
|
Net Income (Loss) Attributable to Titan Machinery Inc.
|
Earnings (Loss) per Share-Basic
|
Earnings (Loss) per Share-Diluted
|
||||||||||||||||||
|
(in thousands, except per share data)
|
|||||||||||||||||||||||
|
2015
|
|||||||||||||||||||||||
|
First quarter
|
$
|
465,463
|
|
$
|
75,939
|
|
$
|
(6,893
|
)
|
$
|
(6,549
|
)
|
$
|
(0.31
|
)
|
$
|
(0.31
|
)
|
|||||
|
Second quarter
|
450,990
|
|
79,653
|
|
(775
|
)
|
(614
|
)
|
(0.03
|
)
|
(0.03
|
)
|
|||||||||||
|
Third quarter
|
493,141
|
|
84,691
|
|
2,313
|
|
2,470
|
|
0.12
|
|
0.11
|
|
|||||||||||
|
Fourth quarter
|
490,652
|
|
68,101
|
|
(28,062
|
)
|
(27,464
|
)
|
(1.28
|
)
|
(1.28
|
)
|
|||||||||||
|
2014
|
|||||||||||||||||||||||
|
First quarter
|
$
|
441,674
|
|
$
|
73,948
|
|
$
|
(603
|
)
|
$
|
(414
|
)
|
$
|
(0.02
|
)
|
$
|
(0.02
|
)
|
|||||
|
Second quarter
|
488,180
|
|
83,542
|
|
3,967
|
|
3,833
|
|
0.18
|
|
0.18
|
|
|||||||||||
|
Third quarter
|
587,961
|
|
93,606
|
|
5,758
|
|
5,825
|
|
0.27
|
|
0.27
|
|
|||||||||||
|
Fourth quarter
|
708,631
|
|
96,978
|
|
(1,018
|
)
|
(393
|
)
|
(0.02
|
)
|
(0.02
|
)
|
|||||||||||
The amounts of Net Income (Loss) Attributable to Titan Machinery Inc., Earnings per Share-Basic and Earnings per Share-Diluted for the three-month period ended April 30, 2014 have been updated to reflect a correction in the Company's VAT asset classification as of April 30, 2014. This correction has been previously disclosed in the Company's Form 10-Q for the period ended July 31, 2014 and resulted from the Company's conclusion, reached subsequent to the issuance of the Company’s
95
interim consolidated financial statements as of and for the period ended April 30, 2014, that the treatment of its prepaid value added tax (“VAT”) asset in Ukraine as a non-monetary asset was incorrect and that the asset should be classified and accounted for as a monetary asset and therefore should be remeasured from Ukrainian Hryvnia (“UAH”) to U.S. Dollars (“USD”) using the current rate as opposed to the historical rate used for non-monetary assets. In addition, in February of 2014, the National Bank of Ukraine terminated the currency peg of the UAH to the USD; subsequent to the decoupling and as a result of the economic and political conditions present in the country, the UAH experienced significant devaluation from the date the currency peg was terminated through the end of the Company’s fiscal year ended January 31, 2015. The incorrect classification of the VAT asset as a non-monetary asset coupled with the significant devaluation of the UAH resulted in an overstatement of the Company’s assets (Prepaid expenses and other) as of April 30, 2014 and an understatement of the Company’s loss (Interest income and other income (expense)) for the three months ended April 30, 2014. This correction increased the Company’s Net Loss Attributable to Titan Machinery Inc. by
$2.3 million
(from the previously reported
$4.2 million
to
$6.5 million
) and increased the basic and diluted loss per share by
$0.11
(from the previously reported
$0.20
loss per share to a
$0.31
loss per share). Based on an evaluation of all relevant factors, the Company concluded that this correction was immaterial to the Company’s results for the three months ended April 30, 2014; therefore, the Company determined that an amendment of its previously filed Form 10-Q for the quarterly period ended April 30, 2014 was not necessary, and the correction would instead be reflected in future 10-K and 10-Q filings.
The Company recognized impairment charges totaling
$31.2 million
and
$9.7 million
in the fourth quarters of fiscal
2015
and
2014
, respectively, resulting from the annual impairment tests on goodwill, intangible assets and other long-lived assets. Details of the Company's impairment testing is disclosed in Note 1 and Note 5. The Company also recognized
$5.6 million
and
$1.9 million
in valuation allowances on certain deferred tax assets, including net operating losses, in certain of its foreign entities in the fourth quarters of fiscal
2015
and
2014
, respectively. Details of these valuation allowances are disclosed in Note 1 and Note 13.
The Company amended its credit facilities with Wells Fargo and Agricredit in April 2015 which changed certain financial covenants, reduced the available lines of credit and changed certain interest rates, among other things. See Note 6 for details of each amendment. As a result of these amendments, and without adjusting the U.S. dollar amount of the Company's credit facilities related to its foreign subsidiaries based on current foreign currency exchange rates, the Company's total discretionary floorplan payable lines of credit for equipment purchases was reduced from approximately
$1.2 billion
to
$1.1 billion
as of April 2015.
The Company approved a realignment plan in March 2015. See Note 19 for further details.
96
Schedule II—Valuation and Qualifying Accounts and Reserves
Titan Machinery Inc.
|
Classification
|
Beginning Balance
|
Additions Charged to Expenses
|
Deductions for Write-offs, Net of Recoveries
|
Foreign currency translation adjustment
|
Ending Balance
|
||||||||||||||
|
(in thousands)
|
|||||||||||||||||||
|
Valuation reserve deduction from receivables:
|
|||||||||||||||||||
|
Year ended January 31, 2015
|
$
|
3,663
|
|
$
|
5,938
|
|
$
|
(5,452
|
)
|
$
|
69
|
|
$
|
4,218
|
|
||||
|
Year ended January 31, 2014
|
2,337
|
|
4,804
|
|
(3,478
|
)
|
—
|
|
3,663
|
|
|||||||||
|
Year ended January 31, 2013
|
720
|
|
3,218
|
|
(1,601
|
)
|
—
|
|
2,337
|
|
|||||||||
97
As previously reported on the Company's Current Report on Form 8-K, dated June 27, 2013, the Audit Committee of the Board of Directors of the Company approved the dismissal of Eide Bailly LLP (“Eide Bailly”) as the Company’s independent registered public accounting firm, and engaged Deloitte & Touche LLP (“Deloitte”) as the Company's independent registered public accounting firm, each effective on June 27, 2013.
During the fiscal years ended January 31, 2013 and 2012 and the subsequent interim period through June 27, 2013, there were: (i) no disagreements with Eide Bailly on any matter of accounting principles or practices, financial statement disclosure, or auditing scope or procedure, which, if not resolved to the satisfaction of Eide Bailly, would have caused Eide Bailly to make reference to the subject matter of the disagreement(s) in connection with its reports, and (ii) no “reportable events” as defined in Item 304(a)(1)(v) of Regulation S-K.
Evaluation of Disclosure Controls and Procedures.
After evaluating the effectiveness of the Company's disclosure controls and procedures pursuant to Rule 13a-15(b) of the Securities Exchange Act of 1934 ("Exchange Act") as of the end of the period covered by this annual report, our Chief Executive Officer and Chief Financial Officer, with the participation of the Company's management, have concluded that the Company's disclosure controls and procedures (as defined in Exchange Act Rule 13a-15(e)) are effective.
Management's Report on Internal Control Over Financial Reporting.
Our management is responsible for establishing and maintaining adequate internal control over financial reporting, as such term is defined in Exchange Act Rules 13a-15(f) and 15d-15(f). Under the supervision and with the participation of management, including our Chief Executive Officer and Chief Financial Officer, we conducted an evaluation of the effectiveness of our internal control over financial reporting based on the framework in Internal Control—Integrated Framework (2013) issued by the Committee of Sponsoring Organizations of the Treadway Commission ("COSO"). Based on this evaluation, management has concluded that our internal control over financial reporting was effective as of
January 31, 2015
.
Deloitte & Touche LLP, the independent registered public accounting firm that audited the consolidated financial statements included in this Annual Report on Form 10-K, has also audited our internal control over financial reporting as of
January 31, 2015
, as stated in their attestation report included in Part II, Item 8 of this Annual Report on Form 10-K.
Changes in Internal Control over Financial Reporting.
There has not been any change in the Company's internal control over financial reporting (as defined in Exchange Act Rule 13a-15(f)) during its most recently completed fiscal quarter that has materially affected, or is reasonably likely to materially affect, the Company's internal control over financial reporting.
Effective April 10, 2015, the Company amended its credit facility with Wells Fargo to change certain financial covenants, reduce the available lines of credit and change the interest rate, among other things. The minimum consolidated income before income taxes covenant was eliminated for the fiscal year ended January 31, 2015, and changed to a loss of $11.0 million for the three months ended April 30, 2015, a loss of $9.0 million for the six months ended July 31, 2015, income of $1.0 million for the nine months ended October 31, 2015 and income of $10.0 million for the trailing four quarters for each period thereafter. The previous minimum income before income tax covenant was $5.0 million for the period ended January 31, 2015, $6.0 million for each of the two periods ended April 30, 2015 and July 31, 2015, $10.0 million for each of the two periods ended October 31, 2015 and January 31, 2016, and $15.0 million for each period thereafter. The maximum net leverage ratio was changed from 3.0 : 1.00 for all periods to
3.00
: 1.00 as of January 31, 2015 and April 30, 2015, 2.75 : 1.00 as of July 31, 2015 and October 31, 2015, and 2.50: 1.00 for each period thereafter. The Floorplan Payable Line was reduced from
$350.0 million
to
$275.0 million
and the Working Capital Line was reduced from
$112.5 million
to $87.5 million. The interest rate margin was changed from a range of 1.5% to 2.875% to a range of 1.5% to 3.125% per annum, depending upon results of the Company's consolidated leverage ratio and consolidated income before income taxes.
Effective April 1, 2015, the Company amended its credit facility with Agricredit, which decreased its available borrowings under the credit facility from
$225.0 million
to
$200.0 million
and added an annual renewal fee.
98
Other than the information included in Part I of this Form 10-K under the heading "Executive Officers of the Registrant," the information required by Item 10 is incorporated by reference to the sections labeled "Election of Directors," "Corporate Governance" and "Section 16(a) Beneficial Ownership Reporting Compliance," all of which will appear in our definitive proxy statement for our
2015
Annual Meeting.
The information required by Item 11 is incorporated herein by reference to the information under "Compensation Discussion and Analysis," "Compensation Committee Report," "Executive Compensation," and "Non-Employee Director Compensation," in the Company's definitive proxy statement for the
2015
Annual Meeting.
The information required by Item 12 is incorporated herein by reference to the sections entitled "Security Ownership of Principal Stockholders and Management" and "Equity Compensation - Equity Compensation Plan Information," both of which will appear in our definitive proxy statement for our
2015
Annual Meeting.
The information required by Item 13 is incorporated herein by reference to the sections entitled "Corporate Governance—Independence" and "Certain Relationships and Related Transactions," both of which will appear in our definitive proxy statement for our
2015
Annual Meeting.
The information required by Item 14 is incorporated herein by reference to the section entitled "Fees of the Independent Registered Public Accounting Firm," which will appear in our definitive proxy statement for our
2015
Annual Meeting.
|
(a)
|
Documents filed as part of this report.
|
|
(1)
|
Financial Statements. The following financial statements are included in Part II, Item 8 of this Annual Report on Form 10-K:
|
Report of Deloitte & Touche LLP on Consolidated Financial Statements and Financial Statement Schedule as of January 31,
2015
and
2014
and for each the two years in the period ended January 31,
2015
Report of Deloitte & Touche LLP on Internal Control Over Financial Reporting as of
January 31, 2015
Report of Eide Bailly LLP on Consolidated Financial Statements and Financial Statement Schedule as of January 31, 2013 and for the year ended January 31, 2013
Consolidated Balance Sheets as of
January 31, 2015
and
2014
Consolidated Statements of Operations for each of the three years in the period ended
January 31, 2015
Consolidated Statements of Comprehensive Income for each of the three years in the period ended
January 31, 2015
Consolidated Statements of Stockholders' Equity for each of the three years in the period ended
January 31, 2015
Consolidated Statements of Cash Flows for each of the three years in the period ended
January 31, 2015
Notes to Consolidated Financial Statements
99
|
(2)
|
Financial Statement Schedules. The following consolidated financial statement schedule is included in Item 8:
|
Schedule II—Valuation and Qualifying Accounts and Reserves
All other financial statement schedules have been omitted, because they are not applicable, are not required, or the information is included in the Financial Statements or Notes thereto
|
(3)
|
Exhibits. See the Exhibit Index to our Form 10-K immediately following the signature page to this Annual Report on Form 10-K
|
100
SIGNATURES
Pursuant to the requirements of Section 13 or 15(d) of the Securities Exchange Act of 1934, the registrant has duly caused this report to be signed on its behalf by the undersigned, thereunto duly authorized.
Dated:
April 15, 2015
TITAN MACHINERY INC.
|
By
|
/s/ DAVID J. MEYER
|
By
|
/s/ MARK KALVODA
|
|||
|
David J. Meyer,
Board Chair and Chief Executive Officer
|
Mark Kalvoda,
Chief Financial Officer
|
|||||
POWER OF ATTORNEY
Each person whose signature appears below constitutes DAVID J. MEYER and MARK KALVODA his true and lawful attorneys-in-fact and agents, each acting alone, with full power of substitution and resubstitution, for him and in his name, place and stead, in any and all capacities, to sign any or all amendments to this Annual Report on Form 10-K and to file the same, with all exhibits thereto, and other documents in connection therewith, with the Securities and Exchange Commission, granting unto said attorneys-in-fact and agents, each acting alone, full power and authority to do and perform each and every act and thing requisite and necessary to be done in and about the premises, as fully to all intents and purposes as he might or could do in person, hereby ratifying and confirming all said attorneys-in-fact and agents, each acting alone, or his substitute or substitutes, may lawfully do or cause to be done by virtue thereof.
Pursuant to the requirements of the Securities Exchange Act of 1934, this report has been signed below by the following persons on behalf of the registrant and in the capacities and on the dates indicated.
|
Signatures
|
Title
|
Date
|
||
|
/s/ DAVID J. MEYER
|
Board Chair and Chief Executive Officer (principal executive officer)
|
April 15, 2015
|
||
|
David J. Meyer
|
||||
|
/s/ PETER J. CHRISTIANSON
|
President and Director
|
April 15, 2015
|
||
|
Peter J. Christianson
|
||||
|
/s/ MARK KALVODA
|
Chief Financial Officer (principal financial officer and principal accounting officer)
|
April 15, 2015
|
||
|
Mark Kalvoda
|
||||
|
/s/ JOHN BODE
|
Director
|
April 15, 2015
|
||
|
John Bode
|
||||
|
/s/ TONY CHRISTIANSON
|
Director
|
April 15, 2015
|
||
|
Tony Christianson
|
||||
|
/s/ THEODORE CROSBIE
|
Director
|
April 15, 2015
|
||
|
Theodore Crosbie
|
||||
|
/s/ STANLEY DARDIS
|
Director
|
April 15, 2015
|
||
|
Stanley Dardis
|
||||
|
/s/ JAMES IRWIN
|
Director
|
April 15, 2015
|
||
|
James Irwin
|
||||
|
/s/ JAMES WILLIAMS
|
Director
|
April 15, 2015
|
||
|
James Williams
|
||||
|
/s/ THEODORE WRIGHT
|
Director
|
April 15, 2015
|
||
|
Theodore Wright
|
||||
101
EXHIBIT INDEX
TITAN MACHINERY INC.
FORM 10-K
|
No.
|
Description
|
|
|
3.1
|
Certificate of Incorporation of the registrant, as amended (incorporated herein by reference to Exhibit 3.1 of the registrant's Quarterly Report on Form 10-Q filed with the Commission on September 10, 2012).
|
|
|
3.2
|
Bylaws of the registrant, as amended (incorporated herein by reference to Exhibit 3.2 of the registrant's Annual Report on Form 10-K filed with the Commission on April 16, 2009).
|
|
|
4.1
|
Specimen Certificate representing shares of common stock of Titan Machinery Inc. (incorporated by reference to Exhibit 4.1 of the registrant's Amendment No. 6 to Registration Statement on Form S-1, Reg. No. 333-145526, filed with the Commission on December 5, 2007).
|
|
|
4.2
|
Indenture, dated as of April 24, 2012, by and between the registrant and Wells Fargo Bank, National Association, as Trustee (incorporated by reference to Exhibit 4.1 of the registrant's Current Report on Form 8-K filed with the Commission on April 24, 2012).
|
|
|
10.1
|
Amended and Restated Employment Agreement, dated March 6, 2013, between David Meyer and the registrant (incorporated herein by reference to Exhibit 10.2 of the registrant's Annual Report on Form 10-K filed with the Commission on April 10, 2013).**
|
|
|
10.1.1
|
Amendment dated March 1, 2014 to the Amended and Restated Employment Agreement, dated March 6, 2013, between David Meyer and the registrant (incorporated herein by reference to Exhibit 10.54 of the registrant's Annual Report on Form 10-K filed with the Commission on April 11, 2014).**
|
|
|
10.2
|
Amended and Restated Employment Agreement, dated March 6, 2013, between Peter Christianson and the registrant (incorporated herein by reference to Exhibit 10.3 of the registrant's Annual Report on Form 10-K filed with the Commission on April 10, 2013).**
|
|
|
10.2.1
|
Amendment dated March 1, 2014 to the Amended and Restated Employment Agreement, dated March 6, 2013, between Peter Christianson and the registrant (incorporated herein by reference to Exhibit 10.55 of the registrant's Annual Report on Form 10-K filed with the Commission on April 11, 2014).**
|
|
|
10.3
|
Employment Agreement, dated September 5, 2014, between Mark Kalvoda and the registrant (incorporated herein by reference to Exhibit 10.3 of the registrant's Quarterly Report on Form 10-Q filed with the Commission on September 9, 2014).**
|
|
|
10.4
|
Agricultural Equipment Sales & Service Agreement, dated December 31, 2002, between Case, LLC and the registrant (incorporated herein by reference to Exhibit 10.5 of the registrant's Amendment No. 2 to Registration Statement on Form S-1, Reg. No. 333-145526, filed with the Commission on October 10, 2007).
|
|
|
10.4.1
|
Amendment dated November 14, 2007 to Agricultural Equipment Sales & Service Agreements dated December 31, 2002 (IPO), between CNH America LLC and the registrant (incorporated herein by reference to Exhibit 10.28 of the registrant's Amendment No. 5 to Registration Statement on Form S-1, Reg. No. 333-145526, filed with the Commission on November 27, 2007).
|
|
|
10.5
|
Construction Equipment Sales & Service Agreement, dated effective April 8, 2003, between Case, LLC and the registrant (incorporated herein by reference to Exhibit 10.6 of the registrant's Amendment No. 2 to Registration Statement on Form S-1, Reg. No. 333-145526, filed with the Commission on October 10, 2007).
|
|
|
10.6
|
Construction Equipment Sales & Service Agreement, dated effective June 15, 2006, between CNH America, LLC and the registrant (incorporated herein by reference to Exhibit 10.8 of the registrant's Amendment No. 2 to Registration Statement on Form S-1, Reg. No. 333-145526, filed with the Commission on October 10, 2007).
|
|
|
10.7
|
Amendment to All Case Construction Equipment Sales & Service Agreements, dated November 14, 2007 (IPO), between CNH America LLC and the registrant (incorporated herein by reference to Exhibit 10.29 of the registrant's Amendment No. 5 to Registration Statement on Form S-1, Reg. No. 333-145526, filed with the Commission on November 27, 2007).
|
|
|
10.8
|
Dealer Agreement (Construction), dated April 14, 2003, between New Holland North America, Inc. and the registrant, as amended December 27, 2005 and December 9, 2006 (incorporated herein by reference to the Exhibit 10.7 of the registrant's Amendment No. 2 to Registration Statement on Form S-1, Reg. No. 333-145526, filed with the Commission on October 10, 2007).
|
|
|
10.9
|
Amendment to CNH America LLC Dealer Agreement for New Holland Construction Products, dated November 14, 2007 (IPO), between CNH America LLC and the registrant (incorporated herein by reference to Exhibit 10.31 of the registrant's Amendment No. 5 to Registration Statement on Form S-1, Reg. No. 333-145526, filed with the Commission on November 27, 2007).
|
|
102
|
No.
|
Description
|
|
|
10.10
|
Dealer Agreement (AG), effective February 20, 2007, between CNH America LLC and the registrant (incorporated herein by reference to Exhibit 10.9 of the registrant's Amendment No. 2 to Registration Statement on Form S-1, Reg. No. 333-145526, filed with the Commission on October 10, 2007).
|
|
|
10.11
|
Dealer Agreement (AG), dated effective June 22, 2006, between CNH America LLC and the registrant (incorporated herein by reference to Exhibit 10.10 of the registrant's Amendment No. 2 to Registration Statement on Form S-1, Reg. No. 333-145526, filed with the Commission on October 10, 2007).
|
|
|
10.12
|
Dealer Agreements (AG), dated effective April 1, 2006, between CNH America and the registrant (incorporated herein by reference to Exhibit 10.11 of the registrant's Amendment No. 2 to Registration Statement on Form S-1, Reg. No. 333-145526, filed with the Commission on October 10, 2007).
|
|
|
10.13
|
Dealer Agreement (AG), dated effective January 1, 2000 between New Holland North America, Inc. and the registrant (incorporated herein by reference to Exhibit 10.13 of the registrant's Amendment No. 2 to Registration Statement on Form S-1, Reg. No. 333-145526, filed with the Commission on October 10, 2007).
|
|
|
10.14
|
Amendment to CNH America LLC Dealer Agreement for New Holland Agricultural Equipment, dated November 14, 2007 (IPO), between CNH America LLC and the registrant (incorporated herein by reference to Exhibit 10.32 of the registrant's Amendment No. 5 to Registration Statement on Form S-1, Reg. No. 333-145526, filed with the Commission on November 27, 2007).
|
|
|
10.15
|
Dealer Security Agreement dated April 14, 2003 between New Holland North America, Inc. and the registrant (incorporated herein by reference to Exhibit 10.14 of the registrant's Amendment No. 2 to Registration Statement on Form S-1, Reg. No. 333-145526, filed with the Commission on October 10, 2007).
|
|
|
10.16
|
Dealer Security Agreements between CNH America LLC and the registrant (incorporated herein by reference to Exhibit 10.15 of the registrant's Amendment No. 2 to Registration Statement on Form S-1, Reg. No. 333-145526, filed with the Commission on October 10, 2007).
|
|
|
10.17
|
Amended and Restated Wholesale Floorplan Credit Facility and Security Agreement, dated November 13, 2007, between CNH Capital America LLC and the registrant (incorporated herein by reference to Exhibit 10.25 of the registrant's Amendment No. 5 to Registration Statement on Form S-1, Reg. No. 333-145526, filed with the Commission on November 27, 2007).
|
|
|
10.17.1
|
Letter Agreement with CNH Capital America, LLC dated September 30, 2011, amending the November 13, 2007 Amended and Restated Wholesale Floorplan Credit Facility and Security Agreement (incorporated herein by reference to Exhibit 10.3 of the registrant's Quarterly Report on Form 10-Q filed with the Commission on December 9, 2011).
|
|
|
10.17.2
|
Letter Agreement with CNH Capital America, LLC dated November 20, 2012, amending the November 13, 2007 Amended and Restated Wholesale Floorplan Credit Facility and Security Agreement (incorporated herein by reference to Exhibit 10.1 of the registrant's Quarterly Report on Form 10-Q filed with the Commission on December 6, 2012).
|
|
|
10.17.3
|
Amendment dated December 8, 2014 to the Amended and Restated Wholesale Floor Plan Credit Facility and Security Agreement dated November 13, 2007 by and between the registrant and CNH Industrial Capital America LLC (incorporated herein by reference to Exhibit 10.2 of the registrant's Quarterly Report on Form 10-Q filed with the Commission on December 10, 2014).
|
|
|
10.17.4
|
Letter Agreement with CNH Capital America, LLC dated February 15, 2013, amending the November 13, 2007 Amended and Restated Wholesale Floorplan Credit Facility and Security Agreement (incorporated herein by reference to Exhibit 10.49 of the registrant's Annual Report on Form 10-K filed with the Commission on April 10, 2013).
|
|
|
10.18
|
Amended and Restated Credit Agreement dated as of March 30, 2012 by and among the registrant, Wells Fargo Bank, National Association, and the Financial Institutions Party Thereto (incorporated by reference to Exhibit 10.43 of the registrant's Annual Report on Form 10-K filed with the Commission on April 11, 2012).
|
|
|
10.18.1
|
First Amendment, dated as of December 4, 2012, to Amended and Restated Credit Agreement by and among the registrant, Wells Fargo Bank, National Association, and the Financial Institutions Party Thereto (incorporated herein by reference to Exhibit 10.2 of the registrant's Quarterly Report on Form 10-Q filed with the Commission on December 6, 2012).
|
|
|
10.18.2
|
Second Amendment, dated as of November 14, 2013, to Amended and Restated Credit Agreement by and among the registrant, Wells Fargo Bank, National Association, and the Financial Institutions Party Thereto (incorporated herein by reference to Exhibit 10.1 to the registrant's Quarterly Report on Form 10-Q filed with the Commission on December 5, 2013).
|
|
103
|
No.
|
Description
|
|
|
10.18.3
|
Third Amendment, dated as of April 3, 2014, to Amended and Restated Credit Agreement by and among the registrant, Wells Fargo Bank, National Association, and the Financial Institutions Party Thereto (incorporated herein by reference to Exhibit 10.53 of the registrant's Annual Report on Form 10-K filed with the Commission on April 10, 2014).
|
|
|
10.18.4
|
Fourth Amendment to Amended and Restated Credit Agreement dated as of July 31, 2014 by and among the registrant, Wells Fargo Bank, National Association, and the Financial Institution Party thereto (incorporated herein by reference to Exhibit 10.1 of the registrant's Quarterly Report on Form 10-Q filed with the Commission on September 9, 2014).
|
|
|
10.18.5
|
Fifth Amendment to Amended and Restated Credit Agreement dated as of December 5, 2014 by and among the registrant, Wells Fargo Bank, National Association, and the Financial Institution Party thereto (incorporated herein by reference to Exhibit 10.1 of the registrant's Quarterly Report on Form 10-Q filed with the Commission on December 10, 2014).
|
|
|
10.18.6*
|
Sixth Amendment to Amended and Restated Credit Agreement dated as of April 10, 2015 by and among the registrant, Wells Fargo Bank, National Association, and the Financial Institution Party thereto.
|
|
|
10.19
|
Amended and Restated Security Agreement dated as of March 30, 2012 by and between the registrant and Wells Fargo Bank, National Association (incorporated by reference to Exhibit 10.44 of the registrant's Annual Report on Form 10-K filed with the Commission on April 11, 2012).
|
|
|
10.20
|
Second Amended and Restated Agreement for Wholesale Financing, dated March 12, 2010, between GE Commercial Distribution Finance Corporation and the registrant (incorporated herein by reference to the Exhibit 10.42 of the registrant's Annual Report on Form 10-K filed with the Commission on April 15, 2010).
|
|
|
10.21
|
Amended and Restated Wholesale Financing Plan, dated as of October 31, 2013, by and among the registrant and Agricredit Acceptance LLC (incorporated herein by reference to Exhibit 10.1 to the registrant's Quarterly Report on Form 10-Q filed with the Commission on December 5, 2013).
|
|
|
10.21.1*
|
Amendment No. 1 to the Amended and Restated Wholesale Financing Plan, dated as of April 1, 2015, by and among the registrant and Agricredit Acceptance LLC.
|
|
|
10.22*
|
Amendment No. 1 to the Amended and Restated Inventory Security Agreement, dated as of April 1, 2015, by and among the registrant and Agricredit Acceptance LLC.
|
|
|
10.23
|
Amended and Restated 2005 Equity Incentive Plan (incorporated herein by reference to Exhibit 10.1 of the registrant's Current Report on Form 8-K filed with the Commission on June 6, 2011).**
|
|
|
10.24
|
Form of Incentive Stock Option Agreement under the 2005 Equity Incentive Plan (incorporated herein by reference to Exhibit 10.22 of the registrant's Amendment No. 2 to Registration Statement on Form S-1, Reg. No. 333-145526, filed with the Commission on October 10, 2007).**
|
|
|
10.25
|
Form of Non-Qualified Stock Option Agreement under the 2005 Equity Incentive Plan (incorporated herein by reference to Exhibit 10.23 of the registrant's Amendment No. 2 to Registration Statement on Form S-1, Reg. No. 333-145526, filed with the Commission on October 10, 2007).**
|
|
|
10.26
|
Form of Restricted Stock Agreement under the 2005 Equity Incentive Plan (incorporated herein by reference to Exhibit 10.24 of the registrant's Amendment No. 2 to Registration Statement on Form S-1, Reg. No. 333-145526, filed with the Commission on October 10, 2007).**
|
|
|
10.27
|
Titan Machinery Inc. 2014 Equity Incentive Plan (incorporated herein by reference to Exhibit 10.1 of the registrant's Current Report on Form 8-K filed with the Commission on June 3, 2014).**
|
|
|
10.28
|
Form of Titan Machinery Inc. Performance Award Agreement under the 2014 Equity Incentive Plan (incorporated herein by reference to Exhibit 10.1 of the registrant's Quarterly Report on Form 10-Q filed with the Commission on June 5, 2014).**
|
|
|
10.29
|
Form of Titan Machinery Inc. Restricted Stock Agreement (for non-employee directors) under the 2014 Equity Incentive Plan (incorporated herein by reference to Exhibit 10.2 of the registrant's Quarterly Report on Form 10-Q filed with the Commission on June 5, 2014).**
|
|
|
10.30
|
Form of Titan Machinery Inc. Restricted Stock Agreement under the 2014 Equity Incentive Plan (incorporated herein by reference to Exhibit 10.3 of the registrant's Quarterly Report on Form 10-Q filed with the Commission on June 5, 2014).**
|
|
|
10.31
|
Form of Titan Machinery Inc. Restricted Stock Unit Agreement under the 2014 Equity Incentive Plan (incorporated herein by reference to Exhibit 10.2 of the registrant's Quarterly Report on Form 10-Q filed with the Commission on September 9, 2014).**
|
|
104
|
No.
|
Description
|
|
|
10.32
|
Form of Director and Officer Indemnification Agreement (incorporated by reference to Exhibit 10.34 of the registrant's Annual Report on Form 10-K filed with the Commission on April 11, 2012).
|
|
|
10.33
|
Titan Machinery Inc. Non-Employee Director Compensation Plan (incorporated herein by reference to Exhibit 10.37 of the registrant's Annual Report on Form 10-K filed with the Commission on April 10, 2013).**
|
|
|
10.34*
|
Description of Titan Machinery Inc.’s Executive Cash Bonus Plan.**
|
|
|
10.35
|
Description of Titan Machinery Inc.’s Long-Term Incentive Plan (incorporated herein by reference to Exhibit 10.4 of the registrant's Quarterly Report on Form 10-Q filed with the Commission on June 5, 2014).**
|
|
|
21.1*
|
Subsidiaries of Titan Machinery Inc.
|
|
|
23.1*
|
Consent of Eide Bailly, LLP
|
|
|
23.2*
|
Consent of Deloitte & Touche LLP
|
|
|
24.1
|
Power of Attorney (Included on Signature Page)
|
|
|
31.1*
|
Certification of Chief Executive Officer Pursuant to Section 302 of the Sarbanes-Oxley Act of 2002
|
|
|
31.2*
|
Certification of Chief Financial Officer Pursuant to Section 302 of the Sarbanes-Oxley Act of 2002
|
|
|
32.1*
|
Certification of Chief Executive Officer Pursuant to Section 906 of the Sarbanes-Oxley Act of 2002
|
|
|
32.2*
|
Certification of Chief Financial Officer Pursuant to Section 906 of the Sarbanes-Oxley Act of 2002
|
|
|
101+
|
The following materials from Titan Machinery Inc.'s Annual Report on Form 10-K for the year ended January 31, 2015 are furnished herewith, formatted in XBRL (Extensible Business Reporting Language): (i) the Consolidated Balance Sheets as of January 31, 2015 and 2014, (ii) the Consolidated Statements of Operations for the years ended January 31, 2015, 2014 and 2013, (iii) the Consolidated Statements of Comprehensive Income for the years ended January 31, 2015, 2014 and 2013, (iv) the Consolidated Statements of Stockholders' Equity for the years ended January 31, 2015, 2014 and 2013 (v) the Consolidated Statements of Cash Flows for the years ended January 31, 2015, 2014 and 2013, and (vi) the Notes to the Consolidated Financial Statements.
|
|
______________________________________________________
|
*
|
Filed herewith
|
|
+
|
Furnished herewith
|
|
**
|
Indicates management contract or compensatory plan or arrangement.
|
105
TABLE OF CONTENTS
Item 1. BusinessItem 1A. Risk FactorsItem 1B. Unresolved Staff CommentsItem 2. PropertiesItem 3. Legal ProceedingsItem 4. Mine Safety DisclosuresPart IIItem 5. Market For Registrant's Common Equity, Related Stockholder Matters and Issuer Purchases Of Equity SecuritiesItem 6. Selected Financial DataItem 7. Management's Discussion and Analysis Of Financial Condition and Results Of OperationsItem 7A. Quantitative and Qualitative Disclosures About Market RiskItem 8. Financial Statements and Supplementary DataNote 1 Business Activity and Significant Accounting PoliciesNote 2 ReceivablesNote 3 InventoriesNote 4 Property and EquipmentNote 5 Intangible Assets and GoodwillNote 6 Floorplan Payable/lines Of CreditNote 7 Senior Convertible NotesNote 8 Long-term DebtNote 9 Derivative InstrumentsNote 10 Accrued ExpensesNote 11 Commitments and ContingenciesNote 12 Operating Lease Commitments and Related Party TransactionsNote 13 Income TaxesNote 14 Capital StructureNote 15 Stock-based CompensationNote 16 Employee Benefit PlansNote 17 Business CombinationsNote 18 Fair Value Of Financial InstrumentsNote 19 Store Closings and Realignment CostsNote 20 Held For SaleNote 21 Segment Information and Operating ResultsNote 22 Selected Quarterly Financial Data (unaudited)Note 23 Subsequent EventsItem 9. Changes in and Disagreements with Accountants on Accounting and Financial DisclosureItem 9A. Controls and ProceduresItem 9B. Other InformationPart IIIItem 10. Directors, Executive Officers and Corporate GovernanceItem 11. Executive CompensationItem 12. Security Ownership Of Certain Beneficial Owners and Management and Related Stockholder MattersItem 13. Certain Relationships and Related Transactions, and Director IndependenceItem 14. Principal Accounting Fees and ServicesPart IVItem 15. Exhibits, Financial Statement Schedules