UNITED STATES
SECURITIES AND EXCHANGE COMMISSION
WASHINGTON, D.C. 20549
____________________________________
FORM 20-F
____________________________________
(Mark One)
|
¨
|
REGISTRATION STATEMENT PURSUANT TO SECTION 12(b) or (g) OF THE SECURITIES EXCHANGE ACT OF 1934
|
OR
|
ý
|
ANNUAL REPORT PURSUANT TO SECTION 13 or 15(d) OF THE SECURITIES EXCHANGE ACT OF 1934
|
For the fiscal year ended
December 31, 2018
OR
|
¨
|
TRANSITION REPORT PURSUANT TO SECTION 13 or 15(d) OF THE SECURITIES EXCHANGE ACT OF 1934
|
OR
|
¨
|
SHELL COMPANY REPORT PURSUANT TO SECTION 13 or 15(d) OF THE SECURITIES EXCHANGE ACT OF 1934
|
Date of event requiring this shell company report
For the transition period from
to
Commission file number 1-12874
____________________________________
TEEKAY CORPORATION
(Exact name of Registrant as specified in its charter)
____________________________________
Republic of The Marshall Islands
(Jurisdiction of incorporation or organization)
Not Applicable
(Translation of Registrant’s name into English)
4
th
Floor, Belvedere Building, 69 Pitts Bay Road, Hamilton, HM 08, Bermuda
Telephone: (441) 298-2530
(Address and telephone number of principal executive offices)
Edith Robinson
4
th
Floor, Belvedere Building, 69 Pitts Bay Road, Hamilton, HM 08, Bermuda
Telephone: (441) 298-2530
Fax: (441) 292-3931
(Name, Telephone, E-mail and/or Facsimile number and Address of Company Contact Person)
Securities registered, or to be registered, pursuant to Section 12(b) of the Act.
|
Title of each class
|
|
Name of each exchange on which registered
|
|
Common Stock, par value of $0.001 per share
|
|
New York Stock Exchange
|
Securities registered, or to be registered, pursuant to Section 12(g) of the Act.
None
Securities for which there is a reporting obligation pursuant to Section 15(d) of the Act.
None
____________________________________
Indicate the number of outstanding shares of each issuer’s classes of capital or common stock as of the close of the period covered by the annual report.
100,435,210
shares of Common Stock, par value of $0.001 per share.
Indicate by check mark whether the registrant is a well-known seasoned issuer, as defined in Rule 405 of the Securities Act. Yes
¨
No
ý
If this report is an annual or transition report, indicate by check mark if the registrant is not required to file reports pursuant to Section 13 or 15(d) of the Securities Exchange Act of 1934. Yes
¨
No
ý
Indicate by check mark if the registrant (1) has filed all reports required to be filed by Section 13 or 15(d) of the Securities Exchange Act of 1934 during the preceding 12 months (or for such shorter period that the registrant was required to file such reports), and (2) has been subject to such filing requirements for the past 90 days. Yes
ý
No
¨
Indicate by check mark if the registrant (1) has submitted electronically, if any, every Interactive Data File required to be submitted pursuant to Rule 405 of Regulation S-T (§232.405 of this chapter) during the preceding 12 months (or for such shorter period that the registrant was required to submit such files). Yes
ý
No
¨
Indicate by check mark whether the registrant is a large accelerated filer, an accelerated filer, or a non-accelerated filer, or an emerging growth company. See the definitions of “large accelerated filer", "accelerated filer,” and "emerging growth company" in Rule 12b-2 of the Exchange Act. (Check one):
Large Accelerated Filer
¨
Accelerated Filer
ý
Non-Accelerated Filer
¨
Emerging growth company
¨
If an emerging growth company that prepares its financial statements in accordance with U.S. GAAP, indicate by check mark if the registrant has elected not to use the extended transition period for complying with any new or revised financial accounting standards† provided pursuant to Section 13(a) of the Exchange Act.
¨
† The term “new or revised financial accounting standard” refers to any update issued by the Financial Accounting Standards Board to its Accounting Standards Codification after April 5, 2012.
Indicate by check mark which basis of accounting the registrant has used to prepare the financial statements included in this filing:
|
U.S. GAAP
x
|
|
International Financial Reporting Standards as issued
by the International Accounting Standards Board
¨
|
|
Other
¨
|
If “Other” has been checked in response to the previous question, indicate by check mark which financial statement item the registrant has elected to follow: Item 17
¨
Item 18
¨
If this is an annual report, indicate by check mark whether the registrant is a shell company (as defined in Rule 12b-2 of the Exchange Act). Yes
¨
No
ý
TEEKAY CORPORATION
INDEX TO REPORT ON FORM 20-F
INDEX
|
PAGE
|
|||||
|
Item 1.
|
|||||
|
Item 2.
|
|||||
|
Item 3.
|
|||||
|
Item 4.
|
|||||
|
A.
|
|||||
|
B.
|
|||||
|
C.
|
|||||
|
D.
|
|||||
|
E.
|
|||||
|
1.
|
|||||
|
2.
|
|||||
|
3.
|
|||||
|
Item 4A.
|
|||||
|
Item 5.
|
|||||
|
Item 6.
|
|||||
|
Item 7.
|
|||||
|
Item 8.
|
|||||
|
Item 9.
|
|||||
|
Item 10.
|
|||||
3
|
Item 11.
|
|||||
|
Item 12.
|
|||||
|
Item 13.
|
|||||
|
Item 14.
|
|||||
|
Item 15.
|
|||||
|
Item 16A.
|
|||||
|
Item 16B.
|
|||||
|
Item 16C.
|
|||||
|
Item 16D.
|
|||||
|
Item 16E.
|
|||||
|
Item 16F.
|
|||||
|
Item 16G.
|
|||||
|
Item 16H.
|
|||||
|
Item 17.
|
|||||
|
Item 18.
|
|||||
|
Item 19.
|
|||||
4
This annual report of Teekay Corporation on Form 20-F for the year ended
December 31, 2018
(or Annual Report) should be read in conjunction with the consolidated financial statements and accompanying notes included in this report.
Unless otherwise indicated,
references in this Annual Report to “Teekay,” “the Company,” “we,” “us” and “our” and similar terms refer to Teekay Corporation and its subsidiaries. References in this Annual Report to Teekay LNG refer to Teekay LNG Partners L.P. (NYSE: TGP), to Teekay Tankers refer to Teekay Tankers Ltd. (NYSE: TNK) and to “Teekay Offshore” refer to Teekay Offshore Partners L.P. (NYSE: TOO).
In addition to historical information, this Annual Report contains forward-looking statements that involve risks and uncertainties. Such forward-looking statements relate to future events and our operations, objectives, expectations, performance, financial condition and intentions. When used in this Annual Report, the words “expect,” “intend,” “plan,” “believe,” “anticipate,” “estimate” and variations of such words and similar expressions are intended to identify forward-looking statements. Forward-looking statements in this Annual Report include, in particular, statements regarding:
|
•
|
our future financial condition and results of operations and our future revenues, expenses and capital expenditures, and our expected financial flexibility to pursue capital expenditures, acquisitions and other expansion opportunities, including vessel acquisitions;
|
|
•
|
our dividend policy and our ability to pay cash dividends on our shares of common stock or any increases in quarterly distributions, and the distribution and dividend policies of our publicly-listed subsidiaries, Teekay LNG and Teekay Tankers (or the
Controlled Daughter Entities
), and our equity-accounted investee, Teekay Offshore (collectively with the Controlled Daughter Entities, the
Daughter Entities
), including the ability to increase the distribution levels of the Daughter Entities in the future;
|
|
•
|
meeting our going concern requirements and our liquidity needs, and the liquidity needs of Teekay LNG and Teekay Tankers, anticipated funds and sources of financing for liquidity needs and the sufficiency of cash flows, and our estimation that we will have sufficient liquidity for at least the next 12 months;
|
|
•
|
our
ability and plans to obtain financing for new and existing projects, refinance existing debt obligations and fulfill our debt obligations;
|
|
•
|
our plans for Teekay Parent, which excludes our interests in the Daughter Entities and includes Teekay Corporation and
its remaining subsidiaries, not to have a direct ownership in any conventional tankers and floating production, storage and offloading (or
FPSO
) units, and increase its free cash flow per share
, reduce its net debt and further strengthen its balance sheet;
|
|
•
|
conditions and fundamentals of the markets in which we operate, including the balance of supply and demand in these markets and spot tanker charter rates and oil production and competition for providing services;
|
|
•
|
our expectations regarding tax liabilities and classifications;
|
|
•
|
offshore, liquefied natural gas (or
LNG
) and liquefied petroleum gas (or
LPG
) market conditions and fundamentals, including the balance of supply and demand in these markets and charter rates, and estimated growth in size of the world LNG and LPG fleets;
|
|
•
|
our expectations as to the useful lives of our vessels;
|
|
•
|
our future growth prospects;
|
|
•
|
the impact of future changes in the demand for and price of oil, and the related effects on the demand for and price of natural gas;
|
|
•
|
expected costs
, capabilities, completion and delivery dates of newbuildings, acquisitions and conversions, and the commencement of any related charters or other contracts;
|
|
•
|
our
ability to maximize the use of our vessels, including the re-deployment or disposition of vessels no longer under long-term time charter or on a short-term charter contract;
|
|
•
|
our expectations regarding the ability of our other customers to make charter payments to us, and the ability of our customers to fulfill purchase obligations at the end of charter contracts;
|
|
•
|
the future resumption of a LNG plant in Yemen operated by Yemen LNG Company Limited (or
YLNG
), the expected expiration of the current deferral arrangement with YLNG, the expected further agreement with YLNG to suspend the charter contracts, the expected repayment of deferred hire amounts on Teekay LNG's two 52%-owned vessels, the
Marib Spirit
and
Arwa Spirit
, on charter to YLNG, and the expected reduction to Teekay LNG's equity income in 2019 as a result of the charter payment deferral;
|
|
•
|
expected deliveries of the LNG newbuilding vessels in connection with
Teekay LNG’s
joint venture with China LNG Shipping (Holdings) Limited;
|
|
•
|
the expected technical and operational capabilities of newbuildings, including the benefits of the M-type, Electronically Controlled, Gas Injection (or
MEGI
) twin engines in certain LNG carrier newbuildings;
|
|
•
|
our expectations regarding the schedule and performance of the receiving and regasification terminal in Bahrain, which will be owned and operated by a new joint venture, Bahrain LNG W.L.L., owned by Teekay LNG (30%), National Oil & Gas Authority (or
Nogaholding
) (30%), Gulf Investment Corporation (or
GIC
) (24%) and Samsung C&T (or
Samsung
) (16%) (or the
Bahrain LNG Joint Venture
), and our expectations regarding the charter of a floating storage unit (or
FSU
) vessel for the project;
|
|
•
|
the future valuation or impairment of our assets, including our FPSO units, investment in Teekay Offshore and goodwill;
|
5
|
•
|
our expectations and estimates regarding future charter business, with respect to minimum charter hire payments, revenues and our vessels' ability to perform to specifications and maintain their hire rates in the future;
|
|
•
|
our expectations regarding the ability of Awilco LNG ASA (or
Awilco
), and Teekay LNG's other customers to make charter payments to Teekay LNG, and the ability of our customers to fulfill purchase obligations at the end of charter contracts, including obligations relating to two of Teekay LNG's LNG carriers completing charters with Awilco in 2019;
|
|
•
|
compliance with financing agreements and the expected effect of restrictive covenants in such agreements;
|
|
•
|
operating expenses, availability of crew and crewing costs, number of off-hire days, dry-docking requirements and durations and the adequacy and cost of insurance;
|
|
•
|
the effectiveness of our risk management policies and procedures and the ability of the counterparties to our derivative and other contracts to fulfill their contractual obligations;
|
|
•
|
the impact on us and the shipping industry of environmental liabilities, including climate change;
|
|
•
|
the impact and expected cost of, and our ability to comply with, new and existing governmental regulations and maritime self-regulatory organization standards applicable to our business, including the expected cost to install ballast water treatment systems on our vessels and the switch to burning low sulphur fuel in compliance with the International Marine Organization (or
IMO
) proposals and the effect of IMO 2020,
a new regulation for a 0.50% global sulphur cap for marine fuels effective January 1, 2020.
|
|
•
|
our ability to obtain all permits, licenses and certificates with respect to the conduct of our operations;
|
|
•
|
expected uses of proceeds from vessel or securities transactions;
|
|
•
|
the expectations as to the chartering of unchartered vessels;
|
|
•
|
the impact of our cost saving initiatives;
|
|
•
|
our entering into joint ventures or partnerships with companies;
|
|
•
|
our hedging activities relating to foreign exchange, interest rate and spot market risks, and the effects of fluctuations in foreign exchange, interest rate and spot market rates on our business and results of operations;
|
|
•
|
the potential impact of new accounting guidance; and
|
|
•
|
our business strategy and other plans and objectives for future operations.
|
Forward-looking statements involve known and unknown risks and are based upon a number of assumptions and estimates that are inherently subject to significant uncertainties and contingencies, many of which are beyond our control. Actual results may differ materially from those expressed or implied by such forward-looking statements. Important factors that could cause actual results to differ materially include, but are not limited to, those factors discussed below in “Item 3. Key Information—Risk Factors” and other factors detailed from time to time in other reports we file with the U.S. Securities and Exchange Commission (or the
SEC
).
We do not intend to revise any forward-looking statements in order to reflect any change in our expectations or events or circumstances that may subsequently arise. You should carefully review and consider the various disclosures included in this Annual Report and in our other filings made with the SEC that attempt to advise interested parties of the risks and factors that may affect our business, prospects and results of operations.
|
Item 1.
|
Identity of Directors, Senior Management and Advisors
|
Not applicable.
|
Item 2.
|
Offer Statistics and Expected Timetable
|
Not applicable.
6
|
Item 3.
|
Key Information
|
Selected Financial Data
Set forth below is selected consolidated financial and other data of Teekay for fiscal years
2014
through
2018
, which have been derived from our consolidated financial statements. The data below should be read in conjunction with the consolidated financial statements and the notes thereto and the Reports of the Independent Registered Public Accounting Firm thereon with respect to fiscal years in the three-year period ended December 31,
2018
(which are included herein) and “Item 5. Operating and Financial Review and Prospects.”
Our consolidated financial statements are prepared in accordance with United States generally accepted accounting principles (or
GAAP
).
In May 2014, the Financial Accounting Standards Board issued Accounting Standards Update 2014-09, Revenue from Contracts with Customers (or
ASU 2014-09
). ASU 201
4-09 requires an entity to recognize revenue when it transfers promised goods or services to customers in an amount that reflects the consideration to which the entity expects to be entitled in exchange for those goods or services. ASU 2014-09 became effective for Teekay on January 1, 2018. We adopted ASU 2014-09 as a cumulative-effect adjustment as of the date of adoption. As such, periods prior to January 1, 2018 were not retroactively adjusted.
The impact to our historical consolidated results of operation for the year ended December 31, 2018 was as follows:
|
•
|
We previously presented the net allocation for our vessels participating in revenue sharing arrangements (or
RSAs
) as revenues. We have determined that we are the principal in voyages our vessels perform that are included in the RSAs. As such, the revenue from those voyages is presented in revenues and the difference between this amount and our net allocation from the RSA is presented as voyage expenses. This had the effect of increasing both revenues and voyage expenses for the year ended December 31, 2018 by $292.6 million.
|
|
•
|
We manage vessels owned by our equity-accounted investments and third parties. Upon the adoption of ASU 2014-09, costs incurred by us for our seafarers are presented as vessel operating expenses and the reimbursement of such expenses are presented as revenue, instead of such amounts being presented on a net basis. This had the effect of increasing both revenues and vessel operating expenses for the year ended December 31, 2018 by $82.9 million.
|
7
|
|
Years Ended December 31,
|
|||||||||||||||||||
|
|
2018
|
2017
|
2016
|
2015
|
2014
|
|||||||||||||||
|
|
(in thousands of U.S. Dollars, except share and per share data)
|
|||||||||||||||||||
|
Income Statement Data:
|
||||||||||||||||||||
|
Revenues
|
$
|
1,707,758
|
|
$
|
1,880,332
|
|
$
|
2,328,569
|
|
$
|
2,450,382
|
|
$
|
1,993,920
|
|
|||||
|
Income from vessel operations
(1)
|
164,319
|
|
6,700
|
|
384,290
|
|
625,132
|
|
427,159
|
|
||||||||||
|
Interest expense
|
(254,126
|
)
|
(268,400
|
)
|
(282,966
|
)
|
(242,469
|
)
|
(208,529
|
)
|
||||||||||
|
Interest income
|
8,525
|
|
6,290
|
|
4,821
|
|
5,988
|
|
6,827
|
|
||||||||||
|
Realized and unrealized losses on non-designated derivative instruments
|
(14,852
|
)
|
(38,854
|
)
|
(35,091
|
)
|
(102,200
|
)
|
(231,675
|
)
|
||||||||||
|
Equity income (loss)
|
61,054
|
|
(37,344
|
)
|
85,639
|
|
102,871
|
|
128,114
|
|
||||||||||
|
Foreign exchange gain (loss)
|
6,140
|
|
(26,463
|
)
|
(6,548
|
)
|
(2,195
|
)
|
13,431
|
|
||||||||||
|
Loss on deconsolidation of Teekay Offshore
|
(7,070
|
)
|
(104,788
|
)
|
—
|
|
—
|
|
—
|
|
||||||||||
|
Other (loss) income
|
(2,013
|
)
|
(53,981
|
)
|
(39,013
|
)
|
1,566
|
|
(1,152
|
)
|
||||||||||
|
Income tax (expense) recovery
|
(19,724
|
)
|
(12,232
|
)
|
(24,468
|
)
|
16,767
|
|
(10,173
|
)
|
||||||||||
|
Net (loss) income
|
(57,747
|
)
|
(529,072
|
)
|
86,664
|
|
405,460
|
|
124,002
|
|
||||||||||
|
Net (income) loss attributable to non-controlling interests
|
(21,490
|
)
|
365,796
|
|
(209,846
|
)
|
(323,309
|
)
|
(178,759
|
)
|
||||||||||
|
Net (loss) income attributable to shareholders of Teekay Corporation
|
(79,237
|
)
|
(163,276
|
)
|
(123,182
|
)
|
82,151
|
|
(54,757
|
)
|
||||||||||
|
Per Common Share Data:
|
||||||||||||||||||||
|
Basic (loss) earnings attributable to shareholders of Teekay Corporation
|
(0.79
|
)
|
(1.89
|
)
|
(1.62
|
)
|
1.13
|
|
(0.76
|
)
|
||||||||||
|
Diluted (loss) earnings attributable to shareholders of Teekay Corporation
|
(0.79
|
)
|
(1.89
|
)
|
(1.62
|
)
|
1.12
|
|
(0.76
|
)
|
||||||||||
|
Cash dividends declared
|
0.2200
|
|
0.2200
|
|
0.2200
|
|
1.7325
|
|
1.2650
|
|
||||||||||
|
Balance Sheet Data (at end of year):
|
||||||||||||||||||||
|
Cash and cash equivalents
|
$
|
424,169
|
|
$
|
445,452
|
|
$
|
567,994
|
|
$
|
678,392
|
|
$
|
806,904
|
|
|||||
|
Restricted cash
|
81,470
|
|
106,722
|
|
237,248
|
|
176,437
|
|
119,351
|
|
||||||||||
|
Vessels and equipment
|
5,517,133
|
|
5,208,544
|
|
9,138,886
|
|
9,366,593
|
|
8,106,247
|
|
||||||||||
|
Net investments in direct financing leases
|
575,163
|
|
495,990
|
|
660,594
|
|
684,129
|
|
704,953
|
|
||||||||||
|
Total assets
|
8,391,670
|
|
8,092,437
|
|
12,814,752
|
|
13,061,248
|
|
11,779,690
|
|
||||||||||
|
Total debt (including obligations related to capital leases)
|
4,993,368
|
|
4,578,162
|
|
7,032,385
|
|
7,443,213
|
|
6,715,526
|
|
||||||||||
|
Capital stock and additional paid-in capital
|
1,045,659
|
|
919,078
|
|
887,075
|
|
775,018
|
|
770,759
|
|
||||||||||
|
Non-controlling interest
|
2,058,037
|
|
2,102,465
|
|
3,189,928
|
|
2,782,049
|
|
2,290,305
|
|
||||||||||
|
Total equity
|
2,867,028
|
|
2,879,656
|
|
4,089,293
|
|
3,701,074
|
|
3,388,633
|
|
||||||||||
|
Number of outstanding shares of common stock
|
100,435,210
|
|
89,127,041
|
|
86,149,975
|
|
72,711,371
|
|
72,500,502
|
|
||||||||||
|
Other Financial Data:
|
||||||||||||||||||||
|
EBITDA
(2)
|
$
|
483,885
|
|
$
|
231,099
|
|
$
|
961,102
|
|
$
|
1,134,674
|
|
$
|
758,781
|
|
|||||
|
Adjusted EBITDA
(2)
|
745,076
|
|
893,145
|
|
1,241,857
|
|
1,379,679
|
|
1,027,458
|
|
||||||||||
|
Total debt to total capitalization
(3)
|
63.5
|
%
|
61.4
|
%
|
63.2
|
%
|
66.8
|
%
|
66.5
|
%
|
||||||||||
|
Net debt to total net capitalization
(4)
|
61.0
|
%
|
58.3
|
%
|
60.4
|
%
|
64.0
|
%
|
63.1
|
%
|
||||||||||
|
Capital expenditures:
|
||||||||||||||||||||
|
Expenditures for vessels and equipment
|
$
|
693,792
|
|
$
|
1,054,052
|
|
$
|
648,326
|
|
$
|
1,795,901
|
|
$
|
994,931
|
|
|||||
|
(1)
|
Income from vessel operations includes, among other things, the following:
|
|
Years Ended December 31,
|
||||||||||||||||||||
|
|
2018
|
2017
|
2016
|
2015
|
2014
|
|||||||||||||||
|
|
(in thousands of U.S. Dollars)
|
|||||||||||||||||||
|
Write-down and (loss) gain on sale of vessels
|
$
|
(53,693
|
)
|
$
|
(270,743
|
)
|
$
|
(112,246
|
)
|
$
|
(70,175
|
)
|
$
|
11,271
|
|
|||||
|
Restructuring charges
|
(4,065
|
)
|
(5,101
|
)
|
(26,811
|
)
|
(14,017
|
)
|
(9,826
|
)
|
||||||||||
|
$
|
(57,758
|
)
|
$
|
(275,844
|
)
|
$
|
(139,057
|
)
|
$
|
(84,192
|
)
|
$
|
1,445
|
|
||||||
8
|
(2)
|
EBITDA and Adjusted EBITDA are non-GAAP financial measures.
EBITDA represents earnings before interest, taxes, depreciation and amortization. Adjusted EBITDA represents EBITDA before
foreign exchange gain (loss)
, items included in other (loss) income,
w
rite-down and (loss) gain on sale of vessels, equipment and other operating assets, amortization of in-process revenue contracts, unrealized gains (loss) on derivative instruments, realized losses on interest rate swaps, realized losses on interest rate swap amendments and terminations, loss on deconsolidation of Teekay Offshore, write-downs related to equity-accounted investments, and our share of the above items in non-consolidated joint ventures which are accounted for using the equity method of accounting. EBITDA and Adjusted EBITDA are used as supplemental financial performance measures by management and by external users of our financial statements, such as investors. EBITDA and Adjusted EBITDA assist our management and security holders by increasing the comparability of our fundamental performance from period to period and against the fundamental performance of other companies in our industry that provide EBITDA or Adjusted EBITDA-based information. This increased comparability is achieved by excluding the potentially disparate effects between periods or companies of interest expense, taxes, depreciation or amortization (or other items in determining Adjusted EBITDA), which items are affected by various and possibly changing financing methods, capital structure and historical cost basis and which items may significantly affect net income between periods. We believe that including EBITDA and Adjusted EBITDA benefits security holders in (a) selecting between investing in us and other investment alternatives and (b) monitoring our ongoing financial and operational strength and health in order to assess whether to continue to hold our equity, or debt securities, as applicable.
|
Neither EBITDA nor Adjusted EBITDA should be considered as an alternative to net income, operating income or any other measure of financial performance presented in accordance with GAAP. EBITDA and Adjusted EBITDA exclude some, but not all, items that affect net income and operating income, and these measures may vary among other companies. Therefore, EBITDA and Adjusted EBITDA as presented below may not be comparable to similarly titled measures of other companies.
The following table reconciles our historical consolidated EBITDA and Adjusted EBITDA to net (loss) income.
|
|
Year Ended December 31,
|
|||||||||||||||||||
|
|
2018
|
2017
|
2016
|
2015
|
2014
|
|||||||||||||||
|
|
(in thousands of U.S. Dollars)
|
|||||||||||||||||||
|
Income Statement Data:
|
||||||||||||||||||||
|
Reconciliation of EBITDA and Adjusted EBITDA to Net (loss) income
|
||||||||||||||||||||
|
Net (loss) income
|
$
|
(57,747
|
)
|
$
|
(529,072
|
)
|
$
|
86,664
|
|
$
|
405,460
|
|
$
|
124,002
|
|
|||||
|
Income tax expense (recovery)
|
19,724
|
|
12,232
|
|
24,468
|
|
(16,767
|
)
|
10,173
|
|
||||||||||
|
Depreciation and amortization
|
276,307
|
|
485,829
|
|
571,825
|
|
509,500
|
|
422,904
|
|
||||||||||
|
Interest expense, net of interest income
|
245,601
|
|
262,110
|
|
278,145
|
|
236,481
|
|
201,702
|
|
||||||||||
|
EBITDA
|
483,885
|
|
231,099
|
|
961,102
|
|
1,134,674
|
|
758,781
|
|
||||||||||
|
Foreign exchange (gain) loss
(a)
|
(6,140
|
)
|
26,463
|
|
6,548
|
|
2,195
|
|
(13,431
|
)
|
||||||||||
|
Items included in other loss
(b) (c)
|
2,372
|
|
48,750
|
|
42,401
|
|
—
|
|
7,699
|
|
||||||||||
|
Write-down and loss (gain) on sale of vessels
|
53,693
|
|
270,743
|
|
112,246
|
|
70,175
|
|
(11,271
|
)
|
||||||||||
|
Amortization of in-process revenue contracts
|
(14,890
|
)
|
(26,958
|
)
|
(28,109
|
)
|
(30,085
|
)
|
(40,939
|
)
|
||||||||||
|
Unrealized (gains) losses on derivative instruments
|
(12,590
|
)
|
(13,634
|
)
|
(69,401
|
)
|
(38,319
|
)
|
100,496
|
|
||||||||||
|
Realized losses on interest rate swaps
|
13,898
|
|
53,921
|
|
87,320
|
|
108,036
|
|
125,424
|
|
||||||||||
|
Realized losses on interest rate swap amendments
and terminations
|
13,681
|
|
610
|
|
8,140
|
|
10,876
|
|
1,319
|
|
||||||||||
|
Loss on deconsolidation of Teekay Offshore
(d)
|
7,070
|
|
104,788
|
|
—
|
|
—
|
|
—
|
|
||||||||||
|
Write-down and gain on sale of equity-accounted investments
(e)
|
(21,576
|
)
|
46,168
|
|
2,357
|
|
—
|
|
—
|
|
||||||||||
|
Adjustments relating to equity income
(f)
|
225,673
|
|
151,195
|
|
119,253
|
|
122,127
|
|
99,380
|
|
||||||||||
|
Adjusted EBITDA
|
745,076
|
|
893,145
|
|
1,241,857
|
|
1,379,679
|
|
1,027,458
|
|
||||||||||
|
(a)
|
Foreign exchange (gain) loss
includes the unrealized
gain
of
$21.2 million
in
2018
(
2017
–
gain
of
$82.7 million
,
2016
–
gain
of
$75.0 million
, 2015 – loss of $89.2 million, and 2014 – loss of $167.3 million) on cross currency swaps.
|
|
(b)
|
In June 2016, as part of its financing initiatives, Teekay Offshore canceled the construction contracts for its two UMS newbuildings. As a result, Teekay Offshore accrued for potential damages resulting from the cancellations and reversed contingent liabilities previously recorded that were relating to the delivery of the UMS newbuildings. This net loss provision of $23.4 million for the year ended December 31, 2016 is reported in other loss in our
consolidated statements of (loss) income
. The newbuilding contracts are held in Teekay Offshore's separate subsidiaries and obligations of these subsidiaries are non-recourse to Teekay Offshore.
|
|
(c)
|
The Company held cost-accounted investments at cost. During the year ended December 31, 2016, the Company recorded a write-down of an investment of
$19.0 million
. This investment was subsequently sold in 2017, resulting in a gain on sale of cost-accounted investment of
$1.3 million
. During 2017, the Company recognized an additional tax indemnification guarantee liability of $50 million related to the Teekay Nakilat capital leases.
|
|
(d)
|
On September 25, 2017, Teekay, Teekay Offshore and Brookfield Business Partners L.P. together with its institutional partners (collectively,
Brookfield
) completed a strategic partnership (or the
Brookfield Transaction
), which resulted in the deconsolidation of Teekay Offshore as of that date. For additional information regarding the deconsolidation of Teekay Offshore, please read "Item 18 - Financial Statements: Note 4 – Deconsolidation of TOO".
|
|
(e)
|
The year ended December 31, 2018 includes a gain on the sale of Teekay's 43.5% stake in Magnora ASA in November 2018, a gain on the sale of a 2% ownership interest in Teekay Offshore's general partner to Brookfield in July 2018, a loss on the sale of Teekay's investment in KT Maritime (Pty) Ltd. and a gain on the sale of Teekay LNG's 50% ownership interest in the Excelsior Joint Venture.
|
9
|
(f)
|
Adjustments relating to equity income, which is a non-GAAP measure, should not be considered as an alternative to equity income or any other measure of financial performance or liquidity presented in accordance with GAAP. Adjustments relating to equity income exclude some, but not all, items that affect equity income and these measures may vary among other companies. Therefore, adjustments relating to equity income as presented in this Annual Report may not be comparable to similarly titled measures of other companies. When using Adjusted EBITDA as a measure of liquidity it should be noted that this measure includes the Adjusted EBITDA from our equity-accounted for investments. We do not have control over the operations, nor do we have any legal claim to the revenue and expenses of our equity-accounted for investments. Consequently, the cash flow generated by our equity-accounted for investments may not be available for use by us in the period generated. Equity income from equity-accounted investments is adjusted for depreciation and amortization, interest expense, net of interest income, income tax expense (recovery), amortization of in-process revenue contracts, foreign currency exchange loss (gain), realized and unrealized loss (gain) on derivative instruments and certain other items. Adjustments relating to equity income from our equity-accounted investments are as follows:
|
|
|
Year Ended December 31,
|
||||||||||||||
|
|
2018
|
2017
|
2016
|
2015
|
2014
|
||||||||||
|
(in thousands of U.S. Dollars)
|
|||||||||||||||
|
Depreciation and amortization
|
115,370
|
|
82,513
|
|
69,781
|
|
69,103
|
|
61,367
|
|
|||||
|
Interest expense, net of interest income
|
101,344
|
|
63,189
|
|
45,584
|
|
47,799
|
|
42,713
|
|
|||||
|
Income tax expense (recovery)
|
3,209
|
|
503
|
|
724
|
|
476
|
|
(188
|
)
|
|||||
|
Amortization of in-process revenue contracts
|
(8,799
|
)
|
(4,307
|
)
|
(5,482
|
)
|
(7,153
|
)
|
(8,295
|
)
|
|||||
|
Foreign currency exchange loss (gain)
|
716
|
|
366
|
|
132
|
|
(527
|
)
|
(441
|
)
|
|||||
|
Write-down and loss (gain) on sale of vessels
|
16,277
|
|
5,479
|
|
4,763
|
|
(7,472
|
)
|
(16,923
|
)
|
|||||
|
Realized and unrealized (gain) loss on derivative instruments
|
(4,785
|
)
|
3,452
|
|
3,075
|
|
15,027
|
|
21,147
|
|
|||||
|
Losses on debt repurchases
|
2,341
|
|
—
|
|
—
|
|
—
|
|
—
|
|
|||||
|
Other
|
—
|
|
—
|
|
676
|
|
4,874
|
|
—
|
|
|||||
|
Adjustments relating to equity income
|
225,673
|
|
151,195
|
|
119,253
|
|
122,127
|
|
99,380
|
|
|||||
|
(3)
|
Total capitalization represents total debt and total equity.
|
|
(4)
|
Net debt is a non-GAAP financial measure. Net debt represents total debt less cash, cash equivalents and restricted cash. Total net capitalization represents net debt and total equity.
|
Risk Factors
Some of the following risks relate principally to the industry in which we operate and to our business in general. Other risks relate principally to the securities market and to ownership of our common stock. The occurrence of any of the events described in this section could materially and adversely affect our business, financial condition, operating results and ability to pay interest or principal or dividends on, and the trading price of our public debt and common stock.
Changes in the oil and natural gas markets could result in decreased demand for our vessels and services.
Demand for our vessels and services in transporting, production and storage of oil, petroleum products, LNG and LPG depend upon world and regional oil, petroleum and natural gas markets. Any decrease in shipments of oil, petroleum products, LNG or LPG in those markets could have a material adverse effect on our business, financial condition and results of operations. Historically, those markets have been volatile as a result of the many conditions and events that affect the price, production and transport of oil, petroleum products, LNG or LPG, and competition from alternative energy sources. A slowdown of the U.S. and world economies may result in reduced consumption of oil, petroleum products and natural gas and decreased demand for our vessels and services, which would reduce vessel earnings.
A decline in oil prices may adversely affect our growth prospects and results of operations.
Although global crude oil and gas prices have experienced moderate recovery since falling from the highs of mid-2014, prices have not returned to those same highs and remain volatile due to global and regional geopolitical and economic risks and changes. A
further decline in oil prices may adversely affect our business, results of operations and financial condition and our ability to make cash distributions, as a result of, among other things:
|
•
|
a reduction in or termination of production of oil at certain fields we service, which may reduce our revenues under production-based components of our FPSO unit contracts or life-of-field contracts;
|
|
•
|
reductions in revenues from certain FPSO unit contracts that are affected by changes to oil prices;
|
|
•
|
a reduction in both the competitiveness of natural gas as a fuel for power generation and the market price of natural gas, to the extent that natural gas prices are benchmarked to the price of crude oil;
|
|
•
|
lower demand for vessels of the types we own and operate, which may reduce available charter rates and revenue to us upon redeployment of our vessels, in particular FPSO units, following expiration or termination of existing contracts or upon the initial chartering of vessels, or which may result in extended periods of our vessels being idle between contracts;
|
10
|
•
|
customers potentially seeking to renegotiate or terminate existing vessel contracts, failing to extend or renew contracts upon expiration, or seeking to negotiate cancellable contracts;
|
|
•
|
the inability or refusal of customers to make charter payments to us, including purchase obligations at the end of certain charter contracts, due to financial constraints or otherwise; or
|
|
•
|
declines in vessel values, which may result in losses to us upon vessel sales or impairment charges against our earnings.
|
Current market conditions limit our access to capital and our growth.
We have relied primarily upon bank financing and debt and equity offerings, primarily by the Daughter Entities, to fund our growth. Current market conditions generally in the energy sector and for master limited partnerships have significantly reduced our and the Daughter Entities’ access to capital, particularly equity capital, compared to periods prior to mid-2014. Issuing additional common equity given current market conditions is more dilutive and costly than it has been in the past. Lack of access to debt or equity capital at reasonable rates would adversely affect our growth prospects and our ability to refinance debt and pay dividends to our equityholders.
Teekay Parent has limited current liquidity.
As at December 31, 2018, Teekay Parent had total cash and cash equivalents of $220.2 million and total liquidity, including cash, cash equivalents and undrawn credit facilities, of $333.4 million. The outstanding principal amount of our 8.5% senior unsecured notes that mature in January 2020 was
$508.6 million
and $497.7 million at December 31, 2018 and March 29, 2019, respectively. Our current and forecasted liquidity could constrain our ability to meet our financial obligations. Teekay Parent will need to pursue one or more financing initiatives in order to refinance or repay its 8.5% senior unsecured notes. We are considering, among other things, subject to market conditions and other factors, debt financings, debt and equity securities issuances and sales of Teekay Parent’s FPSO units or other assets. There is no assurance we will be able to complete any of these transactions on acceptable terms, if at all.
Our ability to repay or refinance debt obligations and to fund capital expenditures will depend on certain financial, business and other factors, many of which are beyond our control. We will need to obtain additional financing, which financing may limit our ability to make cash dividends and distributions, increase our financial leverage and result in dilution to our equityholders.
To fund existing and future debt obligations and capital expenditures
and to meet the minimum liquidity requirements under the financial covenants in our credit facilities, we will be required to obtain additional sources of financing, in addition to amounts generated from operations. These anticipated sources of financing include raising additional capital through equity issuances.
Our ability to obtain external financing may be limited by our financial condition at the time of any such financing as well as by adverse market conditions in general. Even if we are successful in obtaining necessary funds, the terms of such financings could limit our ability to pay cash dividends or distributions to security holders or operate our or their businesses as currently conducted. In addition, issuing additional equity securities may result in significant equityholder dilution and would increase the aggregate amount of cash required to maintain quarterly dividends and distributions. The sale of certain assets will reduce cash from operations and the cash available for distribution to equityholders.
For more information on our liquidity requirements, please read “Item 18 - Financial Statements:
Note 16
c
—
Commitments and Contingencies
- Liquidity."
We have guaranteed certain debt of Teekay Tankers and will be directly obligated to make related payments if Teekay Tankers defaults in its payment obligations.
We have guaranteed obligations pursuant to certain credit facilities of Teekay Tankers.
Two
of Teekay Tankers’ term loans require Teekay Parent and Teekay Tankers collectively to maintain the greater of (a) free cash (cash and cash equivalents) of at least
$100.0 million
for
one
of the term loans and
$50.0 million
for the other and (b) an aggregate of free cash and undrawn committed revolving credit lines with at least six months to maturity of at least
7.5%
for
one
of the term loans and
5.0%
for the other, of their total debt. In addition, certain loan agreements require Teekay Tankers to maintain a minimum liquidity (cash, cash equivalents and undrawn committed revolving credit lines with at least
six
months to maturity) of
$35.0 million
and at least
5.0%
of Teekay Tankers' total consolidated debt.
As at
December 31, 2018
, the aggregate outstanding balance on such credit facilities was
$
166.4
million.
If Teekay Tankers defaults in paying these obligations, we will be obligated to make the required payments.
The value of our investment in Teekay Offshore could vary significantly.
We own approximately
13.8%
of the outstanding common units of Teekay Offshore, which units represent 15.9% of the assets of Teekay Parent, at their current carrying value of
$134.4 million
. Based on Teekay Offshore's publicly-traded unit price at December 31, 2018, of $1.21 per unit, the fair value of this investment was
$68.5 million
, and based on the publicly-traded unit price at September 30, 2018 of $2.33 per unit, the fair value of this investment was $131.9 million. We also hol
d warrants exercisable for additional Teekay Offshore common units and we own a 49% interest in Teekay Offshore’s general partner. Due to the recent decline in Teekay Offshore's publicly-traded unit price, we may realize a loss if we choose to divest our investment in Teekay Offshore. Further, should we choose not to divest of our investment in Teekay Offshore and the fair value remains below our carrying value for an other than temporary period, we may recognize a significant impairment loss. Based on the publicly-traded unit price of Teekay Offshore's outstanding common units of $1.20 at March 29, 2019, the fair value of this investment was
$67.9 million
.
11
The value of our investment in Teekay Offshore may be affected by a number of factors, most of which are beyond our control, including, among others, the following:
|
•
|
Teekay Offshore’s distribution policy, its ability to make cash distributions on its common units and any changes in quarterly distributions;
|
|
•
|
Teekay Offshore’s results of operations, cash flows, financial condition and liquidity, including variations in quarterly operating results;
|
|
•
|
future sales of Teekay Offshore common units or other securities;
|
|
•
|
given the number of common units owned by Brookfield and Teekay there is a limited public float of common units;
|
|
•
|
investors’ perceptions of Teekay Offshore and its markets and industries;
|
|
•
|
general economic or financial market conditions;
|
|
•
|
conditions in the energy and master limited partnership capital markets;
|
|
•
|
a reduction in, or termination of, production of oil at fields Teekay Offshore services;
|
|
•
|
lower demand and rates for Teekay Offshore's assets;
|
|
•
|
operational issues, including of Teekay Offshore’s FPSO units;
|
|
•
|
Teekay Offshore’s ability to refinance existing debt obligations, to raise additional debt and capital, to fund capital expenditures, and negotiate extensions or new or redeployments of existing assets, including FPSO units;
|
|
•
|
the loss by Teekay Offshore of any significant customer(s);
|
|
•
|
the ability of Teekay Offshore's customers and other business partners to fulfill their contractual obligations, or the early termination of any contracts;
|
|
•
|
the outcome and cost of claims or potential claims against Teekay Offshore;
|
|
•
|
the failure of securities analysts to publish research about Teekay Offshore’s common units or analysts making changes in their financial estimates; and
|
|
•
|
announcements by Teekay Offshore or its competitors of significant contracts, acquisitions or capital commitments.
|
In addition, pursuant to the terms of the LLC agreement of the general partner of Teekay Offshore, we have agreed to certain restrictions on our ability to transfer our membership interest in the general partner of Teekay Offshore without the prior approval of Brookfield and, if Brookfield agrees to sell all or substantially all of its common units in Teekay Offshore and membership interests in Teekay Offshore’s general partner, Brookfield may require us to participate in the sale on the same terms and conditions as Brookfield.
Our reputation could be harmed if Teekay Offshore fails to operate its fleet up to our standards.
In connection with the 2017 transactions among us, Teekay Offshore and Brookfield, we entered into a trademark license agreement with Teekay Offshore, pursuant to which we have granted to Teekay Offshore a license to use certain intellectual property, including trademarks and service marks owned by us, in connection with Teekay Offshore’s business. The license permits Teekay Offshore to, among other things, use the Teekay logo and other identifying traits on its vessels. The license is granted subject to Teekay Offshore’s compliance with Teekay quality control standards, applicable legal requirements and other conditions, including operation of Teekay Offshore’s business consistent with certain key performance indicators applicable to Teekay LNG and Teekay Tankers. However, failure of Teekay Offshore to operate its business or fleet in accordance with such standards and indicators, particularly if a vessel was involved in a significant maritime or environmental incident, may harm our reputation before we are able to terminate the license agreement for noncompliance.
Our cash flow depends substantially on the ability of our subsidiaries and equity-accounted investees, primarily our Daughter Entities, to make distributions to us. Our Daughter Entities have significantly reduced their cash distribution levels.
The source of our cash flow includes cash distributions and dividends from our subsidiaries and equity-accounted investees, primarily Teekay LNG, Teekay Tankers, and Teekay Offshore. The amount of cash our subsidiaries and equity-accounted investees can distribute to us principally depends upon the amount of distributions or dividend declared by each of their Boards of Directors and the amount of cash they generate from their operations.
Effective for the quarterly distribution of the fourth quarter of 2015, we reduced our quarterly cash dividend per share to $0.055 from $0.55, Teekay LNG reduced its quarterly cash distribution per common unit to $0.14 from $0.70, and Teekay Offshore reduced its quarterly cash distribution per common unit to $0.11 from $0.56. At the time these changes were made, there was a dislocation in the capital markets relative to the stability of our businesses. More specifically, the future equity capital requirements for our committed growth projects, coupled with the relative weakness in energy and capital markets, resulted in our conclusion that it would be in the best interests of our shareholders to conserve more of our internally generated cash flows to fund committed existing growth projects and to reduce debt levels.
12
We and Teekay LNG each maintained these reduced dividend and distribution levels throughout 2016, 2017 and 2018. Teekay LNG has announced a distribution increase of 36% from 2018 levels, effective in the first quarter of 2019. Teekay Offshore maintained its reduced distribution level throughout 2016, and in September 2017, Teekay Offshore further reduced its quarterly cash distribution per common unit to $0.01 in connection with the Brookfield Transaction. Pursuant to the terms of the amended limited liability company agreement entered into upon closing of the Brookfield Transaction, Teekay Offshore’s general partner and we have agreed not to declare or pay (or cause the general partner to declare or to pay) any quarterly distribution on the Teekay Offshore common units in an amount over $0.01 per unit without the prior consent of Brookfield. Teekay Offshore maintained this dividend and distribution level through 2018 and further reduced its quarterly cash distribution per common unit to $nil in January 2019 in order to reinvest additional cash in the business. There is no guarantee that quarterly cash distributions payable to common unitholders of Teekay Offshore will return to historical levels.
Effective May 2018, Teekay Tankers eliminated the payment of its minimum quarterly dividend of $0.03 per share in order to preserve liquidity during the cyclical downturn of the tanker spot market. Otherwise, its dividend policy remains the same, with quarterly dividends expected to range from 30% to 50% of its quarterly adjusted net income, subject to reserves its Board of Directors may determine are necessary for the prudent operations of Teekay Tankers.
These distribution reductions by Teekay Offshore, Teekay LNG and Teekay Tankers substantially reduced our cash flows from them, including by currently eliminating any distributions on our incentive distribution rights in Teekay Offshore and Teekay LNG.
The amount of cash our subsidiaries and equity-accounted investees generate from their operations may fluctuate from quarter-to-quarter based on, among other things:
|
•
|
the rates they obtain from their charters, voyages and contracts;
|
|
•
|
the price and level of production of, and demand for, crude oil, LNG and LPG, including the level of production at the offshore oil fields Teekay Offshore services under contracts of affreightment;
|
|
•
|
the operating performance of our and Teekay Offshore's FPSO units, whereby receipt of incentive-based revenue from the FPSO units is dependent upon the fulfillment of the applicable performance criteria;
|
|
•
|
the level of their operating costs, such as the cost of crews and repairs and maintenance;
|
|
•
|
the number of off-hire days for their vessels and the timing of, and number of days required for, dry docking of vessels;
|
|
•
|
the rates, if any, at which Teekay Offshore may be able to redeploy shuttle tankers in the spot market as conventional oil tankers during any periods of reduced or terminated oil production at fields serviced by contracts of affreightment;
|
|
•
|
the rates, if any, at which our subsidiaries and equity-accounted investees may be able to redeploy vessels, particularly FPSO units, after they complete their charters or contracts and are redelivered to us;
|
|
•
|
the rates, if any, and ability, at which our subsidiaries and equity-accounted investees may be able to contract our newbuilding vessels, including Teekay Offshore's towage vessels;
|
|
•
|
the rates, if any, at which Teekay Tankers can deploy tankers in revenue sharing arrangements and/or the spot market;
|
|
•
|
delays in the delivery of any newbuildings or in any future conversions of upgrades of existing vessels, and the beginning of payments under charters relating to those vessels;
|
|
•
|
prevailing global and regional economic and political conditions;
|
|
•
|
currency exchange rate fluctuations; and
|
|
•
|
the effect of governmental regulations and maritime self-regulatory organization standards on the conduct of business.
|
The actual amount of cash our subsidiaries and equity-accounted investees have available for distribution also depends on other factors such as:
|
•
|
the level of their capital expenditures, including for maintaining vessels or converting existing vessels for other uses and complying with regulations;
|
|
•
|
their debt service requirements and restrictions on distributions contained in their debt agreements,
including financial ratio covenants which may indirectly restrict loans, distributions or dividends
;
|
|
•
|
fluctuations in their working capital needs;
|
|
•
|
their ability to make working capital borrowings; and
|
|
•
|
the amount of any cash reserves, including reserves for future maintenance capital expenditures, working capital and other matters, established by the Boards of Directors of the Daughter Entities at their discretion.
|
The amount of cash our subsidiaries and equity-accounted investees generate from operations may differ materially from their profit or loss for the period, which will be affected by non-cash items and the timing of debt service payments. As a result of this and the other factors mentioned above, our subsidiaries and equity-accounted investees may make cash distributions during periods when they record losses and may not make cash distributions during periods when they record net income.
13
The cyclical nature of the tanker industry may lead to volatile changes in charter rates and significant fluctuations in the utilization of our vessels, which may adversely affect our earnings and profitability.
Historically, the tanker industry has been cyclical, experiencing volatility in profitability due to changes in the supply of and demand for tanker capacity and changes in the supply of and demand for oil and oil products. The cyclical nature of the tanker industry may cause significant increases or decreases in the revenue we earn from our vessels and may also cause significant increases or decreases in the value of our vessels. If the tanker market is depressed, our earnings may decrease, particularly with respect to the conventional tanker vessels owned by Teekay Tankers, which accounted for approximately
44%
and
23%
of our consolidated revenues during
2018
and
2017
, respectively. These vessels are primarily employed on the spot-charter market, which is highly volatile and fluctuates based upon tanker and oil supply and demand. Declining spot rates in a given period generally will result in corresponding declines in operating results for that period. The successful operation of our vessels in the spot-charter market depends upon, among other things, obtaining profitable spot charters and minimizing, to the extent possible, time spent waiting for charters and time spent traveling unladen to pick up cargo. Future spot rates may not be sufficient to enable our vessels trading in the spot tanker market to operate profitably or to provide sufficient cash flow to service our debt obligations. The factors affecting the supply of and demand for tankers are outside of our control, and the nature, timing and degree of changes in industry conditions are unpredictable.
Factors that influence demand for tanker capacity include:
|
•
|
demand for oil and oil products;
|
|
•
|
supply of oil and oil products;
|
|
•
|
regional availability of refining capacity;
|
|
•
|
global and regional economic and political conditions;
|
|
•
|
the distance oil and oil products are to be moved by sea; and
|
|
•
|
changes in seaborne and other transportation patterns.
|
Factors that influence the supply of tanker capacity include:
|
•
|
the number of newbuilding deliveries;
|
|
•
|
the scrapping rate of older vessels;
|
|
•
|
conversion of tankers to other uses;
|
|
•
|
the number of vessels that are out of service; and
|
|
•
|
environmental concerns and regulations.
|
Changes in demand for transportation of oil over longer distances and in the supply of tankers to carry that oil may materially affect our revenues, profitability and cash flows.
Reduction in oil produced from offshore oil fields may adversely affect the results of operations from our FPSO units.
As at
December 31, 2018
, we had three FPSO units operating in our fleet. The revenue earned by certain FPSO units depends upon the volume of oil produced from offshore oil fields. Oil production levels are affected by several factors, all of which are beyond our control, including: geologic factors, including general declines in production that occur naturally over time; mechanical failure or operator error; the rate of technical developments in extracting oil and related infrastructure and implementation costs; and operator decisions based on revenue compared to costs from continued operations.
Factors that may affect an operator’s decision to initiate or continue production include: changes in oil prices; capital budget limitations; the availability of necessary drilling and other governmental permits; the availability of qualified personnel and equipment; the quality of drilling prospects in the area; and regulatory changes. The rate of oil production at fields we service may decline from existing or future levels, and may be terminated, all of which could harm our business and operating results.
The redeployment risk of FPSO units is high given their lack of alternative uses and significant costs.
FPSO units are specialized vessels that have very limited alternative uses and high fixed costs. In addition, FPSO units typically require substantial capital investments prior to being redeployed to a new field and production service agreement. These factors increase the redeployment risk of FPSO units. Our clients may also terminate certain of our FPSO production service agreements prior to their expiration under specified circumstances. Any idle time prior to the commencement of a new contract or our inability to redeploy the vessels at acceptable rates may have an adverse effect on our business and operating results.
14
The duration of many of our FPSO contracts is the life of the relevant oil field or is subject to extension by the field operator or vessel charterer. If the oil field no longer produces oil or is abandoned or the contract term is not extended, we will no longer generate revenue under the related contract and will need to seek to redeploy affected vessels.
Certain FPSO contracts under which our vessels operate are subject to extensions beyond their initial term. The likelihood of these contracts being extended may be negatively affected by reductions in oil field reserves, low oil prices generally or other factors. If we are unable to promptly redeploy any affected vessels at rates at least equal to those under the contracts, if at all, our operating results will be harmed. Any potential redeployment may not be under long-term contracts, which may affect the stability of our business and operating results.
Charter rates for conventional oil and product tankers may fluctuate substantially over time and may be lower when we are attempting to re-charter these vessels, which could adversely affect our operating results. Any changes in charter rates for LNG carriers, LPG carriers, or FPSO units could also adversely affect redeployment opportunities for those vessels.
Our ability to re-charter our conventional oil and product tankers following expiration of existing time-charter contracts and the rates payable upon any renewal or replacement charters will depend upon, among other things, the state of the conventional tanker market. Conventional oil and product tanker trades are highly competitive and have experienced significant fluctuations in charter rates based on, among other things, oil, refined petroleum product and vessel demand. For example, an oversupply of conventional oil tankers can significantly reduce their charter rates. There also exists some volatility in charter rates for LNG and LPG carriers, and FPSO units, which could also adversely affect redeployment opportunities for those vessels.
If upon scheduled expiration or any early termination we are unable to renew or replace fixed-rate charters on favorable terms, if at all, or if we choose not to renew or replace fixed-rate charters, we may employ applicable vessels in the volatile spot market. Increasing our exposure to the spot market, particularly during periods of unfavorable market conditions, could harm our results of operations and make them more volatile.
Over time, the value of our vessels may decline, which could adversely affect our operating results.
Vessel values for oil and product tankers, LNG and LPG carriers
, and FPSO units
can fluctuate substantially over time due to a number of different factors, including:
|
•
|
prevailing economic conditions in oil and energy markets;
|
|
•
|
a substantial or extended decline in demand for oil or natural gas;
|
|
•
|
increases in the supply of vessel capacity;
|
|
•
|
competition from more technologically advanced vessels;
|
|
•
|
the cost of retrofitting or modifying existing vessels, as a result of technological advances in vessel design or equipment, changes in applicable environmental or other regulations or standards, or otherwise; and
|
|
•
|
a decrease in oil reserves in the fields and other fields in which our FPSO units or other vessels might otherwise be deployed.
|
Vessel values may decline from existing levels. If operation of a vessel is not profitable, or if we cannot redeploy a chartered vessel at attractive rates upon charter termination, rather than continue to incur costs to maintain and finance the vessel, we may seek to dispose of it. Our inability to dispose of the vessel at a fair market value or the disposal of the vessel at a fair market value that is lower than its book value could result in a loss on its sale and adversely affect our results of operations and financial condition.
Teekay Parent anticipates selling its three FPSO units in the future. If the sales price for any such transactions is lower than the carrying value of the applicable FPSO unit, we could incur a material impairment charge.
Further, if we determine at any time that a vessel’s future useful life and earnings require us to impair its value on our financial statements, we may need to recognize a significant impairment charge against our earnings. S
uch a determination involves numerous assumptions and estimates, some of which require more discretion and are less predictable, including certain estimates for our FPSO units.
We recognized asset impairment charges, excluding impairment charges recognized by Teekay Offshore subsequent to its deconsolidation on September 25, 2017, of
$53.7 million
,
$270.7 million
and
$112.2 million
in
2018
,
2017
, and
2016
, respectively.
The 2017 charge included impairments recognized of $205.7 million for two of our three FPSO units, the
Petrojarl Banff
and
Petrojarl Foinaven.
Declining market values of our vessels could adversely affect our liquidity and result in breaches of our financing agreements.
Market values of vessels fluctuate depending upon general economic and market conditions affecting relevant markets and industries and competition from other shipping companies and other modes of transportation. In addition, as vessels become older, they generally decline in value. Declining vessel values could adversely affect our liquidity by limiting our ability to raise cash by refinancing vessels. Declining vessel values could also result in a breach of loan covenants and events of default under certain of our credit facilities that require us to maintain certain loan-to-value ratios. If we are unable to pledge additional collateral in the event of a decline in vessel values, the lenders under these facilities could accelerate our debt and foreclose on our vessels pledged as collateral for the loans. As of
December 31, 2018
, the total outstanding debt under credit facilities with this type of loan-to-value covenant tied to conventional tanker values was
$575.6 million
and tied to LNG carrier values was
$442.2 million
. We have
five
financing arrangements that require us to maintain vessel value to outstanding loan principal balance ratios ranging from
115%
to
135%
. At
December 31, 2018
, we were in compliance with these required ratios.
15
Our growth depends on continued growth in demand for LNG and LPG, and LNG and LPG shipping.
A significant portion of our growth strategy focuses on continued expansion in the LNG and LPG shipping sectors.
Expansion of the LNG and LPG shipping sectors depends on growth in world and regional demand for LNG and LPG and marine transportation of LNG and LPG, as well as the supply of LNG and LPG. Demand for LNG and LPG and for the marine transportation of LNG and LPG could be negatively affected by a number of factors, such as:
|
•
|
increases in the cost of natural gas derived from LNG relative to the cost of natural gas generally;
|
|
•
|
increases in the cost of LPG relative to the cost of naphtha and other competing petrochemicals;
|
|
•
|
increases in the production of natural gas in areas linked by pipelines to consuming areas, the extension of existing, or the development of new, pipeline systems in markets we may serve, or the conversion of existing non-natural gas pipelines to natural gas pipelines in those markets;
|
|
•
|
decreases in the consumption of natural gas due to increases in its price relative to other energy sources or other factors making consumption of natural gas less attractive;
|
|
•
|
additional sources of natural gas, including shale gas;
|
|
•
|
availability of alternative energy sources; and
|
|
•
|
negative global or regional economic or political conditions, particularly in LNG and LPG consuming regions, which could reduce energy consumption or its rate of growth.
|
Reduced demand for LNG or LPG and LNG or LPG shipping could have a material adverse effect on future growth of Teekay LNG and could harm its results. Growth of the LNG and LPG markets may be limited by infrastructure constraints and community and environmental group resistance to new LNG and LPG infrastructure over concerns about the environment, safety and terrorism. If the LNG or LPG supply chain is disrupted or does not continue to grow, or if a significant LNG or LPG explosion, spill or similar incident occurs, it could have a material adverse effect on demand for LNG or LPG and could harm our business, results of operations and financial condition.
The intense competition in our markets may lead to reduced profitability or reduced expansion opportunities.
Our vessels operate in highly competitive markets. Competition arises primarily from other vessel owners, including major oil companies and independent companies. We also compete with owners of other size vessels. Our market share is insufficient to enforce any degree of pricing discipline in the markets in which we operate, and our competitive position may erode in the future. Any new markets that we enter could include participants that have greater financial strength and capital resources than we have. We may not be successful in entering new markets.
One of our objectives is to enter into additional long-term, fixed-rate charters for our LNG and LPG carriers, and FPSO units. The process of obtaining new long-term time charters is highly competitive and generally involves an intensive screening process and competitive bids, and often extends for several months. We expect competition for providing services for potential gas and offshore projects from other experienced companies, including state-sponsored entities. Our competitors may have greater financial resources than us. This increased competition may cause greater price competition for charters. As a result of these factors, we may be unable to expand our relationships with existing customers or to obtain new customers on a profitable basis, if at all, which would have a material adverse effect on our business, results of operations and financial condition.
Teekay Offshore is not controlled by us and may engage in competition with us.
We have entered into an omnibus agreement with Teekay LNG, Teekay Offshore and related parties governing, among other things, when Teekay, Teekay LNG, and Teekay Offshore may compete with each other and providing for rights of first offer on the transfer or rechartering of certain LNG carriers, oil tankers, shuttle tankers, FSO units and FPSO units. Subject to applicable exceptions, the omnibus agreement generally provides that, without the approval of the other applicable parties, (a) neither Teekay nor Teekay LNG will own or operate offshore vessels (i.e. dynamically positioned shuttle tankers, FSO units and FPSO units) that are subject to contracts with a duration of three years or more, excluding extension options, (b) neither Teekay nor Teekay Offshore will own or operate LNG carriers and (c) neither Teekay LNG nor Teekay Offshore will own or operate crude oil tankers, other than crude oil tankers included in their respective fleets as of the dates of their respective initial public offerings and certain replacement tankers. If Teekay or its affiliates no longer control the general partner of Teekay LNG or Teekay Offshore or if there is a change of control of Teekay, the general partner of Teekay LNG or Teekay Offshore or Teekay, as applicable, may terminate relevant noncompetition and rights of first offer provisions of the omnibus agreement. During 2018, Brookfield Business Partners L.P. and its institutional investors acquired a 51% ownership interest in the general partner of Teekay Offshore and have the right to appoint a majority of the directors of the general partner’s Board of Directors. This transaction constituted a change of control, giving Teekay Offshore the right to elect to terminate the omnibus agreement as it applies to Teekay Offshore, though we have not received any indication from Teekay Offshore that it intends to do so.
16
The loss of any key customer or its inability to pay for our services could result in a significant loss of revenue in a given period.
We have derived, and believe that we will continue to derive, a significant portion of our revenues from a limited number of customers.
One customer, an international oil company, accounted for an aggregate of 11%, or $195.0 million, of our consolidated revenues during 2018 (2017 – two customers for 24%, or $442.4 million; 2016 – two customers for 29%, or $653.6 million). During these periods, no other customer accounted for over 10% of our revenues for the applicable period
.
The loss of any significant customer or a substantial decline in the amount of services requested by a significant customer, or the inability of a significant customer to pay for our services, could have a material adverse effect on our business, financial condition and results of operations.
We could lose a customer or the benefits of a contract if:
|
•
|
the customer fails to make payments because of its financial inability, disagreements with us or otherwise;
|
|
•
|
we agree to reduce the payments due to us under a contract because of the customer’s inability to continue making the original payments;
|
|
•
|
the customer exercises certain rights to terminate the contract; or
|
|
•
|
the customer terminates the contract because we fail to deliver the vessel within a fixed period of time, the vessel is lost or damaged beyond repair, there are serious deficiencies in the vessel or prolonged periods of off-hire, or we default under the contract.
|
If we lose a key customer, we may be unable to obtain replacement long-term charters. If a customer exercises its right under some charters to purchase the vessel, or terminate the charter, we may be unable to acquire an adequate replacement vessel or charter. Any replacement newbuilding would not generate revenues during its construction and we may be unable to charter any replacement vessel on terms as favorable to us as those of the terminated charter.
The loss of any of our significant customers or a reduction in revenues from them could have a material adverse effect on our business, results of operations and financial condition and our ability to pay dividends and service our debt.
In June 2017, Teekay LNG reached an agreement with Awilco to defer a portion of charter hire and extend the two LNG carrier bareboat charter contracts that were originally due to expire in November 2017 and August 2018 to December 2019, which would also include related purchase obligations on both vessels due at that time. However, there is no assurance that Awilco will be able to generate enough operating cash flows or have the ability to raise enough equity to pay for the charter hire deferrals and associated purchase obligations for the two LNG carriers.
Future adverse economic conditions, including disruptions in the global credit markets, could adversely affect our business, financial condition and results of operations.
Economic downturns and financial crises in the global markets could produce illiquidity in the capital markets, market volatility, increased exposure to interest rate and credit risks and reduced access to capital markets. If global financial markets and economic conditions significantly deteriorate in the future, we may face restricted access to the capital markets or bank lending, which may make it more difficult and costly to fund future growth. Decreased access to such resources could have a material adverse effect on our business, financial condition and results of operations.
Future adverse economic conditions or other developments may affect our customers’ ability to charter our vessels and pay for our services and may adversely affect our business and results of operations.
Future adverse economic conditions or other developments relating directly to our customers may lead to a decline in our customers’ operations or ability to pay for our services, which could result in decreased demand for our vessels and services. Our customers’ inability to pay for any reason could also result in their default on our current contracts and charters. The decline in the amount of services requested by our customers or their default on our contracts with them could have a material adverse effect on our business, financial condition and results of operations.
Our operations are subject to substantial environmental and other regulations, which may significantly increase our expenses.
Our operations are affected by extensive and changing international, national and local environmental protection laws, regulations, treaties and conventions in force in international waters, the jurisdictional waters of the countries in which our vessels operate, as well as the countries of our vessels’ registration, including those governing oil spills, discharges to air and water, and the handling and disposal of hazardous substances and wastes. Many of these requirements are designed to reduce the risk of oil spills and other pollution. In addition, we believe that the heightened environmental, quality and security concerns of insurance underwriters, regulators and charterers will lead to additional regulatory requirements, including enhanced risk assessment and security requirements and greater inspection and safety requirements on vessels. We expect to incur substantial expenses in complying with these laws and regulations, including expenses for vessel modifications and changes in operating procedures.
17
These requirements can affect the resale value or useful lives of our vessels, require a reduction in cargo capacity, ship modifications or operational changes or restrictions, lead to decreased availability of insurance coverage for environmental matters or result in the denial of access to certain jurisdictional waters or ports, or detention in, certain ports. Under local, national and foreign laws, as well as international treaties and conventions, we could incur material liabilities, including clean-up obligations, in the event that there is a release of petroleum or other hazardous substances from our vessels or otherwise in connection with our operations. We could also become subject to personal injury or property damage claims relating to the release of or exposure to hazardous materials associated with our operations. In addition, failure to comply with applicable laws and regulations may result in administrative and civil penalties, criminal sanctions or the suspension or termination of our operations, including, in certain instances, seizure or detention of our vessels. For further information about regulations affecting our business and related requirements on us, please read “Item 4. Information on the Company—B. Operations—Regulations.”
We may be unable to make or realize expected benefits from acquisitions and implementing our long-term strategy of growth through acquisitions may harm our financial condition and performance.
A principal component of our long-term strategy is to continue to grow by expanding our business both in the geographic areas and markets where we have historically focused as well as into new geographic areas, market segments and services. We may not be successful in expanding our operations and any expansion may not be profitable. Our long-term strategy of growth through acquisitions involves business risks commonly encountered in acquisitions of companies, including:
|
•
|
interruption of, or loss of momentum in, the activities of one or more of an acquired company’s businesses and our businesses;
|
|
•
|
additional demands on members of our senior management while integrating acquired businesses, which would decrease the time they have to manage our existing business, service existing customers and attract new customers;
|
|
•
|
difficulties identifying suitable acquisition candidates;
|
|
•
|
difficulties integrating the operations, personnel and business culture of acquired companies;
|
|
•
|
difficulties coordinating and managing geographically separate organizations;
|
|
•
|
adverse effects on relationships with our existing suppliers and customers, and those of the companies acquired;
|
|
•
|
difficulties entering geographic markets or new market segments in which we have no or limited experience; and
|
|
•
|
loss of key officers and employees of acquired companies.
|
Acquisitions may not be profitable to us at the time of their completion and may not generate revenues sufficient to justify our investment. In addition, our acquisition growth strategy exposes us to risks that may harm our results of operations and financial condition, including risks that we may: fail to realize anticipated benefits, such as cost-savings, revenue and cash flow enhancements and earnings accretion; decrease our liquidity by using a significant portion of our available cash or borrowing capacity to finance acquisitions; incur additional indebtedness, which may result in significantly increased interest expense or financial leverage, or issue additional equity securities to finance acquisitions, which may result in significant shareholder dilution; incur or assume unanticipated liabilities, losses or costs associated with the business acquired; or incur other significant charges, such as impairment of goodwill or other intangible assets, asset devaluation or restructuring charges.
Unlike newbuildings, existing vessels typically do not carry warranties as to their condition. While we generally inspect existing vessels prior to purchase, such an inspection would normally not provide us with as much knowledge of a vessel’s condition as we would possess if it had been built for us and operated by us during its life. Repairs and maintenance costs for existing vessels are difficult to predict and may be substantially higher than for vessels we have operated since they were built. These costs could decrease our cash flow and reduce our liquidity.
Our insurance may not be sufficient to cover losses that may occur to our property or as a result of our operations.
The operation of oil and product tankers, lightering vessels, oil and gas transfer operations, LNG and LPG carriers and FPSO units are inherently risky. Although we carry hull and machinery (marine and war risk) and protection and indemnity insurance, all risks may not be adequately insured against, and any particular claim may not be paid. In addition, only certain of our LNG and LPG carriers carry insurance covering the loss of revenues resulting from vessel off-hire time based on its cost compared to our off-hire experience. Any significant off-hire time of our vessels could harm our business, operating results and financial condition. Any claims relating to our operations covered by insurance would be subject to deductibles, and since it is possible that a large number of claims may be brought, the aggregate amount of these deductibles could be material. Certain of our insurance coverage is maintained through mutual protection and indemnity associations and as a member of such associations we may be required to make additional payments over and above budgeted premiums if member claims exceed association reserves.
We may be unable to procure adequate insurance coverage at commercially reasonable rates in the future. For example, more stringent environmental regulations have led in the past to increased costs for, and in the future may result in the lack of availability of, insurance against risks of environmental damage or pollution. A catastrophic oil spill, marine disaster or natural disaster could result in losses that exceed our insurance coverage, which could harm our business, financial condition and operating results. Any uninsured or under-insured loss could harm our business and financial condition. In addition, our insurance may be voidable by the insurers as a result of certain of our actions, such as our ships failing to maintain certification with applicable maritime regulatory organizations.
18
Changes in the insurance markets attributable to terrorist attacks, environmental catastrophes or political changes may also make certain types of insurance more difficult for us to obtain. In addition, the insurance that may be available may be significantly more expensive than our existing coverage.
Past port calls by our vessels, or third-party vessels from which we derived pooling revenues, to countries that are subject to sanctions imposed by the United States and the European Union may impact investors’ decisions to invest in our securities.
The United States has imposed sanctions on several countries or regions such as Cuba, North Korea, Syria and the Crimea region of the Ukraine. The United States and the European Union (or
EU
) also had imposed sanctions on trade with Iran. The EU lifted these sanctions in January 2016. At that time, the U.S. lifted its secondary sanctions on Iran which applied to foreign persons but has retained its primary sanctions which apply to U.S. entities and their foreign subsidiaries. In the past, conventional oil tankers owned or chartered-in by us, or third-party vessels participating in revenue sharing arrangements (or
RSAs
) from which we derive revenue, made limited port calls to those countries for the loading and discharging of oil products. Those port calls did not violate U.S. or EU sanctions at the time and we intend to maintain our compliance with all U.S. and EU sanctions. In addition, we have no future contracted loadings or discharges in any of those countries and intend not to enter into voyage charter contracts for the transport of oil or gas to or from Iran or Syria.
We believe that our compliance with these sanctions and our lack of any future port calls to those countries does not and will not adversely impact our revenues, because port calls to these countries have never accounted for any material amount of our revenues. However, some investors might decide not to invest in us simply because we have previously called on, or through our participation in RSAs have previously received revenue from calls on, ports in these sanctioned countries. Any such investor reaction could adversely affect the market for our common shares.
Marine transportation and oil production is inherently risky, and an incident involving loss or damage to a vessel, significant loss of product or environmental contamination by any of our vessels could harm our reputation and business.
Our vessels, crew and cargoes are at risk of being damaged, injured or lost because of events such as:
|
•
|
marine disaster;
|
|
•
|
bad weather or natural disasters;
|
|
•
|
mechanical failures;
|
|
•
|
grounding, fire, explosions and collisions;
|
|
•
|
piracy (hijacking and kidnapping);
|
|
•
|
cyber-attack;
|
|
•
|
human error; and
|
|
•
|
war and terrorism.
|
An accident involving any of our vessels could result in any of the following:
|
•
|
death or injury to persons, loss of property or environmental damage or pollution;
|
|
•
|
delays in the delivery of cargo;
|
|
•
|
loss of revenues from or termination of charter contracts;
|
|
•
|
governmental fines, penalties or restrictions on conducting business;
|
|
•
|
higher insurance rates; and
|
|
•
|
damage to our reputation and customer relationships generally.
|
Any of these results could have a material adverse effect on our business, financial condition and operating results.
In addition, any damage to, or environmental contamination involving, oil production facilities serviced by our vessels could result in the suspension or curtailment of operations by our customer, which would in turn result in loss of revenues to us.
Our operating results are subject to seasonal fluctuations.
We operate our conventional tankers in markets that have historically exhibited seasonal variations in demand and, therefore, in charter rates. This seasonality may result in quarter-to-quarter volatility in our results of operations. Tanker markets are typically stronger in the winter months as a result of increased oil consumption in the Northern Hemisphere. In addition, unpredictable weather patterns in these months tend to disrupt vessel scheduling, which historically has increased oil price volatility and oil trading activities in the winter months. As a result, our revenues have historically been weaker during the fiscal quarters ended June 30 and September 30, and stronger in our fiscal quarters ended March 31 and December 31.
19
Due to harsh winter weather conditions, oil field operators in the North Sea typically schedule oil platform and other infrastructure repairs and maintenance during the summer months. Because the North Sea is our primary existing offshore oil market for our FPSO units, this seasonal repair and maintenance activity contributes to quarter-to-quarter volatility in our results of operations, as oil production typically is lower in the fiscal quarters ended June 30 and September 30 in this region compared with production in the fiscal quarters ended March 31 and December 31.
We and the Daughter Entities expend substantial sums during construction of newbuildings or upgrades to our or their existing vessels, including upgrades to FPSO units, without earning revenue and without assurance that they will be completed.
We are typically required to expend substantial sums as progress payments during construction of a newbuilding or upgrades to our existing FPSO units, but we do not derive any revenue from the vessel until after its delivery. In addition, under some of our time charters if our delivery of a vessel to a customer is delayed, we may be required to pay liquidated damages in amounts equal to or, under some charters, almost double the hire rate during the delay. For prolonged delays, the customer may terminate the time charter and, in addition to the resulting loss of revenues, we may be responsible for additional substantial liquidated charges.
Our newbuilding financing commitments typically have been pre-arranged. However, if we are unable to obtain financing required to complete payments on any of our newbuilding orders, we could effectively forfeit all or a portion of the progress payments previously made. As of
December 31, 2018
, Teekay LNG had
6
LNG carrier newbuildings scheduled for delivery in 2019 (of which one is 100% owned, four are 50%-owned and one is 20%-owned), and one 30%-owned LNG receiving and regasification terminal under construction scheduled for completion in 2019. In January 2019, Teekay LNG had in place $636 million, based on its proportionate share of the remaining newbuilding installments, of financing required for the majority of its remaining newbuilding vessels, and its LNG receiving and regasification terminal under construction.
Actual results of new technologies or technologies upgrades may differ from expected results and affect our results of operations.
Teekay LNG has invested and is investing in technology upgrades such as MEGI twin engines and other equipment and designs for certain LNG carrier newbuildings, including, among other things, to improve fuel efficiency and vessel performance. These new engine designs and other equipment may not perform to expectations, which may result in performance issues or claims based on failure to achieve specification included in charter party agreements. Actual fuel consumption for Teekay LNG’s MEGI LNG carriers exceeds specified levels in certain charter party agreements, which may result in reimbursement by Teekay LNG to the charterer for the cost of the excess fuel consumed. The amount of the reimbursements generally will increase to the extent fuel prices increase, including as a result of the IMO 2020 regulations that will take effect January 1, 2020 and limit Sulphur content in vessel fuel oils. Teekay LNG is considering installing additional equipment to lower fuel consumption on these vessels and taking action against the shipbuilders for failure to deliver vessels that meet anticipated levels of fuel efficiency. Continued reimbursement obligations or unrecovered capital expenditures could harm our results of operations or financial condition.
We make substantial capital expenditures to expand the size of our fleet and generally are required to make significant installment payments for acquisitions of newbuilding vessels. Depending on whether we finance our expenditures through cash from operations or by incurring debt or issuing equity securities, our financial leverage could increase, or our shareholders could be diluted.
We regularly evaluate and pursue opportunities to provide the marine transportation requirements for various projects, and we have recently submitted bids to provide transportation solutions for LNG and LPG projects. We may submit additional bids from time to time. The award process relating to LNG and LPG transportation, typically involves various stages and takes several months to complete. If we bid on and are awarded contracts relating to any LNG and LPG projects, we will need to incur significant capital expenditures to build the related LNG and LPG carriers.
To fund the remaining portion of existing or future capital expenditures, we will be required to use existing liquidity, cash from operations or incur borrowings or raise capital through the incurrence of debt or issuance of additional equity, debt or hybrid securities. Our ability to obtain bank financing or to access the capital markets for future offerings may be limited by our financial condition at the time of any such financing or offering as well as by adverse market conditions resulting from, among other things, general economic conditions and contingencies and uncertainties that are beyond our control. Our failure to obtain the funds for necessary future capital expenditures could have a material adverse effect on our business, results of operations and financial condition. Even if we are successful in obtaining necessary funds, incurring additional debt may significantly increase our interest expense and financial leverage, which could limit our financial flexibility and ability to pursue other business opportunities. Issuing additional equity securities may result in significant shareholder dilution and would increase the aggregate amount of cash required to pay quarterly dividends.
In addition, although delivery of the completed vessel will not occur until much later (approximately two to three years from the time the order is placed), we typically must pay an initial installment up-front upon signing the purchase contract. During the construction period, we generally are required to make installment payments on newbuildings prior to their delivery, in addition to incurring financing, miscellaneous construction and project management costs,
but we do not derive any income from the vessel until after its delivery. If we finance these payments by issuing debt or equity securities, we will increase the aggregate amount of interest or cash required to maintain our current level of quarterly distributions/dividends to unitholders/shareholders prior to generating cash from the operation of the newbuilding.
20
Exposure to currency exchange rate and interest rate fluctuations results in fluctuations in our cash flows and operating results.
Substantially all of our revenues are earned in U.S. Dollars, although we are paid in Euros, Australian Dollars, Norwegian Kroner and British Pounds under some of our charters. A portion of our operating costs are incurred in currencies other than U.S. Dollars, including a significant portion in British Pounds. This partial mismatch in operating revenues and expenses leads to fluctuations in net income due to changes in the value of the U.S. Dollar relative to other currencies, in particular the British Pound, the Euro, Singapore Dollar, Australian Dollar, and Canadian Dollar. We also make payments under two Euro-denominated term loans. If the amount of these and other Euro-denominated obligations exceeds our Euro-denominated revenues, we must convert other currencies, primarily the U.S. Dollar, into Euros. An increase in the strength of the Euro relative to the U.S. Dollar would require us to convert more U.S. Dollars to Euros to satisfy those obligations.
Because we report our operating results in U.S. Dollars, changes in the value of the U.S. Dollar relative to other currencies also result in fluctuations of our reported revenues and earnings. Under U.S. accounting guidelines, all foreign currency-denominated monetary assets and liabilities, such as cash and cash equivalents, accounts receivable, restricted cash, accounts payable, accrued liabilities, advances from affiliates and long-term debt are revalued and reported based on the prevailing exchange rate at the end of the applicable period. This revaluation historically has caused us to report significant unrealized foreign currency exchange gains or losses each period. The primary source of these gains and losses is our Euro-denominated term loans and our Norwegian Kroner-denominated bonds.
We are exposed to the impact of interest rate changes primarily through our borrowings that require us to make interest payments based on LIBOR, EURIBOR or NIBOR. Significant increases in interest rates could adversely affect our operating margins, results of operations and our ability to service our debt. In addition, there is uncertainty as to the continued use of LIBOR in the future. LIBOR is the subject of recent national, international and other regulatory guidance and proposals for reform. These reforms and other pressures may cause LIBOR to be eliminated or to perform differently than in the past. The consequences of these developments cannot be entirely predicted but could include an increase in the cost of our variable rate indebtedness and obligations. From time to time, we use interest rate swaps to reduce our exposure to market risk from changes in interest rates. The principal objective of these contracts is to minimize the risks and costs associated with our floating-rate debt.
In addition, we are exposed to credit loss in the event of non-performance by the counterparties to the interest rate swap agreements. For further information about our financial instruments at
December 31, 2018
, that are sensitive to changes in interest rates, please read "Item 11 - Quantitative and Qualitative Disclosures About Market Risk."
Teekay LNG may have more difficulty entering into long-term, fixed-rate LNG time-charters if the active short-term, medium-term or spot LNG shipping markets continue to develop.
LNG shipping historically has been transacted with long-term, fixed-rate time-charters, usually with terms ranging from 20 to 25 years. One of Teekay LNG’s principal strategies is to enter into additional long-term, fixed-rate LNG time-charters. In recent years, the amount of LNG traded on a spot and short-term basis (defined as contracts with a duration of 4 years or less) has been increasing. In 2018, spot and short-term trades accounted for approximately 30% of global LNG trade.
If the active spot, short-term or medium-term markets continue to develop, Teekay LNG may have increased difficulty entering into long-term, fixed-rate time-charters for its LNG carriers and, as a result, its cash flow may decrease and be less stable. In addition, an active short-term, medium-term or spot LNG market may require Teekay LNG to enter into charters based on changing market prices, as opposed to contracts based on a fixed rate, which could result in a decrease in its cash flow in periods when the market price for shipping LNG is depressed.
Many of our seafaring employees are covered by collective bargaining agreements and the failure to renew those agreements or any future labor agreements may disrupt operations and adversely affect our cash flows.
A significant portion of our seafarers are employed under collective bargaining agreements. We may become subject to additional labor agreements in the future. We may suffer labor disruptions if relationships deteriorate with the seafarers or the unions that represent them. Our collective bargaining agreements may not prevent labor disruptions, particularly when the agreements are being renegotiated. Salaries are typically renegotiated annually or bi-annually for seafarers and annually for onshore operational staff and may increase our cost of operation. Any labor disruptions could harm our operations and could have a material adverse effect on our business, results of operations and financial condition.
We and certain of our joint venture partners may be unable to attract and retain qualified, skilled employees or crew necessary to operate our business.
Our success depends in large part on our ability to attract and retain highly skilled and qualified personnel. In crewing our vessels, we require technically skilled employees with specialized training who can perform physically demanding work. Any inability we experience in the future to hire, train and retain a sufficient number of qualified employees could impair our ability to manage, maintain and grow our business.
21
Terrorist attacks, increased hostilities, political change or war could lead to further economic instability, increased costs and disruption of business.
Terrorist attacks, and the current or future conflicts in the Middle East, South East Asia, West Africa (Nigeria), Libya and elsewhere, and political change, may adversely affect our business, operating results, financial condition, and ability to raise capital and future growth. Continuing hostilities in the Middle East especially among Qatar, Saudi Arabia, the United Arab Emirates, Yemen and elsewhere may lead to additional armed conflicts or to further acts of terrorism and civil disturbance in the United States or elsewhere, which may contribute to economic instability and disruption of oil production and distribution, which could result in reduced demand for our services and have an adverse impact on our operations and or our ability to conduct business.
In addition, oil facilities, shipyards, vessels, pipelines and oil fields could be targets of future terrorist attacks and warlike operations and our vessels could be targets of hijackers, terrorists or warlike operations. Any such attacks could lead to, among other things, bodily injury or loss of life, vessel or other property damage, increased vessel operational costs, including insurance costs, and the inability to transport oil to or from certain locations. Terrorist attacks, war, hijacking or other events beyond our control that adversely affect the distribution, production or transportation of oil to be shipped by us could entitle customers to terminate charters, which would harm our cash flow and business.
Acts of piracy on ocean-going vessels continue to be a risk, which could adversely affect our business.
Acts of piracy have historically affected ocean-going vessels trading in regions of the world such as the South China Sea, Gulf of Guinea and the Indian Ocean off the coast of Somalia. While there continues to be a significant risk of piracy incidents in the Gulf of Aden and Indian Ocean, recently there have been increases in the frequency and severity of piracy incidents off the coast of West Africa and a resurgent piracy risk in the Straits of Malacca, Sulu & Celebes Sea and surrounding waters. If these piracy attacks result in regions in which our vessels are deployed being named on the Joint War Committee Listed Areas, war risk insurance premiums payable for such coverage may increase significantly and such insurance coverage may be more difficult to obtain. In addition, crew costs, including costs which are incurred to the extent we employ on-board armed security guards and escort vessels, could increase in such circumstances. We may not be adequately insured to cover losses from these incidents, which could have a material adverse effect on us. In addition, hijacking as a result of an act of piracy against our vessels, or an increase in cost or unavailability of insurance for our vessels, could have a material adverse impact on our business, financial condition and results of operations.
Our and many of our customers’ substantial operations outside the United States expose us to political, governmental and economic instability, which could harm our operations.
Because our operations, and the operations of certain of our customers, are primarily conducted outside of the United States, they may be affected by economic, political and governmental conditions in the countries where we engage in business, including Brazil, or where our vessels are registered. Any disruption caused by these factors could harm our business, including by reducing the levels of oil exploration, development and production activities in these areas. We derive some of our revenues from shipping oil and gas from politically and economically unstable regions. Conflicts in these regions have included attacks on ships and other efforts to disrupt shipping.
Hostilities, strikes, or other political or economic instability in regions where we operate or where we may operate could have a material adverse effect on the growth of our business, results of operations and financial condition and ability to make cash distributions. In addition, tariffs, trade embargoes and other economic sanctions by the United States or other countries against countries in which we operate or to which we trade could harm our business and ability to make cash distributions. Finally, a government could requisition one or more of our vessels, which is most likely during war or national emergency. Any such requisition would cause a loss of the vessel and could harm our cash flow and financial results.
Two of the six MALT LNG Carriers in the Teekay LNG-Marubeni Joint Venture, the
Marib Spirit
and
Arwa Spirit
, are currently under long-term charter contracts with YLNG. Due to the political unrest in Yemen, YLNG decided to temporarily close operation of its LNG plant in Yemen in 2015. As a result, commencing January 1, 2016, the Teekay LNG-Marubeni Joint Venture agreed to successive deferral arrangements with YLNG pursuant to which a portion of the charter payments were deferred. Concurrent with the anticipated expiry of the most current deferral arrangement, which is expected to occur within the first half of 2019, the Teekay LNG-Marubeni Joint Venture intends to enter into a further agreement with YLNG pursuant to which the Teekay-LNG Marubeni Joint Venture and YLNG will suspend the two charter contracts for a period of up to three years. Should the LNG plant in Yemen resume operations during such suspended term, it is intended that YLNG will be required to repay the deferred amounts plus interest over a period of installments. However, there is no assurance if or when the LNG plant will resume operations and, accordingly, if YLNG will be able to repay all or any portion of the deferred amounts.
A cyber-attack could materially disrupt our business
We rely on information technology systems and networks in our operations and the administration of our business. Cyber-attacks have increased in number and sophistication in recent years. Our operations could be targeted by individuals or groups seeking to sabotage or disrupt our information technology systems and networks, or to steal data. A successful cyber-attack could materially disrupt our operations, including the safety of our operations, or lead to unauthorized release of information or alteration of information on our systems. Any such attack or other breach of our information technology systems could have a material adverse effect on our business and results of operations.
22
Our failure to comply with data privacy laws could damage our customer relationships and expose us
to litigation risks and potential fines.
Data privacy is subject to frequently changing rules and regulations, which sometimes conflict among the various jurisdictions and countries in which we provide services and continue to develop in ways which we cannot predict, including with respect to evolving technologies such as cloud computing. The European Union has adopted the General Data Privacy Regulation (or
GDPR
), a comprehensive legal framework to govern data collection, use and sharing and related consumer privacy rights which took effect in May 2018. The GDPR includes significant penalties for non-compliance. Our failure to adhere to or successfully implement processes in response to changing regulatory requirements in this area could result in legal liability or impairment to our reputation in the marketplace, which could have a material adverse effect on our business, financial condition and results of operations.
The ARC7 LNG carrier newbuildings for the Yamal LNG Project are customized vessels and Teekay LNG's financial condition, results of operations and ability to make distributions to us could be substantially affected if the remaining portion of the Yamal LNG Project is abandoned.
On July 9, 2014, Teekay LNG's Yamal LNG Joint Venture ordered
six
internationally-flagged icebreaker LNG carriers for a project located on the Yamal Peninsula in Northern Russia (or the
Yamal LNG Project
), two of which newbuilding carriers delivered in 2018. The Yamal LNG Project is a joint venture between Russia-based Novatek OAO (
50.1%
), France-based Total S.A. (
20%
), China-based China National Petroleum Corporation (
20%
) and Silk Road Fund (
9.9%
).
The four remaining ARC7 LNG carrier newbuildings ordered by the Yamal LNG Joint Venture, which are scheduled for delivery during the remainder of 2019, are being specifically built for the Arctic requirements of the Yamal LNG Project and will have limited redeployment opportunities to operate as conventional trading LNG carriers if the project is abandoned or cancelled. If the project is abandoned or cancelled after commencement of operations, the Yamal LNG Joint Venture may be unable to reach an agreement with the shipyard allowing for the termination of the shipbuilding contracts (since no such optional termination right exists under these contracts), change the vessel specifications to reflect those applicable to more conventional LNG carriers and which do not incorporate ice-breaking capabilities, or find suitable alternative employment for the newbuilding vessels on a long-term basis with other LNG projects or otherwise.
The Yamal LNG Project may be abandoned for various reasons, including, among others:
|
•
|
failure to achieve expected operating results;
|
|
•
|
changes in demand for LNG;
|
|
•
|
adverse changes in Russian regulations or governmental policy relating to the project or the export of LNG;
|
|
•
|
technical challenges of completing and operating the complex project, particularly in extreme Arctic conditions;
|
|
•
|
labor disputes; and
|
|
•
|
environmental regulations or potential claims.
|
If the project is abandoned, proceeds if any, received from limited Yamal LNG project sponsor guarantees and potential alternative employment, if any, of the vessels and from potential sales of components and scrapping of the vessels likely would fall substantially short of the cost of the vessels to the Yamal LNG Joint Venture. Any such shortfall could have a material adverse effect on Teekay LNG's financial condition, results of operations and ability to make cash distributions to us.
Sanctions against key participants in the Yamal LNG Project could impede completion or performance of the Yamal LNG Project, which could have a material adverse effect on us.
The U.S. Treasury Department’s Office of Foreign Assets Control (or
OFAC
) placed Russia-based Novatek, a 50.1% owner of the Yamal LNG Project, on the Sectoral Sanctions Identifications List. OFAC also previously imposed sanctions on an investor in Novatek and these sanctions also remain in effect. The current restrictions on Novatek prohibit U.S. persons (and their subsidiaries) from participating in debt financing transactions of greater than 60 days maturity with Novatek and, by virtue of Novatek’s 50.1% ownership interest, the Yamal LNG Project. The European Union also imposed certain sanctions on Russia. These sanctions require a European Union license or authorization before a party can provide certain technologies or technical assistance, financing, financial assistance, or brokering with regard to these technologies. However, the technologies being currently sanctioned by the EU appear to focus on oil exploration projects, not gas projects.
In addition, OFAC and other governments or organizations may impose additional sanctions on Novatek, the Yamal LNG Project or other project participants, which may further hinder the ability of the Yamal LNG Project to receive necessary financing. Although we believe that we are in compliance with all applicable sanctions, laws and regulations, and intend to maintain such compliance, the scope of these sanctions laws may be subject to change.
Future sanctions may prohibit the Yamal LNG Joint Venture from performing under its contracts with the Yamal LNG Project, which could have a material adverse effect on Teekay LNG's financial condition, results of operations and ability to make cash distributions.
23
Failure of the Yamal LNG Project to achieve expected results could lead to a default under the time-charter contracts by the charter party.
The charter party under the Yamal LNG Joint Venture’s time-charter contracts for the Yamal LNG Project is Yamal Trade Pte. Ltd., a wholly-owned subsidiary of Yamal LNG, the project’s sponsor. If the Yamal LNG Project does not achieve expected results, the risk of charter party default may increase. If the charter party defaults on the time-charter contracts, Teekay LNG may be unable to redeploy the vessels under other time-charter contracts or may be forced to scrap the vessels. Any such default could adversely affect Teekay LNG’s results of operations and ability to make cash distributions to us.
Maritime claimants could arrest, or port authorities could detain, our vessels, which could interrupt our cash flow.
Crew members, suppliers of goods and services to a vessel, shippers of cargo and other parties may be entitled to a maritime lien against that vessel for unsatisfied debts, claims or damages. In many jurisdictions, a maritime lienholder may enforce its lien by arresting a vessel through foreclosure proceedings. The arrest or attachment of one or more of our vessels could interrupt our cash flow and require us to pay large sums of funds to have the arrest or attachment lifted. In addition, in some jurisdictions, such as South Africa, under the “sister ship” theory of liability, a claimant may arrest both the vessel that is subject to the claimant’s maritime lien and any “associated” vessel, which is any vessel owned or controlled by the same owner. Claimants could try to assert “sister ship” liability against one vessel in our fleet for claims relating to another of our ships. In addition, port authorities may seek to detain our vessels in port, which could adversely affect our operating results or relationships with customers.
Climate change and greenhouse gas restrictions may adversely impact our operations and markets.
Due to concern over the risk of climate change, a number of countries have adopted, or are considering the adoption of, regulatory frameworks to reduce greenhouse gas emissions. These regulatory measures include, among others, adoption of cap and trade regimes, carbon taxes, increased efficiency standards, and incentives or mandates for renewable energy. Compliance with changes in laws, regulations and obligations relating to climate change could increase our costs related to operating and maintaining our vessels and require us to install new emission controls, acquire allowances or pay taxes related to our greenhouse gas emissions, or administer and manage a greenhouse gas emissions program. Revenue generation and strategic growth opportunities may also be adversely affected.
Adverse effects upon the oil and gas industry relating to climate change may also adversely affect demand for our services. Although we do not expect that demand for oil and gas will lessen dramatically over the short term, in the long term, climate change may reduce the demand for oil and gas or increased regulation of greenhouse gases may create greater incentives for use of alternative energy sources. Any long-term material adverse effect on the oil and gas industry could have a significant financial and operational adverse impact on our business that we cannot predict with certainty at this time.
We have substantial debt levels and may incur additional debt.
As of
December 31, 2018
, our consolidated long-term debt and obligations related to capital leases totaled
$5.0 billion
and we had the capacity to borrow an additional
$0.3 billion
under our revolving credit facilities. These credit facilities may be used by us for general corporate purposes.
In addition to our consolidated debt, as of December 31, 2018, our total proportionate interest in debt of joint ventures, excluding Teekay Offshore, we do not control was $1.8 billion, of which Teekay Tankers or Teekay LNG has guaranteed $0.9 billion and the remaining $0.9 billion has limited recourse to Teekay LNG. Our consolidated debt, capital lease obligations and joint venture debt could increase substantially.
We will continue to have the ability to incur additional debt, subject to limitations in our credit facilities. Our level of debt could have important consequences to us, including:
|
•
|
our ability to obtain additional financing, if necessary, for working capital, capital expenditures, acquisitions or other purposes, and our ability to refinance our credit facilities may be impaired or such financing may not be available on favorable terms, if at all;
|
|
•
|
we will need to use a substantial portion of our cash flow to make principal and interest payments on our debt, reducing the funds that would otherwise be available for operations, future business opportunities and dividends to shareholders;
|
|
•
|
our debt level may make us more vulnerable than our competitors with less debt to competitive pressures or a downturn in our industry or the economy generally; and
|
|
•
|
our debt level may limit our flexibility in obtaining additional financing, pursuing other business opportunities and responding to changing business and economic conditions.
|
Financing agreements containing operating and financial restrictions may restrict our business and financing activities.
The operating and financial restrictions and covenants in our revolving credit facilities, term loans, lease obligations, indentures and in any of our future financing agreements could adversely affect our ability to finance future operations or capital needs or to pursue and expand our business activities. For example, these financing arrangements restrict our ability to:
|
•
|
incur additional indebtedness and guarantee indebtedness;
|
|
•
|
pay dividends or make other distributions or repurchase or redeem our capital stock;
|
|
•
|
prepay, redeem or repurchase certain debt;
|
24
|
•
|
issue certain preferred shares or similar equity securities;
|
|
•
|
make loans and investments;
|
|
•
|
enter into a new line of business;
|
|
•
|
incur or permit certain liens to exist;
|
|
•
|
enter into transactions with affiliates;
|
|
•
|
create unrestricted subsidiaries;
|
|
•
|
transfer, sell, convey or otherwise dispose of assets;
|
|
•
|
make certain acquisitions and investments;
|
|
•
|
enter into agreements restricting our subsidiaries’ ability to pay dividends; and
|
|
•
|
consolidate, merge or sell all or substantially all of our assets.
|
In addition, certain of our debt agreements require, us to comply with certain financial covenants. Our ability to comply with covenants and restrictions contained in debt instruments and lease obligations may be affected by events beyond our control, including prevailing economic, financial and industry conditions. If market or other economic conditions deteriorate, we may fail to comply with these covenants. If we breach any of the restrictions, covenants, ratios or tests in our financing agreements or indentures, our obligations may become immediately due and payable, and the lenders’ commitment under our credit facilities, if any, to make further loans may terminate. This could lead to cross-defaults under our other financing agreements and result in obligations becoming due and commitments being terminated under such agreements. A default under financing agreements could also result in foreclosure on any of our vessels and other assets securing related loans.
Furthermore, the termination of any of our charter contracts by our customers could result in the repayment of the debt facilities to which the chartered vessels relate.
Because we are organized under the laws of the Marshall Islands, it may be difficult to serve us with legal process or enforce judgments against us, our directors or our management.
We are organized under the laws of the Marshall Islands, and all of our assets are located outside of the United States. In addition, a majority of our directors and officers are non-residents of the United States, and all or a substantial portion of the assets of these non-residents are located outside the United States. As a result, it may be difficult or impossible to bring an action against us or against these individuals in the United States. Even if successful in bringing an action of this kind, the laws of the Marshall Islands and of other jurisdictions may prevent or restrict the enforcement of a judgment against our assets or the assets of our general partner or its directors and officers.
As a Marshall Islands corporation with our headquarters in Bermuda, and with a majority of our subsidiaries being Marshall Islands entities and also having subsidiaries in other offshore jurisdictions, our operations may be subject to economic substance requirements of the European Union, which could harm our business.
Finance ministers of the EU rate jurisdictions for tax transparency, governance, real economic activity and corporate tax rate. Countries that do not adequately cooperate with the finance ministers are put on a “grey list” or a “blacklist”. Various countries, including the Republic of the Marshall Islands and Bermuda, are currently on the blacklist.
EU member states have agreed upon a set of measures, which they can choose to apply against the listed countries, including increased monitoring and audits, withholding taxes, special documentation requirements and anti-abuse provisions. The European Commission has stated it will continue to support member states' efforts to develop a more coordinated approach to sanctions for the listed countries in 2019. EU legislation prohibits EU funds from being channelled or transited through entities in countries on the blacklist.
We are a Marshall Islands corporation with our headquarters in Bermuda. A majority of our subsidiaries are Marshall Islands entities and many of our subsidiaries are either organized or registered in Bermuda. It is difficult to determine how the EU blacklisting of these jurisdictions will affect our business. These jurisdictions have enacted or may enact economic substance laws and regulations with which we may be obligated to comply. We understand that recently-adopted Bermudian legislation requires each Bermudian-registered entity to maintain a substantial economic presence in Bermuda and provides that a registered entity that carries on a relevant activity may comply with the economic substance requirements if (i) it is directed and managed in Bermuda, (ii) its core income-generating activities are undertaken in Bermuda with respect to the relevant activity, (iii) it maintains adequate physical presence in Bermuda, (iv) it has adequate full-time employees in Bermuda with suitable qualifications, and (v) it incurs adequate operating expenditures in Bermuda in relation to the relevant activity. We do not know what actions the Marshall Islands may take, if any, to remove itself from the list; whether the EU will remove the Marshall Islands or Bermuda from the list; how quickly the EU would react to any changes in legislation of the Marshall Islands, Bermuda or other applicable jurisdictions; or how EU banks or other counterparties will react while we or any of our subsidiaries remain as entities organized and existing or registered under the laws of blacklisted countries. The effect of the EU blacklist, and any noncompliance by us with any legislation adopted by applicable countries to achieve removal from the list, could have a material adverse effect on our business, financial condition and operating results.
25
Our joint venture arrangements impose obligations upon us but limit our control of the joint ventures, which may affect our ability to achieve our joint venture objectives.
For financial or strategic reasons, we conduct a portion of our business through joint ventures. Generally, we are obligated to provide proportionate financial support for the joint ventures although our control of the business entity may be substantially limited. Due to this limited control, we generally have less flexibility to pursue our own objectives through joint ventures or to access available cash of the joint ventures than we would with our own subsidiaries. There is no assurance that our joint venture partners will continue their relationships with us in the future or that we will be able to achieve our financial or strategic objectives relating to the joint ventures and the markets in which they operate. In addition, our joint venture partners may have business objectives that are inconsistent with ours, experience financial and other difficulties that may affect the success of the joint venture or be unable or unwilling to fulfill their obligations under the joint ventures, which may affect our financial condition or results of operations.
We depend on certain joint venture partners to assist us in operating our businesses and competing in our markets.
Our ability to compete for certain projects, enter into new charters, secure financings and expand our customer relationships depends in part on our ability to leverage our relationship with our joint venture partners and their reputation and relationships in the shipping industry. If our joint venture partners suffer material damage to its financial condition, reputation or relationships, it may harm the ability of us or our subsidiaries to:
|
•
|
renew existing charters and contracts of affreightment upon their expiration;
|
|
•
|
obtain new charters and contracts of affreightment;
|
|
•
|
successfully interact with shipyards during periods of shipyard construction constraints;
|
|
•
|
obtain financing on commercially acceptable terms, if at all; or
|
|
•
|
maintain satisfactory relationships with suppliers and other third parties.
|
If our or our subsidiaries’ ability to do any of the things described above is impaired, it could have a material adverse effect on our business, results of operations and financial condition and our ability to make cash distributions.
We may experience operational problems with vessels that reduce revenue and increase costs.
FPSO units are complex and their operations are technically challenging. Marine transportation and oil production operations are subject to mechanical risks and problems as well as environmental risks. Operational problems may lead to loss of revenue or higher than anticipated operating expenses or require additional capital expenditures. Any of these results could harm our business, financial condition and operating results.
Teekay Tankers’ U.S. Gulf lightering business competes with alternative methods of delivering crude oil to ports, which may limit its earnings in this area of its operations.
Teekay Tankers’ U.S. Gulf lightering business faces competition from alternative methods of delivering crude oil shipments to port, including offshore offloading facilities. While we believe that lightering offers advantages over alternative methods of delivering crude oil to U.S. Gulf ports, Teekay Tankers’ lightering revenues may be limited due to the availability of alternative methods.
Teekay Tankers’ full service lightering operations are subject to specific risks that could lead to accidents, oil spills or property damage.
Lightering is subject to specific risks arising from the process of safely bringing two large moving tankers next to each other and mooring them for lightering operations. These operations require a high degree of expertise and present a higher risk of collision compared to when docking a vessel at port. Lightering operations, similar to marine transportation in general, are also subject to risks due to events such as mechanical failures, human error, and weather conditions.
Tax Risks
In addition to the following risk factors, you should read "Item 4E — Taxation of the Company", "Item 10 — Additional Information — Material U.S. Federal Income Tax Considerations" and "Item 10 — Additional Information — Non-United States Tax Considerations" for a more complete discussion of the expected material U.S. federal and non-U.S. income tax considerations relating to us and the ownership and disposition of our common stock.
26
U.S. tax authorities could treat us as a “passive foreign investment company,” which could have adverse U.S. federal income tax consequences to U.S. shareholders.
A non-U.S. entity treated as a corporation for U.S. federal income tax purposes will be treated as a “passive foreign investment company” (or
PFIC
) for such purposes in any taxable year for which either (a) at least 75% of its gross income consists of “passive income” or (b) at least 50% of the average value of the entity’s assets is attributable to assets that produce or are held for the production of “passive income.” For purposes of these tests, “passive income” includes dividends, interest, gains from the sale or exchange of investment property and rents and royalties (other than rents and royalties that are received from unrelated parties in connection with the active conduct of a trade or business). By contrast, income derived from the performance of services does not constitute “passive income.”
There are legal uncertainties involved in determining whether the income derived from our time-chartering activities constitutes rental income or income derived from the performance of services, including the decision in Tidewater Inc. v. United States, 565 F.3d 299 (5th Cir. 2009), which held that income derived from certain time-chartering activities should be treated as rental income rather than services income for purposes of a foreign sales corporation provision of the Internal Revenue Code of 1986, as amended (or the
Code
). However, the Internal Revenue Service (or
IRS
) stated in an Action on Decision (AOD 2010-01) that it disagrees with, and will not acquiesce to, the way that the rental versus services framework was applied to the facts in the Tidewater decision, and in its discussion stated that the time charters at issue in Tidewater would be treated as producing services income for PFIC purposes. The IRS’s statement with respect to Tidewater cannot be relied upon or otherwise cited as precedent by taxpayers. Consequently, in the absence of any binding legal authority specifically relating to the statutory provisions governing PFICs, there can be no assurance that the IRS or a court would not follow the Tidewater decision in interpreting the PFIC provisions of the Code. Nevertheless, based on the current composition of our assets and operations (and those of our subsidiaries), we intend to take the position that we are not now and have never been a PFIC. No assurance can be given, however, that this position would be sustained by a court if contested by the IRS or that we would not constitute a PFIC for any future taxable year if there were to be changes in our assets, income or operations.
If the IRS were to determine that we are or have been a PFIC for any taxable year during which a U.S. Holder (as defined below under "Item 10 — Additional Information — Material U.S. Federal Income Tax Considerations") held our common stock, such U.S. Holder would face adverse tax consequences. For a more comprehensive discussion regarding the tax consequences to U.S. Holders if we are treated as a PFIC, please read "Item 10 — Additional Information — Material U.S. Federal Income Tax Considerations — United States Federal Income Taxation of U.S. Holders — Consequences of Possible PFIC Classification".
We are subject to taxes, which reduce our operating results.
We or our subsidiaries are subject to tax in certain jurisdictions in which we or our subsidiaries are organized, own assets or have operations, which reduces our operating results. In computing our tax obligations in these jurisdictions, we are required to take various tax accounting and reporting positions on matters that are not entirely free from doubt and for which we have not received rulings from the governing authorities. We cannot assure you that upon review of these positions, the applicable authorities will agree with our positions. A successful challenge by a tax authority could result in additional tax imposed on us or our subsidiaries, further reducing our operating results. In addition, changes in our operations or ownership could result in additional tax being imposed on us or on our subsidiaries in jurisdictions in which operations are conducted. For example, changes in the ownership of our stock may cause us to be unable to claim an exemption from U.S. federal income tax under Section 883 of the Code. If we were not exempt from tax under Section 883 of the Code, we would be subject to U.S. federal income tax on shipping income attributable to our subsidiaries’ transportation of cargoes to or from the United States, the amount of which is not within our complete control. Also, jurisdictions in which we or our subsidiaries are organized, own assets or have operations may change their tax laws, or we may enter into new business transactions relating to such jurisdictions, which could result in increased tax liability and reduce our operating results. Please read "Item 4 — Information on the Company — Taxation of the Company."
|
Item 4.
|
Information on the Company
|
|
A.
|
Overview, History and Development
|
Overview
We are a leading provider of international crude oil and gas marine transportation services and
through our strategic partnership in Teekay Offshore with Brookfield Business Partners L.P. and certain affiliates (collectively,
Brookfield
)
we also offer offshore oil production, storage and offloading services.
We generate revenue primarily under long-term, fixed-rate contracts with a diverse customer base of major energy and utility companies.
Over the past 15 years, we have undergone a major transformation from being primarily an owner of ships in the cyclical spot tanker business to being an asset manager in the “Marine Midstream” sector. This transformation has included our expansion into the liquefied natural gas (or
LNG
) and liquefied petroleum gas (or
LPG
) shipping sectors through our publicly-listed subsidiary Teekay LNG Partners L.P. (NYSE: TGP) (or
Teekay LNG
), the continuation of our conventional tanker business through our publicly-listed subsidiary Teekay Tankers Ltd. (NYSE: TNK) (or
Teekay Tankers
), and further growth of our operations in the offshore production, storage and transportation sector through our ownership of TPO AS (formerly TPO Investments AS
)
and through our equity-accounted investment Teekay Offshore Partners L.P. (NYSE: TOO) (or
Teekay Offshore
).
27
The combined Teekay entities operate total assets under management of approximately $16 billion, comprised of approximately 205 liquefied gas, offshore, and conventional tanker assets (excluding vessels managed for third parties). With offices in 14 countries and approximately 8,000 seagoing and shore-based employees, Teekay provides a comprehensive set of marine services to the world’s leading oil and gas companies.
We are the world’s third largest independent LNG carrier owner and operator and one of the world’s largest owner and operator of mid-sized crude tankers. Teekay Offshore is the world’s largest operator of shuttle tankers and fourth largest independent provider of leased floating production, storage and offloading (or
FPSO
) unit solutions.
Our organizational structure can be divided into (a) our controlling interests in our publicly-listed subsidiaries, Teekay LNG and Teekay Tankers (or
the Controlled Daughter Entities
), our equity-accounted investment in Teekay Offshore (together with the Controlled Daughter Entities, the
Daughter Entities
), and (b) Teekay and its remaining subsidiaries, which is referred to herein as
Teekay Parent
.
Our business strategy across the Teekay Group is focused on the following:
|
•
|
Generate attractive long-term risk-adjusted returns, utilizing our market leading positions, global footprint and operational excellence;
|
|
•
|
Offer a wide breadth of marine midstream solutions to meet our customers’ needs; and
|
|
•
|
Provide superior customer service by maintain high reliability, safety, environmental and quality standards.
|
As of January 1, 2019, the Teekay group had approximately $16 billion of contracted, forward fixed-rate revenues. The revenue-weighted average remaining term of the Teekay group’s contracts was approximately 8.4 years as of January 1, 2019, excluding spot market contracts and extension options. “Revenue-weighted average” represents the average remaining fixed contract duration of the applicable contracts, weighted on the basis of aggregate fixed forward payments to be received from each operating segment, excluding extension options. Fixed forward payments for Teekay Offshore are on a 100% basis and our other equity-accounted investments and joint ventures are proportionately adjusted in the calculation to reflect our ownership interests in such investments and joint ventures.
Teekay LNG includes all of our LNG and LPG carriers. LNG carriers are usually chartered to carry LNG pursuant to time-charter contracts, where a vessel is hired for a fixed period of time. LPG carriers are mainly chartered to carry LPG and ammonia on time charters, on contracts of affreightment or spot voyage charters. As of
December 31, 2018
, Teekay LNG’s fleet, including newbuildings on order, had a total cargo carrying capacity of approximately 9.2 million cubic meters. Please read “—B. Operations—Our Fleet.”
Teekay Tankers includes a substantial majority of our conventional crude oil tankers and product carriers. Teekay Tankers' conventional crude oil tankers and product tankers primarily operate in the spot-tanker market or are subject to time charters or contracts of affreightment that are priced on a spot-market basis or are short-term, fixed-rate contracts. Teekay Tankers considers contracts that have an original term of less than one year in duration to be short-term. Certain of its conventional crude oil tankers and product tankers are on fixed-rate time-charter contracts with an initial duration of at least one year. Our conventional Aframax, Suezmax, and large product tankers are among the vessels included in Teekay Tankers. Please read “—B. Operations—Our Fleet.”
We have chartering staff located in Singapore; London, England; and Houston, USA. Each office serves our clients headquartered in that office’s region. Fleet operations, vessel positions and charter market rates are monitored around the clock. We believe that monitoring such information is critical to making informed bids on competitive brokered business.
Teekay Offshore includes shuttle tanker operations, FPSO units, FSO units, and offshore support which includes UMS, which primarily operate under long-term fixed-rate contracts, and long-distance towing and offshore installation vessels.
The Company does not currently have any intention to reinvest in the offshore space.
Teekay Parent currently owns three FPSO units;
however, Teekay Parent does not intend to retain these assets over the long term.
The Teekay organization was founded in 1973. We are incorporated under the laws of the Republic of The Marshall Islands as Teekay Corporation and maintain our principal executive office at 4
th
floor, Belvedere Building, 69 Pitts Bay Road, Hamilton, HM 08, Bermuda. Our telephone number at such address is (441) 298-2530.
The SEC maintains an Internet site at www.sec.gov, that contains reports, proxy and information statements, and other information regarding issuers that file electronically with the SEC. Our website is www.teekay.com. The information contained on our website is not part of this annual report.
Our Ownership of the Daughter Entities and Recent Equity Offerings and Transactions by Daughter Entities
Our ownership of Teekay Tankers was
28.8%
as of
December 31, 2018
. We maintain voting control of Teekay Tankers through our ownership of shares of Class A and Class B Common Stock and continue to consolidate this subsidiary. Our ownership of Teekay LNG was 33.1% (including our 2% general partner interest) as of
December 31, 2018
. We maintain control of Teekay LNG by virtue of our control of the general partner and continue to consolidate this subsidiary. Our ownership interest in Teekay Offshore was 14.1% (including 13.8% of the outstanding publicly traded common units and 49% of the general partner interest) as of
December 31, 2018
. We have significant influence over Teekay Offshore
and account for our investment in Teekay Offshore using the equity method
. Please read “Item 18. Financial Statements:
Note 5 — Equity Financing Transactions of the Daughter Entities
.”
Please read “Item 5. Operating and Financial Review and Prospects—Management’s Discussion and Analysis of Financial Condition and Results of Operations— Recent Developments and Results of Operations” for more information on recent transactions.
28
|
B.
|
Operations
|
We (excluding our investment in Teekay Offshore) have three primary lines of business: offshore production (
FPSO
units), liquefied gas carriers, and conventional tankers. We manage these businesses for the benefit of all stakeholders. We allocate capital and assess performance from the separate perspectives of Teekay LNG and Teekay Tankers, Teekay Parent, and its investment in Teekay Offshore, as well as from the perspective of the lines of business (the
Line of Business approach
). The primary focus of our organizational structure, internal reporting and allocation of resources by the chief operating decision maker, is on Teekay LNG and Teekay Tankers, Teekay Parent, and its investment in Teekay Offshore (the
Legal Entity approach
). However, we have continued to incorporate the Line of Business approach as in certain cases there is more than one line of business in each of Teekay LNG, Teekay Tankers and Teekay Parent, and we believe this information allows a better understanding of our performance and prospects for future net cash flows. We assess the performance of, and make decisions to allocate resources to, our investment in Teekay Offshore as a whole and not at the level of the individual lines of business within Teekay Offshore, which are (1) offshore production (
FPSO
units), (2) offshore logistics (shuttle tankers, the HiLoad DP unit, floating storage and offtake (or
FSO
) units, units for maintenance and safety (or
UMS
) and long-distance towing and offshore installation vessels), and (3) conventional tankers.
Teekay LNG
Teekay LNG’s vessels primarily compete in the LNG and LPG markets. LNG carriers are usually chartered to carry LNG pursuant to time-charter contracts, where a vessel is hired for a fixed period of time and the charter rate is payable to the owner on a monthly basis. LNG shipping historically has been transacted with long-term, fixed-rate time-charter contracts. LNG projects require significant capital expenditures and typically involve an integrated chain of dedicated facilities and cooperative activities. Accordingly, the overall success of an LNG project depends heavily on long-range planning and coordination of project activities, including marine transportation. Most shipping requirements for new LNG projects continue to be provided on a long-term basis, though the level of spot voyages (typically consisting of a single voyage), short-term time-charters and medium-term time-charters have grown in the past few years. The amount of LNG traded on a spot and short-term basis (defined as contracts with a duration of four years or less) has increased from approximately 10% of total LNG supply in 2010 to almost 30% in 2018.
In the LNG market, Teekay LNG competes principally with other private and state-controlled energy and utilities companies that generally operate captive fleets, and independent ship owners and operators. Many major energy companies compete directly with independent owners by transporting LNG for third parties in addition to their own LNG. Given the complex, long-term nature of LNG projects, major energy companies historically have transported LNG through their captive fleets. However, independent fleet operators have been obtaining an increasing percentage of charters for new or expanded LNG projects as some major energy companies have continued to divest non-core businesses.
LNG carriers transport LNG internationally between liquefaction facilities and import terminals. After natural gas is transported by pipeline from production fields to a liquefaction facility, it is supercooled to a temperature of approximately negative 260 degrees Fahrenheit. This process reduces its volume to approximately 1/600
th
of its volume in a gaseous state. The reduced volume facilitates economical storage and transportation by ship over long distances, enabling countries with limited natural gas reserves or limited access to long-distance transmission pipelines to meet their demand for natural gas. LNG carriers include a sophisticated containment system that holds the LNG and provides insulation to reduce the amount of LNG that boils off naturally. That natural boil off is either used as fuel to power the engines on the ship or it can be reliquified and put back into the tanks. LNG is transported overseas in specially built tanks on double-hulled ships to a receiving terminal, where it is offloaded and stored in insulated tanks. In regasification facilities at the receiving terminal, the LNG is returned to its gaseous state (or
regasified
) and then shipped by pipeline for distribution to natural gas customers.
With the exception of the
Arctic Spirit
and
Polar Spirit,
which are the only two ships in the world that utilize the Ishikawajima Harima Heavy Industries Self Supporting Prismatic Tank IMO Type B (or
IHI SPB
) independent tank technology, Teekay LNG's fleet makes use of one of the Gaz Transport and Technigaz (or
GTT
) membrane containment systems. The GTT membrane systems are used in the majority of LNG tankers now being constructed. New LNG carriers generally have an expected lifespan of approximately 35 to 40 years. Unlike the oil tanker industry, there are currently no regulations that require the phase-out from trading of LNG carriers after they reach a certain age. As at
December 31, 2018
, Teekay LNG's LNG carriers, excluding newbuilding vessels but including equity-accounted vessels, had an average age of approximately
eight
years, compared to the world LNG carrier fleet average age of approximately
10
years. In addition, as at that date, there were approximately 555 vessels in the world LNG fleet and approximately 136 additional LNG carriers under construction or on order for delivery through 2022.
In the LPG market, Teekay LNG competes principally with independent ship owners and operators, and other private and state-controlled energy and chemical companies that generally operate captive fleets.
LPG shipping involves the transportation of three main categories of cargo: liquid petroleum gases, including propane, butane and ethane; petrochemical gases including ethylene, propylene and butadiene; and ammonia. LPG carriers are mainly chartered to carry LPG on time-charters, contracts of affreightment or spot voyage charters. The two largest consumers of LPG are residential users and the petrochemical industry. Residential users, particularly in developing regions where electricity and gas pipelines are not developed, do not have fuel switching alternatives and generally are not LPG price sensitive. The petrochemical industry, however, has the ability to switch between LPG and other feedstock fuels depending on price and availability of alternatives. As at
December 31, 2018
, Teekay LNG's LPG and multi-gas carriers had an average age of approximately eight years compared to world average of 15 years as of
December 31, 2018
.
As of
December 31, 2018
, the worldwide LPG tanker fleet consisted of approximately 1,451 vessels with an average age of approximately 15 years and approximately 74 additional LPG vessels on order for delivery through 2022. LPG carriers range in size from approximately 100 to approximately 88,000 cubic meters (or
cbm
). Approximately 47% (in terms of vessel numbers) of the worldwide fleet is less than 5,000 cbm. New LPG carriers generally have an expected lifespan of approximately 30 to 35 years
.
29
Teekay LNG includes all of our LNG and LPG carriers. As at
December 31, 2018
, Teekay LNG had ownership interests in 43 LNG carriers, as well as six additional newbuilding LNG carriers on order. In addition, as at
December 31, 2018
, Teekay LNG had full ownership of seven LPG carriers and 50% ownership, through its joint venture agreement with Exmar, in another 20 LPG carriers and two chartered-in LPG carriers.
Teekay Tankers
Teekay Tankers owns a substantial majority of our conventional crude oil tankers and product carriers. Our conventional crude oil tankers and product tankers primarily operate in the spot-tanker market or are subject to time charters or contracts of affreightment that are priced on a spot-market basis or are short-term, fixed-rate contracts. We consider contracts that have an original term of less than one year in duration to be short-term. Certain of our conventional crude oil tankers and product tankers are on fixed-rate time-charter contracts with an initial duration of at least one year.
Most of Teekay Tankers’ conventional tankers operate pursuant to pooling or revenue sharing commercial management arrangements. Under such arrangements, different vessel owners pool their vessels, which are managed by a pool manager, to improve utilization and reduce expenses. In general, revenues generated by the vessels operating in a pool or revenue sharing commercial management arrangement, less related voyage expenses (such as fuel and port charges) and administrative expenses, are pooled and allocated to the vessel owners according to a pre-determined formula. As of
December 31, 2018
, 54 of Teekay Tankers' owned and leased vessels and three of Teekay Tankers' time-chartered in vessels operated in the spot market through participation in Teekay-managed RSAs or on spot voyage charters. Twenty-nine of Teekay Tankers' owned and leased vessels operated in the Suezmax RSAs, ten of Teekay Tankers' owned and leased vessels and one of Teekay Tankers' time-chartered in vessels operated in the Aframax RSAs, eight of Teekay Tankers' owned and leased vessels operated in the Taurus LR2 RSAs, and seven of Teekay Tankers' owned and leased vessels and two time-chartered in vessels operated in the spot market on voyage charters. In addition, as of
December 31, 2018
, two of Teekay Tankers' owned vessels operated under fixed-rate time-charter contracts.
Teekay Tankers’ vessels compete primarily in the Aframax and Suezmax tanker markets. In these markets, international seaborne oil and other petroleum products transportation services are provided by two main types of operators: captive fleets of major oil companies (both private and state-owned) and independent ship-owner fleets. Many major oil companies and other oil trading companies, the primary charterers of our vessels, also operate their own vessels and transport their own oil and oil for third-party charterers in direct competition with independent owners and operators. Competition for charters in the Aframax and Suezmax spot charter market is intense and is based upon price, location, the size, age, condition and acceptability of the vessel, and the reputation of the vessel’s manager.
Teekay Tankers competes principally with other owners in the spot-charter market through the global tanker charter market. This market is comprised of tanker broker companies that represent both charterers and ship-owners in chartering transactions. Within this market, some transactions, referred to as “market cargoes,” are offered by charterers through two or more brokers simultaneously and shown to the widest possible range of owners; other transactions, referred to as “private cargoes,” are given by the charterer to only one broker and shown selectively to a limited number of owners whose tankers are most likely to be acceptable to the charterer and are in position to undertake the voyage.
Teekay Tankers’ competition in the Aframax (85,000 to 124,999 dwt) market is also affected by the availability of other size vessels that compete in that market. Suezmax (125,000 to 199,999 dwt) vessels and Panamax (55,000 to 84,999 dwt) vessels can compete for many of the same charters for which our Aframax tankers compete; Aframax size vessels and VLCCs (200,000 to 319,999 dwt) can compete for many of the same charters for which our Suezmax tankers may compete. Because of their large size, Very Large Crude Carriers (or
VLCCs
) and Ultra Large Crude Carriers (or
ULCCs
) (320,000+ dwt) rarely compete directly with Aframax tankers, and ULCCs rarely compete with Suezmax tankers for specific charters. However, because VLCCs and ULCCs comprise a substantial portion of the total capacity of the market, movements by such vessels into Suezmax trades and of Suezmax vessels into Aframax trades would heighten the already intense competition.
Teekay Tankers also competes in the Long Range 2 (or
LR2
) (85,000 to 109,999 dwt) product tanker market. Competition in the LR2 product tanker market is affected by the availability of other size vessels that compete in the market. Long Range 1 (or
LR1
) (55,000-84,999 dwt) size vessels can compete for many of the same charters for which Teekay Tankers' LR2 tankers compete.
The operation of tanker vessels, as well as the seaborne transportation of crude oil and refined petroleum products, is a competitive market. There are several large operators of Aframax, Suezmax, and LR2 tonnage that provide these services globally.
Teekay Tankers believe that it has competitive advantages in the Aframax and Suezmax tanker market as a result of the quality, type and dimensions of its vessels and their market share in the Indo-Pacific and Atlantic Basins. As of
December 31, 2018
, its
Aframax/LR2 tanker fleet (excluding Aframax/LR2-size shuttle tankers and newbuildings) had an average age of approximately 11.2 years and their Suezmax tanker fleet (excluding Suezmax-size shuttle tankers and newbuildings) had an average age of approximately 10.7 years. This compares to an average age for the world oil tanker fleet of approximately 10.5 years, for the world Aframax/LR2 tanker fleet of approximately 10.0 years and for the world Suezmax tanker fleet of approximately 9.5 years.
Teekay Tankers completed a merger with TIL in November 2017, acquiring all of the remaining 27.0 million issued and outstanding common shares of TIL, in a share-for-share exchange at a ratio of 3.3 shares of Teekay Tankers' Class A common stock for each share of TIL common stock. As a result of the merger, TIL became a wholly-owned subsidiary of Teekay Tankers. At the time of the merger, TIL owned a modern fleet of 10 Suezmax tankers, six Aframax tankers and two LR2 product tankers.
For additional information, please read "Item 18 - Financial Statements:
Note 22 — Equity-accounted Investments
".
30
In May 2017, Teekay Tankers completed the acquisition from Teekay Holdings Ltd., a wholly-owned subsidiary of Teekay, of the remaining 50% interest in Teekay Tanker Operations Ltd. (or
TTOL
), which owns conventional tanker commercial management and technical management operations and directly administers four commercially managed tanker RSAs.
Teekay Tankers acquired a ship-to-ship transfer business (now known as Teekay Marine Solutions or
TMS
) in July 2015 from a company jointly owned by Teekay and I.M. Skaugen SE (or
Skaugen
). TMS provides a full suite of ship-to-ship transfer services in the oil, gas and dry bulk industries. In addition to full service lightering and lightering support, it also provides consultancy, terminal management and project development services. TMS owns three STS support vessels.
Teekay Parent
Our long-term vision is for Teekay Parent to be primarily a portfolio manager and project developer with the Teekay Group’s fixed assets primarily owned directly by its Controlled Daughter Entities. Our primary financial objectives for Teekay Parent are to increase the value of our three FPSO units and the value of our investments in Teekay LNG, Teekay Tankers and Teekay Offshore, increase Teekay Parent’s free cash flow per share and, as a service provider to its Daughter Entities, provide scale and other benefits across the Teekay Group.
We also intend to (a) continue to reduce debt of Teekay Parent, including by selling the three FPSO units or other assets in the future and using the net proceeds to repay debt and (b) seek to increase the distributions of Teekay LNG in a sustainable manner and the dividends of Teekay Tankers as the tanker market recovers.
FPSO Units
FPSO units are offshore production facilities that are ship-shaped or cylindrical-shaped and store processed crude oil in tanks located in the hull of the vessel. FPSO units are typically used as production facilities to develop marginal oil fields or deepwater areas remote from existing pipeline infrastructure. Of four major types of floating production systems, FPSO units are the most common type. Typically, the other types of floating production systems do not have significant storage and need to be connected into a pipeline system or use an FSO unit for storage. FPSO units are less weight-sensitive than other types of floating production systems and their extensive deck area provides flexibility in process plant layouts. In addition, the ability to utilize surplus or aging tanker hulls for conversion to an FPSO unit provides a relatively inexpensive solution compared to the new construction of other floating production systems. A majority of the cost of an FPSO comes from its top-side production equipment and thus, FPSO units are expensive relative to conventional tankers. An FPSO unit carries on board all the necessary production and processing facilities normally associated with a fixed production platform. As the name suggests, FPSO units are not fixed permanently to the seabed but are designed to be moored at one location for long periods of time. In a typical FPSO unit installation, the untreated well-stream is brought to the surface via subsea equipment on the sea floor that is connected to the FPSO unit by flexible flow lines called risers. The risers carry oil, gas and water from the ocean floor to the vessel, which processes it on board. The resulting crude oil is stored in the hull of the vessel and subsequently transferred to tankers either via a buoy or tandem loading system for transport to shore.
Traditionally for large field developments, the major oil companies have owned and operated new, custom-built FPSO units. FPSO units for smaller fields have generally been provided by independent FPSO contractors under life-of-field production contracts, where the contract’s duration is for the useful life of the oil field. FPSO units have been used to develop offshore fields around the world since the late 1970s. Most independent FPSO contractors have backgrounds in marine energy transportation, oil field services or oil field engineering and construction. As of
December 31, 2018
, there were approximately 179 FPSO units active and operating, another 23 idle FPSO units, and 16 FPSO units on order in the world fleet. At
December 31, 2018
, Teekay Parent owned three FPSO units, in which it has 100% ownership interests. Other major independent FPSO contractors are SBM Offshore N.V., BW Offshore, MODEC, Bumi Armada, Yinson Holdings and Bluewater.
Investment in Teekay Offshore and Other
Teekay Offshore is primarily involved with various aspects of the offshore oil industry, including (1) offshore production (FPSO units) and (2) offshore logistics (shuttle tankers, floating storage and offtake (or
FSO
) units, units for maintenance and safety (or
UMS
) and long-distance towing and offshore installation vessels). While the Company does not have any intention to reinvest in the offshore space, it continues to look to maximize the value of its investment in Teekay Offshore.
31
Our Consolidated Fleet under Management
As at
December 31, 2018
, Teekay and its Controlled Daughter Entities operated under management a fleet of
155
vessels (excluding vessels managed for third parties), including chartered-in vessels and newbuildings/conversions on order. The following table summarizes our fleet under management as at
December 31, 2018
:
|
Owned
Vessels
|
Chartered-in
Vessels
|
Newbuildings /
Conversions
|
Total
|
|||||||||
|
Teekay LNG
|
||||||||||||
|
LNG Vessels
|
43
|
|
(1)
|
—
|
|
6
|
|
(2)
|
49
|
|
||
|
LPG/Multigas Vessels
|
27
|
|
(3)
|
2
|
|
(4)
|
—
|
|
29
|
|
||
|
Suezmax Tankers
|
1
|
|
—
|
|
—
|
|
|
1
|
|
|||
|
Handymax Product Tanker
|
1
|
|
|
—
|
|
—
|
|
|
1
|
|
||
|
72
|
|
|
2
|
|
6
|
|
|
80
|
|
|||
|
Teekay Tankers
|
||||||||||||
|
Aframax Tankers
|
17
|
|
|
3
|
|
—
|
|
|
20
|
|
||
|
Suezmax Tankers
|
30
|
|
—
|
|
—
|
|
|
30
|
|
|||
|
VLCC
|
1
|
|
(5)
|
—
|
|
—
|
|
|
1
|
|
||
|
Product Tankers
|
9
|
|
|
—
|
|
—
|
|
|
9
|
|
||
|
STS Support Vessels
|
3
|
|
|
3
|
|
—
|
|
|
6
|
|
||
|
60
|
|
|
6
|
|
—
|
|
|
66
|
|
|||
|
Teekay Parent
|
||||||||||||
|
FPSO Units
|
3
|
|
|
—
|
|
—
|
|
|
3
|
|
||
|
FSO Units
|
—
|
|
3
|
|
—
|
|
3
|
|
||||
|
Shuttle Tankers
|
—
|
|
2
|
|
—
|
|
2
|
|
||||
|
Bunker Barge
|
—
|
|
|
1
|
|
—
|
|
|
1
|
|
||
|
3
|
|
|
6
|
|
—
|
|
|
9
|
|
|||
|
Total
|
135
|
|
|
14
|
|
6
|
|
|
155
|
|
||
|
(1)
|
Includes a 99% interest in nine LNG carriers, a 70% interest in three LNG carriers, a 69% interest in two LNG carriers, a 52% interest in six LNG carriers, a 50% interest in two LNG carriers, a 49% interest in one LNG carrier, a 40% interest in four LNG carriers, a 33% interest in four LNG carriers, a 30% interest in two LNG carriers, and a 20% interest in one LNG carrier.
|
|
(2)
|
Includes a
50% interest in four LNG newbuildings, and a 20% interest in one LNG newbuilding, the
Pan Africa
, that was delivered in January 2019. One 100%-owned LNG newbuilding, the
Yamal Spirit,
was delivered in January 2019.
|
|
(3)
|
Includes a 99% interest in seven LPG carriers and a 50% interest in 20 LPG carriers.
|
|
(4)
|
50% interest in both LPG carriers.
|
|
(5)
|
VLCC is 50%-owned by Teekay Tankers.
|
Our vessels are of Bahamian, Belgian, Canadian, Cyprus, Danish, Greek, Hong Kong, Isle of Man, Liberian, Malta, Marshall Islands, Netherlands, Norwegian, Panama, Singapore, and Spanish registry.
Many of our Aframax and Suezmax vessels have been designed and constructed as substantially identical sister ships. These vessels can, in many situations, be interchanged, providing scheduling flexibility and greater capacity utilization. In addition, spare parts and technical knowledge can be applied to all the vessels in the particular series, thereby generating operating efficiencies.
Please read “Item 18. Financial Statements:
Note 8 — Long-Term Debt
” for information with respect to major encumbrances against our vessels.
32
Safety, Management of Ship Operations and Administration
Safety and environmental compliance are our top operational priorities. We operate our vessels in a manner intended to protect the safety and health of our employees, the general public and the environment. We seek to manage the risks inherent in our business and are committed to eliminating incidents that threaten the safety and integrity of our vessels, such as groundings, fires, collisions and oil spills. In 2008, we introduced the Quality Assurance and Training Officers Program (or
QATO
) to conduct rigorous internal audits of our processes and provide our seafarers with on-board training. In 2007, we introduced a behavior-based safety program called “Safety in Action” to improve the safety culture in our fleet. We are also committed to reducing our emissions and waste generation. In 2010, we introduced a safety leadership program for our employees titled “Operational Leadership,
The Journey” which sets out our operational expectations, the responsibilities of individual employees and our commitment to empowering our employees to work safely and live Teekay’s vision through a positive and responsible attitude.
In 2016, we introduced a 5-year "Safety Road Map" that comprises a number of safety projects to further enhance the culture of safety on board Teekay's vessels.
Key performance indicators facilitate regular monitoring of our operational performance. Targets are set on an annual basis to drive continuous improvement, and indicators are reviewed quarterly to determine if remedial action is necessary to reach the targets.
We, through certain of our subsidiaries, assist our operating subsidiaries in managing their ship operations. All vessels are operated under our comprehensive and integrated Safety Management System that complies with the International Safety Management Code (or
ISM Code
), the International Standards Organization’s (or
ISO
) 9001 for Quality Assurance, ISO 14001 for Environment Management Systems, ISO 45001 for Occupational Health and Safety Management System and the Maritime Labour Convention 2006 (MLC 2006) that became effective in 2013. The management system is certified by Det Norske Veritas
Germanischer Lloyd
(or
DNV-GL
), the Norwegian classification society. It has also been separately approved by the Australian and Spanish flag administrations. Although certification is valid for five years, compliance with the above-mentioned standards is confirmed on a yearly basis by a rigorous auditing procedure that includes both internal audits as well as external verification audits by DNV-GL and certain flag states.
We provide, through certain of our subsidiaries, expertise in various functions critical to the operations of our operating subsidiaries. We believe this arrangement affords a safe, efficient and cost-effective operation. Our subsidiaries also provide to us access to human resources, financial and other administrative functions pursuant to administrative services agreements.
Critical ship management functions undertaken by our subsidiaries are:
|
•
|
vessel maintenance (including repairs and dry docking) and certification;
|
|
•
|
crewing by competent seafarers;
|
|
•
|
procurement of stores, bunkers and spare parts;
|
|
•
|
management of emergencies and incidents;
|
|
•
|
supervision of shipyard and projects during new-building and conversions;
|
|
•
|
insurance; and
|
|
•
|
financial management services.
|
These functions are supported by onboard and onshore systems for maintenance, inventory, purchasing and budget management.
Our day-to-day focus on cost efficiencies is applied to all aspects of our operations. We believe that the generally uniform design of some of our existing and new-building vessels and the adoption of common equipment standards provides operational efficiencies, including with respect to crew training and vessel management, equipment operation and repair, and spare parts ordering. In addition, we and two other shipping companies have a purchasing alliance, Teekay Bergesen Worldwide, which leverages the purchasing power of the combined fleets, mainly in such commodity areas as lube oils, paints and other chemicals.
Risk of Loss and Insurance
The operation of any ocean-going vessel carries an inherent risk of catastrophic marine disasters, death or injury of persons and property losses caused by adverse weather conditions, mechanical failures, human error, war, terrorism, piracy and other circumstances or events. In addition, the transportation and transfer/lightering of crude oil, petroleum products, LNG and LPG is subject to the risk of spills and to business interruptions due to political circumstances in foreign countries, hostilities, labor strikes, sanctions and boycotts. The occurrence of any of these events may result in loss of revenues or increased costs.
We carry hull and machinery (marine and war risks) and protection and indemnity insurance coverage to protect against most of the accident-related risks involved in the conduct of our business. Hull and machinery insurance covers loss of or damage to a vessel due to marine perils such as collision, grounding and weather. Protection and indemnity insurance indemnifies us against liabilities incurred while operating vessels, including injury to our crew or third parties, cargo loss and pollution. The current maximum amount of our coverage for pollution is $1 billion per vessel per incident. We also carry insurance policies covering war risks (including piracy and terrorism) and, for some of our LNG carriers, loss of revenues resulting from vessel off-hire time due to a marine casualty.
33
We believe that our current insurance coverage is adequate to protect against most of the accident-related risks involved in the conduct of our business and that we maintain appropriate levels of environmental damage and pollution insurance coverage. However, we cannot guarantee that all covered risks are adequately insured against, that any particular claim will be paid or that we will be able to procure adequate insurance coverage at commercially reasonable rates in the future. More stringent environmental regulations have resulted in increased costs for, and may result in the lack of availability of, insurance against risks of environmental damage or pollution.
In our operations, we use a thorough risk management program that includes, among other things, risk analysis tools, maintenance and assessment programs, a seafarers' competence training program, seafarers' workshops and membership in emergency response organizations.
We have achieved certification under the standards reflected in ISO 9001 for quality assurance, ISO 14001 for environment management systems, OHSAS 18001, and the IMO’s International Management Code for the Safe Operation of Ships and Pollution Prevention on a fully integrated basis.
Operations Outside of the United States
Because our operations are primarily conducted outside of the United States, we are affected by currency fluctuations, to the extent we do not contract in U.S. dollars, and by changing economic, political and governmental conditions in the countries where we engage in business or where our vessels are registered. Past political conflicts in those regions, particularly in the Arabian Gulf, have included attacks on tankers, mining of waterways and other efforts to disrupt shipping in the area. Vessels trading in certain regions have also been subject to acts of piracy. In addition to tankers, targets of terrorist attacks could include oil pipelines, LNG facilities and offshore oil fields. The escalation of existing, or the outbreak of future, hostilities or other political instability in regions where we operate could affect our trade patterns, increase insurance costs, increase tanker operational costs and otherwise adversely affect our operations and performance. In addition, tariffs, trade embargoes, and other economic sanctions by the United States or other countries against countries in the Indo-Pacific Basin or elsewhere as a result of terrorist attacks or otherwise may limit trading activities with those countries, which could also adversely affect our operations and performance.
Customers
We have derived, and believe that we will continue to derive, a significant portion of our revenues from a limited number of customers. Our customers include major energy and utility companies, major oil traders, large oil and LNG consumers and petroleum product producers, government agencies, and various other entities that depend upon marine transportation.
One customer, an international oil company, accounted for an aggregate of 11%, or $195.0 million, of our consolidated revenues during 2018 (2017 – two customers for 24%, or $442.4 million; 2016 – two customers for 29%, or $653.6 million). During these periods, no other customer accounted for over 10% of our revenues for the applicable period
. The loss of any significant customer or a substantial decline in the amount of services requested by a significant customer, or the inability of a significant customer to pay for our services, could have a material adverse effect on our business, financial condition and results of operations.
Flag, Classification, Audits and Inspections
Our vessels are registered with reputable flag states, and the hull and machinery of all of our vessels have been “Classed” by one of the major classification societies and members of International Association of Classification Societies ltd (or IACS): Bureau Veritas (or BV), Lloyd’s Register of Shipping, the American Bureau of Shipping or DNV-GL.
The applicable classification society certifies that the vessel’s design and build conform to the applicable Class rules and meets the requirements of the applicable rules and regulations of the country of registry of the vessel and the international conventions to which that country is a signatory. The classification society also verifies throughout the vessel’s life that it continues to be maintained in accordance with those rules. In order to validate this, the vessels are surveyed by the classification society, in accordance to the classification society rules, which in the case of our vessels follows a comprehensive five-year special survey cycle, renewed every fifth year. During each five-year period, the vessel undergoes annual and intermediate surveys, the scrutiny and intensity of which is primarily dictated by the age of the vessel. As our vessels are modern and we have enhanced the resiliency of the underwater coatings of each vessel hull and marked the hull to facilitate underwater inspections by divers, their underwater areas are inspected in a dry dock at two and a half to five-year intervals. In-water inspection is carried out during the second or third annual inspection (e.g. during an intermediate survey).
In addition to class surveys, the vessel’s flag state also verifies the condition of the vessel during annual flag state inspections, either independently or by additional authorization to class. Also, port state authorities of a vessel’s port of call are authorized under international conventions to undertake regular and spot checks of vessels visiting their jurisdiction.
Processes followed onboard are audited by either the flag state or the classification society acting on behalf of the flag state to ensure that they meet the requirements of the ISM Code. DNV-GL typically carries out this task. We also follow an internal process of internal audits undertaken annually at each office and vessel.
We follow a comprehensive inspections scheme supported by our sea staff, shore-based operational and technical specialists and members of our QATO program. We carry out a minimum of two such inspections annually, which helps ensure us that:
|
•
|
our vessels and operations adhere to our operating standards;
|
34
|
•
|
the structural integrity of the vessel is being maintained;
|
|
•
|
machinery and equipment are being maintained to give reliable service;
|
|
•
|
we are optimizing performance in terms of speed and fuel consumption; and
|
|
•
|
our vessels’ appearance supports our brand and meets customer expectations.
|
Our customers also often carry out vetting inspections under the Ship Inspection Report Program, which is a significant safety initiative introduced by the Oil Companies International Marine Forum to specifically address concerns about sub-standard vessels. The inspection results permit charterers to screen a vessel to ensure that it meets their general and specific risk-based shipping requirements.
We believe that the heightened environmental and quality concerns of insurance underwriters, regulators and charterers will generally lead to greater scrutiny, inspection and safety requirements on all vessels in the oil tanker and LNG and LPG carrier markets and will accelerate the scrapping or phasing out of older vessels throughout these markets.
Overall, we believe that our well-maintained and high-quality vessels provide us with a competitive advantage in the current environment of increasing regulation and customer emphasis on quality of service.
Regulations
General
Our business and the operation of our vessels are significantly affected by international conventions and national, state and local laws and regulations in the jurisdictions in which our vessels operate, as well as in the country or countries of their registration. Because these conventions, laws and regulations change frequently, we cannot predict the ultimate cost of compliance or their impact on the resale price or useful life of our vessels. Additional conventions, laws, and regulations may be adopted that could limit our ability to do business or increase the cost of our doing business and that may materially affect our operations. We are required by various governmental and quasi-governmental agencies to obtain permits, licenses and certificates with respect to our operations. Subject to the discussion below and to the fact that the kinds of permits, licenses and certificates required for the operations of the vessels we own will depend on a number of factors, we believe that we will be able to continue to obtain all permits, licenses and certificates material to the conduct of our operations.
International Maritime Organization (or IMO)
The IMO is the United Nations’ agency for maritime safety and prevention of pollution. IMO regulations relating to pollution prevention for oil tankers have been adopted by many of the jurisdictions in which our tanker fleet operates. Under IMO regulations and subject to limited exceptions, a tanker must be of double-hull construction in accordance with the requirements set out in these regulations, or be of another approved design ensuring the same level of protection against oil pollution. All of our tankers are double-hulled.
Many countries, but not the United States, have ratified and follow the liability regime adopted by the IMO and set out in the International Convention on Civil Liability for Oil Pollution Damage, 1969, as amended (or
CLC
). Under this convention, a vessel’s registered owner is strictly liable for pollution damage caused in the territorial waters of a contracting state by discharge of persistent oil (e.g., crude oil, fuel oil, heavy diesel oil or lubricating oil), subject to certain defenses. The right to limit liability to specified amounts that are periodically revised is forfeited under the CLC when the spill is caused by the owner’s actual fault or when the spill is caused by the owner’s intentional or reckless conduct. Vessels trading to contracting states must provide evidence of insurance covering the limited liability of the owner. In jurisdictions where the CLC has not been adopted, various legislative regimes or common law governs, and liability is imposed either on the basis of fault or in a manner similar to the CLC.
IMO regulations also include the International Convention for Safety of Life at Sea (or
SOLAS
), including amendments to SOLAS implementing the International Ship and Port Facility Security Code (or
ISPS
), the ISM Code, the International Convention on Load Lines of 1966, and, specifically with respect to LNG and LPG carriers, the International Code for Construction and Equipment of Ships Carrying Liquefied Gases in Bulk (the
IGC Code
). The IMO Marine Safety Committee has also published guidelines for vessels with dynamic positioning (
DP
) systems, which would apply to shuttle tankers and DP-assisted FSO units and FPSO units. SOLAS provides rules for the construction of and the equipment required for commercial vessels and includes regulations for their safe operation. Flag states which have ratified the convention and the treaty generally employ the classification societies, which have incorporated SOLAS requirements into their class rules, to undertake surveys to confirm compliance.
SOLAS and other IMO regulations concerning safety, including those relating to treaties on training of shipboard personnel, lifesaving appliances, radio equipment and the global maritime distress and safety system, are applicable to our operations. Non-compliance with IMO regulations, including SOLAS, the ISM Code, ISPS, the IGC Code for LNG and LPG carriers, and the specific requirements for shuttle tankers, FSO units and FPSO units under the NPD (Norway) and HSE (United Kingdom) regulations, may subject us to increased liability or penalties, may lead to decreases in available insurance coverage for affected vessels and may result in the denial of access to or detention in some ports. For example, the United States Coast Guard (or
USCG
) and European Union authorities have indicated that vessels not in compliance with the ISM Code will be prohibited from trading in United States and European Union ports. The ISM Code requires vessel operators to obtain a safety management certification for each vessel they manage, evidencing the shipowner’s development and maintenance of an extensive safety management system. Each of the existing vessels in our fleet is currently ISM Code-certified, and we expect to obtain safety management certificates for each newbuilding vessel upon delivery.
35
With regard to offshore support vessels, such as UMS, SOLAS permits certain exemptions and equivalents to be allowed by the relevant vessel’s flag state. The International Code on Intact Stability, 2008 also applies generally to offshore support vessels. In 2016, the IMO’s Maritime Safety Committee (or
MSC
) adopted amendments to the IS Code relating to ships engaged in anchor handling operations and to ships engaged in lifting and towing operations, including escort towing. These amendments are expected to enter into force on January 1, 2020. The IMO has also developed non-mandatory codes and guidelines which apply to various types or aspects of offshore support vessels.
LNG and LPG carriers are also subject to regulation under the IGC Code. Each LNG and LPG carrier must obtain a certificate of compliance evidencing that it meets the requirements of the IGC Code, including requirements relating to its design and construction. Each of our LNG and LPG carriers is currently IGC Code compliant, and each of the shipbuilding contracts for our LNG newbuildings, and for the LPG newbuildings requires ICG Code compliance prior to delivery. Amendments to the IGC Code, aligning wheelhouse window fire-rating requirements with those in SOLAS chapter II-2, were adopted in 2016 and are expected to enter into force on January 1, 2020.
In addition, the International Code of Safety for Ships using Gases or other Low-flashpoint Fuels (the
IGF Code
), which entered into force on January 1, 2017, is mandatory for ships fueled by gases or other low-flashpoint fuels, setting out mandatory provisions for the arrangement, installation, control and monitoring of machinery, equipment and systems using low-flashpoint fuel.
Annex VI to the IMO’s International Convention for the Prevention of Pollution from Ships (
MARPOL
) (or
Annex VI
) sets limits on sulfur oxide and nitrogen oxide (or
NOx
) emissions from ship exhausts and prohibits emissions of ozone depleting substances, emissions of volatile compounds from cargo tanks and the incineration of specific substances. Annex VI also includes a world-wide cap on the sulfur content of fuel oil and allows for special “emission control areas” (or
ECAs
) to be established with more stringent controls on sulfur emissions. Annex VI provides for a three-tier reduction in NOx emissions from marine diesel engines, with the final tier (or
Tier III
) to apply to engines installed on vessels constructed on or after January 1, 2016, and which operate in the North American ECA or the U.S. Caribbean Sea ECA as well as ECAs designated in the future by the IMO. In October 2016, the IMO’s Marine Environment Protection Committee (or
MEPC
) approved the designation of the North Sea (including the English Channel) and the Baltic Sea as ECAs for NOx emissions; these ECAs and the related amendments to Annex VI of MARPOL (with some exceptions) entered into effect on January 1, 2019
.
This requirement will be applicable for new ships constructed on or after January 1, 2021 if they visit the Baltic or North Sea (including the English Channel) and requires the future trading area of a ship to be assessed at the contract stage. There are exemption provisions to allow ships with only Tier II engines, to navigate in a NOx Tier III ECA if the ship is departing from a shipyard where the ship is newly built or visiting a shipyard for conversion/repair/maintenance without loading/unloading cargoes.
Effective January 1, 2020, Annex VI imposes a global limit for sulphur in fuel oil used on board ships of 0.50% m/m (mass by mass), regardless of whether a ship is operating outside a designated ECA. To comply with this new standard, ships may utilize different fuels containing low or zero sulphur (e.g., LNG or biofuels), or utilize exhaust gas cleaning systems, known as “scrubbers”. Amendments to the information to be included in bunker delivery notes relating to the supply of marine fuel oil to ships fitted with alternative mechanisms to address sulphur emission requirements (e.g., scrubbers) became effective January 1, 2019. We have taken and continue to take steps to comply with the 2020 sulphur limit. At present, we have not installed any scrubbers on our existing fleet, and we intend to switch over to burning low sulphur fuel from January 1, 2020.
As of March 1, 2018, amendments to Annex VI impose new requirements for ships of 5,000 gross tonnage and above to collect fuel oil consumption data for ships, as well as certain other data including proxies for transport work
; the amendments also set forth criteria for determining whether cargo residues are harmful to the marine environment and a new Garbage Record Book format
.
The IMO has issued guidance regarding protecting against acts of piracy off the coast of Somalia. We comply with these guidelines.
The IMO's Ballast Water Management Convention entered into force on September 8, 2017. As of December 31, 2018, there were 79 contracting states to the convention. The convention stipulates two standards for discharged ballast water. The D-1 standard covers ballast water exchange while the D-2 standard covers ballast water treatment. The convention requires the implementation of either the D-1 or D-2 standard. There will be a transitional period from the entry into force to the International Oil Pollution Prevention (or
IOPP
) renewal survey in which ballast water exchange (reg. D-1) can be employed. The IMO’s Marine Environment Protection Committee (or
MEPC
), made a decision at the 71st meeting held in July 2017 to extend the implementation date for the D-2 standard to September 8, 2019. All ships constructed before September 8, 2017 will have to install a BWMS at their first renewal survey associated with the IOPP Certificate under MARPOL Annex I after September 8, 2019. New ships constructed after September 8, 2017 will have to comply with Regulation D2 at the time of delivery. D1 requirements - approvals of BWMP and issuance of BWMC or SOC (Statement of Compliance) shall remain unaffected with this extension and all vessels will have to meet D1 requirements (Plan approvals) post September 8, 2017.
The
MEPC
agreed to a compromise on the implementation dates for the D-2 discharge standard: ships constructed on or after September 8, 2017 must comply with the D-2 standard upon delivery. Existing ships should be D-2 compliant on the first IOPP renewal following entry into force if the survey is completed on or after September 8, 2019, or a renewal IOPP survey is completed on or after September 8, 2014 but prior to September 8, 2017. Ships should be D-2 compliant on the second IOPP renewal survey after September 8, 2017 if the first renewal survey after that date is completed prior to September 8, 2019 and if the previous two conditions are not met. Vessels will be required to meet the discharge standard D-2 by installing an approved Ballast Water Management System (or
BWMS
).
Besides the IMO convention, ships sailing in U.S. waters are required to employ a type-approved BWMS which is compliant with USCG regulations. The USCG has approved a number of BWMS - Alfa Laval (Sweden), Ocean Saver (Norway), Sunrui (China), Optimarin (Norway), Ecochlor (USA), Erma First (Greece), Hyundai Heavy Industries Co. Ltd. (Korea), Qingdao Headway Technology Co. Ltd. (China), and JFE Engineering Corporation (Japan), out of which first two makers are under Teekay’ s approved list for retrofit. We estimate that the installation of approved BWMS may cost between $2 million and $3 million per vessel.
36
Amendments to MARPOL Annex VI that makes the data collection system for fuel oil consumption of ships mandatory were adopted at the 70th session of the MEPC held in October 2016 and entered into force on March 1, 2018. The amendments require operators to update the vessels Ship Energy Efficiency Management Plan (SEEMP) to include a part II describing the ship specific methodology that will be used for collecting and measuring data for fuel oil consumption, distance travelled, hours underway, ensuring data quality is maintained and the processes that will be used to report the data to the Administration. This must be verified as compliant on or before December 31, 2018, with the first data collection period being for the 2019 calendar year. A Confirmation of Compliance will be issued by the administration/registered organization, which must be kept on board the ship.
MARPOL Annex I also states that oil residue may be discharged directly from the sludge tank to the shore reception facility through standard discharge connections. They may also be discharged to the incinerator or to an auxiliary boiler suitable for burning the oil by means of a dedicated discharge pump. Amendments to Annex I expand on the requirements for discharge connections and piping to ensure residues are properly disposed of. Annex I is applicable for existing vessels with a first renewal survey beginning on or after January 1, 2017.
Amendments to MARPOL Annex V were adopted at the 70th session of the MEPC held in October 2016 and entered into force on March 1, 2018. The changes include criteria for determining whether cargo residues are harmful to the marine environment and a new Garbage Record Book (or
GRB
) format with a new garbage category for e-waste. Solid bulk cargo as per regulation VI/1-1.2 of SOLAS, other than grain, shall now be classified as per the criteria in the new Appendix I of MARPOL Annex V
,
and the shipper shall then declare whether or not the cargo is harmful to the marine environment. A new form of the GRB has been included in Appendix II to MAROL Annex V. The GRB is now divided into two parts: Part I - for all garbage other than cargo residues, applicable to all ships. PART II - for cargo residues only applicable to ships carrying solid bulk cargo. These changes are reflected in the vessels latest revised GRB.
The IMO has also adopted an International Code for Ships Operating in Polar Waters (or
Polar Code
) which deals with matters regarding design, construction, equipment, operation, search and rescue and environmental protection in relation to ships operating in waters surrounding the two poles. The Polar Code includes both safety and environmental provisions. The Polar Code and related amendments entered into force in January 2017. The Polar Code is mandatory for new vessels built after January 1, 2017. For existing ships, this code will be applicable from the first intermediate or renewal survey, whichever occurs first, beginning on or after January 1, 2018.
MSC 91 adopted amendments to SOLAS Regulation II-2/10 to clarify that a minimum of two-way portable radiotelephone apparatus for each fire party for firefighters' communication shall be carried on board. These radio devices shall be of explosion proof type or intrinsically safe type. All existing ships built before July 1, 2014 should comply with this requirement by the first safety equipment survey after July 1, 2018. All new vessels constructed (keel laid) on or after July 1, 2014 must comply with this requirement at the time of delivery. Amendments to SOLAS Regulation II-1/3/-12 on protection against noise, Regulation II-2/1 and II 2/10 on firefighting and new Regulation XI-1/2-1 on harmonization of survey periods of cargo ships not subject to the ESP code become effective January 1, 2020.
As per MSC. 338(91), requirements have been highlighted for audio and visual indicators for breathing apparatus which will alert the user before the volume of the air in the cylinder has been reduced to no less than 200 liters. This applies to ships constructed on or after July 1, 2014. Ships constructed before July 1, 2014 must comply no later than July 1, 2019.
Cyber-related risks are operational risks that are appropriately assessed and managed in accordance with the safety management requirements of the ISM Code. Cyber risks are required to be appropriately addressed in our safety management system no later than the first annual verification of the company's Document of Compliance after January 1, 2021.
The IMO continues to review and introduce new regulations; as such, it is impossible to predict what additional requirements, if any, may be adopted by the IMO and what effect, if any, such regulations might have on our operations.
European Union (or EU)
The EU has adopted legislation that: bans from European waters manifestly sub-standard vessels (defined as vessels that have been detained twice by EU port authorities, in the preceding two years); creates obligations on the part of EU member port states to inspect minimum percentages of vessels using these ports annually; provides for increased surveillance of vessels posing a high risk to maritime safety or the marine environment; and provides the EU with greater authority and control over classification societies, including the ability to seek to suspend or revoke the authority of negligent societies.
Two regulations, that are part of the implementation of the Port State Control Directive, came into force on January 1, 2011 and introduced a ranking system (published on a public website and updated daily) displaying shipping companies operating in the EU with the worst safety records. The ranking is judged upon the results of the technical inspections carried out on the vessels owned by a particular shipping company. Those shipping companies that have the most positive safety records are rewarded by subjecting them to fewer inspections, while those with the most safety shortcomings or technical failings recorded upon inspection will in turn be subject to a greater frequency of official inspections to their vessels.
The EU has, by way of Directive 2005/35/EC, which has been amended by Directive 2009/123/EC created a legal framework for imposing criminal penalties in the event of discharges of oil and other noxious substances from ships sailing in its waters, irrespective of their flag. This relates to discharges of oil or other noxious substances from vessels. Minor discharges shall not automatically be considered as offenses, except where repetition leads to deterioration in the quality of the water. The persons responsible may be subject to criminal penalties if they have acted with intent, recklessly or with serious negligence and the act of inciting, aiding and abetting a person to discharge a polluting substance may also lead to criminal penalties.
37
The EU adopted a Directive requiring the use of low sulfur fuel. Since January 1, 2015, vessels have been required to burn fuel with sulfur content not exceeding 0.1% while within EU member states’ territorial seas, exclusive economic zones and pollution control zones that are included in SOX Emission Control Areas. Other jurisdictions have also adopted similar regulations. Since January 1, 2014, the California Air Resources Board has required vessels to burn fuel with 0.1% sulfur content or less within 24 nautical miles of California. China also established emission control areas and continues to establish such areas, restricting the maximum sulfur content of the fuel to be used by vessels within those areas, which limits become progressively stricter over time.
IMO regulations required that as of January 1, 2015, all vessels operating within ECAs worldwide recognized under MARPOL Annex VI must comply with 0.1% sulfur requirements. Certain modifications were necessary in order to optimize operation on low sulphur marine gas oil (LSMGO) of equipment originally designed to operate on Heavy Fuel Oil (or
HFO
), and to ensure our compliance with the EU Directive. In addition, LSMGO is more expensive than HFO and this impacts the costs of operations. Our exposure to increased cost is in our spot trading vessels, although our competitors bear a similar cost increase as this is a regulatory item applicable to all vessels. All required vessels in our fleet trading to and within regulated low sulfur areas are able to comply with fuel requirements. The global cap on the sulfur content of fuel oil is currently 3.5%, to be reduced to 0.5% by January 1, 2020.
The EU Regulation on Ship Recycling entered into force on December 30, 2013. This regulation aims to prevent, reduce and minimize accidents, injuries and other negative effects on human health and the environment when ships are recycled and the hazardous waste they contain is removed. The legislation applies to all ships flying the flag of an EU country and to vessels with non-EU flags that call at an EU port or anchorage. It sets out responsibilities for ship owners and for recycling facilities both in the EU and in other countries. Each new ship has to have on board an inventory of the hazardous materials (such as asbestos, lead or mercury) it contains in either its structure or equipment. The use of certain hazardous materials is forbidden. Before a ship is recycled, its owner must provide the company carrying out the work with specific information about the vessel and prepare a ship recycling plan. Recycling may only take place at facilities listed on the EU ‘List of facilities’. In 2014, the Council Decision 2014/241/EU authorized EU countries having ships flying their flag or registered under their flag to ratify or to accede to the Hong Kong International Convention for the Safe and Environmentally Sound Recycling of Ships. Compliance timelines are as follows: EU-flagged new-buildings were required to have onboard a verified Inventory of Hazardous Materials (IHM) with a Statement of Compliance at the latest by December 31, 2018, existing EU-flagged vessels are required to have onboard a verified IHM with a Statement of Compliance at the latest by December 31, 2020, non-EU-flagged vessels calling at EU ports are also required to have onboard a verified IHM with a Statement of Compliance latest by December 31, 2020. The EU Commission also adopted a European List of approved ship recycling facilities, as well as four further implementing decisions dealing with certification and other administrative requirements set out in the EU Ship Recycling Regulation
.
North Sea, Canada, and Brazil
Our shuttle tankers and FPSO units primarily operate in the North Sea, Brazil and Newfoundland.
There is no international regime in force which deals with compensation for oil pollution from offshore craft, such as FPSOs. Whether the CLC and the International Convention on the Establishment of an International Fund for Compensation for Oil Pollution Damage 1971, as amended by the 1992 Protocol (or the
Fund Convention
), which deal with liability and compensation for oil pollution and the Convention on Limitation of Liability for Maritime Claims 1976, as amended by the 1996 Protocol (or the
1976 Limitation of Liability Convention
), which deals with limitation of liability for maritime claims, apply to FPSOs is neither straightforward nor certain. This is due to the definition of “ship” under these conventions and the requirement that oil is “carried” on board the relevant vessel. Nevertheless, the wording of the 1992 Protocol to the CLC leaves room for arguing that FPSOs and oil pollution caused by them can come under the ambit of these conventions for the purposes of liability and compensation. However, the application of these conventions also depends on their implementation by the relevant domestic laws of the countries which are parties to them.
UK’s Merchant Shipping Act 1995, as amended (or
MSA
), implements the CLC but uses a wider definition of a “ship” than the one used in the CLC and in its 1992 Protocol but still refers to the criteria used by the CLC. It is therefore doubtful that FPSOs fall within its wording. However, the MSA also includes separate provisions for liability for oil pollution. These apply to vessels which fall within a much wider definition and include non-seagoing vessels. It is arguable that the wording of these MSA provisions is wide enough to cover oil pollution caused by offshore crafts such as FPSOs. The liability regime under these MSA provisions is similar to that imposed under the CLC but limitation of liability is subject to the 1976 Limitation of Liability Convention regime (as implemented in the MSA).
With regard to the 1976 Limitation of Liability Convention, it is, again, doubtful whether it applies to FPSOs, as it contains certain exceptions in relation to vessels constructed for or adapted to and engaged in drilling and in relation to floating platforms constructed for the purpose of exploring or exploiting natural resources of the seabed or its subsoil. However, these exceptions are not included in the legislation implementing the 1976 Limitation of Liability Convention in the UK, which is also to be found in the MSA. In addition, the MSA sets out a very wide definition of “ship” in relation to which the 1976 Limitation of Liability Convention is to apply and there is room for argument that if FPSOs fall within that definition of “ship”, they are subject in the UK to the limitation provisions of the 1976 Limitation of Liability Convention.
In the absence of an international regime regulating liability and compensation for oil pollution caused by offshore oil and gas facilities, the Offshore Pollution Liability Agreement 1974 was entered into by a number of oil companies and became effective in 1975. This is a voluntary industry oil pollution compensation scheme which is funded by the parties to it. These are operators or intending operators of offshore facilities used in the exploration for and production of oil and gas located within the jurisdictions of a number of “Designated States” which include the UK, Denmark, Norway, Germany, France, Greenland, Ireland, the Netherlands, the Isle of Man and the Faroe Islands. The scheme provides for strict liability of the relevant operator for pollution damage and remedial costs, subject to a limit, and the operators must provide evidence of financial responsibility in the form of insurance or other security to meet the liability under the scheme.
38
With regard to FPSOs, Chapter 7 of Annex I of MARPOL (which contains regulations for the prevention of oil pollution) sets out special requirements for fixed and floating platforms, including, amongst others, FPSOs and FSUs. The IMO’s Marine Environment Protection Committee has issued guidelines for the application of MARPOL Annex I requirements to FPSOs and FSUs.
The EU’s Directive 2004/35/CE on environmental liability with regard to the prevention and remedying of environmental damage (or the Environmental Liability Directive) deals with liability for environmental damage on the basis of the “polluter pays” principle. Environmental damage includes damage to protected species and natural habitats and damage to water and land. Under this Directive, operators whose activities caused the environmental damage or the imminent threat of such damage are to be held liable for the damage (subject to certain exceptions). With regard to environmental damage caused by specific activities listed in the Directive, operators are strictly liable. This is without prejudice to their right to limit their liability in accordance with national legislation implementing the 1976 Limitation of Liability Convention. The Directive applies both to damage which has already occurred and where there is an imminent threat of damage. It also requires the relevant operator to take preventive action, to report an imminent threat and any environmental damage to the regulators and to perform remedial measures, such as clean-up. The Environmental Liability Directive is implemented in the UK by the Environmental Damage (Prevention and Remediation) Regulations 2015.
In June 2013, the EU adopted Directive 2013/30/EU on safety of offshore oil and gas operations and amending Directive 2004/35/EC (or the
Offshore Safety Directive
). This Directive lays down minimum requirements for member states and the European Maritime Safety Agency for the purposes of reducing the occurrence of major accidents related to offshore oil and gas operations, thus increasing protection of the marine environment and coastal economies against pollution, establishing minimum conditions for safe offshore exploration and exploitation of oil and gas, and limiting disruptions to the EU’s energy production and improving responses to accidents. The Offshore Safety Directive sets out extensive requirements, such as preparation of a major hazard report with risk assessment, emergency response plan and safety and environmental management system applicable to the relevant oil and gas installation before the planned commencement of the operations, independent verification of safety and environmental critical elements identified in the risk assessment for the relevant oil and gas installation, and ensuring that factors such as the applicant’s safety and environmental performance and its financial capabilities or security to meet potential liabilities arising from the oil and gas operations are taken into account when considering granting a license. Under the Offshore Safety Directive, Member States are to ensure that the relevant licensee is financially liable for the prevention and remediation of environmental damage (as defined in the Environmental Liability Directive) caused by offshore oil and gas operations carried out by or on behalf of the licensee or the operator. Member States must lay down rules on penalties applicable to infringements of the legislation adopted pursuant to this Directive. Member States were required to bring into force laws, regulations and administrative provisions necessary to comply with this Directive by July 19, 2015. The Offshore Safety Directive has been implemented in the UK by a number of different UK Regulations, including the Environmental Damage (Prevention and Remediation) (England) Regulations 2015, as amended, (which revoked and replaced the Environmental Damage (Prevention and Remediation) Regulations 2015)) and the Offshore Installations (Offshore Safety Directive) (Safety Case etc.) Regulations 2015, as amended, both of which entered into force on July 19, 2015.
In addition to the regulations imposed by the IMO and EU, countries having jurisdiction over North Sea areas impose regulatory requirements in connection with operations in those areas, including HSE in the United Kingdom and NPD in Norway. These regulatory requirements, together with additional requirements imposed by operators in North Sea oil fields, require that we make further expenditures for sophisticated equipment, reporting and redundancy systems on the shuttle tankers and for the training of seagoing staff. Additional regulations and requirements may be adopted or imposed that could limit our ability to do business or further increase the cost of doing business in the North Sea.
In Norway, the Norwegian Pollution Control Authority requires the installation of volatile organic compound emissions (or
VOC
) reduction units on most shuttle tankers serving the Norwegian continental shelf. Customers bear the cost to install and operate the VOC equipment on board the shuttle tankers.
In addition to the requirements of major IMO shipping conventions, the exploration for and production of oil and gas within the Newfoundland & Labrador (or
NL
) offshore area is conducted pursuant to the Canada Newfoundland and Labrador Atlantic Accord Implementation Act (the
Accord Act
) in accordance with the conditions of a license and authorization issued by the Canada-Newfoundland and Labrador Offshore Petroleum Board (or
CNLOPB
). Various regulations dealing with environmental, occupational health and safety, and other aspects of offshore oil and gas activities have been enacted under the Accord Act. The CNLOPB has also issued interpretive guidelines concerning compliance with the regulations, and compliance with CNLOPB guidelines may be a condition of the issuance or renewal of the license and authorizations. These regulations and guidelines require that the shuttle tankers in the NL offshore area meet stringent standards for equipment, reporting and redundancy systems, and for the training and equipping of seagoing staff. Further, licensees are required by the Accord Act to provide a benefits plan satisfactory to CNLOPB. Such plans generally require the licensee to: establish an office in NL; give NL residents first consideration for training and employment; make expenditures for research and development and education and training to be carried out in NL; and give first consideration to services provided from within NL and to goods manufactured in NL. These regulatory requirements may change as regulations and CNLOPB guidelines are amended or replaced from time to time.
In addition to the regulations imposed by the IMO, Brazil imposes regulatory requirements in connection with operations in its territory, including specific requirements for the operations of vessels flagged in countries other than Brazil. Brazil has several maritime regulations and frequent amendments and updates. With respect to environmental protection while operating under Brazilian waters, the Federal Constitution establishes that the State shall regulate and impose protections to the environment, establishing liability in the civil, administrative and criminal spheres. Law no. 6938/1981 sets the National Environmental Policy and Law no. 9966/2000, known as “The Oil Law”, institutes several rules, liabilities and penalties regarding the handling oil or other dangerous substances, being applicable to foreign vessels and platforms operating in Brazilian waters.
39
Regulating the exploitation and production of oil and natural gas, Law no. 9.478/1997, known as “The Petroleum Law”, created the National Petroleum Agency (or
ANP
), responsible for regulating and supervising the industry through directives and resolutions. After the discovery of the pre-salt, the mentioned law was altered in some points by Law no. 12.351/2010 (the "Pre-Salt Law") being the industry also regulated by several administrative Regulations issued by the ANP.
ANP is currently reviewing an amendment to its Ordinance 170/02, with aims to specifically regulate ship-to-ship operations in addition to the transportation of hydrocarbons and byproducts.
Additional requirements and restrictions for the operation of offshore vessels and shuttle tankers are imposed by Law 9.432/97 and by the National Waterway Transport Agency (or
ANTAQ
), instituted by Law 10.233/2001, by way of frequently updated administrative resolutions.
The transit of vessels and permanence and operation of offshore units in Brazil are further regulated by the Maritime Authorities, through law and administrative Ordinances known as “NORMAM”.
Brazil also is a signatory of several IMO/MARPOL conventions, including the deliberation to reduce Sulphur emissions as of January 1, 2020, agreed during the 70º session of the Marine Environment Protection Committee, held at IMO’s headquarters on June 2016.
Under Brazil’s environmental laws, owners and operators of vessels are strictly liable for damages to the environment. Other penalties for non-compliance with environmental laws include fines, loss of tax incentives and suspension of activities. Operators such as Petrobras may impose additional requirements, such as compliance with specific health, safety and environmental standards or the use of local labor. Additional regulations and requirements may be adopted or imposed that could limit our ability to do business or further increase the cost of doing business in Brazil.
United States
The United States has enacted an extensive regulatory and liability regime for the protection and clean-up of the environment from oil spills, including discharges of oil cargoes, bunker fuels or lubricants, primarily through the Oil Pollution Act of 1990 (or
OPA 90
) and the Comprehensive Environmental Response, Compensation and Liability Act (or
CERCLA
). OPA 90 affects all owners, bareboat charterers, and operators whose vessels trade to the United States or its territories or possessions or whose vessels operate in United States waters, which include the U.S. territorial sea and 200-mile exclusive economic zone around the United States. CERCLA applies to the discharge of “hazardous substances” rather than “oil” and imposes strict joint and several liabilities upon the owners, operators or bareboat charterers of vessels for clean-up costs and damages arising from discharges of hazardous substances. We believe that petroleum products and LNG and LPG should not be considered hazardous substances under CERCLA, but additives to oil or lubricants used on LNG or LPG carriers and other vessels might fall within its scope.
Under OPA 90, vessel owners, operators and bareboat charterers are “responsible parties” and are jointly, severally and strictly liable (unless the oil spill results solely from the act or omission of a third party, an act of God or an act of war and the responsible party reports the incident and reasonably cooperates with the appropriate authorities) for all containment and clean-up costs and other damages arising from discharges or threatened discharges of oil from their vessels. These other damages are defined broadly to include: natural resources damages and the related assessment costs; real and personal property damages; net loss of taxes, royalties, rents, fees and other lost revenues; lost profits or impairment of earning capacity due to property or natural resources damage; net cost of public services necessitated by a spill response, such as protection from fire, safety or health hazards; and loss of subsistence use of natural resources.
OPA 90 limits the liability of responsible parties in an amount it periodically updates. The liability limits do not apply if the incident was proximately caused by violation of applicable U.S. federal safety, construction or operating regulations, including IMO conventions to which the United States is a signatory, or by the responsible party’s gross negligence or willful misconduct, or if the responsible party fails or refuses to report the incident or to cooperate and assist in connection with the oil removal activities. Liability under CERCLA is also subject to limits unless the incident is caused by gross negligence, willful misconduct or a violation of certain regulations. We currently maintain for each of our vessels pollution liability coverage in the maximum coverage amount of $1 billion per incident. A catastrophic spill could exceed the coverage available, which could harm our business, financial condition and results of operations.
Under OPA 90, with limited exceptions, all newly built or converted tankers delivered after January 1, 1994 and operating in U.S. waters must be double-hulled. All of our tankers are double-hulled.
OPA 90 also requires owners and operators of vessels to establish and maintain with the USCG evidence of financial responsibility in an amount at least equal to the relevant limitation amount for such vessels under the statute. The USCG has implemented regulations requiring that an owner or operator of a fleet of vessels must demonstrate evidence of financial responsibility in an amount sufficient to cover the vessel in the fleet having the greatest maximum limited liability under OPA 90 and CERCLA. Evidence of financial responsibility may be demonstrated by insurance, surety bond, self-insurance, guaranty or an alternate method subject to approval by the USCG. Under the self-insurance provisions, the ship owners or operators must have a net worth and working capital, measured in assets located in the United States against liabilities located anywhere in the world, that exceeds the applicable amount of financial responsibility. We have complied with the USCG regulations by using self-insurance for certain vessels and obtaining financial guaranties from a third party for the remaining vessels. If other vessels in our fleet trade into the United States in the future, we expect to obtain guaranties from third-party insurers.
OPA 90 and CERCLA permit individual U.S. states to impose their own liability regimes with regard to oil or hazardous substance pollution incidents occurring within their boundaries, and some states have enacted legislation providing for unlimited strict liability for spills. Several coastal states, such as California, Washington and Alaska require state-specific evidence of financial responsibility and vessel response plans. We intend to comply with all applicable state regulations in the ports where our vessels call.
40
Owners or operators of vessels, including tankers operating in U.S. waters, are required to file vessel response plans with the USCG, and their tankers are required to operate in compliance with USCG approved plans. Such response plans must, among other things: address a “worst case” scenario and identify and ensure, through contract or other approved means, the availability of necessary private response resources to respond to a “worst case discharge”; describe crew training and drills; and identify a qualified individual with full authority to implement removal actions.
All our vessels have USCG approved vessel response plans. In addition, we conduct regular oil spill response drills in accordance with the guidelines set out in OPA 90. The USCG has announced it intends to propose similar regulations requiring certain vessels to prepare response plans for the release of hazardous substances.
OPA 90 and CERCLA do not preclude claimants from seeking damages resulting from the discharge of oil and hazardous substances under other applicable law, including maritime tort law. Such claims could include attempts to characterize the transportation of LNG or LPG aboard a vessel as an ultra-hazardous activity under a doctrine that would impose strict liability for damages resulting from that activity. The application of this doctrine varies by jurisdiction.
The U.S. Clean Water Act (or the
Clean Water Act
) also prohibits the discharge of oil or hazardous substances in U.S. navigable waters and imposes strict liability in the form of penalties for unauthorized discharges. The Clean Water Act imposes substantial liability for the costs of removal, remediation and damages and complements the remedies available under OPA 90 and CERCLA discussed above.
Our vessels that discharge certain effluents, including ballast water, in U.S. waters must obtain a Clean Water Act permit from the Environmental Protection Agency (or
EPA
) titled the “Vessel General Permit” and comply with a range of effluent limitations, best management practices, reporting, inspections and other requirements. The Vessel General Permit incorporated USCG requirements for ballast water exchange and includes specific technology-based requirements for vessels, and includes an implementation schedule to require vessels to meet the ballast water effluent limitations by the first dry docking after January 1, 2016, depending on the vessel size. The Vessel Incidental Discharge Act (or
VIDA
) was signed into law on December 4, 2018 and establishes a new framework for the regulation of vessel incidental discharges under the CWA. VIDA requires the EPA to develop performance standards for incidental discharges and requires the USCG to develop regulations within two years of the EPA’s promulgation of standards. Under VIDA, all provisions of the Vessel General Permit remain in force and effect as currently written until the USCG regulations are finalized. Vessels that are constructed after December 1, 2013 are subject to the ballast water numeric effluent limitations. Several U.S. states have added specific requirements to the Vessel General Permit and, in some cases, may require vessels to install ballast water treatment technology to meet biological performance standards.
Greenhouse Gas Regulation
In February 2005, the Kyoto Protocol to the United Nations Framework Convention on Climate Change (or the
Kyoto Protocol
) entered into force. Pursuant to the Kyoto Protocol, adopting countries are required to implement national programs to reduce emissions of greenhouse gases. In December 2009, more than 27 nations, including the United States, entered into the Copenhagen Accord. The Copenhagen Accord is non-binding but is intended to pave the way for a comprehensive, international treaty on climate change. In December 2015, the Paris Agreement (or the
Paris Agreement
) was adopted by a large number of countries at the 21st Session of the Conference of Parties (commonly known as COP 21, a conference of the countries which are parties to the United Nations Framework Convention on Climate Change; the COP is the highest decision-making authority of this organization). The Paris Agreement, which entered into force on November 4, 2016, deals with greenhouse gas emission reduction measures and targets from 2020 in order to limit the global temperature increases to well below 2˚ Celsius above pre-industrial levels. Although shipping was ultimately not included in the Paris Agreement, it is expected that the adoption of the Paris Agreement may lead to regulatory changes in relation to curbing greenhouse gas emissions from shipping.
In July 2011, the IMO adopted regulations imposing technical and operational measures for the reduction of greenhouse gas emissions. These new regulations formed a new chapter in Annex VI and became effective on January 1, 2013. The new technical and operational measures include the “Energy Efficiency Design Index” (or the
EEDI
), which is mandatory for newbuilding vessels, and the “Ship Energy Efficiency Management Plan,” which is mandatory for all vessels. In October 2016, the IMO’s MEPC adopted updated guidelines for the calculation of the EEDI. In October 2014, the IMO’s MEPC agreed in principle to develop a system of data collection regarding fuel consumption of ships. In October 2016, the IMO adopted a mandatory data collection system under which vessels of 5,000 gross tonnages and above are to collect fuel consumption and other data and to report the aggregated data so collected to their flag state at the end of each calendar year. The new requirements entered into force on March 1, 2018.
All vessels are required to submit fuel consumption data to their respective administration/registered organizations for onward submission to the IMO for analysis and to help with decision making on future measures. The amendments require operators to update the vessels Ship Energy Efficiency Management Plan (SEEMP) to include a part II describing the ship specific methodology that will be used for collecting and measuring data for fuel oil consumption, distance travelled, hours underway and processes that will be used to report the data to the Administration, in order to ensure data quality is maintained. The vessels were required to be verified as compliant on or before December 31, 2018, with the first data collection period being for the 2019 calendar year. A Confirmation of Compliance will be issued by the administration/registered organization, which must be kept on board the ship.
The IMO also approved a roadmap for the development of a comprehensive IMO strategy on reduction of greenhouse gas emissions from ships with an initial strategy adopted on April 13, 2018 and a revised strategy to be adopted in 2023
.
41
The EU also has indicated that it intends to propose an expansion of an existing EU emissions trading regime to include emissions of greenhouse gases from vessels, and individual countries in the EU may impose additional requirements. The EU has adopted Regulation (EU) 2015/757 on the monitoring, reporting and verification (or
MRV
) of CO2 emissions from vessels (or the
MRV Regulation
), which entered into force on July 1, 2015. The MRV Regulation aims to quantify and reduce CO2 emissions from shipping. It lists the requirements on the MRV of carbon dioxide emissions and requires ship owners and operators to annually monitor, report and verify CO2 emissions for vessels larger than 5,000 gross tonnage calling at any EU and EFTA (Norway and Iceland) port (with a few exceptions, such as fish-catching or fish-processing vessels). Data collection takes place on a per voyage basis and started January 1, 2018. The reported CO2 emissions, together with additional data, such as cargo and energy efficiency parameters, are to be verified by independent verifiers and sent to a central
inspection database hosted by the European Maritime Safety Agency (EMSA) to collate all the data applicable to the EU region. Companies responsible for the operation of large ships using EU ports are required to report their CO2 emissions.
While the EU was considering a proposal for the inclusion of shipping in the EU Emissions Trading System as from 2021 (in the absence of a comparable system operating under the IMO), it appears that the decision to include shipping may be deferred until 2023
.
In the United States, the EPA issued an “endangerment finding” regarding greenhouse gases under the Clean Air Act. While this finding in itself does not impose any requirements on our industry, it authorizes the EPA to regulate directly greenhouse gas emissions through a rule-making process. In addition, climate change initiatives are being considered in the United States Congress and by individual states. Any passage of new climate control legislation or other regulatory initiatives by the IMO, EU, the United States or other countries or states where we operate that restrict emissions of greenhouse gases could have a significant financial and operational impact on our business that we cannot predict with certainty at this time.
Vessel Security
The ISPS was adopted by the IMO in December 2002 in the wake of heightened concern over worldwide terrorism and became effective on July 1, 2004. The objective of ISPS is to enhance maritime security by detecting security threats to ships and ports and by requiring the development of security plans and other measures designed to prevent such threats. Each of the existing vessels in our fleet currently complies with the requirements of ISPS and Maritime Transportation Security Act of 2002 (U.S. specific requirements). Procedures are in place to inform the relevant reporting regimes such as Maritime Security Council Horn of Africa (or
MSCHOA
), the Maritime Domain Awareness for Trade - Gulf of Guinea (or
MDAT-GoG
), the Information Fusion Center (or
IFC
) whenever our vessels are calling in the Indian Ocean Region, or West Coast of Africa (or
WAF
) or Southeast Asia high-risk areas respectively. In order to mitigate the security risk, security arrangements are required for vessels which travel through these high-risk areas.
|
C.
|
Organizational Structure
|
Our organizational structure includes, among others, our interests in Teekay LNG and Teekay Tankers, which are our publicly-traded subsidiaries, and our publicly-traded equity-accounted investee Teekay Offshore.
42
The following chart provides an overview of our organizational structure as at March 1,
2019
. Please read Exhibit 8.1 to this Annual Report for a list of our subsidiaries as at March 1,
2019
.

|
(1)
|
Teekay LNG is controlled by its general partner. Teekay Corporation indirectly owns a 100% beneficial ownership in the general partner. However, in certain limited cases, approval of a majority of the unitholders of Teekay LNG is required to approve certain actions.
|
|
(2)
|
Teekay Tankers has two classes of shares: Class A common stock and Class B common stock. Teekay Corporation indirectly owns 100% of the Class B shares which have up to five votes each but aggregate voting power capped at 49%. As a result of Teekay Corporation’s ownership of Class A and Class B shares, it holds aggregate voting power of
54.1%
as of March 1,
2019
.
|
|
(3)
|
Teekay Offshore is controlled by its general partner. An affiliate of Brookfield and Teekay indirectly have ownership interests of 51% and 49% of the general partner, respectively. Teekay has significant influence over Teekay Offshore and accounts for its investment in Teekay Offshore using the equity method.
|
|
(4)
|
We are entitled to distributions on our general and limited partner interests in each of Teekay LNG and Teekay Offshore. The general partner of each of Teekay LNG and Teekay Offshore is also entitled to distributions payable with respect to incentive distribution rights. Incentive distribution rights represent the right to receive an increasing percentage of quarterly distributions of available cash from operating surplus after the minimum quarterly distribution and the target distribution levels have been achieved.
|
Teekay LNG is a Marshall Islands limited partnership formed by us in 2004 as part of our strategy to expand our operations in the LNG and LPG shipping sectors. Teekay LNG provides LNG, LPG and crude oil marine transportation service, primarily under long-term, fixed-rate contracts with major energy and utility companies. As of
December 31, 2018
, Teekay LNG’s fleet, including its equity investees, included
49
LNG carriers (including
6
newbuildings),
29
LPG/multigas carriers,
one
conventional tanker and
one
Handymax product tanker. Teekay LNG’s ownership interests in these vessels range from 20% to 100%. Teekay LNG also has a 30% interest in an LNG receiving and regasification terminal under construction.
Teekay Offshore
is a Marshall Islands limited partnership formed by us in 2006 as part of our strategy to expand our operations in the offshore oil marine transportation, processing and storage sectors. Teekay Parent owns three FPSO units which, pursuant to an omnibus agreement we entered into in connection with Teekay Offshore’s initial public offering in 2006, we have agreed to offer to Teekay Offshore in the future. Please read "Item 7. Major Shareholders and Certain Relationships with Related Party Transactions - Competition with Teekay Tankers, Teekay Offshore and Teekay LNG" for information with respect to the omnibus agreement.
In December 2007, we added Teekay Tankers to our structure. Teekay Tankers is a Marshall Islands corporation formed by us to own our conventional tanker business. As of
December 31, 2018
, Teekay Tankers’ fleet included
20
double-hull Aframax tankers (including
three
chartered-in vessel),
30
double-hull Suezmax tankers,
nine
product tankers, and
one
VLCC, all of which trade either in the spot tanker market or under short- or medium-term, fixed-rate time-charter contracts. Teekay Tankers owns 100% of its fleet, other than a 50% interest in the VLCC and the in-chartered vessels.
Prior to October 1, 2018, we provided Teekay Tankers with certain commercial, technical, administrative, and strategic services under a long-term management agreement through a wholly-owned subsidiary. As of October 1, 2018, Teekay Tankers elected to receive commercial and technical management services directly from its wholly-owned subsidiaries, who receive various services from us and our affiliates.
We entered into an omnibus agreement with Teekay LNG, Teekay Offshore and related parties governing, among other things, when we, Teekay LNG, and Teekay Offshore may compete with each other and certain rights of first offer on LNG carriers, oil tankers, shuttle tankers, FSO units and FPSO units.
Teekay Parent owns three FPSO units, in addition to its interests in its subsidiaries and equity-accounted investments. For additional information about Teekay LNG and Teekay Tankers please read Item 4.B. above.
43
|
D.
|
Property, Plant and Equipment
|
Other than our vessels, and
Teekay LNG’s
30% interest, through the Bahrain LNG Joint Venture, in an LNG receiving and regasification terminal under construction, we do not have any material property. Please read “Item 18. Financial Statements:
Note 8 — Long-Term Debt
for information about major encumbrances against our vessels.
|
E.
|
Taxation of the Company
|
United States Taxation
The following is a discussion of the expected material U.S. federal income tax considerations applicable to us. This discussion is based upon the provisions of the Code, legislative history, applicable U.S. Treasury Regulations (or
Treasury Regulations
), judicial authority and administrative interpretations, all as in effect on the date of this Annual Report, and which are subject to change, possibly with retroactive effect, or are subject to different interpretations. Changes in these authorities may cause the tax consequences to vary substantially from the consequences described below.
Taxation of Operating Income.
A significant portion of our gross income will be attributable to the transportation of crude oil and related products. For this purpose, gross income attributable to transportation (or
Transportation Income
) includes income derived from, or in connection with, the use (or hiring or leasing for use) of a vessel to transport cargo, or the performance of services directly related to the use of any vessel to transport cargo, and thus includes income from time charters, contracts of affreightment, bareboat charters, and voyage charters.
Fifty percent (50%) of Transportation Income that either begins or ends, but that does not both begin and end, in the United States (or
U.S. Source International Transportation Income
) is considered to be derived from sources within the United States. Transportation Income that both begins and ends in the United States (or
U.S. Source Domestic Transportation Income
) is considered to be 100% derived from sources within the United States. Transportation Income exclusively between non-U.S. destinations is considered to be 100% derived from sources outside the United States. Transportation Income derived from sources outside the United States generally is not subject to U.S. federal income tax.
Based on our current operations, a substantial portion of our Transportation Income is from sources outside the United States and not subject to U.S. federal income tax. However, certain of our subsidiaries which have made special U.S. tax elections to be treated as partnerships or disregarded as entities separate from us for U.S. federal income tax purposes are potentially engaged in activities which could give rise to U.S. Source International Transportation Income. Unless the exemption from U.S. taxation under Section 883 of the Code (or the
Section 883 Exemption
) applies, our U.S. Source International Transportation Income generally is subject to U.S. federal income taxation under either the net basis and branch profits taxes or the 4% gross basis tax, each of which is discussed below. Furthermore, certain of our subsidiaries engaged in activities which could give rise to U.S. Source International Transportation Income rely on our ability to claim the Section 883 Exemption.
The Section 883 Exemption.
In general, the Section 883 Exemption provides that if a non-U.S. corporation satisfies the requirements of Section 883 of the Code and the Treasury Regulations thereunder (or the
Section 883 Regulations
), it will not be subject to the net basis and branch profits taxes or the 4% gross basis tax described below on its U.S. Source International Transportation Income. As discussed below, we believe the Section 883 Exemption will apply and we will not be taxed on our U.S. Source International Transportation Income. The Section 883 Exemption does not apply to U.S. Source Domestic Transportation Income.
A non-U.S. corporation will qualify for the Section 883 Exemption if, among other things, it (i) is organized in a jurisdiction outside the United States that grants an exemption from tax to U.S. corporations on international Transportation Income (or an
Equivalent Exemption
), (ii) meets one of three ownership tests (or
Ownership Tests
) described in the Section 883 Regulations, and (iii) meets certain substantiation, reporting and other requirements (or the
Substantiation Requirements
).
We are organized under the laws of the Republic of the Marshall Islands. The U.S. Treasury Department has recognized the Republic of the Marshall Islands as a jurisdiction that grants an Equivalent Exemption. We also believe that we will be able to satisfy the Substantiation Requirements necessary to qualify for the Section 883 Exemption. Consequently, our U.S. Source International Transportation Income (including for this purpose, our share of any such income earned by our subsidiaries that have properly elected to be treated as partnerships or disregarded as entities separate from us for U.S. federal income tax purposes) will be exempt from U.S. federal income taxation provided we satisfy one of the Ownership Tests. We believe that we should satisfy one of the Ownership Tests because our stock is primarily and regularly traded on an established securities market in the United States within the meaning of Section 883 of the Code and the Section 883 Regulations. We can give no assurance, however, that changes in the ownership of our stock subsequent to the date of this report will permit us to continue to qualify for the Section 883 exemption.
44
Net Basis Tax and Branch Profits Tax.
If the Section 883 Exemption does not apply, our U.S. Source International Transportation Income may be treated as effectively connected with the conduct of a trade or business in the United States (or
Effectively Connected Income
) if we have a fixed place of business in the United States and substantially all of our U.S. Source International Transportation Income is attributable to regularly scheduled transportation or, in the case of income derived from bareboat charters, is attributable to a fixed place of business in the United States. Based on our current operations, none of our potential U.S. Source International Transportation Income is attributable to regularly scheduled transportation or is derived from bareboat charters attributable to a fixed place of business in the United States. As a result, we do not anticipate that any of our U.S. Source International Transportation Income will be treated as Effectively Connected Income. However, there is no assurance that we will not earn income pursuant to regularly scheduled transportation or bareboat charters attributable to a fixed place of business in the United States in the future, which would result in such income being treated as Effectively Connected Income.
U.S. Source Domestic Transportation Income generally will be treated as Effectively Connected Income.
Any income we earn that is treated as Effectively Connected Income would be subject to U.S. federal corporate income tax (the statutory rate for 2018 onwards is 21%) and a 30% branch profits tax imposed under Section 884 of the Code. In addition, a branch interest tax could be imposed on certain interest paid, or deemed paid, by us.
On the sale of a vessel that has produced Effectively Connected Income, we generally would be subject to the net basis and branch profits taxes with respect to our gain recognized up to the amount of certain prior deductions for depreciation that reduced Effectively Connected Income. Otherwise, we would not be subject to U.S. federal income tax with respect to gain realized on the sale of a vessel, provided the sale is considered to occur outside of the United States under U.S. federal income tax principles.
The 4% Gross Basis Tax.
If the Section 883 Exemption does not apply and we are not subject to the net basis and branch profits taxes described above, we will be subject to a 4% U.S. federal income tax on our subsidiaries’ gross U.S. Source International Transportation Income, without benefit of deductions. For 2018, we estimate that, if the Section 883 Exemption and the net basis tax did not apply, the U.S. federal income tax on such U.S. Source International Transportation Income would have been approximately $6.2 million. In addition, we estimate that certain of our subsidiaries that are unable to claim the Section 883 Exemption were subject to less than $0.2 million in the aggregate of U.S. federal income tax on the U.S. source portion of their U.S. Source International Transportation Income for 2018. If the Section 883 Exemption does not apply, the amount of such tax for which we or our subsidiaries may be liable in any year will depend upon the amount of income we earn from voyages into or out of the United States in such year, however, which is not within our complete control.
Marshall Islands Taxation
We believe that neither we nor our subsidiaries will be subject to taxation under the laws of the Marshall Islands, nor that distributions by our subsidiaries to us will be subject to any taxes under the laws of the Marshall Islands, other than taxes, fines, or fees due to (i) the incorporation, dissolution, continued existence, merger, domestication (or similar concepts) of legal entities registered in the Republic of the Marshall Islands, (ii) filing certificates (such as certificates of incumbency, merger, or re-domiciliation) with the Marshall Islands registrar, (iii) obtaining certificates of good standing from, or certified copies of documents filed with, the Marshall Islands registrar, (iv) compliance with Marshall Islands law concerning vessel ownership, such as tonnage tax, or (v) non-compliance with requests made by the Marshall Islands registrar of corporations relating to our books and records and the books and records of our subsidiaries.
Other Taxation
We and our subsidiaries are subject to taxation
in certain non-U.S. jurisdictions
because we or our subsidiaries are either organized, or conduct business or operations in such jurisdictions. In other non-U.S. jurisdictions, we rely on statutory exemptions from tax. However, we cannot assure that any statutory exemptions from tax on which we rely will continue as tax laws in those jurisdictions may change, or we may enter into new business transactions relating to such jurisdictions, which could affect our tax liability. Please read “Item 18. Financial Statements:
Note 21 — Income Taxes
".
|
Item 4A.
|
Unresolved Staff Comments
|
None.
|
Item 5.
|
Operating and Financial Review and Prospects
|
The following discussion should be read in conjunction with the financial statements and notes thereto appearing elsewhere in this report.
Management’s Discussion and Analysis of Financial Condition and Results of Operations
Overview
Teekay Corporation is an operational leader and project developer in the marine midstream space. We have
100% and 49%
general partnership interests in two publicly-listed master limited partnerships, Teekay LNG and Teekay Offshore, respectively. In addition, we have a controlling ownership interest in publicly-listed Teekay Tankers and
we directly own three floating production storage and offloading (or
FPSO
) units
. Teekay provides a comprehensive set of marine services to the world’s leading oil and gas companies.
45
Structure
To understand our financial condition and results of operations, a general understanding of our organizational structure is required. Our organizational structure can be divided into (a) our controlling interests in two publicly-traded subsidiaries, Teekay LNG and Teekay Tankers (together, the
Controlled Daughter Entities
), (b) Teekay and its remaining subsidiaries, which is referred to herein as
Teekay Parent
, and (c) our equity-accounted investment in Teekay Offshore
(together with the Controlled Daughter Entities, the
Daughter Entities
)
. Since we control the voting interests of the Controlled Daughter Entities through our ownership of the sole general partner interest of Teekay LNG and of Class A and Class B common shares of Teekay Tankers, we consolidate the results of these subsidiaries. On September 25, 2017, Teekay, Teekay Offshore and Brookfield Business Partners L.P., together with its institutional partners (collectively,
Brookfield
) completed a strategic partnership (or the
Brookfield Transaction
) which resulted in the deconsolidation of Teekay Offshore as of that date. Although Teekay owned less than 50% of Teekay Offshore, Teekay maintained control of Teekay Offshore until September 25, 2017, by virtue of its 100% ownership interest in the general partner of Teekay Offshore, Teekay Offshore GP L.L.C. (or
TOO GP
). In connection with Brookfield's acquisition of a 49% interest in TOO GP as part of the Brookfield Transaction, Teekay and Brookfield entered into an amended limited liability company agreement whereby Brookfield obtained certain participatory rights in the management of TOO GP, which resulted in Teekay deconsolidating Teekay Offshore for accounting purposes on September 25, 2017. In July 2018, Brookfield exercised its option to acquire an additional 2% of ownership interests in TOO GP from Teekay. Subsequent to the closing of the Brookfield Transaction, Teekay maintains significant influence over Teekay Offshore and accounts for its investment in Teekay Offshore using the equity method.
As of
December 31, 2018
, excluding our incentive distribution rights in Teekay LNG and Teekay Offshore, we had economic interests in Teekay LNG, Teekay Tankers and Teekay Offshore of
33.1%
,
28.8%
and
14.1%
respectively. Please read “Item 4.C. Information on the Company – Organizational Structure.”
Teekay Offshore and Teekay LNG primarily hold assets that generate long-term fixed-rate cash flows. The strategic rationale for establishing these two master limited partnerships was to illuminate the higher value of fixed-rate cash flows to Teekay investors, realize advantages of a lower cost of equity when investing in new offshore or liquefied natural gas (or
LNG
) projects, enhance returns to Teekay through fee-based revenue and ownership of the partnerships’ incentive distribution rights and increase our access to capital for growth. Teekay Tankers holds a substantial majority of our conventional tanker assets.
In addition to Teekay Parent’s investments in Teekay LNG, Teekay Tankers and Teekay Offshore, Teekay Parent continues to own three FPSO units. Our long-term vision is for Teekay Parent to be primarily a portfolio manager and project developer with the Teekay Group’s fixed assets primarily owned directly by the Daughter Entities. Our primary financial objectives for Teekay Parent are to increase the value of our three FPSO units and the value of our investments in Teekay LNG, Teekay Tankers and Teekay Offshore, increase Teekay Parent’s free cash flow per share and, as a service provider to its Daughter Entities, provide scale and other benefits across the Teekay Group.
Teekay entered into an omnibus agreement with Teekay LNG, Teekay Offshore and related parties governing, among other things, when Teekay, Teekay LNG, and Teekay Offshore may compete with each other and certain rights of first offer on LNG carriers, oil tankers, shuttle tankers,
floating storage and offtake (or
FSO
) units and FPSO units.
The Brookfield Transaction constituted a change in control of Teekay Offshore, which gives Teekay Offshore the right to elect to terminate the omnibus agreement, although we have not received any indication from Teekay Offshore that it intends to do so.
We (excluding our investment in Teekay Offshore) have three primary lines of business: offshore production (FPSO units), liquefied gas carriers and conventional tankers.
We manage these businesses for the benefit of all stakeholders. We allocate capital and assess performance from the separate perspectives of Teekay LNG and Teekay Tankers, Teekay Parent, and its investment in Teekay Offshore, as well as from the perspective of the lines of business (the
Line of Business approach
). The primary focus of our organizational structure, internal reporting and allocation of resources by the chief operating decision maker, is on Teekay LNG and Teekay Tankers, Teekay Parent, and its investment in Teekay Offshore (the
Legal Entity approach
). As a result, a substantial majority of the information provided in this Annual Report is presented in accordance with the Legal Entity approach. However, we have continued to incorporate the Line of Business approach in our financial reporting because in certain cases there is more than one line of business in each of Teekay LNG, Teekay Tankers and Teekay Parent, and we believe this information allows a better understanding of our performance and prospects for future net cash flows. We present our investment in Teekay Offshore as a separate operating segment. We assess the performance of, and make decisions to allocate resources to, our investment in Teekay Offshore as a whole and not at the level of the individual lines of business within Teekay Offshore, which are (1) offshore production (FPSO units), (2) offshore logistics (shuttle tankers, the HiLoad DP unit, FSO units, units for maintenance and safety (or
UMS
) and long-distance towing and offshore installation vessels), and (3) conventional tankers.
IMPORTANT FINANCIAL AND OPERATIONAL TERMS AND CONCEPTS
We use a variety of financial and operational terms and concepts when analyzing our performance. These include the following:
Revenues.
Revenues primarily include revenues from voyage charters, pool arrangements, time charters accounted for under operating and direct financing leases, and FPSO contracts. Revenues are affected by hire rates and the number of days a vessel operates, the daily production volume on FPSO units, and the oil price for certain FPSO units. Revenues are also affected by the mix of business between time charters, voyage charters, and vessels operating in pool arrangements. Hire rates for voyage charters are more volatile, as they are typically tied to prevailing market rates at the time of a voyage.
46
Voyage Expenses.
Voyage expenses are all expenses unique to a particular voyage, including any fuel expenses, port fees, cargo loading and unloading expenses, canal tolls, agency fees and commissions. Voyage expenses are typically paid by the customer under time charters and FPSO contracts and by us under voyage charters.
Vessel Operating Expenses.
Under all types of charters and contracts for our vessels, except for bareboat charters, we are responsible for vessel operating expenses, which include crewing, repairs and maintenance, insurance, stores, lube oils and communication expenses. The two largest components of our vessel operating expenses are crew costs and repairs and maintenance. We expect these expenses to increase as our fleet matures and to the extent that it expands. We are taking steps to maintain these expenses at a stable level but expect an increase in line with inflation in respect of crew, material, and maintenance costs. The strengthening or weakening of the U.S. Dollar relative to foreign currencies may result in significant decreases or increases, respectively, in our vessel operating expenses, depending on the currencies in which such expenses are incurred.
Income from Vessel Operations.
To assist us in evaluating our operations by segment, we analyze our income from vessel operations for each segment, which represents the income we receive from the segment after deducting operating expenses, but prior to the deduction of interest expense, realized and unrealized gains (losses) on non-designated derivative instruments, income taxes, foreign currency and other income and losses.
Dry docking.
We must periodically dry dock each of our vessels for inspection, repairs and maintenance and any modifications to comply with industry certification or governmental requirements. Generally, we dry dock each of our vessels every two and a half to five years, depending upon the type of vessel and its age. In addition, a shipping society classification intermediate survey is performed on our LNG carriers between the second and third year of the five-year dry-docking cycle. We capitalize a substantial portion of the costs incurred during dry docking and for the survey and amortize those costs on a straight-line basis from the completion of a dry docking or intermediate survey over the estimated useful life of the dry dock. We expense as incurred costs for routine repairs and maintenance performed during dry dockings that do not improve or extend the useful lives of the assets and annual class survey costs for our FPSO units. The number of dry dockings undertaken in a given period and the nature of the work performed determine the level of dry-docking expenditures.
Depreciation and Amortization.
Our depreciation and amortization expense typically consists of:
|
•
|
charges related to the depreciation and amortization of the historical cost of our fleet (less an estimated residual value) over the estimated useful lives of our vessels;
|
|
•
|
charges related to the amortization of dry-docking expenditures over the useful life of the dry dock; and
|
|
•
|
charges related to the amortization of intangible assets, including the fair value of time charters and customer relationships where amounts have been attributed to those items in acquisitions; these amounts are amortized over the period in which the asset is expected to contribute to our future cash flows.
|
Time-Charter Equivalent (TCE) Rates.
Bulk shipping industry freight rates are commonly measured in the shipping industry in terms of “time-charter equivalent” (or
TCE
) rates, which represent revenues less voyage expenses divided by revenue days.
Revenue Days.
Revenue days are the total number of calendar days our vessels were in our possession during a period, less the total number of off-hire days during the period associated with major repairs, dry dockings or special or intermediate surveys. Consequently, revenue days represent the total number of days available for the vessel to earn revenue. Idle days, which are days when the vessel is available for the vessel to earn revenue, yet is not employed, are included in revenue days. We use revenue days to explain changes in our revenues between periods.
Calendar-Ship-Days.
Calendar-ship-days are equal to the total number of calendar days that our vessels were in our possession during a period. As a result, we use calendar-ship-days primarily in explaining changes in vessel operating expenses, time-charter hire expense and depreciation and amortization.
47
ITEMS YOU SHOULD CONSIDER WHEN EVALUATING OUR RESULTS
You should consider the following factors when evaluating our historical financial performance and assessing our future prospects:
|
•
|
Deconsolidation of Teekay Offshore.
On September 25, 2017, Teekay deconsolidated Teekay Offshore (please read "Item 18
–
Financial Statements: Note 4 – Deconsolidation of Teekay Offshore and Note 3 – Segment Reporting"). Our consolidated results presented in this report include those of Teekay Offshore until the date of its deconsolidation.
|
|
•
|
Adoption of Accounting Standards Update 2014-09.
In May 2014, the Financial Accounting Standards Board (or
FASB
) issued Accounting Standards Update 2014-09, Revenue from Contracts with Customers (or
ASU 2014-09
) (please read "Item 18
–
Financial Statements: Note 2 – Recent Accounting Pronouncements"). Teekay has adopted ASU 2014-09 as a cumulative-effect adjustment as of January 1, 2018, and as a result, comparative 2017 and 2016 periods do not reflect the effect of this new standard. The following differences had a material effect on revenues reported in the year ended December 31, 2018:
|
|
•
|
Teekay Tankers previously presented the net allocation for its vessels participating in revenue sharing arrangements (or
RSAs
) as revenues. Teekay Tankers is the principal in voyages its vessels perform that are included in the RSAs. As such, under ASU 2014-09, the revenue from those voyages is presented in revenues and the difference between this amount and Teekay Tankers' net allocation from the RSA is presented as voyage expenses. This had the effect of increasing both revenues and voyage expenses for the year ended December 31, 2018 by
$292.6 million
.
|
|
•
|
Teekay manages vessels owned by its equity-accounted investments and third parties. Upon the adoption of ASU 2014-09, costs incurred by Teekay for its seafarers are presented as vessel operating expenses and the reimbursement of such expenses are presented as revenue, instead of such amounts being presented on a net basis. In the Teekay Parent - Other and Corporate G&A segment, this had the effect of increasing both revenues and vessel operating expenses for the year ended December 31, 2018 by
$82.9 million
.
|
|
•
|
Our revenues are affected by cyclicality in the tanker markets.
The cyclical nature of the tanker industry causes significant increases or decreases in the revenue we earn from our vessels, particularly those we trade in the spot conventional tanker market.
|
|
•
|
Tanker rates also fluctuate based on seasonal variations in demand.
Tanker markets are typically stronger in the winter months as a result of increased oil consumption in the Northern Hemisphere but weaker in the summer months as a result of lower oil consumption in the Northern Hemisphere and increased refinery maintenance. In addition, unpredictable weather patterns during the winter months tend to disrupt vessel scheduling, which historically has increased oil price volatility and oil trading activities in the winter months. As a result, revenues generated by our vessels have historically been weaker during the quarters ended June 30 and September 30, and stronger in the quarters ended December 31 and March 31.
|
|
•
|
The size of and types of vessels in our fleet continues to change.
Our results of operations reflect changes in the size and composition of our fleet due to certain vessel deliveries, vessel dispositions and changes to the number of vessels we charter in, as well as our entry into new markets. Please read “—Results of Operations” below for further details about vessel dispositions, deliveries and vessels chartered in. Due to the nature of our business, we expect our fleet to continue to fluctuate in size and composition.
|
|
•
|
Vessel operating and other costs are facing industry-wide cost pressures
. The
shipping industry continues to forecast a shortfall in qualified personnel, although weak shipping and offshore markets and slowing growth may ease officer shortages. We will continue to focus on our manning and training strategies to meet future needs but going forward, crew compensation may increase.
In addition, factors such as pressure on commodity and raw material prices, as well as changes in regulatory requirements could also contribute to operating expenditure increases. We continue to take action aimed at improving operational efficiencies and tempering the effect of inflationary and other price escalations; however, increases to operational costs are still likely to occur in the future.
|
|
•
|
Our net income is affected by fluctuations in the fair value of our derivative instruments
. Most of our existing cross currency and interest rate swap agreements and foreign currency forward contracts are not designated as hedges for accounting purposes. Although we believe the non-designated derivative instruments are economic hedges, the changes in their fair value are included in our
consolidated statements of (loss) income
as unrealized gains or losses on non-designated derivatives. The unrealized changes in fair value do not affect our cash flows or liquidity.
|
|
•
|
The amount and timing of dry dockings of our vessels can affect our revenues between periods.
Our vessels are off hire at various times due to scheduled and unscheduled maintenance. During
2018
and
2017
, on a consolidated basis, we incurred
451
and
796
off-hire days relating to dry docking, respectively. The financial impact from these periods of off-hire, if material, is explained in further detail below in "—Results of Operations”.
Twenty-one
of our vessels are scheduled for dry docking during
2019
.
|
|
•
|
Our financial results are affected by fluctuations in currency
exchange rates
. Under GAAP, all foreign currency-denominated monetary assets and liabilities (including cash and cash equivalents, restricted cash, accounts receivable, accounts payable, accrued liabilities, unearned revenue, advances from affiliates, and long-term debt) are revalued and reported based on the prevailing exchange rate at the end of the period. These foreign currency translations fluctuate based on the strength of the U.S. Dollar relative to the applicable foreign currency, mainly to the Euro and NOK, and are included in our results of operations. The translation of all foreign currency-denominated monetary assets and liabilities at each reporting date results in unrealized foreign currency exchange gains or losses but do not currently impact our cash flows.
|
48
|
•
|
The division of our results of operations between the Daughter Entities and Teekay Parent is impacted by the sale of vessels or operations from Teekay Parent to the Daughter Entities.
Prior to our adoption of ASU 2017-01 on October 1, 2017, the Controlled Daughter Entities (and Teekay Offshore until its deconsolidation on September 25, 2017) accounted for the acquisition of the vessels or operations from Teekay as a transfer of a business between entities under common control. The method of accounting for such transfers was similar to the pooling of interests method of accounting. Under this method, the carrying amounts of net assets recognized in the balance sheets of each combining entity are carried forward to the balance sheet of the combined entity, and no other assets or liabilities are recognized as a result of the combination. In addition, such transfers were accounted for as if the transfer occurred from the date that the acquiring subsidiary and the acquired vessels were both under the common control of Teekay and had begun operations. As a result, the historical financial information of the Controlled Daughter Entities (and of Teekay Offshore until its deconsolidation on September 25, 2017) included in this Annual Report reflects the financial results of the vessels or operations acquired from Teekay Parent from the date the vessels or operations were both under the common control of Teekay and had begun operations but prior to the date they were owned by the Controlled Daughter Entity (or Teekay Offshore until its deconsolidation on September 25, 2017).
|
|
•
|
The duration of some of our FPSO contracts is the life of the relevant oil field or is subject to extension by the field operator or vessel charterer. If the oil field no longer produces oil or is abandoned or the contract term is not extended, we will no longer generate revenue under the related contract and will need to seek to redeploy affected vessels.
FPSO contracts under which our vessels operate are subject to extensions beyond their initial term. The likelihood of these contracts being extended may be negatively affected by reductions in oil field reserves, low oil prices generally or other factors. If we are unable to promptly redeploy any affected vessels at rates at least equal to those under the contracts, if at all, our operating results will be harmed. Any potential redeployment may not be under long-term contracts, which may affect the stability of our cash flow and our ability to make cash distributions. FPSO units, in particular, are specialized vessels that have very limited alternative uses and high fixed costs. In addition, FPSO units typically require substantial capital investments prior to being redeployed to a new field and production service agreement. Any idle time prior to the commencement of a new contract or our inability to redeploy the vessels at acceptable rates may have an adverse effect on our business and operating results.
|
RECENT DEVELOPMENTS AND RESULTS OF OPERATIONS
The results of operations that follow have first been divided into (a) our controlling interests in our publicly-traded subsidiaries Teekay LNG and Teekay Tankers, (b) Teekay Parent, and (c) the results of Teekay Offshore until its deconsolidation on September 25, 2017. Within the first two of these three groups, we have further subdivided the results into their respective lines of business. The following table (a) presents revenues and
income (loss) from vessel operations
for each of Teekay LNG and Teekay Tankers, for Teekay Parent, and for Teekay Offshore until its deconsolidation on September 25, 2017, and (b) reconciles these amounts to our consolidated financial statements.
|
|
Revenues
|
Income (loss) from vessel operations
|
||||||||||||||||
|
(in thousands of U.S. dollars)
|
2018
|
2017
|
2016
|
2018
|
2017
|
2016
|
||||||||||||
|
Teekay LNG
|
510,762
|
|
432,676
|
|
396,444
|
|
148,599
|
|
148,649
|
|
153,181
|
|
||||||
|
Teekay Tankers
(1)
|
755,763
|
|
431,178
|
|
550,543
|
|
7,204
|
|
1,416
|
|
96,752
|
|
||||||
|
Teekay Parent
|
451,659
|
|
303,566
|
|
340,513
|
|
8,516
|
|
(290,425
|
)
|
(96,496
|
)
|
||||||
|
Teekay Offshore
(2)
|
—
|
|
796,711
|
|
1,152,390
|
|
—
|
|
147,060
|
|
230,853
|
|
||||||
|
Elimination of intercompany
(1)(3)
|
(10,426
|
)
|
(83,799
|
)
|
(111,321
|
)
|
—
|
|
—
|
|
—
|
|
||||||
|
Teekay Corporation Consolidated
|
1,707,758
|
|
1,880,332
|
|
2,328,569
|
|
164,319
|
|
6,700
|
|
384,290
|
|
||||||
|
(1)
|
During 2014, Teekay sold to Teekay Tankers a 50% interest in Teekay Tankers Operations Ltd. (or
TTOL
), which owns our conventional tanker commercial management and technical management operations, including direct ownership in five commercially managed revenue sharing arrangements of the Teekay group. Following that sale, Teekay Tankers and Teekay Parent each accounted for their 50% interests in TTOL as equity-accounted investments and, as such, TTOL’s results were reflected in equity income of Teekay Tankers and Teekay Parent. Upon consolidation of Teekay Tankers into Teekay, the results of TTOL were accounted for on a consolidated basis by Teekay. On May 31, 2017, Teekay Tankers acquired from Teekay Parent the remaining 50% interest in TTOL. As a result of the acquisition, the financial information for Teekay Tankers prior to the date that Teekay Tankers acquired interests in TTOL is retroactively adjusted to include the results of TTOL on a consolidated basis during the periods they were under common control of Teekay and had begun operations.
|
|
(2)
|
On September 25, 2017, Teekay deconsolidated Teekay Offshore (see “Item 5. Operating and Financial Review and Prospects - Management’s Discussion and Analysis of Financial Condition and Results of Operations - Recent Developments and Results of Operations - Recent Developments in Teekay Offshore” for additional information). The figures above are those of Teekay Offshore until the date of deconsolidation.
|
|
(3)
|
During 2018, Teekay Parent chartered in two LNG carriers from Teekay LNG until March and April 2018. During 2017, Teekay Parent chartered in three FSO units and two shuttle tankers from Teekay Offshore, and two LNG carriers from Teekay LNG. During 2016, Teekay Parent chartered in three FSO units, three shuttle tankers and one Aframax tanker from Teekay Offshore, two LNG carriers from Teekay LNG and two Aframax tankers from Teekay Tankers.
|
49
Summary
Teekay Corporation consolidated income from vessels operations
increased
to
$164.3 million
for the year ended
December 31, 2018
compared to
$6.7 million
in the prior year. The primary reasons for this
increase
are as follows:
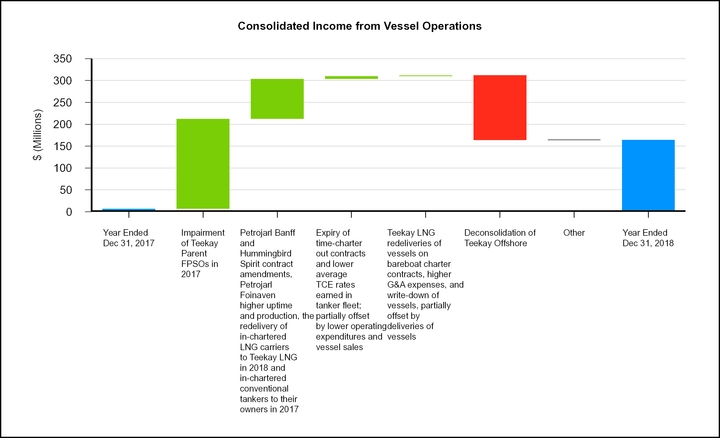
|
•
|
in Teekay Parent,
increases in income from operations due to the write-downs in 2017 of the
Petrojarl Foinaven
and
Petrojarl Banff
FPSO units, contract amendments related to the
Petrojarl Banff
FPSO and
Hummingbird Spirit
FPSO units that resulted in higher revenues in 2018, higher uptime and production on the
Petrojarl Foinaven
in 2018 that resulted in higher revenues, the redelivery of our last two chartered-in conventional tankers to their owners in 2017, and the redelivery of two in-chartered LNG carriers to Teekay LNG in 2018; and
|
|
•
|
in Teekay Tankers
, a net increase in income from vessel operations primarily due to losses on the sales of five vessels in 2017, higher realized full service lightering (or
FSL
) spot rates and changes in the utilization of FSL vessels, scope and timing of repairs and planned maintenance activities in 2018 and redeliveries of various in-chartered tankers to their owners in 2017, partially offset by the expiry of time-charter out contracts, which subsequently traded on the spot market at lower averaged realized rates;
|
partially offset by
|
•
|
in
Teekay LNG, decreases from the redelivery to Teekay LNG of seven multi-gas carriers and two conventional tankers trading in the spot market in 2018, and the
Polar Spirit
earning a lower time-charter rate upon redeployment; higher general and administrative expenses in 2018; and the write-downs of three conventional tankers and four multi-gas carriers in 2018, net of the initial write-downs of four conventional tankers in 2017, partially offset by deliveries to Teekay LNG of the
Torben Spirit
,
Macoma
,
Murex
,
Magdala
,
Myrina
,
Megara,
Bahrain
Spirit
and
Sean Spirit
LNG carrier newbuildings between February 2017 and December 2018 and the commencements of their charter contracts;
|
|
•
|
the
impact of the deconsolidation of Teekay Offshore on September 25, 2017;
|
Details of the changes to our results of operations for the year ended
December 31, 2018
, compared to the year ended
December 31, 2017
are provided in the following section.
50
Year Ended
December 31, 2018
versus Year Ended
December 31, 2017
Teekay LNG
Recent Developments in Teekay LNG
In December 2018, during the special meeting of Teekay LNG's common unitholders, the common unitholders approved a proposal to allow Teekay LNG to elect to be treated as a corporation, instead of a partnership, for U.S. federal income tax purposes, along with other proposals included in the related proxy statement. As a result, effective January 1, 2019, Teekay LNG will be treated as a corporation for U.S. federal income tax purposes, and commencing in 2019, common and preferred unitholders will receive Form 1099s instead of Schedule K-1s relating to distributions taxable as dividend. Teekay LNG will remain a master limited partnership and all other provisions of the Teekay LNG's limited partnership agreement remain in effect.
This change to Teekay LNG's status for U.S. federal income tax purposes is not expected to result in Teekay LNG recognizing a tax related gain or loss. While some Teekay LNG investors may incur a tax gain on conversion, any gain recognized for U.S. tax purposes is expected to result in tax benefits to investors that are expected to reduce the taxable portion of cash distributions paid by Teekay LNG in the future.
Six of Teekay LNG's LNG carrier newbuildings, the
Magdala, Myrina, Megara, Bahrain Spirit
floating storage unit (or
FSU
),
Sean Spirit
and
Yamal
Spirit
delivered in February 2018, May 2018, July 2018, August 2018, December 2018 and January 2019, respectively. Upon delivery, the
Magdala, Myrina
and
Megara
were sold to third parties and leased back under 10-year bareboat charter contracts with purchase obligations for each respective vessel and concurrently commenced their six, eight and eight-year charter contracts with Shell Royal Dutch Plc (or
Shell
), respectively. The
Bahrain Spirit
FSU commenced its 21-year charter contract with Bahrain LNG W.L.L. (or the
Bahrain LNG Joint Venture
) in September 2018 and the
Sean Spirit
commenced its 13-year charter contract (which the charterer has a cancellation option after seven years) with BP Plc in December 2018.
In January 2019, the
Yamal Spirit
LNG carrier newbuilding was delivered and concurrently commenced its 15-year time-charter
contract with Yamal Trade Pte. Ltd
.
Upon delivery of the vessel, Teekay LNG sold and leased back the vessel under a sale-leaseback financing transaction, which Teekay LNG secured in January 2019 prior to the delivery of the
Yamal Spirit
.
In January 2018, July 2018 and January 2019, Teekay LNG's joint venture with China LNG, CETS Investment Management (HK) Co. Ltd. and BW LNG Investments Pte. Ltd. (or
the Pan Union Joint Venture
) took delivery of its second, third and fourth LNG carrier newbuildings, the
Pan Americas, Pan Europe
and
Pan Africa,
respectively. Upon delivery, the vessels commenced their 20-year charter contracts with Shell. Teekay LNG has ownership interest in these vessels ranging from 20% to 30% through the Pan Union Joint Venture.
In January 2018, Teekay LNG's 50/50 joint venture with China LNG Shipping (Holdings) Limited (or the
Yamal LNG Joint Venture
) took delivery of its first ARC7 LNG carrier newbuilding, the
Eduard Toll.
In September 2018, the Yamal LNG Joint Venture took delivery of its second ARC7 LNG carrier newbuilding,
Rudolf Samoylovich,
earlier than the scheduled November 2018 delivery date to service the project’s second LNG train. Upon delivery, the vessels commenced their 28-year and 27-year charter contracts with Yamal Trade Pte., respectively. The Yamal LNG Joint Venture currently has secured financing in place for its four remaining ARC7 LNG carrier newbuildings.
In January 2018, Teekay LNG sold its 50% ownership interest in one of its joint ventures with Exmar NV (or the
Excelsior Joint Venture
) to a third party for gross proceeds of approximately $54 million. Teekay LNG recognized a gain on the sale of its ownership interest of $5.6 million, which was recorded in equity income for the year ended December 31, 2018.
In March 2018, upon its scheduled redelivery to Teekay LNG from us, Teekay LNG re-chartered the
Polar Spirit
LNG carrier to an Asian-based energy company for a period of approximately three months and then subsequently secured employment for the vessel beginning in July 2018 for nine months with a subsidiary of Petroliam Nasional Berhad (or
Petronas
). In addition, Teekay LNG secured a four-year charter contract for the
Arctic Spirit
LNG carrier, also with a subsidiary of Petronas, which commenced immediately upon its scheduled redelivery from us to Teekay LNG in May 2018. In May 2018, Teekay LNG agreed to a six-month charter extension of the
Torben Spirit
LNG carrier to December 2018 with a major energy company, which was further extended for an additional three years from the six-month extension ending in December 2018.
In March, May and July 2018, Teekay LNG's LPG 50%-owned joint venture with Exmar NV (or the
Exmar LPG Joint Venture
), took delivery of its seventh, eighth and ninth LPG carrier newbuildings in the past four years, the
Kapellen
,
Koksijde
and
Wepion
, respectively. The
Kapellen, Koksijde
and
Wepion
are on short-term charter contracts.
In February 2018 and January 2019, Compañía Española de Petróleos, S.A.U. (or
CEPSA
), the charterer, and owner of Teekay LNG's capital leased vessels, the
Teide Spirit
and
Toledo Spirit
, sold these vessels to third parties. As a result of these sales, Teekay LNG returned the vessels to CEPSA and the full amount of the associated obligations related to the capital lease were concurrently extinguished. In addition, Teekay LNG incurred associated seafarer severance payments in 2018 of approximately $1.8 million upon the sale of the
Teide Spirit
and approximately $1.8 million in 2019 for the sale of the
Toledo Spirit
.
In October 2018, Teekay LNG sold the
African Spirit
Suezmax tanker for net proceeds of $12.8 million. In December 2018, Teekay LNG sold the
European Spirit
Suezmax tanker for net proceeds of $15.7 million. During 2018, prior to the sale of the vessels, Teekay LNG recorded further aggregate write-downs on the two Suezmax tankers totaling $7.9 million (December 31, 2017 – $25.1 million).
51
Two of the six LNG carriers (or
MALT LNG Carriers
) in Teekay LNG's 52%-owned joint venture with Marubeni Corporation (or the
Teekay LNG-Marubeni Joint Venture
), the
Marib Spirit
and
Arwa Spirit
, are under long-term charters with Yemen LNG Ltd. (or
YLNG
), a consortium led by Total SA. Due to the political unrest in Yemen, YLNG decided to temporarily close operation of its LNG plant in Yemen in 2015. As a result, commencing January 1, 2016, the Teekay LNG-Marubeni Joint Venture agreed to successive deferral arrangements with YLNG pursuant to which a portion of the charter payments were deferred. Concurrent with the anticipated expiry of the most current deferral arrangement, which is expected to occur within the first half of 2019, the Teekay LNG-Marubeni Joint Venture intends to enter into a further agreement with YLNG pursuant to which the Teekay LNG-Marubeni Joint Venture and YLNG will suspend the two charter contracts for a period of up to three years. If the LNG plant in Yemen resumes operations, it is intended that YLNG will be required to repay the applicable deferred amounts plus interest over a period of installments. However, there is no assurance whether or when the LNG plant will resume operations if YLNG will be able to repay all or any portion of the deferred amounts. Teekay LNG's proportionate share of the estimated impact of the charter payment deferral and Suspension Agreement for 2019 compared to the original charter rates earned prior to January 1, 2016 is estimated to be a reduction to equity income ranging from $7 million to $8 million per quarter, which Teekay LNG expects will be partially offset by sub-chartering employment for the
Marib Spirit
and
Arwa Spirit
in 2019.
In September 2018, the Teekay LNG-Marubeni Joint Venture agreed to charter its LNG carrier, the
Magellan Spirit,
to Teekay LNG for two years at a fixed rate. In turn, Teekay LNG will charter the
Magellan Spirit
in the spot market or secure a short-term charter for this vessel. Teekay LNG currently has the
Magellan Spirit
employed on a charter contract until March 31, 2019 at a charter rate that is significantly higher than the charter-in rate.
In February 2019, Teekay LNG entered into a commercial management agreement (or
CMA
) with a third-party commercial manager (or the
Manager
) whereby the Manager agreed to commercially manage and employ Teekay LNG's seven multi-gas vessels, with such transition to occur over a period between February 2019 and April 2019. Teekay LNG has the ability to withdraw its vessels from the Manager at any time subject to the requirements provided in the CMA.
Operating Results – Teekay LNG
The following table compares Teekay LNG’s operating results, equity income and number of calendar-ship-days for its vessels for
2018
and
2017
:
|
|
|
Liquefied Gas
Carriers |
|
Conventional
Tankers |
|
Teekay LNG
Total |
||||||||||||
|
(in thousands of U.S. dollars, except calendar-ship-days)
|
|
2018
|
|
2017
|
|
2018
|
|
2017
|
|
2018
|
|
2017
|
||||||
|
Revenues
|
|
478,439
|
|
385,683
|
|
32,323
|
|
46,993
|
|
510,762
|
|
432,676
|
|
|||||
|
Voyage expenses
|
|
(18,657
|
)
|
(3,020
|
)
|
(9,580
|
)
|
(5,182
|
)
|
(28,237
|
)
|
(8,202
|
)
|
|||||
|
Vessel operating expenses
|
|
(103,884
|
)
|
(83,328
|
)
|
(13,774
|
)
|
(18,211
|
)
|
(117,658
|
)
|
(101,539
|
)
|
|||||
|
Time-charter hire expense
|
(7,670
|
)
|
—
|
|
—
|
|
—
|
|
(7,670
|
)
|
—
|
|
||||||
|
Depreciation and amortization
|
|
(119,108
|
)
|
(95,025
|
)
|
(5,270
|
)
|
(10,520
|
)
|
(124,378
|
)
|
(105,545
|
)
|
|||||
|
General and administrative expenses
(1)
|
|
(26,202
|
)
|
(15,634
|
)
|
(2,310
|
)
|
(2,507
|
)
|
(28,512
|
)
|
(18,141
|
)
|
|||||
|
Write-down and loss on sale of vessels
|
|
(33,000
|
)
|
—
|
|
(20,863
|
)
|
(50,600
|
)
|
(53,863
|
)
|
(50,600
|
)
|
|||||
|
Restructuring charges
|
|
—
|
|
—
|
|
(1,845
|
)
|
—
|
|
(1,845
|
)
|
—
|
|
|||||
|
Income (loss) from vessel operations
|
|
169,918
|
|
188,676
|
|
(21,319
|
)
|
(40,027
|
)
|
148,599
|
|
148,649
|
|
|||||
|
Equity income
|
|
53,546
|
|
9,789
|
|
—
|
|
—
|
|
53,546
|
|
9,789
|
|
|||||
|
Calendar-Ship-Days
(2)
|
|
|||||||||||||||||
|
Liquefied Gas Carriers
|
|
10,125
|
|
8,357
|
|
—
|
|
—
|
|
10,125
|
|
8,357
|
|
|||||
|
Conventional Tankers
|
|
—
|
|
—
|
|
1,389
|
|
1,904
|
|
1,389
|
|
1,904
|
|
|||||
|
(1)
|
Includes direct general and administrative expenses and indirect general and administrative expenses allocated to the liquefied gas carriers and conventional tankers based on estimated use of corporate resources.
|
|
(2)
|
Calendar-ship-days presented relate to consolidated vessels only and excludes equity-accounted vessels.
|
Teekay LNG – Liquefied Gas Carriers
As at
December 31, 2018
, Teekay LNG’s liquefied gas fleet, including newbuildings, included 49 LNG carriers and 29 LPG/Multigas carriers, in each case, in which its interests ranged from 20% to 100%. The number of calendar-ship-days for Teekay LNG’s liquefied gas carriers consolidated in its financial results
increased
to
10,125
days in
2018
from
8,357
days in
2017
, as a result of the deliveries to Teekay LNG of the
Torben Spirit
and
Murex
,
Macoma
,
Magdala, Myrina, Megara, Bahrain Spirit
and
Sean Spirit
LNG carrier newbuildings between February 2017 and December 2018, the
Magellan Spirit
chartered-in from the Teekay LNG-Marubeni Joint Venture commencing in September 2018 and the acquisition of the
Sonoma Spirit
in April 2017. During
2018
, vessels in this segment were off-hire for scheduled dry dockings of 127 days, unscheduled off-hire for repairs of 146 days and idle for 178 days for repositioning to other charters, compared to vessels in this segment being off-hire for scheduled dry dockings of 63 days, unscheduled off-hire for repairs of 53 days and idle for three days in the same period of the prior year.
52
Income from vessel operations
decreased
to
$169.9 million
in
2018
compared to
$188.7 million
in
2017
, primarily as a result of:
|
•
|
a decrease
of
$33.0 million
due to 2018 write-downs of the
Napa Spirit
,
Camilla
Spirit
,
Cathinka
Spirit
and
Pan
Spirit
as a result of Teekay LNG's evaluation of alternative strategies for these assets, the charter rate environment and outlook for charter rates for these vessels at that time;
|
|
•
|
a
decrease of
$28.0 million
due to six Multi-gas carriers previously on bareboat charter contracts to wholly-owned subsidiaries of Skaugen and redelivered to Teekay LNG from Skaugen during 2017, which incurred operating expenses following their redelivery, partially offset by higher spot revenues earned by these vessels compared to the rates received from their original contracts in 2017;
|
|
•
|
a decrease of
$10.6 million
due to increased general and administrative expenses in 2018 related to an increase in operational staff relating to new vessel deliveries, higher levels of business development activities, and an increase in professional fees primarily due to the lease dispute for Teekay LNG's RasGas II LNG Carriers and due to claims against Skaugen for damages and losses for Teekay LNG's Multi-gas carriers previously on charter to them, and new vessel deliveries;
|
|
•
|
a decrease of
$6.1 million
due to the
Polar Spirit
earning a lower time-charter rate upon redeployment after its previous charter contract ended during the first quarter of 2018; and
|
|
•
|
a decrease of
$0.9 million
due to the
Catalunya Spirit
being off-hire for 30 days in 2018 for a scheduled dry docking, partially offset by the
Hispania Spirit
being off-hire for 31 days in the first quarter of 2017 for a scheduled dry docking;
|
partially offset by
|
•
|
an increase of
$48.6 million
as a result of the deliveries of the
Torben
Spirit
,
Murex
,
Macoma
,
Magdala
,
Myrina
and
Megara
and commencement of their charter contracts;
|
|
•
|
an increase of
$8.3 million
due to the deliveries of the
Sean Spirit
and the
Bahrain Spirit
; and
|
|
•
|
an increase of
$5.1 million
as a result of the
Magellan Spirit
chartered-in contract commencing in September 2018.
|
Equity income related to Teekay LNG’s liquefied gas carriers
increased
to
$53.5 million
in
2018
compared to
$9.8 million
in
2017
, as set forth in the table below:
|
(in thousands of U.S. Dollars)
|
Year Ended December 31,
|
|||||||||||||||||
|
|
Angola
LNG Carriers |
Exmar
LNG Carriers |
Exmar
LPG Carriers |
MALT
LNG Carriers |
RasGas 3
LNG Carriers |
Pan Union LNG Carriers
|
Yamal LNG Carriers
|
Bahrain LNG Joint Venture
|
Total
Equity Income |
|||||||||
|
2018
|
17,337
|
|
9,233
|
|
(6,682
|
)
|
(1,005
|
)
|
14,730
|
|
6,819
|
|
9,607
|
|
3,507
|
|
53,546
|
|
|
2017
|
16,755
|
|
7,397
|
|
(7,863
|
)
|
(16,547
|
)
|
16,324
|
|
496
|
|
(1,761
|
)
|
(5,012
|
)
|
9,789
|
|
|
Difference
|
582
|
|
1,836
|
|
1,181
|
|
15,542
|
|
(1,594
|
)
|
6,323
|
|
11,368
|
|
8,519
|
|
43,757
|
|
The
$0.6 million
increase
in Teekay LNG's 33% investment in the four Angola LNG Carriers was
primarily due to mark-to-market changes on non-designated derivative instruments. The mark-to-market changes resulted from increases in long-term LIBOR benchmark interest rates for interest rate swaps compared to the same period in 2017
.
The
$1.8 million
increase
in Teekay LNG's 50% investment in the Exmar LNG Carriers
was primarily due to a gain of $5.6 million upon the sale of Teekay LNG's 50% ownership interest in the Excelsior Joint Venture in 2018, which was recorded in equity income, partially offset by lower earnings due to the sale of the Excelsior Joint Venture
.
The
$1.2 million
increase
in equity income from Teekay LNG's 50% ownership interest in the Exmar LPG Carriers
was primarily due to
the impairment loss recorded on the
Courcheville
and
Temse
during 2017,
partially offset by
lower spot rates earned during 2018 compared to 2017 for certain vessels and the sale of the
Courcheville
in January 2018.
The
$15.5 million
increase
in equity income from Teekay LNG's 52% investment in the MALT LNG Carriers was
primarily due to
higher fleet utilization and higher rates earned as a result of certain vessels that operated in the spot market during 2017 being on short-term charter contracts in 2018.
The
$1.6 million
decrease
in equity income from Teekay LNG's 40% investment in the RasGas 3 LNG Carriers was primarily due to higher interest expense due to an increase in LIBOR, partially offset by unrealized gains recognized in 2018 relating to its non-designated interest rate swaps compared to unrealized losses in 2017.
The
$6.3 million
increase
in equity income from the Pan Union LNG Carriers was primarily due to the deliveries of the Pan Union Joint Venture's three LNG carrier newbuildings, the
Pan Asia, Pan Americas
and
Pan Europe
, in October 2017, January 2018 and July 2018, respectively, in which Teekay LNG has ownership interests ranging from 20% to 30%
.
The
$11.4 million
increase
in equity income from the 50%-owned investment in the Yamal LNG Carriers was primarily due to the deliveries of the Yamal LNG Joint Venture's first two ARC7 LNG carrier newbuildings, the
Eduard Toll
and
Rudolf Samoylovich
, in January 2018 and September 2018, respectively, partially offset by
ineffectiveness recognized on hedged-accounted interest rate swaps.
53
The
$8.5 million
increase
in equity income from Teekay LNG's 30%-owned investment in the Bahrain LNG Joint Venture was primarily due to unrealized gains on designated and non-designated derivative instruments recorded in earnings in 2018 compared to losses recorded in earnings in 2017 due to mark-to-market changes
and the sub-charter income earned on the
Bahrain Spirit
.
Teekay LNG – Conventional Tankers
As at
December 31, 2018
, Teekay LNG’s conventional tanker fleet included one Suezmax-class double-hulled conventional crude oil tanker which it leases under capital lease and one Handymax product tanker, which it owns. Two of Teekay LNG’s conventional tankers, the
African Spirit
and
European Spirit
, have been trading in the spot market since the termination of their respective fixed-rate charters in November 2017 and August 2017, respectively. The
African Spirit, European Spirit
and
Toledo Spirit
were sold in October 2018, December 2018 and January 2019, respectively. The number of calendar-ship-days for Teekay LNG’s conventional tankers decreased to
1,389
days in
2018
from
1,904
days in
2017
, primarily as a result of the sales of the
Asian Spirit, Teide Spirit
,
European Spirit
and
African Spirit
in March 2017, February 2018, October 2018 and December 2018, respectively. During 2018, the
European Spirit
was off-hire for 29 days for a scheduled dry docking and 17 days for repairs, and the
African Spirit
and
Alexander Spirit
had 15 days of unscheduled off-hire due to repairs, compared to 34 idle days for the
Asian Spirit
after its firm charter contract ended in January 2017 and two unscheduled off-hire days for the
African Spirit
for repairs during the same period in 2017. As a result, Teekay LNG's conventional tanker fleet utilization decreased to
95.6%
in
2018
compared to
98.1%
in
2017
.
Loss from vessel operations was
$21.3 million
during
2018
compared to
$40.0 million
in
2017
, primarily as a result of:
|
•
|
a decrease in loss of
$29.7 million
due to write-downs of the
Alexander Spirit, European Spirit
and
African Spirit
of
$20.9 million
for the year ended
December 31, 2018
, compared to write-downs of the
European Spirit, African Spirit, Teide Spirit, and Toledo Spirit
of
$50.6 million
for the year ended December 31, 2017;
|
partially offset by
|
•
|
an increase in loss of
$4.9 million
due to the
European Spirit
and
African Spirit
earning lower rates in the spot market and a scheduled dry docking and off-hire days for repairs for the
European Spirit
in 2018, partially offset by the cessation of depreciation since 2017 when the vessels were first classified as held for sale;
|
|
•
|
an increase in loss of
$4.9 million
due to
CEPSA’s sale of Teekay LNG's vessel related to a capital lease, the
Teide Spirit
, in February 2018, and seafarer severance costs upon its sale; and
|
|
•
|
an increase in loss of
$1.7 million
due to
lower revenues earned by the
Toledo Spirit
in 2018 related to the profit-loss-sharing agreement between Teekay LNG and CEPSA.
|
Teekay Tankers
Recent Developments in Teekay Tankers
During the fourth quarter of 2018, Teekay Tankers entered into time charter-in contracts for 2.5 Aframax vessel equivalents for periods ranging from one to two years with extension options. The new time charter-in contracts have a weighted average daily rate of $17,600.
In March 2018, Teekay Tankers entered into time charter-in contracts for two Aframax vessels, with average daily rates of approximately $11,900 and firm periods of 45 days to six months. The charter contract for one of the Aframax tankers included a 50/50 profit sharing component with the option to extend the contract for six months at an escalated rate. The charter contract for the other Aframax tanker had a maximum period of approximately four months and the vessel was used to support full service lightering operations. Teekay Tankers redelivered both Aframax
tankers back to their respective owners in June and September 2018. Teekay Tankers also redelivered one in-chartered Aframax tanker back to its owner in March 2018.
In July 2018, Teekay Tankers entered into a time charter-out contract for one Suezmax tanker, with a daily rate of $17,500 and a firm period of 12 months, with an option to extend the contract at an escalated rate. In January 2018, Teekay Tankers entered into a time charter-out contract for one Suezmax tanker, with a daily rate of $17,250 and a period of six to nine months, with an option to extend the contract to a year at an escalated rate.
During 2018, six time chartered-out Suezmax tankers, seven time chartered-out Aframax tankers and two time chartered-out LR2 product tankers were redelivered back to Teekay Tankers. All of these vessels were trading in the spot market as of December 31, 2018.
54
Operating Results – Teekay Tankers
The following table compares Teekay Tankers’ operating results, equity income and number of calendar-ship-days for its vessels for 2018 and 2017.
|
|
|
Year Ended December 31,
|
||||
|
(in thousands of U.S. dollars, except calendar-ship-days)
|
|
2018
|
|
2017
|
||
|
Revenues
(1)
|
|
755,763
|
|
431,178
|
|
|
|
Voyage expenses
(1)
|
|
(360,576
|
)
|
(77,368
|
)
|
|
|
Vessel operating expenses
|
|
(209,131
|
)
|
(175,389
|
)
|
|
|
Time-charter hire expense
|
|
(19,538
|
)
|
(30,661
|
)
|
|
|
Depreciation and amortization
|
|
(118,514
|
)
|
(100,481
|
)
|
|
|
General and administrative expenses
|
|
(39,775
|
)
|
(32,879
|
)
|
|
|
Loss on sale of vessels
|
|
170
|
|
(12,984
|
)
|
|
|
Restructuring charges
|
|
(1,195
|
)
|
—
|
|
|
|
Income from vessel operations
|
|
7,204
|
|
1,416
|
|
|
|
Equity income (loss)
|
|
1,220
|
|
(25,370
|
)
|
|
|
Calendar-Ship-Days
(2)
|
|
|||||
|
Conventional Tankers
|
|
21,226
|
|
16,654
|
|
|
|
(1)
|
The adoption of ASU 2014-09 had the impact of increasing both voyage charter revenues and voyage expenses for the year ended
December 31, 2018
by
$292.6 million
.
|
|
(2)
|
Calendar-ship-days presented relate to owned and in-chartered consolidated vessels.
|
Tanker Market
Tanker rates were at multi-year lows during the first half of 2018 as OPEC supply cuts took their toll on tanker demand. However, the market appeared to reach an inflection point in the middle of the year, as an increase in oil supply from both OPEC and non-OPEC sources, and a period of low fleet growth, allowed rates to recover.
Tanker spot rates improved significantly during the fourth quarter of 2018, spurred by both winter market seasonality and positive underlying supply / demand fundamentals. In the fourth quarter of 2018, OPEC crude oil production rose to 33.0 million barrels per day (
mb/d
), the highest level since July 2017 and up from 32.0 mb/d earlier in the year. Russian oil production reached a record high 11.5 mb/d by the end of the year, which was positive for mid-size tanker demand in the Mediterranean / Black Sea and Baltic Sea regions. Rising U.S. exports also supported tanker demand, with U.S. crude oil production reaching a record high 11.7 mb/d during the fourth quarter and crude oil exports reaching 2.5 mb/d. This was positive for both crude tanker demand, as well as lightering demand in the U.S. Gulf.
Tanker spot rates have weakened through the first quarter of 2019, which is typical for this time of year as refineries enter seasonal maintenance programs. OPEC supply cuts are also weighing on tanker demand, with OPEC (plus select non-OPEC partners) pledging to cut production by 1.2 mb/d starting in January 2019. Early data suggests that OPEC are achieving a high compliance with these cuts, which is negative for crude tanker demand in the near-term. We expect OPEC cuts to have a negative impact on tanker demand through the first half of the year, though the oil market is reasonably well balanced, and we believe that OPEC will increase production during the second half of the year when oil demand is expected to increase substantially versus first half levels.
The global tanker fleet grew by just 5.7 million deadweight tonnes (
mdwt
), or 1.0%, in 2018, which was the lowest level of tanker fleet growth since 2001. High tanker scrapping was the main driver of low fleet growth last year, with a total of 22.4 mdwt removed, representing the fifth highest scrapping year on record. Looking ahead, we expect an increase in tanker fleet growth during 2019 as a firmer freight rate environment is expected to lead to comparatively fewer vessels sold for scrap. We expect total tanker fleet growth of approximately 3.5% during 2019, with much of this growth weighted towards the first half of the year. We expect that this will further add to pressure on the tanker market during the early part of the year, though it paves the way for much lower fleet growth in the second half of 2019 and into 2020, when we forecast that the tanker fleet will grow by less than 2%.
Global oil demand remains firm, with the IEA forecasting growth of 1.4 mb/d growth in 2019. Furthermore, we expect that tanker demand will be boosted in 2019 by an increase in global refining capacity. According to the IEA, a total of 2.6 mb/d of new refining capacity will come online in 2019, which is the largest annual increase on record. This is expected to increase both crude and product tanker demand. We also expect that the new IMO 2020 regulations will be positive for tanker demand, as it may increase refinery throughput. The new regulations could also open up a number of new trade patterns and arbitrage opportunities for both crude and product, which would benefit overall tonne-mile demand. Finally, we believe that an increase in US crude exports during the second half of the year will contribute to both crude tanker demand and U.S. Gulf lightering demand. New pipeline capacity to the Gulf Coast is expected to result in increased U.S. crude exports from approximately 2.5 mb/d at present to approximately 4 mb/d by the end of the year.
In summary, we believe that OPEC supply cuts, high fleet growth, and the impact of seasonal refinery maintenance could decrease tanker demand through the first half of the year. However, we believe that demand during the second half of 2019 and 2020 will strengthen due to strong underlying oil demand, an increase in US crude oil exports, the return of OPEC supply, lower tanker fleet growth, and the positive impact of IMO 2020.
55
Teekay Tankers – Conventional Tankers
As at
December 31, 2018
, Teekay Tankers owned 42 double-hulled conventional oil tankers, had time-chartered in three Aframax tankers, had capital leases for 14 vessels from third parties and owned a 50% interest in one VLCC, the results of which are included in equity (loss) income.
Teekay Tankers' calendar ship days increased in 2018 compared to 2017 primarily due to
the addition of 18 vessels that Teekay Tankers acquired as part of the TIL merger in November 2017 and three Aframax in-charters that were delivered to Teekay Tankers during 2018, partially offset by
the redeliveries of various in-charters to their owners at various times during 2017 and 2018 and the sale of two Suezmax product tankers, and three Aframax tankers in 2017.
Income from vessel operations
increased to
$7.2 million
in
2018
compared to
$1.4 million
in
2017
, primarily as a result of:
|
•
|
an increase of $18.6 million primarily due to the addition of 18 vessels that Teekay Tankers acquired as part of the TIL merger in November 2017;
|
|
•
|
a net increase
of $16.9 million primarily due to
losses on sales of vessels recognized in 2017 and lower operating expenditures in 2018 related to those vessels, partially offset by revenues earned by those vessels in 2017;
|
|
•
|
a net increase of $3.9 million primarily due to Teekay Tankers' full service lightering (or
FSL
) operations as a result of higher realized FSL spot rates and changes in the utilization of dedicated FSL vessels;
|
|
•
|
an increase of $3.3 million due to the scope and timing of repairs and planned maintenance activities in 2018 as compared to 2017; and
|
|
•
|
an increase of $2.0 million due to the redeliveries of various in-chartered tankers to their owners at various times in 2017;
|
partially offset by
|
•
|
a net decrease of $20.9 million due to the expiration of time-charter out contracts for various vessels, which subsequently traded on spot voyages at lower average realized rates;
|
|
•
|
a decrease of $4.5 million primarily due to lower commissions and management fees earned during 2018 from the management of fewer external vessels;
|
|
•
|
a decrease of $3.8 million due to higher administrative, strategic management and other fees incurred during 2018, primarily relating to levels of corporate support;
|
|
•
|
a decrease of $3.8 million due to higher depreciation recognized related to dry-docking expenditures, which increased in 2018 as compared to 2017;
|
|
•
|
a decrease of $2.9 million due to higher corporate expenses incurred during 2018, primarily as a result of legal expenses related to management initiatives, partially offset by lower legal fees incurred related to the arbitration of STX Offshore & Shipbuilding Co. Ltd (or
STX
) of South Korea in 2018 as compared to 2017; and
|
|
•
|
a decrease of $2.7 million as a result of higher off-hire days in 2018, as compared to the prior year, primarily due an increase in the number of vessels that entered dry dock during the year.
|
Equity income (loss)
increased to income of $1.2 million in 2018 from a loss of $25.4 million in 2017 primarily due to:
|
•
|
a decrease in equity losses of $28.4 million primarily due to a $26.7 million net write-down of Teekay Tankers' investment in TIL to its fair market value in 2017 and lower equity losses in 2018, both resulting from the TIL merger;
|
partially offset by
|
•
|
a decrease in equity income of $1.9 million primarily resulting from lower earnings recognized in 2018 from the High-Q Investment Ltd. (or
High-Q
) joint venture due to the dry dock of its VLCC, which was completed in June 2018, and the expiry of the time-charter out contract for the VLCC, which subsequently traded on spot voyages at lower average realized rates.
|
56
Teekay Parent
Recent Developments in Teekay Parent
In March 2019, we announced that
Chair Emeritus and Director C. Sean Day and Directors Tore Sandvold and Peter S. Janson, are retiring from the Board, effective in June 2019
following our annual meeting of shareholders
. Mr. Day will remain as a Director of Teekay GP LLC (the general partner of Teekay LNG Partners L.P.). In addition, William P. Utt will be stepping down from his role as our Chair and Director and as a Director of Teekay GP LLC but will remain as Chair and Director of Teekay Offshore GP LLC (the general partner of Teekay Offshore Partners L.P.). The Board has selected current Teekay director, David Schellenberg, to take over as Teekay’s Chair from Mr. Utt in June 2019. The Board has appointed Kenneth Hvid, Teekay’s President and Chief Executive Officer, to fill the vacancy on the Board that will be created upon the retirement of Mr. Day. Peter Antturi has been nominated to stand for election at our annual meeting of shareholders in June 2019 to become a Director of Teekay.
The
Petrojarl Banff
FPSO unit has been operating on the Banff field since its delivery nearly 20 years ago under a charter contract with Canadian Natural Resources (or
CNR
) that permitted CNR to terminate the contact at any time with six months’ notice. In January 2017, Teekay Parent entered into a contract amendment with CNR to ensure the unit would stay on the current field at least until the third quarter of 2018 and to revise the charter rate structure to include a variable component (through an oil price and oil production tariff) in addition to a fixed charter rate. In July 2018, Teekay Parent secured a one-year contract extension with CNR to extend the employment of the
Petrojarl
Banff FPSO to August 2019.
The
Hummingbird Spirit
FPSO unit is on a charter contract with Spirit Energy Ltd (or
Spirit Energy
). In June 2016, Teekay Parent entered into a contract amendment with Spirit Energy to extend the firm period to September 2017 in exchange for a lower fixed charter rate and an oil price tariff. The contract amendment took effect on July 1, 2016. In the second quarter of 2017, Teekay Parent completed a contract extension with Spirit Energy for an additional three years from October 2017 to September 2020 at a higher fixed charter rate plus a variable component based on oil production and oil price.
In November 2018, Teekay Parent sold its 43.5% ownership interest in Magnora ASA (or
Magnora
, previously Sevan Marine ASA) for total consideration of approximately $27 million
and recognized a gain of
$15.3 million
, which is presented in equity income on the
consolidated statements of (loss) income
.
During 2018, the Company repurchased $84.1 million in aggregate principal amount of the 8.5% senior unsecured notes that mature in January 2020. During the first quarter of 2019, the Company repurchased $10.9 million in aggregate principal amount of its 8.5% senior unsecured notes. For more information, please read "Item 18 - Financial Statements: Note 8 - Long-term Debt."
In September 2017, Teekay Parent, Teekay Offshore and Brookfield finalized the
Brookfield Transaction
which resulted in our deconsolidation of Teekay Offshore and subsequently accounting for our investment in Teekay Offshore by the equity method, which is explained more fully in "Item 18 - Financial Statements: Note 4 - Deconsolidation of Teekay Offshore."
In July 2018, Brookfield exercised its option to acquire an additional 2% of ownership interests in Teekay Offshore's general partner from Teekay Parent in exchange for 1.0 million warrants, with each warrant exercisable for one of Teekay Offshore's common units. This resulted in a gain of $2.2 million reflected in equity income in the Other and Corporate G&A segment in the tables below.
Until December 31, 2017, Teekay Parent directly and indirectly provided substantially all of Teekay Offshore’s ship management, commercial, technical, strategic, business development and administrative service needs. On January 1, 2018, as a condition of the Brookfield Transaction, Teekay Offshore acquired,
at Teekay's carrying value, a 100% ownership interest in seven subsidiaries (or the
Transferred Subsidiaries
)
that had been devoted exclusively or nearly exclusively to providing such services to Teekay Offshore and its subsidiaries
.
The Transferred Subsidiaries provide ship management, commercial, technical, strategic, business development and administrative services to Teekay Offshore, primarily related to Teekay Offshore's FPSO units, shuttle tankers and FSO units. Subsequent to their transfer to Teekay Offshore, the Transferred Subsidiaries continue to provide ship management, commercial, technical, strategic, business development and administrative services to Teekay, primarily related to Teekay Parent's FPSO units. Commencing in the first quarter of 2018, Teekay Parent presented the fees paid by it to Teekay Offshore for services provided by Teekay Offshore in vessel operating expenses and general and administrative expenses. Teekay Parent and certain of its subsidiaries, other than the Transferred Subsidiaries, continue to provide certain other ship management, commercial, technical, strategic and administrative services to Teekay Offshore. Teekay Parent presented the fees received from Teekay Offshore for providing these services in revenues, and the related costs to provide such services in vessel operating expenses.
57
Operating Results – Teekay Parent
The following table compares Teekay Parent’s operating results,
equity income (loss)
and number of calendar-ship-days for its vessels for
2018
and
2017
.
|
|
Offshore
Production
|
Conventional
Tankers
|
Other and
Corporate G&A
|
Teekay Parent
Total
|
||||||||||||||||||||
|
(in thousands of U.S. dollars, except calendar-ship-days)
|
2018
|
2017
|
2018
|
2017
|
2018
|
2017
|
2018
|
2017
|
||||||||||||||||
|
Revenues
(1)
|
261,736
|
|
209,394
|
|
—
|
|
5,065
|
|
189,923
|
|
89,107
|
|
451,659
|
|
303,566
|
|
||||||||
|
Voyage expenses
|
(805
|
)
|
(186
|
)
|
—
|
|
(81
|
)
|
(37
|
)
|
(1,426
|
)
|
(842
|
)
|
(1,693
|
)
|
||||||||
|
Vessel operating expenses
|
(148,871
|
)
|
(144,325
|
)
|
—
|
|
(5,481
|
)
|
(162,054
|
)
|
(53,179
|
)
|
(310,925
|
)
|
(202,985
|
)
|
||||||||
|
Time-charter hire expense
|
(45,788
|
)
|
(38,346
|
)
|
—
|
|
(12,461
|
)
|
(22,880
|
)
|
(47,847
|
)
|
(68,668
|
)
|
(98,654
|
)
|
||||||||
|
Depreciation and amortization
|
(33,271
|
)
|
(60,560
|
)
|
—
|
|
—
|
|
(144
|
)
|
163
|
|
(33,415
|
)
|
(60,397
|
)
|
||||||||
|
General and administrative expenses
(2)
|
(10,043
|
)
|
(16,966
|
)
|
—
|
|
(432
|
)
|
(18,225
|
)
|
(5,251
|
)
|
(28,268
|
)
|
(22,649
|
)
|
||||||||
|
Write-down and loss on sales of vessels
|
—
|
|
(205,659
|
)
|
—
|
|
—
|
|
—
|
|
—
|
|
—
|
|
(205,659
|
)
|
||||||||
|
Restructuring charges
|
—
|
|
(110
|
)
|
—
|
|
—
|
|
(1,025
|
)
|
(1,844
|
)
|
(1,025
|
)
|
(1,954
|
)
|
||||||||
|
Income (loss) from vessel operations
|
22,958
|
|
(256,758
|
)
|
—
|
|
(13,390
|
)
|
(14,442
|
)
|
(20,277
|
)
|
8,516
|
|
(290,425
|
)
|
||||||||
|
Equity income (loss)
|
15,089
|
|
(7,861
|
)
|
(510
|
)
|
(20,677
|
)
|
(1,384
|
)
|
(2,792
|
)
|
13,195
|
|
(31,330
|
)
|
||||||||
|
Calendar-Ship-Days
(3)
|
||||||||||||||||||||||||
|
FPSO Units
|
1,095
|
|
1,095
|
|
—
|
|
—
|
|
—
|
|
—
|
|
1,095
|
|
1,095
|
|
||||||||
|
Conventional Tankers
|
—
|
|
—
|
|
—
|
|
587
|
|
—
|
|
—
|
|
—
|
|
587
|
|
||||||||
|
Gas carriers
|
—
|
|
—
|
|
—
|
|
—
|
|
185
|
|
730
|
|
185
|
|
730
|
|
||||||||
|
FSO Units
|
365
|
|
365
|
|
—
|
|
—
|
|
730
|
|
730
|
|
1,095
|
|
1,095
|
|
||||||||
|
Shuttle Tankers
|
730
|
|
730
|
|
—
|
|
—
|
|
—
|
|
—
|
|
730
|
|
730
|
|
||||||||
|
Bunker Barges
|
—
|
|
—
|
|
—
|
|
—
|
|
365
|
|
365
|
|
365
|
|
365
|
|
||||||||
|
(1)
|
Teekay manages vessels owned by its equity-accounted investments and third parties. Subsequent to the adoption of ASU 2014-09, costs incurred by Teekay for its seafarers are presented as vessel operating expenses and the reimbursement of such expenses is presented as revenue, instead of such amounts being presented on a net basis. This had the effect of increasing both revenues and vessel operating expenses in the Other and Corporate G&A segment for the year ended
December 31, 2018
by
$82.9 million
.
|
|
(2)
|
Includes direct general and administrative expenses and indirect general and administrative expenses allocated to offshore production, conventional tankers and other and corporate G&A based on estimated use of corporate resources.
|
|
(3)
|
Apart from three FPSO units in
2018
and
2017
, all remaining calendar-ship-days presented relate to in-chartered days.
|
Teekay Parent – Offshore Production
Offshore Production consists primarily of our FPSO units. As at
December 31, 2018
, we owned three FPSO units, and we in-chartered two shuttle tankers and one FSO unit from Teekay Offshore.
The charter contracts for the
Hummingbird Spirit
FPSO unit and the
Petrojarl Banff
FPSO unit include an incentive compensation component based on oil production and oil price. In addition, the
Petrojarl Foinaven
FPSO unit’s charter contract includes incentives based on total oil production for the year, certain operational measures, and the average annual oil price. As such, changes in oil prices impact Teekay Parent's incentive compensation under these contracts and may negatively impact its future revenues if oil prices fall below current levels.
Income (loss) from vessel operations increased to
$23.0 million
during
2018
compared to (
$256.8 million
) in
2017
, primarily as a result of:
|
•
|
an increase of
$205.7 million
due to the impairments of the
Petrojarl Banff
and
Petrojarl Foinaven
FPSO units in the third quarter of 2017, primarily due to
changes to the estimated cash flows and carrying values of the asset groups as a result of the deconsolidation of Teekay Offshore on September 25, 2017, and a re-evaluation of the estimated future net cash flows of the units;
|
|
•
|
an increase of
$28.0 million
for the year ended December 31, 2018 related to the
Petrojarl Banff
FPSO unit, primarily due to a higher day rate and tariff earned in 2018 due to the contract amendment in 2017 described above
under the heading “Recent Developments in Teekay Parent”,
and lower depreciation as an impairment charge was taken on the unit in the third quarter of 2017. This was partially offset by a decrease in production and an increase in planned maintenance costs;
|
|
•
|
an increase of
$26.3 million
for the year ended December 31, 2018 related to the
Petrojarl Foinaven
FPSO unit, primarily due to higher uptime and production in 2018 resulting in higher revenues, and lower depreciation as an impairment charge was taken on the unit in the third quarter of 2017. This was partially offset by a decrease in production and an increase in planned maintenance costs; and
|
|
•
|
an increase of
$17.7 million
for the year ended December 31, 2018 related to the
Hummingbird
Spirit
FPSO unit, primarily due to the contract amendment that took effect on October 1, 2017 along with higher production in the fourth quarter of 2018.
|
58
Teekay Parent – Conventional Tankers
As at
December 31, 2018
and December 31, 2017, Teekay Parent had no conventional tankers remaining in the fleet, as the last two chartered-in vessels were redelivered to their owners in the fourth quarter of 2017.
Teekay Parent – Other and Corporate G&A
As at
December 31, 2018
, Teekay Parent had two chartered-in FSO units owned by Teekay Offshore and one chartered-in bunker barge owned by a third party. Teekay Parent redelivered one in-chartered LNG carrier to Teekay LNG early in March 2018 and its other in-chartered LNG carrier was redelivered to Teekay LNG in May 2018.
Loss from vessel operations was
$14.4 million
for the year ended
December 31, 2018
compared to loss from vessel operations of
$20.3 million
for the year ended
December 31, 2017
, primarily due to the redelivery of the two in-chartered LNG carriers to Teekay LNG in 2018.
Teekay Parent – Equity Income (Loss)
Equity income was
$13.2 million
for the year ended
December 31, 2018
, compared to equity loss of
$31.3 million
for the year ended
December 31, 2017
. The decrease in the equity loss for the year ended December 31, 2018, was primarily due to the sale of Teekay's 43.5% ownership interest in Magnora in November 2018 and a write-down of Teekay Parent's investment in Tanker Investments Ltd. (or
TIL
) to its fair market value in 2017, and lower equity losses in 2018 subsequent to the TIL merger in November 2017.
Equity-Accounted Investment in Teekay Offshore
Recent Developments in Teekay Offshore
Following the Brookfield Transaction on September 25, 2017, Teekay deconsolidated Teekay Offshore. Teekay currently has significant influence over Teekay Offshore and accounts for its investment in Teekay Offshore using the equity method. As of December 31, 2018, Teekay owned a 13.8% interest in the common units of Teekay Offshore
.
In January 2019, Teekay Offshore reduced the quarterly common unit cash distributions to $nil, from $0.01 per common unit in previous quarters, in order to reinvest additional cash in the business and further strengthen its balance sheet. There are no changes to the quarterly cash distributions relating to any of Teekay Offshore's outstanding preferred units.
In January 2019, Teekay Offshore secured a three-year contract extension with Petrobras to extend the employment of the
Piranema Spirit
FPSO unit on its Brazilian field. The contract extension commenced in February 2019 and includes customer termination rights with 10 months' notice.
In October 2018, Teekay Offshore entered into a settlement agreement with Petróleo Brasileiro S.A. and Petroleo Netherlands B.V. - PNBV S.A. (or
Petrobras
) with respect to various disputes relating to the previously-terminated charter contracts of the
HiLoad DP
unit and
Arendal Spirit
UMS. As part of the settlement agreement, Petrobras has agreed to pay a total amount of $96.0 million to Teekay Offshore, $55.0 million of which was received in the fourth quarter of 2018. The remaining $41.0 million is to be paid in two separate installments of $22.0 million and $19.0 million by the end of 2020 and 2021, respectively, subject to certain potential offsets described below.
If in the ordinary course of business and prior to the end of 2021, new charter contracts are entered into with Petrobras in respect of the
Arendal Spirit
UMS,
Cidade de Rio das Ostras
(or
Rio das Ostras
) FPSO unit and
Piranema Spirit
FPSO unit, the deferred installments of $41.0 million will be partly reduced by revenue received from such new contracts in this same period (or the
Offset Amounts
). The recent three-year contract extension with Petrobras for the
Piranema Spirit
FPSO unit is not expected to result in Offset Amounts being generated.
In addition, in October 2018, Teekay Offshore entered into a further settlement agreement with Petrobras with regards to a dispute relating to the charter of the
Piranema Spirit
FPSO unit. Pursuant to the settlement agreement, Teekay Offshore agreed to a reduction in charter rate for the FPSO unit totaling approximately $11.0 million, which was credited to Petrobras in the fourth quarter of 2018. This amount was accrued in Teekay Offshore's financial statements in prior periods, primarily in 2016 and 2017.
In October 2018, Teekay Offshore entered into a conditional agreement with Alpha Petroleum Resources Limited (or
Alpha
) for the
Petrojarl Varg
FPSO unit for Alpha's development of the Cheviot oil field on the UK continental shelf. The FPSO contract is for a seven-year fixed term from first oil, which was originally expected to occur during the second quarter of 2021 and is now delayed, and which would follow completion of a life extension and upgrade phase for the
Petrojarl Varg
FPSO unit at Sembcorp Marine’s shipyard in Singapore. It is intended that the
Petrojarl Varg
FPSO unit would be used for the entire expected life of the Cheviot field.
The effectiveness of the agreement remains subject to satisfaction of a number of conditions precedent, including (i) initial funding from Alpha to cover life extension and upgrade costs of the
Petrojarl Varg
FPSO unit, which is conditional on Alpha finalizing its project financing, and (ii) approval by relevant governmental authorities of Alpha’s final field development plan for the Cheviot field. Teekay Offshore understands that Alpha continues to seek required funding for the project, the commencement of which will be delayed pending satisfaction of the conditions precedent. There is no assurance that the conditions will be satisfied.
59
In July 2018, Teekay Offshore entered into a contract with Petrobras to extend the employment of the
Rio das Ostras
FPSO unit for four months until November 2018, with an option to extend to January 2019. In December 2018, Teekay Offshore entered into a further contract extension for two months until March 2019.
In May 2018, the
Petrojarl I
FPSO unit successfully achieved first oil and commenced its five-year charter contract with a consortium led by Queiroz Galvão Exploração e Produção SA (or
QGEP
) on the Atlanta oil field in offshore Brazil. The
Petrojarl I
FPSO unit operates under a charter rate profile with a lower day rate during the first 18 months of production. During the final three and a half years of the contract, the charter contract will increase to a higher day rate. The charter contract also contains an oil price and oil production tariff.
In April 2018, Teekay Offshore signed a contract with Premier Oil to extend the employment of the
Voyageur Spirit
FPSO unit on the Huntington field for an additional 12 months to April 2019. The new contract, which took effect in April 2018, includes a lower fixed charter rate component and an upside component based on oil production and oil price.
In July 2018, Teekay Offshore entered into an additional contract with Premier Oil to extend the employment of the
Voyageur Spirit
FPSO unit on the Huntington field for an additional 12 months to April 2020. Compared to the current extension, the new one-year extension, which takes effect in April 2019, maintains the same fixed charter rate and oil production tariff elements, but provides additional potential upside from a formula based on oil price, regardless of production performance.
Operating Results – Teekay Offshore
The following table summarizes Teekay Offshore’s operating results, equity income and number of calendar-ship-days for its vessels for the period up to September 25, 2017.
|
|
Teekay Offshore
Total |
||||
|
(in thousands of U.S. dollars, except calendar-ship-days)
|
2018
|
2017
|
|||
|
Revenues
|
—
|
|
796,711
|
|
|
|
Voyage expenses
|
—
|
|
(68,802
|
)
|
|
|
Vessel operating expenses
|
—
|
|
(249,805
|
)
|
|
|
Time-charter hire expense
|
—
|
|
(60,592
|
)
|
|
|
Depreciation and amortization
|
—
|
|
(219,406
|
)
|
|
|
General and administrative expenses
|
—
|
|
(46,399
|
)
|
|
|
Asset impairments and net gain on sale of vessels
|
—
|
|
(1,500
|
)
|
|
|
Restructuring charges
|
—
|
|
(3,147
|
)
|
|
|
Income from vessel operations
|
—
|
|
147,060
|
|
|
|
Equity income
(1)
|
—
|
|
12,028
|
|
|
|
Calendar-Ship-Days
(2)
|
|||||
|
FPSO Units
|
—
|
|
1,602
|
|
|
|
Shuttle Tankers
|
—
|
|
8,378
|
|
|
|
FSO Units
|
—
|
|
1,869
|
|
|
|
UMS
|
—
|
|
267
|
|
|
|
Towage vessels
|
—
|
|
2,018
|
|
|
|
Conventional Tankers
|
—
|
|
534
|
|
|
|
(1)
|
This amount represents equity income from Teekay Offshore's equity interests in OOG-TK Libra GmbH & Co KG and OOG-TKP FPSO GmbH & Co KG.
|
|
(2)
|
Calendar-ship-days presented relate to owned and in-chartered consolidated vessels.
|
Income from vessel operations for Teekay Offshore decreased to $
nil
for the year ended
December 31, 2018
compared to
$147.1 million
for the year ended
December 31, 2017
, as a result of our deconsolidation of Teekay Offshore on September 25, 2017.
We recognized
equity losses
from Teekay Offshore of
$6.9 million
for the year ended
December 31, 2018
, and
$2.5 million
during the period between September 26 to
December 31, 2017
. The equity loss includes our proportionate share of write-downs of two of Teekay Offshore's FPSO units totaling
$9.4 million
and gains on Teekay Offshore's settlement with Petrobras in relation to the previously-terminated charter contracts of the
HiLoad DP
unit and
Arendal Spirit
UMS of
$12.9 million
for the year ended
December 31, 2018
.
60
Other Consolidated Operating Results
The following table compares our other consolidated operating results for
2018
and
2017
:
|
|
Year Ended December 31,
|
|||||
|
(in thousands of U.S. dollars, except percentages)
|
2018
|
2017
|
||||
|
Interest expense
|
(254,126
|
)
|
(268,400
|
)
|
||
|
Interest income
|
8,525
|
|
6,290
|
|
||
|
Realized and unrealized losses on non-designated derivative instruments
|
(14,852
|
)
|
(38,854
|
)
|
||
|
Foreign exchange gain (loss)
|
6,140
|
|
(26,463
|
)
|
||
|
Loss on deconsolidation of Teekay Offshore
|
(7,070
|
)
|
(104,788
|
)
|
||
|
Other loss
|
(2,013
|
)
|
(53,981
|
)
|
||
|
Income tax expense
|
(19,724
|
)
|
(12,232
|
)
|
||
Interest expense.
Interest expense
decreased
to
$254.1 million
in
2018
, compared to
$268.4 million
in
2017
, primarily due to:
|
•
|
a decrease of $88.5 million
as a result of the deconsolidation of Teekay Offshore on September 25, 2017
(please read "Item 18 - Financial Statements:
Note 4 — Deconsolidation of Teekay Offshore
"); and
|
|
•
|
a decrease of $7.3 million due to the repayment of Teekay Parent's revolving credit facilities;
|
partially offset by
|
•
|
an increase $37.1 million primarily relating to interest incurred on the obligations related to capital leases for the
Torben Spirit
,
Murex
,
Macoma
,
Magdala
,
Myrina
,
Megara
, and
Bahrain Spirit
upon their deliveries;
|
|
•
|
an increase of $27.4 million primarily due to the debt facilities assumed and refinanced as a result of the merger with TIL in November 2017, the additional interest expense incurred relating to the sale and leaseback of eight Aframax tankers, five Suezmax tankers and one LR2 product tanker during 2018, and an increase in average variable interest rates related to Teekay Tankers' debt facilities; partially offset by a lower average balance on one of Teekay Tankers' corporate revolving credit facilities due to the scheduled repayments and prepayments made on the facility in connection with the sales of three Aframax tankers and two Suezmax tankers in 2017.
|
|
•
|
an increase of $8.5 million
as a result of interest incurred on the new 5% Convertible Senior Notes issued by Teekay Parent in January 2018, partially offset by a decrease in interest expense due to the repurchase of the 8.5% senior notes (please read "Item 18 - Financial Statements:
Note 8 — Long-Term Debt
");
|
|
•
|
an increase of $7.6 million in interest incurred by Teekay LNG as a result of higher LIBOR rates, net of principal debt repayments, as compared to the same periods of the prior year; and
|
|
•
|
an increase of $3.7 million due to decreases in capitalized interest relating to advances and capital contributions to the Yamal LNG Joint Venture for newbuilding installments and capitalized interest relating to newbuilding installments for the
Sean Spirit
and
Yamal Spirit
.
|
61
Realized and unrealized (losses) gains on non-designated derivative instruments
.
Realized and unrealized (losses) gains related to derivative instruments that are not designated as hedges for accounting purposes are included as a separate line item in the
consolidated statements of (loss) income
. Net realized and unrealized losses on non-designated derivatives were
$14.9 million
for
2018
, compared to
$38.9 million
for
2017
, as detailed in the table below:
|
Year Ended
December 31, 2018 $ |
Year Ended
December 31, 2017 $ |
||||
|
Realized (losses) gains relating to:
|
|||||
|
Interest rate swap agreements
|
(13,898
|
)
|
(53,921
|
)
|
|
|
Interest rate swap agreement terminations
|
(13,681
|
)
|
(610
|
)
|
|
|
Foreign currency forward contracts
|
—
|
|
667
|
|
|
|
Time charter swap agreement
|
—
|
|
1,106
|
|
|
|
Forward freight agreements
|
137
|
|
270
|
|
|
|
(27,442
|
)
|
(52,488
|
)
|
||
|
Unrealized gains (losses) relating to:
|
|||||
|
Interest rate swap agreements
|
33,700
|
|
17,005
|
|
|
|
Foreign currency forward contracts
|
—
|
|
3,925
|
|
|
|
Stock purchase warrants
|
(21,053
|
)
|
(6,421
|
)
|
|
|
Time charter swap agreement
|
—
|
|
(875
|
)
|
|
|
Forward freight agreements
|
(57
|
)
|
—
|
|
|
|
12,590
|
|
13,634
|
|
||
|
Total realized and unrealized losses on derivative instruments
|
(14,852
|
)
|
(38,854
|
)
|
|
The realized losses relate to amounts we actually realized for settlements related to these derivative instruments in normal course and amounts paid to terminate interest rate swap agreement terminations.
During
2018
and
2017
, we had interest rate swap agreements with aggregate average net outstanding notional amounts of approximately
$1.3 billion
and
$2.6 billion
, respectively, with average fixed rates of approximately
2.9%
and
3.1%
, respectively.
The decrease in the notional amounts is mainly due to the deconsolidation of Teekay Offshore, which had interest rate swaps with aggregate average notional amount of
$1.8 billion
during the period up to September 25, 2017.
Short-term variable benchmark interest rates during these periods were generally less than 2.0% and, as such, we incurred realized losses of
$13.9 million
and
$53.9 million
during
2018
and
2017
, respectively, under the interest rate swap agreements. We also incurred realized losses of
$13.7 million
during
2018
, compared to realized losses of
$0.6 million
during
2017
, from the termination of interest rate swaps.
We did not recognize any realized gains or realized losses under foreign currency contracts in
2018
, compared to realized gains of
$0.7 million
in
2017
.
We did not recognize a realized gain or realized loss on a time charter swap agreement in
2018
compared to a realized gain of
$1.1 million
in
2017
. The time-charter swap agreement ended on April 30, 2017.
Primarily as a result of significant changes in long-term benchmark interest rates during
2018
and
2017
, we recognized unrealized
gains
of
$33.7 million
for
2018
compared to
$17.0 million
for
2017
under the interest rate swap agreements. We did not recognize any unrealized gains or losses under foreign currency contracts in
2018
compared to unrealized gains
$3.9 million
in
2017
.
As at
December 31, 2018
, Teekay held
15.5 million
Brookfield Transaction Warrants. Please read “Item 18 - Financial Statements:
Note 4 — Deconsolidation of Teekay Offshore
". The fair value of the Brookfield Transaction Warrants was
$11.8 million
as at
December 31, 2018
. We recognized unrealized losses of
$20.0 million
on these warrants in
2018
compared to
$5.2 million
in
2017
.
Please read “Item 18 Financial Statements:
Note 15 — Derivative Instruments and Hedging Activities
.”
As of
December 31, 2018
, Teekay held
1,755,000
Teekay Offshore stock purchase warrants with an exercise price of $4.55, which have a seven-year term and are exercisable any time after six months following their issuance date. The fair value of these warrants was
$0.2 million
as at
December 31, 2018
.
We recognized unrealized losses of
$1.1 million
on these warrants in
2018
compared to
$0.6 million
in
2017
.
Please read “Item 18 - Financial Statements:
Note 15 — Derivative Instruments and Hedging Activities
.”
In January 2014, we and Teekay Tankers received TIL stock purchase warrants, which entitled us and Teekay Tankers to purchase up to 1.5 million shares of common stock of TIL at a fixed price of $10 per share. On May 31, 2017, TIL entered into a definitive agreement to merge with Teekay Tankers (Please read “Item 18 - Financial Statements:
Note 22 — Equity-accounted Investments
”). Following the completion of the merger, TIL became a wholly-owned subsidiary of Teekay Tankers, and as a result, the stock purchase warrants are valued at $nil at
December 31, 2018
and December 31, 2017. We recognized $nil and
$0.6 million
of unrealized losses on the stock purchase warrants, respectively, during
2018
and
2017
. Please read “Item 18 - Financial Statements:
Note 15 — Derivative Instruments and Hedging Activities
.”
62
Foreign Exchange Loss.
Foreign currency exchange gains were
$6.1 million
in
2018
compared to losses of
$26.5 million
in
2017
. Our foreign currency exchange gains, substantially all of which are unrealized, are primarily due to the relevant period-end revaluation of our Norwegian-Kroner (or
NOK
)-denominated debt and our Euro-denominated term loans, capital leases and restricted cash for financial reporting purposes and the realized and unrealized (losses) gains on our cross currency swaps. Gains on NOK-denominated and Euro-denominated monetary liabilities reflect a stronger U.S. Dollar against the NOK and Euro on the date of revaluation or settlement compared to the rate in effect at the beginning of the period. Losses on NOK-denominated and Euro-denominated monetary liabilities reflect a weaker U.S. Dollar against the NOK and Euro on the date of revaluation or settlement compared to the rate in effect at the beginning of the period. For
2018
, foreign currency exchange
gain
included realized
losses
of
$6.5 million
(
2017
–
$18.5 million
) and unrealized
gains
of
$21.2 million
(
2017
–
$82.7 million
) on our cross currency swaps, realized
losses
on maturity and termination of NOK bonds of
$42.3 million
(
2017
–
$25.7 million
) offset by the unrealized gains of
$19.2 million
(
2017
– losses of
$23.3 million
) on the revaluation of our NOK-denominated debt.
Loss on deconsolidation of Teekay Offshore.
Loss on deconsolidation of Teekay Offshore was
$7.1 million
in
2018
(
2017
–
$104.8 million
). Please read "Item 18 - Financial Statements:
Note 4 — Deconsolidation of Teekay Offshore
."
Other loss.
Other loss was
$2.0 million
in
2018
compared to
$54.0 million
in
2017
. Other loss in 2018 includes
$1.8 million
related to repurchases of t
he Company’s 8.5% senior unsecured notes and
$0.6 million
related to the
tax indemnification guarantee liability related to the Teekay Nakilat capital lease
.
Other loss in 2017 includes a $50.0 million increase in the tax indemnification guarantee liability related to the Teekay Nakilat capital lease, $4.5 million related to a settlement agreement entered into between CeFront Technology AS and certain subsidiaries of Teekay Offshore, partially offset by a gain on sale of a cost-accounted investment.
Income Tax Expense.
Income tax expense
was
$19.7 million
in
2018
compared to
$12.2 million
in
2017
.
This
increase
in income tax expense was primarily due to increases in freight tax accruals in 2018.
Year Ended
December 31, 2017
versus Year Ended
December 31, 2016
Teekay LNG
Operating Results – Teekay LNG
The following table compares Teekay LNG’s operating results, equity income and number of calendar-ship-days for its vessels for
2017
and
2016
.
|
|
Liquefied Gas
Carriers
|
Conventional
Tankers
|
Teekay LNG
Total
|
|||||||||||||||
|
(in thousands of U.S. dollars, except calendar-ship-days)
|
2017
|
2016
|
2017
|
2016
|
2017
|
2016
|
||||||||||||
|
Revenues
|
385,683
|
|
336,530
|
|
46,993
|
|
59,914
|
|
432,676
|
|
396,444
|
|
||||||
|
Voyage expenses
|
(3,020
|
)
|
(449
|
)
|
(5,182
|
)
|
(1,207
|
)
|
(8,202
|
)
|
(1,656
|
)
|
||||||
|
Vessel operating expenses
|
(84,928
|
)
|
(66,087
|
)
|
(18,211
|
)
|
(22,503
|
)
|
(103,139
|
)
|
(88,590
|
)
|
||||||
|
Depreciation and amortization
|
(95,025
|
)
|
(80,084
|
)
|
(10,520
|
)
|
(15,458
|
)
|
(105,545
|
)
|
(95,542
|
)
|
||||||
|
General and administrative expenses
(1)
|
(14,034
|
)
|
(15,310
|
)
|
(2,507
|
)
|
(3,189
|
)
|
(16,541
|
)
|
(18,499
|
)
|
||||||
|
Write-down and loss on sale of vessels
|
—
|
|
—
|
|
(50,600
|
)
|
(38,976
|
)
|
(50,600
|
)
|
(38,976
|
)
|
||||||
|
Income (loss) from vessel operations
|
188,676
|
|
174,600
|
|
(40,027
|
)
|
(21,419
|
)
|
148,649
|
|
153,181
|
|
||||||
|
Equity income
|
9,789
|
|
62,307
|
|
—
|
|
—
|
|
9,789
|
|
62,307
|
|
||||||
|
Calendar-Ship-Days
(2)
|
||||||||||||||||||
|
Liquefied Gas Carriers
|
8,357
|
|
7,440
|
|
—
|
|
—
|
|
8,357
|
|
7,440
|
|
||||||
|
Conventional Tankers
|
—
|
|
—
|
|
1,904
|
|
2,439
|
|
1,904
|
|
2,439
|
|
||||||
|
(1)
|
Includes direct general and administrative expenses and indirect general and administrative expenses allocated to the liquefied gas carriers and conventional tankers based on estimated use of corporate resources.
|
|
(2)
|
Calendar-ship-days presented relate to consolidated vessels only and excludes equity-accounted vessels.
|
Teekay LNG – Liquefied Gas Carriers
As at
December 31, 2017
,
Teekay LNG’s liquefied gas fleet, including newbuildings, included 50 LNG carriers and 30 LPG/Multigas carriers, in which its interests ranged from 20% to 100%. The number of calendar-ship-days for Teekay LNG’s liquefied gas carriers consolidated in its financial results increased to 8,357 days in 2017 from 7,440 days in 2016, as a result of the deliveries to Teekay LNG of the
Creole Spirit
and
Oak Spirit
during 2016 and the deliveries of the
Torben Spirit
,
Macoma
, and
Murex
during 2017. During 2017, three of Teekay LNG's consolidated vessels in this segment were off-hire for scheduled dry dockings, and the
Torben Spirit
was idle for three days prior to its charter contract commencement, compared to three consolidated vessels in this segment being off-hire for repairs, and the
Creole Spirit
and
Oak Spirit
being idle for 12 days and 15 days, respectively, prior to their charter contract commencements in 2016. As a result, Teekay LNG's liquefied gas fleet utilization decreased to 98.6% in 2017, compared to 99.1% in 2016.
63
Income from vessel operations increased to $188.7 million in
2017
compared to $174.6 million in
2016
, primarily as a result of:
|
•
|
an
increase of $26.6 million as a result of the deliveries of the
Creole Spirit
,
Oak Spirit
,
Torben Spirit
,
Macoma
, and
Murex
and the commencement of their charter contracts; and
|
|
•
|
an
increase of $6.9 million primarily related to additional revenue recognized relating to the accelerated dry docking of two LNG carriers and higher pass-through operating expenses due to timing of main engine maintenance;
|
partially offset by
|
•
|
a
decrease of $4.8 million due to uncertainty of collection of hire receipts relating to Teekay LNG's six LPG carriers on charter to Skaugen in 2017;
|
|
•
|
a
decrease of $4.1 million due to higher dry-docking amortization due to recent dry dockings;
|
|
•
|
a
decrease of $3.0 million for two of Teekay LNG's LNG carriers as a result of timing of main engine maintenance;
|
|
•
|
a
decrease of $2.4 million relating to 35 days of unscheduled off-hire in the second quarter of 2017 due to repairs required for one of Teekay LNG's LNG carriers; and
|
|
•
|
a
decrease of $2.3 million as a result of the acquisition of the
Sonoma Spirit
in April 2017 and due to the redelivery of six LPG carriers from Skaugen during 2017, which were previously on bareboat charter contracts.
|
Equity income related to Teekay LNG’s liquefied gas carriers decreased to $9.8 million in
2017
compared to $62.3 million in
2016
, as set forth in the table below:
|
(in thousands of U.S. Dollars)
|
Year Ended December 31,
|
|||||||||||||||
|
|
Angola
LNG Carriers |
Exmar
LNG Carriers |
Exmar
LPG Carriers |
MALT
LNG Carriers |
RasGas 3
LNG Carriers |
Pan Union LNG Carriers
|
Other
|
Total
Equity Income |
||||||||
|
2017
|
16,755
|
|
7,397
|
|
(7,863
|
)
|
(16,547
|
)
|
16,324
|
|
496
|
|
(6,773
|
)
|
9,789
|
|
|
2016
|
15,713
|
|
9,038
|
|
13,674
|
|
4,503
|
|
19,817
|
|
(104
|
)
|
(334
|
)
|
62,307
|
|
|
Difference
|
1,042
|
|
(1,641
|
)
|
(21,537
|
)
|
(21,050
|
)
|
(3,493
|
)
|
600
|
|
(6,439
|
)
|
(52,518
|
)
|
The $1.0 million increase in Teekay LNG's 33% investment in the four Angola LNG Carriers was primarily due to an increase in unrealized gains on non-designated derivative instruments due to mark-to-market changes. The mark-to-market changes resulted from changes in long-term LIBOR benchmark interest rates for interest rate swaps compared to 2016.
The $1.6 million decrease in Teekay LNG's 50% investment in the Exmar LNG Carriers was primarily due to the Excalibur being off-hire in 2017 for a scheduled dry docking.
The $21.5 million decrease in equity income from Teekay LNG's 50% ownership interest in Exmar LPG BVBA was primarily due to more vessels trading in the spot market at lower rates during 2017 compared to higher fixed rates earned in 2016, the scheduled dry dockings of the
Eupen
and
Brussels
in the second and third quarters of 2017, respectively, the write-downs of the
Courcheville
and
Temse
recorded in 2017, and the sale of the
Brugge Venture
in January 2017. These decreases were partially offset by income earned from five LPG carrier newbuildings that were delivered to the Exmar LPG Joint Venture between February 2016 and July 2017, and a write-down of the
Brugge Venture
recorded in 2016.
The $21.1 million decrease in equity income from Teekay LNG's 52% investment in the MALT LNG Carriers was primarily due to a settlement payment awarded to the joint venture in 2016 for the disputed contract termination relating to the
Magellan Spirit
, of which Teekay LNG's proportionate share was $20.3 million; a further deferral effective August 2016 of a portion of the charter payments for the
Marib Spirit
and
Arwa Spirit
that are chartered to service the YLNG plant in Yemen, which has been closed since 2015. These decreases were partially offset by higher fleet utilization in the second half of 2017 due to commencements of short-term charter contracts for certain vessels which were previously trading in the spot market.
The $3.5 million decrease in equity income from Teekay LNG's 40% investment in the RasGas 3 LNG Carriers was primarily due to higher interest expense resulting from the completion of debt refinancing in December 2016.
The $6.4 million decrease in Teekay LNG's other equity-accounted investments was primarily due to unrealized losses on interest rate swaps relating to Teekay LNG's 30% ownership interest in the Bahrain LNG Joint Venture in 2017, and higher crew training expenses for the Yamal LNG Joint Venture in preparation for its vessel deliveries commencing in 2018.
64
Teekay LNG – Conventional Tankers
As at
December 31, 2017
, Teekay LNG’s conventional tanker fleet included four Suezmax-class double-hulled conventional crude oil tankers and one Handymax product tanker, three of which it owned (including the
European Spirit
and
African Spirit
, which were classified as held for sale as at December 31, 2017) and two of which it leased under capital leases. Three of Teekay LNG’s five conventional tankers operated under fixed-rate charters. The
European Spirit
and
African Spirit
were trading in the spot market since August and November 2017, respectively, as Teekay LNG continued to market these vessels for sale. These vessels were subsequently sold during 2018. The number of calendar-ship-days for Teekay LNG’s conventional tankers decreased to 1,904 days in 2017 from 2,439 days in 2016, primarily as a result of the sales of the
Bermuda Spirit
,
Hamilton Spirit
and
Asian Spirit
in April 2016, May 2016 and March 2017, respectively. During 2017, the
Asian Spirit
was idle for 34 days between the time its firm charter contract ended in January 2017 and the time the vessel was sold and the
European Spirit
was off-hire for two days for vessel maintenance, compared to no off-hire days during 2016. As a result, Teekay LNG's conventional tanker fleet utilization decreased to 98.1% in 2017 compared to 100.0% in 2016.
Loss from vessel operations was $40.0 million during
2017
compared to $21.4 million in
2016
, primarily as a result of:
|
•
|
a decrease
of $25.5 million due to the combined write-downs of the
Teide Spirit
and
Toledo Spirit
. In August 2017, the charterer of the
Teide Spirit
gave formal notification to Teekay LNG of its intention to terminate its charter contract subject to certain conditions being met and third-party approvals being received. In February 2018, the charterer sold the
Teide Spirit
and concurrently terminated its existing charter contract with Teekay LNG. The charterer’s cancellation option for the
Toledo Spirit
was first exercisable in August 2018.
I
n May 2018, the charterer of the
Toledo Spirit
gave formal notification to Teekay LNG of its intention to terminate its charter contract subject to certain conditions being met and the receipt of certain third-party approvals.
Given Teekay LNG's prior experience with this charterer, Teekay LNG expected it would also cancel the charter contract and sell the
Toledo Spirit
to a third party in 2018.
In January 2019, the charterer of the
Toledo Spirit
cancelled the contract and sold the vessel;
|
|
•
|
a
decrease of $12.6 million due to the write-down of the
European Spirit
as Teekay LNG commenced marketing the vessel for sale upon receiving notification from the charterer of the vessel that it would redeliver the vessel to Teekay LNG upon completion of its charter contract in August 2017;
|
|
•
|
a
decrease of $12.5 million due to the write-down of the
African Spirit
as Teekay LNG received notification from the charterer of the vessel in August 2017 that it would redeliver the vessel to Teekay LNG upon completion of its charter contract in November 2017; and
|
|
•
|
a
decrease of $1.3 million due to lower revenues earned by the
Toledo Spirit
in 2017 relating to the profit-sharing agreement between Teekay LNG and CEPSA;
|
partially offset by
|
•
|
an
increase of $32.4 million due to the sales of the
Bermuda Spirit
and
Hamilton Spirit
in 2016 and
Asian Spirit
in the first quarter of 2017, comprised of a $39.0 million loss on the sales of the vessels in 2016, partially offset by a resulting decrease in operating income in 2017.
|
Teekay Tankers
Operating Results – Teekay Tankers
The following table compares Teekay Tankers’ operating results, equity income and number of calendar-ship-days for its vessels for
2017
and
2016
.
|
|
Year Ended December 31,
|
|||||
|
(in thousands of U.S. dollars, except calendar-ship-days)
|
2017
|
2016
|
||||
|
Revenues
|
431,178
|
|
550,543
|
|
||
|
Voyage expenses
|
(77,368
|
)
|
(53,604
|
)
|
||
|
Vessel operating expenses
|
(175,389
|
)
|
(182,598
|
)
|
||
|
Time-charter hire expense
|
(30,661
|
)
|
(59,647
|
)
|
||
|
Depreciation and amortization
|
(100,481
|
)
|
(104,149
|
)
|
||
|
General and administrative expenses
|
(32,879
|
)
|
(33,199
|
)
|
||
|
Loss on sale of vessels
|
(12,984
|
)
|
(20,594
|
)
|
||
|
Income from vessel operations
|
1,416
|
|
96,752
|
|
||
|
Equity (loss) income
|
(25,370
|
)
|
7,680
|
|
||
|
Calendar-Ship-Days
(1)
|
||||||
|
Conventional Tankers
|
16,654
|
|
19,303
|
|
||
|
(1)
|
Calendar-ship-days presented relate to owned and in-chartered consolidated vessels.
|
65
Teekay Tankers – Conventional Tankers
As
at December 31, 2017, Teekay Tankers owned 52 double-hulled conventional oil tankers, time-chartered in one Aframax tanker, had capital leases for four Suezmax tankers from third parties and owned a 50% interest in one VLCC, the results of which were included in equity (loss) income.
Teekay
Tankers' calendar ship days decreased in 2017 compared to 2016 primarily due to the redeliveries of various in-charters to their owners at various times during 2016 and 2017 and the sale of two Suezmax product tankers, three Aframax tankers and two MR product tankers in 2016 and 2017, partially offset by the addition of 18 vessels that Teekay Tankers acquired as part of the TIL merger in November 2017 and three Aframax in-charters that were delivered to Teekay Tankers during 2016 and 2017.
Income from vessel operations
decreased to
$1.4 million
in
2017
compared to
$96.8 million
in
2016
, primarily as a result of:
|
•
|
a
decrease of $66.5 million due to lower average realized rates earned by the Suezmax, Aframax and LR2 tankers trading in the spot tanker market in 2017 compared to 2016;
|
|
•
|
a
net decrease of $27.9 million due to the expiry of time-charter out contracts for various vessels, which subsequently traded on spot voyages at lower average realized rates and more vessels transitioned from voyage charter to full service lightering employment in 2017 compared to 2016;
|
|
•
|
a
net decrease of $7.2 million primarily due to the redeliveries of various in-charters to their owners at various times during 2016 and 2017 and the sale of two Suezmax product tankers, three Aframax tankers and two MR product tankers in 2016 and 2017, partially offset by the addition of 18 vessels that Teekay Tankers acquired as part of the TIL merger and three Aframax in-charters that were delivered to Teekay Tankers during 2016 and 2017; and
|
|
•
|
a
decrease of $1.2 million due to in-process revenue contract amortization that Teekay Tankers recognized in revenue in the first quarter of 2016;
|
partially offset by
|
•
|
a net
increase of $3.0 million due to the scope of repairs and planned maintenance activities in 2017 as compared to 2016;
|
|
•
|
an
increase of $2.9 million due to higher transition costs incurred in 2016 compared to 2017 directly relating to 12 Suezmax tankers which were acquired in the latter part of 2015; and
|
|
•
|
an
increase of $1.3 million due to higher corporate expenses incurred during 2016 primarily as a result of legal expenses related to the vessel construction and option agreements with STX Offshore & Shipbuilding Co. Ltd (or
STX
) of South Korea.
|
Equity (loss) income
decreased to a loss of
$25.4 million
in
2017
from income of
$7.7 million
for
2016
primarily due to:
|
•
|
a
decrease of $31.9 million primarily due to a $26.7 million net write-down of Teekay Tankers' investment in TIL to its fair market value in June 2017 and prior to the TIL merger completion, and lower equity earnings from TIL resulting from overall lower realized average spot rates earned in 2017 compared to 2016; and
|
|
•
|
a
decrease of $1.3 million due to lower equity earnings from the High-Q Investment Ltd (or
High-Q
) joint venture primarily resulting from profit share recognized in the second quarter of 2016 as VLCC rates averaged above certain thresholds, triggering a profit sharing with the customer.
|
66
Teekay Parent
Operating Results – Teekay Parent
The following table compares Teekay Parent’s operating results, equity income and number of calendar-ship-days for its vessels for
2017
and
2016
.
|
|
Offshore
Production
|
Conventional
Tankers
|
Other and
Corporate G&A
|
Teekay Parent
Total
|
||||||||||||||||||||
|
(in thousands of U.S. dollars, except calendar-ship-days)
|
2017
|
2016
|
2017
|
2016
|
2017
|
2016
|
2017
|
2016
|
||||||||||||||||
|
Revenues
(1)
|
209,394
|
|
231,435
|
|
5,065
|
|
32,967
|
|
89,107
|
|
76,111
|
|
303,566
|
|
340,513
|
|
||||||||
|
Voyage expenses
|
(186
|
)
|
(269
|
)
|
(81
|
)
|
(287
|
)
|
(1,426
|
)
|
(2,879
|
)
|
(1,693
|
)
|
(3,435
|
)
|
||||||||
|
Vessel operating expenses
(1)
|
(144,325
|
)
|
(159,084
|
)
|
(5,481
|
)
|
(10,468
|
)
|
(53,179
|
)
|
(26,576
|
)
|
(202,985
|
)
|
(196,128
|
)
|
||||||||
|
Time-charter hire expense
|
(38,346
|
)
|
(33,366
|
)
|
(12,461
|
)
|
(23,166
|
)
|
(47,847
|
)
|
(48,452
|
)
|
(98,654
|
)
|
(104,984
|
)
|
||||||||
|
Depreciation and amortization
|
(60,560
|
)
|
(70,855
|
)
|
—
|
|
(1,717
|
)
|
163
|
|
449
|
|
(60,397
|
)
|
(72,123
|
)
|
||||||||
|
General and administrative expenses
(2)
|
(16,966
|
)
|
(14,099
|
)
|
(432
|
)
|
(809
|
)
|
(5,251
|
)
|
(10,707
|
)
|
(22,649
|
)
|
(25,615
|
)
|
||||||||
|
Asset Impairments
|
(205,659
|
)
|
—
|
|
—
|
|
(205,659
|
)
|
||||||||||||||||
|
Net loss on sale of vessels and
equipment
|
—
|
|
(110
|
)
|
—
|
|
(12,487
|
)
|
—
|
|
—
|
|
—
|
|
(12,597
|
)
|
||||||||
|
Restructuring charges
|
(110
|
)
|
(1,962
|
)
|
—
|
|
—
|
|
(1,844
|
)
|
(20,165
|
)
|
(1,954
|
)
|
(22,127
|
)
|
||||||||
|
Loss from vessel operations
|
(256,758
|
)
|
(48,310
|
)
|
(13,390
|
)
|
(15,967
|
)
|
(20,277
|
)
|
(32,219
|
)
|
(290,425
|
)
|
(96,496
|
)
|
||||||||
|
Equity (loss) income
|
(7,861
|
)
|
(575
|
)
|
(20,677
|
)
|
132
|
|
(2,792
|
)
|
(1,838
|
)
|
(31,330
|
)
|
(2,281
|
)
|
||||||||
|
Calendar-Ship-Days
(3)
|
||||||||||||||||||||||||
|
FPSO Units
|
1,095
|
|
1,098
|
|
—
|
|
—
|
|
—
|
|
—
|
|
1,095
|
|
1,098
|
|
||||||||
|
Conventional Tankers
|
—
|
|
—
|
|
587
|
|
1,278
|
|
—
|
|
—
|
|
587
|
|
1,278
|
|
||||||||
|
Gas carriers
|
—
|
|
—
|
|
—
|
|
—
|
|
730
|
|
732
|
|
730
|
|
732
|
|
||||||||
|
FSO Units
|
365
|
|
366
|
|
—
|
|
—
|
|
730
|
|
732
|
|
1,095
|
|
1,098
|
|
||||||||
|
Shuttle Tankers
|
730
|
|
732
|
|
—
|
|
—
|
|
—
|
|
—
|
|
730
|
|
732
|
|
||||||||
|
Bunker Barges
|
—
|
|
—
|
|
—
|
|
—
|
|
365
|
|
672
|
|
365
|
|
672
|
|
||||||||
|
(1)
|
Revenues and vessel operating expenses for 2017 include $17.8 million and $16.1 million, respectively, related to intercompany transactions between Teekay Offshore and Teekay Parent, which as a result of the deconsolidation of Teekay Offshore, are no longer eliminated upon consolidation. The intercompany transactions relate to services for ship management, crew training, commercial, technical, project management, strategic, business development and administrative services provided by Teekay Parent to Teekay Offshore.
|
|
(2)
|
Includes direct general and administrative expenses and indirect general and administrative expenses allocated to offshore production, conventional tankers and other and corporate G&A based on estimated use of corporate resources.
|
|
(3)
|
Apart from three FPSO units and one conventional tanker, all remaining calendar-ship-days presented relate to in-chartered days.
|
Teekay Parent – Offshore Production
Offshore Production consists primarily of our FPSO units. As at December 31, 2017, we had a direct interest in three 100%-owned FPSO units, and we in-chartered two shuttle tankers and one FSO unit from Teekay Offshore.
Asset impairments for the year ended December 31, 2017, primarily relate to the impairments of the
Petrojarl Banff
and
Petrojarl Foinaven
FPSO units. Factors contributing to the impairments included changes to the estimated cash flows and carrying values of the asset groups as a result of the deconsolidation of Teekay Offshore on September 25, 2017, and a re-evaluation of the estimated future net cash flows of the units. Please read "Item 18 - Financial Statements: Note 18a - Asset Impairments".
Loss
from vessel operations increased to $256.8 million during 2017 compared to $48.3 million in 2016, primarily as a result of:
|
•
|
an
increase in loss of $205.7 million from impairment charges in respect of the
Petrojarl Banff
and
Petrojarl Foinaven
FPSO units, described above;
|
|
•
|
an
increase in loss of $14.2 million related to the
Hummingbird Spirit
FPSO unit primarily due to the contract amendment described above
under the heading “Recent Developments in Teekay Parent”, which
took effect on July 1, 2016; and
|
|
•
|
an
increase in loss of $18.5 million related to the
Petrojarl Foinaven
FPSO unit primarily due to lower revenue earned and higher repairs and maintenance costs incurred during the shutdown of the unit in the third quarter for 2017, and insurance proceeds recognized in 2016;
|
partially offset by
67
|
•
|
a
decrease in loss of $25.4 million related to the
Petrojarl Banff
FPSO unit primarily due to higher day rate and tariff earned in 2017 due to the contract amendment described above
under the heading “Recent Developments in Teekay Parent”,
and higher repairs and maintenance costs in 2016 due to the temporary loss of two mooring lines in the second quarter of 2016, partially offset by insurance proceeds received in 2016; and
|
|
•
|
a
decrease in loss of $1.9 million for the year ended December 31, 2017 primarily due to reorganization of the FPSO business in 2016.
|
Teekay Parent – Conventional Tankers
As
at December 31, 2017, Teekay Parent had no conventional tankers remaining in the fleet. The average fleet size (including in-chartered vessels), as measured by calendar-ship-days, decreased in 2017 compared with 2016 due to the redeliveries of two Aframax in-chartered vessels to their owners, one Aframax in-chartered vessel to Teekay Offshore and two Aframax in-chartered vessels to Teekay Tankers, and due to the sale of one VLCC during 2016. The collective impact from the noted fleet changes are referred to below as the
Net Fleet Reductions
.
Loss
from vessel operations for Teekay Parent’s Conventional Tankers was $13.4 million in 2017 compared to $16.0 million in 2016, primarily as a result of:
|
•
|
a
decrease in loss of $12.5 million due to the write-down of the VLCC to its agreed sales price in the second quarter of 2016; and
|
|
•
|
a
decrease in loss of $2.4 million due to a cancellation fee paid by Teekay Parent to Teekay Offshore in the first quarter of 2016 related to the termination of a time-charter contract, partially offset by a cancellation fee paid to the owners in the fourth quarter of 2017 related to the termination of two bareboat charter-in contracts;
|
partially offset by
|
•
|
an
increase in loss of $6.2 million due to the Net Fleet Reductions;
|
|
•
|
an
increase in loss of $5.1 million due to lower average realized TCE rates earned in 2017 compared to 2016; and
|
|
•
|
an
increase in loss of $2.0 million due to a distribution received from Gemini Pool L.L.C. in the first quarter of 2016.
|
Teekay Parent – Other and Corporate G&A
As
at December 31, 2017, Teekay Parent had two chartered-in LNG carriers owned by Teekay LNG, two chartered-in FSO units owned by Teekay Offshore and one chartered-in bunker barge owned by a third party.
Loss from vessel operations
was $20.3 million for the year ended December 31, 2017, compared to $32.2 million for the year ended December 31, 2016, primarily as a result of:
|
•
|
a
decrease in loss of $14.5 million from Teekay Parent's in-chartered LNG carriers primarily due to the start of a one-year charter contract for the
Polar Spirit
LNG carrier in the second quarter of 2017 and the start of a seven-month charter contract for the
Arctic Spirit
LNG carrier in the third quarter of 2017;
|
partially offset by
|
•
|
an
increase in loss of $1.8 million in 2017, due to transaction fees received from TIL in 2016 for our arrangement of the sale of the
Voss Spirit
and
Hemsedal Spirit
by TIL; and
|
|
•
|
an
increase in loss of $1.7 million relating to the
Suksan Salamander
FSO unit from amortization of the off-market in-charter contract subsequent to the deconsolidation of Teekay Offshore and contract amendments during 2017.
|
Teekay Parent – Equity Loss
Equity loss was
$31.3 million
in
2017
compared to
$2.3 million
in
2016
,
primarily due to a $20.5 million write-down of Teekay Parent's investment in TIL in June 2017 and lower equity earnings from lower average realized spot rates earned by TIL in 2017 and losses from Magnora.
68
Teekay Offshore
Operating Results – Teekay Offshore
The following table compares Teekay Offshore’s operating results, equity income and number of calendar-ship-days for its vessels for
2017
and
2016
.
Following the Brookfield Transaction in September 2017, Teekay deconsolidated Teekay Offshore on September 25, 2017. After September 25, 2017, Teekay accounts for its investment in Teekay Offshore using the equity method.
|
|
Year ended December 31,
|
||||
|
(in thousands of U.S. dollars, except calendar-ship-days)
|
2017
(1)
|
2016
|
|||
|
Revenues
|
796,711
|
|
1,152,390
|
|
|
|
Voyage expenses
|
(68,802
|
)
|
(80,750
|
)
|
|
|
Vessel operating expenses
|
(249,805
|
)
|
(364,441
|
)
|
|
|
Time-charter hire expense
|
(60,592
|
)
|
(75,485
|
)
|
|
|
Depreciation and amortization
|
(219,406
|
)
|
(300,011
|
)
|
|
|
General and administrative expenses
|
(46,399
|
)
|
(56,122
|
)
|
|
|
Asset impairments and gain on sale of vessels
(2)
|
(1,500
|
)
|
(40,079
|
)
|
|
|
Restructuring charges
|
(3,147
|
)
|
(4,649
|
)
|
|
|
Income from vessel operations
|
147,060
|
|
230,853
|
|
|
|
Equity income
(3)
|
12,028
|
|
17,933
|
|
|
|
Calendar-Ship-Days
(4)
|
|||||
|
FPSO units
|
1,602
|
|
2,196
|
|
|
|
Shuttle Tankers
|
8,378
|
|
11,913
|
|
|
|
FSO units
|
1,869
|
|
2,562
|
|
|
|
UMS
|
267
|
|
366
|
|
|
|
Towage vessels
|
2,018
|
|
2,307
|
|
|
|
Conventional Tankers
|
534
|
|
732
|
|
|
|
(1)
|
On September 25, 2017, we deconsolidated Teekay Offshore (please read "Item 18 - Financial Statements: Note 3 - Deconsolidation of Teekay Offshore"). Figures represent Teekay Offshore's results for the period up to September 25, 2017.
|
|
(2)
|
Commencing on September 25, 2017, Teekay accounts for its investment in Teekay Offshore using the equity method, and recognized an equity loss of $2.5 million for the year ended December 31, 2017. In the period after deconsolidation of Teekay Offshore to September 30, 2017, Teekay Offshore incurred impairment charges of $316.7 million which did not impact the equity loss recognized by Teekay as Teekay recognized its equity-accounted investment in Teekay Offshore at fair value on September 25, 2017.
|
|
(3)
|
These amounts represent equity income from Teekay Offshore's equity interests in OOG-TK Libra GmbH & Co KG and OOG-TKP FPSO GmbH & Co KG.
|
|
(4)
|
Calendar-ship-days presented relate to owned and in-chartered consolidated vessels.
|
As
at December 31, 2017, Teekay Offshore's FPSO fleet consisted of the
Petrojarl Knarr
, the
Petrojarl Varg
, the
Ostras
, the
Piranema Spirit
, the
Voyageur Spirit
, and the
Petrojarl I
FPSO units, all of which Teekay Offshore owned 100%, and the
Itajai
and the
Libra
FPSO units, of which Teekay Offshore owned 50%. One equity-accounted FSPO unit, the
Libra
FPSO unit owned through Teekay Offshore's 50/50 joint venture with Ocyan, achieved first oil and commenced its 12-year charter contract in late-November 2017. The
Petrojarl I
FPSO unit completed its upgrades and arrived on the Atlanta field in offshore Brazil in early-January 2018
and commenced its five-year charter contract with QGEP in May 2018. One FPSO unit, the
Petrojarl Varg
, was in lay-up as at December 31, 2017.
In
late-2015, Teekay Offshore received a termination notice for the
Petrojarl Varg
FPSO charter contract from Repsol S.A. (or Repsol), based on a termination right that was specific to the
Petrojarl Varg
FPSO contract. In accordance with the termination provision of the charter contract, the charterer ceased paying the capital component of the charter hire six months prior to the July 2016 redelivery date.
As
at December 31, 2017, Teekay Offshore's shuttle tanker fleet consisted of 30 vessels that operate under fixed-rate
contracts of affreightment
, time charters and bareboat charters, one shuttle commenced operations under a fixed-rate
contract of affreightment
, in the East Coast of Canada in January 2018, five shuttle tanker newbuildings (one of which was delivered in March 2018) and the
HiLoad DP
unit (which was in lay-up as at December 31, 2017). Of these 37 shuttle tankers, six were owned through 50%-owned subsidiaries and three were chartered-in. The remaining vessels were owned 100% by Teekay Offshore.
As
at December 31, 2017, Teekay Offshore's FSO fleet consisted of six units that operated under fixed-rate time charters or fixed-rate bareboat charters, for which Teekay Offshore's ownership interests ranged from 89% to 100%. The
Randgrid
completed its conversion from a shuttle tanker to an FSO unit in June 2017 and commenced operations in early-October 2017 at the Gina Krog oil and gas field located in the North Sea, under a three-year time-charter contract, which includes 12 additional one-year extension options. The
Navion Saga
FSO unit was sold in October 2017.
69
As
at December 31, 2017, Teekay Offshore's UMS fleet consisted of one unit, the
Arendal Spirit
, in which Teekay Offshore owned a 100% interest. The
Arendal Spirit
was off-hire from mid-April 2016 until early-July 2016 due to damage suffered to the gangway of the unit. No revenue was recognized for this unit since November 2016, for the reasons described above.
As
at December 31, 2017, Teekay Offshore's towage vessel fleet consisted of nine long-distance towing and offshore installation vessels and one long-distance towing and offshore installation vessel newbuilding which was delivered in February 2018. Two of the vessels were in lay-up as at December 31, 2017. Teekay Offshore owned a 100% interest in each of the vessels in Teekay Offshore's towage fleet. Long-distance towing and offshore installation vessels are used for the towage, station-keeping, installation and decommissioning of large floating objects, such as exploration, production and storage units, including FPSO units, FLNG and floating drill rigs.
As
at December 31, 2017, Teekay Offshore's conventional tanker fleet consisted of two in-chartered conventional tankers. Both vessels were trading in the spot conventional tanker market as at December 31, 2017.
Income from vessel operations for Teekay Offshore decreased to $147.1 million for the period up to September 25, 2017 compared to $230.9 million for the year ended December 31, 2016, primarily a result of:
FPSO Fleet
|
•
|
a
decrease of $13.7 million for the nine months ended September 30, 2017 for the
Petrojarl Varg
due to no longer receiving the capital portion of the charter hire for the
Petrojarl Varg
FPSO since February 1, 2016 and the unit being in lay-up since August 1, 2016 subsequent to the termination of the charter contract by Repsol and net revenue received for offshore field studies in 2016;
|
|
•
|
a
decrease of $4.2 million for the nine months ended September 30, 2017 for the
Voyageur Spirit
FPSO, primarily due to a decrease in incentive compensation;
|
|
•
|
a
decrease of $2.6 million for the nine months ended September 30, 2017 for the
Piranema Spirit,
primarily due to the timing of repair and maintenance costs; and
|
|
•
|
a
decrease of $1.0 million for the nine months ended September 30, 2017 for the
Petrojarl I
FPSO, primarily due to higher pre-operational costs incurred as the unit continues upgrades and is undergoing installation before commencing operations during the second quarter of 2018;
|
partially offset by
|
•
|
an
increase of $6.5 million for the nine months ended September 30, 2017 for the
Petrojarl Knarr
FPSO, primarily due to a one-time performance bonus earned during the third quarter of 2017 and crew and repair and maintenance costs in 2016 relating to the unit preparing for its final performance test, which was completed during the third quarter of 2016; and
|
|
•
|
an
increase of $4.2 million for the nine months ended September 30, 2017 for the
Petrojarl Varg,
primarily due to lower costs from the unit being in lay-up since August 1, 2016.
|
Shuttle Tanker Fleet
|
•
|
a
n increase of $11.3 million for the nine months ended September 30, 2017 due to an increase in project revenues, as a result of providing offloading services to Statoil for the Gina Krog field as an interim measure pending the start-up of the recently converted
Randgrid
FSO unit in October 2017;
|
|
•
|
a
n increase of $9.2 million for the nine months ended September 30, 2017 primarily due to an increase in revenues in Teekay Offshore's
contract of affreightment
fleet mainly due to higher fleet utilization and higher average rates; and
|
|
•
|
a
n increase of $2.7 million for the nine months ended September 30, 2017, due to cost savings as a result of the sale of one vessel in November 2016;
|
partially offset by
|
•
|
a decrease of $13.1 million for the nine months ended September 30, 2017 due to the in-chartering of one vessel from September 2016.
|
FSO Fleet
|
•
|
a
decrease of $10.3 million for the nine months ended September 30, 2017 due to the redelivery to Teekay Offshore of the
Navion Saga
in October 2016 and the write-down of the Falcon Spirit as a result of a decrease in the estimated residual value of the unit.
|
UMS Fleet
|
•
|
a
n increase of $11.4 million for the nine months ended September 30, 2017 primarily due to the termination of the
Arendal Spirit
UMS charter contract in April 2017, partially offset by the write-down relating to the cancellation of two UMS newbuilding contracts in June 2016.
|
70
Towage Fleet
|
•
|
a
decrease of $8.8 million for the nine months ended September 30, 2017 mainly due to lower utilization for the towage fleet as a result of lower demand in the offshore market, and increased costs associated with the delivery of the
ALP Striker
and
ALP Defender
in September 2016 and June 2017, respectively, partially offset by an increase in the owned and chartered-in fleet size.
|
Conventional Tanker Fleet
|
•
|
a
decrease of $7.6 million for the nine months ended September 30, 2017 primarily due to a $4.0 million termination fee received from Teekay Parent for the early termination of the time-charter-out contract of the
Kilimanjaro Spirit
in March 2016, and the in-chartering of the
Blue Pride
and the
Blue Power
conventional tankers from March 2016, partially offset by lower costs as a result of the sale of two conventional tankers in March 2016.
|
General and administrative expenses
|
•
|
General
and administrative expenses increased by $4.4 million for the nine months ended September 30, 2017, mainly due to costs associated with the Brookfield Transaction and higher business development fees relating to its FPSO segment, partially offset by lower management fees relating to the FPSO and shuttle tanker segments primarily from its cost saving initiatives and lower expenses as a result of the redelivery and lay-up of the
Petrojarl Varg
FPSO unit in August 2016.
|
Impact of deconsolidation of Teekay Offshore
|
•
|
a
decrease of $59.1 million in 2017, including $56.5 million of income from vessel operations of Teekay Offshore for the fourth quarter of 2016 and $2.6 million of income from vessel operations of Teekay Offshore for the five days subsequent to its deconsolidation on September 25, 2017, of which our 14% share was recognized in equity loss, and which is not included in the above results (please read "Item 18 - Financial Statements: Note 3 - Deconsolidation of Teekay Offshore"). The Company recognized an equity loss of $2.5 million from September 25, 2017 to December 31, 2017.
|
Other Consolidated Operating Results
The following table compares our other consolidated operating results for
2017
and
2016
:
|
|
Year Ended December 31,
|
|
|||||||
|
(in thousands of U.S. dollars, except percentages)
|
2017
|
2016
|
% Change
|
||||||
|
Interest expense
|
(268,400
|
)
|
(282,966
|
)
|
(5.1
|
)
|
|||
|
Interest income
|
6,290
|
|
4,821
|
|
30.5
|
|
|||
|
Realized and unrealized loss on non-designated derivative instruments
|
(38,854
|
)
|
(35,091
|
)
|
10.7
|
|
|||
|
Foreign exchange loss
|
(26,463
|
)
|
(6,548
|
)
|
304.1
|
|
|||
|
Loss on deconsolidation of Teekay Offshore
|
(104,788
|
)
|
—
|
|
100.0
|
|
|||
|
Other loss
|
(53,981
|
)
|
(39,013
|
)
|
38.4
|
|
|||
|
Income tax expense
|
(12,232
|
)
|
(24,468
|
)
|
(50.0
|
)
|
|||
Interest expense.
Interest expense decreased to $268.4 million in 2017, compared to $283.0 million in 2016, primarily due to:
|
•
|
a
decrease of $5.2 million primarily due to a termination fee and write-off in 2016 of deferred loan costs due to the cancellation of a portion of Teekay Parent's equity margin loan in 2016;
|
|
•
|
a
decrease of $4.8 million due to interest expense incurred relating to costs associated with the delay in the delivery of a UMS newbuilding in the first and second quarters of 2016 up until its construction contract cancellation by subsidiaries of Teekay Offshore in late-June 2016;
|
|
•
|
a
decrease of $4.1 million due to increases in capitalized interest relating to additional advances and capital contributions to the Yamal LNG Joint Venture and Bahrain LNG Joint Venture for newbuilding installments and construction costs;
|
|
•
|
a
decrease of $3.0 million due to decreases in Teekay Offshore's average debt balance;
|
|
•
|
a
decrease of $1.5 million due to the repayment of the bridge loan relating to the
Shoshone Spirit
upon its sale by Teekay Parent in 2016; and
|
|
•
|
a
decrease of $0.9 million due to the partial repayment of Teekay Parent's revolving credit facility in 2017;
|
partially offset by
|
•
|
a
n increase of $16.3 million primarily relating to interest incurred on the obligations related to capital leases for the
Creole Spirit
,
Oak Spirit
,
Torben Spirit
,
Murex
, and
Macoma
commencing upon their deliveries in 2016 and 2017;
|
|
•
|
a
n increase of $7.9 million due to an increase in the weighted-average interest rates on Teekay Offshore's long-term debt;
|
71
|
•
|
an
increase of $4.6 million as a result of Teekay LNG's issuances of NOK bonds in October 2016 and January 2017, net of NOK bond repurchases in October 2016 and the maturity of certain of the NOK bonds in May 2017;
|
|
•
|
an
increase of $4.1 million as a result of interest expense accretion on the Pan Union Joint Venture crew training and site supervision obligation, and higher LIBOR rates net of debt principal repayments;
|
|
•
|
an
increase of $2.3 million due to the ineffective portion of the unrealized loss, and the reclassification of the realized loss from accumulated other comprehensive loss to interest expense, on interest rate swaps designated as cash flow hedges relating to Teekay Offshore's towage segment; and
|
|
•
|
an
increase of $1.5 million primarily due to additional interest incurred related to the sale and leaseback of four Suezmax tankers and the completion of the TIL merger in November 2017, partially offset by higher expenses incurred in 2016 due to the refinancing of Teekay Tankers' debt facilities in the first quarter of 2016.
|
On September 25, 2017, we deconsolidated Teekay Offshore (please read "Item 18 - Financial Statements: Note 3 - Deconsolidation of Teekay Offshore"). As a result, consolidated interest expense decreased by $30.0 million for the year ended December 31, 2017, compared to the same period of the prior year.
Realized and unrealized (losses) gains on non-designated derivative instruments
.
Realized and unrealized (losses) gains related to derivative instruments that are not designated as hedges for accounting purposes are included as a separate line item in the
consolidated statements of (loss) income
. Net realized and unrealized losses on non-designated derivatives were $38.9 million for 2017, compared to $35.1 million for 2016, as detailed in the table below:
|
Year Ended December 31, 2017
|
Year Ended December 31, 2016
|
||||
|
$
|
$
|
||||
|
Realized (losses) gains relating to:
|
|||||
|
Interest rate swap agreements
|
(53,921
|
)
|
(87,320
|
)
|
|
|
Interest rate swap agreement terminations
|
(610
|
)
|
(8,140
|
)
|
|
|
Foreign currency forward contracts
|
667
|
|
(11,186
|
)
|
|
|
Time charter swap agreement
|
1,106
|
|
2,154
|
|
|
|
Forward freight agreements
|
270
|
|
—
|
|
|
|
(52,488
|
)
|
(104,492
|
)
|
||
|
Unrealized gains (losses) relating to:
|
|||||
|
Interest rate swap agreements
|
17,005
|
|
62,446
|
|
|
|
Foreign currency forward contracts
|
3,925
|
|
15,833
|
|
|
|
Stock purchase warrants
|
(6,421
|
)
|
(9,753
|
)
|
|
|
Time charter swap agreement
|
(875
|
)
|
875
|
|
|
|
13,634
|
|
69,401
|
|
||
|
Total realized and unrealized losses on derivative instruments
|
(38,854
|
)
|
(35,091
|
)
|
|
The
realized losses relate to amounts we actually realized for settlements related to these derivative instruments in normal course, and amounts paid to terminate interest rate swap agreement terminations.
During
2017 and 2016, we had interest rate swap agreements with aggregate average net outstanding notional amounts of approximately $2.6 billion and $3.3 billion, respectively, with average fixed rates of approximately 3.1% and 3.4%. The decrease in the notional amounts is mainly due to the deconsolidation of Teekay Offshore, which had interest rate swaps with aggregate average notional amount of $1.8 billion. Short-term variable benchmark interest rates during these periods were generally less than 2.0% and, as such, we incurred realized losses of $53.9 million and $87.3 million during 2017 and 2016, respectively, under the interest rate swap agreements. We also incurred realized losses of $0.6 million during 2017, compared to losses of $8.1 million during 2016, from the termination of interest rate swaps.
We
recognized realized gains of $0.7 million in 2017, compared to realized losses of $11.2 million in 2016 under the foreign currency forward contracts.
We recognized realized gains on a time charter swap agreement of $1.1 million in 2017 and $2.2 million in 2016. The time-charter swap agreement ended on April 30, 2017.
Primarily as a result of significant changes in long-term benchmark interest rates during 2017 and 2016, we recognized unrealized gains of $17.0 million for 2017 compared to $62.4 million for 2016 under the interest rate swap agreements. We recognized unrealized gains of $3.9 million for 2017 compared to unrealized gains of $15.8 million for 2016 under the foreign currency forward contracts.
72
As
at December 31, 2017, Teekay held 14.5 million Brookfield Transaction Warrants. Please read “Item 18 - Financial Statements: Note 3 – Deconsolidation of Teekay Offshore". The fair value of the Brookfield Transaction Warrants was $29.4 million as at December 31, 2017. We recognized $5.2 million of unrealized losses on these warrants in 2017. Please read “Item 18 Financial Statements:
Note 15 — Derivative Instruments and Hedging Activities
.”
As of December 31, 2017, Teekay held 1,755,000 Teekay Offshore stock purchase warrants with an exercise price of $4.55, which have a seven-year term and are exercisable any time after six months following their issuance date. The fair value of these warrants was $1.3 million as at December 31, 2017. We recognized $0.6 million of unrealized losses on these warrants. Please read “Item 18 - Financial Statements:
Note 15 — Derivative Instruments and Hedging Activities
.”
In
January 2014, we and Teekay Tankers received TIL stock purchase warrants which entitled us and Teekay Tankers to purchase up to 1.5 million shares of common stock of TIL at a fixed price of $10 per share. On May 31, 2017, TIL entered into a definitive agreement to merge with Teekay Tankers (Please read “Item 18 - Financial Statements:
Note 22 — Equity-accounted Investments
”). Following the completion of the merger, TIL became a wholly-owned subsidiary of Teekay Tankers, and as a result, the stock purchase warrants were valued at $nil at December 31, 2017. We recognized $0.6 million and $9.8 million of unrealized losses on the stock purchase warrants, respectively, during 2017 and 2016. Please read “Item 18 - Financial Statements:
Note 15 — Derivative Instruments and Hedging Activities
.”
Foreign Exchange Loss.
Foreign currency exchange losses were $26.5 million in 2017 compared to $6.5 million in 2016. Our foreign currency exchange losses, substantially all of which were unrealized, were due primarily to the relevant period-end revaluation of our NOK-denominated debt and our Euro-denominated term loans, capital leases and restricted cash for financial reporting purposes and the realized and unrealized gains (losses) on our cross currency swaps. Gains on NOK-denominated and Euro-denominated monetary liabilities reflect a stronger U.S. Dollar against the NOK and Euro on the date of revaluation or settlement compared to the rate in effect at the beginning of the period. Losses on NOK-denominated and Euro-denominated monetary liabilities reflect a weaker U.S. Dollar against the NOK and Euro on the date of revaluation or settlement compared to the rate in effect at the beginning of the period. For 2017, foreign currency exchange loss included realized losses of $18.5 million (2016—$38.6 million) and unrealized gains of $82.7 million (2016 — $75.0 million) on our cross currency swaps, realized losses on maturity and termination of NOK bonds of $25.7 million (2016 — $41.7 million) offset by the NOK bond gain, and unrealized losses of $23.3 million (2016—$6.8 million) on the revaluation of our NOK-denominated debt.
Other Loss.
Other loss
was $54.0 million in 2017 compared to $39.0 million in 2016. Other loss in 2017 included a $50.0 million increase in the tax indemnification guarantee liability related to the Teekay Nakilat capital lease (please read "Item 18 - Financial Statements: Note 16d — Commitments and Contingencies"), $4.5 million related to a settlement agreement entered into between CeFront Technology AS and certain subsidiaries of Teekay Offshore, partially offset by a gain on sale of a cost-accounted investment. Other loss in 2016 included the recognition of an expense relating to estimated potential damages of $38.0 million as a result of the cancellation by subsidiaries of Teekay Offshore of two UMS construction contracts, partially offset by a $14.5 million gain associated with the extinguishment of contingent liabilities relating to the UMS newbuildings and a $2.1 million gain relating to the reassessment of a contingent liability fair value associated with the
Arendal Spirit
UMS in 2016. Other loss in 2016 also included a write-down of a cost-accounted investment of $19.0 million in 2016.
Income Tax Expense.
Income tax expense
was $12.2 million in 2017 compared to $24.5 million in 2016. This decrease in income tax expense was primarily due to valuation allowances relating to our Australian operations and Teekay Offshore in 2016, the deconsolidation of Teekay Offshore on September 25, 2017, and lower freight taxes in Teekay Tankers in 2017.
LIQUIDITY AND CAPITAL RESOURCES
Liquidity and Cash Needs
Teekay Corporation Consolidated
Overall, our consolidated operations are capital intensive. We finance the purchase of our vessels primarily through a combination of borrowings from commercial banks or our joint venture partners, the issuance of equity and debt securities (primarily by our publicly-traded subsidiaries) and cash generated from operations. In addition, we may use sale and leaseback arrangements as a source of long-term liquidity. We use certain of our revolving credit facilities to temporarily finance capital expenditures until longer-term financing is obtained, at which time we typically use all or a portion of the proceeds from the longer-term financings to prepay outstanding amounts under revolving credit facilities. We have pre-arranged financing of approximately
$1.2 billion
, which relates to Teekay LNG's remaining capital expenditure commitments.
In January 2019, Teekay LNG secured
$159 million
of financing through a sale-leaseback agreement for its remaining unfinanced LNG carrier newbuilding.
As at
December 31, 2018
, Teekay Corporation’s total consolidated cash and cash equivalents were
$424.2 million
, compared to
$445.5 million
at
December 31, 2017
. Teekay Corporation’s total consolidated liquidity, including cash, cash equivalents and undrawn credit facilities, was
$724.7 million
as at
December 31, 2018
, compared to
$906.9 million
as at
December 31, 2017
. Teekay Corporation's total consolidated liquidity as at December 31, 2018 and December 31, 2017 excludes Teekay Offshore as a result of its deconsolidation on September 25, 2017.
Our revolving credit facilities and term loans are described in "Item 18 – Financial Statements:
Note 8 — Long-Term Debt
.” They contain covenants and other restrictions typical of debt financing secured by vessels that restrict the ship-owning subsidiaries from, among other things: incurring or guaranteeing indebtedness; changing ownership or structure, including mergers, consolidations, liquidations and dissolutions; making dividends or distributions if we are in default; making capital expenditures in excess of specified levels; making certain negative pledges and granting certain liens; selling, transferring, assigning or conveying assets; making certain loans and investments; or entering into new lines of business.
73
The Company's long-term debt agreements generally provide for maintenance of minimum consolidated financial covenants and
five
loan agreements require the maintenance of vessel market value to loan ratios. As at
December 31, 2018
, these vessel market value to loan ratios ranged from
131.7%
to
197.8%
compared to their minimum required ratios of
115.0%
to
135.0%
. The vessel values used in these ratios are the appraised values provided by third parties where available or prepared by us based on second-hand sale and purchase market data.
Changes in the LNG/LPG carrier or conventional tanker markets could negatively affect our compliance with these ratios.
Two
of Teekay Tankers’ term loans require Teekay Parent and Teekay Tankers collectively to maintain the greater of (a) free cash (cash and cash equivalents) of at least
$100.0 million
for one of the term loans and
$50.0 million
for the other and (b) an aggregate of free cash and undrawn committed revolving credit lines with at least six months to maturity of at least
7.5%
of their total debt for one of the term loans and
5.0%
for the other. In addition, certain loan agreements require Teekay Tankers to maintain a minimum liquidity (cash, cash equivalents and undrawn committed revolving credit lines with at least six months to maturity) of
$35.0 million
and at least
5.0%
of Teekay Tankers' total consolidated debt. Certain loan agreements require Teekay LNG to maintain a minimum level of tangible net worth, and minimum liquidity (cash, cash equivalents and undrawn committed revolving credit lines with at least six months to maturity) of
$35.0 million
, and not to exceed a maximum level of financial leverage.
As at
December 31, 2018
, the Company was in compliance with all covenants under its credit facilities and other long-term debt.
The aggregate annual long-term debt principal repayments, excluding payments made related to our capital lease obligations, required to be made by us subsequent to
December 31, 2018
,
are
$0.2 billion
(
2019
),
$1.2 billion
(
2020
),
$0.9 billion
(
2021
),
$0.2 billion
(
2022
),
$0.3 billion
(
2023
) and
$0.6 billion
(thereafter).
We conduct our funding and treasury activities based on corporate policies designed to minimize borrowing costs and maximize investment returns while maintaining the safety of the funds and appropriate levels of liquidity for our purposes. We hold cash and cash equivalents primarily in U.S. Dollars, with some balances held in Australian Dollars, British Pounds, Canadian Dollars, Euros, Japanese Yen, Norwegian Kroner and Singapore Dollars.
We are exposed to market risk from foreign currency fluctuations and changes in interest rates, spot tanker market rates for vessels and bunker fuel prices. We use forward foreign currency contracts, cross currency and interest rate swaps and forward freight agreements to manage currency, interest rate and spot tanker rates. Please read "Item 11 - Quantitative and Qualitative Disclosures About Market Risk."
Teekay Parent
Teekay Parent primarily owns an equity ownership interest in its Daughter Entities and three FPSO units, provides management services to its Daughter Entities and third-parties, and in-charters a small number of vessels. Teekay Parent’s primary short-term liquidity needs are the payment of operating expenses, debt servicing costs, dividends on our shares of common stock and scheduled repayments of long-term debt, as well as funding its other working capital requirements. Teekay Parent’s primary sources of liquidity are cash and cash equivalents, cash flows provided by operations, dividends/distributions and management fees received from the Daughter Entities and other investments, its undrawn credit facilities and proceeds from the sale of vessels to external parties (and in the past, Teekay LNG, Teekay Tankers and Teekay Offshore). As at
December 31, 2018
, Teekay Parent’s total cash and cash equivalents was
$220.2 million
, compared to
$129.8 million
at
December 31, 2017
. Teekay Parent’s total liquidity, including cash, cash equivalents and undrawn credit facilities, was
$333.4 million
as at
December 31, 2018
, compared to
$313.2 million
as at
December 31, 2017
.
In December 2017 and January 2018, Teekay Parent sold an aggregate of 4.0 million shares of common stock as part of a continuous offering program, generating gross proceeds of
$36.9 million
. Teekay Parent currently has the ability to sell additional shares of common stock having an aggregate offering amount of up to
$3.4 million
under its existing continuous offering program.
In January 2018, Teekay Parent completed a private offering of $125 million of aggregate principal amount of 5% Convertible Senior Notes due 2023 (
Convertible Notes
), raising net proceeds of approximately $121.0 million. The Convertible Notes will be convertible into Teekay’s common stock, initially at a rate of 85.4701 shares of common stock per $1,000 principal amount of Convertible Notes. This represents an initial effective conversion price of $11.70 per share of common stock.
The conversion rate is subject to customary adjustments for, among other things, payments of dividends by us beyond the current quarterly rate of $0.055 per share of common stock, other distributions of Teekay Parent’s common stock, other securities, assets or rights to Teekay Parent’s shareholders or a Teekay Parent tender or exchange offer. In addition, following certain corporate events that occur prior to the maturity date of the Convertible Notes or following any notice of optional redemption given by Teekay Parent, Teekay Parent will, under certain circumstances, increase the conversion rate for a holder who elects to convert its notes in connection with such a corporate event or for Convertible Notes that are surrendered for conversion following such notice of redemption.
Concurrently with the offering of Convertible Notes in January 2018, Teekay Parent completed a public offering through the issuance of 10.0 million common shares priced at $9.75 per share, raising net proceeds of approximately $93.0 million.
74
Teekay’s equity margin revolving credit facility is secured by common units of Teekay Offshore and Teekay LNG and shares of Class A common stock of Teekay Tankers that are owned by Teekay. In June 2016, Teekay amended the facility by reducing its aggregate potential borrowings from $300 million to $150 million, extending its maturity date from January 2018 to December 2018 and amending the formula which further limits the amount available to borrow based on the value of the common units of Teekay Offshore and Teekay LNG and the shares of Class A common stock of Teekay Tankers which are pledged as collateral. The amendment resulted in an increase in the loan-to-value ratio which increased the availability under the facility from approximately $34 million to $150 million.
In April 2017, Teekay further amended the facility by increasing the aggregate potential borrowings from $150 million to $200 million. In December 2018, Teekay further amended the facility
extending its maturity date from December 2018 to December 2020, decreasing the aggregate potential borrowings from $200 million to $150 million and
pledging additional
common units of Teekay Offshore and Teekay LNG and shares of Class A common stock of Teekay Tankers
as collateral.
As of
December 31, 2018
, Teekay Parent did not have any amounts drawn on this facility and had
$113.2 million
available to be drawn based on the value of the collateral. As of March 29, 2019, $142.8 million was available to be drawn on this facility.
Teekay has
guaranteed obligations of Teekay Tankers pursuant to certain of its credit facilities. As at
December 31, 2018
, the aggregate outstanding balance on such credit facilities was
$166.4 million
.
In September 2017, as part of the Brookfield Transaction (
please read "Item 18 - Financial Statements:
Note 4 — Deconsolidation of Teekay Offshore
")
, Teekay was released from all of its previous guarantees relating to Teekay Offshore's long-term debt and interest rate swap and cross currency swap agreements.
We believe that Teekay Parent’s existing cash and cash equivalents and undrawn long-term borrowings, in addition to all other sources of cash including cash from operations, and after considering initiatives described below that are planned by Teekay Parent, will be sufficient to meet its existing liquidity needs for at least the next 12 months.
We believe Teekay Parent will need to pursue one or more financing initiatives in order to refinance or repay its 8.5% senior unsecured notes that mature in January 2020. We are considering, among other things, subject to market conditions and other factors, debt financings,
debt and equity securities issuances and sales of Teekay Parent’s FPSO units or other assets
. The outstanding principal amounts of the 8.5% senior unsecured notes was
$508.6 million
and $497.7 million at
December 31, 2018
and March 29, 2019, respectively.
Teekay LNG
Teekay LNG's business model is to employ the majority of its vessels on fixed-rate contracts, mainly with large energy companies and their transportation subsidiaries. Teekay LNG's primary liquidity needs for 2019 through 2020 include payment of its quarterly distributions, including payments of distributions on its common units and Series A and Series B Preferred Units, funding any common unit repurchases it may undertake, operating expenses, dry-docking expenditures, debt service costs, scheduled repayments of long-term debt, bank debt maturities and the funding of general working capital requirements. Teekay LNG anticipates that its primary sources of funds for its short-term liquidity needs will be cash flows from operations, proceeds from debt and capital lease financings, and dividends that it expects to receive from its equity-accounted joint ventures. For 2019 through 2020, Teekay LNG expects that its existing liquidity, combined with the cash flow Teekay LNG expects to generate from its operations and receive as dividends from its equity-accounted joint ventures, will be sufficient to finance the majority of its liquidity needs, including the equity portion of its committed capital expenditures.
Teekay LNG's remaining liquidity needs include the requirement to refinance its loan facilities maturing in 2020. Teekay LNG already has committed debt financing in place for all of its existing growth projects, including: its wholly-owned LNG carrier newbuilding to be chartered on a 15-year charter contract with Yamal Trade Pte. Ltd. (which was delivered in January 2019); one LNG carrier under construction in the Pan Union Joint Venture (which was delivered in January 2019); all four ARC7 LNG carriers under construction for the Yamal LNG Joint Venture; and the assets of the Bahrain LNG Joint Venture formed for the development of an LNG receiving and regasification terminal in Bahrain.
Teekay LNG's ability to continue to expand the size of its fleet over the long-term is dependent upon its ability to generate operating cash flow, obtain long-term bank borrowings, sale-leaseback financing and other debt, as well as its ability to raise debt or equity financing through public or private offerings.
As at
December 31, 2018
, Teekay LNG's consolidated cash and cash equivalents were
$149.0 million
, compared to
$244.2 million
at
December 31, 2017
. Teekay LNG's total liquidity, which consists of cash, cash equivalents and undrawn credit facilities, was
$324.6 million
as at
December 31, 2018
, compared to
$433.6 million
as at
December 31, 2017
. The decrease in total consolidated liquidity was primarily due to funding of its committed projects, including capital contributions into the Pan Union Joint Venture and Teekay LNG-Marubeni Joint Venture, and payment of a tax indemnification liability in Teekay LNG's consolidated Teekay Nakilat Joint Venture during 2018. The decrease in total consolidated liquidity was partially offset by cash generated from operations, proceeds from Teekay LNG's sale-leaseback transactions completed during 2018, proceeds from the sales of the
European Spirit
and
African Spirit
and proceeds from the sale of Teekay LNG's 50% ownership interest in the Excelsior Joint Venture.
As at
December 31, 2018
, Teekay LNG had a working capital
deficit
of
$32.8 million
, which includes $24.0 million of current obligations related to capital leases relating to the
Toledo Spirit
, which was sold by the owner in January 2019 to a third party, resulting in the extinguishment of the remaining lease obligation without any cash flow impact directly relating to such extinguishment.
Teekay LNG expects to manage its working capital deficit primarily with net operating cash flow and dividends from its equity-accounted joint ventures, debt refinancings, sale-leaseback financings, and, to a lesser extent, existing undrawn revolving credit facilities.
As at December 31, 2018
, Teekay LNG had undrawn revolving credit facilities of $175.6 million.
Teekay LNG intends to increase its quarterly cash distributions on its common units by 36%, commencing with the distribution for the quarter ending March 31, 2019, as part of a balanced capital allocation strategy. Any increase in the level of quarterly distributions is subject to approval by the Board of Directors of Teekay LNG's general partner.
75
During 2018, Teekay LNG announced that its
general partner’s
Board of Directors had authorized a common unit repurchase program of up to $100 million of Teekay LNG's common units. Common units may be repurchased in the open market or privately-negotiated transactions or otherwise at times and prices considered appropriate by Teekay LNG. The timing of any purchases and the exact number of common units to be purchased under the common unit repurchase program will be dependent on market conditions and other factors. During December 2018 and January 2019, Teekay LNG repurchased an aggregate 1.1 million of its common units for $13.0 million.
Teekay LNG believes that its existing cash and cash equivalents and undrawn long-term borrowings, in addition to other sources of cash including cash from operations and the initiatives described above, will be sufficient to meet its existing liquidity needs for at least the next 12 months.
Teekay Tankers
Teekay Tankers' primary sources of liquidity are cash and cash equivalents, cash flows provided by its operations, its undrawn credit facilities, proceeds from sales of vessels, and capital raised through financing transactions. As at
December 31, 2018
, Teekay Tankers' total cash and cash equivalents were
$54.9 million
, compared to
$71.4 million
at
December 31, 2017
. Teekay Tankers' cash balance at
December 31, 2018
decreased primarily as a result of working capital timing differences, repayments of its long-term debt, repayments of obligations related to its capital leases, dividends paid on its shares of common stock, and capital expenditures due to dry-docking activities.
Teekay Tankers' total liquidity, including cash, cash equivalents and undrawn credit facilities, was $66.7 million as at
December 31, 2018
, compared to $160.0 million as at
December 31, 2017
. Teekay Tankers anticipates that its primary sources of funds for its short-term liquidity needs will be cash flows from operations on an expected tanker market recovery, existing cash and cash equivalents and undrawn long-term borrowings, or proceeds from refinancing existing loans and new financings, which Teekay Tankers believes will be sufficient to meet its existing liquidity needs for at least the next 12 months. These anticipated additional sources of financing include further sale-leasebacks of additional vessels, and the proceeds of a loan to finance working capital for Teekay Tankers' RSA commercial management pool operations. Please read "Item 1 - Financial Statements: Note 16c - Liquidity" for information about required funding over the next 12 months.
Teekay Tankers' short-term liquidity requirements include the payment of operating expenses, dry-docking expenditures, debt servicing costs, scheduled repayments and prepayments of long-term debt, scheduled repayments of its obligations related to capital leases, as well as funding its other working capital requirements. Teekay Tankers' short-term charters and spot market tanker operations contribute to the volatility of its net operating cash flow, and thus impact its ability to generate sufficient cash flows to meet its short-term liquidity needs. Historically, the tanker industry has been cyclical, experiencing volatility in profitability and asset values resulting from changes in the supply of, and demand for, vessel capacity. In addition, tanker spot markets historically have exhibited seasonal variations in charter rates. Tanker spot markets are typically stronger in the winter months as a result of increased oil consumption in the northern hemisphere and unpredictable weather patterns that tend to disrupt vessel scheduling.
Effective May 2018, Teekay Tankers eliminated the payment of its minimum quarterly dividend of $0.03 per share in order to preserve liquidity during the cyclical downturn of the tanker spot market. Otherwise, its dividend policy remains the same, with quarterly dividends expected to range from 30% to 50% of its quarterly adjusted net income, subject to reserves its Board of Directors may determine are necessary for the prudent operations of Teekay Tankers. Dividend payments are subject to the discretion of its Board of Directors and the policy remains subject to further change. Adjusted net (loss) income is a non-GAAP measure that excludes specific items affecting net loss that are typically excluded by securities analysts in their published estimates of Teekay Tankers' financial results. Specific items affecting net loss include, among others, foreign exchange gain or losses, unrealized gains or losses on derivative instruments and gains or losses on sale of vessels.
Teekay Tankers' long-term capital needs are primarily for capital expenditures and repayment of its loan facilities and obligations related to capital leases. Generally, Teekay Tankers expects that its long-term sources of funds will primarily be cash balances, long-term bank borrowings and other debt or equity financings. Teekay Tankers expects that it will rely upon external financing sources, including bank borrowings and the issuance of debt and equity securities, to fund acquisitions and expansion capital expenditures, including opportunities Teekay Tankers may pursue to purchase additional vessels.
I
n November 2018, one of Teekay
Tankers’ wholly-owned subsidiaries
entered into a working capital loan facility agreement which provides for available aggregate borrowings of up to $40.0 million for the subsidiary, with the option to increase the facility up to an additional $15.0 million.
The loan facility is scheduled to terminate six months after the first borrowing date, which may be continually extended for further periods of six months thereafter unless and until the lender gives written notice that no further extensions shall occur.
As at
December 31, 2018
, no amounts have been drawn from this facility.
In November 2018, Teekay Tankers completed an $84.7 million sale-leaseback financing transaction relating to four of its vessels. The transaction was structured using 10 to 12-year bareboat charters with an average rate of approximately $6,400 per day, with purchase options for all four vessels throughout the lease term beginning in November 2021. Teekay Tankers used the proceeds from this transaction to refinance one of its corporate revolving facilities, which matured in November 2018, and to prepay a portion of another revolving credit facility.
76
In September 2018, Teekay Tankers completed a $156.6 million sale-leaseback financing transaction relating to six of its vessels. The transaction was structured using nine to 10-year bareboat charters with an average rate of approximately $9,900 per day, with purchase options for all six vessels throughout the lease terms beginning in September 2020 and an obligation to purchase the vessels on maturity of the bareboat charters. Teekay Tankers used the proceeds from this transaction to prepay a portion of one of its corporate revolving credit facilities.
Teekay Tankers believes that its existing cash and cash equivalents and undrawn long-term borrowings, in addition to other expected sources of liquidity including cash from operations based on an expected tanker market recovery and the initiatives described above, will be sufficient to meet its existing liquidity needs for at least the next 12 months.
Teekay Offshore
As of September 25, 2017, as a result of the Brookfield Transaction, Teekay deconsolidated Teekay Offshore. Teekay retains ownership of approximately 14% of Teekay Offshore's outstanding common units and a 49% interest in Teekay Offshore's general partner, but no longer has in place any financial guarantees with respect to Teekay Offshore's long-term debt and interest rate swap and cross currency swap agreements. As at
December 31, 2018
, Teekay has recorded
$23.8 million
in net advances to Teekay Offshore compared to
$65.6 million
as at
December 31, 2017
.
On March 31, 2018, Teekay Offshore entered into a loan agreement for a
$125.0 million
senior unsecured revolving credit facility, of which up to
$25.0 million
is provided by Teekay Parent and up to
$100.0 million
is provided by Brookfield. As at
December 31, 2018
, Teekay had advanced
$25.0 million
to Teekay Offshore under this facility which is included in the net advances to Teekay Offshore. The facility is scheduled to mature in October 2019.
Cash Flows
The following table summarizes our consolidated cash and cash equivalents provided by (used for) operating, financing and investing activities for the periods presented:
|
(in thousands of U.S. Dollars)
|
Year Ended December 31,
|
||||||||
|
|
2018
|
2017
|
2016
|
||||||
|
Net operating cash flows
|
182,135
|
|
544,264
|
|
676,546
|
|
|||
|
Net financing cash flows
|
434,786
|
|
284,309
|
|
(195,610
|
)
|
|||
|
Net investing cash flows
|
(663,456
|
)
|
(1,081,641
|
)
|
(530,523
|
)
|
|||
Operating Cash Flows
Our consolidated net cash flow from operating activities fluctuates primarily as a result of changes in vessel utilization and TCE rates, changes in interest rates, fluctuations in working capital balances, the timing and amount of dry-docking expenditures, repairs and maintenance activities, vessel additions and dispositions, and foreign currency rates. Our exposure to the spot tanker market has contributed significantly to fluctuations in operating cash flows historically as a result of highly cyclical spot tanker rates. In addition, the production performance of certain of our FPSO units that operate under contracts with a production-based compensation component has contributed to fluctuations in operating cash flows. As the charter contracts of some of our FPSO units include incentives based on average annual oil prices, the changes in global oil prices during recent years have also impacted our operating cash flows.
Consolidated net cash flow from operating activities
decreased
to
$182.1 million
for the year ended
December 31, 2018
, from
$544.3 million
for the year ended
December 31, 2017
. This
decrease
was primarily due to a
$252.6 million
decrease in income from operations
mainly from operations (before depreciation, amortization, asset impairments, loss on sale of vessels and the amortization of in-process revenue contracts) of our businesses, including a decrease of approximately
$352.6 million
due to the deconsolidation of Teekay Offshore in September 2017. For further discussion of changes in income from vessel operations from our businesses, please read
“Item 5 - Operating and Financial Review and Prospects: Management’s Discussion and Analysis of Financial Condition and Results of Operations - Recent Developments and Results of Operations.
” In addition,
there was a
$119.6 million
decrease
in cash flows from changes to non-cash working capital, primarily due to the settlement of the lease dispute relating to Teekay LNG's three RasGas II LNG Carriers, and a
$33.5 million
decrease
due to a reduction in dividends received from joint ventures.
These decreases were partially offset by a decrease in cash outflows of
$6.2 million
in dry-dock expenditures for the year ended
December 31, 2018
, compared to
2017
. In addition,
interest expense, including realized losses on interest rate swaps and cross currency swaps, decreased a net amount of
$37.4 million
for the year ended
December 31, 2018
, compared to
2017
,
primarily due to the deconsolidation of Teekay Offshore.
Consolidated net cash flow from operating activities decreased to
$544.3 million
for the year ended
December 31, 2017
, from
$676.5 million
for the year ended December 31, 2016. This decrease was primarily due to a $296.8 million increase in net loss mainly from operations (before depreciation, amortization, asset impairments, loss on sale of vessels, equipment and other operating assets, and the amortization of in-process revenue contracts) of our businesses. This decrease was also due to an increase of $4.9 million in dry-dock expenditures for the year ended December 31, 2017, compared to 2016. These decreases were partially offset by an increase from changes to non-cash working capital items of $54.1 million primarily due to the deconsolidation of Teekay Offshore in September 2017, a decrease in interest expense, including realized losses on interest rate swaps and cross currency swaps, of $94.5 million, a decrease in realized losses in foreign currency forward contracts and time charter swap agreements of $11.1 million and an increase in dividends from joint ventures of $12.2 million.
77
Financing Cash Flows
The Controlled Daughter Entities hold all of our liquefied gas carriers (Teekay LNG) and all of our conventional tanker assets (Teekay Tankers). Historically, the Daughter Entities have distributed operating cash flows to their owners in the form of distributions or dividends. The Daughter Entities raised net proceeds from issuances of new equity to the public and to third-party investors of
$nil
for the year ended
December 31, 2018
, compared to
$172.9 million
in
2017
and
$327.4 million
in
2016
. Teekay Parent raised net proceeds from issuances of new equity to the public and to third-party investors and two entities established by our founder (including Resolute, our largest shareholder) of
$103.7 million
in
2018
, compared to
$25.6 million
in
2017
and
$105.5 million
in
2016
.
Teekay LNG received
$370.1 million
of net proceeds from the sale-leaseback financing transactions for the deliveries of the
Magdala, Myrina
and
Megara
LNG carriers for the year ended
December 31, 2018
, compared to
$656.9 million
in the same period in
2017
. Teekay Tankers received
$241.3 million
from the sale-leaseback financing transactions completed on eight Aframax tankers, one Suezmax tankers and one LR2 Product tanker for the year ended
December 31, 2018
, compared to
$153.0 million
in the same period last year from the sale-leaseback financing transactions completed on four Suezmax tankers.
We use our credit facilities to partially finance capital expenditures. Occasionally, we will use revolving credit facilities to finance these expenditures until longer-term financing is obtained, at which time we typically use all or a portion of the proceeds from the longer-term financings to prepay outstanding amounts under the revolving credit facilities. We actively manage the maturity profile of our outstanding financing arrangements. Our net proceeds from the issuance of long-term debt, which is the proceeds from the issuances of long-term debt, net of issuance costs, prepayments of long-term debt and payments on maturity and termination of cross currency swaps, was
$553.7 million
in
2018
,
$175.1 million
in
2017
and
$200.1 million
in
2016
. Scheduled repayments
decreased
by
$41.5 million
in
2018
compared to
2017
.
Investing Cash Flows
During
2018
, we incurred capital expenditures for vessels and equipment of
$0.7 billion
, primarily for capitalized vessel modifications and shipyard construction installment payments. Teekay Parent
advanced
$25.0 million
to Teekay Offshore in the form of a senior unsecured revolving credit facility. Teekay LNG received proceeds of
$54.4 million
from the sale of Teekay LNG's 50% ownership interest in the Excelsior Joint Venture and
$28.5 million
from
the sales of the
European Spirit
and
African Spirit
.
Teekay LNG contributed
$40.5 million
to its equity-accounted joint ventures and loans to joint ventures for the year ended
December 31, 2018
, primarily to fund project expenditures in the Yamal LNG Joint Venture,
the Bahrain LNG
project,
and the Pan Union Joint Venture, and for working capital requirements for the Teekay LNG-Marubeni Joint Venture
. Teekay incurred a net
$25.3 million
cash outflow as a result of the Brookfield Transaction (please read "Item 18 - Financial Statements:
Note 4 — Deconsolidation of Teekay Offshore
").
During
2017
, we incurred capital expenditures for vessels and equipment of $1.1 billion, primarily for capitalized vessel modifications and shipyard construction installment payments relating to the
Gina Krog
FSO conversion, the
Petrojarl I
FPSO unit, the newbuilding towing and offshore installation vessels, and the LNG carrier newbuildings. We received proceeds of $73.7 million as a result of Teekay LNG's sale of the
Asian Spirit
and Teekay Tankers' sales of two Suezmax tankers, two Aframax tankers and one lightering support vessel during 2017. Teekay LNG contributed $183.9 million to its equity-accounted joint ventures and loans to joint ventures for the year ended December 31,
2017
, primarily to fund newbuilding installments in the Yamal LNG Joint Venture and project expenditures for the Bahrain LNG project. Teekay LNG received $40.3 million and $52.0 million as returns of capital from its joint venture with QGTC Nakilat (1643-6) Holdings Corporation (or the
RasGas 3 Joint Venture
) and the Yamal LNG Joint Venture, respectively, upon completion of their debt refinancings. Teekay LNG has a 40% ownership interest in the Ras Gas 3 Joint Venture and 50% ownership in the Yamal Joint Venture. Teekay incurred a net
$45.4 million
cash outflow as a result of the Brookfield Transaction (please read "Item 18 - Financial Statements:
Note 4 — Deconsolidation of Teekay Offshore
"). Teekay Tankers acquired $30.8 million of cash through its merger with TIL, net of costs.
During
2016
, we incurred capital expenditures for vessels and equipment of $648.3 million, primarily for capitalized vessel modifications and shipyard construction installment payments. Teekay Offshore incurred capitalized expenditures of $294.6 million for vessels and equipment, including conversion costs on the
Gina Krog
FSO conversion, upgrade costs on the
Petrojarl I
FPSO unit, installment payments on the newbuilding towing and offshore installation vessels, partially offset by credits received relating to the
Petrojarl Knarr
FPSO unit. Teekay LNG incurred capital expenditures of $345.8 million, primarily for newbuilding installment payments and shipbuilding supervision costs for its LNG carrier newbuildings, contributed $120.9 million to its equity-accounted joint ventures, and received a $5.5 million repayment of a shareholder loan from the Exmar LPG Joint Venture. In addition, Teekay Offshore made a $54.9 million investment in its joint ventures and received proceeds of $69.8 million from the sale of the
Navion Torinita
and
Navion Europa
shuttle tankers and the
Fuji Spirit
and
Kilimanjaro Spirit
conventional tankers. Teekay LNG received proceeds of $94.3 million from the sales of the
Bermuda Spirit
and
Hamilton Spirit
in April 2016 and May 2016.
78
COMMITMENTS AND CONTINGENCIES
The following table summarizes our long-term contractual obligations as at
December 31, 2018
:
|
Total
|
2019
|
2020
|
2021
|
2022
|
2023
|
Beyond 2023
|
|||||||||||||||
|
|
In millions of U.S. Dollars
|
||||||||||||||||||||
|
Teekay LNG
|
|||||||||||||||||||||
|
Bond repayments
(1) (2)
|
353.0
|
|
—
|
|
115.7
|
|
138.9
|
|
—
|
|
98.4
|
|
—
|
|
|||||||
|
Scheduled repayments of long-term debt
(1) (3)
|
758.1
|
|
133.3
|
|
128.5
|
|
98.3
|
|
87.1
|
|
80.3
|
|
230.6
|
|
|||||||
|
Repayments on maturity of long-term debt
(1) (3)
|
876.5
|
|
3.3
|
|
368.8
|
|
166.9
|
|
5.0
|
|
34.6
|
|
297.9
|
|
|||||||
|
Scheduled repayments of obligations related to capital leases
(4)
|
1,734.2
|
|
143.7
|
|
118.7
|
|
117.8
|
|
117.0
|
|
116.3
|
|
1,120.7
|
|
|||||||
|
Commitments under operating leases
(5)
|
284.7
|
|
47.6
|
|
39.9
|
|
23.9
|
|
23.9
|
|
23.9
|
|
125.5
|
|
|||||||
|
Newbuildings installments/shipbuilding supervision
(6)
|
652.2
|
|
652.2
|
|
—
|
|
—
|
|
—
|
|
—
|
|
—
|
|
|||||||
|
4,658.7
|
|
980.1
|
|
771.6
|
|
545.8
|
|
233.0
|
|
353.5
|
|
1,774.7
|
|
||||||||
|
Teekay Tankers
|
|||||||||||||||||||||
|
Scheduled repayments of long-term debt
(7)
|
266.7
|
|
106.7
|
|
118.6
|
|
28.8
|
|
12.6
|
|
—
|
|
—
|
|
|||||||
|
Repayments on maturity of long-term debt
(7)
|
475.3
|
|
—
|
|
—
|
|
401.3
|
|
74.0
|
|
—
|
|
—
|
|
|||||||
|
Scheduled repayments of obligations related to
capital leases
|
557.1
|
|
48.0
|
|
47.4
|
|
47.2
|
|
47.2
|
|
47.2
|
|
320.1
|
|
|||||||
|
Chartered-in vessels (operating leases)
(8)
|
62.5
|
|
36.9
|
|
23.5
|
|
2.1
|
|
—
|
|
—
|
|
—
|
|
|||||||
|
1,361.6
|
|
191.6
|
|
189.5
|
|
479.4
|
|
133.8
|
|
47.2
|
|
320.1
|
|
||||||||
|
Teekay Parent
|
|||||||||||||||||||||
|
Bond repayments
(9)
|
633.6
|
|
—
|
|
508.6
|
|
—
|
|
|
|
125.0
|
|
—
|
|
|||||||
|
Chartered-in vessels (operating leases)
(10)
|
181.7
|
|
55.7
|
|
50.8
|
|
51.4
|
|
9.1
|
|
9.1
|
|
5.6
|
|
|||||||
|
Asset retirement obligation
(11)
|
27.6
|
|
—
|
|
27.6
|
|
—
|
|
—
|
|
—
|
|
—
|
|
|||||||
|
842.9
|
|
55.7
|
|
587.0
|
|
51.4
|
|
9.1
|
|
134.1
|
|
5.6
|
|
||||||||
|
Total
|
6,863.2
|
|
1,227.4
|
|
1,548.1
|
|
1,076.6
|
|
375.9
|
|
534.8
|
|
2,100.4
|
|
|||||||
|
(1)
|
Euro-denominated and NOK-denominated obligations are presented in U.S. Dollars and have been converted using the prevailing exchange rate as of
December 31, 2018
.
|
|
(2)
|
Excludes expected interest payments of
$21.2 million
(
2019
),
$18.4 million
(
2020
),
$10.6 million
(
2021
),
$5.7 million
(
2022
) and
$2.9 million
(
2023
). Expected interest payments are based on NIBOR at
December 31, 2018
, plus margins that range up to
6.0%
, as well as the prevailing U.S. Dollar/NOK exchange rate as of
December 31, 2018
. The expected interest payments do not reflect the effect of the related cross currency swaps that Teekay LNG has used as an economic hedge of its foreign exchange and interest rate exposure associated with its NOK-denominated long-term debt.
|
|
(3)
|
Excludes expected interest payments of
$64.7 million
(
2019
),
$51.8 million
(
2020
),
$36.4 million
(
2021
),
$30.1 million
(
2022
),
$26.9 million
(
2023
) and
$71.7 million
(beyond
2023
). Expected interest payments are based on LIBOR or EURIBOR at
December 31, 2018
, plus margins on debt that has been drawn that range up to
3.25%
(variable-rate loans), as well as the prevailing U.S. Dollar/Euro exchange rate as of
December 31, 2018
. The expected interest payments do not reflect the effect of related interest rate swaps that Teekay LNG has used as an economic hedge of certain of its variable-rate debt. In addition, the above table does not reflect scheduled debt repayments in Teekay LNG's equity-accounted joint ventures.
|
|
(4)
|
Includes, in addition to lease payments, amounts Teekay LNG may be or is required to pay to purchase the leased vessels at the end of their respective lease terms. For one of Teekay LNG's nine obligations related to capital leases, the vessel was sold by the owner in January 2019 and the full amount of the associated lease obligation of $24.0 million was extinguished when Teekay LNG returned the vessel to the owner.
|
|
(5)
|
Teekay LNG has corresponding leases whereby it is the lessor and expects to receive approximately
$217.8 million
under those leases from
2019
to 2029.
|
|
(6)
|
As of
December 31, 2018
, Teekay LNG has an agreement for the construction of one wholly-owned LNG carrier newbuilding, for which the estimated remaining cost for this newbuilding totaled
$120.4 million
, including estimated interest and construction supervision fees. In January 2019, Teekay LNG secured
$159 million
of financing related to the commitments for the LNG carrier newbuilding included in the table above.
|
As part of the acquisition of an ownership interest in the Pan Union Joint Venture, Teekay LNG agreed to assume Shell’s obligation to provide shipbuilding supervision and crew training services for the four LNG carrier newbuildings and to fund its proportionate share of the remaining newbuilding installments. The estimated remaining costs for the shipbuilding supervision and crew training services and Teekay LNG's proportionate share of newbuilding installments totaled
$29.2 million
as of
December 31, 2018
. However, as part of this agreement with Shell, Teekay LNG recovered
$0.2 million
of the shipbuilding supervision and crew training costs from Shell in
2019
. The Pan Union Joint Venture has secured undrawn financing of
$24.0 million
based on Teekay LNG's proportionate share of newbuilding installments as of
December 31, 2018
.
In July 2014, the Yamal LNG Joint Venture, in which Teekay LNG has a 50% ownership interest, entered into agreements for the construction of six LNG carrier newbuildings, of which two delivered in 2018. As at
December 31, 2018
, Teekay LNG's 50% share of the estimated remaining costs for the four remaining newbuildings totaled
$436.1 million
, of which the Yamal LNG Joint Venture has secured undrawn financing of
$395.3 million
based on Teekay LNG's proportionate share of the remaining newbuilding installments as of
December 31, 2018
.
79
The Bahrain LNG Joint Venture, in which Teekay LNG has a 30% ownership interest, is developing an LNG receiving and regasification terminal in Bahrain. The project will be owned and operated under a 20-year agreement commencing in mid-2019 with a fully-built-up cost of approximately
$903.1 million
. As at
December 31, 2018
, Teekay LNG's 30% share of the estimated remaining costs is
$66.5 million
. The Bahrain LNG Joint Venture has secured undrawn debt financing of
$58.4 million
based on Teekay LNG's proportionate share as of
December 31, 2018
.
|
(7)
|
Excludes all expected interest payments of
$31.4 million
(
2019
),
$26.3 million
(
2020
),
$14.1 million
(
2021
),
$2.3 million
(
2022
). Expected interest payments are based on the existing interest rates for fixed-rate loans of
5.4%
and existing interest rates for variable-rate loans at LIBOR plus margins that range from
0.30%
to
2.75%
at
December 31, 2018
. The expected interest payments do not reflect the effect of related interest rate swaps that we have used to hedge certain of our floating-rate debt.
|
|
(8)
|
Excludes payments required if Teekay Tankers' exercises all options to extend the terms of in-chartered leases signed as of
December 31, 2018
. If Teekay Tankers' exercises all options to extend the terms of signed in-chartered leases, Teekay Tankers would expect total payments of
$39.4 million
(
2019
),
$28.9 million
(
2020
), and
$2.6 million
(
2021
).
|
|
(9)
|
Excludes expected interest payments of
$49.5 million
(
2019
),
$8.1 million
(
2020
),
$6.3 million
(
2021
),
$6.3 million
(
2022
) and
$0.3 million
(
2023
). Expected interest payments are based on the existing interest rate for fixed-rate loans at
8.5%
and
5.0%
, and the existing interest rate for the variable-rate loan that is based on LIBOR plus a margin which was
3.95%
as at
December 31, 2018
. The expected interest payments do not reflect the effect of related interest rate swaps that Teekay Parent uses as an economic hedge of certain of its variable rate debt.
|
|
(10)
|
Teekay Parent in-charters three FSO units and two shuttle tankers from Teekay Offshore. Two of the FSO units are on back-to-back out-charters to third parties. One of the FSO units and the two shuttle tankers are part of the service contracts of the
Petrojarl Banff
FPSO unit and the
Petrojarl Foinaven
FPSO unit, respectively.
|
|
(11)
|
Teekay Parent has an asset retirement obligation (or
ARO
) relating to the sub-sea production facility associated with the
Petrojarl Banff
FPSO unit operating in the North Sea. This obligation generally involves the costs associated with the restoration of the environment surrounding the facility and removal and disposal of all production equipment. This obligation is expected to be settled at the end of the contract under which the FPSO unit currently operates. We expect that the ARO will be covered in part by contractual payments of
$7.5 million
, presented in other non-current assets on our balance sheets, to be received from FPSO contract counterparties.
|
OFF-BALANCE SHEET ARRANGEMENTS
We have no off-balance sheet arrangements that have or are reasonably likely to have, a current or future material effect on our financial condition, changes in financial condition, revenues or expenses, results of operations, liquidity, capital expenditures or capital resources. Our equity-accounted investments are described in “Item 18 – Financial Statements:
Note 22 — Equity-accounted Investments
.”
CRITICAL ACCOUNTING ESTIMATES
We prepare our consolidated financial statements in accordance with GAAP, which requires us to make estimates in the application of our accounting policies based on our best assumptions, judgments and opinions. On a regular basis, management reviews our accounting policies, assumptions, estimates and judgments to ensure that our consolidated financial statements are presented fairly and in accordance with GAAP. However, because future events and their effects cannot be determined with certainty, actual results could differ from our assumptions and estimates, and such differences could be material. Accounting estimates and assumptions discussed in this section are those that we consider to be the most critical to an understanding of our financial statements because they inherently involve significant judgments and uncertainties. For a further description of our material accounting policies, please read “Item 18. Financial Statements:
Note 1 — Summary of Significant Accounting Policies
.”
Revenue Recognition
Description
.
We recognize revenue from voyage charters on either a load-to-discharge or discharge-to-discharge basis. Voyage revenues are recognized ratably from the beginning of when product is loaded to when it is discharged if using a load-to-discharge basis, or from when product is discharged (unloaded) at the end of the prior voyage to when it is discharged after the current voyage, if using a discharge-to-discharge basis. However, we do not begin recognizing voyage revenue for any of our vessels until a charter has been agreed to by the customer and us, even if the vessel has discharged its cargo and is sailing to the anticipated load port on its next voyage.
Judgments and Uncertainties.
Whether to use the load-to-discharge basis or the discharge-to-discharge basis depends on whether the customer directs the use of the vessel throughout the period of use, pursuant to the terms of the voyage charter. This is a matter of judgement. However, we believe that if the customer has the right to direct the vessel to different load and discharge ports, among other things, a voyage charter contract contains a lease, and the lease term begins on the later of the vessel’s last discharge or inception of the voyage charter contract. As such, in this case revenue is recognized on a discharge-to-discharge basis. Otherwise, it is recognized on a load-to-discharge basis.
Effect if Actual Results Differ from Assumptions.
If our assessment of whether the customer directs the use of the vessel throughout the period of use is not consistent with actual results, then the period over which voyage revenue is recognized would be different and as such our revenues could be overstated or understated for any given period by the amount of such difference.
80
Contingencies
Description
. We
may, from time to time, be involved in legal proceedings, claims or other situations involving uncertainty as to a possible loss that will ultimately be resolved when one or more future events occur or fail to occur. We accrue a provision for such loss contingencies if it is probable as of the reporting date, that an asset had been impaired or a liability incurred, based in information available prior to the issuance of the consolidated financial statements, and if the amount of the loss can be reasonably estimated.
Judgments and Uncertainties.
The amount of loss contingencies recognized as a liability in our consolidated financial statements requires management to make significant estimates that may at times be inherently difficult to make given the uncertainties involved, including estimates of whether it is probable an asset had been impaired or a liability incurred, the amount of possible losses, the ability to recover some or all of the possible loss through insurance coverage, amongst others. Our loss contingencies are disclosed in more detail in "Item 18 - Financial Statements:
Note 16
d — Commitments and Contingencies".
Effect if Actual Results Differ from Assumptions.
Our
net (loss) income
could be overstated or understated for any given period to the extent actual losses incurred, following resolution of our contingencies, are different than our prior estimates of recognized loss contingencies.
Vessel Lives and Depreciation
Description.
The carrying value of each of our vessels represents its original cost at the time of delivery or purchase less depreciation and impairment charges. We depreciate the original cost, less an estimated residual value, of our vessels on a straight-line basis over each vessel’s estimated useful life. The carrying values of our vessels may not represent their market value at any point in time because the market prices of second-hand vessels tend to fluctuate with changes in charter rates, the cost of newbuildings, among other factors. Both charter rates and newbuilding costs tend to be cyclical in nature.
Judgments and Uncertainties.
Depreciation is calculated using an estimated useful life of
25 years
for tankers carrying crude oil and refined product,
30 years
for LPG carriers and
35 years
for LNG carriers, commencing the date the vessel is delivered from the shipyard, or a shorter period if regulations prevent us from operating the vessels for those periods of time. The Company’s current FPSO units are depreciated using an estimated useful life of
25 years
commencing the date the unit is installed at the oil field and is in a condition that is ready to operate. The estimated useful life of our vessels involves an element of judgment, which takes into account design life, commercial considerations and regulatory restrictions.
Effect if Actual Results Differ from Assumptions.
The actual life of a vessel may be different than the estimated useful life, with a shorter actual useful life resulting in an increase in depreciation expense and potentially resulting in an impairment loss. A longer actual useful life will result in a decrease in depreciation expense.
Vessel Lives and Impairment
Description.
We review vessels and equipment for impairment whenever events or circumstances indicate the carrying value of an asset, including the carrying value of the charter contract, if any, under which the vessel is employed, may not be recoverable. This occurs when the asset’s carrying value is greater than the future undiscounted cash flows the asset is expected to generate over its remaining useful life. If the estimated future undiscounted cash flows of an asset exceed the asset’s carrying value, no impairment is recognized even though the fair value of the asset may be lower than its carrying value. If the estimated future undiscounted cash flows of an asset are less than the asset’s carrying value and the fair value of the asset is less than its carrying value, the asset is written down to its fair value. Fair value is calculated as the net present value of estimated future cash flows, which, in certain circumstances, will approximate the estimated market value of the vessel. For a vessel under charter, the discounted cash flows from that vessel may exceed or be less than its market value, as market values may assume the vessel is not employed on an existing charter.
Judgments and Uncertainties.
Our estimates of future undiscounted cash flows used to determine whether a vessel's carrying value is recoverable involves assumptions about future charter rates, vessel utilization, operating expenses, dry-docking expenditures, vessel residual values, redeployment assumptions for vessels on long-term charter, the probability of the vessels being sold and the remaining estimated life of our vessels. Our estimated charter rates are based on rates under existing vessel contracts and market rates at which we expect we can re-charter our vessels. Our estimates of operating expenses and dry-docking expenditures are based on historical operating and dry-docking costs and our expectations of future inflation and operating requirements. Vessel residual values are a product of a vessel’s lightweight tonnage and an estimated scrap rate. The remaining estimated lives of our vessels used in our estimates of future cash flows are consistent with those used in the calculations of depreciation.
In our experience, certain assumptions relating to our estimates of future cash flows are more predictable by their nature, including estimated revenue under existing contract terms, ongoing operating costs and remaining vessel life. Certain assumptions relating to our estimates of future cash flows require more discretion and are inherently less predictable, such as future charter rates beyond the firm period of existing contracts and vessel residual values, due to factors such as the volatility in vessel charter rates and vessel values.
To estimate the future undiscounted cash flows for FPSO units, additional estimates are made including, level of oil production, average annual oil price, oil field reserves, redeployment prospects for the FPSO units, redeployment rates, amount of capital investments required before redeployment to a new field and any idle time before redeployment. Should actual results differ significantly from our estimates and assumptions, we may be required to recognize impairments of the carrying values of the assets.
81
We believe that the assumptions used to estimate future cash flows of our vessels are reasonable at the time they are made. We can make no assurances, however, as to whether our estimates of future cash flows, particularly future vessel charter rates, vessel values or redeployment assumptions for our FPSO units, will be accurate.
Effect if Actual Results Differ from Assumptions.
If we conclude that a vessel or equipment is impaired, we recognize a loss in an amount equal to the excess of the carrying value of the asset over its fair value at the date of impairment. The written-down amount becomes the new lower cost basis and will result in a lower annual depreciation expense than for periods before the vessel impairment.
Consequently, any changes in our estimates of future undiscounted cash flows may result in a different impairment amount, including no impairment, and a different future annual depreciation expense.
The following table presents, by type of vessel, the aggregate market values and carrying values of certain of our vessels that we have determined have a market value that may be less than their carrying value as of December 31, 2018. We have excluded those assets operating on charter contracts where the remaining term is significant and the estimated future undiscounted cash flows relating to such charter contracts are sufficiently greater than the carrying value of the vessels such that we consider it unlikely that an impairment would be recognized in 2019. While the market values of these vessels may be below their carrying values, no impairment has been recognized on any of these vessels as the estimated future undiscounted cash flows relating to such vessels are greater than their carrying values. The vessels included in the following table generally include those vessels employed on single-voyage, or “spot” charters, as well as those vessels near the end of existing charter contracts.
We would consider the vessels reflected in the following table, as well as our FPSO units described in the paragraph below the table, to be at a higher risk of future impairment than our vessels not reflected in the table. The table is disaggregated for vessels which have estimated future undiscounted cash flows that are marginally or significantly greater than their respective carrying values. The recognition of an impairment in the future may be more likely for those vessels that have estimated future undiscounted cash marginally greater than their respective carrying values. Vessels with estimated future cash flows significantly greater than their respective carrying values would not likely be impaired in the next 12 months unless they are disposed of. In deciding whether to dispose of a vessel, we determine whether it is economically preferable to sell the vessel or continue to operate it. This assessment includes an estimate of the net proceeds expected to be received if the vessel is sold in its existing condition compared to the present value of the vessel’s estimated future cash flows. Such estimates are based on the terms of the existing charter, charter market outlook and estimated operating costs, given a vessel’s type, condition and age.
|
(in thousands of U.S. dollars, except number of vessels)
Type of Vessel
|
Number of
Vessels
|
Market Value
(1)
|
Carrying
Value
|
|||||||
|
Conventional Tankers
(2)
|
11
|
|
163,400
|
|
276,763
|
|
||||
|
Conventional Tankers
(3)
|
32
|
|
816,000
|
|
1,281,396
|
|
||||
|
Liquefied Gas Carriers
(3)
|
3
|
|
100,250
|
|
146,416
|
|
||||
|
(1)
|
Market values are based on second-hand market comparable values. Since vessel values can be volatile, our estimates of market value may not be indicative of either the current or future prices we could obtain if we sold any of the vessels.
|
|
(2)
|
Undiscounted cash flows for these vessels are marginally greater than their carrying values.
|
|
(3)
|
Undiscounted cash flows for these vessels are significantly greater than their carrying values.
|
In addition to the vessels in the table above, we own three FPSO units that had an aggregate carrying value of
$279.4 million
and which had estimated market values lower than carrying values at
December 31, 2018
. There is no liquid second-hand market for FPSO units and their market values are largely based on the terms of their existing charter contracts, among other factors. An FPSO unit’s market value is based on its ability to be employed on charter contracts and uncertainties exist about extensions of existing charter contracts and redeployments onto new charter contracts in the future. Such uncertainties include the duration of charter contract extensions and redeployment contracts, the charter rate of contract extensions and redeployment contracts, the amount of idle time between charter contracts, future oil prices, oil production volumes and the amount of any capital investment required to enable the FPSO unit to operate on new fields. Such uncertainties can result in a wide range of potential estimates of future cash flows and thus, the market value. However, if the FPSO units are sold based on the charter contracts that existed as at December 31, 2018, we estimate that this could result in a material accounting loss on sale.
Dry docking
Description
. We capitalize a substantial portion of the costs we incur during dry docking and amortize those costs on a straight-line basis over the useful life of the dry dock. We expense costs related to routine repairs and maintenance incurred during dry docking that do not improve operating efficiency or extend the useful lives of the assets and for annual class survey costs on our FPSO units. When significant dry-docking expenditures occur prior to the expiration of the original amortization period, the remaining unamortized balance of the original dry-docking cost and any unamortized intermediate survey costs are expensed in the period of the subsequent dry dockings.
Judgments and Uncertainties.
Amortization of capitalized dry-dock expenditures requires us to estimate the period of the next dry-docking and useful life of dry-dock expenditures. While we generally dry dock each vessel every two and a half to five years, we may dry dock the vessels at an earlier date, with a shorter life resulting in an increase in the amortization expense.
Effect if Actual Results Differ from Assumptions.
If we change our estimate of the next dry-dock date for a vessel, we will adjust our annual amortization of dry-docking expenditures.
82
Goodwill and Intangible Assets
Description
. We allocate the cost of acquired businesses to the identifiable tangible and intangible assets and liabilities acquired, with the remaining amount being classified as goodwill. Certain intangible assets, such as time-charter contracts, are being amortized over time. Our future operating performance will be affected by the amortization of intangible assets and potential impairment charges related to goodwill or intangible assets. Accordingly, the allocation of the purchase price to intangible assets and goodwill may significantly affect our future operating results. Goodwill and indefinite-lived assets are not amortized, but reviewed for impairment annually, or more frequently if impairment indicators arise. The process of evaluating the potential impairment of goodwill and intangible assets is highly subjective and requires significant judgment at many points during the analysis.
Goodwill is not amortized, but reviewed for impairment at the reporting unit level on an annual basis or more frequently if an event occurs or circumstances change that would more likely than not reduce the fair value of a reporting unit to below its carrying value. When goodwill is reviewed for impairment,
the Company will measure the amount by which a reporting unit's carrying value exceeds its fair value, with the maximum impairment not to exceed the carrying value of goodwill.
Judgments and Uncertainties
. The allocation of the purchase price of acquired companies requires management to make significant estimates and assumptions, including estimates of future cash flows expected to be generated by the acquired assets and the appropriate discount rate to value these cash flows. In addition, the process of evaluating the potential impairment of goodwill and intangible assets is highly subjective and requires significant judgment at many points during the analysis. The fair value of our reporting units was estimated based on discounted expected future cash flows using a weighted-average cost of capital rate. The estimates and assumptions regarding expected cash flows and the appropriate discount rates require considerable judgment and are based upon existing contracts, historical experience, financial forecasts and industry trends and conditions.
Effect if Actual Results Differ from Assumptions.
As of
December 31, 2018
, we had four reporting units with goodwill attributable to them. As of the date of this Annual Report, we do not believe that there is a reasonable possibility that the goodwill attributable to our four reporting units with goodwill attributable to them might be impaired within the next year. However, certain factors that impact our goodwill impairment tests are inherently difficult to forecast and as such we cannot provide any assurances that an impairment will or will not occur in the future. An assessment for impairment involves a number of assumptions and estimates that are based on factors that are beyond our control. Please read “Part I—Forward-Looking Statements.”
Impairment of Investments
Description.
We evaluate our equity-accounted investments for impairment when events or circumstances indicate that the estimated fair value of such investments may have experienced an other-than-temporary decline in value below their carrying value. If an e
quity-accounted investment experiences such an other-than-temporary decline in value
, the carrying value of the investment is written down to its estimated fair value and the resulting impairment is recorded in our
consolidated statements of (loss) income
.
Judgments and Uncertainties.
The determination of whether the estimated fair value of an equity-accounted investment has experienced an other-than-temporary decline in value below its carrying value may require management to make significant estimates or judgments. This may include reviewing the length of time and the extent to which the market value has been less than cost, assessing the financial condition and near-term prospects of the investee and making a determination of the intent and ability of the holder to retain its investment in the issuer for a period of time sufficient to allow for any anticipated recovery in market value.
During the fourth quarter of 2018, the fair market value of our investment in Teekay Offshore declined below its carrying value and remained that way through December 31, 2018. Management has determined that the decrease in the quoted market price is not indicative of a loss that is other-than-temporary due in part to the relatively short length of time that the fair market value has declined below its carrying value combined with the absence of any specific events or circumstances indicating a loss in value, and the assessment that we have the intent and ability to retain our investment in Teekay Offshore for a period of time sufficient to allow for any anticipated recovery in market value.
Effect if Actual Results Differ from Assumptions.
If we had concluded that our investment in Teekay Offshore had experienced an other-than-temporary decline in value below its carrying value in 2018, we would have recognized a loss of $67.7 million during 2018. Based on the publicly-traded unit price of Teekay Offshore's outstanding common units of $1.20 at March 29, 2019, the fair value of this investment was
$67.9 million
(
December 31, 2018
–
$68.5 million
).
83
Valuation of Derivative Financial Instruments
Description.
Our risk management policies permit the use of derivative financial instruments to manage foreign currency fluctuation, interest rate, bunker fuel price and spot tanker market rate risk. In addition, we have stock purchase warrants, a type of option agreement, to acquire up to an additional 16.3 million shares of Teekay Offshore’s common units at a fixed price. See “Item 18 – Financial Statements:
Note 15 — Derivative Instruments and Hedging Activities
”. Changes in fair value of derivative financial instruments that are not designated as cash flow hedges for accounting purposes are recognized in earnings in the consolidated statement of income. Changes in fair value of derivative financial instruments that are designated as cash flow hedges for accounting purposes are recorded in other comprehensive income and are reclassified to earnings in the consolidated statement of income when the hedged transaction is reflected in earnings. Ineffective portions of the hedges are recognized in earnings as they occur. During the life of the hedge, we formally assess whether each derivative designated as a hedging instrument continues to be highly effective in offsetting changes in the fair value or cash flows of hedged items. If we determine that a hedge has ceased to be highly effective, we will discontinue hedge accounting prospectively.
Judgments and Uncertainties.
A substantial majority of the fair value of our derivative instruments and the change in fair value of our derivative instruments from period to period result from our use of interest rate swap agreements and our holding of stock purchase warrants. The fair value of our derivative instruments is the estimated amount that we would receive or pay to terminate the agreements in an arm’s length transaction under normal business conditions at the reporting date, taking into account current interest rates, foreign exchange rates and the current credit worthiness of us and the swap counterparties. The estimated amount for interest rate swaps is the present value of estimated future cash flows, being equal to the difference between the benchmark interest rate and the fixed rate in the interest rate swap agreement, multiplied by the notional principal amount of the interest rate swap agreement at each interest reset date. For the stock purchase warrants, we take into account the stock price of Teekay Offshore, the expected volatility of the Teekay Offshore stock price and an estimate of the risk-free rate over the term of the warrants.
The fair value of our interest rate swap agreements at the end of each period is most significantly impacted by the interest rate implied by the benchmark interest rate yield curve, including its relative steepness. Interest rates have experienced significant volatility in recent years in both the short and long-term. While the fair value of our interest rate swap agreements is typically more sensitive to changes in short-term rates, significant changes in the long-term benchmark interest rate also materially impact our interest rate swap agreements.
The fair value of our interest rate swap agreements is also impacted by changes in our specific credit risk included in the discount factor. We discount our interest rate swap agreements with reference to the credit default swap spreads of similarly rated global industrial companies and by considering any underlying collateral. The process of determining credit worthiness requires significant judgment in determining which source of credit risk information most closely matches our risk profile.
The benchmark interest rate yield curve and our specific credit risk are expected to vary over the life of the interest rate swap agreements. The larger the notional amount of the interest rate swap agreements outstanding and the longer the remaining duration of the interest rate swap agreements, the larger the impact of any variability in these factors will be on the fair value of our interest rate swaps. We economically hedge the interest rate exposure on a significant amount of our long-term debt and for long durations. As such, we have historically experienced, and we expect to continue to experience, material variations in the period-to-period fair value of our derivative instruments.
The fair value of our Teekay Offshore stock purchase warrants at the end of each period is most significantly impacted by the stock price of Teekay Offshore and the expected future volatility of the Teekay Offshore stock price. The cyclical nature of the offshore industry may cause significant increases or decreases in the value of Teekay Offshore’s vessels, Teekay Offshore’s stock price and the value of the stock purchase warrants we hold.
Effect if Actual Results Differ from Assumptions.
Although we measure the fair value of our derivative instruments utilizing the inputs and assumptions described above, if we were to terminate the agreements or sell the stock purchase warrants at the reporting date, the amount we would pay or receive to terminate the derivative instruments and the amount we would receive upon sale of the stock purchase warrants may differ from our estimate of fair value. If the estimated fair value differs from the actual termination amount, an adjustment to the carrying amount of the applicable derivative asset or liability would be recognized in earnings for the current period. Such adjustments could be material. See “Item 18 – Financial Statements:
Note 15 — Derivative Instruments and Hedging Activities
” for the effects on the change in fair value of our derivative instruments on our
consolidated statements of (loss) income
.
84
|
Item 6.
|
Directors, Senior Management and Employees
|
Directors and Senior Management
Our directors and executive officers as of the date of this Annual Report and their ages as of
December 31, 2018
are listed below:
|
Name
|
Age
|
Position
|
||
|
C. Sean Day
|
69
|
Chair Emeritus
|
||
|
Peter S. Janson
|
71
|
Director
|
||
|
Rudolph Krediet
|
41
|
Director
|
||
|
Heidi Locke Simon
|
51
|
Director
|
||
|
Bjorn Moller
|
61
|
Director
|
||
|
Tore I. Sandvold
|
71
|
Director
|
||
|
David Schellenberg
|
55
|
Director
|
||
|
Alan Semple
|
59
|
Director
|
||
|
Bill Utt
|
61
|
Director and Chair
|
||
|
Arthur Bensler
|
61
|
Executive Vice President, Secretary and General Counsel
|
||
|
William Hung
|
47
|
Executive Vice President, Strategic Development
|
||
|
Kenneth Hvid
|
50
|
President and Chief Executive Officer
|
||
|
Mark Kremin
|
48
|
President and Chief Executive Officer, Teekay Gas Group Ltd.
|
||
|
Vincent Lok
|
50
|
Executive Vice President and Chief Financial Officer
|
||
|
Kevin Mackay
|
50
|
President and Chief Executive Officer, Teekay Tankers Ltd.
|
||
Directors C. Sean Day, Peter S. Janson and Tore I. Sandvold will retire from the Board, and Chair Bill Utt will resign from his role as Chair and as a director, effective at our June 2019 annual meeting of shareholders. Mr. Schellenberg will replace Mr. Utt as Chair. The Board has appointed Kenneth Hvid, Teekay’s President and Chief Executive Officer
,
to serve as a Director following Mr. Day’s retirement. The Board has also nominated Peter Antturi to stand for election as a director at the June 2019 annual meeting of shareholders. Among other things, Mr. Antturi serves as an executive officer and director of Teekay’s largest shareholder, Resolute Investments, Ltd. (or
Resolute
) and previously served as President of Teekay’s shuttle tankers division and as our Senior Vice President and Chief Financial Officer
.
Certain biographical information about each of these individuals included in the table above is set forth below:
C. Sean Day
has served as director of Teekay Corporation since 1998, taking on the role as Chair of the Board from 1999 until June 2017. He continues to serve on the Board as Chair Emeritus. He currently also serves as director of Teekay GP L.L.C., the general partner of Teekay LNG Partners L.P., where he also served as Chair until 2015. In addition, he served as the Chair of Teekay Offshore GP L.L.C., the general partner of Teekay Offshore Partners L.P. from 2006 to 2017, and as Chair of Teekay Tankers Ltd, from 2007 to 2013. From 1989 to 1999, Mr. Day was President and Chief Executive Officer of Navios Corporation, a large bulk shipping company based in Stamford, Connecticut. Prior to Navios, Mr. Day held a number of senior management positions in the shipping and finance industries. He currently serves as a director of Kirby Corporation and is Chair of Compass Diversified Holdings. Mr. Day is engaged as a consultant to Kattegat Limited, the parent company of Resolute, our largest shareholder, to oversee its investments, including that in the Teekay group of companies.
Peter S. Janson
has served as a Teekay director since 2005.
Mr. Janson also serves as director of Guaranty Company of North America, a Canadian privately held Surety and P&C Insurance Company.
From 1999 to 2002, Mr. Janson was the Chief Executive Officer of Amec Inc. (formerly Agra Inc.), a publicly traded engineering and construction company. From 1986 to 1994, he served as the President and Chief Executive Officer of Canadian operations for Asea Brown Boveri Inc., a company for which he also served as Chief Executive Officer for U.S. operations from 1996 to 1999. Mr. Janson has also served as a member of the Business Round Table in the United States and as a member of the National Advisory Board on Sciences and Technology in Canada.
Rudolph Krediet
joined the Teekay Board in September 2017. Mr. Krediet brings over 15 years of experience as a financial investment professional. He has served as a Partner at Anholt Services (USA), a wholly-owned subsidiary of Kattegat Trust, which oversees the trust’s globally diverse investment portfolio, since 2013.
Kattegat Trust is a parent company of Kattegat Limited.
Mr. Krediet has acted as Principal at Compass Group Management LLC, the manager of Compass Diversified Holdings, a publicly traded investment holding company, from 2010 to 2013, and as Vice President from 2006 to 2009. He acted as Vice President at CPM Roskamp Champion, a global leader in the design of manufacturing of oil seed processing equipment, from 2003 to 2004.
Mr. Krediet has a MBA from the Darden Graduate School of Business at the University of Virginia.
85
Heidi Locke Simon
joined the Teekay Board in September 2017. Ms. Locke Simon brings over 20 years of strategic management experience to the Teekay Board. She was formerly a Partner at Bain & Company, a global management consulting organization, where she worked from 1993 to 2012. Prior to this, Ms. Locke Simon was an Investment Banking Analyst at Goldman, Sachs & Co. She has contributed to HBS Community Partners, a volunteer consulting organization, from 2013 to 2016. She served as a Board Observer with Teekay from 2016 to September 2017, a director of KQED Public Media from 2008 to 2014 and director of Turning Green from 2004 to present.
Ms. Locke Simon holds an MBA from Harvard Business School. Ms. Locke Simon is engaged as a consultant to Kattegat Limited, the parent company of Resolute Investments.
Bjorn Moller
has served as a Teekay director since 1998. Mr. Moller also served as Teekay's President and Chief Executive Officer from 1998 until 2011. Mr. Moller also served as Vice Chair of Teekay GP L.L.C., the general partner of Teekay LNG Partners L.P., Vice Chair of Teekay Offshore GP L.L.C., the general partner of Teekay Offshore Partners L.P. and as a director and the Chief Executive Officer of Teekay Tankers Ltd. Mr. Moller remains a director of Teekay Tankers Ltd. Mr. Moller has over 35 years of experience in the shipping industry, and served as Chair of the International Tanker Owners Pollution Federation from 2006 to 2013. He served in senior management positions with Teekay for more than 20 years and headed our overall operations beginning in 1997, following his promotion to the position of Chief Operating Officer. Prior to this, Mr. Moller led our global chartering operations and business development activities. Mr. Moller is also a director of Kattegat Limited, the parent company of Resolute.
Tore I. Sandvold
has served as a Teekay director since 2003. He has over 30 years of experience in the oil and energy industry. From 1973 to 1987, he served in the Norwegian Ministry of Industry, Oil & Energy in a variety of positions in the areas of domestic and international energy policy. From 1987 to 1990, he served as the Counselor for Energy in the Norwegian Embassy in Washington, D.C. From 1990 to 2001, Mr. Sandvold served as Director General of the Norwegian Ministry of Oil & Energy, with overall responsibility for Norway's national and international oil and gas policy. From 2001 to 2002, he served as Chair of the Board of Petoro, the Norwegian state-owned oil company that is the largest oil asset manager on the Norwegian continental shelf. From 2002 to the present, Mr. Sandvold, through his company, Sandvold Energy AS, has acted as advisor to companies and advisory bodies in the energy industry. Mr. Sandvold serves on other Boards, including those of Lambert Energy Advisory Ltd., Energy Policy Foundation of Norway, and Rowan Companies plc.
David Schellenberg
joined the Teekay Board in September 2017. Mr. Schellenberg brings over 25 years of financial and operating leadership to the Teekay Board and is currently a Managing Director and Principal with Highland West Capital, a Private Equity firm in Vancouver. Prior to that, he was with Conair Group and its subsidiary Cascade Aerospace, specialty aviation and aerospace businesses, from 2000 to 2013 and was President and CEO from 2007 to 2013. Mr. Schellenberg also acted as a Managing Director in the Corporate Office of the Jim Pattison Group, Canada’s second largest private company, from 1991 to 2000. Mr. Schellenberg holds an MBA, is a member of the Young Presidents’ Organization and is a fellow of the Chartered Professionals Accountants of Canada (FCPA, FCA).
Alan Semple
has served as a Teekay director since 2015. Mr. Semple brings over 30 years of finance experience primarily in the energy industry, to the Teekay Board. He was formerly Director and Chief Financial Officer at John Wood Group PLC (Wood Group), a provider of engineering, production support and maintenance management services to the oil and gas and power generation industries, a role he held from 2000 until his retirement in May 2015. Prior to this, he held a number of senior finance roles in Wood Group from 1996. Mr. Semple currently serves on the Board of Directors of Cactus, Inc. (NYSE) where he is Chair of the Audit Committee.
Bill Utt
has served as a Teekay director since 2015 and was appointed Chair in June 2017. He has served as Chair and director of Teekay Offshore GP L.L.C., the general partner of Teekay Offshore Partners L.P. since June 2017, and in September 2018 was appointed to the Board of Teekay GP L.L.C., the general partner of Teekay LNG Partners L.P. Mr. Utt brings over 33 years of engineering and energy industry experience to the Teekay Board. From 2006 until his retirement in 2014, he served as Chair, President and Chief Executive Officer of KBR Inc., a global engineering, construction and services company. From 1995 to 2006, Mr. Utt served as the President and CEO of SUEZ Energy North America and President and CEO of Tractebel’s North American energy businesses. Prior to 1995, he held senior management positions with CRSS, Inc., which was a developer and operator of independent power and industrial energy facilities prior to its merger with Tractebel in 1995. Mr. Utt also currently serves as a member of the Board of Directors for Brand Industrial Holdings Inc., a Clayton, Dubilier & Rice, LLC portfolio company.
Arthur Bensler
joined Teekay in 1998 as General Counsel. He was promoted to the position of Vice President in 2002 and became Corporate Secretary in 2003. He was appointed Senior Vice President in 2004 and Executive Vice President in 2006. In June 2013, Mr. Bensler was appointed Director and Chair of Teekay Tankers Ltd. having served as Secretary from 2007 to September 2014. Prior to joining Teekay, Mr. Bensler was a partner in a large Vancouver, Canada law firm, where he practiced corporate, commercial and maritime law from 1987 until joining Teekay.
William Hung
joined Teekay in 1995 and has served as Executive Vice President, Strategic Development since February 2016. Prior to this position, Mr. Hung had worked in a variety of roles at Teekay including Chartering, Business Development, Finance and Accounting, Commercial and Strategic Development. Additionally, Mr. Hung served as Chief Executive Officer of Tanker Investments Ltd. from January 2014 until its merger with Teekay Tankers Ltd. in November 2017.
86
Kenneth Hvid
was appointed President and Chief Executive Officer of Teekay in February 2017. He has served as a director of Teekay Offshore GP LLC, the general partner of Teekay Offshore Partners L.P. since 2011, as director of Teekay Tankers Ltd. since February 2017, and was reappointed as director of Teekay GP L.L.C., the general partners of Teekay LNG Partners L.P. in September 2018, having served as director from 2011 to 2015. He joined Teekay in 2000 and was responsible for leading our global procurement activities until he was promoted in 2004 to Senior Vice President, Teekay Gas Services. During this time, Mr. Hvid was involved in leading Teekay through its entry and growth in the LNG business. He held this position until the beginning of 2006, when he was appointed President of our Teekay Navion Shuttle Tankers and Offshore division. In that role, he was responsible for our global shuttle tanker business as well as initiatives in the floating storage and offtake business and related offshore activities. Mr. Hvid served as Chief Strategy Officer and Executive Vice President from 2011 to 2015, and as President and Chief Executive Officer of Teekay Offshore Group Ltd., from 2015 until January 2017. Mr. Hvid has 30 years of global shipping experience, 12 of which were spent with A.P. Moller in Copenhagen, San Francisco and Hong Kong. In 2007, Mr. Hvid joined the Board of Gard P.& I. (Bermuda) Ltd.
Mark Kremin
was appointed President & CEO of Teekay Gas Group Ltd., a company that provides services to Teekay LNG Partners L.P. and its subsidiaries, in February 2017. He was appointed President of Teekay Gas Services in 2015 having acted as its Vice President since 2006. Mr. Kremin has over 20 years of experience in shipping. In 2000, he joined Teekay as in-house counsel. He subsequently held commercial roles within Teekay Gas Services. He represents Teekay on the Boards of joint ventures with partners in Asia, Europe and the Middle East. Prior to joining Teekay, he was an attorney in an admiralty law firm in Manhattan. Prior to attending law school in New York City, he worked for a leading owner and operator of container ships.
Vincent Lok
has served as Teekay’s Executive Vice President and Chief Financial Officer since 2007. He has held a number of finance and accounting positions with Teekay, including Controller from 1997 until his promotions to the positions of Vice President, Finance in 2002, Senior Vice President and Treasurer in 2004, and Senior Vice President and Chief Financial Officer in 2006. Mr. Lok served as director of Teekay GP LLC, the general partner of Teekay LNG Partners L.P. from 2015 to September 2018, and as the Chief Financial Officer of Teekay Tankers Ltd. from 2007 to 2017. Prior to joining Teekay, Mr. Lok worked as a Chartered Professional Accountant with Deloitte & Touche LLP. Mr. Lok is also a Chartered Financial Analyst.
Kevin Mackay
was a
ppointed as President and Chief Executive Officer of Teekay Tankers Ltd
. a controlled subsidiary of Teekay,
in 2014. Mr. Mackay joined Teekay Tankers from Phillips 66, where he headed the global marine business unit and held a similar role as the General Manager, Commercial Marine at ConocoPhillips from 2009 to 2012 before the formation of Phillips 66. Mr. Mackay started his career working for Neptune Orient Lines in Singapore from 1991 to 1995. He then joined AET Inc. Limited (AET) (formerly American Eagle Tankers Inc.) in Houston, becoming the Regional Director - Americas, Senior Vice President.
Mr. Mackay holds a B.Sc. (Econ) Honours from the London School of Economics & Political Science and has extensive international experience
.
Compensation of Directors and Senior Management
Director Compensation
The aggregate cash fees received by the nine non-employee directors listed above under Directors and Senior Management
and one
individual who served as a non-employee director and retired in March 2018, for their service as directors, plus reimbursement of their out-of-pocket expenses, was approximately $1.5 million. Each non-employee director receives an annual cash retainer of $90,000. The Chair of the Board also receives an annual cash retainer of $275,000. Members of the Audit Committee, Compensation and Human Resources Committee, and Nominating and Governance Committee each receive an annual cash fee of $10,000. The Chairs of the Audit Committee, Compensation and Human Resources Committee, and Nominating and Governance Committee each receive an annual cash fee of $20,000, $17,500 and $15,000, respectively.
Each non-employee director also receives a $110,000 annual retainer to be paid by way of a grant of, at the director’s election, restricted stock or stock options under our 2013 Equity Incentive Plan (or the
2013 Plan
). Pursuant to this annual retainer, during 2018, we granted stock options to purchase an aggregate of 218,855 shares of our common stock at an exercise price of $8.67 per share and 53,918 shares of restricted stock.
The Chair of the Board also receives a
$225,000 annual retainer to be paid by way of a grant of, at the Chair’s election, restricted stock or stock options under our 2013 Equity Incentive Plan. Pursuant to this annual retainer, during 2018, we granted 25,951 shares of restricted stock to Bill Utt.
The stock options described in this section expire March 12, 2028, ten years after the date of their grant. The stock options and restricted stock vest as to one-third of the shares on each of the first three anniversaries of their respective grant dates.
Annual Executive Compensation
The aggregate compensation earned in
2018
by Teekay’s six executive officers listed above under Directors and Senior Management (or the
Executive Officers
), excluding equity-based compensation described below, was $6.1 million.
This is comprised of base salary ($2.7 million), annual bonus ($2.4 million) and pension and other benefits ($1 million).
These amounts were paid primarily in Canadian Dollars, but are reported here in U.S. Dollars using an average exchange rate of 1.30 Canadian Dollars for each U.S. Dollar for
2018
. Teekay’s annual bonus plan considers both company performance and team performance.
87
Long-Term Incentive Program
Teekay’s long-term incentive program focuses on the returns realized by our shareholders and is intended to acknowledge and retain those executives who can influence our long-term performance. The long-term incentive plan provides a balance against short-term decisions and encourages a longer time horizon for decisions. This program consists of grants of stock option and restricted stock units. All grants in
2018
were made under our 2013 Plan.
During March
2018
, we granted stock options to purchase an aggregate of 668,772 shares of our common stock at an exercise price of $8.67 and 342,508 shares of restricted stock to Teekay's Executive Officers under our 2013 Plan. The stock options expire March 12, 2028, ten years after the date of grant. The stock options and restricted stock units vest as to one-third of the shares on each of the first three anniversaries of their grant dates.
Options to Purchase Securities from Registrant or Subsidiaries
In March 2013, we adopted the 2013 Plan and suspended the 1995 Stock Option Plan and the 2003 Equity Incentive Plan (collectively referred to as the
Plans
). As at
December 31, 2018
, we had reserved pursuant to our 2013 Plan
5,777,326
shares (
December 31, 2017
–
5,115,308
) of common stock.
During
2018
,
2017
and
2016
, we granted options under the 2013 Plan to acquire up to
1,048,916
,
732,314
and
916,015
shares of Common Stock, respectively, to eligible officers, employees and directors. Each option under the Plans has a 10-year term and vests equally over three years from the grant date. The outstanding options under the Plans as at
December 31, 2018
are exercisable at prices ranging from $8.67 to $56.76 per share, with a weighted-average exercise price of $
15.54
per share and expire between March 8, 2019 and March 12, 2028.
Starting in 2013, employees who provide services to our publicly-traded subsidiaries (Teekay LNG and Teekay Tankers) and our equity-accounted investee (Teekay Offshore), received a proportion of their annual equity compensation award under the equity compensation plan of the applicable Daughter Entity (the Teekay LNG Partners L.P. 2005 Long-Term Incentive Plan, the Teekay Tankers Ltd. 2007 Long-Term Incentive Plan or the Teekay Offshore Partners L.P. 2006 Long-Term Incentive Plan), depending on their level of contribution towards the applicable subsidiary. These awards generally took the form of Restricted Stock Units (or
RSUs
), which are described as Phantom Units under the Teekay Offshore Partners L.P. 2006 Long-Term Incentive Plan and the Teekay LNG Partners L.P. 2005 Long-Term Incentive Plan, but we refer to all of these awards as RSUs for purposes of this disclosure.
Teekay Tankers also granted stock options starting in 2014 to certain senior employees.
The RSUs vest and become payable with respect to one-third of the shares on each of the first three years following the grant date and accrue distributions or dividends from the date of the grant to the date of vesting.
Stock options vest one-third on each of the first three years and expire ten years after the date of their grant.
Board Practices
Our Board of Directors
currently consists of nine members as listed above under Directors and Senior Management. The Board of Directors is divided into three classes, with members of each class elected to hold office for a term of three years in accordance with the classification indicated below or until his or her successor is elected and qualified.
Following the 2019 annual meeting and related Board membership changes described above, the Board intends to reduce the size of the Board to seven members. Director David Schellenberg’s term expires in 2019, and he will stand for election at the 2019 annual meeting along with Peter Antturi. Directors Rudolph Krediet, Bjorn Moller and Heidi Locke Simon have terms expiring in 2020. Director Alan Semple, and Kenneth Hvid, who has been elected to the Board effective as of the 2019 annual meeting, will each have terms expiring in 2021. Bill Utt currently serves as Chair of the Board and will be succeeded by David Schellenberg following Mr. Utt’s resignation in June 2019.
There are no service contracts between us and any of our directors providing for benefits upon termination of their employment or service.
The Board of Directors has determined that each of the current members of the Board and director nominee has no material relationship with Teekay (either directly or as a partner, shareholder or officer of an organization that has a relationship with Teekay), and is independent within the meaning of our director independence standards, which reflect the New York Stock Exchange (or NYSE) director independence standards as currently in effect and as they may be changed from time to time. In making this determination, the Board considered the relationships of C. Sean Day, Bjorn Moller, Rudolph Krediet, Heidi Locke Simon and director nominee Peter Antturi with our largest shareholder or its affiliates and concluded these relationships do not materially affect their independence as directors. Please read “Item 7 - Major Shareholders and Certain Relationships and Related Party Transactions.”
The Board of Directors has adopted Corporate Governance Guidelines that address, among other things, director qualification standards, director functions and responsibilities, director access to management, director compensation and management succession. This document is available under “Investors - Teekay Corporation - Governance” from the home page of our web site at www.teekay.com.
The NYSE does not require a company like ours, which is a “foreign private issuer,” to have a majority of independent directors on the Board of Directors or to establish compensation or nominating/corporate governance committees composed of independent directors.
88
The Board of Directors has the following three committees: Audit Committee, Compensation and Human Resources Committee, and Nominating and Governance Committee. The membership of these committees during 2018 and the function of each of the committees are described below. Each of the committees is currently comprised of independent members and operates under a written charter adopted by the Board. All of the committee charters are available under “Investors - Teekay Corporation - Governance” from the home page of our web site at www.teekay.com. During 2018, the Board held eleven meetings. Each director attended all Board meetings, with the exception of one director, who was absent from one meeting. During 2018, the Board held 14 committee meetings. Each director who was a member of a committee attended all applicable committee meetings, except for one committee member, who was absent from one meeting.
Our Audit Committee is composed entirely of directors who satisfy applicable NYSE and SEC audit committee independence standards. Our Audit Committee is currently comprised of Alan Semple (Chair), Heidi Locke Simon and David Schellenberg. All members of the committee are financially-literate and the Board has determined that Mr. Semple qualifies as an audit committee financial expert.
The Audit Committee assists the Board in fulfilling its responsibilities for general oversight of:
|
•
|
the integrity of our consolidated financial statements;
|
|
•
|
our compliance with legal and regulatory requirements;
|
|
•
|
the independent auditors’ qualifications and independence; and
|
|
•
|
the performance of our internal audit function and independent auditors.
|
Our Compensation and Human Resources Committee is composed entirely of directors who satisfy applicable NYSE compensation committee independence standards. This committee is currently comprised of Peter S. Janson (Chair), C. Sean Day, Rudolph Krediet and David Schellenberg.
The Compensation and Human Resources Committee:
|
•
|
reviews and approves corporate goals and objectives relevant to the Chief Executive Officer’s compensation, evaluates the Chief Executive Officer’s performance in light of these goals and objectives, and determines the Chief Executive Officer’s compensation;
|
|
•
|
reviews and approves the evaluation process and compensation structure for executive officers, other than the Chief Executive Officer, evaluates their performance and sets their compensation based on this evaluation;
|
|
•
|
reviews and makes recommendations to the Board regarding compensation for directors;
|
|
•
|
establishes and administers long-term incentive compensation and equity-based plans; and
|
|
•
|
oversees our other compensation plans, policies and programs.
|
Our Nominating and Governance Committee is currently comprised of Bjorn Moller (Chair), Tore I. Sandvold, Bill Utt, and Heidi Locke Simon.
The Nominating and Governance Committee:
|
•
|
identifies individuals qualified to become Board members
and recommends to the Board of Directors nominees for election as directors;
|
|
•
|
maintains oversight of the operation and effectiveness of the Board and our corporate governance and management;
|
|
•
|
develops, updates and recommends to the Board corporate governance principles and policies applicable to us, monitors compliance with these principles and policies; and
|
|
•
|
oversees the evaluation of the Board and its committees.
|
Crewing and Staff
As at
December 31, 2018
, we employed approximately 4,800 seagoing staff serving on our consolidated and equity-accounted vessels managed by us, and 780 shore-based personnel, compared to approximately
7,200
seagoing and
1,100
shore-based personnel as at December 31, 2017, and approximately
6,800
seagoing and
1,100
shore-based personnel as at
December 31, 2016
. The 2018 seagoing staff and shore-based personnel do not include the employees of Teekay Offshore.
We regard attracting and retaining motivated seagoing personnel as a top priority. Through our global manning organization comprised of offices in Glasgow, Scotland; Manila, Philippines; Mumbai, India; Sydney, Australia; and Madrid, Spain, we offer seafarers what we believe are competitive employment packages and comprehensive benefits. We also intend to provide opportunities for personal and career development, which relate to our philosophy of promoting internally.
We are a party to a collective bargaining agreement with the Philippine Seafarers’ Union, an affiliate of the International Transport Workers’ Federation (or
ITF
), and an agreement with ITF London that cover substantially all of our junior officers and seafarers that operate our Bahamian-flagged vessels. We are also party to collective bargaining agreements with various Australian maritime unions that cover officers and seafarers employed through our Australian operations. Our officers and seafarers for our Spanish-flagged vessels are covered by a collective bargaining agreement with Spain’s Union General de Trabajadores and Comisiones Obreras. We believe our relationships with these labor unions are good, with long-term collective bargaining agreements that demonstrate commitment from both parties.
89
Our commitment to training is fundamental to the development of the highest caliber seafarers for our marine operations. Our cadet training program is designed to balance academic learning with hands-on training at sea. We have relationships with training institutions in Canada, Croatia, India, Norway, Philippines, Turkey and the United Kingdom. After receiving formal instruction at one of these institutions, the cadets’ training continues on-board a Teekay vessel. We also have an accredited Teekay-specific competence management system that is designed to ensure a continuous flow of qualified officers who are trained on our vessels and are familiar with our operational standards, systems and policies. We believe that high-quality manning and training policies will play an increasingly important role in distinguishing larger independent tanker companies that have in-house, or affiliate, capabilities from smaller companies that must rely on outside ship managers and crewing agents.
Share Ownership
The following table sets forth certain information regarding beneficial ownership, as of
December 31, 2018
, of our common stock by the nine directors and six Executive Officers as a group, described above under Directors and Senior Management. The information is not necessarily indicative of beneficial ownership for any other purpose. Under SEC rules a person or entity beneficially owns any shares that the person or entity (a) has or shares voting or investment power over or (b) has the right to acquire as of March 1, 2019 (60 days after
December 31, 2018
) through the exercise of any common stock option or other right. Unless otherwise indicated, each person or entity has sole voting and investment power (or shares such powers with his or her spouse) with respect to the shares set forth in the following table. Information for certain holders is based on information delivered to us.
|
Identity of Person or Group
|
|
Shares Owned
|
|
Percent of Class
|
|
All directors and executive officers as a group (15 persons)
(1)
|
|
1,377,429
|
|
1.37%
(3)
|
____________________________
|
(1)
|
Includes 707,995 shares of common stock subject to stock options exercisable as of March 1, 2019 under our equity incentive plans with a weighted-average exercise price of $19.94 that expire between March 8, 2019 and March 12, 2028. Excludes 1,222,418 shares of common stock subject to stock options that may become exercisable after March 1, 2019 under the plans with a weighted average exercise price of $9.06, that expire between March 7, 2026 and March 12, 2028. Excludes shares held by our largest shareholder, Resolute, whose ultimate parent is Path Spirit Limited (or Path), which is the trust protector for the trust that indirectly owns all of Resolute’s outstanding equity. For additional information on the relationships between Resolute and certain of our directors, please see the section titled “Item 7. Major Shareholders and Certain Relationships with Related Party Transactions - Relationships with our Major Shareholder”, below.
|
|
(2)
|
Each director is expected to hold shares of Teekay having a value of at least four times the value of the annual cash retainer paid to them for their Board service (excluding fees for Chair or Committee service) no later than March 1, 2019 or the fifth anniversary of the date on which the director joined the Board, whichever is later. In addition, each Executive Officer is expected to acquire shares of Teekay’s common stock equivalent in value to one to three times their annual base salary by 2018 or, for executive officers subsequently joining Teekay or achieving a position covered by the guidelines, within five years after the guidelines become applicable to them.
|
|
(3)
|
Based on a total of
100.4
million outstanding shares of our common stock as of
December 31, 2018
. Each director and Executive Officer beneficially owns less than 1% of the outstanding shares of common stock.
|
|
Item 7.
|
Major Shareholders and Certain Relationships and Related Party Transactions
|
Major Shareholders
The following table sets forth information regarding beneficial ownership, as of March 1,
2019
, of Teekay’s common stock by each person we know to beneficially own more than 5% of the common stock. Information for certain holders is based on their latest filings with the SEC or information delivered to us. The number of shares beneficially owned by each person or entity is determined under SEC rules and the information is not necessarily indicative of beneficial ownership for any other purpose. Under SEC rules, a person or entity beneficially owns any shares as to which the person or entity has or shares voting or investment power. In addition, a person or entity beneficially owns any shares that the person or entity has the right to acquire as of April 30,
2019
(60 days after March 1,
2019
) through the exercise of any stock option or other right. Unless otherwise indicated, each person or entity has sole voting and investment power with respect to the shares set forth in the following table.
|
Identity of Person or Group
|
Shares Owned
|
Percent of Class
(3)
|
||
|
Resolute Investments, Ltd.
(1)
|
31,936,012
|
31.8%
|
||
|
Cobas Asset Management, SGIIC, S.A.
(2)
|
15,030,863
|
15.0%
|
||
____________________________
|
(1)
|
Includes shared voting and shared dispositive power. The ultimate controlling person of Resolute is Path, which is the trust protector for the trust that indirectly owns all of Resolute’s outstanding equity. This information is based in part on the Schedule 13D/A (Amendment No. 8) filed by Resolute and Path with the SEC on January 29, 2018. Resolute’s beneficial ownership was
31.8%
on March 1,
2019
, and
31.9%
on March 1,
2018
. For additional information on the relationships between Resolute and certain of our directors, please see the section titled Item 7. Major Shareholders and Certain Relationships with Related Party Transactions - Relationships with our Major Shareholder”, below.
|
|
(2)
|
Includes sole voting power. This information is based on the Schedule 13G/A filed by this investor with the SEC on February 13, 2019.
|
|
(3)
|
Based on a total of
100.4
million outstanding shares of our common stock as of March 1,
2019
.
|
90
Our major shareholders have the same voting rights as our other shareholders. No corporation or foreign government or other natural or legal person owns more than 50% of our outstanding common stock. We are not aware of any arrangements, the operation of which may at a subsequent date result in a change in control of Teekay.
Teekay and certain of its subsidiaries have relationships or are parties to transactions with other Teekay subsidiaries, including Teekay’s publicly-traded subsidiaries Teekay LNG and Teekay Tankers and Teekay's publicly-traded equity-accounted investee, Teekay Offshore. Certain of these relationships and transactions are described below.
Relationships with Our Major Shareholder
As of March 1,
2019
, Resolute owned approximately
31.8%
of our outstanding common stock. The ultimate controlling person of Resolute is Path, which is the trust protector for the trust that indirectly owns all of Resolute’s outstanding equity. Two of our current directors, C. Sean Day and Heidi Locke Simon, are engaged as consultants to Kattegat Limited, the parent company of Resolute, to oversee its investments, including that in the Teekay group of companies. Mr. Day will be resigning from the Teekay Board effective as of our 2019 annual meeting of shareholders. Another of our directors, Rudolph Krediet, is partner at Anholt Services (USA), a wholly-owned subsidiary of Kattegat Limited, and Director Bjorn Moller, is a director of Kattegat Limited. Director nominee Peter Antturi serves as an executive officer and director of Resolute and other Kattegat Limited subsidiaries and affiliates. He is also an executive officer and owner of Anglemont Financial Services Ltd., a joint venture with Kattegat Limited that provides financial services to Kattegat Limited and its subsidiaries.
Our Directors and Executive Officers
Our current Chair of the Board, Bill Utt, also serves as a director of Teekay GP L.L.C. (the general partner of Teekay LNG) and of Teekay Offshore GP L.L.C. (the general partner of Teekay Offshore). He will remain as Chair and Director of Teekay Offshore GP L.L.C. following his resignation from our Board and that of Teekay GP L.L.C. effective as of our 2019 annual meeting of shareholders. Our director, C. Sean Day, also serves as a director of Teekay GP L.L.C. He will remain as a director of Teekay GP L.L.C. following his retirement from our Board at our 2019 annual meeting of shareholders. Our director, Bjorn Moller, is also a director of Teekay Tankers but will not stand for re-election at the Teekay Tankers’ 2019 annual meeting of shareholders. Director David Schellenberg has been nominated to stand for election as a director of Teekay Tankers effective at Teekay Tankers’ 2019 annual meet of shareholders. Kenneth Hvid, our President and Chief Executive Officer, is also a director of Teekay GP L.L.C. and of Teekay Offshore GP L.L.C. and has been elected to join our Board effective as of the 2019 annual meeting of shareholders. Arthur Bensler, our Executive Vice President, Secretary and General Counsel, also serves as the Chair of Teekay Tankers.
Other of our officers currently serve as the Chief Executive Officer and the Chief Financial Officer of Teekay Tankers and as the Chief Executive Officer and the Chief Financial Officer of Teekay Gas Group Ltd., which provides executive personnel and other services to Teekay LNG. Prior to January 1, 2018, our officers also served as executive officers of Teekay Offshore or of Teekay Offshore Group Ltd., our former subsidiary that provided executive personnel and other services to Teekay Offshore.
Because each of the executive officers of Teekay Tankers and the two executive officers of Teekay Gas Group Ltd. and Teekay Offshore Partners L.P., who provide or provided services to Teekay LNG and Teekay Offshore or were employees of Teekay or other of its subsidiaries, their compensation (other than any awards under the respective long-term incentive plans of Teekay Tankers, Teekay LNG and Teekay Offshore) is or was paid by Teekay or such other applicable entities. Pursuant to agreements with Teekay, each of Teekay Tankers, Teekay LNG and Teekay Offshore agreed to reimburse Teekay or its applicable subsidiaries for time spent by the executive officers on providing services to such public entities and their subsidiaries. For
2018
, these reimbursement obligations totaled approximately
$1.8 million and $1.4 million, respectively, for Teekay Tankers and Teekay LNG. For 2017,
these reimbursement obligations totaled approximately
$1.3 million, $0.9 million, and $0.4 million, respectively, for Teekay Tankers, Teekay LNG, and Teekay Offshore and are included in amounts paid as strategic management fees under the management agreement for Teekay Tankers and the services agreements for Teekay LNG and Teekay Offshore.
Relationships with the Daughter Entities
Please see “Item 4. Information on the Company-C. Organizational Structure” for information about our ownership interests in Teekay Tankers, Teekay LNG and Teekay Offshore. Please see “Item 4. Information on the Company-A. Overview, History and Development-Our Ownership of the Daughter Entities and Recent Equity Offerings and Transactions by Daughter Entities” for information about certain equity issuances by the Daughter Entities to Teekay.
Competition with Teekay Tankers, Teekay LNG and Teekay Offshore
We have entered into an omnibus agreement with Teekay LNG, Teekay Offshore and related parties governing, among other things, when Teekay, Teekay LNG, and Teekay Offshore may compete with each other and providing for rights of first offer on the transfer or rechartering of certain LNG carriers, oil tankers, shuttle tankers, FSO units and FPSO units. Subject to applicable exceptions, the omnibus agreement generally provides that, without the approval of the other applicable parties, (a) neither Teekay nor Teekay LNG will own or operate offshore vessels (i.e. dynamically positioned shuttle tankers, FSO units and FPSO units) that are subject to contracts with a duration of three years or more, excluding extension options, (b) neither Teekay nor Teekay Offshore will own or operate LNG carriers and (c) neither Teekay LNG nor Teekay Offshore will own or operate crude oil tankers, other than crude oil tankers included in their respective fleets as of the dates of their respective initial public offerings and certain replacement tankers. If Teekay or its affiliates no longer control the general partner of Teekay LNG or Teekay Offshore or if there is a change of control of Teekay, the general partner of Teekay LNG or Teekay Offshore or Teekay, as
91
applicable, may terminate relevant noncompetition and rights of first offer provisions of the omnibus agreement. During 2018, Brookfield Business Partners L.P. and its institutional investors acquired a 51% ownership interest in the general partner of Teekay Offshore and have the right to appoint a majority of the directors of the general partner’s Board of Directors. This transaction constituted a change of control, giving Teekay Offshore the right to elect to terminate the omnibus agreement, though we have not received any indication from Teekay Offshore that it intends to do so.
In addition, Teekay Tankers’ organization documents provide that Teekay may pursue business opportunities attractive to both parties and of which either party becomes aware. These business opportunities may include, among other things, opportunities to charter out, charter in or acquire oil tankers or to acquire tanker businesses.
Sales of Vessels and Project Interests
From time to time, Teekay has sold to Teekay Tankers, Teekay LNG and Teekay Offshore vessels or interests in vessel-owning subsidiaries or joint ventures. These transactions include those described under “Item 5. Operating and Financial Review and Prospects—Management’s Discussion and Analysis of Financial Condition and Results of Operations.”
|
•
|
Teekay Parent is obligated to offer to sell the
Petrojarl Foinaven
FPSO unit to Teekay Offshore, subject to approvals required from the charterer. The purchase price for the
Foinaven
FPSO unit would be its fair market value plus any additional tax or other similar costs to Teekay Petrojarl that would be required to transfer the FPSO unit to Teekay Offshore.
|
|
•
|
Teekay Parent owns the
Petrojarl Banff
and the
Hummingbird Spirit
FPSO units, which we will be obligated to offer to Teekay Offshore in the future under the omnibus agreement following the commencement of a charter contract with a firm period of greater than three years' duration (which is not currently the case).
|
|
•
|
Teekay Parent is obliged to offer to sell its FPSO units to Teekay Offshore, before it can offer to sell the FPSO units to third parties.
|
Time Chartering and Bareboat Chartering Arrangements
Teekay charters in from or out to its Daughter Entities certain vessels, including the following charter arrangements:
|
•
|
During 2016, one of Teekay Offshore’s conventional tankers was chartered out to Teekay subsidiaries under a long-term time charter. Two of Teekay Offshore’s shuttle tankers were chartered out to Teekay subsidiaries until March 31, 2017, under long-term bareboat charters, and as from April 1, 2017, have been chartered out to Teekay subsidiaries under long-term time charters. The two shuttle tankers are part of the service contract of the
Petrojarl Foinaven
FPSO unit. Pursuant to these charter contracts, Teekay Offshore earned revenues of
$41.9 million
,
$33.3 million
, and
$30.6 million
, respectively, for
2018
,
2017
, and
2016
.
|
|
•
|
During
2018
, three (three in
2017
and
2016
) of Teekay Offshore’s FSO units were chartered out to Teekay subsidiaries under long-term bareboat charters. Two of the FSO units are on back-to-back out-charters to third parties. One of the FSO units is part of the service contract of the
Petrojarl Banff
FPSO unit. Pursuant to these charter contracts, Teekay Offshore earned revenues of
$14.3 million
,
$16.2 million
, and
$15.1 million
, respectively, for
2018
,
2017
, and
2016
.
|
|
•
|
Since April 2008, Teekay had chartered in from Teekay LNG the LNG carriers
Arctic Spirit
and
Polar Spirit
under a fixed-rate time charter for a period of ten years. The contracts for
Arctic Spirit
and
Polar Spirit
terminated in March and April 2018, respectively. During
2018
,
2017
, and
2016
, Teekay LNG earned revenues of
$9.4 million
,
$36.4 million
, and
$37.3 million
, respectively, under these time-charter contracts.
|
Services, Management and Pooling Arrangements
Services Agreements.
In connection with their initial public offerings in May 2005 and December 2006, respectively, and subsequent thereto, Teekay LNG and Teekay Offshore and certain of their subsidiaries entered into services agreements with certain other subsidiaries of Teekay, pursuant to which the other Teekay subsidiaries agreed to provide to Teekay LNG, Teekay Offshore and their operating subsidiaries administrative, strategic, business development, advisory, commercial and ship management services. The Teekay subsidiaries provide these services directly or subcontract for certain of these services with other entities, including other Teekay subsidiaries. Under the agreements, Teekay LNG and Teekay Offshore pay arm’s-length fees for the services that include reimbursement of any direct and indirect expenses the other Teekay subsidiaries incur in providing these services.
Until December 31, 2017, Teekay and its wholly-owned subsidiaries directly and indirectly provided substantially all of Teekay Offshore’s ship management, commercial, technical, strategic, business development and administrative service needs.
In connection with the Brookfield Transaction, Teekay agreed to transfer to Teekay Offshore, as of January 1, 2018, certain Teekay subsidiaries that had been devoted exclusively or nearly exclusively to providing services to Teekay Offshore and its subsidiaries. Pursuant to this agreement, Teekay
Offshore acquired a 100% ownership interest in seven subsidiaries (or the
Transferred Subsidiaries
) of Teekay on January 1, 2018. Subsequent to their transfer to Teekay Offshore, the Transferred Subsidiaries continue to provide ship management, commercial, technical, strategic, business development and administrative services to Teekay, primarily related to Teekay's FPSO units.
Teekay and certain of its subsidiaries, other than the Transferred Subsidiaries, continue to provide certain other ship management, commercial, technical, strategic and administrative services to Teekay Offshore.
92
Revenues received by the Company for services provided to Teekay Offshore were
$21.0 million
,
$17.8 million
, $63.7 million and $64.6 million for the year ended
December 31, 2018
, the period from deconsolidation on September 25, 2017 to December 31, 2017, the period prior to deconsolidation between January 1, 2017 to September 24, 2017, and the year ended 2016, respectively. Such fees we received subsequent to deconsolidation
were recorded in revenues on the Company's
consolidated statements of (loss) income
.
Fees paid by the Company to Teekay Offshore for services provided by Teekay Offshore to us were
$25.7 million
for the year ended December 31, 2018 and for the period from deconsolidation on September 25, 2017 to December 31, 2017, were
$0.8 million
, and were recorded in vessel operating expenses and general and administrative expenses on the Company's
consolidated statements of (loss) income
.
During 2018, 2017 and 2016, Teekay LNG incurred expenses of $42.1 million, $33.9 million and $32.9 million, respectively, for services rendered to
them by us for these services.
Management Agreement.
In connection with its initial public offering, Teekay Tankers entered into the long-term management agreement with Teekay Tankers Management Services Ltd. (
TTMS,
or the
Manager
), a subsidiary of Teekay. On October 1, 2018, TTMS merged with Teekay Shipping Ltd. (or
TSL
), a subsidiary of Teekay and assumed the role as Manager.
Pursuant to the Management Agreement, the Manager has agreed to provide the following types of services to Teekay Tankers: commercial (primarily vessel chartering), technical (primarily vessel maintenance and crewing), administrative (primarily accounting, legal and financial) and strategic (primarily advising on acquisitions, strategic planning and general management of the business). Since commencement of the Management Agreement, the Manager subcontracted with Teekay Tankers Operations Ltd. (or
TTOL
) to provide to Teekay Tankers, through its subsidiaries or affiliates, commercial management and technical services for most of Teekay Tankers’ fleet. In August 2014, Teekay Tankers purchased from us a 50% interest in TTOL and in May 2017 Teekay Tankers acquired the remaining 50% interest in TTOL. On October 1, 2018, Teekay Tankers elected to provide its own commercial and technical services, effectively eliminating the prior subcontracting arrangement between the Manager and TTOL.
In return for commercial and technical services under the Management Agreement, prior to October 1, 2018, Teekay Tankers paid the Manager an agreed-upon fee for the commercial services (other than for Teekay Tankers vessels participating in pooling arrangements) and a technical services fee equal to the average rate Teekay charges third parties to technically manage their vessels of a similar size. In addition, Teekay Tankers pays fees for administrative and strategic services that reimburse the Manager for its related direct and indirect expenses in providing such services and which includes a profit margin. During
2018
,
2017
, and
2016
, Teekay Tankers incurred $43.3 million, $30.0 million, and $19.3 million, respectively, for all of these services
, and during 2018 and 2017 the Manager paid to the Teekay Tankers’ subsidiaries with which it subcontracted for certain services, $13.8 million and $7.7 million, respectively.
The management agreement also provides for the payment of a performance fee in order to provide the Manager an incentive to increase cash available for distribution to Teekay Tankers’ shareholders. Teekay Tankers did not incur any performance fees for
2018
,
2017
, or
2016
.
Pooling Arrangements.
Certain Aframax tankers, Suezmax tankers and LR2 product tankers of Teekay Tankers participate in vessel pooling arrangements managed by subsidiaries of TTOL. The pool managers provide commercial services to the pool participants and administer the pools in exchange for a fee currently equal to 1.25% of the gross revenues attributable to each pool participant’s vessels and a fixed amount per vessel per day which ranges from $275 to $350, depending upon the pool. Voyage revenues and voyage expenses of Teekay Tankers’ vessels operating in these pool arrangements are pooled with the voyage revenues and voyage expenses of other pool participants. The resulting net pool revenues, calculated on a time-charter equivalent basis, are allocated to the pool participants according to an agreed formula. Teekay Tankers incurred pool management fees during
2018
,
2017
, and
2016
of
$nil
,
$2.8 million
, and
$9.8 million
, respectively.
Teekay Tanker Operations Ltd.
On May 31, 2017, Teekay Tankers acquired from Teekay Holdings Ltd., a wholly-owned subsidiary of Teekay, the remaining 50% interest in TTOL for $39.0 million, which included $13.1 million for assumed working capital. Teekay Tankers issued approximately 13.8 million shares of its Class B common stock to Teekay as consideration in addition to the working capital consideration of $13.1 million.
Prior to May 31, 2017, Teekay Tankers owned 50% of TTOL and accounted for this investment using the equity method of accounting. Since Teekay Tankers acquired the remaining 50% of TTOL on May 31, 2017, it owns 100% of TTOL and now consolidates TTOL.
Relationship with Tanker Investments Ltd. (or
TIL
)
In January 2014, Teekay and Teekay Tankers formed TIL.
On November 27, 2017, Teekay Tankers completed a merger with TIL acquiring all of the remaining 27.0 million issued and outstanding common shares of TIL,
in a share-for-share exchange at a ratio of 3.3 shares of Teekay Tankers’ Class A common stock for each share of TIL common stock
, and as a result TIL became a wholly-owned subsidiary. As consideration for the merger, Teekay Tankers issued 88,977,544 Class A common shares to the TIL shareholders, including 8,250,000 shares to Teekay. Commencing on November 27, 2017, Teekay Tankers consolidates the results of TIL.
|
Item 8.
|
Financial Information
|
Consolidated Financial Statements and Notes
Please see Item 18 below for additional information required to be disclosed under this Item.
93
Legal Proceedings
From time to time we have been, and we expect to continue to be, subject to legal proceedings and claims in the ordinary course of our business, principally personal injury and property casualty claims. Such claims, even if lacking merit, could result in the expenditure of significant financial and managerial resources. We believe that any adverse outcome of existing claims, individually or in the aggregate, would not have a material effect on our financial position, results of operations or cash flows, when taking into account our insurance coverage and rights to seek indemnification from charterers. For information about recent legal proceedings, please read “Item 18. Financial Statements:
Note 16
d — Legal Proceedings and Claims.”
Dividend Policy
Since our initial public offering in 1995, we have declared and paid a regular cash dividend. Our current quarterly cash dividend is
$0.055 per common share.
Our quarterly dividend payment is primarily based on the cash flow contributions from our general partner and limited partner interests in Teekay LNG, together with other dividends received and cash flows provided by Teekay Parent's FPSO operations, after deductions for parent company level corporate general and administrative expenses, net interest expense, and any reserves determined to be required by our Board of Directors. Given our strategy to further strengthen our balance sheet, we believe that it is in the best interests of our shareholders to conserve more of our cash flows to reduce debt levels.
For similar reasons and in light of equity capital requirements for committed growth projects it had at that time, the Board of Directors of Teekay LNG’s general partner believed that it was in the best interests of Teekay LNG’s unitholders to conserve more of its internally generated cash flows to fund future growth projects and to reduce debt levels.
Consequently, effective for the quarterly distribution for the fourth quarter of 2015, Teekay LNG reduced its quarterly cash distribution per common unit to $0.14 from $0.70; however, Teekay LNG anticipates
an increase to $0.19 per common unit commencing with the distribution for the quarter ending March 31, 2019. Similarly,
Teekay Offshore reduced its quarterly cash distribution per common unit to $0.11 from $0.56
for the fourth quarter of 2015 and further reduced the quarterly cash distribution per common unit to $0.01 in the third quarter of 2017 and to $nil in January 2019.
Effective May 2018, Teekay Tankers eliminated the payment of its minimum quarterly dividend of $0.03 per share in order to preserve liquidity during the cyclical downturn of the tanker spot market. Otherwise, its dividend policy remains the same, with quarterly dividends expected to range from 30% to 50% of its quarterly adjusted net income, subject to reserves its Board of Directors may determine are necessary for the prudent operations of Teekay Tankers.
Pursuant to our dividend reinvestment program, holders of shares of our common stock are permitted to choose, in lieu of receiving cash dividends, to reinvest any dividends in additional shares of common stock at then-prevailing market prices, but without brokerage commissions or service charges.
The timing and amount of our dividends, if any, will depend, among other things, on our results of operations, financial condition, cash requirements, restrictions in financing agreements and other factors deemed relevant by our Board of Directors. Since we primarily are a holding company, with limited assets other than the ownership interests in our subsidiaries and equity-accounted investees, our ability to pay dividends on the common stock depends on the earnings and cash flow of our subsidiaries and distributions from our subsidiaries and equity-accounted investees.
Our Board of Directors may change or eliminate our common stock dividends at any time.
Significant Changes
Please read “Item 18. Financial Statements:
Note 23 — Subsequent Events
for descriptions of significant changes that have occurred since
December 31, 2018
”.
Please read “Item 5 - Operating and Financial Review and Prospects: Management’s Discussion and Analysis of Financial Condition and Results of Operations-Significant Developments in
2018
and
2019
.”
|
Item 9.
|
The Offer and Listing
|
Our common stock is traded on the NYSE under the symbol “TK”.
|
Item 10.
|
Additional Information
|
Memorandum and Articles of Association
Our Amended and Restated Articles of Incorporation, as amended, have been filed as exhibits 1.1 and 1.2 to our Annual Report on Form 20-F (File No. 1-12874), filed with the SEC on April 7, 2009, and are hereby incorporated by reference into this Annual Report. Our Bylaws have previously been filed as exhibit 1.3 to our Report on Form 6-K (File No. 1-12874), filed with the SEC on August 31, 2011, and are hereby incorporated by reference into this Annual Report.
The rights, preferences and restrictions attaching to each class of our capital stock are described in the section entitled “Description of Capital Stock” of our Rule 424(b) prospectus (Registration No. 333-52513), filed with the SEC on June 10, 1998, and hereby incorporated by reference into this Annual Report, provided that since the date of such prospectus (1) the par value of our capital stock has been changed to $0.001 per share, (2) our authorized capital stock has been increased to 725,000,000 shares of common stock and 25,000,000 shares of Preferred Stock, (3) we have been domesticated in the Republic of The Marshall Islands and (4) we have adopted a staggered Board of Directors, with directors serving three-year terms.
94
The necessary actions required to change the rights of holders of our capital stock and the conditions governing the manner in which annual and special meetings of shareholders are convened are described in our Bylaws filed as exhibit 1.3 to our Report on Form 6-K (File No. 1-12874), filed with the SEC on August 31, 2011, and hereby incorporated by reference into this Annual Report.
We have in place a rights agreement that would have the effect of delaying, deferring or preventing a change in control of Teekay. The amended and restated rights agreement has been filed as part of our Form 8-A/A (File No. 1-12874), filed with the SEC on July 2, 2010, and hereby incorporated by reference into this Annual Report.
There are no limitations on the rights to own securities, including the rights of non-resident or foreign shareholders to hold or exercise voting rights on the securities imposed by the laws of the Republic of The Marshall Islands or by our Articles of Incorporation or Bylaws.
Material Contracts
The following is a summary of each material contract, other than material contracts entered into in the ordinary course of business, to which we or any of our subsidiaries is a party, for the two years immediately preceding the date of this Annual Report:
|
(a)
|
Agreement, dated August 23, 2006 for a $330,000,000 Secured Reducing Revolving Loan Facility among Teekay LNG Partners L.P., ING Bank N.V. and various other banks. Please read
Note 7
to the Consolidated Financial Statements of Teekay Corporation included herein for a summary of certain contract terms relating to our loan facilities.
|
|
(b)
|
Agreement, dated November 28, 2007 for a $845,000,000 Secured Reducing Revolving Loan Facility among Teekay Corporation, Teekay Tankers Ltd., Nordea Bank Finland PLC and various other banks.
|
|
(c)
|
Annual Executive Bonus Plan.
|
|
(d)
|
Amended 2003 Equity Incentive Plan.
|
|
(e)
|
Amended 1995 Stock Option Plan.
|
|
(f)
|
Amended and Restated Rights Agreement, dated as of July 2, 2010, between Teekay Corporation and The Bank of New York, as Rights Agent.
|
|
(g)
|
Amended and Restated Omnibus Agreement dated as of December 19, 2006, among Teekay Corporation, Teekay GP L.L.C., Teekay LNG Partners L.P., Teekay LNG Operating L.L.C., Teekay Offshore GP L.L.C., Teekay Offshore Partners L.P., Teekay Offshore Operating GP. L.L.C. and Teekay Offshore Operating L.P. govern, among other things, when Teekay Corporation, Teekay LNG L.P. and Teekay Offshore L.P. may compete with each other and to provide the applicable parties certain rights of first offer on LNG carriers, oil tankers, shuttle tankers, FSO units and FPSO units.
|
|
(h)
|
Indenture dated January 27, 2010 among Teekay Corporation and The Bank of New York Mellon Trust Company, N.A. for $450,000,000 8.5% Senior Unsecured Notes due 2020.
|
|
(i)
|
2013 Equity Incentive Plan.
|
|
(j)
|
Agreement, dated December 21, 2012 for a $200,000,000 Margin Loan Agreement among Teekay Finance Limited, Citibank, N.A. and others.
|
|
(k)
|
Amendment Agreement No. 1, dated December 18, 2013 for a $300,000,000 Margin Loan Agreement among Teekay Finance Limited, Citibank, N.A. and others.
|
|
(l)
|
Agreement, dated February 24, 2014 for a $815,000,000 Secure Term Loan Facility Agreement among Knarr L.L.C., Citibank, N.A. and others.
|
|
(m)
|
Agreement dated July 7, 2014; between Teekay LNG Operating L.L.C. and China LNG Shipping (Holdings) Limited to form TC LNG Shipping L.L.C. in connection with the Yamal LNG Project.
|
|
(n)
|
Agreement dated December 17, 2014, for a $450,000,000 secured loan facility between Nakilat Holdco L.L.C. and Qatar National Bank SAQ. The loan bears interest at LIBOR plus a margin of 1.85%. The facility requires quarterly repayments, with a bullet payment in 2026.
|
|
(o)
|
Amendment Agreement No. 2, dated December 19, 2014 for a $500,000,000 Margin Loan Agreement among Teekay Finance Limited, Citibank, N.A. and others.
|
|
(p)
|
Amendment Agreement No. 3, dated October 2, 2015 for a $500,000,000 Margin Loan Agreement among Teekay Finance Limited, Citibank, N.A. and others.
|
|
(q)
|
Amendment Agreement No. 4, dated December 17, 2015 for a $300,000,000 Margin Loan Agreement among Teekay Finance Limited, Citibank, N.A. and others.
|
|
(r)
|
First Supplemental Indenture dated November 16, 2015 among Teekay Corporation and The Bank of New York Mellon Trust Company, N.A. for $200,000,000 8.5% Senior Unsecured Notes due 2021.
|
|
(s)
|
Agreement, dated July 31, 2015, among OOGTK Libra GmbH & Co KG, ABN AMRO Bank N.V. and various other banks for a $803,711,786.92 term loan due 2027.
|
95
|
(t)
|
Purchase Agreement, dated as of November 10, 2015, between Teekay Corporation and J.P. Morgan Securities LLC, for itself and on behalf of the several initial purchasers listed in Schedule 1 thereto.
|
|
(u)
|
Registration Rights Agreement, dated November 16, 2015 by and among Teekay Corporation and J.P. Morgan Securities LLC, for itself and as representative of the several initial purchasers listed in Schedule 1 thereto.
|
|
(v)
|
Secured Term Loan and Revolving Credit Facility Agreement dated January 8, 2016 between Teekay Tankers Ltd., Nordea Bank Finland PLC and various other banks, for a $894.4 million long-term debt facility, consisting of both a term loan and a revolving credit facility, which is scheduled to mature in January 2021.
|
|
(w)
|
Share Purchase Agreement, dated May 18, 2016, by and among Teekay Corporation and the purchasers named therein.
|
|
(x)
|
Registration Rights Agreement, dated June 29, 2016, by and among Teekay Corporation and the investors named therein.
|
|
(y)
|
Equity Distribution Agreement, dated September 9, 2016, between Teekay Corporation and Citigroup Global Markets Inc.
|
|
(z)
|
Warrant Agreement dated September 25, 2017, between Teekay Offshore Partners L.P. and Teekay Shipping Limited
|
|
(aa)
|
Second Amended and Restated Limited Liability Company Agreement of Teekay Offshore GP L.L.C., dated September 25, 2017, by and between Teekay Holdings Limited and Brookfield TK TOGP L.P.
|
|
(ab)
|
Registration Rights Agreement, dated September 25, 2017, by and between Teekay Offshore Partners L.P., Teekay Corporation and Brookfield TK TOLP L.P.
|
|
(ac)
|
Investment Agreement, dated July 26, 2017, between Teekay Offshore Partners L.P. and Teekay Holdings Limited
|
|
(ad)
|
Purchase Agreement, dated July 26, 2017, between Teekay Holdings Limited and Brookfield TK TOGP L.P.
|
|
(ae)
|
Amended and Restated Subordinate Promissory Note, dated July 26, 2017, by and between Teekay Offshore Partners L.P., Teekay Corporation and Brookfield TK TOLP L.P.
|
|
(af)
|
Master Services Agreement, dated September 25, 2017, by and between Teekay Corporation, Teekay Offshore Partners L.P. and Brookfield TK TOLP L.P.
|
|
(ag)
|
Trademark License Agreement, dated September 25, 2017, by and between Teekay Corporation and Teekay Offshore Partners L.P.
|
|
(ah)
|
Indenture dated as of January 26, 2018 between Teekay Corporation and The Bank of New York Mellon, as Trustee
.
|
|
(ai)
|
Underwriting
Agreement, dated January 24, 2018, by and between Teekay Corporation, Morgan Stanley & Co. LLC, and J.P. Morgan Securities LLC, acting on behalf of themselves and on behalf of the several purchases listed on Schedule I thereto.
|
|
(aj)
|
Purchase
Agreement, dated January 24, 2018, by and between Teekay Corporation, Morgan Stanley & Co. LLC, and J.P. Morgan Securities LLC, acting on behalf of themselves and on behalf of the several purchases listed on Schedule I thereto.
|
|
(ak)
|
Amendment Agreement No. 8, dated December 24, 2018 for a $200,000,000 Margin Loan Agreement among Teekay Finance Limited, Citibank, N.A. and others.
|
Exchange Controls and Other Limitations Affecting Security Holders
We are not aware of any governmental laws, decrees or regulations, including foreign exchange controls, in the Republic of the Marshall Islands that restrict the export or import of capital or that affect the remittance of dividends, interest or other payments to holders of our securities that are non-resident and not citizens
and otherwise not conducting business or transactions in the Marshall Islands
.
We are not aware of any limitations on the right of non-resident or foreign owners to hold or vote our securities imposed by the laws of the Republic of the Marshall Islands or our Articles of Incorporation and Bylaws.
Taxation
Teekay Corporation was incorporated in the Republic of Liberia on February 9, 1979 and was domesticated in the Republic of the Marshall Islands on December 20, 1999. Its principal executive offices are located in Bermuda. The following provides information regarding taxes to which a U.S. Holder of our common stock may be subject.
Material U.S. Federal Income Tax Considerations
The following is a discussion of certain material U.S. federal income tax considerations that may be relevant to shareholders. This discussion is based upon the provisions of the Internal Revenue Code of 1986, as amended (or the Code), legislative history, applicable U.S. Treasury Regulations (or Treasury Regulations), judicial authority and administrative interpretations, all as in effect on the date of this Annual Report and which are subject to change, possibly with retroactive effect, or are subject to different interpretations. Changes in these authorities may cause the tax consequences to vary substantially from the consequences described below. Unless the context otherwise requires, references in this section to “we,” “our” or “us” are references to Teekay Corporation.
96
This discussion is limited to shareholders who hold their common stock as a capital asset for tax purposes. This discussion does not address all tax considerations that may be important to a particular shareholder in light of the shareholder’s circumstances, or to certain categories of shareholders that may be subject to special tax rules, such as:
|
•
|
dealers in securities or currencies,
|
|
•
|
traders in securities that have elected the mark-to-market method of accounting for their securities,
|
|
•
|
persons whose functional currency is not the U.S. dollar,
|
|
•
|
persons holding our common stock as part of a hedge, straddle, conversion or other “synthetic security” or integrated transaction,
|
|
•
|
certain U.S. expatriates,
|
|
•
|
financial institutions,
|
|
•
|
insurance companies,
|
|
•
|
persons subject to the alternative minimum tax,
|
|
•
|
persons that actually or under applicable constructive ownership rules own 10% or more of our common stock (by vote or value), and
|
|
•
|
entities that are tax-exempt for U.S. federal income tax purposes.
|
If a partnership (including any entity or arrangement treated as a partnership for U.S. federal income tax purposes) holds our common stock, the tax treatment of a partner generally will depend upon the status of the partner and the activities of the partnership. Partners in partnerships holding our common stock should consult their tax advisors to determine the appropriate tax treatment of the partnership’s ownership of our common stock.
This discussion does not address any U.S. estate tax considerations or tax considerations arising under the laws of any state, local or non-U.S. jurisdiction. Each shareholder is urged to consult its tax advisor regarding the U.S. federal, state, local, non-U.S. and other tax consequences of the ownership or disposition of our common stock.
United States Federal Income Taxation of U.S. Holders
As used herein, the term U.S. Holder means a beneficial owner of our common stock that is, for U.S. federal income tax purposes: (i) a U.S. citizen or U.S. resident alien (or a
U.S. Individual Holder
), (ii) a corporation or other entity taxable as a corporation, that was created or organized under the laws of the United States, any state thereof or the District of Columbia, (iii) an estate whose income is subject to U.S. federal income taxation regardless of its source, or (iv) a trust that either is subject to the supervision of a court within the United States and has one or more U.S. persons with authority to control all of its substantial decisions or has a valid election in effect under applicable Treasury Regulations to be treated as a U.S. person.
Distributions
Subject to the discussion of passive foreign investment companies (or
PFICs
) below, any distributions made by us to a U.S. Holder generally will constitute dividends, which may be taxable as ordinary income or “qualified dividend income” as described in more detail below, to the extent of our current and accumulated earnings and profits, as determined under U.S. federal income tax principles. Distributions in excess of our current and accumulated earnings and profits will be treated first as a non-taxable return of capital to the extent of the U.S. Holder’s tax basis in our common stock and thereafter as capital gain, which will be either long-term or short-term capital gain depending upon whether the U.S. Holder has held the common stock for more than one year. U.S. Holders that are corporations for U.S. federal income tax purposes generally will not be entitled to claim a dividends received deduction with respect to any distributions they receive from us. For purposes of computing allowable foreign tax credits for U.S. federal income tax purposes, dividends received with respect to our common stock will be treated as foreign source income
and generally will be treated as “passive category income
.
”
Subject to holding period requirements and certain other limitations, dividends received with respect to our common stock by a U.S. Holder who is an individual, trust or estate (or a
Non-Corporate U.S. Holder
) will be treated as “qualified dividend income” that is taxable to such Non-Corporate U.S. Holder at preferential capital gain tax rates provided that we are not classified as a PFIC for the taxable year during which the dividend is paid or the immediately preceding taxable year (we intend to take the position that we are not now and have never been classified as a PFIC, as discussed below). Any dividends received with respect to our common stock not eligible for these preferential rates will be taxed as ordinary income to a Non-Corporate U.S. Holder.
Special rules may apply to any “extraordinary dividend” paid by us. Generally, an extraordinary dividend is, a dividend with respect to a share of common stock if the amount of the dividend is equal to or in excess of 10% of a common stockholder’s adjusted tax basis (or fair market value in certain circumstances) in such common stock. In addition, extraordinary dividends include dividends received within a one-year period that, in the aggregate, equal or exceed 20% of a stockholder’s adjusted tax basis (or fair market value in certain circumstances). If we pay an “extraordinary dividend” on our common stock that is treated as “qualified dividend income,” then any loss recognized by a Non-Corporate U.S. Holder from the sale or exchange of such common stock will be treated as long-term capital loss to the extent of the amount of such dividend.
97
Certain Non-Corporate U.S. Holders are subject to a 3.8% tax on certain investment income, including dividends. Non-Corporate U.S. Holders should consult their tax advisors regarding the effect, if any, of this tax on their ownership of our common stock.
Sale, Exchange or Other Disposition of Common Stock
Subject to the discussion of PFICs below, a U.S. Holder generally will recognize capital gain or loss upon a sale, exchange or other disposition of our common stock in an amount equal to the difference between the amount realized by the U.S. Holder from such sale, exchange or other disposition and the U.S. Holder’s tax basis in such stock. Subject to the discussion of extraordinary dividends above, such gain or loss generally will be treated as (a) long-term capital gain or loss if the U.S. Holder’s holding period is greater than one year at the time of the sale, exchange or other disposition, or short -term capital gain or loss otherwise and (b) U.S.-source gain or loss, as applicable, for foreign tax credit purposes. Non-Corporate U.S. Holders may be eligible for preferential rates of U.S. federal income tax in respect of long-term capital gains. A U.S. Holder’s ability to deduct capital losses is subject to certain limitations.
Certain Non-Corporate U.S. Holders are subject to a 3.8% tax on certain investment income, including capital gains from the sale or other disposition of stock. Non-Corporate U.S. Holders should consult their tax advisors regarding the effect, if any, of this tax on their disposition of our common stock.
Consequences of Possible PFIC Classification
A non-U.S. entity treated as a corporation for U.S. federal income tax purposes will be treated as a PFIC in any taxable year in which, after taking into account the income and assets of the corporation and certain subsidiaries pursuant to a “look through” rule, either: (i) at least 75% of its gross income is “passive” income, or (ii) at least 50% of the average value of its assets is attributable to assets that produce, or are held for the production of, passive income. For purposes of these tests, “passive income” includes dividends, interest, gains from the sale or exchange of investment property and rents and royalties other than rents and royalties that are received from unrelated parties in connection with the active conduct of a trade or business. By contrast, income derived from the performance of services does not constitute “passive income.”
There are legal uncertainties involved in determining whether the income derived from our time-chartering activities constitutes rental income or income derived from the performance of services, including legal uncertainties arising from the decision in Tidewater Inc. v. United States, 565 F.3d 299 (5th Cir. 2009), which held that income derived from certain time-chartering activities should be treated as rental income rather than services income for purposes of a foreign sales corporation provision of the Code. However, the Internal Revenue Service (or IRS) stated in an Action on Decision (AOD 2010-01) that it disagrees with, and will not acquiesce to, the way that the rental versus services framework was applied to the facts in the Tidewater decision, and in its discussion stated that the time charters at issue in Tidewater would be treated as producing services income for PFIC purposes. The IRS’s statement with respect to Tidewater cannot be relied upon or otherwise cited as precedent by taxpayers. Consequently, in the absence of any binding legal authority specifically relating to the statutory provisions governing PFICs, there can be no assurance that the IRS or a court would not follow the Tidewater decision in interpreting the PFIC provisions of the Code. Moreover, the market value of our common stock and our publicly traded subsidiaries may be treated as reflecting the value of our assets, and our publicly traded subsidiaries’ assets, respectively, at any given time. Therefore, a decline in the market value of our common stock, or our publicly traded subsidiaries, which is not within our control, may impact the determination of whether we are a PFIC. Nevertheless, based on our and our subsidiaries’ current assets and operations, we intend to take the position that we are not now and have never been a PFIC. No assurance can be given, however, that the IRS, or a court of law, will accept our position or that we would not constitute a PFIC for any future taxable year if there were to be changes in our or our subsidiaries' assets, income or operations.
As discussed more fully below, if we were to be treated as a PFIC for any taxable year, a U.S. Holder generally would be subject to different taxation rules depending on whether the U.S. Holder makes a timely and effective election to treat us as a “Qualified Electing Fund” (a QEF election). As an alternative to making a QEF election, a U.S. Holder should be able to make a “mark-to-market” election with respect to our common stock, as discussed below.
Taxation of U.S. Holders Making a Timely QEF Election.
A U.S. Holder who makes a timely QEF election (an Electing Holder) must report the Electing Holder’s pro rata share of our ordinary earnings and net capital gain, if any, for each taxable year for which we are a PFIC that ends with or within the Electing Holder’s taxable year, regardless of whether or not the Electing Holder received distributions from us in that year. Such income inclusions would not be eligible for the preferential tax rates applicable to qualified dividend income. The Electing Holder’s adjusted tax basis in our common stock will be increased to reflect taxed but undistributed earnings and profits. Distributions of earnings and profits that were previously taxed will result in a corresponding reduction in the Electing Holder’s adjusted tax basis in our common stock and will not be taxed again once distributed. An Electing Holder generally will recognize capital gain or loss on the sale, exchange or other disposition of our common stock. A U.S. Holder makes a QEF election with respect to any year that we are a PFIC by filing IRS Form 8621 with the U.S. Holder’s timely filed U.S. federal income tax return (including extensions).
98
If a U.S. Holder has not made a timely QEF election with respect to the first year in the U.S. Holder’s holding period of our common stock during which we qualified as a PFIC, the U.S. Holder may be treated as having made a timely QEF election by filing a QEF election with the U.S. Holder’s timely filed U.S. federal income tax return (including extensions) and, under the rules of Section 1291 of the Code, a “deemed sale election” to include in income as an “excess distribution” (described below) the amount of any gain that the U.S. Holder would otherwise recognize if the U.S. Holder sold the U.S. Holder’s common stock on the “qualification date.” The qualification date is the first day of our taxable year in which we qualified as a “qualified electing fund” with respect to such U.S. Holder. In addition to the above rules, under very limited circumstances, a U.S. Holder may make a retroactive QEF election if the U.S. Holder failed to file the QEF election documents in a timely manner. If a U.S. Holder makes a timely QEF election for one of our taxable years, but did not make such election with respect to the first year in the U.S. Holder’s holding period of our common stock during which we qualified as a PFIC and the U.S. Holder did not make the deemed sale election described above, the U.S. Holder also will be subject to the more adverse rules described below.
A U.S. Holder’s QEF election will not be effective unless we annually provide the U.S. Holder with certain information concerning our income and gain, calculated in accordance with the Code, to be included with the U.S. Holder’s U.S. federal income tax return. We have not provided our U.S. Holders with such information in prior taxable years and do not intend to provide such information in the current taxable year. Accordingly, U.S. Holders will not be able to make an effective QEF election at this time. If, contrary to our expectations, we determine that we are or will be a PFIC for any taxable year, we will provide U.S. Holders with the information necessary to make an effective QEF election with respect to our common stock.
Taxation of U.S. Holders Making a Mark-to-Market Election.
If we were to be treated as a PFIC for any taxable year and, as we anticipate, our common stock was treated as “marketable stock”, then, as an alternative to making a QEF election, a U.S. Holder would be allowed to make a “mark-to-market” election with respect to our common stock, provided the U.S. Holder completes and files IRS Form 8621 in accordance with the relevant instructions and related Treasury Regulations. If that election is made for the first year a U.S. Holder holds or is deemed to hold our common stock and for which we are a PFIC, the U.S. Holder generally would include as ordinary income in each taxable year that we are a PFIC the excess, if any, of the fair market value of the U.S. Holder’s common stock at the end of the taxable year over the U.S. Holder’s adjusted tax basis in the common stock. The U.S. Holder also would be permitted an ordinary loss in respect of the excess, if any, of the U.S. Holder’s adjusted tax basis in the common stock over the fair market value thereof at the end of the taxable year that we are a PFIC, but only to the extent of the net amount previously included in income as a result of the mark-to-market election. A U.S. Holder’s tax basis in our common stock would be adjusted to reflect any such income or loss recognized. Gain recognized on the sale, exchange or other disposition of our common stock in taxable years that we are a PFIC would be treated as ordinary income, and any loss recognized on the sale, exchange or other disposition of our common stock in taxable years that we are a PFIC would be treated as ordinary loss to the extent that such loss does not exceed the net mark-to-market gains previously included in income by the U.S. Holder. Because the mark-to-market election only applies to marketable stock, however, it would not apply to a U.S. Holder’s indirect interest in any of our subsidiaries that were also determined to be PFICs.
If a U.S. Holder makes a mark-to-market election for one of our taxable years and we were a PFIC for a prior taxable year during which such U.S. Holder held our common stock and for which (i) we were not a QEF with respect to such U.S. Holder and (ii) such U.S. Holder did not make a timely mark-to-market election, such U.S. Holder would also be subject to the more adverse rules described below in the first taxable year for which the mark-to-market election is in effect and also to the extent the fair market value of the U.S. Holder’s common stock exceeds the U.S. Holder’s adjusted tax basis in the common stock at the end of the first taxable year for which the mark-to-market election is in effect.
Taxation of U.S. Holders Not Making a Timely QEF or Mark-to-Market Election.
If we were to be treated as a PFIC for any taxable year, a U.S. Holder who does not make either a QEF election or a “mark-to-market” election for that year (a Non-Electing Holder) would be subject to special rules resulting in increased tax liability with respect to (i) any excess distribution (i.e., the portion of any distributions received by the Non-Electing Holder on our common stock in a taxable year in excess of 125% of the average annual distributions received by the Non-Electing Holder in the three preceding taxable years, or, if shorter, the Non-Electing Holder’s holding period for our common stock), and (ii) any gain realized on the sale, exchange or other disposition of our common stock. Under these special rules:
|
•
|
the excess distribution or gain would be allocated ratably over the Non-Electing Holder’s aggregate holding period for our common stock;
|
|
•
|
the amount allocated to the current taxable year and any taxable year prior to the taxable year we were first treated as a PFIC with respect to the Non-Electing Holder would be taxed as ordinary income in the current taxable year;
|
|
•
|
the amount allocated to each of the other taxable years would be subject to U.S. federal income tax at the highest rate of tax in effect for the applicable class of taxpayer for that year; and
|
|
•
|
an interest charge for the deemed deferral benefit would be imposed with respect to the resulting tax attributable to each such other taxable year.
|
Additionally, for each year during which a U.S. Holder owns our common stock, we are a PFIC, and the total value of all PFIC stock that such U.S. Holder directly or indirectly owns exceeds certain thresholds, such U.S. Holder will be required to file IRS Form 8621 with its annual U.S. federal income tax return to report its ownership of our common stock. In addition, if a Non-Electing Holder who is an individual dies while owning our common stock, such Non-Electing Holder’s successor generally would not receive a step-up in tax basis with respect to such common stock.
U.S. Holders are urged to consult their tax advisors regarding the PFIC rules, including the PFIC annual reporting requirements, as well as the applicability, availability and advisability of, and procedure for, making QEF, Mark-to-Market and other available elections with respect to us and our subsidiaries, and the U.S. federal income tax consequences of making such elections.
99
U.S. Return Disclosure Requirements for U.S. Individual Holders
U.S. Individual Holders who hold certain specified foreign financial assets, including stock in a foreign corporation that is not held in an account maintained by a financial institution, with an aggregate value in excess of $50,000 on the last day of a taxable year, or $75,000 at any time during that taxable year, may be required to report such assets on IRS Form 8938 with their U.S. federal income tax return for that taxable year. This reporting requirement does not apply to U.S. Individual Holders who report their ownership of our common stock under the PFIC annual reporting rules described above. Penalties apply for failure to properly complete and file IRS Form 8938. U.S. Individual Holders are encouraged to consult with their tax advisors regarding the possible application of this disclosure requirement
to their investment in our common stock
.
United States Federal Income Taxation of Non-U.S. Holders
A beneficial owner of our common stock (other than a partnership, including any entity or arrangement treated as a partnership for U.S. federal income tax purposes) that is not a U.S. Holder is a Non-U.S. Holder.
Distributions
In general, a Non-U.S. Holder will not be subject to U.S. federal income tax on distributions received from us with respect to our common stock unless the distributions are effectively connected with the Non-U.S. Holder’s conduct of a trade or business within the United States (and, if required by an applicable income tax treaty, are attributable to a permanent establishment that the Non-U.S. Holder maintains in the United States). If a Non-U.S. Holder is engaged in a trade or business within the United States and the distributions are deemed to be effectively connected to that trade or business, the Non-U.S. Holder generally will be subject to U.S. federal income tax on those distributions in the same manner as if it were a U.S. Holder.
Sale, Exchange or Other Disposition of Common Stock
In general, a Non-U.S. Holder is not subject to U.S. federal income tax on any gain resulting from the disposition of our common stock unless (a) such gain is effectively connected with the Non-U.S. Holder’s conduct of a trade or business within the United States (and, if required by an applicable income tax treaty, is attributable to a permanent establishment that the Non-U.S. Holder maintains in the United States) or (b) the Non-U.S. Holder is an individual who is present in the United States for 183 days or more during the taxable year in which such disposition occurs and meets certain other requirements. If a Non-U.S. Holder is engaged in a trade or business within the United States and the disposition of our common stock is deemed to be effectively connected to that trade or business, the Non-U.S. Holder generally will be subject to U.S. federal income tax on the resulting gain in the same manner as if it were a U.S. Holder.
Information Reporting and Backup Withholding
In general, distributions taxable as dividends with respect to, or the proceeds from a sale, redemption or other taxable disposition of, our common stock held by a Non-Corporate U.S. Holder will be subject to information reporting requirements, unless such distribution taxable as a dividend is paid and received outside the United States by a non-U.S. payor or non-U.S. middleman (within the meaning of U.S. Treasury Regulations), or such proceeds are effected through an office outside the U.S. of a broker that is considered a non-U.S. payor or non-U.S. middleman (within the meaning of U.S. Treasury Regulations). These amounts also generally will be subject to backup withholding if the Non-Corporate U.S. Holder:
•
fails to timely provide an accurate taxpayer identification number;
•
is notified by the IRS that it has failed to report all interest or distributions required to be shown on its U.S. federal income tax returns; or
•
in certain circumstances, fails to comply with applicable certification requirements.
Information reporting and backup withholding generally will not apply to distributions taxable as dividends on our common stock to a Non-U.S. Holder if such dividend is paid and received outside the United States by a non-U.S. payor or non-U.S. middleman (within the meaning of U.S. Treasury Regulations) or the Non-U.S. Holder properly certifies under penalties of perjury as to its non-U.S. status (generally on IRS Form W-8BEN, W-8BEN-E, W-8ECI, W-8EXP or W-8IMY, as applicable) and certain other conditions are met or the Non-U.S. Holder otherwise establishes an exemption.
Payment of proceeds to a Non-U.S. Holder from a sale, redemption or other taxable disposition of our common stock to or through the U.S. office of a broker, or through a broker that is considered a U.S. payor or U.S. middleman (within the meaning of U.S. Treasury Regulations), generally will be subject to information reporting and backup withholding, unless the Non-U.S. Holder properly certifies under penalties of perjury as to its non-U.S. status (generally on IRS Form W-8BEN, W-8BEN-E, W-8ECI, W-8EXP or W-8IMY, as applicable) and certain other conditions are met or the Non-U.S. Holder otherwise establishes an exemption.
Backup withholding is not an additional tax. Rather, a Non-Corporate U.S. Holder or Non-U.S. Holder generally may obtain a credit for any amount withheld against its liability for U.S. federal income tax (and obtain a refund of any amounts withheld in excess of such liability) by accurately completing and timely filing a U.S. federal income tax return with the IRS.
Non-United States Tax Considerations
100
Marshall Islands Tax Considerations.
Because we and our subsidiaries do not, and do not expect that we or they will, conduct business, transactions or operations in the Republic of the Marshall Islands, and because all documentation related to issuances of shares of our common stock was executed outside of the Republic of the Marshall Islands, under current Marshall Islands law, holders of our common stock that are not citizens of and do not reside in, maintain offices in, or engage in business, operations, or transactions in the Republic of the Marshall Islands will not be subject to Marshall Islands taxation or withholding on dividends we make to our shareholders. In addition, such shareholders will not be subject to Marshall Islands stamp, capital gains or other taxes on the purchase, ownership or disposition of our common stock, and they will not be required by the Republic of the Marshall Islands to file a tax return relating to the common stock.
It is the responsibility of each shareholder to investigate the legal and tax consequences, under the laws of pertinent jurisdictions, including the Marshall Islands, of such shareholder's investment in us. Accordingly, each shareholder is urged to consult a tax counsel or other advisor with regard to those matters. Further, it is the responsibility of each shareholder to file all state, local and non-U.S., as well as U.S. federal tax returns that may be required of such shareholder.
Documents on Display
Documents concerning us that are referred to herein may be
accessed on our website under “Investors - Teekay Corporation - Financials & Presentations” from the home page of our web site at
www.teekay.com
, or may be
inspected at our principal executive offices at 4
th
Floor, Belvedere Building, 69 Pitts Bay Road, Hamilton, HM 08, Bermuda. Those documents electronically filed via the Electronic Data Gathering, Analysis, and Retrieval (or
EDGAR
) system may also be obtained from the SEC’s website at
www.sec.gov
, free of charge.
|
Item 11.
|
Quantitative and Qualitative Disclosures About Market Risk
|
We, as in Teekay Corporation and its subsidiaries, are exposed to market risk from foreign currency fluctuations and changes in interest rates, bunker fuel prices and spot tanker market rates for vessels. We use foreign currency forward contracts, cross currency and interest rate swaps and forward freight agreements to manage currency, interest rate, bunker fuel price and spot tanker market rate risks but we do not use these financial instruments for trading or speculative purposes. Please read “Item 18. Financial Statements:
Note 15 — Derivative Instruments and Hedging Activities
.”
Foreign Currency Fluctuation Risk
Our primary economic environment is the international shipping market. Transactions in this market generally utilize the U.S. Dollar. Consequently, a substantial majority of our revenues and most of our operating costs are in U.S. Dollars. We incur certain voyage expenses, vessel operating expenses, dry docking and overhead costs in foreign currencies, the most significant of which are the Australian Dollar, Brazilian Real, British Pound, Canadian Dollar, Euro, Norwegian Kroner and Singaporean Dollar. There is a risk that currency fluctuations will have a negative effect on the value of cash flows.
In some cases, we hedge a portion of our net foreign currency exposure for the following nine to 12 months by entering into foreign currency forward contracts. We generally do not hedge our net foreign currency exposure beyond three years forward.
As at December 31,
2018
, t
he Company was not committed to any foreign currency forward contracts.
Although the majority of our transactions, assets and liabilities are denominated in U.S. Dollars, certain of our subsidiaries have foreign currency-denominated liabilities. There is a risk that currency fluctuations will have a negative effect on the value of our cash flows. As at December 31,
2018
, we had Euro-denominated term loans of
169 million
Euros (
$193.8 million
). We receive Euro-denominated revenue from certain of our time charters. These Euro cash receipts generally are sufficient to pay the principal and interest payments on our Euro-denominated term loans. Consequently, we have not entered into any foreign currency forward contracts with respect to our Euro-denominated term loans, although there is no assurance that our net exposure to fluctuations in the Euro will not increase in the future.
We enter into cross currency swaps in connection with our NOK bond issuances, and pursuant to these swaps we receive the principal amount in NOK on the maturity date of the swap, in exchange for payment of a fixed U.S. Dollar amount. In addition, the cross currency swaps exchange a receipt of floating interest in NOK based on NIBOR plus a margin for a payment of U.S. Dollar fixed interest. The purpose of the cross currency swaps is to economically hedge the foreign currency exposure on the payment of interest and principal of Teekay LNG's NOK-denominated bonds due in 2020, 2021 and 2023. In addition, the cross currency swaps economically hedge the interest rate exposure on the NOK bonds due in 2020, 2021 and 2023. We have not designated, for accounting purposes, these cross currency swaps as cash flow hedges of Teekay LNG's NOK-denominated bonds due in 2020, 2021 and 2023.
101
As at December 31,
2018
, we were committed to the following cross currency swaps:
|
Notional
Amount
NOK
(1)
|
Notional
Amount
USD
(1)
|
Floating Rate Receivable
|
Fixed
Rate
Payable
|
|
|
|||||||
|
Reference
Rate
|
Margin
|
Fair Value
(1)
$
|
Remaining
Term (years)
|
|||||||||
|
1,000,000
|
134,000
|
NIBOR
|
3.70%
|
5.92%
|
(18,315)
|
1.4
|
||||||
|
1,200,000
|
146,500
|
NIBOR
|
6.00%
|
7.72%
|
(4,727)
|
2.8
|
||||||
|
850,000
|
102,000
|
NIBOR
|
4.60%
|
7.89%
|
(6,080)
|
4.7
|
||||||
|
(29,122)
|
||||||||||||
|
(1)
|
In thousands of Norwegian Kroner and U.S. Dollars.
|
Interest Rate Risk
We are exposed to the impact of interest rate changes primarily through our borrowings that require us to make interest payments based on LIBOR, NIBOR or EURIBOR. Significant increases in interest rates could adversely affect our operating margins, results of operations and our ability to service our debt. We use interest rate swaps to reduce our exposure to market risk from changes in interest rates. Generally, our approach is to economically hedge a substantial majority of floating-rate debt associated with our vessels that are operating on long-term fixed-rate contracts. We manage the rest of our debt based on our outlook for interest rates and other factors.
We are exposed to credit loss in the event of non-performance by the counterparties to the interest rate swap agreements. In order to minimize counterparty risk, we only enter into derivative transactions with counterparties that are rated A- or better by Standard & Poor’s or A3 or better by Moody’s at the time of the transaction. In addition, to the extent possible and practical, interest rate swaps are entered into with different counterparties to reduce concentration risk.
The table below provides information about our financial instruments at December 31,
2018
, that are sensitive to changes in interest rates, including our debt and obligations related to capital leases and interest rate swaps, but excluding any amounts related to our equity-accounted investments. For long-term debt and obligations related to capital leases, the table presents principal cash flows and related weighted-average interest rates by expected maturity dates. For interest rate swaps, the table presents notional amounts and weighted-average interest rates by expected contractual maturity dates.
|
|
|
|
Expected Maturity Date
|
|
|
|
|||||||||||||||||||||
|
|
2019
|
2020
|
2021
|
2022
|
2023
|
Thereafter
|
Total
|
Fair Value
Asset /
(Liability)
|
Rate
(1)
|
||||||||||||||||||
|
|
(in millions of U.S. dollars)
|
||||||||||||||||||||||||||
|
Long-Term Debt:
|
|||||||||||||||||||||||||||
|
Variable Rate ($U.S.)
(2)
|
199.3
|
|
570.8
|
|
621.7
|
|
141.2
|
|
45.9
|
|
437.2
|
|
2,016.1
|
|
(1,974.3
|
)
|
3.3
|
%
|
|||||||||
|
Variable Rate (Euro)
(3) (4)
|
24.7
|
|
25.8
|
|
27.0
|
|
28.2
|
|
59.6
|
|
28.5
|
|
193.8
|
|
(189.9
|
)
|
1.2
|
%
|
|||||||||
|
Variable Rate (NOK)
(4) (5)
|
—
|
|
115.7
|
|
138.9
|
|
—
|
|
98.4
|
|
—
|
|
353.0
|
|
(361.1
|
)
|
6.0
|
%
|
|||||||||
|
Fixed-Rate Debt ($U.S.)
|
19.3
|
|
527.9
|
|
46.6
|
|
9.3
|
|
134.3
|
|
62.8
|
|
800.2
|
|
(721.5
|
)
|
7.2
|
%
|
|||||||||
|
Average Interest Rate
|
4.9
|
%
|
8.4
|
%
|
5.2
|
%
|
4.4
|
%
|
5.0
|
%
|
4.4
|
%
|
7.2
|
%
|
|||||||||||||
|
Obligations Related to Capital Leases:
|
|||||||||||||||||||||||||||
|
Variable-Rate ($U.S.)
(6)
|
63.4
|
|
40.3
|
|
41.9
|
|
43.9
|
|
45.8
|
|
491.5
|
|
726.8
|
|
(728.3
|
)
|
6.1
|
%
|
|||||||||
|
Fixed-Rate ($U.S.)
(6)
|
38.8
|
|
40.7
|
|
42.8
|
|
45.1
|
|
47.6
|
|
732.0
|
|
947.0
|
|
(924.0
|
)
|
5.4
|
%
|
|||||||||
|
Average Interest Rate
(7)
|
5.4
|
%
|
5.4
|
%
|
5.4
|
%
|
5.4
|
%
|
5.4
|
%
|
5.4
|
%
|
5.4
|
%
|
|||||||||||||
|
Interest Rate Swaps:
|
|||||||||||||||||||||||||||
|
Contract Amount ($U.S.)
(8)
|
236.4
|
|
253.9
|
|
430.8
|
|
25.9
|
|
26.6
|
|
188.9
|
|
1,162.5
|
|
(22.4
|
)
|
2.9
|
%
|
|||||||||
|
Average Fixed Pay Rate
(2)
|
2.6
|
%
|
3.0
|
%
|
2.6
|
%
|
3.7
|
%
|
3.7
|
%
|
3.3
|
%
|
2.9
|
%
|
|||||||||||||
|
Contract Amount (Euro)
(4) (9)
|
9.7
|
|
10.4
|
|
11.2
|
|
12.1
|
|
43.1
|
|
—
|
|
86.5
|
|
(11.1
|
)
|
3.8
|
%
|
|||||||||
|
Average Fixed Pay Rate
(3)
|
3.7
|
%
|
3.7
|
%
|
3.7
|
%
|
3.7
|
%
|
3.9
|
%
|
—
|
%
|
3.8
|
%
|
|||||||||||||
|
(1)
|
Rate refers to the weighted-average effective interest rate for our long-term debt and obligations related to capital leases, including the margin we pay on our floating-rate debt, which, as of December 31,
2018
, ranged from
0.3%
to
3.95%
for U.S. Dollar-denominated debt. The average interest rate for our obligations related to capital leases is the weighted-average interest rate implicit in our obligations related to capital leases at the inception of the leases.
|
|
(2)
|
Interest payments on U.S. Dollar-denominated debt and interest rate swaps are based on LIBOR.
|
|
(3)
|
Interest payments on Euro-denominated debt and interest rate swaps are based on EURIBOR.
|
|
(4)
|
Euro-denominated and NOK-denominated amounts have been converted to U.S. Dollars using the prevailing exchange rate as of December 31,
2018
.
|
102
|
(5)
|
Interest payments on Teekay LNG's NOK-denominated debt and on Teekay LNG's cross currency swaps are based on NIBOR. Teekay LNG's NOK-denominated debt has been economically hedged with cross currency swaps, to swap all interest and principal payments at maturity into U.S. Dollars, with the interest payments fixed at rates between
5.92%
to
7.89%
, and the transfer of principal fixed at
$382.5 million
upon maturities.
|
|
(6)
|
The amount of obligations related to capital leases represents the present value of minimum lease payments together with our purchase obligation, as applicable.
|
|
(7)
|
The average interest rate is the weighted-average interest rate implicit in the obligations related to fixed-rate capital leases at the inception of the leases.
|
|
(8)
|
The average variable receive rate for our U.S. Dollar-denominated interest rate swaps is set at 3-month or 6-month LIBOR.
|
|
(9)
|
The average variable receive rate for our Euro-denominated interest rate swaps is set at 1-month EURIBOR or 6-month EURIBOR.
|
Equity Price Risk
We are exposed to the changes in the unit price of Teekay Offshore. We have stock purchase warrants entitling us to purchase an aggregate of
15.5 million
common units of Teekay Offshore for an exercise price of
$0.01
per common unit, which warrants become exercisable when Teekay Offshore's common unit volume-weighted average price is equal to or greater than
$4.00
per common unit for
10
consecutive trading days until September 25, 2024. In addition, we hold
1.8 million
warrants to purchase common units of Teekay Offshore that were issued in connection with Teekay Offshore's private placement of Series D Preferred Units in June 2016 with an exercise price of
$4.55
, which have a seven-year term and are exercisable any time and will be net settled in either cash or common units at Teekay Offshore’s option.
Commodity Price Risk
From time to time, we may use bunker fuel swap contracts relating to a portion of our bunker fuel expenditures. As at December 31,
2018
, we were not committed to any bunker fuel swap contracts.
Spot Tanker Market Rate Risk
We are exposed to fluctuations in spot tanker market rates which can adversely affect our revenues. To reduce its exposure, Teekay Tankers uses forward freight agreements (or
FFAs)
in non-hedge-related transactions to increase or decrease its exposure to spot market rates, within defined limits. Net gains and losses from FFAs are recorded within realized and unrealized losses on non-designated derivative instruments in our
consolidated statements of (loss) income
. As at
December 31, 2018
,
the fair value of the forward freight agreement was
negative
$0.1 million
.
|
Item 12.
|
Description of Securities Other than Equity Securities
|
Not applicable.
|
Item 13.
|
Defaults, Dividend Arrearages and Delinquencies
|
None.
|
Item 14.
|
Material Modifications to the Rights of Security Holders and Use of Proceeds
|
Not applicable.
|
Item 15.
|
Controls and Procedures
|
We maintain disclosure controls and procedures (as defined in Rules 13a-15(e) and 15d-15(e) under the Exchange Act that are designed to ensure that (i) information required to be disclosed in our reports that are filed or submitted under the Exchange Act, are recorded, processed, summarized, and reported within the time periods specified in the SEC’s rules and forms, and (ii) information required to be disclosed by us in the reports we file or submit under the Exchange Act is accumulated and communicated to our management, including the principal executive and principal financial officers, or persons performing similar functions, as appropriate to allow timely decisions regarding required disclosure.
We conducted an evaluation of our disclosure controls and procedures under the supervision and with the participation of the Chief Executive Officer and Chief Financial Officer. Based on the evaluation, the Chief Executive Officer and Chief Financial Officer concluded that our disclosure controls and procedures are effective as of
December 31, 2018
.
103
The Chief Executive Officer and Chief Financial Officer do not expect that our disclosure controls or internal controls will prevent all errors and all fraud. Although our disclosure controls and procedures were designed to provide reasonable assurance of achieving their objectives, a control system, no matter how well conceived and operated, can provide only reasonable, not absolute, assurance that the objectives of the system are met. Further, the design of a control system must reflect the fact that there are resource constraints, and the benefits of controls must be considered relative to their costs. Because of the inherent limitations in all control systems, no evaluation of controls can provide absolute assurance that all control issues and instances of fraud, if any, within us have been detected. These inherent limitations include the realities that judgments in decision-making can be faulty, and that breakdowns can occur because of simple error or mistake. Additionally, controls can be circumvented by the individual acts of some persons, by collusion of two or more people, or by management override of the control. The design of any system of controls also is based partly on certain assumptions about the likelihood of future events, and there can be no assurance that any design will succeed in achieving its stated goals under all potential future conditions.
Management’s Report on Internal Control over Financial Reporting
Our management is responsible for establishing and maintaining adequate internal control over financial reporting for us.
Our internal controls are designed to provide reasonable assurance as to the reliability of our financial reporting and the preparation and presentation of the consolidated financial statements for external purposes in accordance with accounting principles generally accepted in the United States. Our internal control over financial reporting includes those policies and procedures that: (1) pertain to the maintenance of records that, in reasonable detail, accurately and fairly reflect the transactions and dispositions of our assets; (2) provide reasonable assurance that transactions are recorded as necessary to permit preparation of the financial statements in accordance with generally accepted accounting principles, and that our receipts and expenditures are being made in accordance with authorizations of management and the directors; and (3) provide reasonable assurance regarding prevention or timely detection of unauthorized acquisition, use or disposition of our assets that could have a material effect on the financial statements.
We conducted an evaluation of the effectiveness of our internal control over financial reporting based upon the framework in Internal Control – Integrated Framework (2013) issued by the Committee of Sponsoring Organizations of the Treadway Commission. This evaluation included review of the documentation of controls, evaluation of the design effectiveness of controls, testing of the operating effectiveness of controls and a conclusion on this evaluation.
Because of its inherent limitations, internal control over financial reporting may not prevent or detect misstatements even when determined to be effective and can only provide reasonable assurance with respect to financial statement preparation and presentation. Also, projections of any evaluation of effectiveness to future periods are subject to the risk that controls may become inadequate because of changes in conditions, or that the degree of compliance with the policies and procedures may deteriorate. However, based on the evaluation, management believes that we maintained effective internal control over financial reporting as of
December 31, 2018
.
Our independent auditors, KPMG LLP, an independent registered public accounting firm, have audited the accompanying consolidated financial statements and the effectiveness of our internal control over financial reporting as of
December 31, 2018
. Their attestation report on the effectiveness of our internal control over financial reporting can be found on page F-2 of this Annual Report.
There were no changes in our internal controls that have materially affected, or are reasonably likely to materially affect, our internal control over financial reporting (as defined in Rule 13a – 15 (f) under the Exchange Act) that occurred during the year ended
December 31, 2018
.
|
Item 16A.
|
Audit Committee Financial Expert
|
The Board has determined that director and Chair of the Audit Committee, Alan Semple, qualifies as an audit committee financial expert and is independent under applicable NYSE and SEC standards.
|
Item 16B.
|
Code of Ethics
|
We have adopted a Standards of Business Conduct that applies to all employees and directors. This document is available under “Investors – Teekay Corporation – Governance” from the home page of our website (www.teekay.com). We also intend to disclose under “Investors – Teekay Corporation – Governance” in the Investors section of our web site any waivers to or amendments of our Standards of Business Conduct that benefit our directors and executive officers.
104
|
Item 16C.
|
Principal Accountant Fees and Services
|
Our principal accountant for
2018
and
2017
was KPMG LLP, Chartered Professional Accountants. The following table shows the fees Teekay and our subsidiaries paid or accrued for audit and other services provided by KPMG LLP for
2018
and
2017
.
|
Fees
(1)
(in thousands of U.S. dollars)
|
2018
|
2017
|
||||
|
Audit Fees
(2)
|
2,529
|
|
3,547
|
|
||
|
Audit-Related Fees
(3)
|
59
|
|
64
|
|
||
|
Tax Fees
(4)
|
32
|
|
57
|
|
||
|
Total
|
2,620
|
|
|
3,668
|
|
|
___________________________
|
(1)
|
The fees for the 2017 comparative period include the fees of Teekay Offshore Partners L.P. for the period from January 1, 2017 to September 25, 2017.
|
|
(2)
|
Audit fees represent fees for professional services provided in connection with the audits of our consolidated financial statements and effectiveness of internal control over financial reporting, reviews of our quarterly consolidated financial statements and audit services provided in connection with other statutory or regulatory filings for Teekay or our subsidiaries including professional services in connection with the review of our regulatory filings for public offerings of our subsidiaries. Audit fees for
2018
and
2017
include approximately
$859,000
and
$930,000
, respectively, of fees paid to KPMG LLP by Teekay LNG that were approved by the Audit Committee of the Board of Directors of the general partner of Teekay LNG. Audit fees for
2018
and
2017
include approximately
$nil
and
$437,000
, respectively, of fees paid to KPMG LLP by our equity-accounted investee, Teekay Offshore, that were approved by the Audit Committee of the Board of Directors of the general partner of Teekay Offshore. Audit fees for
2018
and
2017
include approximately
$517,000
and
$545,000
, respectively, of fees paid to KPMG LLP by our subsidiary Teekay Tankers that were approved by the Audit Committee of the Board of Directors of Teekay Tankers.
|
|
(3)
|
Audit-related fees consisted primarily of accounting consultations, employee benefit plan audits, services related to business acquisitions, divestitures and other attestation services.
|
|
(4)
|
For
2018
and
2017
, tax fees principally included corporate tax compliance fees.
|
The Audit Committee has the authority to pre-approve audit-related and non-audit services not prohibited by law to be performed by our independent auditors and associated fees. Engagements for proposed services either may be separately pre-approved by the Audit Committee or entered into pursuant to detailed pre-approval policies and procedures established by the Audit Committee, as long as the Audit Committee is informed on a timely basis of any engagement entered into on that basis. The Audit Committee separately pre-approved all engagements and fees paid to our principal accountants in
2018
and
2017
.
|
Item 16D.
|
Exemptions from the Listing Standards for Audit Committees
|
Not applicable.
|
Item 16E.
|
Purchases of Equity Securities by the Issuer and Affiliated Purchasers
|
In October 2008, we announced that our Board of Directors had authorized the repurchase of up to $200 million of shares of our common stock. As at
December 31, 2018
, Teekay had repurchased
5.2 million
shares of Common Stock for
$162.3 million
pursuant to such authorizations, and the total remaining share repurchase authorization at
December 31, 2018
, was
$37.7 million
.
Neither Teekay nor any “affiliated purchaser,” as defined in Rule 10b-18(a)(3) of the Exchange Act, purchased any shares of our common stock during 2017 and 2018.
|
Item 16F.
|
Change in Registrant’s Certifying Accountant
|
Not applicable.
105
|
Item 16G.
|
Corporate Governance
|
The following are the significant ways in which our corporate governance practices differ from those followed by domestic companies:
|
•
|
In lieu of obtaining shareholder approval prior to the adoption of equity compensation plans, the Board of Directors approves such adoption, as permitted by New York Stock Exchange rules for foreign private issuers.
|
There are no other significant ways in which our corporate governance practices differ from those followed by U.S. domestic companies under the listing requirements of the New York Stock Exchange.
|
Item 16H.
|
Mine Safety Disclosure
|
Not applicable.
|
Item 17.
|
Financial Statements
|
Not applicable.
|
Item 18.
|
Financial Statements
|
The following consolidated financial statements and schedule, together with the related reports of KPMG LLP, Independent Registered Public Accounting Firm thereon, are filed as part of this Annual Report:
All other schedules for which provision is made in the applicable accounting regulations of the SEC are not required, are inapplicable or have been disclosed in the Notes to the Consolidated Financial Statements and therefore have been omitted.
|
Item 19.
|
Exhibits
|
The following exhibits are filed as part of this Annual Report:
|
Amended and Restated Articles of Incorporation of Teekay Corporation.
(10)
|
|
|
Articles of Amendment of Articles of Incorporation of Teekay Corporation.
(10)
|
|
|
Amended and Restated Bylaws of Teekay Corporation.
(1)
|
|
|
2.1
|
Registration Rights Agreement among Teekay Corporation, Tradewinds Trust Co. Ltd., as Trustee for the Cirrus Trust, and Worldwide Trust Services Ltd., as Trustee for the JTK Trust.
(2)
|
|
2.2
|
Specimen of Teekay Corporation Common Stock Certificate.
(2)
|
|
Indenture dated as of January 27, 2010 among Teekay Corporation and The Bank of New York Mellon Trust Company, N.A. for $450,000,000 8.5% Senior Notes due 2020.
(11)
|
|
|
First Supplemental Indenture dated November 16, 2015 among Teekay Corporation and The Bank of New York Mellon Trust Company, N.A. for $200,000,000 8.5% Senior Unsecured Notes due 2021.
(18)
|
|
|
Underwriting Agreement, dated January 24, 2018, by and between Teekay Corporation, Morgan Stanley & Co. LLC, and J.P. Morgan Securities LLC, acting on behalf of themselves and on behalf of the several purchases listed on Schedule I thereto.
(23)
|
|
|
Indenture dated as of January 26, 2018, between Teekay Corporation and The Bank of New York Mellon, as Trustee.
(23)
|
|
|
Purchase Agreement, dated January 24, 2018, between Teekay Corporation and J.P. Morgan Securities LLC, for itself and on behalf of the several initial purchasers listed in Schedule 1 thereto.
(23)
|
|
106
|
1995 Stock Option Plan.
(2)
|
|
|
4.2
|
Amendment to 1995 Stock Option Plan.
(3)
|
|
Amended 1995 Stock Option Plan.
(4)
|
|
|
Amended 2003 Equity Incentive Plan.
(13)
|
|
|
Annual Executive Bonus Plan.
(5)
|
|
|
4.7
|
Form of Indemnification Agreement between Teekay and each of its officers and directors.
(2)
|
|
Amended Rights Agreement, dated as of July 2, 2010 between Teekay Corporation and The Bank of New York, as Rights Agent.
(6)
|
|
|
Agreement dated August 23, 2006, for a $330,000,000 Secured Reducing Revolving Loan Facility among Teekay LNG Partners L.P., ING Bank N.V. and various other banks.
(7)
|
|
|
Agreement, dated November 28, 2007 for a $845,000,000 Secured Reducing Revolving Loan Facility among Teekay Corporation, Teekay Tankers Ltd., Nordea Bank Finland PLC and various other banks.
(8)
|
|
|
Amended and Restated Omnibus Agreement dated as of December 19, 2006, among Teekay Corporation, Teekay GP L.L.C., Teekay LNG Partners L.P., Teekay LNG Operating L.L.C., Teekay Offshore GP L.L.C., Teekay Offshore Partners L.P., Teekay Offshore Operating GP. L.L.C. and Teekay Offshore Operating L.P.
(9)
|
|
|
2013 Equity Incentive Plan.
(12)
|
|
|
Agreement, dated December 21, 2012 for a $200,000,000 Margin Loan Agreement among Teekay Finance Limited, Citibank, N.A. and others.
(14)
|
|
|
Amendment Agreement No. 1, dated December 18, 2013 for a $300,000,000 Margin Loan Agreement among Teekay Finance Limited, Citibank, N.A. and others.
(15)
|
|
|
Agreement, dated February 24, 2014 for a $815,000,000 Secure Term Loan Facility Agreement among Knarr L.L.C., Citibank, N.A. and others.
(16)
|
|
|
Agreement dated July 7, 2014; Teekay LNG Operating L.L.C. entered into a shareholder agreement with China LNG Shipping (Holdings) Limited to form TC LNG Shipping L.L.C in connection with the Yamal LNG Project.
(17)
|
|
|
Agreement dated December 17, 2014, for a $450,000,000 secured loan facility between Nakilat Holdco L.L.C. and Qatar National Bank SAQ.
(17)
|
|
|
Amendment Agreement No. 2, dated December 19, 2014 for a $500,000,000 Margin Loan Agreement among Teekay Finance Limited, Citibank, N.A. and others.
(17)
|
|
|
Amendment Agreement No. 3, dated October 2, 2015 for a $500,000,000 Margin Loan Agreement among Teekay Finance Limited, Citibank, N.A. and others.
(18)
|
|
|
Amendment Agreement No. 4, dated December 17, 2015 for a $300,000,000 Margin Loan Agreement among Teekay Finance Limited, Citibank, N.A. and others.
(18)
|
|
|
Agreement, dated July 31, 2015, among OOGTK Libra GmbH & Co KG, ABN AMRO Bank N.V. and various other banks for a $803,711,786.92 term loan due 2027.
(18)
|
|
|
Purchase Agreement, dated November 10, 2015, between Teekay Corporation and J.P. Morgan Securities LLC, for itself and on behalf of the several initial purchasers listed in Schedule 1 thereto.
(18)
|
|
|
Registration Rights Agreement, dated November 16, 2015 by and among Teekay Corporation and J.P. Morgan Securities LLC, for itself and as representative of the several initial purchasers listed in Schedule 1 thereto.
(18)
|
|
|
Secured Term Loan and Revolving Credit Facility Agreement dated January 8, 2016 between Teekay Tankers Ltd., Nordea Bank Finland PLC and various other banks, for a $894.4 million long-term debt facility.
(18)
|
|
|
Share Purchase Agreement, dated May 18, 2016, by and among Teekay Corporation and the purchasers named therein.
(19)
|
|
|
Registration Rights Agreement, dated June 29, 2016, by and among Teekay Corporation and the investors named therein.
(19)
|
|
|
Equity Distribution Agreement, dated September 9, 2016, between Teekay Corporation and Citigroup Global Markets Inc.
(20)
|
|
|
Warrant Agreement dated as of September 25, 2017, between Teekay Offshore Partners L.P. and Teekay Shipping Limited.
(21)
|
|
|
Second Amended and Restated Limited Liability Company Agreement of Teekay Offshore GP L.L.C., dated as of September 25, 2017, by and between Teekay Holdings Limited and Brookfield TK TOGP L.P.
(21)
|
|
|
Registration Rights Agreement, dated as of September 25, 2017, by and between Teekay Offshore Partners L.P., Teekay Corporation and Brookfield TK TOLP L.P.
(21)
|
|
|
Investment Agreement, dated as of July 26, 2017, between Teekay Offshore Partners L.P. and Teekay Holdings Limited
(22)
|
|
|
Purchase Agreement, dated as of July 26, 2017, between Teekay Holdings Limited and Brookfield TK TOGP L.P.
(22)
|
|
|
Amended and Restated Subordinate Promissory Note, dated as of July 26, 2017, by and between Teekay Offshore Partners L.P., Teekay Corporation and Brookfield TK TOLP L.P.
(22)
|
|
|
Master Services Agreement, dated as of September 25, 2017, by and between Teekay Corporation, Teekay Offshore Partners L.P. and Brookfield TK TOLP L.P.
(21)
|
|
107
|
Trademark License Agreement, dated as of September 25, 2017, by and between Teekay Corporation and Teekay Offshore Partners L.P.
(21)
|
|
|
Amendment Agreement No. 8, dated December 24, 2018 for a $200,000,000 Margin Loan Agreement among Teekay Finance Limited, Citibank, N.A. and others.
|
|
|
List of Subsidiaries.
|
|
|
Rule 13a-14(a)/15d-14(a) Certification of Teekay’s Chief Executive Officer.
|
|
|
Rule 13a-14(a)/15d-14(a) Certification of Teekay’s Chief Financial Officer.
|
|
|
Teekay Corporation Certification of Kenneth Hvid, Chief Executive Officer, pursuant to 18 U.S.C. Section 1350, as adopted pursuant to Section 906 of the Sarbanes-Oxley Act of 2002.
|
|
|
Teekay Corporation Certification of Vincent Lok, Chief Financial Officer, pursuant to 18 U.S.C. Section 1350, as adopted pursuant to Section 906 of the Sarbanes-Oxley Act of 2002.
|
|
|
Consent of KPMG LLP, as independent registered public accounting firm.
|
|
|
101.INS
|
XBRL Instance Document
|
|
101.SCH
|
XBRL Taxonomy Extension Schema
|
|
101.CAL
|
XBRL Taxonomy Extension Calculation Linkbase
|
|
101.DEF
|
XBRL Taxonomy Extension Definition Linkbase
|
|
101.LAB
|
XBRL Taxonomy Extension Label Linkbase
|
|
101.PRE
|
XBRL Taxonomy Extension Presentation Linkbase
|
_________________________
|
(1)
|
Previously filed as an exhibit to the Company’s Report on Form 6-K (File No.1-12874), filed with the SEC on August 31, 2011, and hereby incorporated by reference to such Report.
|
|
(2)
|
Previously filed as an exhibit to the Company’s Registration Statement on Form F-1 (Registration No. 33-7573-4), filed with the SEC on July 14, 1995, and hereby incorporated by reference to such Registration Statement.
|
|
(3)
|
Previously filed as an exhibit to the Company’s Form 6-K (File No.1-12874), filed with the SEC on May 2, 2000, and hereby incorporated by reference to such Report.
|
|
(4)
|
Previously filed as an exhibit to the Company’s Annual Report on Form 20-F (File No.1-12874), filed with the SEC on April 2, 2001, and hereby incorporated by reference to such Report.
|
|
(5)
|
Previously filed as exhibit 4.28 to the Company’s Report on Form 20-F (File No. 1-12874), filed with the SEC on April 8, 2005, and hereby incorporated by reference to such Report.
|
|
(6)
|
Previously filed as exhibit 1.2 to the Company’s Form 8-A/A (File No.1-12874), filed with the SEC on July 2, 2010, and hereby incorporated by reference to such Report.
|
|
(7)
|
Previously filed as an exhibit to the Company’s Report on Form 6-K (File No. 1-12874), filed with the SEC on December 21, 2006, and hereby incorporated by reference to such Report.
|
|
(8)
|
Previously filed as an exhibit to the Company’s Report on Form 20-F (File No. 1-12874), filed with the SEC on April 11, 2008, and hereby incorporated by reference to such Report.
|
|
(9)
|
Previously filed as exhibit 4.15 to the Company’s Report on Form 20-F (File No. 1-12874), filed with the SEC on April 19, 2007, and hereby incorporated by reference to such Report.
|
|
(10)
|
Previously filed as an exhibit to the Company’s Report on Form 20-F (File No. 1-12874), filed with the SEC on April 7, 2009, and hereby incorporated by reference to such Report.
|
|
(11)
|
Previously filed as exhibit 4.1 to the Company’s Report on Form 6-K (File No. 1-12874), filed with the SEC on January 27, 2010, and hereby incorporated by reference to such Report.
|
|
(12)
|
Previously filed as exhibit 99.1 to the Company’s Registration Statement on Form S-8 (Registration No. 333-187142), filed with the SEC on March 8, 2013, and hereby incorporated by reference to such Registration Statement.
|
|
(13)
|
Previously filed as an exhibit to the Company’s Report on Form 20-F (File No. 1-12874), filed with the SEC on April 25, 2012, and hereby incorporated by reference to such Report.
|
|
(14)
|
Previously filed as an exhibit to the Company’s Report on Form 20-F (File No. 1-12874), filed with the SEC on April 29, 2013, and hereby incorporated by reference to such Report.
|
|
(15)
|
Previously filed as an exhibit to the Company’s Report on Form 20-F (File No. 1-12874), filed with the SEC on April 28, 2014, and hereby incorporated by reference to such Report.
|
|
(16)
|
Previously filed as exhibit 4.1 to the Company’s Report on Form 6-K (File No. 1-12874), filed with the SEC on September 2, 2014, and hereby incorporated by reference to such Report.
|
|
(17)
|
Previously filed as an exhibit to the Company’s Report on Form 20-F (File No. 1-12874), filed with the SEC on April 29, 2015, and hereby incorporated by reference to such Report.
|
108
|
(18)
|
Previously filed as an exhibit to the Company’s Report on Form 20-F (File No. 1-12874), filed with the SEC on April 26, 2016, and hereby incorporated by reference to such Report.
|
|
(19)
|
Previously filed as exhibits 10.1 and 4.1 to the Company’s Report on Form 6-K (File No. 1-12874), filed with the SEC on June 30, 2016, and hereby incorporated by reference to such Report.
|
|
(20)
|
Previously filed as exhibit 1.1 to the Company’s Report on Form 6-K (File No. 1-12874), filed with the SEC on September 9, 2016, and hereby incorporated by reference to such Report.
|
|
(21)
|
Previously filed as exhibits 4.1, 4.2, 4.3, 10.4 and 10.5 to the Company’s Report on Form 6-K (File No. 1-12874), filed with the SEC on November 22, 2017, and hereby incorporated by reference to such Report.
|
|
(22)
|
Previously filed as exhibits 10.1, 10.2 and 10.3 to the Company’s Report on Form 6-K (File No. 1-12874), filed with the SEC on August 1, 2017, and hereby incorporated by reference to such Report.
|
|
(23)
|
Previously filed as exhibits 1.1, 4.1 and 10.1 to the Company’s Report on Form 6-K (File No. 1-12874), filed with the SEC on January 26, 2018, and hereby incorporated by reference to such Report.
|
109
SIGNATURE
The registrant hereby certifies that it meets all of the requirements for filing on Form 20-F and that it has duly caused and authorized the undersigned to sign this Annual Report on its behalf.
|
TEEKAY CORPORATION
|
||
|
By:
|
|
/s/ Vincent Lok
|
|
Vincent Lok
|
||
|
Executive Vice President and Chief Financial Officer
(Principal Financial and Accounting Officer)
|
||
Dated: April 1, 2019
110
REPORT OF INDEPENDENT REGISTERED PUBLIC ACCOUNTING FIRM
The Board of Directors and Shareholders
TEEKAY CORPORATION
Opinion on the Consolidated Financial Statements
We have audited the accompanying consolidated balance sheets of Teekay Corporation and subsidiaries (the Company) as of December 31, 2018 and 2017, the related consolidated statements of (loss) income, comprehensive (loss) income, cash flows, and changes in total equity for each of the years in the three‑year period ended December 31, 2018, and the related notes and financial statement schedule I (collectively, the consolidated financial statements). In our opinion, the consolidated financial statements present fairly, in all material respects, the financial position of the Company as of December 31, 2018 and 2017, and the results of its operations and its cash flows for each of the years in the three‑year period ended December 31, 2018, in conformity with U.S. generally accepted accounting principles.
We also have audited, in accordance with the standards of the Public Company Accounting Oversight Board (United States) (PCAOB), the Company’s internal control over financial reporting as of December 31, 2018, based on the criteria established in
Internal Control - Integrated Framework (2013)
issued by the Committee of Sponsoring Organizations of the Treadway Commission, and our report dated April 1, 2019 expressed an unqualified opinion on the effectiveness of the Company’s internal control over financial reporting.
Change in Accounting Principle
As discussed in Note 2 to the consolidated financial statements, the Company has changed its accounting policies for revenue recognition as of January 1, 2018 due to the adoption of ASU 2014-09
- Revenue from Contracts with Customers,
and has changed the classification of restricted cash and final settlements on cross currency swap agreements on the statement of cash flows for 2018 and comparative periods due to the adoption of ASU 2016-18 -
Statement of Cash Flows: Restricted Cash
and
ASU 2016-15
- Statement of Cash Flows: Classification of Certain Cash Receipts and Cash Payments
, respectively.
Basis for Opinion
These consolidated financial statements are the responsibility of the Company’s management. Our responsibility is to express an opinion on these consolidated financial statements based on our audits. We are a public accounting firm registered with the PCAOB and are required to be independent with respect to the Company in accordance with the U.S. federal securities laws and the applicable rules and regulations of the Securities and Exchange Commission and the PCAOB.
We conducted our audits in accordance with the standards of the PCAOB. Those standards require that we plan and perform the audit to obtain reasonable assurance about whether the consolidated financial statements are free of material misstatement, whether due to error or fraud. Our audits included performing procedures to assess the risks of material misstatement of the consolidated financial statements, whether due to error or fraud, and performing procedures that respond to those risks. Such procedures included examining, on a test basis, evidence regarding the amounts and disclosures in the consolidated financial statements. Our audits also included evaluating the accounting principles used and significant estimates made by management, as well as evaluating the overall presentation of the
consolidated financial statements. We believe that our audits provide a reasonable basis for our opinion.
Accompanying Supplemental Information
The financial statement schedule I has been subjected to audit procedures performed in conjunction with the audit of the Company’s consolidated financial statements. The financial statement schedule I is the responsibility of the Company’s management. Our audit procedures included determining whether the financial statement schedule I reconciles to the consolidated financial statements or the underlying accounting and other records, as applicable, and performing procedures to test the completeness and accuracy of the information presented in the financial statement schedule I. In forming our opinion on the financial statement schedule I, we evaluated whether the financial statement schedule I, including its form and content, is presented in conformity with U.S. generally accepted accounting principles. In our opinion, the financial statement schedule I is fairly stated, in all material respects, in relation to the consolidated financial statements as a whole.
|
/s/ KPMG LLP
|
|
Chartered Professional Accountants
|
|
We have served as the Company’s auditor since 2011.
|
|
Vancouver, Canada
|
|
April 1, 2019
|
F -
1
REPORT OF INDEPENDENT REGISTERED PUBLIC ACCOUNTING FIRM
The Board of Directors and Shareholders
TEEKAY CORPORATION
Opinion on Internal Control Over Financial Reporting
We have audited Teekay Corporation and subsidiaries’ (the Company) internal control over financial reporting as of December 31, 2018, based on the criteria established in
Internal Control - Integrated Framework (2013)
issued by the Committee of Sponsoring Organizations of the Treadway Commission. In our opinion, the Company maintained, in all material respects, effective internal control over financial reporting as of December 31, 2018, based on the criteria established in
Internal Control - Integrated Framework (2013)
issued by the Committee of Sponsoring Organizations of the Treadway Commission.
We also have audited, in accordance with the standards of the Public Company Accounting Oversight Board (United States) (PCAOB), the consolidated balance sheets of the Company as of December 31, 2018 and 2017, the related consolidated statements of (loss) income, comprehensive (loss) income, cash flows, and changes in total equity for each of the years in the three-year period ended December 31, 2018, and the related notes and financial statement schedule I (collectively, the consolidated financial statements), and our report dated April 1, 2019 expressed an unqualified opinion on those consolidated financial statements.
Basis for Opinion
The Company’s management is responsible for maintaining effective internal control over financial reporting and for its assessment of the effectiveness of internal control over financial reporting, included in the accompanying Management’s Report on Internal Control over Financial Reporting. Our responsibility is to express an opinion on the Company’s internal control over financial reporting based on our audit. We are a public accounting firm registered with the PCAOB and are required to be independent with respect to the Company in accordance with the U.S. federal securities laws and the applicable rules and regulations of the Securities and Exchange Commission and the PCAOB.
We conducted our audit in accordance with the standards of the PCAOB. Those standards require that we plan and perform the audit to obtain reasonable assurance about whether effective internal control over financial reporting was maintained in all material respects. Our audit of internal control over financial reporting included obtaining an understanding of internal control over financial reporting, assessing the risk that a material weakness exists, and testing and evaluating the design and operating effectiveness of internal control based on the assessed risk. Our audit also included performing such other procedures as we considered necessary in the circumstances. We believe that our audit provides a reasonable basis for our opinion.
Definition and Limitations of Internal Control Over Financial Reporting
An entity’s internal control over financial reporting is a process designed to provide reasonable assurance regarding the reliability of financial reporting and the preparation of financial statements for external purposes in accordance with generally accepted accounting principles. An entity’s internal control over financial reporting includes those policies and procedures that (1) pertain to the maintenance of records that, in reasonable detail, accurately and fairly reflect the transactions and dispositions of the assets of the company; (2) provide reasonable assurance that transactions are recorded as necessary to permit preparation of financial statements in accordance with generally accepted accounting principles, and that receipts and expenditures of the entity are being made only in accordance with authorizations of management and directors of the entity; and (3) provide reasonable assurance regarding prevention or timely detection of unauthorized acquisition, use, or disposition of the entity’s assets that could have a material effect on the financial statements.
Because of its inherent limitations, internal control over financial reporting may not prevent or detect misstatements. Also, projections of any evaluation of effectiveness to future periods are subject to the risk that controls may become inadequate because of changes in conditions, or that the degree of compliance with the policies or procedures may deteriorate.
|
/s/ KPMG LLP
|
|
Chartered Professional Accountants
|
|
Vancouver, Canada
|
|
April 1, 2019
|
F -
2
TEEKAY CORPORATION AND SUBSIDIARIES
(in thousands of U.S. dollars, except share and per share amounts)
|
|
|
Year Ended
December 31, 2018 $ |
Year Ended
December 31, 2017 $ |
Year Ended
December 31, 2016 $ |
|||||
|
Revenues (
notes 2 and 13
)
|
|
1,707,758
|
|
1,880,332
|
|
2,328,569
|
|
||
|
Voyage expenses
|
|
(388,887
|
)
|
(153,766
|
)
|
(138,339
|
)
|
||
|
Vessel operating expenses (
note 13
)
|
|
(637,474
|
)
|
(731,150
|
)
|
(825,024
|
)
|
||
|
Time-charter hire expense
|
|
(86,458
|
)
|
(120,893
|
)
|
(150,145
|
)
|
||
|
Depreciation and amortization
|
|
(276,307
|
)
|
|
(485,829
|
)
|
(571,825
|
)
|
|
|
General and administrative expenses (
note 13
)
|
|
(96,555
|
)
|
(106,150
|
)
|
(119,889
|
)
|
||
|
Write-down and loss on sale of vessels (
note 18
)
|
|
(53,693
|
)
|
|
(270,743
|
)
|
(112,246
|
)
|
|
|
Restructuring charges
(note 20)
|
|
(4,065
|
)
|
|
(5,101
|
)
|
(26,811
|
)
|
|
|
Income from vessel operations
|
|
164,319
|
|
|
6,700
|
|
|
384,290
|
|
|
Interest expense
|
|
(254,126
|
)
|
|
(268,400
|
)
|
(282,966
|
)
|
|
|
Interest income
|
|
8,525
|
|
|
6,290
|
|
4,821
|
|
|
|
Realized and unrealized losses on non-designated derivative instruments (
note 15
)
|
|
(14,852
|
)
|
(38,854
|
)
|
(35,091
|
)
|
||
|
Equity income (loss)
(note 22)
|
|
61,054
|
|
(37,344
|
)
|
85,639
|
|
||
|
Foreign exchange gain (loss)
(notes 8 and 15)
|
|
6,140
|
|
|
(26,463
|
)
|
(6,548
|
)
|
|
|
Loss on deconsolidation of Teekay Offshore
(note 4)
|
|
(7,070
|
)
|
|
(104,788
|
)
|
—
|
|
|
|
Other loss
(note 14)
|
|
(2,013
|
)
|
(53,981
|
)
|
(39,013
|
)
|
||
|
Net (loss) income before income taxes
|
|
(38,023
|
)
|
|
(516,840
|
)
|
|
111,132
|
|
|
Income tax expense
(note 21)
|
|
(19,724
|
)
|
|
(12,232
|
)
|
(24,468
|
)
|
|
|
Net (loss) income
|
|
(57,747
|
)
|
|
(529,072
|
)
|
|
86,664
|
|
|
Net (income) loss attributable to non-controlling interests
(note 1)
|
|
(21,490
|
)
|
365,796
|
|
(209,846
|
)
|
||
|
Net loss attributable to shareholders of Teekay Corporation
|
|
(79,237
|
)
|
|
(163,276
|
)
|
|
(123,182
|
)
|
|
Per common share of Teekay Corporation
(note 19)
|
|
|
|||||||
|
• Basic loss attributable to shareholders of Teekay Corporation
|
|
(0.79
|
)
|
(1.89
|
)
|
(1.62
|
)
|
||
|
• Diluted loss attributable to shareholders of Teekay Corporation
|
|
(0.79
|
)
|
(1.89
|
)
|
(1.62
|
)
|
||
|
• Cash dividends declared
|
|
0.220
|
|
0.220
|
|
0.220
|
|
||
|
Weighted average number of common shares outstanding
(note 19)
|
|
|
|||||||
|
• Basic
|
|
99,670,176
|
|
86,335,473
|
|
79,211,154
|
|
||
|
• Diluted
|
|
99,670,176
|
|
86,335,473
|
|
79,211,154
|
|
||
The accompanying notes are an integral part of the consolidated financial statements.
F -
3
TEEKAY CORPORATION AND SUBSIDIARIES
CONSOLIDATED STATEMENTS OF COMPREHENSIVE (LOSS) INCOME
(in thousands of U.S. dollars)
|
Year Ended
December 31, 2018 $ |
Year Ended
December 31, 2017 $ |
Year Ended
December 31, 2016 $ |
|||||||
|
Net (loss) income
|
(57,747
|
)
|
(529,072
|
)
|
86,664
|
|
|||
|
Other comprehensive income:
|
|||||||||
|
Other comprehensive income (loss) before reclassifications
|
|||||||||
|
Unrealized gain on marketable securities
|
—
|
|
438
|
|
47
|
|
|||
|
Unrealized loss on qualifying cash flow hedging instruments
|
(11
|
)
|
(1,895
|
)
|
(2,183
|
)
|
|||
|
Pension adjustments, net of taxes
|
(196
|
)
|
1,463
|
|
7,594
|
|
|||
|
Foreign exchange (loss) gain on currency translation
|
(132
|
)
|
1,279
|
|
179
|
|
|||
|
Amounts reclassified from accumulated other comprehensive loss
|
|||||||||
|
To other income:
|
|||||||||
|
Sale of marketable securities
|
—
|
|
(22
|
)
|
—
|
|
|||
|
To general and administrative expenses:
|
|||||||||
|
Settlement of defined benefit pension plan
|
—
|
|
—
|
|
(3,905
|
)
|
|||
|
To interest expense:
|
|||||||||
|
Realized loss on qualifying cash flow hedging instruments
|
152
|
|
1,614
|
|
—
|
|
|||
|
To equity income:
|
|||||||||
|
Realized (gain) loss on qualifying cash flow hedging instruments
|
(1,291
|
)
|
2,470
|
|
3,486
|
|
|||
|
Foreign exchange gain on currency translation
|
(3,161
|
)
|
—
|
|
—
|
|
|||
|
Loss on deconsolidation of Teekay Offshore (
note 4
)
|
7,720
|
|
—
|
|
—
|
|
|||
|
Other comprehensive income
|
3,081
|
|
|
5,347
|
|
|
5,218
|
|
|
|
Comprehensive (loss) income
|
(54,666
|
)
|
(523,725
|
)
|
91,882
|
|
|||
|
Comprehensive (income) loss attributable to non-controlling interests
|
(20,948
|
)
|
364,422
|
|
(211,823
|
)
|
|||
|
Comprehensive loss attributable to shareholders of Teekay Corporation
|
(75,614
|
)
|
|
(159,303
|
)
|
|
(119,941
|
)
|
|
The accompanying notes are an integral part of the consolidated financial statements.
F -
4
TEEKAY CORPORATION AND SUBSIDIARIES
(in thousands of U.S. dollars)
|
As at
December 31, 2018 $ |
As at
December 31, 2017 $ |
|||||
|
ASSETS
|
||||||
|
Current
|
||||||
|
Cash and cash equivalents (
note 8
)
|
424,169
|
|
|
445,452
|
|
|
|
Restricted cash - current (
notes 10 and 15)
|
40,493
|
|
|
38,179
|
|
|
|
Accounts receivable, including non-trade of $7,883 (2017 - $15,273) and related party balances of $57,062 (2017 - $16,068)
|
174,031
|
|
159,859
|
|
||
|
Assets held for sale (
note 18
)
|
—
|
|
33,671
|
|
||
|
Net investment in direct financing leases (
note 2
)
|
12,635
|
|
9,884
|
|
||
|
Prepaid expenses and other (
notes 1 and 15
)
|
77,496
|
|
38,180
|
|
||
|
Current portion of loans to equity-accounted investments (
note 22
)
|
169,197
|
|
107,486
|
|
||
|
Total current assets
|
898,021
|
|
|
832,711
|
|
|
|
Restricted cash - non-current (
notes 10 and 15
)
|
40,977
|
|
|
68,543
|
|
|
|
Vessels and equipment
(
note 8
)
|
||||||
|
At cost, less accumulated depreciation of $1,270,460 (2017 - $1,293,447)
|
3,362,937
|
|
3,491,491
|
|
||
|
Vessels related to capital leases, at cost, less accumulated amortization of $178,178 (2017 – $51,290) (
note 10
)
|
2,067,254
|
|
1,272,560
|
|
||
|
Advances on newbuilding contracts and conversion costs
(note 16a)
|
86,942
|
|
444,493
|
|
||
|
Total vessels and equipment
|
5,517,133
|
|
|
5,208,544
|
|
|
|
Net investment in direct financing leases - non-current (
note 2
)
|
562,528
|
|
486,106
|
|
||
|
Investments in and loans to equity-accounted investments (
notes 4, 16b and 22
)
|
1,193,741
|
|
1,276,618
|
|
||
|
Other non-current assets
(notes 2, 15)
|
57,807
|
|
83,211
|
|
||
|
Intangible assets – net (
note 6
)
|
77,773
|
|
93,014
|
|
||
|
Goodwill (
note 6
)
|
43,690
|
|
43,690
|
|
||
|
Total assets
|
8,391,670
|
|
8,092,437
|
|
||
|
LIABILITIES AND EQUITY
|
||||||
|
Current
|
||||||
|
Accounts payable
|
31,201
|
|
24,107
|
|
||
|
Accrued liabilities and other (
notes 2, 7, 9, 15 and 20
)
|
223,179
|
|
296,232
|
|
||
|
Loans from equity-accounted investments
|
75,292
|
|
49,100
|
|
||
|
Current portion of derivative liabilities (
note 15
)
|
12,205
|
|
80,423
|
|
||
|
Current portion of long-term debt (
note 8
)
|
242,137
|
|
800,897
|
|
||
|
Current obligation related to capital leases (
note 10
)
|
102,115
|
|
114,173
|
|
||
|
Total current liabilities
|
686,129
|
|
|
1,364,932
|
|
|
|
Long-term debt (
note 8
)
|
3,077,386
|
|
2,616,808
|
|
||
|
Long-term obligation related to capital leases (
note 10
)
|
1,571,730
|
|
1,046,284
|
|
||
|
Derivative liabilities (
note 15
)
|
56,352
|
|
48,388
|
|
||
|
Other long-term liabilities (
notes 7, 9, 21
)
|
133,045
|
|
136,369
|
|
||
|
Total liabilities
|
5,524,642
|
|
|
5,212,781
|
|
|
|
Commitments and contingencies (
notes 8, 9, 10, 15 and 16
)
|
|
|
||||
|
Equity
|
||||||
|
Common stock and additional paid-in capital ($0.001 par value; 725,000,000 shares authorized; 100,435,210 shares outstanding and issued (2017 – 89,127,041))
(note 12)
|
1,045,659
|
|
919,078
|
|
||
|
Accumulated deficit
|
(234,395
|
)
|
(135,892
|
)
|
||
|
Non-controlling interest
|
2,058,037
|
|
2,102,465
|
|
||
|
Accumulated other comprehensive loss (
note 1
)
|
(2,273
|
)
|
(5,995
|
)
|
||
|
Total equity
|
2,867,028
|
|
|
2,879,656
|
|
|
|
Total liabilities and equity
|
8,391,670
|
|
|
8,092,437
|
|
|
Subsequent events (
note 23
)
The accompanying notes are an integral part of the consolidated financial statements.
F -
5
TEEKAY CORPORATION AND SUBSIDIARIES
(in thousands of U.S. dollars)
|
Year Ended
December 31, 2018 $ |
Year Ended
December 31, 2017 $ |
Year Ended
December 31, 2016 $ |
|||||||
|
Cash, cash equivalents and restricted cash provided by (used for)
|
|||||||||
|
OPERATING ACTIVITIES
|
|||||||||
|
Net (loss) income
|
(57,747
|
)
|
(529,072
|
)
|
86,664
|
|
|||
|
Non-cash and non-operating items:
|
|||||||||
|
Depreciation and amortization
|
276,307
|
|
485,829
|
|
571,825
|
|
|||
|
Unrealized gain on derivative instruments
|
(34,570
|
)
|
(95,556
|
)
|
(145,116
|
)
|
|||
|
Write-down and loss on sales of vessels
|
53,693
|
|
270,743
|
|
112,246
|
|
|||
|
Loss on deconsolidation of Teekay Offshore (
note 4
)
|
7,070
|
|
104,788
|
|
—
|
|
|||
|
Equity (income) loss, net of dividends received
|
(44,312
|
)
|
87,602
|
|
(47,563
|
)
|
|||
|
Income tax expense
|
19,724
|
|
12,232
|
|
24,468
|
|
|||
|
Foreign currency exchange loss including the effect of the termination of cross currency swaps
|
7,135
|
|
101,157
|
|
40,154
|
|
|||
|
Other
|
14,279
|
|
52,609
|
|
29,098
|
|
|||
|
Change in operating assets and liabilities (
note 17
)
|
(14,754
|
)
|
|
104,831
|
|
|
50,734
|
|
|
|
Expenditures for dry docking
|
(44,690
|
)
|
(50,899
|
)
|
(45,964
|
)
|
|||
|
Net operating cash flow
|
182,135
|
|
|
544,264
|
|
676,546
|
|
||
|
FINANCING ACTIVITIES
|
|||||||||
|
Proceeds from issuance of long-term debt, net of issuance costs
|
1,325,482
|
|
1,007,010
|
|
2,075,014
|
|
|||
|
Prepayments of long-term debt
|
(771,827
|
)
|
(831,901
|
)
|
(1,874,893
|
)
|
|||
|
Scheduled repayments of long-term debt and settlement of related swaps
|
(671,803
|
)
|
(713,278
|
)
|
(1,008,853
|
)
|
|||
|
Proceeds from financing related to sale-leaseback of vessels
|
611,388
|
|
809,935
|
|
355,306
|
|
|||
|
Repayments of obligations related to capital leases
|
(74,680
|
)
|
(46,090
|
)
|
(21,595
|
)
|
|||
|
Net proceeds from equity issuances of subsidiaries
(note 5)
|
—
|
|
172,930
|
|
327,419
|
|
|||
|
Net proceeds from equity issuances of Teekay Corporation
|
103,655
|
|
25,636
|
|
105,462
|
|
|||
|
Acquisition of shares in Teekay Tankers
|
—
|
|
(19,444
|
)
|
—
|
|
|||
|
Distribution from subsidiaries to non-controlling interests
|
(64,676
|
)
|
(103,150
|
)
|
(136,151
|
)
|
|||
|
Cash dividends paid
|
(22,082
|
)
|
(18,977
|
)
|
(17,406
|
)
|
|||
|
Other financing activities
|
(671
|
)
|
1,638
|
|
87
|
|
|||
|
Net financing cash flow
|
434,786
|
|
284,309
|
|
(195,610
|
)
|
|||
|
INVESTING ACTIVITIES
|
|||||||||
|
Expenditures for vessels and equipment
|
(693,792
|
)
|
(1,054,052
|
)
|
(648,326
|
)
|
|||
|
Proceeds from sale of vessels and equipment
|
28,837
|
|
73,712
|
|
252,656
|
|
|||
|
Proceeds from sale of equity-accounted investment
|
81,823
|
|
—
|
|
—
|
|
|||
|
Investment in equity-accounted investments
|
(41,018
|
)
|
(98,774
|
)
|
(61,885
|
)
|
|||
|
Loans to joint ventures and joint venture partners
|
(24,934
|
)
|
(12,946
|
)
|
(96,823
|
)
|
|||
|
Cash of Tanker Investments Ltd. upon acquisition, net of transaction costs (
note 22
)
|
—
|
|
30,831
|
|
—
|
|
|||
|
Cash of transferred subsidiaries on sale, net of proceeds received
|
(25,254
|
)
|
—
|
|
—
|
|
|||
|
Cash of Teekay Offshore upon deconsolidation, net of proceeds received
|
—
|
|
(45,447
|
)
|
—
|
|
|||
|
Direct financing lease payments received
|
10,882
|
|
17,422
|
|
23,535
|
|
|||
|
Other investing activities
|
—
|
|
7,613
|
|
320
|
|
|||
|
Net investing cash flow
|
(663,456
|
)
|
(1,081,641
|
)
|
(530,523
|
)
|
|||
|
Decrease in cash, cash equivalents and restricted cash
|
(46,535
|
)
|
(253,068
|
)
|
(49,587
|
)
|
|||
|
Cash, cash equivalents and restricted cash, beginning of the year
|
552,174
|
|
805,242
|
|
854,829
|
|
|||
|
Cash, cash equivalents and restricted cash, end of the year
|
505,639
|
|
552,174
|
|
805,242
|
|
|||
|
Supplemental cash flow information (
note 17
)
|
|||||||||
The accompanying notes are an integral part of the consolidated financial statements.
F -
6
TEEKAY CORPORATION AND SUBSIDIARIES
CONSOLIDATED STATEMENTS OF CHANGES IN TOTAL EQUITY
(in thousands of U.S. dollars and shares)
|
|
TOTAL EQUITY
|
|
||||||||||||||||||
|
Thousands
of Shares of Common Stock Outstanding # |
Common
Stock and Additional Paid-in Capital $ |
Retained Earnings (Accu-
mulated Deficit) $ |
Accumul-
ated Other Compre- hensive Loss $ |
Non-
controlling Interest $ |
Total
$ |
Redeemable
Non- controlling Interest $ |
||||||||||||||
|
Balance at December 31, 2015
|
72,711
|
|
775,018
|
|
158,898
|
|
(14,891
|
)
|
2,782,049
|
|
3,701,074
|
|
255,671
|
|
||||||
|
Net (loss) income
|
—
|
|
—
|
|
(123,182
|
)
|
—
|
|
209,846
|
|
86,664
|
|
—
|
|
||||||
|
Reclassification of redeemable non-controlling interest in net income
|
—
|
|
—
|
|
—
|
|
—
|
|
(25,342
|
)
|
(25,342
|
)
|
25,342
|
|
||||||
|
Other comprehensive income
|
—
|
|
—
|
|
—
|
|
3,241
|
|
1,977
|
|
5,218
|
|
—
|
|
||||||
|
Dividends declared
|
—
|
|
—
|
|
(17,562
|
)
|
—
|
|
(120,801
|
)
|
(138,363
|
)
|
(27,058
|
)
|
||||||
|
Reinvested dividends
|
1
|
|
4
|
|
—
|
|
—
|
|
—
|
|
4
|
|
—
|
|
||||||
|
Employee stock compensation and other
(note 12)
|
102
|
|
6,591
|
|
—
|
|
—
|
|
—
|
|
6,591
|
|
—
|
|
||||||
|
Equity offerings
(note 12)
|
13,336
|
|
105,462
|
|
—
|
|
—
|
|
—
|
|
105,462
|
|
—
|
|
||||||
|
Dilution gains on equity issuances of subsidiaries
(note 5)
|
—
|
|
—
|
|
9,732
|
|
—
|
|
—
|
|
9,732
|
|
—
|
|
||||||
|
Changes to non-controlling interest from equity contributions and other
|
—
|
|
—
|
|
(4,993
|
)
|
1,047
|
|
342,199
|
|
338,253
|
|
(4,853
|
)
|
||||||
|
Balance at December 31, 2016
|
86,150
|
|
887,075
|
|
22,893
|
|
(10,603
|
)
|
3,189,928
|
|
4,089,293
|
|
249,102
|
|
||||||
|
Net loss
|
—
|
|
—
|
|
(163,276
|
)
|
—
|
|
(365,796
|
)
|
(529,072
|
)
|
—
|
|
||||||
|
Reclassification of redeemable non-controlling interest in net income
|
—
|
|
—
|
|
—
|
|
—
|
|
(18,610
|
)
|
(18,610
|
)
|
18,610
|
|
||||||
|
Other comprehensive income
|
—
|
|
—
|
|
—
|
|
3,973
|
|
1,374
|
|
5,347
|
|
—
|
|
||||||
|
Dividends declared
|
—
|
|
—
|
|
(19,039
|
)
|
—
|
|
(107,609
|
)
|
(126,648
|
)
|
(13,699
|
)
|
||||||
|
Reinvested dividends
|
1
|
|
4
|
|
—
|
|
—
|
|
—
|
|
4
|
|
—
|
|
||||||
|
Employee stock compensation and other
(note 12)
|
112
|
|
6,363
|
|
—
|
|
—
|
|
—
|
|
6,363
|
|
—
|
|
||||||
|
Equity offerings
(note 12)
|
2,864
|
|
25,636
|
|
—
|
|
—
|
|
—
|
|
25,636
|
|
—
|
|
||||||
|
Dilution gains on equity issuances of subsidiaries
(note 5)
|
—
|
|
—
|
|
23,530
|
|
—
|
|
—
|
|
23,530
|
|
—
|
|
||||||
|
Impact of deconsolidation of Teekay Offshore (
note 4
)
|
—
|
|
—
|
|
—
|
|
643
|
|
(882,473
|
)
|
(881,830
|
)
|
(255,802
|
)
|
||||||
|
Changes to non-controlling interest from equity contributions and other
|
—
|
|
—
|
|
—
|
|
(8
|
)
|
285,651
|
|
285,643
|
|
1,789
|
|
||||||
|
Balance at December 31, 2017
|
89,127
|
|
919,078
|
|
(135,892
|
)
|
(5,995
|
)
|
2,102,465
|
|
2,879,656
|
|
—
|
|
||||||
|
Net (loss) income
|
—
|
|
—
|
|
(79,237
|
)
|
—
|
|
21,490
|
|
(57,747
|
)
|
—
|
|
||||||
|
Other comprehensive income (loss)
|
—
|
|
—
|
|
—
|
|
3,623
|
|
(542
|
)
|
3,081
|
|
—
|
|
||||||
|
Dividends declared
|
—
|
|
—
|
|
(22,231
|
)
|
—
|
|
(64,676
|
)
|
(86,907
|
)
|
—
|
|
||||||
|
Reinvested dividends
|
1
|
|
4
|
|
—
|
|
—
|
|
—
|
|
4
|
|
—
|
|
||||||
|
Employee stock compensation and other (
note 12
)
|
180
|
|
6,823
|
|
—
|
|
—
|
|
—
|
|
6,823
|
|
—
|
|
||||||
|
Equity offerings (
note 12
)
|
11,127
|
|
103,655
|
|
—
|
|
—
|
|
—
|
|
103,655
|
|
—
|
|
||||||
|
Equity component of convertible notes (
note 8
)
|
—
|
|
16,099
|
|
—
|
|
—
|
|
—
|
|
16,099
|
|
—
|
|
||||||
|
Change in accounting policy (
note 1
)
|
—
|
|
—
|
|
2,556
|
|
—
|
|
2,101
|
|
4,657
|
|
—
|
|
||||||
|
Changes to non-controlling interest from equity contributions and other
|
—
|
|
—
|
|
409
|
|
99
|
|
(2,801
|
)
|
(2,293
|
)
|
—
|
|
||||||
|
Balance at December 31, 2018
|
100,435
|
|
1,045,659
|
|
(234,395
|
)
|
(2,273
|
)
|
2,058,037
|
|
2,867,028
|
|
—
|
|
||||||
The accompanying notes are an integral part of the consolidated financial statements.
F -
7
TEEKAY CORPORATION AND SUBSIDIARIES
NOTES TO THE CONSOLIDATED FINANCIAL STATEMENTS
(all tabular amounts stated in thousands of U.S. dollars, other than share data and unless otherwise indicated)
1. Summary of Significant Accounting Policies
Basis of presentation
These consolidated financial statements have been prepared in conformity with U.S. generally accepted accounting principles (or
GAAP
). They include the accounts of Teekay Corporation (or
Teekay
), which is incorporated under the laws of the Republic of The Marshall Islands, its wholly-owned or controlled subsidiaries and any variable interest entities (or
VIEs
) of which it is the primary beneficiary (collectively, the
Company
).
Certain of Teekay’s significant non-wholly-owned subsidiaries are consolidated in these financial statements even though Teekay owns less than a
50%
ownership interest in the subsidiaries. These significant subsidiaries include the following publicly traded subsidiaries (collectively, the
Public Subsidiaries
): Teekay LNG Partners L.P. (or
Teekay LNG
); Teekay Tankers Ltd. (or
Teekay Tankers
); and until September 25, 2017, Teekay Offshore Partners L.P. (or
Teekay Offshore
). As of
December 31, 2018
, Teekay owned a
33.1%
interest in Teekay LNG (
33.0%
–
December 31, 2017
), including common units and its
2%
general partner interest,
a
nd
28.8%
of the capital stock of Teekay Tankers (
28.8%
–
December 31, 2017
), including Teekay Tankers’ outstanding shares of Class B common stock, which entitle the holders to
five
votes per share, subject to a
49%
aggregate Class B Common Stock voting power maximum. While Teekay owns less than
50%
of Teekay LNG and Teekay Tankers, Teekay maintains control of Teekay LNG by virtue of its
100%
ownership interest in the general partner of Teekay LNG, which is a master limited partnership, and maintains control of Teekay Tankers through its ownership of a sufficient number of Class A common shares and Class B common shares, which provide increased voting rights, to maintain a majority voting interest in Teekay Tankers and thus consolidates these subsidiaries. As at
December 31, 2018
, Teekay owned a
13.8%
interest in the common units of Teekay Offshore
and a
49%
interest in the general partner of Teekay Offshore. Teekay
accounts for its interest in Teekay Offshore using the equity method.
Teekay has entered into an omnibus agreement with Teekay LNG and Teekay Offshore to govern, among other things, when Teekay, Teekay LNG and Teekay Offshore may compete with each other and to provide the applicable parties certain rights of first offer on liquefied natural gas (or LNG) carriers, oil tankers, shuttle tankers, floating storage and off-take (or FSO) units and floating, production, storage and offloading (or FPSO) units. During 2018, Brookfield Business Partners L.P. and its institutional investors acquired a 51% ownership interest in the general partner of Teekay Offshore and have the right to appoint a majority of the directors of the general partner’s Board of Directors. This transaction constituted a change of control, giving Teekay Offshore the right to elect to terminate the omnibus agreement, though we have not received any indication from Teekay Offshore that it intends to do so.
The preparation of these consolidated financial statements in conformity with GAAP requires management to make estimates and assumptions that affect the amounts reported in the financial statements and accompanying notes. Actual results may differ from those estimates. Significant intercompany balances and transactions have been eliminated upon consolidation.
Non-Controlling Interests
Where Teekay’s ownership interest in a consolidated subsidiary is less than 100%, the non-controlling interests’ share of these non-wholly-owned subsidiaries is reported in the Company’s consolidated balance sheets as a separate component of equity. The non-controlling interests’ share of the net income of these non-wholly-owned subsidiaries is reported in the Company’s
consolidated statements of (loss) income
as a deduction from the Company’s
net (loss) income
to arrive at
net (loss) income
attributable to shareholders of Teekay.
The basis for attributing net income or loss of each non-wholly-owned subsidiary to the controlling interest and the non-controlling interests, with the exception of Teekay LNG and Teekay Offshore, until its deconsolidation on September 25, 2017, was based on the relative ownership interests of the non-controlling interests compared to the controlling interest, which is consistent with how dividends and distributions were paid or were payable for these non-wholly-owned subsidiaries.
Teekay LNG and Teekay Offshore each have limited partners and
one
general partner. Teekay LNG's general partner is wholly-owned by Teekay, and until September 25, 2017, Teekay Offshore's general partner was wholly owned by Teekay. For both Teekay LNG and Teekay Offshore, the limited partners hold common units and preferred units. For each quarterly period (with regards to Teekay Offshore, until its deconsolidation on September 25, 2017), the method of attributing Teekay LNG’s and Teekay Offshore’s net income (loss) of that period to the non-controlling interests of Teekay LNG and Teekay Offshore began by attributing net income (loss) of Teekay Offshore and Teekay LNG to the non-controlling interests which hold
100%
of the preferred units of Teekay Offshore, except for Series D Preferred Units, of which the non-controlling interests held
74%
until redemption in September 2017, and
100%
of the preferred units of Teekay LNG based on the amount of preferred unit distributions declared for the quarterly period. The remaining net income (loss) to be attributed to the controlling interest and the non-controlling interests of Teekay LNG and Teekay Offshore was then divided into
two
components. The first component consists of the cash distribution that Teekay LNG or Teekay Offshore will declare and pay to limited and general partners for that quarterly period (or the
Distributed Earnings
). The second component consists of the difference between (a) the net income (loss) of Teekay LNG or Teekay Offshore that is available to be allocated to the common unitholders and the general partner of such entity and (b) the amount of the first component cash distribution (or the
Undistributed Earnings
). The portion of the Distributed Earnings that is allocated to the non-controlling interests is the amount of the cash distribution that Teekay LNG or Teekay Offshore will declare and pay to the non-controlling interests for that quarterly period. The portion of the Undistributed Earnings that is allocated to the non-controlling interests is based on the relative ownership percentages of the non-controlling interests of Teekay LNG and Teekay Offshore compared to the controlling interest. The controlling interests include both limited partner common units and the general partner interests.
F -
8
TEEKAY CORPORATION AND SUBSIDIARIES
NOTES TO THE CONSOLIDATED FINANCIAL STATEMENTS
(all tabular amounts stated in thousands of U.S. dollars, other than share data and unless otherwise indicated)
The total net income (loss) of Teekay’s consolidated partially-owned entities and the attribution of that net income (loss) to controlling and non-controlling interests is as follows:
|
Net income (loss) attributable to non-controlling interests
|
Controlling Interest
|
Net income (loss) of consolidated partially-owned entities
(1)
|
||||||||||||||||||||||||||
|
Non-public partially-owned subsidiaries
|
Preferred unit-holders
|
Distri-
buted Earnings
|
Undistri-
buted Earnings
|
Total Net income (loss) attributable
|
Distri-
buted Earnings
|
Undistri-
buted Earnings
|
Total Controlling Interest (Teekay)
|
|||||||||||||||||||||
|
Teekay LNG
|
13,506
|
|
25,701
|
|
30,463
|
|
(10,807
|
)
|
58,863
|
|
15,026
|
|
2,986
|
|
18,012
|
|
76,875
|
|
||||||||||
|
Teekay Tankers
|
—
|
|
—
|
|
—
|
|
(37,423
|
)
|
(37,423
|
)
|
—
|
|
(15,125
|
)
|
(15,125
|
)
|
(52,548
|
)
|
||||||||||
|
Other entities and eliminations
|
—
|
|
—
|
|
—
|
|
—
|
|
50
|
|
||||||||||||||||||
|
For the Year Ended December 31, 2018
|
13,506
|
|
25,701
|
|
30,463
|
|
(48,230
|
)
|
21,490
|
|
||||||||||||||||||
|
Teekay Offshore
|
8,262
|
|
36,339
|
|
16,312
|
|
(398,185
|
)
|
(2
|
)
|
(337,272
|
)
|
5,981
|
|
334,033
|
|
(3
|
)
|
340,014
|
|
2,742
|
|
||||||
|
Teekay LNG
|
(54
|
)
|
13,979
|
|
30,474
|
|
(41,520
|
)
|
2,879
|
|
15,027
|
|
(18,995
|
)
|
(3,968
|
)
|
(1,089
|
)
|
||||||||||
|
Teekay Tankers
|
—
|
|
—
|
|
—
|
|
(28,893
|
)
|
(28,893
|
)
|
—
|
|
(30,434
|
)
|
(30,434
|
)
|
(59,327
|
)
|
||||||||||
|
Other entities and eliminations
|
—
|
|
—
|
|
—
|
|
—
|
|
(2,510
|
)
|
|
|
|
|
||||||||||||||
|
For the Year Ended December 31, 2017
|
8,208
|
|
50,318
|
|
46,786
|
|
(468,598
|
)
|
(365,796
|
)
|
||||||||||||||||||
|
Teekay Offshore
|
11,858
|
|
45,835
|
|
41,688
|
|
(46,155
|
)
|
53,226
|
|
18,378
|
|
(27,129
|
)
|
(8,751
|
)
|
44,475
|
|
||||||||||
|
Teekay LNG
|
17,514
|
|
2,719
|
|
30,444
|
|
60,545
|
|
111,222
|
|
15,026
|
|
31,717
|
|
46,743
|
|
157,965
|
|
||||||||||
|
Teekay Tankers
|
—
|
|
—
|
|
—
|
|
47,459
|
|
47,459
|
|
—
|
|
15,396
|
|
15,396
|
|
62,855
|
|
||||||||||
|
Other entities and eliminations
|
—
|
|
—
|
|
—
|
|
—
|
|
(2,061
|
)
|
|
|
|
|||||||||||||||
|
For the Year Ended December 31, 2016
|
29,372
|
|
48,554
|
|
72,132
|
|
61,849
|
|
209,846
|
|
||||||||||||||||||
|
(1)
|
Includes earnings attributable to common shares and preferred shares.
|
|
(2)
|
Subsequent to the formation of Teekay Offshore, Teekay sold certain vessels to Teekay Offshore. Even though Teekay Offshore was a non-wholly-owned consolidated subsidiary of Teekay at the date of the sales, all of the gain or loss on sales of these vessels was fully eliminated upon consolidation. Consequently, the portion of the gain or loss attributable to Teekay’s reduced interest in the vessels was deferred. The total unrecognized net deferred gain relating to the vessels previously sold from Teekay to Teekay Offshore was
$349.6 million
. Upon deconsolidation of Teekay Offshore, such amount was recognized as an increase to net loss attributable to non-controlling interests for the year ended
December 31, 2017
.
|
When Teekay’s non-wholly-owned subsidiaries declare dividends or distributions to their owners or require all of their owners to contribute capital to the non-wholly-owned subsidiaries, such amounts are paid to, or received from, each of the owners of the non-wholly-owned subsidiaries based on the relative ownership interests in the non-wholly-owned subsidiary. As such, any dividends or distributions paid to, or capital contributions received from, the non-controlling interests are reflected as a reduction (dividends or distributions) or an increase (capital contributions) in non-controlling interest in the Company’s consolidated balance sheets.
When Teekay’s non-wholly-owned subsidiaries issue additional equity interests to non-controlling interests, Teekay is effectively selling a portion of the non-wholly-owned subsidiaries. Consequently, the proceeds received by the subsidiaries from their issuance of additional equity interests are allocated between non-controlling interests and retained earnings in the Company’s consolidated balance sheets. The portion allocated to non-controlling interests on the Company’s consolidated balance sheets consists of the carrying value of the portion of the non-wholly-owned subsidiary that is effectively disposed of, with the remaining amount attributable to the controlling interests, which consists of the Company’s dilution gain or loss that is reflected in retained earnings.
Foreign currency
The consolidated financial statements are stated in U.S. Dollars and the functional currency of the Company is the U.S. Dollar. Transactions involving other currencies during the year are converted into U.S. Dollars using the exchange rates in effect at the time of the transactions. At the balance sheet date, monetary assets and liabilities that are denominated in currencies other than the U.S. Dollar are translated to reflect the year-end exchange rates. Resulting gains or losses are reflected in
foreign exchange gain (loss)
in the accompanying
consolidated statements of (loss) income
.
F -
9
TEEKAY CORPORATION AND SUBSIDIARIES
NOTES TO THE CONSOLIDATED FINANCIAL STATEMENTS
(all tabular amounts stated in thousands of U.S. dollars, other than share data and unless otherwise indicated)
Revenues
The Company’s accounting policies for revenue have been impacted by the adoption of Accounting Standards Update 2014-09. See accounting pronouncements below.
Each vessel charter may, depending on its terms, contain a lease component, a non-lease component or both. Revenues that are fixed on or prior to the commencement of the contract are recognized by the Company on a straight-line basis daily over the term of the contract, unless the charter contains a direct financing lease, in which case the carrying value of the vessel is derecognized and the net investment in the lease is recognized. The lease element of hire receipts is allocated to the lease receivable and voyage revenues over the term of the lease using the effective interest rate method. Where the term of the contract is based on the duration of a single voyage, the Company uses a discharge-to-discharge basis in determining the lease term for all tanker spot voyages that contain a lease and a load-to-discharge basis in determining the duration of the performance obligation for all tanker spot voyages that do not contain a lease. Consequently, the Company does not begin recognizing revenue until a voyage charter has been agreed to by the customer and the Company, even if the vessel has discharged its prior cargo and is sailing to the anticipated load location for its next voyage. For voyage charters within a revenue sharing arrangement, the difference between the net revenue earned by a vessel of the Company and its allocated share of the aggregate net contribution is reflected within voyage expenses. Reimbursements of vessel operating expenditures incurred to provide the contracted services to the charterer are recognized when the expenses entitling the Company to reimbursement are incurred. Reimbursements of drydocking expenditures are recognized as revenue on a straight-line basis over the drydocking cycle they relate to. Revenue or penalties from performance-based metrics, such as production tariffs and other operational performance measures are recognized as earned under the contract unless such performance-based revenue is based on a multi-period performance-based metric that is allocable to non-lease services provided. In such a case, the Company will estimate the amount of variable consideration, to the extent that it is probable that a significant reversal in the amount of cumulative revenue recognized will not occur when the uncertainty associated with the variable consideration is subsequently resolved and recognize such estimate of revenue over the performance period.
The consolidated balance sheets reflect in other current assets the accrued portion of revenues for those voyages that commence prior to balance sheet date and complete after the balance sheet date and reflect in deferred revenues or other long-term liabilities the deferred portion of revenues which will be earned in subsequent periods.
Revenues are also earned from the management of third-party vessels and LNG terminals. The Company recognizes fixed revenue on a straight-line basis over the duration of the management contract and variable revenue, such as monthly commissions, in the month they are earned. The Company presents the reimbursement of expenditures it incurs to provide the promised goods or services as revenue if it controls such goods or services before they are transferred to the customer and presents such reimbursement of expenditures as an offset against the expenditures if the Company does not control the goods or services them before they are transferred to the customer.
Operating expenses
Voyage expenses are all expenses unique to a particular voyage, including fuel expenses, port fees, cargo loading and unloading expenses, canal tolls, agency fees and commissions.
In addition, the difference between the net revenue earned by a vessel of the Company performing voyage charters within a RSA and its allocated share of the aggregate net contribution is reflected within voyage expenses. The Company, as shipowner, pays voyage expenses under voyage charters. The Company’s customers pay voyage expenses under time charters, except when the vessel is off-hire during the term of a time-charter in which case the Company pays voyage expenses.
Vessel operating expenses include crewing, ship management services, repairs and maintenance, insurance, stores, lube oils and communication expenses.
Voyage expenses and vessel operating expenses are expensed when incurred, except when the Company incurs pre-operational costs related to the repositioning of a vessel that relates directly to a specific customer contract, that generates or enhances resources of the Company that will be used in satisfying performance obligations in the future, whereby such costs are expected to be recovered via the customer contract. In this case, such costs are deferred and amortized over the duration of the customer contract.
The Company recognizes the expense from vessels accounted for as operating leases, which is included in time-charter hire expense, on a straight-line basis over the firm period of the charters.
Cash and cash equivalents
The Company classifies all highly liquid investments with an original maturity date of three months or less as cash and cash equivalents.
Restricted cash
The Company maintains restricted cash deposits relating to certain term loans, collateral for derivatives, project tenders, leasing arrangements, amounts received from charterers to be used only for dry-docking expenditures and emergency repairs and other obligations.
F -
10
TEEKAY CORPORATION AND SUBSIDIARIES
NOTES TO THE CONSOLIDATED FINANCIAL STATEMENTS
(all tabular amounts stated in thousands of U.S. dollars, other than share data and unless otherwise indicated)
Accounts receivable and allowance for doubtful accounts
Accounts receivable are recorded at the invoiced amount and do not bear interest. The allowance for doubtful accounts is the Company’s best estimate of the amount of probable credit losses in existing accounts receivable. The Company determines the allowance based on historical write-off experience and customer economic data. The Company reviews the allowance for doubtful accounts regularly and past due balances are reviewed for collectability. Account balances are charged off against the allowance when the Company believes that the receivable will not be recovered. There were no significant amounts recorded as allowance for doubtful accounts as at
December 31, 2018
and
2017
.
The consolidated balance sheets reflect, in accounts receivable, any amounts where the right to consideration is conditioned upon the passage of time, in other current assets any accrued revenue where the right to consideration is conditioned upon something other than the passage of time.
Vessels and equipment
All pre-delivery costs incurred during the construction of newbuildings, including interest, supervision and technical costs, are capitalized. The acquisition cost and all costs incurred to restore used vessels purchased by the Company to the standard required to properly service the Company’s customers are capitalized.
Interest costs capitalized to vessels and equipment for the years ended
December 31, 2018
,
2017
, and
2016
, aggregated
$14.8 million
,
$36.3 million
and
$36.9 million
, respectively.
Vessel capital modifications include the addition of new equipment or certain modifications to the vessel that are aimed at improving or increasing the operational efficiency and functionality of the asset. This type of expenditure is
capitalized and depreciated
over the estimated useful life of the modification. Expenditures covering recurring routine repairs and maintenance are expensed as incurred.
Depreciation is calculated on a straight-line basis over a vessel’s estimated useful life, less an estimated residual value. Depreciation is calculated using an estimated useful life of
25 years
for tankers carrying crude oil and refined product,
30 years
for liquefied petroleum gas (or
LPG
) carriers and
35 years
for LNG carriers, commencing the date the vessel is delivered from the shipyard, or a shorter period if regulations prevent the Company from operating the vessels for
25
years,
30
years, or
35
years, respectively
.
FPSO units are depreciated using an estimated useful life of
25 years
commencing the date the unit is installed at the oil field and is in a condition that is ready to operate.
Depreciation of vessels and equipment, excluding amortization of dry-docking expenditures, for the years ended December 31,
2018
,
2017
, and
2016
aggregated
$244.0 million
,
$397.6 million
and
$492.0 million
, respectively.
Depreciation includes depreciation on all owned vessels and amortization of vessels accounted for as capital leases.
Generally, the Company dry docks each conventional oil tanker and gas carrier every two and a half to
five years
. FPSO units are generally not dry docked and maintenance is performed on these units while at sea. The Company capitalizes
certain costs incurred
during dry docking and amortizes those costs on a straight-line basis from the completion of a dry docking to the estimated completion of the next dry docking. The Company includes in capitalized dry-docking costs those costs incurred as part of the dry docking to meet classification and regulatory requirements. The Company expenses costs related to routine repairs and maintenance performed during dry docking, and for annual class survey costs on the Company’s FPSO units.
The
following table summarizes the change in the Company’s
of capitalized dry docking costs from January 1, 2016 to
December 31, 2018
:
|
Year Ended December 31,
|
||||||||
|
2018
$ |
2017
$ |
2016
$ |
||||||
|
Balance at the beginning of the year
|
89,372
|
|
135,700
|
|
150,702
|
|
||
|
Costs incurred for dry dockings
|
43,155
|
|
52,677
|
|
47,980
|
|
||
|
Dry-dock amortization
|
(33,684
|
)
|
(49,686
|
)
|
(55,026
|
)
|
||
|
Write-down / sales of vessels
|
(2,459
|
)
|
(49,319
|
)
|
(7,956
|
)
|
||
|
Balance at the end of the year
|
96,384
|
|
89,372
|
|
135,700
|
|
||
Vessels and equipment that are intended to be held and used in the Company's business are assessed for impairment when events or circumstances indicate the carrying amount of the asset may not be recoverable. If the asset’s net carrying value exceeds the net undiscounted cash flows expected to be generated over its remaining useful life, the carrying amount of the asset is reduced to its estimated fair value. The estimated fair value for the Company’s impaired vessels is determined using discounted cash flows or appraised values. In cases where an active second-hand sale and purchase market does not exist, the Company uses a discounted cash flow approach to estimate the fair value of an impaired vessel. In cases where an active second-hand sale and purchase market exists, an appraised value is used to estimate the fair value of an impaired vessel. An appraised value is generally the amount the Company would expect to receive if it were to sell the vessel. Such appraisal is normally completed by the Company and is based on second-hand sale and purchase data.
Vessels and equipment that are “held for sale” are measured at the lower of their carrying amount or fair value less costs to sell and are not depreciated while classified as held for sale. Interest and other expenses and related liabilities attributable to vessels and equipment classified as held for sale continue to be recognized as incurred.
F -
11
TEEKAY CORPORATION AND SUBSIDIARIES
NOTES TO THE CONSOLIDATED FINANCIAL STATEMENTS
(all tabular amounts stated in thousands of U.S. dollars, other than share data and unless otherwise indicated)
Gains on vessels sold and leased back under capital leases are deferred and amortized over the remaining term of the capital lease. Losses on vessels sold and leased back under capital leases are recognized immediately when the fair value of the vessel at the time of a sale-leaseback transaction is less than its book value. In such case, the Company would recognize a loss in the amount by which book value exceeds fair value.
Other loan receivables
The Company’s advances to equity-accounted for investments and any other investments in loan receivables are recorded at cost. The Company analyzes its loans for collectability during each reporting period. A loan loss provision is recognized when, based on current information and events, it is probable that the Company will be unable to collect all amounts due according to the contractual terms of the loan agreement. Factors the Company considers in determining if a loan loss provision is required include, among other things, an assessment of the financial condition of the debtor, payment history of the debtor, general economic conditions, the credit rating of the debtor (when available) any information provided by the debtor regarding its ability to repay the loan and the fair value of the underlying collateral. When a loan loss provision is recognized, the Company measures the amount of the loss provision based on the present value of expected future cash flows discounted at the loan’s effective interest rate and recognizes the resulting loss in the
consolidated statements of (loss) income
. The carrying value of the loan will be adjusted each subsequent reporting period to reflect any changes in the present value of estimated future cash flows,
which may result in increases or decreases to the loan loss provision.
The following table contains the carrying value of the Company's financing receivables by type of borrower, the method by which the Company monitors the credit quality of its financing receivables on a quarterly basis, and the grade as of
December 31, 2018
.
|
December 31,
|
|||||||||
|
Class of Financing Receivable
|
Credit Quality Indicator
|
Grade
|
2018
$ |
2017
$ |
|||||
|
Direct financing leases
|
Payment activity
|
Performing
|
575,163
|
|
495,990
|
|
|||
|
Other loan receivables
|
|||||||||
|
Loans to equity-accounted investees and joint venture partners
|
Other internal metrics
|
Performing
|
231,404
|
|
253,906
|
|
|||
|
Long-term receivable and accrued revenue included in accounts receivable and other assets
|
Payment activity
|
Performing
|
15,694
|
|
12,175
|
|
|||
|
822,261
|
|
762,071
|
|
||||||
Equity-accounted for investments
The Company’s investments in certain joint ventures and other partially-owned entities in which the Company has the ability to exercise significant influence over the operating and financial policies of the entity are accounted for using the equity method of accounting. Under the equity method of accounting, investments are stated at initial cost and are adjusted for subsequent additional investments and the Company’s proportionate share of earnings or losses and distributions. The Company evaluates its equity-accounted for investments for impairment when events or circumstances indicate that the carrying value of such investments may have experienced an other-than-temporary decline in value below its carrying value.
If an equity-accounted for investment experiences an other-than-temporary decline in value and i
f the estimated fair value is less than the carrying value, the carrying value is written down to its estimated fair value and the resulting impairment is recorded in the Company's
consolidated statements of (loss) income
.
Debt issuance costs
Debt issuance costs related to a recognized debt liability, including fees, commissions and legal expenses, are deferred and presented as a direct reduction from the carrying amount of that debt liability and amortized on an effective interest rate method over the term of the relevant loan. Debt issuance costs
which are not attributable to a specific debt liability
or where the debt issuance costs exceed the carrying value of the related debt liability (primarily undrawn revolving credit facilities) are deferred and presented as non-current assets in the Company's consolidated balance sheets. Amortization of debt issuance costs is included in interest expense in the Company's
consolidated statements of (loss) income
.
Fees paid to substantially amend a non-revolving credit facility are associated with the extinguishment of the old debt instrument and included in determining the debt extinguishment gain or loss to be recognized. In addition, any unamortized debt issuance costs are written off. If the amendment is considered not to be a substantial amendment, then the fees would be associated with the replacement or modified debt instrument and, along with any existing unamortized premium, discount and unamortized debt issuance costs, would be amortized as an adjustment of interest expense over the remaining term of the replacement or modified debt instrument using the effective interest method. Other related costs incurred with third parties directly related to the modification, other than the loan amendment fee, are expensed as incurred.
Fees paid to amend a revolving credit facility are deferred and amortized over the term of the modified revolving credit facility. If the borrowing capacity of the revolving credit facility increases as a result of the amendment, unamortized debt issuance costs of the original revolving credit facility are amortized over the remaining term of the modified revolving credit facility. If the borrowing capacity
of the revolving credit facility
decreases as a result of the amendment, a proportionate amount, based on the reduction in borrowing capacity, of the unamortized debt issuance costs of the original revolving credit facility are written off and the remaining amount is amortized over the remaining term of the modified revolving credit facility.
F -
12
TEEKAY CORPORATION AND SUBSIDIARIES
NOTES TO THE CONSOLIDATED FINANCIAL STATEMENTS
(all tabular amounts stated in thousands of U.S. dollars, other than share data and unless otherwise indicated)
Derivative instruments
All derivative instruments are initially recorded at fair value as either assets or liabilities in the accompanying consolidated balance sheets and subsequently remeasured to fair value each period end, regardless of the purpose or intent for holding the derivative. The method of recognizing the resulting gain or loss is dependent on whether the derivative contract is designed to hedge a specific risk and whether the contract qualifies for hedge accounting. The Company does not apply hedge accounting to its derivative instruments, except for certain types of interest rate swaps (See
Note 15
).
When a derivative is designated as a cash flow hedge, the Company formally documents the relationship between the derivative and the hedged item. This documentation includes the strategy and risk management objective for undertaking the hedge and the method that will be used to assess the effectiveness of the hedge. Any hedge ineffectiveness is recognized immediately in earnings, as are any gains and losses on the derivative that are excluded from the assessment of hedge effectiveness. The Company does not apply hedge accounting if it is determined that the hedge was not effective or will no longer be effective, the derivative was sold or exercised, or the hedged item was sold, or repaid or no longer probable of occurring.
For derivative financial instruments designated and qualifying as cash flow hedges, changes in the fair value of the effective portion of the derivative financial instruments are initially recorded as a component of accumulated other comprehensive loss in total equity. In the periods when the hedged items affect earnings, the associated fair value changes on the hedging derivatives are transferred from total equity to the corresponding earnings line item (e.g. interest expense) in the Company's
consolidated statements of (loss) income
. The ineffective portion of the change in fair value of the derivative financial instruments is immediately recognized in the corresponding earnings line item in the Company's
consolidated statements of (loss) income
. If a cash flow hedge is terminated and the originally hedged item is still considered probable of occurring, the gains and losses initially recognized in total equity remain there until the hedged item impacts earnings, at which point they are transferred to the corresponding earnings line item in the Company's
consolidated statements of (loss) income
. If the hedged items are no longer probable of occurring, amounts recognized in total equity are immediately transferred to the corresponding earnings line item in the Company's
consolidated statements of (loss) income
.
For derivative financial instruments that are not designated or that do not qualify as hedges under Financial Accounting Standards Board (or
FASB
) Accounting Standards Codification (or
ASC
) 815,
Derivatives and Hedging
, the changes in the fair value of the derivative financial instruments are recognized in earnings. Gains and losses from the Company’s non-designated interest rate swaps related to long-term debt, non-designated interest rate swaptions, non-designated bunker fuel swap contracts and forward freight agreements, and non-designated foreign currency forward contracts are recorded in realized and unrealized loss on non-designated derivative instruments in the Company's
consolidated statements of (loss) income
. Gains and losses from the Company’s non-designated cross currency swaps are recorded in
foreign exchange gain (loss)
in the Company's
consolidated statements of (loss) income
.
Goodwill and intangible assets
Goodwill is not amortized but is reviewed for impairment at the reporting unit level on an annual basis or more frequently if an event occurs or circumstances change that would more likely than not reduce the fair value of a reporting unit below its carrying value. A reporting unit is a component of the Company that constitutes a business for which discrete financial information is available and regularly reviewed by management. When goodwill is reviewed for impairment, the Company will measure the amount by which a reporting unit's carrying value exceeds its fair value, with the maximum impairment not to exceed the carrying value of goodwill.
Alternatively, the Company may bypass this step and use a fair value approach to identify potential goodwill impairment and, when necessary, measure the amount of impairment. The Company uses a discounted cash flow model to determine the fair value of reporting units unless there is a readily determinable fair market value. The Company adopted ASU 2017-04,
Simplifying the Test for Goodwill Impairment,
effective October 1, 2018. Consequently, goodwill impairment is measured as the amount by which a reporting unit’s carrying value exceeds its fair value, not to exceed the carrying value of goodwill
.
Customer-related intangible assets are amortized over the expected life of a customer contract or the expected duration that the customer relationships are estimated to contribute to the cash flows of the Company. The amount amortized each year is weighted based on the projected revenue to be earned under the contracts or projected revenue to be earned as a result of the customer relationships. Intangible assets are assessed for impairment when and if impairment indicators exist. An impairment loss is recognized if the carrying amount of an intangible asset is not recoverable and its carrying amount exceeds its fair value.
Asset retirement obligation
The Company has an asset retirement obligation (or
ARO
) relating to the sub-sea production facility associated with the
Petrojarl Banff
FPSO unit operating in the North Sea. This obligation generally involves the costs associated with the restoration of the environment surrounding the facility and removal and disposal of all production equipment. This obligation is expected to be settled at the end of the contract under which the FPSO unit currently operates. The ARO will be covered in part by contractual payments to be received from FPSO contract counterparties.
F -
13
TEEKAY CORPORATION AND SUBSIDIARIES
NOTES TO THE CONSOLIDATED FINANCIAL STATEMENTS
(all tabular amounts stated in thousands of U.S. dollars, other than share data and unless otherwise indicated)
The Company records the fair value of an ARO as a liability in the period when the obligation arises. The fair value of the ARO is measured using expected future cash outflows discounted at the Company’s credit-adjusted risk-free interest rate. When the liability is recorded, the Company capitalizes the cost by increasing the carrying amount of the related equipment. Each period, the liability is increased for the change in its present value, and the capitalized cost is depreciated over the useful life of the related asset. Changes in the amount or timing of the estimated ARO are recorded as an adjustment to the related asset and liability. As at
December 31, 2018
, the ARO and associated receivable, which is recorded in other non-current assets, were
$27.8 million
and
$7.5 million
, respectively (
2017
–
$27.3 million
and
$7.4 million
, respectively).
Repurchase of common stock
The Company accounts for repurchases of common stock by decreasing common stock by the par value of the stock repurchased. In addition, the excess of the repurchase price over the par value is allocated between additional paid in capital and retained earnings. The amount allocated to additional paid in capital is the pro-rata share of the capital paid in and the balance is allocated to retained earnings.
Share-based compensation
The Company grants stock options, restricted stock units, performance share units and restricted stock awards as incentive-based compensation to certain employees and directors. The Company measures the cost of such awards using the grant date fair value of the award and recognizes that cost, net of estimated forfeitures, over the requisite service period, which generally equals the vesting period. For stock-based compensation awards subject to graded vesting, the Company calculates the value for the award as if it was one single award with one expected life and amortizes the calculated expense for the entire award on a straight-line basis over the vesting period of the award.
Compensation cost for awards with performance conditions is recognized when it is probable that the performance condition will be achieved. The compensation cost of the Company’s stock-based compensation awards is substantially reflected in general and administrative expense.
Income taxes
The Company accounts for income taxes using the liability method. Under the liability method, deferred tax assets and liabilities are recognized for the anticipated future tax effects of temporary differences between the consolidated financial statement basis and the tax basis of the Company’s assets and liabilities using the applicable jurisdictional tax rates. A valuation allowance for deferred tax assets is recorded when it is more likely than not that some or all of the benefit from the deferred tax asset will not be realized.
The Company recognizes the tax benefits of uncertain tax positions only if it is more-likely-than-not that a tax position taken or expected to be taken in a tax return will be sustained upon examination by the taxing authorities, including resolution of any related appeals or litigation processes, based on the technical merits of the position.
The tax benefits recognized in the Company’s consolidated financial statements from such positions are measured based on the largest benefit that has a greater than 50% likelihood of being realized upon ultimate settlement.
The Company recognizes interest and penalties related to uncertain tax positions in
income tax expense
in the Company's
consolidated statements of (loss) income
.
The Company believes that it and its subsidiaries are not subject to income taxation under the laws of the Republic of The Marshall Islands or Bermuda, or that distributions by its subsidiaries to the Company will be subject to any income taxes under the laws of such countries, and that it qualifies for the Section 883 exemption under U.S. federal income tax purposes.
Accumulated other comprehensive loss
The following table contains the changes in the balances of each component of accumulated other comprehensive income (loss) attributable to shareholders of Teekay for the periods presented.
|
Qualifying Cash Flow Hedging Instruments
$ |
Pension Adjustments
$ |
Unrealized (Loss) Gain on Available for Sale Marketable Securities
$ |
Foreign Exchange Gain (Loss) on Currency Translation
$ |
Total
$ |
||||||||||
|
Balance as of December 31, 2015
|
(419
|
)
|
(15,850
|
)
|
(463
|
)
|
1,841
|
|
(14,891
|
)
|
||||
|
Other comprehensive income and other
|
378
|
|
3,690
|
|
47
|
|
173
|
|
4,288
|
|
||||
|
Balance as of December 31, 2016
|
(41
|
)
|
(12,160
|
)
|
(416
|
)
|
2,014
|
|
(10,603
|
)
|
||||
|
Other comprehensive income and other
|
1,450
|
|
1,463
|
|
416
|
|
1,279
|
|
4,608
|
|
||||
|
Balance as of December 31, 2017
|
1,409
|
|
(10,697
|
)
|
—
|
|
3,293
|
|
(5,995
|
)
|
||||
|
Other comprehensive income and other
|
(506
|
)
|
7,521
|
|
—
|
|
(3,293
|
)
|
3,722
|
|
||||
|
Balance as of December 31, 2018
|
903
|
|
(3,176
|
)
|
—
|
|
—
|
|
(2,273
|
)
|
||||
F -
14
TEEKAY CORPORATION AND SUBSIDIARIES
NOTES TO THE CONSOLIDATED FINANCIAL STATEMENTS
(all tabular amounts stated in thousands of U.S. dollars, other than share data and unless otherwise indicated)
Employee pension plans
The Company has defined contribution pension plans covering the majority of its employees. Pension costs associated with the Company’s required contributions under its defined contribution pension plans are based on a percentage of employees’ salaries and are charged to earnings in the year incurred. With the exception of certain of the Company’s employees in Australia, the Company’s employees are generally eligible to participate in defined contribution plans. These plans allow for the employees to contribute a certain percentage of their base salaries into the plans. The Company matches all or a portion of the employees’ contributions, depending on how much each employee contributes. During the years ended
December 31, 2018
,
2017
, and
2016
, the amount of cost recognized for the Company’s defined contribution pension plans was
$7.9 million
,
$11.8 million
and
$13.5 million
, respectively.
The Company also has defined benefit pension plans (or the
Benefit Plans
) covering certain of its employees in Australia. The Company accrues the costs and related obligations associated with its defined benefit pension plans based on actuarial computations using the projected benefits obligation method and management’s best estimates of expected plan investment performance, salary escalation, and other relevant factors. For the purpose of calculating the expected return on plan assets, those assets are valued at fair value. The overfunded or underfunded status of the defined benefit pension plans is recognized as assets or liabilities in the consolidated balance sheets. The Company recognizes as a component of other comprehensive loss, the gains or losses that arise during a period but that are not recognized as part of net periodic benefit costs. The Company's funded status was a surplus of
$0.7 million
at December 31,
2018
and a deficiency of
$1.5 million
at December 31,
2017
.
Loss
per common share
The computation of basic
loss
per share is based on the weighted average number of common shares outstanding during the period. The computation of diluted earnings per share assumes the exercise of all dilutive stock options and restricted stock awards using the treasury stock method. The computation of diluted loss per share does not assume such exercises.
Accounting pronouncements
In May 2014, the Financial Accounting Standards Board (or
FASB
) issued Accounting Standards Update 2014-09,
Revenue from Contracts with Customers
(or
ASU 2014-09
). ASU 2014-09 required an entity to recognize revenue when it transfers promised goods or services to customers in an amount that reflects the consideration to which the entity expects to be entitled in exchange for those goods or services. This update creates a five-step model that requires entities to exercise judgment when considering the terms of the contract(s) which includes (i) identifying the contract(s) with the customer, (ii) identifying the separate performance obligations in the contract, (iii) determining the transaction price, (iv) allocating the transaction price to the separate performance obligations, and (v) recognizing revenue as each performance obligation is satisfied.
The Company
elected to apply ASU 2014-09 only to those contracts that were not completed as of January 1, 2018.
The Company adopted ASU 2014-09 as a cumulative-effect
adjustment as of January 1, 2018. The Company has identified the following differences on adoption of ASU 2014-09:
|
•
|
The
Company previously presented the net allocation for its vessels participating in RSAs as revenues. The Company has determined that it is the principal in voyages its vessels perform that are included in the RSAs. As such, the revenue from those voyages is presented in revenues and the difference between this amount and the Company's net allocation from the RSA is presented as voyage expenses. This had the effect of increasing both revenues and voyage expenses for the year ended
December 31, 2018
by
$292.6 million
. There was
no
cumulative impact to opening equity as at January 1, 2018.
|
|
•
|
The
Company manages vessels owned by its equity-accounted investments and third parties. Upon the adoption of ASU 2014-09, costs incurred by the Company for its seafarers are presented as vessel operating expenses and the reimbursement of such expenses are presented as revenue, instead of such amounts being presented on a net basis. This had the effect of increasing both revenues and vessel operating expenses for the year ended
December 31, 2018
by
$82.9 million
. There was
no
cumulative impact to opening equity as at January 1, 2018.
|
|
•
|
The
Company previously presented all accrued revenue as a component of accounts receivable. The Company has determined that if the right to such consideration is conditioned upon something other than the passage of time, such accrued revenue should be presented apart from accounts receivable. This had the
effect
of increasing prepaid expenses and other and decreasing accounts receivable by
$20.2 million
as at
December 31, 2018
. There was
no
cumulative impact to opening equity as at January 1, 2018.
|
|
•
|
In certain cases, the
Company incurs pre-operational costs relating directly to a specific customer contract, that generate or enhance resources of the Company that will be used in satisfying performance obligations in the future, whereby such costs are expected to be recovered via the customer contract. Such costs are now deferred and amortized over the duration of the customer contract. The Company previously expensed such costs as incurred unless the costs were directly reimbursable by the contract or if they were related to the mobilization of offshore assets to an oil field. This change had the effect of increasing o
ther non-current assets
by
$3.5 million
, investments in and loans to equity-accounted joint ventures by
$2.2 million
and equity by
$5.7 million
as at
December 31, 2018
. This change did not have a material effect on the
consolidated statements of (loss) income
for the year ended
December 31, 2018
. The cumulative increase to opening equity as at January 1, 2018 was
$4.1 million
.
|
F -
15
TEEKAY CORPORATION AND SUBSIDIARIES
NOTES TO THE CONSOLIDATED FINANCIAL STATEMENTS
(all tabular amounts stated in thousands of U.S. dollars, other than share data and unless otherwise indicated)
|
•
|
The
Company at times will enter into charter contracts that have annual performance measures that may result in the Company receiving additional consideration each year based on the annual performance measure result for such year. The Company previously recognized such consideration upon completion of the annual performance period. Upon adoption of ASU 2014-09, the portion of such consideration allocable to the non-lease element of charter contracts is included in the determination of the contract consideration and recognized over the annual performance period. There was
no
impact for the year ended
December 31, 2018
and
no
cumulative impact to opening equity as at January 1, 2018 as the end of the annual performance period is December 31st.
|
In February 2016, the FASB issued Accounting Standards Update 2016-02,
Leases
(or
ASU 2016-02
). ASU 2016-02 establishes a right-of-use model that requires a lessee to record a right-of-use asset and a lease liability on the balance sheet for all leases with terms longer than 12 months. For lessees, leases will be classified as either finance or operating, with classification affecting the pattern of expense recognition in the income statement.
ASU 2016-02 requires lessors to classify leases as a sales-type, direct financing, or operating lease. A lease is a sales-type lease if any one of
five
criteria are met, each of which indicate that the lease, in effect, transfers control of the underlying asset to the lessee. If none of those
five
criteria are met, but two additional criteria are both met, indicating that the lessor has transferred substantially all of the risks and benefits of the underlying asset to the lessee and a third party, the lease is a direct financing lease. All leases that are not sales-type leases or direct financing leases are operating leases. ASU 2016-02 became effective for the Company on January 1, 2019. FASB issued an additional accounting standards update in July 2018 that made further amendments to accounting for leases, including allowing the use of a transition approach whereby a cumulative effect adjustment is made as of the effective date, with no retrospective effect. The Company has elected to use this new optional transitional approach. To determine the cumulative effect adjustment, the Company will not reassess lease classification, initial direct costs for any existing leases and whether any expired or existing contracts are or contain leases. The Company identified the following differences:
|
•
|
The adoption of ASU 2016-02 will result in a change in the accounting method for the lease portion of the daily charter hire for the chartered-in vessels by the Company and the
Company's
equity-accounted joint ventures accounted for as operating leases with firm periods of greater than one year, as well as a small number of office leases. On January 1, 2019, a right-of-use asset of and a lease liability of
$170.0 million
was recognized. In addition, the existing carrying value on January 1, 2019 of the Company's chartered-in vessels has been reclassified from other non-current assets (
$13.7 million
) and from other long-term liabilities (
$0.9 million
) to the right-of-use asset. Under ASU 2016-02, the Company and the Company's equity-accounted joint ventures will recognize a right-of-use asset and a lease liability on the balance sheet for these charters and office leases based on the present value of future minimum lease payments, whereas currently no right-of-use asset or lease liability is recognized. This will have the result of increasing the Company's and its equity-accounted joint ventures' assets and liabilities. The pattern of expense recognition of chartered-in vessels and office leases is expected to remain substantially unchanged, unless the right-of-use asset becomes impaired.
|
|
•
|
The adoption of ASU 2016-02 will require the
Company
to complete its lease classification assessment when a lease commences instead of when the lease is entered into. The
Company
has entered into charters in prior periods for certain of its vessels currently under construction and which are expected to deliver over the period from 2019 to 2020.
Historically, for charters that were negotiated concurrently with the construction of the related vessels, the fair value of the constructed asset was presumed to be its newbuilding cost and no gain or loss was recognized on commencement of the charter if such charters were classified as direct finance leases. Subsequent to the adoption of
ASU 2016-02,
the fair value of the vessel will be determined based on information available at the lease commencement date and any
difference in the fair value of the ship upon commencement of the charter and its carrying value is recognized as a gain or loss in earnings upon commencement of the charter.
|
|
•
|
The adoption of ASU 2016-02 will result in the recognition of revenue from the reimbursement of scheduled dry-dock expenditures, where such charter contract is accounted for as an operating lease, occurring upon completion of the scheduled dry-dock, instead of ratably over the period between the previous scheduled dry-dock and the next scheduled dry-dock. The cumulative decrease to opening equity as at January 1, 2019 was
$3.0 million
.
|
|
•
|
In addition, direct financing lease payments received will be presented as an operating cash inflow instead of an investing cash inflow in the consolidated statement of cash flows.
|
In March 2016, the FASB issued Accounting Standards Update 2016-09,
Improvements to Employee Share-Based Payment Accounting
(or
ASU 2016-09
). ASU 2016-09 simplifies aspects of accounting for share-based payment transactions, including the income tax consequences, classification of awards as either equity or liabilities and classification on the statement of cash flows. ASU 2016-09 became effective for the Company January 1, 2017.
The impact of adopting this new accounting guidance resulted in a
change in presentation of cash payments for tax withholdings on share-settled equity awards from an operating cash outflow to financing cash outflow on the Company's statement of cash flows.
In June 2016, the FASB issued Accounting Standards Update 2016-13,
Financial Instruments - Credit Losses: Measurement of Credit Losses on Financial Instruments
(or
ASU 2016-13
). ASU 2016-13 replaces the incurred loss impairment methodology with a methodology that reflects expected credit losses and requires consideration of a broader range of reasonable and supportable information to inform credit loss estimates. This update is effective for the Company on January 1, 2020, with a modified-retrospective approach. The Company is currently evaluating the effect of adopting this new guidance.
F -
16
TEEKAY CORPORATION AND SUBSIDIARIES
NOTES TO THE CONSOLIDATED FINANCIAL STATEMENTS
(all tabular amounts stated in thousands of U.S. dollars, other than share data and unless otherwise indicated)
In August 2016, the FASB issued Accounting Standards Update 2016-15,
Statement of Cash Flows: Classification of Certain Cash Receipts and Cash Payments
(or
ASU 2016-15
), which, among other things, provides guidance on two acceptable approaches of classifying distributions received from equity method investees in the statements of cash flows and application of the predominance principle on the cash flow statement classification of cash receipts and payments that have aspects of more than one class of cash flows. ASU 2016-15 became effective for the
Company on January 1, 2018, w
ith a retrospective approach required on adoption
. The Company
has elected to classify distributions received from equity method investees in the consolidated statements of cash flows based on the nature of the distribution. In addition, the adoption of ASU 2016-15 resulted in
$25.7 million
and
$41.7 million
of cross currency swap payments that were related to the principal repayment of long-term debt for the years ended
December 31, 2017
and December 31, 2016, respectively, being reclassified from a net operating cash outflow to a prepayment or repayment of long-term debt in net financing cash flow as the amounts related to the termination or final settlement of the cross currency swaps.
In November 2016, the FASB issued Accounting Standards Update 2016-18,
Statement of Cash Flows: Restricted Cash
(or
ASU 2016-18
). ASU 2016-18 requires that the statement of cash flows explain the change during the period in the total of cash, cash equivalents, and amounts generally described as restricted cash or restricted cash equivalents. Entities are also required to reconcile such total to amounts on the balance sheet and disclose the nature of the restrictions. ASU 2016-18 became effective for the Company January 1, 2018. Adoption of ASU 2016-18 resulted in the Company including in its consolidated statement of cash flows changes in cash, cash equivalents and restricted cash.
In January 2017, the FASB issued Accounting Standards Update 2017-01,
Clarifying the Definition of a Business
, (or
ASU 2017-01
). ASU 2017-01 changes the definition of a business to assist entities with evaluating when a set of transferred assets and activities is a business. ASU 2017-01 requires an entity to evaluate if substantially all of the fair value of the gross assets acquired is concentrated in a single identifiable asset or a group of similar identifiable assets; if so, the set of transferred assets and activities is not a business. ASU 2017-01 also requires a business to include at least one substantive process and narrows the definition of outputs by more closely aligning it with how outputs are described in ASC 606. ASU 2017-01 is effective for annual reporting periods beginning after December 15, 2017, and for interim periods within those years.
The Company adopted this standard effective October 1, 2017, and this standard was applied to the acquisition of Tanker Investment Ltd. (or
TIL
) (See
Note 22
).
In August 2017, the FASB issued Accounting Standards Update 2017-12,
Derivatives and Hedging - Targeted Improvements to Accounting for Hedging Activities
(or
ASU 2017-12
). ASU 2017-12 eliminates the requirement to separately measure and report hedge ineffectiveness and generally requires, for qualifying hedges, the entire change in the fair value of a hedging instrument to be presented in the same income statement line as the hedged item. The guidance also modifies the accounting for components excluded from the assessment of hedge effectiveness, eases documentation and assessment requirements and modifies certain disclosure requirements. ASU 2017-12 will be effective for the Company January 1, 2019. The Company is currently evaluating the effect of adopting this new guidance.
In October 2017, the FASB issued Accounting Standards Update 2017-04,
Simplifying the Test for Goodwill Impairment
(or
ASU 2017-04
). Pursuant to this update, goodwill impairment is now measured as the amount by which a reporting unit’s carrying value exceeds its fair value, not to exceed the carrying value of goodwill. This update eliminates previous guidance that required an entity to determine goodwill impairment by calculating the implied fair value of goodwill by hypothetically assigning the fair value of a reporting unit to all of its assets and liabilities as if that reporting unit had been acquired in a business combination. ASU 2017-04 requires prospective adoption approach and is effective for annual and interim periods beginning after December 15, 2019, with early adoption permitted. ASU 2017-04 was adopted by the Company on October 1, 2018, and such adoption did not have a material impact on the Company's consolidated financial statements and related disclosures.
In August 2018, the FASB issued Accounting Standards Update 2018-15,
Intangibles-Goodwill and Other-Internal Use Software: Customer’s Accounting for Implementation Costs Incurred in a Cloud Computing Arrangement that is a Service Contract
, (or
ASU 2018-15
). ASU 2018-15 aligns the requirements for capitalizing implementation costs incurred in a hosting arrangement that is a service contract with the requirements for capitalizing implementation costs incurred to develop or obtain internal-use software. ASU 2018-15 is effective for annual and interim periods beginning after December 15, 2019, with early adoption permitted. The Company has elected to adopt ASU 2018-15 on October 1, 2018, and such adoption did not have a material impact on the Company’s consolidated financial statements and related disclosures.
2. Revenue
The Company’s primary source of revenue is chartering its vessels and offshore units to its customers. The Company utilizes four primary forms of contracts, consisting of time-charter contracts, voyage charter contracts, bareboat charter contracts and contracts for FPSO units. The Company also generates revenue from the management and operation of vessels owned by third parties and by equity-accounted investees as well as providing corporate management services to such entities.
F -
17
TEEKAY CORPORATION AND SUBSIDIARIES
NOTES TO THE CONSOLIDATED FINANCIAL STATEMENTS
(all tabular amounts stated in thousands of U.S. dollars, other than share data and unless otherwise indicated)
Time Charters
Pursuant to a time charter, the Company charters a vessel to a customer for a period of time, generally one year or more. The performance obligations within a time-charter contract, which will include the lease of the vessel to the charterer as well as the operation of the vessel, are satisfied as services are rendered over the duration of such contract, as measured using the time that has elapsed from commencement of performance. In addition, any expenses that are unique to a particular voyage, including any fuel expenses, port fees, cargo loading and unloading expenses, canal tolls, agency fees and commissions, are the responsibility of the customer, as long as the vessel is not off-hire. Hire is typically invoiced monthly in advance for time-charter contracts, based on a fixed daily hire amount. However, certain sources of variability exist. Those include penalties, such as those that relate to periods the vessels are off-hire and where minimum speed and performance metrics are not met. In addition, certain time-charters contracts contain provisions that allow the Company to be compensated for increases in the Company’s costs during the term of the charter. Such provisions may be in the form of annual hire rate adjustments for changes in inflation indices or interest rates or in the form of cost reimbursements for vessel operating expenditures or dry-docking expenditures. Finally, in a small number of charters, the Company may earn profit share consideration, which occurs when actual spot tanker rates earned by the vessel exceed certain thresholds for a period of time. Variable consideration of the Company’s contracts is typically recognized in the period in which the changes in facts and circumstances on which the variable lease payments are based occur as either such revenue is allocated and accounted for under lease accounting requirements or alternatively such consideration is allocated to distinct periods within a contract that such variable consideration was incurred in. The Company does not engage in any specific tactics to minimize vessel residual value risk.
Voyage Charters
Voyage charters are charters for a specific voyage that are usually priced on a current or "spot" market rate and then adjusted for any pool participation based on predetermined criteria. The performance obligations within a voyage charter contract, which will typically include the lease of the vessel to the charterer as well as the operation of the vessel, are satisfied as services are rendered over the duration of the voyage, as measured using the time that has elapsed from commencement of performance. In addition, any expenses that are unique to a particular voyage, including fuel expenses, port fees, cargo loading and unloading expenses, canal tolls, agency fees and commissions, are the responsibility of the vessel owner. The Company’s voyage charters will normally contain a lease; however, judgment is necessary to determine whether this is the case based upon the decision-making rights the charterer has under the contract. Consideration for such contracts is fixed or variable, depending on certain conditions. Delays caused by the charterer result in additional consideration. Payment for the voyage is not due until the voyage is completed. The duration of a single voyage will typically be less than three months. The Company does not engage in any specific tactics to minimize vessel residual value risk due to the short-term nature of the contracts.
Bareboat Charters
Pursuant to a bareboat charter, the Company charters a vessel to a customer for a fixed period of time, generally one year or more, at rates that are generally fixed. However, the customer is responsible for operation and maintenance of the vessel with its own crew as well as any expenses that are unique to a particular voyage, including any fuel expenses, port fees, cargo loading and unloading expenses, canal tolls, agency fees and commissions. If the vessel goes off-hire due to a mechanical issue or any other reason, the monthly hire received by the vessel owner is normally not impacted by such events. The performance obligations within a bareboat charter, which will include the lease of the vessel to the charterer, are satisfied over the duration of such contract, as measured using the time that has elapsed from commencement of the lease. Hire is typically invoiced monthly in advance for bareboat charters, based on a fixed daily hire amount.
FPSO Contracts
Pursuant to an FPSO contract, the Company charters an FPSO unit to a customer for a period of time, generally more than one year. The performance obligations within an FPSO contract, which include the lease of the FPSO unit to the charterer as well as the operation of the FPSO unit, are satisfied as services are rendered over the duration of such contract, as measured using the time that has elapsed from commencement of performance. Hire is typically invoiced monthly in arrears, based on a fixed daily hire amount. In certain FPSO contracts, the Company is entitled to a lump sum amount due upon commencement of the contract and may also be entitled to termination fees if the contract is canceled early. While the fixed daily hire amount may be the same over the term of the FPSO contract, the daily hire amount may increase or decrease over the duration of the FPSO contract. As a result of the Company accounting for compensation from such charters on a straight-line basis over the duration of the charter, FPSO contracts where revenue is recognized before the Company is entitled to such amounts under the FPSO contracts will result in the Company recognizing a contract asset and FPSO contracts where revenue is recognized after the Company is entitled to such amounts under the FPSO contracts will result in the Company recognizing deferred revenue.
Certain sources of consideration variability exist within FPSO contracts. Those include penalties, such as those that relate to periods where production on the FPSO unit is interrupted. In addition, certain FPSO contracts may contain provisions that allow the Company to be compensated for increases in the Company’s costs to operate the unit during the term of the contract. Such provisions may be in the form of annual hire rate adjustments for changes in inflation indices or in the form of cost reimbursements for vessel operating expenditures incurred. Finally, the Company may earn additional compensation from monthly production tariffs, which are based on the volume of oil produced, the price of oil, as well as other monthly or annual operational performance measures. Variable consideration of the Company's contracts is typically recognized as incurred as either such revenue is allocated and accounted for under lease accounting requirements or alternatively such consideration is allocated to distinct periods under a contract during which such variable consideration was incurred. The Company does not engage in any specific tactics to minimize residual value risk. Given the uncertainty involved in oil field production estimates and the result impact on oil field life, FPSO contracts typically will include extension options or options to terminate early.
F -
18
TEEKAY CORPORATION AND SUBSIDIARIES
NOTES TO THE CONSOLIDATED FINANCIAL STATEMENTS
(all tabular amounts stated in thousands of U.S. dollars, other than share data and unless otherwise indicated)
Management Fees and Other
The Company also generates revenue from the management and operation of vessels owned by third parties and by equity-accounted investees as well as providing corporate management services to such entities. Such services may include the arrangement of third-party goods and services for the vessel’s owner. The performance obligations within these contracts will typically consist of crewing, technical management, insurance and potentially commercial management. The performance obligations are satisfied concurrently and consecutively rendered over the duration of the management contract, as measured using the time that has elapsed from commencement of performance. Consideration for such contracts will generally consist of a fixed monthly management fee, plus the reimbursement of crewing costs for vessels being managed. Management fees are typically invoiced monthly.
Revenue Table
The following tables contain the Company’s revenue for the years ended
December 31, 2018
,
2017
and
2016
, by contract type, by segment and by business line within segments. The tables do not include revenues of Teekay Offshore for periods subsequent to the deconsolidation of Teekay Offshore in September 2017 as a result of the Brookfield Transaction (see
Note 4
).
|
|
Year Ended December 31, 2018
|
|||||||||||||
|
|
Teekay LNG Liquefied Gas Carriers
|
Teekay LNG Conventional Tankers
|
Teekay Tankers Conventional Tankers
|
Teekay Parent Offshore Production
|
Teekay Parent Other
|
Eliminations and Other
|
Total
|
|||||||
|
|
||||||||||||||
|
|
||||||||||||||
|
|
$
|
$
|
$
|
$
|
$
|
$
|
$
|
|||||||
|
Time charters
|
420,262
|
|
17,405
|
|
59,786
|
|
—
|
|
33,737
|
|
(9,418
|
)
|
521,772
|
|
|
Voyage charters
(1)
|
23,922
|
|
14,591
|
|
651,388
|
|
—
|
|
—
|
|
—
|
|
689,901
|
|
|
Bareboat charters
|
23,820
|
|
—
|
|
—
|
|
—
|
|
—
|
|
729
|
|
24,549
|
|
|
FPSO contracts
|
—
|
|
—
|
|
—
|
|
261,736
|
|
—
|
|
—
|
|
261,736
|
|
|
Management fees and other
(2)
|
10,435
|
|
327
|
|
44,589
|
|
—
|
|
156,186
|
|
(1,737
|
)
|
209,800
|
|
|
|
478,439
|
|
32,323
|
|
755,763
|
|
261,736
|
|
189,923
|
|
(10,426
|
)
|
1,707,758
|
|
|
|
Year Ended December 31, 2017
|
|||||||||||||||||
|
|
Teekay LNG Liquefied Gas Carriers
|
Teekay LNG Conven-tional Tankers
|
Teekay Tankers Conven-tional Tankers
|
Teekay Parent Offshore Production
|
Teekay Parent Conven-tional Tankers
|
Teekay Parent Other
|
Teekay Offshore
|
Eliminations and Other
|
Total
|
|||||||||
|
|
||||||||||||||||||
|
|
||||||||||||||||||
|
|
||||||||||||||||||
|
|
$
|
$
|
$
|
$
|
$
|
$
|
$
|
$
|
$
|
|||||||||
|
Time charters
|
332,751
|
|
39,171
|
|
112,100
|
|
—
|
|
—
|
|
41,734
|
|
231,950
|
|
(57,385
|
)
|
700,321
|
|
|
Voyage charters
|
2,285
|
|
6,709
|
|
125,774
|
|
—
|
|
—
|
|
—
|
|
34,576
|
|
—
|
|
169,344
|
|
|
Bareboat charters
|
40,058
|
|
—
|
|
—
|
|
—
|
|
—
|
|
—
|
|
68,453
|
|
(28,818
|
)
|
79,693
|
|
|
FPSO contracts
|
—
|
|
—
|
|
—
|
|
209,394
|
|
—
|
|
—
|
|
332,108
|
|
—
|
|
541,502
|
|
|
Net pool revenues
|
—
|
|
—
|
|
139,936
|
|
—
|
|
5,065
|
|
—
|
|
|
|
—
|
|
145,001
|
|
|
Contracts of affreightment
|
—
|
|
—
|
|
—
|
|
—
|
|
—
|
|
—
|
|
129,624
|
|
—
|
|
129,624
|
|
|
Management fees and other
|
10,589
|
|
1,113
|
|
53,368
|
|
—
|
|
—
|
|
47,373
|
|
—
|
|
2,404
|
|
114,847
|
|
|
|
385,683
|
|
46,993
|
|
431,178
|
|
209,394
|
|
5,065
|
|
89,107
|
|
796,711
|
|
(83,799
|
)
|
1,880,332
|
|
F -
19
TEEKAY CORPORATION AND SUBSIDIARIES
NOTES TO THE CONSOLIDATED FINANCIAL STATEMENTS
(all tabular amounts stated in thousands of U.S. dollars, other than share data and unless otherwise indicated)
|
Year Ended December 31, 2016
|
||||||||||||||||||
|
Teekay LNG Liquefied Gas Carriers
|
Teekay LNG Conven-tional Tankers
|
Teekay Tankers Conven-tional Tankers
|
Teekay Parent Offshore Production
|
Teekay Parent Conven-tional Tankers
|
Teekay Parent Other
|
Teekay Offshore
|
Eliminations and Other
|
Total
|
||||||||||
|
$
|
$
|
$
|
$
|
$
|
$
|
$
|
$
|
$
|
||||||||||
|
Time charters
|
283,159
|
|
58,802
|
|
97,374
|
|
—
|
|
—
|
|
28,951
|
|
336,521
|
|
(37,336
|
)
|
767,471
|
|
|
Voyage charters
|
—
|
|
—
|
|
90,032
|
|
—
|
|
—
|
|
—
|
|
64,445
|
|
—
|
|
154,477
|
|
|
Bareboat charters
|
45,763
|
|
—
|
|
—
|
|
—
|
|
—
|
|
—
|
|
107,834
|
|
(60,460
|
)
|
93,137
|
|
|
FPSO contracts
|
—
|
|
—
|
|
—
|
|
231,435
|
|
—
|
|
—
|
|
495,223
|
|
—
|
|
726,658
|
|
|
Net pool revenues
|
—
|
|
—
|
|
310,108
|
|
—
|
|
32,967
|
|
—
|
|
|
|
—
|
|
343,075
|
|
|
Contracts of affreightment
|
—
|
|
—
|
|
—
|
|
—
|
|
—
|
|
—
|
|
148,367
|
|
—
|
|
148,367
|
|
|
Management fees and other
|
7,608
|
|
1,112
|
|
53,029
|
|
—
|
|
—
|
|
47,160
|
|
—
|
|
(13,525
|
)
|
95,384
|
|
|
336,530
|
|
59,914
|
|
550,543
|
|
231,435
|
|
32,967
|
|
76,111
|
|
1,152,390
|
|
(111,321
|
)
|
2,328,569
|
|
|
|
(1)
|
The adoption of ASU 2014-09 had the impact of increasing both voyage charter revenues and voyage expenses for the year ended
December 31, 2018
by
$292.6 million
(see Note 1).
|
|
(2)
|
The Company manages vessels owned by its equity-accounted investments and third parties. Following the adoption of ASU 2014-09, costs incurred by the Company for its seafarers are presented as vessel operating expenses, and the reimbursement of such expenses is presented as revenue, instead of such amounts being presented on a net basis. This had the effect of increasing both revenues and vessel operating expenses for the year ended
December 31, 2018
by
$82.9 million
.
|
The following table contains the Company's revenue from contracts that do not contain a lease element and the non-lease element of time-charter contracts accounted for as direct financing leases for the years ended
December 31, 2018
,
2017
and
2016
.
|
|
Year Ended December 31,
|
|||||||
|
|
2018
|
|
2017
|
|
2016
|
|||
|
|
$
|
|
$
|
|
$
|
|||
|
Non-lease revenue - related to sales type or direct financing leases
|
18,554
|
|
|
25,590
|
|
|
20,058
|
|
|
Voyage charters - towage
|
—
|
|
|
25,813
|
|
|
37,952
|
|
|
Management fees and other
|
209,800
|
|
|
114,847
|
|
|
95,384
|
|
|
|
228,354
|
|
|
166,250
|
|
|
153,394
|
|
Operating Leases
As at
December 31, 2018
, the minimum scheduled future rentals to be received by the Company in each of the next five years for the lease and non-lease elements related to time-charters, bareboat charters and FPSO contracts that were accounted for as operating leases are approximately
$630.8 million
(
2019
),
$524.6 million
(
2020
),
$457.5 million
(
2021
),
$382.0 million
(
2022
),
$291.8 million
(
2023
) and
$570.8 million
thereafter. The minimum scheduled future revenues should not be construed to reflect total charter hire revenues for any of the years. Minimum scheduled future revenues do not include revenue generated from new contracts entered into after
December 31, 2018
, revenue from unexercised option periods of contracts that existed on
December 31, 2018
, revenue from vessels in the Company’s equity-accounted investments, or variable or contingent revenues accounted for under ASC 840
Leases
. In addition, minimum scheduled future operating lease revenues presented in this paragraph have been reduced by estimated off-hire time for any periodic maintenance. The amounts may vary given unscheduled future events such as vessel maintenance.
The net carrying amount of the vessels employed on time-charter contracts, bareboat charter contracts and FPSO contracts that have been accounted for as operating leases at
December 31, 2018
, was
$3.4 billion
(
2017
–
$3.1 billion
,
2016
–
$6.6 billion
). At
December 31, 2018
, the cost and accumulated depreciation of such vessels were
$4.3 billion
(
2017
–
$4.1 billion
,
2016
–
$9.1 billion
) and
$0.8 billion
(
2017
–
$1.0 billion
,
2016
–
$2.5 billion
), respectively.
F -
20
TEEKAY CORPORATION AND SUBSIDIARIES
NOTES TO THE CONSOLIDATED FINANCIAL STATEMENTS
(all tabular amounts stated in thousands of U.S. dollars, other than share data and unless otherwise indicated)
Direct Financing Leases
Teekay LNG owns a
69%
ownership interest in Teekay BLT Corporation (or the
Teekay Tangguh Joint Venture
), which is a party to operating leases whereby the Teekay Tangguh Joint Venture leases
two
LNG carriers (or the
Tangguh LNG Carriers
) to a third party, which in turn leases the vessels back to the joint venture. The time charters for the
two
Tangguh LNG carriers are accounted for as direct financing leases. The Tangguh LNG Carriers commenced their time-charters with their charterers in 2009. In addition, in 2013, Teekay LNG acquired
two
155,900
-cubic meter LNG carriers (or
Awilco LNG Carriers)
from Norway-based Awilco LNG ASA (or
Awilco
) and chartered them back to Awilco on
five
- and
four
-year fixed-rate bareboat charter contracts (plus a
one
-year extension option), respectively, with Awilco holding a fixed-price purchase obligation at the end of the charters. The bareboat charters with Awilco were accounted for as direct financing leases. However, in June 2017, Teekay LNG agreed to amend the charter contracts with Awilco to defer a portion of charter hire and extend the bareboat charter contracts and related purchase obligations on both vessels to December 2019. The amendments have the effect of deferring charter hire of between
$10,600
per day and
$20,600
per day per vessel from July 1, 2017 until December 2019, with such deferred amounts added to the purchase obligation amounts. As a result of the contract amendments, both of the charter contracts with Awilco were reclassified as operating leases upon the expiry of their respective original contract terms in November 2017 and August 2018. In addition, the
21
-year charter contract for the
Bahrain Spirit
floating storage unit (or
FSU
) commenced in September 2018 and is accounted for as a direct finance lease. The following table lists the components of the net investments in direct financing leases:
|
|
December 31, 2018
|
|
December 31, 2017
|
||
|
|
$
|
|
$
|
||
|
Total minimum lease payments to be received
|
897,130
|
|
568,710
|
|
|
|
Estimated unguaranteed residual value of leased properties
|
291,098
|
|
194,965
|
|
|
|
Initial direct costs and other
|
329
|
|
361
|
|
|
|
Less unearned revenue
|
(613,394
|
)
|
(268,046
|
)
|
|
|
Total
|
575,163
|
|
495,990
|
|
|
|
Less current portion
|
(12,635
|
)
|
(9,884
|
)
|
|
|
Long-term portion
|
562,528
|
|
486,106
|
|
|
As at
December 31, 2018
, estimated minimum lease payments to be received by Teekay LNG related to its direct financing leases in each of the next five succeeding fiscal years are approximately
$64.2 million
(
2019
),
$64.3 million
(
2020
),
$64.2 million
(
2021
),
$64.2 million
(
2022
),
$64.0 million
(
2023
) and an aggregate of
$576.2 million
thereafter. The leases are scheduled to end between 2029 and 2039.
Contract Costs
In certain cases, the Company incurs pre-operational costs that relate directly to a specific customer contract and that generate or enhance resources of the Company that will be used in satisfying performance obligations in the future, in which case such costs are expected to be recovered via the customer contract. Those costs include costs incurred to mobilize an offshore asset to an oilfield, pre-operational costs incurred to prepare for commencement of operations of an offshore asset or costs incurred to reposition a vessel to a location where a charterer will take delivery of the vessel. In certain cases, the Company must make judgments about whether costs relate directly to a specific customer contract or whether costs were factored into the pricing of a customer contract and thus expected to be recovered. Such deferred costs are amortized on a straight-line basis over the duration of the customer contract. Amortization of such costs for the year ended
December 31, 2018
was
$0.2 million
. As at
December 31, 2018
, repositioning costs of
$3.5 million
(
December 31, 2017
–
$
nil
) were included as part of other non-current assets in the Company's consolidated balance sheets.
Contract Liabilities
The Company enters into certain customer contracts that result in situations where the customer will pay consideration upfront for performance to be provided in the following month or months. These receipts are contract liabilities and are included in accrued liabilities and other on the consolidation balance sheets until performance is provided. As at
December 31, 2018
and on transition to ASC 606 on January 1, 2018, there were contract liabilities of
$26.4 million
and
$29.5 million
, respectively. During the year ended
December 31, 2018
, the Company recognized
$29.5 million
of revenue that was included in the contract liability balance on transition.
3. Segment Reporting
The Company allocates capital and assesses performance from the separate perspectives of its
two
publicly-traded subsidiaries Teekay LNG and Teekay Tankers (together, the
Controlled Daughter Entities
), Teekay and its remaining subsidiaries (or
Teekay Parent
), and its equity-accounted investee, Teekay Offshore,
(collectively with the Controlled Daughter Entities, the
Daughter Entities
)
, as well as from the perspective of the Company's lines of business. The primary focus of the Company’s organizational structure, internal reporting and allocation of resources by the chief operating decision maker is on the Controlled Daughter Entities, Teekay Parent and its equity-accounted investee, Teekay Offshore, (the
Legal Entity approach
) and its segments are presented accordingly on this basis. The Company (which excludes Teekay Offshore) has three primary lines of business: (1) offshore production (FPSO units), (2) LNG and LPG carriers, and (3) conventional tankers. The Company manages these businesses for the benefit of all stakeholders. The Company incorporates the primary lines of business within its segments, as in certain cases there is more than one line of business in each Controlled Daughter Entity and the Company believes this information allows a better understanding of the Company’s performance and prospects for future net cash flows.
F -
21
TEEKAY CORPORATION AND SUBSIDIARIES
NOTES TO THE CONSOLIDATED FINANCIAL STATEMENTS
(all tabular amounts stated in thousands of U.S. dollars, other than share data and unless otherwise indicated)
The following table includes the Company’s revenues and income (loss) from vessel operations by segment for the periods presented in these financial statements.
|
Revenues
(1)(2)
|
Income (loss) from Vessel Operations
(3)
|
||||||||||||||||
|
Year Ended
December 31, |
Year Ended
December 31,
|
||||||||||||||||
|
2018
|
2017
|
2016
|
2018
|
2017
|
2016
|
||||||||||||
|
Teekay LNG
|
|||||||||||||||||
|
Liquefied Gas Carriers
|
478,439
|
|
385,683
|
|
336,530
|
|
169,918
|
|
188,676
|
|
174,600
|
|
|||||
|
Conventional Tankers
|
32,323
|
|
46,993
|
|
59,914
|
|
(21,319
|
)
|
(40,027
|
)
|
(21,419
|
)
|
|||||
|
510,762
|
|
432,676
|
|
396,444
|
|
148,599
|
|
148,649
|
|
153,181
|
|
||||||
|
Teekay Tankers
|
|||||||||||||||||
|
Conventional Tankers
|
755,763
|
|
431,178
|
|
550,543
|
|
7,204
|
|
1,416
|
|
96,752
|
|
|||||
|
Teekay Parent
|
|||||||||||||||||
|
Offshore Production
|
261,736
|
|
|
209,394
|
|
231,435
|
|
22,958
|
|
(256,758
|
)
|
(48,310
|
)
|
||||
|
Conventional Tankers
|
—
|
|
|
5,065
|
|
32,967
|
|
—
|
|
(13,390
|
)
|
(15,967
|
)
|
||||
|
Other
|
189,923
|
|
|
89,107
|
|
76,111
|
|
(14,442
|
)
|
(20,277
|
)
|
(32,219
|
)
|
||||
|
451,659
|
|
|
303,566
|
|
340,513
|
|
8,516
|
|
(290,425
|
)
|
(96,496
|
)
|
|||||
|
Teekay Offshore
(4)
|
—
|
|
796,711
|
|
1,152,390
|
|
—
|
|
147,060
|
|
230,853
|
|
|||||
|
Eliminations and other
|
(10,426
|
)
|
(83,799
|
)
|
(111,321
|
)
|
—
|
|
—
|
|
—
|
|
|||||
|
1,707,758
|
|
1,880,332
|
|
2,328,569
|
|
164,319
|
|
6,700
|
|
384,290
|
|
||||||
|
(1)
|
The comparative periods do not include the impact of the January 1, 2018 adoption of ASU 2014-09 (see
Note 1
).
|
|
(2)
|
Certain vessels are chartered between the Daughter Entities and Teekay Parent. The amounts in the table below represent revenue earned by each segment from other segments within the group. Such intersegment revenue for the years ended
2018
,
2017
and
2016
are as follows:
|
|
Year Ended
December 31, |
||||||||
|
|
2018
|
2017
|
2016
|
|||||
|
Teekay LNG - Liquefied Gas Carriers
|
9,418
|
|
36,358
|
|
37,336
|
|
||
|
Teekay Tankers - Conventional Tankers
|
1,689
|
|
—
|
|
5,404
|
|
||
|
Teekay Offshore
|
—
|
|
34,232
|
|
49,514
|
|
||
|
11,107
|
|
70,590
|
|
92,254
|
|
|||
|
(3)
|
Includes direct general and administrative expenses and indirect general and administrative expenses (allocated to each segment based on estimated use of corporate resources).
|
|
(4)
|
On September 25, 2017, the Company deconsolidated Teekay Offshore (see
Note 4
). The figures above include those of Teekay Offshore until the date of deconsolidation.
|
The following table presents revenues and percentage of consolidated revenues for customers that accounted for more than
10%
of the Company’s consolidated revenues during the periods presented. All of these customers are international oil companies.
|
Year Ended
December 31, |
Year Ended
December 31, |
Year Ended
December 31, |
|||
|
(U.S. dollars in millions)
|
2018
|
2017
|
2016
|
||
|
Royal Dutch Shell Plc
(1) (2)
|
(5)
|
$259.4 or 14%
|
$429.9 or 19%
|
||
|
Petroleo Brasileiro SA
(1) (3)
|
(5)
|
(5)
|
$223.7 or 10%
|
||
|
BP Plc
(1) (4)
|
$195.0 or 11%
|
$183.0 or 10%
|
(5)
|
||
F -
22
TEEKAY CORPORATION AND SUBSIDIARIES
NOTES TO THE CONSOLIDATED FINANCIAL STATEMENTS
(all tabular amounts stated in thousands of U.S. dollars, other than share data and unless otherwise indicated)
|
(1)
|
On September 25, 2017, the Company deconsolidated Teekay Offshore (see
Note 4
). The figures above include those of Teekay Offshore until the date of deconsolidation.
|
|
(2)
|
Teekay Offshore Segment, Teekay LNG Segment — Liquefied Gas Carriers, Teekay Tankers Segment — Conventional Tankers, and Teekay Parent Segment — Conventional Tankers
|
|
(3)
|
Teekay Offshore Segment, and Teekay Tankers Segment — Conventional Tankers
|
|
(4)
|
Teekay Offshore Segment, Teekay LNG Segment — Liquefied Gas Carriers, Teekay Tankers Segment — Conventional Tankers, Teekay Parent Segment — Offshore Production, and Teekay Parent Segment — Conventional Tankers
|
|
(5)
|
Less than 10%.
|
The following table includes other income statement items by segment for the periods presented in these financial statements.
|
Depreciation and Amortization
|
Write-down and loss on sale of vessels
|
Equity Income (Loss)
|
||||||||||||||||||||||||
|
Year Ended
December 31, |
Year Ended
December 31, |
Year Ended
December 31, |
||||||||||||||||||||||||
|
2018
|
2017
|
2016
|
2018
|
2017
|
2016
|
2018
|
2017
|
2016
|
||||||||||||||||||
|
Teekay LNG
|
||||||||||||||||||||||||||
|
Liquefied Gas Carriers
|
(119,108
|
)
|
(95,025
|
)
|
(80,084
|
)
|
(33,000
|
)
|
—
|
|
—
|
|
53,546
|
|
9,789
|
|
62,307
|
|
||||||||
|
Conventional Tankers
|
(5,270
|
)
|
(10,520
|
)
|
(15,458
|
)
|
(20,863
|
)
|
(50,600
|
)
|
(38,976
|
)
|
—
|
|
—
|
|
—
|
|
||||||||
|
(124,378
|
)
|
(105,545
|
)
|
(95,542
|
)
|
(53,863
|
)
|
(50,600
|
)
|
(38,976
|
)
|
53,546
|
|
9,789
|
|
62,307
|
|
|||||||||
|
Teekay Tankers
|
||||||||||||||||||||||||||
|
Conventional Tankers
|
(118,514
|
)
|
(100,481
|
)
|
(104,149
|
)
|
170
|
|
(12,984
|
)
|
(20,594
|
)
|
1,220
|
|
(25,370
|
)
|
7,680
|
|
||||||||
|
Teekay Parent
|
||||||||||||||||||||||||||
|
Offshore Production
|
(33,271
|
)
|
(60,560
|
)
|
(70,855
|
)
|
—
|
|
(205,659
|
)
|
(110
|
)
|
15,089
|
|
(7,861
|
)
|
(575
|
)
|
||||||||
|
Conventional Tankers
|
—
|
|
—
|
|
(1,717
|
)
|
—
|
|
—
|
|
(12,487
|
)
|
(510
|
)
|
(20,677
|
)
|
132
|
|
||||||||
|
Other
|
(144
|
)
|
163
|
|
449
|
|
—
|
|
—
|
|
—
|
|
(1,384
|
)
|
(2,792
|
)
|
(1,838
|
)
|
||||||||
|
(33,415
|
)
|
(60,397
|
)
|
(72,123
|
)
|
—
|
|
(205,659
|
)
|
(12,597
|
)
|
13,195
|
|
(31,330
|
)
|
(2,281
|
)
|
|||||||||
|
Teekay Offshore
(1)
|
—
|
|
(219,406
|
)
|
(300,011
|
)
|
—
|
|
(1,500
|
)
|
(40,079
|
)
|
—
|
|
12,028
|
|
17,933
|
|
||||||||
|
Teekay Offshore
(2)
|
—
|
|
—
|
|
—
|
|
—
|
|
—
|
|
—
|
|
(6,907
|
)
|
(2,461
|
)
|
—
|
|
||||||||
|
Eliminations and other
|
—
|
|
—
|
|
—
|
|
—
|
|
—
|
|
—
|
|
—
|
|
—
|
|
—
|
|
||||||||
|
(276,307
|
)
|
(485,829
|
)
|
(571,825
|
)
|
(53,693
|
)
|
(270,743
|
)
|
(112,246
|
)
|
61,054
|
|
(37,344
|
)
|
85,639
|
|
|||||||||
|
(1)
|
On September 25, 2017, the Company deconsolidated Teekay Offshore (see
Note 4
). The figures above include those of Teekay Offshore until the date of deconsolidation.
|
|
(2)
|
Commencing on September 25, 2017, the Company accounts for its investment in Teekay Offshore using the equity method, and recognized an equity loss of
$6.9 million
for the year ended
December 31, 2018
and an equity loss of
$2.5 million
for the post-deconsolidation period ended December 31, 2017.
|
A reconciliation of total segment assets to total assets presented in the accompanying consolidated balance sheets is as follows:
|
December 31, 2018
$ |
December 31, 2017
$ |
||||
|
Teekay LNG
–
Liquefied Gas Carriers
|
5,162,756
|
|
4,624,321
|
|
|
|
Teekay LNG
– Conventional Tankers
|
36,701
|
|
112,844
|
|
|
|
Teekay Tankers
– Conventional Tankers
|
2,106,169
|
|
2,125,909
|
|
|
|
Teekay Parent
–
Offshore Production
|
311,550
|
|
366,229
|
|
|
|
Teekay Parent
–
Conventional Tankers
|
13,056
|
|
13,620
|
|
|
|
Teekay Parent
–
Other
|
25,224
|
|
26,527
|
|
|
|
Teekay Offshore
|
233,225
|
|
280,774
|
|
|
|
Cash and cash equivalents
|
424,169
|
|
445,452
|
|
|
|
Other assets not allocated
|
99,024
|
|
118,493
|
|
|
|
Eliminations
|
(20,204
|
)
|
(21,732
|
)
|
|
|
Consolidated total assets
|
8,391,670
|
|
8,092,437
|
|
|
The following table includes capital expenditures by segment for the periods presented in these financial statements.
F -
23
TEEKAY CORPORATION AND SUBSIDIARIES
NOTES TO THE CONSOLIDATED FINANCIAL STATEMENTS
(all tabular amounts stated in thousands of U.S. dollars, other than share data and unless otherwise indicated)
|
December 31, 2018
$ |
December 31, 2017
$ |
||||
|
Teekay LNG
–
Liquefied Gas Carriers
|
687,841
|
|
708,608
|
|
|
|
Teekay LNG
–
Conventional Tankers
|
124
|
|
—
|
|
|
|
Teekay Tankers
–
Conventional Tankers
|
5,827
|
|
4,732
|
|
|
|
Teekay Parent
–
Other
|
—
|
|
7
|
|
|
|
Teekay Offshore
|
—
|
|
340,705
|
|
|
|
693,792
|
|
1,054,052
|
|
||
4. Deconsolidation of Teekay Offshore
On September 25, 2017, Teekay, Teekay Offshore and Brookfield Business Partners L.P. together with its institutional partners (collectively,
Brookfield
) finalized a strategic partnership (or the
Brookfield Transaction
) which resulted in the deconsolidation of Teekay Offshore as of that date. Although Teekay owned less than
50%
of Teekay Offshore, Teekay maintained control of Teekay Offshore until September 25, 2017, by virtue of its
100%
ownership interest in the general partner of Teekay Offshore, which is a master limited partnership.
In connection with Brookfield's acquisition of a
49%
interest in Teekay Offshore's general partner, Teekay Offshore GP LLC (or
TOO GP
), Teekay and Brookfield entered into an amended limited liability company agreement whereby Brookfield obtained certain participatory rights in the management of TOO GP, which resulted in Teekay deconsolidating Teekay Offshore for accounting purposes on September 25, 2017. Subsequent to the closing of the Brookfield Transaction, Teekay has significant influence over Teekay Offshore and accounts for its investment in Teekay Offshore using the equity method.
Teekay Offshore is a related party of Teekay, and Brookfield is not a related party of Teekay (see
Note 13
).
In July 2018, Brookfield exercised its option to acquire an additional
2%
of ownership interests in Teekay Offshore's general partner from Teekay in exchange for
1.0 million
Brookfield Transaction Warrants (defined below). After exercising this option, Brookfield holds a
51%
interest in the general partner and Teekay owns a
49%
interest in the general partner of Teekay Offshore.
As of
December 31, 2018
, Teekay owned a
13.8%
interest in the common units of Teekay Offshore (
13.8%
–
December 31, 2017
).
The Brookfield Transaction that was finalized in September 2017, included, among other things, the following:
|
•
|
Brookfield and Teekay invested
$610.0 million
and
$30.0 million
, respectively, in exchange for
244.0 million
and
12.0 million
common units of Teekay Offshore, respectively, and
62.4 million
and
3.1 million
common unit warrants (or the
Brookfield Transaction Warrants
), with an exercise price of
$0.01
per unit, a term of
seven
years, and which are exercisable when Teekay Offshore's common unit volume-weighted average price is equal to or greater than
$4.00
per common unit for
10
consecutive trading days until September 25, 2024;
|
|
•
|
Brookfield acquired from Teekay a
49%
interest in Teekay Offshore's general partner in exchange for
$4.0 million
and an option to purchase an additional
2.0%
interest in Teekay Offshore's general partner from Teekay in exchange for
1.0 million
of the Brookfield Transaction Warrants initially issued to Brookfield. Brookfield exercised this option in July 2018 increasing their ownership interest in Teekay Offshore's general partner to
51%
;
|
|
•
|
Teekay Offshore repurchased and cancelled all of its outstanding Series C-1 and Series D Preferred Units at a per unit redemption value of
$18.20
and
$23.75
per unit, plus accrued and unpaid distributions, respectively, which included Teekay's investment in
1,040,000
Series D Preferred Units. The Series D tranche B Warrants to purchase Teekay Offshore common units, which were issued as part of the Series D Preferred Units on June 29, 2016, were amended to reduce the exercise price from
$6.05
to
$4.55
per unit; and
|
|
•
|
Brookfield acquired from a subsidiary of Teekay the
$200 million
subordinated promissory note issued by Teekay Offshore to Teekay on July 1, 2016, the maturity of which Brookfield extended from 2019 to 2022, in consideration for
$140.0 million
in cash on a net basis and
11.4 million
of the Brookfield Transaction Warrants initially issued to Brookfield.
|
The following table shows the accounting impact from the deconsolidation of Teekay Offshore on September 25, 2017. On such date, the Company recognized both the net cash proceeds it received from Brookfield and the fair value of its retained interests in Teekay Offshore, including common units, warrants, and vessel charters with Teekay Offshore, and derecognized the carrying value of both Teekay Offshore’s net assets and the non-controlling interest in Teekay Offshore, with the difference between the amounts recognized and derecognized being the loss on deconsolidation.
F -
24
TEEKAY CORPORATION AND SUBSIDIARIES
NOTES TO THE CONSOLIDATED FINANCIAL STATEMENTS
(all tabular amounts stated in thousands of U.S. dollars, other than share data and unless otherwise indicated)
|
As of September 25, 2017
|
||
|
Net cash proceeds received by Teekay
|
139,693
|
|
|
Fair value of common units and general partner interest of Teekay Offshore (
note 22
)
|
150,132
|
|
|
Fair value of warrants (
note 15
)
|
36,596
|
|
|
Fair value of vessel charters with Teekay Offshore (
notes 6 and 7
)
|
14,812
|
|
|
Carrying value of the non-controlling interest in Teekay Offshore
|
1,138,275
|
|
|
Subtotal
|
1,479,508
|
|
|
Less:
|
||
|
Carrying value of Teekay Offshore's net assets on deconsolidation
|
(1,584,296
|
)
|
|
Loss on deconsolidation of Teekay Offshore
|
(104,788
|
)
|
The
$150.1 million
fair value of Teekay's retained investment in Teekay Offshore, which consisted of approximately
14%
in its outstanding common units and a
51%
interest in TOO GP, was determined with reference to the market price of Teekay Offshore's common units on September 25, 2017. The
$14.8 million
fair value of vessel charters was determined using an income approach and with reference to market rates, contract term, and a discount rate of
10%
.
Subsequent to the formation of Teekay Offshore, Teekay sold certain vessels to Teekay Offshore. As Teekay Offshore was a non-wholly-owned consolidated subsidiary of Teekay at the date of the sales, all of the gain or loss on sales of these vessels was fully eliminated upon consolidation. Consequently, the portion of the gain or loss attributable to Teekay’s reduced interest in the vessels was deferred. The total unrecognized net deferred gain relating to the vessels previously sold from Teekay to Teekay Offshore was
$349.6 million
. Upon deconsolidation of Teekay Offshore, such amount was recognized as an increase to net loss attributable to non-controlling interests for the year ended December 31, 2017.
Until
December 31, 2017, Teekay and its wholly-owned subsidiaries directly and indirectly provided substantially all of Teekay Offshore’s ship management, commercial, technical, strategic, business development and administrative service needs. On January 1, 2018, as part of the Brookfield Transaction, Teekay Offshore acquired a
100%
ownership interest in seven subsidiaries (or the
Transferred Subsidiaries
) of Teekay at carrying value. The Company recognized a loss of
$7.1 million
for the year ended
December 31, 2018
related to the sale of the Transferred Subsidiaries and the resultant release of accumulated pension losses from accumulated other comprehensive income, which is recorded in loss on deconsolidation of Teekay Offshore on the Company's
consolidated statements of (loss) income
.
5. Equity Financing Transactions of the Daughter Entities
During the years ended December 31,
2017
and
2016
, the Company’s publicly-traded subsidiaries, Teekay Tankers and Teekay LNG, and prior to the Brookfield Transaction on September 25, 2017, Teekay Offshore, completed the following public offerings and private placements of equity securities. During the year ended
December 31, 2018
, there were no equity financing transactions of the Controlled Daughter Entities.
|
Number of shares / units #
|
Total Proceeds Received
$ |
Less:
Teekay Corporation Portion $ |
Offering Expenses
$ |
Net Proceeds Received
$ |
||||||||||
|
2017
|
||||||||||||||
|
Teekay Tankers Continuous Offering Program
|
3,800,000
|
|
8,826
|
|
—
|
|
(305
|
)
|
8,521
|
|
||||
|
Teekay Tankers Private Placement
|
2,155,172
|
|
5,000
|
|
(5,000
|
)
|
—
|
|
—
|
|
||||
|
Teekay Tankers Direct Equity Placement
(1)
|
13,775,224
|
|
25,897
|
|
(25,897
|
)
|
—
|
|
—
|
|
||||
|
Teekay Offshore Private Placements
(2)
|
6,521,518
|
|
29,817
|
|
(17,160
|
)
|
(212
|
)
|
12,445
|
|
||||
|
Teekay Tankers Direct Equity Placement
(3)
|
88,977,544
|
|
151,262
|
|
(14,025
|
)
|
—
|
|
137,237
|
|
||||
|
Teekay LNG Preferred B Units Offering
|
6,800,000
|
|
170,000
|
|
—
|
|
(5,589
|
)
|
164,411
|
|
||||
|
2016
|
||||||||||||||
|
Teekay Offshore Preferred D Units Offering
|
(4)
|
100,000
|
|
(26,000
|
)
|
(2,750
|
)
|
71,250
|
|
|||||
|
Teekay Offshore Common Units Offering
|
21,978,022
|
|
102,041
|
|
(2,041
|
)
|
(2,550
|
)
|
97,450
|
|
||||
|
Teekay Offshore Continuous Offering Program
|
5,525,310
|
|
31,819
|
|
(636
|
)
|
(792
|
)
|
30,391
|
|
||||
|
Teekay Offshore Private Placement
|
(5)
|
24,874
|
|
(13,167
|
)
|
—
|
|
11,707
|
|
|||||
|
Teekay LNG Preferred A Units Offering
|
5,000,000
|
|
125,000
|
|
—
|
|
(4,293
|
)
|
120,707
|
|
||||
|
Teekay Tankers Continuous Offering Program
|
3,020,000
|
|
7,747
|
|
—
|
|
(189
|
)
|
7,558
|
|
||||
|
(1)
|
In May 2017, Teekay Tankers issued Class B common stock to the Company as consideration for its acquisition of the remaining
50%
interest in TTOL.
|
F -
25
TEEKAY CORPORATION AND SUBSIDIARIES
NOTES TO THE CONSOLIDATED FINANCIAL STATEMENTS
(all tabular amounts stated in thousands of U.S. dollars, other than share data and unless otherwise indicated)
|
(2)
|
During 2017, Teekay Offshore issued common units (including the general partner's
2%
proportionate capital contribution) as a payment-in-kind for the distributions on Teekay Offshore's
8.60%
Series C-1 Cumulative Convertible Perpetual Preferred Units (or the
Series C-1 Preferred Units
) and
10.50%
Series D Cumulative Convertible Perpetual Preferred Units (or the
Series D Preferred Units
) and on Teekay Offshore's common units and general partner interest held by subsidiaries of Teekay.
|
In June 2016, Teekay Offshore agreed with Teekay that, until the Teekay Offshore's NOK bonds maturing in 2018 had been repaid, all cash distributions (other than with respect to distributions, if any, on incentive distribution rights) to be paid by Teekay Offshore to Teekay or its affiliates, including Teekay Offshore's general partner, would instead be paid in common units or from the proceeds of the sale of common units. During 2017, Teekay Offshore issued Teekay
2.4 million
common units (including the general partner's
2%
proportionate capital contribution) as a payment-in-kind for the distributions on Teekay Offshore's Series D Preferred Units, common units and general partner interest held by subsidiaries of Teekay. During 2017, Teekay Offshore issued common units (including the general partner's
2%
proportionate capital contribution) as a payment-in-kind for the interest due on Teekay Offshore's
$200 million
loan due to Teekay. Teekay Offshore issued Teekay
1.7 million
common units (including the general partner's
2%
proportionate capital contribution) as a payment-in-kind for the loan interest.
|
(3)
|
In November 2017, Teekay Tankers issued Class A common shares to the shareholders of TIL as consideration for the Teekay Tankers' acquisition of the remaining
88.7%
interest (including Teekay Parent's
8.2%
interest) in TIL. The shares had an approximate value of
$151.3 million
, or
$1.70
per share, when the purchase price was agreed between the parties.
|
|
(4)
|
In June 2016, Teekay Offshore issued
4,000,000
of its Series D Preferred Units and
4,500,000
warrants exercisable to acquire up to
4,500,000
common units at an exercise price equal to the closing price of Teekay Offshore's common units on June 16, 2016, or
$4.55
per unit (or the
$4.55
Warrants
) and
2,250,000
warrants exercisable to acquire up to
2,250,000
common units with an exercise price at a
33%
premium to the closing price of Teekay Offshore's common units on June 16, 2016, or
$6.05
per unit (or the
$6.05
Warrants
) (together, the
Warrants
). The Warrants have a
seven
-year term and became exercisable any time
six
months following their issuance date. The Warrants are to be net settled in either cash or common units at Teekay Offshore's option. The gross proceeds from the sale of these securities were
$100.0 million
(
$97.2 million
net of offering costs). Also in June 2016, Teekay Offshore exchanged approximately
1.9 million
of the Series C Preferred Units for approximately
8.3 million
common units of Teekay Offshore and also exchanged the remaining approximately
8.5 million
Series C Preferred Units for approximately
8.5 million
Series C-1 Preferred Units. In connection with the repurchase of the Series C-1 and Series D Preferred Units on September 25, 2017, the exercise price of the
$6.05
Warrants was reduced to
$4.55
per unit.
|
Teekay purchased for
$26.0 million
a total of
1,040,000
of Teekay Offshore's Series D Preferred Units. Teekay also received
1,170,000
of the
$4.55
Warrants and
585,000
of the
$6.05
Warrants. The purchase of Teekay Offshore Series D Preferred Units has been accounted for as an equity transaction. Therefore, no gains or losses were recognized in the Company’s
consolidated statements of (loss) income
as a result of this purchase.
Net cash proceeds from the sale of these securities of
$71.3 million
, which excludes Teekay's investment, was allocated on a relative fair value basis to the Series D Preferred Units (
$61.1 million
), to the
$4.55
Warrants (
$7.0 million
) and to the
$6.05
Warrants (
$3.1 million
). The Warrants qualify as freestanding financial instruments and are accounted for separately from the Series D Preferred Units. The Series D Preferred Units were presented in the Company's consolidated balance sheets as redeemable non-controlling interest in temporary equity which is above the equity section but below the liabilities section as they were not mandatorily redeemable, and the prospect of a forced redemption paid with cash due to a change of control event was not probable. The Warrants were recorded as non-controlling interests in the Company's consolidated balance sheets. The Series D Preferred Units were redeemed in September 2017 upon the deconsolidation of Teekay Offshore (see
Note 4
).
|
(5)
|
In 2016, Teekay Offshore issued
4.7 million
common units for a total value of
$24.9 million
(including the general partner's
2%
proportionate capital contribution of
$0.5 million
) as a payment-in-kind for the distributions on Teekay Offshore's Series C-1 Preferred Units and Series D Preferred Units and Teekay Offshore's common units and general partner interest held by subsidiaries of Teekay. In June 2016, Teekay Offshore agreed with Teekay that, until the Teekay Offshore's Norwegian Kroner bonds maturing in 2018 have been repaid, all cash distributions (other than with respect to incentive distribution rights) to be paid by Teekay Offshore to Teekay or its affiliates, including Teekay Offshore's general partner, would instead be paid in Teekay Offshore common units or from the proceeds of the sale of common units. During 2016, Teekay Offshore issued Teekay
2.5
million common units (including the general partner's
2%
proportionate capital contribution) as a payment-in-kind for the distribution on Teekay Offshore's Series D Preferred Units, common units and general partner interest held by Teekay and its subsidiaries. The Series C-1 Preferred Units and Series D Preferred Units were redeemed in September 2017 upon the deconsolidation of Teekay Offshore (see
Note 4
).
|
As a result of the public offerings and equity placements of Teekay Tankers and Teekay LNG, and Teekay Offshore prior to the Brookfield Transaction on September 25, 2017, the Company recorded increases to retained earnings
$23.5 million
(
2017
) and
$9.7 million
(
2016
). These amounts represent Teekay’s dilution gains from the issuance of units and shares by these consolidated subsidiaries.
6. Goodwill and Intangible Assets
Goodwill
The carrying amount of goodwill for the years ended
December 31, 2018
and
2017
, for the Company’s reportable segments are as follows:
|
Teekay LNG – Liquefied Gas Segment
$ |
Conventional Tanker Segment
$ |
Total
$ |
|||||||
|
Balance as of December 31, 2017
|
35,631
|
|
8,059
|
|
43,690
|
|
|||
|
Balance as of December 31, 2018
|
35,631
|
|
8,059
|
|
43,690
|
|
|||
F -
26
TEEKAY CORPORATION AND SUBSIDIARIES
NOTES TO THE CONSOLIDATED FINANCIAL STATEMENTS
(all tabular amounts stated in thousands of U.S. dollars, other than share data and unless otherwise indicated)
Intangible Assets
As at
December 31, 2018
, the Company’s intangible assets consisted of:
|
Gross Carrying Amount
$ |
Accumulated Amortization
$ |
Net Carrying Amount
$ |
||||||
|
Customer contracts
|
193,194
|
|
(140,756
|
)
|
52,438
|
|
||
|
Customer relationships
|
22,500
|
|
(10,875
|
)
|
11,625
|
|
||
|
Off-market in-charter contracts
(1)
|
17,900
|
|
(4,190
|
)
|
13,710
|
|
||
|
233,594
|
|
(155,821
|
)
|
77,773
|
|
|||
(1) Represents the off-market in-charter contracts between the Company and Teekay Offshore for
two
FSO units.
As at
December 31, 2017
, the Company’s intangible assets consisted of:
|
Gross Carrying Amount
$ |
Accumulated Amortization
$ |
Net Carrying Amount
$ |
||||||
|
Customer contracts
|
193,194
|
|
(131,647
|
)
|
61,547
|
|
||
|
Customer relationships
|
22,500
|
|
(8,005
|
)
|
14,495
|
|
||
|
Off-market in-charter contracts
(1)
|
17,900
|
|
(928
|
)
|
16,972
|
|
||
|
233,594
|
|
(140,580
|
)
|
93,014
|
|
|||
(1) Represents the off-market in-charter contracts between the Company and Teekay Offshore for
two
FSO units.
In July 2015, as part of Teekay Tankers’ acquisition of
a ship-to-ship transfer business (previously referred to as SPT and now known as Teekay Marine Solutions or
TMS
) from a company jointly owned by Teekay Corporation and a Norway-based marine transportation company, I.M. Skaugen SE
, Teekay Tankers ascribed a value of
$30.9 million
to the customer relationships assumed. The Company is amortizing those customer relationships over a period of
10 years
. The
estimates of fair value were finalized in the first quarter of 2016 and resulted in a decrease in intangible assets of
$8.4 million
from preliminary estimates.
Amortization expense relating to this acquisition for the years ended
December 31, 2018
and
2017
were
$2.9 million
and
$3.2 million
, respectively, which is included in depreciation and amortization expenses.
Aggregate amortization expense of intangible assets for the year ended
December 31, 2018
, was
$15.2 million
(
2017
–
$14.0 million
,
2016
–
$14.9 million
), including
$12.0 million
presented in depreciation and amortization (
2017
–
$13.1 million
,
2016
–
$14.9 million
) and
$3.2 million
presented in time-charter hire expenses (
2017
–
$0.9 million
,
2016
–
$
nil
). Amortization of intangible assets following
2018
is expected to be
$13.9 million
(
2019
),
$13.3 million
(
2020
),
$13.1 million
(
2021
),
$12.9 million
(
2022
),
$12.7 million
(
2023
) and
$11.9 million
(thereafter).
7. Accrued Liabilities and Other and Other Long-Term Liabilities
Accrued Liabilities and Other
|
December 31, 2018
$ |
December 31, 2017
$ |
||||
|
Voyage and vessel expenses
|
98,135
|
|
69,544
|
|
|
|
Interest
|
47,731
|
|
42,028
|
|
|
|
Payroll and benefits and other
|
41,275
|
|
137,659
|
|
|
|
Deferred revenues and gains - current
|
30,108
|
|
33,121
|
|
|
|
In-process revenue contracts - current
|
5,930
|
|
13,880
|
|
|
|
223,179
|
|
296,232
|
|
||
F -
27
TEEKAY CORPORATION AND SUBSIDIARIES
NOTES TO THE CONSOLIDATED FINANCIAL STATEMENTS
(all tabular amounts stated in thousands of U.S. dollars, other than share data and unless otherwise indicated)
Other Long-Term Liabilities
|
December 31, 2018
$ |
December 31, 2017
$ |
||||
|
Deferred revenues and gains
|
31,324
|
|
33,363
|
|
|
|
Guarantee liabilities
|
9,434
|
|
10,633
|
|
|
|
Asset retirement obligation
|
27,759
|
|
27,302
|
|
|
|
Pension liabilities
|
4,847
|
|
6,529
|
|
|
|
In-process revenue contracts
|
17,800
|
|
24,313
|
|
|
|
Unrecognized tax benefits
|
40,556
|
|
31,061
|
|
|
|
Other
|
1,325
|
|
3,168
|
|
|
|
133,045
|
|
136,369
|
|
||
In-Process Revenue Contracts
As part of the Company’s previous acquisition of FPSO units from Petrojarl ASA (subsequently renamed Teekay Petrojarl AS, or
Teekay Petrojarl
), and Teekay LNG’s acquisition of Shell's ownership interests in
four
LNG carrier newbuildings, the Company assumed certain FPSO contracts and time-charter-out contracts with terms that were less favorable than the then prevailing market terms, and a service obligation for shipbuilding supervision and crew training services for the
four
LNG carrier newbuildings. At the time of the acquisitions, the Company recognized liabilities based on the estimated fair value of these contracts and service obligations. The Company is amortizing the remaining liabilities over the estimated remaining terms of their associated contracts on a weighted basis, based on the projected revenue to be earned under the contracts. As at December 31, 2018, the liabilities associated with the
four
LNG carrier newbuildings have been fully amortized.
Amortization of in-process revenue contracts for the year ended
December 31, 2018
was
$14.5 million
(
2017
–
$27.2 million
,
2016
–
$28.1 million
), which is included in revenues on the
consolidated statements of (loss) income
. Amortization of in-process revenue contracts following
2018
is expected to be
$5.9 million
(
2019
),
$5.9 million
(
2020
),
$5.9 million
(
2021
) and
$5.9 million
(
2022
).
|
December 31, 2018
$ |
December 31, 2017
$ |
||||
|
Revolving Credit Facilities
|
642,997
|
|
877,343
|
|
|
|
Senior Notes (8.5%) due January 15, 2020
|
508,577
|
|
592,657
|
|
|
|
Convertible Senior Notes (5%) due January 15, 2023
|
125,000
|
|
|
—
|
|
|
Norwegian Kroner-denominated Bonds due through August 2023
|
352,973
|
|
377,856
|
|
|
|
U.S. Dollar-denominated Term Loans due through 2030
|
1,536,499
|
|
1,358,798
|
|
|
|
Euro-denominated Term Loans due through 2024
|
193,781
|
|
232,957
|
|
|
|
Other U.S. Dollar-denominated loan
|
3,300
|
|
10,000
|
|
|
|
Total principal
|
3,363,127
|
|
3,449,611
|
|
|
|
Less unamortized discount and debt issuance costs
|
(43,604
|
)
|
(31,906
|
)
|
|
|
Total debt
|
3,319,523
|
|
3,417,705
|
|
|
|
Less current portion
|
(242,137
|
)
|
(800,897
|
)
|
|
|
Long-term portion
|
3,077,386
|
|
2,616,808
|
|
|
As of
December 31, 2018
, the Company had
five
revolving credit facilities (or the
Revolvers
) available, which, as at such date, provided for aggregate borrowings of up to
$0.9 billion
, of which
$0.3 billion
was undrawn. Interest payments are based on LIBOR plus margins; at
December 31, 2018
, the margins ranged between
1.40%
and
3.95%
(
December 31, 2017
–
0.45%
and
4.00%
). The aggregate amount available under the Revolvers is scheduled to decrease by
$39.2 million
(
2019
),
$378.4 million
(
2020
),
$333.9 million
(
2021
) and
$192.0 million
(
2022
). The Revolvers are collateralized by first-priority mortgages granted on
38
of the Company’s vessels, together with other related security, and include a guarantee from Teekay or its subsidiaries for all but one of the Revolvers' outstanding amounts. Included in other related security are
56.6 million
common units in Teekay Offshore,
25.2 million
common units in Teekay LNG and
40.3 million
Class A common shares in Teekay Tankers, which secure a
$150 million
credit facility.
The Company’s
8.5%
senior unsecured notes are due January 15, 2020 with an original aggregate principal amount of
$450 million
(or the
Original Notes
). The Original Notes issued on January 27, 2010 were sold at a price equal to
99.2%
of par. During 2014, the Company repurchased
$57.3 million
of the Original Notes. In November 2015, the Company issued an aggregate principal amount of
$200 million
of the Company’s
8.5%
senior unsecured notes due on January 15, 2020 (or
the Notes
) at
99.01%
of face value, plus accrued interest from July 15, 2015. The Notes are an additional issuance of the Company’s Original Notes (collectively referred to as the
8.5%
Notes
). The Notes were issued under the same indenture governing the Original Notes and are fungible with the Original Notes. The discount on the
8.5%
F -
28
TEEKAY CORPORATION AND SUBSIDIARIES
NOTES TO THE CONSOLIDATED FINANCIAL STATEMENTS
(all tabular amounts stated in thousands of U.S. dollars, other than share data and unless otherwise indicated)
Notes is accreted through the maturity date of the notes using the effective interest rate of
8.67%
per year. During
2018
, the Company repurchased
$84.1 million
in aggregate principal amount of the
8.5%
Notes. During the first quarter of 2019, the Company repurchased an additional
$10.9 million
in aggregate principal amount of the
8.5%
Notes.
The Company capitalized aggregate issuance costs of
$13.3 million
which are amortized to interest expense over the term of the
8.5%
Notes. As of
December 31, 2018
, the unamortized balance of the capitalized issuance costs was
$1.6 million
which is recorded in long-term debt in the consolidated balance sheet. The
8.5%
Notes rank equally in right of payment with all of Teekay’s existing and future senior unsecured debt and senior to any future subordinated debt of Teekay. The
8.5%
Notes are not guaranteed by any of Teekay’s subsidiaries and effectively rank behind all existing and future secured debt of Teekay and other liabilities of its subsidiaries.
The Company may redeem the
8.5%
Notes in whole or in part at any time before their maturity date at a redemption price equal to the greater of (i)
100%
of the principal amount of the
8.5%
Notes to be redeemed and (ii) the sum of the present values of the remaining scheduled payments of principal and interest on the
8.5%
Notes to be redeemed (excluding accrued interest), discounted to the redemption date on a semi-annual basis, at the treasury yield plus
50 basis points
, plus accrued and unpaid interest to the redemption date.
On January 26, 2018, Teekay Parent completed a private offering of
$125.0 million
of aggregate principal amount of
5%
Convertible Senior Notes due January 15, 2023 (the
Convertible Notes
). The Convertible Notes are convertible into Teekay’s common stock, initially at a rate of
85.4701
shares of common stock per
$1,000
principal amount of Convertible Notes. This represents an initial effective conversion price of
$11.70
per share of common stock. The initial conversion price represents a premium of
20%
to the concurrent common stock offering price of
$9.75
per share. The conversion rate is subject to customary adjustments for, among other things, payments of dividends by Teekay Parent beyond the current quarterly dividend of
$0.055
per share of common stock. On issuance of the Convertible Notes,
$104.6 million
of the net proceeds was reflected in long-term debt and is being accreted to
$125.0 million
over its
five
-year term through interest expense. The remaining amount of the net proceeds of
$16.1 million
was allocated to the conversion feature and reflected in additional paid-in capital.
Teekay LNG has a total of NOK
3.1 billion
in senior unsecured bonds issued in the Norwegian bond market at
December 31, 2018
that mature through August 2023. As at
December 31, 2018
, the total carrying amount of the senior unsecured bonds was
$353.0 million
. The bonds are listed on the Oslo Stock Exchange. The interest payments on the bonds are based on NIBOR plus a margin, which ranges from
3.70%
to
6.00%
. Teekay LNG entered into cross currency rate swaps to swap all interest and principal payments of the bonds into U.S. Dollars, with the interest payments fixed at rates ranging from
5.92%
to
7.89%
, and the transfer of principal amount fixed at
$382.5 million
upon maturity in exchange for NOK
3.1 billion
(see
Note 15
).
As of
December 31, 2018
, the Company had
11
U.S. Dollar-denominated term loans outstanding, which totaled
$1.5 billion
in aggregate principal amount (
December 31, 2017
–
$1.4 billion
). Interest payments on the term loans are based on LIBOR plus a margin, of which
two
of the term loans have additional tranches based on fixed rates of
4.41%
and
5.37%
. At
December 31, 2018
and
December 31, 2017
, the margins ranged between
0.30%
and
3.50%
. All but one of the term loans, which is repayable on demand, have payments that are made in quarterly or semi-annual payments commencing
three
or
six
months after delivery of each newbuilding vessel financed thereby, and
nine
of the term loans have balloon or bullet repayments due at maturity. The term loans are collateralized by first-priority mortgages on
24
(
December 31, 2017
–
22
) of the Company’s vessels, together with certain other security.
Teekay LNG has
two
Euro-denominated term loans outstanding, which, as at
December 31, 2018
, totaled
169.0 million
Euros (
$193.8 million
) (
December 31, 2017
–
194.1 million
Euros (
$233.0 million
)). Teekay LNG is servicing the loans with funds generated by
two
Euro-denominated, long-term time-charter contracts. Interest payments on the loans are based on EURIBOR plus a margin. At
December 31, 2018
the margins ranged between
0.6%
and
1.95%
(
December 31, 2017
–
0.60%
and
2.25%
). The Euro-denominated term loans reduce in monthly and semi-annual payments with varying maturities through 2024, are collateralized by first-priority mortgages on
two
of Teekay LNG’s vessels, together with certain other security, and are guaranteed by Teekay LNG and
one
of its subsidiaries.
Both Euro-denominated term loans and NOK-denominated bonds are revalued at the end of each period using the then-prevailing U.S. Dollar exchange rate. Due primarily to the revaluation of the Company’s NOK-denominated bonds, the Company’s Euro-denominated term loans, and restricted cash, and the change in the valuation of the Company’s cross currency swaps, the Company recognized a foreign exchange
gain
during
2018
of
$6.1 million
(
2017
– loss of
$26.5 million
,
2016
– loss of
$6.5 million
).
The weighted-average interest rate on the Company’s aggregate long-term debt as at
December 31, 2018
was
5.1%
(
December 31, 2017
–
4.3%
). This rate does not include the effect of the Company’s interest rate swap agreements (see
Note 15
).
Teekay Corporation has guaranteed obligations pursuant to certain credit facilities of Teekay Tankers. As at
December 31, 2018
, the aggregate outstanding balance on such credit facilities was
$166.4 million
.
The aggregate annual long-term debt principal repayments required to be made by the Company subsequent to
December 31, 2018
are
$0.2 billion
(
2019
),
$1.2 billion
(
2020
),
$0.9 billion
(
2021
),
$0.2 billion
(
2022
),
$0.3 billion
(
2023
) and
$0.6 billion
(thereafter).
The Company’s long-term debt agreements generally provide for maintenance of minimum consolidated financial covenants and
five
loan agreements require the maintenance of vessel market value to loan ratios. As at
December 31, 2018
, these ratios ranged from
131.7%
to
197.8%
compared to their minimum required ratios of
115.0%
to
135.0%
. The vessel values used in these ratios are the appraised values provided by third parties where available or prepared by the Company based on second-hand sale and purchase market data. Changes in the LNG/LPG and conventional tanker markets could negatively affect the Company’s compliance with these ratios.
F -
29
TEEKAY CORPORATION AND SUBSIDIARIES
NOTES TO THE CONSOLIDATED FINANCIAL STATEMENTS
(all tabular amounts stated in thousands of U.S. dollars, other than share data and unless otherwise indicated)
Two
of Teekay Tankers’ term loans require Teekay Parent and Teekay Tankers collectively to maintain the greater of (a) free cash (cash and cash equivalents) of at least
$100.0 million
for
one
of the term loans and
$50.0 million
for the other and (b) an aggregate of free cash and undrawn committed revolving credit lines with at least six months to maturity of at least
7.5%
for
one
of the term loans and
5.0%
for the other, of their total debt. In addition, certain loan agreements require Teekay Tankers to maintain a minimum liquidity (cash, cash equivalents and undrawn committed revolving credit lines with at least
six
months to maturity) of
$35.0 million
and at least
5.0%
of Teekay Tankers' total consolidated debt. Certain loan agreements require Teekay LNG to maintain a minimum level of tangible net worth, and minimum liquidity (cash, cash equivalents and undrawn committed revolving credit lines with at least
six
months to maturity) of
$35.0 million
, and not to exceed a maximum level of financial leverage.
As at
December 31, 2018
, the Company was in compliance with all covenants under its credit facilities and other long-term debt.
9. Operating Leases
Charters-in
As at
December 31, 2018
, minimum commitments to be incurred by the Company under vessel operating leases by which the Company charters-in vessels were approximately
$283.9 million
, comprised as follows:
|
|
2019
|
2020
|
2021
|
2022
|
2023
|
Beyond 2023
|
|||||||||||
|
(in millions of U.S. Dollars)
|
|||||||||||||||||
|
Charters-in – operating leases
|
92.6
|
|
74.3
|
|
53.4
|
|
9.1
|
|
9.1
|
|
5.6
|
|
|||||
|
Charters-in – operating leases
(1)
|
23.7
|
|
16.1
|
|
—
|
|
—
|
|
—
|
|
—
|
|
|||||
|
116.3
|
|
90.4
|
|
53.4
|
|
9.1
|
|
9.1
|
|
5.6
|
|
||||||
|
(1)
|
As at
December 31, 2018
, Teekay LNG was chartering in a vessel at a fixed-rate from its
52%
-owned joint venture with Marubeni Corporation (or the
Teekay LNG-Marubeni Joint Venture
) for a period of two years until September 2020. Teekay LNG recognizes the expense from this charter on a straight-line basis over the firm period of the charter and this expense is presented as time-charter hire expense in the Company's
consolidated statements of (loss) income
.
|
Other
Teekay Tangguh Joint Venture
As at
December 31, 2018
, the Teekay BLT Corporation (or the
Teekay Tangguh Joint Venture
), of which Teekay LNG has a 69% ownership interest, was a party to operating leases (or
Head Leases
) whereby it leases its
two
LNG carriers (or the
Tangguh LNG Carriers
) to a third party. The Teekay Tangguh Joint Venture then leases back the LNG carriers from the same third-party company (or the
Subleases
). Under the terms of these leases, the third-party company claims tax depreciation on the capital expenditures it incurred to lease the vessels. As is typical in these leasing arrangements, tax and change of law risks are assumed by the Teekay Tangguh Joint Venture. Lease payments under the Subleases are based on certain tax and financial assumptions at the commencement of the leases. If an assumption proves to be incorrect, the lease payments are increased or decreased under the Sublease to maintain the agreed after-tax margin. The Teekay Tangguh Joint Venture’s carrying amounts of this tax indemnification guarantee as at
December 31, 2018
and
December 31, 2017
were
$6.6 million
and
$7.1 million
, respectively, and are included as part of other long-term liabilities in the consolidated balance sheets of the Company. The tax indemnification is for the duration of the lease contract with the third party plus the years it would take for the lease payments to be statute barred and ends in 2033. Although there is no maximum potential amount of future payments, the Teekay Tangguh Joint Venture may terminate the lease arrangements on a voluntary basis at any time. If the lease arrangements terminate, the Teekay Tangguh Joint Venture will be required to make termination payments to the third-party company sufficient to repay the third-party company’s investment in the vessels and to compensate it for the tax effect of the terminations, including recapture of any tax depreciation. The Head Leases and the Subleases have
20
-year terms and are classified as operating leases. The Head Lease and the Sublease for the
two
Tangguh LNG Carriers commenced in November 2008 and March 2009, respectively.
As at
December 31, 2018
, the total estimated future minimum rental payments to be received and paid under the lease contracts are as follows:
|
Year
|
Head Lease
Receipts (1)
$
|
Sublease
Payments (1)(2)
$
|
|||
|
2019
|
21,242
|
|
23,875
|
|
|
|
2020
|
21,242
|
|
23,875
|
|
|
|
2021
|
21,242
|
|
23,875
|
|
|
|
2022
|
21,242
|
|
23,875
|
|
|
|
2023
|
21,242
|
|
23,875
|
|
|
|
Thereafter
|
111,611
|
|
125,485
|
|
|
|
Total
|
217,821
|
|
244,860
|
|
|
F -
30
TEEKAY CORPORATION AND SUBSIDIARIES
NOTES TO THE CONSOLIDATED FINANCIAL STATEMENTS
(all tabular amounts stated in thousands of U.S. dollars, other than share data and unless otherwise indicated)
|
(1)
|
The Head Leases are fixed-rate operating leases while the Subleases have a small variable-rate component. As at
December 31, 2018
, Teekay LNG had received
$292.6 million
of aggregate Head Lease receipts and had paid
$236.3 million
of aggregate Sublease payments. The portion of the Head Lease receipts that has not been recognized into earnings, is deferred and amortized on a straight-line basis over the lease terms and, as at
December 31, 2018
, $
3.7 million
(
December 31, 2017
–
$3.7 million
) and $
29.3 million
(
December 31, 2017
–
$33.0 million
) of Head Lease receipts had been deferred and included in accrued liabilities and other and other long-term liabilities, respectively, in the Company’s consolidated balance sheets.
|
|
(2)
|
The amount of payments under the Subleases is updated annually to reflect any changes in the lease payments due to changes in tax law.
|
10. Obligations Related to Capital Leases
|
December 31, 2018
$ |
December 31, 2017
$ |
||||
|
Teekay LNG
|
|||||
|
LNG Carriers
|
1,274,569
|
|
961,711
|
|
|
|
Suezmax Tanker
|
23,987
|
|
49,838
|
|
|
|
Teekay Tankers
|
|||||
|
Suezmax Tankers
|
191,267
|
|
148,908
|
|
|
|
Aframax Tankers
|
157,899
|
|
—
|
|
|
|
LR2 Product Tanker
|
26,123
|
|
—
|
|
|
|
Total obligations related to capital leases
|
1,673,845
|
|
1,160,457
|
|
|
|
Less current portion
|
(102,115
|
)
|
(114,173
|
)
|
|
|
Long-term obligations related to capital leases
|
1,571,730
|
|
1,046,284
|
|
|
As at
December 31, 2018
, Teekay LNG was a party to capital leases on
eight
LNG carriers, the
Creole Spirit,
the
Oak Spirit,
the
Torben Spirit,
the
Macoma,
the
Murex
, the
Magdala
, the
Myrina
, and the
Megara
. Upon delivery of these
eight
LNG carriers between February 2016 and July 2018, Teekay LNG sold these respective vessels to third parties (or
Lessors
) and leased them back under
10
-year bareboat charter contracts ending in 2026 through to 2028. The bareboat charter contracts are accounted for as obligations related to capital leases and have purchase obligations at the end of the lease terms.
Teekay LNG understands that these vessels and lease operations are the only assets and operations of the Lessors. Teekay LNG operates the vessels during the lease term and as a result, is considered to be, under U.S. GAAP, the Lessor's primary beneficiary; therefore, Teekay LNG consolidates the Lessors for financial reporting purposes as VIEs.
The liabilities of the Lessors are loans and are non-recourse to Teekay LNG. The amounts funded to the Lessors in order to purchase the vessels materially match the funding to be paid by Teekay LNG's subsidiaries under the sale-leaseback transaction. As a result, the amounts due by Teekay LNG's subsidiaries to the Lessors have been included in obligations related to capital lease as representing the Lessors' loans.
The obligations of Teekay LNG under the bareboat charter contracts are guaranteed by Teekay LNG
. In addition, the guarantee agreements require Teekay LNG to maintain minimum levels of tangible net worth and aggregate liquidity, and not to exceed a maximum amount of leverage. As at
December 31, 2018
, Teekay LNG was in compliance with all covenants in respect of the obligations related to capital leases.
As at
December 31, 2018
, the remaining commitments related to the
eight
capital leases for Teekay LNG's LNG carriers and LNG carrier newbuildings, including the related purchase obligations, approximated
$1.7 billion
, including imputed interest of
$435.3 million
, repayable from
2019
through 2028, as indicated below:
|
Year
|
Commitment
|
||
|
2019
|
$
|
119,517
|
|
|
2020
|
$
|
118,685
|
|
|
2021
|
$
|
117,772
|
|
|
2022
|
$
|
116,978
|
|
|
2023
|
$
|
116,338
|
|
|
Thereafter
|
$
|
1,120,670
|
|
As at
December 31, 2018
, Teekay LNG was a party, as lessee, to capital leases on
one
Suezmax tanker, the
Toledo Spirit
. Under this capital lease, the owner had the option to require Teekay LNG to purchase the vessel.
The charterer, who is also the owner, also had the option to cancel the charter contract and the cancellation option was first exercisable in August 2018. In January 2019, the charterer of the
Toledo Spirit
sold the vessel and the capital lease was terminated.
The amounts in the table below include the remaining commitments related to the
one
capital lease for the
Toledo Spirit
Suezmax tanker, including the related purchase obligations, repayable in 2019. Upon the sale of the vessel in January 2019, Teekay LNG returned the vessel to the owner and the full amount of the associated obligation related to the capital lease was concurrently extinguished.
F -
31
TEEKAY CORPORATION AND SUBSIDIARIES
NOTES TO THE CONSOLIDATED FINANCIAL STATEMENTS
(all tabular amounts stated in thousands of U.S. dollars, other than share data and unless otherwise indicated)
Teekay LNG's
capital lease relating to its Suezmax tanker does not contain financial or restrictive covenants other than those relating to operation and maintenance of the vessel.
In November 2018, Teekay Tankers completed an
$84.7 million
sale-leaseback financing transaction with a financial institution relating to
four
of the Teekay Tankers' vessels, consisting of
two
Aframax tankers,
one
Suezmax tanker and
one
LR2 product tanker, the
Explorer Spirit, Navigator Spirit, Pinnacle Spirit
and
Trysil Spirit
.
In September 2018, Teekay Tankers completed a
$156.6 million
sale-leaseback financing transaction with a financial institution relating to
six
of its Aframax tankers, the
Blackcomb Spirit, Emerald Spirit, Garibaldi Spirit, Peak Spirit, Tarbet Spirit
and
Whistler Spirit
.
In July 2017, Teekay Tankers completed a
$153.0 million
sale-leaseback financing transaction with a financial institution relating to
four
of Teekay Tankers' Suezmax tankers, the
Athens Spirit
, the
Beijing Spirit
, the
Moscow Spirit
and the
Sydney Spirit
. Under these arrangements, Teekay Tankers transferred the vessels to subsidiaries of the financial institutions (or collectively, the
Lessors
), and leased the vessels back from the Lessors on bareboat charters ranging from
nine
-to
12
-year terms. Teekay Tankers has the option to purchase each of the
14
tankers at any point between July 2020 and the end of their respective terms.
Teekay Tankers is also obligated to purchase
six
of the Aframax vessels upon maturity of their respective bareboat charters.
Teekay Tankers understands that these vessels and lease operations are the only assets and operations of the Lessors. Teekay Tankers operates the vessels during the lease term, and as a result, is considered to be the Lessor's primary beneficiary and therefore Teekay Tankers consolidates the Lessors for financial reporting purposes.
The liabilities of the Lessors are loans that are non-recourse to Teekay Tankers. The amounts funded to the Lessors in order to purchase the vessels materially match the funding to be paid by Teekay Tankers' subsidiaries under these lease-back transactions. As a result, the amounts due by Teekay Tankers' subsidiaries to the Lessors have been included in obligations related to capital leases as representing the Lessors' loans.
The bareboat charters related to each of these vessels require that Teekay Tankers maintain a minimum liquidity (cash, cash equivalents and undrawn committed revolving credit lines with at least
six
months to maturity) of
$35.0 million
and at least
5.0%
of Teekay Tankers' consolidated debt and obligations related to capital leases (excluding applicable security deposits reflected in restricted cash
–
non-current on the Company's consolidated balance sheets).
Four
of the bareboat charters require Teekay Tankers to maintain, for each vessel, a hull coverage ratio of
90%
of the total outstanding principal balance during the first
three
years of the lease period and
100%
of the total outstanding principal balance thereafter. As at
December 31, 2018
, this ratio was approximately
101%
(
December 31, 2017
–
105%
).
Six
of the bareboat charters require Teekay Tankers to maintain, for each vessel, a hull coverage ratio of
75%
of the total outstanding principal balance during the first year of the lease period,
78%
for the second year,
80%
for the following two years and
90%
of the total outstanding principal balance thereafter. As at
December 31, 2018
, this ratio was approximately
91%
(
December 31, 2017
–
nil
).
The remaining
four
bareboat charters also require Teekay Tankers to maintain, for each vessel, a hull overage ratio of
100%
of the total outstanding principal balance. As at
December 31, 2018
, this ratio was approximately
122%
(
December 31, 2017
–
nil
).
Such requirements are assessed annually with reference to vessel valuations compiled by one or more agreed upon third parties. As at
December 31, 2018
, Teekay Tankers was in compliance with all covenants in respect of the obligations related to capital leases.
Teekay Tankers maintains restricted cash deposits relating to leasing arrangements which cash totaled
$4.3 million
and
$2.7 million
as at
December 31, 2018
and
2017
, respectively.
As at
December 31, 2018
, the remaining commitments related to Teekay LNG's
one
capital lease for a Suezmax tanker and Teekay Tankers'
five
capital leases for Suezmax tankers,
eight
capital leases for Aframax tankers and
one
capital lease for the LR2 product tanker, including the related purchase obligations, approximated
$581.3 million
, including imputed interest of
$182.0 million
, repayable from 2019 through 2029, as indicated below:
|
Year
|
Commitment
|
||
|
2019
|
$
|
72,168
|
|
|
2020
|
$
|
47,373
|
|
|
2021
|
$
|
47,237
|
|
|
2022
|
$
|
47,230
|
|
|
2023
|
$
|
47,222
|
|
|
Thereafter
|
$
|
320,064
|
|
11. Fair Value Measurements
The following methods and assumptions were used to estimate the fair value of each class of financial instruments and other non-financial assets.
F -
32
TEEKAY CORPORATION AND SUBSIDIARIES
NOTES TO THE CONSOLIDATED FINANCIAL STATEMENTS
(all tabular amounts stated in thousands of U.S. dollars, other than share data and unless otherwise indicated)
Cash and cash equivalents and restricted cash
– The fair value of the Company’s cash and cash equivalents and restricted cash approximates their carrying amounts reported in the accompanying consolidated balance sheets.
Vessels and equipment and assets held for sale
– The estimated fair value of the Company’s vessels and equipment and assets held for sale was determined based on discounted cash flows or appraised values. In cases where an active second-hand sale and purchase market does not exist, the Company uses a discounted cash flow approach to estimate the fair value of an impaired vessel. In cases where an active second-hand sale and purchase market exists, an appraised value is generally the amount the Company would expect to receive if it were to sell the vessel. Such appraisal is normally completed by the Company. Other assets held for sale include working capital balances and the fair value of such amounts generally approximate their carrying value.
Loans to equity-accounted investees and joint venture partners
– The fair value of the Company’s loans to joint ventures and joint venture partners approximates their carrying amounts reported in the accompanying consolidated balance sheets.
Long-term receivable included in accounts receivable and other assets
– The fair value of the Company’s long-term loan receivable is estimated using discounted cash flow analysis based on rates currently available for debt with similar terms and remaining maturities and the current credit worthiness of the counterparty.
Long-term debt
– The fair value of the Company’s fixed-rate and variable-rate long-term debt is either based on quoted market prices or estimated using discounted cash flow analyses, based on rates currently available for debt with similar terms and remaining maturities and the current credit worthiness of the Company. Alternatively, if the fixed-rate and variable-rate long-term debt is held for sale the fair value is based on the estimated sales price.
Long-term obligation related to capital leases
– The fair value of the Company's long-term obligation related to capital leases is estimated using discounted cash flow analyses, based on rates currently available for debt with similar terms and remaining maturities.
Derivative instruments
– The fair value of the Company’s derivative instruments is the estimated amount that the Company would receive or pay to terminate the agreements at the reporting date, taking into account, as applicable, fixed interest rates on interest rate swaps, current interest rates, foreign exchange rates, and the current credit worthiness of both the Company and the derivative counterparties. The estimated amount is the present value of future cash flows. The Company transacts all of its derivative instruments through investment-grade rated financial institutions at the time of the transaction and requires no collateral from these institutions. Given the current volatility in the credit markets, it is reasonably possible that the amounts recorded as derivative assets and liabilities could vary by material amounts in the near term.
The Company categorizes its fair value estimates using a fair value hierarchy based on the inputs used to measure fair value. The fair value hierarchy has three levels based on the reliability of the inputs used to determine fair value as follows:
Level 1.
Observable inputs such as quoted prices in active markets;
Level 2.
Inputs, other than the quoted prices in active markets, that are observable either directly or indirectly; and
Level 3.
Unobservable inputs in which there is little or no market data, which require the reporting entity to develop its own assumptions.
The following table includes the estimated fair value and carrying value of those assets and liabilities that are measured at fair value on a recurring and non-recurring basis, as well as the estimated fair value of the Company’s financial instruments that are not accounted for at a fair value on a recurring basis.
F -
33
TEEKAY CORPORATION AND SUBSIDIARIES
NOTES TO THE CONSOLIDATED FINANCIAL STATEMENTS
(all tabular amounts stated in thousands of U.S. dollars, other than share data and unless otherwise indicated)
|
December 31, 2018
|
December 31, 2017
|
||||||||||||
|
Fair Value
Hierarchy Level |
Carrying
Amount Asset (Liability) $ |
Fair
Value Asset (Liability) $ |
Carrying
Amount Asset (Liability) $ |
Fair
Value Asset (Liability) $ |
|||||||||
|
Recurring
|
|||||||||||||
|
Cash, cash equivalents and restricted cash
|
Level 1
|
505,639
|
|
505,639
|
|
552,174
|
|
552,174
|
|
||||
|
Derivative instruments (
note 15
)
|
|||||||||||||
|
Interest rate swap agreements
–
assets
(1)
|
Level 2
|
9,640
|
|
9,640
|
|
6,081
|
|
6,081
|
|
||||
|
Interest rate swap agreements
–
liabilities
(1)
|
Level 2
|
(43,175
|
)
|
(43,175
|
)
|
(78,560
|
)
|
(78,560
|
)
|
||||
|
Cross currency interest swap agreements
–
assets
(1)
|
Level 2
|
—
|
|
—
|
|
3,758
|
|
3,758
|
|
||||
|
Cross currency interest swap agreements
–
liabilities
(1)
|
Level 2
|
(29,122
|
)
|
(29,122
|
)
|
(54,217
|
)
|
(54,217
|
)
|
||||
|
Foreign currency contracts
|
Level 2
|
—
|
|
—
|
|
81
|
|
81
|
|
||||
|
Stock purchase warrants
|
Level 3
|
12,026
|
|
12,026
|
|
30,749
|
|
30,749
|
|
||||
|
Freight forward agreements
|
Level 2
|
(57
|
)
|
(57
|
)
|
—
|
|
—
|
|
||||
|
Non-recurring
|
|||||||||||||
|
Vessels held for sale (
note 18
)
|
Level 2
|
—
|
|
—
|
|
16,671
|
|
16,671
|
|
||||
|
Other
|
|
||||||||||||
|
Loans to equity-accounted investees
|
(2)
|
169,197
|
|
(2)
|
107,486
|
|
(2)
|
||||||
|
Loans to equity-accounted investees and joint venture partners
–
Long-term
|
(2)
|
62,207
|
|
(2)
|
146,420
|
|
(2)
|
||||||
|
Long-term receivable
included in accounts receivable and other non-current assets
(3)
|
Level 3
|
175
|
|
174
|
|
3,476
|
|
3,459
|
|
||||
|
Long-term debt
–
public (
note 8
)
|
Level 1
|
(856,986
|
)
|
(851,470
|
)
|
(963,563
|
)
|
(979,773
|
)
|
||||
|
Long-term debt
–
non-public (
note 8
)
|
Level 2
|
(2,462,537
|
)
|
(2,395,300
|
)
|
(2,454,142
|
)
|
(2,421,273
|
)
|
||||
|
Obligations related to capital leases, including current portion
(note 10)
|
Level 2
|
(1,673,845
|
)
|
(1,652,345
|
)
|
(1,160,457
|
)
|
(1,148,989
|
)
|
||||
|
(1)
|
The fair value of the Company’s interest rate swap and cross currency swap agreements at
December 31, 2018
includes
$3.2 million
(
December 31, 2017
–
$5.7 million
) accrued interest expense which is recorded in accrued liabilities on the consolidated balance sheets.
|
|
(2)
|
In the consolidated financial statements, the Company’s loans to and equity investments in equity-accounted investees constitute the aggregate carrying value of the Company’s interests in entities accounted for by the equity method. The fair value of the individual components of such aggregate interests is not determinable.
|
|
(3)
|
As at
December 31, 2018
, the estimated fair value of the non-interest bearing receivable from Royal Dutch Shell Plc (or
Shell
) is based on the remaining future fixed payments as well as an estimated discount rate. The estimated fair value of this receivable as of
December 31, 2018
was
$0.2 million
(
December 31, 2017
–
$3.5 million
) using a discount rate of
8.0%
. As there is no market rate for the equivalent of an unsecured non-interest bearing receivable from Shell, the discount rate was based on unsecured debt instruments of similar maturity held by the Company, adjusted for a liquidity premium. A higher or lower discount rate would result in a lower or higher fair value asset.
|
Stock purchase warrants
– As at
December 31, 2018
, Teekay held
15.5 million
Brookfield Transaction Warrants (
December 31, 2017
–
14.5 million
) (see
Note 4
).
In July 2018, Brookfield transferred to Teekay an additional
1.0 million
Brookfield Transaction Warrants upon Brookfield’s exercise of its option to acquire an additional
2%
of ownership interests in Teekay Offshore's general partner from Teekay.
The Brookfield Transaction Warrants allow the holders to acquire one common unit of Teekay Offshore for each Brookfield Transaction Warrant for an exercise price of
$0.01
per common unit, which warrants become exercisable when Teekay Offshore's common unit volume-weighted average price is equal to or greater than
$4.00
per common unit for
10
consecutive trading days until September 25, 2024. The fair value of the Brookfield Transaction Warrants was
$11.8 million
and
$29.4 million
on
December 31, 2018
and
December 31, 2017
, respectively.
As of
December 31, 2018
, in addition to the Brookfield Transaction Warrants, Teekay held a total of
1,755,000
warrants to purchase common units of Teekay Offshore that were issued in connection with Teekay Offshore's private placement of Series D Preferred Units in June 2016 (or the
Series D Warrants
) with an exercise price of
$4.55
, which have a
seven
-year term. The Series D Warrants will be net settled in either cash or common units at Teekay Offshore’s option. The fair value of the Series D Warrants was
$0.2 million
and
$1.3 million
on
December 31, 2018
and
December 31, 2017
, respectively.
The estimated fair value of the Brookfield Transaction Warrants and the Series D Warrants was determined using a Black-Scholes pricing model and is based, in part, on the historical price of common units of Teekay Offshore, the risk-free rate, vesting conditions and the historical volatility of Teekay Offshore. The estimated fair value of these Brookfield Transaction Warrants and Series D Warrants as of
December 31, 2018
was based on the historical volatility of Teekay Offshore's common units of
64.1%
and
56.2%
, respectively, (
2017
–
74.9%
and
72.8%
, respectively). Higher or lower volatilities would result in a higher or lower fair value of these derivative assets.
F -
34
TEEKAY CORPORATION AND SUBSIDIARIES
NOTES TO THE CONSOLIDATED FINANCIAL STATEMENTS
(all tabular amounts stated in thousands of U.S. dollars, other than share data and unless otherwise indicated)
During January 2014, the Company received from TIL stock purchase warrants entitling it to purchase up to
1.5 million
shares of the common stock of TIL (see
Note 15
). In May 2017, Teekay Tankers entered into a merger agreement with TIL (see
Note 22
), and in November 2017, on completion of the merger, TIL became a wholly-owned subsidiary of Teekay Tankers. Under the terms of a merger agreement, warrants to purchase or acquire shares of common stock of TIL that had not been exercised as of the effective time of the merger, were canceled. As a result, no value is recorded for these warrants in the Company's balance sheets at
December 31, 2018
and 2017.
Changes in fair value during the years ended
December 31, 2018
and
2017
for the Company's Brookfield Transaction Warrants, Series D Warrants and the TIL stock purchase warrants, as applicable, which are described above and are measured at fair value on the recurring basis using significant unobservable inputs (Level 3), are as follows:
|
Year Ended December 31,
|
|||||
|
2018
$ |
2017
$ |
||||
|
Fair value at the beginning of the year
|
30,749
|
|
575
|
|
|
|
Fair value on acquisition/issuance
|
2,330
|
|
36,596
|
|
|
|
Unrealized loss included in earnings
|
(21,053
|
)
|
(6,422
|
)
|
|
|
Fair value at the end of the year
|
12,026
|
|
30,749
|
|
|
12. Capital Stock
The authorized capital stock of Teekay at
December 31, 2018
,
2017
, and
2016
, was
25,000,000
shares of Preferred Stock, with a par value of
$1
per share, and
725,000,000
shares of Common Stock, with a par value of
$0.001
per share. As at
December 31, 2018
,
100,435,210
shares of Common Stock (
2017
–
89,127,041
) were issued and outstanding and
no
shares of Preferred Stock issued.
During
2018
, Teekay completed a public offering of
10.0 million
common shares priced at
$9.75
per share, raising net proceeds of approximately
$93.0 million
and issued
0.2 million
shares of common stock upon the exercise or issuance of stock options, restricted stock units and restricted stock awards. During
2017
, Teekay issued
0.1 million
shares of common stock upon the exercise or issuance of stock options, restricted stock units and restricted stock awards.
In
2016
, Teekay implemented a continuous offering program (or
COP
) under which Teekay may issue new common stock, at market prices up to a maximum aggregate amount of $
50.0
million. During
2018
, Teekay sold an aggregate of
1.1 million
shares of common stock under the COP, generating net proceeds of
$10.7 million
. During
2017
, Teekay sold an aggregate of
2.9
million shares of common stock under the COP, generating net proceeds of $
25.6
million. Teekay used the net proceeds from the issuance of these shares of common stock for general corporate purposes.
Dividends may be declared and paid out of surplus, but if there is no surplus, dividends may be declared or paid out of the net profits for the fiscal year in which the dividend is declared and for the preceding fiscal year. Surplus is the excess of the net assets of the Company over the aggregated par value of the issued shares of the Teekay. Subject to preferences that may apply to any shares of preferred stock outstanding at the time, the holders of common stock are entitled to share equally in any dividends that the Board of Directors may declare from time to time out of funds legally available for dividends.
During 2008, Teekay announced that its Board of Directors had authorized the repurchase of up to
$200 million
of shares of its Common Stock in the open market, subject to cancellation upon approval by the Board of Directors. As at
December 31, 2018
, Teekay had repurchased approximately
5.2 million
shares of Common Stock for
$162.3 million
pursuant to such authorization. The total remaining share repurchase authorization at
December 31, 2018
, was
$37.7 million
.
On July 2, 2010, the Company amended and restated its Shareholder Rights Agreement (the
Rights Agreement
), which was originally adopted by the Board of Directors in September 2000. In September 2000, the Board of Directors declared a dividend of
one
common share purchase right (or a
Right
) for each outstanding share of the Company’s common stock. These Rights continue to remain outstanding and will not be exercisable and will trade with the shares of the Company’s common stock until after such time, if any, as a person or group becomes an “acquiring person” as set forth in the amended Rights Agreement. A person or group will be deemed to be an “acquiring person,” and the Rights generally will become exercisable, if a person or group acquires
20%
or more of the Company’s common stock, or if a person or group commences a tender offer that could result in that person or group owning more than
20%
of the Company’s common stock, subject to certain higher thresholds for existing shareholders that owned in excess of
15%
of the Company’s common stock when the Rights Agreement was amended. Once exercisable, each Right held by a person other than the “acquiring person” would entitle the holder to purchase, at the then-current exercise price, a number of shares of common stock of the Company having a value of twice the exercise price of the Right. In addition, if the Company is acquired in a merger or other business combination transaction after any such event, each holder of a Right would then be entitled to purchase, at the then-current exercise price, shares of the acquiring company’s common stock having a value of twice the exercise price of the Right. The amended Rights Agreement will expire on July 1, 2020, unless the expiry date is extended or the Rights are earlier redeemed or exchanged by the Company.
F -
35
TEEKAY CORPORATION AND SUBSIDIARIES
NOTES TO THE CONSOLIDATED FINANCIAL STATEMENTS
(all tabular amounts stated in thousands of U.S. dollars, other than share data and unless otherwise indicated)
Stock-based compensation
In March 2013, the Company adopted the 2013 Equity Incentive Plan (or the
2013 Plan
) and suspended the 1995 Stock Option Plan and the 2003 Equity Incentive Plan (collectively referred to as the
Plans
). As at
December 31, 2018
, the Company had reserved
5,777,326
(
2017
–
5,115,308
) shares of Common Stock pursuant to the 2013 Plan, for issuance upon the exercise of options or equity awards granted or to be granted.
During the years ended
December 31, 2018
,
2017
and
2016
, the Company granted options under the 2013 Plan to acquire up to
1,048,916
,
732,314
and
916,015
shares of Common Stock, respectively, to certain eligible officers, employees and directors of the Company. The options under the Plans have
ten
-year terms and vest equally over
three years
from the grant date. All options outstanding as of
December 31, 2018
, expire between March 8, 2019 and March 12, 2028,
ten
years after the date of each respective grant.
A summary of the Company’s stock option activity and related information for the years ended
December 31, 2018
,
2017
, and
2016
, are as follows:
|
December 31, 2018
|
December 31, 2017
|
December 31, 2016
|
|||||||||||||||
|
Options
(000’s) # |
Weighted-Average
Exercise Price $ |
Options
(000’s) # |
Weighted-Average
Exercise Price $ |
Options
(000’s) # |
Weighted-Average
Exercise Price $ |
||||||||||||
|
Outstanding
–
beginning of year
|
3,600
|
|
22.96
|
|
3,367
|
|
29.16
|
|
2,800
|
|
36.84
|
|
|||||
|
Granted
|
1,052
|
|
8.67
|
|
732
|
|
10.18
|
|
916
|
|
9.44
|
|
|||||
|
Exercised
|
(2
|
)
|
9.44
|
|
(3
|
)
|
9.44
|
|
—
|
|
—
|
|
|||||
|
Forfeited / expired
|
(896
|
)
|
37.44
|
|
(496
|
)
|
46.27
|
|
(349
|
)
|
38.97
|
|
|||||
|
Outstanding
–
end of year
|
3,754
|
|
15.54
|
|
3,600
|
|
22.96
|
|
3,367
|
|
29.16
|
|
|||||
|
Exercisable
–
end of year
|
1,954
|
|
21.35
|
|
2,221
|
|
29.76
|
|
2,271
|
|
35.89
|
|
|||||
A summary of the Company’s non-vested stock option activity and related information for the years ended
December 31, 2018
,
2017
and
2016
, are as follows:
|
December 31, 2018
|
December 31, 2017
|
December 31, 2016
|
|||||||||||||||
|
Options
(000’s) # |
Weighted-Average
Grant Date Fair Value $ |
Options
(000’s) # |
Weighted-Average
Grant Date Fair Value $ |
Options
(000’s) # |
Weighted-Average
Grant Date Fair Value $ |
||||||||||||
|
Outstanding non-vested stock options
–
beginning of year
|
1,379
|
|
4.44
|
|
1,096
|
|
4.30
|
|
300
|
|
8.09
|
|
|||||
|
Granted
|
1,052
|
|
4.21
|
|
732
|
|
4.71
|
|
916
|
|
3.60
|
|
|||||
|
Vested
|
(609
|
)
|
4.65
|
|
(399
|
)
|
4.62
|
|
(118
|
)
|
8.48
|
|
|||||
|
Forfeited
|
(22
|
)
|
3.93
|
|
(50
|
)
|
3.94
|
|
(2
|
)
|
3.60
|
|
|||||
|
Outstanding non-vested stock options
–
end of year
|
1,800
|
|
4.25
|
|
1,379
|
|
4.44
|
|
1,096
|
|
4.30
|
|
|||||
The weighted average grant date fair value for non-vested options forfeited in
2018
was
$0.1 million
(
2017
–
$0.2 million
,
2016
–
$
nil
).
As of
December 31, 2018
, there was
$2.9 million
of total unrecognized compensation cost related to non-vested stock options granted under the Plans. Recognition of this compensation cost over the next three years is expected to be
$1.7 million
(
2019
),
$1.0 million
(
2020
) and
$0.2 million
(
2021
). During the years ended
December 31, 2018
,
2017
, and
2016
, the Company recognized
$2.8 million
,
$1.7 million
and
$1.5 million
, respectively, of compensation cost relating to stock options granted under the Plans.
No
options were exercised during 2016. The intrinsic value of options exercised during
2018
was $
nil
, during
2017
was $
0.03 million
and during
2016
was $
nil
.
As at
December 31, 2018
, the intrinsic value of outstanding and exercisable stock options was $
nil
(
2017
–
$
nil
). As at
December 31, 2018
, the weighted-average remaining life of options vested and expected to vest was
6.7
years (
2017
–
5.1
years).
F -
36
TEEKAY CORPORATION AND SUBSIDIARIES
NOTES TO THE CONSOLIDATED FINANCIAL STATEMENTS
(all tabular amounts stated in thousands of U.S. dollars, other than share data and unless otherwise indicated)
Further details regarding the Company’s outstanding and exercisable stock options at
December 31, 2018
are as follows:
|
Outstanding Options
|
Exercisable Options
|
||||||||||||||
|
Range of Exercise Prices
|
Options
(000’s) # |
Weighted- Average
Remaining Life (Years) |
Weighted-
Average Exercise Price $ |
Options
(000’s) # |
Weighted- Average
Remaining Life (Years) |
Weighted-
Average Exercise Price $ |
|||||||||
|
$5.00 – $9.99
|
1,878
|
|
8.3
|
9.01
|
|
554
|
|
7.2
|
9.44
|
|
|||||
|
$10.00 – $19.99
|
871
|
|
6.7
|
10.48
|
|
396
|
|
5.0
|
10.85
|
|
|||||
|
$20.00 – $24.99
|
281
|
|
1.2
|
24.42
|
|
281
|
|
1.2
|
24.42
|
|
|||||
|
$25.00 – $29.99
|
350
|
|
3.2
|
27.69
|
|
349
|
|
3.2
|
27.69
|
|
|||||
|
$30.00 – $34.99
|
95
|
|
3.4
|
34.43
|
|
95
|
|
3.4
|
34.42
|
|
|||||
|
$40.00 – $49.99
|
264
|
|
6.2
|
43.99
|
|
264
|
|
6.2
|
43.99
|
|
|||||
|
$50.00 – $59.99
|
15
|
|
5.2
|
56.76
|
|
15
|
|
5.2
|
56.76
|
|
|||||
|
3,754
|
|
6.7
|
15.54
|
|
1,954
|
|
4.8
|
21.35
|
|
||||||
The weighted-average grant-date fair value of options granted during
2018
was
$4.21
per option (
2017
–
$4.71
,
2016
–
$3.60
). The fair value of each option granted was estimated on the date of the grant using the Black-Scholes option pricing model. The following weighted-average assumptions were used in computing the fair value of the options granted: expected volatility of
64.8%
in
2018
,
62.4%
in
2017
and
55.1%
in
2016
; expected life of
5.5
years in
2018
and
6
years in
2017
and
2016
; dividend yield of
2.5%
in
2018
,
2.5%
in
2017
and
3.2%
in
2016
; risk-free interest rate of
2.6%
in
2018
,
2.0%
in
2017
, and
1.3%
in
2016
; and estimated forfeiture rate of
7.4%
in
2018
,
7%
in
2017
and
7%
2016
. The expected life of the options granted was estimated using the historical exercise behavior of employees. The expected volatility was generally based on historical volatility as calculated using historical data during the
five years
prior to the grant date.
The Company grants restricted stock units and performance share units to certain eligible officers and employees of the Company. Each restricted stock unit and restricted stock award is equal in value to
one
share of the Company’s common stock plus reinvested dividends from the grant date to the vesting date. The restricted stock units vest equally over
three years
from the grant date. Upon vesting, the value of the restricted stock units and restricted stock awards are paid to each grantee in the form of shares.
During
2018
, the Company granted
616,397
restricted stock units with a fair value of
$5.3 million
to certain of the Company’s employees. During
2018
, a total of
563,588
restricted stock units with a market value of
$15.2 million
vested and that amount, net of withholding taxes, was paid to grantees by issuing
311,124
shares of common stock. During
2017
, the Company granted
349,175
restricted stock units with a fair value of
$3.6 million
, to certain of the Company’s employees. During
2017
, a total of
129,106
restricted stock units with a market value of
$3.2 million
vested and that amount, net of withholding taxes, was paid to grantees by issuing
73,078
shares of common stock. During
2016
, the Company granted
238,609
restricted stock units with a fair value of
$2.3 million
and
311,691
performance share units with a fair value of
$3.6 million
, based on the quoted market price and a Monte Carlo valuation model, to certain of the Company's employees. During
2016
, a total of
98,844
restricted stock units with a market value of
$4.3 million
vested and that amount, net of withholding taxes, was paid to grantees by issuing
59,518
shares of common stock. For the year ended
December 31, 2018
, the Company recorded an expense of
$3.0 million
(
2017
-
$4.0 million
,
2016
-
$4.2 million
) related to the restricted stock units and performance share units.
During
2018
, the Company also granted
79,869
(
2017
–
89,387
and
2016
–
67,000
) shares as restricted stock awards with a fair value of
$0.7 million
(
2017
–
$0.9 million
and
2016
–
$0.6 million
), based on the quoted market price, to certain of the Company’s directors. The shares of restricted stock are issued when granted.
Share-based Compensation of Subsidiaries and Equity-Accounted Investments
During the years ended
December 31, 2018
,
2017
and
2016
,
293,770
,
56,950
and
76,084
common units of Teekay Offshore,
17,498
,
17,345
and
32,723
common units of Teekay LNG and
168,029
,
nil
and
9,358
shares of Class A common stock of Teekay Tankers, with aggregate values of
$1.3 million
,
$0.6 million
, and
$0.7 million
, respectively, were granted and issued to the non-management directors of the general partners of Teekay Offshore and Teekay LNG and the non-management directors of Teekay Tankers as part of their annual compensation for
2018
,
2017
and
2016
.
Teekay Offshore, Teekay LNG and Teekay Tankers grant equity-based compensation awards as incentive-based compensation to certain employees of Teekay’s subsidiaries that provide services to Teekay Offshore, Teekay LNG and Teekay Tankers. During March
2018
,
2017
and
2016
, Teekay Offshore and Teekay LNG granted phantom unit awards and Teekay Tankers granted restricted stock-based compensation awards with respect to
1,424,058
,
321,318
and
601,368
units of Teekay Offshore,
62,283
,
60,809
and
132,582
units of Teekay LNG and
762,640
,
382,437
and
279,980
Class A common shares of Teekay Tankers, respectively, with aggregate grant date fair values of
$5.8 million
,
$3.5 million
and
$4.9 million
, respectively, based on Teekay Offshore, Teekay LNG and Teekay Tankers’ closing unit or stock prices on the grant dates.
F -
37
TEEKAY CORPORATION AND SUBSIDIARIES
NOTES TO THE CONSOLIDATED FINANCIAL STATEMENTS
(all tabular amounts stated in thousands of U.S. dollars, other than share data and unless otherwise indicated)
Each phantom unit or restricted stock unit is equal in value to one of Teekay Offshore’s, Teekay LNG’s or Teekay Tankers’ common units or common shares plus reinvested distributions or dividends from the grant date to the vesting date. The awards vest equally over
three
years from the grant date. Any portion of an award that is not vested on the date of a recipient’s termination of service is cancelled, unless their termination arises as a result of the recipient’s retirement, in which case the award will continue to vest in accordance with the vesting schedule. Upon vesting, the awards are paid to a substantial majority of the grantees in the form of common units or common shares, net of withholding tax.
During March
2018
,
2017
and
2016
, respectively, Teekay Tankers granted
736,327
,
486,329
and
216,043
stock options with an exercise price of
$1.22
,
$2.23
and
$3.74
per share that have a
ten
-year term and vest equally over
three
years from the grant date to an officer of Teekay Tankers and to certain employees at Teekay that provide services to Teekay Tankers. During March
2018
and
2017
, respectively, Teekay Tankers also granted
504,097
and
396,412
stock options with an exercise price of
$1.22
and
$2.23
per share that have a
ten
-year term and vest immediately to non-management directors of Teekay Tankers.
13. Related Party Transactions
Teekay Offshore is a related party of Teekay.
As at
December 31, 2018
, Teekay has recorded
$83.1 million
(
December 31, 2017
–
$102.8 million
) in advances to Teekay Offshore and
$59.3 million
(
December 31, 2017
–
$37.2 million
) in advances from Teekay Offshore in current portion of loans to equity-accounted investments and loans from equity-accounted investments, respectively, on the consolidated balance sheets.
On March 31, 2018, Teekay Offshore entered into a loan agreement for a
$125.0 million
senior unsecured revolving credit facility, of which up to
$25.0 million
is provided by Teekay Parent and up to
$100.0 million
is provided by Brookfield. The facility is scheduled to mature in October 2019.
As at
December 31, 2018
, Teekay had advanced
$25.0 million
to Teekay Offshore under this facility recorded in c
urrent portion of loans to equity-accounted investments
in the consolidated balance sheets.
Until December 31, 2017, Teekay and its wholly-owned subsidiaries directly and indirectly provided substantially all of Teekay Offshore’s ship management, commercial, technical, strategic, business development and administrative service needs. Specifically, the Transferred Subsidiaries provided ship management, commercial, technical, strategic, business development and administrative services to Teekay Offshore, primarily related to Teekay Offshore's FPSO units, shuttle tankers and FSO units. On January 1, 2018, Teekay Offshore acquired a 100% ownership interest in the Transferred Subsidiaries (see
Note 4
).
Subsequent to their transfer to Teekay Offshore, the Transferred Subsidiaries continue to provide ship management, commercial, technical, strategic, business development and administrative services to Teekay, primarily related to Teekay's FPSO units. Teekay and certain of its subsidiaries, other than the Transferred Subsidiaries, continue to provide certain other ship management, commercial, technical, strategic and administrative services to Teekay Offshore.
Revenues received by the Company for services provided to Teekay Offshore for the year ended
December 31, 2018
were
$21.0 million
and for the period from deconsolidation on September 25, 2017 to December 31, 2017 were
$17.8 million
which were recorded in revenues on the Company's
consolidated statements of (loss) income
.
Fees paid by the Company to Teekay Offshore for services provided by Teekay Offshore for the year ended
December 31, 2018
were
$25.7 million
and for the period from deconsolidation on September 25, 2017 to December 31, 2017, were
$0.8 million
, and were recorded in vessel operating expenses and general and administrative expenses on the Company's
consolidated statements of (loss) income
.
As at
December 31, 2018
,
two
shuttle tankers and
three
FSO units of Teekay Offshore were employed on long-term time-charter-out or bareboat contracts with subsidiaries of Teekay. Time-charter hire expense paid by the Company to Teekay Offshore for such related party transactions for the year ended
December 31, 2018
was
$56.3 million
and for the period from deconsolidation on September 25, 2017 to December 31, 2017 was
$14.3 million
.
The Company provides ship management and corporate services to certain of its equity-accounted joint ventures that own and operate LNG carriers on long-term charters. During the years ended
December 31, 2018
and
December 31, 2017
, the Company earned
$15.4 million
and
$6.5 million
, respectively, of fees pursuant to these management agreements. In addition, during the year ended
December 31, 2018
, the Company was reimbursed
$39.8 million
for costs incurred by the Company for its seafarers operating these LNG carriers. The accounting presentation of such reimbursement of costs was impacted by the adoption of ASU 2014-09 January 1, 2018 (see
Note 1
)
.
As at
December 31, 2018
, Resolute Investments, Ltd. (or
Resolute
) owned
31.8%
(
2017
–
31.9%
,
2016
–
37.1%
) of the Company’s outstanding Common Stock. Two of the Company’s directors, C. Sean Day and Heidi Locke Simon, are engaged as consultants to Kattegat Limited, the parent company of Resolute, to oversee its investments, including those in the Teekay group of companies.
Mr. Day will be resigning from the Teekay Board effective as of the 2019 annual meeting of shareholders.
Another of the Company's directors, Rudolph Krediet,
is partner at Anholt Services (USA), a wholly-owned subsidiary of Kattegat Limited
.
Director Bjorn Moller is a director of Kattegat Limited.
Director nominee Peter Antturi serves as an executive officer and director of Resolute and other Kattegat Limited subsidiaries and affiliates. He is also an executive officer and owner of Anglemont Financial Services Ltd., a joint venture with Kattegat Limited that provides financial services to Kattegat Limited and its subsidiaries.
F -
38
TEEKAY CORPORATION AND SUBSIDIARIES
NOTES TO THE CONSOLIDATED FINANCIAL STATEMENTS
(all tabular amounts stated in thousands of U.S. dollars, other than share data and unless otherwise indicated)
14. Other loss
|
Year Ended
December 31, 2018 $ |
Year Ended
December 31, 2017 $ |
Year Ended
December 31, 2016 $ |
||||||
|
Tax indemnification guarantee liability
(1)
|
(600
|
)
|
(50,000
|
)
|
—
|
|
||
|
Write-off of contingent consideration
(2)
|
—
|
|
—
|
|
36,630
|
|
||
|
Contingent liability
(3)
|
—
|
|
(4,500
|
)
|
(61,862
|
)
|
||
|
Gain on sale / (write-down) of cost-accounted investment
(4)
|
—
|
|
1,250
|
|
(19,000
|
)
|
||
|
Loss on bond repurchases
|
(1,772
|
)
|
—
|
|
—
|
|
||
|
Miscellaneous income (loss)
|
359
|
|
(731
|
)
|
5,219
|
|
||
|
Other loss
|
(2,013
|
)
|
(53,981
|
)
|
(39,013
|
)
|
||
|
(1)
|
Following the termination of the capital lease arrangements for the
RasGas II LNG Carriers
in 2014, the lessor made a determination that additional rentals were due under the leases following a challenge by the UK taxing authority. As a result, in 2017 the Teekay Nakilat Joint Venture recognized an additional liability, which was included as part of other loss in the Company's
consolidated statements of (loss) income
.
|
|
(2)
|
Related to reversals of contingent liabilities as a result of the cancellation of units for maintenance and safety (or
UMS
) construction contracts in Teekay Offshore, which was deconsolidated in September 2017 (see
Note 4
).
|
|
(3)
|
Related to settlements and accruals made prior to September 2017 as a result of claims and potential claims made against Logitel Offshore Holding AS (or
Logitel
), a company acquired by Teekay Offshore in 2014. Teekay Offshore was deconsolidated in September 2017 (see
Note 4
).
|
|
(4)
|
The Company holds cost-accounted investments at cost. During the year ended December 31, 2016, the Company recorded a write-down of an investment of
$19.0 million
. This investment was subsequently sold in 2017, resulting in a gain on sale of cost-accounted investment of
$1.3 million
.
|
15. Derivative Instruments and Hedging Activities
The Company uses derivatives to manage certain risks in accordance with its overall risk management policies.
Foreign Exchange Risk
From time to time the Company economically hedges portions of its forecasted expenditures denominated in foreign currencies with foreign currency forward contracts. As at
December 31, 2018
, the Company was not committed to any foreign currency forward contracts.
The Company enters into cross currency swaps and pursuant to these swaps the Company receives the principal amount in NOK on the maturity date of the swap, in exchange for payment of a fixed U.S. Dollar amount. In addition, the cross currency swaps exchange a receipt of floating interest in NOK based on NIBOR plus a margin for a payment of U.S. Dollar fixed interest. The purpose of the cross currency swaps is to economically hedge the foreign currency exposure on the payment of interest and principal at maturity of Teekay LNG's NOK-denominated bonds due in 2020, 2021 and 2023. In addition, the cross currency swaps economically hedge the interest rate exposure on the NOK bonds due in 2020, 2021 and 2023. The Company has not designated, for accounting purposes, these cross currency swaps as cash flow hedges of its NOK-denominated bonds due in 2020, 2021 and 2023. As at
December 31, 2018
, Teekay LNG was committed to the following cross currency swaps:
|
Notional Amount NOK
|
Notional Amount USD
|
|
|
|
Fair Value / Carrying Amount of (Liability) / Asset
|
Remaining
Term (years) |
||||||||||
|
Floating Rate Receivable
|
|
|||||||||||||||
|
Reference Rate
|
Margin
|
Fixed Rate Payable
|
||||||||||||||
|
1,000,000
|
134,000
|
|
NIBOR
|
3.70
|
%
|
5.92
|
%
|
(18,315
|
)
|
1.4
|
||||||
|
1,200,000
|
146,500
|
|
NIBOR
|
6.00
|
%
|
7.72
|
%
|
(4,727
|
)
|
2.8
|
||||||
|
850,000
|
102,000
|
|
NIBOR
|
4.60
|
%
|
7.89
|
%
|
(6,080
|
)
|
4.7
|
||||||
|
(29,122
|
)
|
|||||||||||||||
Interest Rate Risk
The Company enters into interest rate swap agreements, which exchange a receipt of floating interest for a payment of fixed interest, to reduce the Company’s exposure to interest rate variability on its outstanding floating-rate debt. The Company designates certain of its interest rate swap agreements as cash flow hedges for accounting purposes.
As at
December 31, 2018
, the Company was committed to the following interest rate swap agreements related to its LIBOR-based debt and EURIBOR-based debt, whereby certain of the Company’s floating-rate debt obligations were swapped with fixed-rate obligations:
F -
39
TEEKAY CORPORATION AND SUBSIDIARIES
NOTES TO THE CONSOLIDATED FINANCIAL STATEMENTS
(all tabular amounts stated in thousands of U.S. dollars, other than share data and unless otherwise indicated)
|
Interest
Rate Index |
Principal
Amount $ |
Fair Value /
Carrying Amount of Asset / (Liability) $ |
Weighted-
Average Remaining Term (years) |
Fixed
Interest Rate (%) (1) |
|||||||
|
LIBOR-Based Debt:
|
|||||||||||
|
U.S. Dollar-denominated interest rate swaps
(2)
|
LIBOR
|
1,162,476
|
|
(22,443
|
)
|
3.7
|
2.9
|
||||
|
EURIBOR-Based Debt:
|
|||||||||||
|
Euro-denominated interest rate swaps
|
EURIBOR
|
86,477
|
|
(11,092
|
)
|
4.7
|
3.8
|
||||
|
(33,535
|
)
|
||||||||||
|
(1)
|
Excludes the margins the Company pays on its variable-rate debt, which, as of
December 31, 2018
, ranged from
0.3%
to
3.95%
.
|
|
(2)
|
Includes interest rate swaps with the notional amount reducing quarterly or semi-annually.
Two
interest rate swaps are subject to mandatory early termination in 2020 and 2021, at which time the swaps will be settled based on their fair value.
|
Stock Purchase Warrants
As at
December 31, 2018
, Teekay held
15.5 million
Brookfield Transaction Warrants (see Notes
4
and
11
). The fair value of the Brookfield Transaction Warrants was
$11.8 million
as at
December 31, 2018
.
As of
December 31, 2018
, Teekay held
1,755,000
Series D Warrants (see Notes
4
and
11
). The fair value of the Series D Warrants was
$0.2 million
as at
December 31, 2018
.
Upon completion of the TIL merger, TIL stock purchase warrants previously held by the Company were cancelled. As a result, no value is recorded for these warrants on the Company's consolidated balance sheet as at
December 31, 2018
(see
Note 11
).
Tabular Disclosure
The following table presents the location and fair value amounts of derivative instruments, segregated by type of contract, on the Company’s consolidated balance sheets.
|
Prepaid Expenses and Other
|
Other Non-Current Assets
|
Accrued Liabilities and Other
|
Current
Portion of Derivative Liabilities |
Derivative
Liabilities |
||||||||||
|
As at December 31, 2018
|
||||||||||||||
|
Derivatives designated as a cash flow hedge:
|
||||||||||||||
|
Interest rate swap agreements
|
784
|
|
2,362
|
|
20
|
|
—
|
|
—
|
|
||||
|
Derivatives not designated as a cash flow hedge:
|
|
|
|
|
|
|||||||||
|
Foreign currency contracts
|
—
|
|
—
|
|
—
|
|
—
|
|
—
|
|
||||
|
Interest rate swap agreements
|
2,915
|
|
2,973
|
|
(2,498
|
)
|
(7,419
|
)
|
(32,672
|
)
|
||||
|
Cross currency swap agreements
|
—
|
|
—
|
|
(713
|
)
|
(4,729
|
)
|
(23,680
|
)
|
||||
|
Stock purchase warrants
|
—
|
|
12,026
|
|
—
|
|
—
|
|
—
|
|
||||
|
Forward freight agreements
|
—
|
|
—
|
|
—
|
|
(57
|
)
|
—
|
|
||||
|
3,699
|
|
17,361
|
|
(3,191
|
)
|
(12,205
|
)
|
(56,352
|
)
|
|||||
|
As at December 31, 2017
|
||||||||||||||
|
|
||||||||||||||
|
Derivatives designated as a cash flow hedge:
|
||||||||||||||
|
Interest rate swap agreements
|
—
|
|
1,037
|
|
(18
|
)
|
(751
|
)
|
(7
|
)
|
||||
|
Derivatives not designated as a cash flow hedge:
|
||||||||||||||
|
Foreign currency contracts
|
96
|
|
—
|
|
—
|
|
(15
|
)
|
—
|
|
||||
|
Interest rate swap agreements
|
1,124
|
|
4,319
|
|
(4,836
|
)
|
(35,134
|
)
|
(38,213
|
)
|
||||
|
Cross currency swap agreements
|
—
|
|
5,042
|
|
(810
|
)
|
(44,523
|
)
|
(10,168
|
)
|
||||
|
Stock purchase warrants
|
—
|
|
30,749
|
|
—
|
|
—
|
|
—
|
|
||||
|
1,220
|
|
41,147
|
|
(5,664
|
)
|
(80,423
|
)
|
(48,388
|
)
|
|||||
F -
40
TEEKAY CORPORATION AND SUBSIDIARIES
NOTES TO THE CONSOLIDATED FINANCIAL STATEMENTS
(all tabular amounts stated in thousands of U.S. dollars, other than share data and unless otherwise indicated)
As at
December 31, 2018
, the Company had multiple interest rate swaps and cross currency swaps with the same counterparty that are subject to the same master agreements. Each of these master agreements provides for the net settlement of all derivatives subject to that master agreement through a single payment in the event of default or termination of any one derivative. The fair value of these derivatives is presented on a gross basis in the Company’s consolidated balance sheets. As at
December 31, 2018
, these derivatives had an aggregate fair value asset amount of
$9.5 million
(
December 31, 2017
–
$9.8 million
) and an aggregate fair value liability amount of
$55.8 million
(
December 31, 2017
–
$86.1 million
). As at
December 31, 2018
, the Company had
$6.8 million
on deposit with the relevant counterparties as security for swap liabilities under certain master agreements (
December 31, 2017
–
$22.3 million
). The deposit is presented in restricted cash
–
current and long-term on the consolidated balance sheets.
During 2017
, as part of the Brookfield Transaction (see
Note 4
), Teekay was released from all of its previous guarantees relating to Teekay Offshore's interest rate swap and cross currency swap agreements.
For the periods indicated, the following table presents the effective portion of gains (losses) on consolidated interest rate swap agreements designated and qualifying as cash flow hedges:
|
Year Ended December 31, 2018
|
|||||||||
|
Effective Portion
|
Effective Portion
|
Ineffective
|
|||||||
|
Recognized in AOCI
(1)
|
Reclassified from AOCI
(2)
|
Portion
(3)
|
|
||||||
|
$
|
$
|
$
|
|||||||
|
2,128
|
|
(152
|
)
|
740
|
|
Interest expense
|
|||
|
Year Ended December 31, 2017
|
|||||||||
|
Effective Portion
|
Effective Portion
|
Ineffective
|
|||||||
|
Recognized in AOCI (1)
|
Reclassified from AOCI (2)
|
Portion (3)
|
|
||||||
|
$
|
$
|
$
|
|||||||
|
(31
|
)
|
(1,614
|
)
|
(746
|
)
|
Interest expense
|
|||
(1) Recognized in accumulated other comprehensive loss (or
AOCI
).
(2) Recorded in AOCI during the term of the hedging relationship and reclassified to earnings.
(3) Recognized in the ineffective portion of gains (losses) on derivative instruments designated and qualifying as cash flow hedges.
Realized and unrealized (losses) and gains from derivative instruments that are not designated for accounting purposes as cash flow hedges, are recognized in earnings and reported in realized and unrealized losses on non-designated derivatives in the
consolidated statements of (loss) income
. The effect of the (losses) and gains on derivatives not designated as hedging instruments in the
consolidated statements of (loss) income
are as follows:
|
Year Ended
December 31, 2018 $ |
Year Ended
December 31, 2017 $ |
Year Ended
December 31, 2016 $ |
||||||
|
Realized (losses) gains relating to:
|
||||||||
|
Interest rate swap agreements
|
(13,898
|
)
|
(53,921
|
)
|
(87,320
|
)
|
||
|
Interest rate swap agreement terminations
|
(13,681
|
)
|
(610
|
)
|
(8,140
|
)
|
||
|
Foreign currency forward contracts
|
—
|
|
667
|
|
(11,186
|
)
|
||
|
Time charter swap agreement
|
—
|
|
1,106
|
|
2,154
|
|
||
|
Forward freight agreements
|
137
|
|
270
|
|
—
|
|
||
|
(27,442
|
)
|
(52,488
|
)
|
(104,492
|
)
|
|||
|
Unrealized gains (losses) relating to:
|
||||||||
|
Interest rate swap agreements
|
33,700
|
|
17,005
|
|
62,446
|
|
||
|
Foreign currency forward contracts
|
—
|
|
3,925
|
|
15,833
|
|
||
|
Stock purchase warrants
|
(21,053
|
)
|
(6,421
|
)
|
(9,753
|
)
|
||
|
Time-charter swap agreement
|
—
|
|
(875
|
)
|
875
|
|
||
|
Forward Freight Agreements
|
(57
|
)
|
—
|
|
—
|
|
||
|
12,590
|
|
13,634
|
|
69,401
|
|
|||
|
Total realized and unrealized losses on derivative instruments
|
(14,852
|
)
|
(38,854
|
)
|
(35,091
|
)
|
||
F -
41
TEEKAY CORPORATION AND SUBSIDIARIES
NOTES TO THE CONSOLIDATED FINANCIAL STATEMENTS
(all tabular amounts stated in thousands of U.S. dollars, other than share data and unless otherwise indicated)
Realized and unrealized losses of the cross currency swaps are recognized in earnings and reported in
foreign exchange gain (loss)
in the
consolidated statements of (loss) income
. The effect of the gains (losses) on cross currency swaps on the
consolidated statements of (loss) income
is as follows:
|
|
Year Ended December 31,
|
|||||||
|
|
2018
$ |
2017
$ |
2016
$ |
|||||
|
Realized losses on maturity and/or partial termination of cross currency swap
|
(42,271
|
)
|
(25,733
|
)
|
(41,707
|
)
|
||
|
Realized losses
|
(6,533
|
)
|
(18,494
|
)
|
(38,564
|
)
|
||
|
Unrealized gains
|
21,240
|
|
82,668
|
|
75,033
|
|
||
|
Total realized and unrealized (losses) gains on cross currency swaps
|
(27,564
|
)
|
38,441
|
|
(5,238
|
)
|
||
The Company is exposed to credit loss to the extent the fair value represents an asset in the event of non-performance by the counterparties to the foreign currency forward contracts, and cross currency and interest rate swap agreements; however, the Company does not anticipate non-performance by any of the counterparties. In order to minimize counterparty risk, the Company only enters into derivative transactions with counterparties that are rated A- or better by Standard & Poor’s or A3 or better by Moody’s at the time of the transaction. In addition, to the extent possible and practical, interest rate swaps are entered into with different counterparties to reduce concentration risk.
16. Commitments and Contingencies
a)
Vessels under Construction
As at
December 31, 2018
, the Company was committed to the construction of
one
100%
-owned LNG carrier for a total cost of approximately
$207.4 million
, including capitalized interest and other miscellaneous construction costs. As at
December 31, 2018
, payments made towards these commitments totaled
$86.9 million
and the remaining payments required to be made under this newbuilding and conversion capital commitments were
$120.4 million
(
2019
).
In January 2019, Teekay LNG secured
$159 million
of financing through a sale-leaseback agreement for this LNG carrier newbuilding. The vessel delivered on January 31, 2019.
Vessels in which the Company holds an interest through non-consolidated joint ventures are excluded from the above amounts and are described in
Note 16
b.
b)
Joint Ventures
Teekay LNG’s share of commitments to fund newbuildings and other construction contract costs of its non-consolidated joint ventures as at
December 31, 2018
are as follows, all of which are due in 2019:
|
$
|
||
|
Yamal LNG Joint Venture
(i)
|
436,100
|
|
|
Pan Union Joint Venture
(ii)
|
29,200
|
|
|
Bahrain LNG Joint Venture
(iii)
|
66,509
|
|
|
531,809
|
|
|
|
(i)
|
Teekay LNG, through the Yamal LNG Joint Venture, has a
50
% ownership interest in
four
172,000
-cubic meter ARC7 LNG carrier newbuildings that have an estimated total fully built-up cost of approximately
$1.4 billion
. As at
December 31, 2018
, Teekay LNG’s proportionate costs incurred under these newbuilding contracts totaled
$255.8 million
. The Yamal LNG Joint Venture had secured debt financing of
$1.1 billion
for the
four
LNG carrier newbuildings, of which
$395.3 million
was undrawn at
December 31, 2018
, related to Teekay LNG's proportionate share of the commitments included in the table above.
|
|
(ii)
|
Through the Pan Union Joint Venture, Teekay LNG has a
20%
ownership interest in
one
LNG carrier newbuilding which delivered in January 2019 (see
Note 23
). The Pan Union Joint Venture had secured financing of
$24.0 million
related to Teekay LNG's proportionate share of the commitments included in the table above and Teekay LNG received
$0.2 million
of reimbursement directly from Shell in 2019.
|
|
(iii)
|
Teekay LNG has a
30%
ownership interest in the Bahrain LNG Joint Venture for the development of an LNG receiving and regasification terminal in Bahrain. The project will include an FSU, which will be modified from one of the Teekay LNG’s existing MEGI LNG carrier newbuildings, an offshore gas receiving facility, and an onshore nitrogen production facility. The terminal will have a capacity of
800 million
standard cubic feet per day and will be owned and operated under a
20
-year agreement commencing mid-2019. The receiving and regasification terminal is expected to have a fully-built up cost of approximately
$903.1 million
. The Bahrain LNG Joint Venture has secured undrawn debt financing of
$195 million
, of which
$58.4 million
relates to Teekay LNG's proportionate share of the commitments included in the table above.
|
F -
42
TEEKAY CORPORATION AND SUBSIDIARIES
NOTES TO THE CONSOLIDATED FINANCIAL STATEMENTS
(all tabular amounts stated in thousands of U.S. dollars, other than share data and unless otherwise indicated)
c)
Liquidity
Management is required to assess if the Company will have sufficient liquidity to continue as a going concern for the one-year period following the issuance of its financial statements. The Company had a consolidated net loss of
$57.7 million
and
$182.1 million
of consolidated cash flows from operating activities during the year ended
December 31, 2018
and ended the year with a working capital
surplus
of
$211.9 million
. This working capital
surplus
includes scheduled maturities in the next 12 months and repayment obligations of approximately
$242.1 million
of outstanding consolidated debt, which were classified as current liabilities as at
December 31, 2018
. In addition to these obligations, Teekay Parent has
$508.6 million
of senior notes due in January 2020.
Based on these factors, over the one-year period following the issuance of their consolidated financial statements, the Company will need to obtain additional sources of financing, in addition to amounts generated from operations, to meet its minimum liquidity requirements under its financial covenants. These anticipated potential sources of financing include: refinancing the senior notes of Teekay Parent; potentially raising capital through equity and/or bond issuances; drawing on revolving debt facilities and sales of existing assets.
The Company is actively pursuing the alternatives described above, which it considers probable of completion based on the Company’s history of being able to complete equity and bond issuances, refinance similar loan facilities and to complete asset sales. The Company is in various stages of completion on these matters.
Based on the Company’s liquidity at the date these consolidated financial statements were issued, the liquidity the Company expects to generate from operations over the following year, and by incorporating the Company’s plans to raise additional liquidity that it considers probable of completion, the Company expects that it will have sufficient liquidity to continue as a going concern for at least the one-year period following the issuance of these consolidated financial statements.
d)
Legal Proceedings and Claims
The Company may, from time to time, be involved in legal proceedings and claims that arise in the ordinary course of business. The Company believes that any adverse outcome of existing claims, individually or in the aggregate, would not have a material effect on its financial position, results of operations or cash flows, when taking into account its insurance coverage and indemnifications from charterers.
e)
Other
The Company enters into indemnification agreements with certain officers and directors. In addition, the Company enters into other indemnification agreements in the ordinary course of business. The maximum potential amount of future payments required under these indemnification agreements is unlimited. However, the Company maintains what it believes is appropriate liability insurance that reduces its exposure and enables the Company to recover future amounts paid up to the maximum amount of the insurance coverage, less any deductible amounts pursuant to the terms of the respective policies, the amounts of which are not considered material.
17. Supplemental Cash Flow Information
a)
Total cash, cash equivalents and restricted cash are as follows:
|
December 31, 2018
|
December 31, 2017
|
December 31, 2016
|
||||||
|
$
|
$
|
$
|
||||||
|
Cash and cash equivalents
|
424,169
|
|
445,452
|
|
567,994
|
|
||
|
Restricted cash – current
|
40,493
|
|
38,179
|
|
107,672
|
|
||
|
Restricted cash – non-current
|
40,977
|
|
68,543
|
|
129,576
|
|
||
|
505,639
|
|
552,174
|
|
805,242
|
|
|||
The Company maintains
restricted cash deposits relating to certain term loans, leasing arrangements, and project tenders.
b)
The changes in operating assets and liabilities for the years ended
December 31, 2018
,
2017
, and
2016
, are as follows:
|
|
Year Ended December 31,
|
|||||||
|
|
2018
|
2017
|
2016
|
|||||
|
Accounts receivable
|
(25,090
|
)
|
(1,925
|
)
|
96,497
|
|
||
|
Prepaid expenses and other
|
(30,808
|
)
|
3,118
|
|
9,690
|
|
||
|
Accounts payable
|
8,929
|
|
(14,499
|
)
|
(10,705
|
)
|
||
|
Accrued liabilities and other
|
32,215
|
|
118,137
|
|
(44,748
|
)
|
||
|
(14,754
|
)
|
104,831
|
|
50,734
|
|
|||
F -
43
TEEKAY CORPORATION AND SUBSIDIARIES
NOTES TO THE CONSOLIDATED FINANCIAL STATEMENTS
(all tabular amounts stated in thousands of U.S. dollars, other than share data and unless otherwise indicated)
|
c)
|
Cash interest paid, including realized interest rate swap settlements, during the years ended
December 31, 2018
,
2017
, and
2016
, totaled
$242.9 million
,
$319.6 million
and
$341.0 million
, respectively. In addition, during the years ended
December 31, 2018
,
2017
, and
2016
, cash interest paid relating to interest rate swap amendments and terminations totaled
$13.7 million
,
$0.6 million
and
$8.1 million
, respectively
.
|
|
d)
|
As described in
Note 22
, in November 2017, Teekay Tankers acquired the outstanding shares of TIL through issuing
89.0 million
Class A common shares, which was treated as a non-cash transaction in the Company's consolidated statement of cash flows. As a result of this transaction, Teekay Tankers acquired
$37.6 million
in cash and paid
$6.8 million
in professional fees.
|
|
e)
|
In 2018 and 2017, the portion of the distributions paid in kind by Teekay Offshore to the unitholders of Series C-1 Preferred Units and Series D Preferred Units, of $
nil
and
$12.7 million
, respectively, was treated as a non-cash transaction in the consolidated statements of cash flows.
|
18. Write-down and loss on sale of vessels
The Company's write-downs and sales of vessels generally consist of those vessels approaching the end of their useful lives as well as other vessels it strategically sells to reduce exposure to a certain vessel class.
The following table shows the write-downs and net (loss) gain on sale of vessels for the years ended December 31,
2018
,
2017
, and
2016
:
|
Write-down and (Loss) Gain on Sales of Vessels
|
|||||||||||||
|
Year Ended December 31,
|
|||||||||||||
|
Segment
|
Asset Type
|
Completion of Sale Date
|
2018
$ |
2017
$ |
2016
$ |
||||||||
|
Teekay LNG Segment
–
Conventional Tankers
|
Handymax
|
(1)
|
(13,000
|
)
|
—
|
|
—
|
|
|||||
|
Teekay LNG Segment
–
Liquefied Gas Carriers
|
4 Multi-gas Carriers
|
(2)
|
(33,000
|
)
|
—
|
|
—
|
|
|||||
|
Teekay LNG Segment
–
Conventional Tankers
|
2 Suezmaxes
|
Oct/Dec-2018
(3)
|
(7,863
|
)
|
(25,100
|
)
|
—
|
|
|||||
|
Teekay LNG Segment
–
Conventional Tankers
|
2 Suezmaxes
|
(4)
|
—
|
|
(25,500
|
)
|
—
|
|
|||||
|
Teekay LNG Segment
–
Conventional Tankers
|
Suezmax
|
Mar-2017
|
—
|
|
—
|
|
(11,537
|
)
|
|||||
|
Teekay LNG Segment
–
Conventional Tankers
|
2 Suezmaxes
|
Apr/May-2016
|
—
|
|
—
|
|
(27,439
|
)
|
|||||
|
Teekay Tankers Segment
–
Conventional Tankers
|
3 Aframaxes
|
June/Sept/Nov-2017
|
—
|
|
(11,158
|
)
|
—
|
|
|||||
|
Teekay Tankers Segment
–
Conventional Tankers
|
2 Suezmaxes
|
Jan/Mar-2017
|
—
|
|
(1,797
|
)
|
(6,276
|
)
|
|||||
|
Teekay Tankers Segment
–
Conventional Tankers
|
2 MR Tankers
|
Aug/Nov-2016
|
—
|
|
—
|
|
(14,650
|
)
|
|||||
|
Teekay Parent Segment
–
Offshore Segment
|
2 FPSOs
|
(5)
|
—
|
|
(205,659
|
)
|
—
|
|
|||||
|
Teekay Parent Segment
–
Conventional Tankers
|
VLCC
|
Oct-2016
|
—
|
|
—
|
|
(12,495
|
)
|
|||||
|
Teekay Offshore Segment
|
FSO
|
(6)
|
—
|
|
(1,500
|
)
|
—
|
|
|||||
|
Teekay Offshore Segment
|
FSO
|
Oct-2017
|
—
|
|
—
|
|
(983
|
)
|
|||||
|
Teekay Offshore Segment
|
Shuttle Tanker
|
Nov-2016
|
—
|
|
—
|
|
6,817
|
|
|||||
|
Teekay Offshore Segment
|
2 Conventional Tankers
|
Mar-2016
|
—
|
|
—
|
|
65
|
|
|||||
|
Teekay Offshore Segment
|
2 UMS Vessels
|
(7)
|
—
|
|
—
|
|
(43,650
|
)
|
|||||
|
Teekay Offshore Segment
|
Shuttle Tanker
|
Nov-2017
(8)
|
—
|
|
—
|
|
(2,146
|
)
|
|||||
|
Other
|
170
|
|
(29
|
)
|
48
|
|
|||||||
|
Total
|
(53,693
|
)
|
(270,743
|
)
|
(112,246
|
)
|
|||||||
|
(1)
|
In March 2018, the carrying value of the
Alexander Spirit
conventional tanker was written down to its estimated fair value, using an appraised value, as a result of changes in the Company's expectations of the vessel's future opportunities once its current charter contract ends in 2019.
|
|
(2)
|
In June 2018, the carrying value for
four
of Teekay LNG's
seven
wholly-owned multi-gas carriers, the
Napa Spirit
,
Pan Spirit
,
Cathinka Spirit
and
Camilla Spirit
, were written down to their estimated fair value, taking into consideration vessel appraised values, as a result of Teekay LNG's evaluation of alternative strategies for these assets, the current charter rate environment and the outlook for charter rates for these vessels at that time.
|
|
(3)
|
In June and August 2017, the charterer for the
European Spirit
and
African Spirit
Suezmax tankers gave formal notices to Teekay LNG that it will not exercise its one-year extension option under the charter contracts and redelivered the tankers in August 2017 and November 2017, respectively. Upon receiving these notifications, Teekay LNG commenced marketing the vessels for sale. Based on second-hand market comparable values at the time, Teekay LNG wrote down the vessels to their estimated resale values and they were presented as held for sale on the consolidated balance sheets as at December 31, 2017. In the fourth quarter of 2018, Teekay LNG sold the
European Spirit
and
African Spirit
for net proceeds of
$15.7 million
and
$12.8 million
, respectively, using the net proceeds from the sales primarily to repay its existing term loans associated with the vessels.
|
F -
44
TEEKAY CORPORATION AND SUBSIDIARIES
NOTES TO THE CONSOLIDATED FINANCIAL STATEMENTS
(all tabular amounts stated in thousands of U.S. dollars, other than share data and unless otherwise indicated)
|
(4)
|
Under Teekay LNG's charter contracts for the
Teide Spirit
and
Toledo Spirit
Suezmax tankers, the charterer, who is also the owner of the vessels, has the option to cancel the charter contracts
13
years following commencement of the respective charter contracts. In August 2017, the charterer of the
Teide Spirit
gave formal notification to Teekay LNG of its intention to terminate its charter contract subject to certain conditions being met and third-party approvals being received. In February 2018, the charterer sold the
Teide Spirit
to a third party. In May 2018, the charterer of the
Toledo Spirit
gave formal notification to Teekay LNG of its intention to terminate its charter contract subject to certain conditions being met and the receipt of certain third-party approvals. In November 2018, the owner and charterer of the
Toledo Spirit
, reached an agreement to sell the vessel and delivered the vessel to the buyer in January 2019 (see
Note 23
). Teekay LNG wrote down the vessels to their estimated fair values based on their expected future discounted cash flows.
|
|
(5)
|
In September 2017, the estimated future cash flows and carrying value of the asset groups for the
Petrojarl Foinaven
FPSO unit and
Petrojarl Banff
FPSO unit, each owned by Teekay Parent, changed upon the deconsolidation of Teekay Offshore. For the
Petrojarl Foinaven
FPSO,
two
shuttle tankers, which are owned by Teekay Offshore, were removed from the carrying value of the asset group and the estimated future cash flows of the asset group was changed to include the in-charter costs of these
two
vessels to be paid by Teekay Parent to Teekay Offshore. For the
Petrojarl Banff
FPSO, the carrying value of an FSO, which is owned by Teekay Offshore, was removed from the carrying value of the asset group and the estimated future cash flows of the asset group were changed to include the in-charter costs of the FSO unit to be paid by Teekay Parent to Teekay Offshore. This change in asset groups and a re-evaluation of the estimated future net cash flows of the units resulted in a write-down of the carrying values of the units to their estimated fair values, which in aggregate was approximately
$113.0 million
. The impairment charges are included in the Company's Teekay Parent Segment - Offshore Production. The Company has determined the discounted cash flows using the current projected time charter rates and costs, discounted at an estimated market participant rate of
10%
. For both units, the Company has included the existing contracted time charter rates and operating costs as well as projected future use on another field. The projected future use of each of the FPSO units takes into consideration the Company’s estimated upgrade costs and projected time charter rates that could be contracted in future periods. In establishing these estimates, the Company considered recent discussions with potential customers, available information regarding field expansions and historical experience redeploying FPSO units.
|
|
(6)
|
In 2017, the carrying value of the
Falcon Spirit
FSO was written down as a result of a decrease in the estimated residual value of the unit.
|
|
(7)
|
In 2016, Teekay Offshore canceled the UMS construction contracts for its
two
UMS newbuildings. As a result, the carrying values of these
two
UMS newbuildings were written down to $
nil
.
|
|
(8)
|
In 2016, the carrying value of the
Navion Marita
was written down to its estimated fair value, using an appraised value, as a result of fewer opportunities to trade the vessel in the spot conventional tanker market.
|
See
Note 3 — Segment Reporting
for the write-downs and gain (loss) on sales of vessels, by segment for
2018
,
2017
and
2016
.
19. Net Loss Per Share
|
|
Year Ended December 31,
|
|||||||
|
2018
$ |
2017
$ |
2016
$ |
||||||
|
Net loss attributable to shareholders of Teekay Corporation
|
(79,237
|
)
|
(163,276
|
)
|
(123,182
|
)
|
||
|
The Company's portion of the Inducement Premium and Exchange Contribution charged to retained earnings by Teekay Offshore
|
—
|
|
—
|
|
(4,993
|
)
|
||
|
Net loss attributable to shareholders of Teekay Corporation for basic loss per share
|
(79,237
|
)
|
(163,276
|
)
|
(128,175
|
)
|
||
|
Reduction in net earnings due to dilutive impact of stock-based compensation in Teekay LNG, Teekay Offshore and Teekay Tankers and stock purchase warrants in Teekay Offshore
|
—
|
|
(90
|
)
|
(25
|
)
|
||
|
Net loss attributable to shareholders of Teekay Corporation for diluted loss per share
|
(79,237
|
)
|
(163,366
|
)
|
(128,200
|
)
|
||
|
Weighted average number of common shares
|
99,670,176
|
|
86,335,473
|
|
79,211,154
|
|
||
|
Dilutive effect of stock-based compensation
|
—
|
|
—
|
|
—
|
|
||
|
Common stock and common stock equivalents
|
99,670,176
|
|
86,335,473
|
|
79,211,154
|
|
||
|
Loss per common share:
|
||||||||
|
- Basic
|
(0.79
|
)
|
(1.89
|
)
|
(1.62
|
)
|
||
|
- Diluted
|
(0.79
|
)
|
(1.89
|
)
|
(1.62
|
)
|
||
The Company intends to settle the principal of the Convertible Notes in cash on conversion and calculates diluted earnings per share using the treasury-stock method. Stock-based awards and the conversion feature on the Convertible Notes that
have an anti-dilutive effect on the calculation of diluted loss per common share, are excluded from this calculation. For the years ended
December 31, 2018
and
2017
, options to acquire
4.0 million
shares and
3.6 million
shares of Common Stock, respectively, had an anti-dilutive effect on the calculation of diluted earnings per common share. In periods where a loss attributable to shareholders has been incurred all stock-based awards and the conversion feature on the Convertible Notes are anti-dilutive.
20. Restructuring Charges
During
2018
, the Company recorded restructuring charges of
$4.1 million
(
$5.1 million
–
2017
,
$26.8 million
–
2016
).
The restructuring charges in 2018 primarily related to severance costs resulting from reorganization and realignment of resources of certain of the Company's business development, marine solutions and fleet operations functions to better respond to the changing business environment.
F -
45
TEEKAY CORPORATION AND SUBSIDIARIES
NOTES TO THE CONSOLIDATED FINANCIAL STATEMENTS
(all tabular amounts stated in thousands of U.S. dollars, other than share data and unless otherwise indicated)
The restructuring charges in 2017 primarily related to severance costs resulting from the termination of the charter contract for the
Arendal Spirit
UMS in Teekay Offshore and the resulting decommissioning of the unit, reorganization and realignment of resources of certain of the Company's strategic development function to better respond to the changing business environment, and reorganization of the Company's FPSO business to create better alignment with the Company's offshore operations.
The restructuring charges in 2016 primarily related to the closure of
two
offices and seafarers' severance amounts related to the tug business in Western Australia, reorganization of the Company’s FPSO business to create better alignment with the Company’s offshore operations, and reductions to charges previously accrued. The charges related to the seafarers' severance were partly recovered from customers and the recovery is included in revenues on the
consolidated statements of (loss) income
.
At
December 31, 2018
and
2017
,
$0.8 million
and
$1.3 million
, respectively, of restructuring liabilities were recorded in accrued liabilities on the consolidated balance sheets.
21. Income Taxes
Teekay and a majority of its subsidiaries are not subject to income tax in the jurisdictions in which they are incorporated because they do not conduct business or operate in those jurisdictions. However, among others, the Company’s U.K. and Norwegian subsidiaries are subject to income taxes.
The significant components of the Company’s deferred tax assets and liabilities are as follows:
|
December 31,
2018 $ |
December 31,
2017 $ |
||||
|
Deferred tax assets:
|
|||||
|
Vessels and equipment
|
5,868
|
|
5,377
|
|
|
|
Tax losses carried forward and disallowed finance costs
(1)
|
155,910
|
|
193,501
|
|
|
|
Other
|
10,545
|
|
29,355
|
|
|
|
Total deferred tax assets
|
172,323
|
|
228,233
|
|
|
|
Deferred tax liabilities:
|
|||||
|
Vessels and equipment
|
18,037
|
|
9,053
|
|
|
|
Provisions
|
5,588
|
|
5,153
|
|
|
|
Other
|
2,060
|
|
8,417
|
|
|
|
Total deferred tax liabilities
|
25,685
|
|
22,623
|
|
|
|
Net deferred tax assets
|
146,638
|
|
205,610
|
|
|
|
Valuation allowance
|
(144,560
|
)
|
(202,513
|
)
|
|
|
Net deferred tax assets
|
2,078
|
|
3,097
|
|
|
|
(1)
|
Substantially all of the Company’s net operating loss carryforwards of
$826.3 million
relates primarily to its U.K., Spanish, Norwegian and Luxembourg subsidiaries and, to a lesser extent, to its Australian ship-owning subsidiaries. The Company had disallowed finance costs in Spain and Norway of approximately
$23.6 million
and
$15.3 million
, respectively, at December 31, 2018, which are available for
18
years and
10
years, respectively, from the year the costs are incurred for offset against future taxable income in Spain and Norway, respectively. The Company's tax losses in Luxembourg are available for offset against taxable future income in Luxembourg, either indefinitely for losses arising prior to 2017, or for
17
years for losses arising subsequent to 2016.
|
Deferred tax balances are presented in other non-current assets in the accompanying consolidated balance sheets.
The components of the provision for
income tax expense
are as follows:
|
Year Ended
December 31, 2018 $ |
Year Ended
December 31, 2017 $ |
Year Ended
December 31, 2016 $ |
||||||
|
Current
|
(17,458
|
)
|
(11,997
|
)
|
(14,424
|
)
|
||
|
Deferred
|
(2,266
|
)
|
(235
|
)
|
(10,044
|
)
|
||
|
Income tax expense
|
(19,724
|
)
|
(12,232
|
)
|
(24,468
|
)
|
||
The Company operates in countries that have differing tax laws and rates. Consequently, a consolidated weighted average tax rate will vary from year to year according to the source of earnings or losses by country and the change in applicable tax rates. Reconciliations of the tax charge related to the relevant year at the applicable statutory income tax rates and the actual tax charge related to the relevant year are as follows:
F -
46
TEEKAY CORPORATION AND SUBSIDIARIES
NOTES TO THE CONSOLIDATED FINANCIAL STATEMENTS
(all tabular amounts stated in thousands of U.S. dollars, other than share data and unless otherwise indicated)
|
Year Ended
December 31, 2018 $ |
Year Ended
December 31, 2017 $ |
Year Ended
December 31, 2016 $ |
||||||
|
Net (loss) income before taxes
|
(38,023
|
)
|
(516,840
|
)
|
111,132
|
|
||
|
Net (loss) income not subject to taxes
|
(104,465
|
)
|
(297,688
|
)
|
57,862
|
|
||
|
Net income (loss) subject to taxes
|
66,442
|
|
(219,152
|
)
|
53,270
|
|
||
|
At applicable statutory tax rates
|
15,177
|
|
(51,471
|
)
|
5,996
|
|
||
|
Permanent and currency differences, adjustments to valuation allowances and uncertain tax positions
|
4,639
|
|
64,164
|
|
18,198
|
|
||
|
Other
|
(92
|
)
|
(461
|
)
|
274
|
|
||
|
Tax expense related to the year
|
19,724
|
|
12,232
|
|
24,468
|
|
||
The following is a roll-forward of the Company’s unrecognized tax benefits, recorded in other long-term liabilities, from January 1,
2016
to
December 31, 2018
:
|
Year Ended
December 31, 2018 $ |
Year Ended
December 31, 2017 $ |
Year Ended
December 31, 2016 $ |
||||||
|
Balance of unrecognized tax benefits as at January 1
|
31,061
|
|
19,492
|
|
18,390
|
|
||
|
Increases for positions related to the current year
|
9,297
|
|
2,631
|
|
6,422
|
|
||
|
Changes for positions taken in prior years
|
981
|
|
3,475
|
|
(3,729
|
)
|
||
|
Decreases related to statute of limitations
|
(783
|
)
|
(1,562
|
)
|
(1,591
|
)
|
||
|
Increase due to acquisition of TIL
|
—
|
|
8,528
|
|
—
|
|
||
|
Decrease due to deconsolidation of Teekay Offshore
|
—
|
|
(1,503
|
)
|
—
|
|
||
|
Balance of unrecognized tax benefits as at December 31
|
40,556
|
|
31,061
|
|
19,492
|
|
||
The majority of the net increase for positions relates to the potential tax on freight income on an increased number of voyages for the year ended
December 31, 2018
.
The Company does not presently anticipate such uncertain tax positions will significantly increase or decrease in the next 12 months; however, actual developments could differ from those currently expected. The tax years 2008 through
2018
remain open to examination by some of the major jurisdictions in which the Company is subject to tax.
The Company recognizes interest and penalties related to uncertain tax positions in income tax expense. The interest and penalties on unrecognized tax benefits are included in the roll-forward schedule above and, are approximately
an increase
of
$9.2 million
in
2018
, and
an increase
of
$6.4 million
in
2017
and
an increase
of
$1.0 million
in
2016
.
22. Equity-accounted Investments
On September 25, 2017, Teekay, Teekay Offshore and Brookfield finalized the Brookfield Transaction (see
Note 4
). As a result, Teekay has included the results of Teekay Offshore as an equity-accounted investment in its financial results as at
December 31, 2018
and
December 31, 2017
, and for year ended
December 31, 2018
and for the period from September 25, 2017 to December 31, 2017. At September 25, 2017, when the Company initially recorded its equity investment in Teekay Offshore, the difference between the Company's investment and the carrying value of Teekay Offshore's net assets was substantially attributable to basis differences between the fair value and carrying amounts of the vessels.
A
s at
December 31, 2018
, the excess of the carrying value of the Company's investment over the carrying value of Teekay Offshore's net assets was
$10.7 million
(
December 31, 2017
–
$3.8 million
).
As at
December 31, 2018
, the aggregate fair value of the Company’s
13.8%
interest in the common units of Teekay Offshore
(
13.8%
interest
–
December 31, 2017
), based on the quoted market price of Teekay Offshore's common stock on the New York Stock Exchange, was
$68.5 million
(
$133.5 million
–
December 31, 2017
) and its carrying value was
$134.4 million
(
$143.3 million
–
December 31, 2017
). T
he aggregate fair value of the Company’s
13.8%
interest in the common units of Teekay Offshore b
ased on the quoted market price of Teekay Offshore's common stock on the New York Stock Exchange was
$67.9 million
on March 29, 2019.
F -
47
TEEKAY CORPORATION AND SUBSIDIARIES
NOTES TO THE CONSOLIDATED FINANCIAL STATEMENTS
(all tabular amounts stated in thousands of U.S. dollars, other than share data and unless otherwise indicated)
The equity investees of Teekay LNG include the following:
|
•
|
In December 2015, Teekay LNG entered into an agreement with National Oil & Gas Authority (or
Nogaholding
), Samsung C&T (or
Samsung
) and Gulf Investment Corporation (or
GIC
) to form a joint venture, Bahrain LNG W.L.L. (or the
Bahrain LNG Joint Venture
), for the development of an LNG receiving and regasification terminal in Bahrain. The Bahrain LNG Joint Venture is a joint venture between Nogaholding (
30%
), Teekay LNG (
30%
), Samsung (
16%
) and GIC (
24%
). The project is expected to include an offshore LNG receiving jetty and breakwater, an adjacent regasification platform, subsea gas pipelines from the platform to shore, an onshore gas receiving facility, and an onshore nitrogen production facility with a total LNG terminal capacity of
800 million
standard cubic feet per day and will be owned and operated under a
20
-year agreement, which is expected to commence in mid-2019. In addition, Teekay LNG has supplied an FSU in connection with this project in September 2018 through a
21
-year time-charter contract with the Bahrain LNG Joint Venture.
|
As at
December 31, 2018
, Teekay LNG had advanced
$79.1 million
(
December 31, 2017
–
$79.1 million
) to the Bahrain LNG Joint Venture. These advances bear interest at LIBOR plus
1.25%
and as at
December 31, 2018
, the interest receivable on these advances was
$nil
(
December 31, 2017
–
$0.1 million
).
|
•
|
A
50
/
50
joint venture agreement with China LNG Shipping (Holdings) Limited (or the
Yamal LNG Joint Venture
) and the joint venture had ordered
six
internationally-flagged icebreaker LNG carriers for a project located on the Yamal Peninsula in Northern Russia (or the
Yamal LNG Project
) of which
two
LNG carrier newbuildings were delivered during 2018.
I
n December 2017, the Yamal LNG Joint Venture secured a
$1.6 billion
long-term debt facility to finance all
six
of its ARC7 LNG carrier newbuildings. As part of the completed financing, the Yamal LNG Joint Venture returned a total of
$104 million
of capital back to the joint venture partners in December 2017, of which Teekay LNG's share was
$52 million
. Teekay LNG has guaranteed its
50%
share of a secured loan facility in the Yamal LNG Joint Venture and, as a result, has recorded a guarantee liability. The carrying value of the guarantee liability as at
December 31, 2018
was
$0.6 million
(
December 31, 2017
–
$0.6 million
) and is included as part of other long-term liabilities in the consolidated balance sheets.
|
|
•
|
In June 2014, Teekay LNG acquired from Shell its ownership interests in
four
LNG carrier newbuildings. As compensation for Shell’s ownership interests in these
four
LNG carrier newbuildings, Teekay LNG assumed Shell’s obligation to provide the shipbuilding supervision and crew training services for the
four
LNG carrier newbuildings up to their delivery date pursuant to a ship construction support agreement. Teekay LNG initially estimated it would incur approximately
$36.9 million
of costs to provide these services, of which Shell has agreed to pay a fixed amount of
$20.3 million
. Teekay LNG estimated that the fair value of the service obligation was
$33.3 million
and the fair value of the amount due from Shell was
$16.5 million
.
As at
December 31, 2018
, the carrying value of the service obligation of
$nil
(
December 31, 2017
–
$8.2 million
) is included in o
ther long-term liabilities
and the carrying value of the receivable from Shell of
$0.2 million
(
December 31, 2017
–
$3.5 million
) is included in accounts receivable in the Company’s consolidated balance sheets.
|
As at
December 31, 2018
, Teekay LNG has a
30%
ownership interest in
two
LNG carriers, the
Pan Asia
and the
Pan Americas
, and a
20%
ownership interest in
one
LNG carrier newbuilding, the
Pan Europe
(or collectively, the
Pan Union Joint Venture
). The
Pan Africa
was delivered in January 2019 and concurrently commenced its
20
-year charter contract with Shell.
On initial acquisition, the basis difference between Teekay LNG's investment and the carrying value of the Pan Union Joint Venture's net assets was substantially attributed to ship construction support agreements and the time-charter contracts. A
s at
December 31, 2018
,
the unamortized amount of the basis difference was
$11.0 million
(
December 31, 2017
–
$11.4 million
).
|
•
|
A
50
/
50
joint venture agreement with Exmar NV (or
Exmar)
(or the
Exmar LPG Joint Venture
). Teekay LNG has guaranteed its
50%
share of a secured loan facility and
four
capital leases in the Exmar LPG Joint Venture and, as a result, has recorded a guarantee liability. The carrying value of the guarantee liability as at
December 31, 2018
was
$1.3 million
(
December 31, 2017
–
$1.6 million
) and is included as part of other long-term liabilities in the consolidated balance sheets.
|
As at
December 31, 2018
, the Teekay LNG had advanced
$52.3 million
(
December 31, 2017
–
$52.3 million
) to the Exmar LPG Joint Venture, which bears interest at LIBOR plus
0.50%
and has no fixed repayment terms. As at
December 31, 2018
, the interest receivable on these advances was $
nil
(
December 31, 2017
–
$0.2 million
). These amounts are included in the table below.
On initial acquisition, the basis difference between Teekay LNG's investment and the carrying value of the Exmar LPG Joint Venture's net assets was substantially attributed to the value of the vessels and charter agreements of the Exmar LPG Joint Venture and goodwill in accordance with the finalized purchase price allocation. At
December 31, 2018
, the unamortized amount of the basis difference was
$24.9 million
(
December 31, 2017
–
$25.5 million
).
|
•
|
A
50
/
50
joint venture with Exmar (or the
Excalibur Joint Venture
). On January 31, 2018, Teekay LNG sold its other
50
/
50
joint venture with Exmar relating to the Excelsior LNG carrier (or the
Excelsior Joint Venture
) for gross proceeds of approximately
$54 million
. As a result of the sale, Teekay LNG recorded a gain of
$5.6 million
for the year ended December 31, 2018, which is included in
equity income (loss)
in the
consolidated statements of (loss) income
. Teekay LNG has guaranteed its
50%
share of the secured loan facility of the Excalibur Joint Venture and, as a result, has recorded a guarantee liability. The carrying value of the guarantee liability as of
December 31, 2018
was
nominal
(
December 31, 2017
–
$0.2 million
) and is included as part of other long-term liabilities in the consolidated balance sheets.
|
On initial acquisition, the basis difference between Teekay LNG's investment and the carrying value of the Excalibur Joint Venture's net assets was substantially attributed to an increase to the carrying value of the vessel of the Excalibur Joint Venture in accordance with the finalized purchase price allocation. At
December 31, 2018
, the unamortized amount of the basis difference was
$13.0 million
(
December 31, 2017
–
$13.4 million
).
F -
48
TEEKAY CORPORATION AND SUBSIDIARIES
NOTES TO THE CONSOLIDATED FINANCIAL STATEMENTS
(all tabular amounts stated in thousands of U.S. dollars, other than share data and unless otherwise indicated)
|
•
|
A
52%
ownership interest in the joint venture between Marubeni Corporation and Teekay LNG (or the
Teekay LNG-Marubeni Joint Venture
).
In December 2018, the Teekay LNG-Marubeni Joint Venture completed the refinancing one of its debt facilities maturing in 2019 by entering into a new
$306.5 million
U.S. Dollar-denominated term loan maturing in December 2023. Teekay LNG has guaranteed its
52%
share of the secured loan facilities of the Teekay LNG-Marubeni Joint Venture and, as a result, has recorded a guarantee liability. The carrying value of the guarantee liability as at
December 31, 2018
was
$0.4 million
(
December 31, 2017
–
$0.5 million
) and is included as part of other long-term liabilities in the consolidated balance sheets.
|
|
•
|
A
33%
ownership interest in the Angola Joint Venture that owns
four
newbuilding
160,400
-cubic meter LNG carriers (or the
Angola LNG Carriers
).
The other partners of the Angola Joint Venture are NYK Energy Transport (or
NYK
) (
33%
) and Mitsui & Co. Ltd. (
34%
).
|
Teekay LNG has guaranteed its
33%
share of the secured loan facilities and interest rate swaps of the Angola Joint Venture and, as a result, has recorded a guarantee liability. The carrying value of the guarantee liability as at
December 31, 2018
was
$0.6 million
(
December 31, 2017
–
$0.7 million
) and is included as part of other long-term liabilities in the consolidated balance sheets.
|
•
|
A
40%
ownership interest in Teekay Nakilat (III) Corporation (or the
RasGas 3 Joint Venture
), and the remaining
60%
is held by Qatar Gas Transport Company Ltd. (Nakilat). between Teekay LNG and QGTC Nakilat (1643-6) Holdings Corporation.
|
In January 2014, Teekay and Teekay Tankers formed TIL, which sought to opportunistically acquire, operate and sell modern second-hand tankers to benefit from an expected recovery in the current cyclical low of the tanker market. Teekay and Teekay Tankers in the aggregate purchased
5.0 million
shares of common stock, representing an initial
20%
interest in TIL, as part of a
$250 million
private placement by TIL, which represented a total investment by Teekay and Teekay Tankers of
$50.0 million
. In October 2014, Teekay Tankers acquired an additional
0.9 million
common shares in TIL, representing
2.43%
of the then outstanding share capital of TIL.
On May 31, 2017, Teekay Tankers entered into a merger agreement (or the
Merger Agreement
) to acquire the remaining
27.0 million
issued and outstanding common shares of TIL, by way of a share-for-share exchange of
3.3
shares of Teekay Tankers Class A common stock for each outstanding share of TIL common stock (or the
TIL merger
). During the year ended December 31, 2017, the Company recognized a loss of
$46.2 million
on remeasuring its investment in TIL to fair value.
On completion of the TIL merger, TIL became a wholly-owned subsidiary of Teekay Tankers. As consideration for the merger, Teekay Tankers issued
88,977,544
Class A common shares (including
8,250,000
Class A common shares to Teekay) to the TIL shareholders (other than Teekay Tankers) for
$151.3 million
, or
$1.70
per share. The merger with TIL was accounted for as an acquisition of assets. The purchase price was determined based on the value of Teekay Tankers shares issued on the merger date and transaction costs associated with the merger, which amounted to
$6.9 million
. Together with the fair value of the Company's
19.5%
ownership in TIL (
11.3%
of which was held through Teekay Tankers)
and the total number of Class A common shares issued at the close of the merger, the total acquisition cost was
$177.4 million
. The assets acquired and liabilities assumed were recognized at their fair values on November 27, 2017, with the difference between the purchase price and the net fair value of the net assets acquired allocated on a relative fair value basis to the vessels acquired. Net working capital and long-term debt assumed were recognized at their fair values on November 27, 2017, of
$47.1 million
and
$337.1 million
, respectively. The remaining amount of the asset acquisition purchase price was allocated to vessels (
$467.2 million
) and existing time-charter contracts (
$0.2 million
), on a relative fair value basis.
Teekay Tankers also owns a
50%
interest in a joint venture arrangement between Teekay Tankers and Wah Kwong Maritime Transport Holdings Limited (or
Wah Kwong Joint Venture
) which owns a single VLCC tanker. The vessel is currently trading on spot voyage charters in an RSA managed by a third party.
In November 2011, Teekay acquired a
40%
interest in a recapitalized
Magnora ASA (or
Magnora
, previously Sevan Marine ASA)
for approximately
$25 million
and as at December 31, 2017, the Company had a
43.5%
interest in Magnora. In November 2018, Teekay sold its ownership interest in Magnora for approximately
$27 million
and recognized a gain of
$15.3 million
, which is presented in equity income on the
consolidated statements of (loss) income
.
F -
49
TEEKAY CORPORATION AND SUBSIDIARIES
NOTES TO THE CONSOLIDATED FINANCIAL STATEMENTS
(all tabular amounts stated in thousands of U.S. dollars, other than share data and unless otherwise indicated)
A condensed summary of the Company’s investments in equity-accounted investees by segment, which includes loans and net advances to equity-accounted investees, is as follows (in thousands of U.S. dollars, except percentages):
|
|
As at December 31,
|
||||||
|
Investments in Equity-accounted Investees
(1)
|
Ownership Percentage
|
2018
$ |
2017
$ |
||||
|
Teekay LNG
–
Liquefied Gas
|
|||||||
|
Bahrain LNG Joint Venture
|
30%
|
81,709
|
|
77,786
|
|
||
|
Yamal LNG Joint Venture
|
50%
|
210,290
|
|
194,715
|
|
||
|
Pan Union Joint Venture
|
20%-30%
|
71,040
|
|
38,298
|
|
||
|
Exmar LNG Joint Venture
|
49%
|
32,419
|
|
79,915
|
|
||
|
Exmar LPG Joint Venture
|
50%
|
151,186
|
|
157,926
|
|
||
|
Teekay LNG - Marubeni Joint Venture
|
52%
|
342,280
|
|
335,897
|
|
||
|
Angola LNG Carriers
|
33%
|
79,606
|
|
73,316
|
|
||
|
RasGas3 Joint Venture
|
40%
|
132,256
|
|
123,034
|
|
||
|
Teekay Tankers
–
Conventional Tankers
|
|||||||
|
Wah Kwong Joint Venture
|
50%
|
25,766
|
|
24,546
|
|
||
|
Teekay Parent
–
Offshore Production
|
|||||||
|
Magnora
(2)
|
44%
|
—
|
|
15,589
|
|
||
|
Teekay Parent – Other
|
|||||||
|
Teekay Offshore
(3)
(
note 4
)
|
14%
|
157,924
|
|
208,871
|
|
||
|
TOO GP
(3)
(note 4)
|
49%
|
3,968
|
|
4,061
|
|
||
|
Other
|
50%
|
—
|
|
1,169
|
|
||
|
1,288,444
|
|
1,335,123
|
|
||||
|
(1)
|
Investments in equity-accounted investees is presented in current portion of loans to equity-accounted investments, investments in and loans to equity-accounted investments and loans from equity-accounted investments in the Company’s consolidated balance sheets.
|
|
(2)
|
Teekay sold its ownership interest in Magnora in November 2018.
|
|
(3)
|
The results included for Teekay Offshore are from the date of deconsolidation on September 25, 2017.
|
A condensed summary of the Company’s financial information for equity-accounted investments (
14%
to
52%
-owned) shown on a
100%
basis are as follows:
|
|
As at December 31,
|
||||
|
|
2018
|
2017
|
|||
|
Cash and restricted cash
|
568,843
|
|
555,566
|
|
|
|
Other assets – current
|
412,388
|
|
370,790
|
|
|
|
Vessels and equipment, including vessels related to capital leases and advances on newbuilding contracts
|
6,615,077
|
|
8,056,504
|
|
|
|
Net investment in direct financing leases
|
3,000,927
|
|
1,973,307
|
|
|
|
Other assets
–
non-current
|
1,957,271
|
|
500,108
|
|
|
|
Current portion of long-term debt and obligations related to capital leases
|
1,106,812
|
|
764,098
|
|
|
|
Other liabilities
–
current
|
563,862
|
|
593,968
|
|
|
|
Long-term debt and obligations related to capital leases
|
6,882,426
|
|
5,957,406
|
|
|
|
Other liabilities
–
non-current
|
478,311
|
|
751,416
|
|
|
|
Year Ended December 31,
|
||||||||
|
2018
|
2017
|
2016
|
||||||
|
Revenues
|
2,052,084
|
|
980,078
|
|
882,650
|
|
||
|
Income from vessel operations
|
406,125
|
|
258,006
|
|
365,472
|
|
||
|
Realized and unrealized gain (loss) on non-designated derivative instruments
|
21,664
|
|
(17,438
|
)
|
(10,900
|
)
|
||
|
Net (loss) income
|
(3,747
|
)
|
38,646
|
|
239,766
|
|
||
The results included for TIL are until its consolidation on November 27, 2017. The results included for Teekay Offshore are from the date of deconsolidation on September 25, 2017.
F -
50
TEEKAY CORPORATION AND SUBSIDIARIES
NOTES TO THE CONSOLIDATED FINANCIAL STATEMENTS
(all tabular amounts stated in thousands of U.S. dollars, other than share data and unless otherwise indicated)
For the year ended
December 31, 2018
, the Company recorded
equity income
of
$61.1 million
(
2017
– loss of
$37.3 million
, and
2016
– income of
$85.6 million
). The
equity income
in 2018 was primarily comprised of the Company’s share of net income from the Angola LNG Carriers, Magnora, the RasGas3 Joint Venture, the Pan Union Joint Venture, the Bahrain LNG Joint Venture, the Yamal LNG Joint Venture and the Exmar LNG Joint Venture; offset by equity losses in Teekay Offshore and the Exmar LPG Joint Venture. For the year ended
December 31, 2018
,
equity income
included
$17.6 million
related to the Company’s share of unrealized gains on interest rate swaps in the equity-accounted investees (
2017
–
$7.7 million
and
2016
–
$8.7 million
).
23. Subsequent Events
|
a)
|
During the first quarter of 2019, the Company repurchased
$10.9 million
in aggregate principal amount of the
8.5%
Notes.
|
|
b)
|
In January 2019, Teekay LNG's Pan Union Joint Venture took delivery of its fourth LNG carrier newbuilding, the
Pan Africa
, in which Teekay LNG has a
20%
ownership interest. The vessel concurrently commenced its
20
-year charter contract with Shell.
|
|
c)
|
In January 2019, Teekay LNG's
Toledo Spirit
Suezmax tanker was delivered to the owner of the vessel. Upon delivery, the charterer, who is also the owner of the vessel, terminated its charter contract with Teekay LNG and sold the vessel to a third-party.
|
|
d)
|
In January 2019, Teekay LNG's
Yamal Spirit
LNG carrier newbuilding was delivered
and concurrently commenced its
15
-year charter time-contract with Yamal Trade Pte. Ltd
.
Upon delivery
of the vessel, Teekay LNG sold and leased back the vessel under a sale-leaseback financing transaction, which Teekay LNG secured in January 2019 prior to the delivery of the
Yamal Spirit
.
|
|
e)
|
In January 2019, Teekay LNG repurchased
0.8 million
of its common units for
$9.3 million
.
|
|
f)
|
In February 2019, Teekay LNG entered into a commercial management agreement (or
CMA
) with a third-party commercial manager (or the
Manager
) whereby the Manager agreed to commercially manage and employ Teekay LNG's
seven
multi-gas vessels, with such transition to occur over a period between February 2019 and April 2019. Teekay LNG has the ability to withdraw its vessels from the Manager at any time subject to the requirements provided in the CMA.
|
|
g)
|
In February 2019, Teekay Tankers signed a term sheet for a sale-leaseback transaction relating to
two
of its Suezmax tankers. Proceeds from the sale-leaseback transaction will be used to prepay a portion of one of the Teekay Tankers' loan facilities and
is expected to increase Teekay Tankers’ liquidity by approximately
$25 million
. The transaction is expected to be completed in the second quarter of 2019
.
|
F -
51
TEEKAY CORPORATION
SCHEDULE I
CONDENSED NON-CONSOLIDATED FINANCIAL INFORMATION OF REGISTRANT
CONDENSED BALANCE SHEETS (NOTE 1)
(in thousands of U.S. dollars)
|
|
|
As at
December 31, 2018 $ |
As at
December 31, 2017 $ |
|||
|
ASSETS
|
|
|||||
|
Current
|
|
|||||
|
Cash and cash equivalents
|
|
81,681
|
|
22,050
|
|
|
|
Accounts receivable
|
|
202
|
|
699
|
|
|
|
Prepaid expenses and other
|
12
|
|
175
|
|
||
|
Due from affiliates
|
676,087
|
|
736,938
|
|
||
|
Total current assets
|
|
757,982
|
|
759,862
|
|
|
|
Investments in subsidiaries
(note 1)
|
|
488,547
|
|
1,117,291
|
|
|
|
Other assets
|
|
329
|
|
297
|
|
|
|
Total assets
|
|
1,246,858
|
|
1,877,450
|
|
|
|
LIABILITIES AND EQUITY
|
|
|||||
|
Current
|
|
|||||
|
Accounts payable
|
|
1,339
|
|
1,660
|
|
|
|
Accrued liabilities
|
|
24,641
|
|
24,972
|
|
|
|
Due to affiliates
|
203,585
|
|
254,983
|
|
||
|
Other current liabilities
|
|
584
|
|
2,239
|
|
|
|
Total current liabilities
|
|
230,149
|
|
283,854
|
|
|
|
Long-term debt
(note 2)
|
|
614,341
|
|
586,982
|
|
|
|
Other long-term liabilities
|
|
7,911
|
|
10,783
|
|
|
|
Total liabilities
|
|
852,401
|
|
881,619
|
|
|
|
Equity
|
|
|||||
|
Common stock and additional paid-in capital
|
|
1,045,659
|
|
919,078
|
|
|
|
(Accumulated deficit) retained earnings
|
|
(651,202
|
)
|
76,753
|
|
|
|
Total equity
|
|
394,457
|
|
995,831
|
|
|
|
Total liabilities and equity
|
|
1,246,858
|
|
1,877,450
|
|
|
The accompanying notes are an integral part of the condensed non-consolidated financial information.
F -
52
TEEKAY CORPORATION
SCHEDULE I
CONDENSED NON-CONSOLIDATED FINANCIAL INFORMATION OF REGISTRANT
CONDENSED STATEMENTS OF LOSS (NOTE 1)
(in thousands of U.S. dollars)
|
|
|
Year Ended
December 31, 2018 $ |
Year Ended
December 31, 2017 $ |
Year Ended
December 31, 2016 $ |
|||||
|
Revenues
|
|
345
|
|
5,089
|
|
14,142
|
|
||
|
Voyage expenses
|
|
20
|
|
(242
|
)
|
(59
|
)
|
||
|
Vessel operating expenses
|
(26
|
)
|
—
|
|
(30
|
)
|
|||
|
Time-charter hire expense
|
|
—
|
|
(17,765
|
)
|
(24,477
|
)
|
||
|
General and administrative expenses
|
(23,799
|
)
|
(20,549
|
)
|
(20,583
|
)
|
|||
|
Loss from vessel operations
|
|
(23,460
|
)
|
(33,467
|
)
|
(31,007
|
)
|
||
|
Interest expense
|
|
(60,166
|
)
|
(53,103
|
)
|
(53,164
|
)
|
||
|
Interest income
|
|
2,839
|
|
422
|
|
18,430
|
|
||
|
Impairments of investments
(note 1)
|
(651,473
|
)
|
(338,749
|
)
|
—
|
|
|||
|
Dividend income
(note 1)
|
32,751
|
|
58,000
|
|
1,039
|
|
|||
|
Other
|
|
(6,008
|
)
|
4,764
|
|
(981
|
)
|
||
|
Net loss before income taxes
|
|
(705,517
|
)
|
(362,133
|
)
|
(65,683
|
)
|
||
|
Income tax expense
|
|
(208
|
)
|
(251
|
)
|
(525
|
)
|
||
|
Net loss
|
|
(705,725
|
)
|
(362,384
|
)
|
(66,208
|
)
|
||
The accompanying notes are an integral part of the condensed non-consolidated financial information.
F -
53
TEEKAY CORPORATION
SCHEDULE I
CONDENSED NON-CONSOLIDATED FINANCIAL INFORMATION OF REGISTRANT
CONDENSED STATEMENTS OF CASH FLOWS
(in thousands of U.S. dollars)
|
Year Ended
December 31, 2018 $ |
Year Ended
December 31, 2017 $ |
Year Ended
December 31, 2016 $ |
|||||||
|
Cash, cash equivalents and restricted cash provided by (used for)
|
|||||||||
|
OPERATING ACTIVITIES
|
|||||||||
|
Net loss
|
(705,725
|
)
|
(362,384
|
)
|
(66,208
|
)
|
|||
|
Non-cash and non-operating items:
|
|||||||||
|
Unrealized (gain) loss on derivative instruments
|
(2,932
|
)
|
(2,336
|
)
|
604
|
|
|||
|
Impairments of investments
|
651,473
|
|
338,749
|
|
—
|
|
|||
|
Income tax expense
|
208
|
|
251
|
|
525
|
|
|||
|
Stock-based compensation
|
7,329
|
|
6,952
|
|
7,106
|
|
|||
|
Dividends-in-kind
|
(10,000
|
)
|
(58,000
|
)
|
(1,039
|
)
|
|||
|
Other
|
7,453
|
|
3,262
|
|
529
|
|
|||
|
Change in operating assets and liabilities
|
(36,296
|
)
|
718
|
|
17,050
|
|
|||
|
Net operating cash flow
|
(88,490
|
)
|
(72,788
|
)
|
(41,433
|
)
|
|||
|
FINANCING ACTIVITIES
|
|||||||||
|
Proceeds from issuance of long-term debt, net of issuance costs
|
120,713
|
|
—
|
|
—
|
|
|||
|
Prepayments of long-term debt
|
(85,654
|
)
|
—
|
|
—
|
|
|||
|
Advances from (to) affiliates
|
39,293
|
|
103,400
|
|
(15,802
|
)
|
|||
|
Net proceeds from equity issuances
|
103,655
|
|
25,636
|
|
105,462
|
|
|||
|
Cash dividends paid
|
(22,081
|
)
|
(18,967
|
)
|
(17,406
|
)
|
|||
|
Other financing activities
|
(651
|
)
|
(662
|
)
|
(666
|
)
|
|||
|
Net financing cash flow
|
155,275
|
|
109,407
|
|
71,588
|
|
|||
|
INVESTING ACTIVITIES
|
|||||||||
|
Investments in subsidiaries
|
(7,109
|
)
|
(24,443
|
)
|
(62,714
|
)
|
|||
|
Other investing activities
|
(45
|
)
|
1,289
|
|
660
|
|
|||
|
Net investing cash flow
|
(7,154
|
)
|
(23,154
|
)
|
(62,054
|
)
|
|||
|
Increase (decrease) in cash, cash equivalents and restricted cash
|
59,631
|
|
13,465
|
|
(31,899
|
)
|
|||
|
Cash, cash equivalents and restricted cash, beginning of the year
|
22,050
|
|
8,585
|
|
40,484
|
|
|||
|
Cash, cash equivalents and restricted cash, end of the year
|
81,681
|
|
22,050
|
|
8,585
|
|
|||
|
Supplemental cash flow information (
note 4
)
|
|||||||||
The accompanying notes are an integral part of the condensed non-consolidated financial information.
F -
54
TEEKAY CORPORATION
SCHEDULE I
NOTES TO CONDENSED NON-CONSOLIDATED FINANCIAL INFORMATION OF REGISTRANT
1. Summary of Significant Accounting Policies
Basis of presentation
The accompanying condensed non-consolidated financial information is required by SEC Regulation S-X 5-04 for Teekay Corporation (or
Teekay
), which requires the inclusion of financial information for Teekay on a stand-alone basis if the restricted net assets of consolidated subsidiaries exceed
25%
of total consolidated net assets as of the last day of its most recent fiscal year.
Teekay’s investments in subsidiaries are presented in this financial information under the cost method of accounting, whereby Teekay’s investment in subsidiaries is measured initially at cost. Under the cost method of accounting for investments in common stock, dividends are the basis for recognition of earnings from an investment. Under this method, an investor recognizes as income dividends received that are distributed from net accumulated earnings of the investee since the date of acquisition by the investor. The net accumulated earnings of an investee subsequent to the date of investment are recognized by the investor only to the extent distributed by the investee as dividends. Dividends received in excess of earnings subsequent to the date of investment are considered a return of investment and are recorded as reductions of cost of the investment. Teekay received dividends from its subsidiaries of
$32.8 million
(
2018
),
$58.0 million
(
2017
) and
$1.0 million
(
2016
), respectively.
Teekay recognizes an impairment loss on its investments in its subsidiaries when the fair value of its investments is lower than the carrying value. The fair value of Teekay's investments in its subsidiaries is primarily influenced by
the publicly-traded prices of Teekay LNG's and Teekay Offshore's common units, and the publicly-traded share price of Teekay Tankers' common shares as of the respective balance sheet dates.
During the years ended December 31,
2018
,
2017
and
2016
, Teekay recognized impairment losses of
$651.5 million
,
$338.7 million
and $
nil
, respectively, in relation to declines in the fair value of its investments.
A substantial amount of Teekay’s operating, investing and financing activities are conducted by its affiliates and not reflected in this financial information. The condensed non-consolidated financial information should be read in conjunction with Teekay’s consolidated financial statements.
2. Long-term debt
|
December 31, 2018
$ |
December 31, 2017
$ |
||||
|
Senior Notes (8.5%) due January 15, 2020
|
508,577
|
|
592,657
|
|
|
|
Convertible Senior Notes (5%) due January 15, 2023
|
125,000
|
|
—
|
|
|
|
Less unamortized discount and debt issuance costs
|
(19,236
|
)
|
(5,675
|
)
|
|
|
Total debt
|
614,341
|
|
586,982
|
|
|
|
Long-term portion
|
614,341
|
|
586,982
|
|
|
The Company’s
8.5%
senior unsecured notes are due January 15, 2020 with an original aggregate principal amount of
$450 million
(or the
Original Notes
). The Original Notes issued on January 27, 2010 were sold at a price equal to
99.2%
of par. During 2014, the Company repurchased
$57.3 million
of the Original Notes. In November 2015, the Company issued an aggregate principal amount of
$200 million
of the Company’s
8.5%
senior unsecured notes due on January 15, 2020 (or
the Notes
) at
99.01%
of face value, plus accrued interest from July 15, 2015. The Notes are an additional issuance of the Company’s Original Notes (collectively referred to as the
8.5%
Notes
). The Notes were issued under the same indenture governing the Original Notes and are fungible with the Original Notes. The discount on the
8.5%
Notes is accreted through the maturity date of the notes using the effective interest rate of
8.67%
per year. During
2018
, the Company repurchased
$84.1 million
in aggregate principal amount of the
8.5%
Notes. During the first quarter of 2019, the Company repurchased an additional
$10.9 million
in aggregate principal amount of the
8.5%
Notes.
The Company capitalized aggregate issuance costs of
$13.3 million
which are amortized to interest expense over the term of the
8.5%
Notes. As of
December 31, 2018
, the unamortized balance of the capitalized issuance cost was
$1.6 million
which is recorded in long-term debt in the condensed balance sheet. The
8.5%
Notes rank equally in right of payment with all of Teekay’s existing and future senior unsecured debt and senior to any future subordinated debt of Teekay. The
8.5%
Notes are not guaranteed by any of Teekay’s subsidiaries and effectively rank behind all existing and future secured debt of Teekay and other liabilities of its subsidiaries.
The Company may redeem the
8.5%
Notes in whole or in part at any time before their maturity date at a redemption price equal to the greater of (i)
100%
of the principal amount of the
8.5%
Notes to be redeemed and (ii) the sum of the present values of the remaining scheduled payments of principal and interest on the
8.5%
Notes to be redeemed (excluding accrued interest), discounted to the redemption date on a semi-annual basis, at the treasury yield plus
50 basis points
, plus accrued and unpaid interest to the redemption date.
F -
55
On January 26, 2018, Teekay completed a private offering of
$125.0 million
of aggregate principal amount of
5%
Convertible Senior Notes due January 15, 2023 (the Convertible Notes). The Convertible Notes are convertible into Teekay’s common stock, initially at a rate of
85.4701
shares of common stock per
$1,000
principal amount of Convertible Notes. This represents an initial effective conversion price of
$11.70
per share of common stock. The initial conversion price represents a premium of
20%
to the concurrent common stock offering price of
$9.75
per share. The conversion rate is subject to customary adjustments for, among other things, payments of dividends by Teekay beyond the current quarterly dividend of
$0.055
per share of common stock. On issuance of the Convertible Notes,
$104.6 million
of the net proceeds was reflected in long-term debt and is being accreted to
$125.0 million
over its
5
-year term through interest expense. The remaining amount of the net proceeds of
$16.1 million
was allocated to the conversion feature and reflected in additional paid-in capital.
3. Guarantees
Teekay Corporation has guaranteed obligations pursuant to certain credit facilities of its subsidiaries. As at
December 31, 2018
, the aggregate outstanding balance on such credit facilities of Teekay Tankers was
$166.4 million
(
December 31, 2017
-
$252.7 million
). In September 2017, Teekay was released from all of its previous guarantees relating to Teekay Offshore's long-term debt and interest rate swap and cross currency swap agreements.
4. Supplemental Cash Flow Information
During
2018
, one of the Company's subsidiaries returned capital in the amount of
$1.7 million
, paid-in-kind, which was treated as a non-cash transaction in the Company's condensed statement of cash flows.
During
2018
,
2017
and
2016
, the Company received dividends of
$10.0 million
,
$58.0 million
and
$1.0 million
, respectively, paid-in-kind, which were treated as non-cash transactions in the Company's condensed statement of cash flows.
F -
56
TABLE OF CONTENTS
Part IItem 1. Identity Of Directors, Senior Management and AdvisorsItem 2. Offer Statistics and Expected TimetableItem 3. Key InformationItem 4. Information on The CompanyNote 5 Equity Financing Transactions Of The Daughter EntitiesNote 22 Equity-accounted InvestmentsNote 8 Long-term DebtNote 21 Income TaxesItem 4A. Unresolved Staff CommentsItem 5. Operating and Financial Review and ProspectsNote 4 Deconsolidation Of Teekay OffshoreNote 15 Derivative Instruments and Hedging ActivitiesNote 1 Summary Of Significant Accounting PoliciesItem 6. Directors, Senior Management and EmployeesItem 7. Major Shareholders and Certain Relationships and Related Party TransactionsItem 8. Financial InformationNote 23 Subsequent EventsItem 9. The Offer and ListingItem 10. Additional InformationItem 11. Quantitative and Qualitative Disclosures About Market RiskItem 12. Description Of Securities Other Than Equity SecuritiesPart IIItem 13. Defaults, Dividend Arrearages and DelinquenciesItem 14. Material Modifications To The Rights Of Security Holders and Use Of ProceedsItem 15. Controls and ProceduresItem 16A. Audit Committee Financial ExpertItem 16B. Code Of EthicsItem 16C. Principal Accountant Fees and ServicesItem 16D. Exemptions From The Listing Standards For Audit CommitteesItem 16E. Purchases Of Equity Securities By The Issuer and Affiliated PurchasersItem 16F. Change in Registrant S Certifying AccountantItem 16G. Corporate GovernanceItem 16H. Mine Safety DisclosurePart IIIItem 17. Financial StatementsItem 18. Financial StatementsItem 19. ExhibitsNote 3 Segment Reporting