TIMKEN CO
10-Ks and 10-Qs
|
|
|
|
|
|
|
|
|
|
|
|
|
|
|
|
|
|
|
|
|
|
|
|
|
|
|
|
|
|
|
|
|
|
|
|
|
|
|
|
|
|
|
|
|
|
|
|
|
|
|
|
|
|
|
|
UNITED STATES
SECURITIES AND EXCHANGE COMMISSION
WASHINGTON, D.C. 20549
FORM 10-K
|
x
|
ANNUAL REPORT PURSUANT TO SECTION 13 OR 15(d) OF THE SECURITIES EXCHANGE ACT OF 1934
|
|
For the fiscal year ended December 31, 2016
|
|
OR
|
o
|
TRANSITION REPORT PURSUANT TO SECTION 13 OR 15(d) OF THE SECURITIES EXCHANGE ACT OF 1934
|
|
For the transition period from______to_______
|
|
Commission file number: 1-1169
THE TIMKEN COMPANY
(Exact name of registrant as specified in its charter)
|
Ohio
|
|
34-0577130
|
|
(State or other jurisdiction of
|
|
(I.R.S. Employer
|
|
incorporation or organization)
|
|
Identification No.)
|
|
4500 Mt. Pleasant St. NW, North Canton, Ohio
|
|
44720-5450
|
|
(Address of principal executive offices)
|
|
(Zip Code)
|
234.262.3000
(Registrant’s telephone number, including area code)
Securities registered pursuant to Section 12(b) of the Act:
|
Title of each class
|
|
Name of each exchange on which registered
|
|
Common Shares, without par value
|
|
New York Stock Exchange
|
Securities registered pursuant to Section 12(g) of the Act: None
Indicate by check mark if the registrant is a well-known seasoned issuer, as defined in Rule 405 of the Securities Act.
Yes
x
No
o
Indicate by check mark if the registrant is not required to file reports pursuant to Section 13 or Section 15(d) of the Exchange Act. Yes
o
No
x
Indicate by check mark whether the registrant (1) has filed all reports required to be filed by Section 13 or 15(d) of the Securities Exchange Act of 1934 during the preceding 12 months (or for such shorter period that the registrant was required to file such reports), and (2) has been subject to such filing requirements for the past 90 days.
Yes
x
No
o
Indicate by check mark whether the registrant has submitted electronically and posted on its corporate Web site, if any, every Interactive Data File required to be submitted and posted pursuant to Rule 405 of Regulation S-T during the preceding 12 months (or for such shorter period that the registrant was required to submit and post such files).
Yes
x
No
o
Indicate by check mark if disclosure of delinquent filers pursuant to Item 405 of Regulation S-K is not contained herein, and will not be contained, to the best of registrant’s knowledge, in definitive proxy or information statements incorporated by reference in Part III of this Form 10-K or any amendment to this Form 10-K.
x
Indicate by check mark whether the registrant is a large accelerated filer, an accelerated filer, a non-accelerated filer or a smaller reporting company. See the definitions of “large accelerated filer,” “accelerated filer” and “smaller reporting company” in Rule 12b-2 of the Exchange Act.
|
Large accelerated filer
|
x
|
Accelerated filer
|
o
|
Non-accelerated filer
|
o
|
Smaller reporting company
|
o
|
Indicate by check mark whether the registrant is a shell company (as defined in Rule 12b-2 of the Exchange Act). Yes
o
No
x
As of
June 30, 2016
, the aggregate market value of the registrant’s common shares held by non-affiliates of the registrant was
$2,097,179,228
based on the closing sale price as reported on the New York Stock Exchange.
Indicate the number of shares outstanding of each of the issuer’s classes of common stock, as of the latest practicable date.
|
Class
|
|
Outstanding at January 31, 2017
|
|
Common Shares, without par value
|
|
77,565,732 shares
|
DOCUMENTS INCORPORATED BY REFERENCE
|
Document
|
|
Parts Into Which Incorporated
|
|
Proxy Statement for the Annual Meeting of Shareholders to be held on or about May 9, 2017 (Proxy Statement)
|
|
Part III
|
THE TIMKEN COMPANY
INDEX TO FORM 10-K REPORT
|
|
|
|
PAGE
|
|
I.
|
|||
|
Item 1.
|
|||
|
Item 1A.
|
|||
|
Item 1B.
|
|||
|
Item 2.
|
|||
|
Item 3.
|
|||
|
Item 4.
|
|||
|
Item 4A.
|
|||
|
II.
|
|||
|
Item 5.
|
|||
|
Item 6.
|
|||
|
Item 7.
|
|||
|
Item 7A.
|
|||
|
Item 8.
|
|||
|
Item 9.
|
|||
|
Item 9A.
|
|||
|
Item 9B.
|
|||
|
III.
|
|||
|
Item 10.
|
|||
|
Item 11.
|
|||
|
Item 12.
|
|||
|
Item 13.
|
|||
|
Item 14.
|
|||
|
IV.
|
|||
|
Item 15.
|
|||
General:
As used herein, the term “Timken” or the “Company” refers to The Timken Company and its subsidiaries unless the context otherwise requires. Timken engineers, manufactures and markets bearings, transmissions, gearboxes, belts, chain, couplings and related products and offers a spectrum of power system rebuild and repair services around the world. The Company’s growing product and services portfolio features many strong industrial brands, including Timken®, Fafnir®, Philadelphia Gear®, Carlisle®, Drives®, Lovejoy® and Interlube
TM.
.
The Company was founded in 1899 by Henry Timken, who received two patents on the design of a tapered roller bearing. Timken later became, and continues to be, the world's largest manufacturer of tapered roller bearings, leveraging its expertise to develop a full portfolio of industry-leading products and services. Timken built its reputation as a global leader by applying its knowledge of metallurgy, friction management and mechanical power transmission to increase the reliability and efficiency of its customers' equipment across a diverse range of industries. Today, the Company's global footprint consists of
73
manufacturing facilities/service centers,
15
technology and engineering centers, and
25
distribution centers and warehouses, supported by a team comprised of more than
14,000
employees. Timken operates in
28
countries around the globe.
Industry Segments and Geographical Financial Information:
Information required by this Item is incorporated herein by reference to
Note 16 - Segment Information
.
Major Customers:
The Company sells products and services to a diverse customer base globally, including customers in the following market sectors: industrial equipment, construction, agriculture, rail, aerospace and defense, automotive, heavy truck and energy. No single customer accounts for
5%
or more of total net sales.
Products:
Timken manufactures and manages global supply chains for multiple product lines including anti-friction bearings and mechanical power transmission products designed to operate in demanding environments. The Company leverages its technical knowledge, research expertise, and production and engineering capabilities across all of its products and end markets to deliver high-performance products and services to its customers. Differentiation in these product lines is achieved by either: (1) product type or (2) the targeted applications utilizing the product.
Engineered Bearings:
The Timken® bearing portfolio features a broad range of anti-friction bearing products, including tapered, spherical and cylindrical roller bearings; thrust and ball bearings; and housed units. Timken is a leading authority on tapered roller bearings, and leverages its position by applying engineering know-how and technology across its entire bearing portfolio.
A bearing is a mechanical device that reduces friction between moving parts. The purpose of a bearing is to carry a load while allowing a machine shaft to rotate freely. The basic elements of the bearing include two rings, called races; a set of rollers that rotate around the bearing raceway; and a cage to separate and guide the rolling elements. Bearings come in a number of designs, featuring tapered, spherical, cylindrical or ball rolling elements. The various bearing designs accommodate radial and/or thrust loads differently, making certain bearing types better suited for specific applications.
Selection and development of bearings for customer applications and demand for high reliability require sophisticated engineering and analytical techniques. High precision tolerances, proprietary internal geometries and quality materials provide Timken bearings with high load-carrying capacity, excellent friction-reducing qualities and long service lives. The uses for bearings are diverse and can be found in transportation applications that include passenger cars and trucks, heavy trucks, helicopters, airplanes and trains. Ranging in size from precision bearings the size of a pencil eraser to those roughly three meters in diameter, Timken components are also used in a wide variety of industrial applications: paper and steel mills, mining, oil and gas extraction and production, machine tools, gear drives, health and positioning control, wind turbines and food processing.
1
Tapered Roller Bearings
.
Timken tapered roller bearings can increase power density and can include customized geometries, engineered surfaces and specialized sealing solutions. The Company’s tapered roller bearing line comes in thousands of combinations in single-, double- and four-row configurations. Tapered roller designs permit ready absorption of both radial and axial load combinations, which makes them particularly well-adapted to reducing friction where shafts, gears or wheels are used.
Spherical and Cylindrical Roller Bearings.
Timken also produces spherical and cylindrical roller bearings that are used in large gear drives, rolling mills and other industrial and infrastructure development applications. These products are sold worldwide to original equipment manufacturers ("OEMs") and industrial distributors serving major end-market sectors, including construction and mining, natural resources, defense, pulp and paper production, rolling mills and general industrial goods.
Ball Bearings.
Timken radial, angular and precision ball bearings are used by customers in a variety of market sectors, including aerospace, agriculture, construction, health, machine tool and general industries. Radial ball bearings are designed to tolerate relatively high-speed operation under a range of load conditions. These bearing types consist of an inner and outer ring with a cage containing a complement of precision balls. Angular contact ball bearings are designed for a combination of radial and axial loading. Precision ball bearings are manufactured to tight tolerances and come in miniature and instrument, thin section and ball screw support designs.
Housed Units.
Timken markets among the broadest range of bearing housed units in the industry. These products deliver durable, heavy-duty components designed to protect spherical, tapered and ball bearings in debris-filled, contaminated or high-moisture environments. Common housed unit applications include material handling and processing equipment.
Mechanical Power Transmission:
Belts.
Timken makes and markets a full line of Carlisle® belts used in industrial, commercial and consumer applications. The portfolio features more than 20,000 parts designed for demanding applications, which are sold to original equipment and aftermarket customers. Carlisle® belts are engineered for maximum performance and durability, with products available in wrap molded, raw edge, v-ribbed and synchronous belt designs. Common applications include agriculture, construction, industrial machinery, outdoor power equipment and powersports.
Chain.
Timken manufactures precision Drives® roller chain, pintle chain, agricultural conveyor chain, engineering class chain and oil field roller chain. These highly engineered products are used in a wide range of mobile and industrial machinery applications, including agriculture, oil and gas, aggregate and mining, primary metals, forest products and other heavy industries. These products are also utilized in the food and beverage and packaged goods sectors, which often require high-end, specialty products, including stainless-steel and corrosion-resistant roller chain.
Couplings.
The Company offers a full range of industrial couplings within its mechanical power transmission products portfolio. The Lovejoy brand is widely known for its flexible coupling design and as the creator of the jaw-style coupling. Lovejoy® couplings are available in curved jaw, jaw in-shear, s-flex, gear-torsional and disc style configurations. These components are used in a wide range of industries such as steel, pulp and paper, power generation, food processing, mining and construction.
Lubrication Systems.
The Company offers 27 formulations of grease, leveraging its knowledge of tribology and anti-friction bearings to enable smooth equipment operation. Interlube® automated lubrication delivery systems dispense precise amounts of Timken grease, saving users from having to manually apply lubrication. These multifaceted delivery systems are used by the commercial vehicle, construction, mining, and heavy and general industries.
Aerospace Products
.
The Company's portfolio of parts, systems and services for the aerospace market sector includes products used in helicopters and fixed-wing aircraft for the military and commercial aviation industries. Timken designs, manufactures and tests a wide variety of power transmission and drive train components, including bearings, transmissions, turbine engine components, gears and rotor-head assemblies and housings. In addition to original equipment, Timken provides aftermarket component repair for bearings and compressor cases. Timken inspects and reconditions main engine, gearbox and APU bearings on a wide range of platforms, such as engines, transmissions and gearboxes.
2
Industrial Gearboxes.
The Company’s Philadelphia Gear® line of low- and high-speed gear drive designs are used in large-scale industrial applications. These gear drive configurations are custom-made to meet user specifications, offering a wide-array of size, footprint and gear arrangements. Low-speed drives are commonly used in crushing and pulverizing equipment, cooling towers, conveyors and pumps. High-speed drives are typically used by power generation, oil and gas, marine and pipeline industries.
Other Products.
The Company also offers a full line of seals, augers and other mechanical power transmission components. Timken industrial sealing solutions come in a variety of types and material options that are used in manufacturing, food processing, mining, power generation, chemical processing, primary metals, pulp and paper, and oil and gas industry applications. The Company also designs and manufactures Drives helicoid and sectional augers for agricultural applications, like conveying, digging and combines.
Services:
Power Systems.
Timken services components in the industrial customer's drive train, including switch gears, electric motors and generators, gearboxes, bearings, couplings and central panels. The Company’s Philadelphia Gear services for gear drive applications include onsite technical services; inspection, repair and upgrade capabilities; and manufacturing of parts to OEM specifications. In addition, the Company’s Wazee, Smith Services, Schulz, Standard Machine and H&N service centers provide customers with services that include motor and generator rewind and repair and uptower wind turbine maintenance and repair. Timken Power Systems commonly serves customers in the power, wind energy, hydro and fossil fuel, water management, paper, mining and general manufacturing sectors.
Bearing Repair.
Timken bearing repair services return worn bearings to like-new specifications, which increases bearing service life and can often restore bearings in less time than required to manufacture new. Bearing remanufacturing is available for any bearing type or brand - including competitor products - and is well-suited to heavy industrial applications such as paper, metals, mining, power generation and cement; railroad locomotives, passenger cars and freight cars; and aerospace engines and gearboxes.
Services accounted for approximately 7% of the Company’s net sales for the year ended
December 31, 2016
.
Sales and Distribution:
Timken products are sold principally by its own internal sales organizations. A portion of each segment's sales are made through authorized distributors.
Customer collaboration is central to the Company's sales strategy. Therefore, Timken goes where its customers need them, with sales engineers primarily working in close proximity to customers rather than at production sites. In some cases, Timken may co-locate with a customer at its facility to ensure optimized collaboration. The Company's sales force constantly updates the team's training and knowledge regarding all friction management products and market sector trends, and Timken employees assist customers during development and implementation phases and provide ongoing service and support.
The Company has a joint venture in North America focused on joint logistics and e-business services. This joint venture, CoLinx, LLC, includes five equity members: Timken, SKF Group, the Schaeffler Group, ABB Group and Gates Corporation. The e-business service focuses on information and business services for authorized distributors in the Process Industries segment.
Timken has entered into individually negotiated contracts with some of its customers. These contracts may extend for one or more years and, if a price is fixed for any period extending beyond current shipments, customarily include a commitment by the customer to purchase a designated percentage of its requirements from Timken. Timken does not believe that there is any significant loss of earnings risk associated with any given contract.
Competition:
The anti-friction bearing business is highly competitive in every country where Timken sells products. Timken competes primarily based on total value, including price, quality, timeliness of delivery, product design and the ability to provide engineering support and service on a global basis. The Company competes with domestic manufacturers and many foreign manufacturers of anti-friction bearings, including SKF Group, the Schaeffler Group, NTN Corporation, JTEKT Corporation and NSK Ltd.
3
Joint Ventures:
Investments in affiliated companies accounted for under the equity method were approximately
$3.1 million
and $2.6 million, respectively, at
December 31, 2016
and
2015
. The investment balance at
December 31, 2016
was reported in other non-current assets on the Consolidated Balance Sheets.
Backlog:
The following table provides the backlog of orders for the Company's domestic and overseas operations at
December 31, 2016
and
2015
:
|
|
December 31,
|
|||||
|
(Dollars in millions)
|
2016
|
2015
|
||||
|
Segment:
|
||||||
|
Mobile Industries
|
$
|
644.7
|
|
$
|
587.1
|
|
|
Process Industries
|
398.4
|
|
356.1
|
|
||
|
Total Company
|
$
|
1,043.1
|
|
$
|
943.2
|
|
Approximately
90%
of the Company’s backlog at
December 31, 2016
, is scheduled for delivery in the succeeding twelve months. Actual shipments depend upon customers' ever-changing production schedules. Accordingly, Timken does not believe that its backlog data and comparisons thereof, as of different dates, reliably indicate future sales or shipments.
Raw Materials:
The principal raw material used by the Company to make anti-friction bearings is special bar quality ("SBQ") steel. SBQ steel is produced around the world by various suppliers. SBQ steel is purchased in bar, tube and wire forms. The primary inputs to SBQ steel include scrap metal, iron ore, alloys, energy and labor. The availability and price of SBQ steel are subject to changes in supply and demand, commodity prices for ferrous scrap, ore, alloy, electricity, natural gas, transportation fuel, and labor costs. The Company manages price variability of commodities by using surcharge mechanisms on some of its contracts with its customers that provides for partial recovery of these cost increases in the price of bearing products.
Any significant increase in the cost of steel could materially affect the Company’s earnings. Disruptions in the supply of SBQ steel could temporarily impair the Company’s ability to manufacture bearings for its customers, or require the Company to pay higher prices in order to obtain SBQ, which could affect the Company’s revenues and profitability. The availability of bearing quality tubing is relatively limited, and the Company is taking steps to diversify its processes to limit its exposure to this particular form of SBQ steel. Overall, the Company believes that the number of suppliers of SBQ steel is adequate to support the needs of global bearing production, and, in general, the Company is not dependent on any single source of supply.
Research:
Timken operates a network of technology and engineering centers to support its global customers with sites in North America, Europe and Asia. This network develops and delivers innovative friction management and mechanical power transmission solutions and technical services. Timken's largest technical center is located at the Company's world headquarters in North Canton, Ohio. Other sites in the United States include Manchester, Connecticut; Downer's Grove and Fulton, Illinois; Springfield, Massachusetts; Springfield, Missouri; Keene and Lebanon, New Hampshire; and King of Prussia, Pennsylvania. Within Europe, the Company has technology facilities in Plymouth, England; Colmar, France; Werdohl, Germany; and Ploiesti, Romania. In Asia, Timken operates technology and engineering facilities in Bangalore, India and Shanghai, China.
Expenditures for research and development amounted to approximately
$31.8 million
,
$32.6 million
and
$38.8 million
in
2016
,
2015
and
2014
, respectively.
$0.3 million
of the
2014
amount was funded by others. No amounts were funded by others in
2016
and
2015
.
Environmental Matters:
The Company continues its efforts to protect the environment and comply with environmental protection laws. Additionally, it has invested in pollution control equipment and updated plant operational practices. The Company is committed to implementing a documented environmental management system worldwide and to becoming certified under the ISO 14001 standard where appropriate to meet or exceed customer requirements. As of the end of
2016
,
16
of the Company’s plants had obtained ISO 14001 certification.
4
The Company believes it has established appropriate reserves to cover its environmental expenses and has a well-established environmental compliance audit program for its domestic and international units. This program measures performance against applicable laws, as well as against internal standards that have been established for all units worldwide. It is difficult to assess the possible effect of compliance with future requirements that differ from existing requirements.
The Company and certain of its United Stated ("U.S.") subsidiaries previously have been and could in the future be identified as potentially responsible parties for investigation and remediation at off-site disposal or recycling facilities under the Comprehensive Environmental Response, Compensation and Liability Act ("CERCLA"), known as the Superfund, or state laws similar to CERCLA. In general, such claims for investigation and remediation have also been asserted against numerous other entities.
Management believes any ultimate liability with respect to pending actions will not materially affect the Company’s operations, cash flows or consolidated financial position. The Company is also conducting environmental investigation and/or remediation activities at a number of current or former operating sites. The costs of such investigation and remediation activities, in the aggregate, are not expected to be material to the operations or financial position of the Company.
New laws and regulations, stricter enforcement of existing laws and regulations, the discovery of previously unknown contamination or the imposition of new clean-up requirements may require Timken to incur costs or become the basis for new or increased liabilities that could have a materially adverse effect on the Company's business, financial condition or results of operations.
Patents, Trademarks and Licenses:
Timken owns numerous U.S. and foreign patents, trademarks and licenses relating to certain products. While Timken regards these as important, it does not deem its business as a whole, or any industry segment, to be materially dependent upon any one item or group of items.
Employment:
At
December 31, 2016
, Timken had more than
14,000
employees. Approximately
7%
of Timken’s U.S. employees are covered under collective bargaining agreements.
Available Information:
The Company uses its Investor Relations website at http://investors.timken.com, as a channel for routine distribution of important information, including news releases, analyst presentations and financial information. The Company posts filings as soon as reasonably practicable after they are electronically filed with, or furnished to, the Securities and Exchange Commission (the "SEC"), including its annual, quarterly and current reports on Forms 10-K, 10-Q and 8-K; its proxy statements; and any amendments to those reports or statements. All such postings and filings are available on the Company’s website free of charge. In addition, this website allows investors and other interested persons to sign up to automatically receive e-mail alerts when the Company posts news releases and financial information on the Company’s website. The SEC also maintains a website, www.sec.gov, which contains reports, proxy and information statements and other information regarding issuers that file electronically with the SEC. The content on any website referred to in this Annual Report on Form 10-K is not incorporated by reference into this Annual Report unless expressly noted.
5
The following are certain risk factors that could affect our business, financial condition and results of operations. The risks that are described below are not the only ones that we face. These risk factors should be considered in connection with evaluating forward-looking statements contained in this Annual Report on Form 10-K because these factors could cause our actual results and financial condition to differ materially from those projected in forward-looking statements. If any of the following risks actually occur, our business, financial condition or results of operations could be negatively affected.
Risk Relating to our Business
The bearing industry is highly competitive, and this competition results in significant pricing pressure for our products that could affect our revenues and profitability.
The global bearing industry is highly competitive. We compete with domestic manufacturers and many foreign manufacturers of anti-friction bearings, including SKF Group, the Schaeffler Group, NTN Corporation, JTEKT Corporation and NSK Ltd. Due to competitiveness within the bearing industry, we may not be able to increase prices for our products to cover increases in our costs or to achieve desired profitability. In many cases we face pressure from our customers to reduce prices, which could adversely affect our revenues and profitability. In addition, our customers may choose to purchase products from one of our competitors rather than pay the prices we seek for our products, which could adversely affect our revenues and profitability.
Our business is capital intensive, and if there are downturns in the industries that we serve, we may be forced to significantly curtail or suspend operations with respect to those industries, which could result in our recording asset impairment charges or taking other measures that may adversely affect our results of operations and profitability.
Our business operations are capital intensive, and we devote a significant amount of capital to certain industries. Our profitability is dependent on factors such as labor compensation and productivity and inventory management, which are subject to risks that we may not be able to control. If there are downturns in the industries that we serve, we may be forced to significantly curtail or suspend our operations with respect to those industries, including laying-off employees, reducing production, recording asset impairment charges and other measures, which may adversely affect our results of operations and profitability.
Weakness in global economic conditions or in any of the industries or geographic regions in which we or our customers operate, as well as the cyclical nature of our customers' businesses generally or sustained uncertainty in financial markets, could adversely impact our revenues and profitability by reducing demand and margins.
There has been significant volatility in the capital markets and in the end markets and geographic regions in which we and our customers operate, which has negatively affected our revenues. Our revenues may also be negatively affected by changes in customer demand, changes in the product mix and negative pricing pressure in the industries in which we operate. Margins in those industries are highly sensitive to demand cycles, and our customers in those industries historically have tended to delay large capital projects, including expensive maintenance and upgrades, during economic downturns. As a result, our revenues and earnings are impacted by overall levels of industrial production.
6
Our results of operations may be materially affected by conditions in global financial markets or in any of the geographic regions in which we, our customers and our suppliers, operate. If an end user cannot obtain financing to purchase our products, either directly or indirectly contained in machinery or equipment, demand for our products will be reduced, which could have a material adverse effect on our financial condition and earnings.
Global financial markets have experienced volatility in recent years, including volatility in securities prices and diminished liquidity and credit availability. Our access to the financial markets cannot be assured and is dependent on, among other things, market conditions and company performance. Accordingly, we may be forced to delay raising capital, issue shorter tenors than we prefer or pay unattractive interest rates, which could increase our interest expense, decrease our profitability and significantly reduce our financial flexibility.
If a customer becomes insolvent or files for bankruptcy, our ability to recover accounts receivable from that customer would be adversely affected and any payment we received during the preference period prior to a bankruptcy filing may be potentially recoverable by the bankruptcy estate. Furthermore, if certain of our customers liquidate in bankruptcy, we may incur impairment charges relating to obsolete inventory and machinery and equipment.
In addition, financial instability of certain companies in the supply chain could disrupt production in any particular industry. A disruption of production in any of the industries where we participate could have a material adverse effect on our financial condition and earnings. If any of our suppliers are unable or unwilling to provide the products or services that we require or materially increase their costs, our ability to offer and deliver our products on a timely and profitable basis could be impaired. We cannot assure you that any or all of our relationships will not be terminated or that such relationships will continue as presently in effect. Furthermore, if any of our suppliers were to become subject to bankruptcy, receivership or similar proceedings, we may be unable to arrange for alternate or replacement relationships on favorable terms, which could harm our sales and operating results.
Any change in raw material prices or the availability or cost of raw materials could adversely affect our results of operations and profit margins.
We require substantial amounts of raw materials, including steel, to operate our business. Our supply of raw materials could be interrupted for a variety of reasons, including availability and pricing. Prices for raw materials necessary for production have fluctuated significantly in the past and could do so in the future. We generally attempt to manage these fluctuations by passing along increased raw material prices to our customers in the form of price increases; however, we may be unable to increase the price of our products due to pricing pressure, contract terms or other factors, which could adversely impact our revenue and profit margins.
Moreover, future disruptions in the supply of our raw materials could impair our ability to manufacture our products for our customers or require us to pay higher prices in order to obtain these raw materials from other sources. Any significant increase in the prices for such raw materials could adversely affect our results of operations and profit margins.
7
Warranty, recall, quality or product liability claims could materially adversely affect our earnings.
In our business, we are exposed to warranty and product liability claims. In addition, we may be required to participate in the recall of a product. If we fail to meet customer specifications for their products, we may be subject to product quality costs and claims. A successful warranty or product liability claim against us, or a requirement that we participate in a product recall, could have a material adverse effect on our earnings.
We may incur further impairment and restructuring charges that could materially affect our profitability.
We have taken approximately $188 million in impairment and restructuring charges in the aggregate during the last five years. Changes in business or economic conditions, or our business strategy, may result in additional restructuring programs and may require us to take additional charges in the future, which could have a material adverse effect on our earnings.
Environmental laws and regulations impose substantial costs and limitations on our operations and environmental compliance may be more costly than we expect.
We are subject to the risk of substantial environmental liability and limitations on our operations due to environmental laws and regulations. We are subject to extensive federal, state, local and foreign environmental, health and safety laws and regulations concerning matters such as air emissions, wastewater discharges, solid and hazardous waste handling and disposal and the investigation and remediation of contamination. The risks of substantial costs and liabilities related to compliance with these laws and regulations are an inherent part of our business, and future conditions may develop, arise or be discovered that create substantial environmental compliance or remediation liabilities and costs.
Compliance with environmental, health and safety legislation and regulatory requirements may prove to be more limiting and costly than we anticipate. To date, we have committed significant expenditures in our efforts to achieve and maintain compliance with these requirements at our facilities, and we expect that we will continue to make significant expenditures related to such compliance in the future. From time to time, we may be subject to legal proceedings brought by private parties or governmental authorities with respect to environmental matters, including matters involving alleged noncompliance with or liability arising from environmental, health and safety laws, property damage or personal injury. New laws and regulations, including those that may relate to emissions of greenhouse gases, stricter enforcement of existing laws and regulations, the discovery of previously unknown contamination or the imposition of new clean-up requirements could require us to incur costs or become the basis for new or increased liabilities that could have a material adverse effect on our business, financial condition or results of operations.
8
The Company may be subject to risks relating to its information technology systems.
The Company relies on information technology systems to process, transmit and store electronic information and manage and operate its business. A breach in security could expose the Company and its customers and suppliers to risks of misuse of confidential information, manipulation and destruction of data, production downtimes and operational disruptions, which in turn could adversely affect the Company's reputation, competitive position, business or results of operations.
The global nature of our business exposes us to foreign currency fluctuations that may affect our asset values, results of operations and competitiveness.
We are exposed to the risks of currency exchange rate fluctuations because a significant portion of our net sales, costs, assets and liabilities, are denominated in currencies other than the U.S. dollar. These risks include a reduction in our asset values, net sales, operating income and competitiveness.
For those countries outside the United States where we have significant sales, devaluation in the local currency would reduce the value of our local inventory as presented in our Consolidated Financial Statements. In addition, a stronger U.S. dollar would result in reduced revenue, operating profit and shareholders' equity due to the impact of foreign exchange translation on our Consolidated Financial Statements. Fluctuations in foreign currency exchange rates may make our products more expensive for others to purchase or increase our operating costs, affecting our competitiveness and our profitability.
Changes in exchange rates between the U.S. dollar and other currencies and volatile economic, political and market conditions in emerging market countries have in the past adversely affected our financial performance and may in the future adversely affect the value of our assets located outside the United States, our gross profit and our results of operations.
Global political instability and other risks of international operations may adversely affect our operating costs, revenues and the price of our products.
Our international operations expose us to risks not present in a purely domestic business, including primarily:
|
•
|
changes in tariff regulations, which may make our products more costly to export or import;
|
|
•
|
difficulties establishing and maintaining relationships with local OEMs, distributors and dealers;
|
|
•
|
import and export licensing requirements;
|
|
•
|
compliance with a variety of foreign laws and regulations, including unexpected changes in taxation and environmental or other regulatory requirements, which could increase our operating and other expenses and limit our operations;
|
|
•
|
disadvantages of competing against companies from countries that are not subject to U.S. laws and regulations, including the Foreign Corrupt Practices Act ("FCPA");
|
|
•
|
difficulty in staffing and managing geographically diverse operations; and
|
|
•
|
tax exposures related to cross-border intercompany transfer pricing and other tax risks unique to international operations.
|
These and other risks may also increase the relative price of our products compared to those manufactured in other countries, reducing the demand for our products in the markets in which we operate, which could have a material adverse effect on our revenues and earnings.
9
Expenses and contributions related to our defined benefit plans are affected by factors outside our control, including the performance of plan assets, interest rates, actuarial data and experience, and changes in laws and regulations, all of which could impact our funded status.
Our future expense and funding obligations for the defined benefit pension plans depend upon a number of factors, including the level of benefits provided for by the plans, the future performance of assets set aside in trusts for these plans, the level of interest rates used to determine the discount rate to calculate the amount of liabilities, actuarial data and experience and any changes in government laws and regulations. In addition, if the various investments held by our pension trusts do not perform as expected or the liabilities increase as a result of discount rates and other actuarial changes, our pension expense and required contributions would increase and, as a result, could materially adversely affect our business or require us to record charges that could be significant and would cause a reduction in our shareholders' equity. We may be legally required to make contributions to the pension plans in the future in excess of our current expectations, and those contributions could be material.
Future actions involving our defined benefit and other postretirement plans, such as annuity purchases, lump sum payouts, and/or plan terminations could cause us to incur significant pension and postretirement settlement and curtailment charges.
We have purchased annuities and offered lump sum payouts to defined benefit plan and other postretirement plan participants and retirees in the past. If we were to take similar actions in the future, we could incur significant pension settlement and curtailment charges related to the reduction in pension and postretirement obligations from annuity purchases, lump sum payouts of benefits to plan participants, and/or plan terminations. Pursuing these types of actions could require us to make additional contributions to the defined plans to maintain a legally required funded status.
Work stoppages or similar difficulties could significantly disrupt our operations, reduce our revenues and materially affect our earnings.
A work stoppage at one or more of our facilities, or at facilities of one or more of our suppliers, could have a material adverse effect on our business, financial condition and results of operations. Also, if one or more of our customers were to experience a work stoppage, that customer would likely halt or limit purchases of our products, which could have a material adverse effect on our business, financial condition and results of operations.
We are subject to a wide variety of domestic and foreign laws and regulations that could adversely affect our results of operations, cash flow or financial condition.
We are subject to a wide variety of domestic and foreign laws and regulations, and legal compliance risks, including securities laws, tax laws, employment and pension-related laws, competition laws, U.S. and foreign export and trading laws, and laws governing improper business practices. We are affected by new laws and regulations, and changes to existing laws and regulations, including interpretations by courts and regulators.
In addition, we could be adversely affected by violations of the FCPA and similar worldwide anti-bribery laws as well as export controls and economic sanction laws. The FCPA and similar anti-bribery laws in other jurisdictions generally prohibit companies and their intermediaries from making improper payments to non-U.S. officials for the purpose of obtaining or retaining business. Recently, there has been a substantial increase in the global enforcement of anti-corruption laws. We operate in many parts of the world that have experienced governmental corruption to some degree and, in certain circumstances, strict compliance with anti-bribery laws may conflict with local customs and practices. Our policies mandate compliance with these laws., but we cannot assure you that our internal controls and procedures will always protect us from the improper acts committed by our employees or agents. If we are found to be liable for FCPA, export control or sanction violations, we could suffer from criminal or civil penalties or other sanctions, including loss of export privileges or authorization needed to conduct aspects of our international business, which could have a material adverse effect on our business.
Compliance with the laws and regulations described above or with other applicable foreign, federal, state, and local laws and regulations currently in effect or that may be adopted in the future could materially adversely affect our competitive position, operating results, financial condition and liquidity.
10
If we are unable to attract and retain key personnel our business could be materially adversely affected.
Our business substantially depends on the continued service of key members of our management. The loss of the services of a significant number of members of our management could have a material adverse effect on our business. Our future success will also depend on our ability to attract and retain highly skilled personnel, such as engineering, finance, marketing and senior management professionals. Competition for these types of employees is intense, and we could experience difficulty from time to time in hiring and retaining the personnel necessary to support our business. If we do not succeed in retaining our current employees and attracting new high quality employees, our business could be materially adversely affected.
We may not realize the improved operating results that we anticipate from past and future acquisitions and we may experience difficulties in integrating acquired businesses.
We seek to grow, in part, through strategic acquisitions and joint ventures, which are intended to complement or expand our businesses, and expect to continue to do so in the future. These acquisitions involve challenges and risks. In the event that we do not successfully integrate these acquisitions into our existing operations so as to realize the expected return on our investment, our results of operations, cash flow or financial condition could be adversely affected.
Our operating results depend in part on continued successful research, development and marketing of new and/or improved products and services, and there can be no assurance that we will continue to successfully introduce new products and services.
The success of new and improved products and services depends on their initial and continued acceptance by our customers. Our businesses are affected, to varying degrees, by technological change and corresponding shifts in customer demand, which could result in unpredictable product transitions or shortened life cycles. We may experience difficulties or delays in the research, development, production, or marketing of new products and services which may prevent us from recouping or realizing a return on the investments required to bring new products and services to market. The end result could be a negative impact on our operating results.
If our internal controls are found to be ineffective, our financial results or our stock price may be adversely affected.
Our most recent evaluation resulted in our conclusion that, as of December 31, 2016, our internal control over financial reporting was effective. We believe that we currently have adequate internal control procedures in place for future periods, including processes related to newly acquired businesses; however, increased risk of internal control breakdowns generally exists in a business environment that is decentralized. In addition, if our internal control over financial reporting is found to be ineffective, investors may lose confidence in the reliability of our financial statements, which may adversely affect our stock price.
Our consolidated financial statements are prepared in accordance with U.S. GAAP, which is periodically revised and/or expanded. Accordingly, from time to time we are required to adopt new or revised accounting guidance and related interpretations issued by recognized authoritative bodies, including the Financial Accounting Standards Board and the SEC. The impact of accounting pronouncements that have been issued but not yet implemented is disclosed in this annual report on Form 10-K and our quarterly reports on Form 10-Q. It is possible that future accounting guidance we are required to adopt, or future changes in accounting principles, could change the current accounting treatment that we apply to our consolidated financial statements and that such changes could have an adverse effect on our results of operations, as reported in our consolidated financial statements.
11
Risks Relating to the Spinoff of Our Steel Business
If the spinoff of TimkenSteel Corporation (TimkenSteel) into a separate independent publicly traded company on June 30, 2014 (the Spinoff) does not qualify as a tax-free transaction, the Company and its shareholders could be subject to substantial tax liabilities.
The Spinoff was conditioned on our receipt of an opinion from Covington & Burling LLP, special tax counsel to the Company, that the distribution of TimkenSteel common shares in the Spinoff qualified as tax-free (except for cash received by shareholders in lieu of fractional shares) to the Company, TimkenSteel and the Company’s shareholders for U.S. federal income tax purposes under Sections 355 and 368(a)(1)(D) and related provisions of the Code. The opinion relied on, among other things, various assumptions and representations as to factual matters made by the Company and TimkenSteel, which, if inaccurate or incomplete in any material respect, could jeopardize the conclusions reached by such counsel in its opinion. We are not aware of any facts or circumstances that would cause the assumptions or representations that were relied on in the opinion of counsel to be inaccurate or incomplete in any material respect. The opinion is not binding on the Internal Revenue Service, or IRS, or the courts, and there can be no assurance that the qualification of the Spinoff as a transaction under Sections 355 and 368(a) of the Code will not be challenged by the IRS or by others in court, or that any such challenge would not prevail. If the Spinoff is determined to be taxable for U.S. federal income tax purposes, the Company and its shareholders that are subject to U.S. federal income tax could incur significant U.S. federal income tax liabilities, as each U.S. holder of the Company’s common shares that received TimkenSteel common shares in the Spinoff would generally be treated as having received a taxable distribution of property in an amount equal to the fair market value of the TimkenSteel common shares received.
Certain members of our Board of Directors and management may have actual or potential conflicts of interest because of their ownership of shares of TimkenSteel or their relationships with TimkenSteel following the Spinoff.
Certain members of our Board of Directors and management own shares of TimkenSteel and/or options to purchase shares of TimkenSteel, which could create, or appear to create, potential conflicts of interest when our directors and executive officers are faced with decisions that could have different implications for us and TimkenSteel. One of our directors, Ward J. Timken, Jr., is also Chairman, President and Chief Executive Officer of TimkenSteel. This may create, or appear to create, potential conflicts of interest if Mr. Timken is faced with decisions that could have different implications for TimkenSteel then the decisions have for us.
12
None.
Timken has manufacturing facilities at multiple locations in the United States and in a number of countries outside the United States. The aggregate floor area of these facilities worldwide is approximately
10.7 million
square feet, all of which, except for approximately
1.7 million
square feet, is owned in fee. The facilities not owned in fee are leased. The buildings occupied by Timken are principally made of brick, steel, reinforced concrete and concrete block construction. The Company believes all buildings are in satisfactory operating condition to conduct business.
Timken’s Mobile Industries segment's manufacturing facilities and service centers in the United States are located in Los Alamitos, California; Manchester, Connecticut; Carlyle, Illinois; Lenexa, Kansas; Keene and Lebanon, New Hampshire; Iron Station, North Carolina; Bucyrus, Canton and New Philadelphia, Ohio; Gaffney and Honea Path, South Carolina; Pulaski and Knoxville, Tennessee; Ogden, Utah and Altavista, Virginia. These facilities, including warehouses at plant locations and a technology and wind center in North Canton, Ohio have an aggregate floor area of approximately
3.6 million
square feet.
Timken’s Mobile Industries segment’s manufacturing plants and service centers outside the United States are located in Belo Horizonte, Curitiba, and Sorocaba, Brazil; Yantai, China; Cheltenham, Northampton and Plymouth England; Colmar, France; Jamshedpur, India; Villa Carcina, Italy; Sosnowiec, Poland; and Benoni, South Africa. These facilities, including warehouses at plant locations, have an aggregate floor area of approximately
2.3 million
square feet.
Timken's Process Industries segment's manufacturing plants and service centers in the United States are located in Hueytown, Alabama; Sante Fe Springs, California; Broomfield and Denver, Colorado; New Haven, Connecticut; New Castle, Delaware; Downers Grove, Fulton and Mokena, Illinois; Mishawaka, Indiana; Fort Scott, Kansas; Augusta and Portland, Maine; Springfield, Massachusetts, South Haven, Michigan, Springfield, Missouri; Randleman, and Rutherfordton, North Carolina; Union, South Carolina; Ferndale, Pasco and Vancouver, Washington; Princeton, West Virginia; and Casper, Wyoming. These facilities, including warehouses at plant locations and a wind center in North Canton, Ohio have an aggregate floor area of approximately
2.8 million
square feet.
Timken's Process Industries segment's manufacturing plants and service centers outside the United States are located in Mississauga, Prince George and Sasakatoon, Canada; Chengdu, Jiangsu and Wuxi, China; Dudley, England; Werdohl, Germany; Chennai and Durg, India; and Ploiesti, Romania. These facilities, including warehouses at plant locations have an aggregate floor area of approximately
2.1 million
square feet.
In addition to the manufacturing and distribution facilities discussed above, Timken owns or leases warehouses and distribution facilities in Argentina, Australia, China, France, Mexico, Singapore and the United States.
The extent to which the Company uses its properties varies by property and from time to time. The Company believes that its capacity levels are adequate for its present and anticipated future needs. Most of the Company’s manufacturing facilities remain capable of handling additional volume increases.
The Company is involved in various claims and legal actions arising in the ordinary course of business. In the opinion of management, the ultimate disposition of these matters will not have a material adverse effect on the Company’s consolidated financial position or results of operations.
In October 2014, the Brazilian government antitrust agency announced that it had opened an investigation of alleged antitrust violations in the bearing industry. The Company’s Brazilian subsidiary, Timken do Brasil Comercial Importadora Ltda, was included in the investigation. While the Company is unable to predict the ultimate length, scope or results of the investigation, management believes that the outcome will not have a material effect on the Company’s consolidated financial position; however, any such outcome may be material to the results of operations of any particular period in which costs, if any, are recognized. Based on current facts and circumstances, the low end of the range for potential penalties, if any, would be immaterial to the Company.
Not applicable.
13
The executive officers are elected by the Board of Directors normally for a term of one year and until the election of their successors. All executive officers have been employed by Timken or by a subsidiary of the Company during the past five-year period. The executive officers of the Company as of
February 21, 2017
are as follows:
|
Name
|
Age
|
Current Position and Previous Positions During Last Five Years
|
||
|
William R. Burkhart
|
51
|
2014 Executive Vice President, General Counsel and Secretary
|
||
|
2000 Senior Vice President and General Counsel
|
||||
|
Christopher A. Coughlin
|
56
|
2014 Executive Vice President, Group President
|
||
|
2012 Group President
|
||||
|
2011 President - Process Industries
|
||||
|
Philip D. Fracassa
|
48
|
2014 Executive Vice President and Chief Financial Officer
|
||
|
2012 Senior Vice President - Planning and Development
|
||||
|
2010 Senior Vice President and Controller - B&PT
|
||||
|
Richard G. Kyle
|
51
|
2014 President and Chief Executive Officer
|
||
|
2013 Chief Operating Officer - B&PT; Director
|
||||
|
2012 Group President
|
||||
|
2011 President - Mobile Industries & Aerospace
|
||||
|
Ronald J. Myers
|
58
|
2015 Vice President of Human Resources
|
||
|
2014 Vice President of Organizational Advancement Operations
|
||||
|
2012 Vice President - Operational Organizational Advancement
|
||||
14
The Company’s common shares are traded on the New York Stock Exchange under the symbol “TKR.” The estimated number of record holders of the Company’s common shares at
December 31, 2016
was
4,238
. The estimated number of beneficial shareholders at
December 31, 2016
was
43,458
.
The following table provides information about the high and low sales prices for the Company’s common shares and dividends paid for each quarter for the last two fiscal years.
|
|
2016
|
2015
|
|||||||||||||||||
|
Stock prices
|
Dividends
|
Stock prices
|
Dividends
|
||||||||||||||||
|
High
|
Low
|
per share
|
High
|
Low
|
per share
|
||||||||||||||
|
First quarter
|
$
|
33.64
|
|
$
|
22.22
|
|
$
|
0.26
|
|
$
|
43.56
|
|
$
|
37.65
|
|
$
|
0.25
|
|
|
|
Second quarter
|
$
|
37.07
|
|
$
|
28.72
|
|
$
|
0.26
|
|
$
|
43.06
|
|
$
|
36.24
|
|
$
|
0.26
|
|
|
|
Third quarter
|
$
|
35.28
|
|
$
|
29.31
|
|
$
|
0.26
|
|
$
|
36.95
|
|
$
|
26.31
|
|
$
|
0.26
|
|
|
|
Fourth quarter
|
$
|
41.15
|
|
$
|
31.60
|
|
$
|
0.26
|
|
$
|
32.89
|
|
$
|
26.84
|
|
$
|
0.26
|
|
|
Issuer Purchases of Common Shares:
The following table provides information about purchases of its common shares by the Company during the quarter ended
December 31, 2016
.
|
Period
|
Total number
of shares purchased
(1)
|
Average
price paid per share
(2)
|
Total number of
shares purchased as
part of publicly
announced
plans or programs
|
Maximum number
of shares that may
yet be purchased
under the
plans or programs
(3)
|
|||||
|
10/1/2016 - 10/31/2016
|
46,901
|
|
$
|
34.62
|
|
46,199
|
|
2,566,180
|
|
|
11/1/2016 - 11/30/2016
|
282,902
|
|
35.93
|
|
277,500
|
|
2,288,680
|
|
|
|
12/1/2016 - 12/31/2016
|
156,855
|
|
39.52
|
|
154,200
|
|
2,134,480
|
|
|
|
Total
|
486,658
|
|
$
|
36.96
|
|
477,899
|
|
2,134,480
|
|
|
(1)
|
Of the shares purchased in October, November and December, 702, 5,402 and 2,655, respectively, represent common shares of the Company that were owned and tendered by employees to exercise stock options, and to satisfy withholding obligations in connection with the exercise of stock options and vesting of restricted shares.
|
|
(2)
|
For shares tendered in connection with the vesting of restricted shares, the average price paid per share is an average calculated using the daily high and low of the Company’s common shares as quoted on the New York Stock Exchange at the time of vesting. For shares tendered in connection with the exercise of stock options, the price paid is the real-time trading share price at the time the options are exercised.
|
|
(3)
|
On January 29, 2016, the Board of Directors of the Company approved a share purchase plan pursuant to which the Company may purchase up to five million of its common shares, in the aggregate. This share purchase plan expired on January 31, 2017. Under this plan the Company purchased shares from time to time in open market purchases or privately negotiated transactions and was able to make all or part of the purchases pursuant to accelerated share repurchases or Rule 10b5-1 plans. On February 6, 2017, the Company's Board of Directors approved a new share repurchase plan pursuant to which the Company may purchase up to ten million of its common shares, in the aggregate. This new share purchase plan expires on February 28, 2021.
|
15
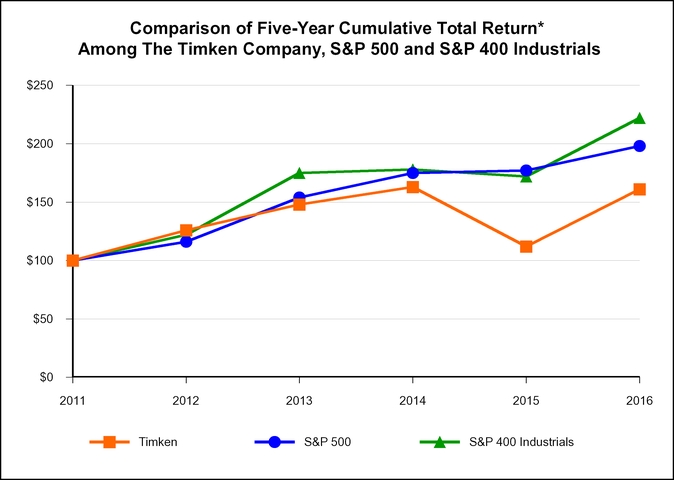
*Total return assumes reinvestment of dividends. Fiscal years ending December 31.
|
|
|||||||||||||||
|
2012
|
2013
|
2014
|
2015
|
2016
|
|||||||||||
|
Timken
|
$
|
126
|
|
$
|
148
|
|
$
|
163
|
|
$
|
112
|
|
$
|
161
|
|
|
S&P 500
|
116
|
|
154
|
|
175
|
|
177
|
|
198
|
|
|||||
|
S&P 400 Industrials
|
122
|
|
175
|
|
178
|
|
172
|
|
222
|
|
|||||
The line graph compares the cumulative total shareholder returns over five years for The Timken Company, the S&P 500 Stock Index and the S&P 400 Industrials Index. The graph assumes, in each case, an initial investment of $100 on January 1, 2011, in Timken common shares, S&P 500 Index and S&P 400 Industrials Index, based on market prices at the end of each fiscal year through and including December 31, 2016, and reinvestment of dividends (and taking into account the value of the TimkenSteel common shares distributed in the Spinoff).
16
Summary of Operations and Other Comparative Data:
|
(Dollars in millions, except per share and per employee data)
|
2016
|
2015
|
2014
|
2013
|
2012
|
||||||||||
|
Statements of Income
|
|||||||||||||||
|
Net sales
|
$
|
2,669.8
|
|
$
|
2,872.3
|
|
$
|
3,076.2
|
|
$
|
3,035.4
|
|
$
|
3,359.5
|
|
|
Gross profit
|
694.8
|
|
793.9
|
|
898.0
|
|
868.4
|
|
1,028.0
|
|
|||||
|
Selling, general and administrative expenses
|
450.0
|
|
494.3
|
|
542.5
|
|
546.6
|
|
554.5
|
|
|||||
|
Impairment and restructuring charges
|
21.7
|
|
14.7
|
|
113.4
|
|
8.7
|
|
29.5
|
|
|||||
|
Operating income (loss)
(1)
|
195.0
|
|
(151.4
|
)
|
208.4
|
|
305.9
|
|
444.0
|
|
|||||
|
Continued Dumping and Subsidy Offset Act income (expense), net
|
59.6
|
|
—
|
|
—
|
|
—
|
|
—
|
|
|||||
|
Other (expense) income, net
|
(0.9
|
)
|
(7.5
|
)
|
19.9
|
|
6.7
|
|
102.0
|
|
|||||
|
Interest expense, net
|
31.6
|
|
30.7
|
|
24.3
|
|
22.5
|
|
28.2
|
|
|||||
|
(Loss) income from continuing operations
|
152.9
|
|
(68.0
|
)
|
149.3
|
|
175.5
|
|
331.5
|
|
|||||
|
Income from discontinued operations, net of income taxes
|
—
|
|
—
|
|
24.0
|
|
87.5
|
|
164.4
|
|
|||||
|
Net income (loss) attributable to The Timken Company
|
$
|
152.6
|
|
$
|
(70.8
|
)
|
$
|
170.8
|
|
$
|
262.7
|
|
$
|
495.5
|
|
|
Balance Sheets
|
|||||||||||||||
|
Inventories, net
|
$
|
545.8
|
|
$
|
543.2
|
|
$
|
585.5
|
|
$
|
582.6
|
|
$
|
611.5
|
|
|
Property, plant and equipment, net
|
804.4
|
|
777.8
|
|
780.5
|
|
855.8
|
|
834.1
|
|
|||||
|
Total assets
|
2,758.3
|
|
2,784.1
|
|
3,001.4
|
|
4,477.9
|
|
4,244.2
|
|
|||||
|
Total debt:
|
|||||||||||||||
|
Short-term debt
|
19.2
|
|
62.0
|
|
7.4
|
|
18.6
|
|
14.3
|
|
|||||
|
Current portion of long-term debt
|
5.0
|
|
15.1
|
|
0.6
|
|
250.7
|
|
9.6
|
|
|||||
|
Long-term debt
|
635.0
|
|
579.4
|
|
518.4
|
|
175.6
|
|
423.4
|
|
|||||
|
Total debt
|
$
|
659.2
|
|
$
|
656.5
|
|
$
|
526.4
|
|
$
|
444.9
|
|
$
|
447.3
|
|
|
Net debt (cash)
|
|||||||||||||||
|
Total debt
|
659.2
|
|
656.5
|
|
526.4
|
|
444.9
|
|
447.3
|
|
|||||
|
Less: cash and cash equivalents and restricted cash
|
(151.5
|
)
|
(129.8
|
)
|
(294.1
|
)
|
(399.7
|
)
|
(601.5
|
)
|
|||||
|
Net debt (cash):
(2)
|
$
|
507.7
|
|
$
|
526.7
|
|
$
|
232.3
|
|
$
|
45.2
|
|
$
|
(154.2
|
)
|
|
Total liabilities
|
1,452.3
|
|
1,439.5
|
|
1,408.7
|
|
1,828.4
|
|
1,996.2
|
|
|||||
|
Shareholders’ equity
|
$
|
1,306.0
|
|
$
|
1,344.6
|
|
$
|
1,589.1
|
|
$
|
2,648.6
|
|
$
|
2,246.6
|
|
|
Capital:
|
|||||||||||||||
|
Net debt (cash)
|
507.7
|
|
526.7
|
|
232.3
|
|
45.2
|
|
(154.2
|
)
|
|||||
|
Shareholders’ equity
|
1,306.0
|
|
1,344.6
|
|
1,589.1
|
|
2,648.6
|
|
2,246.6
|
|
|||||
|
Net debt (cash) + shareholders’ equity (capital)
|
$
|
1,813.7
|
|
$
|
1,871.3
|
|
$
|
1,821.4
|
|
$
|
2,693.8
|
|
$
|
2,092.4
|
|
|
Other Comparative Data
|
|||||||||||||||
|
Income (loss) from continuing operations / Net sales
|
5.7
|
%
|
(2.4
|
%)
|
4.9
|
%
|
5.8
|
%
|
9.9
|
%
|
|||||
|
Net income (loss) attributable to The Timken Company / Net sales
|
5.7
|
%
|
(2.5
|
%)
|
5.6
|
%
|
8.7
|
%
|
14.7
|
%
|
|||||
|
Return on equity
(3)
|
11.7
|
%
|
(5.1
|
%)
|
9.4
|
%
|
6.6
|
%
|
14.8
|
%
|
|||||
|
Net sales per employee
(4)
|
$
|
189.2
|
|
$
|
197.5
|
|
$
|
210.9
|
|
$
|
203.1
|
|
$
|
218.0
|
|
|
Capital expenditures
|
137.5
|
|
105.6
|
|
126.8
|
|
133.6
|
|
118.3
|
|
|||||
|
Depreciation and amortization
|
131.7
|
|
130.8
|
|
137.0
|
|
142.4
|
|
149.6
|
|
|||||
|
Capital expenditures / Net sales
|
5.2
|
%
|
3.7
|
%
|
4.1
|
%
|
4.4
|
%
|
3.5
|
%
|
|||||
|
Dividends per share
|
$
|
1.04
|
|
$
|
1.03
|
|
$
|
1.00
|
|
$
|
0.92
|
|
$
|
0.92
|
|
|
Basic earnings (loss) per share - continuing operations
(5)
|
1.94
|
|
(0.84
|
)
|
1.62
|
|
1.84
|
|
3.41
|
|
|||||
|
Diluted earnings (loss) per share - continuing operations
(5)
|
1.92
|
|
(0.84
|
)
|
1.61
|
|
1.82
|
|
3.38
|
|
|||||
|
Basic earnings (loss) per share
(6)
|
1.94
|
|
(0.84
|
)
|
1.89
|
|
2.76
|
|
5.11
|
|
|||||
|
Diluted earnings (loss) per share
(6)
|
1.92
|
|
(0.84
|
)
|
1.87
|
|
2.74
|
|
5.07
|
|
|||||
|
Net debt (cash) to capital
(2)
|
28.0
|
%
|
28.1
|
%
|
12.8
|
%
|
1.7
|
%
|
(7.4
|
%)
|
|||||
|
Number of employees at year-end
(7)
|
14,111
|
|
14,709
|
|
14,378
|
|
14,794
|
|
15,093
|
|
|||||
|
Number of shareholders
(8)
|
43,458
|
|
40,257
|
|
44,271
|
|
52,218
|
|
50,783
|
|
|||||
|
(1)
|
Operating (loss) income included pension settlement charges of $28.1 million during 2016.
|
|
(2)
|
The Company presents net debt (cash) because it believes net debt (cash) is more representative of the Company’s financial position than total debt due to the amount of cash and cash equivalents.
|
|
(3)
|
Return on equity is defined as (loss) income from continuing operations divided by ending shareholders’ equity.
|
|
(4)
|
Based on average number of employees employed during the year.
|
|
(5)
|
Based on average number of shares outstanding during the year.
|
|
(6)
|
Based on average number of shares outstanding during the year and includes discontinued operations for 2012 through
2014
.
|
|
(7)
|
Adjusted to exclude temporary employees for all periods.
|
|
(8)
|
Includes an estimated count of shareholders having common shares held for their accounts by banks, brokers and trustees for benefit plans.
|
17
(Dollars in millions, except per share data)
OVERVIEW
Introduction:
The Timken Company engineers, manufactures and markets bearings, transmissions, gearboxes, belts, chain, couplings, and related products and offers a variety of power system rebuild and repair services. The Company’s growing product and services portfolio features many strong industrial brands, such as Timken®, Fafnir®, Philadelphia Gear®, Carlisle®, Drives®, Lovejoy® and Interlube
TM
. Timken applies its deep knowledge of metallurgy, friction management and mechanical power transmission across the broad spectrum of bearings and related systems to improve the reliability and efficiency of machinery and equipment all around the world. Known for its quality products and collaborative technical sales model, Timken focuses on providing value to diverse markets worldwide through both OEM and aftermarket channels. With more than
14,000
people operating in
28
countries, Timken makes the world more productive and keeps industry in motion. The Company operates under two reportable segments: (1) Mobile Industries and (2) Process Industries. The following further describes these business segments:
|
•
|
Mobile Industries
serves OEM customers that manufacture off-highway equipment for the agricultural, mining and construction markets; on-highway vehicles including passenger cars, light trucks, and medium- and heavy-duty trucks; rail cars and locomotives; outdoor power equipment; and rotorcraft and fixed-wing aircraft. Beyond service parts sold to OEMs, aftermarket sales to individual end users, equipment owners, operators and maintenance shops are handled through the Company's extensive network of authorized automotive and heavy-truck distributors.
|
|
•
|
Process Industries
serves OEM and end-user customers in industries that place heavy demands on the fixed operating equipment they make or use in heavy and other general industrial sectors. This includes metals, cement and aggregate production; coal and wind power generation; oil and gas extraction and refining; pulp and paper and food processing; and health and critical motion control equipment. Other applications include marine equipment, gear drives, cranes, hoists and conveyors. This segment also supports aftermarket sales and service needs through its global network of authorized industrial distributors.
|
Timken creates value by understanding customer needs and applying its know-how in attractive market sectors. The Company’s business strengths include its channel mix and end-market diversity, serving a broad range of customers and industries across the globe. Timken collaborates with OEMs to improve equipment efficiency with its engineered products and captures subsequent equipment replacement cycles by selling through independent channels in the aftermarket. Timken focuses its international efforts and footprint in regions of the world where strong macroeconomic factors such as urbanization, infrastructure development and sustainability create demand for its products and services.
18
The Timken Business Model
is the specific framework for how the Company evaluates opportunities and differentiates itself in the market.
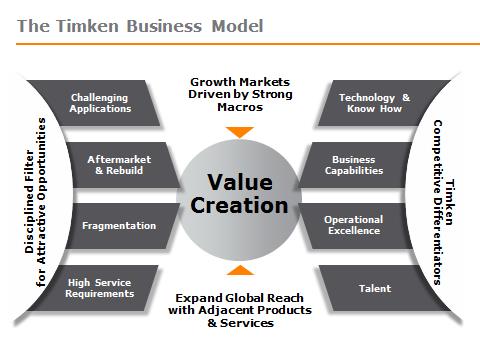
The Company’s Strategy
is to apply the
Timken Business Model
and leverage the Company’s competitive differentiators and strengths to create customer value and drive increased growth and profitability by:
Capturing Opportunities and Expanding Reach.
The Company intends to expand into new and existing markets by leveraging its collective knowledge of metallurgy, friction management and mechanical power transmission to create value for Timken customers. Using a highly collaborative technical selling approach, the Company places particular emphasis on creating unique solutions for challenging and/or demanding applications. The Company intends to grow in attractive market sectors around the world, emphasizing those spaces that are highly fragmented, demand high service and value the reliability and efficiency offered by Timken products. The Company also targets those applications that offer significant aftermarket demand, thereby providing product and services revenue throughout the equipment’s lifetime.
Performing With Excellence.
Timken operates with a relentless drive for exceptional results and a passion for superior execution. The Company embraces a continuous improvement culture that is charged with increasing efficiency, lowering costs, eliminating waste, encouraging organizational agility and building greater brand equity to fuel future growth. This requires the Company’s ongoing commitment to attract, retain and develop the best talent across the world.
Driving Effective Capital Deployment.
The Company is intently focused on providing the highest returns for shareholders through its capital allocation framework, which includes (1) investing in the core business through capital expenditures, research and development and organic growth initiatives like DeltaX; (2) pursuing strategic acquisitions to broaden our portfolio and capabilities, with a focus on bearings, adjacent power transmission products and related services; and (3) returning capital to shareholders through share repurchases and dividends. As part of this framework, the Company may also restructure, reposition or divest underperforming product lines or assets.
19
The following items highlight certain of the Company
'
s more significant strategic accomplishments in
2016
:
Business Highlights
|
•
|
The Company continued to advance its manufacturing footprint initiatives with:
|
|
◦
|
The announced closures of its bearing plants in Pulaski, Tennessee ("Pulaski") and Altavista, Virginia ("Altavista") and its manufacturing facility in Benoni, South Africa ("Benoni"), which are expected to be completed in 2017. Production from Altavista will be transferring to the Company's bearing plant near Lincolnton, North Carolina; and
|
|
◦
|
The closure of its bearing facility in the United Kingdom ("U.K.").
|
|
•
|
Received a multi-year contract from the U.S. Department of Defense ("DoD") to provide engineering and supply Philadelphia Gear main reduction gears for the Navy's next generation of Arleigh Burke DDG 51 class ships. The fixed price contract includes options that, if exercised, could bring the cumulative value of the contract to more than $1 billion over its estimated 10-year life; and
|
|
•
|
Completed the installation of aerospace transmission overhaul and repair equipment at its plant in Manchester, Connecticut. This equipment adds new capabilities and will support a contract secured in 2015 to overhaul and repair up to roughly 220 Apache AH64D main transmissions for the DoD over a three-year period.
|
Share Repurchases
|
•
|
On February 6, 2017, the Company's Board of Directors approved a new share repurchase plan pursuant to which the Company may purchase up to ten million of its common shares, in the aggregate. This new share purchase plan expires on February 28, 2021.
|
Acquisitions
|
•
|
On October 31, 2016, the Company acquired EDT Corp. ("EDT"), a manufacturer of polymer housed units and stainless steel ball bearings used widely by the food and beverage industry, for $10 million in cash. Headquartered in Vancouver, Washington, EDT had sales of less than $10 million for the twelve months ended September 30, 2016.
|
|
•
|
On July 8, 2016, the Company acquired Lovejoy Inc. ("Lovejoy"), a manufacturer of premium industrial couplings and universal joints, for $63.5 million in cash and assumed debt of $2.2 million. Headquartered in Downers Grove, Illinois, with additional locations in the U.S., Canada and Germany, Lovejoy had sales of approximately $55 million for the twelve months ended June 30, 2016.
|
20
RESULTS OF OPERATIONS
2016
vs.
2015
Overview:
|
2016
|
2015
|
$ Change
|
% Change
|
||||||||
|
Net sales
|
$
|
2,669.8
|
|
$
|
2,872.3
|
|
$
|
(202.5
|
)
|
(7.1
|
%)
|
|
Net income (loss)
|
152.9
|
|
(68.0
|
)
|
220.9
|
|
(324.9
|
%)
|
|||
|
Net income attributable to noncontrolling interest
|
0.3
|
|
2.8
|
|
(2.5
|
)
|
(89.3
|
%)
|
|||
|
Net income (loss) attributable to The Timken Company
|
$
|
152.6
|
|
$
|
(70.8
|
)
|
$
|
223.4
|
|
(315.5
|
%)
|
|
Diluted earnings (loss) per share
|
$
|
1.92
|
|
$
|
(0.84
|
)
|
$
|
2.76
|
|
(328.6
|
%)
|
|
Average number of shares—diluted
|
79,234,324
|
|
84,631,778
|
|
—
|
|
(6.4
|
%)
|
|||
The
decrease
in net sales was primarily due to lower end-market demand and the impact of foreign currency exchange rate changes, partially offset by the net benefit of acquisitions and divestitures. The increase in net income in
2016
compared with
2015
was primarily due to pretax pension settlement charges that were $436.9 million lower than
2015
and pretax U.S. Continued Dumping and Subsidy Offset Act ("CDSOA") income of $59.6 million recorded in
2016
. In addition, the Company's net income in
2016
was impacted by lower volume across most market sectors, unfavorable price/mix, higher restructuring charges and the impact of foreign currency exchange rate changes, partially offset by lower material and manufacturing costs, and lower selling, general and administrative ("SG&A") expenses compared with
2015
. The prior year also included a gain from the divestiture of Timken Alcor Aerospace Technologies, Inc. ("Alcor") and higher discrete income tax benefits.
Outlook:
The Company expects 2017 full-year sales to be flat compared with
2016
, as the benefit of acquisitions is offset by the estimated negative impact of foreign currency exchange rate changes. The Company's earnings are expected to be lower in 2017 than
2016
, primarily due to no expected CDSOA income in 2017, partially offset by lower pension settlement charges. Timken plans to adopt mark-to-market accounting for its defined benefit pension and other postretirement benefit plans in the first quarter of 2017, which will impact earnings before interest and taxes ("EBIT")for 2017 and prior years on a retrospective basis. Refer to
Change in Accounting Principle
in the
Other Disclosures
section for additional information.
The Company expects to generate operating cash of approximately
$310 million
in 2017, a decrease from
2016
of approximately
$92 million
or
23%
, as the Company anticipates lower net income (including no expected CDSOA receipts), lower benefit from working capital and higher income tax payments. The Company expects capital expenditures to be approximately
4%
of sales in 2017, compared with
5%
of sales in
2016
.
21
THE STATEMENTS OF INCOME
Sales:
|
2016
|
2015
|
$ Change
|
% Change
|
||||||||
|
Net sales
|
$
|
2,669.8
|
|
$
|
2,872.3
|
|
$
|
(202.5
|
)
|
(7.1
|
%)
|
Net sales
decreased
in
2016
compared with
2015
primarily due to lower organic sales of $239 million, the effect of foreign currency exchange rate changes of $47 million and divestitures of $15 million, partially offset by the benefit of acquisitions of $99 million. The decrease in organic sales was driven by lower demand across most market sectors, partially offset by growth in the automotive market sector.
Gross Profit:
|
2016
|
2015
|
$ Change
|
Change
|
||||||||
|
Gross profit
|
$
|
694.8
|
|
$
|
793.9
|
|
$
|
(99.1
|
)
|
(12.5
|
%)
|
|
Gross profit % to net sales
|
26.0
|
%
|
27.6
|
%
|
—
|
|
(160) bps
|
|
|||
|
Rationalization expenses included in cost of products sold
|
$
|
11.6
|
|
$
|
6.4
|
|
$
|
5.2
|
|
81.3
|
%
|
Gross profit
decreased
in
2016
compared with
2015
, primarily due to the impact of lower volume of $91 million, unfavorable price/mix of $65 million, higher restructuring charges and the impact of foreign currency exchange rate changes. These factors were partially offset by lower material and manufacturing costs net of manufacturing underutilization of $61 million and the benefit of acquisitions.
Selling, General and Administrative Expenses:
|
2016
|
2015
|
$ Change
|
Change
|
||||||||
|
Selling, general and administrative expenses
|
$
|
450.0
|
|
$
|
494.3
|
|
$
|
(44.3
|
)
|
(9.0%
|
)
|
|
Selling, general and administrative expenses % to net sales
|
16.9
|
%
|
17.2
|
%
|
—
|
|
(30) bps
|
|
|||
The
decrease
in SG&A expenses in
2016
compared with
2015
was primarily due to the benefit of cost reduction initiatives of $41 million, the impact of foreign currency exchange rate changes, lower depreciation expense and lower non-income tax expense, partially offset by additional expenses from Carlstar Belts LLC ("Timken Belts"), Lovejoy and EDT acquired in September 2015, July 2016, and October 2016, respectively.
Impairment and Restructuring Charges:
|
2016
|
2015
|
$ Change
|
|||||||
|
Impairment charges
|
$
|
3.9
|
|
$
|
3.3
|
|
$
|
0.6
|
|
|
Severance and related benefit costs
|
15.3
|
|
7.7
|
|
7.6
|
|
|||
|
Exit costs
|
2.5
|
|
3.7
|
|
(1.2
|
)
|
|||
|
Total
|
$
|
21.7
|
|
$
|
14.7
|
|
$
|
7.0
|
|
Impairment and restructuring charges of
$21.7 million
in
2016
were primarily comprised of severance and related benefit costs associated with initiatives to reduce headcount and right-size the Company's manufacturing footprint, including the planned closures of the Altavista, Pulaski and Benoni bearing plants. In addition, the Company recognized impairment charges of $3.9 million during 2016 associated with the planned closures of the Altavista and Benoni bearing plants.
Impairment and restructuring charges of
$14.7 million
in
2015
were primarily due to severance and related benefit costs associated with initiatives to reduce headcount, impairment charges of $3.0 million related to the Company's service center in Niles, Ohio and exit costs of approximately $3.0 million related to the Company's termination of its relationship with one of its third-party sales representatives in Colombia.
22
Pension Settlement Charges:
|
2016
|
2015
|
$ Change
|
|||||||
|
Pension settlement charges
|
$
|
28.1
|
|
$
|
465.0
|
|
$
|
(436.9
|
)
|
Pension settlement charges in
2016
were primarily related to $19 million of lump–sum distributions to new retirees and deferred vested participants that triggered remeasurements, as well as $7 million related to the purchase of a group annuity contract from The Canada Life Assurance Company ("Canada Life") for one of the Company's Canadian defined benefit pension plans, which was executed in September
2016
. These actions resulted in a decrease in the Company's pension obligations of approximately $70 million.
Pension settlement charges in
2015
were primarily due to the purchase of group annuity contracts from Prudential Insurance Company of America ("Prudential") by two of the Company's U.S. defined benefit pension plans. The two group annuity contracts require Prudential to pay and administer future pension benefits for approximately 8,400 U.S. Timken retirees in the aggregate. The Company transferred a total of approximately $1.1 billion of its pension obligations and a total of approximately $1.2 billion of pension assets to Prudential in these transactions. In addition to the purchase of the group annuity contracts, the Company made lump-sum distributions of $37.2 million to new retirees. The Company also incurred pension settlement and curtailment charges related to one of its Canadian defined benefit pension plans. As a result of the group annuity contracts, lump-sum distributions as well as pension settlement and curtailment charges related to the Canadian pension plan, the Company incurred total pension settlement and curtailment charges of $465.0 million, including professional fees of $2.6 million, in
2015
.
Gain on Divestiture:
|
2016
|
2015
|
$ Change
|
|||||||
|
Gain on divestiture
|
$
|
—
|
|
$
|
28.7
|
|
$
|
(28.7
|
)
|
Gain on divestiture in 2015 was primarily related to the gain on the sale of Alcor of $29.0 million in the fourth quarter of 2015.
Interest Income (Expense):
|
2016
|
2015
|
$ Change
|
% Change
|
||||||||
|
Interest (expense)
|
$
|
(33.5
|
)
|
$
|
(33.4
|
)
|
$
|
(0.1
|
)
|
0.3
|
%
|
|
Interest income
|
1.9
|
|
2.7
|
|
(0.8
|
)
|
(29.6
|
%)
|
|||
Other (Expense) Income:
|
2016
|
2015
|
$ Change
|
% Change
|
||||||||
|
CDSOA income, net
|
$
|
59.6
|
|
$
|
—
|
|
$
|
59.6
|
|
NM
|
|
|
Fixed asset write-off
|
—
|
|
(9.7
|
)
|
9.7
|
|
(100.0
|
%)
|
|||
|
Other income (expense), net
|
(0.9
|
)
|
2.2
|
|
(3.1
|
)
|
(140.9
|
%)
|
|||
|
Total other income (expense)
|
$
|
58.7
|
|
$
|
(7.5
|
)
|
$
|
66.2
|
|
NM
|
|
CDSOA income, net in
2016
represents income recorded in connection with funds awarded to the Company from monies collected by U.S. Customs and Border Protection ("U.S. Customs") from antidumping cases, net of related professional fees. Refer to
Note 21 - Continued Dumping and Subsidy Offset Act
for further discussion.
During the fourth quarter of 2015, the Company wrote-off $9.7 million that remained in construction in process ("CIP") after the related assets were placed into service. The majority of these assets were placed into service between 2008 and 2012. This item was identified during an examination of aged balances in the CIP account. Management of the Company concluded that the correction of this error in the fourth quarter of 2015 and the presence of this error in prior periods was immaterial to all periods presented.
23
Income Tax Expense:
|
2016
|
2015
|
$ Change
|
Change
|
||||||||
|
Income tax expense (benefit)
|
$
|
69.2
|
|
$
|
(121.6
|
)
|
$
|
190.8
|
|
(156.9%
|
)
|
|
Effective tax rate
|
31.2
|
%
|
64.1
|
%
|
—
|
|
(3,290
|
) bps
|
|||
The effective tax rate for
2016
was favorable relative to the U.S. federal statutory rate primarily due to U.S. foreign tax credits, earnings in certain foreign jurisdictions where the effective tax rate is less than 35%, the U.S. manufacturing deduction, and certain discrete tax benefits (net). These favorable impacts were partially offset by U.S. taxation of foreign income and losses at certain foreign subsidiaries where no tax benefit could be recorded.
The effective tax rate for
2015
was
64.1%
, which reflects a tax benefit on pretax loss. The tax benefit rate of
64.1%
was greater than the U.S. statutory rate of 35% primarily due to the tax benefits of reversals of certain valuation allowances in foreign jurisdictions, U.S. foreign tax credits, earnings in certain foreign jurisdictions where the effective tax rate was less than 35%, reversals of reserves for uncertain tax positions, state and local taxes, the U.S. manufacturing deduction, the U.S. research tax credit and other U.S. tax benefits. These factors were offset by U.S. taxation of foreign earnings, recording of deferred tax liabilities related to foreign branch operations, and losses at certain foreign subsidiaries where no tax benefit could be recorded.
The change in the effective tax rate for
2016
compared with
2015
was primarily due to reduced valuation allowance releases in
2016
, partially offset by increased US foreign tax credits, the US manufacturing deduction, and discrete tax items occurring in
2016
. Refer to the table below for additional detail of the impact of each item on income tax expense.
|
2015 to 2016 $ Change
|
|||
|
Impact of global earnings at the U.S. statutory rate of 35%
|
$
|
144.1
|
|
|
Foreign taxation impact
|
4.4
|
|
|
|
U.S. taxation
(1)
|
10.6
|
|
|
|
Other discrete items, net
|
31.7
|
|
|
|
Total
|
$
|
190.8
|
|
(1)
U.S. taxation includes the impact of foreign tax credits, U.S. Manufacturing deductions, U.S. Research and Experimentation credit, U.S. state and local taxation, U.S. taxation of foreign earnings and other U.S. items.
Refer to
Note 17 - Income Taxes
for more information on the computation of the income tax expense in interim periods.
24
BUSINESS SEGMENTS
The Company
'
s reportable segments are business units that serve different industry sectors. While the segments often operate using shared infrastructure, each reportable segment is managed to address specific customer needs in these diverse market sectors. The primary measurement used by management to measure the financial performance of each segment is EBIT. Refer to
Note 16 - Segment Information
in the Notes to the Consolidated Financial Statements for the reconciliation of EBIT by segment to consolidated income before income taxes.
The presentation of segment results below includes a reconciliation of the changes in net sales for each segment reported in accordance with U.S. GAAP to net sales adjusted to remove the effects of acquisitions and divestitures completed in 2016 and 2015 and foreign currency exchange rate changes. The effects of acquisitions, divestitures and foreign currency exchange rate changes on net sales are removed to allow investors and the Company to meaningfully evaluate the percentage change in net sales on a comparable basis from period to period.
The following items highlight the Company
'
s acquisitions and divestitures completed in
2016
and
2015
:
|
•
|
The Company acquired EDT during the fourth quarter of 2016. Results for EDT are reported in the Process Industries segment.
|
|
•
|
The Company acquired Lovejoy during the third quarter of 2016. Substantially all of the results for Lovejoy are reported in the Process Industries segment based on the customers and underlying markets served.
|
|
•
|
The Company sold Alcor during the fourth quarter of 2015. Results for Alcor prior to the sale were reported in the Mobile Industries segment.
|
|
•
|
The Company acquired Timken Belts during the third quarter of 2015. Results for Timken Belts are reported in the Mobile Industries and Process Industries segments based on the customers and underlying markets served.
|
Mobile Industries Segment:
|
2016
|
2015
|
$ Change
|
Change
|
||||||||
|
Net sales
|
$
|
1,446.4
|
|
$
|
1,558.3
|
|
$
|
(111.9
|
)
|
(7.2%
|
)
|
|
EBIT
|
$
|
108.8
|
|
$
|
173.3
|
|
$
|
(64.5
|
)
|
(37.2%
|
)
|
|
EBIT margin
|
7.5
|
%
|
11.1
|
%
|
—
|
|
(360
|
) bps
|
|||
|
|
2016
|
2015
|
$ Change
|
% Change
|
|||||||
|
Net sales
|
$
|
1,446.4
|
|
$
|
1,558.3
|
|
$
|
(111.9
|
)
|
(7.2%
|
)
|
|
Less: Acquisitions
|
46.8
|
|
—
|
|
46.8
|
|
NM
|
|
|||
|
Divestitures
|
(15.7
|
)
|
—
|
|
(15.7
|
)
|
NM
|
|
|||
|
Currency
|
(22.8
|
)
|
—
|
|
(22.8
|
)
|
NM
|
|
|||
|
Net sales, excluding the impact of acquisitions, divestitures and currency
|
$
|
1,438.1
|
|
$
|
1,558.3
|
|
$
|
(120.2
|
)
|
(7.7%
|
)
|
The Mobile Industries segment's net sales, excluding the effects of acquisitions, divestitures and foreign currency exchange rate changes, decreased
$120.2 million
or
7.7%
in
2016
compared with
2015
. The decline in net sales was primarily driven by a decrease in the rail, off-highway, aerospace and heavy truck market sectors, partially offset by organic growth in the automotive market sector. EBIT
decreased
by
$64.5 million
or
37.2%
in
2016
compared with
2015
primarily due to unfavorable price/mix of $52 million, the impact of lower volume of $35 million, higher restructuring charges, the impact of foreign currency exchange rate changes and the net unfavorable impact of acquisitions and divestitures, partially offset by lower material and manufacturing costs net of manufacturing underutilization of $53 million and lower SG&A expenses. EBIT for 2015 also included a gain on the sale of Alcor of $29 million.
Full-year sales for the Mobile Industries segment are expected to be down approximately 4% to 5% in 2017 compared with
2016
. This reflects lower expected volume in the rail, agriculture and heavy truck market sectors and the unfavorable impact of foreign currency exchange rate changes of approximately 1.5%, partially offset by the benefit of acquisitions. EBIT for the Mobile Industries segment is expected to decrease in 2017 compared with
2016
due to lower volume, unfavorable price/mix and the impact of foreign currency exchange rate changes.
25
Process Industries Segment:
|
2016
|
2015
|
$ Change
|
Change
|
||||||||
|
Net sales
|
$
|
1,223.4
|
|
$
|
1,314.0
|
|
$
|
(90.6
|
)
|
(6.9%
|
)
|
|
EBIT
|
$
|
163.2
|
|
$
|
190.2
|
|
$
|
(27.0
|
)
|
(14.2%
|
)
|
|
EBIT margin
|
13.3
|
%
|
14.5
|
%
|
—
|
|
(120) bps
|
|
|||
|
|
2016
|
2015
|
$ Change
|
% Change
|
|||||||
|
Net sales
|
$
|
1,223.4
|
|
$
|
1,314.0
|
|
$
|
(90.6
|
)
|
(6.9%
|
)
|
|
Less: Acquisitions
|
52.4
|
|
—
|
|
52.4
|
|
NM
|
|
|||
|
Currency
|
(23.8
|
)
|
—
|
|
(23.8
|
)
|
NM
|
|
|||
|
Net sales, excluding the impact of acquisitions and currency
|
$
|
1,194.8
|
|
$
|
1,314.0
|
|
$
|
(119.2
|
)
|
(9.1%
|
)
|
The Process Industries segment's net sales, excluding the effects of acquisitions and foreign currency exchange rate changes,
decreased
$119.2 million
or
9.1%
in
2016
compared with
2015
. The decline was primarily due to lower demand across the heavy industries (mainly oil and gas), industrial aftermarket, military marine and wind energy market sectors. EBIT decreased
$27.0 million
or
14.2%
in
2016
compared with
2015
primarily due to the impact of lower volume of $56 million and unfavorable price/mix, partially offset by lower SG&A expenses of $24 million and lower material and manufacturing costs net of manufacturing underutilization. EBIT in 2015 also included a charge of $8.2 million related to the write-off of certain CIP balances. Refer to
Note 8 - Property, Plant and Equipment
for additional information.
Full-year sales for the Process Industries segment are expected to be up approximately 4% to 5% in 2017 compared with
2016
. This reflects higher expected demand in the industrial aftermarket and wind energy sectors and the benefit of acquisitions, partially offset by the unfavorable impact of foreign currency exchange rate changes of approximately 1.5%. EBIT for the Process Industries segment is expected to increase in 2017 compared with
2016
primarily due to the impact of higher volume and the impact of improved manufacturing underutilization and the benefit of acquisitions, partially offset by foreign currency exchange rate changes.
Corporate:
|
2016
|
2015
|
$ Change
|
Change
|
||||||||
|
Corporate expenses
|
$
|
49.8
|
|
$
|
57.4
|
|
$
|
(7.6
|
)
|
(13.2%
|
)
|
|
Corporate expenses % to net sales
|
1.9
|
%
|
2.0
|
%
|
—
|
|
(10) bps
|
|
|||
Corporate expenses
decreased
in
2016
compared with
2015
primarily due to cost reduction initiatives.
26
RESULTS OF OPERATIONS:
2015
vs.
2014
Overview:
|
2015
|
2014
|
$ Change
|
% Change
|
||||||||
|
Net sales
|
$
|
2,872.3
|
|
$
|
3,076.2
|
|
$
|
(203.9
|
)
|
(6.6
|
%)
|
|
(Loss) income from continuing operations
|
(68.0
|
)
|
149.3
|
|
(217.3
|
)
|
(145.5
|
%)
|
|||
|
Income from discontinued operations
|
—
|
|
24.0
|
|
(24.0
|
)
|
(100.0
|
%)
|
|||
|
Income attributable to noncontrolling interest
|
2.8
|
|
2.5
|
|
0.3
|
|
12.0
|
%
|
|||
|
Net (loss) income attributable to The Timken Company
|
$
|
(70.8
|
)
|
$
|
170.8
|
|
$
|
(241.6
|
)
|
(141.5
|
%)
|
|
Diluted (loss) earnings per share:
|
|||||||||||
|
Continuing operations
|
$
|
(0.84
|
)
|
$
|
1.61
|
|
$
|
(2.45
|
)
|
(152.2
|
%)
|
|
Discontinued operations
|
—
|
|
0.26
|
|
(0.26
|
)
|
(100.0
|
%)
|
|||
|
Diluted earnings per share
|
$
|
(0.84
|
)
|
$
|
1.87
|
|
$
|
(2.71
|
)
|
(144.9
|
%)
|
|
Average number of shares - diluted
|
84,631,778
|
|
91,224,328
|
|
—
|
|
(7.2
|
%)
|
|||
The
decrease
in net sales was primarily due to the impact of foreign currency exchange rate changes and lower end market demand, partially offset by the benefit of acquisitions. The Company's net income from continuing operations in 2015 was lower compared to 2014 due to non-cash pension settlement charges of $465.0 million recorded in 2015, the impact of lower volume across most end market sectors, unfavorable price/mix and foreign currency exchange rate changes. These factors were partially offset by lower SG&A expenses, lower material and manufacturing costs and a lower provision for income taxes. The decrease in income from discontinued operations in 2015 compared with 2014 was due to the Spinoff that was completed on June 30, 2014.
THE STATEMENTS OF INCOME
Sales:
|
2015
|
2014
|
$ Change
|
% Change
|
||||||||
|
Net sales
|
$
|
2,872.3
|
|
$
|
3,076.2
|
|
$
|
(203.9
|
)
|
(6.6
|
%)
|
Net sales
decreased
in
2015
compared with
2014
, primarily due to the impact of foreign currency exchange rate changes of $152 million and lower organic sales of $90 million, partially offset by the benefit of acquisitions of $39 million. The decrease in organic sales was driven by lower demand across most of the Company's end market sectors, partially offset by growth in the wind, military marine, rail and automotive sectors.
Gross Profit:
|
2015
|
2014
|
$ Change
|
Change
|
||||||||
|
Gross profit
|
$
|
793.9
|
|
$
|
898.0
|
|
$
|
(104.1
|
)
|
(11.6
|
%)
|
|
Gross profit % to net sales
|
27.6
|
%
|
29.2
|
%
|
—
|
|
(160
|
) bps
|
|||
|
Rationalization expenses included in cost of products sold
|
$
|
6.4
|
|
$
|
3.6
|
|
$
|
2.8
|
|
77.8
|
%
|
Gross profit
decreased
in
2015
compared with
2014
, primarily due to the impact of lower volume of $40 million, unfavorable price/mix of $37 million and the impact of foreign currency exchange rate changes of $63 million. These factors were partially offset by the impact of inventory valuation adjustments that occurred during 2014 of $20 million, lower raw material and operating costs net of manufacturing underutilization and the impact of acquisitions.
27
Selling, General and Administrative Expenses:
|
2015
|
2014
|
$ Change
|
Change
|
||||||||
|
Selling, general and administrative expenses
|
$
|
494.3
|
|
$
|
542.5
|
|
$
|
(48.2
|
)
|
(8.9%
|
)
|
|
Selling, general and administrative expenses % to net sales
|
17.2
|
%
|
17.6
|
%
|
—
|
|
(40) bps
|
|
|||
The
decrease
in SG&A expenses in
2015
compared with
2014
was primarily due to lower incentive compensation expense of $28 million and the impact of foreign currency exchange rate changes of $20 million. The benefits of cost reduction initiatives were largely offset by the impact of acquisitions, higher pension and bad debt expense and costs associated with ongoing growth initiatives.
Impairment and Restructuring Charges:
|
2015
|
2014
|
$ Change
|
|||||||
|
Impairment charges
|
$
|
3.3
|
|
$
|
98.9
|
|
$
|
(95.6
|
)
|
|
Severance and related benefit costs
|
7.7
|
|
10.7
|
|
(3.0
|
)
|
|||
|
Exit costs
|
3.7
|
|
3.8
|
|
(0.1
|
)
|
|||
|
Total
|
$
|
14.7
|
|
$
|
113.4
|
|
$
|
(98.7
|
)
|
Impairment and restructuring charges of
$14.7 million
in
2015
were primarily due to severance and related benefit costs associated with initiatives to reduce headcount, impairment charges of $3.0 million related to the Company's service center in Niles, Ohio and exit costs of approximately $3.0 million related to the Company's termination of its relationship with one of its third-party sales representatives in Colombia. Impairment and restructuring charges of $113.4 million in 2014 were primarily due to goodwill and other intangible impairment charges of $96.2 million that were recorded in the third quarter of 2014.
Pension Settlement Charges:
|
2015
|
2014
|
$ Change
|
|||||||
|
Pension settlement charges
|
$
|
465.0
|
|
$
|
33.7
|
|
$
|
431.3
|
|
Pension settlement charges in 2015 were primarily due to the purchase of group annuity contracts from Prudential by two of the Company's U.S. defined benefit pension plans. The two group annuity contracts require Prudential to pay and administer future pension benefits for approximately 8,400 U.S. Timken retirees in the aggregate. The Company transferred a total of approximately $1.1 billion of its pension obligations and a total of approximately $1.2 billion of pension assets to Prudential in these transactions. In addition to the purchase of the group annuity contracts, the Company made lump-sum distributions of $37 million to new retirees. The Company also incurred pension settlement and curtailment charges related to one of its Canadian defined benefit pension plans. As a result of the group annuity contracts, lump-sum distributions as well as pension settlement and curtailment charges related to the Canadian pension plan, the Company incurred total pension settlement and curtailment charges of $465.0 million, including professional fees of $2.6 million, in 2015.
Pension settlement charges recorded in
2014
were primarily the result of the settlement of approximately $110 million of the Company's pension obligations related to its defined benefit pension plan in the United States as a result of lump sum distributions to new retirees and certain deferred vested plan participants in 2014.
Gain on Divestiture:
|
2015
|
2014
|
$ Change
|
|||||||
|
Gain on divestiture
|
$
|
28.7
|
|
$
|
—
|
|
$
|
28.7
|
|
Gain on divestiture in 2015 was primarily related to the gain on the sale of Alcor of $29.0 million in the fourth quarter of 2015, partially offset by a loss on the sale of the Company's repair business in Niles, Ohio of $0.3 million in the second quarter of 2015.
28
Interest Income (Expense):
|
2015
|
2014
|
$ Change
|
% Change
|
||||||||
|
Interest (expense)
|
$
|
(33.4
|
)
|
$
|
(28.7
|
)
|
$
|
(4.7
|
)
|
16.4
|
%
|
|
Interest income
|
$
|
2.7
|
|
$
|
4.4
|
|
$
|
(1.7
|
)
|
(38.6
|
%)
|
Interest expense for
2015
increased
compared with
2014
primarily due to lower capitalized interest and higher average debt, partially offset by lower average interest rates. Interest income
decreased
for
2015
compared with
2014
primarily due to lower interest income recognized on the deferred payments related to the sale of real estate in Sao Paulo, Brazil ("Sao Paulo"). The last of the deferred payments was received during the fourth quarter of 2015.
Other (Expense) Income:
|
2015
|
2014
|
$ Change
|
% Change
|
||||||||
|
Gain on sale of real estate
|
$
|
—
|
|
$
|
22.6
|
|
$
|
(22.6
|
)
|
(100.0
|
%)
|
|
Fixed asset write-off
|
(9.7
|
)
|
—
|
|
(9.7
|
)
|
NM
|
|
|||
|
Other income (expense), net
|
2.2
|
|
(2.7
|
)
|
4.9
|
|
(181.5
|
%)
|
|||
|
Total
|
$
|
(7.5
|
)
|
$
|
19.9
|
|
$
|
(27.4
|
)
|
(137.7
|
%)
|
During
2014
, the Company recognized a gain of $22.6 million related to the sale of real estate in Sao Paulo.
During the fourth quarter of 2015, the Company wrote-off $9.7 million that remained in CIP after the related assets were placed into service. The majority of these assets were placed into service between 2008 and 2012. This item was identified during an examination of aged balances in the CIP account. Management of the Company concluded that the correction of this error in the fourth quarter of 2015 and the presence of this error in prior periods was immaterial to all periods presented.
29
Income Tax Expense:
|
2015
|
2014
|
$ Change
|
Change
|
||||||||
|
Income tax (benefit) expense
|
$
|
(121.6
|
)
|
$
|
54.7
|
|
$
|
(176.3
|
)
|
(322.3%
|
)
|
|
Effective tax rate
|
64.1
|
%
|
26.8
|
%
|
—
|
|
3,730 bps
|
|
|||
The effective tax rate for 2015 was 64.1%, which reflects a tax benefit on pretax loss. The tax benefit rate of 64.1% was greater than the U.S. statutory rate of 35% primarily due to the tax benefits of reversals of certain valuation allowances in foreign jurisdictions, U.S. foreign tax credits, earnings in certain foreign jurisdictions where the effective tax rate was less than 35%, reversals of reserves for uncertain tax positions, state and local taxes, the U.S. manufacturing deduction, the U.S. research tax credit and other U.S. tax benefits. These factors were offset by U.S. taxation of foreign earnings, recording of deferred tax liabilities related to foreign branch operations, and losses at certain foreign subsidiaries where no tax benefit could be recorded.
The effective tax rate on pretax income for 2014 was favorable relative to the U.S. federal statutory rate primarily due to U.S. foreign tax credits, earnings in certain foreign jurisdictions where the effective tax rate was less than 35%, adjustments to tax accruals for undistributed foreign earnings, the U.S. manufacturing deduction, the U.S. research tax credit and other U.S. tax benefits. These factors were partially offset by U.S. taxation of foreign income, losses at certain foreign subsidiaries where no tax benefit could be recorded, non-deductible intangible asset impairment charges recorded in the Mobile Industries segment and accruals for uncertain tax positions.
Refer to the table below for additional detail of the impact of each item on income tax expense:
|
2014 to 2015
$ Change
|
|||
|
Impact of global earnings at the U.S. statutory rate of 35%
|
$
|
(137.8
|
)
|
|
Foreign taxation impact
|
4.1
|
|
|
|
U.S. taxation
(1)
|
(14.3
|
)
|
|
|
Other discrete items, net
|
(28.3
|
)
|
|
|
Total
|
$
|
(176.3
|
)
|
(1)
U.S. taxation includes the impact of foreign tax credits, U.S. Manufacturing deductions, U.S. Research and Experimentation credit, U.S. state and local taxation, U.S. taxation of foreign earnings and other U.S. items.
Discontinued Operations:
|
2015
|
2014
|
$ Change
|
|||||||
|
Net sales
|
$
|
—
|
|
$
|
786.2
|
|
$
|
(786.2
|
)
|
|
Income before income taxes
|
—
|
|
40.0
|
|
(40.0
|
)
|
|||
|
Income taxes
|
—
|
|
16.0
|
|
(16.0
|
)
|
|||
|
Operating results, net of tax
|
$
|
—
|
|
$
|
24.0
|
|
$
|
(24.0
|
)
|
On June 30, 2014, the Company completed the Spinoff. The operating results, net of tax, included one-time transaction costs of $57.1 million during 2014. These costs included consulting and professional fees associated with preparing for and executing the Spinoff.
30
BUSINESS SEGMENTS
The primary measurement used by management to measure the financial performance of each segment is EBIT. Refer to
Note 16 - Segment Information
in the Notes to the Consolidated Financial Statements for the reconciliation of EBIT by segment to consolidated income before income taxes.
The presentation of segment results below includes a reconciliation of the changes in net sales for each segment reported in accordance with U.S. GAAP to net sales adjusted to remove the effects of acquisitions and divestitures completed in 2015 and 2014 and foreign currency exchange rate changes. The effects of acquisitions, divestitures and foreign currency exchange rate changes on net sales are removed to allow investors and the Company to meaningfully evaluate the percentage change in net sales on a comparable basis from period to period.
The following items highlight the Company
'
s acquisitions and divestitures completed in
2015
and
2014
:
|
•
|
The Company sold Alcor during the fourth quarter of 2015. Results for Alcor were reported in the Mobile Industries segment.
|
|
•
|
The Company acquired the Belts business during the third quarter of 2015. Results for Timken Belts are reported in the Mobile Industries and Process Industries segments based on the customers served.
|
|
•
|
The Company acquired Revolvo Ltd. ("Revolvo") during the fourth quarter of 2014. Results for Revolvo are reported in the Process Industries segment.
|
|
•
|
The Company sold its aerospace engine overhaul business during the fourth quarter of 2014. Results for the aerospace engine overhaul business were reported in the Mobile Industries segment.
|
|
•
|
The Company acquired Schulz Group ("Schulz") during the second quarter of 2014. Results for Schulz are reported in the Process Industries segment.
|
Mobile Industries Segment:
|
2015
|
2014
|
$ Change
|
Change
|
||||||||
|
Net sales
|
$
|
1,558.3
|
|
$
|
1,685.4
|
|
$
|
(127.1
|
)
|
(7.5
|
%)
|
|
EBIT
|
$
|
173.3
|
|
$
|
65.6
|
|
$
|
107.7
|
|
164.2
|
%
|
|
EBIT margin
|
11.1
|
%
|
3.9
|
%
|
—
|
|
720 bps
|
|
|||
|
|
2015
|
2014
|
$ Change
|
% Change
|
|||||||
|
Net sales
|
$
|
1,558.3
|
|
$
|
1,685.4
|
|
$
|
(127.1
|
)
|
(7.5
|
%)
|
|
Less: Acquisitions
|
21.8
|
|
—
|
|
21.8
|
|
NM
|
|
|||
|
Divestitures
|
(13.2
|
)
|
—
|
|
(13.2
|
)
|
NM
|
|
|||
|
Currency
|
(88.1
|
)
|
—
|
|
(88.1
|
)
|
NM
|
|
|||
|
Net sales, excluding the impact of acquisitions,
divestitures and currency |
$
|
1,637.8
|
|
$
|
1,685.4
|
|
$
|
(47.6
|
)
|
(2.8
|
%)
|
The Mobile Industries segment's net sales, excluding the effects of acquisitions, divestitures and foreign currency exchange rate changes, decreased
$47.6 million
or
2.8%
in
2015
compared with
2014
. The decrease in net sales was primarily due to lower volume in the off-highway (primarily agriculture) and aerospace end market sectors, partially offset by organic growth in the rail and automotive sectors. EBIT was
lower
in
2015
compared with
2014
primarily due to the impact of goodwill impairment and inventory valuation adjustments of $118 million recorded in 2014, a gain on the sale of Alcor of $29 million recorded in 2015, the benefit of lower raw material and operating costs net of manufacturing underutilization, lower SG&A expenses and the impact of acquisitions. These factors were partially offset by a gain on the sale of real estate in Brazil of $23 million recorded in 2014, lower volume of $20 million and unfavorable price/mix of $14 million and the negative impact of foreign currency exchange rate changes of $18 million.
31
Process Industries Segment:
|
2015
|
2014
|
$ Change
|
Change
|
||||||||
|
Net sales
|
$
|
1,314.0
|
|
$
|
1,390.8
|
|
$
|
(76.8
|
)
|
(5.5%
|
)
|
|
EBIT
|
$
|
190.2
|
|
$
|
267.1
|
|
$
|
(76.9
|
)
|
(28.8%
|
)
|
|
EBIT margin
|
14.5
|
%
|
19.2
|
%
|
—
|
|
(470
|
) bps
|
|||
|
|
2015
|
2014
|
$ Change
|
% Change
|
|||||||
|
Net sales
|
$
|
1,314.0
|
|
$
|
1,390.8
|
|
$
|
(76.8
|
)
|
(5.5%
|
)
|
|
Less: Acquisitions
|
30.2
|
|
—
|
|
30.2
|
|
NM
|
|
|||
|
Currency
|
(63.5
|
)
|
—
|
|
(63.5
|
)
|
NM
|
|
|||
|
Net sales, excluding the impact of acquisitions and
currency |
$
|
1,347.3
|
|
$
|
1,390.8
|
|
$
|
(43.5
|
)
|
(3.1%
|
)
|
The Process Industries segment's net sales, excluding the effects of acquisitions and foreign currency exchange rate changes,
decreased
$43.5 million
or
3.1%
in
2015
compared with
2014
primarily due to lower volume in the industrial distribution, services and heavy industries end market sectors, partially offset by organic growth in the wind energy and military marine sectors. EBIT was lower in
2015
compared with
2014
primarily due to the impact of lower volume of $21 million, unfavorable price/mix of $24 million, the impact of unfavorable foreign currency exchange rate changes of $25 million and higher impairment and restructuring charges. These factors were partially offset by lower SG&A expenses, the impact of lower material and operating costs net of manufacturing underutilization and the impact of acquisitions. EBIT also included a charge of $8.2 million in the fourth quarter of 2015 related to the write-off of certain CIP balances. Refer to
Note 8 - Property, Plant and Equipment
for additional information.
Corporate:
|
2015
|
2014
|
$ Change
|
Change
|
||||||||
|
Corporate expenses
|
$
|
57.4
|
|
$
|
71.4
|
|
$
|
(14.0
|
)
|
(19.6%
|
)
|
|
Corporate expenses % to net sales
|
2.0
|
%
|
2.3
|
%
|
—
|
|
(30
|
) bps
|
|||
Corporate expenses
decreased
in
2015
compared with
2014
primarily due to lower incentive compensation expenses and the impact of cost reduction initiatives.
32
THE BALANCE SHEETS
The following discussion is a comparison of the Consolidated Balance Sheets at
December 31, 2016
and
2015
.
Current Assets:
|
|
December 31,
|
|
|
||||||||
|
|
2016
|
2015
|
$ Change
|
% Change
|
|||||||
|
Cash and cash equivalents
|
$
|
148.8
|
|
$
|
129.6
|
|
$
|
19.2
|
|
14.8
|
%
|
|
Restricted cash
|
2.7
|
|
0.2
|
|
2.5
|
|
NM
|
|
|||
|
Accounts receivable, net
|
438.0
|
|
454.6
|
|
(16.6
|
)
|
(3.7
|
%)
|
|||
|
Inventories, net
|
545.8
|
|
543.2
|
|
2.6
|
|
0.5
|
%
|
|||
|
Deferred charges and prepaid expenses
|
20.3
|
|
22.7
|
|
(2.4
|
)
|
(10.6
|
%)
|
|||
|
Other current assets
|
48.4
|
|
56.1
|
|
(7.7
|
)
|
(13.7
|
%)
|
|||
|
Total current assets
|
$
|
1,204.0
|
|
$
|
1,206.4
|
|
$
|
(2.4
|
)
|
(0.2
|
%)
|
Refer to the Consolidated Statements of Cash Flows for discussion of the change in cash and cash equivalents.
Accounts receivable, net, decreased as a result of lower sales in December 2016 compared with December 2015 and the impact of foreign currency exchange rate changes, partially offset by the impact of current year acquisitions.
Property, Plant and Equipment, Net:
|
|
December 31,
|
|
|
||||||||
|
|
2016
|
2015
|
$ Change
|
% Change
|
|||||||
|
Property, plant and equipment
|
$
|
2,233.0
|
|
$
|
2,171.7
|
|
$
|
61.3
|
|
2.8
|
%
|
|
Less: allowances for depreciation
|
(1,428.6
|
)
|
(1,393.9
|
)
|
(34.7
|
)
|
(2.5
|
%)
|
|||
|
Property, plant and equipment, net
|
$
|
804.4
|
|
$
|
777.8
|
|
$
|
26.6
|
|
3.4
|
%
|
The increase in property, plant and equipment, net, in
2016
was primarily due to capital expenditures of $128.0 million and additions from current-year acquisitions of $16.6 million, partially offset by current-year depreciation of $95.5 million, the impact of foreign currency exchange rate changes of $15.4 million and impairment charges of $3.6 million.
Other Assets:
|
|
December 31,
|
|
|
||||||||
|
|
2016
|
2015
|
$ Change
|
% Change
|
|||||||
|
Goodwill
|
$
|
357.5
|
|
$
|
327.3
|
|
$
|
30.2
|
|
9.2
|
%
|
|
Non-current pension assets
|
32.1
|
|
86.3
|
|
(54.2
|
)
|
(62.8
|
%)
|
|||
|
Other intangible assets
|
271.0
|
|
271.3
|
|
(0.3
|
)
|
(0.1
|
%)
|
|||
|
Deferred income taxes
|
54.4
|
|
65.9
|
|
(11.5
|
)
|
(17.5
|
%)
|
|||
|
Other non-current assets
|
34.9
|
|
49.1
|
|
(14.2
|
)
|
(28.9
|
%)
|
|||
|
Total other assets
|
$
|
749.9
|
|
$
|
799.9
|
|
$
|
(50.0
|
)
|
(6.3
|
%)
|
The
increase
in goodwill was primarily due to the acquisition of Lovejoy in the third quarter of 2016.
The
decrease
in non-current pension assets was primarily due a decrease in the discount rate used to measure the obligation for the Company's U.S. and U.K. defined benefit pension plans, which negatively impacted the funded status of these plans. See
Note 14 - Retirement Benefit Plans
for additional information.
The
decrease
in deferred income taxes was primarily due to purchase accounting adjustments, changes in tax rates and other deferred tax adjustments, partially offset by the impact of current year book-tax temporary differences including pension expense and depreciation.
The
decrease
in other non-current assets was primarily due to the reclassification of $18.6 million of tax payments in India to income taxes payable in order to apply these payments to the underlying liabilities to which they related during the third quarter of 2016.
33
Current Liabilities:
|
|
December 31,
|
|
|
||||||||
|
|
2016
|
2015
|
$ Change
|
% Change
|
|||||||
|
Short-term debt
|
$
|
19.2
|
|
$
|
62.0
|
|
$
|
(42.8
|
)
|
(69.0
|
)%
|
|
Current portion of long-term debt
|
5.0
|
|
15.1
|
|
(10.1
|
)
|
(66.9
|
)%
|
|||
|
Accounts payable
|
176.2
|
|
159.7
|
|
16.5
|
|
10.3
|
%
|
|||
|
Salaries, wages and benefits
|
85.9
|
|
102.3
|
|
(16.4
|
)
|
(16.0
|
%)
|
|||
|
Income taxes payable
|
16.9
|
|
13.1
|
|
3.8
|
|
29.0
|
%
|
|||
|
Other current liabilities
|
149.5
|
|
153.1
|
|
(3.6
|
)
|
(2.4
|
%)
|
|||
|
Total current liabilities
|
$
|
452.7
|
|
$
|
505.3
|
|
$
|
(52.6
|
)
|
(10.4
|
%)
|
The
decrease
in short-term debt was primarily due to the change in classification of the outstanding borrowings under the Accounts Receivable Facility in accordance with the terms of the agreement and the Company's expectations relative to the minimum borrowing base.
Current portion of long-term debt
decreased
due to the payment of medium term notes that matured during the third quarter of 2016, partially offset by the Company's 7.01% Fixed-rate Medium-Term Notes, Series A (2017 Notes) that will be repaid at maturity in November 2017.
The
increase
in accounts payable was primarily due to higher days outstanding driven by the Company's initiative to extend payment terms with its suppliers.
The
decrease
in accrued salaries, wages and benefits was primarily due to lower expected retiree medical payments for the next twelve months, the elimination of one of the Company’s Canadian pension plans and the impact of lower headcount versus the prior year.
The
increase
in income taxes payable reflects the current tax provision, less income tax payments, the reclassification of tax payments in India of $18.6 million and the reclassification of certain accruals for uncertain tax positions to non-current liabilities.
Non-Current Liabilities:
|
|
December 31,
|
|
|
||||||||
|
|
2016
|
2015
|
$ Change
|
% Change
|
|||||||
|
Long-term debt
|
$
|
635.0
|
|
$
|
579.4
|
|
$
|
55.6
|
|
9.6
|
%
|
|
Accrued pension cost
|
154.7
|
|
146.9
|
|
7.8
|
|
5.3
|
%
|
|||
|
Accrued postretirement benefits cost
|
131.5
|
|
136.1
|
|
(4.6
|
)
|
(3.4
|
%)
|
|||
|
Deferred income taxes
|
3.9
|
|
3.6
|
|
0.3
|
|
8.3
|
%
|
|||
|
Other non-current liabilities
|
74.5
|
|
68.2
|
|
6.3
|
|
9.2
|
%
|
|||
|
Total non-current liabilities
|
$
|
999.6
|
|
$
|
934.2
|
|
$
|
65.4
|
|
7.0
|
%
|
The
increase
in long-term debt was primarily due to the classification of $49 million of outstanding borrowings under the Accounts Receivable Facility in accordance with the terms of the agreement and the Company's expectations relative to the minimum borrowing base as long-term at
December 31, 2016
compared with zero as of
December 31, 2015
, along with an $8.6 million increase in borrowing under the Senior Credit Facility.
The increase in accrued pension cost was primarily due to a decrease in the discount rate used to measure the obligation for the Company's unfunded defined benefit pension plans.
The
increase
in other non-current liabilities during
2016
was primarily due to acquisition related expense of $4.1 million.
34
Shareholders’ Equity:
|
|
December 31,
|
|
|
||||||||
|
|
2016
|
2015
|
$ Change
|
% Change
|
|||||||
|
Common stock
|
$
|
960.0
|
|
$
|
958.2
|
|
$
|
1.8
|
|
0.2
|
%
|
|
Earnings invested in the business
|
1,528.6
|
|
1,457.6
|
|
71.0
|
|
4.9
|
%
|
|||
|
Accumulated other comprehensive loss
|
(322.0
|
)
|
(287.0
|
)
|
(35.0
|
)
|
12.2
|
%
|
|||
|
Treasury shares
|
(891.7
|
)
|
(804.3
|
)
|
(87.4
|
)
|
(10.9
|
%)
|
|||
|
Noncontrolling interest
|
31.1
|
|
20.1
|
|
11.0
|
|
54.7
|
%
|
|||
|
Total equity
|
$
|
1,306.0
|
|
$
|
1,344.6
|
|
$
|
(38.6
|
)
|
(2.9
|
%)
|
Earnings invested in the business in
2016
increased
by net income attributable to the Company of
$152.6 million
, partially offset by dividends declared of
$81.6 million
.
The
increase
in accumulated other comprehensive loss was primarily due to foreign currency translation adjustments of
$34.5 million
and pension and postretirement liability adjustments of $0.6 million after tax. The foreign currency translation adjustments were due to the strengthening of the U.S. dollar relative to other foreign currencies, including the British Pound Sterling and the Chinese Renminbi Yuan, partially offset by increases related to the Brazilian Real. See
"Other Disclosures - Foreign Currency
" for further discussion regarding the impact of foreign currency translation. The increase in pension and postretirement liability adjustments was primarily due to a decrease in the discount rate used to measure the underlying pension obligation, mostly offset by pension settlement charges, amortization of actuarial gains and losses, an amendment to the Company's postretirement obligation and the impact of income taxes.
The
increase
in treasury shares was primarily due to the Company's purchase of 3.1 million of its common shares for
$101.0 million
, partially offset by $13.9 million worth of net shares issued for stock compensation plans during
2016
.
35
CASH FLOWS
|
2016
|
2015
|
$ Change
|
|||||||
|
Net cash provided by operating activities
|
$
|
402.0
|
|
$
|
374.8
|
|
$
|
27.2
|
|
|
Net cash used in investing activities
|
(211.0
|
)
|
(265.2
|
)
|
54.2
|
|
|||
|
Net cash used in financing activities
|
(169.4
|
)
|
(241.6
|
)
|
72.2
|
|
|||
|
Effect of exchange rate changes on cash
|
(2.4
|
)
|
(17.2
|
)
|
14.8
|
|
|||
|
Increase (decrease) in cash and cash equivalents
|
$
|
19.2
|
|
$
|
(149.2
|
)
|
$
|
168.4
|
|
Operating Activities:
Operating activities
provided
net cash of
$402.0 million
in
2016
, after providing net cash of
$374.8 million
in
2015
. The increase was due to the favorable impact of income taxes of
$227.8 million
and a net favorable change in working capital items of
$13.3 million
, partially offset by lower net income of
$212.4 million
, excluding pension settlement charges. Refer to the tables below for additional detail of the impact of each line on net cash provided by operating activities.
The following chart displays the impact of working capital items on cash during
2016
and
2015
, respectively:
|
|
2016
|
2015
|
$ Change
|
||||||
|
Cash provided (used):
|
|||||||||
|
Accounts receivable
|
$
|
20.3
|
|
$
|
11.9
|
|
$
|
8.4
|
|
|
Inventories
|
10.1
|
|
52.8
|
|
(42.7
|
)
|
|||
|
Trade accounts payable
|
12.2
|
|
11.6
|
|
0.6
|
|
|||
|
Other accrued expenses
|
(4.7
|
)
|
(51.7
|
)
|
47.0
|
|
|||
|
Cash provided (used) in working capital items
|
$
|
37.9
|
|
$
|
24.6
|
|
$
|
13.3
|
|
The following table displays the impact of income taxes on cash during
2016
and
2015
, respectively:
|
|
2016
|
2015
|
$ Change
|
||||||
|
Accrued income tax expense (benefit) on pre-tax income
|
$
|
69.2
|
|
$
|
(121.6
|
)
|
$
|
190.8
|
|
|
Income tax payments
|
(49.7
|
)
|
(83.3
|
)
|
33.6
|
|
|||
|
Other miscellaneous
|
(2.3
|
)
|
(5.7
|
)
|
3.4
|
|
|||
|
Change in income taxes
|
$
|
17.2
|
|
$
|
(210.6
|
)
|
$
|
227.8
|
|
The following table displays the effect on cash for major components of net income during
2016
and
2015
, respectively:
|
|
2016
|
2015
|
$ Change
|
||||||
|
Net income (loss) attributable to The Timken Company
|
$
|
152.6
|
|
$
|
(70.8
|
)
|
$
|
223.4
|
|
|
Non-cash pension settlement charges included in pre-tax income
|
26.6
|
|
462.4
|
|
(435.8
|
)
|
|||
|
Net income (excluding pension settlement)
|
$
|
179.2
|
|
$
|
391.6
|
|
$
|
(212.4
|
)
|
Investing Activities:
Net cash
used
in investing activities of
$211.0 million
in
2016
decreased
from the same period in
2015
primarily due to a
$140.7 million
decrease
in cash used for acquisitions, partially offset by a $46.2 million reduction in proceeds from divestitures, a
$31.9 million
increase
in cash used in capital expenditures, and an $8.3 million reduction in proceeds from the sale of property, plant and equipment.
Financing Activities:
The following chart displays the factors impacting cash from financing activities during
2016
and
2015
, respectively:
|
|
2016
|
2015
|
$ Change
|
||||||
|
Net borrowings
|
$
|
2.3
|
|
$
|
130.1
|
|
$
|
(127.8
|
)
|
|
Purchase of treasury shares
|
(101.0
|
)
|
(309.7
|
)
|
208.7
|
|
|||
|
Proceeds from exercise of stock options
|
4.3
|
|
4.1
|
|
0.2
|
|
|||
|
Increase in restricted cash
|
(2.5
|
)
|
14.8
|
|
(17.3
|
)
|
|||
|
Cash dividends paid to shareholders
|
(81.6
|
)
|
(87.0
|
)
|
5.4
|
|
|||
|
Other
|
9.1
|
|
6.1
|
|
3.0
|
|
|||
|
Decrease in cash used for financing activities
|
$
|
(169.4
|
)
|
$
|
(241.6
|
)
|
$
|
72.2
|
|
36
LIQUIDITY AND CAPITAL RESOURCES
Reconciliation of total debt to net debt and the ratio of net debt to capital:
Net Debt:
|
|
December 31,
|
|||||
|
|
2016
|
2015
|
||||
|
Short-term debt
|
$
|
19.2
|
|
$
|
62.0
|
|
|
Current portion of long-term debt
|
5.0
|
|
15.1
|
|
||
|
Long-term debt
|
635.0
|
|
579.4
|
|
||
|
Total debt
|
$
|
659.2
|
|
$
|
656.5
|
|
|
Less: Cash and cash equivalents
|
148.8
|
|
129.6
|
|
||
|
Restricted cash
|
2.7
|
|
0.2
|
|
||
|
Net debt
|
$
|
507.7
|
|
$
|
526.7
|
|
Ratio of Net Debt to Capital:
|
|
December 31,
|
|||||
|
|
2016
|
2015
|
||||
|
Net debt
|
$
|
507.7
|
|
$
|
526.7
|
|
|
Total equity
|
1,306.0
|
|
1,344.6
|
|
||
|
Capital (net debt + total equity)
|
$
|
1,813.7
|
|
$
|
1,871.3
|
|
|
Ratio of net debt to capital
|
28.0
|
%
|
28.1
|
%
|
||
The Company presents net debt because it believes net debt is more representative of the Company's financial position than total debt due to the amount of cash and cash equivalents held by the Company.
At
December 31, 2016
, approximately $134 million, or over 90%, of the Company's $149 million cash and cash equivalents resided in jurisdictions outside the United States. It is the Company's practice to use available cash in the United States to pay down its Senior Credit Facility or Accounts Receivable Facility, in order to minimize total interest expense. As a result, the majority of the Company's cash on hand was outside the United States. Repatriation of these funds to the United States could be subject to domestic and foreign taxes and some portion may be subject to governmental restrictions. Part of the Company's strategy is to grow in attractive market sectors, many of which are outside the United States. This strategy includes making investments in facilities and equipment and potential new acquisitions. The Company plans to fund these investments, as well as meet working capital requirements, with cash and cash equivalents and unused lines of credit within the geographic location of these investments where possible.
The Company has a
$100 million
Accounts Receivable Facility that matures on November 30, 2018. The Accounts Receivable Facility is subject to certain borrowing base limitations and is secured by certain domestic accounts receivable of the Company. Certain borrowing base limitations reduced the availability of the Accounts Receivable Facility to
$67.2 million
at
December 31, 2016
. As of
December 31, 2016
, there were outstanding borrowings of
$48.9 million
under the Accounts Receivable Facility, which reduced the availability under this facility to
$18.3 million
. The interest rate on the Accounts Receivable Facility is variable and was
1.65%
as of
December 31, 2016
, which reflects the prevailing commercial paper rate plus facility fees.
The Company has a
$500.0 million
Senior Credit Facility that matures on June 19, 2020. At
December 31, 2016
, the Company had outstanding borrowings of
$83.8 million
, which reduced the availability to
$416.2 million
. The Senior Credit Facility has
two
financial covenants: a consolidated leverage ratio and a consolidated interest coverage ratio. At
December 31, 2016
, the Company was in full compliance with the covenants under the Senior Credit Facility and its other debt agreements. The maximum consolidated leverage ratio permitted under the Senior Credit Facility is 3.5 to 1.0 (3.75 to 1.0 for a limited period up to four quarters following an acquisition with a purchase price of $200 million or greater). As of
December 31, 2016
, the Company’s consolidated leverage ratio was 1.77 to 1.0. The minimum consolidated interest coverage ratio permitted under the Senior Credit Facility is 3.5 to 1.0. As of
December 31, 2016
, the Company’s consolidated interest coverage ratio was 11.37 to 1.0.
37
The interest rate under the Senior Credit Facility is variable with a spread based on the Company’s debt rating. The weighted-average borrowing rate was
1.50%
as of
December 31, 2016
. In addition, the Company pays a facility fee based on the consolidated leverage ratio multiplied by the aggregate commitments of all of the lenders under the Senior Credit Facility.
Other sources of liquidity include short-term lines of credit for certain of the Company’s foreign subsidiaries, which provide for borrowings up to approximately
$202.7 million
. Most of these credit lines are uncommitted. At
December 31, 2016
, the Company had borrowings outstanding of $
19.2 million
and guarantees of
$1.9 million
, which reduced the availability under these facilities to
$181.6 million
.
The Company expects that any cash requirements in excess of cash on hand and cash generated from operating activities will be met by the committed funds available under its Accounts Receivable Facility and the Senior Credit Facility. Management believes it has sufficient liquidity to meet its obligations through at least the term of the Senior Credit Facility.
The Company expects to remain in compliance with its debt covenants. However, the Company may need to limit its borrowings under the Senior Credit Facility or other facilities in order to remain in compliance. As of
December 31, 2016
, the Company could have borrowed the full amounts available under the Senior Credit Facility and Accounts Receivable Facility, and would have still been in compliance with its debt covenants.
In August 2014, the Company issued $350 million aggregate principal amount of fixed-rate unsecured notes that mature in September 2024 (the "2024 Notes"). The Company used a portion of the net proceeds from this issuance to repay the $250 million aggregate principal amount of fixed-rated unsecured notes that matured on September 15, 2014.
The Company expects cash from operations of approximately
$310 million
in 2017, a decrease from
2016
of approximately
$92 million
or
23%
, driven by lower net income (including no expected CDSOA receipts), lower benefit from working capital and higher income tax payments. The Company expects capital expenditures of approximately
4%
of sales in 2017, compared with
5%
of sales in
2016
.
38
CONTRACTUAL OBLIGATIONS
The Company’s contractual debt obligations and contractual commitments outstanding as of
December 31, 2016
were as follows:
Payments due by period:
|
Contractual Obligations
|
Total
|
Less than
1 Year
|
1-3 Years
|
3-5 Years
|
More than
5 Years
|
||||||||||
|
Interest payments
|
$
|
228.4
|
|
$
|
26.7
|
|
$
|
51.7
|
|
$
|
49.4
|
|
$
|
100.6
|
|
|
Long-term debt, including current portion
|
640.0
|
|
5.0
|
|
48.9
|
|
85.7
|
|
500.4
|
|
|||||
|
Short-term debt
|
19.2
|
|
19.2
|
|
—
|
|
—
|
|
—
|
|
|||||
|
Operating leases
|
91.7
|
|
26.2
|
|
37.7
|
|
22.3
|
|
5.5
|
|
|||||
|
Purchase commitments
|
33.0
|
|
29.1
|
|
3.9
|
|
—
|
|
—
|
|
|||||
|
Retirement benefits
|
247.4
|
|
17.5
|
|
64.9
|
|
57.5
|
|
107.5
|
|
|||||
|
Total
|
$
|
1,259.7
|
|
$
|
123.7
|
|
$
|
207.1
|
|
$
|
214.9
|
|
$
|
714.0
|
|
The interest payments beyond five years primarily relate to long-term fixed-rate notes. Refer to
Note 10 - Financing Arrangements
for additional information.
Purchase commitments are defined as an agreement to purchase goods or services that are enforceable and legally binding on the Company. Included in purchase commitments above are certain obligations related to take or pay contracts, capital commitments, service agreements and utilities. Many of these commitments relate to take or pay contracts, in which the Company guarantees payment to ensure availability of products or services. These purchase commitments do not represent the entire anticipated purchases in the future, but represent only those items that the Company is contractually obligated to purchase. The majority of the products and services purchased by the Company are purchased as needed, with no commitment.
In order to maintain minimum funding requirements, the Company is required to make contributions to the trusts established for its defined benefit pension plans and other postretirement benefit plans. The table above shows the expected future minimum cash contributions to the trusts for the funded plans as well as estimated future benefit payments to participants for the unfunded plans. Those minimum funding requirements and estimated benefit payments can vary significantly. The amounts in the table above are based on actuarial estimates using current assumptions for, among other things, discount rates, expected return on assets and health care cost trend rates. Refer to
Note 14 - Retirement Benefit Plans
and
Note 15 - Postretirement Benefit Plans
for additional information.
During
2016
, the Company made cash contributions of approximately
$15 million
to its global defined benefit pension plans. The Company currently expects to make contributions to its global defined benefit pension plans totaling approximately
$10 million
in 2017. Returns for the Company’s global defined benefit pension plan assets in
2016
were 8.50%, above the expected rate of return of 6.0% predominantly due to increases in the long duration fixed-income markets. The higher returns positively impacted the funded status of the plans at the end of
2016
. However, due to a 35 basis point reduction in the discount rate used to measure the Company's U.S. defined benefit pension obligations and a 125 basis point reduction in the discount rate used to measure its U.K defined benefit pension obligations, the higher returns were largely offset. Despite the negative impact of the lower discount rates, the Company expects slightly lower pension expense, excluding pension settlement charges, in future years. Refer to
Note 14 - Retirement Benefit Plans
and
Note 15 - Postretirement Benefit Plans
for additional information.
Refer to
Note 11 - Contingencies
and
Note 17 - Income Taxes
for additional information regarding the Company's exposure for certain legal and tax matters.
As of
December 31, 2016
, the Company had approximately
$39.2 million
of total gross unrecognized tax benefits. The Company believes it is reasonably possible that the amount of unrecognized tax positions could decrease by approximately
$25 million
during the next 12 months. The potential decrease would be primarily driven by settlements with tax authorities and the expiration of various statutes of limitation. Future tax positions are not known at this time and therefore not included in the above summary of the Company’s fixed contractual obligations. Refer to
Note 17 - Income Taxes
for additional information.
The Company does not have any off-balance sheet arrangements with unconsolidated entities or other persons.
39
RECENTLY ADOPTED ACCOUNTING PRONOUNCMENTS
Information required for this Item is incorporated by reference to
Note 1 - Significant Accounting Policies
in the Notes to the Consolidated Financial Statements.
CRITICAL ACCOUNTING POLICIES AND ESTIMATES
The Company’s financial statements are prepared in accordance with accounting principles generally accepted in the United States. The preparation of these financial statements requires management to make estimates and assumptions that affect the reported amounts of assets and liabilities at the date of the financial statements and the reported amounts of revenues and expenses during the periods presented. The following paragraphs include a discussion of some critical areas that require a higher degree of judgment, estimates and complexity.
Revenue recognition:
The Company generally recognizes revenue when title passes to the customer. This occurs at the shipping point except for goods sold by certain foreign entities and certain exported goods, where title passes when the goods reach their destination. Selling prices are fixed based on purchase orders or contractual arrangements. Shipping and handling costs billed to customers are included in net sales and the related costs are included in cost of products sold in the Consolidated Statements of Income.
The Company recognizes a portion of its revenues on the percentage-of-completion method measured on the cost-to-cost basis. In
2016
,
2015
and
2014
, the Company recognized approximately
$68 million
,
$66 million
and
$50 million
, respectively, in net sales under the percentage-of-completion method. As of
December 31, 2016
and
2015
,
$63.5 million
and
$62.5 million
of accounts receivable, net, respectively, related to these net sales.
Inventory:
Inventories are valued at the lower of cost or market, with approximately 53% valued by the first-in, first-out ("FIFO") method and the remaining 47% valued by the last-in, first-out ("LIFO") method. The majority of the Company’s domestic inventories are valued by the LIFO method, and all of the Company’s international inventories are valued by the FIFO method. An actual valuation of the inventory under the LIFO method can be made only at the end of each year based on the inventory levels and costs at that time. Accordingly, interim LIFO calculations are based on management’s estimates of expected year-end inventory levels and costs. Because these are subject to many factors beyond management’s control, annual results may differ from interim results as they are subject to the final year-end LIFO inventory valuation. The Company recognized a decrease in its LIFO reserve of
$4.2 million
during
2016
compared with a decrease in its LIFO reserve of
$11.6 million
during
2015
.
Goodwill:
The Company tests goodwill and indefinite-lived intangible assets for impairment at least annually. The Company performs its annual impairment test as of October first, after the annual forecasting process is completed. Furthermore, goodwill is reviewed for impairment whenever events or changes in circumstances indicate that the carrying value may not be recoverable. Each interim period, management of the Company assesses whether or not an indicator of impairment is present that would necessitate that a goodwill impairment analysis be performed in an interim period other than during the fourth quarter.
The goodwill impairment analysis is a two-step process. Step one compares the carrying amount of the reporting unit to its estimated fair value. To the extent that the carrying value of the reporting unit exceeds its estimated fair value, step two is performed, where the reporting unit’s carrying value of goodwill is compared with the implied fair value of goodwill. To the extent that the carrying value of goodwill exceeds the implied fair value of goodwill, impairment exists and must be recognized.
The Company reviews goodwill for impairment at the reporting unit level. The Mobile Industries segment has three reporting units and the Process Industries segment has two reporting units. The reporting units within the Mobile Industries segment are Mobile Industries, Aerospace Transmissions and Aerospace Aftermarket. The reporting units within the Process Industries segment are Process Industries and Industrial Services.
40
The Company prepares its goodwill impairment analysis by comparing the estimated fair value of each reporting unit, using an income approach (a discounted cash flow model), as well as a market approach, with its carrying value. The income approach and market approach are weighted in arriving at fair value based on the relative merits of the methods used and the quantity and quality of collected data to arrive at the indicated fair value.
The income approach requires several assumptions including future sales growth, EBIT (earnings before interest and taxes) margins and capital expenditures. The Company’s reporting units each provide their forecast of results for the next three years. These forecasts are the basis for the information used in the discounted cash flow model. The discounted cash flow model also requires the use of a discount rate and a terminal revenue growth rate (the revenue growth rate for the period beyond the three years forecasted by the reporting units), as well as projections of future operating margins (for the period beyond the forecasted three years). During the fourth quarter of
2016
, the Company used a discount rate for its reporting units of
8.0%
to
11.0%
and a terminal revenue growth rate of
1.0%
to
3.5%
.
The market approach requires several assumptions including sales and EBITDA (earnings before interest, taxes, depreciation and amortization) multiples for comparable companies that operate in the same markets as the Company’s reporting units. During the fourth quarter of
2016
, the Company used sales multiples of
0.75
to
3.30
for its reporting units. During the fourth quarter of
2016
, the Company used EBITDA multiples of
6.5
to
10.0
for its reporting units.
As of
December 31, 2016
, the Company had
$357.5 million
of goodwill on its Consolidated Balance Sheet, of which
$97.2 million
was attributable to the Mobile Industries segment and
$260.3 million
was attributable to the Process Industries segment. See
Note 9 - Goodwill and Other Intangible Assets
in the Notes to Consolidated Financial Statements for the carrying amount of goodwill by segment.
The fair value of the Aerospace Transmission reporting unit was
$81.5 million
, compared with its carrying value of
$71.5 million
. This reporting unit only had $1.8 million of goodwill at
December 31, 2016
. The fair value of the other reporting units exceeded their carrying values by a significant amount. As a result, the Company did not recognize any goodwill impairment charges during the fourth quarter of 2016.
A
60 basis point
increase in the discount rate would have resulted in the Aerospace Transmission reporting unit failing step one of the goodwill impairment analysis, which would have required the completion of step two of the goodwill impairment analysis to arrive at a potential goodwill impairment loss. The projected cash flows could have declined by as much as
6.6%
for the Aerospace Transmission reporting unit and the fair value would have still exceeded its carrying value.
Restructuring costs:
The Company’s policy is to recognize restructuring costs in accordance with Accounting Standards Codification (ASC) Topic 420, “Exit or Disposal Cost Obligations,” and ASC Topic 712, “Compensation and Non-retirement Post-Employment Benefits.” Detailed contemporaneous documentation is maintained and updated to ensure that accruals are properly supported. If management determines that there is a change in estimate, the accruals are adjusted to reflect this change.
Income taxes:
Significant management judgment is required in determining the provision for income taxes, deferred tax assets and liabilities, valuation allowances against deferred tax assets, and accruals for uncertain tax positions.
The Company, which is subject to income taxes in the United States and numerous non-U.S. jurisdictions, accounts for income taxes in accordance with ASC Topic 740, “Income Taxes.” Deferred tax assets and liabilities are recorded for the future tax consequences attributable to differences between financial statement carrying amounts of existing assets and liabilities and their respective tax bases, as well as net operating losses and tax credit carryforwards. Deferred tax assets and liabilities are measured using enacted tax rates expected to apply to taxable income in the years in which temporary differences are expected to be recovered or settled. The Company records valuation allowances against deferred tax assets by tax jurisdiction when it is more likely than not that such assets will not be realized. In determining the need for a valuation allowance, the historical and projected financial performance of the entity recording the net deferred tax asset is considered along with any other pertinent information. Deferred tax assets relate primarily to pension and postretirement benefit obligations in the United States, which the Company believes are more likely than not to result in future tax benefits. The net activity from additions and reversals of valuation allowances was immaterial in 2016 and 2014. In 2015, the company recorded $34.7 million of tax benefit related to the reversal of valuation allowances. Refer to
Note 17 - Income Taxes
for further discussion on the valuation allowance reversals.
41
In the ordinary course of the Company’s business, there are many transactions and calculations where the ultimate income tax determination is uncertain. The Company is regularly under audit by tax authorities. Accruals for uncertain tax positions are provided for in accordance with the requirements of ASC Topic 740. The Company records interest and penalties related to uncertain tax positions as a component of income tax expense. In 2016, the company recorded $8.1 million of net tax benefits related to uncertain tax positions. The company recorded tax benefits of $16.9 million related to settlements with tax authorities and reduction in prior year reserves and $8.8 million of tax expense related to current and prior year tax positions and interest expense. Refer to
Note 17 - Income Taxes
for further discussion on the uncertain tax positions reserve reversals.
Benefit Plans:
The Company sponsors a number of defined benefit pension plans that cover eligible associates. The Company also sponsors several funded and unfunded postretirement plans that provide health care and life insurance benefits for eligible retirees and their dependents. These plans are accounted for in accordance with ASC Topic 715-30, "Defined Benefit Plans – Pension," and ASC Topic 715-60, "Defined Benefit Plans – Other Postretirement."
The measurement of liabilities related to these plans is based on management's assumptions related to future events, including discount rates, rates of return on pension plan assets, rates of compensation increases and health care cost trend rates. Management regularly evaluates these assumptions and adjusts them as required and appropriate. Other plan assumptions are also reviewed on a regular basis to reflect recent experience and the Company's future expectations. Actual experience that differs from these assumptions may affect future liquidity, expense and the overall financial position of the Company. While the Company believes that current assumptions are appropriate, significant differences in actual experience or significant changes in these assumptions may materially affect the Company's pension and other postretirement employee benefit obligations and its future expense and cash flow.
The discount rate is used to calculate the present value of expected future pension and postretirement cash flows as of the measurement date. The Company establishes the discount rate by constructing a notional portfolio of high-quality corporate bonds and matching the coupon payments and bond maturities to projected benefit payments under the Company's pension and postretirement welfare plans. The bonds included in the portfolio are generally non-callable. A lower discount rate will result in a higher benefit obligation; conversely, a higher discount rate will result in a lower benefit obligation. The discount rate is also used to calculate the annual interest cost, which is a component of net periodic benefit cost.
The expected rate of return on plan assets is determined by analyzing the historical long-term performance of the Company's pension plan assets, as well as the mix of plan assets between equities, fixed income securities and other investments, the expected long-term rate of return expected for those asset classes and long-term inflation rates. Short-term asset performance can differ significantly from the expected rate of return, especially in volatile markets. A lower-than-expected rate of return on pension plan assets will increase pension expense and future contributions.
42
Defined Benefit Pension Plans:
The Company recognized net periodic benefit cost of $57.7 million in
2016
for defined benefit pension plans compared with $497.8 million in
2015
. The decrease in net periodic benefit cost was primarily due to lower pension settlement charges, lower interest costs and lower amortization of net actuarial losses, partially offset by lower expected return on plan assets. Pension settlement charges decreased from $465.0 million in 2015 to $28.1 million in 2016. The decrease in pension settlement charges was primarily due to the Company entering into two agreements in 2015 pursuant to which two of the Company's U.S. defined benefit pension plans purchased group annuity contracts from Prudential. The two group annuity contracts required Prudential to pay and administer future pension benefits for approximately 8,400 U.S. Timken retirees in the aggregate. The Company transferred a total of approximately $1.1 billion of its pension obligations and a total of approximately $1.2 billion of pension assets to Prudential in these transactions. In addition to the purchase of the group annuity contracts, the Company made lump-sum distributions of $37.2 million to new retirees in the United States in 2015. In 2015, the Company also entered into an agreement pursuant to which one of the Company's Canadian defined benefit pension plans purchased a group annuity contract from Canada Life. The group annuity contract required Canada Life to pay and administer future pension benefits for approximately 40 Canadian retirees. As a result of the group annuity contracts and lump-sum distributions, as well as pension settlement and curtailment charges related to the Company's Canadian pension plans, the Company incurred total pension settlement and curtailment charges of $465.0 million, including professional fees of $2.6 million, in 2015.
In 2016, one of the Company's Canadian defined benefit pension plans purchased a group annuity contract from Canada Life to pay and administer future pension benefits for 135 Canadian retirees, as well as lump-sum distributions to deferred vested participants of $6.8 million were paid in the same plan. The Company also made lump-sum distributions of $32.4 million to new retirees in 2016 in one of the Company's U.S. defined benefit pension plans. In addition, the Company made lump-sum distributions to deferred vested participants in 2016 in another of the Company's U.S. defined benefit pension plans. As a result of the group annuity contract purchase and lump-sum distributions that triggered remeasurment, the Company recognized pension settlement charges of $28.1 million, including professional fees of $1.5 million, in 2016.
The lower interest costs in 2016 were primarily due to lower defined benefit pension obligations as a result of the purchase of the group annuity contracts in 2015, and the lower amortization of net actuarial losses was due primarily to the recognition of pension settlement charges in 2015, which reduced the amount of net actuarial losses to be amortized in 2016. Net actuarial losses are generally amortized over the average remaining service period of participants in the defined benefit pension plans. Refer to
Note 1 - Significant Accounting Policies
for additional information on the amortization of actuarial gains and losses. The lower expected return from plan assets for 2016, compared to 2015, was primarily due to a lower pension asset base in 2016 primarily due to the purchase of the group annuity contracts in 2015 and a lower expected rate of return.
In 2017, the Company expects net periodic benefit cost to decrease to approximately $42 million for defined benefit pension plans. The expected decrease is primarily due to lower pension settlement charges and lower interest costs, partially offset by higher amortization of net actuarial losses. Pension settlement charges are expected to decrease approximately $15 million as the Company expects to incur pension settlement charges of approximately $13 million in 2017, compared with $28.1 million in 2016. Interest costs are expected to decrease in 2017, compared with 2016, primarily due to a decrease in the weighted-average discount rate used for expense purposes from 4.69% for 2016 to 4.34% for 2017 for U.S. defined benefit pension plans and from 3.75% for 2016 to 2.50% for 2017 for the Company's U.K. defined benefit pension plan. Amortization of actuarial losses is expected to increase as a result of a decrease in the discount rate to measure the Company's pension obligations for its U.S. and U.K defined benefit pension plans.
The Company expects to contribute approximately $10 million to its defined benefit pension plans in 2017 compared with $15.0 million in 2016.
43
The following table below presents a reconciliation of the cumulative net actuarial losses at December 31, 2013 and the cumulative net actuarial losses at December 31, 2016:
|
Net actuarial losses at December 31, 2013
|
$
|
989.1
|
|
||||
|
Plus/minus actuarial (gains) and losses recognized:
|
|||||||
|
Net actuarial gains recognized in 2014
|
$
|
161.2
|
|
||||
|
Net actuarial losses recognized in 2015
|
89.5
|
|
|||||
|
Net actuarial losses recognized in 2016
|
61.6
|
|
|||||
|
312.3
|
|
||||||
|
Minus amortization of net actuarial losses:
|
|||||||
|
Amortization of net actuarial losses in 2014
|
$
|
(60.9
|
)
|
||||
|
Amortization of net actuarial losses in 2015
|
(36.3
|
)
|
|||||
|
Amortization of net actuarial losses in 2016
|
(17.9
|
)
|
|||||
|
(115.1
|
)
|
||||||
|
Minus settlement charges:
|
|||||||
|
Settlement charges recognized in 2014
|
$
|
(33.5
|
)
|
||||
|
Settlement charges recognized in 2015
|
(461.2
|
)
|
|||||
|
Settlement charges recognized in 2016
|
(26.6
|
)
|
|||||
|
(521.3
|
)
|
||||||
|
Curtailment loss recognized in 2015
|
(0.6
|
)
|
|||||
|
Curtailment gain recognized in 2016
|
0.1
|
|
|||||
|
Spinoff of TimkenSteel
|
(347.4
|
)
|
|||||
|
Foreign currency impact
|
(30.9
|
)
|
|||||
|
Net actuarial losses at December 31, 2016
|
$
|
286.2
|
|
||||
During the period between December 31, 2013 and December 31, 2016, net actuarial losses decreased by $702.9 million. This decrease included $521.3 million of pension settlement charges, representing an acceleration of previously recognized net actuarial gains and losses, the Spinoff of $347.4 million and the amortization of actuarial losses of $115.1 million, partially offset by net actuarial losses totaling $312.3 million recognized for defined benefit pension plans.
The net actuarial losses occurred the years between 2014 and 2016. In 2014, the net actuarial loss of $161.2 million was primarily due to an 82 basis point reduction in the Company's discount rate used to measure its defined benefit pension obligations, as well as the impact of adopting the new RP-2014 mortality tables for pension obligations. The change in the discount rate accounted for approximately $226 million of the net actuarial loss, and the change due to the adoption of the new RP-2014 mortality tables accounted for approximately $59 million. Net actuarial losses as a result of the discount rate and the adoption of the new mortality tables were partially offset by higher than expected asset returns of approximately $117 million (a net asset gain of $292.7 million on actual assets in 2014, or positive 11.2% on pension plan assets of $2.1 billion, compared with an expected return of $175.7 million, or 7.25%, in 2014). The remaining portion of the net actuarial loss for 2014 was due to other changes in actuarial assumptions.
In 2015, the net actuarial loss of $89.5 million was primarily due to the amount of the premium of $116.1 million paid to Prudential (the difference between the pension assets transferred to Prudential and the pension obligations transferred to Prudential) in connection with the purchase of the group annuity contracts in 2015, as well as lower than expected asset returns of $51.8 million (a net asset gain of $27.5 million on actual assets in 2015, or a positive 1.3% on pension assets of $858.3 million, compared with an expected return of $79.3 million, or 6.0%, in 2015). These items were partially offset by a 50 basis point increase in the Company's discount rate used to measure its defined benefit pension obligations. The change in the discount rate accounted for $56.1 million. The remaining portion of the net actuarial loss for 2015 was due to other changes in actuarial assumptions.
In 2016, the net actuarial loss of $61.6 million was primarily due to a 35 basis point reduction in the discount rate used to measure the Company's U.S. defined benefit pension obligations and a 125 basis point reduction in the discount rate used to measure its U.K defined benefit pension obligations. The change in the discount rate accounted for approximately $87 million of the net actuarial loss. Net actuarial losses as a result of the discount rate were partially offset by higher than expected asset returns of approximately $37 million (a net asset gain of $77.0 million on actual assets in 2016, or positive 8.5% on pension plan assets of $798.3 million, compared with an expected return of $40.1 million, or 6%, in 2016). The remaining portion of the net actuarial loss for 2016 was due to other changes in actuarial assumptions.
44
During the period between December 31, 2013 and December 31, 2016, the Company contributed a total of $46.9 million to its global defined benefit pension plans. As discussed above, the Company expects to contribute approximately
$10 million
to its global defined benefit pension plans in 2017. Despite the net actuarial losses recorded for the period between December 31, 2013 and December 31, 2016, only approximately $8 million of contributions were required in 2016. The contributions over the last three years, as well as favorable returns on pension assets, have contributed to the Company's U.S. defined benefit pension plans being overfunded and a lower requirement for the Company to contribute to its defined benefit pension plans. The effect of actuarial losses on future earnings and operating cash flow, as well as a lower discount rate to measure the Company's pension obligations, is expected to be favorable in 2017, compared with 2016.
For expense purposes in
2016
, the Company applied a weighted-average discount rate of
4.69%
to its US defined benefit pension plans. For expense purposes in
2017
, the Company will apply a weighted-average discount rate of
4.34%
to its U.S. defined benefit pension plans.
For expense purposes in
2016
, the Company applied an expected weighted-average rate of return of
5.78%
for the Company’s U.S. pension plan assets. For expense purposes in
2017
, the Company will apply an expected weighted-average rate of return on plan assets of
5.78%
.
The following table presents the sensitivity of the Company's U.S. projected pension benefit obligation ("PBO"), total equity and 2016 expense to the indicated increase/decrease in key assumptions:
|
+ / - Change at December 31, 2016
|
Change to
|
|||||||||||||
|
Change
|
PBO
|
Equity
|
2017 Expense
|
|||||||||||
|
Assumption:
|
||||||||||||||
|
Discount rate
|
+/- 0.25%
|
$
|
21.4
|
|
$
|
21.4
|
|
$
|
2.2
|
|
||||
|
Actual return on plan assets
|
+/- 0.25%
|
N/A
|
|
1.2
|
|
—
|
|
|||||||
|
Expected return on assets
|
+/- 0.25%
|
N/A
|
|
N/A
|
|
1.2
|
|
|||||||
In the table above, a 25 basis point decrease in the discount rate will increase the PBO by $21.4 million and decrease total equity by $21.4 million. The change in equity in the table above is reflected on a pre-tax basis. Defined benefit pension plans in the United States represent 66% of the Company's benefit obligation and 66% of the fair value of the Company's plan assets at December 31, 2016. The Company uses a combined U.S. federal and state statutory rate of approximately 37% to calculate the after tax impact on equity for U.S. plans. The Company uses the local statutory tax rate in effect to calculate the after tax impact on equity for all remaining non-U.S. plans. For some non-U.S. plans, a valuation allowance has been recorded against the tax benefits recorded in equity and, therefore, no tax benefits are recognized on an after tax basis.
45
Postretirement Benefit Plans:
The Company recognized net periodic benefit cost of $5.8 million in 2016 for postretirement benefit plans, compared with $5.1 million in 2015. The increase was primarily due to a lower expected return on plan assets. The lower expected return on plan assets for 2016 was primarily due to a 25 basis point decrease in the expected return on assets in the Company's Voluntary Employee Beneficiary Association (VEBA) trust.
In 2017, the Company expects net periodic benefit cost to decrease to $2.3 million for postretirement benefit plans. The expected decrease is primarily due to lower amortization of prior service cost of $2.1 million and lower interest costs of $1.9 million, partially offset by a lower expected return on plan assets of $0.8 million. The lower amortization of prior service costs is primarily due to an amendment to the Company's postretirement benefit plan in 2016. The Company will no longer offer company subsidized postretirement medical benefits to non-bargaining employees who retire after December 31, 2016. This amendment reduced the accumulated benefit obligation by $11.4 million in 2016. This amount will be amortized over the remaining service period of the employees affected by this amendment. The expected decrease in interest costs was primarily due to a 42 basis point reduction in the discount rated used for expense purposes. The lower expected return on plan assets is primarily due to a reduction in VEBA trust assets in 2016 that will affect the expected return on plan assets in 2017.
For expense purposes in
2016
, the Company applied a discount rate of
4.39%
to its postretirement benefit plans. For expense purposes in 2017, the Company will apply a discount rate of
3.97%
to its postretirement benefit plans. For expense purposes in
2016
, the Company applied an expected rate of return of 6.00% to the VEBA trust assets. For expense purposes in 2017, the Company will apply an expected rate of return of 6.00% to the VEBA trust assets.
The following table presents the sensitivity of the Company's accumulated other postretirement benefit obligation (ABO), total equity and 2017 expense to the indicated increase/decrease in key assumptions:
|
+ / - Change at Dec. 31, 2016
|
Change to
|
|||||||||||||
|
Change
|
ABO
|
Equity
|
2017 Expense
|
|||||||||||
|
Assumption:
|
||||||||||||||
|
Discount rate
|
+/- 0.25%
|
$
|
4.2
|
|
$
|
4.2
|
|
$
|
0.3
|
|
||||
|
Actual return on plan assets
|
+/- 0.25%
|
N/A
|
|
0.2
|
|
—
|
|
|||||||
|
Expected return on assets
|
+/- 0.25%
|
N/A
|
|
N/A
|
|
0.2
|
|
|||||||
In the table above, a 25 basis point decrease in the discount rate will increase the ABO by $4.2 million and decrease equity by $4.2 million. The change in total equity in the table above is reflected on a pre-tax basis.
For measurement purposes for postretirement benefits, the Company assumed a weighted-average annual rate of increase in per capita cost (health care cost trend rate) for medical and prescription drug benefits of 6.50% for 2017, declining steadily for the next six years to 5.0%; and 8.50% for HMO benefits for 2017, declining gradually for the next 14 years to 5.0%. The assumed health care cost trend rate may have a significant effect on the amounts reported. A one percentage point increase in the assumed health care cost trend rate would have increased the 2016 total service and interest cost components by $0.2 million and would have increased the postretirement obligation by $6.0 million. A one percentage point decrease would provide corresponding reductions of $0.2 million and $5.3 million, respectively.
Other loss reserves:
The Company has a number of loss exposures that are incurred in the ordinary course of business such as environmental claims, product liability, product warranty, litigation and accounts receivable reserves. Establishing loss reserves for these matters requires management’s judgment with regards to estimating risk exposure and ultimate liability or realization. These loss reserves are reviewed periodically and adjustments are made to reflect the most recent facts and circumstances.
46
OTHER DISCLOSURES:
Foreign Currency:
Assets and liabilities of subsidiaries are translated at the rate of exchange in effect on the balance sheet date; income and expenses are translated at the average rates of exchange prevailing during the reporting period. Related translation adjustments are reflected as a separate component of accumulated other comprehensive loss. Foreign currency gains and losses resulting from transactions are included in the Consolidated Statements of Income.
The Company recognized a foreign currency exchange loss resulting from transactions of
$5.6 million
,
$0.3 million
and
$9.9 million
for the years ended
December 31, 2016
,
2015
and
2014
, respectively. For the year ended
December 31, 2016
, the Company recorded a negative non-cash foreign currency translation adjustment of
$34.5 million
that decreased shareholders’ equity, compared with a negative non-cash foreign currency translation adjustment of
$71.5 million
that decreased shareholders’ equity for the year ended
December 31, 2015
. The foreign currency translation adjustments for the year ended
December 31, 2016
were negatively impacted by the strengthening of the U.S. dollar relative to most other currencies.
Change in Accounting Principle:
Timken plans to adopt mark-to-market accounting for its defined benefit pension and other postretirement benefit plans in the first quarter of 2017, subject to the completion of its preferability analysis. Under the new accounting method, the Company will immediately recognize actuarial gains and losses through earnings in the year in which they occur (in the fourth quarter or earlier as triggering events warrant). Under the current accounting method, actuarial gains and losses are recognized as a component of other comprehensive income (loss) and amortized to earnings over many years. Also in the first quarter of 2017, the Company plans to change its policy for recognizing returns on plan assets from a market-related value method (based on a smoothing of asset returns) to a fair value method. Once adopted, these policy changes will be applied retrospectively to prior years. The Company is currently determining the impact on prior years and will provide that information later in 2017. Actual results for 2016 and related disclosures, as well as the Company's 2017 outlook, included in this Form 10-K do not reflect the impact of these voluntary method changes.
Trade Law Enforcement:
The U.S. government has an antidumping duty order in effect covering tapered roller bearings from China. The Company is a producer of these bearings, as well as ball bearings and other bearing types, in the United States. In 2012, the U.S. government extended this order for an additional five years. Antidumping duty orders covering ball bearings from Japan and the United Kingdom were sunset, as expected, by the U.S. Department of Commerce in March 2014, retroactive to September 2011.
Quarterly Dividend:
On February 10, 2017, the Company’s Board of Directors declared a quarterly cash dividend of $0.26 per common share. The quarterly dividend will be paid on March 3, 2017 to shareholders of record as of February 22, 2017. This will be the 379
th
consecutive quarterly dividend paid on the common shares of the Company.
47
Forward-Looking Statements
Certain statements set forth in this Annual Report on Form 10-K and in the Company’s
2016
Annual Report to Shareholders (including the Company’s forecasts, beliefs and expectations) that are not historical in nature are “forward-looking” statements within the meaning of the Private Securities Litigation Reform Act of 1995. In particular, Management’s Discussion and Analysis on pages
17
through
47
contains numerous forward-looking statements. Forward-looking statements generally will be accompanied by words such as “anticipate,” “believe,” “could,” “estimate,” “expect,” “forecast,” “outlook,” “intend,” “may,” “possible,” “potential,” “predict,” “project” or other similar words, phrases or expressions. You are cautioned not to place undue reliance on forward-looking statements, which speak only as of the date of this Annual Report on Form 10-K. Actual results may differ materially from those expressed or implied in forward-looking statements made by or on behalf of the Company due to a variety of factors, such as:
|
(a)
|
deterioration in world economic conditions, or in economic conditions in any of the geographic regions in which the Company or its customers or suppliers conducts business, including additional adverse effects from the global economic slowdown, terrorism or hostilities. This includes: political risks associated with the potential instability of governments and legal systems in countries in which the Company, its customers or suppliers conduct business, and changes in foreign currency valuations;
|
|
(b)
|
the effects of fluctuations in customer demand on sales, product mix and prices in the industries in which the Company operates. This includes: the ability of the Company to respond to rapid changes in customer demand, the effects of customer or supplier bankruptcies or liquidations, the impact of changes in industrial business cycles, and whether conditions of fair trade continue in our markets;
|
|
(c)
|
competitive factors, including changes in market penetration, increasing price competition by existing or new foreign and domestic competitors, the introduction of new products by existing and new competitors, and new technology that may impact the way the Company’s products are produced, sold or distributed;
|
|
(d)
|
changes in operating costs. This includes: the effect of changes in the Company’s manufacturing processes; changes in costs associated with varying levels of operations and manufacturing capacity; availability and cost of raw materials; changes in the expected costs associated with product warranty claims; changes resulting from inventory management and cost reduction initiatives; the effects of unplanned plant shutdowns; and changes in the cost of labor and benefits;
|
|
(e)
|
the success of the Company’s operating plans, announced programs, initiatives and capital investments; the ability to integrate acquired companies; the ability of acquired companies to achieve satisfactory operating results, including results being accretive to earnings; and the Company’s ability to maintain appropriate relations with unions that represent Company associates in certain locations in order to avoid disruptions of business;
|
|
(f)
|
unanticipated litigation, claims or assessments. This includes: claims or problems related to intellectual property, product liability or warranty, environmental issues, and taxes;
|
|
(g)
|
changes in worldwide capital markets, including availability of financing and interest rates on satisfactory terms, which affect: the Company’s cost of funds and/or ability to raise capital; and the ability of customers to obtain financing to purchase the Company’s products or equipment that contain the Company’s products;
|
|
(h)
|
the impact on the Company's pension obligations due to changes in interest rates, investment performance, changes in law or regulation, and other tactics designed to reduce risk;
|
|
(i)
|
the impact of changes to the Company's accounting methods, including the actual impact of the adoption of mark-to-market accounting;
|
|
(j)
|
retention of CDSOA distributions;
|
|
(k)
|
the taxable nature of the Spinoff; and
|
|
(l)
|
those items identified under Item 1A. Risk Factors on pages
6
through
11
.
|
Additional risks relating to the Company’s business, the industries in which the Company operates or the Company’s common shares may be described from time to time in the Company’s filings with the Securities and Exchange Commission. All of these risk factors are difficult to predict, are subject to material uncertainties that may affect actual results and may be beyond the Company’s control.
Readers are cautioned that it is not possible to predict or identify all of the risks, uncertainties and other factors that may affect future results and that the above list should not be considered to be a complete list. Except as required by the federal securities laws, the Company undertakes no obligation to publicly update or revise any forward-looking statement, whether as a result of new information, future events or otherwise.
48
Interest Rate Risk:
Changes in short-term interest rates related to several separate funding sources impact the Company’s earnings. These sources are borrowings under the Accounts Receivable Facility, borrowings under the Senior Credit Facility and short-term bank borrowings by its international subsidiaries. If the market rates for short-term borrowings increased by one-percentage-point around the globe, the impact would be an increase in interest expense of
$1.5 million
annually, with a corresponding decrease in income from continuing operations before income taxes of the same amount. This amount was determined by considering the impact of hypothetical interest rates on the Company’s borrowing cost and year-end debt balances by category.
Foreign Currency Exchange Rate Change Risk:
Fluctuations in the value of the U.S. dollar compared to foreign currencies, including the Euro, also impact the Company’s earnings. The greatest risk relates to products shipped between the Company’s European operations and the United States, as well as intercompany loans between Timken affiliates. Foreign currency forward contracts are used to hedge a portion of these intercompany transactions. Additionally, hedges are used to cover third-party purchases of products and equipment. As of
December 31, 2016
, there were
$282.8 million
of hedges in place. A uniform
10%
weakening of the U.S. dollar against all currencies would have resulted in a charge of
$17.3 million
related to these hedges, which would have partially offset the otherwise favorable impact of the underlying currency fluctuation. In addition to the direct impact of the hedged amounts, changes in exchange rates also affect the volume of sales or foreign currency sales price as competitors’ products become more or less attractive.
Commodity Price Risk:
In the ordinary course of business, the Company is exposed to market risk with respect to commodity price fluctuations, primarily related to our purchases of raw materials and energy, principally steel and natural gas. Whenever possible, the Company manages its exposure to commodity risks primarily through the use of supplier pricing agreements that enable the Company to establish the purchase prices for certain inputs that are used in our manufacturing and distribution business.
49
|
Consolidated Statements of Income
|
|||||||||
|
|
Year Ended December 31,
|
||||||||
|
2016
|
2015
|
2014
|
|||||||
|
(Dollars in millions, except per share data)
|
|||||||||
|
Net sales
|
$
|
|
|
$
|
|
|
$
|
|
|
|
Cost of products sold
|
|
|
|
|
|
|
|||
|
Gross Profit
|
|
|
|
|
|
|
|||
|
Selling, general and administrative expenses
|
|
|
|
|
|
|
|||
|
Impairment and restructuring charges
|
|
|
|
|
|
|
|||
|
Gain on divestiture
|
|
|
(
|
)
|
|
|
|||
|
Pension settlement charges
|
|
|
|
|
|
|
|||
|
Operating Income (Loss)
|
|
|
(
|
)
|
|
|
|||
|
Interest expense
|
(
|
)
|
(
|
)
|
(
|
)
|
|||
|
Interest income
|
|
|
|
|
|
|
|||
|
Continued Dumping and Subsidy Offset Act income, net
|
|
|
|
|
|
|
|||
|
Gain on sale of real estate
|
|
|
|
|
|
|
|||
|
Other expense, net
|
(
|
)
|
(
|
)
|
(
|
)
|
|||
|
Income (Loss) From Continuing Operations Before Income Taxes
|
|
|
(
|
)
|
|
|
|||
|
Provision (benefit) for income taxes
|
|
|
(
|
)
|
|
|
|||
|
Income (Loss) From Continuing Operations
|
|
|
(
|
)
|
|
|
|||
|
Income from discontinued operations, net of income taxes
|
|
|
|
|
|
|
|||
|
Net Income (Loss)
|
|
|
(
|
)
|
|
|
|||
|
Less: Net income attributable to noncontrolling interest
|
|
|
|
|
|
|
|||
|
Net Income (Loss) Attributable to The Timken Company
|
$
|
|
|
$
|
(
|
)
|
$
|
|
|
|
Amounts Attributable to The Timken Company's Common Shareholders:
|
|||||||||
|
Income (loss) from continuing operations, net of income taxes
|
$
|
|
|
$
|
(
|
)
|
$
|
|
|
|
Income from discontinued operations, net of income taxes
|
|
|
|
|
|
|
|||
|
Net Income (Loss) Attributable to The Timken Company
|
$
|
|
|
$
|
(
|
)
|
$
|
|
|
|
Net Income (Loss) per Common Share Attributable to The Timken Company
Common Shareholders
|
|||||||||
|
Earnings (loss) per share - continuing operations
|
$
|
|
|
$
|
(
|
)
|
$
|
|
|
|
Earnings per share - discontinued operations
|
|
|
|
|
|
|
|||
|
Basic earnings (loss) per share
|
$
|
|
|
$
|
(
|
)
|
$
|
|
|
|
Diluted earnings (loss) per share - continuing operations
|
$
|
|
|
$
|
(
|
)
|
$
|
|
|
|
Diluted earnings per share - discontinued operations
|
|
|
|
|
|
|
|||
|
Diluted earnings (loss) per share
|
$
|
|
|
$
|
(
|
)
|
$
|
|
|
|
Dividends per share
|
$
|
|
|
$
|
|
|
$
|
|
|
See accompanying Notes to the Consolidated Financial Statements.
50
|
Consolidated Statements of Comprehensive Income
|
|||||||||
|
Year Ended December 31,
|
|||||||||
|
2016
|
2015
|
2014
|
|||||||
|
(Dollars in millions)
|
|||||||||
|
Net Income (Loss)
|
$
|
|
|
$
|
(
|
)
|
$
|
|
|
|
Other comprehensive (loss) income, net of tax:
|
|||||||||
|
Foreign currency translation adjustments
|
(
|
)
|
(
|
)
|
(
|
)
|
|||
|
Pension and postretirement liability adjustment
|
(
|
)
|
|
|
(
|
)
|
|||
|
Change in fair value of derivative financial instruments
|
|
|
|
|
(
|
)
|
|||
|
Other comprehensive (loss) income, net of tax
|
(
|
)
|
|
|
(
|
)
|
|||
|
Comprehensive Income, net of tax
|
|
|
|
|
|
|
|||
|
Less: comprehensive income attributable to noncontrolling interest
|
|
|
|
|
|
|
|||
|
Comprehensive Income Attributable to The Timken Company
|
$
|
|
|
$
|
|
|
$
|
|
|
See accompanying Notes to the Consolidated Financial Statements.
51
|
|
||||||
|
|
December 31,
|
|||||
|
2016
|
2015
|
|||||
|
(Dollars in millions)
|
||||||
|
ASSETS
|
||||||
|
Current Assets
|
||||||
|
Cash and cash equivalents
|
$
|
|
|
$
|
|
|
|
Restricted cash
|
|
|
|
|
||
|
Accounts receivable, less allowances (2016 - $20.2 million; 2015 - $16.9 million)
|
|
|
|
|
||
|
Inventories, net
|
|
|
|
|
||
|
Deferred charges and prepaid expenses
|
|
|
|
|
||
|
Other current assets
|
|
|
|
|
||
|
Total Current Assets
|
|
|
|
|
||
|
Property, Plant and Equipment, Net
|
|
|
|
|
||
|
Other Assets
|
||||||
|
Goodwill
|
|
|
|
|
||
|
Other intangible assets
|
|
|
|
|
||
|
Non-current pension assets
|
|
|
|
|
||
|
Deferred income taxes
|
|
|
|
|
||
|
Other non-current assets
|
|
|
|
|
||
|
Total Other Assets
|
|
|
|
|
||
|
Total Assets
|
$
|
|
|
$
|
|
|
|
LIABILITIES AND EQUITY
|
||||||
|
Current Liabilities
|
||||||
|
Short-term debt
|
$
|
|
|
$
|
|
|
|
Current portion of long-term debt
|
|
|
|
|
||
|
Accounts payable, trade
|
|
|
|
|
||
|
Salaries, wages and benefits
|
|
|
|
|
||
|
Income taxes payable
|
|
|
|
|
||
|
Other current liabilities
|
|
|
|
|
||
|
Total Current Liabilities
|
|
|
|
|
||
|
Non-Current Liabilities
|
||||||
|
Long-term debt
|
|
|
|
|
||
|
Accrued pension cost
|
|
|
|
|
||
|
Accrued postretirement benefits cost
|
|
|
|
|
||
|
Deferred income taxes
|
|
|
|
|
||
|
Other non-current liabilities
|
|
|
|
|
||
|
Total Non-Current Liabilities
|
|
|
|
|
||
|
Shareholders’ Equity
|
||||||
|
Class I and II Serial Preferred Stock without par value:
|
||||||
|
Authorized - 10,000,000 shares each class, none issued
|
|
|
|
|
||
|
Common stock without par value:
|
||||||
|
Authorized - 200,000,000 shares
|
||||||
|
Issued (including shares in treasury) (2016 - 98,375,135; 2015 - 98,375,135 shares)
|
||||||
|
Stated capital
|
|
|
|
|
||
|
Other paid-in capital
|
|
|
|
|
||
|
Earnings invested in the business
|
|
|
|
|
||
|
Accumulated other comprehensive loss
|
(
|
)
|
(
|
)
|
||
|
Treasury shares at cost (2016 - 20,925,492; 2015 - 18,112,047 shares)
|
(
|
)
|
(
|
)
|
||
|
Total Shareholders’ Equity
|
|
|
|
|
||
|
Noncontrolling interest
|
|
|
|
|
||
|
Total Equity
|
|
|
|
|
||
|
Total Liabilities and Equity
|
$
|
|
|
$
|
|
|
See accompanying Notes to the Consolidated Financial Statements.
52
|
|
|||||||||
|
Year Ended December 31,
|
|||||||||
|
2016
|
2015
|
2014
|
|||||||
|
(Dollars in millions)
|
|||||||||
|
CASH PROVIDED (USED)
|
|||||||||
|
Operating Activities
|
|||||||||
|
Net income (loss) attributable to The Timken Company
|
$
|
|
|
$
|
(
|
)
|
$
|
|
|
|
Net income from discontinued operations
|
|
|
|
|
(
|
)
|
|||
|
Net income attributable to noncontrolling interest
|
|
|
|
|
|
|
|||
|
Adjustments to reconcile net income (loss) to net cash provided by operating activities:
|
|||||||||
|
Depreciation and amortization
|
|
|
|
|
|
|
|||
|
Impairment charges
|
|
|
|
|
|
|
|||
|
Loss (gain) on sale of assets
|
|
|
|
|
(
|
)
|
|||
|
Gain on divestitures
|
|
|
(
|
)
|
|
|
|||
|
Deferred income tax provision (benefit)
|
(
|
)
|
(
|
)
|
(
|
)
|
|||
|
Stock-based compensation expense
|
|
|
|
|
|
|
|||
|
Excess tax benefits related to stock-based compensation
|
|
|
(
|
)
|
(
|
)
|
|||
|
Pension and other postretirement expense
|
|
|
|
|
|
|
|||
|
Pension and other postretirement benefit contributions
|
(
|
)
|
(
|
)
|
(
|
)
|
|||
|
Changes in operating assets and liabilities:
|
|||||||||
|
Accounts receivable
|
|
|
|
|
(
|
)
|
|||
|
Inventories
|
|
|
|
|
(
|
)
|
|||
|
Accounts payable, trade
|
|
|
|
|
|
|
|||
|
Other accrued expenses
|
(
|
)
|
(
|
)
|
|
|
|||
|
Income taxes
|
|
|
(
|
)
|
(
|
)
|
|||
|
Other, net
|
|
|
|
|
|
|
|||
|
Net Cash Provided by Operating Activities - continuing operations
|
|
|
|
|
|
|
|||
|
Net Cash Provided by Operating Activities - discontinued operations
|
|
|
|
|
|
|
|||
|
Net Cash Provided by Operating Activities
|
|
|
|
|
|
|
|||
|
Investing Activities
|
|||||||||
|
Capital expenditures
|
(
|
)
|
(
|
)
|
(
|
)
|
|||
|
Acquisitions, net of cash acquired of $2.5 million in 2016 and $0.1 million in 2015
|
(
|
)
|
(
|
)
|
(
|
)
|
|||
|
Proceeds from disposals of property, plant and equipment
|
|
|
|
|
|
|
|||
|
Divestitures
|
|
|
|
|
|
|
|||
|
Investments in short-term marketable securities, net
|
(
|
)
|
(
|
)
|
|
|
|||
|
Other
|
|
|
(
|
)
|
|
|
|||
|
Net Cash Used by Investing Activities - continuing operations
|
(
|
)
|
(
|
)
|
(
|
)
|
|||
|
Net Cash Used by Investing Activities - discontinued operations
|
|
|
|
|
(
|
)
|
|||
|
Net Cash Used by Investing Activities
|
(
|
)
|
(
|
)
|
(
|
)
|
|||
|
Financing Activities
|
|||||||||
|
Cash dividends paid to shareholders
|
(
|
)
|
(
|
)
|
(
|
)
|
|||
|
Purchase of treasury shares
|
(
|
)
|
(
|
)
|
(
|
)
|
|||
|
Proceeds from exercise of stock options
|
|
|
|
|
|
|
|||
|
Excess tax benefits related to stock-based compensation
|
|
|
|
|
|
|
|||
|
Proceeds from issuance of long-term debt
|
|
|
|
|
|
|
|||
|
Payments on long-term debt
|
(
|
)
|
(
|
)
|
(
|
)
|
|||
|
Deferred financing costs
|
|
|
(
|
)
|
(
|
)
|
|||
|
Accounts receivable securitization financing borrowings
|
|
|
|
|
|
|
|||
|
Accounts receivable securitization financing payments
|
(
|
)
|
(
|
)
|
(
|
)
|
|||
|
Short-term debt activity, net
|
|
|
|
|
(
|
)
|
|||
|
(Increase) decrease in restricted cash
|
(
|
)
|
|
|
|
|
|||
|
Cash transferred to TimkenSteel Corporation
|
|
|
|
|
(
|
)
|
|||
|
Other
|
|
|
|
|
(
|
)
|
|||
|
Net Cash Used by Financing Activities - continuing operations
|
(
|
)
|
(
|
)
|
(
|
)
|
|||
|
Net Cash Provided by Financing Activities - discontinued operations
|
|
|
|
|
|
|
|||
|
Net Cash Used by Financing Activities
|
(
|
)
|
(
|
)
|
(
|
)
|
|||
|
Effect of exchange rate changes on cash
|
(
|
)
|
(
|
)
|
(
|
)
|
|||
|
Increase (decrease) In Cash and Cash Equivalents
|
|
|
(
|
)
|
(
|
)
|
|||
|
Cash and cash equivalents at beginning of year
|
|
|
|
|
|
|
|||
|
Cash and Cash Equivalents at End of Year
|
$
|
|
|
$
|
|
|
$
|
|
|
See accompanying Notes to the Consolidated Financial Statements.
53
|
Consolidated Statements of Shareholders’ Equity
|
|||||||||||||||||||||
|
|
|
The Timken Company Shareholders
|
|
||||||||||||||||||
|
Total
|
Stated
Capital
|
Other
Paid-In
Capital
|
Earnings
Invested
in the
Business
|
Accumulated
Other
Comprehensive
Income (Loss)
|
Treasury
Shares
|
Non-
controlling
Interest
|
|||||||||||||||
|
(Dollars in millions, except per share data)
|
|
|
|
|
|
|
|
||||||||||||||
|
Year Ended December 31, 2014
|
|||||||||||||||||||||
|
Balance at January 1, 2014
|
$
|
|
|
$
|
|
|
$
|
|
|
$
|
|
|
$
|
(
|
)
|
$
|
(
|
)
|
$
|
|
|
|
Net income
|
|
|
|
|
|
|
|||||||||||||||
|
Foreign currency translation adjustments
|
(
|
)
|
(
|
)
|
(
|
)
|
|||||||||||||||
|
Pension and postretirement liability adjustment
(net of income tax expense of $23.9 million) |
(
|
)
|
(
|
)
|
|||||||||||||||||
|
Change in fair value of derivative financial
instruments, net of reclassifications
|
(
|
)
|
(
|
)
|
|||||||||||||||||
|
Dividends declared to noncontrolling interest
|
(
|
)
|
(
|
)
|
|||||||||||||||||
|
Dividends – $1.00 per share
|
(
|
)
|
(
|
)
|
|||||||||||||||||
|
Distribution of TimkenSteel
|
(
|
)
|
(
|
)
|
|
|
|||||||||||||||
|
Excess tax benefit from stock compensation
|
|
|
|
|
|||||||||||||||||
|
Stock-based compensation expense
|
|
|
|
|
|||||||||||||||||
|
Purchase of treasury shares
|
(
|
)
|
(
|
)
|
|||||||||||||||||
|
Stock option exercise activity
|
|
|
(
|
)
|
|
|
|||||||||||||||
|
Restricted share activity
|
|
|
(
|
)
|
|
|
|||||||||||||||
|
Shares surrendered for taxes
|
(
|
)
|
|
|
|
|
(
|
)
|
|
||||||||||||
|
Balance at December 31, 2014
|
$
|
|
|
$
|
|
|
$
|
|
|
$
|
|
|
$
|
(
|
)
|
$
|
(
|
)
|
$
|
|
|
|
Year Ended December 31, 2015
|
|||||||||||||||||||||
|
Net (loss) income
|
(
|
)
|
(
|
)
|
|
|
|||||||||||||||
|
Foreign currency translation adjustments
|
(
|
)
|
(
|
)
|
(
|
)
|
|||||||||||||||
|
Pension and postretirement liability adjustment
(net of income tax benefit of $155.4 million) |
|
|
|
|
|||||||||||||||||
|
Change in fair value of derivative financial
instruments, net of reclassifications
|
|
|
|
|
|||||||||||||||||
|
Dividends declared to noncontrolling interest
|
(
|
)
|
(
|
)
|
|||||||||||||||||
|
Investment in joint venture by noncontrolling
interest party
|
|
|
|
|
|||||||||||||||||
|
Dividends – $1.03 per share
|
(
|
)
|
(
|
)
|
|||||||||||||||||
|
Excess tax benefit from stock compensation
|
|
|
|
|
|||||||||||||||||
|
Stock-based compensation expense
|
|
|
|
|
|||||||||||||||||
|
Purchase of treasury shares
|
(
|
)
|
(
|
)
|
|||||||||||||||||
|
Stock option exercise activity
|
|
|
(
|
)
|
|
|
|||||||||||||||
|
Restricted share activity
|
|
|
(
|
)
|
|
|
|||||||||||||||
|
Shares surrendered for taxes
|
(
|
)
|
|
|
|
|
(
|
)
|
|
||||||||||||
|
Balance at December 31, 2015
|
$
|
|
|
$
|
|
|
$
|
|
|
$
|
|
|
$
|
(
|
)
|
$
|
(
|
)
|
$
|
|
|
|
Year Ended December 31, 2016
|
|||||||||||||||||||||
|
Net income
|
|
|
|
|
|
|
|||||||||||||||
|
Foreign currency translation adjustments
|
(
|
)
|
(
|
)
|
|
|
|||||||||||||||
|
Pension and postretirement liability adjustment
(net of income tax benefit of $4.6 million) |
(
|
)
|
(
|
)
|
|||||||||||||||||
|
Change in fair value of derivative financial
instruments, net of reclassifications
|
|
|
|
|
|||||||||||||||||
|
Investment in joint venture by noncontrolling
interest party
|
|
|
|
|
|||||||||||||||||
|
Dividends declared to noncontrolling interest
|
(
|
)
|
(
|
)
|
|||||||||||||||||
|
Dividends –
$1.04
per share
|
(
|
)
|
(
|
)
|
|||||||||||||||||
|
Tax shortfall from stock compensation
|
(
|
)
|
(
|
)
|
|||||||||||||||||
|
Stock-based compensation expense
|
|
|
|
|
|||||||||||||||||
|
Purchase of treasury shares
|
(
|
)
|
(
|
)
|
|||||||||||||||||
|
Stock option exercise activity
|
|
|
(
|
)
|
|
|
|||||||||||||||
|
Restricted share activity
|
|
|
(
|
)
|
|
|
|||||||||||||||
|
Shares surrendered for taxes
|
(
|
)
|
|
|
|
|
(
|
)
|
|
||||||||||||
|
Balance at December 31, 2016
|
$
|
|
|
$
|
|
|
$
|
|
|
$
|
|
|
$
|
(
|
)
|
$
|
(
|
)
|
$
|
|
|
See accompanying Notes to the Consolidated Financial Statements.
54
NOTES TO CONSOLIDATED FINANCIAL STATEMENTS
(Dollars in millions, except per share data)
The Company considers all highly liquid investments with a maturity of three months or less when purchased to be cash equivalents.
Property, plant and equipment, net is valued at cost less accumulated depreciation. Maintenance and repairs are charged to expense as incurred. The provision for depreciation is computed principally by the straight-line method based upon the estimated useful lives of the assets. The useful lives are approximately
30
years
for buildings,
three
to
ten years
for computer software and
three
to
20
years
for machinery and equipment.
55
Assets and liabilities of subsidiaries are translated at the rate of exchange in effect on the balance sheet date; income and expenses are translated at the average rates of exchange prevailing during the reporting period. Related translation adjustments are reflected as a separate component of accumulated other comprehensive loss. Foreign currency gains and losses resulting from transactions are included in the Consolidated Statements of Income.
For the year ended
December 31, 2016
, the Company recorded a non-cash foreign currency translation adjustment of
$
34.5
million
that decreased shareholders’ equity, compared with a non-cash foreign currency translation adjustment of
$
71.5
million
that decreased shareholders’ equity for the year ended
December 31, 2015
. The foreign currency translation adjustments for the year ended
December 31, 2016
were negatively impacted by the strengthening of the U.S. dollar relative to most other currencies.
The Company recognizes an overfunded status or underfunded status (i.e., the difference between the fair value of plan assets and the benefit obligations) as either an asset or a liability for its defined benefit pension and postretirement benefit plans on the Consolidated Balance Sheets, with a corresponding adjustment to accumulated other comprehensive loss, net of tax. The adjustment to accumulated other comprehensive loss represents the current year net unrecognized actuarial gains and losses and unrecognized prior service costs. These amounts will be recognized in future periods as net periodic benefit cost. Net actuarial gains and losses for the Company's defined benefit pension plan in the United Kingdom are amortized over the remaining life expectancy of the participants in the plan.
56
Recent Accounting Pronouncements:
In September 2015, the FASB issued Accounting Standards Update ("ASU") 2015-16, "Business Combinations (Topic 805): Simplifying the Accounting for Measurement-Period Adjustments." ASU 2015-16 eliminates the requirement for an acquirer in a business combination to account for measurement-period adjustments retrospectively. Instead, acquirers must recognize measurement-period adjustments during the period in which they determine the amounts, including the effect on earnings of any amounts they would have recorded in previous periods if the accounting had been completed at the acquisition date. This new accounting guidance does not eliminate the requirement for the measurement period to be completed within one year. On January 1, 2016, the Company adopted the provisions of ASU 2015-16. The impact of the adoption of ASU 2015-16 was immaterial to the Company's results of operations and financial condition as there was only a minor measurement-period adjustment during 2016.
57
In May 2015, the FASB issued ASU 2015-07, "Fair Value Measurement (Topic 820): Disclosures for Investments in Certain Entities That Calculate Net Asset Value per Share (or Its Equivalent)." ASU 2015-07 eliminates the requirement to categorize within the fair value hierarchy investments for which fair values are estimated using the net asset value ("NAV") practical expedient provided in ASC 820, "Fair Value Measurement." Instead, entities will be required to disclose the fair values of such investments so that financial statement users can reconcile amounts reported in the fair value hierarchy table and the amounts reported on the balance sheet. On January 1, 2016, the Company adopted the provisions of ASU 2015-07. The adoption of ASU 2015-07 did not have any impact on the Company's results of operations or financial condition as the new guidance addresses disclosure only. See
Note 18 - Fair Value
for the new disclosures.
In April 2015, the FASB issued ASU 2015-05, "Intangibles - Goodwill and Other - Internal-Use Software (Subtopic 350-40): Customer's Accounting for Fees Paid in a Cloud Computing Arrangement." ASU 2015-05 provides guidance to customers about whether a cloud computing arrangement includes a software license. If a cloud computing arrangement does not include a software license, the customer should account for the arrangement as a service contract. Prior to the issuance of this new accounting guidance, there was no explicit guidance about a customer's accounting for fees paid in a cloud computing arrangement. On January 1, 2016, the Company adopted the provisions of ASU 2015-05 on a prospective basis. The adoption of ASU 2015-05 did not have a material impact on the Company's results of operations or financial condition.
In April 2015, the FASB issued ASU 2015-03, "Interest - Imputation of Interest (Subtopic 835-30) - Simplifying the Presentation of Debt Issuance Costs." ASU 2015-03 requires that all costs incurred to issue debt be presented in the balance sheet as a direct deduction to the carrying value of debt. Prior to the issuance of this new accounting guidance, debt issuance costs were required to be presented in the balance sheet as a deferred charge (i.e., an asset), and only a debt discount was recorded as a direct deduction to the carrying value of debt. ASU 2015-03 requires that the new accounting guidance be applied on a retrospective basis, wherein the balance sheet of each individual period presented should be adjusted to reflect the period-specific effects of applying the new guidance.
|
As Originally Reported
|
New Presentation
|
Effect of Change
|
|||||||
|
Assets:
|
|||||||||
|
Other non-current assets
|
$
|
|
|
$
|
|
|
$
|
|
|
|
Liabilities:
|
|||||||||
|
Long-term debt
|
$
|
|
|
$
|
|
|
$
|
|
|
58
New Accounting Guidance Issued and Not Yet Adopted:
In June 2016, the FASB issued ASU 2016-13, "Financial Instruments - Credit Losses (Topic 326): Measurement of Credit Losses on Financial Instruments." ASU 2016-13 changes how entities will measure credit losses for most financial assets and certain other instruments that are not measured at fair value through net income. The new guidance will replace the current incurred loss approach with an expected loss model. The new expected credit loss impairment model will apply to most financial assets measured at amortized cost and certain other instruments, including trade and other receivables, loans, held-to-maturity debt instruments, net investments in leases, loan commitments and standby letters of credit. Upon initial recognition of the exposure, the expected credit loss model requires entities to estimate the credit losses expected over the life of an exposure (or pool of exposures). The estimate of expected credit losses should consider historical information, current information, and reasonable and supportable forecasts, including estimates of prepayments. Financial instruments with similar risk characteristics should be grouped together when estimating expected credit losses. ASU 2016-13 does not prescribe a specific method to make the estimate so its application will require significant judgment. ASU 2016-13 is effective in fiscal years beginning after December 15, 2019, including interim periods within those fiscal years. The Company is currently evaluating the effect that ASU 2016-13 will have on the Company's results of operations and financial condition.
In March 2016, the FASB issued ASU 2016-09, "Compensation - Stock Compensation (Topic 718): Improvements to Employee Share-Based Payment Accounting." ASU 2016-09 simplifies various aspects of the accounting for stock-based payments. The simplifications include:
|
a.
|
recording all tax effects associated with stock-based compensation through the income statement, as opposed to recording certain amounts in other paid-in capital, which eliminates the complications of tracking a “windfall pool,” but will increase the volatility of income tax expense;
|
|
b.
|
allowing entities to withhold shares to satisfy the employer’s statutory tax withholding requirement up to the highest marginal tax rate applicable to employees rather than the employer’s minimum statutory rate, without requiring liability classification for the award;
|
|
c.
|
modifying the requirement to estimate the number of awards that will ultimately vest by providing an accounting policy election to either estimate the number of forfeitures or recognize forfeitures as they occur; and
|
|
d.
|
changing certain presentation requirements in the statement of cash flows, including removing the requirement to present excess tax benefits as an inflow from financing activities and an outflow from operating activities, and requiring the cash paid to taxing authorities arising from withheld shares to be classified as a financing activity.
|
The Company is currently evaluating the effect that ASU 2016-09 will have on the Company's results of operations and financial condition, but does not expect the impact to be material.
In February 2016, the FASB issued ASU 2016-02, "Leases (Topic 842)." ASU 2016-02 was issued to increase transparency and comparability among entities by recognizing leased assets and leased liabilities on the balance sheet and disclosing key information about lease arrangements. ASU 2016-02 is effective for public companies for fiscal years, and interim periods within those fiscal years, beginning after December 15, 2018. The Company is currently evaluating the effect that ASU 2016-02 will have on the Company's results of operations and financial condition.
In May 2014, the FASB issued ASU 2014-09, "Revenue from Contracts with Customers (Topic 606)." ASU 2014-09 introduces a new five-step revenue recognition model in which an entity should recognize revenue to depict the transfer of goods or services to customers in an amount that reflects the consideration to which the entity expects to be entitled in exchange for those goods or services. ASU 2014-09 also requires disclosures sufficient to enable users to understand the nature, amount, timing, and uncertainty of revenue and cash flows arising from contracts with customers, including qualitative and quantitative disclosures about contracts with customers, significant judgments and changes in judgments and assets recognized from the costs to obtain or fulfill a contract. On July 9, 2015, the FASB decided to delay the effective date of this new accounting guidance by one year, which will result in it being effective for annual periods beginning after December 15, 2017. Although early adoption is permitted, the Company intends to adopt the new accounting standard effective January 1, 2018.
59
The two permitted transition methods under the new standard are 1) the full retrospective method, in which case the standard would be applied to each prior reporting period presented, subject to allowable practical expedients, and the cumulative effect of applying the standard would be recognized at the earliest period shown, or 2) the modified retrospective method, in which case the cumulative effect of applying the standard would be recognized at the date of initial application accompanied by additional disclosures comparing the current period results presented under the new standard to the prior periods presented under the current, legacy revenue recognition standards. While the Company has not yet determined which adoption method it will use, the Company is currently anticipating using the modified retrospective method, but will base the final decision on the results of its assessment, once completed.
60
On June 30, 2014, the Company completed the separation of its steel business through the Spinoff. The Company's Board of Directors declared a distribution of all outstanding common shares of TimkenSteel through a dividend. At the close of business on June 30, 2014, the Company's shareholders received
one
common share of TimkenSteel for every
two
common shares of the Company they held as of the close of business on June 23, 2014.
At the time of the Spinoff, the Company and TimkenSteel entered into certain transitional relationships, including an 18-month commercial supply agreement for TimkenSteel to supply the Company with certain steel products and other relationships.
The operating results, net of tax, included a one-time transaction cost of approximately
$
57.1
million
for
2014
in connection with the separation of the two companies. The cost primarily consisted of consulting and professional fees associated with preparing for and executing the Spinoff, as well as lease cancellation fees. In addition to the one time transaction costs, the Company incurred approximately
$
15
million
of capital expenditures related to the Spinoff in 2014.
|
Year Ended December 31, 2014
|
|||
|
Net sales
|
$
|
|
|
|
Cost of goods sold
|
|
|
|
|
Gross profit
|
|
|
|
|
Selling, administrative and general expenses
|
|
|
|
|
Separation costs
|
|
|
|
|
Interest expense, net
|
|
|
|
|
Other (income) expense, net
|
(
|
)
|
|
|
Income before income taxes
|
|
|
|
|
Income tax expense
|
|
|
|
|
Income from discontinued operations
|
$
|
|
|
61
Note 3 - Acquisitions and Divestitures
During
2016
, the Company completed two acquisitions. On
October 31, 2016
, the Company completed the acquisition of EDT, a manufacturer of polymer housed units and stainless steel ball bearings used primarily in the food and beverage industry. On
July 8, 2016
, the Company completed the acquisition of Lovejoy, a manufacturer of premium industrial couplings and universal joints. Aggregate sales for these companies for the most recent twelve months prior to their respective acquisitions totaled approximately
$
61
million
. The total purchase price for these two acquisitions was
$
74.4
million
in cash and
$
2.2
million
in assumed debt. The Company acquired cash of approximately
$
2.5
million
, subject to post-closing working capital adjustments, as part of these acquisitions. The Company incurred approximately
$
1.7
million
of legal and professional fees to acquire EDT and Lovejoy. Substantially all of the results for EDT and Lovejoy are reported in the Process Industries segment. The Company assumed certain contingent liabilities, including an environmental liability, as part of the Lovejoy transaction. Refer to
Note 11 - Contingencies
for additional information on Lovejoy's contingent liabilities.
On
September 1, 2015
, the Company completed the acquisition of Timken Belts, a leading North American manufacturer of belts used in industrial, commercial and consumer applications, and sold under multiple brand names, including Carlisle®, Ultimax® and Panther®, among others. The acquisition portfolio includes more than 20,000 parts that utilize wrap molded, raw edge, v-ribbed and synchronous belt designs. Aggregate sales for Timken Belts for the most recent twelve months prior to the acquisition was approximately
$
140
million
. The total purchase price for Timken Belts was
$
213.7
million
in cash, including cash acquired of approximately
$
0.1
million
. In
June 2016
, the Company paid a net purchase price adjustment of
$
0.7
million
, resulting in an adjustment to goodwill. The Company incurred approximately
$
1.0
million
of legal and professional fees to acquire Timken Belts. The results of the operations of Timken Belts are reported in both the Mobile Industries and Process Industries segments based on customers served.
During
2014
, the Company completed two acquisitions. On
November 30, 2014
, the Company completed the acquisition of Revolvo, a specialty bearing company that makes and markets ball and roller bearings for industrial applications in process and heavy industries. On
April 28, 2014
, the Company completed the acquisition of Schulz, a provider of electric motor and generator repairs, motor rewinds, custom controls and panels, systems integration, pump services, machine rebuilds, hydro services and diagnostics for a broad range of commercial and industrial applications. Aggregate sales for these companies for the most recent twelve months prior to their respective acquisitions totaled approximately
$
26
million
. The total purchase price for these two acquisitions was
$
21.7
million
in cash. The results for Revolvo and Schulz are reported in the Process Industries segment.
Pro forma results of these operations have not been presented because the effects of the acquisitions were not significant to the Company’s income from operations or total assets in any of the years presented.
62
T
he purchase price allocations, net of cash acquired, and any subsequent purchase price adjustments for acquisitions in
2016
,
2015
and
2014
are presented below:
|
2016
|
2015
|
2014
|
|||||||
|
Assets:
|
|||||||||
|
Accounts receivable
|
$
|
|
|
$
|
|
|
$
|
|
|
|
Inventories
|
|
|
|
|
|
|
|||
|
Other current assets
|
|
|
|
|
|
|
|||
|
Property, plant and equipment
|
|
|
|
|
|
|
|||
|
Goodwill
|
|
|
|
|
|
|
|||
|
Other intangible assets
|
|
|
|
|
|
|
|||
|
Other non-current assets
|
|
|
|
|
|
|
|||
|
Total assets acquired
|
$
|
|
|
$
|
|
|
$
|
|
|
|
Liabilities:
|
|||||||||
|
Accounts payable, trade
|
$
|
|
|
$
|
|
|
$
|
|
|
|
Salaries, wages and benefits
|
|
|
|
|
|
|
|||
|
Other current liabilities
|
|
|
|
|
|
|
|||
|
Long-term debt
|
|
|
|
|
|
|
|||
|
Accrued pension cost
|
|
|
|
|
|
|
|||
|
Accrued postretirement liability
|
|
|
|
|
|
|
|||
|
Deferred taxes
|
|
|
|
|
|
|
|||
|
Other non-current liabilities
|
|
|
|
|
|
|
|||
|
Total liabilities assumed
|
$
|
|
|
$
|
|
|
$
|
|
|
|
Net assets acquired
|
$
|
|
|
$
|
|
|
$
|
|
|
The amounts for
2016
in the table above represent the preliminary purchase price allocations for Lovejoy and EDT. The preliminary purchase accounting for 2016 acquisitions is incomplete as it is subject to working capital adjustments for the EDT acquisition and the final determination of the fair value of the contingent liabilities assumed in the Lovejoy acquisition.
|
Purchase
Price Allocation
|
||||
|
Weighted-
Average Life
|
||||
|
Trade name (not subject to amortization)
|
$
|
|
|
Indefinite
|
|
Trade name
|
|
|
|
|
|
Technology / Know-how
|
|
|
|
|
|
All customer relationships
|
|
|
|
|
|
Non-competition agreements
|
|
|
|
|
|
Favorable leases
|
|
|
|
|
|
Capitalized software
|
|
|
|
|
|
Total intangible assets
|
$
|
|
|
|
63
T
he following table summarizes the final purchase price allocation for identifiable intangible assets acquired in
2015
:
|
Purchase
Price Allocation
|
||||
|
Weighted-
Average Life
|
||||
|
Trade name
|
$
|
|
|
|
|
Technology / Know-how
|
|
|
|
|
|
All customer relationships
|
|
|
|
|
|
Non-compete agreements
|
|
|
|
|
|
Total intangible assets
|
$
|
|
|
|
Divestitures:
On
October 21, 2015
, the Company completed the sale of Alcor. Alcor, located in Mesa, Arizona, had sales of
$
20.6
million
for the twelve months ending September 30, 2015. The results of the operations of Alcor were reported in the Mobile Industries segment. The Company recorded proceeds of
$
43.4
million
and recognized a gain on the sale of Alcor of
$
29.0
million
during the fourth quarter of 2015. The gain was reflected in gain on divestitures in the Consolidated Statement of Income.
On April 30, 2015, the Company completed the sale of a service center in Niles, Ohio. The company received
$
2.8
million
in cash proceeds for the service center. The Company recognized a loss of
$
0.3
million
from the sale reflected in gain on divestitures in the Consolidated Statement of Income.
On March 6, 2014, Timken Lux Holdings II S.A.R.L, a subsidiary of the Company, entered into a joint venture agreement with Holme Services Limited ("joint venture partner"). During 2015, the Company and its joint venture partner established TUBC Limited, a Cyprus entity, for the purpose of producing bearings to serve the rail market sector in Russia. The Company and its joint venture partner have a
51
%
controlling interest and
49
%
controlling interest, respectively, in TUBC Limited. During
2015
, the Company and its joint venture partner amended and restated the joint venture agreement and contributed
$
6.9
million
and
$
6.6
million
, respectively, to TUBC Limited. During
2016
, the Company and its joint venture partner contributed
$
9.7
million
and
$
9.3
million
, respectively, to TUBC Limited.
64
|
2016
|
2015
|
2014
|
|||||||
|
Numerator:
|
|||||||||
|
Net income (loss) from continuing operations attributable to The Timken Company
|
$
|
|
|
$
|
(
|
)
|
$
|
|
|
|
Less: undistributed earnings allocated to nonvested stock
|
|
|
|
|
|
|
|||
|
Net income (loss) from continuing operations available to common shareholders for basic earnings per share and diluted earnings per
share |
$
|
|
|
$
|
(
|
)
|
$
|
|
|
|
Denominator:
|
|||||||||
|
Weighted-average number of shares outstanding – basic
|
|
|
|
|
|
|
|||
|
Effect of dilutive securities:
|
|||||||||
|
Stock options and awards - based on the treasury
stock method
|
|
|
|
|
|
|
|||
|
Weighted-average number of shares outstanding, assuming
dilution of stock options and awards |
|
|
|
|
|
|
|||
|
Basic earnings (loss) per share from continuing operations
|
$
|
|
|
$
|
(
|
)
|
$
|
|
|
|
Diluted earnings (loss) per share from continuing operations
|
$
|
|
|
$
|
(
|
)
|
$
|
|
|
65
|
Foreign currency
translation adjustments
|
Pension and postretirement
liability adjustments
|
Change in fair value of
derivative financial instruments
|
Total
|
|||||||||
|
Balance at December 31, 2015
|
$
|
(
|
)
|
$
|
(
|
)
|
$
|
|
|
$
|
(
|
)
|
|
Other comprehensive (loss) income before
reclassifications, before income tax
|
(
|
)
|
(
|
)
|
(
|
)
|
(
|
)
|
||||
|
Amounts reclassified from accumulated other
comprehensive income (loss), before income tax
|
|
|
|
|
|
|
|
|
||||
|
Income tax (benefit)
|
|
|
(
|
)
|
|
|
(
|
)
|
||||
|
Net current period other comprehensive (loss) income, net of income taxes
|
(
|
)
|
(
|
)
|
|
|
(
|
)
|
||||
|
Non-controlling interest
|
(
|
)
|
|
|
|
|
(
|
)
|
||||
|
Net current period comprehensive (loss) income, net of income taxes and non-controlling interest
|
(
|
)
|
(
|
)
|
|
|
(
|
)
|
||||
|
Balance at December 31, 2016
|
$
|
(
|
)
|
$
|
(
|
)
|
$
|
|
|
$
|
(
|
)
|
|
Foreign currency
translation adjustments
|
Pension and postretirement
liability adjustments
|
Change in fair value of
derivative financial instruments
|
Total
|
|||||||||
|
Balance at December 31, 2014
|
$
|
(
|
)
|
$
|
(
|
)
|
$
|
(
|
)
|
$
|
(
|
)
|
|
Other comprehensive (loss) income before
reclassifications, before income tax
|
(
|
)
|
(
|
)
|
|
|
(
|
)
|
||||
|
Amounts reclassified from accumulated other
comprehensive income (loss), before income tax
|
|
|
|
|
(
|
)
|
|
|
||||
|
Income tax (benefit) expense
|
|
|
(
|
)
|
(
|
)
|
(
|
)
|
||||
|
Net current period other comprehensive (loss) income, net of income taxes
|
(
|
)
|
|
|
|
|
|
|
||||
|
Non-controlling interest
|
|
|
|
|
|
|
|
|
||||
|
Net current period comprehensive (loss) income, net of income taxes and non-controlling interest
|
(
|
)
|
|
|
|
|
|
|
||||
|
Balance at December 31, 2015
|
$
|
(
|
)
|
$
|
(
|
)
|
$
|
|
|
$
|
(
|
)
|
Other comprehensive (loss) income before reclassifications and income taxes includes the effect of foreign currency.
Of the
$
47.2
million
before-tax reclassification of pension and postretirement liability adjustments,
$
26.6
million
was included in pension settlement charges in the Consolidated Statement of Income for the year ended
December 31, 2016
. The remaining before-tax reclassification of pension and postretirement liability adjustments of
$
20.6
million
in
2016
was due to the amortization of actuarial losses and prior service costs and was included in costs of products sold and selling, general and administrative expenses in the Consolidated Statements of Income. The reclassification of the remaining components of accumulated other comprehensive income (loss) was included in other expense, net in the Consolidated Statements of Income.
66
|
2016
|
2015
|
|||||
|
Manufacturing supplies
|
$
|
|
|
$
|
|
|
|
Raw materials
|
|
|
|
|
||
|
Work in process
|
|
|
|
|
||
|
Finished products
|
|
|
|
|
||
|
Subtotal
|
$
|
|
|
$
|
|
|
|
Allowance for surplus and obsolete inventory
|
(
|
)
|
(
|
)
|
||
|
Total Inventories, net
|
$
|
|
|
$
|
|
|
|
2016
|
2015
|
|||||
|
Land and buildings
|
$
|
|
|
$
|
|
|
|
Machinery and equipment
|
|
|
|
|
||
|
Subtotal
|
$
|
|
|
$
|
|
|
|
Less allowances for depreciation
|
(
|
)
|
(
|
)
|
||
|
Property, Plant and Equipment, net
|
$
|
|
|
$
|
|
|
Total depreciation expense was
$
95.5
million
,
$
94.6
million
and
$
115.5
million
in
2016
,
2015
and
2014
, respectively.
During the fourth quarter of 2015, the Company wrote-off
$
9.7
million
that remained in CIP after the related assets were placed into service. This item was identified during an examination of aged balances in the CIP account and
91
%
of the amount related to fiscal years prior to 2013. Net loss attributable to The Timken Company in 2015 included a charge of
$
9.7
million
(
$
6.1
million
, or
$
0.07
per share, after-tax) due to the correction of this error. Management of the Company concluded that the correction of this error in the fourth quarter of 2015 and the presence of this error in prior periods was immaterial to all periods presented.
During the first quarter of 2014, the Company recognized a gain of
$
22.6
million
related to the sale of its former manufacturing facility in Sao Paulo.
67
Goodwill:
The Company tests goodwill and indefinite-lived intangible assets for impairment at least annually. The Company performs its annual impairment test as of October 1 after the annual forecasting process is completed. Furthermore, goodwill and indefinite-lived intangible assets are reviewed for impairment whenever events or changes in circumstances indicate that the carrying value may not be recoverable.
The Company reviews goodwill for impairment at the reporting unit level. The Mobile Industries segment has
three
reporting units and the Process Industries segment has
two
reporting units.
Year ended
December 31, 2016
:
|
Mobile Industries
|
Process
Industries
|
Total
|
|||||||
|
Beginning Balance
|
$
|
|
|
$
|
|
|
$
|
|
|
|
Acquisitions
|
|
|
|
|
|
|
|||
|
Other
|
(
|
)
|
|
|
(
|
)
|
|||
|
Ending Balance
|
$
|
|
|
$
|
|
|
$
|
|
|
The increase in goodwill was due to the acquisition of Lovejoy in July 2016 and EDT in October 2016. None of this goodwill is deductible for tax purposes.
|
Mobile Industries
|
Process
Industries
|
Total
|
|||||||
|
Beginning Balance
|
$
|
|
|
$
|
|
|
$
|
|
|
|
Acquisitions
|
|
|
|
|
|
|
|||
|
Other
|
(
|
)
|
(
|
)
|
(
|
)
|
|||
|
Ending Balance
|
$
|
|
|
$
|
|
|
$
|
|
|
Acquisitions in 2015 related to the purchase of Timken Belts completed on September 1, 2015.
$
59.7
million
of the goodwill acquired for Timken Belts is tax-deductible and will be recognized over
15
years
for tax purposes. The remaining
$
11.1
million
is non-deductible for tax purposes.
“Other” primarily includes foreign currency translation adjustments. Refer to
Note 3 - Acquisitions and Divestitures
for additional information on the acquisitions listed above.
In
2016
and
2015
, no goodwill impairment losses were recorded.
During the third quarter of 2014, the Company reviewed goodwill for impairment for two of its reporting units within the Company's former Aerospace segment (now included in the Mobile Industries segment) as a result of declining sales forecasts and financial performance within the segment. The Company utilizes both an income approach and a market approach in testing goodwill for impairment. The Company utilized updated forecasts for the income approach as part of the goodwill impairment review. As a result of the lower earnings and cash flow forecasts, the Company determined that the Aerospace Transmissions and the Aerospace Aftermarket reporting units could not support the carrying value of their goodwill. As a result, the Company recorded a pretax impairment loss of
$
86.3
million
during the third quarter of 2014, which was reported in impairment and restructuring charges in the Consolidated Statement of Income.
68
Intangible Assets:
|
|
2016
|
2015
|
||||||||||||||||
|
Gross
Carrying
Amount
|
Accumulated
Amortization
|
Net
Carrying
Amount
|
Gross
Carrying
Amount
|
Accumulated
Amortization
|
Net
Carrying
Amount
|
|||||||||||||
|
Intangible assets subject
to amortization: |
||||||||||||||||||
|
Customer relationships
|
$
|
|
|
$
|
|
|
$
|
|
|
$
|
|
|
$
|
|
|
$
|
|
|
|
Know-how
|
|
|
|
|
|
|
|
|
|
|
|
|
||||||
|
Industrial license agreements
|
|
|
|
|
|
|
|
|
|
|
|
|
||||||
|
Land-use rights
|
|
|
|
|
|
|
|
|
|
|
|
|
||||||
|
Patents
|
|
|
|
|
|
|
|
|
|
|
|
|
||||||
|
Technology use
|
|
|
|
|
|
|
|
|
|
|
|
|
||||||
|
Trademarks
|
|
|
|
|
|
|
|
|
|
|
|
|
||||||
|
Non-compete agreements
|
|
|
|
|
|
|
|
|
|
|
|
|
||||||
|
Leases
|
|
|
|
|
|
|
|
|
|
|
|
|
||||||
|
Software
|
|
|
|
|
|
|
|
|
|
|
|
|
||||||
|
|
$
|
|
|
$
|
|
|
$
|
|
|
$
|
|
|
$
|
|
|
$
|
|
|
|
Intangible assets not
subject to amortization: |
||||||||||||||||||
|
Tradename
|
$
|
|
|
$
|
|
|
$
|
|
|
$
|
|
|
$
|
|
|
$
|
|
|
|
FAA air agency
certificates |
|
|
|
|
|
|
|
|
|
|
|
|
||||||
|
|
$
|
|
|
|
$
|
|
|
$
|
|
|
|
$
|
|
|
||||
|
Total intangible assets
|
$
|
|
|
$
|
|
|
$
|
|
|
$
|
|
|
$
|
|
|
$
|
|
|
Intangible assets acquired in 2016 totaled
$
27.9
million
from the acquisitions of Lovejoy and EDT. Intangible assets subject to amortization acquired in 2016 were assigned useful lives of
two
to
20
years and had a weighted-average amortization period of
19.1
years
.
69
|
2016
|
2015
|
|||||
|
Variable-rate Accounts Receivable Facility with an interest rate of
1.05%
at December 31, 2015.
|
$
|
|
|
$
|
|
|
|
Borrowings under variable-rate lines of credit for certain of the Company’s foreign subsidiaries with various banks with interest rates of 0.50% at December 31, 2016 and 0.31% to 0.44% at December 31, 2015, respectively.
|
|
|
|
|
||
|
Short-term debt
|
$
|
|
|
$
|
|
|
The Company has a
$
100
million
Accounts Receivable Facility that matures on
November 30, 2018
. Under the terms of the Accounts Receivable Facility, the Company sells, on an ongoing basis, certain domestic trade receivables to Timken Receivables Corporation, a wholly-owned consolidated subsidiary that in turn uses the trade receivables to secure borrowings which are funded through a vehicle that issues commercial paper in the short-term market. Borrowings under the Accounts Receivable Facility are limited to certain borrowing base calculations. Certain borrowing base limitations reduced the availability of the Accounts Receivable Facility to
$
67.2
million
at
December 31, 2016
. As of
December 31, 2016
, there were outstanding borrowings of
$
48.9
million
under the Accounts Receivable Facility included in long-term debt, which reduced the availability under this facility to
$
18.3
million
. As of December 31, 2015, there were
$
49.0
million
outstanding borrowings under the Accounts Receivable Facility included in short-term debt. The cost of this facility, which is the commercial paper rate plus program fees, is considered a financing cost and is included in interest expense in the Consolidated Statements of Income. The yield rate was
1.65
%
,
1.05
%
and
0.20
%
, at
December 31, 2016
,
2015
and
2014
, respectively.
The lines of credit for certain of the Company’s foreign subsidiaries provide for borrowings up to $
202.7
million
. Most of these lines of credit are uncommitted. At
December 31, 2016
, the Company’s foreign subsidiaries had borrowings outstanding of
$
19.2
million
and guarantees of
$
1.9
million
, which reduced the availability under these facilities to
$
181.6
million
.
The weighted-average interest rate on short-term debt during the year was
0.7
%
,
1.1
%
and
3.1
%
in
2016
,
2015
and
2014
, respectively. The weighted-average interest rate on short-term debt outstanding at
December 31, 2016
and
2015
was
0.50
%
and
0.90
%
, respectively. The decrease in the weighted-average interest rate was primarily due to increased borrowings in the U.S. at a lower rate.
|
Long-term debt for the years ended December 31 was as follows:
|
||||||
|
2016
|
2015
|
|||||
|
Fixed-rate Medium-Term Notes, Series A, maturing at various dates through
May 2028, with interest rates ranging from 6.74% to 7.76% |
$
|
|
|
$
|
|
|
|
Fixed-rate Senior Unsecured Notes, maturing on September 1, 2024, with an
interest rate of 3.875% |
|
|
|
|
||
|
Variable-rate Senior Credit Facility with a weighted-average interest rate
of 1.50% at December 31, 2016 and 1.45% at December 31, 2015, respectively. |
|
|
|
|
||
|
Variable-rate Accounts Receivable Facility with an interest rate of
1.65%
at
December 31, 2016 |
|
|
|
|
||
|
Other
|
|
|
|
|
||
|
Total debt
|
$
|
|
|
$
|
|
|
|
Less current maturities
|
|
|
|
|
||
|
Long-term debt
|
$
|
|
|
$
|
|
|
The Company has a
$
500
million
Senior Credit Facility, which matures on
June 19, 2020
. At
December 31, 2016
, the Company had $
83.8
million
of outstanding borrowings under the Senior Credit Facility, which reduced the availability under this facility to
$
416.2
million
. Under the Senior Credit Facility, the Company has
two
financial covenants: a consolidated leverage ratio and a consolidated interest coverage ratio. At
December 31, 2016
, the Company was in full compliance with the covenants under the Senior Credit Facility.
70
On August 20, 2014, the Company issued the 2024 Notes. The Company used the net proceeds from the issuance of the 2024 Notes to repay the Company's 2014 Notes and for general corporate purposes.
|
Year
|
|||
|
2017
|
$
|
|
|
|
2018
|
|
|
|
|
2019
|
|
|
|
|
2020
|
|
|
|
|
2021
|
|
|
|
|
Thereafter
|
|
|
|
Interest paid was
$
30.1
million
in
2016
,
$
32.1
million
in
2015
and
$
34.4
million
in
2014
. This differs from interest expense due to the timing of payments and interest capitalized of
$
1.1
million
in
2016
,
zero
in
2015
and
$
1.6
million
in
2014
.
The Company and its subsidiaries lease a variety of real property and equipment. Rent expense under operating leases amounted to
$
30.0
million
,
$
33.5
million
and
$
33.0
million
in
2016
,
2015
and
2014
, respectively.
|
Year
|
|||
|
2017
|
$
|
|
|
|
2018
|
|
|
|
|
2019
|
|
|
|
|
2020
|
|
|
|
|
2021
|
|
|
|
|
Thereafter
|
|
|
|
71
The Company and certain of its subsidiaries have been identified as potentially responsible parties for investigation and remediation under the Superfund or similar state laws with respect to certain sites. Claims for investigation and remediation have been asserted against numerous other entities, which are believed to be financially solvent and are expected to fulfill their proportionate share of the obligation.
On December 28, 2004, the United States Environmental Protection Agency (“USEPA”) sent Lovejoy a Special Notice Letter that identified Lovejoy as a potentially responsible party, together with at least fourteen other companies, at the Ellsworth Industrial Park Site, Downers Grove, DuPage County, Illinois (the “Site”). Lovejoy’s Downers Grove property is situated within the Ellsworth Industrial Complex. The USEPA and the Illinois Environmental Protection Agency (“IEPA”) allege there have been one or more releases or threatened releases of hazardous substances, allegedly including, but not limited to, a release or threatened release on or from Lovejoy's property, at the Site. The relief sought by the USEPA and IEPA includes further investigation and potential remediation of the Site and reimbursement of response costs. Lovejoy’s allocated share of past and future costs related to the Site, including for investigation and/or remediation, could be significant. All previously pending property damage and personal injury lawsuits against Lovejoy related to the Site have been settled or dismissed. In connection with the acquisition of Lovejoy discussed in
Note 3 - Acquisitions and Divestitures
, the Company recorded an accrual for potential environmental remediation.
The Company had total accruals of
$
5.6
million
and $
1.2
million
for various known environmental matters that are probable and reasonably estimable as of
December 31, 2016
and
2015
, respectively. These accruals were recorded based upon the best estimate of costs to be incurred in light of the progress made in determining the magnitude of remediation costs, the timing and extent of remedial actions required by governmental authorities and the amount of the Company’s liability in proportion to other responsible parties. Of the
2016
and
2015
accruals,
$
0.6
million
and $
0.3
million
, respectively, was included in the rollforward of the restructuring accrual as of
December 31, 2016
, discussed further in
Note 12 - Impairment and Restructuring Charges
.
In addition, the Company is subject to various lawsuits, claims and proceedings, which arise in the ordinary course of its business. The Company accrues costs associated with legal and non-income tax matters when they become probable and reasonably estimable. Accruals are established based on the estimated undiscounted cash flows to settle the obligations and are not reduced by any potential recoveries from insurance or other indemnification claims. Management believes that any ultimate liability with respect to these actions, in excess of amounts provided, will not materially affect the Company’s Consolidated Financial Statements.
In October 2014, the Brazilian government antitrust agency announced that it had opened an investigation of alleged antitrust violations in the bearing industry. The Company’s Brazilian subsidiary, Timken do Brasil Comercial Importadora Ltda, was included in the investigation. While the Company is unable to predict the ultimate length, scope or results of the investigation, management believes that the outcome will not have a material effect on the Company’s consolidated financial position; however, any such outcome may be material to the results of operations of any particular period in which costs, if any, are recognized. Based on current facts and circumstances, the low end of the range for potential penalties, if any, would be immaterial to the Company.
Product Warranties:
|
2016
|
2015
|
|||||
|
Beginning balance, January 1
|
$
|
|
|
$
|
|
|
|
Expense
|
|
|
|
|
||
|
Payments
|
(
|
)
|
(
|
)
|
||
|
Ending balance, December 31
|
$
|
|
|
$
|
|
|
The product warranty liability for
2016
and
2015
was included in other current liabilities on the Consolidated Balance Sheets.
72
Year ended
December 31, 2016
:
|
Mobile
Industries
|
Process
Industries
|
Corporate
|
Total
|
|||||||||
|
Impairment charges
|
$
|
|
|
$
|
|
|
$
|
|
|
$
|
|
|
|
Severance expense and related benefit costs
|
|
|
|
|
|
|
|
|
||||
|
Exit costs
|
|
|
|
|
|
|
|
|
||||
|
Total
|
$
|
|
|
$
|
|
|
$
|
|
|
$
|
|
|
Year ended
December 31, 2015
:
|
Mobile
Industries
|
Process
Industries
|
Corporate
|
Total
|
|||||||||
|
Impairment charges
|
$
|
|
|
$
|
|
|
$
|
|
|
$
|
|
|
|
Severance expense and related benefit costs
|
|
|
|
|
|
|
|
|
||||
|
Exit costs
|
|
|
|
|
|
|
|
|
||||
|
Total
|
$
|
|
|
$
|
|
|
$
|
|
|
$
|
|
|
Year ended
December 31, 2014
:`
|
Mobile
Industries
|
Process
Industries
|
Corporate
|
Total
|
|||||||||
|
Impairment charges
|
$
|
|
|
$
|
|
|
$
|
|
|
$
|
|
|
|
Severance expense and related benefit costs
|
|
|
|
|
|
|
|
|
||||
|
Exit costs
|
|
|
|
|
|
|
|
|
||||
|
Total
|
$
|
|
|
$
|
|
|
$
|
|
|
$
|
|
|
The following discussion explains the major impairment and restructuring charges recorded for the periods presented; however, it is not intended to reflect a comprehensive discussion of all amounts in the tables above.
Mobile Industries:
On September 29, 2016, the Company announced the closure of the Pulaski bearing plant, which is expected to close in approximately one year from the announcement date and to affect approximately
120
employees. During
2016
, the Company recorded severance and related benefit costs of
$
2.5
million
related to this closure.
In August 2016, the Company completed the consultation process to close the Benoni manufacturing operations affecting approximately
85
employees. During
2016
, the Company recorded impairment charges of
$
0.5
million
and severance and related benefit costs of
$
1.1
million
related to this closure. Benoni will continue to recondition bearings and assemble rail bearings.
On March 17, 2016, the Company announced the closure of the Altavista bearing plant. The plant is expected to close approximately one year from the announcement date, with production transferring to the Company's bearing plant near Lincolnton, North Carolina. During
2016
, the Company recorded impairment charges of
$
3.1
million
and severance and related benefit costs of
$
1.9
million
related to this closure.
73
On September 8, 2014, the Company announced plans to restructure its former Aerospace segment. In connection with the restructuring, the Company: (1) eliminated leadership positions and integrated substantially all aerospace activities into Mobile Industries under the direction of Christopher A. Coughlin, Executive Vice President and Group President; (2) sold the assets of its aerospace engine overhaul business, located in Mesa, Arizona, during the fourth quarter of 2014; (3) evaluated strategic alternatives for its aerospace MRO parts business, also located in Mesa; and (4) announced plans to close its aerospace bearing facility located in Wolverhampton, U.K. by early 2016, rationalizing the capacity into existing facilities. In conjunction with this announcement, the Company reviewed goodwill for impairment for its three reporting units within the Aerospace segment as a result of declining sales forecasts and financial performance within the segment. As a result of that review, the Company recorded a pretax goodwill impairment charge of
$
86.3
million
during the third quarter of 2014 related to its Aerospace Transmissions and Aerospace Aftermarket reporting units. In addition, the Company recorded an intangible asset impairment charge of
$
9.9
million
, an impairment charge of
$
1.2
million
for its engine overhaul business, which it classified as assets held for sale and severance and related benefits of
$
0.3
million
. During the fourth quarter of 2014, the Company recorded severance and related benefits of
$
3.7
million
related to the planned closure of Wolverhampton. In 2016, the Company recorded exit costs of
$
0.9
million
related to the closure of Wolverhampton. See
Note 18 - Fair Value
for additional information on the impairment charges for the former Aerospace segment.
In addition to the above charges, during 2015 and 2014, the Company recorded severance and related benefit costs of
$
1.2
million
and
$
2.9
million
related to the rationalization of its facility in Colmar, France.
Process Industries
During
2015
, the Company recorded impairment charges of
$
3.0
million
related to a repair business in Niles, Ohio. See
Note 18 - Fair Value
for additional information on the impairment charges for the repair business. In addition, the Company recorded
$
2.9
million
of exit costs related to the Company's termination of its relationship with one of its third-party sales representatives in Colombia.
Workforce Reductions:
In
2016
, the Company recognized
$
9.4
million
of severance and related benefits to eliminate approximately
175
positions to improve efficiency and reduce costs. Of the
$
9.4
million
charge for
2016
,
$
3.8
million
related to the Mobile Industries segment and
$
5.6
million
related to the Process Industries segment. During
2015
, the Company recognized
$
6.5
million
of severance and related benefit costs to eliminate approximately
100
positions. Of the
$
6.5
million
charge for
2015
,
$
3.4
million
related to the Mobile Industries segment,
$
2.5
million
related to the Process Industries segment and
$
0.6
million
related to Corporate positions.
Consolidated Restructuring Accrual:
|
2016
|
2015
|
|||||
|
Beginning balance, January 1
|
$
|
|
|
$
|
|
|
|
Expense
|
|
|
|
|
||
|
Payments
|
(
|
)
|
(
|
)
|
||
|
Ending balance, December 31
|
$
|
|
|
$
|
|
|
74
Under the Company’s long-term incentive plan, the Company’s common shares have been made available for grant, at the discretion of the Compensation Committee of the Board of Directors, to officers and key employees in the form of stock option awards. Stock option awards typically have a
ten-year
term and generally vest in
25
%
increments annually beginning on the first anniversary of the date of grant. In addition to stock option awards, the Company has granted restricted shares, deferred shares, performance-based restricted stock units and time-vested restricted stock units under the long-term incentive plan.
During
2016
,
2015
and
2014
, the Company recognized stock-based compensation expense of
$
5.9
million
(
$
3.7
million
after tax or
$
0.05
per diluted share),
$
6.6
million
(
$
4.1
million
after tax or
$
0.05
per diluted share) and
$
13.7
million
(
$
8.5
million
after tax or
$
0.09
per diluted share), respectively, for stock option awards.
|
2016
|
2015
|
2014
|
|||||||
|
Weighted-average fair value per option (Pre-Spinoff for 2014)
|
$
|
|
|
$
|
|
|
$
|
|
|
|
Risk-free interest rate
|
|
%
|
|
%
|
|
%
|
|||
|
Dividend yield
|
|
%
|
|
%
|
|
%
|
|||
|
Expected stock volatility
|
|
%
|
|
%
|
|
%
|
|||
|
Expected life - years
|
|
|
|
|
|
|
|||
Historical information was the primary basis for the selection of the expected dividend yield, expected volatility and the expected lives of the options. The dividend yield was calculated based upon the last dividend prior to the grant compared to the trailing 12 months' daily stock prices. The risk-free interest rate was based upon yields of U.S. zero coupon issues with a term equal to the expected life of the option being valued. Forfeitures were estimated at
2.3
%
.
|
Number of
Shares
|
Weighted-average
Exercise Price |
Weighted-average
Remaining Contractual Term |
Aggregate Intrinsic Value
(millions)
|
||||||
|
Outstanding - beginning of year
|
|
|
$
|
|
|
||||
|
Granted - new awards
|
|
|
|
|
|||||
|
Exercised
|
(
|
)
|
|
|
|||||
|
Canceled or expired
|
(
|
)
|
|
|
|||||
|
Outstanding - end of year
|
|
|
$
|
|
|
|
$
|
|
|
|
Options expected to vest
|
|
|
$
|
|
|
|
$
|
|
|
|
Options exercisable
|
|
|
$
|
|
|
|
$
|
|
|
The total intrinsic value of stock option awards exercised during the years ended
December 31, 2016
,
2015
and
2014
was
$
1.7
million
,
$
5.6
million
and
$
21.5
million
, respectively. Net cash proceeds from the exercise of stock option awards were
$
4.3
million
,
$
4.1
million
and
$
16.8
million
, respectively. Income taxes were a shortfall of
$
0.3
million
for the year ended
December 31, 2016
. Income tax benefits were
$
1.3
million
and
$
5.9
million
for the years ended
December 31, 2015
and
2014
, respectively.
In
2016
, the Company issued
368,815
performance-based restricted stock units and
265,930
time-based restricted stock units to officers and key employees. The performance-based restricted stock units are calculated and awarded based on the achievement of specified performance objectives and vest
three years
from the date of grant. The performance-based restricted stock units settle in either cash or shares, with
10,880
shares expected to settle in cash and
357,935
expected to settle in common shares. Time-vesting restricted stock units vest in
25
%
increments annually beginning on the first anniversary of the grant or vest
five years
from the date of grant. Time-based restricted stock units also settle in either cash or shares, with
10,700
time-based restricted stock units expected to settle in cash and
255,230
time-based restricted stock units expected to settle in common shares. For time-based restricted stock units that are expected to settle in cash, the Company had
$
1.2
million
and
$
6.1
million
, accrued in salaries, wages and benefits as of
December 31, 2016
and
2015
, respectively, on the Consolidated Balance Sheets.
75
|
Number of Shares
|
Weighted-average
Grant Date Fair Value |
||||
|
Outstanding - beginning of year
|
|
|
$
|
|
|
|
Granted - new awards
|
|
|
|
|
|
|
Vested
|
(
|
)
|
|
|
|
|
Canceled or expired
|
(
|
)
|
|
|
|
|
Outstanding - end of year
|
|
|
$
|
|
|
As of
December 31, 2016
, a total of
1,349,175
stock awards have been awarded that have not yet vested. The Company distributed
188,383
,
103,953
and
171,135
shares in
2016
,
2015
and
2014
, respectively, due to the vesting of stock awards. The shares awarded in
2016
,
2015
and
2014
totaled
613,165
,
485,975
and
520,912
, respectively. The Company recognized compensation expense of
$
8.2
million
,
$
11.8
million
and
$
10.1
million
, for the years ended
December 31, 2016
,
2015
and
2014
, respectively, relating to restricted share activity.
76
The Company and its subsidiaries sponsor a number of defined benefit pension plans, which cover eligible employees, including certain employees in foreign countries. These plans are generally noncontributory. Pension benefits earned are generally based on years of service and compensation during active employment. The cash contributions for the Company’s defined benefit pension plans were
$
15.0
million
,
$
10.8
million
and
$
21.1
million
in
2016
,
2015
and
2014
, respectively.
|
U.S. Plans
|
International Plans
|
|||||||||||||||||
|
|
2016
|
2015
|
2014
|
2016
|
2015
|
2014
|
||||||||||||
|
Components of net periodic benefit cost:
|
||||||||||||||||||
|
Service cost
|
$
|
|
|
$
|
|
|
$
|
|
|
$
|
|
|
$
|
|
|
$
|
|
|
|
Interest cost
|
|
|
|
|
|
|
|
|
|
|
|
|
||||||
|
Expected return on plan assets
|
(
|
)
|
(
|
)
|
(
|
)
|
(
|
)
|
(
|
)
|
(
|
)
|
||||||
|
Amortization of prior service cost
|
|
|
|
|
|
|
|
|
|
|
|
|
||||||
|
Amortization of net actuarial loss
|
|
|
|
|
|
|
|
|
|
|
|
|
||||||
|
Curtailment
|
|
|
|
|
|
|
(
|
)
|
|
|
|
|
||||||
|
Settlement
|
|
|
|
|
|
|
|
|
|
|
|
|
||||||
|
Special termination benefits
|
|
|
|
|
|
|
|
|
|
|
|
|
||||||
|
Less: Discontinued operations
|
|
|
|
|
(
|
)
|
|
|
|
|
|
|
||||||
|
Net periodic benefit cost
|
$
|
|
|
$
|
|
|
$
|
|
|
$
|
|
|
$
|
|
|
$
|
|
|
|
Assumptions
|
2016
|
2015
|
2014
|
||
|
U.S. Plans:
|
|||||
|
Discount rate
|
4.50% to 4.70%
|
3.98% to 4.64%
|
|
4.68% / 5.02%
|
|
|
Future compensation assumption
|
2.50% to 3.00%
|
2.00% to 3.00%
|
|
2.00% to 3.00%
|
|
|
Expected long-term return on plan assets
|
5.75% to 6.75%
|
|
%
|
|
%
|
|
International Plans:
|
|||||
|
Discount rate
|
2.00% to 8.50%
|
1.50% to 8.75%
|
|
3.25% to 9.75%
|
|
|
Future compensation assumption
|
2.20% to 8.00%
|
2.20% to 8.00%
|
|
2.30% to 8.00%
|
|
|
Expected long-term return on plan assets
|
0.82% to 9.25%
|
2.25% to 9.25%
|
|
3.00% to 8.50%
|
|
In
2016
, the Company incurred pension settlement charges of
$
28.1
million
, including professional fees of
$
1.5
million
, primarily to settle approximately
$
70
million
of the Company's pension obligations. On September 8, 2016, the Retirement Plan for the Hourly-Rated Employees of Timken Canada LP (the "Canadian Plan") purchased a group annuity contract from Canada Life to pay and administer future pension benefits for
135
Canadian Timken retirees. The Plan was associated with former employees of the St. Thomas, Ontario manufacturing facility, which closed on March 31, 2013. The Company transferred approximately
$
15
million
of the Company's pension obligations and
$
15
million
of pension assets to Canada Life in this transaction. In addition to the purchase of the group annuity contract, the Company made lump-sum distributions of approximately
$
55
million
to new retirees and deferred vested participants in two of the Company's U.S. defined benefit pension plans and the Canadian Plan.
77
In 2015, the Company entered into two agreements pursuant to which two of the Company's U.S. defined benefit pension plans purchased group annuity contracts from Prudential. The two group annuity contracts require Prudential to pay and administer future pension benefits for approximately
8,400
U.S. Timken retirees in the aggregate. The Company transferred a total of approximately
$
1.1
billion
of its pension obligations and a total of approximately
$
1.2
billion
of pension assets to Prudential in these transactions. In addition to the purchase of the group annuity contracts, the Company made lump-sum distributions of
$
37.2
million
to new retirees in the U.S. The Company also entered into an agreement pursuant to which one of the Company's Canadian defined benefit pension plans purchased a group annuity contract from Canada Life. The group annuity contract requires Canada Life to pay and administer future pension benefits for approximately
40
Canadian retirees. As a result of the group annuity contracts, lump-sum distributions, as well as pension settlement and curtailment charges related to the Company's Canadian pension plans, the Company incurred total pension settlement and curtailment charges of
$
465.0
million
, including professional fees of
$
2.6
million
, in 2015.
In 2014, the Company incurred pension settlement charges of
$
33.7
million
, including professional fees, primarily to settle approximately
$
110
million
of the Company's pension obligations related to one of its defined benefit pension plans in the U.S. as a result of the lump sum distributions for 2014 retirements and certain deferred vested plan participants.
For expense purposes in
2016
, the Company applied a weighted-average discount rate of
4.69
%
to its US defined benefit pension plans. For expense purposes in 2017, the Company will apply a weighted-average discount rate of
4.34
%
to its U.S. defined benefit pension plans.
For expense purposes in
2016
, the Company applied a weighted-average expected rate of return of
5.78
%
for the Company’s U.S. pension plan assets. For expense purposes in
2017
, the Company will apply a weighted-average expected rate of return on plan assets of
5.78
%
.
|
U.S. Plans
|
International Plans
|
|||||||||||
|
|
2016
|
2015
|
2016
|
2015
|
||||||||
|
Change in benefit obligation:
|
||||||||||||
|
Benefit obligation at beginning of year
|
$
|
|
|
$
|
|
|
$
|
|
|
$
|
|
|
|
Service cost
|
|
|
|
|
|
|
|
|
||||
|
Interest cost
|
|
|
|
|
|
|
|
|
||||
|
Actuarial losses (gains)
|
|
|
|
|
|
|
(
|
)
|
||||
|
International plan exchange rate change
|
|
|
|
|
(
|
)
|
(
|
)
|
||||
|
Curtailment
|
|
|
|
|
(
|
)
|
|
|
||||
|
Benefits paid
|
(
|
)
|
(
|
)
|
(
|
)
|
(
|
)
|
||||
|
Special termination benefits
|
|
|
|
|
|
|
|
|
||||
|
Settlements
|
|
|
(
|
)
|
|
|
(
|
)
|
||||
|
Acquisitions
|
|
|
|
|
|
|
|
|
||||
|
Benefit obligation at end of year
|
$
|
|
|
$
|
|
|
$
|
|
|
$
|
|
|
78
|
U.S. Plans
|
International Plans
|
|||||||||||
|
2016
|
2015
|
2016
|
2015
|
|||||||||
|
Change in plan assets:
|
||||||||||||
|
Fair value of plan assets at beginning of year
|
$
|
|
|
$
|
|
|
$
|
|
|
$
|
|
|
|
Actual return on plan assets
|
|
|
|
|
|
|
|
|
||||
|
Company contributions / payments
|
|
|
|
|
|
|
|
|
||||
|
International plan exchange rate change
|
|
|
|
|
(
|
)
|
(
|
)
|
||||
|
Acquisitions
|
|
|
|
|
|
|
|
|
||||
|
Settlements
|
|
|
(
|
)
|
|
|
(
|
)
|
||||
|
Benefits paid
|
(
|
)
|
(
|
)
|
(
|
)
|
(
|
)
|
||||
|
Fair value of plan assets at end of year
|
|
|
|
|
|
|
|
|
||||
|
Funded status at end of year
|
$
|
(
|
)
|
$
|
(
|
)
|
$
|
(
|
)
|
$
|
(
|
)
|
|
Amounts recognized on the Consolidated Balance Sheets:
|
||||||||||||
|
Non-current assets
|
$
|
|
|
$
|
|
|
$
|
|
|
$
|
|
|
|
Current liabilities
|
(
|
)
|
(
|
)
|
(
|
)
|
(
|
)
|
||||
|
Non-current liabilities
|
(
|
)
|
(
|
)
|
(
|
)
|
(
|
)
|
||||
|
$
|
(
|
)
|
$
|
(
|
)
|
$
|
(
|
)
|
$
|
(
|
)
|
|
|
Amounts recognized in accumulated other comprehensive loss:
|
||||||||||||
|
Net actuarial loss
|
$
|
|
|
$
|
|
|
$
|
|
|
$
|
|
|
|
Net prior service cost
|
|
|
|
|
|
|
|
|
||||
|
Accumulated other comprehensive loss
|
$
|
|
|
$
|
|
|
$
|
|
|
$
|
|
|
|
Changes in plan assets and benefit obligations recognized in accumulated other comprehensive loss (AOCL):
|
||||||||||||
|
AOCL at beginning of year
|
$
|
|
|
$
|
|
|
$
|
|
|
$
|
|
|
|
Net actuarial loss (gain)
|
|
|
|
|
|
|
(
|
)
|
||||
|
Recognized net actuarial loss
|
(
|
)
|
(
|
)
|
(
|
)
|
(
|
)
|
||||
|
Recognized prior service cost
|
(
|
)
|
(
|
)
|
(
|
)
|
(
|
)
|
||||
|
Loss recognized due to curtailment
|
|
|
|
|
|
|
(
|
)
|
||||
|
Loss recognized due to settlement
|
(
|
)
|
(
|
)
|
(
|
)
|
(
|
)
|
||||
|
Foreign currency impact
|
|
|
|
|
(
|
)
|
(
|
)
|
||||
|
Total recognized in accumulated other comprehensive loss at December 31
|
$
|
|
|
$
|
|
|
$
|
|
|
$
|
|
|
The presentation in the above tables for amounts recognized in accumulated other comprehensive loss on the Consolidated Balance Sheets is before the effect of income taxes.
|
Assumptions
|
2016
|
2015
|
|
U.S. Plans:
|
||
|
Discount rate
|
4.34% to 4.50%
|
4.50% to 4.70%
|
|
Future compensation assumption
|
2.00% to 3.00%
|
2.00% to 3.00%
|
|
International Plans:
|
||
|
Discount rate
|
1.25% to 9.00%
|
1.50% to 8.75%
|
|
Future compensation assumption
|
2.00% to 8.00%
|
2.20% to 8.00%
|
79
Defined benefit pension plans in the United States represent
66
%
of the benefit obligation and
66
%
of the fair value of plan assets as of
December 31, 2016
.
Certain of the Company’s defined benefit pension plans were overfunded as of
December 31, 2016
. As a result,
$
32.1
million
and
$
86.3
million
at
December 31, 2016
and
2015
, respectively, are included in non-current pension assets on the Consolidated Balance Sheets. The current portion of accrued pension cost, which was included in salaries, wages and benefits on the Consolidated Balance Sheets, was
$
5.7
million
and
$
9.1
million
at
December 31, 2016
and
2015
, respectively. In
2016
, the current portion of accrued pension cost relates to unfunded plans and represents the actuarial present value of expected payments related to the plans to be made over the next 12 months.
The accumulated benefit obligation at
December 31, 2016
exceeded the market value of plan assets for several of the Company’s pension plans. For these plans, the projected benefit obligation was
$
194.2
million
, the accumulated benefit obligation was
$
182.5
million
and the fair value of plan assets was
$
34.7
million
at
December 31, 2016
.
The total pension accumulated benefit obligation for all plans was
$
888.0
million
and
$
890.3
million
at
December 31, 2016
and
2015
, respectively.
Investment performance increased the value of the Company’s pension assets by
8.5
%
in 2016.
As of
December 31, 2016
and
2015
, the Company’s defined benefit pension plans did not directly hold any of the Company’s common shares.
Under current accounting policies, the estimated net actuarial loss and prior service cost for the defined benefit pension plans that will be amortized from accumulated other comprehensive loss into net periodic benefit cost over the next fiscal year are
$
19.2
million
and
$
1.4
million
, respectively. Refer to
Change in Accounting Principle
in the
Other Disclosures
section for additional information on potential changes to these policies.
Plan Assets:
|
Current Target
Allocation
|
Percentage of Pension Plan
Assets at December 31,
|
||||
|
Asset Category
|
2016
|
2015
|
|||
|
Equity securities
|
|
to
|
|
|
|
|
Debt securities
|
|
to
|
|
|
|
|
Other
|
|
to
|
|
|
|
|
Total
|
|
|
|||
The Company recognizes its overall responsibility to ensure that the assets of its various defined benefit pension plans are managed effectively and prudently and in compliance with its policy guidelines and all applicable laws. Preservation of capital is important; however, the Company also recognizes that appropriate levels of risk are necessary to allow its investment managers to achieve satisfactory long-term results consistent with the objectives and the fiduciary character of the pension funds. Asset allocations are established in a manner consistent with projected plan liabilities, benefit payments and expected rates of return for various asset classes. The expected rate of return for the investment portfolio is based on expected rates of return for various asset classes, as well as historical asset class and fund performance.
80
Fair value is defined as the price that would be received to sell an asset or paid to transfer a liability in an orderly transaction between market participants at the measurement date (exit price). The FASB provides accounting rules that classify the inputs used to measure fair value into the following hierarchy:
|
Level 1 -
|
Unadjusted quoted prices in active markets for identical assets or liabilities.
|
|
Level 2 -
|
Unadjusted quoted prices in active markets for similar assets or liabilities, or unadjusted quoted prices for identical or similar assets or liabilities in markets that are not active, or inputs other than quoted prices that are observable for the asset or liability.
|
|
Level 3 -
|
Unobservable inputs for the asset or liability.
|
|
U.S. Pension Plans
|
International Pension Plans
|
|||||||||||||||||||||||
|
Level 1
|
Level 2
|
Level 3
|
Total
|
Level 1
|
Level 2
|
Level 3
|
Total
|
|||||||||||||||||
|
Assets:
|
||||||||||||||||||||||||
|
Cash and cash equivalents
|
$
|
|
|
$
|
|
|
$
|
|
|
$
|
|
|
$
|
|
|
$
|
|
|
$
|
|
|
$
|
|
|
|
Government and agency securities
|
|
|
|
|
|
|
|
|
|
|
|
|
|
|
|
|
||||||||
|
Corporate bonds - investment grade
|
|
|
|
|
|
|
|
|
|
|
|
|
|
|
|
|
||||||||
|
Equity securities - U.S. companies
|
|
|
|
|
|
|
|
|
|
|
|
|
|
|
|
|
||||||||
|
Equity securities - international companies
|
|
|
|
|
|
|
|
|
|
|
|
|
|
|
|
|
||||||||
|
Mutual funds
|
|
|
|
|
|
|
|
|
|
|
|
|
|
|
|
|
||||||||
|
$
|
|
|
$
|
|
|
$
|
|
|
$
|
|
|
$
|
|
|
$
|
|
|
$
|
|
|
$
|
|
|
|
|
Investments measured at net asset value:
|
||||||||||||||||||||||||
|
Cash and cash equivalents
|
$
|
|
|
$
|
|
|
||||||||||||||||||
|
Corporate bonds - investment grade
|
|
|
|
|
||||||||||||||||||||
|
Equity securities - international companies
|
|
|
|
|
||||||||||||||||||||
|
Common collective funds - domestic equities
|
|
|
|
|
||||||||||||||||||||
|
Common collective funds - international equities
|
|
|
|
|
||||||||||||||||||||
|
Common collective funds - fixed income
|
|
|
|
|
||||||||||||||||||||
|
Limited partnerships
|
|
|
|
|
||||||||||||||||||||
|
Real estate partnerships
|
|
|
|
|
||||||||||||||||||||
|
Other assets
|
|
|
|
|
||||||||||||||||||||
|
Risk parity
|
|
|
|
|
||||||||||||||||||||
|
Total Assets
|
|
$
|
|
|
$
|
|
|
|||||||||||||||||
81
|
U.S. Pension Plans
|
International Pension Plans
|
|||||||||||||||||||||||
|
Level 1
|
Level 2
|
Level 3
|
Total
|
Level 1
|
Level 2
|
Level 3
|
Total
|
|||||||||||||||||
|
Assets:
|
||||||||||||||||||||||||
|
Cash and cash equivalents
|
$
|
|
|
$
|
|
|
$
|
|
|
$
|
|
|
$
|
|
|
$
|
|
|
$
|
|
|
$
|
|
|
|
Government and agency securities
|
|
|
|
|
|
|
|
|
|
|
|
|
|
|
|
|
||||||||
|
Corporate bonds - investment grade
|
|
|
|
|
|
|
|
|
|
|
|
|
|
|
|
|
||||||||
|
Equity securities - U.S. companies
|
|
|
|
|
|
|
|
|
|
|
|
|
|
|
|
|
||||||||
|
Equity securities - international companies
|
|
|
|
|
|
|
|
|
|
|
|
|
|
|
|
|
||||||||
|
$
|
|
|
$
|
|
|
$
|
|
|
$
|
|
|
$
|
|
|
$
|
|
|
$
|
|
|
$
|
|
|
|
|
Investments measured at net asset value:
|
||||||||||||||||||||||||
|
Cash and cash equivalents
|
$
|
|
|
$
|
|
|
||||||||||||||||||
|
Corporate bonds - investment grade
|
|
|
|
|
||||||||||||||||||||
|
Equity securities - U.S. companies
|
|
|
|
|
||||||||||||||||||||
|
Equity securities - international companies
|
|
|
|
|
||||||||||||||||||||
|
Common collective funds - domestic equities
|
|
|
|
|
||||||||||||||||||||
|
Common collective funds - international equities
|
|
|
|
|
||||||||||||||||||||
|
Common collective funds - fixed income
|
|
|
|
|
||||||||||||||||||||
|
Limited partnerships
|
|
|
|
|
||||||||||||||||||||
|
Real estate partnerships
|
|
|
|
|
||||||||||||||||||||
|
Other assets
|
|
|
|
|
||||||||||||||||||||
|
Risk parity
|
|
|
|
|
||||||||||||||||||||
|
Total Assets
|
$
|
|
|
$
|
|
|
||||||||||||||||||
Limited partnerships include investments in funds that invest primarily in private equity, venture capital and distressed debt. Limited partnerships are valued based on the ownership interest in the net asset value of the investment, which is used as a practical expedient to fair value, per the underlying investment fund, which is based upon the general partner's own assumptions about the assumptions a market participant would use in pricing the assets and liabilities of the partnership. Real estate investments include funds that invest in companies that primarily invest in commercial and residential properties, commercial mortgage-backed securities, debt and equity securities of real estate operating companies, and real estate investment trusts. Other real estate investments are valued based on the ownership interest in the net asset value of the investment, which is used as a practical expedient to fair value per the underlying investment fund, which is based on appraised values and current transaction prices. Risk parity investments include funds that invest in diversified global asset classes (equities, bonds, inflation-linked bonds, and commodities) with leverage to balance risk and achieve consistent returns with lower volatility. Risk parity investments are valued based on the closing prices of the underlying securities in the active markets in which they are traded.
82
Cash Flows:
|
Employer Contributions to Defined Benefit Plans
|
|||
|
2015
|
$
|
|
|
|
2016
|
|
|
|
|
2017 (planned)
|
|
|
|
|
Benefit Payments
|
|
||
|
2017
|
$
|
|
|
|
2018
|
|
|
|
|
2019
|
|
|
|
|
2020
|
|
|
|
|
2021
|
|
|
|
|
2022-2026
|
|
|
|
Employee Savings Plans:
83
|
|
2016
|
2015
|
2014
|
||||||
|
Components of net periodic benefit cost:
|
|||||||||
|
Service cost
|
$
|
|
|
$
|
|
|
$
|
|
|
|
Interest cost
|
|
|
|
|
|
|
|||
|
Expected return on plan assets
|
(
|
)
|
(
|
)
|
(
|
)
|
|||
|
Amortization of prior service credit
|
|
|
|
|
|
|
|||
|
Amortization of net actuarial loss
|
|
|
|
|
|
|
|||
|
Curtailment
|
0.1
|
|
—
|
|
—
|
|
|||
|
Less: discontinued operations
|
|
|
|
|
(
|
)
|
|||
|
Net periodic benefit cost
|
$
|
|
|
$
|
|
|
$
|
|
|
|
Assumptions:
|
2016
|
2015
|
2014
|
|||
|
Discount rate
|
|
%
|
|
%
|
4.33% / 4.59%
|
|
|
Rate of return
|
|
%
|
|
%
|
|
%
|
The discount rate assumption is based on current rates of high-quality long-term corporate bonds over the same period that benefit payments will be required to be made. The expected rate of return on plan assets assumption is based on the weighted-average expected return on the various asset classes in the plans’ portfolio. The asset class return is developed using historical asset return performance as well as current market conditions such as inflation, interest rates and equity market performance.
For expense purposes in
2016
, the Company applied a discount rate of
4.39
%
to its postretirement benefit plans. For expense purposes in 2017, the Company will apply a discount rate of
3.97
%
to its postretirement benefit plans.
For expense purposes in
2016
, the Company applied an expected rate of return of
6.00
%
to the VEBA trust assets. For expense purposes in 2017, the Company will apply an expected rate of return of
6.00
%
to the VEBA trust assets.
The following tables set forth the change in benefit obligation, change in plan assets, funded status and amounts recognized on the Consolidated Balance Sheets of the postretirement benefit plans as of
December 31, 2016
and
2015
:
|
|
2016
|
2015
|
||||
|
Change in benefit obligation:
|
||||||
|
Benefit obligation at beginning of year
|
$
|
|
|
$
|
|
|
|
Service cost
|
|
|
|
|
||
|
Interest cost
|
|
|
|
|
||
|
Amendments
|
(
|
)
|
|
|
||
|
Actuarial (gains) losses
|
|
|
(
|
)
|
||
|
International plan exchange rate change
|
|
|
(
|
)
|
||
|
Benefits paid
|
(
|
)
|
(
|
)
|
||
|
Acquisition
|
|
|
|
|
||
|
Benefit obligation at end of year
|
$
|
|
|
$
|
|
|
84
|
|
2016
|
2015
|
||||
|
Change in plan assets:
|
||||||
|
Fair value of plan assets at beginning of year
|
$
|
|
|
$
|
|
|
|
Company contributions / payments
|
|
|
|
|
||
|
Return on plan assets
|
|
|
(
|
)
|
||
|
Benefits paid
|
(
|
)
|
(
|
)
|
||
|
Fair value of plan assets at end of year
|
|
|
|
|
||
|
Funded status at end of year
|
$
|
(
|
)
|
$
|
(
|
)
|
|
Amounts recognized on the Consolidated Balance Sheets:
|
||||||
|
Current liabilities
|
$
|
(
|
)
|
$
|
(
|
)
|
|
Non-current liabilities
|
(
|
)
|
(
|
)
|
||
|
|
$
|
(
|
)
|
$
|
(
|
)
|
|
Amounts recognized in accumulated other comprehensive loss:
|
||||||
|
Net actuarial loss
|
$
|
|
|
$
|
|
|
|
Net prior service cost
|
(
|
)
|
|
|
||
|
Accumulated other comprehensive loss
|
$
|
|
|
$
|
|
|
|
Changes in plan assets and benefit obligations recognized in AOCL:
|
||||||
|
AOCL at beginning of year
|
$
|
|
|
$
|
|
|
|
Net actuarial loss
|
|
|
|
|
||
|
Prior service cost
|
(
|
)
|
|
|
||
|
Recognized net actuarial loss
|
|
|
(
|
)
|
||
|
Recognized prior service credit
|
(
|
)
|
(
|
)
|
||
|
Loss recognized due to curtailment
|
(
|
)
|
|
|
||
|
Total recognized in accumulated other comprehensive loss at December 31
|
$
|
|
|
$
|
|
|
The presentation in the above tables for amounts recognized in accumulated other comprehensive loss on the Consolidated Balance Sheets is before the effect of income taxes.
The following table summarizes assumptions used to measure the benefit obligation for the postretirement benefit plans at
December 31
:
|
Assumptions:
|
2016
|
2015
|
||
|
Discount rate
|
|
%
|
|
%
|
In
2016
, the Company amended the postretirement benefit plan for nonbargaining employees to no longer offer Company subsidized postretirement medical benefits to those employees that retire after December 31, 2016. This amendment reduced the accumulated benefit obligation by
$
11.4
million
in
2016
. This amount will be amortized over the remaining service period of the employees affected by this amendment.
The current portion of accrued postretirement benefit cost, which was included in salaries, wages and benefits on the Consolidated Balance Sheets, was
$
7.5
million
and
$
14.5
million
at
December 31, 2016
and
2015
, respectively. In
2016
, the current portion of accrued postretirement benefit cost related to unfunded plans and represented the actuarial present value of expected payments related to the plans to be made over the
next 12 months
.
The estimated prior service cost for the postretirement plans that will be amortized from accumulated other comprehensive loss into net periodic benefit cost over the next fiscal year is a credit of
$
1.1
million
. The Company does not expect to recognize any amortization of the net actuarial loss over the next fiscal year.
85
For measurement purposes, the Company assumed a weighted-average annual rate of increase in the per capita cost (health care cost trend rate) for medical benefits of
6.50
%
for
2017
, declining gradually to
5.0
%
in
2023
and thereafter; and
6.50
%
for
2017
, declining gradually to
5.0
%
in
2023
and thereafter for prescription drug benefits; and
8.50
%
for
2017
, declining gradually to
5.0
%
in
2031
and thereafter for HMO benefits. Most of the Company's postretirement plans include caps that limit the amount of the benefit provided by the Company to participants each year, which lessens the impact of health care inflation costs to the Company.
The assumed health care cost trend rate may have a significant effect on the amounts reported. A one percentage point increase in the assumed health care cost trend rate would have increased the
2016
total service and interest cost components by
$
0.2
million
and would have increased the postretirement benefit obligation by
$
6.0
million
. A one percentage point decrease would provide corresponding reductions of
$
0.2
million
and
$
5.3
million
, respectively.
The Medicare Prescription Drug, Improvement and Modernization Act of 2003 (the Medicare Act) provides for prescription drug benefits under Medicare Part D and contains a subsidy to plan sponsors who provide “actuarially equivalent” prescription plans. The Company’s actuary determined that the prescription drug benefit provided by the Company’s postretirement plan is considered to be actuarially equivalent to the benefit provided under the Medicare Act. In accordance with ASC Topic 715, “Compensation – Retirement Benefits,” all measures of the accumulated postretirement benefit obligation or net periodic postretirement benefit cost in the financial statements or accompanying notes reflect the effects of the Medicare Act on the plan for the entire fiscal year. The
2016
expected subsidy was
$
1.7
million
, of which
$
1.0
million
was received prior to
December 31, 2016
.
Plan Assets:
The Company’s target allocation for the VEBA trust assets, as well as the actual VEBA trust asset allocation as of
December 31, 2016
and
2015
, was as follows:
|
|
Current Target
Allocation
|
Percentage of VEBA Assets
at December 31,
|
|||
|
Asset Category
|
2016
|
2015
|
|||
|
Equity securities
|
|
to
|
|
|
|
|
Debt securities
|
|
to
|
|
|
|
|
Total
|
|
|
|||
During 2016, the Pension Investment Committee made the decision to temporarily adjust the asset allocation outside of the target allocation percentages in order to better align investments with the timing of anticipated cash flows from the VEBA. The target allocation is currently under review and will be revised as needed in 2017.
Preservation of capital is important; however, the Company also recognizes that appropriate levels of risk are necessary to allow its investment managers to achieve satisfactory long-term results consistent with the objectives and the fiduciary character of the postretirement funds. Asset allocations are established in a manner consistent with projected plan liabilities, benefit payments and expected rates of return for various asset classes. The expected rate of return for the investment portfolio is based on expected rates of return for various asset classes, as well as historical asset class and fund performance.
|
2016
|
2015
|
|||||
|
Assets:
|
||||||
|
Cash and cash equivalents
|
$
|
|
|
$
|
|
|
|
Common collective fund - U.S. equities
|
|
|
|
|
||
|
Common collective fund - international equities
|
|
|
|
|
||
|
Common collective fund - fixed income
|
|
|
|
|
||
|
Total Assets
|
$
|
|
|
$
|
|
|
86
Cash and cash equivalents are valued at redemption value. Common collective funds are valued based on a net asset value per share, which is used as a practical expedient to fair value. When such prices are unavailable, the plan trustee determines a valuation from the market maker dealing in the particular security.
Cash Flows:
The Company did not make any employer contributions to the VEBA Trust in
2016
and
2015
. Employer contributions to the VEBA trust were
$20.0 million
in
2014
. The Company does not expect to make any employer contributions in 2017.
|
Gross
|
Expected
Medicare
Subsidies
|
Net Including
Medicare
Subsidies
|
|||||||
|
2017
|
$
|
|
|
$
|
|
|
$
|
|
|
|
2018
|
|
|
|
|
|
|
|||
|
2019
|
|
|
|
|
|
|
|||
|
2020
|
|
|
|
|
|
|
|||
|
2021
|
|
|
|
|
|
|
|||
|
2022-2026
|
|
|
|
|
|
|
|||
87
The Company operates under
two
reportable segments: (1) Mobile Industries and (2) Process Industries.
Description of types of products and services from which each reportable segment derives its revenues:
The Company
'
s reportable segments are business units that target different industry sectors. While the segments often operate using a shared infrastructure, each reportable segment is managed to address specific customer needs in these diverse market segments.
Mobile Industries offers an extensive portfolio of bearings, seals, lubrication devices and systems, as well as power transmission components, engineered chain, augers, belts and related products and maintenance services, to OEMs and end users of: off-highway equipment for the agricultural, construction, mining, outdoor power equipment and powersports markets; on-highway vehicles including passenger cars, light trucks and medium- and heavy-duty trucks; rail cars and locomotives. Beyond service parts sold to OEMs, aftermarket sales to individual end users, equipment owners, operators and maintenance shops are handled through the Company's extensive network of authorized automotive and heavy-truck distributors, and include hub units, specialty kits and more. Mobile Industries also provides power transmission systems and flight-critical components for civil and military aircraft, which include bearings, helicopter transmission systems, rotor-head assemblies, turbine engine components, gears and housings.
Process Industries supplies industrial bearings and assemblies, power transmission components such as gears and gearboxes, couplings, seals, lubricants, chains, belts and related products and services to OEMs and end users in industries that place heavy demands on operating equipment they make or use. This includes; metals, mining, cement and aggregate production; coal and wind power generation; oil and gas; pulp and paper in applications including printing presses; and cranes, hoists, drawbridges, wind energy turbines, gear drives, drilling equipment, coal conveyors, health and critical motion control equipment, marine equipment and food processing equipment. This segment also supports aftermarket sales and service needs through its global network of authorized industrial distributors. In addition, the Company’s industrial services group offers end users a broad portfolio of maintenance support and capabilities that include repair and service for bearings and gearboxes as well as electric motor rewind, repair and services.
Measurement of segment profit or loss and segment assets:
The Company evaluates performance and allocates resources based on return on capital and profitable growth. The primary measurement used by management to measure the financial performance of each segment is EBIT.
The accounting policies of the reportable segments are the same as those described in the summary of significant accounting policies.
Factors used by management to identify the enterprise’s reportable segments:
Net sales by geographic area are reported by the destination of net sales, which is reflective of how the Company operates its segments. Long-lived assets by geographic area are reported by the location of the subsidiary.
Timken’s non-U.S. operations are subject to normal international business risks not generally applicable to a domestic business. These risks include currency fluctuation, changes in tariff restrictions, difficulties in establishing and maintaining relationships with local distributors and dealers, import and export licensing requirements, difficulties in staffing and managing geographically diverse operations and restrictive regulations by foreign governments, including price and exchange controls, compliance with a variety of foreign laws and regulations, including unexpected changes in taxation and environmental regulatory requirements, and disadvantages of competing against companies from countries that are not subject to U.S. laws and regulations, including the FCPA.
88
|
2016
|
2015
|
2014
|
|||||||
|
Net sales:
|
|||||||||
|
United States
|
$
|
|
|
$
|
|
|
$
|
|
|
|
Americas excluding United States
|
|
|
|
|
|
|
|||
|
Europe / Middle East / Africa
|
|
|
|
|
|
|
|||
|
Asia-Pacific
|
|
|
|
|
|
|
|||
|
$
|
|
|
$
|
|
|
$
|
|
|
|
|
Property, Plant and Equipment, net:
|
|
|
|
||||||
|
United States
|
$
|
|
|
$
|
|
|
$
|
|
|
|
Americas excluding United States
|
|
|
|
|
|
|
|||
|
Europe / Middle East / Africa
|
|
|
|
|
|
|
|||
|
Asia-Pacific
|
|
|
|
|
|
|
|||
|
$
|
|
|
$
|
|
|
$
|
|
|
|
Business Segment Information:
|
2016
|
2015
|
2014
|
|||||||
|
Net sales to external customers:
|
|||||||||
|
Mobile Industries
|
$
|
|
|
$
|
|
|
$
|
|
|
|
Process Industries
|
|
|
|
|
|
|
|||
|
|
$
|
|
|
$
|
|
|
$
|
|
|
|
Segment EBIT:
|
|||||||||
|
Mobile Industries
|
$
|
|
|
$
|
|
|
$
|
|
|
|
Process Industries
|
|
|
|
|
|
|
|||
|
Total EBIT, for reportable segments
|
$
|
|
|
$
|
|
|
$
|
|
|
|
Corporate expenses
|
(
|
)
|
(
|
)
|
(
|
)
|
|||
|
CDSOA income, net
|
|
|
|
|
|
|
|||
|
Pension settlement charges
|
(
|
)
|
(
|
)
|
(
|
)
|
|||
|
Interest expense
|
(
|
)
|
(
|
)
|
(
|
)
|
|||
|
Interest income
|
|
|
|
|
|
|
|||
|
Income (loss) from continuing operations before income taxes
|
$
|
|
|
$
|
(
|
)
|
$
|
|
|
|
2016
|
2015
|
|||||
|
Assets employed at year-end:
|
||||||
|
Mobile Industries
|
$
|
|
|
$
|
|
|
|
Process Industries
|
|
|
|
|
||
|
Corporate
|
|
|
|
|
||
|
|
$
|
|
|
$
|
|
|
89
|
2016
|
2015
|
2014
|
|||||||
|
Capital expenditures:
|
|||||||||
|
Mobile Industries
|
$
|
|
|
$
|
|
|
$
|
|
|
|
Process Industries
|
|
|
|
|
|
|
|||
|
Corporate
|
|
|
|
|
|
|
|||
|
|
$
|
|
|
$
|
|
|
$
|
|
|
|
Depreciation and amortization:
|
|||||||||
|
Mobile Industries
|
$
|
|
|
$
|
|
|
$
|
|
|
|
Process Industries
|
|
|
|
|
|
|
|||
|
Corporate
|
|
|
|
|
|
|
|||
|
|
$
|
|
|
$
|
|
|
$
|
|
|
90
Income before income taxes, based on geographic location of the operations to which such earnings are attributable, is provided below. As the Company has elected to treat certain foreign subsidiaries as branches for U.S. income tax purposes, pretax income attributable to the United States shown below may differ from the pretax income reported in the Company’s annual U.S. Federal income tax return.
Income (loss) from continuing operations before income taxes:
|
|
2016
|
2015
|
2014
|
||||||
|
United States
|
$
|
|
|
$
|
(
|
)
|
$
|
|
|
|
Non-United States
|
|
|
|
|
|
|
|||
|
Income (loss) from continuing operations before income taxes
|
$
|
|
|
$
|
(
|
)
|
$
|
|
|
The provision (benefit) for income taxes consisted of the following:
|
2016
|
2015
|
2014
|
|||||||
|
Current:
|
|||||||||
|
Federal
|
$
|
|
|
$
|
|
|
$
|
|
|
|
State and local
|
|
|
|
|
|
|
|||
|
Foreign
|
|
|
|
|
|
|
|||
|
$
|
|
|
$
|
|
|
$
|
|
|
|
|
Deferred:
|
|||||||||
|
Federal
|
$
|
(
|
)
|
$
|
(
|
)
|
$
|
(
|
)
|
|
State and local
|
(
|
)
|
(
|
)
|
(
|
)
|
|||
|
Foreign
|
|
|
(
|
)
|
(
|
)
|
|||
|
|
$
|
(
|
)
|
$
|
(
|
)
|
$
|
(
|
)
|
|
United States and foreign tax provision (benefit) on income (loss)
|
$
|
|
|
$
|
(
|
)
|
$
|
|
|
The Company made net income tax payments of
$
49.7
million
,
$
83.3
million
and
$
111.6
million
in
2016
,
2015
and
2014
, respectively.
The following table is the reconciliation between the provision (benefit) for income taxes and the amount computed by applying the U.S. Federal income tax rate of
35
%
to income before taxes:
|
2016
|
2015
|
2014
|
|||||||
|
Income tax at the U.S. federal statutory rate
|
$
|
|
|
$
|
(
|
)
|
$
|
|
|
|
Adjustments:
|
|||||||||
|
State and local income taxes, net of federal tax benefit
|
|
|
(
|
)
|
(
|
)
|
|||
|
Tax on foreign remittances and U.S. tax on foreign income
|
|
|
|
|
|
|
|||
|
Tax expense related to undistributed earnings of foreign subsidiaries
|
|
|
|
|
(
|
)
|
|||
|
Foreign losses without current tax benefits
|
|
|
|
|
|
|
|||
|
Foreign earnings taxed at different rates including tax holidays
|
(
|
)
|
(
|
)
|
(
|
)
|
|||
|
U.S. domestic manufacturing deduction
|
(
|
)
|
(
|
)
|
(
|
)
|
|||
|
U.S. foreign tax credit
|
(
|
)
|
(
|
)
|
(
|
)
|
|||
|
U.S. research tax credit
|
(
|
)
|
(
|
)
|
(
|
)
|
|||
|
Accruals and settlements related to tax audits
|
(
|
)
|
(
|
)
|
|
|
|||
|
Valuation allowance changes, net
|
|
|
(
|
)
|
|
|
|||
|
Deferred taxes related to branch operations
|
(
|
)
|
|
|
|
|
|||
|
Other items, net
|
|
|
(
|
)
|
(
|
)
|
|||
|
Provision (benefit) for income taxes
|
$
|
|
|
$
|
(
|
)
|
$
|
|
|
|
Effective income tax rate
|
|
%
|
|
%
|
|
%
|
|||
91
In connection with various investment arrangements, the Company has been granted a “holiday” from income taxes for one affiliate in Asia for
2016
,
2015
and
2014
. These agreements began to expire at the end of 2010, with full expiration in 2018. In total, the agreements reduced income tax expense by
$
0.5
million
in
2016
,
$
1.3
million
in
2015
and
$
1.3
million
in
2014
. These savings resulted in an increase to earnings per diluted share of approximately
$
0.01
in
2016
, approximately
$
0.01
in
2015
and approximately
$
0.01
in
2014
.
Income tax expense includes U.S. and international income taxes. No income tax provision has been made on undistributed foreign earnings of
$
561.7
million
and
$
547.6
million
at
December 31, 2016
and
December 31, 2015
, respectively, as it is our intention to indefinitely reinvest the undistributed foreign earnings. It is not practicable to calculate the taxes that might be payable on such earnings indefinitely reinvested outside the U.S.
The effect of temporary differences giving rise to deferred tax assets and liabilities at
December 31, 2016
and
2015
was as follows:
|
2016
|
2015
|
|||||
|
Deferred tax assets:
|
||||||
|
Accrued postretirement benefits cost
|
$
|
|
|
$
|
|
|
|
Accrued pension cost
|
|
|
|
|
||
|
Other employee benefit accruals
|
|
|
|
|
||
|
Tax loss and credit carryforwards
|
|
|
|
|
||
|
Other, net
|
|
|
|
|
||
|
Valuation allowances
|
(
|
)
|
(
|
)
|
||
|
$
|
|
|
$
|
|
|
|
|
Deferred tax liabilities - principally depreciation and amortization
|
(
|
)
|
(
|
)
|
||
|
Net deferred tax assets
|
$
|
|
|
$
|
|
|
The Company has a U.S. foreign tax credit carryforward of
$
1.1
million
that will expire in 2023, and U.S. state and local credit carryforwards of
$
0.9
million
, portions of which will expire in 2017. The Company also has U.S. state and local loss carryforwards with tax benefits totaling
$
1.1
million
, portions of which will expire at the end of 2017. In addition, the Company has loss carryforwards in various non-U.S. jurisdictions with tax benefits totaling
$
81.6
million
having various expiration dates, as well as tax credit carryforwards of
$
0.1
million
. The Company has provided valuation allowances of
$
62.4
million
against certain of these carryforwards. The majority of the non-U.S. loss carryforwards represent local country net operating losses for branches of the Company or entities treated as branches of the Company under U.S. tax law. Tax benefits have been recorded for these losses in the United States. The related local country net operating loss carryforwards are offset fully by valuation allowances. In addition to loss and credit carryforwards, the Company has provided valuation allowances of
$
23.1
million
against other deferred tax assets.
As of December 31, 2016, the Company had
$
39.2
million
of total gross unrecognized tax benefits. Included in this amount was
$
35.9
million
of unrecognized tax benefits that would favorably impact the Company’s effective income tax rate in any future periods if such benefits were recognized. As of December 31, 2016, the Company believes it is reasonably possible that the amount of unrecognized tax positions could decrease by approximately
$
25
million
during the
next 12 months
. The potential decrease would be primarily driven by settlements with tax authorities and the expiration of various statutes of limitation. As of December 31, 2016, the Company had accrued
$
8.5
million
of interest and penalties related to uncertain tax positions. The Company records interest and penalties related to uncertain tax positions as a component of income tax expense.
As of December 31, 2015, the Company had
$
50.4
million
of total gross unrecognized tax benefits. Included in this amount was
$
38.0
million
of unrecognized tax benefits that would favorably impact the Company’s effective income tax rate in any future periods if such benefits were recognized. As of December 31, 2015, the Company had accrued
$
12.2
million
of interest and penalties related to uncertain tax positions. The Company records interest and penalties related to uncertain tax positions as a component of income tax expense.
As of December 31, 2014, the Company had
$
57.5
million
of total gross unrecognized tax benefits. Included in this amount was
$
47.3
million
of unrecognized tax benefits that would favorably impact the Company’s effective income tax rate in any future periods if such benefits were recognized. As of December 31, 2014, the Company had accrued
$
16.5
million
of interest and penalties related to uncertain tax positions.
92
|
2016
|
2015
|
2014
|
|||||||
|
Beginning balance, January 1
|
$
|
|
|
$
|
|
|
$
|
|
|
|
Tax positions related to the current year:
|
|||||||||
|
Additions
|
|
|
|
|
|
|
|||
|
Tax positions related to prior years:
|
|||||||||
|
Additions
|
|
|
|
|
|
|
|||
|
Reductions
|
(
|
)
|
(
|
)
|
(
|
)
|
|||
|
Settlements with tax authorities
|
(
|
)
|
(
|
)
|
(
|
)
|
|||
|
Lapses in statutes of limitation
|
|
|
|
|
(
|
)
|
|||
|
Ending balance, December 31
|
$
|
|
|
$
|
|
|
$
|
|
|
During 2016, gross unrecognized tax benefits decreased primarily due to settlements with tax authorities related to various prior year tax matters, including certain U.S. federal taxes, U.S. state and local taxes and taxes related to the Company’s international operations. The decrease was also related to expiration of statute of limitations in multiple jurisdictions. These decreases were partially offset by accruals related to prior year tax matters, including certain U.S. federal taxes, U.S. state and local taxes and taxes related to the Company’s international operations.
During 2015, gross unrecognized tax benefits decreased primarily due to settlements with tax authorities related to various prior year tax matters, including certain U.S. federal taxes, U.S. state and local taxes and taxes related to the Company’s international operations. These decreases were partially offset by accruals related to prior year tax matters, including certain U.S. federal taxes, U.S. state and local taxes and taxes related to the Company’s international operations.
During 2014, gross unrecognized tax benefits decreased primarily due to net reductions related to various current year and prior year tax matters, including settlement of tax matters with government authorities and taxes related to the Company’s international operations. These decreases were partially offset by additions related to prior year tax matters, including certain U.S. federal taxes, U.S. state and local taxes and taxes related to the Company’s international operations.
As of December 31, 2016, the Company is subject to examination by the IRS for tax years 2006 to 2009 and 2012 to the present. The Company was also subject to tax examination in various U.S. state and local tax jurisdictions for tax years 2006 to the present, as well as various foreign tax jurisdictions, including Mexico, Poland and India for tax years 2002 to the present. The Company’s unrecognized tax benefits were presented on the Consolidated Balance Sheets as a component of other non-current liabilities.
93
The following tables present the fair value hierarchy for those assets and liabilities on the Consolidated Balance Sheets measured at fair value on a recurring basis as of
December 31, 2016
and
2015
:
|
|
December 31, 2016
|
|||||||||||
|
|
Total
|
Level 1
|
Level 2
|
Level 3
|
||||||||
|
Assets:
|
||||||||||||
|
Cash and cash equivalents
|
$
|
|
|
$
|
|
|
$
|
|
|
$
|
|
|
|
Cash and cash equivalents measured at net
asset value |
|
|
|
|
|
|
|
|
||||
|
Restricted cash
|
|
|
|
|
|
|
|
|
||||
|
Short-term investments
|
|
|
|
|
|
|
|
|
||||
|
Short-term investments measured at net asset value
|
|
|
|
|
|
|
|
|
||||
|
Foreign currency hedges
|
|
|
|
|
|
|
|
|
||||
|
Total Assets
|
$
|
|
|
$
|
|
|
$
|
|
|
$
|
|
|
|
Liabilities:
|
||||||||||||
|
Foreign currency hedges
|
$
|
|
|
$
|
|
|
$
|
|
|
$
|
|
|
|
Total Liabilities
|
$
|
|
|
$
|
|
|
$
|
|
|
$
|
|
|
|
|
December 31, 2015
|
|||||||||||
|
|
Total
|
Level 1
|
Level 2
|
Level 3
|
||||||||
|
Assets:
|
||||||||||||
|
Cash and cash equivalents
|
$
|
|
|
$
|
|
|
$
|
|
|
$
|
|
|
|
Cash and cash equivalents measured at net
asset value |
|
|
|
|
|
|
|
|
||||
|
Restricted cash
|
|
|
|
|
|
|
|
|
||||
|
Short-term investments
|
|
|
|
|
|
|
|
|
||||
|
Short-term investments measured at net asset value
|
|
|
|
|
|
|
|
|
||||
|
Foreign currency hedges
|
|
|
|
|
|
|
|
|
||||
|
Total Assets
|
$
|
|
|
$
|
|
|
$
|
|
|
$
|
|
|
|
Liabilities:
|
||||||||||||
|
Foreign currency hedges
|
$
|
|
|
$
|
|
|
$
|
|
|
$
|
|
|
|
Total Liabilities
|
$
|
|
|
$
|
|
|
$
|
|
|
$
|
|
|
Cash and cash equivalents are highly liquid investments with maturities of three months or less when purchased and are valued at redemption value. Short-term investments are investments with maturities between four months and one year and are valued at amortized cost, which approximates fair value. The Company uses publicly available foreign currency forward and spot rates to measure the fair value of its foreign currency forward contracts.
The Company does not believe it has significant concentrations of risk associated with the counterparts to its financial instruments.
94
Note 18 - Fair Value (continued)
2016
|
Carrying Value
|
Fair Value Adjustment
|
Fair Value
|
|||||||
|
Long-lived assets held for sale:
|
|||||||||
|
Land
|
$
|
|
|
$
|
(
|
)
|
$
|
|
|
|
Total long-lived assets held for sale
|
$
|
|
|
$
|
(
|
)
|
$
|
|
|
|
Long-lived assets held and used:
|
|||||||||
|
Altavista bearing plant
|
$
|
|
|
$
|
(
|
)
|
$
|
|
|
|
Equipment at Benoni bearing plant
|
|
|
(
|
)
|
|
|
|||
|
Total long-lived assets held and used
|
$
|
|
|
$
|
(
|
)
|
$
|
|
|
Assets held for sale of
$
0.3
million
were written down to their fair value of
zero
during the first quarter of
2016
, resulting in an impairment charge. The fair value of these assets was based on the price that the Company expects to receive when it disposes of these assets.
On March 17, 2016, the Company announced the closure of its Altavista bearing plant. The plant is expected to close in approximately one year from the announcement date, with production transferring to the Company's bearing plant near Lincolnton, North Carolina. The Altavista bearing plant, with a carrying value of
$
5.6
million
, was written down to its fair value of
$
2.5
million
during 2016, resulting in an impairment charge of
$
3.1
million
.
In August 2016, the Company completed the consultation process to close the manufacturing operations in Benoni. The Benoni facility will continue to recondition bearings and assemble rail bearings. Equipment at this facility, with a carrying value of
$
0.5
million
, was written down to its fair value of
zero
during the third quarter of 2016, resulting in an impairment of
$
0.5
million
. The fair value for the equipment was based on the price that the Company expects to receive from the sale of the equipment.
2015
|
Carrying Value
|
Fair Value Adjustment
|
Fair Value
|
|||||||
|
Long-lived assets held for sale:
|
|||||||||
|
Repair business
|
$
|
|
|
$
|
(
|
)
|
$
|
|
|
|
Total long-lived assets held for sale
|
$
|
|
|
$
|
(
|
)
|
$
|
|
|
|
Long-lived assets held and used:
|
|||||||||
|
Fixed assets
|
$
|
|
|
$
|
(
|
)
|
$
|
|
|
|
Total long-lived assets held and used
|
$
|
|
|
$
|
(
|
)
|
$
|
|
|
Assets held for sale of
$
5.8
million
associated with the Company's service center in Niles, Ohio were written down to their fair value of
$
2.8
million
during the first quarter of 2015, resulting in an impairment charge of
$
3.0
million
. The fair value of these assets was based on the price that the Company expected to receive from the sale of these assets.
Various items of property, plant and equipment, with a carrying value of
$
0.8
million
, were written down to their fair value of
$
0.5
million
, resulting in an impairment charge of
$
0.3
million
. The fair value for these assets was based on the price that would be received in a current transaction to sell the assets on a standalone basis, considering the age and physical attributes of these items, as these assets had been idled.
95
Note 18 - Fair Value (continued)
2014
|
Carrying Value
|
Fair Value Adjustment
|
Fair Value
|
|||||||
|
Long-lived assets held for sale:
|
|||||||||
|
Aerospace overhaul business
|
$
|
|
|
$
|
(
|
)
|
$
|
|
|
|
Total long-lived assets held for sale
|
$
|
|
|
$
|
(
|
)
|
$
|
|
|
|
Long-lived assets held and used:
|
|||||||||
|
Goodwill
|
$
|
|
|
$
|
(
|
)
|
$
|
|
|
|
Indefinite-lived intangible assets
|
|
|
(
|
)
|
|
|
|||
|
Amortizable intangible assets
|
|
|
(
|
)
|
|
|
|||
|
Fixed assets
|
|
|
(
|
)
|
|
|
|||
|
Total long-lived assets held and used
|
$
|
|
|
$
|
(
|
)
|
$
|
|
|
During 2014, assets held for sale of
$
8.0
million
and assets held and used of
$
112.6
million
were written down to their fair value of
$
6.8
million
and
$
14.9
million
, respectively, and impairment charges of
$
1.2
million
and
$
97.7
million
, respectively, were included in earnings. The fair value of these assets was based on the price that the Company expected to receive to sell these assets.
On September 8, 2014, the Company announced plans to restructure its former Aerospace segment. In connection with the restructuring, the Company: (1) eliminated leadership positions and integrated substantially all aerospace activities into the Mobile Industries segment under the direction of its Group President; (2) sold the assets of its aerospace engine overhaul business, located in Mesa, Arizona, during the fourth quarter of 2014; (3) evaluated strategic alternatives for its aerospace MRO parts business, also located in Mesa; and (4) announced plans to close its aerospace bearing facility located in Wolverhampton, U.K. by early 2016, rationalizing the capacity into existing facilities.
In conjunction with the above Aerospace announcement, the Company reviewed goodwill for impairment for its Aerospace Transmissions and Aerospace Aftermarket reporting units. Step one of the goodwill impairment test failed for both of these reporting units. Therefore, the Company conducted step two of the goodwill impairment test. The carrying value of goodwill for the Aerospace Transmissions reporting unit was
$
56.9
million
, and the carrying value of the Aerospace Aftermarket reporting unit was
$
35.6
million
. The implied fair value of goodwill for the Aerospace Transmissions reporting unit was
$
1.7
million
, and the implied fair value of the Aerospace Aftermarket reporting unit was
$
4.5
million
. As a result of the carrying value of goodwill for these two reporting units exceeding fair value, the Company recorded a pretax impairment charge of
$
86.3
million
during the third quarter of 2014.
Indefinite-lived intangible assets that were classified as assets held and used associated with the Company's Aerospace Aftermarket reporting unit with a carrying value of
$
14.2
million
were written down to their fair value of
$
8.7
million
resulting in an impairment charge of
$
5.5
million
. In conjunction with the above Aerospace announcement, the Company also reviewed indefinite-lived intangible assets within the Aerospace segment for impairment. The fair value for these intangible assets was based on a relief from royalty method.
Intangible assets that were classified as assets held and used associated with the Company's Aerospace Aftermarket reporting unit with a carrying value of
$
4.4
million
were written down to their fair value of
zero
resulting in an impairment charge of
$
4.4
million
. The fair value for these intangible assets was based on the price that would be received in a current transaction to sell the assets on a standalone basis.
Various items of property, plant and equipment, with a carrying value of
$
1.5
million
, were written down to their fair value of
zero
, resulting in an impairment charge of
$
1.5
million
. The fair value for these assets was based on the price that would be received in a current transaction to sell the assets on a standalone basis, considering the age and physical attributes of these items, as these assets had been idled.
96
Financial Instruments:
The Company is exposed to certain risks relating to its ongoing business operations. The primary risks managed by using derivative instruments are foreign currency exchange rate risk and interest rate risk. Forward contracts on various foreign currencies are entered into in order to manage the foreign currency exchange rate risk associated with certain of the Company's commitments denominated in foreign currencies. From time to time, interest rate swaps are used to manage interest rate risk associated with the Company’s fixed and floating-rate borrowings.
The Company designates certain foreign currency forward contracts as cash flow hedges of forecasted revenues and certain interest rate hedges as fair value hedges of fixed-rate borrowings.
The Company does not purchase nor hold any derivative financial instruments for trading purposes. As of
December 31, 2016
and
2015
, the Company had
$
282.8
million
and
$
235.7
million
, respectively, of outstanding foreign currency forward contracts at notional value.
Refer to
Note 18 - Fair Value
for the fair value disclosure of derivative financial instruments.
Cash Flow Hedging Strategy:
For certain derivative instruments that are designated as and qualify as cash flow hedges (
i.e
., hedging the exposure to variability in expected future cash flows that is attributable to a particular risk), the effective portion of the gain or loss on the derivative instrument is reported as a component of other comprehensive income and reclassified into earnings in the same line item associated with the forecasted transaction and in the same period or periods during which the hedged transaction affects earnings. The remaining gain or loss on the derivative instrument in excess of the cumulative change in the present value of future cash flows of the hedged item, if any (
i.e
., the ineffective portion), or hedge components excluded from the assessment of effectiveness, are recognized in the Consolidated Statement of Income during the current period.
To protect against a reduction in the value of forecasted foreign currency cash flows resulting from export sales over the next year, the Company has instituted a foreign currency cash flow hedging program. The Company hedges portions of its forecasted cash flows denominated in foreign currencies with forward contracts. When the dollar strengthens significantly against foreign currencies, the decline in the present value of future foreign currency revenue is offset by gains in the fair value of the forward contracts designated as hedges. Conversely, when the dollar weakens, the increase in the present value of future foreign currency cash flows is offset by losses in the fair value of the forward contracts.
The maximum length of time over which the Company hedges it exposure to the variability in future cash flows for forecasted transactions is generally eighteen months or less.
Fair Value Hedging Strategy:
For derivative instruments that are designated and qualify as fair value hedges (
i.e
., hedging the exposure to changes in the fair value of an asset or a liability or an identified portion thereof that is attributable to a particular risk), the gain or loss on the derivative instrument as well as the offsetting loss or gain on the hedged item attributable to the hedged risk are recognized in the same line item associated with the hedged item (
i.e
., in “interest expense” when the hedged item is fixed-rate debt).
97
Purpose for Derivative Instruments not designated as Hedging Instruments:
For derivative instruments that are not designated as hedging instruments, the instruments are typically forward contracts. In general, the practice is to reduce volatility by selectively hedging transaction exposures including intercompany loans, accounts payable and accounts receivable. Intercompany loans between entities with different functional currencies are typically hedged with a forward contract at the inception of loan with a maturity date at the maturity of the loan. The revaluation of these contracts, as well as the revaluation of the underlying balance sheet items, is recorded directly to the income statement so the adjustment generally offsets the revaluation of the underlying balance sheet items to protect cash payments and reduce income statement volatility.
|
Asset Derivatives
|
Liability Derivatives
|
|||||||||||
|
Derivatives designated as hedging instruments
|
December 31, 2016
|
December 31, 2015
|
December 31, 2016
|
December 31, 2015
|
||||||||
|
Foreign currency forward contracts
|
$
|
|
|
$
|
|
|
$
|
|
|
$
|
|
|
|
Total derivatives designated as hedging instruments
|
|
|
|
|
|
|
|
|
||||
|
Derivatives not designated as hedging instruments
|
||||||||||||
|
Foreign currency forward contracts
|
|
|
|
|
|
|
|
|
||||
|
Total Derivatives
|
$
|
|
|
$
|
|
|
$
|
|
|
$
|
|
|
|
Amount of gain or (loss) recognized in
Other Comprehensive Income (loss)("OCI") on derivative instruments
|
|||||||||
|
Year Ended December 31,
|
|||||||||
|
Derivatives in cash flow hedging relationships
|
2016
|
2015
|
2014
|
||||||
|
Foreign currency forward contracts
|
$
|
(
|
)
|
$
|
|
|
$
|
|
|
|
Interest rate swaps
|
|
|
|
|
(
|
)
|
|||
|
Total
|
$
|
(
|
)
|
$
|
|
|
$
|
(
|
)
|
|
Amount of gain or (loss) reclassified from Accumulated Other Comprehensive (loss) Income ("AOCI") into income (effective portion)
|
|||||||||
|
Year Ended December 31,
|
|||||||||
|
Derivatives in cash flow hedging relationships
|
2016
|
2015
|
2014
|
||||||
|
Foreign currency forward contracts
|
$
|
|
|
$
|
|
|
$
|
|
|
|
Interest rate swaps
|
(
|
)
|
(
|
)
|
(
|
)
|
|||
|
Total
|
$
|
(
|
)
|
$
|
|
|
$
|
|
|
98
|
Amount of gain or (loss) recognized in
income on derivative instruments
|
||||||||||
|
Year Ended December 31,
|
||||||||||
|
Derivatives not designated as hedging instruments
|
Location of gain or (loss) recognized in income on derivative
|
2016
|
2015
|
2014
|
||||||
|
Foreign currency forward contracts
|
Other (expense) income, net
|
$
|
|
|
$
|
(
|
)
|
$
|
|
|
|
Total
|
$
|
|
|
$
|
(
|
)
|
$
|
|
|
|
The Company performs research and development under Company-funded programs and under contracts with the federal government and others. Expenditures committed to research and development amounted to
$
31.8
million
,
$
32.6
million
and $
38.8
million
in
2016
,
2015
and
2014
, respectively. Of the
2014
amount,
$
0.3
million
was funded by others. None of the
2016
and
2015
amounts were funded by others. Expenditures may fluctuate from year-to-year depending on special projects and needs.
CDSOA provides for distribution of monies collected by U.S. Customs and Border Protection on entries of merchandise subject to antidumping orders that entered the U.S. prior to October 1, 2007, to qualifying domestic producers where the domestic producers have continued to invest in their technology, equipment and people. During the
twelve
months ended December 31 2016, the Company recognized pretax CDSOA income, net of related expenses of
$
59.6
million
.
In September 2002, the World Trade Organization ruled that CDSOA payments are not consistent with international trade rules. In February 2006, U.S. legislation was enacted that ended CDSOA distributions for imports covered by antidumping duty orders entering the United States after September 30, 2007. Instead, any such antidumping duties collected would remain with the U.S. Treasury.
CDSOA has been the subject of significant litigation since 2002, and U.S. Customs has withheld CDSOA distributions in recent years while litigation was ongoing. In recent months, much of the CDSOA litigation that involves antidumping orders where Timken is a qualifying domestic producer has concluded.
During 2016, the Company received CDSOA distributions of
$
60.6
million
, representing funds that would have been distributed to the Company at the end of calendar years 2011 through 2016.
99
(Unaudited
)
|
2016
|
|||||||||||||||
|
1st
|
2nd
|
3rd
|
4th
|
Total
|
|||||||||||
|
Net sales
|
$
|
|
|
$
|
|
|
$
|
|
|
$
|
|
|
$
|
|
|
|
Gross profit
|
|
|
|
|
|
|
|
|
|
|
|||||
|
Impairment and restructuring charges
(1)
|
|
|
|
|
|
|
|
|
|
|
|||||
|
Pension settlement charges
(2)
|
|
|
|
|
|
|
|
|
|
|
|||||
|
Net income
(3)
|
|
|
|
|
|
|
|
|
|
|
|||||
|
Net (loss) income attributable to noncontrolling interests
|
(
|
)
|
|
|
|
|
|
|
|
|
|||||
|
Net income attributable to The Timken Company
|
|
|
|
|
|
|
|
|
|
|
|||||
|
Net income per share - Basic:
|
$
|
0.79
|
|
$
|
0.57
|
|
$
|
0.26
|
|
$
|
0.31
|
|
$
|
1.94
|
|
|
Net income per share - Diluted:
|
$
|
0.78
|
|
$
|
0.57
|
|
$
|
0.26
|
|
$
|
0.31
|
|
$
|
1.92
|
|
|
Dividends per share
|
$
|
|
|
$
|
|
|
$
|
|
|
$
|
|
|
$
|
|
|
|
2015
|
|||||||||||||||
|
1st
|
2nd
|
3rd
|
4th
|
Total
|
|||||||||||
|
Net sales
|
$
|
|
|
$
|
|
|
$
|
|
|
$
|
|
|
$
|
|
|
|
Gross profit
|
|
|
|
|
|
|
|
|
|
|
|||||
|
Impairment and restructuring charges
(4)
|
|
|
|
|
|
|
|
|
|
|
|||||
|
Gain (loss) on divestiture
(5)
|
|
|
|
|
|
|
(
|
)
|
(
|
)
|
|||||
|
Pension settlement charges
(6)
|
|
|
|
|
|
|
|
|
|
|
|||||
|
Net (loss) income
(7)
|
(
|
)
|
|
|
|
|
(
|
)
|
(
|
)
|
|||||
|
Net income attributable to noncontrolling interests
|
|
|
|
|
|
|
|
|
|
|
|||||
|
Net (loss) income attributable to The Timken Company
|
(
|
)
|
|
|
|
|
(
|
)
|
(
|
)
|
|||||
|
Net (loss) income per share - Basic:
|
$
|
(
|
)
|
$
|
|
|
$
|
|
|
$
|
(
|
)
|
$
|
(
|
)
|
|
Net (loss) income per share - Diluted:
|
$
|
(
|
)
|
$
|
|
|
$
|
|
|
$
|
(
|
)
|
$
|
(
|
)
|
|
Dividends per share
|
$
|
|
|
$
|
|
|
$
|
|
|
$
|
|
|
$
|
|
|
Earnings per share are computed independently for each of the quarters presented; therefore, the sum of the quarterly earnings per share may not equal the total computed for the year.
|
(1)
|
Impairment and restructuring charges for the first quarter of 2016 included severance and related benefit costs of
$
|
|
(2)
|
Pension settlement charges in
2016
were primarily related to
$
|
|
(3)
|
Net income included CDSOA income, net of
$
|
|
(4)
|
Impairment and restructuring charges for the first quarter of 2015 included exit costs of
$
|
|
(5)
|
Gain (loss) on divestitures in the fourth quarter of 2015 included a gain of
$
|
100
|
(6)
|
Pension settlement charges in the first and fourth quarters of 2015 related to two agreements pursuant to which two of the Company's U.S. defined benefit pension plans purchased group annuity contracts from Prudential, which require Prudential to pay and administer future benefits for a total of approximately
|
|
(7)
|
|
101
Report of Independent Registered Public Accounting Firm
The Board of Directors and Shareholders of The Timken Company and subsidiaries
We have audited the accompanying consolidated balance sheets of The Timken Company and subsidiaries as of December 31, 2016 and 2015, and the related consolidated statements of income, comprehensive income, shareholders' equity and cash flows for each of the three years in the period ended December 31, 2016. Our audits also included the financial statement schedule listed in the Index at Item 15(a). These financial statements and schedule are the responsibility of the Company's management. Our responsibility is to express an opinion on these financial statements and schedule based on our audits.
We conducted our audits in accordance with the standards of the Public Company Accounting Oversight Board (United States). Those standards require that we plan and perform the audit to obtain reasonable assurance about whether the financial statements are free of material misstatement. An audit includes examining, on a test basis, evidence supporting the amounts and disclosures in the financial statements. An audit also includes assessing the accounting principles used and significant estimates made by management, as well as evaluating the overall financial statement presentation. We believe that our audits provide a reasonable basis for our opinion.
In our opinion, the financial statements referred to above present fairly, in all material respects, the consolidated financial position of The Timken Company and subsidiaries at December 31, 2016 and 2015, and the consolidated results of their operations and their cash flows for each of the three years in the period ended December 31, 2016, in conformity with U.S. generally accepted accounting principles. Also, in our opinion, the related financial statement schedule, when considered in relation to the basic financial statements taken as a whole, presents fairly in all material respects the information set forth therein.
We also have audited, in accordance with the standards of the Public Company Accounting Oversight Board (United States), The Timken Company's internal control over financial reporting as of December 31, 2016, based on criteria established in Internal Control-Integrated Framework issued by the Committee of Sponsoring Organizations of the Treadway Commission (2013 framework) and our report dated
February 21, 2017
expressed an unqualified opinion thereon.
/s/ Ernst & Young LLP
Cleveland, OH
February 21, 2017
102
Not applicable.
As of the end of the period covered by this Annual Report on Form 10-K, the Company’s management carried out an evaluation, under the supervision and with the participation of the Company’s principal executive officer and principal financial officer, of the effectiveness of the design and operation of the Company’s disclosure controls and procedures as defined in Exchange Act Rule 13a-15(e). Based upon that evaluation, the principal executive officer and principal financial officer concluded that the Company’s disclosure controls and procedures were effective as of the end of the period covered by this Annual Report on Form 10-K.
There have been no changes during the Company’s fourth quarter of
2016
in the Company’s internal control over financial reporting that have materially affected, or are reasonably likely to materially affect, the Company’s internal control over financial reporting.
Report of Management on Internal Control Over Financial Reporting
The management of The Timken Company is responsible for establishing and maintaining adequate internal control over financial reporting for the Company. Timken’s internal control system was designed to provide reasonable assurance regarding the preparation and fair presentation of published financial statements. Because of its inherent limitations, internal control over financial reporting may not prevent or detect misstatements. Also, projections of any evaluation of effectiveness to future periods are subject to the risk that controls may become inadequate because of changes in conditions, or that the degree of compliance with the policies or procedures may deteriorate.
Timken management assessed the effectiveness of the Company’s internal control over financial reporting as of
December 31, 2016
. In making this assessment, it used the criteria set forth by the Committee of Sponsoring Organizations of the Treadway Commission ("COSO"). Based on this assessment under COSO’s “Internal Control-Integrated Framework,” management believes that, as of
December 31, 2016
, Timken’s internal control over financial reporting is effective.
On July 8, 2016, the Company completed the acquisition of Lovejoy. On October 31, 2016, the Company completed the acquisition of EDT. As permitted by SEC guidance, the scope of Timken's evaluation of internal control over financing reporting as of December 31, 2016 did not include the internal control over financial reporting of Lovejoy and EDT. The results of Lovejoy and EDT are included in the Company's consolidated financial statements beginning July 8, 2016 and October 31, 2016, respectively. The combined total assets of Lovejoy and EDT represented three percent of the Company's total assets at
December 31, 2016
. The combined net sales of Lovejoy and EDT represented one percent of the Company's consolidated net sales for
2016
and the combined net income of Lovejoy and EDT represents less than one percent of the Company's net income for
2016
. The Company will include Lovejoy and EDT in the Company's internal control over financial reporting assessment as of December 31, 2017.
The effectiveness of the Company’s internal control over financial reporting as of
December 31, 2016
has been audited by Ernst & Young LLP, an independent registered public accounting firm, as stated in their report which is presented in this Annual Report on Form 10-K.
103
Report of Independent Registered Public Accounting Firm
The Board of Directors and Shareholders of The Timken Company and subsidiaries
We have audited The Timken Company and subsidiaries’ internal control over financial reporting as of December 31, 2016, based on criteria established in Internal Control-Integrated Framework issued by the Committee of Sponsoring Organizations of the Treadway Commission (2013 framework) (the COSO criteria). The Timken Company and subsidiaries’ management is responsible for maintaining effective internal control over financial reporting, and for its assessment of the effectiveness of internal control over financial reporting included in the accompanying Report of Management on Internal Control Over Financial Reporting. Our responsibility is to express an opinion on the company’s internal control over financial reporting based on our audit.
We conducted our audit in accordance with the standards of the Public Company Accounting Oversight Board (United States). Those standards require that we plan and perform the audit to obtain reasonable assurance about whether effective internal control over financial reporting was maintained in all material respects. Our audit included obtaining an understanding of internal control over financial reporting, assessing the risk that a material weakness exists, testing and evaluating the design and operating effectiveness of internal control based on the assessed risk, and performing such other procedures as we considered necessary in the circumstances. We believe that our audit provides a reasonable basis for our opinion.
A company’s internal control over financial reporting is a process designed to provide reasonable assurance regarding the reliability of financial reporting and the preparation of financial statements for external purposes in accordance with generally accepted accounting principles. A company’s internal control over financial reporting includes those policies and procedures that (1) pertain to the maintenance of records that, in reasonable detail, accurately and fairly reflect the transactions and dispositions of the assets of the company; (2) provide reasonable assurance that transactions are recorded as necessary to permit preparation of financial statements in accordance with generally accepted accounting principles, and that receipts and expenditures of the company are being made only in accordance with authorizations of management and directors of the company; and (3) provide reasonable assurance regarding prevention or timely detection of unauthorized acquisition, use, or disposition of the company’s assets that could have a material effect on the financial statements.
Because of its inherent limitations, internal control over financial reporting may not prevent or detect misstatements. Also, projections of any evaluation of effectiveness to future periods are subject to the risk that controls may become inadequate because of changes in conditions, or that the degree of compliance with the policies or procedures may deteriorate.
As indicated in the accompanying Report of Management on Internal Control Over Financial Reporting, management’s assessment of and conclusion on the effectiveness of internal control over financial reporting did not include the internal controls of Lovejoy, Inc. and EDT, which are included in the 2016 consolidated financial statements of The Timken Company and subsidiaries and on a combined basis constituted 3% and 5% of total assets and net assets, as of December 31, 2016, respectively, and 1% of net sales and less than 1% of net income for the year then ended. Our audit of internal control over financial reporting of The Timken Company and subsidiaries also did not include an evaluation of the internal control over financial reporting of Lovejoy, Inc. and EDT.
In our opinion, The Timken Company and subsidiaries maintained, in all material respects, effective internal control over financial reporting as of December 31, 2016, based on
the COSO criteria
.
We also have audited, in accordance with the standards of the Public Company Accounting Oversight Board (United States), the consolidated balance sheets of The Timken Company and subsidiaries as of December 31, 2016 and 2015 and the related consolidated statements of income, comprehensive income, shareholders’ equity, and cash flows for each of the three years in the period ended December 31, 2016 of The Timken Company and subsidiaries and our report dated
February 21, 2017
expressed an unqualified opinion thereon.
/s/ Ernst & Young LLP
Cleveland, OH
February 21, 2017
104
Not applicable.
Required information is set forth under the captions “Election of Directors” and “Section 16(a) Beneficial Ownership Reporting Compliance” in the proxy statement filed in connection with the annual meeting of shareholders to be held on or about
May 9, 2017
(the "Proxy Statement"), and is incorporated herein by reference. Information regarding the executive officers of the registrant is included in Part I hereof. Information regarding the Company’s Audit Committee and its Audit Committee Financial Expert is set forth under the caption “Audit Committee” in the Proxy Statement, and is incorporated herein by reference.
The General Policies and Procedures of the Board of Directors of the Company and the charters of its Audit Committee, Compensation Committee and Nominating and Corporate Governance Committee are also available on the Company’s website at www.timken.com/investors/about/governance-documents and are available to any shareholder upon request to the General Counsel. The information on the Company’s website is not incorporated by reference into this Annual Report on Form 10-K.
The Company has adopted a code of ethics that applies to all of its employees, including its principal executive officer, principal financial officer and principal accounting officer, as well as its directors. The Company’s code of ethics, The Timken Company Standards of Business Ethics Policy, is available on its website at www.timken.com/about/governance-documents. The Company intends to disclose any amendment to, or waiver from, its code of ethics by posting such amendment or waiver, as applicable, on its website.
Required information is set forth under the captions “Compensation Discussion and Analysis,” “2016 Summary Compensation Table,” “2016 Grants of Plan-Based Awards,” “Outstanding Equity Awards at 2016 Year-End,” “2016 Option Exercises and Stock Vested,” “Pension Benefits,” “2016 Pension Benefits Table,” “2016 Nonqualified Deferred Compensation,” “Potential Payments Upon Termination or Change-in-Control,” “Director Compensation,” “Compensation Committee,” and “Compensation Committee Report” in the Proxy Statement, and is incorporated herein by reference.
Required information, including with respect to institutional investors owning more than 5% of the Company’s common shares, is set forth under the caption “Beneficial Ownership of Common Stock” in the Proxy Statement, and is incorporated herein by reference.
Required information is set forth under the caption “Equity Compensation Plan Information” in the Proxy Statement, and is incorporated herein by reference.
Required information is set forth under the caption “Election of Directors” in the Proxy Statement, and is incorporated herein by reference.
Required information regarding fees paid to and services provided by the Company’s independent auditor during the years ended
December 31, 2016
and
2015
and the pre-approval policies and procedures of the Audit Committee of the Company’s Board of Directors is set forth under the caption “Auditors” in the Proxy Statement, and is incorporated herein by reference.
105
(a)(1) - Financial Statements are included in Part II, Item 8 of the Annual Report on Form 10-K.
(a)(2) - Schedule II - Valuation and Qualifying Accounts is submitted as a separate section of this report. Schedules I, III, IV and V are not applicable to the Company and, therefore, have been omitted.
(a)(3) Listing of Exhibits
|
Exhibit
|
|
||
|
(3.1
|
)
|
Amended Articles of Incorporation of The Timken Company, (effective May 31, 2013) were filed on July 31, 2013 with Form 10-Q (Commission File No. 1-1169) and are incorporated herein by reference.
|
|
|
(3.2
|
)
|
Amended Regulations of The Timken Company adopted on May 10, 2016, were filed on July 28, 2016 with Form 8-K (Commission File No. 1-1169) and are incorporated herein by reference.
|
|
|
(4.1
|
)
|
Third Amended and Restated Credit Agreement, dated as of June 19, 2015, by and among: The Timken Company; Bank of America, N.A. and KeyBank National Association as Co-Administrative Agents; KeyBank National Association as Paying Agent, L/C Issuer and Swing Line Lender; and the other Lenders party thereto, was filed on June 23, 2015 with Form 8-K (Commission File No. 1-1169) and is incorporated herein by reference.
|
|
|
(4.2
|
)
|
Indenture dated as of July 1, 1990, between The Timken Company and Ameritrust Company of New York, was filed with Form S-3 dated July 12, 1990 (Registration No. 333-35773) and is incorporated herein by reference.
|
|
|
(4.3
|
)
|
First Supplemental Indenture, dated as of July 24, 1996, by and between The Timken Company and Mellon Bank, N.A. was filed on November 13, 1996 with Form 10-Q (Commission File No. 1-1169) and is incorporated herein by reference.
|
|
|
(4.4
|
)
|
Indenture, dated as of February 18, 2003, between The Timken Company and The Bank of New York, as Trustee, providing for Issuance of Notes in Series was filed on March 27, 2003 with Form 10-K (Commission File No. 1-1169) and is incorporated herein by reference.
|
|
|
(4.5
|
)
|
Indenture, dated as of August 20, 2014, by and between The Timken Company and The Bank of New York Mellon Trust Company, N.A., was filed on August 20, 2014 with Form 8-K (Commission File No. 1-1169) and is incorporated herein by reference.
|
|
|
(4.6
|
)
|
The Company is also a party to agreements with respect to other long-term debt in total amount less than 10% of the Registrant's consolidated total assets. The Registrant agrees to furnish a copy of such agreements upon request.
|
|
|
Management Contracts and Compensation Plans
|
|||
|
(10.1
|
)
|
|
The Timken Company 1996 Deferred Compensation Plan for officers and other key employees, amended and restated effective December 31, 2010, was filed on February 17, 2012 with Form 10-K (Commission File No. 1-1169) and is incorporated herein by reference.
|
|
(10.2
|
)
|
|
The Timken Company Director Deferred Compensation Plan, amended and restated effective December 31, 2008, was filed on February 25, 2010 with Form 10-K (Commission File No. 1-1169) and is incorporated herein by reference.
|
|
(10.3
|
)
|
|
Form of The Timken Company 1996 Deferred Compensation Plan Election Agreement, amended and restated as of January 1, 2008, was filed on February 25, 2010 with Form 10-K (Commission File No. 1-1169) and is incorporated herein by reference.
|
|
(10.4
|
)
|
|
Form of The Timken Company Director Deferred Compensation Plan Election Agreement, amended and restated as of January 1, 2008, was filed on February 25, 2010 with Form 10-K (Commission File No. 1-1169) and is incorporated herein by reference.
|
|
(10.5
|
)
|
|
The Timken Company Long-Term Incentive Plan for directors, officers and other key employees as amended and restated as of February 5, 2008 and approved by the shareholders on May 1, 2008 was filed on March 18, 2008 as Appendix A to the Registrant's Definitive Proxy Statement on Schedule 14A (Commission File No. 1-1169) and is incorporated herein by reference.
|
|
(10.6
|
)
|
|
The Timken Company 2011 Long-Term Incentive Plan, as amended and restated as of February 13, 2015 for directors, officers and other key employees as approved by the shareholders on May 7, 2015 was filed on March 27, 2015 with Definitive Proxy Statement on Schedule 14A (Commission File No. 1-1169) and is incorporated herein by reference.
|
|
(10.7
|
)
|
|
Amended and Restated Supplemental Pension Plan of The Timken Company, amended and restated effective as of January 1, 2011, was filed on February 17, 2012 with Form 10-K (Commission File No. 1-1169) and is incorporated herein by reference.
|
106
|
Management Contracts and Compensation Plans
|
|||
|
(10.8
|
)
|
|
The Timken Company Senior Executive Management Performance Plan, as amended and restated as of February 13, 2015 and approved by shareholders on May 7, 2015, was filed on March 27, 2015 with Definitive Proxy Statement on Schedule 14A (Commission File No. 1-1169) and is incorporated herein by reference.
|
|
(10.9
|
)
|
|
Form of Severance Agreement (for Executive Officers appointed on or after November 12, 2015), as adopted on November 12, 2015, was filed on February 24, 2016 with Form 10-K (Commission File No. 1-1169) and is incorporated herein by reference.
|
|
(10.10
|
)
|
|
Form of Severance Agreement as adopted on December 9, 2010 was filed on February 22, 2011 with Form 10-K (Commission File No. 1-1169) and is incorporated herein by reference.
|
|
(10.11
|
)
|
|
Form of Indemnification Agreement entered into with all Directors who are not Executive Officers of the Company was filed on July 31, 2013 with Form 10-Q (Commission File No. 1-1169) and is incorporated herein by reference.
|
|
(10.12
|
)
|
|
Form of Indemnification Agreement entered into with all Directors who are not Executive Officers of the Company was filed on July 31, 2013 with Form 10-Q (Commission File No. 1-1169) and is incorporated herein by reference.
|
|
(10.13
|
)
|
|
Form of Indemnification Agreement entered into with all Executive Officers of the Company who are not Directors of the Company was filed on July 31, 2013 with Form 10-Q (Commission File No. 1-1169) and is incorporated herein by reference.
|
|
(10.14
|
)
|
|
Form of Amended and Restated Employee Excess Benefits Agreement entered into with certain Executive Officers and certain key employees of the Company, was filed on February 26, 2009 with Form 10-K (Commission File No. 1-1169) and is incorporated herein by reference
|
|
(10.15
|
)
|
|
Form of Amended and Restated Employee Excess Benefits Agreement entered into with certain Executive Officers and certain key employees of the Company, was filed on February 26, 2009 with Form 10-K (Commission File No. 1-1169) and is incorporated herein by reference.
|
|
(10.16
|
)
|
|
Form of Employee Excess Benefits Agreement, entered into with all Executive Officers after January 1, 2011, was filed on August 4, 2011 with Form 10-Q (Commission File No. 1-1169) and is incorporated herein by reference.
|
|
(10.17
|
)
|
|
Form of Amendment No. 1 to The Amended and Restated Employee Excess Benefit Agreement, entered into with certain Executive Officers and certain key employees of the Company, was filed on September 2, 2009 with Form 8-K (Commission File No. 1-1169) and is incorporated herein by reference.
|
|
(10.18
|
)
|
|
Form of Amendment No. 1 to The Amended and Restated Employee Excess Benefits Agreement with all Executive Officers after January 1, 2011 and Form of Amendment No. 2 to the Amended and Restated Excess Benefits Agreement with certain Executive Officers and certain key employees of the Company, as adopted December 8, 2011, was filed on February 17, 2012 with Form 10-K (Commission File No. 1-1169) and is incorporated herein by reference.
|
|
(10.19
|
)
|
|
Form of Amendment No. 1 to The Amended and Restated Employee Excess Benefits Agreement entered into with the Chief Executive Officer, as adopted December 8, 2011, was filed on February 17, 2012 with Form 10-K (Commission File No. 1-1169) and is incorporated herein by reference.
|
|
(10.20
|
)
|
|
Form of Amendment No. 2 to The Amended and Restated Employee Excess Benefits Agreement entered into with the Chief Executive Officer, as adopted December 8, 2011, was filed on February 17, 2012 with Form 10-K (Commission File No. 1-1169) and is incorporated herein by reference.
|
|
(10.21
|
)
|
|
Form of Nonqualified Stock Option Agreement for nontransferable options without dividend credit, as adopted on April 17, 2001, was filed on May 14, 2001 with Form 10-Q (Commission File No. 1-1169) and is incorporated herein by reference.
|
|
(10.22
|
)
|
|
Form of Nonqualified Stock Option Agreement for transferable options for Officers, as adopted on August 12, 2015, was filed on February 24, 2016 with Form 10-K (Commission File No. 1-1169) and is incorporated herein by reference.
|
|
(10.23
|
)
|
|
Form of Nonqualified Stock Option Agreement for Officers, as adopted on February 6, 2006, was filed on February 10, 2006 with Form 8-K (Commission File No. 1-1169) and is incorporated herein by reference.
|
|
(10.24
|
)
|
|
Form of Nonqualified Stock Option Agreement for Officers, as adopted on November 6, 2008, was filed on February 26, 2009 with Form 10-K (Commission File No. 1-1169) and is incorporated herein by reference.
|
|
(10.25
|
)
|
|
Form of Nonqualified Stock Option Agreement for Officers, as adopted on December 10, 2009, was filed on February 25, 2010 with Form 10-K (Commission File No. 1-1169), and is incorporated herein by reference.
|
|
(10.26
|
)
|
|
Form of Nonqualified Stock Option Agreement for Non-Employee Directors, as adopted on December 8, 2011, was filed on February 17, 2012 with Form 10-K (Commission File No. 1-1169) and is incorporated herein by reference.
|
107
|
Management Contracts and Compensation Plans
|
|||
|
(10.27
|
)
|
|
Form of Nonqualified Stock Option Agreement for transferable options for Officers, as adopted on December 8, 2011, was filed on February 17, 2012 with Form 10-K (Commission File No. 1-1169) and is incorporated herein by reference.
|
|
(10.28
|
)
|
|
Form of Nonqualified Stock Option Agreement for non-transferable options for Non-Officer Employees, as adopted on December 8, 2011, was filed on February 17, 2012 with Form 10-K (Commission File No. 1-1169) and is incorporated herein by reference.
|
|
(10.29
|
)
|
|
Form of Restricted Share Agreement for Non-Employee Directors, as adopted on January 31, 2005, was filed on March 15, 2005 with Form 10-K (Commission File No. 1-1169) and is incorporated herein by reference.
|
|
(10.30
|
)
|
|
Form of Restricted Shares Agreement, as adopted on November 6, 2008, was filed on February 17, 2012 with Form 10-K (Commission File No. 1-1169) and is incorporated herein by reference.
|
|
(10.31
|
)
|
|
Form of Restricted Share Agreement for Non-Employee Directors, as adopted on December 8, 2011, was filed on February 17, 2012 with Form 10-K (Commission File No. 1-1169) and is incorporated herein by reference.
|
|
(10.32
|
)
|
|
Form of Restricted Share Agreement for Non-Employee Directors (ratable vesting over five years), as adopted on August 12, 2015, was filed on February 24, 2016 with Form 10-K (Commission File No. 1-1169) and is incorporated herein by reference.
|
|
(10.33
|
)
|
|
Form of Restricted Share Agreement for Non-Employee Directors (one year vesting), as adopted on February 12, 2015, is attached hereto as Exhibit 10.4.
|
|
(10.34
|
)
|
|
Form of Restricted Share Agreement for Non-Employee Directors (one year vesting), as adopted on February 12, 2015, was filed on February 24, 2016 with Form 10-K (Commission File No. 1-1169) and is incorporated herein by reference.
|
|
(10.35
|
)
|
|
Form of Performance Shares Agreement was filed on February 11, 2010 with Form 8-K (Commission File No. 1-1169) and is incorporated herein by reference.
|
|
(10.36
|
)
|
|
Form of Deferred Shares Agreement, as adopted on February 2, 2009, was filed on February 17, 2012 with Form 10-K (Commission File No. 1-1169) and is incorporated herein by reference.
|
|
(10.37
|
)
|
|
Form of Deferred Shares Agreement entered into with employees after January 1, 2012, as adopted on December 8, 2011, was filed on February 17, 2012 with Form 10-K (Commission File No. 1-1169) and is incorporated herein by reference.
|
|
(10.38
|
)
|
Form of Deferred Shares Agreement (five year cliff vesting) entered into with employees after August 12, 2015, as adopted on August 12, 2015, was filed on February 24, 2016 with Form 10-K (Commission File No. 1-1169) and is incorporated herein by reference.
|
|
|
(10.39
|
)
|
Form of Deferred Shares Agreement (three year cliff vesting) entered into with employees after November 12, 2015, as adopted on November 12, 2015, was filed on February 24, 2016 with Form 10-K (Commission File No. 1-1169) and is incorporated herein by reference.
|
|
|
(10.40
|
)
|
Form of Performance-Based Restricted Stock Unit Agreement entered into with key employees was filed on May 2, 2012 with Form 10-Q (Commission File No. 1-1169) and is incorporated herein by reference.
|
|
|
(10.41
|
)
|
Form of Time-Based Restricted Stock Unit Agreement entered into with key employees was filed on May 2, 2012 with Form 10-Q (Commission File No. 1-1169) and is incorporated herein by reference.
|
|
|
(10.42
|
)
|
Form of Time-Based Restricted Stock Unit Agreement (Cliff Vesting) entered into with key employees was filed on February 28, 2014 with Form 10-K (Commission File No. 1-1169) and is incorporated herein by reference.
|
|
|
(10.43
|
)
|
Form of Associate Non-Compete Agreement entered into with key employees was filed on December 3, 2012 with Form 10-Q/A (Commission File No. 1-1169) and is incorporated herein by reference.
|
|
108
|
Listing of Exhibits (continued)
|
|||
|
(12
|
)
|
|
Computation of Ratio of Earnings to Fixed Charges.
|
|
(21
|
)
|
|
A list of subsidiaries of the Registrant.
|
|
(23
|
)
|
|
Consent of Independent Registered Public Accounting Firm.
|
|
(24
|
)
|
|
Power of Attorney.
|
|
(31.1
|
)
|
|
Principal Executive Officer's Certifications pursuant to Section 302 of the Sarbanes-Oxley Act of 2002.
|
|
(31.2
|
)
|
|
Principal Financial Officer's Certifications pursuant to Section 302 of the Sarbanes-Oxley Act of 2002.
|
|
(32
|
)
|
|
Certification pursuant to 18 U.S.C. Section 1350, as adopted pursuant to Section 906 of the Sarbanes-Oxley Act of 2002.
|
|
(101
|
)
|
|
Financial statements from the Annual Report on Form 10-K of The Timken Company for the year ended December 31, 2016, formatted in XBRL: (i) the Consolidated Statements of Income, (ii) the Consolidated Statements of Comprehensive Income (iii) the Consolidated Balance Sheets, (iv) the Consolidated Statements of Cash Flows, (v) the Consolidated Statements of Shareholders' Equity and (vi) the Notes to the Consolidated Financial Statements.
|
109
SIGNATURES
Pursuant to the requirements of Section 13 or 15(d) of the Securities Exchange Act of 1934, the Company has duly caused this report to be signed on its behalf by the undersigned, thereunto duly authorized.
THE TIMKEN COMPANY
|
By: /s/ Richard G. Kyle
|
|
By: /s/ Philip D. Fracassa
|
|
Richard G. Kyle
|
|
Philip D. Fracassa
|
|
President, Chief Executive Officer and Director
|
|
Executive Vice President and Chief Financial Officer
|
|
(Principal Executive Officer)
|
|
(Principal Financial Officer)
|
|
Date: February 21, 2017
|
|
Date: February 21, 2017
|
|
|
||
|
|
By: /s/ Shelly M. Chadwick
|
|
|
|
Shelly M. Chadwick
|
|
|
|
Vice President - Finance and Chief
Accounting Officer |
|
|
|
(Principal Accounting Officer)
|
|
|
|
Date: February 21, 2017
|
|
Pursuant to the requirements of the Securities Exchange Act of 1934, this report has been signed by the following persons on behalf of the registrant and in the capacities and on the dates indicated.
|
By: /s/ Maria A. Crowe *
|
|
By: /s/ Joseph W. Ralston *
|
|
Maria A. Crowe, Director
|
|
Joseph W. Ralston, Director
|
|
Date: February 21, 2017
|
|
Date: February 21, 2017
|
|
|
||
|
By: /s/ Richard G. Kyle *
|
|
By: /s/ Frank C. Sullivan *
|
|
Richard G. Kyle, Director
|
|
Frank C. Sullivan, Director
|
|
Date: February 21, 2017
|
|
Date: February 21, 2017
|
|
|
||
|
By: /s/ John A. Luke, Jr.*
|
|
By: /s/ John M. Timken, Jr.*
|
|
John A. Luke, Jr., Director
|
|
John M. Timken, Jr., Director
|
|
Date: February 21, 2017
|
|
Date: February 21, 2017
|
|
By: /s/ Christopher L. Mapes*
|
By: /s/ Ward J. Timken, Jr.*
|
|
|
Christopher L. Mapes, Director
|
|
Ward J. Timken, Jr., Director
|
|
Date: February 21, 2017
|
Date: February 21, 2017
|
|
|
By: /s/ James F. Palmer*
|
By: /s/ Jacqueline F. Woods *
|
|
|
James F. Palmer, Director
|
Jacqueline F. Woods, Director
|
|
|
Date: February 21, 2017
|
Date: February 21, 2017
|
|
|
By: /s/ Ajita G. Rajendra*
|
|
* By: /s/ Philip D. Fracassa
|
|
Ajita G. Rajendra, Director
|
|
Philip D. Fracassa, attorney-in-fact
|
|
Date: February 21, 2017
|
|
By authority of Power of Attorney
|
|
filed as Exhibit 24 hereto
|
||
|
|
Date: February 21, 2017
|
|
110
The Timken Company and Subsidiaries
|
Allowance for uncollectible accounts:
|
2016
|
2015
|
2014
|
||||||
|
Balance at beginning of period
|
$
|
|
|
$
|
|
|
$
|
|
|
|
Additions:
|
|||||||||
|
Charged to costs and expenses
(1)
|
|
|
|
|
|
|
|||
|
Charged to other accounts
(2)
|
|
|
|
|
(
|
)
|
|||
|
Deductions
(3)
|
|
|
|
|
(
|
)
|
|||
|
Balance at end of period
|
$
|
|
|
$
|
|
|
$
|
|
|
|
Allowance for surplus and obsolete inventory:
|
2016
|
2015
|
2014
|
||||||
|
Balance at beginning of period
|
$
|
|
|
$
|
|
|
$
|
|
|
|
Additions:
|
|||||||||
|
Charged to costs and expenses
(4)
|
|
|
|
|
|
|
|||
|
Charged to other accounts
(2)
|
|
|
|
|
(
|
)
|
|||
|
Deductions
(5)
|
|
|
|
|
|
|
|||
|
Balance at end of period
|
$
|
|
|
$
|
|
|
$
|
|
|
|
Valuation allowance on deferred tax assets:
|
2016
|
2015
|
2014
|
||||||
|
Balance at beginning of period
|
$
|
|
|
$
|
|
|
$
|
|
|
|
Additions
|
|||||||||
|
Charged to costs and expenses
(6)
|
|
|
|
|
|
|
|||
|
Charged to other accounts
(7)
|
|
|
(
|
)
|
(
|
)
|
|||
|
Deductions
(8)
|
|
|
|
|
|
|
|||
|
Balance at end of period
|
$
|
|
|
$
|
|
|
$
|
|
|
|
(1)
|
|
|
(2)
|
|
|
(3)
|
|
|
(4)
|
|
|
(5)
|
|
|
(6)
|
|
|
(7)
|
|
|
(8)
|
|
111
TABLE OF CONTENTS
Part IItem 1. BusinessNote 16 - Segment InformationItem 1A. Risk FactorsItem 1B. Unresolved Staff CommentsItem 2. PropertiesItem 3. Legal ProceedingsItem 4. Mine Safety DisclosuresItem 4A. Executive Officers Of The RegistrantPart IIItem 5. Market For Registrant S Common Equity, Related Stockholder Matters and Issuer Purchases Of Equity SecuritiesItem 5. Market For Registrant S Common Equity, Related Stockholder Matters and Issuer Purchases Of Equity Securities (continued)Item 6. Selected Financial DataItem 7. Management S Discussion and Analysis Of Financial Condition and Results Of OperationsNote 21 - Continued Dumping and Subsidy Offset ActNote 17 - Income TaxesNote 8 - Property, Plant and EquipmentNote 14 - Retirement Benefit PlansNote 10 - Financing ArrangementsNote 15 - Postretirement Benefit PlansNote 11 - ContingenciesNote 1 - Significant Accounting PoliciesNote 9 - Goodwill and Other Intangible AssetsItem 7A. Quantitative and Qualitative Disclosures About Market RiskItem 8. Financial Statements and Supplementary DataNote 1 Significant Accounting Policies (continued)Note 18 - Fair ValueNote 2 - Discontinued OperationsNote 3 - Acquisitions and DivestituresNote 3 Acquisitions and Divestitures (continued)Note 4 - Investment in Joint VentureNote 5 - Earnings Per ShareNote 6 - Accumulated Other Comprehensive Income (loss)Note 7 - InventoriesNote 9 Goodwill and Other Intangible Assets (continued)Note 10 Financing Arrangements (continued)Note 12 - Impairment and Restructuring ChargesNote 12 Impairment and Restructuring Charges (continued)Note 13 - Stock Compensation PlansNote 13 - Stock Compensation Plans (continued)Note 14 - Retirement Benefit Plans (continued)Note 15 - Postretirement Benefit Plans (continued)Note 16 - Segment Information (continued)Note 17 - Income Taxes (continued)Note 18 - Fair Value (continued)Note 19 - Derivative Instruments and Hedging ActivitiesNote 19 - Derivative Instruments and Hedging Activities (continued)Note 20 - Research and DevelopmentNote 22 - Quarterly Financial DataNote 22 - Quarterly Financial Data (continued)Item 9. Changes in and Disagreements with Accountants on Accounting and Financial DisclosureItem 9A. Controls and ProceduresItem 9B. Other InformationPart IIIItem 10. Directors, Executive Officers and Corporate GovernanceItem 11. Executive CompensationItem 12. Security Ownership Of Certain Beneficial Owners and Management and Related Shareholder MattersItem 13. Certain Relationships and Related Transactions, and Director IndependenceItem 14. Principal Accountant Fees and ServicesPart IVItem 15. Exhibits and Financial Statement Schedules