T-MOBILE US, INC.
10-Ks and 10-Qs
|
|
|
|
|
|
|
|
|
|
|
|
|
|
|
|
|
|
|
|
|
|
|
|
|
|
|
|
|
|
|
|
|
|
|
|
|
|
|
|
|
|
|
|
|
|
|
|
|
|
|
|
|
|
|
|
UNITED STATES
SECURITIES AND EXCHANGE COMMISSION
Washington, D.C. 20549
FORM 10-K
|
x
|
ANNUAL REPORT PURSUANT TO SECTION 13 OR 15(d) OF THE SECURITIES EXCHANGE ACT OF 1934
|
For the fiscal year ended
December 31, 2014
or
|
¨
|
TRANSITION REPORT PURSUANT TO SECTION 13 OR 15(d) OF THE SECURITIES EXCHANGE ACT OF 1934
|
For the transition period from to
Commission File Number: 1-33409

T-MOBILE US, INC.
|
DELAWARE
|
20-0836269
|
|
|
(State of incorporation)
|
(I.R.S. Employer Identification No.)
|
|
|
12920 SE 38th Street, Bellevue, Washington
|
|
98006-1350
|
|
(Address of principal executive offices)
|
|
(Zip Code)
|
|
(425) 378-4000
|
||
|
(Registrant’s telephone number, including area code)
|
||
|
Securities registered pursuant to Section 12(b) of the Act:
|
||
|
Title of Each Class
|
|
Name of Each Exchange on Which Registered
|
|
Common Stock, $0.00001 par value per share
|
NYSE
|
|
|
5.50% Mandatory Convertible Preferred Stock, Series A, $0.00001 par value per share
|
NYSE
|
|
|
Securities registered pursuant to Section 12(g) of the Act:
|
||
|
None.
|
||
Indicate by check mark if the registrant is a well-known seasoned issuer, as defined in Rule 405 of the Securities Act. Yes
x
No
¨
Indicate by check mark if the registrant is not required to file reports pursuant to Section 13 or Section 15(d) of the Act. Yes
¨
No
x
Indicate by check mark whether the registrant (1) has filed all reports required to be filed by Section 13 or 15(d) of the Securities Exchange Act of 1934 during the preceding 12 months (or for such shorter period that the registrant was required to file such reports), and (2) has been subject to such filing requirements for the past 90 days. Yes
x
No
¨
Indicate by check mark whether the registrant has submitted electronically and posted on its corporate Web site, if any, every Interactive Data File required to be submitted and posted pursuant to Rule 405 of Regulation S-T (§ 232.405 of this chapter) during the preceding 12 months (or for such shorter period that the registrant was required to submit and post such files). Yes
x
No
¨
Indicate by check mark if disclosure of delinquent filers pursuant to Item 405 of Regulation S-K (§ 229.405 of this chapter) is not contained herein, and will not be contained, to the best of registrant’s knowledge, in definitive proxy or information statements incorporated by reference in Part III of this Form 10-K or any amendment to this Form 10-K.
x
Indicate by check mark whether the registrant is a large accelerated filer, an accelerated filer, a non-accelerated filer, or a smaller reporting company. See the definitions of “large accelerated filer,” “accelerated filer” and “smaller reporting company” in Rule 12b-2 of the Exchange Act.
Large accelerated filer
x
Accelerated filer
¨
Non-accelerated filer
¨
(Do not check if a smaller reporting company) Smaller reporting company
¨
Indicate by check mark whether the registrant is a shell company (as defined in Rule 12b-2 of the Act). Yes
¨
No
x
As of
June 30, 2014
, the aggregate market value of the registrant’s common stock held by non-affiliates of the registrant was
$9.1 billion
based on the closing sale price as reported on the NYSE. As of
February 17, 2015
, there were
807,778,654
shares of common stock outstanding.
DOCUMENTS INCORPORATED BY REFERENCE
Part III of this Annual Report on Form 10-K incorporates by reference certain portions of the definitive Proxy Statement for the registrant’s Annual Meeting of Stockholders, which definitive Proxy Statement shall be filed with the Securities and Exchange Commission within 120 days after the end of the fiscal year to which this Report relates.
T-Mobile US, Inc.
Form 10-K
For the Year Ended
December 31, 2014
Table of Contents
2
Cautionary Statement Regarding Forward-Looking Statements
This Annual Report on
Form 10-K
(“
Form 10-K
”) includes forward-looking statements within the meaning of the Private Securities Litigation Reform Act of 1995. All statements, other than statements of historical fact, including information concerning our future results of operations, are forward-looking statements. These forward-looking statements are generally identified by the words “anticipate,” “believe,” “estimate,” “expect,” “intend” or similar expressions. Forward-looking statements are based on current expectations and assumptions, which are subject to risks and uncertainties and may cause actual results to differ materially from the forward-looking statements. The following important factors, along with the Risk Factors included in Part I, Item 1A of this
Form 10-K
, could affect future results and cause those results to differ materially from those expressed in the forward-looking statements:
|
•
|
adverse conditions in the United States (“U.S.”) and international economies or disruptions to the credit and financial markets;
|
|
•
|
competition in the wireless services market;
|
|
•
|
the ability to complete and realize expected synergies and other benefits of acquisitions;
|
|
•
|
the inability to implement our business strategies or ability to fund our wireless operations, including payment for additional spectrum, network upgrades, and technological advancements;
|
|
•
|
the ability to renew our spectrum licenses on attractive terms or acquire new spectrum licenses;
|
|
•
|
the ability to manage growth in wireless data services, including network quality and acquisition of adequate spectrum licenses at reasonable costs and terms;
|
|
•
|
material changes in available technology;
|
|
•
|
the timing, scope and financial impact of our deployment of advanced network and business technologies;
|
|
•
|
the impact on our networks and business from major technology equipment failures;
|
|
•
|
breaches of network or information technology security, natural disasters or terrorist attacks or existing or future litigation and any resulting financial impact not covered by insurance;
|
|
•
|
any changes in the regulatory environments in which we operate, including any increase in restrictions on the ability to operate our networks;
|
|
•
|
any disruption of our key suppliers’ provisioning of products or services;
|
|
•
|
material adverse changes in labor matters, including labor negotiations or additional organizing activity, and any resulting financial and/or operational impact;
|
|
•
|
changes in accounting assumptions that regulatory agencies, including the Securities and Exchange Commission (“SEC”), may require or that result from changes in the accounting rules or their application, which could result in an impact on earnings; and,
|
|
•
|
changes in tax laws, regulations and existing standards and the resolution of disputes with any taxing jurisdictions.
|
Given these risks and uncertainties, readers are cautioned not to place undue reliance on such forward-looking statements. We undertake no obligation to revise or publicly release the results of any revision to these forward-looking statements, except as required by law. In this
Form 10-K
, unless the context indicates otherwise, references to “T-Mobile,” “T-Mobile US,” “our Company,” “the Company,” “we,” “our,” and “us” refer to T-Mobile US, Inc., a Delaware corporation, and its wholly-owned subsidiaries.
Business Overview
We are the Un-carrier™. Un-satisfied with the status quo. Un-afraid to innovate. T-Mobile is the fastest growing wireless company in the U.S., based on customer growth in 2014, currently providing wireless communications services, including voice, messaging and data, to over
55 million
customers in the postpaid, prepaid, and wholesale markets. The Un-carrier proposition is an approach that seeks to listen to the customer, address their pain points, bring innovation to the industry, and improve the wireless experience for all. In practice, this means offering customers a great service on a nationwide 4G Long-Term Evolution (“LTE”) network, devices when and how they want them, and plans that are simple, affordable and without unnecessary restrictions. Going forward, we will continue to listen and respond to our customers, refine and improve the Un-carrier proposition, and deliver the best value experience in the industry.
3
History
T-Mobile USA, Inc. (“T-Mobile USA”) was formed in 1994 as VoiceStream Wireless PCS (“VoiceStream”), a subsidiary of Western Wireless Corporation (“Western Wireless”). VoiceStream was spun off from Western Wireless in 1999, acquired by Deutsche Telekom AG (“Deutsche Telekom”) in 2001 and renamed T-Mobile USA, Inc. in 2002.
T-Mobile US, Inc. was formed in 2013 through the business combination between T-Mobile USA and MetroPCS Communications, Inc. (“MetroPCS”). Under the terms of the business combination with MetroPCS, Deutsche Telekom received shares of common stock representing a majority ownership interest in the combined company in exchange for its transfer of all of T-Mobile USA’s common stock. The business combination aimed to provide us with expanded scale, spectrum, and financial resources to compete aggressively with other, larger U.S. wireless communication providers. The business combination was accounted for as a reverse acquisition with T-Mobile USA as the accounting acquirer. Accordingly, T-Mobile USA’s historical financial statements became the historical financial statements of the combined company. See
Note 2 – Business Combination with MetroPCS
of the
Notes to the Consolidated Financial Statements
included in
Part II, Item 8
of this
Form 10-K
for further information regarding the business combination.
Business Strategy
We generate revenue by offering affordable wireless communication services to our postpaid, prepaid and wholesale customers, as well as a wide selection of wireless devices and accessories. We provide service, devices and accessories across our flagship brands, T-Mobile and MetroPCS, through our owned and operated retail stores, third party distributors and our websites (www.T-Mobile.com and www.MetroPCS.com). The information on our websites is not part of this
Form 10-K
. Our most significant expenses are related to acquiring and retaining high-quality customers, compensating employees, and operating and expanding our network.
We continue to aggressively pursue our strategy, which includes the following elements:
Un-carrier Value Proposition
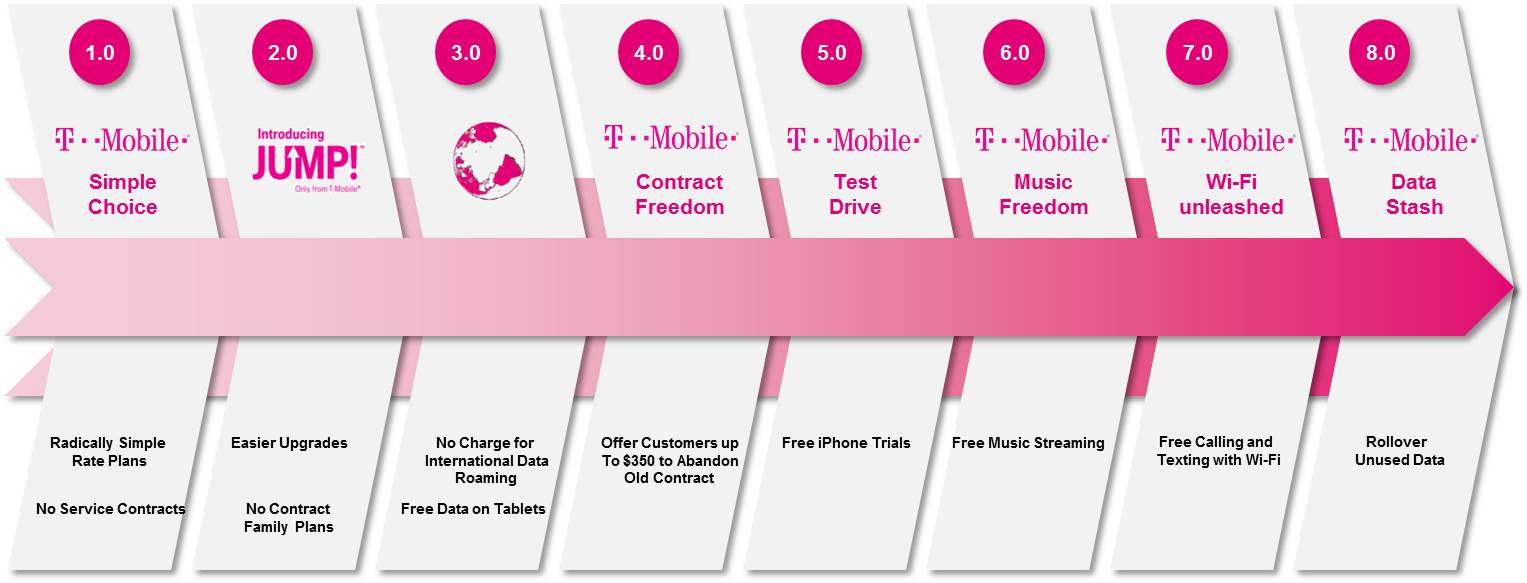
We introduced our Un-carrier proposition with the objective of eliminating customer pain points from the unnecessary complexity of the wireless communication industry. We believe Un-carrier phases 1.0 through 8.0 have been successful as evidenced by our strong customer growth since the launch of the Un-carrier proposition in 2013. We provided service to over
55 million
customers as of
December 31, 2014
, compared to
47 million
as of
December 31, 2013
.
Phases 1.0 through 8.0 of our Un-carrier proposition are described below:
|
•
|
Unlimited Data, No Annual Service Contract
– In March 2013, we introduced Simple Choice™ plans, which eliminated annual service contracts and provided customers with affordable rate plans. Customers on Simple Choice plans can purchase the most popular smartphones and if qualified, pay for them with a low out-of-pocket payment and 24 affordable interest-free monthly installments.
|
4
|
•
|
JUMP!
– In July 2013, we announced Just Upgrade My Phone (“JUMP!™”) as phase 2.0, which allows participating customers to upgrade their eligible device when they want and not when they are told. In addition, participants benefit from handset insurance and extended warranty protection, protecting them from lost, stolen and damaged devices.
|
|
•
|
International Roaming and Tablets Un-leashed
– In October 2013, we unveiled phase 3.0, which provides our Simple Choice customers reduced United States to international calling rates, and messaging and data roaming while traveling abroad in over 100 countries at no extra cost with Simple Global™. In November 2013, we launched part 2 of phase 3.0, allowing every T-Mobile tablet user to use up to 200 MB of free LTE data every month for as long as they own their tablet and use it on our network, even if they are not yet a T-Mobile mobile internet customer.
|
|
•
|
Contract Freedom
– In January 2014, we announced phase 4.0, which eliminated one of the last remaining obstacles for customers wanting to switch from other carriers to T-Mobile by offering to reimburse customers’ early termination fees (“ETF”) when they switch from other carriers and trade in their eligible device.
|
|
•
|
Test Drive
– In June 2014, we released phase 5.0, which allows consumers to test our network using an Apple
®
iPhone
®
5s with unlimited nationwide service for seven days at no charge.
|
|
•
|
Music Freedom
– In June 2014, we introduced phase 6.0, which allows Simple Choice customers to stream music from popular music services without it counting against their high-speed data allotment. Additionally, we launched Rhapsody
®
unRadio in partnership with Rhapsody for a limited time, which allows eligible Simple Choice customers with our newest unlimited 4G data service to stream music at no additional cost. We are also offering Rhapsody unRadio at a discounted price for our eligible customers.
|
|
•
|
Wi-Fi Un-leashed
– In September 2014, we launched phase 7.0, which delivers coverage to customers in more places. With Wi-Fi Un-leashed, we provide Wi-Fi calling and texting for Simple Choice customers on capable smartphones. In addition, we unveiled the T-Mobile Personal CellSpot™, a new device which provides customers with greater coverage in their home. Finally, through a new partnership with Gogo
®
, customers with compatible devices can send and receive unlimited text, picture messages and receive visual voicemails on any Gogo-equipped U.S.-based flight for free.
|
|
•
|
Data Stash
– In December 2014, we introduced phase 8.0, giving customers the ability to roll their unused high-speed data automatically each month into a personal Data Stash™ so they can use it when they need it for up to a year. Starting in January 2015, Data Stash became available at no extra charge to every T-Mobile customer with a postpaid Simple Choice plan who has purchased additional LTE data, 3GB or more for smartphones and 1 GB or more for tablets. In addition, beginning in January 2015, we will provide a one-time Free Data Stash to start with of 10 GB of LTE data to all qualifying customers, which will expire at the end of 2015.
|
Network Modernization and Expansion
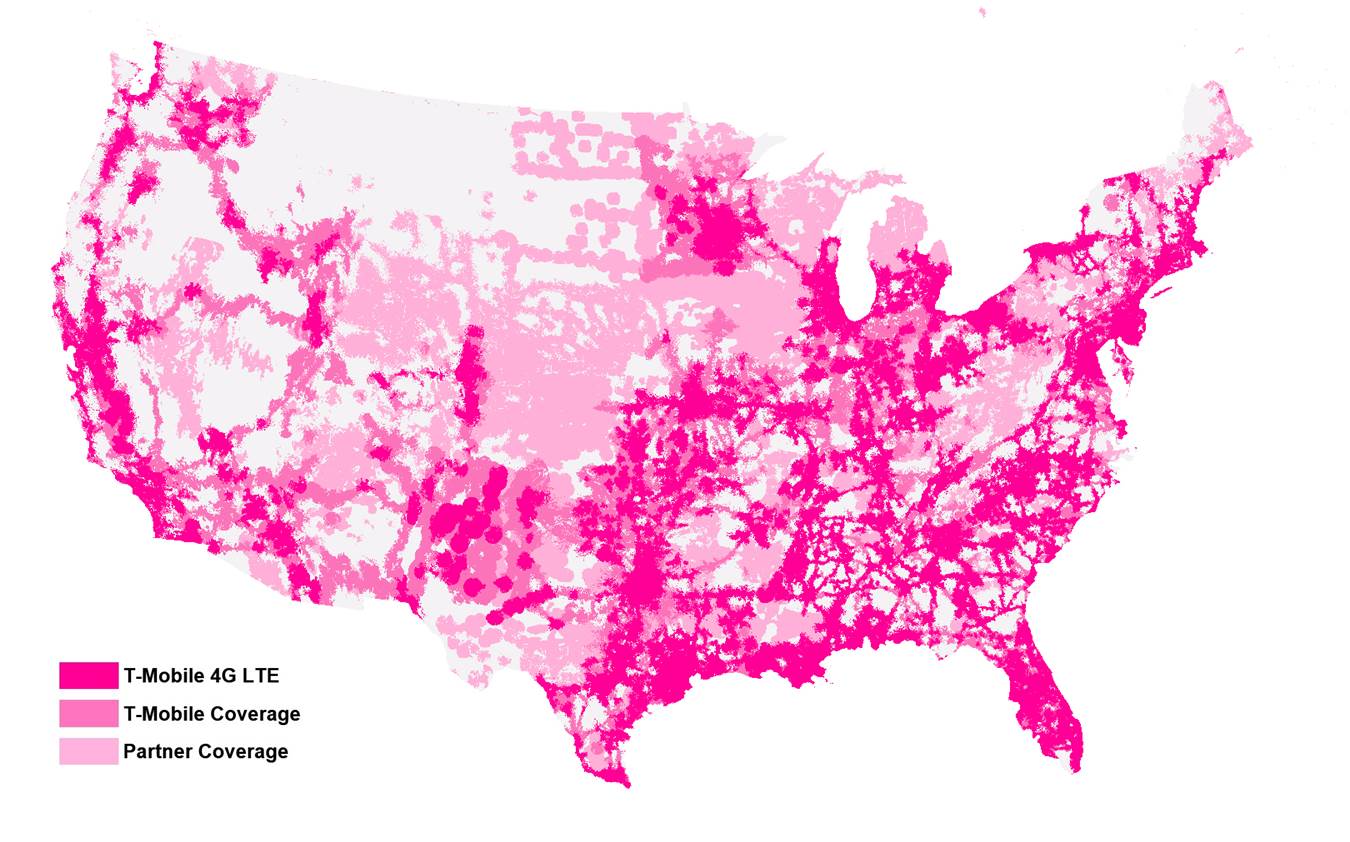
We have substantially completed the process of upgrading our network to LTE, which provides our customers with the fastest nationwide LTE services. Our LTE network covered
265 million
people as of
December 31, 2014
, compared to more than 200 million people as of
December 31, 2013
. This surpassed our year-end goal of covering 250 million people with the fastest nationwide LTE network. We are targeting
300 million
people with LTE by the end of 2015. In addition, we are currently in the process of building out our network to utilize our recently acquired 700 MHz A-Block spectrum licenses, which will boost network reach, improve in-building coverage and extend coverage to more areas.
5
Below is a map showing our coverage, including LTE, in the U.S.:
In addition, we were the first U.S. carrier to introduce Voice over LTE (“VoLTE”) on a nationwide basis. Further, the migration of customers from the MetroPCS brand legacy Code Division Multiple Access (“CDMA”) network onto T-Mobile’s LTE and Evolved High Speed Packet Access Plus (“HSPA+”) network continues to be ahead of schedule, providing faster network performance for MetroPCS customers with compatible handsets.
In 2014, we completed transactions for the acquisition of 700 MHz A-Block, Advanced Wireless Service (“AWS”) and Personal Communications Service (“PCS”) spectrum licenses, primarily from Verizon Communications, Inc. (“Verizon”), for cash and the exchange of certain AWS and PCS spectrum licenses. In addition, in 2014, we entered into transactions, which are expected to close in 2015, with various other companies to acquire additional 700 MHz A-Block, AWS and PCS spectrum licenses, which covers more than
40 million
people, for cash and the exchange of certain AWS and PCS spectrum licenses. The transactions are subject to regulatory approval and other customary closing conditions. Upon closing of these pending transactions, we will own 700 MHz A-Block spectrum covering
190 million
people. In
January 2015
, the Federal Communications Commission (“FCC”) announced T-Mobile was the winning bidder of AWS spectrum licenses covering approximately
97 million
people for an aggregate bid price of
$1.8 billion
. T-Mobile expects to receive the AWS spectrum licenses, subject to regulatory approval, in the
second quarter of 2015
.
Customer Experience
The success of our Un-carrier proposition and continued modernization of the network has further repositioned T-Mobile as a provider of dependable high-speed LTE service with a full range of desirable devices and provides our customers with an unrivaled customer experience. We have continued to focus on retaining customers through churn reduction initiatives to improve customer experience. Branded postpaid phone churn improved to
1.58%
in
2014
, compared to
1.69%
in
2013
and
2.33%
in
2012
. These results reinforce our position as an organization with a strong focus and commitment to providing an outstanding customer experience whether customers call in, come in to our stores, or access our website.
Aligned Cost Structure
We continue to pursue a low-cost business operating model to drive cost savings, which can then be reinvested in the business. These cost-reduction programs are on-going as we continue to simplify our business and drive operational efficiencies and cost savings in areas, such as network optimization, customer roaming, customer service and improved customer collection rates.
6
We expect the business combination with MetroPCS to deliver at least
$1.5 billion
in annual run-rate synergies in operating and capital expenditures by
2016
. A portion of these savings have been, and will continue to be, reinvested into growth of our business.
Customers
T-Mobile provides wireless communication services to three primary categories of customers: branded postpaid, branded prepaid and wholesale. Branded postpaid customers generally include customers that are qualified to pay after incurring wireless communication service. Branded prepaid customers generally include customers who pay in advance. Our branded prepaid customers include customers of the T-Mobile, MetroPCS and certain partner brands. Wholesale customers, which include Machine-to-Machine (“M2M”) and Mobile Virtual Network Operators (“MVNO”), operate on the T-Mobile network, but are managed by wholesale partners.
We generate the majority of our service revenues by providing wireless communication services to branded postpaid customers. In
2014
,
64%
of our service revenues were generated by providing wireless communication services to branded postpaid customers, compared to
31%
from branded prepaid customers and
5%
from wholesale customers, roaming and other services. Therefore, our ability to acquire and retain branded postpaid customers is important to our business in the generation of service revenues, equipment sales and other revenues. Our branded postpaid net customer additions were
4.9 million
in
2014
, compared to
2.0 million
in
2013
. Growth in our branded postpaid customer additions resulted primarily from strong customer response to our network modernization, Un-carrier proposition and promotions for services and devices.
Services and Products
T-Mobile provides wireless communication services through a variety of service plan options. We also offer a wide selection of wireless devices, including smartphones, tablets and other mobile communication devices, which are manufactured by various suppliers. Services, devices and accessories are offered directly to consumers through our owned and operated retail stores, as well as through our websites. In addition, we sell devices and accessories to dealers and other third party distributors for resale through independent third-party retail outlets and a variety of third-party websites.
Service plan options include our Value and Simple Choice (“Simple Choice”) plans, which allow customers to subscribe for wireless services separately from the purchase of a handset. We introduced our Simple Choice plans as part of phase 1.0 of our Un-carrier proposition in 2013, which eliminated annual service contracts and simplified the lineup of consumer rate plans to one affordable plan for unlimited voice and messaging services with the option to add data services. Depending on their credit profile, customers are qualified either for postpaid or prepaid service. As part of the ongoing movement towards simplifying the business, we continued to drive the penetration of Simple Choice plans within our base. The proportion of branded postpaid customers on Simple Choice plans was
89%
as of
December 31, 2014
, up from
69%
as of
December 31, 2013
.
Customers on our Simple Choice, benefit from reduced monthly service charges and can choose whether to use their own compatible handset on our network or purchase a handset from us or one of our dealers. Depending on their credit profile, qualifying customers who purchase a device from us have the option of financing all or a portion of the purchase price at the time of sale over an installment period using our Equipment Installment Plan (“EIP”). In addition, qualifying customers who finance their initial handset device with an EIP can enroll in JUMP! to later upgrade their device. Upon qualifying JUMP! program upgrades, the customers’ remaining EIP balance is settled provided they trade in their used handset at the time of upgrade in good working condition and purchase a new handset from us on a new EIP. Our Simple Choice plans result in increased equipment revenue for each handset sold compared to traditional bundled price plans that typically offer a significant handset discount but involve higher monthly service charges.
Network
Our nationwide network covers all major metropolitan areas and approximately
90%
of people in the U.S., excluding roaming coverage. Over the last two years, we have continued to build out our network to be Data Strong™, meaning we have the most dense network in the nation, with more cell sites per customer than any other nationwide wireless communication provider, and we have concentrated our cell sites where our customers need data most.
We provide mobile communication services utilizing low-band spectrum licenses, consisting of 700 MHz A-Block, and mid-band spectrum licenses, such as AWS and PCS. We had an average of approximately
82
MHz of spectrum in the top 25 major metropolitan areas as of
December 31, 2014
. This is compared to an average of approximately 77 MHz of spectrum in the top 25 major metropolitan areas as of December 31, 2013. Over the last year, we have entered into various agreements for the acquisition of 700 MHz A-Block, AWS and PCS spectrum licenses. In addition, we will seek to opportunistically acquire
7
additional spectrum in private party transactions and government auctions to further enhance our portfolio of U.S. nationwide broadband spectrum.
We provide wireless communication services through a number of technologies, including LTE, HSPA+, Universal Mobile Telecommunications Systems (“UMTS”), General Packet Radio Service (“GPRS”), Enhanced Data rates for GSM Evolution (“EDGE”), Global System for Mobile Communications (“GSM”) and CDMA. We have substantially completed the process of upgrading our network to LTE using our mid-band spectrum licenses, which offers our customers faster data transfer speeds, greater connectivity and increased coverage. Not only does our network offer the fastest nationwide LTE network and the most consistent LTE speeds based on download speed, it currently has more capacity per customer than any other nationwide communications provider. In addition to expanding our LTE coverage, we are enhancing our network through an aggressive deployment of Wideband LTE of at least 15x15 MHz, which delivers faster LTE speeds. We have deployed Wideband LTE in
121
metropolitan areas as of December 31, 2014 and expect Wideband LTE to be available in
150
metropolitan areas by the end of 2015. We have also begun to launch low-band LTE using our recently acquired 700 MHz A-Block spectrum licenses. We offered five devices capable of using low-band LTE in 2014 and are working with our device partners to ensure all new LTE devices that launch in 2015 will be low-band capable. As part of the integration following the business combination, we are in the process of decommissioning the MetroPCS CDMA network and redundant cell sites, while also integrating select MetroPCS assets in certain metropolitan areas into the overall network. We have moved more than 70% of the MetroPCS spectrum licenses onto the T-Mobile network to provide faster LTE performance in many key markets. Upon completion of the migration of the MetroPCS customer base, we expect to have approximately 61,000 equivalent cell sites, including macro sites and certain distributed antenna system (“DAS”) network nodes from the MetroPCS network.
Distribution
We had approximately 62,000 total points of distribution, including approximately 10,000 T-Mobile and MetroPCS branded locations and 52,000 third-party and national retailer locations, as well as distribution through our websites, as of
December 31, 2014
. We had approximately 70,000 points of distribution as of
December 31, 2013
and 61,000 as of
December 31, 2012
. Our distribution density in major metropolitan areas provides customers with the convenience of having retail and service locations close to where they live and work.
Competition
The wireless telecommunications industry is highly competitive. We are the fourth largest provider of postpaid service plans and the largest provider of prepaid service plans in the U.S. as measured by customers. Our competitors include other national carriers, such as AT&T Inc. (“AT&T”), Verizon and Sprint Corporation (“Sprint”), which offer predominantly contract-based service plans. AT&T and Verizon are significantly larger than us and may enjoy greater resources and scale advantages as compared to us. In addition, our competitors include numerous smaller regional carriers and MVNOs, such as TracFone Wireless, Inc., many of which offer no-contract, prepaid service plans. Competitors also include providers who offer similar communication services, such as voice and messaging, using alternative technologies or services. Competitive factors within the wireless telecommunications industry include pricing, market saturation, service and product offerings, customer experience, network investment and quality, development and deployment of technologies, availability of additional spectrum licenses, and regulatory changes. Some competitors have shown a willingness to use aggressive pricing as a source of differentiation. Taken together, the competitive factors we face will continue to put pressure on margins as companies compete to retain the current customer base and continue to add new customers.
Employees
As of
December 31, 2014
, we employed approximately 45,000 full-time and part-time employees, including network, retail, customer support and back office functions, of which approximately 30 employees were covered by a collective bargaining agreement, as of
December 31, 2014
.
Regulation
The FCC regulates many key aspects of our business, including licensing, construction, the operation and use of our network, modifications of our network, control and ownership of our business, the sale of certain business assets, domestic roaming arrangements and interconnection agreements, pursuant to its authority under the Communications Act of 1934, as amended (“Communications Act”). The FCC has a number of complex requirements and proceedings that affect our operations and that could increase our costs or diminish our revenues. For example, the FCC has rules regarding provision of 911 and E-911 services, porting telephone numbers, interconnection, roaming, internet openness, and the universal service and Lifeline programs. Many of these and other issues are being considered in ongoing proceedings, and we cannot predict whether or how
8
such actions will affect our business, financial condition, or results of operations. Our ability to provide services and generate revenues could be harmed by adverse regulatory action or changes to existing laws and regulations. In addition, regulation of companies that offer competing services can impact our business indirectly.
Wireless communications providers must be licensed by the FCC to provide communications services at specified spectrum frequencies within specified geographic areas and must comply with the rules and policies governing the use of the spectrum as adopted by the FCC. The FCC issues each license for a fixed period of time, typically 10 years in the case of cellular, PCS and point-to-point microwave licenses. AWS licenses have an initial term of 15 years, with successive 10-year terms thereafter. While the FCC has generally renewed licenses given to operating companies like us, the FCC has authority to both revoke a license for cause and to deny a license renewal if a renewal is not in the public interest. Furthermore, we could be subject to fines, forfeitures and other penalties for failure to comply with FCC regulations, even if any such non-compliance was unintentional. In extreme cases, penalties can include revocation of our licenses. The loss of any licenses, or any related fines or forfeitures, could adversely affect our business, results of operations and financial condition.
Additionally, Congress’ and the FCC’s allocation of additional spectrum for broadband commercial mobile radio service (“CMRS”), which includes cellular, PCS and specialized mobile radio, could significantly increase competition. We cannot assess the impact that any developments that may occur in the U.S. economy or any future spectrum allocations by the FCC may have on license values. FCC spectrum auctions and other market developments may adversely affect the market value of our licenses in the future. A significant decline in the value of our licenses could adversely affect our financial condition and results of operations. In addition, the FCC periodically reviews its policies on how to evaluate a carrier’s spectrum holdings in the context of transactions and auctions. A change in these policies could affect spectrum resources and competition among us and other carriers.
Congress and the FCC have imposed limitations on foreign ownership of CMRS licensees that exceed 20% direct ownership or 25% indirect ownership. The FCC has ruled that higher levels of indirect foreign ownership, even up to 100%, are presumptively consistent with the public interest albeit subject to review. Consistent with that established policy, the FCC has issued a declaratory ruling authorizing up to 100% ownership of our company by Deutsche Telekom. This declaratory ruling, and our licenses, are conditioned on Deutsche Telekom’s and the Company’s compliance with a network security agreement with the Department of Justice, the Federal Bureau of Investigation and the Department of Homeland Security. Failure to comply with the terms of this agreement could result in fines, injunctions and other penalties, including potential revocation of our spectrum licenses.
While the Communications Act generally preempts state and local governments from regulating the entry of, or the rates charged by, wireless communication providers, certain state and local governments regulate other terms and conditions of wireless service, including billing, termination of service arrangements and the imposition of early termination fees, advertising, network outages, the use of handsets while driving, zoning and land use. Further, the FCC and the Federal Aviation Administration regulate the siting, lighting and construction of transmitter towers and antennae. Tower siting and construction are also subject to state and local zoning, as well as federal statutes regarding environmental and historic preservation. The future costs to comply with all relevant regulations are to some extent unknown and regulations could result in higher operating expenses in the future.
Available Information
T-Mobile’s
Form 10-K
and all other reports and amendments filed with or furnished to the SEC, are publicly available free of charge on the Investor Relations section of our website at investor.t-mobile.com or at www.sec.gov as soon as reasonably practicable after these materials are filed with or furnished to the SEC. Our corporate governance guidelines, code of business conduct, code of ethics for senior financial officers and charters for the audit, compensation, nominating and corporate governance and executive committees of our board of directors are also posted on the Investor Relations section of T-Mobile’s website at investor.t-mobile.com. The information on our websites is not part of this or any other report T-Mobile files with, or furnishes to, the SEC.
Investors and others should note we announce material financial and operational information to our investors using our investor relations website, press releases, SEC filings and public conference calls and webcasts. T-Mobile intends to also use @TMobileIR (https://twitter.com/TMobileIR) and @JohnLegere (https://twitter.com/JohnLegere), which Mr. Legere also uses as a means for personal communications and observations, as a means of disclosing information about the Company, its services and other matters and for complying with its disclosure obligations under Regulation FD. The information we post through these social media channels may be deemed material. Accordingly, investors should monitor these social media channels in addition to following the Company’s press releases, SEC filings, public conference calls and webcasts. The social
9
media channels T-Mobile intends to use as a means of disclosing the information described above may be updated from time to time as listed on the Company’s investor relations website.
In addition to the other information contained in this Form 10-K, the following risk factors should be considered carefully in evaluating T-Mobile. Our business, financial condition, liquidity, or results of operations could be materially adversely affected by any of these risks.
Risks Related to Our Business and the Wireless Industry
The scarcity and cost of additional wireless spectrum, and regulations relating to spectrum use, may adversely affect our business strategy and financial planning.
We will need to acquire additional spectrum in order to continue our customer growth, expand into new metropolitan areas, maintain our quality of service, meet increasing customer demands, and deploy new technologies. We will be at a competitive disadvantage and possibly experience erosion in the quality of service in certain markets if we fail to gain access to necessary spectrum before reaching capacity, especially below 1 GHz - low band spectrum.
The continued interest in, and aggregation of, spectrum by the largest national carriers may reduce our ability to acquire spectrum from other carriers or otherwise negatively impact our ability to gain access to spectrum through other means. As a result, we may need to acquire spectrum through government auctions and/or enter into spectrum sharing arrangements, which are subject to certain risks and uncertainties. For example, the FCC has encountered resistance to its plans to make additional spectrum available, which has created uncertainty about the timing and availability of spectrum through government auctions.
In addition, the FCC may impose conditions on the use of new wireless broadband mobile spectrum, including new restrictions or rules governing the use or access to current or future spectrum. This could increase pressure on capacity. Additional conditions that may be imposed by the FCC include heightened build-out requirements, limited renewal rights, clearing obligations, or open access or net neutrality requirements that may make it less attractive or less economical to acquire spectrum. The FCC has a pending notice of proposed rulemaking to examine whether the current spectrum screen used in acquisitions of spectrum should be changed or whether a spectrum cap should be imposed. In addition, rules may be established for future government spectrum auctions that may negatively impact our ability to obtain spectrum economically or in appropriate configurations or coverage areas.
If we cannot acquire needed spectrum from the government or otherwise, if new competitors acquire spectrum that will allow them to provide services competitive with our services, or if we cannot deploy services on a timely basis without burdensome conditions, at adequate cost, and while maintaining network quality levels, then our ability to attract and retain customers and our associated financial performance could be materially adversely affected.
Increasing competition for wireless customers could adversely affect our operating results.
We have multiple wireless competitors in each of our service areas, some of which have greater resources than us, and compete for customers based principally on service/device offerings, price, call quality, data use experience, coverage area, and customer service. In addition, we are facing growing competition from providers offering services using alternative wireless technologies and IP-based networks, as well as traditional wireline networks. We expect market saturation to continue to cause the wireless industry’s customer growth rate to be moderate in comparison with historical growth rates or possibly negative, leading to increased competition for customers. We also expect that our customers’ growing appetite for data services will place increased demands on our network capacity. This competition and our capacity issues will continue to put pressure on pricing and margins as companies compete for potential customers. Our ability to compete will depend on, among other things, continued absolute and relative improvement in network quality and customer services, effective marketing and selling of products and services, attractive pricing, and cost management, all of which will involve significant expenses.
Joint ventures, mergers, acquisitions and strategic alliances in the wireless industry have resulted in and are expected to result in larger competitors competing for a limited number of customers. The two largest national wireless communication providers currently serve a significant percentage of all wireless customers and hold significant spectrum and other resources. Our largest competitors may be able to enter into exclusive handset, device, or content arrangements, execute pervasive advertising and marketing campaigns, or otherwise improve their cost position relative to ours. In addition, the refusal of our large competitors to provide critical access to resources and inputs, such as roaming services on reasonable terms, may improve their position within the wireless broadband mobile services industry. These factors, together with the effects of the increasing
10
aggregate penetration of wireless services in all metropolitan areas and the ability of our larger competitors to use resources to build out their networks and to quickly deploy advanced technologies, have made it more difficult for smaller carriers like us to attract and retain customers, and may adversely affect our competitive position and ability to grow, which would have a material adverse effect on our business, financial condition, and operating results.
If our efforts to maintain the privacy and security of customer, employee, supplier or other proprietary or sensitive information are not successful at preventing a regulatory investigation, significant data breach or failure of compliance, we could incur substantial additional costs, become subject to litigation and enforcement actions, and suffer reputational damage.
Our business, like that of most retailers and wireless companies, involves the receipt, storage and transmission of customers’ personal information, consumer preferences and payment card information, as well as confidential information about our employees, our suppliers and our Company (“confidential information”). Cyber-attacks such as denial of service, other malicious attacks, unauthorized access or distribution of confidential information by third parties or employees, errors by third party suppliers or other breaches of security could disrupt our internal systems and applications, impair our ability to provide services to our customers or protect the privacy and confidentiality of our confidential information. Our information systems are vulnerable to continuously evolving data breach and information security risks. Unauthorized parties may attempt to gain access to our systems or information through fraud or other means of deceiving our employees or third party service providers. Hardware, software or applications we develop, have developed on our behalf, or we obtain from third parties may contain defects in design or manufacture or other problems that could compromise information security. The methods used to obtain unauthorized access, disable or degrade service, or sabotage systems are also constantly changing and evolving, and may be difficult to anticipate or detect for long periods of time.
Although we have implemented and regularly review and update processes and procedures to protect against unauthorized access to or use of sensitive data and to prevent data loss, the ever-evolving threats require us to continually evaluate and adapt our systems and processes. We cannot assure you that our systems and processes will be adequate to safeguard against all information security breaches or misuses of data. The actions we take may not be adequate to repel a significant attack or prevent a breach, unauthorized access by third parties or employees or errors by third party suppliers. If we are subject to a significant attack or breach, unauthorized access, errors of third party suppliers or other security breaches, we may incur significant costs, be subject to regulatory investigations and sanctions and private litigation, and may suffer damage to our business reputation that negatively impacts customer confidence, any or all of which could materially adversely affect our results of operations and financial condition.
Our reputation and financial condition could be materially adversely affected by system failures, business disruptions, and unauthorized use of or interference with our network and other systems.
To be successful, we must provide our customers with reliable, trustworthy service and protect the communications, location, and personal information shared or generated by our customers. We rely upon our systems and networks, and the systems and networks of other providers and suppliers, to provide and support our services and, in some cases, to protect our customers’ and our information. Failure of our or others’ systems, networks and infrastructure may prevent us from providing reliable service, or may allow for the unauthorized use of or interference with our networks and other systems. Examples of these risks include:
|
•
|
human error such as responding to deceptive communications or unintentionally executing malicious code;
|
|
•
|
physical damage, power surges or outages, or equipment failure, including those as a result of severe weather, natural disasters, terrorist attacks, and acts of war;
|
|
•
|
theft of customer/proprietary information: intrusion and theft of data offered for sale, competitive (dis)advantage, and/or corporate extortion;
|
|
•
|
unauthorized access to our information technology, billing, customer care and provisioning systems and networks, and those of our suppliers and other providers;
|
|
•
|
supplier failures or delays; and
|
|
•
|
other systems failures or outages.
|
Such events could cause us to lose customers, lose revenue, incur expenses, suffer reputational and goodwill damages, and subject us to litigation or governmental investigation. Remediation costs could include liability for information loss, repairing infrastructure and systems, and/or costs of incentives offered to customers. Our insurance may not cover, or be adequate to fully reimburse us for, costs and losses associated with such events.
11
We rely on third-parties to provide specialized products or services for the operation of our business, and a failure or inability by such parties to provide these products or services could adversely affect our business, results of operations, and financial condition.
We depend heavily on suppliers and other third parties in order for us to efficiently operate our business. Our business is complex, and it is not unusual for multiple vendors located in multiple locations to help us to develop, maintain, and troubleshoot products and services, such as network components, software development services, and billing and customer service support. Our suppliers often provide services outside of the U.S., which carries associated additional regulatory and legal obligations. We generally rely upon the suppliers to provide contractual assurances and accurate information regarding risks associated with their provision of products or services in accordance with our expectations and standards, and they may fail to do so.
Generally, there are multiple sources for the types of products and services we purchase or use. However, we currently rely on one key supplier for billing services, a limited number of suppliers for voice and data communications transport services, network infrastructure, equipment, handsets, and other devices, and payment processing services, among other products and services we rely on. Disruptions with respect to such suppliers, or failure of such suppliers to adequately perform, could have a material adverse on our financial performance.
In the past, our suppliers, contractors and third-party retailers have not always performed at the levels we expect or at the levels required by their contracts. Our business could be severely disrupted if key suppliers, contractors, service providers, or third-party retailers fail to comply with their contracts or become unable to continue the supply due to patent or other intellectual property infringement actions, or other disruptions. Our business could also be disrupted if we experience delays or service degradation during any transition to a new outsourcing provider or other supplier, or we were required to replace the supplied products or services with those from another source, especially if the replacement became necessary on short notice. Any such disruptions could have a material adverse effect on our business, results of operations and financial condition.
We are in the process of transferring our customer billing systems from our existing third-party vendor to a new third-party vendor. Any unanticipated difficulties, disruption or significant delays could have adverse operational, financial, and reputational effects on our business.
We are in the initial stages of implementing a new customer billing system, which involves moving to a new platform through utilization of a phased deployment approach. The first release phase is scheduled for 2015. Post implementation, we plan to operate both the existing and new billing systems in parallel to aid in the transition to the new system until all phases of the conversion are complete.
If the implementation causes major system disruptions or if we fail to implement the new billing system in a timely or effective manner, customer experience may be negatively impacted, which could cause material adverse effects on our operational and financial performance. In addition, the third-party billing services vendor may experience errors, cyber-attacks or other operational disruptions that could negatively impact us and over which we may have limited control. Interruptions and/or failure of this new billing services system could disrupt our operations and impact our ability to provide or bill for our services, retain customers or attract new customers. Any occurrence of the foregoing could cause material adverse effects on our operations and financial condition, material weaknesses in our internal control over financial reporting, and reputational damage.
If we are unable to attract and retain wireless subscribers our financial performance will be impaired.
We incur capital expenditures and operating expenses in order to improve and enhance our products, services, network quality and coverage, applications, and content to remain competitive and to keep up with our customer demand. If we fail to improve and enhance our products and services or expand the capacity of, or make upgrades to, our network to remain competitive, or if we fail to maintain access to desired handsets, content and features, or otherwise keep up with customer demand, our ability to attract and retain customers would be adversely affected.
In particular, our gross new subscriber activations may decrease and our subscriber churn may increase, leaving us unable to meet the assumptions of our business plan. Even if we effectively manage the factors described above that are within our control, there can be no assurance that our existing customers will not switch to another wireless communications provider or that we will be able to attract new customers. Our business, results of operations and financial condition, could be materially adversely affected if we are unable to grow our customer base at the levels we project, or achieve the aggregate levels of customer penetration that we currently believe are possible with our business model.
12
If we are unable to take advantage of technological developments on a timely basis, then we may experience a decline in demand for our services or face challenges in implementing or evolving our business strategy.
In order to grow and remain competitive, we will need to adapt to future changes in technology, enhance our existing offerings, and introduce new offerings to address our current and potential customers’ changing demands. For example, we are in the process of transforming and upgrading our network to deploy LTE Release 10 and use multimode integrated radios that can handle GSM, HSPA+ and LTE. As part of our network upgrade program, we expect to install new GSM, HSPA+, and LTE equipment on approximately 40,000 cell sites, and GSM and LTE on approximately 12,000 cell sites. This work is planned to be substantially completed in 2015. However, enhancing our network is subject to risk from equipment changes and migration of customers from existing spectrum bands. Scheduling and supplier delays, unexpected or increased costs, technological constraints, regulatory permitting issues, subscriber dissatisfaction, and other risks could cause delays in launching new network capabilities, which could result in significant costs or reduce the anticipated benefits of the upgrades. As it relates to our current upgrade plans, these risks will be reduced as work is completed. In general, the development of new services in the wireless telecommunications industry will require us to anticipate and respond to the continuously changing demands of our customers, which we may not be able to do accurately or timely. We could experience a material adverse effect on our business, operations, financial position, and operating results if our new services fail to retain or gain acceptance in the marketplace or if costs associated with these services are higher than anticipated.
The agreements governing our indebtedness include restrictive covenants that limit our operating flexibility.
The agreements governing our indebtedness impose significant operating and financial restrictions on us. These restrictions, subject in certain cases to customary baskets, exceptions and incurrence-based ratio tests, may limit our ability to engage in some transactions, including the following:
|
•
|
incurring additional indebtedness and issuing preferred stock;
|
|
•
|
paying dividends, redeeming capital stock or making other restricted payments or investments;
|
|
•
|
selling or buying assets, properties or licenses;
|
|
•
|
developing assets, properties or licenses which we have or in the future may procure;
|
|
•
|
creating liens on assets;
|
|
•
|
participating in future FCC auctions of spectrum or private sales of spectrum;
|
|
•
|
engaging in mergers, acquisitions, business combinations, or other transactions;
|
|
•
|
entering into transactions with affiliates; and
|
|
•
|
placing restrictions on the ability of subsidiaries to pay dividends or make other payments.
|
These restrictions could limit our ability to react to changes in our operating environment or the economy. Any future indebtedness that we incur may contain similar or more restrictive covenants. Any failure to comply with the restrictions of our debt agreements may result in an event of default under these agreements, which in turn may result in defaults or acceleration of obligations under these agreements and other agreements, giving our lenders the right to terminate any commitments they had made to provide us with further funds and to require us to repay all amounts then outstanding. Any of these events would have a material adverse effect on our financial position and performance.
Our significant indebtedness could adversely affect our business, financial condition and operating results.
Our ability to make payments on our debt, to repay our existing indebtedness when due, and to fund operations and significant planned capital expenditures will depend on our ability to generate cash in the future, which is in turn subject to the operational risks described elsewhere in this section. Our debt service obligations could have material adverse effects on our operations and financial results, including by:
|
•
|
limiting our ability to borrow money, sell stock or similar equity linked securities to fund our operational, financing or strategic needs;
|
|
•
|
limiting our flexibility in planning for, or reacting to, changes in our business or the communications industry or pursuing growth opportunities;
|
|
•
|
reducing the amount of cash available for other operational or strategic needs; and
|
|
•
|
placing us at a competitive disadvantage to competitors who are less leveraged than we are.
|
In addition, the $5.6 billion in principal amount of the senior reset notes we issued to Deutsche Telekom in connection with the business combination between T-Mobile and MetroPCS bears interest at rates which will be reset at dates between April 2015 and April 2016. If the resets result in interest rate increases, debt service requirements will increase, which could adversely affect our cash flow. While we have and may enter into agreements limiting our exposure to higher interest rates in the future,
13
any such agreements may not offer complete protection from this risk, and any portion not subject to such agreements would have full exposure to higher interest rates. Any of these risks could have a material adverse effect on our business, financial condition, and operating results.
Economic and market conditions may adversely affect our business and financial performance, as well as our access to financing on favorable terms or at all.
Our business and financial performance are sensitive to changes in general economic conditions, including changes in interest rates, consumer credit conditions, consumer debt levels, consumer confidence, rates of inflation (or concerns about deflation), unemployment rates, energy costs and other macro-economic factors. Market and economic conditions have been unprecedented and challenging in recent years. Concerns about the systemic impact of a long-term downturn, underemployment and unemployment, energy costs, the availability and cost of credit and unstable housing and credit markets have contributed to market volatility and economic uncertainty.
Continued or renewed market turbulence and weak economic conditions may materially adversely affect our business and financial performance in a number of ways. Our services are available to a broad customer base, a significant segment of which may be more vulnerable to weak economic conditions. We may have greater difficulty in gaining new customers within this segment and existing customers may be more likely to terminate service due to an inability to pay. In addition, instability in the global financial markets has resulted in periodic volatility in the credit, equity, and fixed income markets. This volatility could limit our access to the credit markets, leading to higher borrowing costs or, in some cases, the inability to obtain financing on terms that are acceptable to us, or at all.
Weak economic conditions and credit conditions may also adversely impact our suppliers and dealers, some of which have filed for or may be considering bankruptcy, or may experience cash flow or liquidity problems or are unable to obtain or refinance credit such that they may no longer be able to operate. Any of these could adversely impact our ability to distribute, market, or sell our products and services. Difficult, or worsening, general economic conditions could have a material adverse effect on our business, financial condition and results of operations.
Our business and stock price may be adversely affected if our internal controls are not effective.
As a public company, we are required under Section 404 of the Sarbanes-Oxley Act of 2002 and the SEC rules and regulations promulgated thereunder to establish, maintain and annually evaluate the effectiveness of internal control over financial reporting, which is a process designed to provide reasonable assurance regarding the reliability of financial reporting and the preparation of financial statements for external purposes in accordance with generally accepted accounting principles. The information technology, or IT, systems on which we rely extensively to operate, transact and otherwise manage our business and to effectively and timely report our financial results, are an important part of our internal control over financial reporting. Each each year we are required to document and test our internal control over financial reporting, including these IT systems; our management is required to assess and issue a report concerning our internal control over financial reporting; and our independent registered public accounting firm is required to report on the effectiveness of our internal control over financial reporting.
We cannot assure you that we will not discover material weaknesses our IT controls or other aspects of our internal control over financial reporting in the future. The existence of one or more material weaknesses could result in errors in our financial statements, and substantial costs and resources may be required to rectify these or other internal control deficiencies. If we are unable to comply with the requirements of Section 404 in a timely manner or if we conclude that our internal control over financial reporting is not effective, investors may lose confidence in the accuracy and completeness of our financial reports and the trading price of our common stock could be negatively affected, and we could become subject to investigations by the stock exchange on which our securities are listed, the SEC, or other regulatory authorities, which could require additional financial and management resources.
Our financial performance will be impaired if we experience high fraud rates related to device financing, credit cards, dealers, or subscriptions.
Our operating costs could increase substantially as a result of fraud, including device financing, customer credit card, subscription or dealer fraud. If our fraud detection strategies and processes are not successful in detecting and controlling fraud, whether directly or by way of the systems, processes, and operations of third parties such as national retailers, dealers and others, the resulting loss of revenue or increased expenses could have a materially adverse impact on our financial condition and results of operations.
14
We rely on highly-skilled personnel throughout all levels of our business. Our business could be harmed if we are unable to retain or motivate key personnel, hire qualified personnel, or maintain our corporate culture.
We believe that our future success depends in substantial part on our ability to recruit, hire, motivate, develop, and retain talented and highly-skilled personnel. Achieving this objective may be difficult due to many factors, including fluctuations in economic and industry conditions, competitors’ hiring practices, employee tolerance for the significant amount of change within and demands on our company and our industry, and the effectiveness of our compensation programs. If we do not succeed in retaining and motivating our existing key employees and in attracting new key personnel, we may be unable to meet our business plan and, as a result, our revenue growth and profitability may be materially adversely affected.
Risk related to Legal and Regulatory Matters
We operate throughout the U.S., Puerto Rico, and the U.S. Virgin Islands, and as such are subject to regulatory and legislative action by applicable local, state and federal governmental entities, which may increase our costs of providing products or services, or require us to change our business operations, products, or services or subject us to material adverse impacts if we fail to comply with such regulations.
The FCC regulates the licensing, construction, modification, operation, ownership, sale, and interconnection of wireless communications systems, as do some state and local regulatory agencies. Additionally, the Federal Trade Commission (“FTC”) and other federal agencies, such as the Consumer Financial Protection Board (“CFPB”), have jurisdiction over consumer protection and elimination and prevention of anticompetitive business practices with respect to the provision of non-common carrier services. We cannot assure you that the FCC, FTC, CFPB or any other federal, state or local agencies having jurisdiction over our business will not adopt regulations or take other enforcement or other actions that would adversely affect our business, impose new costs, or require changes in current or planned operations. We are subject to regulatory oversight by the FCC, FTC, and/or other federal agencies, as well as judicial review and actions, on issues related to the wireless industry that include, but are not limited to: roaming, spectrum allocation and licensing, pole attachments, intercarrier compensation, Universal Service Fund (“USF”), net neutrality, special access, 911 services, consumer protection including cramming, bill shock, and handset unlocking, consumer privacy, and cybersecurity. We are also subject to regulations in connection with other aspects of our business, including handset financing activities.
In addition, states are increasingly focused on the quality of service and support that wireless communication providers provide to their customers and several states have proposed or enacted new and potentially burdensome regulations in this area. A number of state Public Utility Commissions and state legislatures have introduced proposals in recent years seeking to regulate carriers’ business practices. We also face potential investigations by, and inquiries from or actions by state Public Utility Commissions and state Attorneys General. We also cannot assure you that Congress will not amend the Communications Act, from which the FCC obtains its authority and which serves to limit state authority, or enact other legislation in a manner that could be adverse to our business. Enactment of additional state or federal regulations may increase our costs of providing services (including, through universal service programs, requiring us to subsidize wireline competitors) or require us to change our services. Failure to comply with applicable regulations could have a material adverse effect on our business, financial condition and results of operations.
Furthermore, we could be subject to fines, forfeitures, and other penalties (including, in extreme cases, revocation of our licenses) for failure to comply with FCC or other governmental regulations, even if any such non-compliance was unintentional. The loss of any licenses, or any related fines or forfeitures, could adversely affect our business, results of operations, and financial condition.
Unfavorable outcomes of legal proceedings may adversely affect our business and financial condition.
We are regularly involved in a number of legal proceedings before various state and federal courts, the FCC, the FTC, the CFPB, and state and local regulatory agencies. Such legal proceedings can be complex, costly, and highly disruptive to business operations by diverting the attention and energies of management and other key personnel. The assessment of the outcome of legal proceedings, including our potential liability, if any, is a highly subjective process that requires judgments about future events that are not within our control. The outcome of litigation or other legal proceedings, including amounts ultimately received or paid upon settlement, may differ materially from amounts accrued in the financial statements. In addition, litigation or similar proceedings could impose restraints on our current or future manner of doing business. Such potential outcomes including judgments, awards, settlements or orders could have a material adverse effect on our business, financial condition, operating results, or ability to do business.
15
We increasingly offer products that include highly regulated financial services. These products expose us to a wide variety of state and federal regulations.
The introduction of additional financial services offerings to our customers has expanded our regulatory compliance obligations. If we fail to remain compliant with any of these regulations, then we face the risk of:
|
•
|
Increased consumer complaints and potential examinations or enforcement actions by federal and state regulatory agencies, including but not limited to the CFPB, Federal Deposit Insurance Corporation and FTC;
|
|
•
|
Violation of financial services and consumer protections regulations may result in regulatory fines, penalties, enforcement actions, civil litigation, and/or class action lawsuits.
|
We may be unable to protect our intellectual property. Additionally, we use equipment, software, technology, and content in the operation of our business, which may subject us to third-party intellectual property claims and we may be adversely affected by litigation involving our suppliers
We rely on a combination of patent, service mark, trademark, and trade secret laws and contractual restrictions to establish and protect our proprietary rights, all of which offer only limited protection. The steps we have taken to protect our intellectual property may not prevent the misappropriation of our proprietary rights. Moreover, others may independently develop processes and technologies that are competitive to ours. We cannot be sure that any legal actions against such infringers will be successful, even when our rights have been infringed. We cannot assure you that our pending or future patent applications will be granted or enforceable, or that the rights granted under any patent that may be issued will provide us with any competitive advantages. In addition, we cannot assure you that any trademark or service mark registrations will be issued with respect to pending or future applications or will provide adequate protection of our brands. We do not have insurance coverage for intellectual property losses, and as such, a charge for an anticipated settlement, or an adverse ruling awarding damages, represents unplanned loss events. Any of these factors could have material adverse effects on our business, results of operations and financial condition.
We are a defendant in numerous intellectual property lawsuits, including patent infringement lawsuits, which exposes us to the risk of adverse financial impact either by way of significant settlement amounts or damage awards. As we adopt new technologies and new business systems, and provide customers with new products and/or services, we may face additional infringement claims. These claims could require us to cease certain activities or to cease selling relevant products and services. These claims can be time-consuming and costly to defend, and divert management resources. In addition to litigation directly involving our Company, our vendors and suppliers can be threatened with patent litigation and/or subjected to the threat of disruption or blockage of sale, use, or importation of products, posing the risk of supply chain interruption to particular products and associated services exposing us to material adverse operational and financial impacts.
Our business may be impacted by new or changing tax laws or regulations and actions by federal, state or local agencies, or how judicial authorities apply tax laws.
We calculate, collect, and remit various taxes and regulatory fees to numerous federal, state and local governmental authorities in connection with the products and services we provide. These fees include federal USF contributions and common carrier regulatory fees. Many state and local governments levy various taxes and fees on our sales of products and services to customers and on our purchases of telecommunications equipment and services from vendors and various telecommunications carriers. Further, we impose surcharges on customers to reimburse the company for taxes, regulatory assessments and other costs we incur to comply with governmental regulatory mandates. In many cases, the applicability and method of calculating these surcharges, taxes and fees may be uncertain, and our calculation, assessment or remittance of these amounts may be contested by either customers or governmental authorities. In the event that we have incorrectly described, disclosed, calculated, assessed or remitted amounts that were due to governmental authorities, we could be subject to additional taxes, fines, penalties, or other adverse actions, which could materially impact our operations or financial condition. In the event that federal, state and/or local municipalities were to significantly increase taxes and regulatory fees on our services or seek to impose new ones, it could have a material adverse effect on our margins and financial and operational results.
Our wireless licenses are subject to renewal and may be revoked in the event that we violate applicable laws.
Our existing wireless licenses are subject to renewal upon the expiration of the 10-year or 15-year period for which they are granted. Historically, the FCC has approved our license renewal applications. However, the Communications Act provides that licenses may be revoked for cause and license renewal applications denied if the FCC determines that a renewal would not serve the public interest. In addition, our licenses are subject to our compliance with the terms set forth in the agreement pertaining to national security among Deutsche Telekom, the Federal Bureau of Investigation, the Department of Justice, the
16
Department of Homeland Security and the Company. The failure of Deutsche Telekom or the Company to comply with the terms of this agreement could result in fines, injunctions, and other penalties, including potential revocation or non-renewal of our spectrum licenses. If we fail to timely file to renew any wireless license, or fail to meet any regulatory requirements for renewal, including construction and substantial service requirements, we could be denied a license renewal. Many of our wireless licenses are subject to interim or final construction requirements and there is no guarantee that the FCC will find our construction, or the construction of prior licensees, sufficient to meet the build-out or renewal requirements. The FCC has pending a rulemaking proceeding to reevaluate, among other things, its wireless license renewal showings and standards and may in this or other proceedings promulgate changes or additional substantial requirements or conditions to its renewal rules, including revising license build out requirements. Accordingly, we cannot assure you that the FCC will renew our wireless licenses upon their expiration. If any of our wireless licenses were to be revoked or not renewed upon expiration, we would not be permitted to provide services under that license, which could have a material adverse effect on our business, results of operations, and financial condition.
Our business could be adversely affected by findings of product liability for health/safety risks from wireless devices and transmission equipment, as well as by changes to regulations/radio frequency emission standards.
We do not manufacture devices or other equipment sold by us, and we depend on our suppliers to provide defect-free and safe equipment. Suppliers are required by applicable law to manufacture their devices to meet certain governmentally imposed safety criteria. However, even if the devices we sell meet the regulatory safety criteria, we could be held liable with the equipment manufacturers and suppliers for any harm caused by products we sell if such products are later found to have design or manufacturing defects. We generally seek to enter into indemnification agreements with the manufacturers who supply us with devices to protect us from losses associated with product liability, but we cannot guarantee that we will be fully protected against all losses associated with a product that is found to be defective.
Allegations have been made that the use of wireless handsets and wireless transmission equipment, such as cell towers, may be linked to various health concerns, including cancer and brain tumors. Lawsuits have been filed against manufacturers and carriers in the industry claiming damages for alleged health problems arising from the use of wireless handsets. In addition, the FCC recently indicated that it plans to gather additional data regarding wireless handset emissions to update its assessment of this issue. The media has also reported incidents of handset battery malfunction, including reports of batteries that have overheated. These allegations may lead to changes in regulatory standards. There have also been other allegations regarding wireless technology, including allegations that wireless handset emissions may interfere with various electronic medical devices (including hearing aids and pacemakers), airbags, and anti-lock brakes.
Additionally, there are safety risks associated with the use of wireless devices while operating vehicles or equipment. Concerns over any of these risks and the effect of any legislation, rules or regulations that have been and may be adopted in response to these risks could limit our ability to sell our wireless services.
Related to Ownership of our Common Stock
We are controlled by Deutsche Telekom, whose interests may differ from the interests of our other stockholders.
Deutsche Telekom beneficially owns and possesses majority voting power of the fully diluted shares of our common stock. Through its control of the voting power of our common stock and the rights granted to Deutsche Telekom in our certificate of incorporation and the Stockholder’s Agreement, Deutsche Telekom controls the election of a majority of our directors and all other matters requiring the approval of our stockholders. By virtue of Deutsche Telekom’s voting control, we are a “controlled company”, as defined in the New York Stock Exchange (“NYSE”), listing rules, and are not subject to NYSE requirements that would otherwise require us to have a majority of independent directors, a nominating committee composed solely of independent directors, or a compensation committee composed solely of independent directors.
In addition, our certificate of incorporation and the Stockholder’s Agreement restrict us from taking certain actions without Deutsche Telekom’s prior written consent as long as Deutsche Telekom beneficially owns 30% or more of the outstanding shares of our common stock, including the incurrence of debt (excluding certain permitted debt) if our consolidated ratio of debt to cash flow for the most recently ended four full fiscal quarters for which financial statements are available would exceed 5.25 to 1.0 on a pro forma basis, the acquisition of any business, debt or equity interests, operations or assets of any person for consideration in excess of $1 billion, the sale of any of our or our subsidiaries’ divisions, businesses, operations or equity interests for consideration in excess of $1 billion, any change in the size of our board of directors, the issuances of equity securities in excess of 10% of our outstanding shares or to repurchase debt held by Deutsche Telekom, the repurchase or redemption of equity securities or the declaration of extraordinary or in-kind dividends or distributions other than on a pro rata basis, or the termination or hiring of our chief executive officer. These restrictions could prevent us from taking actions that
17
our board of directors may otherwise determine are in the best interests of the Company and our stockholders or that may be in the best interests of our other stockholders.
Deutsche Telekom effectively has control over all matters submitted to our stockholders for approval, including the election or removal of directors, changes to our certificate of incorporation, a sale or merger of our company and other transactions requiring stockholder approval under Delaware law. Deutsche Telekom may have strategic, financial, or other interests different from our other stockholders, including as the holder of a substantial amount of our indebtedness, and may make decisions adverse to the interests of our other stakeholders.
Future sales or issuances of our common stock, including sales by Deutsche Telekom, could have a negative impact on our stock price.
We cannot predict the effect, if any, that market sales of shares or the availability of shares of our common stock will have on the prevailing trading price of our common stock from time to time. Sales of a substantial number of shares of our common stock could cause our stock price to decline.
We and Deutsche Telekom are parties to the Stockholder’s Agreement pursuant to which Deutsche Telekom is free to transfer its shares in public sales without notice, as long as such transactions would not result in the transferee owning 30% or more of the outstanding shares of our common stock. If a transfer would exceed the 30% threshold, it is prohibited unless the transferee makes a binding offer to purchase all of the other outstanding shares on the same price and terms. The Stockholder’s Agreement does not otherwise impose any other restrictions on the sales of common stock by Deutsche Telekom. Moreover, we have filed a shelf registration statement with respect to the common stock and certain debt securities held by Deutsche Telekom, which would facilitate the resale by Deutsche Telekom of all or any portion of the shares of our common stock it holds. The sale of shares of our common stock by Deutsche Telekom (other than in transactions involving the purchase of all of our outstanding shares) could significantly increase the number of shares available in the market, which could cause a decrease in our stock price. In addition, even if Deutsche Telekom does not sell a large number of its shares into the market, its right to transfer a large number of shares into the market may depress our stock price.
In addition, we have reserved up to 38.684 million shares of common stock for issuance upon conversion of our 5.50% Mandatory Convertible Preferred Stock, Series A ( “preferred stock”), subject to certain anti-dilution adjustments. The dividends on the preferred stock may also be paid in cash or, subject to certain limitations, shares of common stock or any combination of cash and shares of common stock. The issuance of additional shares of common stock upon conversion of, or in connection with the payment of dividends upon, the mandatory convertible preferred stock may depress our stock price.
Our stock price may be volatile, and may fluctuate based upon factors that have little or nothing to do with our business, financial condition, and operating results.
The trading prices of the securities of communications companies historically have been highly volatile, and the trading price of our common stock may be subject to wide fluctuations. Our stock price may fluctuate in reaction to a number of events and factors that may include, among other things:
|
•
|
our or our competitors’ actual or anticipated operating and financial results; introduction of new products and services by us or our competitors or changes in service plans or pricing by us or our competitors;
|
|
•
|
analyst projections, predictions and forecasts, analyst target prices for our securities and changes in, or our failure to meet, securities analysts’ expectations;
|
|
•
|
Deutsche Telekom’s financial performance, results of operation, or actions implied or taken by Deutsche Telekom;
|
|
•
|
entry of new competitors into our markets or perceptions of increased price competition, including a price war;
|
|
•
|
our performance, including subscriber growth, and our financial and operational metric performance;
|
|
•
|
market perceptions relating to our services, network, handsets and deployment of our LTE platform and our access to iconic handsets, services, applications or content;
|
|
•
|
market perceptions of the wireless communications industry and valuation models for us and the industry;
|
|
•
|
changes in our credit rating or future prospects;
|
|
•
|
the availability or perceived availability of additional capital in general and our access to such capital;
|
|
•
|
actual or anticipated consolidation, or other strategic mergers or acquisition activities involving us or our competitors or market speculations regarding such activities;
|
|
•
|
disruptions of our operations or service providers or other vendors necessary to our network operations; the general state of the U.S. and world economies; and
|
|
•
|
availability of additional spectrum, whether by the announcement, commencement, bidding and closing of auctions for new spectrum or the acquisition of companies that own spectrum.
|
18
In addition, the stock market has been volatile in the recent past and has experienced significant price and volume fluctuations, which may continue for the foreseeable future. This volatility has had a significant impact on the trading price of securities issued by many companies, including companies in the communications industry. These changes frequently occur irrespective of the operating performance of the affected companies. Hence, the trading price of our common stock could fluctuate based upon factors that have little or nothing to do with our business, financial condition and operating results.
Our stockholder rights plan could prevent a change in control of our Company in instances in which some stockholders may believe a change in control is in their best interests.
We have a stockholder rights plan (“Rights Plan”) in effect. The Rights Plan will cause substantial dilution to a person or group that attempts to acquire our Company on terms that our board of directors does not believe are in our and our stockholders’ best interest. The Rights Plan is intended to protect stockholders in the event of an unfair or coercive offer to acquire the Company and to provide our board of directors with adequate time to evaluate unsolicited offers. The Rights Plan may prevent or make takeovers or unsolicited corporate transactions with respect to our Company more difficult, even if stockholders may consider such transactions favorable, possibly including transactions in which stockholders might otherwise receive a premium for their shares.
None.
As of
December 31, 2014
, we leased approximately
62,000
cell sites,
70
switching centers and
10
data centers, totaling approximately
2.0 million
square feet. In addition, we had
17
leased call centers, totaling approximately
1.3 million
square feet, and
20
leased warehouses, totaling approximately
450,000
square feet.
We also leased approximately
2,300
retail locations, including stores and kiosks ranging in size from approximately
300
square feet to
11,000
square feet.
We currently lease office space totaling approximately
1.0 million
square feet for our corporate headquarters in Bellevue, Washington. We use these offices for engineering and administrative purposes. We also lease space throughout the U.S., totaling approximately
1.4 million
square feet as of
December 31, 2014
, for use by our regional offices primarily for administrative, engineering and sales purposes.
19
See
Note 13 – Commitments and Contingencies
of the
Notes to the Consolidated Financial Statements
included in
Part II, Item 8
of this
Form 10-K
for information regarding certain legal proceedings in which we are involved.
None.
Market Information
Our common stock has traded on the NYSE under the symbol “TMUS” since May 1, 2013, the first trading day after the closing of the business combination with MetroPCS. As of
December 31, 2014
, there were
328
registered stockholders of record of our common stock, but we estimate the total number of stockholders to be much higher as a number of our shares are held by brokers or dealers for their customers in street name. For periods prior to the closing of the business combination with MetroPCS, the prices represent the high and low sales prices of our common stock, as reported by the NYSE under the symbol “PCS”, adjusted to reflect the 1-for-2 reverse stock split effected on April 30, 2013, but not adjusted on a per share basis for the aggregate cash payment of
$1.5 billion
to MetroPCS stockholders in connection with the business combination. See also
Note 2 – Business Combination with MetroPCS
of the
Notes to the Consolidated Financial Statements
included in
Part II, Item 8
of this
Form 10-K
.
20
The high and low common stock sales prices per share were as follows:
|
High
|
Low
|
||||||
|
Year Ended December 31, 2014
|
|||||||
|
First Quarter
|
$
|
33.92
|
|
$
|
29.06
|
|
|
|
Second Quarter
|
35.50
|
|
27.62
|
|
|||
|
Third Quarter
|
34.55
|
|
28.25
|
|
|||
|
Fourth Quarter
|
29.60
|
|
24.26
|
|
|||
|
Year Ended December 31, 2013
|
|||||||
|
First Quarter
|
$
|
22.08
|
|
$
|
18.28
|
|
|
|
Second Quarter
|
25.02
|
|
16.01
|
|
|||
|
Third Quarter
|
26.66
|
|
22.74
|
|
|||
|
Fourth Quarter
|
34.10
|
|
24.90
|
|
|||
We have never paid or declared any cash dividends on our common stock, and we do not intend to declare or pay any cash dividends on our common stock in the foreseeable future. Our unsecured revolving credit facility with Deutsche Telekom and the indentures and supplemental indentures governing our long-term debt, excluding capital leases, contain covenants that, among other things, restrict our ability to declare or pay dividends on our common stock. In addition, no dividend may be declared or paid on our common stock, other than dividends payable solely in shares of our common stock, unless all accrued dividends for all completed dividend periods have been declared and paid on our preferred stock. Other than to pay dividends on our preferred stock, we currently intend to retain future earnings, if any, to invest in our business. Subject to Delaware law, our board of directors will determine the payment of future dividends on our common stock, if any, and the amount of any dividends in light of:
|
•
|
any applicable contractual or charter restrictions limiting our ability to pay dividends;
|
|
•
|
our earnings and cash flows;
|
|
•
|
our capital requirements;
|
|
•
|
our future needs for cash;
|
|
•
|
our financial condition; and
|
|
•
|
other factors our board of directors deems relevant.
|
21
Performance Graph
The graph below compares the five-year cumulative total returns of T-Mobile, the NYSE Composite index, the S&P 500 index and the Dow Jones US Mobile Telecommunications TSM index. The graph tracks the performance of a $100 investment, with the reinvestment of all dividends, from December 31, 2009 to December 31, 2014. For periods prior to the closing of the business combination with MetroPCS, our stock price performance represents the stock price of MetroPCS, adjusted to reflect the 1-for-2 reverse stock split effected on April 30, 2013.

22
The following selected financial data are derived from our consolidated financial statements. In connection with the business combination with MetroPCS, the selected financial data prior to May 1, 2013 represents T-Mobile USA’s historical financial data. The data below should be read in conjunction with Risk Factors included in Part 1, Item 1A, Management’s Discussion and Analysis of Financial Condition and Results of Operations included in Part II, Item 7 and Financial Statements and Supplementary Data included in
Part II, Item 8
of this
Form 10-K
.
Selected Financial Data
|
(in millions, except per share and customer amounts)
|
As of and for the Year Ended December 31,
|
||||||||||||||||||
|
2014
|
2013
|
2012
|
2011
|
2010
|
|||||||||||||||
|
Statement of Operations Data
|
|||||||||||||||||||
|
Total service revenues
|
$
|
22,375
|
|
$
|
19,068
|
|
$
|
17,213
|
|
$
|
18,481
|
|
$
|
18,733
|
|
||||
|
Total revenues
|
29,564
|
|
24,420
|
|
19,719
|
|
20,618
|
|
21,347
|
|
|||||||||
|
Operating income (loss)
|
1,416
|
|
996
|
|
(6,397
|
)
|
(4,279
|
)
|
2,705
|
|
|||||||||
|
Total other expense, net
|
(1,003
|
)
|
(945
|
)
|
(589
|
)
|
(655
|
)
|
(526
|
)
|
|||||||||
|
Income tax expense (benefit)
|
166
|
|
16
|
|
350
|
|
(216
|
)
|
822
|
|
|||||||||
|
Net income (loss)
|
247
|
|
35
|
|
(7,336
|
)
|
(4,718
|
)
|
1,354
|
|
|||||||||
|
Earnings (loss) per share:
|
|||||||||||||||||||
|
Basic
|
0.31
|
|
0.05
|
|
(13.70
|
)
|
(8.81
|
)
|
2.53
|
|
|||||||||
|
Diluted
|
0.30
|
|
0.05
|
|
(13.70
|
)
|
(8.81
|
)
|
2.53
|
|
|||||||||
|
Other Financial Data
|
|||||||||||||||||||
|
Net cash provided by operating activities
|
$
|
4,146
|
|
$
|
3,545
|
|
$
|
3,862
|
|
$
|
4,980
|
|
$
|
4,905
|
|
||||
|
Purchases of property and equipment
|
(4,317
|
)
|
(4,025
|
)
|
(2,901
|
)
|
(2,729
|
)
|
(2,819
|
)
|
|||||||||
|
Purchases of spectrum licenses and other intangible assets, including deposits
|
(2,900
|
)
|
(381
|
)
|
(387
|
)
|
(23
|
)
|
(18
|
)
|
|||||||||
|
Net cash provided by financing activities
|
2,524
|
|
4,044
|
|
57
|
|
—
|
|
123
|
|
|||||||||
|
Total customers (in thousands)
|
55,018
|
|
46,684
|
|
33,389
|
|
33,185
|
|
33,734
|
|
|||||||||
|
Balance Sheet Data
|
|||||||||||||||||||
|
Cash and cash equivalents
|
$
|
5,315
|
|
$
|
5,891
|
|
$
|
394
|
|
$
|
390
|
|
$
|
109
|
|
||||
|
Property and equipment, net
|
16,245
|
|
15,349
|
|
12,807
|
|
12,703
|
|
13,213
|
|
|||||||||
|
Spectrum licenses
|
21,955
|
|
18,122
|
|
14,550
|
|
12,814
|
|
15,282
|
|
|||||||||
|
Total assets
|
56,653
|
|
49,953
|
|
33,622
|
|
40,609
|
|
46,291
|
|
|||||||||
|
Total debt, excluding long-term financial obligation
|
21,960
|
|
20,189
|
|
14,945
|
|
15,627
|
|
16,293
|
|
|||||||||
|
Stockholders’ equity
|
15,663
|
|
14,245
|
|
6,115
|
|
15,785
|
|
20,492
|
|
|||||||||
Except as expressly stated, the financial condition and results of operations discussed throughout Management’s Discussion and Analysis of Financial Condition and Results of Operations (“MD&A”) are those of T-Mobile US, Inc. and its consolidated subsidiaries.
Overview
The MD&A is intended to provide a reader of our financial statements with a narrative explanation from the perspective of management of our financial condition, results of operations, liquidity and certain other factors that may affect future results. The MD&A is provided as a supplement to, and should be read in conjunction with, our audited Consolidated Financial Statements for the three years ended
December 31, 2014
included in
Part II, Item 8
of this
Form 10-K
.
Business Overview
We are the Un-carrier. Un-satisfied with the status quo. Un-afraid to innovate. T-Mobile is the fastest growing wireless company in the U.S., based on customer growth in 2014, currently providing wireless communications services, including voice, messaging and data, to over
55 million
customers in the postpaid, prepaid, and wholesale markets. The Un-carrier proposition is an approach that seeks to listen to the customer, address their pain points, bring innovation to the industry, and
23
improve the wireless experience for all. In practice, this means offering customers a great service on a nationwide LTE network, devices when and how they want them, and plans that are simple, affordable and without unnecessary restrictions. Going forward, we will continue to listen and respond to our customers, refine and improve the Un-carrier proposition, and deliver the best value experience in the industry.
Our Un-carrier proposition is first and foremost about the customer. In
2014
, we continued to aggressively address customer pain points with the launch of the following phases of our Un-carrier proposition:
|
•
|
Contract Freedom
– In January 2014, we announced phase 4.0, which reimburses customers’ ETFs when they switch from other carriers and trade in their eligible device.
|
|
•
|
Test Drive
– In June 2014, we released phase 5.0, which allows consumers to test our network and an Apple iPhone 5s with unlimited nationwide service for seven days at no charge.
|
|
•
|
Music Freedom
– In June 2014, we introduced phase 6.0, which allows Simple Choice customers to stream music from popular music services without it counting against their high-speed data allotment. Additionally, we launched Rhapsody unRadio, which is available to our eligible Simple Choice customers at no additional cost or at a discounted price.
|
|
•
|
Wi-Fi Un-leashed
– In September 2014, we launched phase 7.0, which provides Wi-Fi calling and texting for Simple Choice customers on capable smartphones. In addition, we unveiled the T-Mobile Personal CellSpot, a new device which provides customers with greater coverage in their home. Finally, through a new partnership with Gogo, customers with compatible devices can send and receive unlimited text, picture messages and receive visual voicemails on any Gogo-equipped U.S.-based flight for free.
|
|
•
|
Data Stash
– In December 2014, we introduced phase 8.0, giving customers the ability to roll their unused high-speed data automatically each month into a personal Data Stash so they can use it when they need it for up to a year. Starting in January 2015, Data Stash will be automatically available at no extra charge to every T-Mobile customer with a postpaid Simple Choice plan who has purchased additional LTE data, 3GB or more for smartphones and 1 GB or more for tablets. In addition, beginning in January 2015, we will provide a one-time Free Data Stash to start with of 10 GB of LTE data to all qualifying customers, which will expire at the end of 2015.
|
Financial Highlights
Our primary financial focus is on growing Adjusted EBITDA, which we expect to continue to improve in 2015. Adjusted EBITDA
increased
to
$5.6 billion
in
2014
, compared to
$4.9 billion
in
2013
and
2012
. Adjusted EBITDA is primarily driven by increasing revenues. We generate revenues by offering affordable wireless communication services to our postpaid, prepaid and wholesale customers, as well as through sale of a wide selection of wireless devices and accessories. Total revenues
increased
to
$29.6 billion
in
2014
compared to
$24.4 billion
in
2013
and
$19.7 billion
in
2012
. We introduced our Un-carrier proposition in 2013 with the objective of eliminating customer pain points from the unnecessary complexity of the wireless communication industry. We believe Un-carrier phases 1.0 through 8.0 have been successful as evidenced by our strong customer growth momentum since the launch of our Un-carrier proposition. Total net customer additions were
8,334,000
in
2014
, a significant improvement compared to
4,377,000
in
2013
and
203,000
in
2012
.
We generate the majority of our service revenues by providing wireless communication services to branded postpaid customers. Our ability to acquire and retain branded postpaid customers is important to our business in the generation of revenues. Total branded postpaid net customer additions were
4,886,000
in
2014
, a significant improvement compared to net customer additions of
2,006,000
in
2013
and net customer losses of
2,074,000
in
2012
. In addition, we have continued to focus on retaining customers through churn reduction initiatives to improve customer experience. Branded postpaid phone churn improved to
1.58%
in
2014
, compared to
1.69%
in
2013
and
2.33%
in
2012
. Improvements in branded postpaid net customer additions and churn were driven by the continued success of our Un-carrier proposition and strong customer response to promotions. We expect further growth in our branded postpaid net customer additions in 2015 as we continue to offer competitive pricing and improve our network and customer experience.
We have also increased our service revenues from branded prepaid customers through the business combination with MetroPCS in 2013 and the expansion of the MetroPCS brand in 2014. In addition, we experienced increases in equipment sales from significant growth in the number of devices sold on higher gross customer additions and upgrade volumes, including redemptions through JUMP!.
24
Our most significant expenses are related to acquiring and retaining high-quality customers, compensating employees, and operating and expanding our network. We expect operating expenses will continue to increase to support our strong customer growth. Operating expenses were
$28.1 billion
in
2014
, compared to
$23.4 billion
in
2013
and
$26.1 billion
in
2012
. Improvements in gross customer additions caused significant growth in the number of devices sold, which resulted in higher cost of equipment sales, and employee-related costs, such as commissions. In addition, employee-related costs increased as a result of increases in the number of retail and customer support employees needed to support customer growth. We also increased promotional activities to attract new customers. We have incurred expenses as part of the network modernization due to increased depreciation expense related to the build out of the LTE network and costs related to decommissioning of the MetroPCS CDMA network and certain other redundant cell sites.
Liquidity and Capital Resources Highlights
The success of our Un-carrier proposition and continued modernization of our network has further repositioned T-Mobile to provide customers with an unrivaled customer experience, which requires substantial investment in our business. Our principal sources of liquidity are our cash and cash equivalents and cash generated from operations, proceeds from the issuance of long-term debt and the issuance of common and preferred stock, the sale of certain service receivables related to a factoring arrangement, and financing arrangements of vendor payables which effectively extend payment terms. In
2014
, we completed an offering of new senior unsecured notes in aggregate principal amounts of
$3.0 billion
, using a portion of the proceeds from the issuance of the notes to redeem senior unsecured notes of
$1.0 billion
with a higher interest rate, and completed a public offering of
20 million
shares of preferred stock for net proceeds of
$982 million
. See
Note 8 – Debt
and
Note 14 – Additional Financial Information
of the
Notes to the Consolidated Financial Statements
included in
Part II, Item 8
of this
Form 10-K
. In addition, in
2014
, we entered into a two-year factoring arrangement to sell certain service accounts receivable on a revolving basis with a current maximum funding limit of
$640 million
. See
Note 4 – Factoring Arrangement
of the
Notes to the Consolidated Financial Statements
included in
Part II, Item 8
of this
Form 10-K
.
We have substantially completed the process of upgrading our network to LTE, which provides our customers with the fastest nationwide LTE services. Our LTE network covered
265 million
people as of
December 31, 2014
, compared to more than 200 million people as of
December 31, 2013
. This surpassed our year-end goal of covering 250 million people with the fastest nationwide LTE network. We are targeting 300 million people with LTE by the end of 2015. In addition, we are currently in the process of building out our network to utilize our recently acquired 700 MHz A-Block spectrum licenses. Cash capital expenditures for property and equipment, which are primarily related to our network modernization, were
$4.3 billion
in
2014
compared to
$4.0 billion
in
2013
and
$2.9 billion
in
2012
. We expect cash capital expenditures for property and equipment to be in the range of
$4.4 billion
to
$4.7 billion
in
2015
.
We provide mobile communication services using spectrum licenses, consisting of 700 MHz A-Block, AWS and PCS licenses. In 2014, we completed transactions for the acquisition of 700 MHz A-Block, AWS and PCS spectrum licenses, primarily from Verizon, with an aggregate fair value of
$4.8 billion
, which covers approximately 150 million people, in exchange for cash and the transfer of certain AWS and PCS spectrum. In addition, in 2014, we entered into agreements, which are expected to close in 2015, for the acquisition of 700 MHz A-Block, AWS and PCS spectrum licenses with an estimated aggregate fair value of approximately
$0.5 billion
, which cover more than
40 million
people, for cash and the exchange of certain AWS and PCS spectrum licenses, which cover approximately
6 million
people. The transactions are subject to regulatory approval and other customary closing conditions. Upon closing of these pending transactions, we will own 700 MHz A-Block covering
190 million
people in total. In
January 2015
, the FCC announced T-Mobile was the winning bidder of AWS spectrum licenses covering approximately
97 million
people for an aggregate bid price of
$1.8 billion
. T-Mobile expects to receive the AWS spectrum licenses, subject to regulatory approval, in the
second quarter of 2015
. These transactions are expected to further enhance our portfolio of U.S. nationwide broadband spectrum. See
Note 6 – Goodwill, Spectrum Licenses and Intangible Assets
and
Note 16 – Subsequent Events
of the
Notes to the Consolidated Financial Statements
included in
Part II, Item 8
of this
Form 10-K
. In 2015, we will seek to opportunistically acquire additional spectrum in private party transactions to further enhance our portfolio of U.S. nationwide broadband spectrum and enable the expansion of LTE coverage to new markets.
See “Results of Operations” below for further discussion of changes in revenues and operating expenses and “Performance Measures” for a description of performance measures, such as Adjusted EBITDA and churn. The comparability of results in this
Form 10-K
for the
year ended
December 31, 2014
and
2013
is affected by the inclusion of MetroPCS results after the completion of the business combination on April 30, 2013.
25
Results of Operations
Set forth below is a summary of consolidated results:
|
Year Ended December 31,
|
Percentage
Change 2014 Versus 2013 |
Percentage
Change 2013 Versus 2012 |
|||||||||||||||
|
(in millions)
|
2014
|
2013
|
2012
|
||||||||||||||
|
Revenues
|
|||||||||||||||||
|
Branded postpaid revenues
|
$
|
14,392
|
|
$
|
13,166
|
|
$
|
14,521
|
|
9
|
%
|
(9
|
)%
|
||||
|
Branded prepaid revenues
|
6,986
|
|
4,945
|
|
1,715
|
|
41
|
%
|
NM
|
|
|||||||
|
Wholesale revenues
|
731
|
|
613
|
|
544
|
|
19
|
%
|
13
|
%
|
|||||||
|
Roaming and other service revenues
|
266
|
|
344
|
|
433
|
|
(23
|
)%
|
(21
|
)%
|
|||||||
|
Total service revenues
|
22,375
|
|
19,068
|
|
17,213
|
|
17
|
%
|
11
|
%
|
|||||||
|
Equipment sales
|
6,789
|
|
5,033
|
|
2,242
|
|
35
|
%
|
124
|
%
|
|||||||
|
Other revenues
|
400
|
|
319
|
|
264
|
|
25
|
%
|
21
|
%
|
|||||||
|
Total revenues
|
29,564
|
|
24,420
|
|
19,719
|
|
21
|
%
|
24
|
%
|
|||||||
|
Operating expenses
|
|||||||||||||||||
|
Cost of services, exclusive of depreciation and amortization shown separately below
|
5,788
|
|
5,279
|
|
4,661
|
|
10
|
%
|
13
|
%
|
|||||||
|
Cost of equipment sales
|
9,621
|
|
6,976
|
|
3,437
|
|
38
|
%
|
103
|
%
|
|||||||
|
Selling, general and administrative
|
8,863
|
|
7,382
|
|
6,796
|
|
20
|
%
|
9
|
%
|
|||||||
|
Depreciation and amortization
|
4,412
|
|
3,627
|
|
3,187
|
|
22
|
%
|
14
|
%
|
|||||||
|
Cost of MetroPCS business combination
|
299
|
|
108
|
|
7
|
|
NM
|
|
NM
|
|
|||||||
|
Impairment charges
|
—
|
|
—
|
|
8,134
|
|
NM
|
|
NM
|
|
|||||||
|
Gains on disposal of spectrum licenses
|
(840
|
)
|
(2
|
)
|
(205
|
)
|
NM
|
|
(99
|
)%
|
|||||||
|
Other, net
|
5
|
|
54
|
|
99
|
|
(91
|
)%
|
(45
|
)%
|
|||||||
|
Total operating expenses
|
28,148
|
|
23,424
|
|
26,116
|
|
20
|
%
|
(10
|
)%
|
|||||||
|
Operating income (loss)
|
1,416
|
|
996
|
|
(6,397
|
)
|
42
|
%
|
NM
|
|
|||||||
|
Other income (expense)
|
|||||||||||||||||
|
Interest expense to affiliates
|
(278
|
)
|
(678
|
)
|
(661
|
)
|
(59
|
)%
|
3
|
%
|
|||||||
|
Interest expense
|
(1,073
|
)
|
(545
|
)
|
—
|
|
97
|
%
|
NM
|
|
|||||||
|
Interest income
|
359
|
|
189
|
|
77
|
|
90
|
%
|
NM
|
|
|||||||
|
Other income (expense), net
|
(11
|
)
|
89
|
|
(5
|
)
|
NM
|
|
NM
|
|
|||||||
|
Total other expense, net
|
(1,003
|
)
|
(945
|
)
|
(589
|
)
|
6
|
%
|
60
|
%
|
|||||||
|
Income (loss) before income taxes
|
413
|
|
51
|
|
(6,986
|
)
|
NM
|
|
NM
|
|
|||||||
|
Income tax expense
|
166
|
|
16
|
|
350
|
|
NM
|
|
(95
|
)%
|
|||||||
|
Net income (loss)
|
$
|
247
|
|
$
|
35
|
|
$
|
(7,336
|
)
|
NM
|
|
NM
|
|
||||
NM – Not Meaningful
Year Ended December 31, 2014
Compared to
Year Ended December 31, 2013
Revenues
Branded postpaid revenues
increased
$1.2 billion
, or
9%
, in
2014
, compared to
2013
. The increase was primarily attributable to growth in the number of average branded postpaid customers driven by the continued success of our Un-carrier proposition and strong customer response to promotions for services and devices. Additional increases resulted from customer adoption of upgrade and insurance programs and changes in requalification requirements for corporate discount programs. The increase was partially offset by lower branded postpaid average revenue per account (“ARPA”). See “Performance Measures” for a description of ARPA. Branded postpaid ARPA was negatively impacted by continued growth of our Simple Choice plans, which have lower monthly service charges compared to traditional bundled plans. Branded postpaid customers on Simple Choice plans increased over the past twelve months to
89%
of the branded postpaid customer base as of
December 31, 2014
, compared to
69%
as of
December 31, 2013
.
Branded prepaid revenues
increased
$2.0 billion
, or
41%
in
2014
, compared to
2013
. The increase was primarily driven by growth of the customer base from the expansion of the MetroPCS brand and an increase in promotional activities. In addition, the inclusion of MetroPCS operating results for the full year period following the business combination in April 2013 contributed to the increase.
26
Wholesale revenues
increased
$118 million
, or
19%
, in
2014
, compared to
2013
. The increase was primarily attributable to growth in customer programs and monthly plans, including data, offered by our MVNO partners and changes to our MVNO contractual arrangements.
Roaming and other service revenues
decreased
$78 million
, or
23%
, in
2014
, compared to
2013
, primarily due to a decline in ETFs following our introduction of the no annual service contract feature of the Simple Choice plan launched in March 2013.
Equipment sales
increased
$1.8 billion
, or
35%
, in
2014
, compared to
2013
. The increase was primarily attributable to significant growth in the number of devices sold due to higher gross customer additions and higher device upgrade volumes, including JUMP! redemptions. The volume of device sales increased
48%
in
2014
, compared to
2013
. Additionally, the inclusion of MetroPCS operating results for the full year period in 2014 following the business combination in April 2013 contributed to the increase. The increase was partially offset by reimbursements of other carriers’ ETFs and a lower average revenue per device sold.
We financed
$5.8 billion
of equipment sales revenues through EIP during
2014
, an increase from
$3.3 billion
in
2013
, resulting from growth of our Simple Choice plans. Additionally, customers had associated EIP billings of
$3.6 billion
in
2014
, compared to
$1.5 billion
in
2013
.
Other revenues
increased
$81 million
, or
25%
, in
2014
, compared to
2013
. The increase was primarily due to higher co-location rental income from leasing space on wireless communication towers to third parties and higher lease income associated with spectrum license lease agreements resulting from spectrum swap transactions.
Operating Expenses
Cost of services
increased
$509 million
, or
10%
, in
2014
, compared to
2013
. The increase was primarily due to the inclusion of MetroPCS operating results for the full year period in 2014 following the business combination in April 2013. Additionally, higher lease expense primarily relating to spectrum license lease agreements resulting from spectrum swap transactions contributed to the increase.
Cost of equipment sales
increased
$2.6 billion
, or
38%
, in
2014
, compared to
2013
. The increase was primarily attributable to significant growth in the number of devices sold due to higher gross customer additions and higher device upgrade volumes, including JUMP! redemptions. Additionally, the inclusion of MetroPCS operating results for the full year period in 2014 following the business combination in April 2013 contributed to the increase. The volume of device sales increased
48%
in
2014
, compared to
2013
. The increase was partially offset by a lower average cost per device sold.
Selling, general and administrative
increased
$1.5 billion
, or
20%
, in
2014
, compared to
2013
. The increase was primarily due to higher employee-related costs as a result of increases in the number of retail and customer support employees, higher commissions driven by increased gross customer additions and higher promotional costs. Additionally, the inclusion of MetroPCS operating results for the full year period in 2014 following the business combination in April 2013 and higher stock-based compensation contributed to the increase.
Depreciation and amortization
increased
$785 million
, or
22%
, in
2014
, compared to
2013
. The increase was primarily associated with the build-out of the T-Mobile LTE network, which increased the depreciable asset base. Additionally, the inclusion of MetroPCS operating results for the full year period in 2014 following the business combination in April 2013, including accelerated depreciation related to the decommissioning of the MetroPCS CDMA network, contributed to the increase.
Cost of MetroPCS business combination
of
$299 million
in
2014
primarily reflects network decommissioning costs associated with the business combination. In
2014
, we began decommissioning the MetroPCS CDMA network and certain other redundant network cell sites. Network decommissioning costs, which are excluded from Adjusted EBITDA, primarily relate to the acceleration of lease costs for cell sites that would have otherwise been recognized as cost of services over the remaining lease term had we not decommissioned the cell sites. We intend to decommission certain cell sites and incur additional network decommissioning costs in the range of
$500 million
to
$600 million
, a majority of which are expected to be recognized in 2015. See
Note 2 – Business Combination with MetroPCS
of the
Notes to the Consolidated Financial Statements
included in
Part II, Item 8
of this
Form 10-K
for more information.
Cost of MetroPCS business combination of
$108 million
in
2013
reflects personnel-related costs and professional services costs associated with the business combination.
Gains on disposal of spectrum licenses
of
$840 million
in
2014
primarily consisted of non-cash gains from spectrum license transactions with Verizon, and to a lesser extent, a non-cash gain from a spectrum license transaction with AT&T during the
27
fourth quarter of
2014
. See
Note 6 – Goodwill, Spectrum Licenses and Intangible Assets
of the
Notes to the Consolidated Financial Statements
included in
Part II, Item 8
of this
Form 10-K
for more information.
Other, net
decreased
$49 million
, or
91%
, in
2014
, compared to
2013
. The decrease was primarily due to our 2013 restructuring program to align our operations to our new strategy and position the company for future growth. Costs associated with the 2013 restructuring program primarily consisted of severance and other personnel-related costs.
Other Income (Expense)
Interest expense to affiliates
decreased
$400 million
, or
59%
, in
2014
, compared to
2013
. The decrease was primarily due to lower debt balances with Deutsche Telekom in
2014
, resulting from the recapitalization of T-Mobile prior to the business combination in April 2013 and Deutsche Telekom’s sale of non-reset notes in the aggregate principal amount of
$5.6 billion
in October 2013. To a lesser extent, additional decreases resulted from fair value adjustments related to embedded derivative instruments associated with the senior reset notes issued to Deutsche Telekom in the recapitalization.
Interest expense
increased
$528 million
, or
97%
in
2014
, compared to
2013
. The increase was primarily the result of higher debt balances in
2014
compared to
2013
, including senior notes issued in 2013, the assumption of MetroPCS long-term debt in connection with the business combination in April 2013, the reclassification of non-reset notes from long-term debt to affiliates to long-term debt following Deutsche Telekom’s sale of the non-reset notes in October 2013, and to a lesser extent, the issuance of new senior unsecured notes in September 2014.
Interest income
increased
$170 million
, or
90%
in
2014
, compared to
2013
. The increase was the result of significant growth in devices financed through EIP. Interest associated with EIP receivables is imputed at the time of sale and then recognized over the financed installment term.
Other income (expense), net
decreased
$100 million
in
2014
, compared to
2013
. The decrease was primarily due to the recognition of foreign currency translation gains in
2013
related to the retirement of derivative instruments prior to the business combination in April 2013. This decrease was offset in part by a non-cash gain recognized in 2014 on the extinguishment of
$1.0 billion
of
7.875%
senior notes due in
2018
.
Income Taxes
Income tax expense
increased
$150 million
in
2014
, compared to
2013
. The increase was primarily due to higher pre-tax income. The effective tax rate was
40.2%
in 2014, compared to
31.4%
in
2013
. The increase in the effective tax rate for
2014
compared to
2013
was primarily due to an increase in the valuation allowance on certain state income tax attributes, which was partially offset by an increase in federal tax credits and a reduction in the effect of Puerto Rico taxes on the effective tax rate.
Guarantor Subsidiaries
Pursuant to the indenture and the supplemental indentures, the long-term debt, excluding capital leases, are fully and unconditionally guaranteed, jointly and severally, on a senior unsecured basis by T-Mobile US, Inc. (“Parent”) and certain of T-Mobile USA’s (“Issuer”) 100% owned subsidiaries (“Guarantor Subsidiaries”). In
2014
, T-Mobile entered into a two-year factoring arrangement to sell certain service accounts receivable on a revolving basis. In connection with the factoring arrangement, the Company formed the Factoring SPE, which is included in the Non-Guarantor Subsidiaries condensed consolidating financial information.
The financial condition of the Parent, Issuer and Guarantor Subsidiaries is substantially similar to the Company’s consolidated financial condition. Similarly, the results of operations of the Parent, Issuer and Guarantor Subsidiaries are substantially similar to the Company’s consolidated results of operations. As of
December 31, 2014
and
December 31, 2013
, the most significant components of the financial condition of the Non-Guarantor Subsidiaries were property and equipment of
$537 million
and
$595 million
, respectively, long-term financial obligations of
$2.3 billion
and
$2.1 billion
, respectively, and stockholders’ deficit of
$1.5 billion
and
$1.3 billion
, respectively. The most significant components of the results of operations of our Non-Guarantor Subsidiaries in
2014
were services revenues of
$1.3 billion
, offset by costs of equipment sales of
$702 million
resulting in a net comprehensive loss of
$38 million
. Similarly, for
2013
, services revenues of
$823 million
were offset by costs of equipment sales of
$552 million
, resulting in a net comprehensive loss of
$52 million
.
28
Year Ended December 31, 2013
Compared to the
Year Ended December 31, 2012
Revenues
Branded postpaid revenues
decreased
$1.4 billion
, or
9%
, in
2013
, compared to
2012
. The decrease was primarily attributable to lower ARPA. Branded postpaid ARPA was negatively impacted by the growth of our Simple Choice plans which have lower priced rate plans than other branded postpaid rate plans. Compared to other traditional bundled postpaid price plans, Simple Choice plans result in lower service revenues but higher equipment sales at the time of the purchase as the plans do not include a bundled sale of a discounted device. Branded postpaid customers on Simple Choice plans more than doubled over the past twelve months to
69%
of the branded postpaid customer base at
December 31, 2013
, compared to
30%
at
December 31, 2012
.
Branded prepaid revenues
increased
$3.2 billion
in
2013
, compared to
2012
. Of the increase, approximately $2.9 billion was due to the inclusion of MetroPCS’s operating results following the business combination in April 2013. Excluding MetroPCS operating results, the increase in
2013
resulted primarily from an increase in average branded prepaid customers driven by the success of T-Mobile’s monthly prepaid service plans, including data services that also have higher ARPU.
Wholesale revenues
increased
$69 million
, or
13%
, in
2013
, compared to
2012
. The increase was primarily attributable to growth of the average number of MVNO customers for the period. The increase in MVNO customers was due in part to growth of government subsidized Lifeline programs offered by our MVNO partners along with MVNO partnerships launched in the fourth quarter of 2012. However, a significant portion of our MVNO partners’ recent customer growth has been in lower ARPU products that result in revenues that do not increase in proportion with customer growth.
Roaming and other service revenues
decreased
$89 million
, or
21%
, in
2013
, compared to
2012
. The decrease was primarily attributable to lower early termination fees of $58 million due to the no annual service contract features of Simple Choice plans launched in March 2013. Additionally, international voice and domestic data revenues decreased due to rate reductions negotiated with certain roaming partners.
Equipment sales
increased
$2.8 billion
, or
124%
, in
2013
, compared to
2012
. The increase was primarily attributable to significant growth in the number of devices sold and an increase in the rate of customers upgrading their device. Additionally, equipment sales increased due to growth in the sales of smartphones, which have higher average revenue per device sold as compared to other devices. This was driven by our introduction of both the Apple iPhone 5 and the Samsung Galaxy S
®
4 in the second quarter of 2013, and the Apple iPhone 5s and iPhone 5c in the third quarter of 2013. Additionally, the inclusion of MetroPCS’s operating results following the business combination in April 2013 contributed approximately $450 million to the increase in equipment sales in
2013
.
We financed
$3.3 billion
of equipment sales revenues through equipment installment plans in
2013
, a significant increase from
$946 million
in
2012
resulting from growth in Simple Choice plans. Additionally, customers had associated equipment installment plan billings of
$1.5 billion
in
2013
, compared to
$450 million
in
2012
.
Other revenues
increased
$55 million
, or
21%
, in
2013
, compared to
2012
due primarily to an increase in imputed rental income on wireless communication tower sites.
Operating Expenses
Cost of services
increased
$618 million
, or
13%
, in
2013
, compared to
2012
. Of the increase, approximately $800 million was due to the inclusion of the operating results of MetroPCS following the business combination in April 2013. Cost of services, excluding MetroPCS, decreased due to lower roaming expenses of $126 million related to reduced roaming rates negotiated with certain roaming partners. Additionally, due to the network transition to enhanced telecommunication lines with higher capacity, we were able to accommodate higher data volumes at a lower cost.
Cost of equipment sales
increased
$3.5 billion
, or
103%
, in
2013
, compared to
2012
. The increase in cost of equipment sales was primarily attributable to a
67%
increase in the volume of devices sold during
2013
. The increase was partially attributable to higher average cost per device sold due in part to a 90% increase in the sale of smartphones units in
2013
, compared to
2012
. Additionally, the inclusion of MetroPCS’s operating results following the business combination in April 2013 contributed approximately $950 million to the increase in cost of equipment sales in
2013
.
Selling, general and administrative
increased
$586 million
, or
9%
, in
2013
, compared to
2012
. Of the increase, approximately $650 million was attributable to the inclusion of operating results of MetroPCS following the business
29
combination in April 2013. Selling, general and administrative expenses, excluding MetroPCS, decreased $61 million, or 1%, primarily driven by $241 million in lower bad debt expense, net of recoveries, as a result of improved credit quality of our customer portfolio. This decrease was partially offset by higher commission expenses driven by increased gross customer additions in
2013
.
Depreciation and amortization
increased
$440 million
, or
14%
, in
2013
, compared to
2012
. Depreciation and amortization attributable to MetroPCS following the business combination in April 2013 was approximately $550 million. Depreciation and amortization expenses, excluding MetroPCS, decreased in
2013
as
2012
included increased depreciation expense due to the shortening of useful lives of certain network equipment to be replaced in connection with network modernization efforts.
Cost of MetroPCS business combination
increased
$101 million
in
2013
, compared to
2012
due primarily to personnel related costs associated with the change in control, professional services costs and network integration expenses associated with the business combination between T-Mobile USA and MetroPCS. See also
Note 2 – Business Combination with MetroPCS
of the
Notes to the Consolidated Financial Statements
included in
Part II, Item 8
of this
Form 10-K
.
Gain on disposal of spectrum licenses
of
$205 million
in
2012
primarily consisted of non-cash gains related to an AWS spectrum license exchange with Verizon.
Other, net
of
$54 million
in
2013
relates primarily to our 2013 cost restructuring program to align our operations to our new strategy and position the company for future growth. Costs associated with the 2013 restructuring program primarily consist of severance and other personnel-related costs. Other, net of
$99 million
in
2012
related primarily to the consolidation of our call center operations in
2012
.
Other Income (Expense)
Interest expense to affiliates
increased
$17 million
, or
3%
, in
2013
, compared to
2012
. Prior to the closing of the business combination with MetroPCS, Deutsche Telekom recapitalized T-Mobile USA by retiring its long-term debt to affiliates of
$14.5 billion
and all related derivative instruments, in exchange for new senior unsecured notes of
$11.2 billion
. Later in
2013
, Deutsche Telekom sold the senior non-reset notes resulting in an aggregate principal reduction of
$5.6 billion
in long-term debt to affiliates. The increase in interest expense to affiliates was primarily due to losses related to the retirement of derivative instruments associated with the extinguishment of the long-term debt to affiliates prior to the business combination, and higher average interest rates on the new senior unsecured notes. See also
Note 8 – Debt
and
Note 14 – Additional Financial Information
of the
Notes to the Consolidated Financial Statements
included in
Part II, Item 8
of this
Form 10-K
.
Interest expense
increased
$545 million
in
2013
, compared to
2012
. The increase in interest expense is primarily the result of MetroPCS long-term debt assumed during the second quarter of 2013 in connection with the business combination, as well as new senior notes issued during 2013. Additionally, interest expense of approximately $200 million in
2013
related to the long-term financial obligation resulting from the Tower Transaction that closed on November 30, 2012. The Tower Transaction and related impacts are further described in
Note 9 – Tower Transaction and Related Long-Term Financial Obligation
of the
Notes to the Consolidated Financial Statements
included in
Part II, Item 8
of this
Form 10-K
.
Interest income
increased
$112 million
in
2013
, compared to
2012
. The increase in interest income is the result of the significant growth in handsets financed through our equipment installment plans in
2013
. Imputed interest associated with our EIP receivables is imputed at the time of sale and then recognized over the financed installment term.
Other income (expense), net
increased
$94 million
in
2013
, compared to
2012
. The increase in other income (expense), net was primarily due to the recognition of gains related to the retirement of derivative instruments associated with the pre-business combination long-term debt to affiliates. See also
Note 8 – Debt
and
Note 14 – Additional Financial Information
of the
Notes to the Consolidated Financial Statements
included in
Part II, Item 8
of this
Form 10-K
.
Income Taxes
Income tax expense
decreased
$334 million
in
2013
, compared to
2012
. The decrease in income tax expense was primarily due to lower pre-tax income, exclusive of impairment charges. The effective tax rate was
31.4%
and
(5.0)%
for the years ended
December 31, 2013
and
2012
, respectively. The change in the effective tax rate for
2013
compared to
2012
was primarily due to the impact of the goodwill impairment recorded in
2012
.
30
Guarantor Subsidiaries
In 2013, T-Mobile entered into an agreement with Cook Inlet Voice and Data Services, Inc. (“Cook Inlet”) to acquire all of Cook Inlet's interest in Cook Inlet/VoiceStream GSM VII PCS Holdings LLC, (“CIVS VII”), a fully consolidated Non-Guarantor Subsidiary. The transaction was completed in July 2013 and resulted in CIVS VII becoming an indirect wholly-owned subsidiary of T-Mobile USA. CIVS VII was subsequently combined with, and the net assets transferred to, T-Mobile License LLC, a wholly-owned Restricted Subsidiary of T-Mobile USA.
The financial condition of the Parent, Issuer and Guarantor Subsidiaries is substantially similar to the Company’s consolidated financial condition. Similarly, the results of operations of the Parent, Issuer and Guarantor Subsidiaries are substantially similar to the Company’s consolidated results of operations. The change in the financial condition of the Non-Guarantor Subsidiaries was primarily due to the transfer of the net assets of CIVS VII into the Guarantor Subsidiaries consolidating balance sheet information as described above. As of
December 31, 2013
, the most significant components of the financial condition of the Non-Guarantor Subsidiaries were property and equipment of
$595 million
, long-term financial obligations of
$2.1 billion
, and stockholders’ deficit of
$1.3 billion
. The most significant components of the results of operations of our Non-Guarantor Subsidiaries in
2012
, were services revenues of
$712 million
were offset by costs of equipment sales of
$449 million
, resulting in a net comprehensive income of
$72 million
.
Performance Measures
In managing our business and assessing financial performance, we supplement the information provided by the financial statements with other operating or statistical data and non-GAAP financial measures. These operating and financial measures are utilized by our management to evaluate our operating performance and, in certain cases, our ability to meet liquidity requirements. Although companies in the wireless industry may not define each of these measures in precisely the same way, we believe that these measures facilitate key operating performance comparisons with other companies in the wireless industry.
Total Customers
A customer is generally defined as a SIM card with a unique T-Mobile identity number which is associated with an account that generates revenue. Branded customers generally include customers that are qualified either for postpaid service, where they generally pay after incurring service, or prepaid service, where they generally pay in advance. Wholesale customers include M2M and MVNO customers that operate on our network, but are managed by wholesale partners.
The following table sets forth the number of ending customers:
|
(in thousands)
|
December 31,
2014 |
December 31,
2013 |
December 31,
2012 |
|||||
|
Customers, end of period
|
||||||||
|
Branded postpaid phone customers
|
25,844
|
|
21,797
|
|
19,858
|
|
||
|
Branded postpaid mobile broadband customers
|
1,341
|
|
502
|
|
435
|
|
||
|
Total branded postpaid customers
|
27,185
|
|
22,299
|
|
20,293
|
|
||
|
Branded prepaid customers
|
16,316
|
|
15,072
|
|
5,826
|
|
||
|
Total branded customers
|
43,501
|
|
37,371
|
|
26,119
|
|
||
|
M2M customers
|
4,421
|
|
3,602
|
|
3,090
|
|
||
|
MVNO customers
|
7,096
|
|
5,711
|
|
4,180
|
|
||
|
Total wholesale customers
|
11,517
|
|
9,313
|
|
7,270
|
|
||
|
Total customers, end of period
|
55,018
|
|
46,684
|
|
33,389
|
|
||
31
The following table sets forth the number of net customer additions (losses):
|
Year Ended December 31,
|
||||||||
|
(in thousands)
|
2014
|
2013
|
2012
|
|||||
|
Net customer additions (losses)
|
||||||||
|
Branded postpaid phone customers
|
4,047
|
|
1,938
|
|
(2,092
|
)
|
||
|
Branded postpaid mobile broadband customers
|
839
|
|
68
|
|
18
|
|
||
|
Total branded postpaid customers
|
4,886
|
|
2,006
|
|
(2,074
|
)
|
||
|
Branded prepaid customers
|
1,244
|
|
328
|
|
1,007
|
|
||
|
Total branded customers
|
6,130
|
|
2,334
|
|
(1,067
|
)
|
||
|
M2M customers
|
819
|
|
512
|
|
660
|
|
||
|
MVNO customers
|
1,385
|
|
1,531
|
|
610
|
|
||
|
Total wholesale customers
|
2,204
|
|
2,043
|
|
1,270
|
|
||
|
Total net customer additions
|
8,334
|
|
4,377
|
|
203
|
|
||
|
Acquired customers
|
—
|
|
8,918
|
|
—
|
|
||
Net customer additions were
8,334,000
in
2014
, compared to net customer additions of
4,377,000
in
2013
. At
December 31, 2014
, we had
55.0 million
customers, an
18%
increase from the customer total as of
December 31, 2013
, as a result of growth in all customer categories, as described below.
Net customer additions, excluding customers acquired as a result of the MetroPCS business combination were
4,377,000
in
2013
, compared to
203,000
net customer additions in
2012
. At
December 31, 2013
, we had
46.7 million
customers, a
40%
increase from the customer total as of
December 31, 2012
. The increase was primarily driven by the addition of MetroPCS’s customer base due to the completion of the business combination during the second quarter of 2013, which increased the branded prepaid customer base by
8,918,000
.
Branded Customers
Branded postpaid phone net customer additions were
4,047,000
in
2014
, compared to branded postpaid phone net customer additions of
1,938,000
in
2013
. The increase in customer development was attributable to increased new customer activations and improved branded postpaid phone churn driven by the continued success of our Un-carrier proposition and strong customer response to promotions for services and devices. Additional increases in customer development resulted from the launch of new popular devices.
Branded postpaid phone net customer additions were
1,938,000
in
2013
, compared to branded postpaid phone net customer losses of
2,092,000
in
2012
. The significant improvement in customer development was primarily attributable to improved branded postpaid phone churn, increased new customer activations and qualified upgrades of branded prepaid customers to branded postpaid plans. Branded postpaid phone net customer additions benefited from the launch of Simple Choice plans as a component of the Un-carrier proposition and launch of popular devices in 2013. These factors drove incremental gross additions for branded postpaid phone customers and improved churn as further described below.
Branded postpaid mobile broadband net customer additions were
839,000
in
2014
, compared to branded postpaid mobile broadband net customer additions of
68,000
in
2013
. The significant increase was driven by strong customer response to promotions for mobile broadband services and devices.
Branded postpaid mobile broadband net customer additions were
68,000
in
2013
, compared to branded postpaid mobile broadband net customer additions of
18,000
in
2012
. The increase was driven by the positive customer response to the “Tablets Un-leashed” promotion launched in October 2013.
Branded prepaid net customer additions were
1,244,000
in
2014
, compared to branded prepaid net customer additions of
328,000
in
2013
. The increase in customer development was attributable to higher branded prepaid gross customer additions due to the growth and expansion of the MetroPCS brand, including the launch into additional markets following the MetroPCS business combination in April 2013. This increase was offset in part by higher deactivations from the competitive environment in the prepaid market.
Branded prepaid net customer additions, excluding customers of MetroPCS acquired as a result of the business combination, were
328,000
in
2013
, compared to
1,007,000
branded prepaid net customer additions in
2012
. The decrease was partly a result of qualified upgrades of branded prepaid customers to branded postpaid plans as the Un-carrier proposition eliminates
32
annual service contracts to credit worthy customers that have historically been utilizing prepaid products. In addition, the robust competitive environment in the prepaid market resulted in higher branded prepaid customer deactivations, partially offset by higher branded prepaid gross customer additions due in part to the expansion of the MetroPCS brand, including the launch into 30 additional markets since the completion of the business combination.
Wholesale
Wholesale net customer additions were
2,204,000
in
2014
, compared to wholesale net customer additions of
2,043,000
in
2013
. The increase was primarily attributable to higher M2M gross customer additions resulting from strong activation volume, partially offset by a decrease in MVNO net customer additions driven by higher churn. T-Mobile offers its M2M customers innovative products and solutions to assist them in embracing the Internet of Things (“IoT”). MVNO customers continued to grow, although at a slower rate in 2014 than 2013. MVNO partners often have relationships with multiple carriers and through steering their business towards carriers offering promotions, can impact specific carriers’ results.
Wholesale net customer additions were
2,043,000
in
2013
, compared to wholesale net customer additions of
1,270,000
in
2012
. The growth in MVNO customers was due in part to government subsidized Lifeline programs offered by our MVNO partners along with ongoing growth from MVNO partnerships launched in the fourth quarter of 2012.
Customers Per Account
Customers per account is calculated by dividing the number of branded postpaid customers as of the end of the period by the number of branded postpaid accounts as of the end of the period. An account may include branded postpaid phone and mobile broadband customers. We believe branded postpaid customers per account provides management with useful information to evaluate our branded postpaid customer base on a per account basis.
|
Year Ended December 31,
|
||||||||
|
2014
|
2013
|
2012
|
||||||
|
Branded postpaid customers per account
|
2.36
|
|
2.18
|
|
2.17
|
|
||
Branded postpaid customers per account were
2.36
as of
December 31, 2014
, compared to
2.18
as of
December 31, 2013
. The increase was primarily due to an increase in the average number of branded postpaid phone customers per account resulting from promotions for services, including the “4 for $100” offer, and increased penetration of mobile broadband devices.
Branded postpaid customers per account as of
December 31, 2013
was consistent compared to
December 31, 2012
.
Churn
Churn represents the number of customers whose service was discontinued as a percentage of the average number of customers during the specified period. The number of customers whose service was discontinued is presented net of customers that subsequently have their service restored. We believe that churn provides management with useful information to evaluate customer retention and loyalty.
|
Year Ended December 31,
|
||||||||
|
2014
|
2013
|
2012
|
||||||
|
Branded postpaid phone churn
|
1.58
|
%
|
1.69
|
%
|
2.33
|
%
|
||
|
Branded prepaid churn
|
4.76
|
%
|
5.37
|
%
|
6.44
|
%
|
||
Branded postpaid phone churn was
1.58%
for the
year ended
December 31, 2014
, an
11
basis point
improvement
compared to
1.69%
in
2013
. The year over year improvement in branded postpaid phone churn was impacted by the continued success of our Un-carrier initiatives resulting in increased customer loyalty.
Branded postpaid phone churn was
1.69%
for the
year ended
December 31, 2013
, a
64
basis point
improvement
compared to
2.33%
in
2012
. The significant improvements were due in part to the continued focus on churn reduction initiatives, such as improving network quality and the customer sales experience. Additionally, our no annual service contracts announced in the first quarter of 2013 gained positive traction with customers. We also began offering new handsets in 2013, such as Apple iPhone products and the Samsung Galaxy S4, which improved customer retention compared to the same periods in 2012.
33
Branded prepaid churn was
4.76%
for the
year ended
December 31, 2014
, a
61
basis point
improvement
compared to
5.37%
in
2013
. The improvement was primarily due to the inclusion and growth of MetroPCS customers, which represent the largest portion of the branded prepaid customer base and historically have lower rates of churn than T-Mobile branded prepaid customers.
Branded prepaid churn was
5.37%
for the
year ended
December 31, 2013
, a
107
basis point
improvement
compared to
6.44%
in
2012
. The improvement was primarily a result of the completion of the business combination with MetroPCS during the second quarter of 2013. MetroPCS customers are now the largest portion of the branded prepaid customer base and have historically had lower rates of churn than the historical T-Mobile branded prepaid business. Consequently, branded prepaid churn was impacted positively by the inclusion of MetroPCS customers.
Average Revenue Per Account, Average Billings Per Account, Average Revenue Per User, and Average Billings Per User
Average Revenue Per Account (“ARPA”) represents the average monthly branded postpaid service revenue earned per account. An account may include branded postpaid phone and mobile broadband customers. We believe branded postpaid ARPA provides management, investors and analysts with useful information to assess and evaluate our branded postpaid service revenue realization and assist in forecasting our future branded postpaid service revenues on a per account basis. We consider branded postpaid ARPA to be indicative of our revenue growth potential given the increase in the average number of branded postpaid phone customers per account and increased penetration of mobile broadband devices.
Average Billings Per Account (“ABPA”) represents the average monthly branded postpaid customer billings per account. We believe branded postpaid ABPA provides management, investors and analysts with useful information to evaluate average branded postpaid customer billings per account as it is indicative of estimated cash collections, including equipment installments payments, from our customers each month on a per account basis.
Average Revenue Per User (“ARPU”) represents the average monthly service revenue earned from customers. Branded postpaid phone ARPU excludes mobile broadband customers and related revenues. We believe branded postpaid phone ARPU and branded postpaid ARPA are useful metrics when assessing the realization of branded postpaid service revenues.
We believe branded prepaid ARPU provides management, investors and analysts with useful information to assess and evaluate our branded prepaid service revenue realization and assist in forecasting our future branded prepaid service revenues on a per customer basis.
Average Billings Per User (“ABPU”) represents the average monthly branded postpaid customer billings. We believe branded postpaid ABPU and branded postpaid ABPA are useful metrics when evaluating average branded postpaid customer billings.
The following tables illustrate the calculation of ARPA and ABPA and reconcile these measures to the related service revenues, which we consider to be the most directly comparable GAAP financial measure to ARPA and ABPA:
|
|
Year Ended December 31,
|
||||||||||
|
(in millions, except average number of accounts, ARPA and ABPA)
|
2014
|
2013
|
2012
|
||||||||
|
Calculation of Branded Postpaid ARPA:
|
|||||||||||
|
Branded postpaid service revenues
|
$
|
14,392
|
|
$
|
13,166
|
|
$
|
14,521
|
|
||
|
Divided by: Average number of branded postpaid accounts (in thousands) and number of months in period
|
11,008
|
|
9,638
|
|
9,975
|
|
|||||
|
Branded postpaid ARPA
|
$
|
108.95
|
|
$
|
113.84
|
|
$
|
121.31
|
|
||
|
Calculation of Branded Postpaid ABPA:
|
|||||||||||
|
Branded postpaid service revenues
|
$
|
14,392
|
|
$
|
13,166
|
|
$
|
14,521
|
|
||
|
Add: EIP billings
|
3,596
|
|
1,471
|
|
450
|
|
|||||
|
Total billings for branded postpaid customers
|
$
|
17,988
|
|
$
|
14,637
|
|
$
|
14,971
|
|
||
|
Divided by: Average number of branded postpaid accounts (in thousands) and number of months in period
|
11,008
|
|
9,638
|
|
9,975
|
|
|||||
|
Branded postpaid ABPA
|
$
|
136.17
|
|
$
|
126.55
|
|
$
|
125.07
|
|
||
Branded postpaid ARPA
decreased
$4.89
, or
4%
, for
2014
, compared to
2013
. The decrease was primarily due to the continued growth of customers on Simple Choice plans, which have lower monthly service charges compared to traditional bundled plans, and promotions for services, including the “4 for $100” offer.
34
Branded postpaid ARPA
decreased
$7.47
, or
6%
, for
2013
, compared to
2012
. The decrease was primarily due to the continued growth of customers on Simple Choice plans, which have lower monthly service charges compared to traditional bundled plans. This was offset in part by increased data revenues from continued growth in smartphone penetration.
Branded postpaid ABPA
increased
$9.62
, or
8%
, for
2014
compared to
2013
, and
increased
$1.48
, or
1%
, for
2013
compared to
2012
. The increases were primarily due to growth in devices financed through EIP, offset in part by lower branded postpaid ARPA.
The following tables illustrate the calculation of ARPU and ABPU and reconcile these measures to the related service revenues, which we consider to be the most directly comparable GAAP financial measure to ARPU and ABPU:
|
|
Year Ended December 31,
|
||||||||||
|
(in millions, except average number of customers, ARPU and ABPU)
|
2014
|
2013
|
2012
|
||||||||
|
Calculation of Branded Postpaid Phone ARPU:
|
|||||||||||
|
Branded postpaid service revenues
|
$
|
14,392
|
|
$
|
13,166
|
|
$
|
14,521
|
|
||
|
Less: Branded postpaid mobile broadband revenues
|
(261
|
)
|
(169
|
)
|
(185
|
)
|
|||||
|
Branded postpaid phone service revenues
|
$
|
14,131
|
|
$
|
12,997
|
|
$
|
14,336
|
|
||
|
Divided by: Average number of branded postpaid phone customers (in thousands) and number of months in period
|
23,817
|
|
20,424
|
|
20,872
|
|
|||||
|
Branded postpaid phone ARPU
|
$
|
49.44
|
|
$
|
53.03
|
|
$
|
57.23
|
|
||
|
Calculation of Branded Postpaid ABPU:
|
|||||||||||
|
Branded postpaid service revenues
|
$
|
14,392
|
|
$
|
13,166
|
|
$
|
14,521
|
|
||
|
Add: EIP billings
|
3,596
|
|
1,471
|
|
450
|
|
|||||
|
Total billings for branded postpaid customers
|
$
|
17,988
|
|
$
|
14,637
|
|
$
|
14,971
|
|
||
|
Divided by: Average number of branded postpaid customers (in thousands) and number of months in period
|
24,683
|
|
20,858
|
|
21,306
|
|
|||||
|
Branded postpaid ABPU
|
$
|
60.73
|
|
$
|
58.48
|
|
$
|
58.56
|
|
||
|
Calculation of Branded Prepaid ARPU:
|
|||||||||||
|
Branded prepaid service revenues
|
$
|
6,986
|
|
$
|
4,945
|
|
$
|
1,715
|
|
||
|
Divided by: Average number of branded prepaid customers (in thousands) and number of months in period
|
15,691
|
|
11,913
|
|
5,325
|
|
|||||
|
Branded prepaid ARPU
|
$
|
37.10
|
|
$
|
34.59
|
|
$
|
26.85
|
|
||
Branded postpaid phone ARPU
decreased
$3.59
, or
7%
, for
2014
, compared to
2013
. The decrease was primarily due to the continued growth of customers on Simple Choice plans, which have lower monthly service charges compared to traditional bundled plans, and promotions for services, including the “4 for $100” offer.
Branded postpaid phone ARPU
decreased
$4.20
, or
7%
, for
2013
, compared to
2012
. The decrease was primarily due to the continued growth of customers on Simple Choice plans, which have lower monthly service charges compared to traditional bundled plans. This was offset in part by increased data revenues from continued growth in smartphone penetration.
Branded postpaid ABPU
increased
$2.25
, or
4%
for
2014
, compared to
2013
. The increase was primarily due to growth in devices financed through EIP, offset in part by lower branded postpaid phone ARPU.
Branded postpaid ABPU
decreased
$0.08
for
2013
, compared to
2012
. The decrease was primarily due lower branded postpaid phone ARPU, offset in part by growth in devices financed through EIP.
Branded prepaid ARPU
increased
$2.51
or
7%
for
2014
, compared to
2013
. The increase was primarily due to the inclusion and growth of the MetroPCS customer base, which generate higher ARPU than the rest of T-Mobile’s branded prepaid customers.
Branded prepaid ARPU
increased
$7.74
or
29%
for
2013
, compared to
2012
. The increase was primarily due to the inclusion of MetroPCS customer base, which generate higher ARPU than the rest of T-Mobile’s branded prepaid customers, as well as the growth of monthly prepaid service plans, which include data services and have higher ARPU than other pay-as-you-go prepaid plans.
35
Adjusted EBITDA
Adjusted EBITDA represents earnings before interest expense (net of interest income), tax, depreciation, amortization, stock-based compensation and expenses not reflective of T-Mobile’s ongoing operating performance. Adjusted EBITDA margin is Adjusted EBITDA divided by service revenues.
Adjusted EBITDA is a non-GAAP financial measure utilized by our management to monitor the financial performance of our operations. We use Adjusted EBITDA internally as a metric to evaluate and compensate our personnel and management for their performance, and as a benchmark to evaluate our operating performance in comparison to our competitors. Management also uses Adjusted EBITDA to measure our ability to provide cash flows to meet future debt services, capital expenditures and working capital requirements, and fund future growth. We believe analysts and investors use Adjusted EBITDA as a supplemental measure to evaluate overall operating performance and facilitate comparisons with other wireless communications companies. Adjusted EBITDA has limitations as an analytical tool and should not be considered in isolation or as a substitute for income from operations, net income, or any other measure of financial performance reported in accordance with GAAP.
The following table illustrates the calculation of Adjusted EBITDA and reconciles Adjusted EBITDA to net income (loss)which we consider to be the most directly comparable GAAP financial measure to Adjusted EBITDA:
|
Year Ended December 31,
|
|||||||||||
|
(in millions)
|
2014
|
2013
|
2012
|
||||||||
|
Net income (loss)
|
$
|
247
|
|
$
|
35
|
|
$
|
(7,336
|
)
|
||
|
Adjustments:
|
|||||||||||
|
Interest expense to affiliates
|
278
|
|
678
|
|
661
|
|
|||||
|
Interest expense
|
1,073
|
|
545
|
|
—
|
|
|||||
|
Interest income
|
(359
|
)
|
(189
|
)
|
(77
|
)
|
|||||
|
Other expense (income), net
|
11
|
|
(89
|
)
|
5
|
|
|||||
|
Income tax expense
|
166
|
|
16
|
|
350
|
|
|||||
|
Operating income (loss)
|
1,416
|
|
996
|
|
(6,397
|
)
|
|||||
|
Depreciation and amortization
|
4,412
|
|
3,627
|
|
3,187
|
|
|||||
|
Cost of MetroPCS business combination
|
299
|
|
108
|
|
7
|
|
|||||
|
Stock based compensation
(1)
|
211
|
|
100
|
|
—
|
|
|||||
|
Gains on disposal of spectrum licenses
(1)
|
(720
|
)
|
—
|
|
(156
|
)
|
|||||
|
Impairment charges
|
—
|
|
—
|
|
8,134
|
|
|||||
|
Other, net
(1)
|
18
|
|
54
|
|
111
|
|
|||||
|
Adjusted EBITDA
|
$
|
5,636
|
|
$
|
4,885
|
|
$
|
4,886
|
|
||
|
Adjusted EBITDA margin
|
25
|
%
|
26
|
%
|
28
|
%
|
|||||
|
(1)
|
Stock-based compensation includes tax impacts and may not agree to stock based compensation expense in the consolidated financial statements. Gains on disposal of spectrum licenses and Other, net transactions may not agree in total to the Gains on disposal of spectrum licenses and Other, net in the
Consolidated Statements of Comprehensive Income (Loss)
primarily due to certain routine operating activities, such as insignificant or routine spectrum license exchanges that would be expected to reoccur, and are therefore included in Adjusted EBITDA.
|
Adjusted EBITDA
increased
15%
for
2014
, compared to
2013
. Adjusted EBITDA was positively impacted by increased branded postpaid revenues resulting from the continued success of our Un-carrier value proposition and strong customer response to promotional activities, as well as the inclusion of MetroPCS operating results since the business combination in
2013
, including branded prepaid revenue growth from expansion of the MetroPCS brand. These increases were partially offset by higher selling, general and administrative expenses and losses on equipment sales.
Adjusted EBITDA was consistent for
2013
, compared to
2012
. The inclusion of MetroPCS’s operating results since May 1, 2013, contributed approximately $1.0 billion in Adjusted EBITDA for
2013
. Excluding the Adjusted EBITDA contributed by MetroPCS’s operating results, Adjusted EBITDA was negatively impacted by the reduction in service revenues, which declined primarily due to impacts from customers migrating to Simple Choice plans, which result in lower ARPU. Additionally, Adjusted EBITDA was negatively impacted by increases in cost of equipment sales from higher sales volumes, partially offset by increases in equipment sales. Increases in costs of equipment sales and equipment sales were driven by higher gross customer additions and the launch of new handsets in 2013. In addition, equipment sales increased in
2013
due to a higher proportion of customers choosing Simple Choice plans for which we do not include a bundled sale of a discounted device.
36
Adjusted EBITDA in the first quarter of 2015 is expected to be significantly impacted by a large investment to front end customer growth in 2015, similar to what we did in 2014. In addition, the first quarter of 2015 will reflect the accounting treatment of Un-carrier 8.0 - Data Stash, which is expected to have a non-cash impact in the range of $100 million to $150 million. The accounting treatment of the initial 10 GB allotment, which is a revenue deferral, is expected to fully reverse itself during 2015.
Liquidity and Capital Resources
Our principal sources of liquidity are our cash and cash equivalents and cash generated from operations, proceeds from issuance of long-term debt and issuance of common and preferred stock, the sale of certain service receivables related to a factoring arrangement, and financing arrangements of vendor payables which effectively extend payment terms. In addition, we have entered into an unsecured revolving credit facility with Deutsche Telekom that allows for up to
$500 million
in borrowings. As of
December 31, 2014
, our cash and cash equivalents were
$5.3 billion
. We expect our current sources of funding to be sufficient to meet the anticipated liquidity requirements of the Company in the next 12 months and intend to use our current sources of funding for general corporate purposes, including capital investments, enhancing our financial flexibility and opportunistically acquiring additional spectrum in private party transactions. We determine future liquidity requirements, for both operations and capital expenditures, based in large part upon projected financial and operating performance. We regularly review and update these projections for changes in current and projected financial and operating results, general economic conditions, the competitive landscape and other factors. There are a number of risks and uncertainties that could cause our financial and operating results and capital requirements to differ materially from our projections, which could cause future liquidity to differ materially from our assessment. We may seek to raise additional debt or equity capital to the extent our projections regarding our liquidity requirements change or on an opportunistic basis when there are favorable market conditions. Further, we may consider entering into factoring arrangements to sell certain EIP receivables as an additional source of liquidity.
Prior to the completion of the business combination with MetroPCS in April 2013, our sources of liquidity were cash and cash equivalents and short-term investments with Deutsche Telekom included in accounts receivable from affiliates, and cash generated from operations.
As of
December 31, 2014
, our total capital consisted of total debt of
$22.0 billion
, excluding our long-term financial obligation related to the tower transaction, and stockholders’ equity of
$15.7 billion
. In
2014
, we completed an offering of new senior unsecured notes in aggregate principal amounts of
$3.0 billion
and used a portion of the proceeds from the issuance of the notes to redeem senior unsecured notes of
$1.0 billion
with a higher interest rate. In addition, in
2014
, we completed a public offering of
20 million
shares of preferred stock for net proceeds of
$982 million
. Unless converted earlier, each share of the preferred stock will automatically convert in
2017
into between
1.6119
and
1.9342
shares of common stock depending on the applicable market value of the common stock. See
Note 8 – Debt
and
Note 14 – Additional Financial Information
of the
Notes to the Consolidated Financial Statements
included in
Part II, Item 8
of this
Form 10-K
for further information.
In
2014
, we completed transactions for the acquisition of 700 MHz A-Block, AWS and PCS spectrum licenses, primarily with Verizon, for cash and the transfer of certain AWS and PCS spectrum licenses. Upon closing of the transactions in 2014, we paid
$2.5 billion
with cash on hand and transferred certain AWS and PCS spectrum licenses. In addition, in 2014, the FCC began conducting an auction of AWS spectrum licenses and T-Mobile provided the FCC with a deposit of
$417 million
in connection with the auction. In
January 2015
, the FCC announced T-Mobile was the winning bidder of AWS spectrum licenses covering approximately
97 million
people for an aggregate bid price of
$1.8 billion
. T-Mobile will pay the FCC the remaining
$1.4 billion
for the AWS spectrum licenses in
March 2015
with cash on hand. T-Mobile expects to receive the AWS spectrum licenses, subject to regulatory approval, in the
second quarter of 2015
.
In
2014
, we entered into a two-year factoring arrangement to sell certain receivables on a revolving basis as an additional source of liquidity. The factoring arrangement has a current maximum funding limit of
$640 million
, subject to change upon notification to certain third parties. We sold receivables related to the factoring arrangement for net cash proceeds of
$610 million
in
2014
. See
Note 4 – Factoring Arrangement
of the
Notes to the Consolidated Financial Statements
included in
Part II, Item 8
of this
Form 10-K
for further information.
The indentures governing the long-term debt, excluding capital leases, contain covenants that, among other things, limit our ability to: incur more debt; pay dividends and make distributions on our common stock; make certain investments; repurchase stock; create liens or other encumbrances; enter into transactions with affiliates; enter into transactions that restrict dividends or distributions from subsidiaries; and merge, consolidate, or sell, or otherwise dispose of, substantially all of their assets. Certain provisions of each of the indentures and the supplemental indentures relating to the long-term debt restrict the ability of the Issuer to loan funds or make payments to the Parent. However, the Issuer is allowed to make certain permitted payments to the
37
Parent under the terms of each of the indentures and the supplemental indentures relating to the long-term debt. We were in compliance with all restrictive debt covenants as of
December 31, 2014
.
Capital Expenditures
Our liquidity requirements have been driven primarily by capital expenditures for spectrum licenses and the construction, expansion and upgrading of our network infrastructure.
The property and equipment capital expenditures in
2014
and
2013
primarily relate to our network modernization and deployment of LTE. The capital expenditures in
2012
were primarily associated with the continued expansion of our network coverage. During
2012
, we were developing plans to deploy LTE in
2013
after the terminated AT&T transaction. As such, capital spending was lower in
2012
than in subsequent periods.
We expect cash capital expenditures for property and equipment to be in the range of
$4.4 billion
to
$4.7 billion
in
2015
. This does not include purchases of spectrum licenses.
Cash Flows
The following table summarizes the consolidated statements of cash flows:
|
Year Ended December 31,
|
|||||||||||
|
(in millions)
|
2014
|
2013
|
2012
|
||||||||
|
Net cash provided by operating activities
|
$
|
4,146
|
|
$
|
3,545
|
|
$
|
3,862
|
|
||
|
Net cash used in investing activities
|
(7,246
|
)
|
(2,092
|
)
|
(3,915
|
)
|
|||||
|
Net cash provided by financing activities
|
2,524
|
|
4,044
|
|
57
|
|
|||||
The historical cash flows of T-Mobile USA should not be considered representative of the anticipated cash flows of T-Mobile US, Inc., the combined company resulting from the business combination.
Operating Activities
Cash provided by operating activities was
$4.1 billion
in
2014
, compared to
$3.5 billion
in
2013
. The increase in cash flow provided by operating activities was driven by several factors. Our operating income, exclusive of non-cash items such as depreciation and amortization and gains from spectrum license transactions, increased slightly compared to the prior year. This was primarily a result of increases in branded postpaid revenues due to our acceleration of customer growth partially offset by higher selling, general and administrative costs and losses on equipment sales. Net changes in working capital increased slightly. This was primarily a result of increases in accounts payable and accrued liabilities due to the timing of vendor payments and proceeds from the sales of certain service receivables related to the factoring arrangement. The increases in working capital were mostly offset by increases in EIP receivables as the result of significant growth in devices financed through EIP and increases in inventories.
Cash provided by operating activities was
$3.5 billion
in
2013
, compared to
$3.9 billion
in
2012
. The decrease in cash flow provided by operating activities was driven by several factors. Our operating income, exclusive of non-cash items such as impairment charges and depreciation and amortization, declined compared to the same period in the prior year primarily as a result of decreases in branded postpaid revenues. Net changes in working capital decreased slightly due to increases in EIP receivables, offset in part by increases in accounts payable and accrued liabilities due in part to timing of vendor payments.
Investing Activities
Cash used in investing activities was
$7.2 billion
in
2014
, compared to
$2.1 billion
used in
2013
. In
2014
, cash used in investing activities primarily consisted of purchases of property and equipment of
$4.3 billion
as a result of our network modernization and purchases of intangible assets of
$2.9 billion
due primarily to the acquisition of 700 MHz A-Block spectrum licenses. In
2013
, cash used in investing activities primarily consisted of purchases of property and equipment of
$4.0 billion
as a result of our network modernization. This was partially offset by cash and cash equivalents acquired in connection with the business combination with MetroPCS of
$2.1 billion
and the settlement of a short-term loan receivable, net with Deutsche Telekom of
$300 million
.
38
Cash used in investing activities was
$2.1 billion
in
2013
, compared to
$3.9 billion
used in
2012
. The decrease was primarily due to the cash and cash equivalents acquired in connection with the business combination with MetroPCS of
$2.1 billion
. The decrease was partially offset by
$1.1 billion
higher purchases of property and equipment in
2013
, as compared to
2012
, as a result of T-Mobile’s network modernization in 2013 described above.
Financing Activities
Cash provided by financing activities was
$2.5 billion
in
2014
, compared to
$4.0 billion
in
2013
. The decrease was primarily due to higher repayments of long-term debt of
$1.0 billion
, lower net proceeds from the issuance of stock of
$805 million
, higher net repayments of short-term debt of
$174 million
and lower proceeds from the exercise of stock options of
$110 million
. The decrease was partially offset by higher net proceeds from the issuance of long-term debt of
$499 million
.
Cash provided by financing activities was
$4.0 billion
in
2013
, compared to
$57 million
in
2012
. The increase was primarily due to net proceeds of
$2.5 billion
from the issuance of long-term debt, net proceeds from the issuance of common stock of
$1.8 billion
, and proceeds from the exercises of stock options issued of
$137 million
. The increase was offset by repayments of short-term debt for purchases of property and equipment of
$244 million
, the purchase of Cook Inlet's interest in CIVS VII of
$80 million
, and a distribution to Deutsche Telekom of
$41 million
in connection with the recapitalization of T-Mobile USA effected immediately prior to the completion of the business combination with MetroPCS.
Contractual Obligations
Current accounting standards require disclosure of material obligations and commitments to make future payments under contracts, such as debt, lease agreements, and purchase obligations. See
Note 8 – Debt
and
Note 13 – Commitments and Contingencies
of the
Notes to the Consolidated Financial Statements
included in
Part II, Item 8
of this
Form 10-K
.
The following table provides aggregate information about T-Mobile’s contractual obligations as of
December 31, 2014
:
|
(in millions)
|
Less Than 1 Year
|
1 - 3 Years
|
4 - 5 Years
|
More Than 5 Years
|
Total
|
||||||||||||||
|
Long-term debt
(1)
|
$
|
—
|
|
$
|
—
|
|
$
|
3,000
|
|
$
|
18,200
|
|
$
|
21,200
|
|
||||
|
Interest on long-term debt
|
1,320
|
|
2,644
|
|
2,563
|
|
3,000
|
|
9,527
|
|
|||||||||
|
Capital lease obligations, including interest
|
49
|
|
102
|
|
107
|
|
319
|
|
577
|
|
|||||||||
|
Vendor financing arrangements
|
64
|
|
—
|
|
—
|
|
—
|
|
64
|
|
|||||||||
|
Financial obligation
(2)
|
166
|
|
332
|
|
332
|
|
1,316
|
|
2,146
|
|
|||||||||
|
Operating leases, including dedicated transportation lines
|
2,289
|
|
4,073
|
|
3,420
|
|
5,520
|
|
15,302
|
|
|||||||||
|
Non-dedicated transportation lines
|
715
|
|
1,389
|
|
945
|
|
935
|
|
3,984
|
|
|||||||||
|
Purchase obligations
(3)
|
1,496
|
|
2,898
|
|
20
|
|
—
|
|
4,414
|
|
|||||||||
|
Network decommissioning
(4)
|
80
|
|
85
|
|
57
|
|
63
|
|
285
|
|
|||||||||
|
Total contractual obligations
|
$
|
6,099
|
|
$
|
11,438
|
|
$
|
10,387
|
|
$
|
29,290
|
|
$
|
57,214
|
|
||||
|
(1)
|
Represents principal amounts of long-term debt at maturity, excluding unamortized premium from purchase price allocation fair value adjustment, capital lease obligations and vendor financing arrangements.
|
|
(2)
|
Future minimum payments, including principal and interest payments and imputed lease rental income, related to the long-term financial obligation recorded in connection with the Tower Transaction. See
Note 9 – Tower Transaction and Related Long-Term Financial Obligation
of the
Notes to the Consolidated Financial Statements
included in
Part II, Item 8
of this
Form 10-K
for further information.
|
|
(3)
|
T-Mobile calculated the minimum obligation for certain agreements to purchase goods or services based on termination fees that can be paid to exit the contract. Termination penalties are included in the above table as payments due in less than one year, as this is the earliest T-Mobile could exit these contracts. For certain contracts that include fixed volume purchase commitments and fixed prices for various products, the purchase obligations are calculated using fixed volumes and contractually fixed prices for the products that are expected to be purchased. This table does not include open purchase orders as of
December 31, 2014
under normal business purposes.
|
|
(4)
|
Represents future undiscounted cash flows related to decommissioned MetroPCS CDMA network and certain other redundant cell sites as of December 31, 2014. See
Note 2 – Business Combination with MetroPCS
of the
Notes to the Consolidated Financial Statements
included in
Part II, Item 8
of this
Form 10-K
for further information.
|
Certain commitments and obligations are included in the table based on the year of required payment or an estimate of the year of payment. Other long-term liabilities, excluding network decommissioning, have been omitted from the table above due to the uncertainty of the timing of payments, combined with the absence of historical trending to be used as a predictor of such payments. In addition, dividends on preferred stock have been excluded from the table above as no dividends were declared for the year ended December 31, 2014. See
Note 14 – Additional Financial Information
of the
Notes to the Consolidated Financial Statements
included in
Part II, Item 8
of this
Form 10-K
for further information.
39
The purchase obligations reflected in the table above are primarily commitments to purchase handsets and accessories, equipment, software, programming and network services, and marketing activities, which will be used or sold in the ordinary course of business. These amounts do not represent T-Mobile’s entire anticipated purchases in the future, but represent only those items for which T-Mobile is contractually committed. The Company also has purchase obligations that vary with the level of the Company’s sales of certain products. The future development of sales of those products could result in purchase obligations in excess of the amounts shown in the table above. Where T-Mobile is committed to make a minimum payment to the supplier regardless of whether it takes delivery, T-Mobile has included only that minimum payment as a purchase obligation. Additionally, included within purchase obligations are amounts for the acquisition of spectrum licenses, which are subject to regulatory approval and other customary closing conditions.
Off-Balance Sheet Arrangements
In
2014
, T-Mobile entered into a two-year factoring arrangement to sell certain service accounts receivable on a revolving basis as an additional source of liquidity. As of
December 31, 2014
, T-Mobile derecognized net receivables of
$768 million
upon
40
sale through the factoring arrangement. See
Note 4 – Factoring Arrangement
of the
Notes to the Consolidated Financial Statements
included in
Part II, Item 8
of this
Form 10-K
for further information.
Related Party Transactions
See
Note 14 – Additional Financial Information
of the
Notes to the Consolidated Financial Statements
included in
Part II, Item 8
of this
Form 10-K
for information regarding related party transactions.
Disclosure of Iranian Activities under Section 13(r) of the Securities Exchange Act of 1934
Section 219 of the Iran Threat Reduction and Syria Human Rights Act of 2012 added Section 13(r) to the Exchange Act of 1934, as amended (“Exchange Act”). Section 13(r) requires an issuer to disclose in its annual or quarterly reports, as applicable, whether it or any of its affiliates knowingly engaged in certain activities, transactions or dealings relating to Iran or with designated natural persons or entities involved in terrorism or the proliferation of weapons of mass destruction. Disclosure is required even where the activities, transactions or dealings are conducted outside the U.S. by non-U.S. affiliates in compliance with applicable law, and whether or not the activities are sanctionable under U.S. law.
As of the date of this report, we are not aware of any activity, transaction or dealing by us or any of our affiliates in
2014
that requires disclosure in this report under Section 13(r) of the Exchange Act, except as set forth below with respect to affiliates that we do not control and that are our affiliates solely due to their common control with Deutsche Telekom. We have relied upon Deutsche Telekom for information regarding their activities, transactions and dealings.
Deutsche Telekom, through certain of its non-U.S. subsidiaries, is party to roaming and interconnect agreements with the following mobile and fixed line telecommunication providers in Iran, some of which are or may be government-controlled entities: Gostaresh Ertebatat Taliya, Irancell Telecommunications Services Company (“MTN Irancell”), Telecommunication Kish Company, Mobile Telecommunication Company of Iran, and Telecommunication Infrastructure Company of Iran. In
2014
, gross revenues of all Deutsche Telekom affiliates generated by roaming and interconnection traffic with Iran were less than
$2 million
and estimated net profits were less than
$2 million
.
In addition, Deutsche Telekom, through certain of its non-U.S. subsidiaries, operating a fixed line network in their respective European home countries (in particular Germany), provides telecommunications services in the ordinary course of business to the Embassy of Iran in those European countries. Gross revenues and net profits recorded from these activities in
2014
were less than
$0.4 million
. We understand that Deutsche Telekom intends to continue these activities.
41
Critical Accounting Policies and Estimates
Preparation of our consolidated financial statements in accordance with U.S. generally accepted accounting principles (“GAAP”) requires us to make estimates and assumptions that affect the reported amounts of certain assets, liabilities, revenues and expenses, as well as related disclosure of contingent assets and liabilities. Significant accounting policies are fundamental to understanding our financial condition and results as they require the use of estimates and assumptions which affect the financial statements and accompanying notes. See
Note 1 – Summary of Significant Accounting Policies
of the
Notes to the Consolidated Financial Statements
included in
Part II, Item 8
of this
Form 10-K
for further information.
Critical accounting policies, which we discuss further below, are those which are both most important to the portrayal of our financial condition and results, and require management to make difficult, subjective or complex judgments, often as a result of the need to make estimates about the effect of matters which are inherently uncertain. Estimates are based on historical experience, where applicable, and other assumptions that management believes are reasonable under the circumstances. These estimates are inherently subject to judgment and actual results could differ from those estimates.
Allowances
We maintain an allowance for estimated losses resulting from the failure of customers to make required payments. When determining the allowance, we consider the probability of recovery based on past experience taking into account current collection trends and general economic factors. Collection risks are assessed for each type of receivable, including EIP receivables, based upon historical and expected write-offs, net of recoveries, and an analysis of the aged accounts receivable balances with reserves generally increasing as the receivable ages. To the extent that actual loss experience differs significantly from historical trends or assumptions, the required allowance amounts could differ from the estimate. We write off account balances if collection efforts are unsuccessful and future collection is unlikely, based on customer credit ratings and the length of time from the original billing date.
We offer certain retail customers the option to pay for devices and other accessories in installments using an EIP. At the time of an installment sale, we impute a discount for interest as there is no stated rate of interest on the EIP receivables and record the EIP receivables at their present value, which is determined by discounting all expected future payments at the imputed interest rate. The difference between the present value of the EIP receivables and their face amount results in a discount which is recorded as a direct reduction to the carrying value with a corresponding reduction to equipment sales. We determine the imputed discount rate based primarily on current market interest rates and the amount of expected credit losses on the EIP receivables. As a result, we do not recognize a separate valuation allowance at the time of issuance as the effects of uncertainty about future cash flows are included in the initial present value measurement of the receivable. The current portion of the EIP receivables is included in equipment installment plan receivables, net and the long-term portion of the EIP receivables is included in equipment installment plan receivables due after one year, net. The imputed discount on EIP receivables is amortized over the financed installment term using the interest method and recognized as interest income in other income (expenses), net.
Subsequent to the initial determination of the imputed discount, we assess the need for and, if necessary, recognize an allowance for credit losses to the extent the expected credit losses on the gross EIP receivables exceed the remaining unamortized imputed discount balances. The allowance is based on a number of factors, including collection experience, aging of the accounts receivable portfolio, credit quality of the customer base and other qualitative factors such as macro-economic conditions.
Total imputed discount and allowances as of
December 31, 2014
and
2013
was approximately
7.4%
and
8.6%
, respectively, of the total amount of gross accounts receivable, including EIP receivables.
Depreciation
Depreciation commences once assets have been placed in service and is computed using the straight-line method over the estimated useful life of each asset. Depreciable life studies are performed periodically to confirm the appropriateness of depreciable lives for certain categories of property, plant and equipment. These studies take into account actual usage, physical wear and tear, replacement history and assumptions about technology evolution. When these factors indicate that an asset’s useful life is different from the previous assessment, the remaining book values are depreciated prospectively over the adjusted remaining estimated useful life. See
Note 1 – Summary of Significant Accounting Policies
and
Note 5 – Property and Equipment
of the
Notes to the Consolidated Financial Statements
included in
Part II, Item 8
of this
Form 10-K
for information regarding depreciation of assets, including management’s underlying estimates of useful lives.
42
Evaluation of Goodwill and Indefinite-Lived Intangible Assets for Impairment
We assess the carrying value of goodwill and other indefinite-lived intangible assets (spectrum licenses) for potential impairment annually as of December 31 or more frequently if events or changes in circumstances indicate that assets might be impaired.
We may elect to first perform a qualitative assessment to determine whether it is more likely than not the fair value of the single reporting unit is less than its carrying amount as a basis for determining whether it is necessary to perform the two-step goodwill impairment test. If we do not perform a qualitative assessment, or if the qualitative assessment indicates it is more likely than not the fair value of the single reporting unit is less than its carrying amount, goodwill is tested for impairment based on a two-step test. In the first step, we compare the fair value of the reporting unit to its carrying value. The fair value of the reporting unit is determined using a market method, which is based on market capitalization. We recognize market capitalization is subject to volatility and will monitor changes in market capitalization to determine whether declines, if any, necessitate an interim impairment review. In the event market capitalization does decline below its book value, we will consider the length, severity and reasons for the decline when assessing whether potential impairment exists, including considering whether a control premium should be added to the market capitalization. We believe short-term fluctuations in share price may not necessarily reflect the underlying aggregate fair value. Historically, we estimated the fair value of the reporting unit using a discounted cash flow approach due to the absence of comparable observable market data. The discounted cash flow method utilizes future cash flow assumptions based on estimates of revenues, EBITDA margin and a long-term growth rate taking into consideration expected industry and market conditions. The cash flows are then discounted using a weighted average cost of capital reflecting the risks associated with the business and the projected cash flows. If the carrying amount of the reporting unit exceeds the fair value, the second step of the test is performed.
In the second step, we determine the fair values of all of the assets and liabilities of the reporting unit, including those that currently may not be recorded. The excess of the fair value of the reporting unit over the sum of the fair value of all of those assets and liabilities represents the implied goodwill amount. If the implied fair value of goodwill is lower than the carrying amount of goodwill, then an impairment loss is recognized for the difference.
We test spectrum licenses for impairment on an aggregate basis, consistent with the management of the overall business at a national level. We may elect to first perform a qualitative assessment to determine whether it is more likely than not that the fair value of an intangible asset group is less than its carrying value. If we do not perform the qualitative assessment, or if the qualitative assessment indicates it is more likely than not the fair value of the intangible asset group is less than its carrying amount, we calculate the estimated fair value of the intangible asset group. If the carrying amount of spectrum licenses exceeds the fair value, an impairment loss is recognized. We estimate the fair value of the spectrum licenses using the Greenfield approach, which is an income approach that estimates the price at which an orderly transaction to sell the asset would take place between market participants at the measurement date under current market conditions. The Greenfield approach values the spectrum licenses by calculating the cash flow generating potential of a hypothetical start-up company that goes into business with no assets except the asset to be valued (in this case, spectrum licenses). The value of the spectrum licenses can be considered as equal to the present value of the cash flows of this hypothetical start-up company. We base the assumptions underlying the Greenfield approach on a combination of market participant data and our historical results, trends and business plans. Future cash flows in the Greenfield approach are based on estimates and assumptions of market participant revenues, EBITDA margin, network build-out period, and a long-term growth rate for a market participant. The cash flows are discounted using a weighted average cost of capital.
The valuation approaches utilized to estimate fair value for the purposes of the impairment tests of goodwill and spectrum licenses require the use of assumptions and estimates, which involve a degree of uncertainty. If actual results or future expectations are not consistent with the assumptions, this may result in the recording of significant impairment charges on goodwill or spectrum licenses. The most significant assumptions within the valuation models are the discount rate, revenues, EBITDA margins and the long-term growth rate. As a result of an impairment test performed in 2012, we recorded an impairment charge on goodwill. See
Note 1 – Summary of Significant Accounting Policies
and
Note 6 – Goodwill, Spectrum Licenses and Intangible Assets
of the
Notes to the Consolidated Financial Statements
included in
Part II, Item 8
of this
Form 10-K
for information regarding our annual impairment test and impairment charges.
Guarantee Liabilities
In 2013, we introduced a handset upgrade program, JUMP!, which provides enrolled customers a specific-price trade-in right to upgrade their device. Participating customers must purchase a device from us, have a qualifying monthly wireless service plan with us, and finance their handset using our EIP, which is treated as a single multiple-element arrangement when entered into at
43
or near the same time. Upon qualifying JUMP! program upgrades, the customers’ remaining EIP balance is settled provided they trade in their eligible used device in good working condition and purchase a new handset from us on a new EIP.
For customers who enroll in the trade-in program, we defer a portion of equipment sales revenue which represents the estimated value of the specified-price trade-in right guarantee. The guarantee liabilities are valued based on various economic and customer behavioral assumptions, which require judgment, including the customer's estimated remaining EIP balance at trade-in, the expected fair value of the used device at trade-in, and probability and timing of trade-in. When the customer upgrades their device, the difference between the trade-in credit to the customer and the fair value of the returned handset is recorded against the guarantee liabilities. All assumptions are reviewed periodically.
Rent Expense
Most of the leases on our tower sites have fixed rent escalations which provide for periodic increases in the amount of rent payable over time. We calculate straight-line rent expense for each of these leases based on the fixed non-cancellable term of the lease plus all periods, if any, for which failure to renew the lease imposes a penalty on us in such amount that a renewal appears, at lease inception, to be reasonably assured. We make significant assumptions at lease inception in determining and assessing the factors that constitute a “penalty”. In doing so, we primarily consider costs incurred in acquiring and developing new sites, the useful life of site improvements and equipment costs, future economic conditions and the extent to which improvements in wireless technologies can be incorporated into a current assessment of whether an economic compulsion will exist in the future to renew a lease.
Income Taxes
We recognize deferred tax assets and liabilities based on temporary differences between the financial statement and tax basis of assets and liabilities using enacted tax rates expected to be in effect when these differences are realized. A valuation allowance is maintained against deferred tax assets when it is more likely than not that some portion or all of the deferred tax assets will not be realized. The ultimate realization of a deferred tax asset depends on the ability to generate sufficient taxable income of the appropriate character and in the appropriate taxing jurisdictions within the carryforward periods available. We consider many factors when determining whether a valuation allowance is needed, including recent cumulative earnings experience by taxing jurisdiction, expectations of future income, the carryforward periods available for tax reporting purposes and other relevant factors.
We account for uncertainty in income taxes recognized in the financial statements in accordance with the accounting guidance on the financial statement recognition and measurement of a tax position taken or expected to be taken in a tax return. We assess whether it is more likely than not that a tax position will be sustained upon examination based on the technical merits of the position and adjust the unrecognized tax benefits in light of changes in facts and circumstances, such as changes in tax law, interactions with taxing authorities and developments in case law.
Recently Issued Accounting Standards
See
Note 1 – Summary of Significant Accounting Policies
of the
Notes to the Consolidated Financial Statements
included in
Part II, Item 8
of this
Form 10-K
for information regarding recently issued accounting standards.
We are exposed to economic risks in the normal course of business, primarily from changes in interest rates. These risks, along with other business risks, impact our cost of capital. Our policy is to manage exposure related to fluctuations in interest rates in order to manage capital costs, control financial risks and maintain financial flexibility over the long term. We have established interest rate risk limits that are closely monitored by measuring interest rate sensitivities of our debt and embedded derivative instruments portfolios. We do not foresee significant changes in the strategies used to manage market risk in the near future.
44
Interest Rate Risk
We are exposed to changes in interest rates, primarily on our long-term debt to affiliates, which consist of the senior reset notes. As of
December 31, 2014
, we had
$5.6 billion
in long-term debt with Deutsche Telekom comprised of senior reset notes. Changes in interest rates can lead to significant fluctuations in the fair value of our long-term debt to affiliates.
To perform the sensitivity analysis on the long-term debt to affiliates, we assessed the risk of a change in the fair value from the effect of a hypothetical interest rate change of 100 basis points. As of
December 31, 2014
, the change in the fair value of our long-term debt to affiliates, based on this hypothetical change, is shown in the table below:
|
Fair Value Assuming
|
|||||||||||
|
(in millions)
|
Fair Value
|
+100 Basis Point Shift
|
-100 Basis Point Shift
|
||||||||
|
Long-term debt to affiliates
|
$
|
5,780
|
|
$
|
5,744
|
|
$
|
5,816
|
|
||
To manage interest rate risk, the interest rates on the senior reset notes are adjusted at the reset dates to rates defined in the applicable supplemental indenture. We determined certain components of the reset feature are required to be bifurcated from the senior reset notes and separately accounted for as embedded derivative instruments. As of
December 31, 2014
, we had
$5 million
in embedded derivatives related to the senior reset notes. The fair value of the embedded derivatives was determined based on the fair value of the senior reset notes with and without the embedded derivatives included. The fair value of the senior reset notes with the embedded derivatives utilizes the contractual term of each senior reset note, reset rates calculated based on the spread between specified yield curves and the yield curve on certain T-Mobile long-term debt, and interest rate volatility. Interest rate volatility is derived based on weighted risk-free rate volatility and credit spread volatility. Changes in the spreads between the specified yield curves and the yield curve on certain T-Mobile long-term debt can lead to fluctuations in the fair value of our embedded derivatives.
To perform sensitivity analysis on the embedded derivatives, we assessed the risk of loss in fair values from the effect of a hypothetical spread change between specified yield curves and the yield curve on certain T-Mobile long-term debt of 10 basis points on our portfolio of embedded derivatives. As of
December 31, 2014
, the change in the fair value of our embedded derivatives, based on this hypothetical change, is shown in the table below:
|
Fair Value Assuming
|
|||||||||||
|
(in millions)
|
Fair Value
|
+10 Basis Point Shift
|
-10 Basis Point Shift
|
||||||||
|
Embedded derivatives
|
$
|
5
|
|
$
|
27
|
|
$
|
(17
|
)
|
||
45
Financial Statements
Report of Independent Registered Public Accounting Firm
To
the Board of Directors and Stockholders of T-Mobile US, Inc.
In our opinion, the
accompanying consolidated balance sheets and the related consolidated statements of comprehensive income (loss), of stockholders’ equity and of cash flows
present fairly, in all material respects, the financial position of T-Mobile US, Inc. and its subsidiaries at December 31, 2014 and December 31, 2013, and the results of their operations and their cash flows for each of the three years in the period ended December 31, 2014 in conformity with accounting principles generally accepted in the United States of America. Also in our opinion, the Company maintained, in all material respects, effective internal control over financial reporting as of December 31, 2014, based on criteria established in
Internal Control - Integrated Framework (2013)
issued by the Committee of Sponsoring Organizations of the Treadway Commission (COSO). The Company's management is responsible for these financial statements, for maintaining effective internal control over financial reporting and for its assessment of the effectiveness of internal control over financial reporting, included in Management's Annual Report on Internal Control over Financial Reporting appearing under Item 9A. Our responsibility is to express opinions on these financial statements and on the Company's internal control over financial reporting based on our audits (which were integrated audits in 2013 and 2014). We conducted our audits in accordance with the standards of the Public Company Accounting Oversight Board (United States). Those standards require that we plan and perform the audits to obtain reasonable assurance about whether the financial statements are free of material misstatement and whether effective internal control over financial reporting was maintained in all material respects. Our audits of the financial statements included examining, on a test basis, evidence supporting the amounts and disclosures in the financial statements, assessing the accounting principles used and significant estimates made by management, and evaluating the overall financial statement presentation. Our audit of internal control over financial reporting included obtaining an understanding of internal control over financial reporting, assessing the risk that a material weakness exists, and testing and evaluating the design and operating effectiveness of internal control based on the assessed risk. Our audits also included performing such other procedures as we considered necessary in the circumstances. We believe that our audits provide a reasonable basis for our opinions.
A company’s internal control over financial reporting is a process designed to provide reasonable assurance regarding the reliability of financial reporting and the preparation of financial statements for external purposes in accordance with generally accepted accounting principles. A company’s internal control over financial reporting includes those policies and procedures that (i) pertain to the maintenance of records that, in reasonable detail, accurately and fairly reflect the transactions and dispositions of the assets of the company; (ii) provide reasonable assurance that transactions are recorded as necessary to permit preparation of financial statements in accordance with generally accepted accounting principles, and that receipts and expenditures of the company are being made only in accordance with authorizations of management and directors of the company; and (iii) provide reasonable assurance regarding prevention or timely detection of unauthorized acquisition, use, or disposition of the company’s assets that could have a material effect on the financial statements.
Because of its inherent limitations, internal control over financial reporting may not prevent or detect misstatements. Also, projections of any evaluation of effectiveness to future periods are subject to the risk that controls may become inadequate because of changes in conditions, or that the degree of compliance with the policies or procedures may deteriorate.
/s/ PricewaterhouseCoopers LLP
Seattle, Washington
Seattle, Washington
February 19, 2015
46
T-Mobile US, Inc.
|
(in millions, except share and per share amounts)
|
December 31,
2014 |
December 31,
2013 |
|||||
|
Assets
|
|||||||
|
Current assets
|
|||||||
|
Cash and cash equivalents
|
$
|
5,315
|
|
$
|
5,891
|
|
|
|
Accounts receivable, net of allowances of $83 and $109
|
1,865
|
|
2,148
|
|
|||
|
Equipment installment plan receivables, net
|
3,062
|
|
1,471
|
|
|||
|
Accounts receivable from affiliates
|
76
|
|
41
|
|
|||
|
Inventories
|
1,085
|
|
586
|
|
|||
|
Deferred tax assets, net
|
988
|
|
839
|
|
|||
|
Other current assets
|
1,593
|
|
1,252
|
|
|||
|
Total current assets
|
13,984
|
|
12,228
|
|
|||
|
Property and equipment, net
|
16,245
|
|
15,349
|
|
|||
|
Goodwill
|
1,683
|
|
1,683
|
|
|||
|
Spectrum licenses
|
21,955
|
|
18,122
|
|
|||
|
Other intangible assets, net
|
870
|
|
1,204
|
|
|||
|
Equipment installment plan receivables due after one year, net
|
1,628
|
|
1,075
|
|
|||
|
Other assets
|
288
|
|
292
|
|
|||
|
Total assets
|
$
|
56,653
|
|
$
|
49,953
|
|
|
|
Liabilities and Stockholders' Equity
|
|||||||
|
Current liabilities
|
|||||||
|
Accounts payable and accrued liabilities
|
$
|
7,364
|
|
$
|
4,567
|
|
|
|
Current payables to affiliates
|
231
|
|
199
|
|
|||
|
Short-term debt
|
87
|
|
244
|
|
|||
|
Deferred revenue
|
459
|
|
445
|
|
|||
|
Other current liabilities
|
635
|
|
353
|
|
|||
|
Total current liabilities
|
8,776
|
|
5,808
|
|
|||
|
Long-term debt
|
16,273
|
|
14,345
|
|
|||
|
Long-term debt to affiliates
|
5,600
|
|
5,600
|
|
|||
|
Long-term financial obligation
|
2,521
|
|
2,496
|
|
|||
|
Deferred tax liabilities
|
4,873
|
|
4,645
|
|
|||
|
Deferred rents
|
2,331
|
|
2,113
|
|
|||
|
Other long-term liabilities
|
616
|
|
701
|
|
|||
|
Total long-term liabilities
|
32,214
|
|
29,900
|
|
|||
|
Commitments and contingencies
|
|
|
|
|
|||
|
Stockholders' equity
|
|||||||
|
5.50% Mandatory Convertible Preferred Stock Series A, par value $0.00001 per share, 100,000,000 shares authorized; 20,000,000 and 0 shares issued; $1,000 and $0 aggregate liquidation value
|
—
|
|
—
|
|
|||
|
Common Stock, par value $0.00001 per share, 1,000,000,000 shares authorized; 808,851,108 and 803,262,309 shares issued
|
—
|
|
—
|
|
|||
|
Additional paid-in capital
|
38,503
|
|
37,330
|
|
|||
|
Treasury stock, at cost, 1,382,505 and 1,382,505 shares issued
|
—
|
|
—
|
|
|||
|
Accumulated other comprehensive income
|
1
|
|
3
|
|
|||
|
Accumulated deficit
|
(22,841
|
)
|
(23,088
|
)
|
|||
|
Total stockholders' equity
|
15,663
|
|
14,245
|
|
|||
|
Total liabilities and stockholders' equity
|
$
|
56,653
|
|
$
|
49,953
|
|
|
The accompanying notes are an integral part of these consolidated financial statements.
47
T-Mobile US, Inc.
|
Year Ended December 31,
|
|||||||||||
|
(in millions, except shares and per share amounts)
|
2014
|
2013
|
2012
|
||||||||
|
Revenues
|
|||||||||||
|
Branded postpaid revenues
|
$
|
14,392
|
|
$
|
13,166
|
|
$
|
14,521
|
|
||
|
Branded prepaid revenues
|
6,986
|
|
4,945
|
|
1,715
|
|
|||||
|
Wholesale revenues
|
731
|
|
613
|
|
544
|
|
|||||
|
Roaming and other service revenues
|
266
|
|
344
|
|
433
|
|
|||||
|
Total service revenues
|
22,375
|
|
19,068
|
|
17,213
|
|
|||||
|
Equipment sales
|
6,789
|
|
5,033
|
|
2,242
|
|
|||||
|
Other revenues
|
400
|
|
319
|
|
264
|
|
|||||
|
Total revenues
|
29,564
|
|
24,420
|
|
19,719
|
|
|||||
|
Operating expenses
|
|
|
|
||||||||
|
Cost of services, exclusive of depreciation and amortization shown separately below
|
5,788
|
|
5,279
|
|
4,661
|
|
|||||
|
Cost of equipment sales
|
9,621
|
|
6,976
|
|
3,437
|
|
|||||
|
Selling, general and administrative
|
8,863
|
|
7,382
|
|
6,796
|
|
|||||
|
Depreciation and amortization
|
4,412
|
|
3,627
|
|
3,187
|
|
|||||
|
Cost of MetroPCS business combination
|
299
|
|
108
|
|
7
|
|
|||||
|
Impairment charges
|
—
|
|
—
|
|
8,134
|
|
|||||
|
Gains on disposal of spectrum licenses
|
(840
|
)
|
(2
|
)
|
(205
|
)
|
|||||
|
Other, net
|
5
|
|
54
|
|
99
|
|
|||||
|
Total operating expenses
|
28,148
|
|
23,424
|
|
26,116
|
|
|||||
|
Operating income (loss)
|
1,416
|
|
996
|
|
(6,397
|
)
|
|||||
|
Other income (expense)
|
|
|
|
||||||||
|
Interest expense to affiliates
|
(278
|
)
|
(678
|
)
|
(661
|
)
|
|||||
|
Interest expense
|
(1,073
|
)
|
(545
|
)
|
—
|
|
|||||
|
Interest income
|
359
|
|
189
|
|
77
|
|
|||||
|
Other income (expense), net
|
(11
|
)
|
89
|
|
(5
|
)
|
|||||
|
Total other expense, net
|
(1,003
|
)
|
(945
|
)
|
(589
|
)
|
|||||
|
Income (loss) before income taxes
|
413
|
|
51
|
|
(6,986
|
)
|
|||||
|
Income tax expense
|
166
|
|
16
|
|
350
|
|
|||||
|
Net income (loss)
|
$
|
247
|
|
$
|
35
|
|
$
|
(7,336
|
)
|
||
|
Other comprehensive income (loss), net of tax
|
|||||||||||
|
Net gain on cross currency interest rate swaps, net of tax effect of $0, $13 and $57
|
—
|
|
23
|
|
95
|
|
|||||
|
Net loss on foreign currency translation, net of tax effect of $0, ($37) and ($16)
|
—
|
|
(62
|
)
|
(27
|
)
|
|||||
|
Unrealized gain (loss) on available-for-sale securities, net of tax effect of ($1), $1 and $0
|
(2
|
)
|
1
|
|
1
|
|
|||||
|
Other comprehensive income (loss), net of tax
|
(2
|
)
|
(38
|
)
|
69
|
|
|||||
|
Total comprehensive income (loss)
|
$
|
245
|
|
$
|
(3
|
)
|
$
|
(7,267
|
)
|
||
|
Earnings (loss) per share
|
|
|
|||||||||
|
Basic
|
$
|
0.31
|
|
$
|
0.05
|
|
$
|
(13.70
|
)
|
||
|
Diluted
|
$
|
0.30
|
|
$
|
0.05
|
|
$
|
(13.70
|
)
|
||
|
Weighted average shares outstanding
|
|
|
|
||||||||
|
Basic
|
805,284,712
|
|
672,955,980
|
|
535,286,077
|
|
|||||
|
Diluted
|
815,922,258
|
|
676,885,215
|
|
535,286,077
|
|
|||||
The accompanying notes are an integral part of these consolidated financial statements.
48
T-Mobile US, Inc.
|
Year Ended December 31,
|
|||||||||||
|
(in millions)
|
2014
|
2013
|
2012
|
||||||||
|
Operating activities
|
|||||||||||
|
Net income (loss)
|
$
|
247
|
|
$
|
35
|
|
$
|
(7,336
|
)
|
||
|
Adjustments to reconcile net income (loss) to net cash provided by operating activities
|
|||||||||||
|
Impairment charges
|
—
|
|
—
|
|
8,134
|
|
|||||
|
Depreciation and amortization
|
4,412
|
|
3,627
|
|
3,187
|
|
|||||
|
Stock-based compensation expense
|
196
|
|
100
|
|
—
|
|
|||||
|
Excess tax benefit from stock-based compensation
|
(34
|
)
|
—
|
|
—
|
|
|||||
|
Deferred income tax expense
|
122
|
|
10
|
|
308
|
|
|||||
|
Amortization of debt discount and premium, net
|
(47
|
)
|
(62
|
)
|
(81
|
)
|
|||||
|
Bad debt expense
|
444
|
|
463
|
|
702
|
|
|||||
|
Losses from factoring arrangement
|
179
|
|
—
|
|
—
|
|
|||||
|
Deferred rent expense
|
225
|
|
229
|
|
206
|
|
|||||
|
Losses (gains) and other, net
|
(755
|
)
|
209
|
|
(258
|
)
|
|||||
|
Changes in operating assets and liabilities
|
|||||||||||
|
Accounts receivable
|
(90
|
)
|
(158
|
)
|
(299
|
)
|
|||||
|
Equipment installment plan receivables
|
(2,429
|
)
|
(2,016
|
)
|
(521
|
)
|
|||||
|
Inventories
|
(499
|
)
|
42
|
|
(2
|
)
|
|||||
|
Deferred purchase price from factoring arrangement
|
(204
|
)
|
—
|
|
—
|
|
|||||
|
Other current and long-term assets
|
(328
|
)
|
314
|
|
(196
|
)
|
|||||
|
Accounts payable and accrued liabilities
|
2,395
|
|
611
|
|
(32
|
)
|
|||||
|
Other current and long-term liabilities
|
312
|
|
141
|
|
50
|
|
|||||
|
Net cash provided by operating activities
|
4,146
|
|
3,545
|
|
3,862
|
|
|||||
|
Investing activities
|
|||||||||||
|
Purchases of property and equipment
|
(4,317
|
)
|
(4,025
|
)
|
(2,901
|
)
|
|||||
|
Purchases of spectrum licenses and other intangible assets, including deposits
|
(2,900
|
)
|
(381
|
)
|
(387
|
)
|
|||||
|
Short term affiliate loan receivable, net
|
—
|
|
300
|
|
(651
|
)
|
|||||
|
Proceeds from disposals of property and equipment and intangible assets
|
20
|
|
3
|
|
51
|
|
|||||
|
Cash and cash equivalents acquired in MetroPCS business combination
|
—
|
|
2,144
|
|
—
|
|
|||||
|
Payments to acquire financial assets, net
|
(9
|
)
|
—
|
|
(5
|
)
|
|||||
|
Change in restricted cash equivalents
|
—
|
|
(100
|
)
|
—
|
|
|||||
|
Investments in unconsolidated affiliates, net
|
(40
|
)
|
(33
|
)
|
(22
|
)
|
|||||
|
Net cash used in investing activities
|
(7,246
|
)
|
(2,092
|
)
|
(3,915
|
)
|
|||||
|
Financing activities
|
|||||||||||
|
Proceeds from issuance of long-term debt
|
2,993
|
|
2,494
|
|
—
|
|
|||||
|
Repayments of long-term debt and capital lease obligations
|
(1,019
|
)
|
(9
|
)
|
—
|
|
|||||
|
Proceeds from issuance of preferred stock
|
982
|
|
—
|
|
—
|
|
|||||
|
Proceeds from issuance of common stock
|
—
|
|
1,787
|
|
—
|
|
|||||
|
Proceeds from financial obligation
|
—
|
|
—
|
|
2,469
|
|
|||||
|
Repayments of short-term debt for purchases of inventory, property and equipment, net
|
(418
|
)
|
(244
|
)
|
—
|
|
|||||
|
Repayments related to a variable interest entity
|
—
|
|
(80
|
)
|
(9
|
)
|
|||||
|
Distribution to affiliate
|
—
|
|
(41
|
)
|
(2,403
|
)
|
|||||
|
Proceeds from exercise of stock options
|
27
|
|
137
|
|
—
|
|
|||||
|
Taxes paid related to net share settlement of stock awards
|
(73
|
)
|
—
|
|
—
|
|
|||||
|
Excess tax benefit from stock-based compensation
|
34
|
|
—
|
|
—
|
|
|||||
|
Other, net
|
(2
|
)
|
—
|
|
—
|
|
|||||
|
Net cash provided by financing activities
|
2,524
|
|
4,044
|
|
57
|
|
|||||
|
Change in cash and cash equivalents
|
(576
|
)
|
5,497
|
|
4
|
|
|||||
|
Cash and cash equivalents
|
|||||||||||
|
Beginning of year
|
5,891
|
|
394
|
|
390
|
|
|||||
|
End of year
|
$
|
5,315
|
|
$
|
5,891
|
|
$
|
394
|
|
||
The accompanying notes are an integral part of these consolidated financial statements.
49
T-Mobile US, Inc.
Consolidated Statement of Stockholders’ Equity
|
(in millions, except shares)
|
Preferred Stock Outstanding
|
Common Stock Outstanding
|
Par Value and Additional
Paid-in Capital |
Accumulated Other Comprehensive Income
|
Accumulated Deficit
|
Total Stockholders' Equity
|
|||||||||||||||
|
Balance as of December 31, 2011
|
—
|
|
535,286,077
|
|
$
|
31,600
|
|
$
|
(28
|
)
|
$
|
(15,787
|
)
|
$
|
15,785
|
|
|||||
|
Net loss
|
—
|
|
—
|
|
—
|
|
—
|
|
(7,336
|
)
|
(7,336
|
)
|
|||||||||
|
Other comprehensive income
|
—
|
|
—
|
|
—
|
|
69
|
|
—
|
|
69
|
|
|||||||||
|
Equity distribution of paid-in capital
|
—
|
|
—
|
|
(2,403
|
)
|
—
|
|
—
|
|
(2,403
|
)
|
|||||||||
|
Balance as of December 31, 2012
|
—
|
|
535,286,077
|
|
$
|
29,197
|
|
$
|
41
|
|
$
|
(23,123
|
)
|
$
|
6,115
|
|
|||||
|
Net income
|
—
|
|
—
|
|
—
|
|
—
|
|
35
|
|
35
|
|
|||||||||
|
Other comprehensive loss
|
—
|
|
—
|
|
—
|
|
(38
|
)
|
—
|
|
(38
|
)
|
|||||||||
|
Effects of debt recapitalization
|
—
|
|
—
|
|
3,143
|
|
—
|
|
—
|
|
3,143
|
|
|||||||||
|
MetroPCS shares converted upon reverse merger, net of treasury stock withheld for taxes
|
—
|
|
184,487,309
|
|
2,971
|
|
—
|
|
—
|
|
2,971
|
|
|||||||||
|
Issuance of common stock
|
—
|
|
72,765,000
|
|
1,787
|
|
—
|
|
—
|
|
1,787
|
|
|||||||||
|
Stock-based compensation
|
—
|
|
—
|
|
100
|
|
—
|
|
—
|
|
100
|
|
|||||||||
|
Exercise of stock options
|
—
|
|
9,278,599
|
|
137
|
|
—
|
|
—
|
|
137
|
|
|||||||||
|
Issuance of vested restricted stock units
|
—
|
|
62,819
|
|
—
|
|
—
|
|
—
|
|
—
|
|
|||||||||
|
Tax impact of stock-based compensation
|
—
|
|
—
|
|
(5
|
)
|
—
|
|
—
|
|
(5
|
)
|
|||||||||
|
Balance as of December 31, 2013
|
—
|
|
801,879,804
|
|
$
|
37,330
|
|
$
|
3
|
|
$
|
(23,088
|
)
|
$
|
14,245
|
|
|||||
|
Net income
|
—
|
|
—
|
|
—
|
|
—
|
|
247
|
|
247
|
|
|||||||||
|
Other comprehensive loss
|
—
|
|
—
|
|
—
|
|
(2
|
)
|
—
|
|
(2
|
)
|
|||||||||
|
Issuance of preferred stock
|
20,000,000
|
|
—
|
|
982
|
|
—
|
|
—
|
|
982
|
|
|||||||||
|
Stock-based compensation
|
—
|
|
—
|
|
196
|
|
—
|
|
—
|
|
196
|
|
|||||||||
|
Exercise of stock options
|
—
|
|
1,496,365
|
|
27
|
|
—
|
|
—
|
|
27
|
|
|||||||||
|
Issuance of vested restricted stock units
|
—
|
|
6,296,107
|
|
—
|
|
—
|
|
—
|
|
—
|
|
|||||||||
|
Shares withheld related to net share settlement of stock awards
|
—
|
|
(2,203,673
|
)
|
(73
|
)
|
—
|
|
—
|
|
(73
|
)
|
|||||||||
|
Excess tax benefit from stock-based compensation
|
—
|
|
—
|
|
34
|
|
—
|
|
—
|
|
34
|
|
|||||||||
|
Other
|
—
|
|
—
|
|
7
|
|
—
|
|
—
|
|
7
|
|
|||||||||
|
Balance as of December 31, 2014
|
20,000,000
|
|
807,468,603
|
|
$
|
38,503
|
|
$
|
1
|
|
$
|
(22,841
|
)
|
$
|
15,663
|
|
|||||
The accompanying notes are an integral part of these consolidated financial statements.
50
T-Mobile US, Inc.
Notes to the Consolidated Financial Statements
Description of Business
T-Mobile US, Inc. (“T-Mobile” or the “Company”), together with its consolidated subsidiaries, is a leading provider of mobile communications services, including voice, messaging and data, under its flagship brands, T-Mobile and MetroPCS, in the United States (“U.S.”), Puerto Rico and the U.S. Virgin Islands. T-Mobile provides mobile communications services using 4G Long-Term Evolution (“LTE”), Evolved High Speed Packet Access (“HSPA+”), Universal Mobile Telecommunications Systems (“UMTS”), General Packet Radio Service (“GPRS”), Enhanced Data rates for GSM Evolution (“EDGE”), Global System for Mobile Communications (“GSM”) and Code Division Multiple Access (“CDMA”) technologies. T-Mobile also offers a wide selection of wireless devices, including handsets, tablets and other mobile communication devices, and accessories. Additionally, T-Mobile provides reinsurance for handset insurance policies and extended warranty contracts offered to T-Mobile’s mobile communications customers through a wholly-owned single-parent captive insurance company.
Basis of Presentation
The consolidated financial statements include the balances and results of operations of T-Mobile and its consolidated subsidiaries. T-Mobile operates as a single operating segment. T-Mobile consolidates all majority-owned subsidiaries over which it exercises control, as well as variable interest entities (“VIE”) where it is deemed to be the primary beneficiary and VIEs which cannot be deconsolidated. Intercompany transactions and balances have been eliminated in consolidation. Certain prior year amounts have been reclassified to conform to the current presentation.
The preparation of financial statements in conformity with U.S. generally accepted accounting principles (“GAAP”) requires management to make estimates and assumptions which affect the financial statements and accompanying notes. Examples include service revenues earned but not yet billed, service revenues billed but not yet earned, allowances for uncollectible accounts and sales returns, discounts for imputed interest on equipment installment plan (“EIP”) receivables, guarantee liabilities, tax liabilities, deferred income taxes including valuation allowances, useful lives of long-lived assets, reasonably assured renewal terms for operating leases, stock-based compensation forfeiture rates, and fair value measurements related to goodwill, spectrum licenses, intangible assets, and derivative financial instruments. Estimates are based on historical experience, where applicable, and other assumptions which management believes are reasonable under the circumstances. These estimates are inherently subject to judgment and actual results could differ from those estimates.
Cash and Cash Equivalents
Cash equivalents consist of highly liquid interest-earning investments with remaining maturities of three months or less at the date of purchase.
T-Mobile is required to restrict cash equivalents as collateral for certain agreements. Cash equivalents with use restrictions of less than twelve months are classified as current. Restricted cash equivalents included in other current assets were
$100 million
as of
December 31, 2014
and
2013
, respectively.
Accounts Receivable and Allowances
Accounts receivable consist of amounts billed and currently due from customers, other carriers and third-party retail channels (“dealers”), as well as revenues earned but not yet billed at the end of each period. T-Mobile has a two-year factoring arrangement to sell certain service accounts receivable on a revolving basis, which are treated as sales of financial assets. T-Mobile maintains an allowance for estimated losses resulting from uncollectible balances based on a number of factors, including collection experience, aging of the accounts receivable portfolio, credit quality of the customer base and other qualitative factors such as macro-economic conditions. The Company writes off account balances if collection efforts are unsuccessful and future collection is unlikely, based on customer credit ratings and the length of time from the original billing date.
Equipment Installment Plan Receivables
The Company offers certain retail customers the option to pay for devices and other accessories in installments using an EIP. At the time of an installment sale, the Company imputes a discount for interest as there is no stated rate of interest on the EIP
51
receivables and records the EIP receivables at their present value, which is determined by discounting all expected future payments at the imputed interest rate. The difference between the present value of the EIP receivables and their face amount results in a discount which is recorded as a direct reduction to the carrying value with a corresponding reduction to equipment sales. T-Mobile determines the imputed discount rate based primarily on current market interest rates and the amount of expected credit losses on the EIP receivables. As a result, T-Mobile does not recognize a separate valuation allowance at the time of issuance as the effects of uncertainty about future cash flows are included in the initial present value measurement of the receivable. The current portion of the EIP receivables is included in equipment installment plan receivables, net and the long-term portion of the EIP receivables is included in equipment installment plan receivables due after one year, net. The imputed discount on EIP receivables is amortized over the financed installment term using the interest method and recognized as interest income in other income (expenses), net.
Subsequent to the initial determination of the imputed discount, T-Mobile assesses the need for and, if necessary, recognizes an allowance for credit losses to the extent the expected credit losses on the gross EIP receivables exceed the remaining unamortized imputed discount balances. The allowance is based on a number of factors, including collection experience, aging of the accounts receivable portfolio, credit quality of the customer base and other qualitative factors such as macro-economic conditions. T-Mobile writes off account balances if collection efforts are unsuccessful and future collection is unlikely, based on customer credit ratings and the length of time from the original billing date. Equipment sales not reasonably assured to be collectible are recorded on a cash basis as payments are received.
Inventories
Inventories consist primarily of wireless devices and accessories, which are valued at the lower of cost or market. Cost is determined using standard cost which approximates average cost. T-Mobile sells wireless devices separately and in connection with service contracts. To the extent the Company sells wireless devices at prices below cost, the loss on the sale of the wireless device (“device subsidy”) is recognized at the time of the sale. The device subsidy is expected to be recovered through future service revenues. Shipping and handling costs paid to wireless device and accessories vendors are included in the standard cost of inventory. T-Mobile records inventory write-downs for obsolete and slow-moving items based on inventory turnover trends and historical experience.
Long-Lived Assets
Long-lived assets include assets which do not have indefinite lives, such as property and equipment and intangible assets. The Company assesses potential impairments to its long-lived assets when events or changes in circumstances indicate the carrying value may not be recoverable and exceeds the fair value of the respective asset or asset group. The carrying value of a long-lived asset or asset group is not recoverable if it exceeds the sum of the undiscounted cash flows expected to result from the use and eventual disposition of the asset or asset group. An impairment loss is measured as the amount by which the carrying amount of a long-lived asset or asset group exceeds its fair value.
Property and equipment
Property and equipment consists of buildings and equipment, wireless communication systems, leasehold improvements, capitalized software and construction in progress. Buildings and equipment include certain network server equipment. Wireless communication systems include assets to operate the Company’s wireless network and IT data centers, including tower asset leaseholds, assets related to the liability for the retirement of long-lived assets and capital leases. Leasehold improvements include asset improvements other than those related to the wireless network.
Property and equipment are recorded at cost less accumulated depreciation and impairments, if any. Costs of major replacements and improvements are capitalized. Repair and maintenance expenditures which do not enhance or extend the asset’s useful life are charged to operating expenses as incurred. Construction costs, labor and overhead incurred in the expansion or enhancement of T-Mobile’s wireless network are capitalized. Capitalization commences with pre-construction period administrative and technical activities, which includes obtaining leases, zoning approvals and building permits, and ceases at the point at which the asset is ready for its intended use. T-Mobile capitalizes interest associated with the acquisition or construction of certain property and equipment. Capitalized interest is reported as a reduction in interest expense and depreciated over the average useful life of the related assets. Depreciation commences once assets have been placed in service and is computed using the straight-line method over the estimated useful life of each asset. Depreciable life studies are performed periodically to confirm the appropriateness of useful lives for certain categories of property and equipment. These studies take into account actual usage, physical wear and tear, replacement history and assumptions about technology evolution. When these factors indicate the useful life of an asset is different from the previous assessment, the remaining book value is
52
depreciated prospectively over the adjusted remaining estimated useful life. Leasehold improvements are depreciated over the shorter of their estimated useful lives or the related lease term.
Capital leases are primarily for distributed antenna systems (“DAS”). Future obligations related to capital leases are included in short-term debt and long-term debt. Depreciation of assets held under capital leases is included in depreciation and amortization expense.
T-Mobile records a liability for the fair value of legal obligations associated with the retirement of tangible long-lived assets and a corresponding increase in the carrying amount of the related asset in the period in which the obligation is incurred. Over time, the liability is accreted to its present value and the capitalized cost is depreciated over the estimated useful life of the asset. The Company’s obligations relate primarily to certain legal obligations to remediate leased property on which the Company’s network infrastructure and administrative assets are located.
The Company capitalizes certain costs incurred in connection with developing or acquiring internal use software. Capitalization of software costs commences once the final selection of the specific software solution has been made and management authorizes and commits to funding the software project. Capitalization ceases at the point at which the software is ready for its intended use. Capitalized costs include direct development costs associated with internal use software, including internal direct labor costs and external costs of materials and services. Capitalized software costs are included in property and equipment, net and amortized on a straight-line basis over the estimated useful life of the asset. Costs incurred during the preliminary project stage, as well as maintenance and training costs are expensed as incurred.
Other Intangible Assets
Intangible assets that have finite useful lives are amortized over their useful lives. Customer lists are amortized using the sum-of-the-years-digits method over the expected period in which the relationship is expected to contribute to future cash flows. The remaining finite-lived intangible assets are amortized using the straight-line method.
Goodwill
Goodwill consists of the excess of the purchase price over the fair value of net identifiable assets acquired in a business combination.
Spectrum Licenses
Spectrum licenses are carried at costs incurred to acquire the spectrum licenses and the costs to prepare the spectrum licenses for their intended use, such as costs to clear acquired spectrum licenses. The Federal Communications Commission (“FCC”) issues spectrum licenses which provide T-Mobile with the exclusive right to utilize designated radio frequency spectrum within specific geographic service areas to provide wireless communication services. While spectrum licenses are issued for a fixed period of time, typically for up to fifteen years, the FCC has granted license renewals routinely and at a nominal cost. The spectrum licenses held by the Company expire at various dates. The Company believes it will be able to meet all requirements necessary to secure renewal of its spectrum licenses at nominal costs. Moreover, the Company has determined there are currently no legal, regulatory, contractual, competitive, economic or other factors that limit the useful lives of its spectrum licenses. Therefore, the Company has determined the spectrum licenses should be treated as indefinite-lived intangible assets.
The Company at times enters into agreements to sell or exchange spectrum licenses. Upon entering into the arrangement, if the transaction has been deemed to have commercial substance, spectrum licenses are reviewed for impairment and transferred at their carrying value, net of any impairment, to assets held for sale included in other current assets until approval and completion of the exchange or sale. Upon closing of the transaction, spectrum licenses acquired as part of an exchange of nonmonetary assets are valued at fair value. The difference between the fair value of the spectrum licenses obtained, book value of the spectrum licenses transferred and cash paid, if any, is recognized as gains (losses) included in gains on disposal of spectrum licenses. If the transaction lacks commercial substance or the fair value is not measurable, the acquired spectrum licenses are recorded at the book value of the assets tendered.
Impairment Tests of Goodwill and Indefinite-Lived Intangible Assets
The Company assesses the carrying value of its goodwill and other indefinite-lived intangible assets (spectrum licenses) for potential impairment annually as of December 31 or more frequently if events or changes in circumstances indicate such assets might be impaired.
53
The Company may elect to first perform a qualitative assessment to determine whether it is more likely than not the fair value of the single reporting unit is less than its carrying amount as a basis for determining whether it is necessary to perform the two-step goodwill impairment test. If the Company does not perform a qualitative assessment, or if the qualitative assessment indicates it is more likely than not the fair value of the single reporting unit is less than its carrying amount, goodwill is tested for impairment based on a two-step test. In the first step, the Company compares the fair value of the reporting unit, calculated using a market approach or a discounted cash flow method, to the carrying value. If the fair value is less than the carrying value, the second step is performed. In the second step, the Company determines the fair values of all of the assets and liabilities of the reporting unit, including those that may not be currently recorded. The excess of the fair value of the reporting unit over the sum of the fair value of all of those assets and liabilities represents the implied goodwill amount. If the implied fair value of goodwill is lower than its carrying amount, an impairment loss is recognized for the difference.
The Company tests its spectrum licenses for impairment on an aggregate basis, consistent with the Company's management of the overall business at a national level. The Company may elect to first perform a qualitative assessment to determine whether it is more likely than not that the fair value of an intangible asset group is less than its carrying value. If the Company does not perform the qualitative assessment, or if the qualitative assessment indicates it is more likely than not the fair value of the intangible asset group is less than its carrying amount, the Company calculates the estimated fair value of the intangible asset group. If the estimated fair value of the spectrum licenses is lower than their carrying amount, an impairment loss is recognized for the difference. The Company estimates fair value using the Greenfield approach, which is an income approach, to estimate the price at which an orderly transaction to sell the asset would take place between market participants at the measurement date under current market conditions.
Guarantee Liabilities
T-Mobile offers a device trade-in program, Just Upgrade My Phone (“JUMP!”), which provides eligible customers a specified-price trade-in right to upgrade their device. Participating customers must purchase a device from T-Mobile, have a qualifying monthly wireless service plan with T-Mobile, and finance their device using an EIP, which is treated as a single multiple-element arrangement when entered into at or near the same time. Upon qualifying JUMP! program upgrades, the customers’ remaining EIP balance is settled provided they trade in their eligible used device in good working condition and purchase a new device from T-Mobile on a new EIP.
For customers who enroll in the device trade-in program, the Company defers the portion of equipment sales revenue which represents the estimated value of the specified-price trade-in right guarantee. The guarantee liabilities are valued based on various economic and customer behavioral assumptions, including the customer's estimated remaining EIP balance at trade-in, the expected fair value of the used handset at trade-in, and probability and timing of trade-in. T-Mobile assesses guarantee liabilities at each reporting date to determine if facts and circumstances would indicate the incurrence of incremental contingent liabilities is probable and if so, reasonably estimable. The recognition and subsequent adjustments of the contingent guarantee liability as a result of these assessments are recorded as adjustments to revenue. When customers upgrade their devices, the difference between the trade-in credit to the customer and the fair value of the returned devices is recorded against the guarantee liabilities. Guarantee liabilities included in other current liabilities were
$286 million
and
$191 million
as of
December 31, 2014
and
2013
, respectively. The estimated EIP receivable balance if all enrolled handset upgrade program customers were to claim their benefit, not including any trade-in value of the required used handset, was
$2.6 billion
as of
December 31, 2014
. This is not an indication of the Company’s expected loss exposure as it does not consider the expected fair value of the used handset, which is required to be in good working condition at trade-in, nor does it consider the probability and timing of trade-in.
Fair Value Measurements
T-Mobile accounts for certain assets and liabilities at fair value. Fair value is a market-based measurement which is determined based on assumptions market participants would use in pricing an asset or liability. As a basis for considering such assumptions, T-Mobile uses the three-tiered fair value hierarchy, which prioritizes the inputs used in measuring fair value as follows:
|
Level 1
|
Observable inputs which reflect quoted prices in active markets for identical assets or liabilities;
|
|
Level 2
|
Inputs other than the quoted prices in active markets which are observable either directly or indirectly; and
|
|
Level 3
|
Unobservable inputs for which there is little or no market data, which require T-Mobile to develop its own assumptions.
|
T-Mobile uses observable market data, when available. Assets and liabilities measured at fair value include embedded derivative instruments related to the Company’s long-term debt to affiliates.
54
The carrying values of cash and cash equivalents, accounts receivable, accounts receivable from affiliates and accounts payable approximate fair value due to the short-term maturities of these instruments. The carrying values of EIP receivables approximate fair value as the receivables are recorded at their present value, net of unamortized discount and allowance for credit losses. There were no financial instruments with a carrying value materially different from their fair value, based on quoted market prices or rates for the same or similar instruments, or internal valuation models.
Derivative Financial Instruments
Derivative financial instruments are recorded on the balance sheet at fair value. Changes in the fair value of derivative instruments are recognized in net income (loss) or other comprehensive income (loss), depending on the type of derivative and whether the derivative is designated as part of an effective hedge transaction. T-Mobile does not enter into derivatives for trading or speculative purposes.
For derivative instruments not designated as hedging instruments, gains (losses) from changes in fair value are recognized as interest expense.
For derivative instruments designated as cash flow hedges, the effective portion of the gains (losses) from changes in fair value are initially reported as a component of other comprehensive income (loss) and subsequently recognized as interest expense in the period during which the hedged transaction affects earnings. The ineffective portion of the gains (losses), if any, is immediately recognized as interest expense. To receive hedge accounting treatment, cash flow hedges must be highly effective in offsetting changes to expected future cash flows of the hedged transaction.
For embedded derivative instruments, gains (losses) from changes in fair value are recognized as interest expense.
Revenue Recognition
Service revenues are earned from providing access to and usage of the Company's wireless communications network and recognized when the service is rendered or collections are reasonably assured. Service revenues also include revenues earned for providing value added services to customers, such as handset insurance services. Branded postpaid service revenues are generally billed in arrears, but may be billed in advance, depending on the plan or contract entered into by the customer. Branded prepaid service revenues include revenues earned from pay-in-advance customers generally not originated under contract. Recognition of prepaid revenue is deferred until services are rendered or the prepaid balance expires. Incentives given to customers are recorded as a reduction to revenue. Access revenue from customers paying a recurring charge for specified services is recognized ratably over the service period. Usage revenue, including roaming revenue and long-distance revenue, is recognized when the service is rendered. Wholesale revenues are earned for providing services to mobile virtual network operators and machine-to-machine customers and recognized when the service is provided. Roaming and other service revenues primarily include revenues from other wireless communication providers for roaming by their customers on the Company's network. Equipment sales, including those on EIP, are composed of revenues from the sale of mobile communication devices and accessories and recognized when the products are delivered to the customer or dealer. The Company records device returns as a reduction to equipment sales revenues and cost of equipment sales
.
Equipment sales that are not reasonably assured to be collectible are recorded on a cash basis as payments are received.
The Company sells both wireless services and devices to customers through its company-owned sales channels. For contracts that involve multiple components entered into at or near the same time, such as wireless services and devices, revenue is allocated between the separate units of accounting, based on such components' relative selling prices on a standalone basis. This is subject to the requirement that revenue recognized is limited to the amounts already received from the customer that are not contingent upon the delivery of additional products or services to the customer in the future. For customers enrolled in JUMP!, the Company treats the JUMP! trade-in right as a component in a multiple element arrangement and defers equipment sales revenue in the amount of the fair value of the trade-in right. See Guarantee Liabilities for more information.
Federal Universal Service Fund (“USF”) and other fees are assessed by various governmental authorities in connection with the services the Company provides to its customers. When the Company separately bills and collects these regulatory fees from customers, they are recorded gross in service revenues and cost of services. For the years ended
December 31, 2014
,
2013
and
2012
, the Company recorded approximately
$349 million
,
$362 million
and
$455 million
, respectively, of USF and other fees on a gross basis.
55
Lease Accounting
The Company has operating leases for cell sites, retail locations, corporate offices and dedicated transportation lines, some of which have escalating rentals during the initial lease term and during subsequent optional renewal periods. The Company recognizes rent expense on a straight-line basis, over the initial lease term and renewal periods that are considered reasonably assured at the inception of the lease.
Advertising Expense
T-Mobile expenses the cost of advertising and other promotional expenditures to market the Company's services and products as incurred. Advertising expense included in selling, general and administrative expenses were
$1.4 billion
,
$1.0 billion
and
$0.9 billion
for the years ended
December 31, 2014
,
2013
and
2012
, respectively.
Income Taxes
Deferred tax assets and liabilities are recognized based on temporary differences between the financial statement and tax bases of assets and liabilities using enacted tax rates expected to be in effect when these differences are realized. A valuation allowance is recorded when it is more likely than not that some portion or all of a deferred tax asset will not be realized. The ultimate realization of a deferred tax asset depends on the ability to generate sufficient taxable income of the appropriate character and in the appropriate taxing jurisdictions within the carryforward periods available.
The Company accounts for uncertainty in income taxes recognized in the financial statements in accordance with the accounting guidance on the financial statement recognition and measurement of a tax position taken or expected to be taken in a tax return. The Company assesses whether it is more likely than not that a tax position will be sustained upon examination based on the technical merits of the position and adjusts the unrecognized tax benefits in light of changes in facts and circumstances, such as changes in tax law, interactions with taxing authorities and developments in case law.
Other Comprehensive Income (Loss)
Other comprehensive income (loss) consists of adjustments, net of tax, related to unrealized gains (losses) on available-for-sale securities, unrealized gains (losses) on cash flow hedging derivatives and unrealized gains (losses) on foreign currency translation. These are reported in accumulated other comprehensive income (“AOCI”) as a separate component of stockholders’ equity until realized in earnings.
Stock-Based Compensation
Stock-based compensation cost for stock awards, which include restricted stock units (“RSU”) and performance stock units (“PSU”), is measured at fair value on the grant date and recognized as expense, net of expected forfeitures, over the related service period. The fair value of stock awards is based on the closing price of T-Mobile common stock on the date of grant. RSUs are recognized as expense using the straight-line method. PSUs are recognized as expense following a graded vesting schedule.
Earnings (Loss) Per Share
Basic earnings (loss) per share is computed by dividing net income (loss) by the weighted-average number of common shares outstanding for the period. Diluted earnings (loss) per share is computed by giving effect to all potentially dilutive common shares outstanding during the period. Potentially dilutive common shares consist of outstanding stock options, RSUs and PSUs, calculated using the treasury stock method, and each share of mandatory convertible preferred stock (“preferred stock”), calculated using the if-converted method.
Variable Interest Entities
VIEs are entities which lack sufficient equity to permit the entity to finance its activities without additional subordinated financial support from other parties, have equity investors which do not have the ability to make significant decisions relating to the entity's operations through voting rights, do not have the obligation to absorb the expected losses, or do not have the right to receive the residual returns of the entity. The most common type of VIE is a special purpose entity (“SPE”). SPEs are commonly used in securitization transactions in order to isolate certain assets and distribute the cash flows from those assets to investors. SPEs are generally structured to insulate investors from claims on the SPE's assets by creditors of other entities, including the creditors of the seller of the assets.
56
The primary beneficiary is required to consolidate the assets and liabilities of the VIE. The primary beneficiary is the party which has both the power to direct the activities of an entity that most significantly impact the VIE's economic performance, and through its interests in the VIE, the obligation to absorb losses or the right to receive benefits from the VIE which could potentially be significant to the VIE. T-Mobile consolidates VIEs when it is deemed to be the primary beneficiary or when the VIE cannot be deconsolidated.
Recently-Issued Accounting Standards
In May 2014, the Financial Accounting Standards Board (“FASB”) issued Accounting Standards Update (“ASU”) 2014-09, “Revenue from Contracts with Customers.” The standard requires entities to recognize revenue through the application of a five-step model, which includes identification of the contract, identification of the performance obligations, determination of the transaction price, allocation of the transaction price to the performance obligations, and recognition of revenue as the entity satisfies the performance obligations. The standard will become effective for T-Mobile beginning January 1, 2017. The Company is currently evaluating the guidance to determine the potential impact on T-Mobile’s consolidated financial statements.
Note 2 – Business Combination with MetroPCS
Transaction Overview
On October 3, 2012, Deutsche Telekom AG (“Deutsche Telekom”), T-Mobile Global Zwischenholding GmbH (“T-Mobile Global”), a direct wholly-owned subsidiary of Deutsche Telekom, T-Mobile Global Holding GmbH (“T-Mobile Holding”), a direct wholly-owned subsidiary of T-Mobile Global, T-Mobile USA, Inc. (“T-Mobile USA”) and MetroPCS Communications, Inc. (“MetroPCS”) entered into a Business Combination Agreement (“BCA”) for the business combination of T-Mobile USA and MetroPCS, which was subsequently amended on April 14, 2013. The business combination provides the Company with expanded scale, spectrum, and financial resources to compete aggressively with other larger U.S. wireless communication providers. The stockholders of MetroPCS approved the business combination on April 24, 2013, and the transaction closed on April 30, 2013 (“Acquisition Date”).
In connection with the business combination, MetroPCS acquired all of the outstanding capital stock of T-Mobile USA beneficially owned by Deutsche Telekom in consideration for the issuance of shares of common stock representing a majority of the fully diluted shares of the Company to T-Mobile Holding. MetroPCS was subsequently renamed T-Mobile US, Inc. and is the consolidated parent of the Company’s subsidiaries, including T-Mobile USA. The transaction was accounted for as a reverse acquisition under the acquisition method of accounting with T-Mobile USA considered to be the accounting acquirer based upon the terms and conditions set forth in the BCA, including the ability of T-Mobile USA’s stockholder, Deutsche Telekom, to nominate a majority of the board of directors of the Company and Deutsche Telekom’s receipt of shares representing a majority of the outstanding voting shares of the Company. Based on the determination that T-Mobile USA was the accounting acquirer in the transaction, the Company has allocated the purchase price to the fair value of MetroPCS’s assets and liabilities as of the Acquisition Date, with the excess purchase price recorded as goodwill.
Accordingly, T-Mobile USA’s historical financial statements became the historical financial statements of the Company. The common shares outstanding and earnings (loss) per share presented for periods up to April 30, 2013 reflect the common shares issued to T-Mobile Holding in connection with the reverse acquisition. The acquired assets and liabilities of MetroPCS are included in the Company’s
consolidated balance sheets
as of April 30, 2013 and the results of its operations and cash flows are included in the Company’s
consolidated statements of comprehensive income (loss)
and cash flows for periods beginning after May 1, 2013.
Pursuant to the terms and the conditions as set forth in the BCA:
|
•
|
Deutsche Telekom recapitalized T-Mobile USA by retiring T-Mobile USA’s long-term debt to affiliates principal balance of
$14.5 billion
and all related derivative instruments in exchange for
$11.2 billion
in new long-term debt to affiliates and additional paid-in capital prior to the closing of the business combination.
|
|
•
|
Deutsche Telekom provided T-Mobile USA with a
$500 million
unsecured revolving credit facility.
|
|
•
|
MetroPCS effected a recapitalization which consisted of a reverse stock split of the MetroPCS common stock and an aggregate cash payment of
$1.5 billion
to the MetroPCS stockholders on the Acquisition Date.
|
|
•
|
Thereafter, MetroPCS acquired all of T-Mobile USA’s capital stock from T-Mobile Holding in exchange for common stock representing approximately
74%
of the fully diluted shares of the combined company’s common stock on the Acquisition Date.
|
57
Debt Recapitalization
In connection with the recapitalization of T-Mobile USA, certain outstanding balances with Deutsche Telekom were settled prior to the closing of the business combination. The debt recapitalization was accounted for as a debt extinguishment with the effects being treated as a capital transaction. The effects on additional paid-in capital as a result of the debt recapitalization are presented in the following table:
|
(in millions)
|
Debt Recapitalization
|
||
|
Retirement of long-term debt to affiliates
|
$
|
14,450
|
|
|
Elimination of net unamortized discounts and premiums on long-term debt to affiliates
|
434
|
|
|
|
Issuance of new long-term debt to affiliates
|
(11,200
|
)
|
|
|
Settlement of accounts receivable from affiliates and other outstanding balances
|
(363
|
)
|
|
|
Income tax effect
|
(178
|
)
|
|
|
Total
|
$
|
3,143
|
|
Reverse Stock Split
On April 30, 2013, as contemplated by the BCA, the Company amended and restated its existing certificate of incorporation in its entirety in the form of the Fourth Amended and Restated Certificate of Incorporation to, among other things, effect a reverse stock split of MetroPCS’s common stock, and change its name to T-Mobile US, Inc. On the Acquisition Date, the Company issued to T-Mobile Holding
535,286,077
shares of common stock in exchange for T-Mobile Holding transferring to the Company all of its rights, title and interest in and to all the equity interests of T-Mobile USA. After giving effect to this transaction, the shares of the Company’s common stock issued to T-Mobile Holding represented approximately
74%
of the fully diluted shares of the Company’s common stock on the Acquisition Date. Immediately prior to the Acquisition Date, each issued share of MetroPCS was reverse split, and at consummation of the business combination each issued share was canceled and converted into shares of the Company’s stock totaling
184,487,309
shares of common stock, exclusive of
1,382,505
shares in treasury.
Consideration Transferred
The fair value of the consideration transferred in a reverse acquisition was determined based on the number of shares the accounting acquirer (T-Mobile USA, the legal acquiree) would have had to issue to the stockholders of the accounting acquiree (MetroPCS, the legal acquirer) in order to provide the same ratio of ownership in the combined entity (approximately
26%
) as a result of the transaction. The fair value of the consideration transferred was based on the most reliable measure, which was determined to be the market price of MetroPCS shares as of the Acquisition Date.
The fair value of the consideration transferred, based on the market price of MetroPCS shares on the Acquisition Date, consisted of the following:
|
(in millions)
|
Purchase Consideration
|
||
|
Fair value of MetroPCS shares
|
$
|
2,886
|
|
|
Fair value of MetroPCS stock options
|
84
|
|
|
|
Cash consideration paid to MetroPCS stock option holders
|
1
|
|
|
|
Total purchase consideration
|
$
|
2,971
|
|
The fair value of the MetroPCS shares was determined by using the closing price of MetroPCS common stock on the New York Stock Exchange on the Acquisition Date, prior to giving effect to the reverse stock split, of
$11.84
per share, adjusted by the
$4.05
per share impact of the
$1.5 billion
cash payment, which was a return of capital to the MetroPCS stockholders made as part of the recapitalization prior to the stock issuance to T-Mobile Holding. This resulted in an adjusted price of
$7.79
per share unadjusted for the effects of the reverse stock split.
Pursuant to the BCA, unvested MetroPCS stock options and shares of restricted stock immediately vested as of the closing of the business combination and were adjusted to give effect to the recapitalization. Holders of stock options for which the exercise price was less than the average closing price of MetroPCS’s common stock for the five days preceding the closing (“in-the-money options”) had the right to receive, at their election, a cash payment based on the amount by which the average closing price exceeded the exercise price of the options. In-the-money options held by holders who made this election were
58
canceled. Finally, stock options with low exercise prices, as defined in the BCA, were canceled in exchange for cash consideration.
Purchase Price Allocation
As T-Mobile USA was the accounting acquirer in the business combination, it has allocated the purchase price to the MetroPCS individually identifiable assets acquired and liabilities assumed based on their estimated fair values on the Acquisition Date. The excess of the purchase price over those fair values was recorded as goodwill. The determination of the fair values of the acquired assets and assumed liabilities required significant judgment, including estimates relating to the decommissioning of network cell sites, the determination of estimated lives of depreciable and intangible assets, and the calculation of the value of inventory, spectrum licenses, customer lists, and trademarks.
The following table summarizes the allocation of the purchase price:
|
(in millions)
|
Fair Value
|
||
|
Assets
|
|||
|
Cash and cash equivalents
|
$
|
2,144
|
|
|
Accounts receivable, net
|
98
|
|
|
|
Inventory
|
171
|
|
|
|
Other current assets
|
240
|
|
|
|
Property and equipment
|
1,475
|
|
|
|
Spectrum licenses
|
3,818
|
|
|
|
Other intangible assets
|
1,376
|
|
|
|
Other assets
|
10
|
|
|
|
Total assets acquired
|
9,332
|
|
|
|
Liabilities and Stockholders’ Equity
|
|||
|
Accounts payable and accrued liabilities
|
475
|
|
|
|
Deferred revenues
|
187
|
|
|
|
Other current liabilities
|
15
|
|
|
|
Deferred tax liabilities
|
735
|
|
|
|
Long-term debt
|
6,277
|
|
|
|
Other long-term liabilities
|
355
|
|
|
|
Total liabilities assumed
|
8,044
|
|
|
|
Net identifiable assets acquired
|
1,288
|
|
|
|
Goodwill
|
1,683
|
|
|
|
Net assets acquired
|
$
|
2,971
|
|
The goodwill recognized was attributable primarily to expected synergies from combining the businesses of T-Mobile USA and MetroPCS, including, but not limited to, the following:
|
•
|
Expected cost synergies from reduced network-related expenses through the elimination of redundant assets.
|
|
•
|
Enhanced spectrum position which will provide greater network coverage and improved LTE coverage in key markets across the country and the ability to offer a wider array of products, plans and services to the Company’s customers.
|
None
of the goodwill is deductible for income tax purposes.
Cost of MetroPCS Business Combination
The Company recognized the following expenses included in Cost of MetroPCS business combination:
|
Year Ended December 31,
|
|||||||||||
|
(in millions)
|
2014
|
2013
|
2012
|
||||||||
|
Network decommissioning costs, including effects of deferred items
|
$
|
263
|
|
$
|
—
|
|
$
|
—
|
|
||
|
Transaction and integration costs
|
36
|
|
108
|
|
7
|
|
|||||
|
Cost of MetroPCS business combination
|
$
|
299
|
|
$
|
108
|
|
$
|
7
|
|
||
59
Network Decommissioning Costs
Prior to the closing of the business combination, T-Mobile developed integration plans which included the decommissioning of the MetroPCS CDMA network and certain other redundant network cell sites. In 2014, T-Mobile began decommissioning the MetroPCS CDMA network and redundant network cell sites. Network decommissioning costs primarily relate to the acceleration of lease costs for decommissioned cell sites for which T-Mobile will no longer receive any economic benefit. Accrued liabilities for network decommissioning costs will be relieved as cash payments are made over the remaining lease terms through 2028. In addition, network decommissioning costs include the write off of deferred items related to certain cell sites, which consist of prepaid rent expense, favorable leases, unfavorable leases and deferred rent expense. T-Mobile recognized network decommissioning costs, including effects of deferred items, of
$97 million
in the third quarter of 2014 and
$166 million
in the fourth quarter of 2014. T-Mobile intends to decommission certain cell sites and incur additional network decommissioning costs in the range of
$500 million
to
$600 million
, a majority of which are expected to be recognized in 2015.
Activities in liabilities for network decommissioning costs were as follows:
|
(in millions)
|
December 31, 2014
|
||
|
Balances, beginning of period
|
$
|
—
|
|
|
Network decommissioning costs, excluding effects of deferred items
|
271
|
|
|
|
Cash payments
|
(32
|
)
|
|
|
Balances, end of period
|
$
|
239
|
|
|
Classified on the balance sheet as:
|
|||
|
Accounts payable and accrued liabilities
|
$
|
78
|
|
|
Other long-term liabilities
|
161
|
|
|
|
Network decommissioning liabilities
|
$
|
239
|
|
Transaction and Integration Costs
Transaction costs generally included costs for personnel associated with the change in control and other acquisition-related charges. Integration costs generally included costs associated with personnel, professional services and combining information technology infrastructures. Transaction costs were not significant for the
year ended December 31, 2014
. Transactions costs were
$41 million
and
$7 million
for the year ended
December 31, 2013
and
2012
, respectively.
Consolidated Statements of Comprehensive Income (Loss)
for MetroPCS Operations
The following supplemental information presents the financial results of MetroPCS operations included in the
consolidated statements of comprehensive income (loss)
since May 1, 2013 for the
year ended
December 31, 2013
:
|
(in millions)
|
Year Ended December 31, 2013
|
||
|
Total revenues
|
$
|
3,366
|
|
|
Income before income taxes
|
143
|
|
|
Pro Forma Financial Information (Unaudited)
The following pro forma consolidated results of operations for the years ended
December 31, 2013
and
2012
assume the business combination was completed as of January 1, 2012, respectively:
|
Year Ended December 31,
|
|||||||
|
(in millions, except per share amounts)
|
2013
|
2012
|
|||||
|
Pro forma revenues
|
$
|
26,158
|
|
$
|
24,941
|
|
|
|
Pro forma net income (loss)
|
52
|
|
(7,297
|
)
|
|||
|
Pro forma basic earnings (loss) per share
|
$
|
0.07
|
|
$
|
(10.15
|
)
|
|
|
Pro forma diluted earnings (loss) per share
|
0.07
|
|
(10.15
|
)
|
|||
The pro forma amounts include the historical operating results of T-Mobile USA and MetroPCS prior to the business combination, with adjustments directly attributable to the business combination relating to purchase accounting adjustments to
60
conform to accounting policies that affect total revenues, total operating expenses, interest expense, other income (expense), income taxes expense, and eliminate intercompany activities.
As the pro forma amounts assumed the business combination was completed as of January 1, 2012, pro forma earnings for the
year ended
December 31, 2013
excluded
$213 million
of transaction costs and these costs were included in the pro forma earnings for the
year ended
December 31, 2012
.
The pro forma results include the following:
|
•
|
Increase in tax expenses based on the inclusion of MetroPCS in the combined company of
$63 million
for the
year ended
December 31, 2013
and a decrease of
$215 million
for the
year ended
December 31, 2012
;
|
|
•
|
Net decrease to amortization and depreciation expense related to the fair value of the intangible assets and fixed assets acquired of
$19 million
for the
year ended
December 31, 2013
and a net increase of
$168 million
for the
year ended
December 31, 2012
, respectively; and
|
|
•
|
The impact of financing agreements entered into whereby an aggregate of
$14.7 billion
senior unsecured notes were issued and
$14.5 billion
of senior unsecured notes previously issued by T-Mobile USA to Deutsche Telekom and
$2.5 billion
of senior unsecured notes previously issued by MetroPCS were retired in connection with the business combination for a net increase to interest and other income (expense) of
$91 million
and
$119 million
for the
year ended
December 31, 2013
and
2012
, respectively.
|
Note 3 – Equipment Installment Plan Receivables
T-Mobile offers certain retail customers the option to pay for their devices and other purchases in installments over a period of up to
24
months using an EIP.
The following table summarizes the EIP receivables:
|
(in millions)
|
December 31, 2014
|
December 31, 2013
|
|||||
|
EIP receivables, gross
|
$
|
5,138
|
|
$
|
2,882
|
|
|
|
Unamortized imputed discount
|
(332
|
)
|
(276
|
)
|
|||
|
EIP receivables, net of unamortized imputed discount
|
4,806
|
|
2,606
|
|
|||
|
Allowance for credit losses
|
(116
|
)
|
(60
|
)
|
|||
|
EIP receivables, net
|
$
|
4,690
|
|
$
|
2,546
|
|
|
|
|
|
|
|||||
|
Classified on the balance sheet as:
|
|||||||
|
Equipment installment plan receivables, net
|
$
|
3,062
|
|
$
|
1,471
|
|
|
|
Equipment installment plan receivables due after one year, net
|
1,628
|
|
1,075
|
|
|||
|
EIP receivables, net
|
$
|
4,690
|
|
$
|
2,546
|
|
|
T-Mobile uses a proprietary credit scoring model that measures the credit quality of a customer at the time of application for mobile communications service using several factors, such as credit bureau information, consumer credit risk scores and service plan characteristics. Based upon customer credit profiles, T-Mobile classifies EIP receivables into the credit categories of “Prime” and “Subprime”. Prime customer receivables are those with lower delinquency risk and Subprime customer receivables are those with higher delinquency risk. Subprime customers are generally required to make a down payment on their equipment purchases. In addition, certain customers within the Subprime category are required to pay an advance deposit.
EIP receivables for which invoices have not yet been generated for the customer are classified as Unbilled. EIP receivables for which invoices have been generated but which are not past the contractual due date are classified as Billed – Current. EIP receivables for which invoices have been generated and the payment is past the contractual due date are classified as Billed – Past Due.
61
The balance and aging of the EIP receivables on a gross basis by credit category were as follows:
|
December 31, 2014
|
December 31, 2013
|
||||||||||||||||||||||
|
(in millions)
|
Prime
|
Subprime
|
Total
|
Prime
|
Subprime
|
Total
|
|||||||||||||||||
|
Unbilled
|
$
|
2,639
|
|
$
|
2,213
|
|
$
|
4,852
|
|
$
|
1,482
|
|
$
|
1,270
|
|
$
|
2,752
|
|
|||||
|
Billed – Current
|
104
|
|
95
|
|
199
|
|
45
|
|
45
|
|
90
|
|
|||||||||||
|
Billed – Past Due
|
35
|
|
52
|
|
87
|
|
15
|
|
25
|
|
40
|
|
|||||||||||
|
EIP receivables, gross
|
$
|
2,778
|
|
$
|
2,360
|
|
$
|
5,138
|
|
$
|
1,542
|
|
$
|
1,340
|
|
$
|
2,882
|
|
|||||
Activity in the unamortized imputed discount and allowance for credit losses balances for the EIP receivables was as follows:
|
(in millions)
|
2014
|
2013
|
|||||
|
Imputed discount and allowance for credit losses, beginning of year
|
$
|
336
|
|
$
|
125
|
|
|
|
Bad debt expense
|
285
|
|
161
|
|
|||
|
Write-offs, net of recoveries
|
(229
|
)
|
(116
|
)
|
|||
|
Change in imputed discount on short-term and long-term EIP receivables
|
56
|
|
166
|
|
|||
|
Imputed discount and allowance for credit losses, end of year
|
$
|
448
|
|
$
|
336
|
|
|
The EIP receivables had weighted average effective imputed interest rates of
9.7%
and
13.4%
as of
December 31, 2014
and
2013
, respectively.
Note 4 – Factoring Arrangement
Transaction Overview
In 2014, T-Mobile entered into a two-year factoring arrangement to sell certain service accounts receivable on a revolving basis with a current maximum funding limit of
$640 million
, subject to change upon notification to certain third parties. Sales of receivables occur daily and are settled on a monthly basis. The receivables consist of service charges currently due from customers and are short-term in nature. In connection with the factoring arrangement, the Company formed a wholly-owned subsidiary, which qualifies as a bankruptcy remote SPE (“Factoring SPE”). Pursuant to the factoring arrangement, certain subsidiaries of T-Mobile transfer selected receivables to the Factoring SPE. The Factoring SPE then sells the receivables to an unaffiliated entity (“Factoring VIE”), which was established to facilitate the sale of ownership interest in the receivables to certain third parties.
Variable Interest Entity
The Company determined the Factoring VIE is a VIE as it lacks sufficient equity to finance its activities. The Company has a variable interest in the Factoring VIE, but is not the primary beneficiary as it lacks the power to direct the activities that most significantly impact the Factoring VIE’s economic performance. The activities which most significantly impact the Factoring VIE’s economic performance include committing the Factoring VIE to legal agreements to purchase or sell assets, selecting which receivables are purchased in the factoring arrangement, determining whether the Factoring VIE will sell interests in the purchased service receivables to other parties, and servicing of the receivables. While T-Mobile acts as the servicer of the sold receivables, which is considered a significant activity of the VIE, the Company is acting as an agent in its capacity as the servicer and the counterparty to the factoring arrangement has the ability to remove T-Mobile as the servicing agent of the receivables at will with no recourse available to T-Mobile. As the Company has determined it is not the primary beneficiary and does not hold any equity interest, the results of the Factoring VIE are not consolidated into the Company’s condensed consolidated financial statements.
Sales of Receivables
The sales of receivables through the factoring arrangement are treated as sales of financial assets. Upon sale, T-Mobile derecognizes the receivables, as well as the related allowances, and recognizes the net proceeds in cash provided by operating activities.
As of
December 31, 2014
, T-Mobile derecognized net receivables of
$768 million
through the factoring arrangement. For the year ended
December 31, 2014
, T-Mobile received net cash proceeds of
$610 million
. The proceeds were net of a receivable for the remainder of the purchase price (“deferred purchase price”), which is received from collections on the service receivables. T-Mobile recognizes the deferred purchase price in cash provided by operating activities due to the short duration
62
of the receivables sold and the nature of the related activity. The deferred purchase price represents a financial asset that can be settled in such a way that T-Mobile may not recover substantially all of its recorded investment due to the creditworthiness of customers. As a result, T-Mobile elected at inception to classify the deferred purchase price as a trading security carried at fair value with unrealized gains and losses from changes in fair value included in selling, general and administrative expense. The fair value of the deferred purchase price was determined based on a discounted cash flow model which uses unobservable inputs (Level 3 inputs), including customer default rates. Due to the short-term nature of the underlying financial assets, the carrying value approximated fair value. As of
December 31, 2014
, other current assets related to the factoring arrangement, which were held by the Factoring SPE and primarily consisted of the deferred purchase price, were
$204 million
. As of
December 31, 2014
, accounts payable and accrued liabilities and other current liabilities related to the factoring arrangement, which were held by the Factoring SPE, were
$13 million
and
$55 million
, respectively.
Net expenses resulting from the sales of receivables are recognized in selling, general and administrative expense. Prior to the sales of receivables, T-Mobile recognizes impairment charges, rather than bad debt expense, to reduce the receivables to fair value for estimated losses resulting from uncollectible balances. Net expenses also include any resulting gains or losses from the sales of receivables, unrealized gains and losses related to the deferred purchase price, and factoring fees. For the
year ended December 31, 2014
, T-Mobile recognized net expenses of
$179 million
.
Continuing Involvement
T-Mobile has continuing involvement with the sold receivables as it services the receivables and is required to repurchase certain receivables, including aged receivables and receivables where write-off is imminent, pursuant to the factoring arrangement. T-Mobile will continue to service the customer and their related receivables, including facilitating customer payment collection, in exchange for a monthly servicing fee. As the receivables are sold on a revolving basis, the customer payment collections are reinvested in new receivable sales. While servicing the receivables the same policies and procedures are applied to the sold receivables that apply to owned receivables, and T-Mobile continues to maintain normal relationships with its customers.
In addition, T-Mobile has continuing involvement related to the sold receivables as it may be responsible for absorbing additional credit losses pursuant to the agreement. The Company’s maximum exposure to loss related to the involvement with the Factoring VIE was
$475 million
as of
December 31, 2014
. The maximum exposure to loss, which is required disclosure under GAAP, represents an estimated loss that would be incurred under severe, hypothetical circumstances whereby the Company would not receive the portion of the contractual proceeds withheld by the Factoring VIE and would also be required to repurchase the maximum amount of receivables pursuant to the agreement without consideration for any recovery. As T-Mobile believes the probability of these circumstances occurring is very remote, the maximum exposure to loss is not an indication of the Company’s expected loss.
The components of property and equipment were as follows:
|
(in millions)
|
Useful Lives
|
December 31,
2014 |
December 31,
2013 |
||||||
|
Buildings and equipment
|
Up to 40 years
|
$
|
1,948
|
|
$
|
1,862
|
|
||
|
Wireless communications systems
|
Up to 20 years
|
25,633
|
|
24,594
|
|
||||
|
Leasehold improvements
|
Up to 12 years
|
988
|
|
971
|
|
||||
|
Capitalized software
|
Up to 7 years
|
7,593
|
|
6,424
|
|
||||
|
Construction in progress
|
1,874
|
|
1,147
|
|
|||||
|
Accumulated depreciation and amortization
|
(21,791
|
)
|
(19,649
|
)
|
|||||
|
Property and equipment, net
|
$
|
16,245
|
|
$
|
15,349
|
|
|||
Wireless communication systems include capital lease agreements primarily for DAS, with varying expiration terms through
2029
. As of
December 31, 2014
, capital lease assets and accumulated amortization were
$364 million
and
$53 million
, respectively. As of
December 31, 2013
, capital lease assets and accumulated amortization were
$285 million
and
$27 million
, respectively.
T-Mobile capitalizes interest associated with the acquisition or construction of certain property and equipment. The Company recognized capitalized interest of
$81 million
,
$5 million
and
$9 million
for the years ended
December 31, 2014
,
2013
and
2012
, respectively. For the year ended
December 31, 2014
, the Company recorded increased capitalized interest in connection
63
with T-Mobile's network modernization, including the build out of the network to utilize the recently acquired 700 MHz A-Block spectrum licenses.
Depreciation expense relating to property and equipment was
$4.1 billion
,
$3.4 billion
and
$3.2 billion
for the years ended
December 31, 2014
,
2013
and
2012
, respectively. For the year ended
December 31, 2014
, the Company recorded additional depreciation expense of
$242 million
as a result of adjustments to useful lives of network equipment expected to be replaced in connection with T-Mobile's network modernization and decommissioning the MetroPCS CDMA network and redundant network cell sites. For the year ended
December 31, 2013
, additional depreciation expense was not significant. For the year ended
December 31, 2012
, the Company recorded additional depreciation expense of
$268 million
as a result of adjustments to useful lives of network equipment expected to be replaced in connection with T-Mobile's network modernization.
Asset retirement obligations are primarily for certain legal obligations to remediate leased property on which the Company’s network infrastructure and administrative assets are located.
Activity in the asset retirement obligations was as follows:
|
(in millions)
|
December 31,
2014 |
December 31,
2013 |
|||||
|
Asset retirement obligations, beginning of year
|
$
|
388
|
|
$
|
136
|
|
|
|
Liabilities incurred
|
3
|
|
—
|
|
|||
|
Liabilities assumed in connection with the business combination with MetroPCS
|
—
|
|
211
|
|
|||
|
Liabilities settled
|
(21
|
)
|
—
|
|
|||
|
Accretion expense
|
20
|
|
15
|
|
|||
|
Revisions in estimated cash flows
|
—
|
|
26
|
|
|||
|
Asset retirement obligations, end of year
|
$
|
390
|
|
$
|
388
|
|
|
|
Classified on the balance sheet as:
|
|||||||
|
Other current liabilities
|
$
|
179
|
|
$
|
—
|
|
|
|
Other long-term liabilities
|
211
|
|
388
|
|
|||
|
Asset retirement obligations
|
$
|
390
|
|
$
|
388
|
|
|
The corresponding asset, net of accumulated depreciation, related to asset retirement obligations were
$95 million
and
$240 million
as of
December 31, 2014
and
2013
, respectively.
Goodwill
Changes in carrying values of goodwill were as follows:
|
(in millions)
|
December 31,
2012 |
Net Changes
|
December 31,
2013 |
Net Changes
|
December 31,
2014 |
||||||||||||||
|
Goodwill, gross
|
$
|
18,465
|
|
$
|
1,683
|
|
$
|
20,148
|
|
$
|
—
|
|
$
|
20,148
|
|
||||
|
Accumulated impairment
|
(18,465
|
)
|
—
|
|
(18,465
|
)
|
—
|
|
(18,465
|
)
|
|||||||||
|
Goodwill
|
$
|
—
|
|
$
|
1,683
|
|
$
|
1,683
|
|
$
|
—
|
|
$
|
1,683
|
|
||||
During the year ended
December 31, 2013
, the carrying value of goodwill increased
$1.7 billion
as a result of the business combination with MetroPCS. See
Note 2 – Business Combination with MetroPCS
for further information.
Spectrum Licenses
Changes in carrying values of spectrum licenses were as follows:
|
(in millions)
|
December 31,
2012 |
Net Changes
|
December 31,
2013 |
Net Changes
|
December 31,
2014 |
||||||||||||||
|
Spectrum licenses
|
$
|
14,550
|
|
$
|
3,572
|
|
$
|
18,122
|
|
$
|
3,833
|
|
$
|
21,955
|
|
||||
During the year ended
December 31, 2014
, the carrying value of spectrum licenses increased primarily as a result of spectrum acquisition activities. In 2014, T-Mobile completed transactions for the acquisition of 700 MHz A-Block, Advanced Wireless
64
Service (“AWS”) and Personal Communications Service (“PCS”) spectrum licenses, primarily with Verizon Communications Inc. (“Verizon”), for cash and the exchange of certain AWS and PCS spectrum licenses. Upon closing of the transactions in 2014, T-Mobile received 700 MHz A-Block, AWS and PCS spectrum licenses, paid
$2.5 billion
in cash and transferred certain AWS and PCS spectrum licenses. T-Mobile recorded the spectrum licenses received at their fair value of
$4.8 billion
. In addition, T-Mobile recognized a non-cash gain of
$840 million
included in gains on disposal of spectrum licenses for the year ended
December 31, 2014
.
In 2014, T-Mobile entered into additional transactions, which are expected to close in 2015, for the acquisition of 700 MHz A-Block, AWS and PCS spectrum licenses with an estimated aggregate fair value of approximately
$0.5 billion
, which cover more than
40 million
people, for cash and the exchange of certain AWS and PCS spectrum licenses, which cover approximately
6 million
people. The transactions are subject to regulatory approval and other customary closing conditions.
In 2014, the FCC began conducting an auction of AWS spectrum licenses and provided the FCC with a deposit in connection with the auction. The deposit of
$417 million
was included in other current assets as of December 31, 2014. See
Note 16 – Subsequent Events
for further information on the auction of AWS spectrum licenses.
During the year ended
December 31, 2013
, the carrying value of spectrum licenses increased
$3.8 billion
as a result of the business combination with MetroPCS. See
Note 2 – Business Combination with MetroPCS
for further information. In addition, during the year ended
December 31, 2013
, T-Mobile completed a transaction to purchase AWS spectrum licenses from United States Cellular Corporation for
$308 million
.
Spectrum licenses to be transferred under various agreements are classified as held for sale and included in other current assets at their carrying value until approval and completion of the exchange or sale. Spectrum licenses classified as held for sale were not significant as of
December 31, 2014
. Spectrum licenses classified as held for sale were
$614 million
as of
December 31, 2013
.
Goodwill Impairment and Indefinite-Lived Intangible Assets Assessment
The Company's two-step impairment assessment of goodwill resulted in no impairment as of
December 31, 2014
and
2013
. The fair value of goodwill is determined using a market method, which is based on market capitalization. The Company's qualitative impairment assessment of indefinite-lived intangible assets (spectrum licenses) resulted in no impairment as of
December 31, 2014
. The Company's fair value impairment assessment of indefinite-lived intangible assets (spectrum licenses) resulted in no impairment as of
December 31, 2013
and
2012
. The Company estimated the fair value of indefinite-lived intangible assets (spectrum licenses) using the Greenfield approach, which is an income approach.
In October 2012, the business combination of T-Mobile USA and MetroPCS was announced. See
Note 2 – Business Combination with MetroPCS
for further information. The Company determined the announced transaction was a triggering event for a goodwill impairment assessment. The fair value of T-Mobile USA implied by using the market value of MetroPCS and the exchange terms contemplated in the BCA was less than the carrying amount, including goodwill, of the Company's single reporting unit. The Company used the fair value implied by the transaction to estimate the fair value of the reporting unit in step one of its goodwill impairment test as it incorporates observable inputs that are considered as Level 2 in the fair value hierarchy. As the carrying value exceeded the fair value of the reporting unit, the Company performed the second step in the goodwill impairment test.
In the second step, the Company concluded that the implied goodwill was
zero
, and recognized a noncash impairment charge of
$8.1 billion
for the year ended
December 31, 2012
. The Company also recorded a related deferred tax benefit of
$74 million
for the year ended
December 31, 2012
to reflect the impact on the respective deferred tax liability due to the reduced book to tax basis difference of goodwill. The Company attributed this impairment to the business impacts from the highly competitive environment and the ongoing challenges in attracting and retaining branded postpaid customers.
65
Other Intangible Assets
The components of intangible assets were as follows:
|
Useful Lives
|
December 31, 2014
|
December 31, 2013
|
|||||||||||||||||||||||
|
(in millions)
|
Gross
Amount |
Accumulated Amortization
|
Net
Amount |
Gross
Amount |
Accumulated Amortization
|
Net
Amount |
|||||||||||||||||||
|
Customer lists
|
Up to 6 years
|
$
|
1,313
|
|
$
|
(700
|
)
|
$
|
613
|
|
$
|
1,313
|
|
$
|
(419
|
)
|
$
|
894
|
|
||||||
|
Trademarks and patents
|
Up to 12 years
|
295
|
|
(78
|
)
|
217
|
|
292
|
|
(38
|
)
|
254
|
|
||||||||||||
|
Other
|
Up to 28 years
|
71
|
|
(31
|
)
|
40
|
|
75
|
|
(19
|
)
|
56
|
|
||||||||||||
|
Other intangible assets
|
$
|
1,679
|
|
$
|
(809
|
)
|
$
|
870
|
|
$
|
1,680
|
|
$
|
(476
|
)
|
$
|
1,204
|
|
|||||||
Amortization expense for intangible assets subject to amortization was
$333 million
,
$255 million
and
$27 million
for the years ended
December 31, 2014
,
2013
and
2012
, respectively. Estimated aggregate future amortization expense for intangible assets subject to amortization as of
December 31, 2014
are
$278 million
for the year ending
2015
,
$222 million
in
2016
,
$163 million
in
2017
,
$104 million
in
2018
,
$51 million
in
2019
and
$52 million
thereafter.
Derivative Financial Instruments
Embedded Derivatives
In connection with the business combination with MetroPCS, T-Mobile issued senior reset notes to Deutsche Telekom. The interest rates are adjusted at the reset dates to rates defined in the applicable supplemental indentures to manage interest rate risk related to the senior reset notes. The Company determined certain components of the reset feature are required to be bifurcated from the senior reset notes and separately accounted for as embedded derivative instruments. T-Mobile held
five
embedded derivatives as of
December 31, 2014
and
2013
, respectively.
The fair value of the embedded derivatives was determined using a lattice-based valuation model by determining the fair value of the senior reset notes with and without the embedded derivatives included. The fair value of the senior reset notes with the embedded derivatives utilizes the contractual term of each senior reset note, reset rates calculated based on the spread between specified yield curves and the yield curve on certain T-Mobile long-term debt adjusted pursuant to the applicable supplemental indentures, and interest rate volatility. Interest rate volatility is a significant unobservable input (Level 3) as it is derived based on weighted risk-free rate volatility and credit spread volatility. Significant increases or decreases in the weighting of risk-free volatility and credit spread volatility, in isolation, would result in a higher or lower fair value of the embedded derivatives. The embedded derivatives were classified as Level 3 in the fair value hierarchy.
Interest Rate Swaps and Cross Currency Interest Rate Swaps
Prior to the closing of the business combination with MetroPCS, T-Mobile managed interest rate risk related to long-term debt to affiliates by entering into interest rate swap and cross currency interest rate swap agreements. The interest rate swaps were not designated as hedging instruments. The cross currency interest rate swaps were designated as cash flow hedges and met the criteria for hedge accounting. Deutsche Telekom recapitalized T-Mobile by retiring the existing T-Mobile long-term debt to affiliates and all related derivative instruments, which included the interest rate swaps and cross currency interest rate swaps. The related balances were reclassified into net income (loss). As of
December 31, 2014
and
2013
, there were
no
outstanding interest rate swaps or cross currency interest rate swap agreements.
The fair value of embedded derivative financial instruments measured on a recurring basis by balance sheet location and level were as follows:
|
December 31, 2014
|
|||||||||||||||
|
(in millions)
|
Level 1
|
Level 2
|
Level 3
|
Total
|
|||||||||||
|
Other current assets
|
$
|
—
|
|
$
|
—
|
|
$
|
3
|
|
$
|
3
|
|
|||
|
Other assets
|
—
|
|
—
|
|
2
|
|
2
|
|
|||||||
66
|
December 31, 2013
|
|||||||||||||||
|
(in millions)
|
Level 1
|
Level 2
|
Level 3
|
Total
|
|||||||||||
|
Other long-term liabilities
|
$
|
—
|
|
$
|
—
|
|
$
|
13
|
|
$
|
13
|
|
|||
The following table summarizes the activity related to derivatives instruments:
|
Year Ended December 31,
|
|||||||||||
|
(in millions)
|
2014
|
2013
|
2012
|
||||||||
|
Gain (loss) recognized in other comprehensive income (loss):
|
|||||||||||
|
Cross currency interest rate swaps
|
$
|
—
|
|
$
|
(17
|
)
|
$
|
139
|
|
||
|
Gain (loss) recognized in interest expense to affiliates:
|
|||||||||||
|
Embedded derivatives
|
18
|
|
(13
|
)
|
—
|
|
|||||
|
Interest rate swaps
|
—
|
|
8
|
|
71
|
|
|||||
|
Cross currency interest rate swaps
|
—
|
|
53
|
|
10
|
|
|||||
The fair value of the Company’s long-term debt to affiliates was determined based on a discounted cash flow approach which considers the future cash flows discounted at current rates. The approach includes an estimate for the stand-alone credit risk of T-Mobile. The Company’s long-term debt to affiliates were classified as Level 2 in the fair value hierarchy. The fair value of the Company’s long-term debt to third parties were determined based on quoted market prices in active markets, and therefore was classified as Level 1 in the fair value hierarchy.
The carrying amounts and fair values of the Company’s long-term debt were as follows:
|
December 31, 2014
|
December 31, 2013
|
||||||||||||||
|
(in millions)
|
Carrying Amount
|
Fair Value
|
Carrying Amount
|
Fair Value
|
|||||||||||
|
Long-term debt to third parties principal, excluding capital leases
|
$
|
15,600
|
|
$
|
16,034
|
|
$
|
13,600
|
|
$
|
14,251
|
|
|||
|
Long-term debt to affiliates
|
5,600
|
|
5,780
|
|
5,600
|
|
5,866
|
|
|||||||
Although the Company has determined the estimated fair value using available market information and commonly accepted valuation methodologies, considerable judgment was required in interpreting market data to develop fair value estimates for the long-term debt. The fair value estimates were based on information available as of
December 31, 2014
and
2013
. As such, the Company’s estimates are not necessarily indicative of the amount the Company could realize in a current market exchange.
67
Note 8 – Debt
Debt was as follows:
|
(in millions)
|
December 31, 2014
|
December 31,
2013 |
|||||
|
5.250% Senior Notes due 2018
|
$
|
500
|
|
$
|
500
|
|
|
|
7.875% Senior Notes due 2018
|
—
|
|
1,000
|
|
|||
|
5.578% Senior Reset Notes to affiliates due 2019 (reset date in April 2015)
|
1,250
|
|
1,250
|
|
|||
|
6.464% Senior Notes due 2019
|
1,250
|
|
1,250
|
|
|||
|
5.656% Senior Reset Notes to affiliates due 2020 (reset date in April 2015)
|
1,250
|
|
1,250
|
|
|||
|
6.542% Senior Notes due 2020
|
1,250
|
|
1,250
|
|
|||
|
6.625% Senior Notes due 2020
|
1,000
|
|
1,000
|
|
|||
|
5.747% Senior Reset Notes to affiliates due 2021 (reset date in October 2015)
|
1,250
|
|
1,250
|
|
|||
|
6.250% Senior Notes due 2021
|
1,750
|
|
1,750
|
|
|||
|
6.633% Senior Notes due 2021
|
1,250
|
|
1,250
|
|
|||
|
5.845% Senior Reset Notes to affiliates due 2022 (reset date in October 2015)
|
1,250
|
|
1,250
|
|
|||
|
6.125% Senior Notes due 2022
|
1,000
|
|
1,000
|
|
|||
|
6.731% Senior Notes due 2022
|
1,250
|
|
1,250
|
|
|||
|
5.950% Senior Reset Notes to affiliates due 2023 (reset date in April 2016)
|
600
|
|
600
|
|
|||
|
6.000% Senior Notes due 2023
|
1,300
|
|
—
|
|
|||
|
6.625% Senior Notes due 2023
|
1,750
|
|
1,750
|
|
|||
|
6.836% Senior Notes due 2023
|
600
|
|
600
|
|
|||
|
6.500% Senior Notes due 2024
|
1,000
|
|
1,000
|
|
|||
|
6.375% Senior Notes due 2025
|
1,700
|
|
—
|
|
|||
|
Unamortized premium from purchase price allocation fair value adjustment
|
286
|
|
410
|
|
|||
|
Capital leases
|
410
|
|
353
|
|
|||
|
Financing arrangements
|
64
|
|
226
|
|
|||
|
Total debt
|
21,960
|
|
20,189
|
|
|||
|
Less: Current portion of capital leases
|
23
|
|
18
|
|
|||
|
Less: Financing arrangements
|
64
|
|
226
|
|
|||
|
Total long-term debt
|
$
|
21,873
|
|
$
|
19,945
|
|
|
|
Classified on the balance sheet as:
|
|||||||
|
Long-term debt
|
$
|
16,273
|
|
$
|
14,345
|
|
|
|
Long-term debt to affiliates
|
5,600
|
|
5,600
|
|
|||
|
Total long-term debt
|
$
|
21,873
|
|
$
|
19,945
|
|
|
Long-term Debt
In
2014
, the Company issued
$1.3 billion
of
6.000%
Senior Notes due
2023
and
$1.7 billion
of
6.375%
Senior Notes due
2025
, for which certain subsidiaries are guarantors. See
Note 15 – Guarantor Financial Information
for further information regarding the condensed consolidating financial information of T-Mobile’s guarantor subsidiaries. In
2014
, a portion of the proceeds from the issuance of the notes was used to redeem
$1.0 billion
of
7.875%
Senior Notes due
2018
, which resulted in a non-cash gain on extinguishment of
$37 million
included in other income (expense), net.
Interest on the long-term debt, excluding capital leases, is accrued from the date of issuance at stated interest rates and paid semi-annually. The interest rates on the senior reset notes to affiliates are adjusted at the reset dates to rates defined in the applicable supplemental indenture. The long-term debt may be redeemed, in whole or from time to time in part, at specified redemption prices. The long-term debt may also be redeemed using make-whole call provisions or in part with equity proceeds. All redemptions are subject to the conditions set forth in the applicable supplemental indenture.
Capital Leases
Capital lease agreements are primarily for DAS, with varying expiration terms through
2029
. As of
December 31, 2014
, capital lease obligations were
$410 million
. As of
December 31, 2013
, capital lease obligations were
$353 million
. Future minimum
68
payments required under capital leases, including interest, over their remaining terms as of
December 31, 2014
are expected to be
$49 million
for the year ending
2015
,
$51 million
in
2016
,
$51 million
in
2017
,
$53 million
in
2018
,
$54 million
in
2019
, and
$319 million
thereafter, for a total of
$577 million
, including
$167 million
in interest.
Financing Arrangements
In
2014
, the Company entered into a handset financing arrangement with Deutsche Bank AG (“Deutsche Bank”) which allows for up to
$108 million
in borrowings. Under the handset financing arrangement, the Company can effectively extend payment terms for invoices payable to certain handset vendors. The interest rate on the handset financing arrangement is determined based on LIBOR plus a specified margin per the arrangement. Obligations under the handset financing arrangement are included in short-term debt. In
2014
, T-Mobile utilized and paid
$100 million
under the handset financing arrangement. As of
December 31, 2014
, there was
no
outstanding balance.
The Company maintains vendor financing arrangements with its primary network equipment suppliers. Under the respective agreements, the Company can obtain extended financing terms. The interest rate on the vendor financing arrangements is determined based on the difference between LIBOR and a specified margin per the agreements. Obligations under the vendor financing arrangements are included in short-term debt. As of
December 31, 2014
and
2013
, the outstanding balances were
$64 million
and
$226 million
.
Lines and Standby Letters of Credit
T-Mobile has an unsecured revolving credit facility with Deutsche Telekom which allows for up to
$500 million
in borrowings. As of
December 31, 2014
and
2013
, T-Mobile had
no
borrowings outstanding under this facility.
For the purposes of securing T-Mobile’s obligations to provide handset insurance services, T-Mobile maintains an agreement for standby letters of credit with JP Morgan Chase Bank, N.A. (“JP Morgan Chase”), which was used to replace an existing standby letter of credit issued by Deutsche Bank and guaranteed by Deutsche Telekom.
For purposes of securing T-Mobile’s obligations for general purposes, T-Mobile entered into a letter of credit reimbursement agreement in 2013 with Deutsche Bank. In 2014, T-Mobile began transitioning existing standby letters of credit with U.S. Bank National Association (“U.S. Bank”) in an orderly fashion to Deutsche Bank.
The following table summarizes the outstanding standby letters of credit under each agreement:
|
(in millions)
|
December 31, 2014
|
December 31,
2013 |
|||||
|
JP Morgan Chase
|
$
|
36
|
|
$
|
—
|
|
|
|
Deutsche Bank
|
50
|
|
58
|
|
|||
|
U.S. Bank
|
—
|
|
46
|
|
|||
|
Total outstanding balance
|
$
|
86
|
|
$
|
104
|
|
|
Note 9 – Tower Transaction and Related Long-Term Financial Obligation
In 2012, T-Mobile conveyed to Crown Castle International Corp. (“CCI”) the exclusive right to manage and operate approximately
7,100
T-Mobile owned wireless communication tower sites in exchange for net proceeds of
$2.5 billion
(“Tower Transaction”), of which the Company distributed
$2.4 billion
as a dividend to Deutsche Telekom. Rights to approximately
6,200
of the tower sites were transferred to CCI via a Master Prepaid Lease with site lease terms ranging from
23
to
37
years (“MPL Sites”), while the remaining tower sites were sold to CCI (“Sale Sites”). In connection with the Tower Transaction, assets essential to operate the tower sites and liabilities associated with the operation of the tower sites were transferred to bankruptcy-remote SPEs. Assets included ground lease agreements or deeds for the land on which the towers are situated, the towers themselves and existing subleasing agreements with other mobile network operator tenants, who lease space at the tower sites. Liabilities included the obligation to pay ground lease rentals, property taxes and other executory costs. Upon closing of the transaction, CCI acquired all of the equity interests in the SPEs containing the Sale Sites and an option to acquire the MPL Sites at the end of their respective lease terms. T-Mobile and CCI contemporaneously entered into a master lease agreement under which T-Mobile agreed to lease back space at all of the tower sites involved in the Tower Transaction for an initial term of
ten
years, followed by eight optional five-year renewal terms for a total potential term of up to
50
years. Leaseback rentals will escalate annually based on changes in the Consumer Price Index.
69
The Company determined that the SPEs containing the MPL Sites (“MPL Site SPEs”) are VIEs as the Company's equity investment lacks the power to direct the activities that most significantly impact the economic performance of the VIEs, such as managing existing tenants, finding new tenants, managing the underlying ground leases, and performing repair and maintenance on the towers; the obligation to absorb expected losses, such as credit risk associated with current and future tenants; and the right to receive the expected future residual returns of the SPEs as CCI holds a purchase option whereby it may purchase the leased properties at a fixed price at the end of the Master Prepaid Lease term. For the aforementioned reasons, the Company determined that it does not have a controlling financial interest and is not the primary beneficiary of the MPL Site SPEs.
Due to its continuing involvement with the tower sites, T-Mobile determined it was precluded from applying sale-leaseback accounting to either the MPL Sites or the Sale Sites and has accounted for the transaction as financing. Consequently, the Company did not derecognize the tower site assets or accrued ground leases that had a carrying value of
$806 million
and
$135 million
, respectively. Tower site assets continue to be reported in property and equipment and depreciated. As of
December 31, 2014
and
2013
, the tower site assets, net of accumulated depreciation, were
$604 million
and
$707 million
, respectively. Upon closing of the transaction, the Company recorded a long-term financial obligation in the amount of the net proceeds received from CCI, as well as interest on the financial obligation at a rate of approximately
8%
using the effective interest method. As of
December 31, 2014
and
2013
, the long-term financial obligation was
$2,521 million
and
$2,496 million
, respectively. The financial obligation is increased by accrued interest expense and amortized through contractual leaseback payments made by T-Mobile to CCI and through estimated future net cash flows generated and retained by CCI from operation of the tower sites.
Future minimum payments related to the financial obligation are summarized below:
|
(in millions)
|
Total
|
||
|
Year Ending December 31,
|
|||
|
2015
|
$
|
166
|
|
|
2016
|
166
|
|
|
|
2017
|
166
|
|
|
|
2018
|
166
|
|
|
|
2019
|
166
|
|
|
|
Thereafter
|
1,316
|
|
|
|
Total
|
$
|
2,146
|
|
In addition, the Company is contingently liable for future ground lease payments through the remaining term of the MPL as the Company remains an obligor on the ground leases related to the sites. These contingent obligations are not included in the above table as any amount due under ground leases is contractually owed by CCI based on the T-Mobile's subleasing arrangement with CCI. See
Note 13 – Commitments and Contingencies
for further information.
Stock Awards
During 2013, the Company’s Board of Directors and stockholders approved the 2013 Omnibus Incentive Plan, which authorized the issuance of up to
63,275,000
shares of common stock. Under the incentive plan, the Company may grant stock options, stock appreciation rights, restricted stock, restricted stock units, and performance awards to employees, consultants, advisors and non-employee directors. As of
December 31, 2014
, there were
37 million
shares of common stock available for future grants under the incentive plan.
In 2013, the Company began to grant restricted stock units (“RSU”) to eligible employees and certain non-employee directors and performance stock units (“PSU”) to eligible key executives of the Company. RSUs entitle the grantee to receive shares of T-Mobile common stock at the end of a vesting period up to
3.5 years
. PSUs entitle the holder to receive shares of T-Mobile common stock at the end of a vesting period up to
2.5 years
if the performance goal is achieved. The number of shares ultimately received is dependent on T-Mobile's business performance against the specified performance goal.
70
Stock-based compensation expense and related income tax benefits were as follows:
|
(in millions)
|
December 31,
2014 |
December 31,
2013 |
|||||
|
Stock-based compensation expense
|
$
|
196
|
|
$
|
100
|
|
|
|
Income tax benefit related to stock-based compensation
|
73
|
|
38
|
|
|||
The following activity occurred under the RSU and PSU awards:
|
Units
|
Weighted Average Grant-Date Fair Value
|
|||||
|
Nonvested, December 31, 2013
|
22,949,165
|
|
$
|
22.14
|
|
|
|
Granted
|
5,199,290
|
|
28.52
|
|
||
|
Vested
|
(6,296,107
|
)
|
21.21
|
|
||
|
Forfeited
|
(1,900,259
|
)
|
21.53
|
|
||
|
Nonvested, December 31, 2014
|
19,952,089
|
|
$
|
24.15
|
|
|
Vesting of the stock awards triggers a tax obligation for the employee, which is required to be remitted to the relevant tax authorities. The Company has agreed to withhold stock units from the employee to cover the tax obligation. For the year ended
December 31, 2014
, the Company withheld
2,203,673
stock units to cover tax obligations associated with vesting of stock awards and remitted cash of
$73 million
to the appropriate tax authorities. For the year ended
December 31, 2013
, the stock units withheld to cover tax obligations associated with vesting of stock awards and cash remitted to the appropriate tax authorities were not significant. The net shares issued to the employee are accounted for as outstanding common stock.
As of
December 31, 2014
, total unrecognized stock-based compensation expense related to nonvested stock awards, net of estimated forfeitures, was
$271 million
, before income taxes, which is expected to be recognized over a weighted-average period of
1.9 years
.
Stock Options
Prior to the business combination, MetroPCS had established the MetroPCS Communications, Inc. 2010 Equity Incentive Compensation Plan, the Amended and Restated MetroPCS Communications, Inc. 2004 Equity Incentive Compensation Plan and the Second Amended and Restated 1995 Stock Option Plan (“Predecessor Plans”). The MetroPCS stock options were adjusted in connection with the business combination. See
Note 2 – Business Combination with MetroPCS
for further information. Following stockholder approval of the Company’s 2013 Omnibus Incentive Plan, no new awards may be granted under the Predecessor Plans.
The following activity occurred under the Predecessor Plans:
|
(in millions, except per share amounts)
|
Shares
|
Weighted-Average Exercise Price
|
Weighted-Average Remaining Contractual Term (Years)
|
|||||
|
Outstanding, December 31, 2013
|
6,333,020
|
|
$
|
24.64
|
|
|||
|
Exercised
|
(1,496,365
|
)
|
17.95
|
|
||||
|
Expired
|
(487,743
|
)
|
42.41
|
|
||||
|
Outstanding and exercisable, December 31, 2014
|
4,348,912
|
|
$
|
24.96
|
|
3.7
|
||
Stock options exercised under the Predecessor Plans generated proceeds of approximately
$27 million
and
$137 million
for the years ended
December 31, 2014
and
2013
, respectively. The Company realized excess tax benefits of
$34 million
for the year ended
December 31, 2014
. The Company did not realize excess tax benefits for the year ended
December 31, 2013
as such benefits would not have reduced income taxes payable.
Employee Retirement Savings Plan
The Company sponsors a retirement savings plan for the majority of its employees under section 401(k) of the Internal Revenue Code and similar plans. The plans allow employees to contribute a portion of their pretax income in accordance with specified guidelines. The plans match a percentage of employee contributions up to certain limits. Employer matching
71
contributions were
$66 million
,
$58 million
and
$59 million
for the years ended
December 31, 2014
,
2013
and
2012
, respectively.
Executive Compensation Plan
The Company maintains a performance-based Long Term Incentive Plan (“LTIP”) which aligns to the Company's long-term business strategy. LTIP awards were earned over a performance period of
three
years with
50%
of the target value earned on a ratable schedule and
50%
of the target value earned at the end of the three year performance period based on achievement of applicable performance metrics. As of
December 31, 2014
, there were LTIP awards outstanding for the 2013 and 2012 plans. Following the business combination with MetroPCS, awards were fixed at
100%
attainment and will be paid out over the remaining three year period. In addition, no new awards are expected to be granted under the LTIP.
Compensation expense reported within operating expenses related to the Company's LTIP was
$44 million
,
$63 million
and
$82 million
for the years ended
December 31, 2014
,
2013
and
2012
, respectively. Payments of
$60 million
,
$61 million
, and
$52 million
were made to participants related to T-Mobile’s LTIP during the years ended
December 31, 2014
,
2013
and
2012
, respectively.
The sources of income (loss) before income taxes were as follows:
|
Year Ended December 31,
|
|||||||||||
|
(in millions)
|
2014
|
2013
|
2012
|
||||||||
|
U.S.
|
$
|
347
|
|
$
|
(5
|
)
|
$
|
(6,739
|
)
|
||
|
Puerto Rico
|
66
|
|
56
|
|
(247
|
)
|
|||||
|
Income (loss) before income taxes
|
$
|
413
|
|
$
|
51
|
|
$
|
(6,986
|
)
|
||
The total income tax expense is summarized as follows:
|
Year Ended December 31,
|
|||||||||||
|
(in millions)
|
2014
|
2013
|
2012
|
||||||||
|
Current tax expense (benefit)
|
|||||||||||
|
Federal
|
$
|
—
|
|
$
|
(10
|
)
|
$
|
8
|
|
||
|
State
|
6
|
|
6
|
|
24
|
|
|||||
|
Puerto Rico
|
38
|
|
10
|
|
10
|
|
|||||
|
Total current tax expense
|
44
|
|
6
|
|
42
|
|
|||||
|
Deferred tax expense (benefit)
|
|||||||||||
|
Federal
|
79
|
|
24
|
|
321
|
|
|||||
|
State
|
40
|
|
(22
|
)
|
(14
|
)
|
|||||
|
Puerto Rico
|
3
|
|
8
|
|
1
|
|
|||||
|
Total deferred tax expense
|
122
|
|
10
|
|
308
|
|
|||||
|
Total income tax expense
|
$
|
166
|
|
$
|
16
|
|
$
|
350
|
|
||
The reconciliation between the U.S. federal statutory income tax rate and T-Mobile's effective income tax rate is as follows:
|
Year Ended December 31,
|
||||||||
|
2014
|
2013
|
2012
|
||||||
|
Federal statutory income tax rate
|
35.0
|
%
|
35.0
|
%
|
35.0
|
%
|
||
|
State taxes, net of federal benefit
|
4.0
|
|
2.5
|
|
2.5
|
|
||
|
Puerto Rico taxes, net of federal benefit
|
5.0
|
|
28.2
|
|
0.7
|
|
||
|
Change in valuation allowance
|
18.8
|
|
(6.1
|
)
|
(0.1
|
)
|
||
|
Impairment charges
|
—
|
|
—
|
|
(43.5
|
)
|
||
|
State net operating losses and other state tax items
|
(12.8
|
)
|
(34.3
|
)
|
0.6
|
|
||
|
Permanent differences
|
1.4
|
|
11.3
|
|
(0.1
|
)
|
||
|
Federal tax credits, net of reserves
|
(10.6
|
)
|
—
|
|
—
|
|
||
|
Other, net
|
(0.6
|
)
|
(5.2
|
)
|
(0.1
|
)
|
||
|
Effective income tax rate
|
40.2
|
%
|
31.4
|
%
|
(5.0
|
)%
|
||
72
Significant components of deferred income tax assets and liabilities, tax effected, are as follows:
|
(in millions)
|
December 31, 2014
|
December 31, 2013
|
|||||
|
Deferred tax assets
|
|||||||
|
Loss carryforwards
|
$
|
2,354
|
|
$
|
2,809
|
|
|
|
Deferred rents
|
1,034
|
|
885
|
|
|||
|
Reserves and accruals
|
454
|
|
362
|
|
|||
|
Federal and state tax credits
|
295
|
|
224
|
|
|||
|
Debt fair market value adjustment
|
111
|
|
159
|
|
|||
|
Other
|
295
|
|
274
|
|
|||
|
Deferred tax assets, gross
|
4,543
|
|
4,713
|
|
|||
|
Valuation allowance
|
(614
|
)
|
(537
|
)
|
|||
|
Deferred tax assets, net
|
3,929
|
|
4,176
|
|
|||
|
Deferred tax liabilities
|
|||||||
|
Spectrum licenses
|
5,629
|
|
5,007
|
|
|||
|
Property and equipment
|
1,877
|
|
2,550
|
|
|||
|
Other intangible assets
|
297
|
|
418
|
|
|||
|
Other
|
11
|
|
7
|
|
|||
|
Total deferred tax liabilities
|
7,814
|
|
7,982
|
|
|||
|
Net deferred tax liabilities
|
$
|
3,885
|
|
$
|
3,806
|
|
|
|
Classified on the balance sheet as:
|
|||||||
|
Current deferred tax assets, net
|
$
|
988
|
|
$
|
839
|
|
|
|
Non-current deferred tax liabilities, net
|
4,873
|
|
4,645
|
|
|||
|
Net deferred tax liabilities
|
$
|
3,885
|
|
$
|
3,806
|
|
|
As of
December 31, 2014
, the Company has net operating loss (“NOL”) carryforwards, tax effected, of
$2.1 billion
for federal income tax purposes and
$0.6 billion
for state income tax purposes, expiring through 2034. The Company’s NOL carryforwards for financial reporting purposes were approximately
$338 million
, tax effected, less than its NOL carryforwards for federal tax purposes as of
December 31, 2014
, due to federal unrecognized tax benefits of
$333 million
and the Company’s inability to realize excess tax benefits until such benefits reduce income taxes payable of
$5 million
. The Company’s ability to utilize NOL carryforwards in any given year may be limited by certain events, including a significant change in ownership interest.
The Company has available Alternative Minimum Tax credit carryforwards of
$172 million
as of
December 31, 2014
, which may be used to reduce regular federal income taxes and have no expiration. The Company also has tax credit carryforwards of
$72 million
for federal income tax purposes related primarily to internal research and development labor costs, which begin to expire in 2030.
The Company’s valuation allowance was
$614 million
and
$537 million
as of
December 31, 2014
and
2013
, respectively. The change in the valuation allowance of
$77 million
is primarily related to an increase in certain state income tax attributes, for which the Company does not believe it is more likely than not it will be able to utilize the attributes before expiration. Furthermore,
$37 million
of valuation allowance as of
December 31, 2014
and
2013
relates to stock option deductions included in the NOL carryforwards which will be reversed as an increase to equity when the related deferred tax assets are ultimately realized.
The Company files income tax returns in the U.S. federal jurisdiction, various state jurisdictions and in Puerto Rico. The Company is currently under examination by the IRS and by various states. Management does not believe the resolution of any of the audits will result in a material change to the Company’s financial condition, results of operations or cash flows. The Company is generally closed to U.S federal, state and Puerto Rico examination for years prior to 1998.
It is reasonably possible that the Company’s gross unrecognized tax benefits could significantly change within the next 12 months due to the closing of examinations. Due to the unpredictability of the examinations, it is not possible to estimate the amount that the unrecognized tax benefits may change.
73
A reconciliation of the beginning and ending amount of unrecognized tax benefits were as follows:
|
Year Ended December 31,
|
|||||||||||
|
(in millions)
|
2014
|
2013
|
2012
|
||||||||
|
Unrecognized tax benefits, beginning of year
|
$
|
178
|
|
$
|
89
|
|
$
|
97
|
|
||
|
Gross decreases to tax positions in prior periods
|
(52
|
)
|
(18
|
)
|
(10
|
)
|
|||||
|
Gross increases to current period tax positions
|
262
|
|
24
|
|
2
|
|
|||||
|
Gross increase due to current year business combination
|
—
|
|
83
|
|
—
|
|
|||||
|
Unrecognized tax benefits, end of year
|
$
|
388
|
|
$
|
178
|
|
$
|
89
|
|
||
As of
December 31, 2014
, the Company has
$44 million
in unrecognized tax benefits that, if recognized, would affect the Company's annual effective tax rate. Included in the 2013 increase to unrecognized tax benefits is
$83 million
related to tax positions acquired through the business combination with MetroPCS. Penalties and interest are included in selling, general and administrative expenses and interest expense, respectively. The accrued interest and penalties associated with unrecognized tax benefits are insignificant.
The computation of basic and diluted earnings (loss) per share was as follows:
|
Year Ended December 31,
|
|||||||||||
|
(in millions, except shares and per share amounts)
|
2014
|
2013
|
2012
|
||||||||
|
Net income (loss)
|
$
|
247
|
|
$
|
35
|
|
$
|
(7,336
|
)
|
||
|
Weighted average shares outstanding - basic
|
805,284,712
|
|
672,955,980
|
|
535,286,077
|
|
|||||
|
Dilutive effect of outstanding stock options and awards
|
8,893,887
|
|
3,929,235
|
|
—
|
|
|||||
|
Dilutive effect of preferred stock
|
1,743,659
|
|
—
|
|
—
|
|
|||||
|
Weighted average shares outstanding - diluted
|
815,922,258
|
|
676,885,215
|
|
535,286,077
|
|
|||||
|
Earnings (loss) per share - basic
|
$
|
0.31
|
|
$
|
0.05
|
|
$
|
(13.70
|
)
|
||
|
Earnings (loss) per share - diluted
|
$
|
0.30
|
|
$
|
0.05
|
|
$
|
(13.70
|
)
|
||
Potentially dilutive securities were not included in the computation of diluted earnings (loss) per share for certain periods if to do so would have been antidilutive. For the
year ended
December 31, 2014
and
2013
, potentially dilutive outstanding stock options of
1,398,961
and
2,161,350
and unvested stock awards of
27,370
and
2,748,391
as of
December 31, 2014
and
2013
, respectively, were excluded. Unvested PSUs were based on the number of shares ultimately expected to vest based on T-Mobile’s business performance against the specified performance goal. There were
no
potentially dilutive securities for the year ended
December 31, 2012
.
Commitments
Operating Leases
T-Mobile has operating leases for dedicated transportation lines with varying expiration terms through
2022
. In addition, T-Mobile has operating leases for cell sites, switch sites, retail stores and office facilities with contractual terms expiring through
2029
. The majority of cell site leases have an initial term of
five years
to
ten years
with several renewal options. The Company considers renewal options on leases as being reasonably assured of exercise, thus included in future minimum lease payments for a total term of approximately
15 years
.
74
Future minimum payments for non-cancelable operating leases, including reasonably assured renewal options, are summarized below:
|
Operating Leases
|
|||||||
|
(in millions)
|
Dedicated Transportation Lines
|
Other Operating Leases
|
|||||
|
Year Ending December 31,
|
|||||||
|
2015
|
$
|
258
|
|
$
|
2,031
|
|
|
|
2016
|
134
|
|
1,977
|
|
|||
|
2017
|
67
|
|
1,895
|
|
|||
|
2018
|
49
|
|
1,744
|
|
|||
|
2019
|
36
|
|
1,591
|
|
|||
|
Thereafter
|
33
|
|
5,487
|
|
|||
|
Total
|
$
|
577
|
|
$
|
14,725
|
|
|
In addition, as of
December 31, 2014
, the Company was contingently liable for approximately
$818 million
in future ground lease payments as the Company remains an obligor on the ground leases related to the Tower Transaction sites. These contingent obligations are not included in the above table as any amounts due under ground leases are contractually owed by CCI based on T-Mobile's subleasing arrangement with CCI. See
Note 9 – Tower Transaction and Related Long-Term Financial Obligation
for further information.
Total rent expense under operating leases, including dedicated transportation lines, was
$2.9 billion
,
$2.7 billion
and
$2.3 billion
for the
year ended
December 31, 2014
,
2013
and
2012
, respectively.
Purchase Commitments
T-Mobile has commitments for non-dedicated transportation lines with varying expiration terms through
2028
. In addition, T-Mobile has commitments to purchase spectrum licenses, handsets, network services, equipment, software, marketing sponsorship agreements and other items in the ordinary course of business, with various terms through
2019
. These amounts are not reflective of the Company’s entire anticipated purchases under the related agreements, but are determined based on the non-cancelable quantities or termination amounts to which the Company was contractually obligated.
In 2014, the FCC began conducting an auction of AWS spectrum licenses. T-Mobile provided the FCC with a deposit in connection with the auction. As the auction of AWS spectrum licenses was not completed as of December 31, 2014, no amounts were included in other purchase commitments below. See Note 16 - Subsequent Events for further information on the auction of AWS spectrum licenses.
Future minimum payments for non-cancelable purchase commitments are summarized below:
|
Purchase Commitments
|
|||||||
|
(in millions)
|
Non-Dedicated Transportation Lines
|
Other Purchase Commitments
|
|||||
|
Year Ending December 31,
|
|||||||
|
2015
|
$
|
715
|
|
$
|
1,496
|
|
|
|
2016
|
723
|
|
608
|
|
|||
|
2017
|
666
|
|
2,290
|
|
|||
|
2018
|
510
|
|
16
|
|
|||
|
2019
|
435
|
|
4
|
|
|||
|
Thereafter
|
935
|
|
—
|
|
|||
|
Total
|
$
|
3,984
|
|
$
|
4,414
|
|
|
Contingencies and Litigation
T-Mobile is involved in various lawsuits, claims, investigations and proceedings that arise in the ordinary course of business, which include numerous court actions alleging that T-Mobile is infringing various patents. Virtually all of the patent infringement cases are brought by non-practicing entities and effectively seek only monetary damages, although they occasionally seek injunctive relief as well. The matters described above have progressed to various stages and a small number
75
may go to trial in the coming 12 months if they are not otherwise resolved. T-Mobile has established an accrual with respect to certain of these matters, where appropriate, which is reflected in the consolidated financial statements but that T-Mobile does not consider, individually or in the aggregate, material. An accrual is established when T-Mobile believes it is both probable that a loss has been incurred and an amount can be reasonably estimated. For other matters, where the Company has not determined that a loss is probable or because the amount of loss cannot be reasonably estimated, the Company has not recorded an accrual due to various factors typical in contested proceedings, including but not limited to: uncertainty concerning legal theories and their resolution by courts or regulators; uncertain damage theories and demands; and a less than fully developed factual record. While T-Mobile does not expect that the ultimate resolution of these proceedings, individually or in the aggregate will have a material adverse effect on the Company’s financial position, an unfavorable outcome of some or all of these proceedings could have a material adverse impact on results of operations or cash flows for a particular period. This assessment is based on T-Mobile’s current understanding of relevant facts and circumstances. As such, T-Mobile’s view of these matters is subject to inherent uncertainties and may change in the future.
As T-Mobile has previously disclosed, the Company has been subject to investigations and inquiries by the Federal Trade Commission (“FTC”), FCC, state Attorneys General and other government agencies regarding third-party billing of unauthorized charges, a practice sometimes referred to as “cramming.” In particular, these investigations and inquiries focused on alleged unauthorized billing for premium Short Message Service (“SMS”) content. Premium SMS content was provided to customers by third parties that sent text alerts on topics of interest, such as weather and sports scores, and ringtones. T-Mobile, along with the other major wireless carriers, stopped billing for these services in late 2013. In June 2014, T-Mobile announced and then implemented a comprehensive refund program, under which T-Mobile has notified current and former customers who paid for premium SMS content and have not already received a refund how to request a summary of these charges and a refund for those charges customers assert to have been unauthorized. On July 1, 2014, the FTC filed a lawsuit alleging that T-Mobile allowed third-party merchants to include unauthorized premium SMS content charges on customer bills, and seeking restitution and changes in business practices (Federal Trade Commission v. T-Mobile USA, Inc., Case No. 2:14-cv-00967-JLR, W.D. Washington). In the fourth quarter of 2014, T-Mobile settled with the FTC, the FCC and the state Attorneys General. Under the terms of the settlements, T-Mobile agreed to provide customer refunds under its refund program, to make certain payments to the government agencies, and to make certain changes in its business practices. T-Mobile accrued
$24 million
in the second quarter of 2014 as a reduction to service revenue to reflect the estimated cost of the voluntary refund program. In addition, based on the status of settlement negotiations, T-Mobile accrued an additional
$29 million
in the third quarter of 2014 to selling, general and administrative expense to reflect additional cost in connection with the anticipated settlements. As a portion of the customer relief will be comprised of forgiveness of customer receivables that T-Mobile had written off in prior periods, T-Mobile determined that
no
additional charge was required in the fourth quarter of 2014 in connection with the settlements.
Note 14 – Additional Financial Information
Supplemental Balance Sheet Information
Allowances and Imputed Discount
The following table summarizes the changes in allowances and unamortized imputed discount related to its current accounts receivables and EIP receivables:
|
(in millions)
|
2014
|
2013
|
2012
|
||||||||
|
Allowances at beginning of year
|
$
|
169
|
|
$
|
197
|
|
$
|
313
|
|
||
|
Bad debt expense
|
444
|
|
463
|
|
702
|
|
|||||
|
Write-offs, net of recoveries
|
(414
|
)
|
(491
|
)
|
(818
|
)
|
|||||
|
Allowances at end of year
|
$
|
199
|
|
$
|
169
|
|
$
|
197
|
|
||
|
Imputed discount at beginning of year
|
$
|
212
|
|
$
|
92
|
|
$
|
34
|
|
||
|
Additions
|
380
|
|
283
|
|
125
|
|
|||||
|
Interest income
|
(355
|
)
|
(185
|
)
|
(72
|
)
|
|||||
|
Cancellations and other
|
(92
|
)
|
(42
|
)
|
(17
|
)
|
|||||
|
Transfer from long-term
|
126
|
|
64
|
|
22
|
|
|||||
|
Imputed discount at end of year
|
$
|
271
|
|
$
|
212
|
|
$
|
92
|
|
||
76
The following table summarizes the changes in unamortized imputed discount related to its long-term EIP receivables:
|
(in millions)
|
2014
|
2013
|
2012
|
||||||||
|
Imputed discount at beginning of year
|
$
|
64
|
|
$
|
18
|
|
$
|
7
|
|
||
|
Additions
|
141
|
|
121
|
|
35
|
|
|||||
|
Cancellations and other
|
(18
|
)
|
(11
|
)
|
(2
|
)
|
|||||
|
Transfer to current
|
(126
|
)
|
(64
|
)
|
(22
|
)
|
|||||
|
Imputed discount at end of year
|
$
|
61
|
|
$
|
64
|
|
$
|
18
|
|
||
See
Note 3 – Equipment Installment Plan Receivables
for further information on EIP receivables and related unamortized imputed discount and allowance for credit losses.
Accounts Payable and Accrued Liabilities
Accounts payable and accrued liabilities are summarized as follows:
|
(in millions)
|
December 31, 2014
|
December 31, 2013
|
|||||
|
Accounts payable
|
$
|
5,322
|
|
$
|
3,026
|
|
|
|
Property and other taxes, including payroll
|
605
|
|
534
|
|
|||
|
Payroll and related benefits
|
470
|
|
394
|
|
|||
|
Interest
|
349
|
|
272
|
|
|||
|
Dealer commissions
|
179
|
|
118
|
|
|||
|
Toll and interconnect
|
166
|
|
74
|
|
|||
|
Network decommissioning
|
78
|
|
—
|
|
|||
|
Advertising
|
53
|
|
42
|
|
|||
|
Other
|
142
|
|
107
|
|
|||
|
Accounts payable and accrued liabilities
|
$
|
7,364
|
|
$
|
4,567
|
|
|
Outstanding checks included in accounts payable and accrued liabilities were
$409 million
and
$342 million
as of
December 31, 2014
and
2013
, respectively.
Accumulated Other Comprehensive Income
Prior to the closing of the business combination with MetroPCS, Deutsche Telekom recapitalized T-Mobile by retiring T-Mobile’s long-term debt to affiliates principal balance and all related derivative instruments, which included the interest rate swaps and cross currency interest rate swaps.
The following table presents the effects on net income (loss) of amounts reclassified from AOCI (in millions):
|
Amount Reclassified from AOCI to Income
|
||||||||||||||
|
AOCI Component
|
Location
|
2014
|
2013
|
2012
|
||||||||||
|
Cross Currency Interest Rate Swaps
|
Interest expense to affiliates
|
$
|
—
|
|
$
|
(53
|
)
|
$
|
(10
|
)
|
||||
|
Income tax effect
|
—
|
|
20
|
|
4
|
|
||||||||
|
Net of tax
|
$
|
—
|
|
$
|
(33
|
)
|
$
|
(6
|
)
|
|||||
|
Foreign Currency Translation
|
Other income, net
|
$
|
—
|
|
$
|
166
|
|
$
|
(2
|
)
|
||||
|
Income tax effect
|
—
|
|
(62
|
)
|
1
|
|
||||||||
|
Net of tax
|
$
|
—
|
|
$
|
104
|
|
$
|
(1
|
)
|
|||||
|
Total reclassifications, net of tax
|
$
|
—
|
|
$
|
71
|
|
$
|
(7
|
)
|
|||||
77
Supplemental Statements of Comprehensive Income (Loss) Information
Related Party Transactions
T-Mobile has related party transactions associated with Deutsche Telekom or its affiliates in the ordinary course of business, which are included in the consolidated financial statements.
The following table summarizes the impact of significant transactions with Deutsche Telekom or its affiliates included in operating expenses in the
consolidated statements of comprehensive income (loss)
:
|
Year Ended December 31,
|
|||||||||||
|
(in millions)
|
2014
|
2013
|
2012
|
||||||||
|
Discount related to roaming expenses
|
$
|
(61
|
)
|
$
|
(16
|
)
|
$
|
(16
|
)
|
||
|
Fees incurred for use of the T-Mobile brand
|
60
|
|
53
|
|
50
|
|
|||||
|
Expenses for telecommunications and IT services
|
24
|
|
102
|
|
105
|
|
|||||
Restructuring Costs
In 2014, T-Mobile began decommissioning the MetroPCS CDMA network and redundant network cell sites. See
Note 2 – Business Combination with MetroPCS
for further information.
In
2013
, T-Mobile initiated a cost restructuring program in order to reduce its overall cost structure to align with its Un-carrier proposition and position T-Mobile for growth. Costs incurred related to the 2013 restructuring program were settled as of December 31, 2013.
In
2012
, T-Mobile consolidated its call center operations and restructured operations in other parts of the business to strengthen T-Mobile’s competitiveness. Major costs incurred primarily related to lease buyout costs, severance payments and other personnel-related restructuring costs. Lease buyout costs included in accrued liabilities and other long-term liabilities related to the
2012
restructuring program were not significant as of December 31, 2014 and are being relieved over the remaining lease terms through 2022.
Restructuring expense by restructuring plans included in other, net were as follows:
|
Year Ended December 31,
|
|||||||
|
(in millions)
|
2013
|
2012
|
|||||
|
2013 Restructuring program
|
|||||||
|
Restructuring costs
|
$
|
54
|
|
$
|
—
|
|
|
|
2012 Restructuring program
|
|||||||
|
Personnel related restructuring costs
|
—
|
|
50
|
|
|||
|
Nonpersonnel related restructuring costs
|
—
|
|
35
|
|
|||
|
Total restructuring costs
|
$
|
54
|
|
$
|
85
|
|
|
78
Supplemental Statements of Cash Flows Information
The following table summarizes T-Mobile’s supplemental cash flows information:
|
Year Ended December 31,
|
|||||||||||
|
(in millions)
|
2014
|
2013
|
2012
|
||||||||
|
Interest and income tax payments:
|
|||||||||||
|
Interest payments, net of amounts capitalized
|
$
|
1,367
|
|
$
|
1,156
|
|
$
|
845
|
|
||
|
Income tax payments
|
36
|
|
20
|
|
42
|
|
|||||
|
Noncash investing and financing activities:
|
|||||||||||
|
Increase in accounts payable for purchases of property and equipment
|
402
|
|
6
|
|
465
|
|
|||||
|
Issuance of short-term debt for financing of property and equipment purchases
|
256
|
|
470
|
|
—
|
|
|||||
|
Assets acquired under capital lease obligations
|
77
|
|
3
|
|
—
|
|
|||||
|
Relinquishment of accounts receivable from affiliates in satisfaction of long-term debt to affiliates
|
—
|
|
—
|
|
644
|
|
|||||
|
Spectrum license transactions with affiliates
|
—
|
|
—
|
|
1,633
|
|
|||||
|
Retirement of long-term debt to affiliates
|
—
|
|
14,450
|
|
—
|
|
|||||
|
Elimination of net unamortized discounts and premiums on long-term debt to affiliates
|
—
|
|
434
|
|
—
|
|
|||||
|
Issuance of new long-term debt to affiliates
|
—
|
|
11,200
|
|
—
|
|
|||||
|
Settlement of accounts receivable from affiliates and other outstanding balances
|
—
|
|
363
|
|
—
|
|
|||||
|
Income tax benefit from debt recapitalization
|
—
|
|
178
|
|
—
|
|
|||||
|
Net assets acquired in MetroPCS business combination, excluding cash acquired
|
—
|
|
827
|
|
—
|
|
|||||
Supplemental Statements of Stockholders’ Equity Information
Preferred Stock
In
2014
, T-Mobile completed a public offering of
20 million
shares of mandatory convertible preferred stock for net proceeds of
$982 million
. Dividends on the preferred stock will be payable on a cumulative basis when and if declared by the Company’s board of directors at an annual rate of
5.5%
. The dividends may be paid in cash, shares of common stock, subject to certain limitations, or any combination of cash and shares of common stock. For the year ended
December 31, 2014
, the Company did not declare or pay any dividends on the preferred stock as the first scheduled dividend payment date will be in 2015.
Unless converted earlier, each share of preferred stock will convert automatically on December 15, 2017 into between
1.6119
and
1.9342
shares of common stock, subject to customary anti-dilution adjustments, depending on the applicable market value of the common stock. At any time, the preferred shares may be converted, in whole or in part, at the minimum conversion rate of
1.6119
shares of common stock, except during a fundamental change conversion period. In addition, holders may be entitled to shares based on the amount of accumulated and unpaid dividends. If certain fundamental changes involving the Company occur, the preferred stock may be converted into common shares at the applicable conversion rate, subject to certain anti-dilution adjustments, and holders will also be entitled to a make-whole amount. The preferred stock ranks senior with respect to liquidation preference and dividend rights to common stock. In the event of any voluntary or involuntary liquidation, winding-up or dissolution of the Company, each holder of preferred stock will be entitled to receive a liquidation preference in the amount of
$50
per share, plus an amount equal to accumulated and unpaid dividends, after satisfaction of liabilities to the Company’s creditors and before any distribution or payment is made to any holders of common stock. The preferred stock is not redeemable.
Common Stock
In
2013
, T-Mobile completed a public offering of
73 million
shares of common stock at a price of
$25
per share.
79
Pursuant to the applicable indentures and supplemental indentures, the long-term debt, excluding capital leases, issued by T-Mobile USA (“Issuer”) is fully and unconditionally guaranteed, jointly and severally, on a senior unsecured basis by T-Mobile (“Parent”) and certain of the Issuer’s
100%
owned subsidiaries (“Guarantor Subsidiaries”). See
Note 8 – Debt
for further information regarding long-term debt. The guarantees of the Guarantor Subsidiaries are subject to release in limited circumstances only upon the occurrence of certain customary conditions. The indentures governing the long-term debt contain covenants that, among other things, limit the ability of the Issuer and the Guarantor Subsidiaries to: incur more debt; pay dividends and make distributions; make certain investments; repurchase stock; create liens or other encumbrances; enter into transactions with affiliates; enter into transactions that restrict dividends or distributions from subsidiaries; and merge, consolidate, or sell, or otherwise dispose of, substantially all of their assets. Certain provisions of each of the indentures and the supplemental indentures relating to the long-term debt restrict the ability of the Issuer to loan funds or make payments to Parent. However, the Issuer and Guarantor Subsidiaries are allowed to make certain permitted payments to the Parent under the terms of the indentures and the supplemental indentures.
In
2014
, T-Mobile entered into a factoring arrangement to sell certain service accounts receivable on a revolving basis. In connection with the factoring arrangement, the Company formed the Factoring SPE, which is included in the Non-Guarantor Subsidiaries condensed consolidating financial information. See
Note 4 – Factoring Arrangement
for further information.
In
2014
, Parent contributed
$1.7 billion
of cash to the Issuer in connection with the Verizon 700 MHz A-Block spectrum license acquisition. The transaction was recorded as an equity contribution and reflected in investments in subsidiaries, net on the Parent’s condensed consolidating balance sheet information. In addition, the contribution was presented as an investing activity from the Parent to the Issuer in the condensed consolidating statement of cash flows information.
In
2014
, Issuer issued unsecured senior notes of
$3.0 billion
. A portion of the proceeds from the issuance of the notes was used to redeem
$1.0 billion
of
7.875%
Senior Notes due
2018
. See
Note 8 – Debt
for further information regarding the issuance of long-term debt.
In
2014
, Parent completed a public offering of
20 million
shares of preferred stock for net proceeds of
$982 million
. See
Note 14 – Additional Financial Information
for further information.
Presented below is the condensed consolidating financial information as of
December 31, 2014
and
2013
and for the years ended
December 31, 2014
,
2013
and
2012
, respectively. As the business combination was treated as a “reverse acquisition” and the Issuer was treated as the accounting acquirer, the Issuer’s historical financial statements are the historical financial statements of Parent for comparative purposes. As a result the Parent column only reflects activity in the condensed consolidating financial statements presented below for periods subsequent to the consummation of the business combination on April 30, 2013. The equity method of accounting is used to account for ownership interests in subsidiaries, where applicable.
80
Condensed Consolidating Balance Sheet Information
December 31, 2014
|
(in millions)
|
Parent
|
Issuer
|
Guarantor Subsidiaries
|
Non-Guarantor Subsidiaries
|
Consolidating and Eliminating Adjustments
|
Consolidated
|
|||||||||||||||||
|
Assets
|
|||||||||||||||||||||||
|
Current assets
|
|||||||||||||||||||||||
|
Cash and cash equivalents
|
$
|
2,278
|
|
$
|
2,246
|
|
$
|
697
|
|
$
|
94
|
|
$
|
—
|
|
$
|
5,315
|
|
|||||
|
Accounts receivable, net
|
—
|
|
—
|
|
1,817
|
|
48
|
|
—
|
|
1,865
|
|
|||||||||||
|
Equipment installment plan receivables, net
|
—
|
|
—
|
|
3,062
|
|
—
|
|
—
|
|
3,062
|
|
|||||||||||
|
Accounts receivable from affiliates
|
—
|
|
—
|
|
76
|
|
—
|
|
—
|
|
76
|
|
|||||||||||
|
Inventories
|
—
|
|
—
|
|
1,085
|
|
—
|
|
—
|
|
1,085
|
|
|||||||||||
|
Deferred tax assets, net
|
—
|
|
—
|
|
988
|
|
—
|
|
—
|
|
988
|
|
|||||||||||
|
Other current assets
|
—
|
|
3
|
|
1,341
|
|
249
|
|
—
|
|
1,593
|
|
|||||||||||
|
Total current assets
|
2,278
|
|
2,249
|
|
9,066
|
|
391
|
|
—
|
|
13,984
|
|
|||||||||||
|
Property and equipment, net
|
—
|
|
—
|
|
15,708
|
|
537
|
|
—
|
|
16,245
|
|
|||||||||||
|
Goodwill
|
—
|
|
—
|
|
1,683
|
|
—
|
|
—
|
|
1,683
|
|
|||||||||||
|
Spectrum licenses
|
—
|
|
—
|
|
21,955
|
|
—
|
|
—
|
|
21,955
|
|
|||||||||||
|
Other intangible assets, net
|
—
|
|
—
|
|
870
|
|
—
|
|
—
|
|
870
|
|
|||||||||||
|
Investments in subsidiaries, net
|
13,470
|
|
30,385
|
|
—
|
|
—
|
|
(43,855
|
)
|
—
|
|
|||||||||||
|
Intercompany receivables
|
—
|
|
2,773
|
|
—
|
|
—
|
|
(2,773
|
)
|
—
|
|
|||||||||||
|
Equipment installment plan receivables due after one year, net
|
—
|
|
—
|
|
1,628
|
|
—
|
|
—
|
|
1,628
|
|
|||||||||||
|
Other assets
|
2
|
|
17
|
|
259
|
|
124
|
|
(114
|
)
|
288
|
|
|||||||||||
|
Total assets
|
$
|
15,750
|
|
$
|
35,424
|
|
$
|
51,169
|
|
$
|
1,052
|
|
$
|
(46,742
|
)
|
$
|
56,653
|
|
|||||
|
Liabilities and Stockholders' Equity
|
|||||||||||||||||||||||
|
Current liabilities
|
|||||||||||||||||||||||
|
Accounts payable and accrued liabilities
|
$
|
—
|
|
$
|
349
|
|
$
|
6,914
|
|
$
|
101
|
|
$
|
—
|
|
$
|
7,364
|
|
|||||
|
Current payables to affiliates
|
—
|
|
56
|
|
175
|
|
—
|
|
—
|
|
231
|
|
|||||||||||
|
Short-term debt
|
—
|
|
63
|
|
24
|
|
—
|
|
—
|
|
87
|
|
|||||||||||
|
Deferred revenue
|
—
|
|
—
|
|
459
|
|
—
|
|
—
|
|
459
|
|
|||||||||||
|
Other current liabilities
|
—
|
|
—
|
|
580
|
|
55
|
|
—
|
|
635
|
|
|||||||||||
|
Total current liabilities
|
—
|
|
468
|
|
8,152
|
|
156
|
|
—
|
|
8,776
|
|
|||||||||||
|
Long-term debt
|
—
|
|
15,886
|
|
387
|
|
—
|
|
—
|
|
16,273
|
|
|||||||||||
|
Long-term debt to affiliates
|
—
|
|
5,600
|
|
—
|
|
—
|
|
—
|
|
5,600
|
|
|||||||||||
|
Long-term financial obligation
|
—
|
|
—
|
|
271
|
|
2,250
|
|
—
|
|
2,521
|
|
|||||||||||
|
Deferred tax liabilities
|
—
|
|
—
|
|
4,987
|
|
—
|
|
(114
|
)
|
4,873
|
|
|||||||||||
|
Deferred rents
|
—
|
|
—
|
|
2,331
|
|
—
|
|
—
|
|
2,331
|
|
|||||||||||
|
Negative carrying value of subsidiaries, net
|
—
|
|
—
|
|
780
|
|
—
|
|
(780
|
)
|
—
|
|
|||||||||||
|
Intercompany payables
|
87
|
|
—
|
|
2,589
|
|
97
|
|
(2,773
|
)
|
—
|
|
|||||||||||
|
Other long-term liabilities
|
—
|
|
—
|
|
616
|
|
—
|
|
—
|
|
616
|
|
|||||||||||
|
Total long-term liabilities
|
87
|
|
21,486
|
|
11,961
|
|
2,347
|
|
(3,667
|
)
|
32,214
|
|
|||||||||||
|
Total stockholders' equity
|
15,663
|
|
13,470
|
|
31,056
|
|
(1,451
|
)
|
(43,075
|
)
|
15,663
|
|
|||||||||||
|
Total liabilities and stockholders' equity
|
$
|
15,750
|
|
$
|
35,424
|
|
$
|
51,169
|
|
$
|
1,052
|
|
$
|
(46,742
|
)
|
$
|
56,653
|
|
|||||
81
Condensed Consolidating Balance Sheet Information
December 31, 2013
|
(in millions)
|
Parent
|
Issuer
|
Guarantor Subsidiaries
|
Non-Guarantor Subsidiaries
|
Consolidating and Eliminating Adjustments
|
Consolidated
|
|||||||||||||||||
|
Assets
|
|||||||||||||||||||||||
|
Current assets
|
|||||||||||||||||||||||
|
Cash and cash equivalents
|
$
|
2,960
|
|
$
|
2,698
|
|
$
|
57
|
|
$
|
176
|
|
$
|
—
|
|
$
|
5,891
|
|
|||||
|
Accounts receivable, net
|
—
|
|
—
|
|
2,070
|
|
78
|
|
—
|
|
2,148
|
|
|||||||||||
|
Equipment installment plan receivables, net
|
—
|
|
—
|
|
1,471
|
|
—
|
|
—
|
|
1,471
|
|
|||||||||||
|
Accounts receivable from affiliates
|
—
|
|
—
|
|
41
|
|
—
|
|
—
|
|
41
|
|
|||||||||||
|
Inventories
|
—
|
|
—
|
|
586
|
|
—
|
|
—
|
|
586
|
|
|||||||||||
|
Deferred tax assets, net
|
—
|
|
—
|
|
824
|
|
15
|
|
—
|
|
839
|
|
|||||||||||
|
Other current assets
|
—
|
|
—
|
|
1,250
|
|
2
|
|
—
|
|
1,252
|
|
|||||||||||
|
Total current assets
|
2,960
|
|
2,698
|
|
6,299
|
|
271
|
|
—
|
|
12,228
|
|
|||||||||||
|
Property and equipment, net
|
—
|
|
—
|
|
14,754
|
|
595
|
|
—
|
|
15,349
|
|
|||||||||||
|
Goodwill
|
—
|
|
—
|
|
1,683
|
|
—
|
|
—
|
|
1,683
|
|
|||||||||||
|
Spectrum licenses
|
—
|
|
—
|
|
18,122
|
|
—
|
|
—
|
|
18,122
|
|
|||||||||||
|
Other intangible assets, net
|
—
|
|
—
|
|
1,204
|
|
—
|
|
—
|
|
1,204
|
|
|||||||||||
|
Investments in subsidiaries, net
|
11,484
|
|
29,123
|
|
—
|
|
—
|
|
(40,607
|
)
|
—
|
|
|||||||||||
|
Intercompany receivables
|
—
|
|
—
|
|
418
|
|
—
|
|
(418
|
)
|
—
|
|
|||||||||||
|
Equipment installment plan receivables due after one year, net
|
—
|
|
—
|
|
1,075
|
|
—
|
|
—
|
|
1,075
|
|
|||||||||||
|
Other assets
|
2
|
|
24
|
|
217
|
|
93
|
|
(44
|
)
|
292
|
|
|||||||||||
|
Total assets
|
$
|
14,446
|
|
$
|
31,845
|
|
$
|
43,772
|
|
$
|
959
|
|
$
|
(41,069
|
)
|
$
|
49,953
|
|
|||||
|
Liabilities and Stockholders' Equity
|
|||||||||||||||||||||||
|
Current liabilities
|
|||||||||||||||||||||||
|
Accounts payable and accrued liabilities
|
$
|
—
|
|
$
|
273
|
|
$
|
4,218
|
|
$
|
76
|
|
$
|
—
|
|
$
|
4,567
|
|
|||||
|
Current payables to affiliates
|
—
|
|
56
|
|
143
|
|
—
|
|
—
|
|
199
|
|
|||||||||||
|
Short-term debt
|
—
|
|
226
|
|
18
|
|
—
|
|
—
|
|
244
|
|
|||||||||||
|
Deferred revenue
|
—
|
|
—
|
|
445
|
|
—
|
|
—
|
|
445
|
|
|||||||||||
|
Other current liabilities
|
—
|
|
—
|
|
313
|
|
40
|
|
—
|
|
353
|
|
|||||||||||
|
Total current liabilities
|
—
|
|
555
|
|
5,137
|
|
116
|
|
—
|
|
5,808
|
|
|||||||||||
|
Long-term debt
|
—
|
|
14,010
|
|
335
|
|
—
|
|
—
|
|
14,345
|
|
|||||||||||
|
Long-term debt to affiliates
|
—
|
|
5,600
|
|
—
|
|
—
|
|
—
|
|
5,600
|
|
|||||||||||
|
Long-term financial obligation
|
—
|
|
—
|
|
365
|
|
2,131
|
|
—
|
|
2,496
|
|
|||||||||||
|
Deferred tax liabilities
|
—
|
|
—
|
|
4,689
|
|
—
|
|
(44
|
)
|
4,645
|
|
|||||||||||
|
Deferred rents
|
—
|
|
—
|
|
2,113
|
|
—
|
|
—
|
|
2,113
|
|
|||||||||||
|
Negative carrying value of subsidiaries, net
|
—
|
|
—
|
|
779
|
|
—
|
|
(779
|
)
|
—
|
|
|||||||||||
|
Intercompany payables
|
201
|
|
183
|
|
—
|
|
34
|
|
(418
|
)
|
—
|
|
|||||||||||
|
Other long-term liabilities
|
—
|
|
13
|
|
688
|
|
—
|
|
—
|
|
701
|
|
|||||||||||
|
Total long-term liabilities
|
201
|
|
19,806
|
|
8,969
|
|
2,165
|
|
(1,241
|
)
|
29,900
|
|
|||||||||||
|
Total stockholders' equity
|
14,245
|
|
11,484
|
|
29,666
|
|
(1,322
|
)
|
(39,828
|
)
|
14,245
|
|
|||||||||||
|
Total liabilities and stockholders' equity
|
$
|
14,446
|
|
$
|
31,845
|
|
$
|
43,772
|
|
$
|
959
|
|
$
|
(41,069
|
)
|
$
|
49,953
|
|
|||||
82
Condensed Consolidating Statement of Comprehensive Income (Loss) Information
Year Ended December 31, 2014
|
(in millions)
|
Parent
|
Issuer
|
Guarantor Subsidiaries
|
Non-Guarantor Subsidiaries
|
Consolidating and Eliminating Adjustments
|
Consolidated
|
|||||||||||||||||
|
Revenues
|
|||||||||||||||||||||||
|
Service revenues
|
$
|
—
|
|
$
|
—
|
|
$
|
21,483
|
|
$
|
1,302
|
|
$
|
(410
|
)
|
$
|
22,375
|
|
|||||
|
Equipment sales
|
—
|
|
—
|
|
7,319
|
|
—
|
|
(530
|
)
|
6,789
|
|
|||||||||||
|
Other revenues
|
—
|
|
—
|
|
270
|
|
140
|
|
(10
|
)
|
400
|
|
|||||||||||
|
Total revenues
|
—
|
|
—
|
|
29,072
|
|
1,442
|
|
(950
|
)
|
29,564
|
|
|||||||||||
|
Operating expenses
|
|||||||||||||||||||||||
|
Cost of services, exclusive of depreciation and amortization shown separately below
|
—
|
|
—
|
|
5,767
|
|
21
|
|
—
|
|
5,788
|
|
|||||||||||
|
Cost of equipment sales
|
—
|
|
—
|
|
9,491
|
|
702
|
|
(572
|
)
|
9,621
|
|
|||||||||||
|
Selling, general and administrative
|
—
|
|
—
|
|
8,723
|
|
518
|
|
(378
|
)
|
8,863
|
|
|||||||||||
|
Depreciation and amortization
|
—
|
|
—
|
|
4,330
|
|
82
|
|
—
|
|
4,412
|
|
|||||||||||
|
Cost of MetroPCS business combination
|
—
|
|
—
|
|
299
|
|
—
|
|
—
|
|
299
|
|
|||||||||||
|
Gain on disposal of spectrum licenses
|
—
|
|
—
|
|
(840
|
)
|
—
|
|
—
|
|
(840
|
)
|
|||||||||||
|
Other, net
|
—
|
|
—
|
|
5
|
|
—
|
|
—
|
|
5
|
|
|||||||||||
|
Total operating expenses
|
—
|
|
—
|
|
27,775
|
|
1,323
|
|
(950
|
)
|
28,148
|
|
|||||||||||
|
Operating income
|
—
|
|
—
|
|
1,297
|
|
119
|
|
—
|
|
1,416
|
|
|||||||||||
|
Other income (expense)
|
|||||||||||||||||||||||
|
Interest expense to affiliates
|
—
|
|
(278
|
)
|
—
|
|
—
|
|
—
|
|
(278
|
)
|
|||||||||||
|
Interest expense
|
—
|
|
(838
|
)
|
(55
|
)
|
(180
|
)
|
—
|
|
(1,073
|
)
|
|||||||||||
|
Interest income
|
—
|
|
—
|
|
359
|
|
—
|
|
—
|
|
359
|
|
|||||||||||
|
Other income (expense), net
|
—
|
|
85
|
|
4
|
|
—
|
|
(100
|
)
|
(11
|
)
|
|||||||||||
|
Total other income (expense), net
|
—
|
|
(1,031
|
)
|
308
|
|
(180
|
)
|
(100
|
)
|
(1,003
|
)
|
|||||||||||
|
Income (loss) before income taxes
|
—
|
|
(1,031
|
)
|
1,605
|
|
(61
|
)
|
(100
|
)
|
413
|
|
|||||||||||
|
Income tax expense (benefit)
|
—
|
|
—
|
|
189
|
|
(23
|
)
|
—
|
|
166
|
|
|||||||||||
|
Earnings (loss) of subsidiaries
|
247
|
|
1,278
|
|
(54
|
)
|
—
|
|
(1,471
|
)
|
—
|
|
|||||||||||
|
Net income (loss)
|
247
|
|
247
|
|
1,362
|
|
(38
|
)
|
(1,571
|
)
|
247
|
|
|||||||||||
|
Other comprehensive income (loss), net of tax
|
(2
|
)
|
(2
|
)
|
(2
|
)
|
—
|
|
4
|
|
(2
|
)
|
|||||||||||
|
Total comprehensive income (loss)
|
$
|
245
|
|
$
|
245
|
|
$
|
1,360
|
|
$
|
(38
|
)
|
$
|
(1,567
|
)
|
$
|
245
|
|
|||||
83
Condensed Consolidating Statement of Comprehensive Income (Loss) Information
Year Ended December 31, 2013
|
(in millions)
|
Parent
|
Issuer
|
Guarantor Subsidiaries
|
Non-Guarantor Subsidiaries
|
Consolidating and Eliminating Adjustments
|
Consolidated
|
|||||||||||||||||
|
Revenues
|
|||||||||||||||||||||||
|
Service revenues
|
$
|
—
|
|
$
|
—
|
|
$
|
18,396
|
|
$
|
823
|
|
$
|
(151
|
)
|
$
|
19,068
|
|
|||||
|
Equipment sales
|
—
|
|
—
|
|
5,728
|
|
—
|
|
(695
|
)
|
5,033
|
|
|||||||||||
|
Other revenues
|
—
|
|
—
|
|
251
|
|
142
|
|
(74
|
)
|
319
|
|
|||||||||||
|
Total revenues
|
—
|
|
—
|
|
24,375
|
|
965
|
|
(920
|
)
|
24,420
|
|
|||||||||||
|
Operating expenses
|
|||||||||||||||||||||||
|
Cost of services, exclusive of depreciation and amortization shown separately below
|
—
|
|
—
|
|
5,302
|
|
50
|
|
(73
|
)
|
5,279
|
|
|||||||||||
|
Cost of equipment sales
|
—
|
|
—
|
|
7,180
|
|
552
|
|
(756
|
)
|
6,976
|
|
|||||||||||
|
Selling, general and administrative
|
—
|
|
—
|
|
7,283
|
|
190
|
|
(91
|
)
|
7,382
|
|
|||||||||||
|
Depreciation and amortization
|
—
|
|
—
|
|
3,545
|
|
82
|
|
—
|
|
3,627
|
|
|||||||||||
|
Cost of MetroPCS business combination
|
—
|
|
—
|
|
108
|
|
—
|
|
—
|
|
108
|
|
|||||||||||
|
Gain on disposal of spectrum licenses
|
—
|
|
—
|
|
(2
|
)
|
—
|
|
—
|
|
(2
|
)
|
|||||||||||
|
Other, net
|
—
|
|
—
|
|
54
|
|
—
|
|
—
|
|
54
|
|
|||||||||||
|
Total operating expenses
|
—
|
|
—
|
|
23,470
|
|
874
|
|
(920
|
)
|
23,424
|
|
|||||||||||
|
Operating income
|
—
|
|
—
|
|
905
|
|
91
|
|
—
|
|
996
|
|
|||||||||||
|
Other income (expense)
|
|||||||||||||||||||||||
|
Interest expense to affiliates
|
—
|
|
(678
|
)
|
—
|
|
—
|
|
—
|
|
(678
|
)
|
|||||||||||
|
Interest expense
|
—
|
|
(317
|
)
|
(55
|
)
|
(173
|
)
|
—
|
|
(545
|
)
|
|||||||||||
|
Interest income
|
—
|
|
—
|
|
189
|
|
—
|
|
—
|
|
189
|
|
|||||||||||
|
Other income (expense), net
|
—
|
|
94
|
|
(6
|
)
|
1
|
|
—
|
|
89
|
|
|||||||||||
|
Total other income (expense), net
|
—
|
|
(901
|
)
|
128
|
|
(172
|
)
|
—
|
|
(945
|
)
|
|||||||||||
|
Income (loss) before income taxes
|
—
|
|
(901
|
)
|
1,033
|
|
(81
|
)
|
—
|
|
51
|
|
|||||||||||
|
Income tax expense (benefit)
|
—
|
|
—
|
|
45
|
|
(29
|
)
|
—
|
|
16
|
|
|||||||||||
|
Earnings (loss) of subsidiaries
|
(104
|
)
|
936
|
|
(54
|
)
|
—
|
|
(778
|
)
|
—
|
|
|||||||||||
|
Net income (loss)
|
(104
|
)
|
35
|
|
934
|
|
(52
|
)
|
(778
|
)
|
35
|
|
|||||||||||
|
Other comprehensive income (loss), net of tax
|
—
|
|
(38
|
)
|
24
|
|
—
|
|
(24
|
)
|
(38
|
)
|
|||||||||||
|
Total comprehensive income (loss)
|
$
|
(104
|
)
|
$
|
(3
|
)
|
$
|
958
|
|
$
|
(52
|
)
|
$
|
(802
|
)
|
$
|
(3
|
)
|
|||||
84
Condensed Consolidating Statement of Comprehensive Income (Loss) Information
Year Ended December 31, 2012
|
(in millions)
|
Parent
|
Issuer
|
Guarantor Subsidiaries
|
Non-Guarantor Subsidiaries
|
Consolidating and Eliminating Adjustments
|
Consolidated
|
|||||||||||||||||
|
Revenues
|
|||||||||||||||||||||||
|
Service revenues
|
$
|
—
|
|
$
|
—
|
|
$
|
16,610
|
|
$
|
712
|
|
$
|
(109
|
)
|
$
|
17,213
|
|
|||||
|
Equipment sales
|
—
|
|
—
|
|
2,783
|
|
—
|
|
(541
|
)
|
2,242
|
|
|||||||||||
|
Other revenues
|
—
|
|
—
|
|
319
|
|
83
|
|
(138
|
)
|
264
|
|
|||||||||||
|
Total revenues
|
—
|
|
—
|
|
19,712
|
|
795
|
|
(788
|
)
|
19,719
|
|
|||||||||||
|
Operating expenses
|
|||||||||||||||||||||||
|
Cost of services, exclusive of depreciation and amortization shown separately below
|
—
|
|
—
|
|
4,730
|
|
69
|
|
(138
|
)
|
4,661
|
|
|||||||||||
|
Cost of equipment sales
|
—
|
|
—
|
|
3,594
|
|
449
|
|
(606
|
)
|
3,437
|
|
|||||||||||
|
Selling, general and administrative
|
—
|
|
—
|
|
6,689
|
|
151
|
|
(44
|
)
|
6,796
|
|
|||||||||||
|
Depreciation and amortization
|
—
|
|
—
|
|
3,180
|
|
7
|
|
—
|
|
3,187
|
|
|||||||||||
|
Cost of MetroPCS business combination
|
—
|
|
—
|
|
7
|
|
—
|
|
—
|
|
7
|
|
|||||||||||
|
Impairment Charges
|
—
|
|
—
|
|
8,134
|
|
—
|
|
—
|
|
8,134
|
|
|||||||||||
|
Gain on disposal of spectrum licenses
|
—
|
|
—
|
|
(205
|
)
|
—
|
|
—
|
|
(205
|
)
|
|||||||||||
|
Other, net
|
—
|
|
—
|
|
99
|
|
—
|
|
—
|
|
99
|
|
|||||||||||
|
Total operating expenses
|
—
|
|
—
|
|
26,228
|
|
676
|
|
(788
|
)
|
26,116
|
|
|||||||||||
|
Operating income (loss)
|
—
|
|
—
|
|
(6,516
|
)
|
119
|
|
—
|
|
(6,397
|
)
|
|||||||||||
|
Other income (expense)
|
|||||||||||||||||||||||
|
Interest expense to affiliates
|
—
|
|
(661
|
)
|
—
|
|
—
|
|
—
|
|
(661
|
)
|
|||||||||||
|
Interest income
|
—
|
|
—
|
|
77
|
|
—
|
|
—
|
|
77
|
|
|||||||||||
|
Other income (expense), net
|
—
|
|
38
|
|
(36
|
)
|
(7
|
)
|
—
|
|
(5
|
)
|
|||||||||||
|
Total other income (expense), net
|
—
|
|
(623
|
)
|
41
|
|
(7
|
)
|
—
|
|
(589
|
)
|
|||||||||||
|
Income (loss) before income taxes
|
—
|
|
(623
|
)
|
(6,475
|
)
|
112
|
|
—
|
|
(6,986
|
)
|
|||||||||||
|
Income tax expense
|
—
|
|
—
|
|
310
|
|
40
|
|
—
|
|
350
|
|
|||||||||||
|
Loss of subsidiaries
|
—
|
|
(6,713
|
)
|
—
|
|
—
|
|
6,713
|
|
—
|
|
|||||||||||
|
Net income (loss)
|
—
|
|
(7,336
|
)
|
(6,785
|
)
|
72
|
|
6,713
|
|
(7,336
|
)
|
|||||||||||
|
Other comprehensive income (loss), net of tax
|
—
|
|
69
|
|
(41
|
)
|
—
|
|
41
|
|
69
|
|
|||||||||||
|
Total comprehensive income (loss)
|
$
|
—
|
|
$
|
(7,267
|
)
|
$
|
(6,826
|
)
|
$
|
72
|
|
$
|
6,754
|
|
$
|
(7,267
|
)
|
|||||
85
Condensed Consolidating Statement of Cash Flows Information
Year Ended December 31, 2014
|
(in millions)
|
Parent
|
Issuer
|
Guarantor Subsidiaries
|
Non-Guarantor Subsidiaries
|
Consolidating and Eliminating Adjustments
|
Consolidated
|
|||||||||||||||||
|
Operating activities
|
|||||||||||||||||||||||
|
Net cash provided by (used in) operating activities
|
$
|
9
|
|
$
|
(5,145
|
)
|
$
|
9,364
|
|
$
|
18
|
|
$
|
(100
|
)
|
$
|
4,146
|
|
|||||
|
Investing activities
|
|||||||||||||||||||||||
|
Purchases of property and equipment
|
—
|
|
—
|
|
(4,317
|
)
|
—
|
|
—
|
|
(4,317
|
)
|
|||||||||||
|
Purchases of spectrum licenses and other intangible assets, including deposits
|
—
|
|
—
|
|
(2,900
|
)
|
—
|
|
—
|
|
(2,900
|
)
|
|||||||||||
|
Proceeds from disposals of property and equipment and intangible assets
|
—
|
|
—
|
|
20
|
|
—
|
|
—
|
|
20
|
|
|||||||||||
|
Investment in subsidiaries
|
(1,700
|
)
|
—
|
|
—
|
|
—
|
|
1,700
|
|
—
|
|
|||||||||||
|
Payments to acquire financial assets, net
|
—
|
|
—
|
|
(9
|
)
|
—
|
|
—
|
|
(9
|
)
|
|||||||||||
|
Investments in unconsolidated affiliates, net
|
—
|
|
—
|
|
(40
|
)
|
—
|
|
—
|
|
(40
|
)
|
|||||||||||
|
Net cash used in investing activities
|
(1,700
|
)
|
—
|
|
(7,246
|
)
|
—
|
|
1,700
|
|
(7,246
|
)
|
|||||||||||
|
Financing activities
|
|||||||||||||||||||||||
|
Proceeds from capital contribution
|
—
|
|
1,700
|
|
—
|
|
—
|
|
(1,700
|
)
|
—
|
|
|||||||||||
|
Proceeds from issuance of long-term debt
|
—
|
|
2,993
|
|
—
|
|
—
|
|
—
|
|
2,993
|
|
|||||||||||
|
Repayments of long-term debt and capital lease obligations
|
—
|
|
—
|
|
(1,019
|
)
|
—
|
|
—
|
|
(1,019
|
)
|
|||||||||||
|
Proceeds from issuance of preferred stock
|
982
|
|
—
|
|
—
|
|
—
|
|
—
|
|
982
|
|
|||||||||||
|
Repayments of short-term debt for purchases of inventory, property and equipment, net
|
—
|
|
—
|
|
(418
|
)
|
—
|
|
—
|
|
(418
|
)
|
|||||||||||
|
Intercompany dividend paid
|
—
|
|
—
|
|
—
|
|
(100
|
)
|
100
|
|
—
|
|
|||||||||||
|
Proceeds from exercise of stock options
|
27
|
|
—
|
|
—
|
|
—
|
|
—
|
|
27
|
|
|||||||||||
|
Taxes paid related to net share settlement of stock awards
|
—
|
|
—
|
|
(73
|
)
|
—
|
|
—
|
|
(73
|
)
|
|||||||||||
|
Excess tax benefit from stock-based compensation
|
—
|
|
—
|
|
34
|
|
—
|
|
—
|
|
34
|
|
|||||||||||
|
Other, net
|
—
|
|
—
|
|
(2
|
)
|
—
|
|
—
|
|
(2
|
)
|
|||||||||||
|
Net cash provided by (used in) financing activities
|
1,009
|
|
4,693
|
|
(1,478
|
)
|
(100
|
)
|
(1,600
|
)
|
2,524
|
|
|||||||||||
|
Change in cash and cash equivalents
|
(682
|
)
|
(452
|
)
|
640
|
|
(82
|
)
|
—
|
|
(576
|
)
|
|||||||||||
|
Cash and cash equivalents
|
|||||||||||||||||||||||
|
Beginning of period
|
2,960
|
|
2,698
|
|
57
|
|
176
|
|
—
|
|
5,891
|
|
|||||||||||
|
End of period
|
$
|
2,278
|
|
$
|
2,246
|
|
$
|
697
|
|
$
|
94
|
|
$
|
—
|
|
$
|
5,315
|
|
|||||
86
Condensed Consolidating Statement of Cash Flows Information
Year Ended December 31, 2013
|
(in millions)
|
Parent
|
Issuer
|
Guarantor Subsidiaries
|
Non-Guarantor Subsidiaries
|
Consolidating and Eliminating Adjustments
|
Consolidated
|
|||||||||||||||||
|
Operating activities
|
|||||||||||||||||||||||
|
Net cash provided by (used in) operating activities
|
$
|
299
|
|
$
|
(1,203
|
)
|
$
|
4,380
|
|
$
|
69
|
|
$
|
—
|
|
$
|
3,545
|
|
|||||
|
Investing activities
|
|||||||||||||||||||||||
|
Purchases of property and equipment
|
—
|
|
—
|
|
(4,025
|
)
|
—
|
|
—
|
|
(4,025
|
)
|
|||||||||||
|
Purchases of spectrum licenses and other intangible assets
|
—
|
|
—
|
|
(381
|
)
|
—
|
|
—
|
|
(381
|
)
|
|||||||||||
|
Short term affiliate loan receivable, net
|
—
|
|
—
|
|
300
|
|
—
|
|
—
|
|
300
|
|
|||||||||||
|
Proceeds from disposals of property and equipment and intangible assets
|
—
|
|
—
|
|
3
|
|
—
|
|
—
|
|
3
|
|
|||||||||||
|
Cash and cash equivalents acquired in MetroPCS business combination
|
737
|
|
1,407
|
|
—
|
|
—
|
|
—
|
|
2,144
|
|
|||||||||||
|
Change in restricted cash equivalents
|
—
|
|
—
|
|
(100
|
)
|
—
|
|
—
|
|
(100
|
)
|
|||||||||||
|
Investments in unconsolidated affiliates, net
|
—
|
|
—
|
|
(33
|
)
|
—
|
|
—
|
|
(33
|
)
|
|||||||||||
|
Net cash provided by (used) in investing activities
|
737
|
|
1,407
|
|
(4,236
|
)
|
—
|
|
—
|
|
(2,092
|
)
|
|||||||||||
|
Financing activities
|
|||||||||||||||||||||||
|
Proceeds from issuance of long-term debt
|
—
|
|
2,494
|
|
—
|
|
—
|
|
—
|
|
2,494
|
|
|||||||||||
|
Repayments of capital lease obligations
|
—
|
|
—
|
|
(9
|
)
|
—
|
|
—
|
|
(9
|
)
|
|||||||||||
|
Proceeds from issuance of common stock
|
1,787
|
|
—
|
|
—
|
|
—
|
|
—
|
|
1,787
|
|
|||||||||||
|
Repayments of short-term debt for purchases of property and equipment
|
—
|
|
—
|
|
(244
|
)
|
—
|
|
—
|
|
(244
|
)
|
|||||||||||
|
Repayments related to a variable interest entity
|
—
|
|
—
|
|
(80
|
)
|
—
|
|
—
|
|
(80
|
)
|
|||||||||||
|
Distribution to affiliate
|
—
|
|
—
|
|
(41
|
)
|
—
|
|
—
|
|
(41
|
)
|
|||||||||||
|
Proceeds from exercise of stock options
|
137
|
|
—
|
|
—
|
|
—
|
|
—
|
|
137
|
|
|||||||||||
|
Net cash provided by (used in) financing activities
|
1,924
|
|
2,494
|
|
(374
|
)
|
—
|
|
—
|
|
4,044
|
|
|||||||||||
|
Change in cash and cash equivalents
|
2,960
|
|
2,698
|
|
(230
|
)
|
69
|
|
—
|
|
5,497
|
|
|||||||||||
|
Cash and cash equivalents
|
|||||||||||||||||||||||
|
Beginning of period
|
—
|
|
—
|
|
287
|
|
107
|
|
—
|
|
394
|
|
|||||||||||
|
End of period
|
$
|
2,960
|
|
$
|
2,698
|
|
$
|
57
|
|
$
|
176
|
|
$
|
—
|
|
$
|
5,891
|
|
|||||
87
Condensed Consolidating Statement of Cash Flows Information
Year Ended December 31, 2012
|
(in millions)
|
Parent
|
Issuer
|
Guarantor Subsidiaries
|
Non-Guarantor Subsidiaries
|
Consolidating and Eliminating Adjustments
|
Consolidated
|
|||||||||||||||||
|
Operating activities
|
|||||||||||||||||||||||
|
Net cash provided by (used in) operating activities
|
$
|
—
|
|
$
|
(66
|
)
|
$
|
3,872
|
|
$
|
56
|
|
$
|
—
|
|
$
|
3,862
|
|
|||||
|
Investing activities
|
|||||||||||||||||||||||
|
Purchases of property and equipment
|
—
|
|
—
|
|
(2,901
|
)
|
—
|
|
—
|
|
(2,901
|
)
|
|||||||||||
|
Purchases of spectrum licenses and other intangible assets
|
—
|
|
—
|
|
(387
|
)
|
—
|
|
—
|
|
(387
|
)
|
|||||||||||
|
Short term affiliate loan receivable, net
|
—
|
|
—
|
|
(651
|
)
|
—
|
|
—
|
|
(651
|
)
|
|||||||||||
|
Proceeds from disposals of property and equipment and intangible assets
|
—
|
|
—
|
|
51
|
|
—
|
|
—
|
|
51
|
|
|||||||||||
|
Payments to acquire financial assets, net
|
—
|
|
—
|
|
(5
|
)
|
—
|
|
—
|
|
(5
|
)
|
|||||||||||
|
Investments in unconsolidated affiliates, net
|
—
|
|
—
|
|
(22
|
)
|
—
|
|
—
|
|
(22
|
)
|
|||||||||||
|
Net cash used in investing activities
|
—
|
|
—
|
|
(3,915
|
)
|
—
|
|
—
|
|
(3,915
|
)
|
|||||||||||
|
Financing activities
|
|||||||||||||||||||||||
|
Proceeds from financial obligation
|
—
|
|
2,469
|
|
—
|
|
—
|
|
—
|
|
2,469
|
|
|||||||||||
|
Repayments related to a variable interest entity
|
—
|
|
—
|
|
|
(9
|
)
|
—
|
|
—
|
|
(9
|
)
|
||||||||||
|
Distribution to affiliate
|
—
|
|
(2,403
|
)
|
—
|
|
—
|
|
—
|
|
(2,403
|
)
|
|||||||||||
|
Net cash provided by (used in) financing activities
|
—
|
|
66
|
|
(9
|
)
|
—
|
|
—
|
|
57
|
|
|||||||||||
|
Change in cash and cash equivalents
|
—
|
|
—
|
|
(52
|
)
|
56
|
|
—
|
|
4
|
|
|||||||||||
|
Cash and cash equivalents
|
|||||||||||||||||||||||
|
Beginning of period
|
—
|
|
—
|
|
339
|
|
51
|
|
—
|
|
390
|
|
|||||||||||
|
End of period
|
$
|
—
|
|
$
|
—
|
|
$
|
287
|
|
$
|
107
|
|
$
|
—
|
|
$
|
394
|
|
|||||
Spectrum Licenses
In
2014
, the FCC began conducting an auction of AWS spectrum licenses. In
January 2015
, the FCC announced T-Mobile was the winning bidder of AWS spectrum licenses covering approximately
97 million
people for an aggregate bid price of
$1.8 billion
. T-Mobile will pay the FCC the remaining
$1.4 billion
for the AWS spectrum licenses in
March 2015
, which is in addition to the deposit of
$417 million
provided to the FCC in connection with the auction in
2014
. T-Mobile expects to receive the AWS spectrum licenses, subject to regulatory approval, in the
second quarter of 2015
.
88
Supplementary Data
Quarterly Financial Information (Unaudited)
|
(in millions, except share and per share amounts)
|
First Quarter
|
Second Quarter
|
Third Quarter
|
Fourth Quarter
|
Full Year
|
||||||||||||||
|
2014
|
|||||||||||||||||||
|
Total revenues
|
$
|
6,875
|
|
$
|
7,185
|
|
$
|
7,350
|
|
$
|
8,154
|
|
$
|
29,564
|
|
||||
|
Operating income (loss)
|
(28
|
)
|
962
|
|
49
|
|
433
|
|
1,416
|
|
|||||||||
|
Net income (loss)
|
(151
|
)
|
391
|
|
(94
|
)
|
101
|
|
247
|
|
|||||||||
|
Earnings (loss) per share
|
|||||||||||||||||||
|
Basic
|
$
|
(0.19
|
)
|
$
|
0.49
|
|
$
|
(0.12
|
)
|
$
|
0.13
|
|
$
|
0.31
|
|
||||
|
Diluted
|
$
|
(0.19
|
)
|
$
|
0.48
|
|
$
|
(0.12
|
)
|
$
|
0.12
|
|
$
|
0.30
|
|
||||
|
Weighted average shares outstanding
|
|||||||||||||||||||
|
Basic
|
802,520,723
|
|
803,923,913
|
|
807,221,761
|
|
807,396,425
|
|
805,284,712
|
|
|||||||||
|
Diluted
|
802,520,723
|
|
813,556,137
|
|
807,221,761
|
|
821,707,289
|
|
815,922,258
|
|
|||||||||
|
Net income (loss) includes:
|
|||||||||||||||||||
|
Cost of MetroPCS business combination
|
$
|
12
|
|
$
|
22
|
|
$
|
97
|
|
$
|
168
|
|
$
|
299
|
|
||||
|
Gains on disposal of spectrum licenses
|
(10
|
)
|
(747
|
)
|
(13
|
)
|
(70
|
)
|
(840
|
)
|
|||||||||
|
2013
|
|||||||||||||||||||
|
Total revenues
|
$
|
4,677
|
|
$
|
6,228
|
|
$
|
6,688
|
|
$
|
6,827
|
|
$
|
24,420
|
|
||||
|
Operating income
|
379
|
|
181
|
|
297
|
|
139
|
|
996
|
|
|||||||||
|
Net income (loss)
|
107
|
|
(16
|
)
|
(36
|
)
|
(20
|
)
|
35
|
|
|||||||||
|
Earnings (loss) per share
|
|||||||||||||||||||
|
Basic
|
$
|
0.20
|
|
$
|
(0.02
|
)
|
$
|
(0.05
|
)
|
$
|
(0.03
|
)
|
$
|
0.05
|
|
||||
|
Diluted
|
$
|
0.20
|
|
$
|
(0.02
|
)
|
$
|
(0.05
|
)
|
$
|
(0.03
|
)
|
$
|
0.05
|
|
||||
|
Weighted average shares outstanding
|
|||||||||||||||||||
|
Basic
|
535,286,077
|
|
664,603,682
|
|
726,877,458
|
|
761,964,720
|
|
672,955,980
|
|
|||||||||
|
Diluted
|
535,286,077
|
|
664,603,682
|
|
726,877,458
|
|
761,964,720
|
|
676,885,215
|
|
|||||||||
|
Net income (loss) includes:
|
|||||||||||||||||||
|
Cost of MetroPCS business combination
|
$
|
13
|
|
$
|
26
|
|
$
|
12
|
|
$
|
57
|
|
$
|
108
|
|
||||
|
Gains on disposal of spectrum licenses
|
(2
|
)
|
—
|
|
—
|
|
—
|
|
(2
|
)
|
|||||||||
|
Restructuring costs
|
31
|
|
23
|
|
—
|
|
—
|
|
54
|
|
|||||||||
Earnings (loss) per share is computed independently for each quarter and the sum of the quarters may not equal earnings (loss) per share for the full year.
None.
Evaluation of Disclosure Controls and Procedures
We maintain disclosure controls and procedures designed to ensure information required to be disclosed in our periodic reports filed or submitted under the Exchange Act, is recorded, processed, summarized and reported within the time periods specified in the SEC’s rules and forms. Our disclosure controls are also designed to ensure that information required to be disclosed in the reports we file or submit under the Exchange Act is accumulated and communicated to our management, including our Principal Executive Officer and Principal Financial Officer, as appropriate, to allow timely decisions regarding required disclosure.
Under the supervision and with the participation of our management, including our Chief Executive Officer and our Chief Financial Officer, we carried out an evaluation of the effectiveness of the design and operation of our disclosure controls and procedures, as defined in Rules 13a-15(e) and 15d-15(e) under the Exchange Act. Based upon that evaluation, our Chief
89
Executive Officer and Chief Financial Officer concluded that our disclosure controls and procedures were effective, as of the end of the period covered by this report.
The certifications required by Section 302 of the Sarbanes-Oxley Act of 2002 are filed as exhibits
31.1
and
31.2
, respectively, to this
Form 10-K
.
Changes in Internal Control over Financial Reporting
There were no changes in our internal control over financial reporting, as defined in Rules 13a-15(f) and 15d-15(f) of the Exchange Act, during our most recently completed fiscal quarter that materially affected or are reasonably likely to materially affect internal control over financial reporting.
Management's Annual Report on Internal Control over Financial Reporting
Our management is responsible for establishing and maintaining adequate internal control over financial reporting. Internal control over financial reporting is a process to provide reasonable assurance regarding the reliability of our financial reporting and the preparation of financial statements for external purposes in accordance with generally accepted accounting principles. Internal control over financial reporting includes maintaining records that in reasonable detail accurately and fairly reflect our transactions; providing reasonable assurance that transactions are recorded as necessary for preparation of our financial statements in accordance with generally accepted accounting principles; providing reasonable assurance that receipts and expenditures are made in accordance with management authorization; and providing reasonable assurance that unauthorized acquisition, use or disposition of company assets that could have a material effect on our financial statements would be prevented or detected on a timely basis. Because of its inherent limitations, internal control over financial reporting may not prevent or detect misstatements. Also, projections of any evaluation of effectiveness to future periods are subject to the risk that controls may become inadequate because of changes in conditions, or that the degree of compliance with policies and procedures may deteriorate.
Management conducted an evaluation of the effectiveness of our internal control over financial reporting based on the framework and criteria established in Internal Control – Integrated Framework (2013), issued by the Committee of Sponsoring Organizations of the Treadway Commission. Based on this evaluation, management concluded that our internal control over financial reporting was effective as of
December 31, 2014
.
The effectiveness of our internal control over financial reporting as of
December 31, 2014
has been audited by PricewaterhouseCoopers LLP, an independent registered public accounting firm, as stated in their report herein.
None.
We maintain a code of ethics applicable to our Chief Executive Officer, Chief Financial Officer, Chief Accounting Officer, Treasurer, and Controller, which is a “Code of Ethics for Senior Financial Officers” as defined by applicable rules of the SEC. This code is publicly available on our website at investor.t-mobile.com. If we make any amendments to this code other than technical, administrative or other non-substantive amendments, or grant any waivers, including implicit waivers, from a provision of this code we will disclose the nature of the amendment or waiver, its effective date and to whom it applies on our website at investor.t-mobile.com or in a periodic report on Form 8-K filed with the SEC.
The remaining information required by this item, including information about our Directors, Executive Officers and Audit Committee, is incorporated by reference to the definitive Proxy Statement for our
2015
Annual Meeting of Stockholders, which will be filed with the SEC, no later than 120 days after
December 31, 2014
.
The information required by this item is incorporated by reference to the definitive Proxy Statement for our
2015
Annual Meeting of Stockholders, which will be filed with the SEC no later than 120 days after
December 31, 2014
.
90
The information required by this item is incorporated by reference to the definitive Proxy Statement for our
2015
Annual Meeting of Stockholders, which will be filed with the SEC no later than 120 days after
December 31, 2014
.
The information required by this item is incorporated by reference to the definitive Proxy Statement for our
2015
Annual Meeting of Stockholders, which will be filed with the SEC no later than 120 days after
December 31, 2014
.
The information required by this item is incorporated by reference to the definitive Proxy Statement for our
2015
Annual Meeting of Stockholders, which will be filed with the SEC no later than 120 days after
December 31, 2014
.
(a) Documents filed as a part of this
Form 10-K
:
1. Financial Statements
The following financial statements are included in
Part II, Item 8
of this
Form 10-K
:
Report of Independent Registered Public Accounting Firm
Consolidated Balance Sheets
Consolidated Statements of Comprehensive Income (Loss)
Consolidated Statements of Cash Flows
Consolidated Statement of Stockholders’ Equity
Notes to the Consolidated Financial Statements
2. Financial Statement Schedules
All other schedules have been omitted because they are not required, not applicable, or the required information is otherwise included.
3. Exhibits
See the Exhibit Index immediately following the signature page of this
Form 10-K
.
91
SIGNATURES
Pursuant to the requirements of Section 13 or 15(d) of the Securities Exchange Act of 1934, the registrant has duly caused this report to be signed on its behalf by the undersigned thereunto duly authorized.
|
T-MOBILE US, INC.
|
||
|
February 19, 2015
|
/s/ John J. Legere
|
|
|
John J. Legere
President and Chief Executive Officer
|
||
Each person whose signature appears below constitutes and appoints John J. Legere and J. Braxton Carter, and each or either of them, his or her true and lawful attorney-in-fact and agent, each acting alone, with full power of substitution and resubstitution, for him or her and in his or her name, place and stead, in any and all capacities, to sign any or all amendments or supplements (including post-effective amendments) to this Report, and to file the same, with all exhibits thereto, and all documents in connection therewith, with the Securities and Exchange Commission, granting unto said attorney-in-fact and agent, full power and authority to do and perform each and every act and thing requisite and necessary to be done in and about the premises, as fully to all intents and purposes as he or she might or could do in person, hereby ratifying and confirming all that said attorney-in-fact and agent, or his or her substitute or substitutes, may lawfully do or cause to be done by virtue hereof.
Pursuant to the requirements of the Securities Exchange Act of 1934, this report has been signed below by the following persons on behalf of the registrant and in the capacities indicated as of
February 19, 2015
.
|
Signature
|
Title
|
|
|
/s/ John J. Legere
|
President and Chief Executive Officer and
|
|
|
John J. Legere
|
Director (Principal Executive Officer)
|
|
|
/s/ J. Braxton Carter
|
Executive Vice President and Chief Financial Officer
|
|
|
J. Braxton Carter
|
(Principal Financial Officer)
|
|
|
/s/ Michael J. Morgan
|
Senior Vice President, Finance and Chief Accounting
|
|
|
Michael J. Morgan
|
Officer (Principal Accounting Officer)
|
|
|
/s/ Timotheus Höttges
|
Chairman of the Board
|
|
|
Timotheus Höttges
|
||
|
/s/ W. Michael Barnes
|
Director
|
|
|
W. Michael Barnes
|
||
|
/s/ Thomas Dannenfeldt
|
Director
|
|
|
Thomas Dannenfeldt
|
||
92
|
/s/ Srikant Datar
|
Director
|
|
|
Srikant Datar
|
||
|
/s/ Lawrence H. Guffey
|
Director
|
|
|
Lawrence H. Guffey
|
||
|
/s/ Bruno Jacobfeuerborn
|
Director
|
|
|
Bruno Jacobfeuerborn
|
||
|
/s/ Raphael Kübler
|
Director
|
|
|
Raphael Kübler
|
||
|
/s/ Thorsten Langheim
|
Director
|
|
|
Thorsten Langheim
|
||
|
/s/ Teresa A. Taylor
|
Director
|
|
|
Teresa A. Taylor
|
||
|
/s/ Kelvin R. Westbrook
|
Director
|
|
|
Kelvin R. Westbrook
|
||
93
INDEX TO EXHIBITS
|
Incorporated by Reference
|
||||||||||
|
Exhibit No.
|
Exhibit Description
|
Form
|
Date of First Filing
|
Exhibit Number
|
Filed Herein
|
|||||
|
2.1
|
Business Combination Agreement, dated as of October 3, 2012, by and among MetroPCS Communications, Inc., Deutsche Telekom AG, T-Mobile Zwischenholding GMBH, T-Mobile Global Holding GMBH and T-Mobile USA, Inc.
|
8-K
|
10/3/2012
|
2.1
|
|
|||||
|
2.2
|
Consent Solicitation Letter Agreement, dated December 5, 2012, by and among MetroPCS Communications, Inc. and Deutsche Telekom AG, amending Exhibit G to the Business Combination Agreement.
|
8-K
|
12/7/2012
|
2.1
|
|
|||||
|
2.3
|
Amendment No. 1 to the Business Combination Agreement by and among Deutsche Telekom AG, T-Mobile USA, Inc., T-Mobile Global Zwischenholding GmbH, T-Mobile Global Holding GmbH and MetroPCS Communications, Inc., dated April 14, 2013.
|
8-K
|
4/15/2013
|
2.1
|
|
|||||
|
3.1
|
Fourth Amended and Restated Certificate of Incorporation.
|
8-K
|
5/2/2013
|
3.1
|
|
|||||
|
3.2
|
Fifth Amended and Restated Bylaws.
|
8-K
|
5/2/2013
|
3.2
|
|
|||||
|
3.3
|
Certificate of Designation of 5.50% Mandatory Convertible Preferred Stock, Series A, of T-Mobile US, Inc., dated December 12, 2014.
|
8-K
|
12/15/2014
|
3.1
|
|
|||||
|
4.1
|
Rights Agreement, dated as of March 29, 2007, between MetroPCS Communications, Inc. and American Stock Transfer & Trust Company, as Rights Agent, which includes the form of Certificate of Designation of Series A Junior Participating Preferred Stock of MetroPCS Communications, Inc. as Exhibit A, the form of Rights Certificate as Exhibit B and the Summary of Rights as Exhibit C.
|
8-K
|
3/30/2007
|
4.1
|
|
|||||
|
4.2
|
Amendment No. 1 to the Rights Agreement, dated as of October 3, 2012 between MetroPCS Communications, Inc. and American Stock Transfer & Trust Company, as Rights Agent.
|
8-K
|
10/3/2012
|
4.1
|
|
|||||
|
4.3
|
Indenture, dated September 21, 2010, among MetroPCS Wireless, Inc., the Guarantors (as defined therein) and Wells Fargo Bank, N.A., a trustee.
|
8-K
|
9/21/2010
|
4.1
|
|
|||||
|
4.4
|
First Supplemental Indenture, dated September 21, 2010, among MetroPCS Wireless, Inc., the Guarantors (as defined therein) and Wells Fargo Bank, N.A., as trustee.
|
8-K
|
9/21/2010
|
4.2
|
|
|||||
|
4.5
|
Second Supplemental Indenture, dated November 17, 2010, among MetroPCS Wireless, Inc., the Guarantors (as defined therein) and Wells Fargo Bank, N.A., as trustee.
|
8-K
|
11/17/2010
|
4.1
|
|
|||||
|
4.6
|
Third Supplemental Indenture, dated December 23, 2010, among MetroPCS Wireless, Inc., the Guarantors (as defined therein) and Wells Fargo Bank, N.A., as trustee.
|
10-K
|
3/1/2011
|
10.19(d)
|
|
|||||
|
4.7
|
Fourth Supplemental Indenture, dated December 23, 2010, among MetroPCS Wireless, Inc., the Guarantors (as defined therein) and Wells Fargo Bank, N.A., as trustee.
|
10-K
|
3/1/2011
|
10.19(e)
|
|
|||||
|
4.8
|
Fifth Supplemental Indenture, dated as of December 14, 2012, among MetroPCS Wireless, Inc., the Guarantors (as defined therein) and Wells Fargo Bank, N.A., as trustee.
|
8-K
|
12/17/2012
|
4.1
|
|
|||||
|
4.9
|
Sixth Supplemental Indenture, dated as of December 14, 2012, among MetroPCS Wireless, Inc., the Guarantors (as defined therein) and Wells Fargo Bank, N.A., as trustee.
|
8-K
|
12/17/2012
|
4.2
|
|
|||||
|
4.10
|
Seventh Supplemental Indenture, dated as of May 1, 2013, among T-Mobile USA, Inc., the guarantors party thereto, and Wells Fargo Bank, N.A., as trustee.
|
8-K
|
5/2/2013
|
4.15
|
|
|||||
94
|
Incorporated by Reference
|
||||||||||
|
Exhibit No.
|
Exhibit Description
|
Form
|
Date of First Filing
|
Exhibit Number
|
Filed Herein
|
|||||
|
4.11
|
Eighth Supplemental Indenture, dated as of July 15, 2013, among T-Mobile USA, Inc., the guarantors party thereto, and Wells Fargo Bank, N.A., as trustee.
|
10-Q
|
8/8/2013
|
4.19
|
|
|||||
|
4.12
|
Indenture, dated as of March 19, 2013, by and among MetroPCS Wireless, Inc., the Guarantors (as defined therein) and Deutsche Bank Trust Company Americas, as trustee.
|
8-K
|
3/22/2013
|
4.1
|
|
|||||
|
4.13
|
First Supplemental Indenture, dated as of March 19, 2013, by and among MetroPCS Wireless, Inc., the Guarantors (as defined therein) and Deutsche Bank Trust Company Americas, as trustee.
|
8-K
|
3/22/2013
|
4.2
|
|
|||||
|
4.14
|
Form of 6.250% Senior Notes due 2021.
|
8-K
|
3/22/2013
|
4.3
|
|
|||||
|
4.15
|
Second Supplemental Indenture, dated as of March 19, 2013, by and among MetroPCS Wireless, Inc., the Guarantors (as defined therein) and Deutsche Bank Trust Company Americas, as trustee.
|
8-K
|
3/22/2013
|
4.4
|
|
|||||
|
4.16
|
Form of 6.625% Senior Notes due 2023.
|
8-K
|
3/22/2013
|
4.5
|
|
|||||
|
4.17
|
Third Supplemental Indenture, dated as of April 29, 2013, among T-Mobile USA, Inc., the guarantors party thereto, and Deutsche Bank Trust Company Americas, as trustee.
|
10-Q
|
8/8/2013
|
4.17
|
|
|||||
|
4.18
|
Fourth Supplemental Indenture, dated as of May 1, 2013, among T-Mobile USA, Inc., the guarantors party thereto, and Deutsche Bank Trust Company Americas, as trustee.
|
8-K
|
5/2/2013
|
4.16
|
|
|||||
|
4.19
|
Fifth Supplemental Indenture, dated as of July 15, 2013, among T-Mobile USA, Inc., the guarantors party thereto, and Deutsche Bank Trust Company Americas, as trustee.
|
10-Q
|
8/8/2013
|
4.20
|
|
|||||
|
4.20
|
Indenture, dated as of April 28, 2013 among T-Mobile USA, Inc., the guarantors party thereto, and Deutsche Bank Trust Company Americas, as trustee.
|
8-K
|
5/2/2013
|
4.1
|
|
|||||
|
4.21
|
First Supplemental Indenture, dated as of April 28, 2013 among T-Mobile USA, Inc., the guarantors party thereto, and Deutsche Bank Trust Company Americas, as trustee.
|
8-K
|
5/2/2013
|
4.2
|
|
|||||
|
4.22
|
Second Supplemental Indenture, dated as of April 28, 2013 among T-Mobile USA, Inc., the guarantors party thereto, and Deutsche Bank Trust Company Americas, as trustee.
|
8-K
|
5/2/2013
|
4.3
|
|
|||||
|
4.23
|
Third Supplemental Indenture, dated as of April 28, 2013 among T-Mobile USA, Inc., the guarantors party thereto, and Deutsche Bank Trust Company Americas, as trustee.
|
8-K
|
5/2/2013
|
4.4
|
|
|||||
|
4.24
|
Fourth Supplemental Indenture, dated as of April 28, 2013 among T-Mobile USA, Inc., the guarantors party thereto, and Deutsche Bank Trust Company Americas, as trustee.
|
8-K
|
5/2/2013
|
4.5
|
|
|||||
|
4.25
|
Fifth Supplemental Indenture, dated as of April 28, 2013 among T-Mobile USA, Inc., the guarantors party thereto, and Deutsche Bank Trust Company Americas, as trustee.
|
8-K
|
5/2/2013
|
4.6
|
|
|||||
|
4.26
|
Sixth Supplemental Indenture, dated as of April 28, 2013 among T-Mobile USA, Inc., the guarantors party thereto, and Deutsche Bank Trust Company Americas, as trustee.
|
8-K
|
5/2/2013
|
4.7
|
|
|||||
|
4.27
|
Seventh Supplemental Indenture, dated as of April 28, 2013 among T-Mobile USA, Inc., the guarantors party thereto, and Deutsche Bank Trust Company Americas, as trustee.
|
8-K
|
5/2/2013
|
4.8
|
|
|||||
|
4.28
|
Eighth Supplemental Indenture, dated as of April 28, 2013 among T-Mobile USA, Inc., the guarantors party thereto, and Deutsche Bank Trust Company Americas, as trustee.
|
8-K
|
5/2/2013
|
4.9
|
|
|||||
|
4.29
|
Ninth Supplemental Indenture, dated as of April 28, 2013 among T-Mobile USA, Inc., the guarantors party thereto, and Deutsche Bank Trust Company Americas, as trustee.
|
8-K
|
5/2/2013
|
4.10
|
|
|||||
95
|
Incorporated by Reference
|
||||||||||
|
Exhibit No.
|
Exhibit Description
|
Form
|
Date of First Filing
|
Exhibit Number
|
Filed Herein
|
|||||
|
4.30
|
Tenth Supplemental Indenture, dated as of April 28, 2013 among T-Mobile USA, Inc., the guarantors party thereto, and Deutsche Bank Trust Company Americas, as trustee.
|
8-K
|
5/2/2013
|
4.11
|
|
|||||
|
4.31
|
Eleventh Supplemental Indenture, dated as of May 1, 2013 among T-Mobile USA, Inc., the guarantors party thereto, and Deutsche Bank Trust Company Americas, as trustee.
|
8-K
|
5/2/2013
|
4.12
|
|
|||||
|
4.32
|
Twelfth Supplemental Indenture, dated as of July 15, 2013, among T-Mobile USA, Inc., the guarantors party thereto, and Deutsche Bank Trust Company Americas, as trustee.
|
10-Q
|
8/8/2013
|
4.18
|
|
|||||
|
4.33
|
Thirteenth Supplemental Indenture, dated as of August 21, 2013, by and among T-Mobile USA, Inc., the Guarantors (as defined therein) and Deutsche Bank Trust Company Americas, as trustee, including the Form of 5.250% Senior Note due 2018.
|
8-K
|
8/22/2013
|
4.1
|
|
|||||
|
4.34
|
Fourteenth Supplemental Indenture, dated as of November 21, 2013, by and among T-Mobile USA, Inc., the Guarantors and Deutsche Bank Trust Company Americas, as trustee, including the Form of 6.125% Senior Note due 2022.
|
8-K
|
11/22/2013
|
4.1
|
|
|||||
|
4.35
|
Fifteenth Supplemental Indenture, dated as of November 21, 2013, by and among T-Mobile USA, Inc., the Guarantors and Deutsche Bank Trust Company Americas, as trustee, including the Form of 6.500% Senior Note due 2024.
|
8-K
|
11/22/2013
|
4.2
|
|
|||||
|
4.36
|
Noteholder Agreement dated as of April 28, 2013, by and between Deutsche Telekom AG and T-Mobile USA, Inc.
|
8-K
|
5/2/2013
|
4.13
|
|
|||||
|
4.37
|
Sixth Supplemental Indenture, dated as of August 11, 2014, by and among T-Mobile USA, Inc., the guarantors party thereto and Deutsche Bank Trust Company Americas, as trustee.
|
10-Q
|
10/28/2014
|
4.1
|
|
|||||
|
4.38
|
Ninth Supplemental Indenture, dated as of August 11, 2014, by and among T-Mobile USA, Inc., the guarantors party thereto and Wells Fargo Bank, N.A., as trustee.
|
10-Q
|
10/28/2014
|
4.2
|
|
|||||
|
4.39
|
Sixteenth Supplemental Indenture, dated as of August 11, 2014, by and among T-Mobile USA, Inc., the guarantors party thereto and Deutsche Bank Trust Company Americas, as trustee.
|
10-Q
|
10/28/2014
|
4.3
|
|
|||||
|
4.40
|
Seventeenth Supplemental Indenture, dated as of September 5, 2014, by and among T-Mobile USA, Inc., the guarantors party thereto and Deutsche Bank Trust Company Americas, as trustee, including the Form of 6.000% Senior Notes due 2023.
|
8-K
|
9/5/2014
|
4.1
|
|
|||||
|
4.41
|
Eighteenth Supplemental Indenture, dated as of September 5, 2014, by and among T-Mobile USA, Inc., the guarantors party thereto and Deutsche Bank Trust Company Americas, as trustee, including the Form of 6.375% Senior Notes due 2025.
|
8-K
|
9/5/2014
|
4.2
|
|
|||||
|
10.1
|
Master Agreement, dated as of September 28, 2012, among T-Mobile USA, Inc., Crown Castle International Corp., and certain T-Mobile and Crown subsidiaries.
|
10-Q
|
8/8/2013
|
10.1
|
|
|||||
|
10.2
|
Amendment No. 1, to Master Agreement, dated as of November 30, 2012, among Crown Castle International Corp., and certain T-Mobile and Crown subsidiaries.
|
10-Q
|
8/8/2013
|
10.2
|
|
|||||
|
10.3
|
Master Prepaid Lease, dated as of November 30, 2012, by and among T-Mobile USA Tower LLC, T-Mobile West Tower LLC, T-Mobile USA, Inc. and CCTMO LLC.
|
10-Q
|
8/8/2013
|
10.3
|
|
|||||
96
|
Incorporated by Reference
|
||||||||||
|
Exhibit No.
|
Exhibit Description
|
Form
|
Date of First Filing
|
Exhibit Number
|
Filed Herein
|
|||||
|
10.4
|
MPL Site Master Lease Agreement, dated as of November 30, 2012, by and among Cook Inlet/VS GSM IV PCS Holdings, LLC, T-Mobile Central LLC, T-Mobile South LLC, Powertel/Memphis, Inc., Voicestream Pittsburgh, L.P., T-Mobile West LLC, T-Mobile Northeast LLC, Wireless Alliance, LLC, Suncom Wireless Operating Company, L.L.C., T-Mobile USA, Inc. and CCTMO LLC.
|
10-Q
|
8/8/2013
|
10.4
|
|
|||||
|
10.5
|
First Amendment to MPL Site Master Lease Agreement, dated as of November 30, 2012, by and among Cook Inlet/VS GSM IV PCS Holdings, LLC, T-Mobile Central LLC, T-Mobile South LLC, Powertel/Memphis, Inc., Voicestream Pittsburgh, L.P., T-Mobile West LLC, T-Mobile Northeast LLC, Wireless Alliance, LLC, Suncom Wireless Operating Company, L.L.C., T-Mobile USA, Inc. and CCTMO LLC.
|
10-Q
|
8/8/2013
|
10.5
|
|
|||||
|
10.6
|
Sale Site Master Lease Agreement, dated as of November 30, 2012, by and among Cook Inlet/VS GSM IV PCS Holdings, LLC, T-Mobile Central LLC, T-Mobile South LLC, Powertel/Memphis, Inc., Voicestream Pittsburgh, L.P., T-Mobile West LLC, T-Mobile Northeast LLC, Wireless Alliance, LLC, Suncom Wireless Operating Company, L.L.C., T-Mobile USA, Inc., T3 Tower 1 LLC and T3 Tower 2 LLC.
|
10-Q
|
8/8/2013
|
10.6
|
|
|||||
|
10.7
|
First Amendment to Sale Site Master Lease Agreement, dated as of November 30, 2012, by and Cook Inlet/VS GSM IV PCS Holdings, LLC, T-Mobile Central LLC, T-Mobile South LLC, Powertel/Memphis, Inc., Voicestream Pittsburgh, L.P., T-Mobile West LLC, T-Mobile Northeast LLC, Wireless Alliance, LLC, Suncom Wireless Operating Company, L.L.C., T-Mobile USA, Inc., T3 Tower 1 LLC and T3 Tower 2 LLC.
|
10-Q
|
8/8/2013
|
10.7
|
|
|||||
|
10.8
|
Management Agreement, dated as of November 30, 2012, by and among Suncom Wireless Operating Company, L.L.C., Cook Inlet/VS GSM IV PCS Holdings, LLC, T-Mobile Central LLC, T-Mobile South LLC, Powertel/Memphis, Inc., Voicestream Pittsburgh, L.P., T-Mobile West LLC, T-Mobile Northeast LLC, Wireless Alliance, LLC, Suncom Wireless Property Company, L.L.C., T-Mobile USA Tower LLC, T-Mobile West Tower LLC, CCTMO LLC, T3 Tower 1 LLC and T3 Tower 2 LLC.
|
10-Q
|
8/8/2013
|
10.8
|
|
|||||
|
10.9
|
Stockholder’s Agreement dated as of April 30, 2013 by and between MetroPCS Communications, Inc. and Deutsche Telekom AG.
|
8-K
|
5/2/2013
|
10.1
|
|
|||||
|
10.10
|
Waiver of Required Approval Under Section 3.6(a) of the Stockholder's Agreement, dated August 7, 2013, between T-Mobile US, Inc. and Deutsche Telekom AG.
|
10-Q
|
8/8/2013
|
10.10
|
|
|||||
|
10.11
|
License Agreement dated as of April 30, 2013 by and between T-Mobile US, Inc. and Deutsche Telekom AG.
|
8-K
|
5/2/2013
|
10.2
|
|
|||||
|
10.12
|
Credit Agreement, dated as of May 1, 2013, among T-Mobile USA, Inc., as Borrower, Deutsche Telekom AG, as Lender, the other lenders party thereto from time to time, and JPMorgan Chase Bank, N.A., as Administrative Agent.
|
8-K
|
5/2/2013
|
4.14
|
|
|||||
|
10.13
|
Amendment No. 1, dated as of November 15, 2013, to the Credit Agreement, dated May 1, 2013, among T-Mobile US, Inc., T-Mobile USA, Inc., each of the Subsidiaries signatory thereto, Deutsche Telekom AG and the other lenders party thereto from time to time, and JPMorgan Chase Bank, N.A., as Administrative Agent.
|
8-K
|
11/20/2013
|
10.1
|
|
|||||
97
|
Incorporated by Reference
|
||||||||||
|
Exhibit No.
|
Exhibit Description
|
Form
|
Date of First Filing
|
Exhibit Number
|
Filed Herein
|
|||||
|
10.14
|
Amendment No. 2, dated as of September 3, 2014, to the Credit Agreement, dated as of May 1, 2013, among T-Mobile USA, Inc., Deutsche Telekom AG and the other lenders party thereto from time to time, and JPMorgan Chase Bank, N.A., as Administrative Agent.
|
8-K
|
9/5/2014
|
10.1
|
|
|||||
|
10.15
|
Registration Rights Agreement, dated as of March 19, 2013, by and among MetroPCS Wireless, Inc., the Initial Guarantors (as defined therein), and Deutsche Bank Securities, as representative of the Initial Purchasers (as defined therein).
|
8-K
|
3/22/2013
|
10.1
|
|
|||||
|
10.16
|
Registration Rights Agreement, dated as of August 21, 2013, by and among T-Mobile USA, Inc., the Guarantors (as defined therein), and Deutsche Bank Securities Inc., as Initial Purchaser (as defined therein).
|
8-K
|
8/21/2013
|
10.1
|
|
|||||
|
10.17*
|
Second Amended and Restated 1995 Stock Option Plan of MetroPCS, Inc.
|
S-1
|
1/4/2007
|
10.1(d)
|
|
|||||
|
10.18*
|
First Amendment to the Second Amended and Restated 1995 Stock Option Plan of MetroPCS, Inc.
|
S-1
|
1/4/2007
|
10.1(e)
|
|
|||||
|
10.19*
|
Second Amendment to the Second Amended and Restated 1995 Stock Option Plan of MetroPCS, Inc.
|
S-1
|
1/4/2007
|
10.1(f)
|
|
|||||
|
10.20*
|
Amended and Restated MetroPCS Communications, Inc. 2004 Equity Incentive Compensation Plan.
|
S-1/A
|
2/27/2007
|
10.1(a)
|
|
|||||
|
10.21*
|
MetroPCS Communications, Inc. 2010 Equity Incentive Compensation Plan.
|
Schedule 14A
|
4/19/2010
|
Annex A
|
|
|||||
|
10.22*
|
Form Change in Control Agreement for MetroPCS Communications, Inc.
|
10-Q
|
8/9/2010
|
10.2
|
|
|||||
|
10.23*
|
Form Change in Control Agreement Amendment for MetroPCS Communications, Inc.
|
10-Q
|
10/30/2012
|
10.1
|
|
|||||
|
10.24*
|
MetroPCS Communications, Inc. Employee Non-qualified Stock Option Award Agreement relating to the MetroPCS Communications, Inc. Amended and Restated 2004 Equity Incentive Compensation Plan.
|
10-K
|
3/1/2013
|
10.9(a)
|
|
|||||
|
10.25*
|
MetroPCS Communications, Inc. Non-Employee Director Non-qualified Stock Option Award Agreement relating to the MetroPCS Communications, Inc. Amended and Restated 2004 Equity Incentive Compensation Plan.
|
10-K
|
3/1/2013
|
10.9(b)
|
|
|||||
|
10.26*
|
Form Amendment to the MetroPCS Communications, Inc. Notice of Grant of Stock Option relating to the Second Amended and Restated 1995 Stock Option Plan of MetroPCS, Inc.
|
10-Q
|
8/9/2010
|
10.5
|
|
|||||
|
10.27*
|
Form MetroPCS Communications, Inc. 2010 Equity Incentive Compensation Plan Employee Non-Qualified Stock Option Award Agreement.
|
10-K
|
2/29/2012
|
10.12
|
|
|||||
|
10.28*
|
Form MetroPCS Communications, Inc. 2010 Equity Incentive Compensation Plan Non-Employee Director Non-Qualified Stock Option Award Agreement.
|
10-K
|
3/1/2013
|
10.12(b)
|
|
|||||
|
10.29*
|
Employment Agreement of J. Braxton Carter dated as of January 25, 2013.
|
8-K
|
5/2/2013
|
10.3
|
|
|||||
|
10.30*
|
Employment Agreement of Thomas C. Keys dated as of January 25, 2013.
|
8-K
|
5/2/2013
|
10.4
|
|
|||||
|
10.31*
|
Employment Agreement of John J. Legere dated as of September 22, 2012.
|
10-Q
|
8/8/2013
|
10.17
|
|
|||||
|
10.32*
|
Amendment to Employment Agreement of John J. Legere dated as of October 23, 2013.
|
10-K
|
2/25/2014
|
10.35
|
|
|||||
|
10.33*
|
Form of Indemnification Agreement.
|
8-K
|
5/2/2013
|
10.6
|
|
|||||
98
|
Incorporated by Reference
|
||||||||||
|
Exhibit No.
|
Exhibit Description
|
Form
|
Date of First Filing
|
Exhibit Number
|
Filed Herein
|
|||||
|
10.34*
|
Amended Director Compensation Program effective as of May 1, 2013 (amended June 4, 2014).
|
10-Q
|
7/31/2014
|
10.1
|
|
|||||
|
10.35*
|
T-Mobile US, Inc. Non-Qualified Deferred Executive Compensation Plan (As Amended and Restated Effective as of January 1, 2014).
|
10-K
|
2/25/2014
|
10.39
|
|
|||||
|
10.36*
|
T-Mobile US, Inc. Executive Continuity Plan as Amended and Restated Effective as of January 1, 2014.
|
8-K
|
10/25/2013
|
10.1
|
|
|||||
|
10.37*
|
T-Mobile US, Inc. 2013 Omnibus Incentive Plan (as amended and restated on August 7, 2013).
|
10-Q
|
8/8/2013
|
10.20
|
|
|||||
|
10.38*
|
T-Mobile USA, Inc. 2011 Long-Term Incentive Plan.
|
10-Q
|
8/8/2013
|
10.21
|
|
|||||
|
10.39*
|
Annual Incentive Award Notice under the 2013 Omnibus Incentive Plan.
|
10-K
|
2/25/2014
|
10.45
|
|
|||||
|
10.40*
|
Form of Restricted Stock Unit Award Agreement for Non-Employee Directors under the T-Mobile US, Inc. 2013 Omnibus Incentive Plan.
|
8-K
|
6/4/2013
|
10.2
|
|
|||||
|
10.41*
|
Form of Restricted Stock Unit Award Agreement (Time-Vesting) for Executive Officers under the T-Mobile US, Inc. 2013 Omnibus Incentive Plan.
|
10-Q
|
8/8/2013
|
10.24
|
|
|||||
|
10.42*
|
Form of Restricted Stock Unit Award Agreement (Performance-Vesting) for Executive Officers under the T-Mobile US, Inc. 2013 Omnibus Incentive Plan.
|
10-Q
|
8/8/2013
|
10.25
|
|
|||||
|
10.43*
|
Form of Restricted Stock Unit Award Agreement (Performance-Vesting) with Deferral Option for Executive Officers under the T-Mobile US, Inc. 2013 Omnibus Incentive Plan.
|
X
|
||||||||
|
10.44*
|
Form of Restricted Stock Unit Award Agreement (Time-Vesting) with Deferral Option for Executive Officers under the T-Mobile US, Inc. 2013 Omnibus Incentive Plan.
|
X
|
||||||||
|
10.45
|
License Exchange Agreement, dated January 5, 2014, among T-Mobile USA, Inc., T-Mobile License LLC, Cellco Partnership d/b/a Verizon Wireless, Verizon Wireless (VAW) LLC, Athens Cellular, Inc. and Verizon Wireless of the East LP.
|
8-K
|
1/6/2014
|
10.1
|
|
|||||
|
10.46
|
License Purchase Agreement, dated January 5, 2014, among T-Mobile USA, Inc., T-Mobile License LLC and Cellco Partnership d/b/a Verizon Wireless.
|
8-K
|
1/6/2014
|
10.2
|
|
|||||
|
10.47
|
Receivables Sale and Conveyancing Agreement, dated as of February 26, 2014, among T-Mobile West LLC, T-Mobile Central LLC, T-Mobile Northeast LLC and T-Mobile South LLC, as sellers, and T-Mobile PCS Holdings LLC, as purchaser.
|
8-K
|
3/4/2014
|
10.1
|
|
|||||
|
10.48
|
Receivables Sale and Contribution Agreement, dated as of February 26, 2014, between T-Mobile PCS Holdings LLC, as seller, and T-Mobile Airtime Funding LLC, as purchaser.
|
8-K
|
3/4/2014
|
10.2
|
|
|||||
|
10.49
|
Master Receivables Purchase Agreement, dated as of February 26, 2014, among T-Mobile Airtime Funding LLC, as funding seller, Billing Gate One LLC, as purchaser, Landesbank Hessen-Thüringen Girozentrale, as bank purchasing agent, T-Mobile PCS Holdings LLC, as servicer, and T-Mobile US, Inc., as performance guarantor.
|
8-K
|
3/4/2014
|
10.3
|
|
|||||
|
10.50
|
Guarantee Facility Agreement, dated as of February 26, 2014, among T-Mobile US, Inc., as the company, T-Mobile Airtime Funding LLC, as the funding seller, and KfW IPEX-Bank GmbH, as the bank.
|
8-K
|
3/4/2014
|
10.4
|
|
|||||
99
|
Incorporated by Reference
|
||||||||||
|
Exhibit No.
|
Exhibit Description
|
Form
|
Date of First Filing
|
Exhibit Number
|
Filed Herein
|
|||||
|
10.51
|
Omnibus Amendment to the Master Receivables Purchase Agreement and Fee Letter, dated as of April 11, 2014, by and among T-Mobile Airtime Funding LLC, as funding seller, Billing Gate One LLC, as purchaser, Landesbank Hessen-Thüringen Girozentrale, as bank purchasing agent and a bank purchaser, T-Mobile PCS Holdings LLC, as servicer, T-Mobile US, Inc. as performance guarantor, and the Bank of Tokyo-Mitsubishi UFJ, Ltd., as a bank purchaser.
|
10-Q
|
5/1/2014
|
10.7
|
|
|||||
|
10.52
|
Second Amendment to the Master Receivables Purchase Agreement dated as of June 12, 2014, by and among T-Mobile Airtime Funding LLC, as funding seller, Billing Gate One LLC, as purchaser, Landesbank Hessen-Thüringen Girozentrale, as bank purchasing agent and a bank purchaser, T-Mobile PCS Holdings LLC, as servicer and T-Mobile US, Inc. as performance guarantor.
|
10-Q
|
7/31/2014
|
10.2
|
|
|||||
|
10.53
|
Third Amendment to the Master Receivables Purchase Agreement, dated as of September 29, 2014, by and among T-Mobile Airtime Funding LLC, as funding seller, Billing Gate One LLC, as purchaser, Landesbank Hessen-Thüringen Girozentrale, as bank purchasing agent and a bank purchaser, T-Mobile PCS Holdings LLC, as servicer and T-Mobile US, Inc. as performance guarantor.
|
10-Q
|
10/28/2014
|
10.2
|
|
|||||
|
10.54
|
Fourth Amendment to the Master Receivables Purchase Agreement, dated as of November 28, 2014, by and among T-Mobile Airtime Funding LLC, as funding seller, Billing Gate One LLC, as purchaser, Landesbank Hessen-Thüringen Girozentrale, as bank purchasing agent and a bank purchaser, T-Mobile PCS Holdings LLC, as servicer and T-Mobile US, Inc. as performance guarantor.
|
X
|
||||||||
|
10.55
|
Joinder and First Amendment to the Receivables Sale and Conveyancing Agreement, dated as of November 28, 2014, among Powertel/Memphis, Inc., Triton PCS Holdings Company L.L.C., T-Mobile West LLC, T-Mobile Central LLC, T-Mobile Northeast LLC and T-Mobile South LLC, as sellers, and T-Mobile PCS Holdings LLC, as purchaser.
|
X
|
||||||||
|
10.56
|
First Amendment to the Receivables Sale and Contribution Agreement, dated as of November 28, 2014, between T-Mobile PCS Holdings LLC, as seller, and T-Mobile Airtime Funding LLC, as purchaser.
|
X
|
||||||||
|
10.57
|
First Amended and Restated Guarantee Facility Agreement, dated as of November 28, 2014, among T-Mobile US, Inc., as the company, T-Mobile Airtime Funding LLC, as the funding seller, and KfW IPEX-Bank GmbH, as the bank.
|
X
|
||||||||
|
12.1
|
Computation of Ratio of Earnings to Fixed Charges.
|
|
|
|
X
|
|||||
|
21.1
|
Subsidiaries of Registrant.
|
|
|
|
X
|
|||||
|
23.1
|
Consent of PricewaterhouseCoopers LLP.
|
|
|
|
X
|
|||||
|
24.1
|
Power of Attorney, pursuant to which amendments to this Form 10-K may be filed (included on the signature page contained in Part IV of the Form 10-K).
|
|
|
|
X
|
|||||
|
31.1
|
Certifications of Chief Executive Officer Pursuant to Section 302 of the Sarbanes-Oxley Act of 2002.
|
|
|
|
X
|
|||||
|
31.2
|
Certifications of Chief Financial Officer Pursuant to Section 302 of the Sarbanes-Oxley Act of 2002.
|
|
|
|
X
|
|||||
|
32.1**
|
Certification of Chief Executive Officer Pursuant to Section 906 of the Sarbanes-Oxley Act of 2002.
|
|
|
|
|
|||||
|
32.2**
|
Certification of Chief Financial Officer Pursuant to Section 906 of the Sarbanes-Oxley Act of 2002.
|
|
|
|
|
|||||
|
101.INS
|
XBRL Instance Document.
|
|
|
|
X
|
|||||
100
|
Incorporated by Reference
|
||||||||||
|
Exhibit No.
|
Exhibit Description
|
Form
|
Date of First Filing
|
Exhibit Number
|
Filed Herein
|
|||||
|
101.SCH
|
XBRL Taxonomy Extension Schema Document.
|
|
|
|
X
|
|||||
|
101.CAL
|
XBRL Taxonomy Extension Calculation Linkbase Document.
|
|
|
|
X
|
|||||
|
101.DEF
|
XBRL Taxonomy Extension Definition Linkbase Document.
|
|
|
|
X
|
|||||
|
101.LAB
|
XBRL Taxonomy Extension Label Linkbase Document.
|
|
|
|
X
|
|||||
|
101.PRE
|
XBRL Taxonomy Extension Presentation Linkbase Document.
|
|
|
|
X
|
|||||
* Indicates a management contract or compensatory plan or arrangement.
** Furnished herein.
101
TABLE OF CONTENTS
Part IItem 1. BusinessNote 2 Business Combination with MetropcsPart Ii, Item 8Item 1A. Risk FactorsItem 1B. Unresolved Staff CommentsItem 2. PropertiesItem 3. Legal ProceedingsNote 13 Commitments and ContingenciesItem 4. Mine Safety DisclosuresPart IIItem 5. Market For Registrant S Common Equity, Related Stockholder Matters and Issuer Purchases Of Equity SecuritiesItem 6. Selected Financial DataItem 7. Management S Discussion and Analysis Of Financial Condition and Results Of OperationsNote 8 DebtNote 14 Additional Financial InformationNote 4 Factoring ArrangementNote 6 Goodwill, Spectrum Licenses and Intangible AssetsNote 16 Subsequent EventsNote 9 Tower Transaction and Related Long-term Financial ObligationNote 1 Summary Of Significant Accounting PoliciesNote 5 Property and EquipmentItem 7A. Quantitative and Qualitative Disclosures About Market RiskItem 8. Financial Statements and Supplementary DataNote 3 Equipment Installment Plan ReceivablesNote 7 Fair Value Measurements and Derivative InstrumentsNote 15 Guarantor Financial InformationNote 10 Employee Compensation and Benefit PlansNote 11 Income TaxesNote 12 Earnings (loss) Per ShareItem 9. Changes in and Disagreements with Accountants on Accounting and Financial DisclosureItem 9A. Controls and ProceduresItem 9B. Other InformationPart IIIItem 10. Directors, Executive Officers and Corporate GovernanceItem 11. Executive CompensationItem 12. Security Ownership Of Certain Beneficial Owners and Management and Related Stockholder MattersItem 13. Certain Relationships and Related Transactions, and Director IndependenceItem 14. Principal Accounting Fees and ServicesPart IVItem 15. Exhibits, Financial Statement Schedules