TRINET GROUP, INC.
10-Ks and 10-Qs
|
|
|
|
|
|
|
|
|
|
|
|
|
|
|
|
|
|
|
|
|
|
|
|
|
|
|
|
|
|
|
|
|
|
|
|
|
|
|
|
|
|
|
|
UNITED STATES
SECURITIES AND EXCHANGE COMMISSION
WASHINGTON, DC 20549
FORM 10-Q
(Mark One)
x
QUARTERLY REPORT PURSUANT TO SECTION 13 OR 15(d) OF THE SECURITIES EXCHANGE ACT OF 1934
For the quarterly period ended
June 30, 2018
or
o
TRANSITION REPORT PURSUANT TO SECTION 13 OR 15(d) OF THE SECURITIES EXCHANGE ACT OF 1934
For the transition period from
to
Commission File Number: 001-36373

TRINET GROUP, INC.
(Exact Name of Registrant as Specified in its Charter)
|
Delaware
|
|
95-3359658
|
|
(State or other jurisdiction of
incorporation or organization)
|
|
(I.R.S. Employer
Identification No.)
|
|
One Park Place, Suite 600, Dublin, CA
|
94568
|
|
|
(Address of principal executive offices)
|
(Zip Code)
|
|
Registrant’s telephone number, including area code: (510) 352-5000
Indicate by check mark whether the registrant (1) has filed all reports required to be filed by Section 13 or 15(d) of the Securities Exchange Act of 1934 during the preceding 12 months (or for such shorter period that the registrant was required to file such reports), and (2) has been subject to such filing requirements for the past 90 days. Yes
x
No
o
Indicate by check mark whether the registrant has submitted electronically and posted on its corporate Web site, if any, every Interactive Data File required to be submitted and posted pursuant to Rule 405 of Regulation S-T (§ 232.405 of this chapter) during the preceding 12 months (or for such shorter period that the registrant was required to submit and post such files). Yes
x
No
o
Indicate by check mark whether the registrant is a large accelerated filer, an accelerated filer, a non-accelerated filer, smaller reporting company, or an emerging growth company. See the definitions of “large accelerated filer,” “accelerated filer”, “smaller reporting company”, and “emerging growth company” in Rule 12b-2 of the Exchange Act. (Check one):
|
Large accelerated filer
|
x
|
Accelerated filer
|
o
|
|
Non-accelerated filer
|
o
(do not check if a smaller reporting company)
|
Smaller reporting company
|
o
|
|
Emerging growth company
|
o
|
||
If an emerging growth company, indicate by check mark if the registrant has elected not to use the extended transition period for complying with any new or revised financial accounting standards provided pursuant to Section 13(a) of the Exchange Act. Yes
o
No
o
Indicate by check mark whether the registrant is a shell company (as defined in Rule 12b-2 of the Exchange Act). Yes
o
No
x
The number of shares of Registrant’s Common Stock outstanding as of
July 23, 2018
was
70,550,657
.
TRINET GROUP, INC.
Form 10-Q - Quarterly Report
For the Quarterly Period Ended
June 30, 2018
TABLE OF CONTENTS
|
Form 10-Q
Cross Reference
|
Page
|
|
|
Part I, Item 1.
|
||
|
Part I, Item 2.
|
||
|
Part I, Item 3.
|
||
|
Part I, Item 4.
|
||
|
Part II, Item 1.
|
||
|
Part II, Item 1A.
|
||
|
Part II, Item 2.
|
||
|
Part II, Item 3.
|
||
|
Part II, Item 4.
|
||
|
Part II, Item 5.
|
||
|
Part II, Item 6.
|
||
|
FORWARD LOOKING STATEMENTS AND OTHER FINANCIAL INFORMATION
|
|
Cautionary Note Regarding Forward-Looking Statements and Other Financial Information
For purposes of this Quarterly Report on Form 10-Q (Form 10-Q), the terms “TriNet," "the Company," “we,” “us” and “our" refer to TriNet Group, Inc., and its consolidated subsidiaries. This Form 10-Q contains statements that are not historical in nature, are predictive in nature, or that depend upon or refer to future events or conditions or otherwise contain forward-looking statements within the meaning of Section 21 of the Securities Exchange Act of 1934, as amended, and the Private Securities Litigation Reform Act of 1995. Forward-looking statements are often identified by the use of words such as, but not limited to, “anticipate,” “believe,” “can,” “continue,” “could,” “design,” “estimate,” “expect,” “forecast,” “hope,” “intend,” “may,” “outlook,” “plan,” “potential,” “predict,” “project,” “seek,” “should,” “strategy,” “target,” “will,” “would” and similar expressions or variations intended to identify forward-looking statements.
Forward-looking statements are not guarantees of future performance, but are based on management’s expectations as of the date of this Form 10-Q and assumptions that are inherently subject to uncertainties, risks and changes in circumstances that are difficult to predict. Forward-looking statements involve known and unknown risks, uncertainties and other factors that may cause actual results, performance or achievements to be materially different from our current expectations and any past results, performance or achievements. Given these risks and uncertainties, readers are cautioned not to place undue reliance on such forward-looking statements.
Important factors that could cause actual results to differ materially from those expressed or implied by these forward-looking statements are discussed throughout our Annual Report on Form 10-K for the year ended December 31, 2017 filed with the Securities and Exchange Commission (SEC) on February 27, 2018 (2017 Form 10-K), including those appearing under the heading “Risk Factors” in Item 1A, and under the heading “Management’s Discussion and Analysis of Financial Condition and Results of Operations” (MD&A) in Item 7 of our 2017 Form 10-K, as well as in our other periodic filings with the SEC. Those factors could cause our actual results to differ materially from our anticipated results. The information provided in this Form 10-Q is based upon the facts and circumstances known as of the date of this Form 10-Q, and any forward-looking statements made by us in this Form 10-Q speak only as of the date of this Form 10-Q. We undertake no obligation to revise or update any of the information provided in this Form 10-Q, except as required by law.
The MD&A of this Form 10-Q includes references to our performance measures presented in conformity with accounting principles generally accepted in the United States of America (GAAP) and other non-GAAP financial measures that we use to manage our business, to make planning decisions, to allocate resources and to use as performance measures in our executive compensation plans. Refer to the Non-GAAP Financial Measures in our Key Financial and Operating Metrics section within our MD&A for definitions and reconciliations from GAAP measures.
|
MANAGEMENT'S DISCUSSION AND ANALYSIS
|
|
Management’s Discussion and Analysis of Financial Condition and Results of Operations
Executive Summary
Overview
TriNet is a leading provider of human resources (HR) solutions for small to midsize businesses (SMBs). Under our co-employment model, we assume certain of the responsibilities of being an employer and help our clients mitigate employer-related risks and manage many of the complex and burdensome administrative and compliance responsibilities associated with employment.
Our solutions include payroll processing, tax administration, access to employee benefits and an HR technology platform with online and mobile tools that allow our clients and worksite employees (WSEs) to store, view and manage their core HR-related information and efficiently conduct a variety of HR-related transactions anytime and anywhere.
Significant Developments in
2018
Our consolidated results for the
six months ended June 30, 2018
reflect continued progress in our industry-oriented (vertical) products and our insurance service offerings, combined with higher WSE enrollment growth within our insurance offerings.
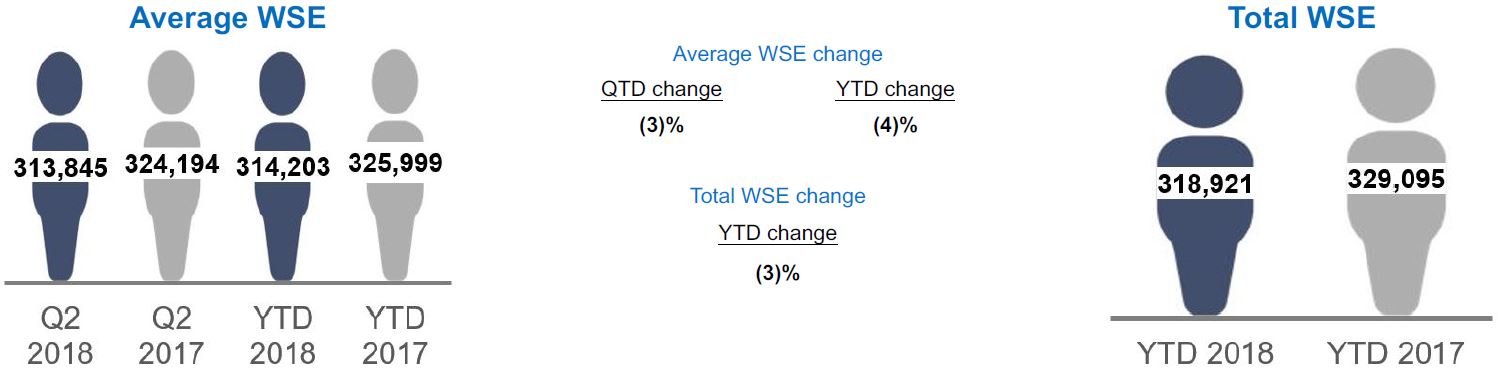
We experienced a decline in Average WSEs (defined as average monthly WSE's paid during the period) for the
six months ended June 30, 2018
as compared to the first
six
months of
2017
primarily due to the migration of clients from our legacy (SOI) platform onto our common TriNet platform. The decline in Average WSEs from our platform migration was partially offset by new customer growth across all of our core verticals and growth within our installed base.
In summary we:
|
•
|
Completed the migration of existing clients from the SOI platform onto our common TriNet platform, which will allow all our clients to benefit from our investment in platform and product improvements,
|
|
•
|
Launched TriNet Professional Services, our sixth vertical product, which addresses the HR needs of professional service firms such as consulting, advertising, and other expertise-driven companies.
|
|
•
|
Improved the financial performance of our vertical products by adding new clients with better sales representative retention.
|
|
•
|
Commenced with investment of corporate funds to generate interest income.
|
|
•
|
Refinanced term loans maturing July 2019 with a new $425 million term loan and secured a $250 million revolving credit facility.
|
|
•
|
Continued to benefit from changes executed in October 2017 for one of our health insurance carriers, where we converted an insurance carrier contract from a guaranteed-cost to risk-based insurance plan,
|
|
•
|
Continued to invest in improving our internal control environment to support our ongoing compliance with the requirements of Sarbanes-Oxley Act of 2002 (SOX), and
|
|
•
|
A TriNet subsidiary received a Certified Professional Employer Organization designation on July 1, 2018.
|
|
MANAGEMENT'S DISCUSSION AND ANALYSIS
|
|
Performance Highlights
Q2
2018
During the
second
quarter of
2018
, we:
|
•
|
Served approximately
16,000
clients and co-employed
Average WSEs
of approximately
314,000
, a
3%
decrease
in
Average WSEs
compared to the same period in
2017
and
|
|
•
|
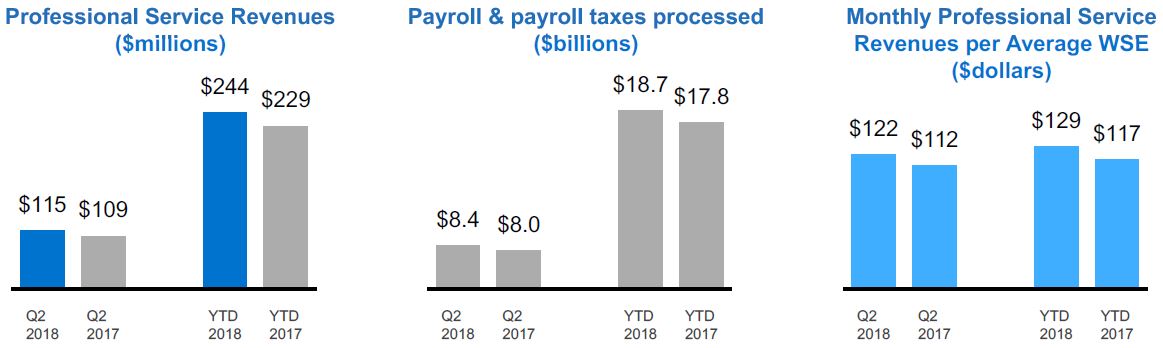
Processed approximately
$8.4 billion
in payroll and payroll tax payments for our clients, an increase of
5%
over the same period in
2017
.
|
Our financial highlights for the
second
quarter of
2018
, compared to the same period in
2017
, include:
|
•
|
Total revenues
increased
6%
to
$850 million
and
Net Service Revenues
increased
10%
to
$220 million
,
|
|
•
|
Operating income
increased
34%
to
$76 million
,
|
|
•
|
Our
effective income tax rate
decreased to
19%
,
|
|
•
|
Net income
increased
45%
to
$58 million
, or
$0.80
per diluted share and
Adjusted Net Income
increased
73%
to
$63 million
, and
|
|
•
|
Adjusted EBITDA
increased
36%
to
$99 million
.
|
YTD
2018
During the first half of
2018
, we:
|
•
|
Co-employed
Average WSEs
of approximately
314,000
, a
4%
decrease
in
Average WSEs
compared to the same period in
2017
and
|
|
•
|
Processed approximately
$18.7 billion
in payroll and payroll tax payments for our clients, an increase of
5%
over the same period in
2017
.
|
Our financial highlights for the first half of
2018
, compared to the same period in
2017
, include:
|
•
|
Total revenues
increased
6%
to
$1.7 billion
and
Net Service Revenues
increased
10%
to
$440 million
,
|
|
•
|
Operating income
increased
38%
to
$147 million
,
|
|
•
|
Our
effective income tax rate
decreased to
19%
,
|
|
•
|
Net income
increased
63%
to
$112 million
, or
$1.55
per diluted share and
Adjusted Net Income
increased
78%
to
$121 million
, and
|
|
•
|
Adjusted EBITDA
increased
40%
to
$190 million
.
|
|
MANAGEMENT'S DISCUSSION AND ANALYSIS
|
|
Key Financial and Operating Metrics
The following key financial and operating metrics should be read in conjunction with our condensed consolidated financial statements and related notes included in this Form 10-Q.
|
Three Months Ended June 30,
|
Six Months Ended June 30,
|
||||||||||||||||||||||
|
(in millions, except per share and WSE data)
|
2018
|
2017
|
% Change
|
2018
|
2017
|
% Change
|
|||||||||||||||||
|
Income Statement Data:
|
|||||||||||||||||||||||
|
Total revenues
|
$
|
850
|
|
$
|
801
|
|
6
|
%
|
$
|
1,711
|
|
$
|
1,608
|
|
6
|
%
|
|||||||
|
Operating income
|
76
|
|
57
|
|
34
|
|
147
|
|
106
|
|
38
|
|
|||||||||||
|
Net income
|
58
|
|
40
|
|
45
|
|
112
|
|
69
|
|
63
|
|
|||||||||||
|
Diluted net income per share of common stock
|
0.80
|
|
0.56
|
|
43
|
|
1.55
|
|
0.97
|
|
60
|
|
|||||||||||
|
Non-GAAP measures
(1)
:
|
|||||||||||||||||||||||
|
Net Service Revenues
|
220
|
|
201
|
|
10
|
|
440
|
|
400
|
|
10
|
|
|||||||||||
|
Net Insurance Service Revenues
|
105
|
|
92
|
|
14
|
|
196
|
|
171
|
|
15
|
|
|||||||||||
|
Adjusted EBITDA
|
99
|
|
72
|
|
36
|
|
190
|
|
137
|
|
40
|
|
|||||||||||
|
Adjusted Net Income
|
63
|
|
37
|
|
73
|
|
121
|
|
68
|
|
78
|
|
|||||||||||
|
Operating Metrics:
|
|||||||||||||||||||||||
|
Total WSEs payroll and payroll taxes processed
|
$
|
8,371
|
|
$
|
7,958
|
|
5
|
%
|
$
|
18,690
|
|
$
|
17,774
|
|
5
|
%
|
|||||||
|
Average WSEs
|
313,845
|
|
324,194
|
|
(3
|
)
|
314,203
|
|
325,999
|
|
(4
|
)
|
|||||||||||
|
(1)
|
Refer to Non-GAAP Financial Measures section below for definitions and reconciliations from GAAP measures.
|
|
Six Months Ended June 30,
|
%
|
||||||||||
|
(in millions, except operating metrics data)
|
2018
|
2017
|
Change
|
||||||||
|
Operating Metrics:
|
|||||||||||
|
Total WSEs at period end
|
318,921
|
|
329,095
|
|
(3
|
)
|
%
|
||||
|
Cash Flow Data:
|
|||||||||||
|
Net cash used in operating activities
(1)
|
$
|
(543
|
)
|
$
|
(204
|
)
|
167
|
|
|||
|
Net cash used in investing activities
|
(166
|
)
|
(9
|
)
|
1,682
|
|
|||||
|
Net cash used in financing activities
|
(36
|
)
|
(45
|
)
|
(22
|
)
|
|||||
|
(1)
|
Prior year balance has been retrospectively adjusted for Accounting Standards Update (ASU) 2016-18.
|
|
(in millions)
|
June 30,
2018 |
December 31,
2017 |
% Change
|
||||||||
|
Balance Sheet Data:
|
|||||||||||
|
Cash and cash equivalents
|
$
|
202
|
|
$
|
336
|
|
(40
|
)
|
%
|
||
|
Working capital
|
188
|
|
234
|
|
(20
|
)
|
|||||
|
Total assets
|
2,015
|
|
2,593
|
|
(22
|
)
|
|||||
|
Notes and capital leases payable
|
423
|
|
423
|
|
—
|
|
|||||
|
Total liabilities
|
1,706
|
|
2,387
|
|
(29
|
)
|
|||||
|
Total stockholders’ equity
|
309
|
|
206
|
|
50
|
|
|||||
Non-GAAP Financial Measures
In addition to financial measures presented in accordance with GAAP, we monitor other non-GAAP financial measures that we use to manage our business, to make planning decisions, to allocate resources, and to use as performance measures in our executive compensation plan. These key financial measures provide an additional view of our operational performance over the long-term and provide useful information that we use in order to maintain and grow our business.
The presentation of these non-GAAP financial measures is used to enhance the understanding of certain aspects of our financial performance. It is not meant to be considered in isolation from, superior to, or as a substitute, for the directly comparable financial measures prepared in accordance with GAAP.
|
MANAGEMENT'S DISCUSSION AND ANALYSIS
|
|
|
Non-GAAP Measure
|
Definition
|
How We Use The Measure
|
|
Net Service Revenues
|
• Sum of professional service revenues and Net Insurance Service Revenues, or total revenues less insurance costs.
|
• Provides a comparable basis of revenues on a net basis. Professional service revenues are represented net of client payroll costs whereas insurance service revenues are presented gross of insurance costs for financial reporting purposes.
• Acts as the basis to allocate resources to different functions and evaluates the effectiveness of our business strategies by each business function.
• Provides a measure, among others, used in the determination of incentive compensation for management.
|
|
Net Insurance Service Revenues
|
• Insurance revenues less insurance costs.
|
• Is a component of Net Service Revenues.
• Provides a comparable basis of revenues on a net basis. Professional service revenues are represented net of client payroll costs whereas insurance service revenues are presented gross of insurance costs for financial reporting purposes. Promotes an understanding of our insurance services business by evaluating insurance service revenues net of our WSE related costs which are substantially pass-through for the benefit of our WSEs. Under GAAP, insurance service revenues and costs are recorded gross as we have latitude in establishing the price, service and supplier specifications.
• We also sometimes refer to Net Insurance Service Margin, which is the ratio of Net Insurance Revenue to Insurance Service Revenue.
|
|
Adjusted EBITDA
|
• Net income, excluding the effects of:
- income tax provision,
- interest expense,
- depreciation,
- amortization of intangible assets, and
- stock-based compensation expense.
|
• Provides period-to-period comparisons on a consistent basis and an understanding as to how our management evaluates the effectiveness of our business strategies by excluding certain non-cash charges such as depreciation and amortization, and stock-based compensation recognized based on the estimated fair values. We believe these charges are not directly resulting from our core operations or indicative of our ongoing operations.
• Enhances comparisons to prior periods and, accordingly, facilitates the development of future projections and earnings growth prospects.
• Provides a measure, among others, used in the determination of incentive compensation for management.
• We also sometimes refer to Adjusted EBITDA margin, which is the ratio of Adjusted EBITDA to Net Service Revenue.
|
|
Adjusted Net Income
|
• Net income, excluding the effects of:
- effective income tax rate
(1)
,
- stock-based compensation,
- amortization of intangible assets,
- non-cash interest expense
(2)
, and
- the income tax effect (at our effective tax rate
(1)
) of these pre-tax adjustments.
|
• Provides information to our stockholders and board of directors to understand how our management evaluates our business, to monitor and evaluate our operating results, and analyze profitability of our ongoing operations and trends on a consistent basis by excluding certain non-cash charges.
|
|
(1)
|
We have adjusted the non-GAAP effective tax rate to
26%
for
2018
from
41%
for
2017
due primarily to a decrease in the statutory rate from 35% to 21%. These non-GAAP effective tax rates exclude the income tax impact from stock-based compensation, changes in uncertain tax positions, and nonrecurring benefits or expenses from federal legislative changes.
|
|
(2)
|
Non-cash interest expense represents amortization and write-off of our debt issuance costs.
|
|
MANAGEMENT'S DISCUSSION AND ANALYSIS
|
|
Reconciliation of GAAP to Non-GAAP Measures
The table below presents a reconciliation of Total revenues to Net Service Revenues:
|
Three Months Ended
June 30, |
Six Months Ended June 30,
|
||||||||||||
|
(in millions)
|
2018
|
2017
|
2018
|
2017
|
|||||||||
|
Total revenues
|
$
|
850
|
|
$
|
801
|
|
$
|
1,711
|
|
$
|
1,608
|
|
|
|
Less: Insurance costs
|
630
|
|
600
|
|
1,271
|
|
1,208
|
|
|||||
|
Net Service Revenues
|
$
|
220
|
|
$
|
201
|
|
$
|
440
|
|
$
|
400
|
|
|
The table below presents a reconciliation of Insurance service revenues to Net Insurance Service Revenues:
|
Three Months Ended
June 30, |
Six Months Ended
June 30, |
||||||||||||
|
(in millions)
|
2018
|
2017
|
2018
|
2017
|
|||||||||
|
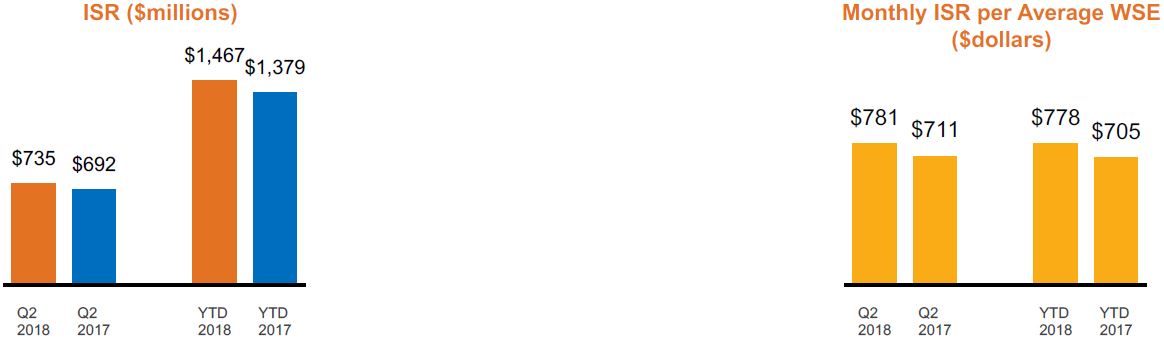
Insurance service revenues
|
$
|
735
|
|
$
|
692
|
|
$
|
1,467
|
|
$
|
1,379
|
|
|
|
Less: Insurance costs
|
630
|
|
600
|
|
1,271
|
|
1,208
|
|
|||||
|
Net Insurance Service Revenues
|
$
|
105
|
|
$
|
92
|
|
$
|
196
|
|
$
|
171
|
|
|
|
Net Insurance Service Revenue Margin
|
14
|
%
|
13
|
%
|
13
|
%
|
12
|
%
|
|||||
The table below presents a reconciliation of Net income to Adjusted EBITDA:
|
Three Months Ended
June 30, |
Six Months Ended
June 30, |
||||||||||||
|
(in millions)
|
2018
|
2017
|
2018
|
2017
|
|||||||||
|
Net income
|
$
|
58
|
|
$
|
40
|
|
$
|
112
|
|
$
|
69
|
|
|
|
Provision for income taxes
|
14
|
|
12
|
|
27
|
|
28
|
|
|||||
|
Stock-based compensation
|
10
|
|
8
|
|
19
|
|
14
|
|
|||||
|
Interest expense and bank fees
|
7
|
|
5
|
|
13
|
|
10
|
|
|||||
|
Depreciation
|
8
|
|
6
|
|
16
|
|
13
|
|
|||||
|
Amortization of intangible assets
|
2
|
|
1
|
|
3
|
|
3
|
|
|||||
|
Adjusted EBITDA
|
$
|
99
|
|
$
|
72
|
|
$
|
190
|
|
$
|
137
|
|
|
|
Adjusted EBITDA Margin
|
45
|
%
|
36
|
%
|
43
|
%
|
34
|
%
|
|||||
The table below presents a reconciliation of Net income to Adjusted Net Income:
|
Three Months Ended
June 30, |
Six Months Ended
June 30, |
||||||||||||
|
(in millions)
|
2018
|
2017
|
2018
|
2017
|
|||||||||
|
Net income
|
$
|
58
|
|
40
|
|
$
|
112
|
|
69
|
|
|||
|
Effective income tax rate adjustment
|
(6
|
)
|
(9
|
)
|
(10
|
)
|
(11
|
)
|
|||||
|
Stock-based compensation
|
10
|
|
8
|
|
19
|
|
14
|
|
|||||
|
Amortization of intangible assets
|
2
|
|
1
|
|
3
|
|
3
|
|
|||||
|
Non-cash interest expense
|
3
|
|
1
|
|
4
|
|
1
|
|
|||||
|
Income tax impact of pre-tax adjustments
|
(4
|
)
|
(4
|
)
|
(7
|
)
|
(8
|
)
|
|||||
|
Adjusted Net Income
|
$
|
63
|
|
$
|
37
|
|
$
|
121
|
|
$
|
68
|
|
|
|
MANAGEMENT'S DISCUSSION AND ANALYSIS
|
|
Results of Operations
Operating Metrics
Worksite Employees (WSE)
Average WSE growth is a volume measure we use to monitor the performance of our business. Average WSEs decreased
3%
in the
second
quarter of
2018
and decreased
4%
in the first half of 2018, compared to the same periods in 2017. The declines in the Average WSE during the second quarter and first half of 2018 compared to the same periods in 2017 were the result of attrition, including attrition from migrating certain of our clients to our common platform, partially offset by WSE growth due to new sales and strong hirings within our installed base.
Total WSE, defined as WSEs paid at period end, comparisons have served as an indicator of our success in growing our business and retaining clients. Anticipated revenues for future periods can diverge from Total WSEs due to pricing differences across our HR solutions and insurance service offerings and the degree to which clients and WSEs elect to participate in our solutions.
|
MANAGEMENT'S DISCUSSION AND ANALYSIS
|
|
Revenues and Income
Our revenues consist of professional service revenues (PSR) and insurance service revenues (ISR). PSR represent fees charged to clients for processing payroll-related transactions on behalf of our clients, access to our HR expertise, employment and benefit law compliance services and other HR-related services. ISR consist of insurance-related billings and administrative fees collected from clients and withheld from WSEs for workers' compensation insurance and health benefit insurance plans provided by third-party insurance carriers.
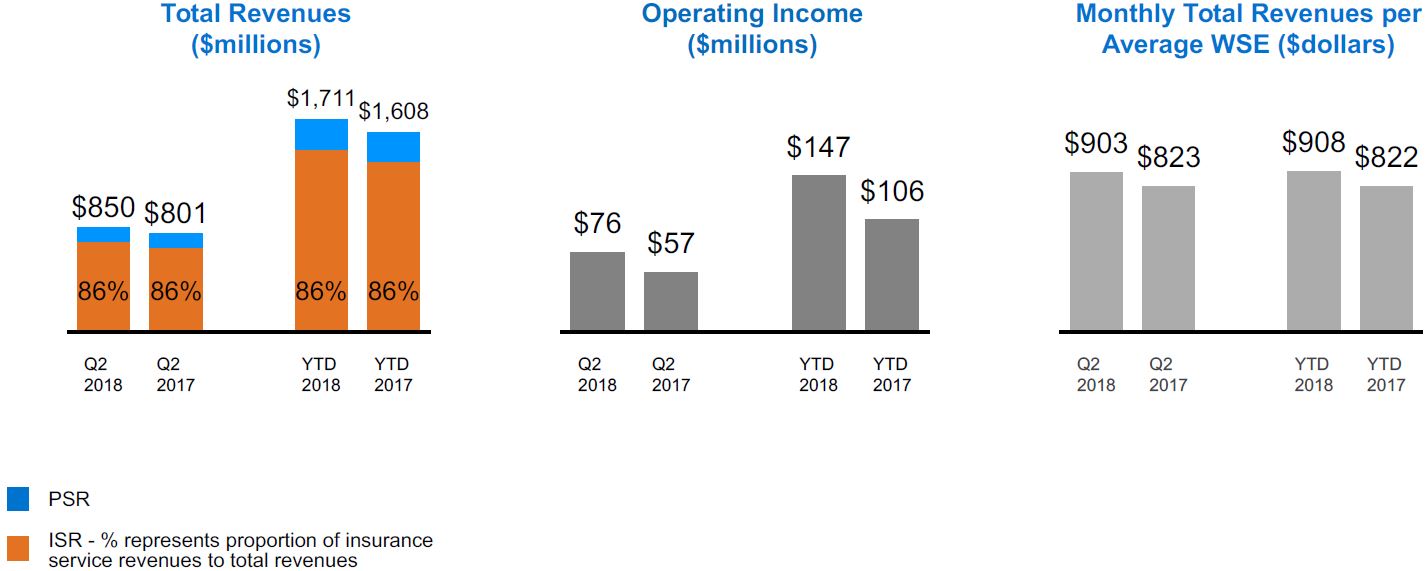
In addition to focusing on growing our Average WSE and Total WSE counts, we also focus on pricing strategies and product differentiation to expand our revenue opportunities. Monthly total revenues per Average WSE, as a measure to monitor the success of such strategies, increased
10%
in both the
second
quarter of
2018
and first half of 2018 compared to the same periods in
2017
.
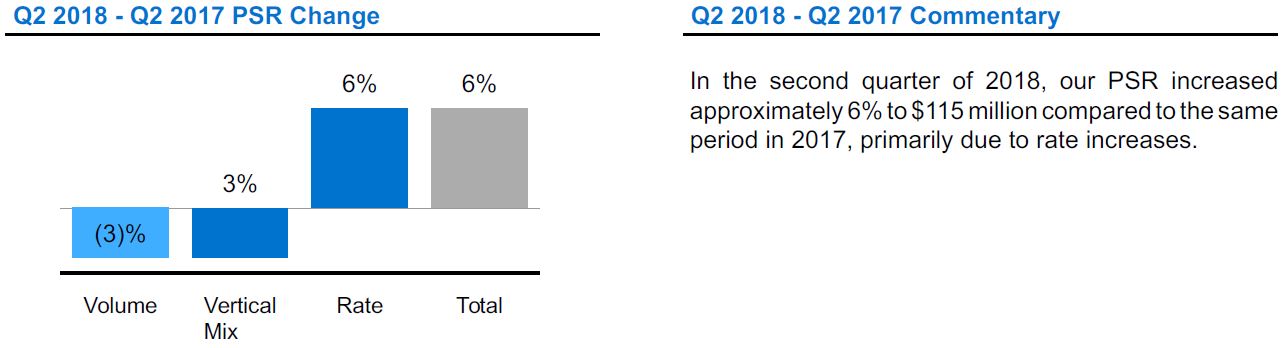
Q2
2018
-
Q2
2017
Commentary
Total revenues
were
$850 million
for the
second
quarter of
2018
, a
6%
increase
compared to the same period in
2017
.
|
•
|
ISR
increased
6%
compared to the same quarter in
2017
to
$735 million
due primarily to increased participation in our health plans, partially offset by a decline in Average WSEs.
|
|
•
|
PSR
increased
6%
compared to the same quarter in
2017
to
$115 million
due primarily to rate increases.
|
Operating income
was
$76 million
in the second quarter of 2018,
up
34%
from the
second
quarter of
2017
, primarily due to improvement in our ISR as noted above, partially offset by an increase insurance costs.
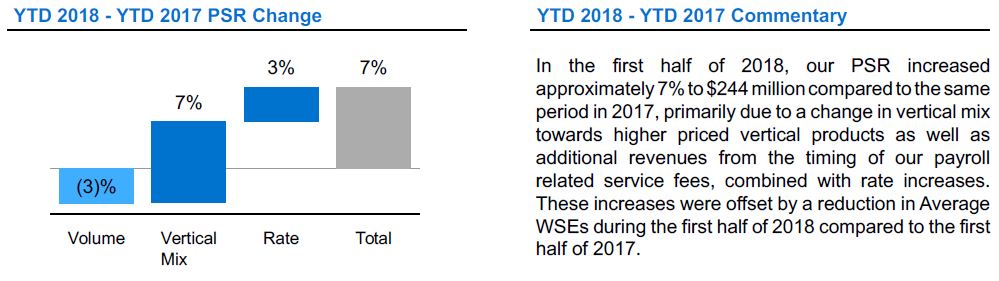
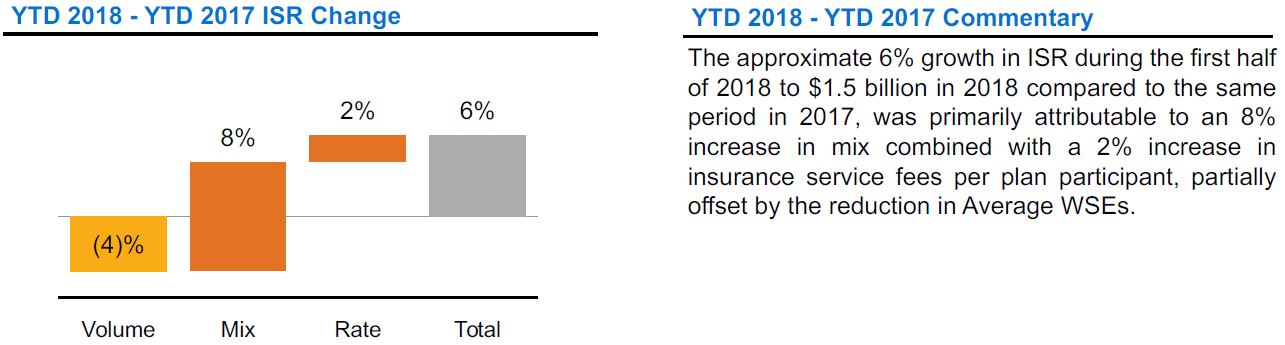
YTD
2018
-
YTD
2017
Commentary
Total revenues
were
$1.7 billion
for the
first
half of
2018
, a
6%
increase
compared to the same period in
2017
.
|
•
|
ISR
increased
6%
compared to the same period in
2017
to
$1.5 billion
due primarily to increased participation in our health plans, partially offset by a decline in Average WSEs.
|
|
•
|
PSR
increased
7%
compared to the same period in
2017
to
$244 million
due primarily to a change in mix towards higher priced vertical products.
|
Operating income
was
$147 million
, in the first half of 2018,
up
38%
from the
first
half of
2017
, primarily due to improvement in our insurance service revenues as noted above, partially offset by an increase in insurance costs.
|
MANAGEMENT'S DISCUSSION AND ANALYSIS
|
|
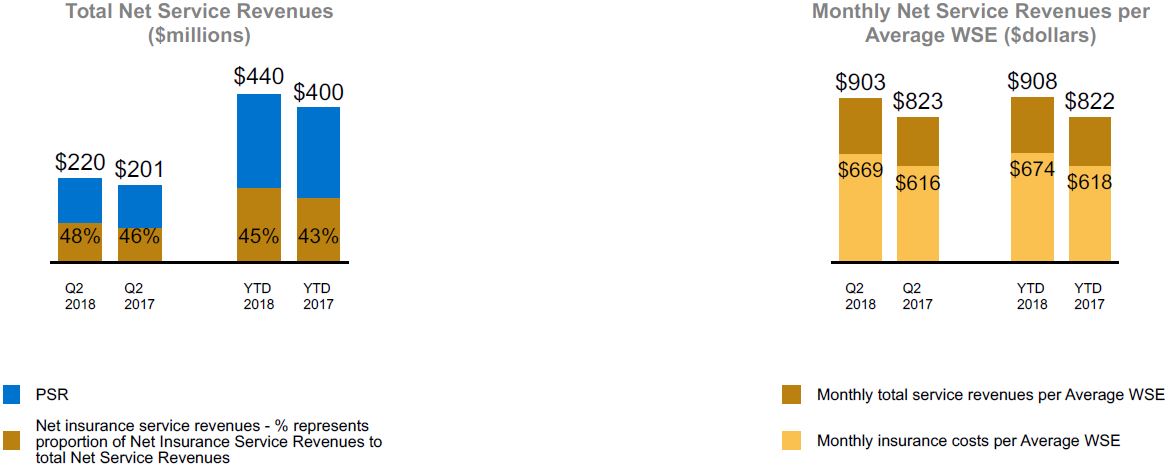
Net Service Revenues
Net Service Revenues (total revenues less insurance costs) provide a comparable basis of revenues on a net basis, act as the basis to allocate resources to different functions, and help us evaluate the effectiveness of our business strategies by each business function.
Q2
2018
-
Q2
2017
Commentary
Net Service Revenues
were
$220 million
for the
second
quarter of
2018
, representing a
10%
increase
from the same period in
2017
. This increase is primarily due to an increase in Net Insurance Service Revenues due to changes in the composition of our enrolled WSEs within our insurance offerings (ISR mix) partially offset by health plan participation costs (insurance cost mix). Additionally, Monthly Net Service Revenues per Average WSE
increased
over the same period in
2017
.
YTD
2018
-
YTD
2017
Commentary
Net Service Revenues
were
$440 million
for the
first
half of
2018
, representing a
10%
increase
from the same period in
2017
. This increase is primarily due to an increase in Net Insurance Service Revenues due to changes in the composition of our enrolled WSEs within our insurance offerings (ISR mix) partially offset by health plan participation costs (insurance cost mix). Additionally, Monthly Net Service Revenues per Average WSE
increased
over the same period in
2017
.
|
MANAGEMENT'S DISCUSSION AND ANALYSIS
|
|
Professional Service Revenues (PSR)
Our clients are billed either based on a fee per WSE per month per transaction or on a percentage of the WSEs’ payroll. For those clients that are billed on a percentage of WSEs' payroll, as our clients' payrolls increase, our fees also increase. As such, payroll and payroll taxes processed may also be an indicator of our PSR growth.
Our investment in a vertical approach provides us the flexibility to offer our clients in different industries with varied services at different prices. We believe that this vertical approach will improve our ability to retain our customers, and potentially reduce the value of using WSEs as the only leading indicator of future revenue performance.
We present the percentage changes in PSR using the following measures:
|
•
|
Volume - the percentage change in period over period Average WSEs,
|
|
•
|
Rate - the percentage changes in prices for each vertical, and
|
|
•
|
Mix - the change in composition of Average WSEs within our verticals.
|
|
MANAGEMENT'S DISCUSSION AND ANALYSIS
|
|
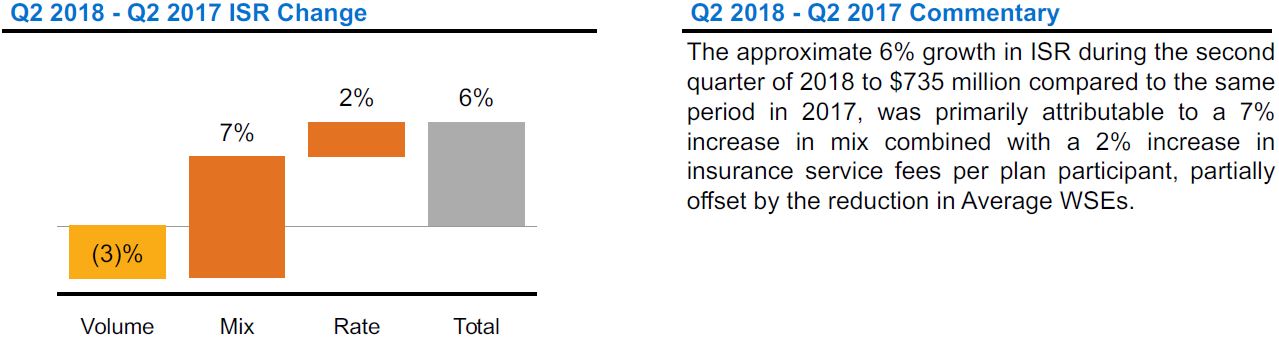
Insurance Service Revenues (ISR)
ISR consists of insurance services-related billings and administrative fees collected from clients and withheld from WSE payroll for health benefits and workers' compensation insurance provided by third-party insurance carriers.
We present the percentage changes in ISR using the following measures:
|
•
|
Volume - the percentage change in period over period Average WSEs,
|
|
•
|
Rate - the percentage changes in prices associated with each of our insurance service offerings, and
|
|
•
|
Mix - all other changes including the composition of our enrolled WSEs within our insurance service offerings.
|
|
MANAGEMENT'S DISCUSSION AND ANALYSIS
|
|
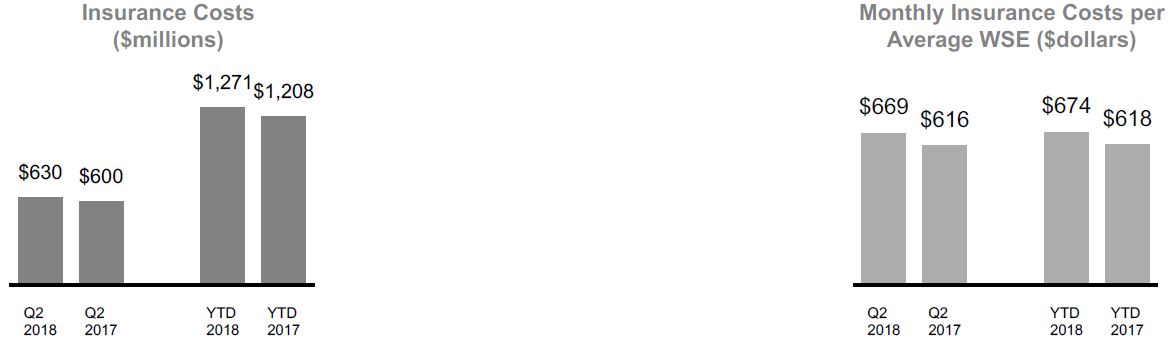
Insurance Costs
Insurance costs include insurance premiums for coverage provided by insurance carriers, reimbursement of claims payments made by insurance carriers or third-party administrators, and changes in loss reserves related to contractual obligations with our workers' compensation and health benefit carriers.
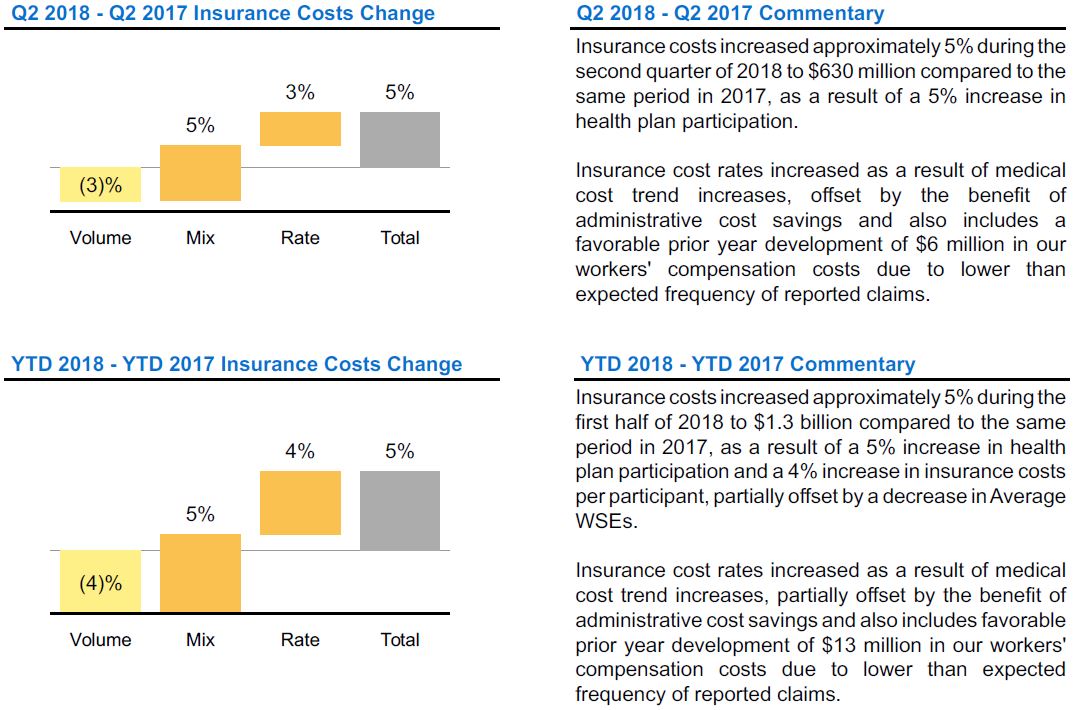
We present the percentage changes in insurance costs using the following measures:
|
•
|
Volume - the percentage change in period over period Average WSEs,
|
|
•
|
Rate - the percentage changes in cost trend associated with our each of our insurance service offerings, and
|
|
•
|
Mix - all other changes including the composition of our enrolled WSEs within our insurance offerings.
|
Insurance costs as a percentage of ISR was
86%
in the
second
quarter of
2018
, consistent with the
second
quarter of
2017
and 87% in the first half of 2018 compared to 88% in the same period of 2017.
|
MANAGEMENT'S DISCUSSION AND ANALYSIS
|
|
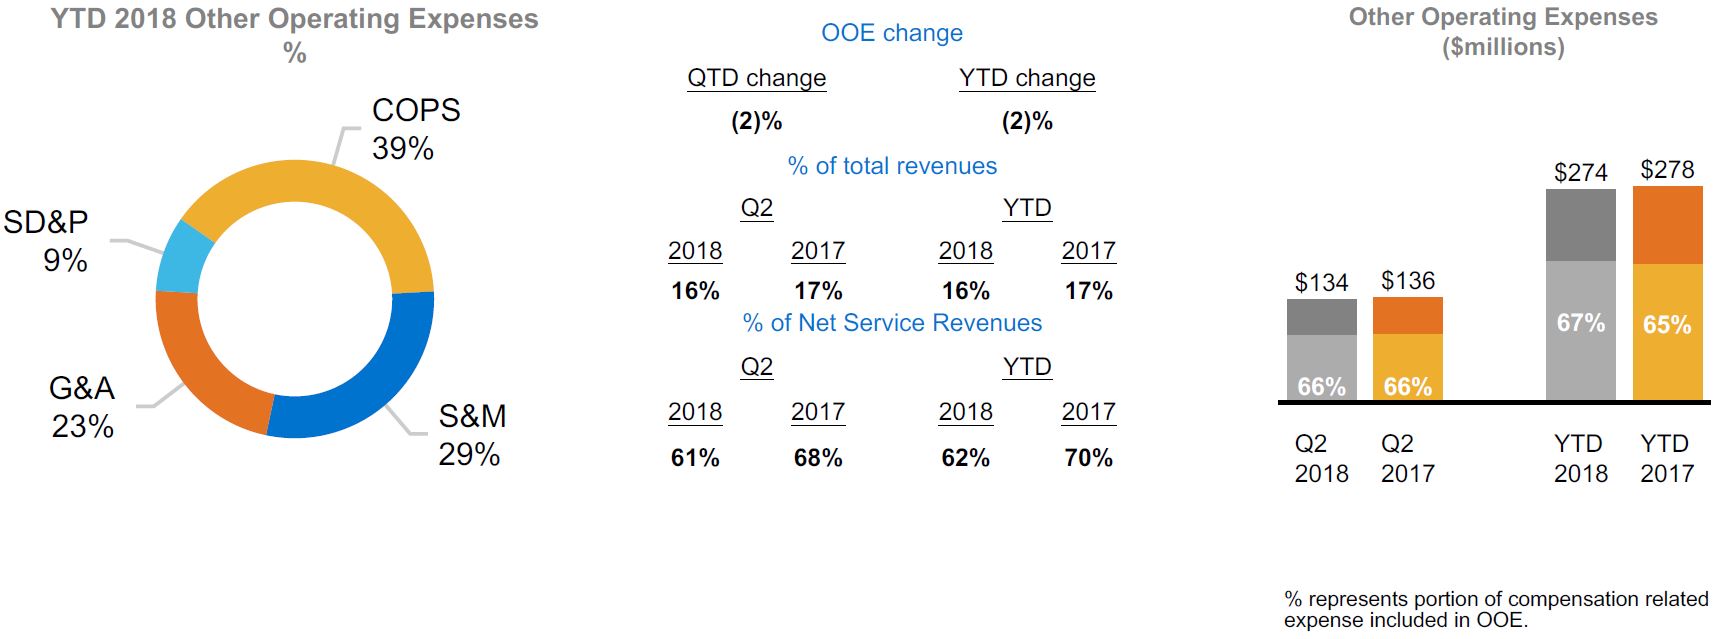
Other Operating Expenses (OOE)
Other operating expenses includes cost of providing services (COPS), sales and marketing (S&M), general and administrative (G&A), and systems development and programming (SD&P) expenses. Other operating expenses excludes depreciation and amortization expenses.
We manage and monitor our other operating expenses and allocate resources across different business functions based on OOE as a percentage of Net Service Revenues which
decreased
to
61%
in the
second
quarter of
2018
from
68%
in the same period in
2017
and
decreased
to
62%
in the
first
half of
2018
from
70%
in the same period in
2017
.
At
June 30, 2018
, we had approximately
2,800
corporate employees in
48
offices across the United States. Our corporate employees' compensation related expenses represent the majority of our operating expenses. Compensation costs for our corporate employees include payroll, payroll taxes, stock-based compensation, bonuses, commissions and other payroll and benefits related costs.
The percentage of compensation related expenses to OOE was
66%
in the
second
quarter of
2018
and
2017
, and increased to
67%
in the first half of 2018 from
65%
in the first half of 2017. The increase in the first half of the 2018 when compared to the same period in 2017 is due to decreased consulting costs associated with compliance initiatives and internal control remediation efforts.
We expect our OOE to increase in the foreseeable future due to expected growth, our continued strategy to develop new vertical products, continued platform integrations, and additional costs associated with our continued efforts to improve our systems, processes, and internal controls. These expenses may fluctuate as a percentage of our total revenues from period-to-period depending on the timing of when expenses are incurred.
|
MANAGEMENT'S DISCUSSION AND ANALYSIS
|
|
Q2 2018
-
Q2 2017
Commentary
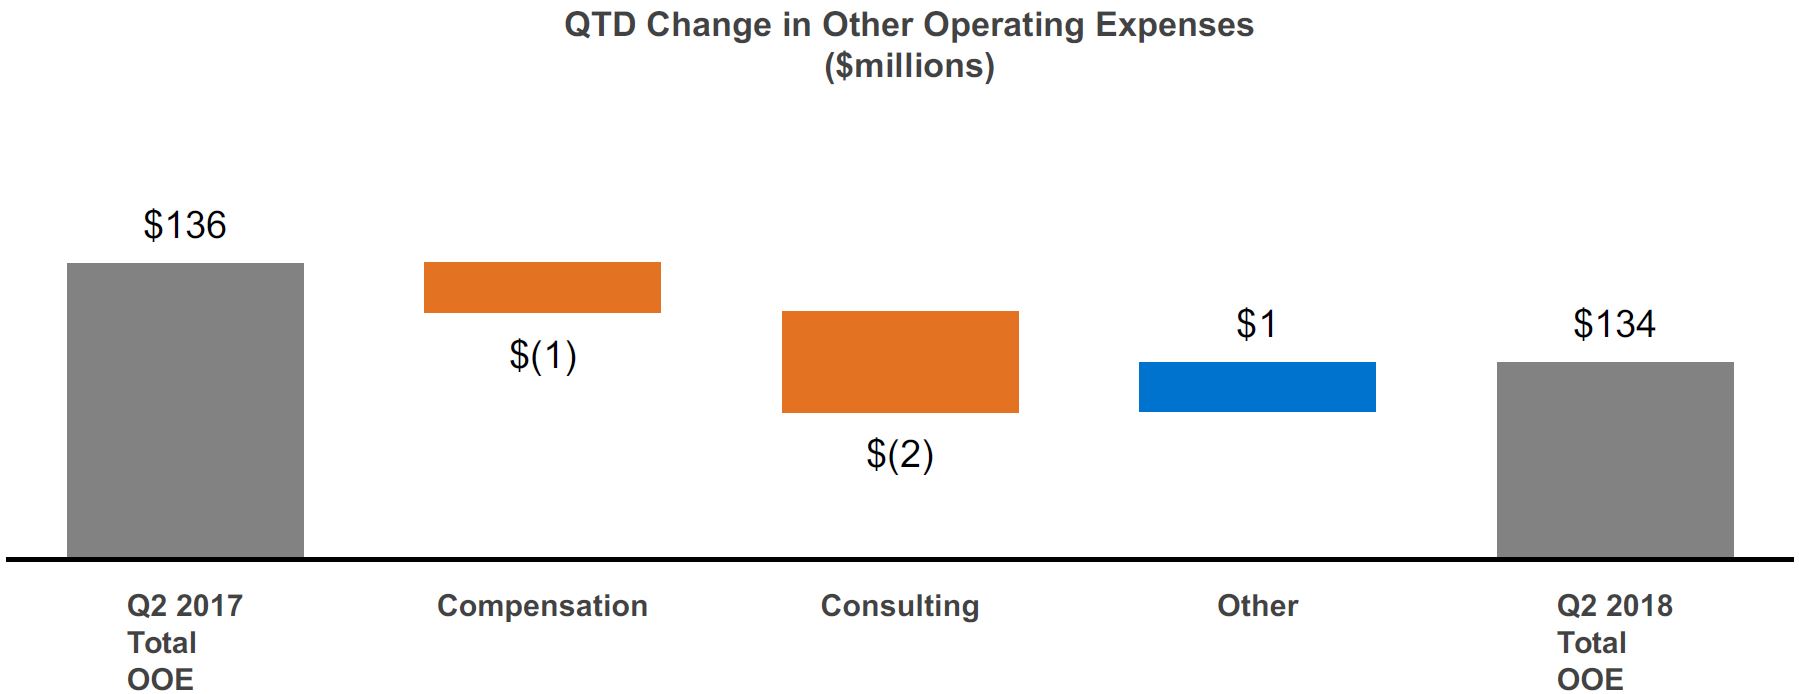
Other operating expenses in the
second
quarter of
2018
remained consistent with the same period in
2017
. Specific costs varied as follows:
|
•
|
Total compensation costs
decreased
$1 million
, or
1%
, primarily due to a:
|
|
▪
|
decrease of $6 million in commission expense with the adoption of ASC Topic 606 in the first quarter of 2018. Refer to Note 1 in Item 1 of this Form 10-Q for additional details surrounding the impact of this adoption,
|
|
▪
|
partially offset by a $5 million increase driven by increased headcount to support operational and compliance requirements,
|
|
•
|
Consulting expenses
decreased
$2 million
primarily due to a decrease in costs associated with payroll tax compliance initiatives.
|
|
MANAGEMENT'S DISCUSSION AND ANALYSIS
|
|
YTD
2018
-
YTD
2017
Commentary
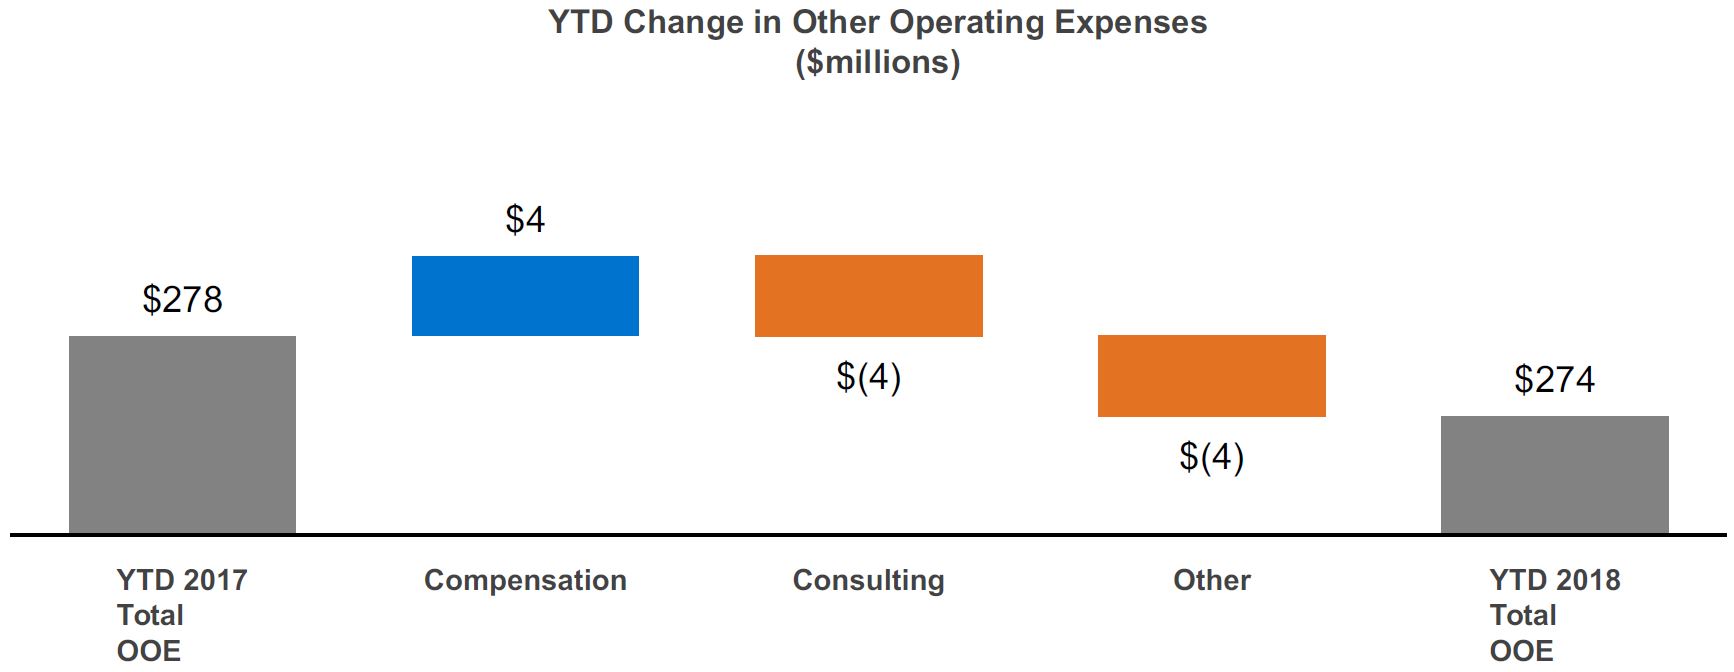
Other operating expenses in the
first
half of
2018
remained consistent with the same period in
2017
. Specific costs varied as follows:
|
•
|
Total compensation costs
increased
$4 million
, or
2%
, primarily due to a:
|
|
▪
|
$19 million increase primarily associated with client services and information technology to support the growth and migration of clients to our common TriNet platform and headcount increase as a result of increased operational and compliance requirements,
|
|
▪
|
partially offset by a decrease of $15 million in commission expense with the adoption of ASC Topic 606 in the first quarter of 2018. Refer to Note 1 in Item 1 of this Form 10-Q for additional details surrounding the impact of this adoption.
|
|
•
|
Consulting expenses
decreased
$4 million
primarily due to a decrease in costs associated with payroll tax compliance initiatives.
|
|
•
|
Other expenses
decreased
$4 million
primarily due to compliance costs (including SOX costs), partially offset by an increase in recruiting.
|
|
MANAGEMENT'S DISCUSSION AND ANALYSIS
|
|
Other Income (Expense)
Other income (expense) in the second quarter and the first half of 2018 remained consistent with the same periods in 2017. Specific income (expense) items for the second quarter and first half of 2018 varied as follows:
|
•
|
Interest and dividend income increased $3 million primarily due to an increase in yields on our interest-bearing assets.
|
|
•
|
Partially offset by a $2 million increase in interest expense associated with the write-off of debt issuance costs related to the refinancing of our previous term loans.
|
Provision for Income Taxes
Our effective income tax rate was
19%
and
24%
for the three months ended
June 30, 2018
and
2017
, respectively, and
19%
and
29%
for the six months ended
June 30, 2018
and
2017
, respectively. The decreases consisted of tax benefits recognized from excess tax benefits related to stock-based compensation, an increase in excludable income for state income tax purposes and a reduction of the federal corporate income tax rate from 35% to 21% pursuant to the Tax Cuts and Jobs Act (TCJA) for the three months and six months ended
June 30, 2018
, as compared to the same periods in
2017
.
Liquidity and Capital Resources
Liquidity
We report our liquidity separately between assets and liabilities that are WSE-related and our corporate assets and liabilities. We believe that we have sufficient liquidity and capital resources to satisfy future requirements and meet our obligations to our clients, creditors and debt holders. Our liquid assets are as follows:
|
June 30, 2018
|
December 31, 2017
|
|||||||||||||||||
|
(in millions)
|
Corporate
|
WSE
|
Total
|
Corporate
|
WSE
|
Total
|
||||||||||||
|
Current assets
|
||||||||||||||||||
|
WSE-related assets
|
$
|
—
|
|
$
|
352
|
|
$
|
352
|
|
$
|
—
|
|
$
|
360
|
|
$
|
360
|
|
|
Cash and cash equivalents
|
202
|
|
—
|
|
202
|
|
336
|
|
—
|
|
336
|
|
||||||
|
Restricted cash, cash equivalents and investments
|
15
|
|
614
|
|
629
|
|
15
|
|
1,265
|
|
1,280
|
|
||||||
|
All other current assets
|
66
|
|
—
|
|
66
|
|
15
|
|
—
|
|
15
|
|
||||||
|
Current assets
|
$
|
283
|
|
$
|
966
|
|
$
|
1,249
|
|
$
|
366
|
|
$
|
1,625
|
|
$
|
1,991
|
|
|
Current liabilities
|
||||||||||||||||||
|
WSE-related liabilities
|
$
|
—
|
|
$
|
966
|
|
$
|
966
|
|
$
|
—
|
|
$
|
1,618
|
|
$
|
1,618
|
|
|
All other current liabilities
|
95
|
|
—
|
|
95
|
|
139
|
|
—
|
|
139
|
|
||||||
|
Current liabilities
|
$
|
95
|
|
$
|
966
|
|
$
|
1,061
|
|
$
|
139
|
|
$
|
1,618
|
|
$
|
1,757
|
|
|
Working capital
|
$
|
188
|
|
$
|
—
|
|
$
|
188
|
|
$
|
227
|
|
$
|
7
|
|
$
|
234
|
|
Working capital for WSE-related assets and liabilities
We present our WSE-related assets and liabilities separately from our corporate assets and liabilities on our condensed consolidated balance sheets to better distinguish those assets and liabilities held by us to cover WSE-related obligations. WSE-related assets and liabilities primarily consist of current assets and current liabilities, respectively, resulting from transactions directly or indirectly associated with WSEs, including payroll and related taxes and withholdings, our sponsored insurance programs, and other benefit programs.
We designate funds to ensure that we have adequate current assets to satisfy our current WSE-related obligations. We manage our WSE payroll and benefits obligations through collections of payments from our clients which generally occurs two to three days in advance of the client's payroll date. We regularly review our short-term WSE-related obligations (such as payroll and related taxes, insurance premium and claim payments) and designate funds required to fulfill these short-term obligations, which we refer to as payroll funds collected (PFC). PFC is included in current assets as restricted cash, cash equivalents and investments in our condensed consolidated financial statements.
|
MANAGEMENT'S DISCUSSION AND ANALYSIS
|
|
We manage our sponsored benefit and workers' compensation insurance obligations by maintaining collateral funds in restricted cash, cash equivalents and investments. These collateral amounts are generally determined at the beginning of each plan year and we may be required by our insurance carriers to adjust the balance when facts and circumstances change. We regularly review our collateral balances with our insurance carriers, and anticipate funding further collateral based upon our capital requirements. We classify our restricted cash, cash equivalents and investments as current and noncurrent assets to match against the anticipated payment of claims.
Working capital for corporate purposes
We use the remaining available cash and cash equivalents and cash from operations to satisfy our operational and regulatory requirements and to fund capital expenditures. We believe that our existing corporate cash and cash equivalents and positive working capital will be sufficient to meet our working capital and capital expenditure needs for at least the next 12 months. Corporate working capital as of
June 30, 2018
decreased by
$39 million
from
December 31, 2017
, largely driven by increased investing activity. During the six-months ended
June 30, 2018
, we invested approximately
$162 million
of available cash in available-for-sale securities, a majority of which are classified as long-term assets. This decrease is partially offset by the timing of payments for corporate obligations.
Capital Resources
Sources of Funds
We believe that we can meet our present and reasonably foreseeable operating cash needs and future commitments through existing liquid assets, continuing cash flows from operations, our borrowing capacity under our revolving credit facility and the potential issuance of debt or equity securities through our filed shelf registration statement.
In June 2018 we refinanced approximately $415 million of, and repaid in full, our outstanding A and A-2 term loans (together, our 2014 Term Loans) under our previous credit agreement (our 2014 Credit Agreement). Our 2014 Term Loans were replaced with a $425 million term loan A (our 2018 Term Loan) under our new credit agreement (our 2018 Credit Agreement). We also replaced our previous $75 million revolving credit facility established under our 2014 Credit Agreement with a
$250 million
revolving credit facility under our 2018 Credit Agreement (our 2018 Revolver), which will be used solely for working capital and other general corporate purposes.
Each of our 2018 Term Loan and our 2018 Revolver mature in June 2023 and bear interest, at our option, either at a LIBOR rate, or the prime lending rate, plus an applicable margin subject to change in the future based on our leverage ratio, as set forth in our 2018 Credit Agreement. As of June 30, 2018, $425 million was outstanding under our 2018 Term Loan at and the full amount of our 2018 Revolver, less approximately $16 million representing an undrawn letter of credit, was available.
|
MANAGEMENT'S DISCUSSION AND ANALYSIS
|
|
Cash Flows
In January 2018, we adopted ASU 2016-18 Statement of Cash Flows
(Topic 230): Restricted Cash,
which significantly impacted our net cash provided by (used in) operating activities as changes in our restricted cash and cash equivalents balances are no longer included within operating cash activities.
The following table presents our cash flow activities for the stated periods:
|
|
Six Months Ended
June 30, |
|||||||||||||||||
|
(in millions)
|
2018
|
2017
|
||||||||||||||||
|
Corporate
|
WSE
|
Total
|
Corporate
|
WSE
|
Total
|
|||||||||||||
|
Net cash provided by (used in):
|
|
|
||||||||||||||||
|
Operating activities
(1)
|
$
|
108
|
|
$
|
(651
|
)
|
$
|
(543
|
)
|
$
|
137
|
|
$
|
(341
|
)
|
$
|
(204
|
)
|
|
Investing activities
|
(166
|
)
|
—
|
|
(166
|
)
|
(9
|
)
|
—
|
|
(9
|
)
|
||||||
|
Financing activities
|
(36
|
)
|
—
|
|
(36
|
)
|
(45
|
)
|
—
|
|
(45
|
)
|
||||||
|
Net increase (decrease) in cash and cash equivalents, unrestricted and restricted
|
$
|
(94
|
)
|
$
|
(651
|
)
|
$
|
(745
|
)
|
$
|
83
|
|
$
|
(341
|
)
|
$
|
(258
|
)
|
|
Cash and cash equivalents, unrestricted and restricted:
|
||||||||||||||||||
|
Beginning of period
|
$
|
476
|
|
$
|
1,262
|
|
$
|
1,738
|
|
$
|
278
|
|
$
|
955
|
|
$
|
1,233
|
|
|
End of period
|
$
|
382
|
|
$
|
611
|
|
$
|
993
|
|
$
|
361
|
|
$
|
614
|
|
$
|
975
|
|
|
Net increase (decrease) in cash and cash equivalents:
|
||||||||||||||||||
|
Unrestricted
|
$
|
(134
|
)
|
$
|
—
|
|
$
|
(134
|
)
|
$
|
50
|
|
$
|
—
|
|
$
|
50
|
|
|
Restricted
|
$
|
40
|
|
$
|
(651
|
)
|
$
|
(611
|
)
|
$
|
33
|
|
$
|
(341
|
)
|
$
|
(308
|
)
|
|
(1)
|
Prior year balances were retrospectively adjusted for Accounting Standards Update (ASU) 2016-18.
|
Operating Activities
Components of net cash used in operating activities are as follows:
|
|
Six Months Ended
June 30, |
|||||||||||||||||
|
(in millions)
|
2018
|
2017
|
||||||||||||||||
|
Corporate
|
WSE
|
Total
|
Corporate
|
WSE
|
Total
|
|||||||||||||
|
Net income
|
$
|
112
|
|
$
|
—
|
|
$
|
112
|
|
$
|
69
|
|
$
|
—
|
|
$
|
69
|
|
|
Depreciation and amortization
|
24
|
|
—
|
|
24
|
|
16
|
|
—
|
|
16
|
|
||||||
|
Stock-based compensation expense
|
19
|
|
—
|
|
19
|
|
14
|
|
—
|
|
14
|
|
||||||
|
Payment of interest
|
(8
|
)
|
—
|
|
(8
|
)
|
(8
|
)
|
—
|
|
(8
|
)
|
||||||
|
Income tax (payments) refunds, net
|
(24
|
)
|
—
|
|
(24
|
)
|
—
|
|
—
|
|
—
|
|
||||||
|
Collateral (paid to) refunded from insurance carriers, net
|
—
|
|
—
|
|
—
|
|
5
|
|
—
|
|
5
|
|
||||||
|
Changes in other operating assets
|
(13
|
)
|
1
|
|
(12
|
)
|
29
|
|
42
|
|
71
|
|
||||||
|
Changes in other operating liabilities
|
(2
|
)
|
(652
|
)
|
(654
|
)
|
12
|
|
(383
|
)
|
(371
|
)
|
||||||
|
Net cash provided by (used in) operating activities
(1)
|
$
|
108
|
|
$
|
(651
|
)
|
$
|
(543
|
)
|
$
|
137
|
|
$
|
(341
|
)
|
$
|
(204
|
)
|
|
(1)
|
Prior year balances were retrospectively adjusted for Accounting Standards Update (ASU) 2016-18.
|
Net cash used in operating activities from WSE-related activities was primarily driven by the timing of client payments, payroll amounts, collateral funding and insurance claim activities. Cash used in operating activities for WSE purposes increased by
$310 million
during the
six months ended June 30, 2018
, compared to the same period in 2017, and was primarily driven by payments of payroll taxes and related liabilities. We expect the changes in restricted cash and cash equivalents to correspond to WSE cash provided by (or used in) operations as we manage our WSE-related obligations through restricted cash.
|
MANAGEMENT'S DISCUSSION AND ANALYSIS
|
|
Cash provided by corporate operating activities decreased
$29 million
in the first half of
2018
compared to the same period in
2017
and was driven by the timing of corporate income tax payments as well as payments to vendors. The overall decrease was partially offset by a
63%
increase
in our net income.
We expect our tax payments to continue to increase in 2018 due to our inability to defer taxes as a result of new restrictions in the TCJA.
Investing Activities
Net cash used in investing activities in the first half of
2018
and
2017
, respectively, primarily consisted of purchases of investments partially offset by proceeds from the sale and maturity of restricted investments, and cash paid for capital expenditures.
|
|
Six Months Ended
June 30, |
|||||
|
(in millions)
|
2018
|
2017
|
||||
|
Investments:
|
||||||
|
Purchases of investments
|
$
|
203
|
|
$
|
—
|
|
|
Proceeds from sale of investments
|
(39
|
)
|
—
|
|
||
|
Proceeds from paydowns and maturity of investments
|
(24
|
)
|
(11
|
)
|
||
|
Cash used in (provided by) investments
|
$
|
140
|
|
$
|
(11
|
)
|
|
Capital expenditures:
|
||||||
|
Software and hardware
|
$
|
13
|
|
$
|
13
|
|
|
Office furniture, equipment and leasehold improvements
|
13
|
|
7
|
|
||
|
Cash used in capital expenditures
|
$
|
26
|
|
$
|
20
|
|
Investments
During the first half of 2018, we invested a portion of available cash in investment-grade securities with effective maturities less than five years that are classified on our balance sheet as investments. As of June 30, 2018, we had approximately
$162 million
in investments.
We also invest funds held as collateral to satisfy our long-term obligation towards the workers' compensation liabilities in U.S. long-term treasuries. These investments are classified on our balance sheet included as restricted cash, cash equivalents and investments. We review the amount and the anticipated holding period of these investments regularly in conjunction with our estimated long-term workers' compensation liabilities and anticipated claims payment trend. As of
June 30, 2018
, we held approximately
$808 million
of restricted cash, cash equivalents and investments in noncurrent and current accounts, of which approximately
$14 million
is in U.S. long-term treasuries.
As of
June 30, 2018
, we held approximately
$1.1 billion
in cash, cash equivalents and investments. Refer to Note 2 in Item 1 in this Form 10-Q for a summary of these funds.
Capital Expenditures
During the first half of
2018
and
2017
, we continued to make investments in software and hardware, enhanced existing products and platforms, and implemented legacy platform migrations. We also incurred expenses related to the build out of our corporate office and our technology and client service centers. We expect capital investments in our software and hardware to continue in the future.
|
MANAGEMENT'S DISCUSSION AND ANALYSIS
|
|
Financing Activities
Net cash used in financing activities in the first half of
2018
and
2017
consisted of our debt and equity related activities.
|
|
Six Months Ended
June 30, |
|||||
|
(in millions)
|
2018
|
2017
|
||||
|
Financing activities
|
||||||
|
Repurchase of common stock, net of issuance
|
$
|
32
|
|
$
|
27
|
|
|
Repayment of borrowings
|
214
|
|
18
|
|
||
|
Net proceeds from issuance of notes payable
|
(210
|
)
|
—
|
|
||
|
Cash used in financing activities
|
$
|
36
|
|
$
|
45
|
|
In the first half of 2018 we refinanced our 2014 Term Loans with our 2018 Term loan as discussed previously. For additional information see Note 7 to our financial statements in this Form 10-Q.
The board of directors authorizes repurchases through an ongoing program initiated in May 2014, primarily to offset dilution from the issuance of stock under our equity-based incentive plan and employee stock purchase plan. During the
six
months ended June 30,
2018
, we repurchased
594,799
shares of our common stock for approximately
$30 million
through our stock repurchase program. As of
June 30, 2018
, approximately
$106 million
remained available for repurchase under all authorizations by our board of directors.
Covenants
Our 2018 Credit Agreement contains customary representations and warranties and customary affirmative and negative covenants applicable to us, including, among other things, restrictions on indebtedness, liens, investments, mergers, dispositions, prepayment of indebtedness (other than our 2018 Term Loan and our 2018 Revolver), dividends, distributions and transactions with affiliates. It also contains financial covenants requiring us to maintain certain minimum interest coverage and maximum total leverage ratios, as set forth in our 2018 Credit Agreement. These covenants took effect on June 30, 2018. We were in compliance with these financial covenants under the credit facilities at June 30, 2018. For more details on the covenants under our 2018 Credit Agreement, see Note 7 to our financial statements in this Form 10-Q.
Contractual Obligations
The following table summarizes changes in our significant contractual obligations associated with our debt refinance:
|
|
Payments Due by Period
|
|||||||||||
|
(in millions)
|
Total
|
Less than 1 year
|
1-3 years
|
3-5 years
|
||||||||
|
Debt obligations
(1)
|
$
|
510
|
|
$
|
39
|
|
$
|
79
|
|
$
|
392
|
|
|
(1)
|
Includes principal and the projected interest payments of our term loans, refer to Note 7 in Item 1 of this Form 10-Q for details.
|
Off-Balance Sheet Arrangements
There has been no material change in our off-balance sheet arrangements discussed in Item 7 of our
2017
Form 10-K.
Critical Accounting Policies, Estimates and Judgments
During the first quarter of 2018, we adopted ASC Topic 606. Refer to Note 1 in Item 1 of this Form 10-Q for disclosure of the changes related to this adoption. There have been no additional material changes to our critical accounting policies as discussed in our
2017
Form 10-K.
Recent Accounting Pronouncements
Refer to
Note 1
in Item 1 of this Form 10-Q.
|
QUANTITATIVE AND QUALITATIVE DISCLOSURES ABOUT MARKET RISK
AND CONTROLS AND PROCEDURES
|
|
Quantitative and Qualitative Disclosures About Market Risk
Our exposure to changes in interest rates relates primarily to our investment portfolio and outstanding floating rate debt. Changes in U.S. interest rates affect the interest earned on the Company’s cash, cash equivalents and investments and the fair value of the investments, as well as interest costs associated with our debt.
In the first quarter of 2018 our board of directors approved a corporate investment policy ("our Investment Policy") that allows us to invest our available cash in instruments that meet the credit quality, liquidity, diversification and other requirements set forth in our Investment Policy. Under our Investment Policy, the Company's investment portfolios must maintain a minimum average credit quality of AA minus by Standard & Poor's (or an equivalent nationally recognized statistical rating organization), maintain average effective maturity durations of less than 36 months (or less than 24 months in some cases), and satisfy diversification requirements intended to reduce overall investment consolidation. Due to the restrictions imposed by our Investment Policy, we believe that our exposure to losses resulting from credit risk is not significant. To provide a meaningful assessment of the interest rate risk associated with our investment portfolio, we performed a sensitivity analysis to determine the impact a change in interest rates would have on the value of the investment portfolio assuming a 100 basis point parallel shift in the yield curve. Based on investment positions as of
June 30, 2018
, a hypothetical 100 basis point increase or decrease in interest rates across all maturities would result in a
$2 million
incremental decline or increase in the fair market value of the portfolio, respectively. Such losses would only be realized if we sold the investments prior to maturity. The risk of rate changes on investment balances was not significant at
June 30, 2018
.
In June 2018, we refinanced our term loans which would have matured in July 2019 and replaced them with a term loan maturing in 2023. At
June 30, 2018
, after this refinancing, we had total outstanding indebtedness of
$425 million
, of which
$21 million
is due within 12 months. A 100 basis point increase or decrease in market interest rates would cause interest expense on our debt as of
June 30, 2018
to increase or decrease by
$19 million
on an annualized basis, respectively.
Controls and Procedures
Evaluation of Disclosure Controls and Procedures
We have, with the participation of our Chief Executive Officer (CEO) and our Chief Financial Officer (CFO), evaluated the effectiveness of our disclosure controls and procedures as of
June 30, 2018
. The term “disclosure controls and procedures,” as defined in Rules 13a-15(e) and 15d-15(e) under the Securities Exchange Act of 1934, as amended, or the Exchange Act, means controls and other procedures of a company that are designed to ensure that information required to be disclosed by a company in the reports that it files or submits under the Exchange Act is recorded, processed, summarized and reported, within the time periods specified in the SEC’s rules and forms.
Disclosure controls and procedures include, without limitation, controls and procedures designed to ensure that information required to be disclosed by a company in the reports that it files or submits under the Exchange Act is accumulated and communicated to the company’s management, including its principal executive officer and principal financial officer, as appropriate to allow timely decisions regarding required disclosure. Based on the evaluation of our disclosure controls and procedures as of
June 30, 2018
, our CEO and CFO concluded that, as of such date, our disclosure controls and procedures were not effective as a result of a material weakness in our internal control over financial reporting. A material weakness is a deficiency, or a combination of deficiencies, in internal control over financial reporting such that there is a reasonable possibility that a material misstatement of our annual or interim financial statements will not be prevented or detected on a timely basis.
Notwithstanding the material weakness in our internal control over financial reporting, we have concluded that the condensed consolidated financial statements included in this Quarterly Report on Form 10-Q fairly present, in all material respects, our financial position, results of operations and cash flows for the periods presented in conformity with accounting principles generally accepted in the United States of America. Additionally, the material weakness did not result in any restatements of our condensed consolidated financial statements or disclosures for any prior period.
Additional Analyses and Procedures and Remediation Plan
We are taking specific steps to remediate the material weakness identified by management and described in greater detail in our
2017
Form 10-K. Although we intend to complete the remediation process with respect to this material weakness as quickly as possible, we cannot at this time estimate how long it will take, and our remediation plan may not prove to be successful.
Because the reliability of the internal control process requires repeatable execution, the successful remediation of this material weakness will require review and evidence of effectiveness prior to concluding that the controls are effective and there is no assurance that additional remediation steps will not be necessary. As such, as we continue to evaluate and work to improve our internal control over financial reporting, our management may decide to take additional measures to address the material weaknesses or modify the remediation steps already underway. As noted above, although we plan to complete the remediation process as quickly as possible, we cannot at this time estimate how long it will take, and our initiatives may not prove to be successful. Accordingly, until this weakness is remediated, we plan to perform additional analyses and other procedures to ensure that our condensed consolidated financial statements are prepared in accordance with GAAP.
Changes in Internal Control Over Financial Reporting
Other than the material weakness remediation efforts underway, there were no changes in our internal control over financial reporting identified in connection with the evaluation required by Rule 13a-15(d) and 15d-15(d) of the Exchange Act that occurred during the quarter ended
June 30, 2018
, that have materially affected, or are reasonably likely to materially affect, our internal control over financial reporting.
Limitations on Effectiveness of Controls and Procedures
In designing and evaluating the disclosure controls and procedures, management recognizes that any controls and procedures, no matter how well designed and operated, can provide only reasonable assurance of achieving the desired control objectives. In addition, the design of disclosure controls and procedures must reflect the fact that there are resource constraints and that management is required to apply judgment in evaluating the benefits of possible controls and procedures relative to their costs.
|
FINANCIAL STATEMENTS
|
|
|
(in millions, except share and per share data)
|
June 30,
2018 |
December 31,
2017 |
|||||||||||
|
Assets
|
|||||||||||||
|
Current assets:
|
|
|
|||||||||||
|
Cash and cash equivalents
|
$
|
202
|
|
$
|
336
|
|
|||||||
|
Investments
|
29
|
|
—
|
|
|||||||||
|
Restricted cash, cash equivalents and investments
|
629
|
|
1,280
|
|
|||||||||
|
Worksite employee related assets:
|
|||||||||||||
|
Unbilled revenue (net of advance collections of $14 and $12
at June 30, 2018 and December 31, 2017, respectively) |
$
|
268
|
|
$
|
297
|
|
|||||||
|
Accounts receivable
|
7
|
|
20
|
|
|||||||||
|
Prepaid insurance premiums and other insurance related receivables
|
28
|
|
26
|
|
|||||||||
|
Other payroll assets
|
49
|
|
17
|
|
|||||||||
|
Worksite employee related assets
|
|
|
352
|
|
|
|
360
|
|
|||||
|
Prepaid expenses and other current assets
|
37
|
|
15
|
|
|||||||||
|
Total current assets
|
1,249
|
|
1,991
|
|
|||||||||
|
Investments, noncurrent
|
133
|
|
—
|
|
|||||||||
|
Restricted cash, cash equivalents and investments, noncurrent
|
179
|
|
162
|
|
|||||||||
|
Workers' compensation collateral receivable
|
40
|
|
39
|
|
|||||||||
|
Property and equipment, net
|
79
|
|
70
|
|
|||||||||
|
Goodwill and other intangible assets, net
|
312
|
|
315
|
|
|||||||||
|
Other assets
|
23
|
|
16
|
|
|||||||||
|
Total assets
|
$
|
2,015
|
|
$
|
2,593
|
|
|||||||
|
Liabilities and stockholders’ equity
|
|||||||||||||
|
Current liabilities:
|
|||||||||||||
|
Accounts payable and other current liabilities
|
$
|
39
|
|
$
|
59
|
|
|||||||
|
Accrued corporate wages
|
35
|
|
40
|
|
|||||||||
|
Notes payable
|
21
|
|
40
|
|
|||||||||
|
Worksite employee related liabilities:
|
|||||||||||||
|
Accrued wages
|
$
|
269
|
|
$
|
289
|
|
|||||||
|
Client deposits
|
28
|
|
52
|
|
|||||||||
|
Payroll tax liabilities and other payroll withholdings
|
442
|
|
1,034
|
|
|||||||||
|
Health benefits loss reserves (net of prepayments of $38 and $19
at June 30, 2018 and December 31, 2017, respectively) |
138
|
|
151
|
|
|||||||||
|
Workers' compensation loss reserves (net of collateral paid of $5 and $6
at June 30, 2018 and December 31, 2017, respectively) |
67
|
|
67
|
|
|||||||||
|
Insurance premiums and other payables
|
22
|
|
25
|
|
|||||||||
|
Worksite employee related liabilities
|
|
|
966
|
|
1,618
|
|
|||||||
|
Total current liabilities
|
1,061
|
|
1,757
|
|
|||||||||
|
Notes payable, noncurrent
|
402
|
|
383
|
|
|||||||||
|
Workers' compensation loss reserves (net of collateral paid of $15 and $17
at June 30, 2018 and December 31, 2017, respectively) |
157
|
|
165
|
|
|||||||||
|
Deferred income taxes
|
70
|
|
68
|
|
|||||||||
|
Other liabilities
|
16
|
|
14
|
|
|||||||||
|
Total liabilities
|
1,706
|
|
2,387
|
|
|||||||||
|
Commitments and contingencies (see Note 10)
|
|
|
|||||||||||
|
Stockholders’ equity:
|
|||||||||||||
|
Preferred stock
($0.000025 par value per share; 20,000,000 shares authorized; no shares issued and outstanding at June 30, 2018 and December 31, 2017) |
—
|
|
—
|
|
|||||||||
|
Common stock and additional paid-in capital
($0.000025 par value per share; 750,000,000 shares authorized; 70,573,887 and 69,818,392 shares issued and outstanding at June 30, 2018 and December 31, 2017, respectively) |
611
|
|
583
|
|
|||||||||
|
Accumulated deficit
|
(302
|
)
|
(377
|
)
|
|||||||||
|
Total stockholders’ equity
|
309
|
|
206
|
|
|||||||||
|
Total liabilities and stockholders’ equity
|
$
|
2,015
|
|
$
|
2,593
|
|
|||||||
See accompanying notes.
|
FINANCIAL STATEMENTS
|
|
(Unaudited)
|
|
Three Months Ended
June 30, |
Six Months Ended
June 30, |
|||||||||||
|
(in millions, except share and per share data)
|
2018
|
2017
|
2018
|
2017
|
|||||||||
|
Professional service revenues
|
$
|
115
|
|
$
|
109
|
|
$
|
244
|
|
$
|
229
|
|
|
|
Insurance service revenues
|
735
|
|
692
|
|
1,467
|
|
1,379
|
|
|||||
|
Total revenues
|
850
|
|
801
|
|
1,711
|
|
1,608
|
|
|||||
|
Insurance costs
|
630
|
|
600
|
|
1,271
|
|
1,208
|
|
|||||
|
Cost of providing services (exclusive of depreciation and amortization of intangible assets)
|
51
|
|
51
|
|
108
|
|
107
|
|
|||||
|
Sales and marketing
|
41
|
|
46
|
|
80
|
|
95
|
|
|||||
|
General and administrative
|
31
|
|
28
|
|
62
|
|
54
|
|
|||||
|
Systems development and programming
|
11
|
|
12
|
|
24
|
|
22
|
|
|||||
|
Depreciation
|
8
|
|
6
|
|
16
|
|
13
|
|
|||||
|
Amortization of intangible assets
|
2
|
|
1
|
|
3
|
|
3
|
|
|||||
|
Total costs and operating expenses
|
774
|
|
744
|
|
1,564
|
|
1,502
|
|
|||||
|
Operating income
|
76
|
|
57
|
|
147
|
|
106
|
|
|||||
|
Other income (expense):
|
|||||||||||||
|
Interest expense, bank fees and other, net
|
(4
|
)
|
(5
|
)
|
(8
|
)
|
(9
|
)
|
|||||
|
Income before provision for income taxes
|
72
|
|
52
|
|
139
|
|
97
|
|
|||||
|
Income tax expense
|
14
|
|
12
|
|
27
|
|
28
|
|
|||||
|
Net income
|
$
|
58
|
|
$
|
40
|
|
$
|
112
|
|
$
|
69
|
|
|
|
Comprehensive income
|
$
|
58
|
|
$
|
40
|
|
$
|
112
|
|
$
|
69
|
|
|
|
Net income per share:
|
|||||||||||||
|
Basic
|
$
|
0.82
|
|
$
|
0.58
|
|
$
|
1.59
|
|
$
|
1.00
|
|
|
|
Diluted
|
$
|
0.80
|
|
$
|
0.56
|
|
$
|
1.55
|
|
$
|
0.97
|
|
|
|
Weighted average shares:
|
|
|
|||||||||||
|
Basic
|
70,448,809
|
|
69,029,749
|
|
70,250,273
|
|
68,770,976
|
|
|||||
|
Diluted
|
72,561,891
|
|
71,167,177
|
|
72,404,539
|
|
71,101,716
|
|
|||||
See accompanying notes.
|
FINANCIAL STATEMENTS
|
|
(Unaudited)
|
|
Six Months Ended
June 30, |
|||||
|
(in millions)
|
2018
|
2017
|
||||
|
Operating activities
|
||||||
|
Net income
|
$
|
112
|
|
$
|
69
|
|
|
Adjustments to reconcile net income to net cash provided by operating activities:
|
|
|||||
|
Depreciation and amortization
|
24
|
|
16
|
|
||
|
Stock-based compensation
|
19
|
|
14
|
|
||
|
Changes in operating assets and liabilities:
|
||||||
|
Prepaid income taxes
|
2
|
|
28
|
|
||
|
Prepaid expenses and other current assets
|
(23
|
)
|
(3
|
)
|
||
|
Workers' compensation collateral receivable and other noncurrent assets
|
(6
|
)
|
5
|
|
||
|
Accounts payable and other current liabilities
|
(14
|
)
|
5
|
|
||
|
Accrued corporate wages
|
(5
|
)
|
7
|
|
||
|
Workers' compensation loss reserves and other noncurrent liabilities
|
(4
|
)
|
(5
|
)
|
||
|
Worksite employee related assets
|
4
|
|
43
|
|
||
|
Worksite employee related liabilities
|
(652
|
)
|
(383
|
)
|
||
|
Net cash used in operating activities
|
(543
|
)
|
(204
|
)
|
||
|
Investing activities
|
||||||
|
Purchases of marketable securities
|
(203
|
)
|
—
|
|
||
|
Proceeds from sale of marketable securities
|
39
|
|
—
|
|
||
|
Proceeds from maturity of marketable securities
|
24
|
|
11
|
|
||
|
Acquisitions of property and equipment
|
(26
|
)
|
(20
|
)
|
||
|
Net cash used in investing activities
|
(166
|
)
|
(9
|
)
|
||
|
Financing activities
|
||||||
|
Repurchase of common stock
|
(30
|
)
|
(30
|
)
|
||
|
Proceeds from issuance of common stock on exercised options
|
5
|
|
6
|
|
||
|
Proceeds from issuance of common stock on employee stock purchase plan
|
3
|
|
2
|
|
||
|
Awards effectively repurchased for required employee withholding taxes
|
(10
|
)
|
(5
|
)
|
||
|
Proceeds from issuance of notes payable, net
|
210
|
|
—
|
|
||
|
Payments for extinguishment of debt
|
(204
|
)
|
—
|
|
||
|
Repayment of notes payable
|
(10
|
)
|
(18
|
)
|
||
|
Net cash used in financing activities
|
(36
|
)
|
(45
|
)
|
||
|
Net decrease in cash and cash equivalents, unrestricted and restricted
|
(745
|
)
|
(258
|
)
|
||
|
Cash and cash equivalents, unrestricted and restricted:
|
||||||
|
Beginning of period
|
1,738
|
|
1,233
|
|
||
|
End of period
|
$
|
993
|
|
$
|
975
|
|
|
Supplemental disclosures of cash flow information
|
||||||
|
Interest paid
|
$
|
8
|
|
$
|
8
|
|
|
Income taxes paid, net
|
24
|
|
—
|
|
||
|
Supplemental schedule of noncash investing and financing activities
|
||||||
|
Payable for purchase of property and equipment
|
$
|
2
|
|
$
|
2
|
|
|
Supplemental schedule of cash and cash equivalents
|
||||||
|
Net increase (decrease) in unrestricted cash and cash equivalents
|
$
|
(134
|
)
|
$
|
50
|
|
|
Net decrease in restricted cash and cash equivalents
|
(611
|
)
|
(308
|
)
|
||
See accompanying notes.
|
FINANCIAL STATEMENTS
|
|
NOTES TO CONDENSED CONSOLIDATED FINANCIAL STATEMENTS
(Unaudited)
Description of Business
TriNet Group, Inc. (TriNet, or the Company, we, our and us), a professional employer organization (PEO) founded in 1988, provides comprehensive human resources (HR) solutions for small to midsize businesses (SMBs) under a co-employment model. These HR solutions include bundled services, such as multi-state payroll processing and tax administration, employee benefits programs, including health insurance and retirement plans, workers' compensation insurance and claims management, employment and benefit law compliance, and other services. Through the co-employment relationship, we are the employer of record for most administrative and regulatory purposes, including:
|
•
|
compensation through wages and salaries,
|
|
•
|
employer payroll-related tax payments,
|
|
•
|
employee payroll-related tax withholdings and payments,
|
|
•
|
employee benefit programs including health and life insurance, and others, and
|
|
•
|
workers' compensation coverage.
|
Our clients are responsible for the day-to-day job responsibilities of the worksite employees (WSEs).
We operate in
one
reportable segment. All of our service revenues are generated from external clients. Less than
1%
of our revenue is generated outside of the U.S.
Basis of Presentation
These unaudited condensed consolidated financial statements (Financial Statements) and accompanying notes have been prepared in accordance with accounting principles generally accepted in the United States of America (GAAP) for interim financial reporting and the instructions to Form 10-Q and Rule 10-01 of Regulation S-X of the Rules and Regulations of the Securities and Exchange Commission (SEC). Certain information and note disclosures included in our annual financial statements prepared in accordance with GAAP have been condensed or omitted pursuant to such rules and regulations. In the opinion of management, the condensed consolidated financial statements reflect all adjustments, that are normal and recurring in nature, necessary for fair financial statement presentation. The results of operations for the three and the six months ended
June 30, 2018
are not necessarily indicative of the operating results anticipated for the full year. These Financial Statements should be read in conjunction with the audited Consolidated Financial Statements included in Part II, Item 8 of our Annual Report on Form 10-K for the year ended
December 31, 2017
(
2017
Form 10-K).
Reclassifications
Certain prior year amounts have been reclassified to conform to current period presentation. These reclassifications include short-term restricted cash, cash equivalents and investments previously classified as WSE-related assets and now presented within restricted cash, cash equivalents and investments. Refer to the accounting policy below for a description of amounts currently included in restricted cash, cash equivalents, and investments.
|
FINANCIAL STATEMENTS
|
|
Use of Estimates
The preparation of financial statements in conformity with GAAP requires us to make estimates and assumptions that affect certain reported amounts and related disclosures. Significant estimates include:
|
•
|
liability for unpaid losses and loss adjustment expenses (loss reserves) related to workers' compensation and workers' compensation collateral receivable,
|
|
•
|
health insurance loss reserves,
|
|
•
|
liability for insurance premiums payable,
|
|
•
|
impairments of goodwill and other intangible assets,
|
|
•
|
income tax assets and liabilities, and
|
|
•
|
liability for legal contingencies.
|
These estimates are based on historical experience and on various other assumptions that we believe to be reasonable from the facts available to us. Some of the assumptions are highly uncertain at the time of estimation. To the extent actual experience differs from the assumptions used, our consolidated financial statements could be materially affected.
Revenue Recognition
On January 1, 2018, we adopted Accounting Standards Codification Topic 606 (ASC Topic 606) using the modified retrospective method applied to those contracts which were not completed as of January 1, 2018. Results for reporting periods beginning after January 1, 2018 are presented under ASC Topic 606, while the comparative prior period amounts are not restated and continue to be reported in accordance with statements previously accounted for under Accounting Standards Codification Topic 605.
Upon adoption of ASC Topic 606, we recorded a
$1 million
cumulative effect adjustment to opening retained earnings as of January 1, 2018. Impacts from adoption of the new standard on our revenue recognition include:
|
•
|
Our annual service contracts with our clients that are cancellable with 30 days' notice are initially considered 30-day contracts under the new standard;
|
|
•
|
Professional service revenues are recognized on an output basis which results in recognition at the time payroll is processed;
|
|
•
|
Our non-refundable set up fees are no longer deferred but accounted for as part of our transaction price and are allocated among professional service revenues and insurance services revenues; and
|
|
•
|
The majority of sales commissions related to onboarding new clients that were previously expensed are capitalized as contract assets and amortized over the estimated customer life.
|
Revenues are recognized when control of the promised services are transferred to our clients, in an amount that reflects the consideration that we expect to receive in exchange for services. We generate all of our revenue from contracts with customers. We disaggregate revenues into professional services revenues and insurance services revenues as reported on the condensed consolidated statements of operations and comprehensive income. Generally, both the client and the Company may terminate the contract without penalty by providing a 30-day notice.
|
FINANCIAL STATEMENTS
|
|
Performance Obligations
At contract inception, we assess the services promised in our contracts with customers and identify a performance obligation for each distinct promise to transfer to the customer a service or bundle of services. We determined that the following distinct services represent separate performance obligations:
|
•
|
Payroll and payroll tax processing,
|
|
•
|
Health benefits services, and
|
|
•
|
Workers’ compensation services.
|
Payroll and payroll tax processing performance obligations include services to process payroll and payroll tax-related transactions on behalf of our clients. Revenues associated with this performance obligation are reported as professional service revenues and recognized using an output method in which the control of the promised services is considered transferred when a client's payroll is processed by us and its WSEs are paid. Professional service revenues are stated net of the gross payroll and payroll tax amounts funded by our clients. Although we assume the responsibilities to process and remit the payroll and payroll related obligations, we do not assume employment-related responsibilities such as determining the amount of the payroll and related payroll obligations. As a result, we are the agent in this arrangement for revenue recognition purposes.
Health benefits and workers' compensation services include performance obligations to provide TriNet-sponsored health benefits and workers' compensation insurance coverage through insurance policies provided by third-party insurance carriers and settle high deductible amounts on those policies. Revenues associated with these performance obligations are reported as insurance services revenues and are recognized using the output method over the period of time that the client and WSEs are covered under TriNet-sponsored insurance policies.
We control the selection of health benefits and workers' compensation coverage made available, insurance services revenues are reported gross as we are the principal in this arrangement for revenue recognition purposes. See Item 8 Note 1 in our 2017 Form 10-K for further discussion on our accounting policy for insurance costs.
We generally charge new customers a nominal upfront non-refundable fee to recover our costs to set up the client on our TriNet platform for payroll processing and other administrative services, such as benefit enrollments. These fees are accounted for as part of our transaction price and are allocated among the performance obligations based on their relative standalone selling price.
Variable Consideration and Pricing Allocation
Our contracts with customers generally do not include any variable consideration. However, from time to time, we may offer incentive credits to our clients considered to be variable consideration including incentive credits issued related to contract renewals. Incentive credits are recorded as a reduction to revenue as part of the transaction price at contract inception when there is a basis to reasonably estimate the amount of the incentive credit and only to the extent that it is probable that a significant reversal of any incremental revenue will not occur. These incentive credits are allocated among the performance obligations based on their relative standalone selling price.
We allocate the total transaction price to each performance obligation based on the estimated relative standalone selling prices of the promised services underlying each performance obligation. The transaction price for payroll and payroll tax processing performance obligations are determined upon establishment of the contract that contains the final terms of the sale, including the description and price of each service purchased. The estimated service fee is calculated based on observable inputs and include the following key assumptions: target profit margin, pricing strategies including the mix of services purchased and competitive factors, and customer and industry specifics.
The transaction price for health benefits insurance and worker’s compensation insurance performance obligations is determined during the new client on-boarding and enrollment processes based on the types of benefits coverage the clients and WSEs have elected and the applicable risk profile of the client. We estimate our service fees based on actuarial forecasts of our expected insurance premiums and claim costs, and to amounts to cover our costs to administer these programs.
We require our clients to prefund payroll and related taxes and other withholding liabilities before payroll is processed or due for payment. Under the provision of our contracts with customers, we generally will process the payment of a client’s payroll only when the client successfully funds the amount required. As a result, there is no financing arrangement
|
FINANCIAL STATEMENTS
|
|
for the contracts, however, certain contracts to provide payroll and payroll tax processing services permit the client to pay certain payroll tax components ratably over a 12-month period rather than as payroll tax is determined on wages paid, which may be considered a significant financing arrangement under ASC Topic 606. However, as the period between our performing the service under the contract and when the client pays for the service is less than one year, we have elected as a practical expedient, not to adjust the transaction price.
Contract Costs
We recognize as deferred commission expense the incremental cost to obtain a contract with a client for certain components under our commission plans for sales representatives and channel partners that are directly related to new customers onboarded as we expect to recover these costs through future service fees. Such assets will be amortized over the estimated average client tenure. These commissions are earned on the basis of the revenue generated from payroll and payroll tax processing performance obligations. When the commission on a renewal contract is not commensurate with the commission on the initial contract, such commission will be capitalized and amortized over the estimated average client tenure. If the commission for both initial contract and renewal contracts are commensurate, such commissions are expensed in the contract period. When the amortization period is less than one year, we apply practical expedient to expense sales commissions in sales and marketing expenses in the period incurred. The below table summarizes the amounts capitalized and amortized during the three and six months ended
June 30, 2018
:
|
Three Months Ended
June 30, 2018
|
Six Months Ended
June 30, 2018
|
|||||||||||
|
(in millions)
|
Capitalized
|
Amortized
|
Capitalized
|
Amortized
|
||||||||
|
Deferred commission costs
|
$
|
7
|
|
$
|
1
|
|
$
|
16
|
|
$
|
1
|
|
Certain commission plans will pay a commission on estimated professional service revenues over the first 12 months of the contract with customers. The portion of commission paid in excess of the actual commission earned in that period is recorded as prepaid commission. When the prepaid commission is considered earned, it is classified as a deferred commission expense and subject to amortization.
We do not have material contract assets and contract liabilities as of
June 30, 2018
. We require our clients to prefund payroll and related liabilities before payroll is processed or due for payment. If a client fails to fund payroll or misses the funding cut-off, at our sole discretion, we may pay the payroll and the resulting unfunded payroll is recognized as accounts receivable on the accompanying consolidated balance sheets. When client payment is received in advance of our performance under the contract, such amount is recorded as client deposits.
Restricted Cash, Cash Equivalents and Investments
Restricted cash, cash equivalents and investments presented on our condensed consolidated balance sheets include:
|
•
|
corporate cash and cash equivalents in trust accounts functioning as security deposits for our insurance carriers,
|
|
•
|
payroll funds collected represents cash collected in advance from clients which we designate as restricted for the purpose of funding WSE payroll and payroll taxes and other payroll related liabilities, and
|
|
•
|
amounts held in trust for current and future premium and claim obligations with our insurance carriers, which amounts are held in trust according to the terms of the relevant insurance policies and by the local insurance regulations of the jurisdictions in which the policies are in force.
|
Investments
Our investments are classified as available-for-sale and are carried at estimated fair value.
Unrealized gains and losses are reported as a component of accumulated other comprehensive income (loss), net of deferred income taxes. The amortized cost of debt investments is adjusted for amortization of premiums and accretion of discounts from the date of purchase to maturity or sale. Such amortization is included in interest income as an addition to or deduction from the coupon interest earned on the investments. We use the specific identification method to determine the realized gains and losses on the sale of available-for-sale securities. Realized gains and losses are included in other income in the accompanying consolidated statements of income and comprehensive income.
|
FINANCIAL STATEMENTS
|
|
We assess our investments for an other-than-temporary impairment loss due to a decline in fair value or other market conditions. We review several factors to determine whether a loss is other than temporary, such as the length and extent of the fair value decline, the financial condition and near-term prospects of the issuer and whether we have the intent to sell or will more likely than not be required to sell before the securities' anticipated recovery, which may be at maturity. If management determines that a security is impaired under these circumstances, the impairment recognized in earnings is measured as the entire difference between the amortized cost and the then-current fair value.
We have investments within our unrestricted and our restricted accounts. Unrestricted investments are recorded on the balance sheet as current or noncurrent based upon the remaining time to maturity, and investments subject to WSE restrictions are classified as current or noncurrent based on the expected payout of the related liability.
Concentrations of Credit Risk
Financial instruments subject to concentrations of credit risk include cash, cash equivalents and investments (unrestricted and restricted), accounts receivable, and amounts due from insurance carriers. We maintain these financial assets principally in domestic financial institutions. We perform periodic evaluations of the relative credit standing of these institutions. Our exposure to credit risk in the event of default by the financial institutions holding these funds is limited to amounts currently held by the institution in excess of insured amounts.
Recent Accounting Pronouncements
Recently adopted accounting guidance
Revenue Recognition -
In May 2014, the FASB issued ASU 2014-09-Revenue from Contracts with Customers, which will replace most existing revenue recognition guidance under GAAP. The core principle of the guidance is that an entity should recognize revenue for the transfer of promised goods or services to customers that reflects the consideration to which the entity expects to be entitled in exchange for those goods or services. The standard provides a five-step analysis of transactions to determine when and how revenue is recognized.
We have adopted the new standard effective January 1, 2018 using the modified retrospective method. For further discussion of our adoption of ASC Topic 606, including our operating results under the new standard, see Revenue Recognition section above.
The impact from the adoption of ASC Topic 606 to our condensed consolidated income statements and balance sheets is as follows:
|
Three Months Ended June 30, 2018
|
Six Months Ended June 30, 2018
|
|||||||||||||||||
|
(in millions, except per share data)
|
As Reported
|
Balance Using Previous Standard
|
Increase (Decrease)
|
As Reported
|
Balance Using Previous Standard
|
Increase (Decrease)
|
||||||||||||
|
Income statement
|
||||||||||||||||||
|
Revenue
|
||||||||||||||||||
|
Professional service revenues
|
$
|
115
|
|
$
|
115
|
|
$
|
—
|
|
$
|
244
|
|
$
|
242
|
|
$
|
2
|
|
|
Total revenues
|
850
|
|
850
|
|
—
|
|
1,711
|
|
1,709
|
|
2
|
|
||||||
|
Expense
|
||||||||||||||||||
|
Sales and marketing expense
|
||||||||||||||||||
|
Commissions expense
|
8
|
|
14
|
|
(6
|
)
|
12
|
|
27
|
|
(15
|
)
|
||||||
|
Total expense
|
774
|
|
780
|
|
(6
|
)
|
1,564
|
|
1,579
|
|
(15
|
)
|
||||||
|
Income before provision for income taxes
|
72
|
|
66
|
|
6
|
|
139
|
|
122
|
|
17
|
|
||||||
|
Income tax expense
|
14
|
|
12
|
|
2
|
|
27
|
|
23
|
|
4
|
|
||||||
|
Net income
|
58
|
|
54
|
|
4
|
|
112
|
|
99
|
|
13
|
|
||||||
|
Basic earnings per share
|
0.82
|
|
0.77
|
|
0.05
|
|
1.59
|
|
1.41
|
|
0.18
|
|
||||||
|
Diluted earnings per share
|
$
|
0.80
|
|
$
|
0.75
|
|
$
|
0.05
|
|
$
|
1.55
|
|
$
|
1.37
|
|
$
|
0.18
|
|
|
FINANCIAL STATEMENTS
|
|
|
June 30, 2018
|
|||||||||
|
(in millions)
|
As reported
|
Balance Using Previous Standard
|
Increase (Decrease)
|
||||||
|
Balance sheet
|
|||||||||
|
Assets
|
|||||||||
|
Cash and cash equivalents
|
$
|
202
|
|
$
|
208
|
|
$
|
(6
|
)
|
|
Restricted cash, cash equivalents and investments
|
629
|
|
623
|
|
6
|
|
|||
|
Unbilled revenue (net of advance collections)
|
268
|
|
274
|
|
(6
|
)
|
|||
|
Prepaid expenses and other current assets
|
37
|
|
29
|
|
8
|
|
|||
|
Other assets
|
23
|
|
17
|
|
6
|
|
|||
|
Liabilities
|
|
|
|||||||
|
Accounts payable and other current liabilities
|
39
|
|
43
|
|
(4
|
)
|
|||
|
Deferred income taxes
|
70
|
|
68
|
|
2
|
|
|||
|
Other liabilities
|
16
|
|
20
|
|
(4
|
)
|
|||
|
Equity
|
|
|
|||||||
|
Retained earnings
|
$
|
(302
|
)
|
$
|
(316
|
)
|
$
|
14
|
|
Statement of Cash Flows -
In November 2016, the FASB issued ASU No. 2016-18, Statement of Cash Flows (Topic
230): Restricted Cash
. ASU 2016-18 addresses diversity in practice from entities classifying and presenting transfers between cash and restricted cash as operating, investing or financing activities or as a combination of those activities in the statement of cash flows. The ASU requires entities to show the changes in the total of cash, cash equivalents, restricted cash and restricted cash equivalents in the Statement of Cash Flows. As a result, transfers between such categories are no longer be presented in the Statement of Cash Flows. We adopted ASU 2016-18 on January 1, 2018 using the retrospective method.
Recently issued accounting pronouncements
Lease arrangements -
In February 2016, the FASB issued ASU 2016-02-
Leases.
The amendment requires that lease arrangements longer than 12 months result in an entity recognizing lease assets and lease liabilities and most significantly impacts those leases classified as operating leases under previous U.S. GAAP. Under the new standard, disclosures are required to meet the objective of enabling users of financial statements to assess the amount, timing, and uncertainty of cash flows arising from leases.
The amendment is effective for annual reporting periods and interim periods within those years beginning after December 15, 2018. We currently anticipate adoption of the new standard effective January 1, 2019.
We anticipate this standard will have a material impact on our condensed consolidated financial statements. While we continue to assess all potential impacts of the standard, we anticipate that there will be a material increase to assets and lease liabilities for existing property leases representing our nationwide office locations not already included on our condensed consolidated balance sheets.
|
FINANCIAL STATEMENTS
|
|
Under the terms of the agreements with certain of our workers' compensation and health benefit insurance carriers, we are required to maintain collateral in trust accounts for the benefit of specified insurance carriers and to reimburse the carriers’ claim payments within our deductible layer. We invest a portion of the collateral amounts in marketable securities. We report the current and noncurrent portions of these trust accounts as restricted cash, cash equivalents and investments on the consolidated balance sheets.
We require our clients to prefund their payroll and related taxes and other withholding liabilities before payroll is processed or due for payment. This prefund is included in restricted cash, cash equivalents and investments as payroll funds collected, which is designated to pay pending payrolls and other WSE-related liabilities.
Our total cash, cash equivalents and investments are summarized below:
|
June 30, 2018
|
December 31, 2017
|
|||||||||||||||||||||||
|
(in millions)
|
Cash and cash equivalents
|
Available-for-sale marketable securities
|
Certificate
of
deposits
|
Total
|
Cash and cash equivalents
|
Available-for-sale marketable securities
|
Certificate
of
deposits
|
Total
|
||||||||||||||||
|
Cash and cash equivalents
|
$
|
202
|
|
$
|
—
|
|
$
|
—
|
|
$
|
202
|
|
$
|
336
|
|
$
|
—
|
|
$
|
—
|
|
$
|
336
|
|
|
Investments
|
—
|
|
29
|
|
—
|
|
29
|
|
—
|
|
—
|
|
—
|
|
—
|
|
||||||||
|
Restricted cash, cash equivalents and investments
|
||||||||||||||||||||||||
|
Insurance carriers security deposits
|
15
|
|
—
|
|
—
|
|
15
|
|
15
|
|
—
|
|
—
|
|
15
|
|
||||||||
|
Payroll funds collected
|
449
|
|
—
|
|
—
|
|
449
|
|
1,095
|
|
—
|
|
—
|
|
1,095
|
|
||||||||
|
Collateral for health benefits claims
|
75
|
|
—
|
|
—
|
|
75
|
|
69
|
|
—
|
|
—
|
|
69
|
|
||||||||
|
Collateral for workers' compensation claims
|
87
|
|
1
|
|
—
|
|
88
|
|
98
|
|
1
|
|
—
|
|
99
|
|
||||||||
|
Collateral to secure standby letter of credit
|
—
|
|
—
|
|
2
|
|
2
|
|
—
|
|
—
|
|
2
|
|
2
|
|
||||||||
|
Total restricted cash, cash equivalents and investments
|
626
|
|
1
|
|
2
|
|
629
|
|
1,277
|
|
1
|
|
2
|
|
1,280
|
|
||||||||
|
Investments, noncurrent
|
—
|
|
133
|
|
—
|
|
133
|
|
—
|
|
—
|
|
—
|
|
—
|
|
||||||||
|
Restricted cash, cash equivalents and investments, noncurrent
|
||||||||||||||||||||||||
|
Collateral for workers' compensation claims
|
165
|
|
14
|
|
—
|
|
179
|
|
125
|
|
37
|
|
—
|
|
162
|
|
||||||||
|
Total
|
$
|
993
|
|
$
|
177
|
|
$
|
2
|
|
$
|
1,172
|
|
$
|
1,738
|
|
$
|
38
|
|
$
|
2
|
|
$
|
1,778
|
|
|
FINANCIAL STATEMENTS
|
|
All of our investment securities that have a contractual maturity date greater than three months are classified as available-for-sale (AFS). The amortized cost, gross unrealized gains, gross unrealized losses, and fair values of our investments as of
June 30, 2018
and
December 31, 2017
are presented below:
|
June 30, 2018
|
||||||||||||
|
(in millions)
|
Amortized Cost
|
Gross Unrealized Gains
|
Gross Unrealized Losses
|
Fair Value
|
||||||||
|
Asset-backed securities
|
$
|
38
|
|
$
|
—
|
|
$
|
—
|
|
$
|
38
|
|
|
Corporate bonds
|
87
|
|
—
|
|
—
|
|
87
|
|
||||
|
U.S. government agencies and government-
sponsored agencies
|
6
|
|
—
|
|
—
|
|
6
|
|
||||
|
U.S. treasuries
|
34
|
|
—
|
|
—
|
|
34
|
|
||||
|
Exchange traded fund
|
1
|
|
—
|
|
—
|
|
1
|
|
||||
|
Other debt securities
|
11
|
|
—
|
|
—
|
|
11
|
|
||||
|
Total
|
$
|
177
|
|
$
|
—
|
|
$
|
—
|
|
$
|
177
|
|
|
December 31, 2017
|
||||||||||||
|
(in millions)
|
Amortized Cost
|
Gross Unrealized Gains
|
Gross Unrealized Losses
|
Fair Value
|
||||||||
|
U.S. treasuries
|
$
|
37
|
|
$
|
—
|
|
$
|
—
|
|
$
|
37
|
|
|
Exchange traded fund
|
1
|
|
—
|
|
—
|
|
1
|
|
||||
|
Total
|
$
|
38
|
|
$
|
—
|
|
$
|
—
|
|
$
|
38
|
|
Investments in a continuous unrealized loss position for less than 12 months and 12 months or more as of
June 30, 2018
and
December 31, 2017
are presented below.
|
June 30, 2018
|
||||||||||||||||||
|
Less than 12 months
|
12 months or more
|
Total
|
||||||||||||||||
|
(in millions)
|
Fair Value
|
Unrealized Losses
|
Fair Value
|
Unrealized Losses
|
Fair Value
|
Unrealized Losses
|
||||||||||||
|
Asset-backed securities
|
$
|
26
|
|
$
|
—
|
|
$
|
—
|
|
$
|
—
|
|
$
|
26
|
|
$
|
—
|
|
|
Corporate bonds
|
82
|
|
—
|
|
—
|
|
—
|
|
82
|
|
—
|
|
||||||
|
U.S. government agencies and government-sponsored agencies
|
5
|
|
—
|
|
—
|
|
—
|
|
5
|
|
—
|
|
||||||
|
U.S. treasuries
|
20
|
|
—
|
|
10
|
|
—
|
|
30
|
|
—
|
|
||||||
|
Other debt securities
|
2
|
|
—
|
|
—
|
|
—
|
|
2
|
|
—
|
|
||||||
|
Total
|
$
|
135
|
|
$
|
—
|
|
$
|
10
|
|
$
|
—
|
|
$
|
145
|
|
$
|
—
|
|
|
December 31, 2017
|
||||||||||||||||||
|
Less than 12 months
|
12 months or more
|
Total
|
||||||||||||||||
|
(in millions)
|
Fair Value
|
Unrealized Losses
|
Fair Value
|
Unrealized Losses
|
Fair Value
|
Unrealized Losses
|
||||||||||||
|
U.S. treasuries
|
$
|
5
|
|
$
|
—
|
|
$
|
24
|
|
$
|
—
|
|
$
|
29
|
|
$
|
—
|
|
|
Total
|
$
|
5
|
|
$
|
—
|
|
$
|
24
|
|
$
|
—
|
|
$
|
29
|
|
$
|
—
|
|
|
FINANCIAL STATEMENTS
|
|
Unrealized losses on fixed income securities are principally caused by changes in interest rates and the financial condition of the issuer. In analyzing an issuer's financial condition, we consider whether the securities are issued by the federal government or its agencies, whether downgrades by credit rating agencies have occurred, and industry analysts' reports. As we have the ability to hold these investments until maturity, or for the foreseeable future, no decline was deemed to be other-than-temporary.
The fair value of debt investments by contractual maturity (actual maturities may differ from contractual maturities because borrowers may have the right to prepay obligations with or without prepayment penalties) are shown below.
|
June 30, 2018
|
|||||||||||||||
|
(in millions)
|
One year or less
|
Over One Year Through Five Years
|
Over Five Years Through Ten Years
|
Over Ten Years
|
Fair Value
|
||||||||||
|
Asset-backed securities
|
$
|
2
|
|
$
|
32
|
|
$
|
3
|
|
$
|
1
|
|
$
|
38
|
|
|
Corporate bonds
|
24
|
|
63
|
|
—
|
|
—
|
|
87
|
|
|||||
|
U.S. government agencies and government-sponsored agencies
|
2
|
|
—
|
|
—
|
|
4
|
|
6
|
|
|||||
|
U.S. treasuries
|
2
|
|
32
|
|
—
|
|
—
|
|
34
|
|
|||||
|
Other debt securities
|
—
|
|
—
|
|
—
|
|
11
|
|
11
|
|
|||||
|
Total
|
$
|
30
|
|
$
|
127
|
|
$
|
3
|
|
$
|
16
|
|
$
|
176
|
|
|
December 31, 2017
|
|||||||||||||||
|
(in millions)
|
One year or less
|
Over One Year Through Five Years
|
Over Five Years Through Ten Years
|
Over Ten Years
|
Fair Value
|
||||||||||
|
U.S. treasuries
|
$
|
—
|
|
$
|
37
|
|
$
|
—
|
|
$
|
—
|
|
$
|
37
|
|
|
Total
|
$
|
—
|
|
$
|
37
|
|
$
|
—
|
|
$
|
—
|
|
$
|
37
|
|
There were immaterial gross realized gains and losses from sales of investments for the three and six months periods ended
June 30, 2018
and
2017
.
The fair value of our investments in an unrealized loss position represented
83%
and
78%
of the total fair value of all investments as of
June 30, 2018
and
December 31, 2017
, respectively.
Our asset-backed securities include auto loan/lease, credit card, and equipment leases with investment-grade ratings.
Our corporate bonds include investment-grade debt securities from a wide variety of issuers, industries, and sectors.
Our U.S. government agencies and government-sponsored agencies securities primarily include commercial mortgage-backed securities and mortgage backed securities consisting of Federal Home Loan Mortgage Corporation and Federal National Mortgage Association securities with investment-grade ratings.
Our other debt securities primarily include mortgage-backed securities with investment-grade ratings issued by institutions without federal backing.
|
FINANCIAL STATEMENTS
|
|
The following table summarizes the workers’ compensation loss reserve activity for the
three and six
months ended
June 30, 2018
and
2017
:
|
Three Months Ended June 30,
|
Six Months Ended
June 30, |
|||||||||||
|
(in millions)
|
2018
|
2017
|
2018
|
2017
|
||||||||
|
Total loss reserves, beginning of period
|
$
|
250
|
|
$
|
260
|
|
$
|
255
|
|
$
|
255
|
|
|
Incurred
|
||||||||||||
|
Current year
|
19
|
|
20
|
|
39
|
|
48
|
|
||||
|
Prior years
|
(6
|
)
|
1
|
|
(13
|
)
|
1
|
|
||||
|
Total incurred
|
13
|
|
21
|
|
26
|
|
49
|
|
||||
|
Paid
|
||||||||||||
|
Current year
|
(2
|
)
|
(5
|
)
|
(2
|
)
|
(6
|
)
|
||||
|
Prior years
|
(17
|
)
|
(21
|
)
|
(35
|
)
|
(43
|
)
|
||||
|
Total paid
|
(19
|
)
|
(26
|
)
|
(37
|
)
|
(49
|
)
|
||||
|
Total loss reserves, end of period
|
$
|
244
|
|
$
|
255
|
|
$
|
244
|
|
$
|
255
|
|
The following summarizes workers' compensation liabilities on the condensed consolidated balance sheets:
|
(in millions)
|
June 30,
2018 |
December 31,
2017 |
||||
|
Total loss reserves, end of period
|
$
|
244
|
|
$
|
255
|
|
|
Collateral paid to carriers and offset against loss reserves
|
(20
|
)
|
(23
|
)
|
||
|
Total loss reserves, net of carrier collateral offset
|
$
|
224
|
|
$
|
232
|
|
|
Payable in less than 1 year
(net of collateral paid to carriers of $5 and $6 at June 30, 2018 and December 31, 2017, respectively) |
$
|
67
|
|
$
|
67
|
|
|
Payable in more than 1 year
(net of collateral paid to carriers of $15 and $17 at June 30, 2018 and December 31, 2017, respectively) |
157
|
|
165
|
|
||
|
Total loss reserves, net of carrier collateral offset
|
$
|
224
|
|
$
|
232
|
|
Incurred claims related to prior years represent changes in estimates for ultimate losses on workers' compensation claims. For the
three and six
months ended
June 30, 2018
, the favorable development was primarily due to lower than expected severity of reported claims associated with office and non-office worker WSEs in recent accident years.
As of
June 30, 2018
and
December 31, 2017
, we had
$62 million
and
$63 million
, respectively, of collateral held by insurance carriers of which
$20 million
and
$23 million
, respectively, was offset against workers' compensation loss reserves as the agreements permit and are net settled of insurance obligations against collateral held. Collateral paid to each carrier for a policy year in excess of our loss reserves is recorded as workers' compensation collateral receivable.
|
FINANCIAL STATEMENTS
|
|
Fair Value of Financial Instruments
Fair value is defined as an exit price, representing the amount that would be received to sell an asset or paid to transfer a liability in an orderly transaction between market participants at the measurement date. As such, fair value is a market-based measurement that should be determined based on assumptions that market participants would use in pricing an asset or a liability.
Our financial assets recorded at fair value on a recurring basis comprise of available-for-sale marketable securities and certificates of deposits. We measure certain financial assets at fair value for disclosure purposes, as well as on a nonrecurring basis when they are deemed to be other-than-temporarily impaired. Our other current financial assets and our other current financial liabilities, including cash and cash equivalents, restricted cash and cash equivalents, WSE related assets and liabilities excluding insurance loss reserves, line of credit and accrued corporate wages, have fair values that approximate their carrying value due to their short-term nature.
Assets and liabilities recorded at fair value are measured and classified in accordance with a three-tier fair value hierarchy based on the observability of the inputs available in the market to measure fair value, summarized as follows:
|
•
|
Level 1—observable inputs for identical assets or liabilities, such as quoted prices in active markets,
|
|
•
|
Level 2—inputs other than the quoted prices in active markets that are observable either directly or indirectly,
|
|
•
|
Level 3—unobservable inputs in which there is little or no market data, which requires that we develop our own assumptions.
|
The fair value hierarchy requires us to maximize the use of observable inputs and minimize the use of unobservable inputs when measuring fair value. We classify our cash equivalents, debt securities and notes payable in the fair value hierarchy based on the lowest level input that is significant to the fair value measurement in its entirety.
We use an independent pricing source to determine the fair value of its available-for-sale securities included as Level 2. For purposes of valuing our securities, the independent pricing source utilizes the following market approach by investment class:
|
•
|
Money market funds are valued on a spread or discount rate basis,
|
|
•
|
Asset-backed securities are valued using historical and projected prepayments speed and loss scenarios and spreads obtained from the new issue market, dealer quotes and trade prices,
|
|
•
|
U.S. treasuries, corporate bonds, and other debt securities are priced based on dealer quotes from multiple sources, and
|
|
•
|
US government agencies and government sponsored agencies are priced using LIBOR/swap curves, credit spreads and interest rate volatilities.
|
We have not adjusted the prices obtained from the independent pricing service and we believe the prices received from the independent pricing service are representative of the prices that would be received to sell the assets at the measurement date (exit price).
We did not have any Level 3 financial instruments as of
June 30, 2018
and
December 31, 2017
. There were no transfers between levels as of
June 30, 2018
and
December 31, 2017
.
|
FINANCIAL STATEMENTS
|
|
Fair Value Measurements on a Recurring Basis
The following table summarizes our financial instruments by significant categories and fair value measurement on a recurring basis as of
June 30, 2018
and
December 31, 2017
.
|
(in millions)
|
Level 1
|
Level 2
|
Total
|
||||||
|
June 30, 2018
|
|||||||||
|
Cash equivalents:
|
|||||||||
|
Money market funds
|
$
|
1
|
|
$
|
—
|
|
$
|
1
|
|
|
U.S. treasuries
|
—
|
|
7
|
|
7
|
|
|||
|
Total cash equivalents
|
1
|
|
7
|
|
8
|
|
|||
|
Investments:
|
|||||||||
|
Asset-backed securities
|
—
|
|
38
|
|
38
|
|
|||
|
Corporate bonds
|
—
|
|
87
|
|
87
|
|
|||
|
U.S. government agencies and government-sponsored agencies
|
—
|
|
6
|
|
6
|
|
|||
|
U.S. treasuries
|
—
|
|
20
|
|
20
|
|
|||
|
Other debt securities
|
—
|
|
11
|
|
11
|
|
|||
|
Total investments
|
—
|
|
162
|
|
162
|
|
|||
|
Restricted cash equivalents:
|
|||||||||
|
Money market mutual funds
|
229
|
|
—
|
|
229
|
|
|||
|
Commercial paper
|
21
|
|
—
|
|
21
|
|
|||
|
Total restricted cash equivalents
|
250
|
|
—
|
|
250
|
|
|||
|
Restricted investments:
|
|||||||||
|
U.S. treasuries
|
—
|
|
14
|
|
14
|
|
|||
|
Exchange traded fund
|
1
|
|
—
|
|
1
|
|
|||
|
Certificate of deposit
|
—
|
|
2
|
|
2
|
|
|||
|
Total restricted investments
|
1
|
|
16
|
|
17
|
|
|||
|
Total investments and restricted cash equivalents and investments
|
$
|
252
|
|
$
|
185
|
|
$
|
437
|
|
|
December 31, 2017
|
|||||||||
|
Restricted cash equivalents:
|
|||||||||
|
Money market mutual funds
|
$
|
199
|
|
$
|
—
|
|
$
|
199
|
|
|
Commercial paper
|
21
|
|
—
|
|
21
|
|
|||
|
Total restricted cash equivalents
|
220
|
|
—
|
|
220
|
|
|||
|
Restricted investments:
|
|||||||||
|
U.S. treasuries
|
37
|
|
—
|
|
37
|
|
|||
|
Exchange traded fund
|
1
|
|
—
|
|
1
|
|
|||
|
Certificate of deposit
|
—
|
|
2
|
|
2
|
|
|||
|
Total restricted investments
|
38
|
|
2
|
|
40
|
|
|||
|
Total restricted cash equivalents and investments
|
$
|
258
|
|
$
|
2
|
|
$
|
260
|
|
Fair Value of Financial Instruments Disclosure
Notes Payable
The carrying value of our notes payable at
June 30, 2018
and
December 31, 2017
was
$425 million
. The estimated fair values of our notes payable at
June 30, 2018
and
December 31, 2017
were
$423 million
and
$428 million
, respectively. These valuations are considered Level 2 in the hierarchy for fair value measurement and are based on quoted market prices.
|
FINANCIAL STATEMENTS
|
|
Equity-Based Incentive Plans
Our 2009 Equity Incentive Plan (2009 Plan) provides for the grant of stock awards, including stock options, restricted stock units (time-based and performance-based), restricted stock awards (time-based and performance-based) and other equity awards. The number of shares available for grant under this 2009 Plan as of
June 30, 2018
was approximately
12 million
.
The following table summarizes stock option activity under our 2009 Plan for the
six
months ended
June 30, 2018
:
|
Number
of Shares |
||
|
Balance at December 31, 2017
|
1,296,863
|
|
|
Exercised
|
(469,894
|
)
|
|
Forfeited
|
(17,846
|
)
|
|
Balance at June 30, 2018
|
809,123
|
|
|
Exercisable at June 30, 2018
|
766,294
|
|
The aggregate intrinsic value of stock options outstanding was
$35 million
and
$41 million
as of
June 30, 2018
and
December 31, 2017
, respectively.
In March 2018, the Equity Award Committee of the Compensation Committee granted awards of time-based restricted stock (RSAs) and performance-based restricted stock (PRSAs) to the Company's named executive officers. A recipient of RSAs owns the underlying shares of common stock upon grant and some of the benefits of ownership, such as voting and dividend rights, but the recipient may not sell those shares and realize any value on a sale, until all time-based and performance-based restrictions have been satisfied or lapsed.
For non-new hire equity awards our RSAs and restricted stock units (RSUs) are eligible to vest in equal installments on a quarterly basis over four years, subject to continued employment through the applicable vesting dates. The PRSAs are earned based on the extent to which we meet or exceed certain annual growth rate percentages. Our PRSAs granted in 2018 are designed with a single-year performance period subject to subsequent multi-year vesting requirements.
Fifty
percent of the shares earned (if any) during performance period (January 1, 2018 to December 31, 2018) will vest on December 31, 2019 and the remaining shares earned (if any) will vest on December 31, 2020. The following tables summarize RSU, performance-based restricted stock unit (PSU), RSA, and PRSA activity under our 2009 Plan for the
six
months ended
June 30, 2018
:
|
RSUs
|
PSUs
|
|||||||||
|
Number of Units
|
Weighted-Average
Grant Date
Fair Value
|
Number of Units
|
Weighted-Average
Grant Date
Fair Value
|
|||||||
|
Nonvested at December 31, 2017
|
2,249,661
|
|
$
|
24.83
|
|
453,674
|
|
$
|
30.72
|
|
|
Granted
|
585,484
|
|
47.36
|
|
23,842
|
|
47.61
|
|
||
|
Vested
|
(545,292
|
)
|
25.09
|
|
(82,066
|
)
|
33.51
|
|
||
|
Forfeited
|
(200,961
|
)
|
26.76
|
|
(65,557
|
)
|
31.60
|
|
||
|
Nonvested at June 30, 2018
|
2,088,892
|
|
$
|
30.89
|
|
329,893
|
|
$
|
31.08
|
|
|
FINANCIAL STATEMENTS
|
|
|
RSAs
|
PRSAs
|
|||||||||
|
Number of Units
|
Weighted-Average
Grant Date
Fair Value
|
Number of Units
|
Weighted-Average
Grant Date
Fair Value
|
|||||||
|
Nonvested at December 31, 2017
|
—
|
|
$
|
—
|
|
—
|
|
$
|
—
|
|
|
Granted
|
116,559
|
|
49.12
|
|
256,224
|
|
48.98
|
|
||
|
Vested
|
(4,560
|
)
|
47.61
|
|
—
|
|
—
|
|
||
|
Nonvested at June 30, 2018
|
111,999
|
|
$
|
49.81
|
|
256,224
|
|
$
|
48.98
|
|
Stock-Based Compensation
Stock-based compensation expense is measured based on the fair value of the stock option on the grant date and recognized over the requisite service period for each separately vesting portion of the stock option award. Stock-based compensation expense and other disclosures for stock-based awards made to our employees pursuant to the equity plans was as follows:
|
|
Three Months Ended
June 30, |
Six Months Ended
June 30, |
|||||||||||
|
(in millions)
|
2018
|
2017
|
2018
|
2017
|
|||||||||
|
Cost of providing services
|
$
|
2
|
|
$
|
2
|
|
$
|
4
|
|
$
|
4
|
|
|
|
Sales and marketing
|
2
|
|
2
|
|
4
|
|
3
|
|
|||||
|
General and administrative
|
5
|
|
3
|
|
9
|
|
5
|
|
|||||
|
Systems development and programming costs
|
1
|
|
1
|
|
2
|
|
2
|
|
|||||
|
Total stock-based compensation expense
|
$
|
10
|
|
$
|
8
|
|
$
|
19
|
|
$
|
14
|
|
|
|
Income tax benefit related to stock-based compensation expense
|
$
|
3
|
|
$
|
3
|
|
$
|
5
|
|
$
|
5
|
|
|
|
Tax benefit realized from stock options exercised and similar awards
|
$
|
7
|
|
$
|
10
|
|
$
|
13
|
|
$
|
16
|
|
|
Stock Repurchases
The board of directors authorizes repurchases through an ongoing program initiated in May 2014. During the
six
months ended
June 30, 2018
, we repurchased
594,799
shares of common stock for approximately
$30 million
. As of
June 30, 2018
, approximately
$106 million
remained available for further repurchases of our common stock under our ongoing stock repurchase program under all authorizations from our board of directors.
|
FINANCIAL STATEMENTS
|
|
As of
June 30, 2018
and
December 31, 2017
, notes payable consisted of the following:
|
(in millions)
|
June 30,
2018 |
December 31,
2017 |
Annual
Contractual Interest Rate |
Effective Interest Rate
|
Maturity
Date |
|||||||
|
Term Loan A
|
$
|
—
|
|
$
|
303
|
|
July 2019
|
|||||
|
Term Loan A-2
|
—
|
|
122
|
|
July 2019
|
|||||||
|
2018 Term Loan A
|
425
|
|
—
|
|
3.78
|
%
|
(1)
|
3.88
|
%
|
June 2023
|
||
|
Total term loans
|
425
|
|
425
|
|
||||||||
|
Deferred loan costs
|
(2
|
)
|
(2
|
)
|
||||||||
|
Less: current portion
|
(21
|
)
|
(40
|
)
|
||||||||
|
Notes payable, noncurrent
|
$
|
402
|
|
$
|
383
|
|
||||||
|
(1)
|
Bears interest at LIBOR plus
1.625%
or the prime rate plus
0.625%
at our option in the first full fiscal quarter of the term loan, thereafter subject to certain rate adjustments based on our total leverage ratio.
|
In June 2018 we refinanced approximately
$415 million
of, and repaid in full, our outstanding A and A-2 term loans (together, our 2014 Term Loans) under our previous credit agreement (our 2014 Credit Agreement). Our 2014 Term Loans were replaced with a
$425 million
term loan A (our 2018 Term Loan) under our new credit agreement (our 2018 Credit Agreement). We also replaced our previous
$75 million
revolving credit facility established under our 2014 Credit Agreement with a
$250 million
revolving credit facility under our 2018 Credit Agreement (our 2018 Revolver), which will be used solely for working capital and other general corporate purposes. As part of this approximately
$415 million
refinancing transaction,
$204 million
was recorded as an extinguishment, and
$211 million
was rolled over into the 2018 Term Loan and was treated as a debt modification. As of June 30, 2018,
$425 million
was outstanding under our 2018 Term Loan and the full amount of our 2018 Revolver, less approximately
$16 million
representing an undrawn letter of credit, was available.
We incurred approximately
$4 million
in fees and acquisition costs related to our June 2018 refinancing, of which we capitalized approximately
$3 million
allocated proportionally between our 2018 Term Loan and 2018 Revolver. As a result of this modification, we expensed approximately
$2 million
in new and existing fees.
Interest on our 2018 Term Loan is payable quarterly. We are required to pay a quarterly commitment fee on the daily unused amount of the commitments under our 2018 Revolver, as well as fronting fees and other customary fees for letters of credit issued under our 2018 Revolver, which is subject to adjustments based on our total leverage ratio.
Borrowings under our 2018 Term Loan and 2018 Revolver are secured by substantially all of our assets, other than excluded assets as defined in our 2018 Credit Agreement, which includes certain customary assets, assets held in trusts as collateral and WSE related assets.
We are permitted to make voluntary prepayments at any time without payment of a premium. We are required to make mandatory prepayments of term loans (without payment of a premium) with (i) net cash proceeds from issuances of debt (other than certain permitted debt), and (ii) net cash proceeds from certain non-ordinary course asset sales and casualty and condemnation proceeds (subject to reinvestment rights and other exceptions).
Our 2018 Term Loan will be repaid in quarterly installments in aggregate annual amounts as follows (in millions):
|
Year ending December 31,
|
||||||||||||||||||
|
2018
|
2019
|
2020
|
2021
|
2022
|
Thereafter
|
|||||||||||||
|
Term loan repayments
|
$
|
11
|
|
$
|
21
|
|
$
|
21
|
|
$
|
21
|
|
$
|
21
|
|
$
|
330
|
|
Our 2018 Credit Agreement contains customary representations and warranties, and customary affirmative and negative covenants applicable to us, including, among other things, restrictions on indebtedness, liens, investments, mergers, dispositions, prepayment of indebtedness (other than our 2018 Term Loan and our 2018 Revolver), dividends, distributions and transactions with affiliates.
|
FINANCIAL STATEMENTS
|
|
Our 2018 Credit Agreement restricts our ability to make certain types of payments including dividends and stock repurchases and other similar distributions, though such payments may generally be made as long as our total leverage ratio remains below
3.00
to
1.00
after the effect of these payments and there exists no default under the New Credit Agreement.
The financial covenants under our 2018 Credit Agreement require us to maintain a minimum consolidated interest coverage ratio of at least
3.50
to
1.00
at each quarter end and a maximum total leverage ratio of
3.50
to
1.00
. In the event of an acquisition the maximum ratio can be raised to
4.00
to
1.00
for four consecutive quarters. We were in compliance with these financial covenants under the credit facilities at June 30, 2018.
The following table presents the computation of our basic and diluted EPS attributable to our common stock:
|
|
Three Months Ended
June 30, |
Six Months Ended
June 30, |
|||||||||||
|
(in millions, except per share data)
|
2018
|
2017
|
2018
|
2017
|
|||||||||
|
Net income
|
$
|
58
|
|
$
|
40
|
|
$
|
112
|
|
$
|
69
|
|
|
|
Weighted average shares of common stock outstanding
|
70
|
|
69
|
|
70
|
|
69
|
|
|||||
|
Basic EPS
|
$
|
0.82
|
|
$
|
0.58
|
|
$
|
1.59
|
|
$
|
1.00
|
|
|
|
Net income
|
$
|
58
|
|
$
|
40
|
|
$
|
112
|
|
$
|
69
|
|
|
|
Weighted average shares of common stock
|
70
|
|
69
|
|
70
|
|
69
|
|
|||||
|
Dilutive effect of stock options and restricted stock units
|
3
|
|
2
|
|
2
|
|
2
|
|
|||||
|
Weighted average shares of common stock outstanding
|
73
|
|
71
|
|
72
|
|
71
|
|
|||||
|
Diluted EPS
|
$
|
0.80
|
|
$
|
0.56
|
|
$
|
1.55
|
|
$
|
0.97
|
|
|
|
Common stock equivalents excluded from income per diluted share because of their anti-dilutive effect
|
—
|
|
—
|
|
1
|
|
—
|
|
|||||
Our effective income tax rate was
19%
and
24%
for the three months ended
June 30, 2018
and
2017
, respectively, and
19%
and
29%
for the six months ended
June 30, 2018
and
2017
, respectively. The decreases consisted of tax benefits recognized from excess tax benefits related to stock-based compensation, an increase in excludable income for state income tax purposes and a reduction of the federal corporate income tax rate from 35% to 21% pursuant to the Tax Cuts and Jobs Act (TCJA).
During the six months ended June 30, 2018, there was a de minimis increase in our unrecognized tax benefits. The total amount of gross interest and penalties accrued was immaterial. Our unrecognized tax benefits are not expected to change significantly during the next 12 months.
We are subject to tax in U.S. federal and various state and local jurisdictions, as well as Canada. We are not subject to any material income tax examinations in federal or state jurisdictions for tax years prior to January 1, 2011. We previously paid Notices of Proposed Assessments disallowing employment tax credits totaling
$11 million
, plus interest of
$4 million
in connection with the IRS examination of Gevity HR, Inc. and its subsidiaries, which was acquired by TriNet in June 2009. This issue is being resolved through the litigation process. While we continue to support our position and will continue to vigorously defend our position through the litigation process, we anticipate our recovery of the refund to likely be less than the total amount in dispute.
Lease Commitments
We lease office facilities, including our headquarters and other facilities, and equipment under non-cancellable operating leases. For detail of these commitments refer to Note 13 in Part II, Item 8 in our
2017
Form 10-K.
|
FINANCIAL STATEMENTS
|
|
Credit Facilities
We maintain a
$250 million
revolving credit facility which includes capacity for a
$20 million
swingline facility. Letters of credit issued pursuant to the revolving credit facility reduce the amount available for borrowing under the revolving credit facility. The total unused portion of the revolving credit facility was
$234 million
as of
June 30, 2018
.
The terms of the credit agreement governing the revolving credit facility require us to maintain certain financial ratios at each quarter end. We were in compliance with these covenants at
June 30, 2018
.
We also have a $
5 million
line of credit facility to secure standby letters of credit related to our workers' compensation obligations. At
June 30, 2018
, the total unused portion of the credit facility was $
3 million
.
Standby Letters of Credit
We have
two
standby letters of credit totaling
$18 million
provided as collateral for our workers’ compensation obligations. At
June 30, 2018
, the facilities were not drawn down.
Contingencies
In August 2015, Howard Welgus, a purported stockholder, filed a putative securities class action lawsuit,
Welgus v. TriNet Group, Inc., et. al.
, under the Securities Exchange Act of 1934 in the United States District Court for the Northern District of California. The complaint was later amended in April 2016 and again in March 2017. On December 18, 2017, the district court granted TriNet’s motion to dismiss the amended complaint in its entirety, without leave to amend. Plaintiff filed a notice of appeal of the district court’s order on January 17, 2018. Plaintiff-Appellant filed his opening appeal brief before the Ninth Circuit Court of Appeals on April 27, 2018. TriNet filed a responsive brief on June 29, 2018. Plaintiff-Appellant’s reply brief is due August 20, 2018. We see no basis for reversal of the district court's decision. We are unable to reasonably estimate the possible loss or expense, or range of losses and expenses, if any, arising from this litigation.
We are and, from time to time,
have been and may in the future become involved in various litigation matters, legal proceedings, and claims arising in the ordinary course of our business, including disputes with our clients or various class action, collective action, representative action, and other proceedings arising from the nature of our co-employment relationship with our clients and WSEs in which we are named as a defendant. In addition, due to the nature of our co-employment relationship with our clients and WSEs, we could be subject to liability for federal and state law violations, even if we do not participate in such violations. While our agreements with our clients contain indemnification provisions related to the conduct of our clients, we may not be able to avail ourselves of such provisions in every instance. We have accrued our current best estimates of probable losses with respect to these matters, which are individually and in aggregate immaterial to our consolidated financial statements.
While the outcome of the matters described above cannot be predicted with certainty, management currently does not believe that any such claims or proceedings or the above mentioned securities class action will have a materially adverse effect on our consolidated financial position, results of operations, or cash flows. However, the unfavorable resolution of any particular matter or our reassessment of our exposure for any of the above matters based on additional information obtained in the future could have a material impact on our consolidated financial position, results of operations, or cash flows.
|
OTHER INFORMATION
|
|
Legal Proceedings
For the information required in this section, refer to Note 10 in the condensed consolidated financial statements and related notes included in this Form 10-Q.
Risk Factors
There have been no material changes in our risk factors disclosed in Part 1, Item 1A, of our
2017
Form 10-K.
Unregistered Sales of Equity Securities and Use of Proceeds
(a) Sales of Unregistered Securities
Not applicable.
(b) Use of Proceeds from Sales of Unregistered Securities
Not applicable.
(c) Issuer Purchases of Equity Securities
The following table provides information about our purchases of TriNet common stock during the quarter ended
June 30, 2018
:
|
Period
|
Total Number of
Shares
Purchased
(1)
|
Weighted Average Price
Paid Per Share |
Total Number of
Shares Purchased as Part of Publicly Announced Plans (2) |
Approximate Dollar Value ($ millions)
of Shares that May Yet be Purchased Under the Plans (2) |
|||||||||
|
April 1 - April 30, 2018
|
188,566
|
|
$
|
48.64
|
|
175,700
|
|
$
|
120
|
|
|||
|
May 1 - May 31, 2018
|
245,496
|
|
$
|
52.68
|
|
165,900
|
|
$
|
112
|
|
|||
|
June 1 - June 30, 2018
|
93,166
|
|
$
|
55.39
|
|
93,166
|
|
$
|
106
|
|
|||
|
Total
|
527,228
|
|
|
434,766
|
|
|
|||||||
|
(1)
|
Includes shares surrendered by employees to us to satisfy tax withholding obligations that arose upon vesting of restricted stock units granted pursuant to approved plans.
|
|
(2)
|
We repurchased a total of approximately
$22 million
of our outstanding common stock during the three months ended
June 30, 2018
.
|
As of
June 30, 2018
, we had approximately
$106 million
remaining for repurchases under our stock repurchase program. Stock repurchases under the program are primarily intended to offset the dilutive effect of share-based employee incentive compensation. The purchases were funded from existing cash and cash equivalents balances.
Our stock repurchases and dividends are subject to certain restrictions under the terms of our 2018 Credit Agreement. For more information about our 2018 Credit Agreement and our stock repurchases, refer to Notes 6 and 7 in Part I, Item 1 of this Form 10-Q.
Defaults Upon Senior Securities
Not applicable.
Mine Safety Disclosures
Not applicable.
Other Information
Not applicable.
|
OTHER INFORMATION
|
|
Exhibits
Incorporated herein by reference is a list of the exhibits contained in the Exhibit Index below.
EXHIBIT INDEX
|
Incorporated by Reference
|
|
|||||||||||
|
Exhibit No.
|
Exhibit
|
Form
|
File No.
|
Exhibit
|
Filing Date
|
Filed Herewith
|
||||||
|
10.1
|
8-K
|
001-36373
|
10.1
|
6/22/2018
|
||||||||
|
31.1
|
X
|
|||||||||||
|
31.2
|
X
|
|||||||||||
|
32.1*
|
|
|
|
|
X
|
|||||||
|
101.INS
|
XBRL Instance Document
|
|
|
|
|
|
||||||
|
101.SCH
|
XBRL Taxonomy Extension Schema Linkbase Document
|
|
|
|
|
|
||||||
|
101.CAL
|
XBRL Taxonomy Extension Calculation Linkbase Document
|
|
|
|
|
|
||||||
|
101.DEF
|
XBRL Taxonomy Extension Definition Linkbase Document
|
|
|
|
|
|
||||||
|
101.LAB
|
XBRL Taxonomy Extension Label Linkbase Document
|
|
|
|
|
|
||||||
|
101.PRE
|
XBRL Taxonomy Extension Presentation Linkbase Document
|
|
|
|
|
|
||||||
|
*
|
Document has been furnished, is deemed not filed and is not to be incorporated by reference into any of TriNet Group, Inc.’s filings under the Securities Act of 1933, as amended, or the Securities Exchange Act of 1934, as amended, irrespective of any general incorporation language contained in any such filing.
|
|
|
SIGNATURES
|
|
SIGNATURES
Pursuant to the requirements of the Securities Exchange Act of 1934, as amended, the registrant has duly caused this report to be signed on its behalf by the undersigned thereunto duly authorized.
|
|
TRINET GROUP, INC.
|
||
|
|
|
||
|
Date: July 30, 2018
|
|
By:
|
/s/ Burton M. Goldfield
|
|
|
|
|
Burton M. Goldfield
|
|
|
|
|
Chief Executive Officer
|
|
|
|
|
|
|
Date: July 30, 2018
|
|
By:
|
/s/ Richard Beckert
|
|
|
|
|
Richard Beckert
|
|
|
|
|
Chief Financial Officer
|
|
Date: July 30, 2018
|
|
By:
|
/s/ Michael P. Murphy
|
|
|
|
|
Michael P. Murphy
|
|
|
|
|
Chief Accounting Officer
|
TABLE OF CONTENTS
Note 1. Description Of Business and Significant Accounting PoliciesNote 2. Cash, Cash Equivalents and InvestmentsNote 3. InvestmentsNote 4. Workers' Compensation Loss ReservesNote 5. Financial Instruments and Fair Value MeasurementsNote 6. Stockholders EquityNote 7. Notes PayableNote 8. Earnings Per Share (eps)Note 8. Earnings Per SharNote 9. Income TaxesNote 10. Commitments and Contingencies