TURNING POINT BRANDS, INC.
10-Ks and 10-Qs
|
|
|
|
|
|
|
|
|
|
|
|
|
|
|
|
|
|
|
|
|
|
|
|
|
|
|
|
|
|
|
|
|
|
|
|
|
|
|
|
|
|
|
|
|
|
|
|
|
|
|
|
|
|
|
|
|
|
|
|
|
|
|
|
|
|
|
|
|
|
|
|
|
|
|
|
|
|
|
|
|
|
|
|
|
|
|
|
|
|
|
|
|
|
|
|
|
|
|
|
|
|
|
|
|
|
|
|
|
|
|
|
|
|
|
|
|
|
|
|
|
|
|
|
|
|
|
|
|
|
|
|
|
|
|
|
|
|
|
|
|
|
|
|
|
|
|
|
|
|
|
UNITED STATES
SECURITIES AND EXCHANGE COMMISSION
WASHINGTON, D.C. 20549
FORM 10-K
(Mark One)
| ☒ |
ANNUAL REPORT PURSUANT TO SECTION 13 OR 15(d) OF THE SECURITIES EXCHANGE ACT OF 1934
|
For the fiscal year ended December 31, 2017
OR
| ☐ |
TRANSITION REPORT PURSUANT TO SECTION 13 OR 15(d) OF THE SECURITIES EXCHANGE ACT OF 1934
|
For the transition period from_______________ to ________________
Commission file number: 001-37763
TURNING POINT BRANDS, INC.
(Exact name of registrant as specified in its charter)
|
Delaware
|
20-0709285
|
|
|
(State or other jurisdiction of incorporation or organization)
|
(I.R.S. Employer Identification No.)
|
|
|
5201 Interchange Way, Louisville, KY
|
40229
|
|
|
(Address of principal executive offices)
|
(Zip Code)
|
(502) 778-4421
(Registrant’s telephone number, including area code)
Securities registered pursuant to Section 12(b) or the Act:
|
Title of each class
|
Name of each exchange on which registered
|
|
|
Common Stock, $0.01 par value
|
New York Stock Exchange
|
Securities registered pursuant to Section 12(g) of the Act: None
Indicate by check mark if the registrant is a well-known seasoned issuer, as defined in Rule 405 of the Securities Act. ☐ Yes ☑ No
Indicate by check mark if the registrant is not required to file reports pursuant to Section 13 or Section 15(d) of the Act. ☐ Yes ☑ No
Indicate by check mark whether the registrant (1) has filed all reports required to be filed by Section 13 or 15(d) of the Securities Exchange Act of 1934 during the preceding 12 months (or for such shorter period that the registrant was required to file such reports), and (2) has been subject to such filing requirements for the past 90 days. ☑ Yes☐ No
Indicate by check mark whether the registrant has submitted electronically and posted on its corporate Web site, if any, every Interactive Data File required to be submitted and posted pursuant to Rule 405 of Regulation S-T (§232.405 of this chapter) during the preceding 12 months (or for such shorter period that the registrant was required to submit and post such files). ☑ Yes ☐ No
Indicate by check mark if disclosure of delinquent filers pursuant to Item 405 of Regulation S-K (§229.405 of this chapter) is not contained herein, and will not be contained, to the best of registrant’s knowledge, in definitive proxy or information statements incorporated by reference in Part III of this Form 10-K or any amendment to this Form 10-K. ☐
Indicate by check mark whether the registrant is a large accelerated filer, an accelerated filer, a non-accelerated filer, a smaller reporting company, or an emerging growth company. See the definitions of “large accelerated filer,” “accelerated filer,” “smaller reporting company,” and “emerging growth company” in Rule 12b-2 of the Exchange Act.
|
Large accelerated filer
|
☐ |
|
Accelerated filer
|
☑
|
||
|
Non-accelerated filer
|
☐ |
(Do not check if a smaller reporting company)
|
Smaller reporting company
|
☐
|
||
|
Emerging growth company
|
☑ |
|
If an emerging growth company, indicate by check mark if the registrant has elected not to use the extended transition period for complying with any new or revised financial accounting standards provided pursuant to Section 13(a) of the Exchange Act
☑
Indicate by check mark whether the registrant is a shell company (as defined in Rule 12b-2 of the Exchange Act).
☐
Yes
☑
No
As of June 30, 2017, the aggregate market value of the registrant’s common stock held by non-affiliates of the registrant was approximately $119 million based on the closing sale price of the common stock as reported on the New York Stock Exchange.
At
March 1, 2018,
there were 19,222,804 shares outstanding of the registrant’s voting common stock, par value $0.01 per share.
DOCUMENTS INCORPORATED BY REFERENCE
Portions of the registrant’s definitive proxy statement for use in connection with its annual meeting of stockholders to be held on May 8, 2018, expected to be filed with the Securities and Exchange Commission on or about March 29, 2018, are incorporated by reference into Part III hereof.
TURNING POINT BRANDS, INC.
|
Page No.
|
|||
| PART I | |||
|
ITEM 1.
|
4
|
||
|
ITEM 1A.
|
13
|
||
|
ITEM 1B.
|
28
|
||
|
ITEM 2.
|
28
|
||
|
ITEM 3.
|
28
|
||
|
ITEM 4.
|
29
|
||
| PART II | |||
|
ITEM 5.
|
30
|
||
|
ITEM 6.
|
31
|
||
|
ITEM 7.
|
33
|
||
|
ITEM 7A.
|
45
|
||
|
ITEM 8.
|
46
|
||
|
ITEM 9.
|
78
|
||
|
ITEM 9A.
|
78
|
||
|
ITEM 9B.
|
79
|
||
| PART III | |||
|
ITEM 10.
|
80
|
||
|
ITEM 11.
|
80
|
||
|
ITEM 12.
|
80
|
||
|
ITEM 13.
|
80
|
||
|
ITEM 14.
|
|||
| PART IV | |||
|
ITEM 15.
|
81
|
||
|
ITEM 16.
|
85
|
||
|
86
|
|||
Cautionary Note Regarding Forward-Looking Statements
This annual report on Form 10-K contains forward-looking statements within the meaning of the federal securities laws. Forward-looking statements may generally be identified by the use of words such as "anticipate," "believe," "expect," "intend," "plan" and "will" or, in each case, their negative, or other variations or comparable terminology. These forward-looking statements include all matters that are not historical facts. By their nature, forward-looking statements involve risks and uncertainties because they relate to events and depend on circumstances that may or may not occur in the future. As a result, actual events may differ materially from those expressed in or suggested by the forward-looking statements. Any forward-looking statement made by TPB in this annual report on Form 10-K speaks only as of the date hereof. New risks and uncertainties come up from time to time, and it is impossible for TPB to predict these events or how they may affect it. TPB has no obligation, and does not intend, to update any forward-looking statements after the date hereof, except as required by federal securities laws. Factors that could cause these differences include, but are not limited to:
| · |
declining sales of tobacco products, and expected continuing decline of sales, in the tobacco industry overall;
|
| · |
our dependence on a small number of third-party suppliers and producers;
|
| · |
the possibility that we will be unable to identify or contract with new suppliers or producers in the event of a supply or product disruption;
|
| · |
the possibility that our licenses to use certain brands or trademarks will be terminated, challenged or restricted;
|
| · |
failure to maintain consumer brand recognition and loyalty of our customers;
|
| · |
substantial and increasing U.S. regulation;
|
| · |
regulation of our products by the FDA, which has broad regulatory powers;
|
| · |
uncertainty related to the regulation and taxation of our NewGen products;
|
| · |
possible significant increases in federal, state and local municipal tobacco-related taxes;
|
| · |
possible increasing international control and regulation;
|
| · |
our reliance on relationships with several large retailers and national chains for distribution of our products;
|
| · |
our amount of indebtedness;
|
| · |
the terms of our credit facilities, which may restrict our current and future operations;
|
| · |
intense competition and our ability to compete effectively;
|
| · |
uncertainty and continued evolution of markets containing our NewGen products;
|
| · |
significant product liability litigation;
|
| · |
the scientific community’s lack of information regarding the long-term health effects of electronic cigarettes, vaporizer and e-liquid use;
|
| · |
requirement to maintain compliance with master settlement agreement escrow account;
|
| · |
competition from illicit sources;
|
| · |
our reliance on information technology;
|
| · |
security and privacy breaches;
|
| · |
contamination of our tobacco supply or products;
|
| · |
infringement on our intellectual property;
|
| · |
third-party claims that we infringe on their intellectual property;
|
| · |
failure to manage our growth;
|
| · |
failure to successfully integrate our acquisitions or otherwise be unable to benefit from pursuing acquisitions;
|
| · |
fluctuations in our results;
|
| · |
exchange rate fluctuations;
|
| · |
adverse U.S. and global economic conditions;
|
| · |
sensitivity of end-customers to increased sales taxes and economic conditions;
|
| · |
failure to comply with certain regulations;
|
| · |
departure of key management personnel or our inability to attract and retain talent;
|
| · |
imposition of significant tariffs on imports into the U.S.;
|
| · |
reduced disclosure requirements applicable to emerging growth companies may make our common stock less attractive to investors, potentially decreasing our stock price;
|
| · |
failure to maintain our status as an emerging growth company before the five-year maximum time period a company may retain such status;
|
| · |
our principal stockholders will be able to exert significant influence over matters submitted to our stockholders and may take certain actions to prevent takeovers;
|
| · |
our certificate of incorporation and bylaws, as well as Delaware law and certain regulations, could discourage or prohibit acquisition bids or merger proposals, which may adversely affect the market price of our common stock;
|
| · |
our certificate of incorporation limits the ownership of our common stock by individuals and entities that are Restricted Investors. These restrictions may affect the liquidity of our common stock and may result in Restricted Investors being required to sell or redeem their shares at a loss or relinquish their voting, dividend and distribution rights;
|
| · |
future sales of our common stock in the public market could reduce our stock price, and any additional capital raised by us through the sale of equity or convertible securities may dilute your ownership in us;
|
| · |
we may issue preferred stock whose terms could adversely affect the voting power or value of our common stock; and
|
| · |
our status as a “controlled company” could make our common stock less attractive to some investors or otherwise harm our stock price.
|
PART I
Turning Point Brands, Inc., Overview
Turning Point Brands, Inc. (the “Company,” “we,” “our,” or “us”) is a leading, independent provider of Other Tobacco Products (“OTP”) in the U.S. We estimate the OTP industry generated approximately $11 billion of manufacturer revenue in 2017.
In contrast to manufactured cigarettes, which have been experiencing declining volumes for decades based on data published by the Alcohol and Tobacco Tax and Trade Bureau (“TTB”), the OTP industry is demonstrating increased consumer appeal with low to mid-single digit consumer unit growth as reported by Management Science Associates, Inc. (“MSAi”), a third-party analytics and information company. We were the 6th largest competitor in terms of total OTP consumer units sold during 2017. We sell a wide range of products across the OTP spectrum; however, we do not sell cigarettes. Our portfolio of brands includes some of the most widely recognized names in the OTP industry, such as
Zig-Zag
®
,
Beech-Nut
®
,
Stoker’s
®
,
Trophy
®
,
VaporBeast
®
, and
Vapor Shark
®
. We currently ship to approximately 800 distributors with an additional 100 secondary, indirect wholesalers in the U.S. that carry and sell our products.
We operate in three segments: (i) Smokeless products, (ii) Smoking products, and (iii) NewGen products. Information regarding net sales, operating income, and assets attributable to each of our segments is included within Note 20 of our Notes to Consolidated Financial Statements, which are incorporated herein by reference.
We have a portfolio of widely recognized brands with significant customer loyalty. We have an experienced management team that possesses long-standing industry relationships and a deep understanding of the OTP industry. We have identified additional opportunities to grow sales, including the launch of new products and expanding our distribution and salesforce. We also believe there are meaningful opportunities to grow through acquisitions and joint ventures across all product categories. As of December 31, 2017, our products are available in approximately 170,000 U.S. retail locations which, with the addition of retail stores in Canada, brings our total North American retail presence to an estimated 200,000 points of distribution. Our sales team targets widespread distribution to all traditional retail channels, including convenience stores, where over 60% of all OTP volume is currently sold, according to MSAi.
Smokeless Segment
Our Smokeless segment includes both loose leaf chewing tobacco and moist snuff tobacco (“MST”). Our Smokeless focus brand is Stoker’s in both chewing tobacco and MST.
Stoker’s
®
chewing tobacco has grown considerably over the last several years and is presently the #1 discount brand and the second largest brand in the industry, with approximately 18% market share. Our status in the chew market is further strengthened by
Beech-Nut
®
, the #3 premium brand and #6 overall, as well as
Trophy
®
,
Durango
®
, and the five Wind River Brands we acquired in November 2016. Refer to Note 4 of Notes to Consolidated Financial Statements for further details regarding this acquisition. Collectively, the company is the #2 marketer of chewing tobacco with approximately 28% market share. Our chewing tobacco operations are facilitated through our long-standing relationship with Swedish Match, the manufacturer of our loose leaf chewing tobaccos.
1
In MST, Stoker’s remains among the fastest growing brands and holds a 6.7% share in the stores with distribution and a 2.9% share of the total U.S. MST market. Stoker’s pioneered the large 12 oz. tub packaging format and is manufactured using a proprietary process that we think results in a superior product. In late 2015, we extended the
Stoker’s
®
MST franchise to include traditional 1.2 oz. cans to broaden retail availability. Our proprietary manufacturing process is conducted at our Dresden, Tennessee, plant and packaged in both our Dresden, Tennessee, and Louisville, Kentucky facilities.
1
Smoking Segment
Our Smoking segment principally includes cigarette papers and Make-Your-Own (“MYO”) cigar wraps. The iconic strength of the
Zig-Zag
®
brand drives our leadership position in both the cigarette papers and MYO cigar wrap markets. In cigarette papers,
Zig-Zag
®
is the #1 premium cigarette paper in the U.S. with approximately 30% market share. Management estimates also indicate that
Zig-Zag
®
is the #1 brand in the promising Canadian market. Cigarette paper operations are aided by our sourcing relationships with Bolloré.
1
In MYO cigar wraps, the
Zig-Zag
®
brand commands about three-quarters of the market and continues to innovate in novel ways, including our recent introduction of
Zig-Zag
®
‘Rillo sized wraps which are similar in size to cigarillos, the most popular and fastest growing type of machine-made cigars. MYO cigar wraps operations are facilitated by our long-standing commercial relationship with the patent holder, Durfort.
1
1
Brand rankings and market share percentages obtained from MSAi as of December 31, 2017.
NewGen Segment
Our NewGen segment includes our recent acquisitions of Smoke Free Technologies, d/b/a VaporBeast (“VaporBeast”), and The Hand Media and its subsidiaries, d/b/a Vapor Shark (collectively, “Vapor Shark”), which have solidified our status as a major player within the segment, in addition to V2 branded products. Refer to Note 4 of our Notes to Consolidated Financial Statements for further details regarding these acquisitions. VaporBeast is a leading distributor of liquid vapor products servicing the non-traditional retail channel. Vapor Shark is a leading distributor and manufacturer of premium vaping e-liquids with nationwide distribution through non-traditional retail as well as Vapor Shark branded retail locations. Our acquisition of VaporBeast, and subsequent acquisition of Vapor Shark, accelerated our entry into the non-traditional retail outlets for vaporizers, e-liquids, and accessories, which we estimate sell greater than 50% of all liquid vapor volume. We believe our NewGen business will expand further as consumers continue to move from combustible cigarettes to vaping. We believe we are well-positioned to act as a consolidator in the NewGen space in anticipation of increased regulation and will continue to explore potential acquisitions.
IPO
In our May 2016 initial public offering (the “IPO”), we sold 6,210,000 shares of our voting common stock at a public offering price per share of $10.00. We raised a total of approximately $62.1 million in gross proceeds from the IPO which amounted to $58.2 million in net proceeds after deducting underwriting commissions and other associated costs. We used the proceeds from the IPO, together with cash on hand, to pay fees and expenses related to the IPO; repurchase outstanding warrants and options issued by our subsidiary Intrepid Brands, LLC (“Intrepid”); repay approximately $34 million of our floating rate PIK Toggle Notes due 2021; and repay approximately $20 million in borrowings outstanding under our second lien credit facility.
Competitive Strengths
We believe our competitive strengths include the following:
Large, Leading Brands with Significant Scale
We have built a portfolio of leading brands with significant scale that are well recognized by consumers, retailers, and wholesalers. Our
Stoker’s
®
and
Zig-Zag
®
brands are each well established and date back 78 and 118 years, respectively. Though the NewGen segment is relatively new within the OTP industry, our 2016 acquisition of VaporBeast added a leading seller of e-liquids, devices, and accessories. In 2017,
Stoker’s
®
,
Zig-Zag
®
, and
VaporBeast
®
together generated approximately $261 million of gross sales, or 84% of our consolidated gross sales. Specifically:
| · |
Stoker’s
®
is the #2 loose leaf chewing tobacco brand and among the fastest growing MST brands in the industry. We manufacture
Stoker’s
®
MST using only 100% American Leaf, utilizing a proprietary process to produce what we believe is a superior product.
|
| · |
Zig-Zag
®
is the #1 cigarette paper brand in terms of retail dollar sales in the U.S., as measured by Nielsen Convenience, with significant distribution in Canada.
Zig-Zag
®
is also the #1 MYO cigar wrap brand in the U.S.
|
| · |
VaporBeast is a leading distributor of liquid vapor products to the non-traditional retail channel. Revenue growth at VaporBeast has been delivered through a more effective selling process, which generated increased order sizes and the frequency of customer orders.
|
We believe the
Stoker’s
®
brand is seen as an innovator in both the loose leaf chewing tobacco and moist snuff markets.
Zig-Zag
®
is an iconic brand and has strong, enduring brand recognition among a wide audience of consumers.
VaporBeast is a powerful distribution engine that allows us to further penetrate the vaporizer and e-liquids markets via non-traditional retail outlets.
Successful Track Record of New Product Launches and Category Expansions
We have successfully launched new products and entered new product categories by leveraging the strength of our brands. We methodically target markets which we believe have significant growth potential. We have been successful in entering new product categories by extending existing products and brands in addition to introducing new products:
| · |
We leveraged the proud legacy and value of the
Stoker’s
®
brand to introduce a 12 oz. MST tub, a product whose size was not offered by any other market participant at the time of introduction.
Stoker’s
®
MST has been among the fastest growing moist snuff brands in the industry in terms of pounds sold. While competitors have introduced larger format tub packaging, the early entry and differentiation of the
Stoker’s
®
product have firmly established us as the market leader with over 50% of the Tub market. In third quarter 2015, we introduced
Stoker’s
®
MST in 1.2 oz. cans to further expand retail penetration, particularly in convenience stores.
|
| · |
In 2009, we extended the
Zig-Zag
®
tobacco brand into the MYO cigar wraps market and captured a 50% market share within the first two years. We are now the market share leader for MYO cigar wraps with a 76% share. We believe our success was driven by the
Zig-Zag
®
tobacco branding, which we feel is widely understood by consumers to represent a favorable, customizable experience ideally suited to MYO products.
|
| · |
VaporBeast
quickly established itself as a leading marketer and distributor of liquid vapor products to the non-traditional retail universe. With its national footprint, VaporBeast is leveraging its regional consumer preference insights to further accelerate sales advances.
|
We strategically target product categories that we believe demonstrate significant growth potential and for which the value of our brands is likely to have a meaningful impact. We believe that our track record and existing portfolio of brands provide growth advantages as we continue to evaluate opportunities to extend our product lines and expand into new categories.
Extensive Distribution Network and Data Driven Sales Organization
We have taken important steps to enhance our selling and distribution network and consumer marketing capabilities while keeping our capital expense requirements relatively low. We service our customer base with an experienced sales and marketing organization of approximately 145 professionals who possess in-depth knowledge of the tobacco industry. We extensively use data supported by leading technology to enable our salesforce to analyze changing trends and effectively identify evolving consumer preferences at the store level. We subscribe to a sales tracking system provided by MSAi that measures all OTP product shipments by all market participants, on a weekly basis, from approximately 900 wholesalers to over 250,000 retail stores in the U.S. This system enables us to understand share and volume trends across multiple categories at the individual store level, allowing us to allocate field salesforce coverage to the highest opportunity stores, thereby enhancing the value of new store placements and sales activity. Within our Stoker’s product categories, we have seen a positive correlation between the frequency of store calls by our salesforce and our retail market share. As the initial sales effort is critical to the success of a product launch, we believe our experienced salesforce, expansive distribution network, and leading market analytics put us in a strong position to swiftly execute new product launches in response to evolving consumer and market preferences.
Long-standing, Strong Relationships with an Established Set of Producers
As part of our asset-light operating model we built long-standing and extensive relationships with leading, high-quality producers. In 2017, our four most important producers were:
| · |
Swedish Match, which manufactures our loose leaf chewing tobacco;
|
| · |
Bolloré, which provides us with exclusive access to the
Zig-Zag
®
cigarette paper and accessories brand for the U.S. and Canada;
|
| · |
Durfort, from which we source our MYO cigar wraps; and
|
| · |
JJA Distributors (“JJA”), from which we source our
Zig-Zag branded cigars.
|
By outsourcing the production of products that represent approximately 87% of our gross sales to a select group of producers with whom we have strong relationships, we are able to maintain low overhead costs and minimal capital expenditures, which together drive our margins.
Experienced Management Team
With an average of 25 years of consumer products experience, including an average of 22 years in the tobacco industry, our senior management team has enabled us to grow and diversify our business while improving operational efficiency. Members of management have previous experience at other leading tobacco companies, including Altria Group, Inc. (formerly Philip Morris); Liggett & Myers Tobacco Company (now Liggett Group, a subsidiary of Vector Group ltd); Swedish Match; American Brands, Inc.; and U.S. Smokeless Tobacco Company (a subsidiary of Altria). Notably, Lawrence Wexler, our President and CEO, brings over 20 years of experience from Altria Group, Inc., where he held various leadership positions within the finance, marketing, planning, manufacturing, and sales departments. Given the professional experience of the senior management team we are able to analyze risks and opportunities from a variety of perspectives. Our senior leadership has embraced a collaborative culture in which the combined experience, analytical rigor, and creativity are leveraged to assess opportunities and deliver products that satisfy consumers’ demands.
Growth Strategies
We are focused on building sustainable margin streams, expanding the availability of our products, developing new products through innovation, and enhancing overall operating efficiencies with the goal of improving margins and cash flow. We adopted the following strategies to drive growth in our business and build stockholder value:
Grow Share of Existing Product Lines, Domestically and Internationally
We intend to remain a consumer centric organization with an innovative view and understanding of the OTP market. We believe there are meaningful opportunities for growth within the OTP market. We expect to continue to identify unmet consumer needs and provide quality products that we believe will result in genuine consumer satisfaction and foster the growth of revenue. We maintain a robust product pipeline and plan to strategically introduce new products in attractive, growing OTP segments, both domestically and internationally. For example, in addition to our successful launch of
Stoker’s
®
smaller 1.2 oz. MST cans, we believe there are opportunities for new products in the MST pouch, cigar, and MYO cigar wrap markets. Products currently in our pipeline include
Zig-Zag
®
Natural Leaf Wraps and
Zig-Zag
®
Unbleached/Hemp Paper in the Smoking products segment and
Primal
®
Hemp Wraps/Cones, Premium e-liquids, and Vape-not-Burn (“VnB”) devices in the NewGen products segment. We believe we have successfully built strong, powerful brands possessing significant potential.
In 2017, less than 5% of our revenues were generated outside of the U.S. Having established a strong infrastructure and negotiated relationships across multiple segments and products, we are pursuing an international growth strategy to broaden sales and strengthen margins. We believe international sales represent a meaningful growth opportunity. Our goals include expanding our presence in the worldwide OTP industry on a targeted basis. For example, we are selling our
Stoker’s
®
MST products in South America,
Zig-Zag
®
cigars in Canada, and
Primal
®
herbal wraps and cones internationally. We intend to pursue a dual path of introducing our own products and brands as well as partnering with other industry leaders to improve market access and profitability in efforts to support our international expansion.
Expand into Adjacent Categories through Innovation and New Partnerships
We continually evaluate opportunities to expand into adjacent product categories by leveraging our current portfolio or through new partnerships. In 2009, we leveraged the
Zig-Zag
®
tobacco brand and introduced
Zig-Zag
®
MYO cigar wraps with favorable results. We now command the #1 market share position for that segment. We are currently expanding our
Zig-Zag
®
MYO cigar wraps through the expansion of the
Zig-Zag
®
‘Rillo
™
size cigar wraps which are similar in size to machine-made cigarillos, the most popular and rapidly growing cigar type. Additionally, in 2015, we negotiated the worldwide, exclusive distribution rights to an herbal sheet material that does not contain tobacco or nicotine, affording us the opportunity to sell, on a global basis, an assortment of products that meet new and emerging consumer preferences. These products are sold under our
Primal
®
brand name and are a component of our NewGen product segment. We intend to continue to identify new adjacent categories for which we are able to leverage our existing brands and partnerships.
Continue to Grow a Strong NewGen Platform
The OTP category is continually evolving as consumers actively seek out new products and product forms. Given this market demand, we have developed a NewGen product platform which we believe will serve new and evolving consumer demands across multiple product categories. Core products within our existing NewGen segment include:
| · |
Electronic cigarette (“e-cigarette”) and vapor products, including e-liquids,
|
| · |
Tobacco vaporizers, which heat rather than combust the smoking material (VnB), and
|
| · |
Herbal smoking products, which contain no tobacco or nicotine.
|
Among these categories, we believe the emerging liquid vapor segment may present the greatest growth opportunity as it allows each consumer to customize his or her experience by being able to choose both flavor and nicotine level. Although the liquid vapor segment is in its infancy, we believe that, when properly commercialized, it may be highly disruptive to the combustible cigarette industry and emerge as a more significant segment of the OTP market. We believe a majority of current liquid vapor revenues are earned outside of the traditional retail environment through online sales or in non-traditional retail outlets. Our recent acquisitions of VaporBeast and Vapor Shark accelerate our expansion into the non-traditional retail outlets for liquid vapor products.
Outside of the tobacco space, we believe there are meaningful opportunities for herbal smoking products like wraps and cones. To capitalize on these opportunities, we have obtained the exclusive rights to a proprietary and patented herbal sheet process that enables us to meet consumer interest and achieve strong margins. These products are marketed and sold on a worldwide basis under our
Primal
™
brand as discussed above.
We believe the categories within our NewGen segment are poised to be the key industry growth drivers in the future, and we are well-positioned to capitalize on this growth. We intend to continue to pursue growth of our NewGen product platform by offering unique and innovative products to address evolving consumer demands.
Strategically Pursue Acquisitions
We believe there are meaningful acquisition opportunities in the fragmented OTP space. We regularly evaluate acquisition opportunities across the OTP landscape. In evaluating acquisition opportunities, our focus is on identifying acquisitions that strengthen our current distribution platform and product offerings or enable category expansion in areas with high potential growth.
Substantially all of our 2017 U.S. gross margin was derived from sales of products currently regulated by the U.S. Food and Drug Administration (“FDA”) Center for Tobacco Products. We have significant experience in complying with the FDA regulatory regime with a compliance infrastructure composed of legal and scientific professionals. We believe many smaller OTP manufacturers currently lack this infrastructure, which we believe is necessary to comply with the broad scope of FDA regulations. We believe our regulatory compliance infrastructure, combined with our skilled management and strong distribution platform, position us to act as a consolidator within the OTP industry.
We have a strong track record of enhancing our OTP business with strategic and accretive acquisitions. For example, our acquisition of the North American
Zig-Zag
®
cigarette papers distribution rights in 1997 has made us the #1 premium cigarette paper brand in the U.S. in terms of retail dollar sales, as measured by Nielsen. Perhaps more importantly, we own the
Zig-Zag
®
tobacco trademark in the U.S. and have leveraged this asset effectively with approximately 52% of our total 2017 Zig-Zag branded gross sales under our own
Zig-Zag
®
marks rather than those we license from Bolloré. In 2003, we acquired the
Stoker’s
®
brand. We have since built the brand to a strong #2 position in the chewing tobacco industry while successfully leveraging the brand’s value through our MST expansion where it remains among the fastest growing MST brands in the industry. More recently, we have completed three acquisitions to acquire the five smokeless tobacco brands from Wind River in addition to VaporBeast and Vapor Shark.
We will continue to evaluate acquisition opportunities as they may arise while exercising care and diligence to ensure we only pursue opportunities believed to afford operational or distribution synergies and add value.
Maintain Lean, Low-Cost Operating Model
We have a lean, asset-light manufacturing and sourcing model which requires low capital expenditures and utilizes outsourced supplier relationships. We believe our asset-light model provides marketplace flexibility and allows us to achieve favorable margins. Our market analytics allow us to efficiently and effectively address evolving consumer and market demands. Our supplier relationships allow us to increase the breadth of our product offerings and quickly enter new OTP markets as management is able to focus on brand building and innovation. We intend to continue to optimize our asset-light operating model as we grow in order to maintain a low cost of operations and healthy margins. In 2017, approximately $268 million of our gross sales, or 87%, were from outsourced production operations. Our capital expenditures have ranged between $0.7 million and $3.2 million per year over the previous 5 years. We do not intend to outsource our MST production as a result of our proprietary manufacturing processes which are substantively different than those of our competitors.
Raw Materials, Product Supply, and Inventory Management
We source our products through a series of longstanding, highly-valued relationships which allow us to conduct our business on an asset-light, distribution-focused basis.
The components of inventories at December 31, 2017 and 2016, were as follows (in thousands):
|
2017
|
2016
|
|||||||
|
Raw materials and work in process
|
$
|
2,545
|
$
|
2,596
|
||||
|
Leaf tobacco
|
30,308
|
27,391
|
||||||
|
Finished goods - smokeless products
|
5,834
|
4,789
|
||||||
|
Finished goods - smoking products
|
14,110
|
18,384
|
||||||
|
Finished goods - electronic/vaporizer products
|
14,532
|
11,993
|
||||||
|
Other
|
1,290
|
1,232
|
||||||
|
68,619
|
66,385
|
|||||||
|
LIFO reserve
|
(5,323
|
)
|
(4,200
|
)
|
||||
|
$
|
63,296
|
$
|
62,185
|
|||||
Smokeless Products
Our loose leaf chewing and moist snuff tobaccos are produced from air-cured and fire-cured leaf tobacco, respectively. We utilize recognized suppliers that generally maintain 12- to 24-month supplies of our various types of tobacco at their facilities. We do not believe we are dependent on any single country or supplier source for tobacco. We generally maintain up to a two-month supply of finished, loose leaf chewing tobacco and moist snuff. This supply is maintained at our Louisville, Kentucky, facility and in two regional public warehouses to facilitate distribution.
We also utilize a variety of suppliers for the sourcing of additives used in our smokeless products and for the supply of our packaging materials. Thus, we believe we are not dependent on a single supplier for these products. There are no current U.S. federal regulations that restrict tobacco flavor additives in smokeless products. The additives that we use are food-grade, generally accepted ingredients.
All of our loose leaf chewing tobacco production is fulfilled through our agreement with Swedish Match. See the “Distribution and Supply Agreements” section for our discussion of the Swedish Match Manufacturing Agreement. All of our moist snuff products are manufactured at our facility in Dresden, Tennessee. Packaging occurs at the Dresden, Tennessee, location in addition to the facility in Louisville, Kentucky.
Smoking Products
Pursuant to our distribution agreements with Bolloré (discussed in more detail, below, under the heading “Distribution and Supply Agreements”), we are required to purchase from Bolloré all cigarette papers, cigarette tubes, and cigarette injecting machines that we sell, subject to Bolloré fulfilling its obligations under these distribution agreements. If Bolloré is unable or unwilling to perform its obligations or ceases its cigarette paper manufacturing operations, in each case, as set forth in the Distribution Agreements, we may seek third-party suppliers and continue the use of the
Zig-Zag
®
trademark to market these products. To ensure we have a steady supply of premium cigarette paper products, as well as cigarette tubes and injectors, Bolloré is required to maintain, at its expense, a two-month supply of inventory in a bonded, public warehouse in the U.S.
We obtain our MYO cigar wraps from the patent holder under our agreement with Durfort in the Dominican Republic. We obtain our Zig-Zag branded cigar products under our agreement with JJA, which sources the cigars on our behalf from the Dominican Republic. We obtain our MYO cigar smoking tobaccos and pipe tobaccos from domestic sources. We generally purchase these tobaccos through multiple sources; thus, we believe we are not dependent on a single supplier. We package these products at our Louisville, Kentucky, facility.
NewGen Products
We have sourcing relationships that are capable of providing liquid vapor products and tobacco vaporizer products for other companies’ brands and for producing our own branded product lines in the category, including our
Zig-Zag
®
brand. Our acquisitions of VaporBeast and Vapor Shark have (i) accelerated our entry into the non-traditional retail channel, where we believe the majority of liquid vapor products are sold; (ii) provided enhanced distribution of products; and (iii) established a best-in-class distribution platform combining VaporBeast’s non-traditional selling skills with a national, retail salesforce.
Our herbal smoking products are obtained from a supplier which owns the patented process for producing the sheet material. We have worldwide, exclusive rights to the material. The production and packaging of our herbal smoking products is subject to an agreement with Durfort. Durfort manufactures and packages the finished goods in the Dominican Republic, subject to our specifications, and coordinates with JJA delivery of the products to our designated distribution center in the U.S. We believe our early entry into the herbal smoking products market has provided us with a meaningful opportunity to capture market share and increase this share as the market grows.
Distribution and Supply Agreements
Bolloré Distribution and License Agreements
We are party to two long-term distribution and license agreements with Bolloré with respect to sales of cigarette papers, cigarette tubes, and cigarette injector machines—one with respect to distribution in the U.S. and one with respect to distribution in Canada (collectively, the “Distribution Agreements”). Under the Distribution Agreements, Bolloré granted us the exclusive right to purchase products bearing the
Zig-Zag
®
brand name from Bolloré for resale in the U.S. and Canada. We have the sole right to determine pricing and other terms upon which we may resell any products purchased from Bolloré, including the right to determine the ultimate distributors of such products within these countries. Furthermore, on March 19, 2013, we entered into an additional License and Distribution Agreement with Bolloré (the “Bolloré License Agreement”), which permits us the exclusive use of the
Zig-Zag
®
brand name in the U.S. for e-cigarettes and any related accessories, including vaporizers and e-liquids. The Bolloré License Agreement terminates upon termination of the Distribution Agreements.
Each of the Distribution Agreements were entered into on November 30, 1992, by a predecessor in interest for an initial twenty-year term. The Distribution Agreements automatically renewed in November 2012 for a second twenty-year term and will automatically renew for successive twenty-year terms unless terminated in accordance with the provisions of such agreement. The Distribution Agreements provide that, in order to assure each of the parties receives commercially reasonable profits in light of inflationary trends and currency fluctuation factors, 120 days prior to December 31, 2004, and each fifth-year anniversary from such date thereafter, the parties are required to enter into good faith negotiations to agree on an index and currency adjustment formula to replace the index and formula currently in effect. If the parties are unable to agree, the dispute is to be submitted to binding arbitration. Pursuant to the Distribution Agreements, if at any time the price received by Bolloré fails to cover its costs, Bolloré may give us notice of this deficiency, and the parties must promptly negotiate in good faith to adjust prices. If the parties cannot agree on new prices, we may purchase products from an alternative supplier reasonably acceptable to Bolloré until the next price adjustment period (subject to certain price-matching rights available to Bolloré and other terms and conditions). As of March 1, 2018, we are operating under a temporary pricing structure and formula. The parties are considering a modified pricing formula and a potential new index and duration; however, there is no guarantee that we will be able to reach a new pricing agreement with Bolloré at all or on terms satisfactory to us. Further, Bolloré sources its needs for our orders from an affiliate of one of our competitors. See “Risk Factors—We depend on a small number of key third-party suppliers and producers for our products” for further details.
Pursuant to the Distribution Agreements, export duties, insurance, and shipping costs are the responsibility of Bolloré. Import duties and taxes in the U.S. and Canada are our responsibility. Under the Distribution Agreements, we must purchase cigarette papers, cigarette tubes, and cigarette injector machines from Bolloré, subject to Bolloré fulfilling its obligations under these agreements. Bolloré is required to provide us with the quantities of the products that we order consistent with specific order-to-delivery timelines detailed in the agreement. The Distribution Agreements provide us with certain safeguards to ensure that we will be able to secure a steady supply of product, including (i) granting us the right to seek third-party suppliers with continued use of the
Zig-Zag
®
trademark if Bolloré is unable to perform its obligations or ceases its cigarette paper manufacturing operation, in each case as set forth in the Distribution Agreements, and (ii) maintaining a two-month supply of safety stock inventory of the premium papers, tubes, and injector machines in the U.S. at Bolloré’s expense.
Under the Distribution Agreements, we have agreed that for a period of five years after the termination of the agreements we will not engage, directly or indirectly, in the manufacturing, selling, distributing, marketing, or otherwise promoting, in the U.S. and Canada, of cigarette paper or cigarette paper booklets of a competitor without Bolloré’s consent, except for certain de minimis acquisitions of debt or equity securities of such a competitor and certain activities with respect to an alternative supplier used by us as permitted under the Distribution Agreements.
Each of the Distribution Agreements permits Bolloré to terminate such agreement (i) if certain minimum purchases (which, in the case of both Distribution Agreements, have been significantly exceeded in recent years) of cigarette paper booklets have not been made by us for resale in the jurisdiction covered by such agreement within a calendar year, (ii) if we assign such agreement without the consent of Bolloré, (iii) upon a change of control without the consent of Bolloré, (iv) upon certain acquisitions of our equity securities by one of our competitors or certain investments by our significant stockholders in one of our competitors, (v) upon certain material breaches, including our agreement not to promote, directly or indirectly, cigarette paper or cigarette paper booklets of a competitor, or (vi) upon our bankruptcy, insolvency, liquidation, or other similar event. Additionally, the Canada Distribution Agreement is terminable by either us or Bolloré upon the termination of the U.S. Distribution Agreement.
Swedish Match Manufacturing Agreement
On September 4, 2008, we entered into a manufacturing and distribution agreement with Swedish Match whereby Swedish Match became the exclusive manufacturer of our loose leaf chewing tobacco. Under the agreement, production of our loose leaf chewing tobacco products was completely transitioned to Swedish Match’s plant located in Owensboro, Kentucky, on September 18, 2009. We source all of the tobacco Swedish Match uses to manufacture our products along with certain proprietary flavorings and retain all marketing, design, formula, and trademark rights over our loose leaf products. We also have the right to approve all product modifications and are solely responsible for decisions related to package design and branding of the loose leaf tobacco produced for us. Responsibilities related to process control, manufacturing activities, and inventory management with respect to our loose leaf products are allocated between us and Swedish Match as specified in the agreement. We also have rights to monitor production and quality control processes on an ongoing basis.
The agreement had an initial ten-year term and will automatically be renewed for five successive ten-year terms unless either party provides at least 180 days’ notice prior to a renewal term of its intent to terminate the agreement, or unless otherwise terminated by mutual agreement of the parties in accordance with the provisions of the agreement. If a notice of non-renewal is delivered, the contract will expire two years after the date on which the agreement would have otherwise been renewed. The terms allow the agreement to be assumed by a buyer, terminated for uncured material breach, or terminated by us subject to a buyout. We also hold a right of first refusal to acquire the manufacturing plant as well as Swedish Match’s chewing tobacco unit.
JJA Distributors Service Agreement
On April 1, 2013 we entered into an agreement with JJA to source our Zig-Zag branded cigars and cigarillos and other products from the Dominican Republic. Under the agreement, JJA and its Dominican Republic partner purchase and inventory all of the necessary raw materials, including packaging bearing our intellectual property, manufacture to our specifications, and deliver to our designated U.S. distribution center. We retain all marketing, design, and trademark rights over our cigar products.
Production and Quality Control
We primarily outsource our manufacturing and production processes and focus on packaging, marketing, and distribution. We currently manufacture approximately 13% of our products as measured by gross sales. Our in-house manufacturing operations are limited to (i) the processing and packaging of our pipe tobacco products, which is completed at our manufacturing facility in Louisville, Kentucky, (ii) the manufacturing of our moist snuff products, which occurs at our facility in Dresden, Tennessee, (iii) the packaging of our moist snuff products at our facilities in Dresden, Tennessee, and Louisville, Kentucky, and, with the acquisition of Vapor Shark, (iv) the manufacturing of e-liquids at our Miami, Florida, facility. Our MST products are processed in-house, rather than outsourced, as a result of our proprietary manufacturing processes which are substantively different than those of our competitors.
We use proprietary production processes and techniques, including strict quality controls. Our quality control group routinely tests the quality of the tobacco, flavorings, application of flavorings, premium cigarette papers, tubes and injectors, cigars, MYO cigar wraps, liquid vapor products, tobacco vaporizer products, and packaging materials. We utilize sophisticated quality controls to test and closely monitor the quality of our products. The high quality of our tobacco products is largely the result of using high-grade tobacco leaf and food-grade flavorings and, on an ongoing basis, analyzing the tobacco cut, flavorings, and moisture content together with strict specifications for sourced products.
Given the importance of contract manufacturing to our business, our quality control group ensures that established, written procedures and standards are adhered to by each of our contract manufacturers. Responsibilities related to process control, manufacturing activities, quality control, and inventory management with respect to our loose leaf are allocated between us and Swedish Match under the manufacturing agreement.
Sales and Marketing
We have grown the size and capacity of our salesforce and intend to continue strengthening the organization to advance our ability to deepen and broaden the retail availability of our products and brands.
As of December 31, 2017, we had a nationwide sales and marketing organization of approximately 145 professionals. Our sales and marketing group focuses on priority markets and sales channels and seeks to operate with a high level of efficiency. In 2017, our sales and marketing efforts enabled our products to reach an estimated 200,000 retail doors in North America and over 800 direct wholesale customers with an additional 100 secondary, indirect wholesalers in the U.S.
Our sales efforts are focused on wholesale distributors and retail merchants in the independent and chain convenience store, tobacco outlet, food store, mass merchandising, drug store, and non-traditional retail channels. We have expanded, and intend to continue to expand, the sales of our products into previously underdeveloped geographic markets and retail channels. In 2017, we derived more than 95% of our net sales from sales in the U.S., with the remainder primarily from sales in Canada.
We subscribe to a sales tracking system from MSAi that records all traditional OTP product shipments (ours as well as those of our competitors) from approximately 900 wholesalers to over 250,000 retail stores in the U.S. This system enables us to understand individual product share and volume trends across multiple categories down to the individual retail store level, allowing us to allocate field salesforce coverage to the highest opportunity stores. Additionally, the ability to select from a range of parameters and to achieve this level of granularity means we can analyze marketplace trends in a timely manner and swiftly evolve our business planning to meet market opportunities.
We employ marketing activities to grow awareness, trial, and sales including selective trade advertising to expand wholesale availability, point-of-sale advertising and merchandising and permanent and temporary displays to improve consumer visibility, and social media. We comply with all regulations relating to the marketing of tobacco products, such as directing marketing efforts to adult consumers, and are committed to full legal compliance in the sales and marketing of our products. To date, we have neither relied upon, nor conducted, any substantial advertising in the consumer media for our products.
In the years ended December 31, 2017 and 2016, we did not have any customer that accounted for 10% or more of our gross sales. Our customers use an open purchase order system to buy our products and are not obligated to do so pursuant to ongoing contractual obligations. We perform periodic credit evaluations of our customers and generally do not require collateral on trade receivables. Historically, we have not experienced material credit losses. Sales to customers within our NewGen segment are generally prepaid.
Competition
Many of our competitors are better capitalized than we are and have greater resources, financial and otherwise. We believe our ability to effectively compete and strong market positions in our principal product lines are due to the high recognition of our brand names, the perceived quality of each of our products, and the efforts of our sales, marketing, and distribution teams. We compete against “big tobacco,” including Altria Group, Inc. (formerly Philip Morris); British American Tobacco p.l.c. (formerly Reynolds); Swedish Match; Swisher International; and manufacturers including U.K. based Imperial Brands, PLC, across our segments. “Big tobacco” has substantial resources and a customer base that has historically demonstrated loyalty to their brands.
Competition in the OTP market is based upon not only brand quality and positioning but also on price, packaging, promotion, and retail availability and visibility. Given the decreasing prevalence of cigarette consumption, the “big tobacco” companies continue to demonstrate an increased interest and participation in a number of OTP markets.
Smokeless Products
Our three principal competitors in the loose leaf chewing tobacco market are Swedish Match, the American Snuff Company, LLC (a unit of British American Tobacco p.l.c.), and Swisher International Group, Inc. We believe moist snuff products are used interchangeably with loose leaf products by many consumers. In the moist snuff category, we face the same competitors with the addition of U.S. Smokeless Tobacco Company (a division of Altria Group, Inc.).
Smoking Products
Our two major competitors for premium cigarette paper sales are Republic Tobacco, L.P., and Commonwealth Brands, Inc., a wholly-owned subsidiary of Imperial Brands, PLC. Our two major competitors for MYO cigar wraps are New Image Global, Inc., and Blunt Wrap USA. In cigars, we compete in the non-tipped cigarillo market with Swisher International, Inc., Swedish Match, and Good Times USA.
NewGen Products
In the NewGen products segment, our competitors are varied as the market is relatively new and highly fragmented. Our direct competitors sell products that are substantially similar to our products through the same channels in which we sell our liquid vapor products and tobacco vaporizer products. We compete with these direct competitors for sales through wholesalers and retailers including, but not limited to, vapor stores, national chain stores, tobacco shops, and convenience stores. Through our acquisitions of VaporBeast and Vapor Shark, we now also compete directly with other non-traditional distributors and retailers.
Patents, Trademarks, and Trade Secrets
We have numerous registered trademarks relating to our products, including:
Beech-Nut
®
,
Trophy
®
,
Havana Blossom
®
,
Durango
®
,
Stoker’s
®
,
Tequila Sunrise
®
,
Fred’s Choice
®
,
Old Hillside
®
,
Our Pride
®
,
Red Cap
®
,
Tennessee Chew
®
,
Big Mountain
®
,
Springfield Standard
®
,
Snake River
®
,
VaporBeast
®
, and
Vapor Shark
®
. The registered trademarks, which are significant to our business, expire periodically and are renewable for additional 10-year terms upon expiration. Flavor and blend formula trade secrets relating to our tobacco products, which are key assets of our businesses, are maintained under strict secrecy. The
Zig-Zag
®
trade name and trademark for premium cigarette papers and related products are owned by Bolloré and have been exclusively licensed to us in the U.S. and Canada. The
Zig-Zag
®
trade name and trademark for e-cigarette and vaporizers are also owned by Bolloré and have been exclusively licensed to us in the U.S. We own the
Zig-Zag
®
trademark with respect to its use in connection with products made with tobacco including, without limitation, cigarettes, cigars, and MYO cigar wraps in the U.S.
Research and Development and Quality Assurance
We have a research and development and quality assurance function that tests raw materials and finished products in order to maintain a high level of product quality and consistency. Research and development largely bases its new product development efforts on our high-tech data systems. We spent approximately $1.9 million, $1.8 million, and $1.4 million dollars on research and development and quality control efforts for the years ended December 31, 2017, 2016, and 2015, respectively.
Employees
As of March 1, 2018, we employed 289 full-time employees. None of our employees are represented by unions. We believe we have a positive relationship with our employees.
Risks related to our business and industry include the following:
Sales of tobacco products are generally expected to continue to decline.
As a result of restrictions on advertising and promotions, increases in regulation and excise taxes, health concerns, a decline in the social acceptability of tobacco and tobacco-related products, increased pressure from anti-tobacco groups, and other factors, the overall U.S. market for tobacco products has generally been declining in terms of volume of sales and is expected to continue to decline.
The general climate of declining sales of tobacco products is principally driven by the long-standing declines in cigarettes. OTP, on the other hand, as measured by MSAi, have been generating modest volume gains. For instance, while loose leaf chewing tobacco products have declined for over a decade, MST, a much larger Smokeless segment, has been growing in the low single digits over the same period. Additionally, cigarillo cigars and MYO cigar wraps have each demonstrated MSAi volume gains in recent years.
Our tobacco products comprised approximately 68% of our total 2017 net sales and, while some of our sales volume declines have been offset by higher prices or by increased sales in other product categories, there can be no assurance that these price increases or increased sales can be sustained, especially in an environment of increased regulation and taxation and changes in consumer spending habits.
We depend on a small number of key third-party suppliers and producers for our products.
Our operations are largely dependent on a small number of key suppliers and producers to supply or manufacture our products pursuant to long-term contracts. In 2017, our four most important suppliers and producers were: (i) Swedish Match, which produces all of our loose leaf chewing tobacco in the U.S., (ii) Bolloré, which provides us with exclusive access to the
Zig-Zag
®
cigarette paper and related accessories in the U.S. and Canada, (iii) Durfort, from which we source our MYO cigar wraps, and (iv) JJA, from which we source our Zig-Zag branded cigars and cigarillos.
All of our loose leaf tobacco products are manufactured for us by Swedish Match pursuant to a ten-year renewable agreement, which we entered into in 2008. The agreement will automatically be renewed for five successive ten-year terms unless either party provides at least 180 days’ notice prior to a renewal term of its intent to terminate the agreement or unless otherwise terminated in accordance with the provisions of the agreement. If a notice of non-renewal is delivered, the contract will expire two years after the date on which the agreement would have otherwise been renewed. Under this agreement, we retain the rights to all marketing, distribution and trademarks over the loose leaf brands that we own or license. We share responsibilities with Swedish Match related to process control, manufacturing activities, quality control, and inventory management with respect to our loose leaf products. We rely on the performance by Swedish Match of its obligations under the agreement for the production of our loose leaf tobacco products. Any significant disruption in Swedish Match’s manufacturing capabilities or our relationship with Swedish Match, a deterioration in Swedish Match’s financial condition, or an industry-wide change in business practices with respect to loose leaf tobacco products could have a material adverse effect on our business, results of operations, and financial condition.
All of our
Zig-Zag
®
premium cigarette papers, cigarette tubes, and injectors are sourced from Bolloré, pursuant to a renewable 20-year exclusive agreement. This agreement was most recently renewed in 2012. In addition, under the terms of the agreement with Bolloré, we renegotiate pricing terms every five years. As of March 1, 2018, we are operating under a temporary price structure and formula. The parties are considering a modified pricing formula and a potential new index and duration. There is no guarantee that we will be able to reach a new pricing agreement with Bolloré at all or on terms satisfactory to us. Further, Bolloré sources its needs for our orders from an affiliate of one of our competitors.
We source our MYO cigar wraps through the patent holder, Durfort, pursuant to an agreement entered into in October 2008. The agreement extends until expiration of the patents or cancellation of the agreement by either party. We rely on Durfort to produce and package our MYO cigar wraps to our specifications. Any significant disruption in our relationship with Durfort, a deterioration in Durfort’s financial condition, an industry-wide change in business practices relating to MYO cigar wraps, or our ability to source the MYO cigar wraps from them could have a material adverse effect on our business, results of operations, and financial condition.
We source our Zig-Zag branded cigars and cigarillos through JJA and its Dominican Republic partner pursuant to an agreement we entered into in April 2013. We rely on JJA to purchase and maintain an inventory of all the necessary raw materials, including packaging bearing our intellectual property, manufacture to our specifications, and deliver the products to our designated U.S. distribution center. We cannot guarantee that JJA will continue to source sufficient quantities of our Zig-Zag branded cigars or cigarillos in order for us to meet our customer demands. Any significant disruption in our relationship with JJA, a failure to supply us with inventory in sufficient amounts, a deterioration in JJA’s financial condition, or an industry-wide change in business practices with respect to Zig-Zag branded cigars could have a material adverse effect on our business, results of operations, and financial condition.
Pursuant to agreements with certain suppliers, we have agreed to store tobacco inventory purchased on our behalf and generally maintain a 12- to 24-month supply of our various tobacco products at their facilities. We cannot guarantee our supply of these products will be adequate to meet the demands of our customers. Further, a major fire, violent weather conditions, or other disasters that affect us or any of our key suppliers or producers, including Bolloré, Swedish Match, Durfort, or JJA, as well as those of our other suppliers and vendors, could have a material adverse effect on our operations. Although we have insurance coverage for some of these events, a prolonged interruption in our operations, as well as those of our producers, suppliers, or vendors, could have a material adverse effect on our business, results of operations, and financial condition. In addition, we do not know whether we will be able to renew any or all of our agreements on a timely basis, on terms satisfactory to us, or at all.
Any disruptions in our relationships with Bolloré, Swedish Match, Durfort, or JJA, a failure to renew any of our agreements, an inability or unwillingness by any supplier to produce sufficient quantities of our products in a timely manner or finding a new supplier would have a significant impact on our ability to continue distributing the same volume and quality of products and maintain our market share, even during a temporary disruption, which could have a material adverse effect on our business, results of operations and financial condition.
We may be unable to identify or contract with new suppliers or producers in the event of a disruption to our supply.
In order to continue selling our products in the event of a disruption to our supply, we would have to identify new suppliers or producers that would be required to satisfy significant regulatory requirements. Only a limited number of suppliers or producers may have the ability to produce our products at the volumes we need, and it could be costly or time-consuming to locate and approve such alternative sources. Moreover, it may be difficult or costly to find suppliers to produce small volumes of our new products in the event we are looking only to supplement current supply as suppliers may impose minimum order requirements. In addition, we may be unable to negotiate pricing or other terms with our existing or new suppliers as favorable as those we currently enjoy. Even if we were able to successfully identify new suppliers and contract with them on favorable terms, these new suppliers would also be subject to stringent regulatory approval procedures that could result in prolonged disruptions to our sourcing and distribution processes.
Furthermore, there is no guarantee that a new third-party supplier could accurately replicate the production process and taste profile of our existing products. We cannot guarantee that a failure to adequately replace our existing suppliers would not have a material adverse effect on our business, results of operations, and financial condition.
Our licenses to use certain brands and trademarks may be terminated or not renewed.
We are reliant upon brand recognition in the OTP markets in which we compete as the OTP industry is characterized by a high degree of brand loyalty and a reluctance to switch to new or unrecognizable brands on the part of consumers. Some of the brands and trademarks under which our products are sold are licensed to us for a fixed period of time in respect of specified markets, such as our distribution and license agreement with Bolloré for use of the
Zig-Zag
®
name and associated trademarks in connection with certain of our cigarette papers and related products.
We have two licensing agreements with Bolloré, the first of which governs licensing and the use of the
Zig-Zag
®
name with respect to cigarette papers, cigarette tubes, and cigarette injector machines, and the second of which governs licensing and the use of the
Zig-Zag
®
name with respect to e-cigarettes, vaporizers, and e-liquids. In 2017, we generated $122.7 million in gross sales of
Zig-Zag
®
products, of which $58.4 million was generated from products sold through our license agreement with Bolloré. In the event the licensing agreements with Bolloré are not renewed, the terms of the agreements bind us under a five-year non-compete clause, under which we cannot engage in direct or indirect manufacturing, selling, distributing, marketing, or otherwise promoting of cigarette papers of a competitor without Bolloré’s consent, except in limited instances. We do not know whether we will renew these agreements on a timely basis, on terms satisfactory to us, or at all. As a result of these restrictions, if our agreements with Bolloré are terminated, we may not be able to access the markets with recognizable brands that would be positioned to compete in these segments.
In the event that the licenses to use the brands and trademarks in our portfolio are terminated or are not renewed after the end of the term, there is no guarantee we will be able to find a suitable replacement, or if a replacement is found, that it will be on favorable terms. Any loss in our brand-name appeal to our existing customers as a result of the lapse or termination of our licenses could have a material adverse effect on our business, results of operations, and financial condition.
We may not be successful in maintaining the consumer brand recognition and loyalty of our products.
We compete in a market that relies on innovation and the ability to react to evolving consumer preferences. The tobacco industry in general, and the OTP industry in particular, are subject to changing consumer trends, demands, and preferences. Therefore, products once favored may over time become disfavored by consumers or no longer perceived as the best option. Consumers in the OTP market have demonstrated a high degree of brand loyalty, but producers must continue to adapt their products in order to maintain their status among these customers as the market evolves. The
Zig-Zag
®
brand has strong brand recognition among smokers, and our continued success depends in part on our ability to continue to differentiate the brand names that we own or license and maintain similarly high levels of recognition with target consumers. Trends within the OTP industry change often. Our failure to anticipate, identify, or react to changes in these trends could, among other things, lead to reduced demand for our products. Factors that may affect consumer perception of our products include health trends and attention to health concerns associated with tobacco, price-sensitivity in the presence of competitors’ products or substitute products, and trends in favor of new NewGen products that are currently being researched and produced by participants in our industry. For example, in recent years, we have witnessed a shift in consumer purchases from chewing tobacco to moist snuff due to its increased affordability. Along with our biggest competitors in the chewing tobacco market, which also produce moist snuff, we have been able to shift priorities and adapt to this change. A failure to react to similar trends in the future could enable our competitors to grow or establish their brands’ market shares in these categories before we have a chance to respond.
Consumer perceptions of the overall health of tobacco-based products is likely to continue to shift, and our success depends, in part, on our ability to anticipate these shifting tastes and the rapidity with which the markets in which we compete will evolve in response to these changes on a timely and affordable basis. If we are unable to respond effectively and efficiently to changing consumer preferences, the demand for our products may decline, which could have a material adverse effect on our business, results of operations, and financial condition.
Regulations may be enacted in the future, particularly in light of increasing restrictions on the form and content of marketing of tobacco products, that would make it more difficult to appeal to our consumers or to leverage existing recognition of the brands that we own or license. Furthermore, even if we are able to continue to distinguish our products, there can be no assurance that the sales, marketing, and distribution efforts of our competitors will not be successful in persuading consumers of our products to switch to their products. Many of our competitors have greater access to resources than we do, which better positions them to conduct market research in relation to branding strategies or costly marketing campaigns. Any loss of consumer brand loyalty to our products or reduction of our ability to effectively brand our products in a recognizable way will have a material effect on our ability to continue to sell our products and maintain our market share, which could have a material adverse effect on our business, results of operations, and financial condition.
We are subject to substantial and increasing regulation.
The tobacco industry has been under public scrutiny for over 50 years. Industry critics include special interest groups, the U.S. Surgeon General, and many legislators and regulators at the state and federal levels. A wide variety of federal, state, and local laws limit the advertising, sale, and use of tobacco, and these laws have proliferated in recent years. Together with changing public attitudes towards tobacco consumption, the constant expansion of regulations has been a major cause of the overall decline in the consumption of tobacco products since the early 1970s. These regulations relate to, among other things, the importation of tobacco products and shipping throughout the U.S. market, increases in the minimum age to purchase tobacco products, imposition of taxes, sampling and advertising bans or restrictions, flavor bans or restrictions, ingredient and constituent disclosure requirements, and media campaigns and restrictions on where smokers can smoke. Additional restrictions may be legislatively imposed or agreed to in the future. These limitations may make it difficult for us to maintain the value of any brand.
Moreover, the current trend is toward increasing regulation of the tobacco industry, which is likely to differ between the various U.S. states and Canadian provinces in which we currently conduct the majority of our business. Extensive and inconsistent regulation by multiple states and at different governmental levels could prove to be particularly disruptive to our business as we may be unable to accommodate such regulations in a cost-effective manner that allows us to continue to compete in an economically viable way. Regulations are often introduced without the tobacco industry’s input and have been a significant reason behind reduced industry sales volumes and increased illicit trade.
In 1986, federal legislation was enacted regulating smokeless tobacco products (including dry and moist snuff and chewing tobacco) by, among other things, requiring health warnings on smokeless tobacco packages and prohibiting the advertising of smokeless tobacco products on media subject to the jurisdiction of the Federal Communications Commission (“FCC”). Since 1986, other proposals have been made at the federal, state, and local levels for additional regulation of tobacco products. It is likely that additional proposals will be made in the coming years. For example, the Prevent All Cigarette Trafficking Act prohibits the use of the U.S. Postal Service to mail most tobacco products and amends the Jenkins Act, which established cigarette sales reporting requirements for state excise tax collection, to require individuals and businesses that make interstate sales of cigarettes or smokeless tobacco comply with state tax laws. See “—There is uncertainty related to the federal regulation of NewGen products, cigars and pipe tobacco products” for further details. Additional federal or state regulation relating to the manufacture, sale, distribution, advertising, labeling, mandatory ingredients disclosure and nicotine yield information disclosure of tobacco products could reduce sales, increase costs, and have a material adverse effect on our business, results of operations, and financial condition.
On June 22, 2009, the Family Smoking Prevention and Tobacco Control Act (the “Tobacco Control Act”) authorized the FDA for regulatory authority over tobacco products. The Act also amended the Federal Cigarette Labeling and Advertising Act, which governs how cigarettes can be advertised and marketed, as well as the Comprehensive Smokeless Tobacco Health Education Act (“CSTHEA”), which governs how smokeless tobacco can be advertised and marketed. In addition to the FDA and FCC, we are subject to regulation by numerous other federal agencies, including the Federal Trade Commission (“FTC”), the Department of Justice (“DOJ”), the Alcohol and Tobacco Tax and Trade Bureau (“TTB”), the U.S. Environmental Protection Agency (“EPA”), the U.S. Department of Agriculture (“USDA”), the Consumer Product Safety Commission (“CPSC”), the U.S. Customs and Border Protection (“CBP”) and the U.S. Center for Disease Control and Prevention’s (“CDC”) Office on Smoking and Health. There have also been adverse legislative and political decisions and other unfavorable developments concerning cigarette smoking and the tobacco industry, which have received widespread public attention. There can be no assurance as to the ultimate content, timing or effect of any regulation of tobacco products by governmental bodies, nor can there be any assurance that potential corresponding declines in demand resulting from negative media attention would not have a material adverse effect on our business, results of operations and financial condition.
Our products are regulated by the FDA, which has broad regulatory powers.
Substantially all of our 2017 U.S. gross sales are derived from the sale of products that are currently regulated by the FDA. The Tobacco Control Act grants the FDA broad regulatory authority over the design, manufacture, sale, marketing and packaging of tobacco products. Among the regulatory powers conferred to the FDA under the Tobacco Control Act is the authority to impose tobacco product standards that are appropriate for the protection of the public health, require manufacturers to obtain FDA review and authorization for the marketing of certain new or modified tobacco products and impose various additional restrictions. Such restrictions may include requiring reduction or elimination of the use of particular constituents or components, requiring product testing, or addressing other aspects of tobacco product construction, constituents, properties or labeling.
Specifically, the Tobacco Control Act (i) increases the number of health warnings required on cigarette and smokeless tobacco products, increases the size of warnings on packaging and in advertising, requires the FDA to develop graphic warnings for cigarette packages, and grants the FDA authority to require new warnings, (ii) imposes restrictions on the sale and distribution of tobacco products, including significant restrictions on tobacco product advertising and promotion as well as the use of brand and trade names, (iii) bans the use of “light,” “mild,” “low” or similar descriptors on tobacco products, (iv) bans the use of “characterizing flavors” in cigarettes other than tobacco or menthol, (v) requires manufacturers to report ingredients and harmful constituents and requires the FDA to disclose certain constituent information to the public, (vi) authorizes the FDA to require the reduction of nicotine and the potential reduction or elimination of other constituents or additives, including menthol, (vii) establishes potentially expensive and time-consuming pre-market and “substantial equivalence” review pathways for tobacco products that are considered new, (viii) gives FDA broad authority to deny product applications thereby preventing the sale or distribution of the product subject to the application (and requiring such product to be removed from the market, if applicable), and (ix) requires tobacco product manufacturers (and certain other entities) to register with the FDA.
The FDA charges user fees based on the USDA unit calculations pro-rated to the annualized FDA congressionally allocated budget. These fees only apply to certain products currently regulated by the FDA, which include our smokeless and smoking products (other than cigarette paper products), but we may in the future be required to pay such fees on more of our products, and we cannot accurately predict which additional products may be subject to such fees or the magnitude of such fees, which could become significant.
Although the FDA is prohibited from issuing regulations banning all cigarettes or all smokeless tobacco products, or requiring the reduction of nicotine yields of a tobacco product to zero, it is likely that its regulations in accordance with the Tobacco Control Act could result in a decrease in cigarette and smokeless tobacco sales in the U.S. We believe that such regulation could adversely affect our ability to compete against our larger competitors, who may be able to more quickly and cost-effectively comply with these new rules and regulations. Our ability to gain efficient market clearance for new tobacco products, or even to keep existing products on the market, could also be affected by FDA rules and regulations. Some of our currently marketed products that are subject to FDA regulation will require marketing authorizations from the FDA for us to continue marketing them (e.g., pre-market or substantial equivalence marketing authorizations, as applicable to the product), which we cannot guarantee we will be able to obtain. In addition, failure to comply with new or existing tobacco laws under which the FDA imposes regulatory requirements could result in significant financial penalties and government investigations of us. To the extent we are unable to respond to, or comply with, new FDA regulations it could have a material adverse effect on our business, results of operations and financial condition.
Many of our products contain nicotine, which is considered to be a highly addictive substance.
Many of our products contain nicotine, a chemical that is considered to be highly addictive. The Tobacco Control Act empowers the FDA to regulate the amount of nicotine found in tobacco products, but not to require the reduction of nicotine yields of a tobacco product to zero. Any FDA regulation, whether of nicotine levels or other product attributes, may require us to reformulate, recall and/or discontinue certain of the products we may sell from time to time, which may have a material adverse effect on our ability to market our products and have a material adverse effect on our business, results of operations and financial condition.
There is uncertainty related to the federal regulation of NewGen products, cigars and pipe tobacco products. Increased regulatory compliance burdens could have a material adverse impact on our NewGen business development efforts.
Since their introduction, there has been significant uncertainty regarding whether, how and when tobacco regulations would apply to NewGen products, such as electronic cigarettes or other vaporizer products. Based on a decision in December 2010 by the U.S. Court of Appeals for the D.C. Circuit (the “Sottera decision”), the FDA is permitted to regulate electronic cigarettes containing tobacco-derived nicotine as “tobacco products” under the Tobacco Control Act.
Effective August 8, 2016, FDA’s regulatory authority under the Tobacco Control Act was extended to all remaining tobacco products, including: (i) certain NewGen products (such as electronic cigarettes, vaporizers and e-liquids) and their components or parts (such as tanks, coils and batteries); (ii) cigars and their components or parts (such as cigar tobacco); (iii) pipe tobacco; (iv) hookah products; or (v) any other tobacco product “newly deemed” by FDA. These deeming regulations apply to all products made or derived from tobacco intended for human consumption, but excluding accessories of tobacco products (such as lighters).
The deeming regulations require us to (i) register with the FDA and report product and ingredient listings; (ii) market newly deemed products only after FDA review and approval; (iii) only make direct and implied claims of reduced risk if the FDA approves after finding that scientific evidence supports the claim and that marketing the product will benefit public health as a whole; (iv) refrain from distributing free samples; (v) implement minimum age and identification restrictions to prevent sales to individuals under age 18; (vi) develop an approved warning plan and include prescribed health warnings on packaging and advertisements; and (vii) refrain from selling the products in vending machines, unless the machine is located in a facility that never admits youth. Newly-deemed tobacco products are also subject to the other requirements of the Tobacco Control Act, such as that they not be adulterated or misbranded. The FDA could in the future promulgate good manufacturing practice regulations for these and our other products, which could have a material adverse impact on our ability and the cost to manufacture our products.
Marketing authorizations will be necessary in order for us to continue our distribution of NewGen and cigar and pipe tobacco products. Compliance dates vary depending upon type of application submitted, but all newly-deemed products will require an application no later than August 8, 2021, for “combustible” products (e.g. cigar and pipe) and August 8, 2022, for “non-combustible” products (e.g. vapor products) with the exception of our “grandfathered” products (products in commerce as of February 15, 2007) which are already authorized, unless FDA grants extensions to these compliance periods. We intend to timely file for the appropriate authorizations to allow us to sell our products in the U.S. We have no assurances that the outcome of such processes will result in our products receiving marketing authorizations from the FDA. We also have certain previously-regulated tobacco products which remain subject to “provisional” substantial equivalence filings made on March 22, 2011. If the FDA establishes regulatory processes that we are unable or unwilling to comply with, our business, results of operations, financial condition and prospects could be adversely affected.
The anticipated costs of complying with future FDA regulations will be dependent on the rules issued by the FDA, the timing and clarity of any new rules or guidance documents accompanying these rules, the reliability and simplicity (or complexity) of the electronic systems utilized by FDA for information and reports to be submitted, and the details required by FDA for such information and reports with respect to each regulated product (which have yet to be issued by FDA). Failure to comply with existing or new FDA regulatory requirements could result in significant financial penalties and could have a material adverse effect on our business, results of operations, financial condition and ability to market and sell our products. Compliance and related costs could be substantial and could significantly increase the costs of operating in our NewGen and cigar and pipe tobacco product markets.
In addition, failure to comply with the Tobacco Control Act and with FDA regulatory requirements could result in litigation, criminal convictions or significant financial penalties and could impair our ability to market and sell our electronic and vaporizer products. At present, we are not able to predict whether the Tobacco Control Act will impact our products to a greater degree than competitors in the industry, thus affecting our competitive position.
Furthermore, neither the Prevent All Cigarette Trafficking Act nor the Federal Cigarette Labeling and Advertising Act currently apply to NewGen products. There may, in the future, also be increased regulation of additives in smokeless products and internet sales of NewGen products. The application of either or both of these federal laws, and of any new laws or regulations which may be adopted in the future, to NewGen products or such additives could result in additional expenses and require us to change our advertising and labeling, and methods of marketing and distribution of our products, any of which could have a material adverse effect on our business, results of operations and financial condition.
Significant increases in state and local regulation of our NewGen products have been proposed or enacted and are likely to continue to be proposed or enacted in numerous jurisdictions.
There has been increasing activity on the state and local levels with respect to scrutiny of NewGen products. State and local governmental bodies across the U.S. have indicated NewGen products may become subject to new laws and regulations at the state and local levels. For example, in January 2015, the California Department of Health declared electronic cigarettes a health threat that should be strictly regulated like tobacco products. Further, some states and cities, have enacted regulations that require obtaining a tobacco retail license in order to sell electronic cigarettes and vaporizer products. Many states and some cities have passed laws restricting the sale of electronic cigarettes and vaporizer products to minors. If one or more states from which we generate or anticipate generating significant sales of NewGen products bring actions to prevent us from selling our NewGen products unless we obtain certain licenses, approvals or permits, and if we are not able to obtain the necessary licenses, approvals or permits for financial reasons or otherwise and/or any such license, approval or permit is determined to be overly burdensome to us, then we may be required to cease sales and distribution of our products to those states, which could have a material adverse effect on our business, results of operations and financial condition.
Certain states and cities have already restricted the use of electronic cigarettes and vaporizer products in smoke-free venues. Additional city, state or federal regulators, municipalities, local governments and private industry may enact rules and regulations restricting the use of electronic cigarettes and vaporizer products in those same places where cigarettes cannot be smoked. Because of these restrictions, our customers may reduce or otherwise cease using our NewGen products, which could have a material adverse effect on our business, results of operations and financial condition.
Increases in tobacco-related taxes have been proposed or enacted and are likely to continue to be proposed or enacted in numerous jurisdictions.
Tobacco products, premium cigarette papers and tubes have long been subject to substantial federal, state and local excise taxes. Such taxes have frequently been increased or proposed to be increased, in some cases significantly, to fund various legislative initiatives or further disincentivize smoking. Since 1986, smokeless products have been subject to federal excise tax. Smokeless products are taxed by weight (in pounds or fractional parts thereof) manufactured or imported.
Since the State Children’s Health Insurance Program (“S-CHIP”) reauthorization in early 2009, which utilizes, among other things, taxes on tobacco products to fund health insurance coverage for children, the federal excise tax increases adopted have been substantial and have materially reduced sales in the “roll your own” (“RYO”) /MYO cigarette smoking products market, and also caused volume declines in other markets. Although the RYO/MYO cigarette smoking tobacco and related products market had been one of the fastest growing markets in the tobacco industry in the five years prior to 2009, the reauthorization of S-CHIP increased the federal excise tax on RYO tobacco from $1.10 to $24.78 per pound, and materially reduced the MYO cigarette smoking tobacco market in the U.S. There have not been any increases announced since 2009, but we cannot guarantee that we will not be subject to further increases, nor whether any such increases will affect prices in a way that further deters consumers from purchasing our products and/or affects our net revenues in a way that renders us unable to compete effectively.
In addition to federal excise taxes, every state and certain city and county governments have imposed substantial excise taxes on sales of tobacco products, and many have raised or proposed to raise excise taxes in recent years.
Approximately one-half of the states tax MST on weight-based versus unit-based. Additional states may consider adopting such revised tax structures as well. Tax increases, depending on their parameters, may result in consumers switching between tobacco products or depress overall tobacco consumption, which is likely to result in declines in overall sales volumes.
Any future enactment of increases in federal or state excise taxes on our tobacco products or rulings that certain of our products should be categorized differently for excise tax purposes could adversely affect demand for our products and may result in consumers switching between tobacco products or a depression in overall tobacco consumption, which would have a material adverse effect on our business, results of operations and financial condition.
If our NewGen products become subject to increased taxes it could adversely affect our business.
Presently the sale of NewGen products is generally not subject to federal, state and local excise taxes like the sale of conventional cigarettes or other tobacco products, all of which generally have high tax rates and have faced significant increases in the amount of taxes collected on their sales. In recent years, however, state and local governments have taken actions to move towards imposing excise taxes on NewGen products. As of December 31, 2017, California, the District of Columbia, Kansas, Louisiana, Minnesota, North Carolina, Pennsylvania, West Virginia and certain localities impose excise taxes on electronic cigarettes and/or liquid vapor. Other jurisdictions are contemplating similar legislation and other restrictions on electronic cigarettes. Should federal, state and local governments and or other taxing authorities begin or continue to impose excise taxes similar to those levied against conventional cigarettes and tobacco products on NewGen products, it may have a material adverse effect on the demand for these products, as consumers may be unwilling to pay the increased costs, which in turn could have a material adverse effect on our business, results of operations and financial condition.
We may be subject to increasing international control and regulation.
The World Health Organization’s Framework Convention on Tobacco Control (“FCTC”) is the first international public health treaty that establishes a global agenda to reduce initiation of tobacco use and regulate tobacco in an effort to encourage tobacco cessation. Over 170 governments worldwide have ratified the FCTC. The FCTC has led to increased efforts to reduce the supply and demand of tobacco products and to encourage governments to further regulate the tobacco industry. The tobacco industry expects significant regulatory developments to take place over the next few years, driven principally by the FCTC. Regulatory initiatives that have been proposed, introduced or enacted include:
| · |
the levying of substantial and increasing tax and duty charges;
|
| · |
restrictions or bans on advertising, marketing and sponsorship;
|
| · |
the display of larger health warnings, graphic health warnings and other labeling requirements;
|
| · |
restrictions on packaging design, including the use of colors and generic packaging;
|
| · |
restrictions or bans on the display of tobacco product packaging at the point of sale, and restrictions or bans on cigarette vending machines;
|
| · |
requirements regarding testing, disclosure and performance standards for tar, nicotine, carbon monoxide and other smoke constituents levels;
|
| · |
requirements regarding testing, disclosure and use of tobacco product ingredients;
|
| · |
increased restrictions on smoking in public and work places and, in some instances, in private places and outdoors;
|
| · |
elimination of duty free allowances for travelers; and
|
| · |
encouraging litigation against tobacco companies.
|
If the U.S. becomes a signatory to the FCTC and/or national laws are enacted in the U.S. that reflect the major elements of the FCTC, our business, results of operations and financial condition could be materially and adversely affected. If NewGen products become subject to one or more of the significant regulatory initiatives proposed under the FCTC, our NewGen products segment may also be materially adversely affected.
As part of our strategy, we have begun strategic international expansions, such as introducing our moist snuff tobacco products in South America and cigar products in Canada. This and other future expansions may subject us to additional or increasing international regulation, either by the countries that are the object of the strategic expansion or through international regulatory regimes, such as the FCTC, to which those countries may be signatories.
Liquid vapor products containing nicotine have not been approved for sale in Canada. Some Canadian provinces have restricted sales and marketing of electronic cigarettes, and other provinces are in the process of passing similar legislation. Furthermore, some Canadian provinces have limited the use of electronic cigarettes and vaporizer products in public places. As a result, we are unable to market these products in the relevant parts of Canada. These measures, and any future measures taken to limit the marketing, sale and use of NewGen products may have a material adverse effect on our business, results of operations and financial condition.
To the extent our existing or future products become subject to international regulatory regimes that we are unable to comply with or fail to comply with, they may have a material adverse effect on our business, results of operations and financial condition.
Our distribution efforts rely in part on our ability to leverage relationships with large retailers and national chains.
Our distribution efforts rely in part on our ability to leverage relationships with large retailers and national chains to sell and promote our products, which is dependent upon the strength of the brand names that we own or license and our salesforce effectiveness. In order to maintain these relationships, we must continue to supply products that will bring steady business to these retailers and national chains. We may not be able to sustain these relationships or establish other relationships with such entities, which could have a material adverse effect on our ability to execute our branding strategies, our ability to access the end-user markets with our products or our ability to maintain our relationships with the producers of our products. For example, if we are unable to meet benchmarking provisions in contracts or if we are unable to maintain and leverage our retail relationships on a scale sufficient to make us an attractive distributor, it would have a material adverse effect on our ability to source products, and on our business, results of operations and financial condition.
In addition, there are factors beyond our control that may prevent us from leveraging existing relationships, such as industry consolidation. If we are unable to develop and sustain relationships with large retailers and national chains, or are unable to leverage those relationships due to factors such as a decline in the role of brick-and-mortar retailers in the North American economy, our capacity to maintain and grow brand and product recognition and increase sales volume will be significantly undermined. In such an event, we may ultimately be forced to pursue and rely on local and more fragmented sales channels, which will have a material adverse effect on our business, results of operations and financial condition.
We have a substantial amount of indebtedness that could affect our financial condition.
As of March 1, 2018, we had $199.1 million outstanding under our credit facility with the ability to borrow an additional $46.5 million under our revolving credit facility. If we cannot generate sufficient cash flow from operations to service our debt, we may need to further refinance our debt, dispose of assets or issue equity to obtain necessary funds. We do not know whether we will be able to do any of this on a timely basis or on terms satisfactory to us or at all.
Our substantial amount of indebtedness could limit our ability to:
| · |
obtain necessary additional financing for working capital, capital expenditures or other purposes in the future;
|
| · |
plan for, or react to, changes in our business and the industries in which we operate;
|
| · |
make future acquisitions or pursue other business opportunities;
|
| · |
react in an extended economic downturn; and
|
| · |
pay dividends to the extent we determine to do so in the future.
|
The terms of the agreement governing our indebtedness may restrict our current and future operations, which would adversely affect our ability to respond to changes in our business and to manage our operations.
Our 2017 Credit Facility contained, our 2018 Credit Facility contains (refer to Note 23 of Notes to Consolidated Financial Statements for details regarding our 2018 Credit Facility), and any future indebtedness of ours would likely contain, a number of restrictive covenants that impose significant operating and financial restrictions on us, including restrictions on our ability to, among other things:
| · |
incur additional debt;
|
| · |
pay dividends and make other restricted payments;
|
| · |
create liens;
|
| · |
make investments and acquisitions;
|
| · |
engage in sales of assets and subsidiary stock;
|
| · |
enter into sale-leaseback transactions;
|
| · |
enter into transactions with affiliates;
|
| · |
transfer all or substantially all of our assets or enter into merger or consolidation transactions; and
|
| · |
enter into certain hedging agreements.
|
Our 2017 Credit Facility required, and the 2018 Credit Facility requires, us to maintain certain financial ratios. As of December 31, 2017, we were in compliance with the financial and restrictive covenants of the 2017 Credit Facility. However, a failure by us to comply with the covenants or financial ratios in our debt instruments could result in an event of default under the applicable facility, which could adversely affect our ability to respond to changes in our business and manage our operations. In the event of any default under our 2018 Credit Facility, the lenders under our debt instruments could elect to declare all amounts outstanding under such instruments to be due and payable and require us to apply all of our available cash to repay these amounts. If the indebtedness under our 2018 Credit Facility were to be accelerated, which would cause an event of default and a cross-acceleration of our obligations under our other debt instruments, there can be no assurance that our assets would be sufficient to repay this indebtedness in full, which could have a material adverse effect on our business, results of operations, and financial condition.
We face intense competition and may fail to compete effectively.
We are subject to significant competition across our segments, and compete against companies in all segments that have access to significant resources in terms of technology, relationships with suppliers and distributors and access to cash flow and financial markets.
The OTP industry is characterized by brand recognition and loyalty, with product quality, price, marketing and packaging constituting the primary methods of competition. Substantial marketing support, merchandising display, competitive pricing and other financial incentives generally are required to introduce a new brand or to improve or maintain a brand’s market position. Our principal competitors are “big tobacco,” Altria Group, Inc. (formerly Phillip Morris) and British American Tobacco p.l.c. (formerly Reynolds) as well as Swedish Match, Swisher International and manufacturers of electronic cigarettes, including U.K.-based Imperial Brands PLC. These competitors are significantly larger than us and aggressively seek to limit the distribution or sale of other companies’ products, both at the wholesale and retail levels. For example, certain competitors have entered into agreements limiting retail-merchandising displays of other companies’ products or imposing minimum prices for OTP products, thereby limiting their competitors’ ability to offer discounted products. In addition, the tobacco industry is experiencing a trend toward industry consolidation, most recently evidenced by the July 2017 acquisition of Reynolds American, Inc., by British American Tobacco p.l.c. and the June 2015 acquisition of Lorillard, Inc., by Reynolds American, Inc. Industry consolidation could result in a more competitive environment if our competitors are able to increase their combined resources, enhance their access to national distribution networks, or become acquired by established companies with greater resources than ours. Any inability to compete due to our smaller scale as the industry continues to consolidate and be dominated by “big tobacco” could have a material adverse effect on our business, results of operations and financial condition.
The competitive environment and our competitive position is also significantly influenced by economic conditions, the state of consumer confidence, competitors’ introduction of low-priced products or innovative products, higher taxes, higher absolute prices and larger gaps between price categories and product regulation that diminishes the consumer’s ability to differentiate tobacco products. Due to the impact of these factors, as well as higher state and local excise taxes and the market share of deep discount brands, the tobacco industry has become increasingly price competitive. As we seek to adapt to the price competitive environment, our competitors that are better capitalized may be able to sustain price discounts for long periods of time by spreading the loss across their expansive portfolios, with which we are not positioned to compete.
“Big tobacco” has also established its presence in the NewGen products market. There can be no assurance that our products will be able to compete successfully against these companies or any of our other competitors, some of which have far greater resources, capital, experience, market penetration, sales and distribution channels than us. In addition, there are currently no U.S. restrictions on advertising electronic cigarettes and vaporizer products and competitors, including “big tobacco,” may have more resources than us for advertising expenses, which could have a material adverse effect on our ability to build and maintain market share, and thus have a material adverse effect on our business, results of operations and financial condition.
The market for NewGen products is subject to a great deal of uncertainty and is still evolving.
Vaporizer products and electronic cigarettes, having recently been introduced to market, are at an early stage of development, and represent core components of a market that is evolving rapidly and is characterized by a number of market participants. Rapid growth in the use of, and interest in, vaporizer products and electronic cigarettes is recent, and may not continue on a lasting basis. The demand and market acceptance for these products is subject to a high level of uncertainty. Therefore, we are subject to all of the business risks associated with a new enterprise in an evolving market. Continued evolution, uncertainty and the resulting increased risk of failure of our new and existing product offerings in this market could have a material adverse effect on our ability to build and maintain market share and on our business, results of operations and financial condition. Further, there can be no assurance that we will be able to continue to effectively compete in the NewGen products marketplace.
We are subject to significant product liability litigation.
The tobacco industry has experienced, and continues to experience, significant product liability litigation. Most tobacco liability lawsuits have been brought against manufacturers and sellers of cigarettes by individual plaintiffs, often participating on a class-action basis, for injuries allegedly caused by cigarette smoking or by exposure to cigarette smoke. However, several lawsuits have also been brought against us and other manufacturers and sellers of smokeless products for injuries to health allegedly caused by use of smokeless products. There are several such suits pending against us with limited activity. In addition to the risks to our business, results of operations and financial condition resulting from adverse results in any such action, ongoing litigation may divert management’s attention and resources, which could have an impact on our business and operations. We cannot predict with certainty the outcome of these claims and there can be no assurance that we will not sustain losses in connection with such lawsuits and that such losses will not have a material adverse effect on our business, results of operations and financial condition.
In addition to current and potential future claims related to our smoking and smokeless products, we are subject to several lawsuits alleging personal injuries resulting from malfunctioning vaporizer devices and may be subject to claims in the future relating to our other NewGen products. We are still evaluating these claims and the potential defenses to them. As a result of their relative novelty, electronic cigarette and vaporizer product manufacturers and sellers have only recently become subject to litigation. We may see increasing litigation over NewGen products or the regulation of our products, as the regulatory regimes surrounding these products develop. For a description of current material litigation to which we or our subsidiaries are a party, see “Item 3. Legal Proceedings.”
As a result, we may face substantial costs due to increased product liability litigation relating to new regulations or other potential defects associated with NewGen products we ship, which could have a material adverse effect on our business, results of operations and financial condition.
The scientific community has not yet studied extensively the long-term health effects of electronic cigarette, vaporizer or e-liquids products use.
Electronic cigarettes, vaporizers and related products were recently developed and therefore the scientific community has not had a sufficient period of time to study the long-term health effects of their use. Currently, there is no way of knowing whether these products are safe for their intended use. If the scientific community were to determine conclusively that use of any or all of these products poses long-term health risks, market demand for these products and their use could materially decline. Such a determination could also lead to litigation and significant regulation. Loss of demand for our product, product liability claims and increased regulation stemming from unfavorable scientific studies on these products could have a material adverse effect on our business, results of operations and financial condition.
We are required to maintain cash amounts within an escrow account in order to be compliant with a settlement agreement between us and certain U.S. states and territories.
In November 1998, the major U.S. cigarette manufacturers entered into the Master Settlement Agreement (“MSA”) and the Smokeless Tobacco Master Settlement Agreement (“STMSA”) with 46 U.S. states and certain U.S. territories and possessions. Pursuant to the MSA and subsequent states’ statutes, a “cigarette manufacturer” (which is defined to also include a manufacturer of RYO/MYO cigarette tobacco) has the option of either becoming a signatory to the MSA, or, as we have elected, operating as a non-participating manufacturer (“NPM”) by funding and maintaining an escrow account, with sub-accounts on behalf of each settling state. These NPM escrow accounts are governed by states’ escrow and complementary statutes that are generally monitored by the Office of the State Attorney General. The statutes require NPM companies to deposit, on an annual basis, into qualified banks’ escrow funds based on the number of cigarettes or cigarette equivalents, which is measured by pounds of RYO/MYO tobacco sold. NPM companies are, within specified limits, entitled to direct the investment of the escrowed funds and withdraw any interest or appreciation, but cannot withdraw the principal for twenty-five years from the year of each annual deposit, except to withdraw funds deposited pursuant to an individual state’s escrow statute to pay a final judgment to that state’s plaintiffs in the event of such a final judgment. The investment vehicles available to us are specified in the state escrow agreements and are limited to low-risk government securities.
Various states have enacted or proposed complementary legislation intended to curb the activity of certain manufacturers and importers of cigarettes or MYO tobacco that are selling into MSA states without signing the MSA or who have failed to properly establish and fund a qualifying escrow account. We believe we have been fully compliant with all applicable laws, regulations, and statutes, although compliance-related issues may, from time to time, be disruptive to our business, any of which could have a material adverse effect on our business, results of operations, and financial condition.
Pursuant to the NPM escrow account statutes, in order to be compliant with the NPM escrow requirements, we are required to deposit such funds for each calendar year into a qualifying escrow account by April 15 of the following year with each year’s deposit being released from escrow after 25 years. We have deposited less than $0.1 million relating to 2017 sales and anticipate deposits of less than $0.1 million relating to 2017 sales during April 2018 due to the discontinuance of our MYO tobacco line in the third quarter of 2017. As of December 31, 2017, we had made deposits of approximately $32.1 million.
Although no such legislation has been proposed or enacted, future changes to the MSA, such as legislation that extends the MSA to products to which it does not currently apply or legislation that limits the ability of companies to receive unused escrow funds after 25 years, may have a material adverse effect on our business, results of operations and financial condition. Despite the amounts maintained and funded to the escrow account, compliance with the funding requirements for the escrow account does not necessarily prevent future federal and/or state regulations with respect to the OTP industry from having a material adverse effect on our business, results of operations and financial condition.
Competition from illicit sources may have an adverse effect on our overall sales volume, restricting the ability to increase selling prices and damaging brand equity.
Illicit trade and tobacco trafficking in the form of counterfeit products, smuggled genuine products and locally manufactured products on which applicable taxes are evaded, represent a significant and growing threat to the legitimate tobacco industry. Factors such as increasing tax regimes, regulatory restrictions, and compliance requirements are encouraging more consumers to switch to illegal, cheaper tobacco products and providing greater rewards for smugglers. Illicit trade can have an adverse effect on our overall sales volume, restrict the ability to increase selling prices, damage brand equity and may lead to commoditization of our products.
Although we combat counterfeiting of our products by engaging in certain tactics, such as requiring all sales force personnel to randomly collect our products from retailers in order to be tested by our quality control team, maintaining a quality control group that is responsible for identifying counterfeit products and using a private investigation firm to help perform surveillance of retailers we suspect are selling counterfeit products, no assurance can be given that we will be able to detect or stop sales of all counterfeit products. In addition, we have in the past and will continue to bring suits against retailers and distributors that sell certain counterfeit products. While we have been successful in securing financial recoveries from and helping to obtain criminal convictions of counterfeiters in the past, no assurance can be given that we will be successful in any such suits or that such suits will be successful in stopping other retailers or distributors from selling counterfeit products. Even if we are successful, such suits could consume a significant amount of management’s time and could also result in significant expenses to the company. Any failure to track and prevent counterfeiting of our products could have a material adverse on our ability to maintain or effectively compete for the products we distribute under our brand names, which would have a material adverse effect on our business, results of operations and financial condition.
Reliance on information technology means a significant disruption could affect our communications and operations.
We increasingly rely on information technology systems for our internal communications, controls, reporting and relations with customers and suppliers and information technology is becoming a significantly important tool for our sales staff. Our marketing and distribution strategy is dependent upon our ability to closely monitor consumer and market trends on a highly specified level, for which we are reliant on our highly sophisticated data tracking systems, which are susceptible to disruption or failure. In addition, our reliance on information technology exposes us to cyber-security risks, which could have a material adverse effect on our ability to compete. Security and privacy breaches may expose us to liability and cause us to lose customers, or may disrupt our relationships and ongoing transactions with other entities with whom we contract throughout our supply chain. The failure of our information systems to function as intended, or the penetration by outside parties intent on disrupting business processes, could result in significant costs, loss of revenue, assets or personal or other sensitive data and reputational harm.
Security and privacy breaches may expose us to liability and cause us to lose customers.
Federal and state laws require us to safeguard our wholesalers’ and retailers’ financial information, including credit information. Although we have established security procedures to protect against identity theft and the theft of our customers’ and distributors’ financial information, our security and testing measures may not prevent security breaches and breaches of privacy may occur and could harm our business. Typically, we rely on encryption and authentication technology licensed from third parties to enhance transmission security of confidential information in relation to financial and other sensitive information that we have on file. Advances in computer capabilities, new discoveries in the field of cryptography, inadequate facility security or other developments may result in a compromise or breach of the technology used by us to protect customer data. Any compromise of our security could harm our reputation or financial condition and, therefore, our business. In addition, a party who is able to circumvent our security measures or exploit inadequacies in our security measures, could, among other effects, misappropriate proprietary information, cause interruptions in our operations or expose customers and other entities with which we interact to computer viruses or other disruptions. Actual or perceived vulnerabilities may lead to claims against us. To the extent the measures we have taken prove to be insufficient or inadequate, we may become subject to litigation or administrative sanctions, which could result in significant fines, penalties or damages and harm to our reputation.
Contamination of, or damage to, our products could adversely impact sales volume, market share and profitability.
Our market position may be affected through the contamination of our tobacco supply or products during the manufacturing process or at different points in the entire supply chain. We keep significant amounts of inventory of our products in warehouses and it is possible that this inventory could become contaminated prior to arrival at our premises or during the storage period. If contamination of our inventory or packaged products occurs, whether as a result of a failure in quality control by us or by one of our suppliers, we may incur significant costs in replacing the inventory and recalling products. We may be unable to meet customer demand and may lose customers who purchase alternative brands or products. In addition, consumers may lose confidence in the affected product.
Under the terms of our contracts, we impose requirements on our suppliers to maintain quality and comply with product specifications and requirements, and on our third-party co-manufacturer to comply with all federal, state and local laws. These third-party suppliers, however, may not continue to produce products that are consistent with our standards or that are in compliance with applicable laws, and we cannot guarantee that we will be able to identify instances in which our third-party suppliers fail to comply with our standards or applicable laws. A loss of sales volume from a contamination event may occur, and such a loss may affect our ability to supply our current customers and to recapture their business in the event they are forced to switch products or brands, even if on a temporary basis. We may also be subject to legal action as a result of a contamination, which could result in negative publicity and affect our sales. During this time, our competitors may benefit from an increased market share that could be difficult and costly to regain. Such a contamination event could have a material adverse effect on our business, results of operations and financial condition.
Our intellectual property may be infringed.
We currently rely on trademark and other intellectual property rights to establish and protect the brand names and logos we own or license. Third parties have in the past infringed, and may in the future infringe, on these trademarks and our other intellectual property rights. Our ability to maintain and further build brand recognition is dependent on the continued and exclusive use of these trademarks, service marks and other proprietary intellectual property, including the names and logos we own or license. Despite our attempts to ensure these intellectual property rights are protected, third parties may take actions that could materially and adversely affect our rights or the value of this intellectual property. Any litigation concerning our intellectual property rights, whether successful or unsuccessful, could result in substantial costs to us and diversions of our resources. Expenses related to protecting our intellectual property rights, the loss or compromise of any of these rights or the loss of revenues as a result of infringement could have a material adverse effect on our business, results of operations and financial condition, and may prevent the brands we own or license from growing or maintaining market share.
Third parties may claim that we infringe their intellectual property and trademark rights.
Competitors in the tobacco products and NewGen markets may claim that we infringe their proprietary rights. Such claims, whether or not meritorious, may result in the expenditure of significant financial and managerial resources, injunctions against us or the payment of damages. Further, our vapor distribution businesses distribute third party product brands with those suppliers’ branding and imagery. If that branding or imagery is alleged by other parties to infringe or otherwise violate intellectual property rights, we could be drawn into such litigation.
We may fail to manage our growth.
We have expanded over our history and intend to grow in the future. For example, we acquired the VaporBeast
®
brand in 2016 which has accelerated our entry into non-traditional retail channels. In addition, we acquired the
Stoker’s
®
brand in 2003, and have continued to develop it through the introduction of new products, such as moist snuff. We have also focused on growing our relationships with our key suppliers through expansion into new product lines, such as the addition of cigarillos, which are sourced by JJA and MYO cigar wraps, which are sourced from Durfort. However, any future growth will place additional demands on our resources, and we cannot be sure we will be able to manage our growth effectively. If we are unable to manage our growth while maintaining the quality of our products and profit margins, or if new systems that we implement to assist in managing our growth do not produce the expected benefits, our business, financial position, results of operations and cash flows could be adversely affected. We may not be able to support, financially or otherwise, future growth, or hire, train, motivate and manage the required personnel. Our failure to manage growth effectively could also limit our ability to achieve our goals as they relate to streamlined sales, marketing and distribution operations and the ability to achieve certain financial metrics.
We may fail to successfully integrate our acquisitions or otherwise be unable to benefit from pursuing acquisitions.
We believe there are meaningful opportunities to grow through acquisitions and joint ventures across all OTP product categories and we expect to continue a strategy of selectively identifying and acquiring businesses with complementary products.
We may be unable to identify, negotiate, and complete suitable acquisition opportunities on reasonable terms. There can be no assurance that any business acquired by us will be successfully integrated with our operations or prove to be profitable to us. We may incur future liabilities related to acquisitions. Should any of the following problems, or others, occur as a result of our acquisition strategy, the impact could be material:
| · |
difficulties integrating personnel from acquired entities and other corporate cultures into our business;
|
| · |
difficulties integrating information systems;
|
| · |
the potential loss of key employees of acquired companies;
|
| · |
the assumption of liabilities and exposure to undisclosed or unknown liabilities of acquired companies; or
|
| · |
the diversion of management attention from existing operations
|
We are subject to fluctuations in our results that make it difficult to track trends and develop strategies in the short-term.
In response to competitor actions and pricing pressures, we have engaged in significant use of promotional and sales incentives. We regularly review the results of our promotional spending activities and adjust our promotional spending programs in an effort to maintain our competitive position. Accordingly, unit sales volume and sales promotion costs in any period are not necessarily indicative of sales and costs that may be realized in subsequent periods. Additionally, promotional activity significantly increases net sales in the month in which it is initiated and net sales are adversely impacted in the month after a promotion. Accordingly, based upon the timing of our marketing and promotional initiatives, we have and may continue to experience significant variability in our results, which could affect our ability to formulate strategies that allow us to maintain our market presence across volatile periods. If our fluctuations obscure our ability to track important trends in our key markets, it may have a material adverse effect on our business, results of operations and financial condition.
We are subject to the risks of exchange rate fluctuations.
Currency movements and suppliers’ price increases relating to premium cigarette papers and cigarette tubes are the primary factors affecting our cost of sales. These products are purchased from Bolloré and we make payments in euros. Thus, we bear certain foreign exchange rate risk for certain of our inventory purchases. In addition, as part of our strategy, we have begun strategic international expansions. As a result, we may be more sensitive to the risks of exchange rate fluctuations. To manage this risk, we sometimes utilize short-term forward currency contracts to purchase euros for our inventory purchases. We have a foreign exchange currency policy which governs our hedging of risk. While we engage in hedging transactions from time to time, no assurance can be made that we will be successful in eliminating currency exchange risks or that changes in currency rates will not have a material adverse effect on our business, results of operations and financial condition.
Adverse U.S. and global economic conditions could negatively impact our business, prospects, results of operations, financial condition or cash flows.
Our business and operations are sensitive to global economic conditions. These conditions include interest rates, energy costs, inflation, recession, fluctuations in debt and equity capital markets and the general condition of the U.S. and world economy. A material decline in the economic conditions affecting consumers, which cause a reduction in disposable income for the average consumer, may change consumption patterns, and may result in a reduction in spending on OTP or a switch to cheaper products or products obtained through illicit channels. Electronic cigarettes, vaporizer and e-liquid products are relatively new to market and may be regarded by users as a novelty item and expendable. As such, demand for our NewGen products may be particularly sensitive to economic conditions such as inflation, recession, high energy costs, unemployment, changes in interest rates and money supply, changes in the political environment and other factors beyond our control, any combination of which could result in a material adverse effect on our business, results of operations and financial condition.
Our supply to our wholesalers and retailers is dependent on the demands of their customers who are sensitive to increased sales taxes and economic conditions affecting their disposable income.
Consumer purchases of tobacco products are historically affected by economic conditions, such as changes in employment, salary and wage levels, the availability of consumer credit, inflation, interest rates, fuel prices, sales taxes, and the level of consumer confidence in prevailing and future economic conditions. Discretionary consumer purchases, such as of OTP, may decline during recessionary periods or at other times when disposable income is lower and taxes may be higher.
In addition, states such as New York, Hawaii, Rhode Island, Georgia and North Carolina have begun collecting taxes on internet sales where companies have used independent contractors in those states to solicit sales from residents of those states. These taxes apply to our online sales of NewGen products into those states, and may result in reduced demand from the independent wholesalers who may not be able to absorb the increased taxes or successfully pass them onto the end-user without experiencing reduced demand. The requirement to collect, track and remit taxes based on independent affiliate sales may require us to increase our prices, which may affect demand for our products or conversely reduce our net profit margin, which could have a material adverse effect on our business, results of operations and financial condition.
Our failure to comply with certain environmental, health and safety regulations could adversely affect our business.
The storage, distribution and transportation of some of the products that we sell are subject to a variety of federal and state environmental regulations. In addition, our manufacturing facilities are similarly subject to federal, state and local environmental laws. We are also subject to operational, health and safety laws and regulations. Our failure to comply with these laws and regulations could cause a disruption in our business, an inability to maintain our manufacturing resources, and additional and potentially significant remedial costs and damages, fines, sanctions or other legal consequences that could have a material adverse effect on our business, results of operations and financial condition.
The departure of key management personnel and the failure to attract and retain talent could adversely affect our operations.
Our success depends upon the continued contributions of our senior management. Our ability to implement our strategy of attracting and retaining the best talent may be impaired by the decreasing social acceptance of OTP usage. The OTP industry competes for talent with the consumer products industry and other companies that enjoy greater societal acceptance. As a result, we may be unable to attract and retain the best talent, which could have a material adverse effect on our business, results of operations and financial condition.
Imposition of significant tariffs on imports into the U.S., could have a material and adverse effect on our business.
We are required to purchase all our cigarette papers, cigarette tubes and cigarette injector machines from Bolloré in France, and we source our Zig-Zag branded cigars and cigarillos and other products from the Dominican Republic. President Trump and his administration have imposed significant tariffs on certain goods imported from outside the U.S. If the U.S. were to impose additional tariffs on goods we import, it is likely to make it more costly for us to import goods from other countries. As a result, our business, financial condition and results of operations could be materially adversely affected.
The reduced disclosure requirements applicable to emerging growth companies may make our common stock less attractive to investors, potentially decreasing our stock price.
We are an “emerging growth company” as defined under the federal securities laws. For as long as we continue to be an emerging growth company, we may take advantage of certain exemptions from various reporting requirements that are applicable to other public companies that are not Emerging Growth Companies. Investors may find our common stock less attractive because we may rely on these exemptions, which include but are not limited to, not being required to comply with the auditor attestation requirements of Section 404 of the Sarbanes-Oxley Act (“Section 404”), reduced disclosure obligations regarding executive compensation in our periodic reports and proxy statements, and exemptions from the requirements of holding a nonbinding advisory vote on executive compensation and shareholder approval of any golden parachute payments not previously approved. In addition, Section 107 of the JOBS Act (“Section 107”) provides that an Emerging Growth Company can take advantage of the extended transition period provided in Section 7(a)(2)(B) of the Securities Act for complying with new or revised accounting standards. We have elected to opt out of the extended transition period for complying with the revised accounting standards.
If investors find our common stock less attractive as a result of exemptions and reduced disclosure requirements, there may be a less active trading market for our common stock and our stock price may be more volatile or decrease.
We may lose our status as an emerging growth company before the five-year maximum time period a company may retain such status.
We have elected to rely on certain exemptions and reduced disclosure requirements applicable to emerging growth companies and expect to continue to do so. However, we may choose to “opt out” of such reduced disclosure requirements and provide disclosure required for companies that do not qualify as emerging growth companies. In addition, we chose to opt out of the provision of the JOBS Act that permits us to take advantage of an extended transition period to comply with new or revised accounting standards applicable to public companies. Section 107 provides that our decision to opt out of the extended transition period for complying with new or revised accounting standards would be irrevocable.
Furthermore, although we are able to remain an emerging growth company for up to five years, we may lose such status at an earlier time if (i) our annual gross revenues exceed $1 billion, (ii) we become a “large accelerated filer” as defined in Rule 12b-2 under the Exchange Act, which would occur if the market value of our common stock that is held by non-affiliates exceeds $700 million as of the last business day of our most recently completed second fiscal quarter, or (iii) we issued more than $1 billion in non-convertible debt during the preceding three-year period.
When we lose our emerging growth company status, whether due to an election, the end of the five-year period, or one of the circumstances listed in the preceding paragraph, the emerging growth company exemptions will cease to apply and we expect we will incur additional expenses and devote increased management effort toward ensuring compliance with the non-emerging growth company requirements. We cannot predict or estimate the amount of additional costs we may incur as a result of the change in our status or the timing of such costs, though such costs may be substantial.
Our principal stockholders are able to exert significant influence over matters submitted to our stockholders and may take certain actions to prevent takeovers.
Special Diversified Opportunities Inc. (“SDOI”), which is controlled by funds managed by Standard General L.P. (together with the funds it manages, “Standard General”), is a significant stockholder. SDOI owns approximately 51% of our stock and Standard General directly owns approximately 2.4% of our common stock. The existence of these and other significant stockholders may have the effect of deterring hostile takeovers, delaying or preventing changes in control or changes in management, or limiting the ability of our other stockholders to approve transactions that they may deem to be in the best interests of our company. In addition, our significant stockholders will be able to exert significant influence over the decision, if any, to authorize additional capital stock, which, if issued, could have a significant dilutive effect on holders of common stock.
Our certificate of incorporation provides that the doctrine of “corporate opportunity” will not apply against SDOI and Standard General in a manner that would prohibit them from investing in competing businesses or doing business with our customers. To the extent they invest in such other businesses, SDOI and Standard General may have differing interests than our other stockholders. In addition, SDOI and Standard General are permitted to engage in business activities or invest in or acquire businesses which may compete with or do business with any competitors of ours.
Furthermore, Standard General is in the business of managing investment funds and therefore may pursue acquisition opportunities that may be complementary to our business and, as a result, such acquisition opportunities may not be available to us.
Our certificate of incorporation and bylaws, as well as Delaware law and certain regulations, could discourage or prohibit acquisition bids or merger proposals, which may adversely affect the market price of our common stock.
Our certificate of incorporation authorizes our board of directors to issue preferred stock without stockholder approval. If our board of directors elects to issue preferred stock, it could be more difficult for a third party to acquire us. In addition, some provisions of our certificate of incorporation, bylaws and applicable law could make it more difficult for a third party to acquire control of us, even if the change of control would be beneficial to our stockholders, including:
| · |
limitations on the removal of directors;
|
| · |
limitations on the ability of our stockholders to call special meetings;
|
| · |
limitations on stockholder action by written consent;
|
| · |
establishing advance notice provisions for stockholder proposals and nominations for elections to the board of directors to be acted upon at meetings of stockholders; and
|
| · |
limitations on the ability of our stockholders to fill vacant directorships or amend the number of directors constituting our board of directors.
|
Our certificate of incorporation limits the ownership of our common stock by individuals and entities that are Restricted Investors. These restrictions may affect the liquidity of our common stock and may result in Restricted Investors being required to sell or redeem their shares at a loss or relinquish their voting, dividend and distribution rights.
For so long as we or one of our subsidiaries is party to any of the Bolloré distribution agreements, our certificate of incorporation will limit the ownership of our common stock by any “Restricted Investor” to 14.9% of our outstanding common stock and shares convertible or exchangeable therefor (including our non-voting common stock) (the “Permitted Percentage”). A “Restricted Investor” is defined as: (i) any entity that directly or indirectly manufactures, sells, markets, distributes or otherwise promotes cigarette paper booklets, filter tubes, injector machines or filter tips in the United States, the District of Columbia, the territories, possessions and military bases of the United States and the Dominion of Canada (a “Bolloré Competitor”), (ii) any entity that owns more than a 20% equity interest in any Bolloré Competitor, or (iii) any person who serves as a director or officer of, or any entity that has the right to appoint an officer or director of, any Bolloré Competitor or of any Entity that owns more than a 20% equity interest in any Bolloré Competitor (each, a “Restricted Investor”). Our certificate of incorporation further provides that any issuance or transfer of shares to a Restricted Investor in excess of the Permitted Percentage will be ineffective as against us and that neither we nor our transfer agent will register the issuance or transfer of shares or be required to recognize the transferee or owner as a holder of our common stock for any purpose except to exercise our remedies described below. Any shares in excess of the Permitted Percentage in the hands of a Restricted Investor will not have any voting or dividend rights and are subject to redemption by us in our discretion. The liquidity or market value of the shares of our common stock may be adversely impacted by such transfer restrictions.
As a result of the above provisions, a proposed transferee of our common stock that is a Restricted Investor may not receive any return on its investment in shares it purchases or owns, as the case may be, and it may sustain a loss. We are entitled to redeem all or any portion of such shares acquired by a Restricted Investor in excess of the Permitted Percentage (“Excess Shares”) at a redemption price based on a fair market value formula that is set forth in our certificate of incorporation, which may be paid in any form, including cash or promissory notes, at our discretion. Excess Shares not yet redeemed will not be accorded any voting, dividend or distribution rights while they constitute Excess Shares. As a result of these provisions, a stockholder who is a Restricted Investor may be required to sell its shares of our common stock at an undesirable time or price and may not receive any return on its investment in such shares. However, we may not be able to redeem Excess Shares for cash because our operations may not have generated sufficient excess cash flow to fund the redemption and we may incur additional indebtedness to fund all or a portion of such redemption, in which case our financial condition may be materially weakened.
Our certificate of incorporation permits us to require that owners of any shares of our common stock provide certification of their status as a Restricted Investor. In the event that a person does not submit such documentation, our certificate of incorporation provides us with certain remedies, including the suspension of the payment of dividends and distributions with respect to shares held by such person and deposit of any such dividends and distributions into an escrow account. As a result of non-compliance with these provisions, an owner of the shares of our common stock may lose significant rights associated with those shares.
Although our certificate of incorporation contains the above provisions intended to assure compliance with the restrictions on ownership of our common stock by Restricted Investors, we may not be successful in monitoring or enforcing the provisions. A failure to enforce or otherwise maintain compliance could lead Bolloré to exercise its termination rights under the agreements, which would have a material and adverse effect on the Company's financial position and its results of operations.
In addition to the risks described above, the foregoing restrictions could delay, defer or prevent a transaction or change in control that might involve a premium price for our common stock or that might otherwise be in the best interest of our stockholders.
Future sales of our common stock in the public market could reduce our stock price, and any additional capital raised by us through the sale of equity or convertible securities may dilute our stockholders.
We may sell additional shares of common stock in subsequent public offerings. We may also issue additional shares of common stock or convertible securities.
We cannot predict the size of future issuances of our common stock or securities convertible into common stock or the effect, if any, that future issuances and sales of shares of our common stock will have on the market price of our common stock. Sales of substantial amounts of our common stock (including shares issued in connection with an acquisition), or the perception that such sales could occur, may adversely affect prevailing market prices of our common stock.
We may issue preferred stock whose terms could adversely affect the voting power or value of our common stock.
Our certificate of incorporation authorizes us to issue, without the approval of our stockholders, one or more classes or series of preferred stock having such designations, preferences, limitations and relative rights, including preferences over our common stock respecting dividends and distributions, as our board of directors may determine. The terms of one or more classes or series of preferred stock could adversely impact the voting power or value of our common stock. For example, we might grant holders of preferred stock the right to elect some number of our directors in all events or on the happening of specified events or the right to veto specified transactions. Similarly, the repurchase or redemption rights or liquidation preferences we might assign to holders of preferred stock could affect the residual value of the common stock.
Our status as a "controlled company" could make our common stock less attractive to some investors or otherwise harm our stock price.
Because we qualify as a "controlled company" under the corporate governance rules for NYSE-listed companies we are not required to have, and could elect in the future not to have, a majority of our board of directors be independent, a compensation committee, or an independent nominating function. Accordingly, should the interests of our controlling stockholder differ from those of other stockholders, the other stockholders may not have the same protections afforded to stockholders of companies subject to all of the corporate governance rules for NYSE-listed companies. Our status as a controlled company could make our common stock less attractive to some investors or otherwise harm our stock price.
None
As of December 31, 2017, we operated manufacturing, distribution, retail, office, and warehouse space in the U.S. with a total floor area of approximately 360,000 square feet, all of which is leased with the exception of our Dresden, Tennessee, manufacturing facility which we purchased in 2016. To provide a cost-efficient supply of products to our customers, we maintain centralized management of internal manufacturing and nationwide distribution facilities. Our three manufacturing and distribution facilities are located in Louisville, Kentucky, Dresden, Tennessee, and Miami, Florida. We believe our facilities are generally adequate for our current and anticipated future use.
The following table describes our principal properties as of December 31, 2017:
|
Location
|
Principal Use
|
Square Feet
|
Owned or
Leased
|
|||
|
Darien, CT
|
Administrative office
|
1,950
|
Leased
|
|||
|
Louisville, KY
|
Corporate offices, manufacturing, R&D, warehousing, and distribution
|
248,800
|
Leased
|
|||
|
Carlsbad, CA
|
Administrative office
|
10,491
|
Leased
|
|||
|
Dresden, TN
|
Manufacturing and administration
|
76,600
|
Owned
|
|||
|
Miami, FL
|
Corporate office, manufacturing, and warehousing
|
8,510
|
Leased
|
|||
|
Miami, FL
|
Corporate office
|
2,512
|
Leased
|
|||
|
Various cities in southern Florida
|
Seven retail stores
|
10,906
|
Leased
|
We are a party from time to time to various proceedings in the ordinary course of business. For a description of the Master Settlement Agreement, to which we are a party, see “Financial Statements and Supplementary Data - Note 2 Summary of Significant Accounting Policies: Risk and Uncertainties.” Other than the proceedings mentioned below, there is no material litigation, arbitration or governmental proceeding currently pending against us or any of our officers or directors in their capacity as such, and we and our officers and directors have not been subject to any such proceeding.
Other major tobacco companies are defendants in a number of product liability claims. In a number of these cases, the amounts of punitive and compensatory damages sought are significant, and could have a material adverse effect on our business and results of operations. We are a defendant in certain cases which have been dormant for many years. Plaintiffs’ counsel are in the process of voluntarily dismissing those claims.
We are subject to several lawsuits alleging personal injuries resulting from malfunctioning vaporizer devices and may be subject to claims in the future relating to our other NewGen products. We are still evaluating these claims and the potential defenses to them. For example, we did not design or manufacture the products at issue; rather, we were merely the distributor. Nonetheless, there can be no assurance that we will prevail in these cases, and they could have a material adverse effect on our business and results of operations. As a result of their relative novelty, electronic cigarette and vaporizer product manufacturers and sellers have only recently become subject to litigation.
See “Risk Factors—We may become subject to significant product liability litigation.”
Not applicable.
Executive Officers of the Registrant
Listed below are the executive officers of the Company. Our executive officers are appointed by, and serve at the discretion of, our board of directors. There are no family relationships between any of the executive officers, and there is no arrangement or understanding between any executive officer and any other person pursuant to which the executive officer was selected.
Lawrence S. Wexler
, age 65, has served as our President and CEO since June 2009 and as President and Chief Operating Officer of NATC, our primary operating subsidiary since June 2006. Prior to June 2006, Mr. Wexler had been the Chief Operating Officer of NATC since June 2005, and prior to that, the President and Chief Operating Officer of one of our other subsidiaries since December 2003. Mr. Wexler was a consultant to a number of emerging marketing, communication, and financial companies, advising them on financial, marketing and strategic matters, at times in an operating role, from 1998 to 2003. From 1977 to 1998, he was employed by Philip Morris, USA in various positions in the Sales, Marketing, and Finance Departments. As Group Director, Discount Brands, his group introduced the Basic and Alpine brands. He served as Senior Vice President of Marketing from 1992 to 1993 and Senior Vice President Finance, Planning, and Information Services from 1993 until his departure in 1998. Mr. Wexler holds a bachelor of science in administrative science from Yale and a master of business administration from Stanford.
Mark A. Stegeman, age 56, has served as our Chief Financial Officer and Senior Vice President since August 2015. Prior to joining us, Mr. Stegeman was Vice President and Assistant Treasurer at Brown-Forman Corporation, a producer of premium spirits, from 2007 to 2015. Mr. Stegeman previously served as Vice President and Treasurer of La-Z-Boy Incorporated from 2001 to 2007. Mr. Stegeman was Vice President & Relationship Manager at UBS from 2000 to 2001, Citigroup from 1997 to 2000, and KeyBank from 1987 to 1997. He was a Senior Audit Accountant at PricewaterhouseCoopers from 1982 to 1987. Mr. Stegeman holds a bachelor of business administration and a master of business administration, both from the University of Toledo.
James W. Dobbins, age 58, has been our Senior Vice President, General Counsel, and Secretary since June 1999 and has served in various roles in our legal department since joining us in June 1999. Prior to joining us, Mr. Dobbins was in private practice in North Carolina and held various positions in the legal department of Liggett Group, Inc., a major cigarette manufacturer, including, at the time he left that company, Vice President, General Counsel, and Secretary. Mr. Dobbins has also practiced as an outside litigation attorney with Webster & Sheffield, a New York law firm, representing a variety of clients including Liggett Group, Inc. Prior to joining Webster & Sheffield, he served as a law clerk to the Honorable J. Daniel Mahoney, U.S. Circuit Judge for the Second Circuit Court of Appeals. Mr. Dobbins holds a bachelor of arts in mathematics and political science from Drew University and a J.D. from Fordham University School of Law.
James Murray, age 57, has served as our Senior Vice President of Business Planning since 2005. Prior to 2005, Mr. Murray was our Senior Vice President of Sales and Marketing since 2002, and prior to that, our Vice President of Marketing since 2000. Previously, Mr. Murray held various marketing positions at Brach’s Confections from 1995 to 1999 and various sales and marketing positions at American Tobacco (American Brands) from 1985 to 1994. Mr. Murray also held various sales and research positions at Schrafft’s Ice Cream and Nielsen Research from 1982 to 1985. Mr. Murray holds a bachelor of science in marketing from Fairfield University and a master of business administration from Fordham University.
PART II
Item 5.
Market for Registrant’s Common Equity, Related Stockholder Matters and Issuer Purchases of Equity Securities
Market Information
The principal stock exchange on which Turning Point Brands, Inc.’s common stock (par value $0.01 per share) is listed is the New York Stock Exchange under the symbol “TPB.” At March 1, 2018, there were 255 holders of record of Turning Point Brands, Inc.’s common stock.
The table below discloses the high and low sales prices per share for Turning Point Brands, Inc.’s common stock as reported by the New York Stock Exchange.
|
For the year ended
December 31, 2017
|
High
|
Low
|
||||||
|
First Quarter
|
$
|
15.87
|
$
|
12.03
|
||||
|
Second Quarter
|
$
|
18.05
|
$
|
14.85
|
||||
|
Third Quarter
|
$
|
17.81
|
$
|
14.45
|
||||
|
Fourth Quarter
|
$
|
21.48
|
$
|
15.34
|
||||
Dividends.
On November 9, 2017, our Board of Directors approved the initiation of a cash dividend to shareholders. The initial quarterly dividend of $0.04 per common share was paid on December 15, 2017 to shareholders of record at the close of business on November 27, 2017.
Performance graph.
The graph below compares the cumulative total shareholder return of Turning Point Brands, Inc.’s common stock since our initial public offering on May 11, 2016, with the Russell 3000 Index and the S&P Small Cap 600 Consumer Staples Index. The information presented assumes an initial investment of $100 on May 11, 2016, and that all dividends were reinvested. The cumulative returns shown represent the value that these investments would have had on December 31, 2017.
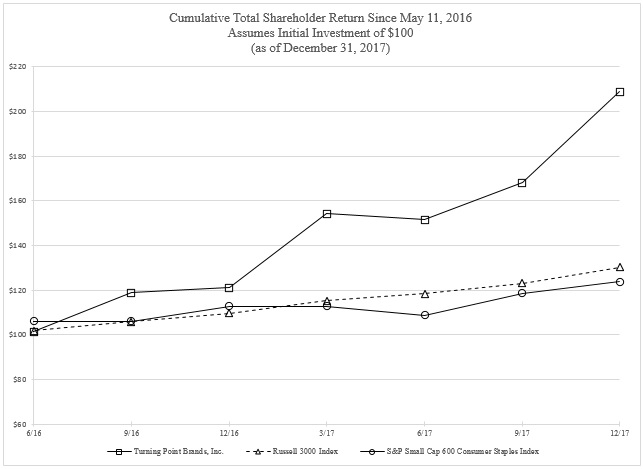
Sales of unregistered securities.
Not applicable.
Issuer purchases of equity securities.
No shares of common stock were purchased during 2017
The following selected financial data should be read in conjunction with “Item 7. Management’s Discussion and Analysis of Financial Condition and Results of Operations” and consolidated financial statements and notes thereto contained in “Item 8. Financial Statements and Supplementary Data” of this report.
A reconciliation of non-GAAP measures to the most directly comparable GAAP financial measure is presented following the Selected Financial Data.
|
(dollars in thousands)
|
Year Ended December 31,
|
|||||||||||||||||||
|
2017
|
2016
|
2015
|
2014
|
2013
|
||||||||||||||||
|
Consolidated Statement of Operations Data:
|
||||||||||||||||||||
|
Net sales
|
$
|
285,777
|
$
|
206,228
|
$
|
197,256
|
$
|
200,329
|
$
|
193,304
|
||||||||||
|
Cost of sales
|
160,908
|
105,872
|
100,960
|
107,165
|
103,043
|
|||||||||||||||
|
Gross profit
|
124,869
|
100,356
|
96,296
|
93,164
|
90,261
|
|||||||||||||||
|
Selling, general and administrative expenses
|
75,369
|
56,771
|
51,785
|
45,108
|
46,849
|
|||||||||||||||
|
Operating income
|
49,500
|
43,585
|
44,511
|
48,056
|
43,412
|
|||||||||||||||
|
Interest expense
|
16,889
|
26,621
|
34,284
|
34,311
|
44,094
|
|||||||||||||||
|
Investment income
|
(438
|
)
|
(768
|
)
|
-
|
-
|
-
|
|||||||||||||
|
Loss on extinguishment of debt
|
6,116
|
2,824
|
-
|
42,780
|
441
|
|||||||||||||||
|
Income (loss) before income taxes
|
26,933
|
14,908
|
10,227
|
(29,035
|
)
|
(1,123
|
)
|
|||||||||||||
|
Income tax expense (benefit)
|
7,280
|
(12,005
|
)
|
1,078
|
370
|
486
|
||||||||||||||
|
Consolidated net income (loss)
|
$
|
19,653
|
$
|
26,913
|
$
|
9,149
|
$
|
(29,405
|
)
|
$
|
(1,609
|
)
|
||||||||
|
Net loss attributable to non-controlling interest
|
$
|
(556
|
)
|
$
|
-
|
$
|
-
|
$
|
-
|
$
|
-
|
|||||||||
|
Net income (loss) attributable to Turning Point Brands, Inc.
|
$
|
20,209
|
$
|
26,913
|
$
|
9,149
|
$
|
(29,405
|
)
|
$
|
(1,609
|
)
|
||||||||
|
Basic income (loss) per common share:
|
||||||||||||||||||||
|
Net income (loss) attributable to Turning Point Brands, Inc.
|
$
|
1.06
|
$
|
1.63
|
$
|
1.27
|
$
|
(4.07
|
)
|
$
|
(0.22
|
)
|
||||||||
|
Diluted income (loss) per common share:
|
||||||||||||||||||||
|
Net income (loss) attributable to Turning Point Brands, Inc.
|
$
|
1.04
|
$
|
1.49
|
$
|
1.10
|
$
|
(4.07
|
)
|
$
|
(0.22
|
)
|
||||||||
|
Weighted average common shares outstanding:
|
||||||||||||||||||||
|
Basic
|
18,989,177
|
16,470,352
|
7,198,081
|
7,223,378
|
7,288,993
|
|||||||||||||||
|
Diluted
|
19,513,008
|
18,015,545
|
8,354,387
|
7,223,378
|
7,288,993
|
|||||||||||||||
|
Other Financial Information:
|
||||||||||||||||||||
|
Net cash provided by operating activities
|
$
|
29,690
|
$
|
9,128
|
$
|
24,430
|
$
|
6,025
|
$
|
3,026
|
||||||||||
|
Net cash used in investing activities
|
(1,932
|
)
|
(26,832
|
)
|
(2,030
|
)
|
(1,314
|
)
|
(723
|
)
|
||||||||||
|
Net cash provided by (used in) financing activities
|
(28,016
|
)
|
15,734
|
(26,032
|
)
|
(31,623
|
)
|
10,641
|
||||||||||||
|
Capital expenditures
|
(2,021
|
)
|
(3,207
|
)
|
(1,602
|
)
|
(1,314
|
)
|
(729
|
)
|
||||||||||
|
Depreciation and amortization
|
2,328
|
1,285
|
1,059
|
933
|
932
|
|||||||||||||||
|
EBITDA (1)
|
52,822
|
42,814
|
45,570
|
6,209
|
43,903
|
|||||||||||||||
|
Adjusted EBITDA (1)
|
60,024
|
52,449
|
50,604
|
48,792
|
49,609
|
|||||||||||||||
|
Leverage Ratio (2)
|
3.3
|
x
|
4.1
|
x
|
5.7
|
x
|
6.1
|
x
|
5.2
|
x
|
||||||||||
|
Balance Sheet Data:
|
||||||||||||||||||||
|
Cash
|
$
|
2,607
|
$
|
2,865
|
$
|
4,835
|
$
|
8,467
|
$
|
35,379
|
||||||||||
|
Working capital
|
41,263
|
37,289
|
42,815
|
42,738
|
68,499
|
|||||||||||||||
|
Total assets
|
282,277
|
285,020
|
242,463
|
242,568
|
287,049
|
|||||||||||||||
|
Notes payable and long-term debt
|
202,040
|
218,225
|
292,440
|
304,916
|
294,007
|
|||||||||||||||
|
Total liabilities
|
228,953
|
250,962
|
324,075
|
334,140
|
350,484
|
|||||||||||||||
|
Total stockholders' equity (deficit)
|
53,324
|
34,058
|
(81,612
|
)
|
(91,572
|
)
|
(63,434
|
)
|
||||||||||||
| (1) |
To supplement our financial information presented in accordance with generally accepted accounting principles in the United States, or U.S. GAAP, we use non-U.S. GAAP financial measures including EBITDA and Adjusted EBITDA. We define “EBITDA” as net income before interest expense, loss on extinguishment of debt, income taxes, depreciation, and amortization. We define “Adjusted EBITDA” as net income before interest expense, loss on extinguishment of debt, income taxes, depreciation, amortization, other non-cash items, and other items that we do not consider ordinary course in our evaluation of ongoing, operating performance. We present EBITDA and Adjusted EBITDA in this Form 10-K because they are key metrics used by management and our board of directors to assess our financial performance and are also used by management to assess performance for the purposes of our executive compensation programs. EBITDA and Adjusted EBITDA are also frequently used by analysts, investors and other interested parties to evaluate companies in our industry. We believe that EBITDA and Adjusted EBITDA are appropriate measures of operating performance because they eliminate the impact of expenses that do not relate to business performance. EBITDA and Adjusted EBITDA have limitations as analytical tools, and you should not consider them in isolation, or as a substitute for analysis of our results as reported under GAAP. Some of these limitations are:
|
| (i) |
They do not reflect our cash expenditures, or future requirements for capital expenditures or contractual commitments;
|
| (ii) |
They do not reflect changes in, or cash requirements for, our working capital needs;
|
| (iii) |
They do not reflect our significant interest expense, or the cash requirements necessary to service interest or principal payments on our debt; and
|
| (iv) |
Although depreciation and amortization are non-cash charges, the assets being depreciated and amortized often will have to be replaced in the future, and EBITDA and Adjusted EBITDA do not reflect any cash requirements for such replacements.
|
|
(2)
|
Leverage Ratio - We calculate our Leverage Ratio by dividing Notes payable and long-term debt, less Cash, by Adjusted EBITDA.
|
|
(dollars in thousands)
|
Year Ended December 31,
|
|||||||||||||||||||
|
2017
|
2016
|
2015
|
2014
|
2013
|
||||||||||||||||
|
Net income (loss) attributable to Turning Point Brands, Inc. (loss)
|
$
|
20,209
|
$
|
26,913
|
$
|
9,149
|
$
|
(29,405
|
)
|
$
|
(1,609
|
)
|
||||||||
|
Add:
|
||||||||||||||||||||
|
Interest expense
|
16,889
|
26,621
|
34,284
|
34,311
|
44,094
|
|||||||||||||||
|
Loss on extinguishment of debt
|
6,116
|
2,824
|
-
|
42,780
|
441
|
|||||||||||||||
|
Income tax expense (benefit)
|
7,280
|
(12,005
|
)
|
1,078
|
370
|
486
|
||||||||||||||
|
Depreciation expense
|
1,626
|
1,227
|
1,059
|
933
|
905
|
|||||||||||||||
|
Amortization expense
|
702
|
58
|
-
|
-
|
27
|
|||||||||||||||
|
EBITDA
|
$
|
52,822
|
$
|
45,638
|
$
|
45,570
|
$
|
48,989
|
$
|
44,344
|
||||||||||
|
Components of Adjusted EBITDA
|
||||||||||||||||||||
|
LIFO adjustment (a)
|
1,123
|
889
|
(56
|
)
|
(798
|
)
|
716
|
|||||||||||||
|
Pension/postretirement expense (b)
|
284
|
437
|
341
|
16
|
407
|
|||||||||||||||
|
Stock options, restricted stock, and incentives expense (c)
|
668
|
180
|
234
|
585
|
234
|
|||||||||||||||
|
Foreign exchange hedging (d)
|
(90
|
)
|
125
|
(35
|
)
|
-
|
-
|
|||||||||||||
|
Strategic initiatives (e)
|
2,133
|
1,587
|
2,259
|
-
|
-
|
|||||||||||||||
|
New product launch costs (f)
|
2,414
|
2,678
|
1,915
|
-
|
633
|
|||||||||||||||
|
Product line rationalizations (g)
|
563
|
-
|
-
|
-
|
-
|
|||||||||||||||
|
Bonus (h)
|
107
|
-
|
-
|
-
|
-
|
|||||||||||||||
|
IPO related compensation costs (i)
|
-
|
915
|
-
|
-
|
-
|
|||||||||||||||
|
Warehouse reconfiguration (j)
|
-
|
-
|
376
|
-
|
-
|
|||||||||||||||
|
Settlement and legal expenses (k)
|
-
|
-
|
-
|
-
|
3,275
|
|||||||||||||||
|
Adjusted EBITDA
|
$
|
60,024
|
$
|
52,449
|
$
|
50,604
|
$
|
48,792
|
$
|
49,609
|
||||||||||
| (a) |
Represents expense related to an inventory valuation allowance for last-in, first-out ("LIFO") reporting.
|
| (b) |
Represents our non-cash Pension/postretirement expense.
|
| (c) |
Represents non-cash stock options, restricted stock and incentives expense.
|
| (d) |
Represents non-cash gain and loss stemming from our foreign exchange hedging activities.
|
| (e) |
Represents the fees incurred for the study of strategic initiatives and acquisition expenses.
|
| (f) |
Represents product launch costs of our new product lines.
|
| (g) |
Represents costs associated with discontinued products related to product line rationalization.
|
| (h) |
Represents bonuses associated with the December 2017 Tax Cuts and Jobs Act.
|
| (i) |
Represents non-recurring compensation expenses incurred coincident with the May 2016 IPO.
|
| (j) |
Represents the one-time relocation of finished product for improved logistical services.
|
| (k) |
Represents settlement and legal expenses relating to the Gordian Group, LLC, complaint and the Langston Complaint.
|
You should read the following discussion of the historical financial condition and results of operations in conjunction with our historical condensed consolidated financial statements and accompanying notes, which are included elsewhere in this Annual Report on Form 10-K. In addition, this discussion includes forward-looking statements subject to risks and uncertainties that may result in actual results differing from statements we make. See “Cautionary Note Regarding Forward-Looking Statements.” Factors that could cause actual results to differ include those risks and uncertainties discussed in “Risk Factors.”
The following discussion relates to the audited financial statements of Turning Point Brands, Inc., included elsewhere in this Annual Report on Form 10-K. In this discussion, unless the context requires otherwise, references to “our Company” “we,” “our,” or “us” refer to Turning Point Brands, Inc., and its consolidated subsidiaries. References to “TPB” refer to Turning Point Brands, Inc., without any of its subsidiaries. We were incorporated in 2004 under the name North Atlantic Holding Company, Inc. On November 4, 2015, we changed our name to Turning Point Brands, Inc. Many of the amounts and percentages in this discussion have been rounded for convenience of presentation.
Organizational Structure
We, Turning Point Brands, Inc., are a holding company which owns North Atlantic Trading Company, Inc. (“NATC”), and its subsidiaries National Tobacco Company, L.P. (“NTC”), National Tobacco Finance, LLC (“NTFLLC”), North Atlantic Operating Company, Inc. (“NAOC”), North Atlantic Cigarette Company, Inc. (“NACC”), and RBJ Sales, Inc. (“RBJ”), and Turning Point Brands, LLC (“TPLLC”), and its subsidiaries Intrepid Brands, LLC (“Intrepid”), VaporBeast, LLC (“VaporBeast”, f/k/a Smoke Free Technologies, Inc.), and Vapor Shark, LLC, and its subsidiaries (collectively, “Vapor Shark”, f/k/a The Hand Media).
Overview
We are a leading independent provider of Other Tobacco Products (“OTP”) in the U.S. We sell a wide range of products across the OTP spectrum including moist snuff tobacco (“MST”), loose leaf chewing tobacco, premium cigarette papers, make-your-own (“MYO”) cigar wraps and cigar smoking tobacco, cigars, liquid vapor products, and tobacco vaporizer products; but, we do not sell cigarettes. We estimate the OTP industry generated approximately $11 billion in manufacturer revenue in 2017. In contrast to manufactured cigarettes, which have been experiencing declining volumes for decades based on data published by the Alcohol and Tobacco Tax and Trade Bureau (“TTB”), the OTP industry is demonstrating increased consumer appeal
with low to mid-single digit consumer unit growth as reported by
Management Science Associates, Inc. (“MSAi”),
a third-party analytics and informatics company. Under the leadership of a senior management team with an average of 22 years of experience in the tobacco industry, we have grown and diversified our business through new product launches, category expansions, and acquisitions while concurrently improving operational efficiency.
Products
We operate in three segments: (i) Smokeless products, (ii) Smoking products and (iii) NewGen products. In our Smokeless products segment we manufacture and market moist snuff and contract for and market loose leaf chewing tobacco products. In our Smoking products segment, we (i) market and distribute cigarette papers and related products, (ii) market and distribute MYO cigar wraps, MYO loose cigar smoking tobacco, and cigars, and (iii) package, market, and distribute traditional pipe tobaccos. In our NewGen products segment, we (i) market and distribute liquid vapor products, tobacco vaporizer products, and certain other products without tobacco and/or nicotine; (ii) distribute a wide assortment of vaping related products to non-traditional retail via VaporBeast and Vapor Shark; and (iii) distribute a wide assortment of vaping related products to individual consumers via Vapor Shark branded retail outlets. Refer to the ‘Recent Developments’ section below for details regarding the VaporBeast and Vapor Shark acquisitions.
Our portfolio of brands includes some of the most widely recognized names in the OTP industry, such as
Stoker’s
®
,
Zig-Zag
®
, and
VaporBeast
®
. The following table sets forth the market share and category rank of our core products and demonstrates their industry positions:
|
Brand
|
Product
|
TPB Segment
|
Market Share
(1)
|
Category Rank
(1)
|
|||||
|
Stoker’s
®
|
Chewing Tobacco
|
Smokeless Products
|
17.9
|
%
|
#1 discount, #2 overall
|
||||
|
Stoker’s
®
|
Moist Snuff
|
Smokeless Products
|
2.9
|
%
|
#4 discount, #7 overall
|
||||
|
Zig-Zag
®
|
Cigarette Papers
|
Smoking Products
|
32.9
|
%
|
#1 premium
|
||||
|
Zig-Zag
®
|
MYO Cigar Wraps
|
Smoking Products
|
76.0
|
%
|
#1 overall
|
||||
|
(1)
|
Market share and category rank data for all products are derived from MSAi data as of 12/31/17.
|
Operations
As of December 31, 2017, our products are available in approximately 170,000 U.S. retail locations which, with the addition of retail stores in Canada, brings our total North American retail presence to an estimated 200,000 points of distribution. We subscribe to a sales tracking system from MSAi that records all OTP product shipments (ours as well as those of our competitors) from approximately 900 wholesalers to over 250,000 retail stores in the U.S. This system enables us to understand individual product share and volume trends across multiple categories down to the individual retail store level, allowing us to allocate field salesforce coverage to the highest opportunity stores. Our sales and marketing group of approximately 145 professionals utilizes the MSAi system to efficiently target markets and sales channels with the highest sales potential.
Our core tobacco business (Smokeless and Smoking segments) primarily generates revenues from the sale of our products to wholesale distributors who, in turn, resell the products to retail operations. Our acquisition of VaporBeast in November 2016 expanded our revenue streams as we began selling directly to non-traditional retail outlets and to ultimate consumers via non-traditional retail outlets as well. Our acquisition of Vapor Shark further expanded our selling network by allowing us to directly reach ultimate consumers through Vapor Shark branded retail outlets. Our net sales, which include federal excise taxes, consist of gross sales net of cash discounts, returns, and selling and marketing allowances.
We rely on long-standing relationships with high-quality, established manufacturers to provide the majority of our produced products. Approximately 87% of our production, as measured by gross sales, is outsourced to suppliers. The remaining 13% represents our moist snuff tobacco operations located in Dresden, TN, and the packaging of our pipe tobacco in Louisville, KY. Our principal operating expenses include the cost of raw materials used to manufacture the limited number of our products which we produce in-house; the cost of finished products, which are generally purchased goods; federal excise taxes; legal expenses; and compensation expenses, including benefits and costs of salaried personnel. Our other principal expenses include interest expense and other expenses.
Key Factors Affecting Our Results of Operations
We consider the following to be the key factors affecting our results of operations:
| · |
Our ability to further penetrate markets with our existing products;
|
| · |
Our ability to introduce new products and product lines that complement our core business;
|
| · |
Decreasing interest in tobacco products among consumers;
|
| · |
Price sensitivity in our end-markets;
|
| · |
Marketing and promotional initiatives, which cause variability in our results;
|
| · |
General economic conditions, including consumer access to disposable income;
|
| · |
Cost and increasing regulation of promotional and advertising activities;
|
| · |
Cost of complying with regulation, including newly passed “deeming regulations”;
|
| · |
Counterfeit and other illegal products in our end-markets;
|
| · |
Currency fluctuations;
|
| · |
Our ability to identify attractive acquisition opportunities in OTP; and
|
| · |
Our ability to integrate acquisitions.
|
Recent Developments
Credit Facility Refinancing
On March 7, 2018 we entered into a $250 million credit facility consisting of $200 million in first and second lien term loans and $50 million in a revolving credit facility (collectively, the “2018 Credit Facility”). We used a portion of the proceeds from the 2018 Credit Facility to repay, in full, the 2017 Credit Facility. (For a more complete description of our 2018 Credit Facility, see”- Subsequent Events – Refinancing.”)
Other Developments
On November 9, 2017, our Board of Directors approved the initiation of a cash dividend to shareholders. The initial quarterly dividend of $0.04 per common share was paid on December 15, 2017, to shareholders of record at the close of business on November 27, 2017.
On July 28, 2017, the U.S. Food and Drug Administration (“FDA”) announced a new direction in regulating tobacco products, including the newly “deemed” markets such as cigars and vapor products. FDA stated it intends to begin several new rulemaking processes, some of which will outline foundational rules governing the premarket application process for the deemed products, including Substantial Equivalence Applications and Premarket Tobacco Applications. Compliance and related costs could be significant and could increase the costs of operating in our NewGen Segment. The original filing deadlines for the applications of these newly “deemed” products on the market as of August 8, 2016, have been postponed until August 8, 2021, for “combustible” products (e.g., cigar and pipe) and August 8, 2022, for “non-combustible” products (e.g., vapor products). No other application filing deadlines were altered. FDA also acknowledged a “continuum of risk” among tobacco products (i.e., that certain tobacco products pose a greater risk to individual and public health than others), that it intends to seek public comment on the role that flavors play in attracting youth and the role that flavors may play in helping some smokers switch to potentially less harmful forms of nicotine delivery, and that it will increase its focus on the regulation of cigarette products. This new FDA direction follows increased taxation efforts by state municipalities including the implementation of a $0.55 per ounce excise tax on smokeless products in Pennsylvania enacted on October 1, 2016, and an increase in tax on all OTP products sold in California to 65.1% effective July 1, 2017.
On June 30, 2017, we filed a Form S-3 Registration Statement with the Securities and Exchange Commission providing for the potential to offer up to $200 million in the aggregate of our common stock, preferred stock, depository shares, warrants, and units, as well as a secondary offering and sale of up to approximately 12.8 million shares of TPB common stock by selling shareholders. We currently have no plans to utilize the offering; however, we believe it provides future flexibility as we continue to drive our strategic organic growth and acquisition initiatives.
In March 2017, we entered into a strategic partnership with The Hand Media, d/b/a Vapor Shark (“Vapor Shark”), a leading distributor and manufacturer of premium vaping e-liquids with nationwide distribution through independent retail vape shops as well as Vapor Shark branded retail locations. Through the strategic partnership, we were issued a warrant to purchase all outstanding stock of Vapor Shark in exchange for a commitment to deposit up to $2.5 million. In April 2017, we entered into a management agreement with Vapor Shark whereby we gained control of the Vapor Shark operations. On June 30, 2017, we exercised the warrant and obtained ownership of 100% of the outstanding shares of Vapor Shark. Our exercise of the warrant triggered an option giving Vapor Shark’s former sole shareholder the right to purchase Vapor Shark’s company-owned stores for $1. As part of the acquisition, we recorded a liability of $0.6 million related to the former shareholder’s option to purchase the company-owned stores. In December 2017, the Company offered to pay Vapor Shark’s former sole shareholder $1.5 million in exchange for his right to purchase the company-owned stores. The agreement was finalized in January 2018, and the Company paid $1.0 million in February 2018 with the remaining $0.5 million to be paid in 24 monthly installments.
IPO
In May 2016, we sold 6,210,000 shares of voting common stock in our IPO at a price of $10.00 per share. The gross proceeds of the IPO totaled $62.1 million. Refer to the 2016 Annual Report on Form 10-K for details regarding use of the IPO proceeds.
In April 2016, we increased the total authorized shares of preferred and voting and non-voting common stock and effected a 10.43174381 for 1 stock split of our voting and non-voting common stock. As a result of the stock split, all previously reported share amounts (including options and warrants) in the accompanying financial statements and related notes of the Company have been retrospectively restated to reflect the stock split.
Critical Accounting Policies and Uses of Estimates
The accompanying consolidated financial statements have been prepared in conformity with accounting principles generally accepted in the United States. When more than one accounting principle, or the method of its application, is generally accepted, we select the principle or method that is appropriate in the specific circumstances. Application of these accounting principles requires us to make estimates about the future resolution of existing uncertainties. Actual results could differ from these estimates. We evaluate our estimates, including those related to revenue recognition, collectability of accounts receivable, inventory valuation and obsolescence, goodwill, intangibles, pension and postretirement obligations, income taxes, litigation, and contingencies on an ongoing basis. We base these estimates on our historical experience and other assumptions we believe are appropriate under the circumstances. In preparing these consolidated financial statements, we have made our best estimates and judgments of the amounts and disclosures included in the consolidated financial statements.
Revenue Recognition
.
We recognize revenues, net of sales incentives and sales returns, including shipping and handling charges billed to customers, upon delivery to the customer at which time there is a transfer of title and risk of loss to the customer in accordance with ASC 605-10-S99. We classify customer rebates as sales deductions in accordance with the requirements of ASC 605-50-25.
Derivative Instruments
.
We use foreign currency forward contracts to hedge a portion of our exposure to changes in foreign currency exchange rates from time to time. We account for our forward contracts under the provisions of ASC 815, Derivatives and Hedging. Under our policy, as amended, we may hedge up to 100% of our anticipated purchases of inventory in the denominated invoice currency over a forward period not to exceed twelve months. We may also, from time to time, hedge up to ninety percent of our non-inventory purchases in the denominated invoice currency. Forward contracts that qualify as hedges are adjusted to their fair value through other comprehensive income as determined by market prices on the measurement date except any hedge ineffectiveness which is recognized currently in income. Gains and losses on these contracts are transferred from other comprehensive income into net income as the related inventories are received. Changes in fair value of any contracts that do not qualify for hedge accounting or are not designated as hedges are recognized in income currently.
Goodwill and Other Intangible Assets
.
We follow the provisions of ASC 350, Intangibles – Goodwill and Other. In accordance with ASC 350-20-35, goodwill and indefinite-lived intangible assets are reviewed for impairment annually on December 31, or more frequently if certain indicators are present. If the carrying value of the goodwill or indefinite-life intangible asset exceeds its fair value, which is determined using discounted cash flows, the goodwill or intangible asset is considered impaired. The carrying value of the goodwill or indefinite-life intangible asset would then be reduced to fair value. For goodwill, the determination of a reporting unit’s fair value involves, among other things, our market capitalization and application of the income approach, which includes developing forecasts of future cash flows and determining an appropriate discount rate.
Based on our annual goodwill impairment testing, the estimated fair values of each of our reporting units were substantially in excess of the respective carrying values. We had no such impairment of goodwill or other intangible assets during the year ended December 31, 2017.
Fair Value:
GAAP establishes a framework for measuring fair value. That framework provides a fair value hierarchy that prioritizes the inputs to valuation techniques used to measure fair value. The hierarchy gives the highest priority to unadjusted quoted prices in active markets for identical assets or liabilities (level 1) and the lowest priority to unobservable inputs (level 3). The three levels of the fair value hierarchy under GAAP are described below:
| · |
Level 1 – Inputs to the valuation methodology are unadjusted quoted prices for identical assets or liabilities in active markets at the measurement date.
|
| · |
Level 2 – Inputs to the valuation methodology include: quoted prices for similar assets or liabilities in active markets; quoted prices for identical or similar assets or liabilities in inactive markets; inputs other than quoted prices that are observable for the asset or liability; and inputs that are derived principally from or corroborated by observable market data by correlation or other means.
|
| · |
Level 3 – Unobservable inputs that reflect management’s best estimate of what market participants would use in pricing the asset or liability at the measurement date.
|
Retirement Plans
.
We follow the provisions of ASC 715, Compensation – Retirement Benefits in accounting for our retirement plans, which requires an employer to (i) recognize in its statement of financial position the funded status of a benefit plan, measured as the difference between the fair value of plan assets and benefit obligations; (ii) recognize, net of tax, the gains or losses and prior service costs or credits that arise during the period but are not recognized as components of net periodic benefit cost; and (iii) measure defined benefit plan assets and obligations as of the date of the employer’s statement of financial position.
Income Taxes
.
We account for income taxes under ASC 740. We record the effects of income taxes under the liability method in which deferred income tax assets and liabilities are recognized based on the difference between the financial and tax basis of assets and liabilities using the enacted tax rates in effect for the years in which the differences are expected to reverse. We assess our ability to realize future benefits of deferred tax assets by determining if they meet the “more likely than not” criteria in ASC 740, Income Taxes. If we determine that future benefits do not meet the “more likely than not” criteria, a valuation allowance is recorded.
Stock-Based Compensation
.
We measure stock compensation costs related to our stock options on the fair value based method under the provisions of ASC 718, Compensation – Stock Compensation, which requires compensation cost for stock options to be recognized based on the fair value of stock options granted. We determined the fair value of these awards using the Black-Scholes option pricing model.
Accounts Receivable
.
Accounts receivable are recognized at their net realizable value. All accounts receivable are trade-related and are recorded at the invoiced amount and do not bear interest. We maintain allowances for doubtful accounts receivable for estimated uncollectible invoices resulting from the customer’s inability to pay, which may result in write-offs. We recorded an allowance for doubtful accounts of less than $0.1 million at December 31, 2017 and 2016, respectively.
Inventories.
Inventories are stated at the lower of cost or market. Cost was determined using the LIFO method for approximately 51% of the inventories. Leaf tobacco is presented in current assets in accordance with standard industry practice, notwithstanding the fact that such tobaccos are carried longer than one year for the purpose of curing. We recorded an inventory valuation allowance of $0.5 million and $0.6 million at December 31, 2017 and 2016, respectively.
Jumpstart Our Business Startups Act of 2012
We chose to “opt out” of the provision of the JOBS Act that permits us, as an “emerging growth company,” to take advantage of an extended transition period to comply with new or revised accounting standards applicable to public companies. As a result, we will comply with new or revised accounting standards as required for public companies. Our decision to opt out of the extended transition period provided in the JOBS Act is irrevocable.
Results of Operations
Summary
The table and discussion set forth below relates to our consolidated results of operations for the years ended December 31 (in thousands):
|
Year Ended December 31,
|
||||||||||||||||||||
|
2017
|
2016
|
% Change
|
2015
|
% Change
|
||||||||||||||||
|
Consolidated Results of Operations Data:
|
||||||||||||||||||||
|
Net sales
|
||||||||||||||||||||
|
Smokeless products
|
$
|
84,560
|
$
|
77,913
|
8.5
|
%
|
$
|
74,293
|
4.9
|
%
|
||||||||||
|
Smoking products
|
109,956
|
111,005
|
-0.9
|
%
|
105,898
|
4.8
|
%
|
|||||||||||||
|
NewGen products
|
91,261
|
17,310
|
427.2
|
%
|
17,065
|
1.4
|
%
|
|||||||||||||
|
Total net sales
|
285,777
|
206,228
|
38.6
|
%
|
197,256
|
4.5
|
%
|
|||||||||||||
|
Cost of sales
|
160,908
|
105,872
|
52.0
|
%
|
100,960
|
4.9
|
%
|
|||||||||||||
|
Gross profit
|
||||||||||||||||||||
|
Smokeless products
|
42,602
|
38,634
|
10.3
|
%
|
38,521
|
0.3
|
%
|
|||||||||||||
|
Smoking products
|
57,146
|
57,595
|
-0.8
|
%
|
52,842
|
9.0
|
%
|
|||||||||||||
|
NewGen products
|
25,121
|
4,127
|
508.7
|
%
|
4,933
|
-16.3
|
%
|
|||||||||||||
|
Total gross profit
|
124,869
|
100,356
|
24.4
|
%
|
96,296
|
4.2
|
%
|
|||||||||||||
|
Selling, general and administrative expenses
|
75,369
|
56,771
|
32.8
|
%
|
51,785
|
9.6
|
%
|
|||||||||||||
|
Operating income
|
49,500
|
43,585
|
44,511
|
|||||||||||||||||
|
Interest expense
|
16,889
|
26,621
|
-36.6
|
%
|
34,284
|
-22.4
|
%
|
|||||||||||||
|
Investment income
|
(438
|
)
|
(768
|
)
|
-43.0
|
%
|
-
|
NM
|
||||||||||||
|
Loss on extinguishment of debt
|
6,116
|
2,824
|
116.6
|
%
|
-
|
NM
|
||||||||||||||
|
Income before income taxes
|
26,933
|
14,908
|
80.7
|
%
|
10,227
|
45.8
|
%
|
|||||||||||||
|
Income tax expense (benefit)
|
7,280
|
(12,005
|
)
|
-160.6
|
%
|
1,078
|
NM
|
|||||||||||||
|
Consolidated net income
|
19,653
|
26,913
|
-27.0
|
%
|
9,149
|
194.2
|
%
|
|||||||||||||
|
Net loss attributable to non-controlling interest
|
(556
|
)
|
-
|
NM
|
-
|
NM
|
||||||||||||||
|
Net income attributable to Turning Point Brands, Inc.
|
$
|
20,209
|
$
|
26,913
|
-24.9
|
%
|
$
|
9,149
|
194.2
|
%
|
||||||||||
Comparison of Year Ended December 31, 2017, to Year Ended December 31, 2016
Net Sales
.
For the year ended December 31, 2017, overall net sales increased to $285.8 million from $206.2 million for the year ended December 31, 2016, an increase of $79.5 million or 38.6%. For the year ended December 31, 2017, volumes increased 34.2% and price/mix increased 4.4%. This increase was substantially due to an increase in NewGen products sales as a result of the acquisitions of VaporBeast and Vapor Shark.
For the year ended December 31, 2017, net sales in the Smokeless products segment increased to $84.6 million from $77.9 million for the year ended December 31, 2016, an increase of $6.6 million or 8.5%. For the year, volume increased 3.4% and price/mix increased 5.1%. Net sales growth was primarily driven by
Stoker’s
®
MST.
For the year ended December 31, 2017, net sales in the Smoking products segment decreased to $110.0 million from $111.0 million for the year ended December 31, 2016, a decrease of $1.0 million or 0.9%. For the year ended December 31, 2017, Smoking products volumes decreased 3.7%, while price/mix increased 2.8%. The decline in net sales is primarily due to reduced investment in the cigar product line to allow for those resources to be used for other product lines with higher margins.
For the year ended December 31, 2017, net sales in the NewGen products segment increased to $91.3 million from $17.3 million for the year ended December 31, 2016, an increase of $74.0 million or 427.2%. For the year ended December 31, 2017, NewGen products volumes increased 415.8%, while price/mix increased 11.4%. Net sales growth was primarily driven by the acquisitions of VaporBeast and Vapor Shark.
Gross Profit.
For the year ended December 31, 2017, overall gross profit increased to $124.9 million from $100.4 million for the year ended December 31, 2016, an increase of $24.5 million or 24.4%, primarily due to acquisition of VaporBeast. Gross margin weakened to 43.7% for the year ended December 31, 2017, from 48.7% for the year ended December 31, 2016, as a result of the mix impact of VaporBeast’s inherently lower distribution margins.
For the year ended December 31, 2017, gross profit in the Smokeless products segment increased to $42.6 million from $38.6 million for the year ended December 31, 2016, an increase of $4.0 million or 10.3%. Gross profit as a percentage of net sales increased to 50.4% of net sales for the year ended December 31, 2017, from 49.6% of net sales for the year ended December 31, 2016. The increase in gross margin is due to us being able to take price increases and the further expansion of
Stoker’s
®
MST sales, leveraging our Smokeless fixed costs across a higher sales volume.
For the year ended December 31, 2017, gross profit in the Smoking products segment decreased to $57.1 million from $57.6 million for the year ended December 31, 2016, a decrease of $0.4 million or 0.8%. Gross profit as a percentage of net sales increased to 52.0% of net sales for the year ended December 31, 2017, from 51.9% of net sales for the year ended December 31, 2016.
For the year ended December 31, 2017, gross profit in the NewGen products segment increased to $25.1 million from $4.1 million for the year ended December 31, 2016, an increase of $21.0 million or 508.7%. Gross profit as a percentage of net sales increased to 27.5% of net sales for the year ended December 31, 2017, from 23.8% of net sales for the year ended December 31, 2016, primarily as a result of the change in product mix in the segment and our continued focus on margin expansion in the NewGen segment.
Selling, General and Administrative Expenses
.
For the year ended December 31, 2017, selling, general and administrative expenses increased to $75.4 million from $56.8 million for the year ended December 31, 2016, an increase of $18.6 million or 32.8%, due primarily to acquisitions of VaporBeast and Vapor Shark, increased legal cost for anti-counterfeiting initiatives related to our
Zig-Zag
®
cigarette papers, and the one-time charge of $0.9 million relating to purchase of the option for the Vapor Shark branded retail stores.
Interest Expense.
For the year ended December 31, 2017, interest expense decreased to $16.9 million from $26.6 million for the year ended December 31, 2016, primarily as a result of lower interest rates from our 2017 debt refinancing.
Income Tax Expense (Benefit).
The Company’s income tax expense of $7.3 million, or 27% of income before income taxes, for the year ended December 31, 2017, is lower than the expected annual effective tax rate as a result of discrete tax benefits of $4.2 million from the exercise of stock options during the year. The Company’s income tax expense for the year ended December 31, 2016, does not bear the normal relationship to income before income taxes primarily due to releasing the valuation allowance on our deferred taxes as we determined that it is more-likely than not that we will realize our deferred tax assets which consist primarily of a federal net operating loss (“NOL”) carryforward.
Investment Income
.
For the year ended December 31, 2017 and 2016, investment income relating to investments of the MSA escrow deposits was $0.4 million and $0.8 million, respectively.
Loss on Extinguishment of Debt.
For the year ended December 31, 2017, loss on extinguishment of debt was $6.1 million as the result of refinancing our credit facility in the first quarter of 2017. For the year ended December 31, 2016, loss on extinguishment of debt was $2.8 million as the result of retiring certain debt with proceeds from our IPO.
Consolidated Net Income
.
Due to the factors described above, net income for the year ended December 31, 2017 and 2016, was $19.7 million and $26.9 million, respectively.
Net Loss Attributable to Non-Controlling Interest.
Net loss attributable to non-controlling interest of $0.6 million for the year ended December 31, 2017, is related to Vapor Shark, which was accounted for as a VIE during the second quarter of 2017.
Net Income Attributable to Turning Point Brands, Inc.
Due to the factors described above, net income for the year ended December 31, 2017 and 2016, was $20.2 million and $26.9 million, respectively.
Comparison of Year Ended December 31, 2016 to Year Ended December 31, 2015
Net Sales.
For the year ended December 31, 2016, overall net sales increased to $206.2 million from $197.3 million in the year ended December 31, 2015, an increase of $9.0 million, or 4.5% as a result of increases in all our segments.
For the year ended December 31, 2016, net sales in the Smokeless products segment increased to $77.9 million from $74.3 million in the year ended December 31, 2015, an increase of $3.6 million, or 4.9%.
Net sales growth was principally driven by MST.
Given the disparity between chew and MST case prices (average chew case price is 2.5 times that of MST), f
or the year ended December 31, 2016, volume increased 0.2% and price/mix increased 4.6%. Volume was adversely impacted by the October 1, 2016, Pennsylvania state excise tax increase.
For the year ended December 31, 2016, net sales in the Smoking products segment increased to $111.0 million from $105.9 million in the year ended December 31, 2015, an increase of $5.1 million, or 4.8%. Net sales growth was driven by
continued growth in our MYO cigar wraps and the roll-out of
Zig-Zag
®
cigarillo size wraps, which was somewhat offset by cigar declines. For the year ended December 31, 2016, volume increased 1.6% and price/mix increased 3.2%.
For the year ended December 31, 2016, net sales in the NewGen products segment increased to $17.3 million from $17.1 million in the year ended December 31, 2015, an increase of $0.2 million or 1.4%
due to the inclusion of one month of VaporBeast net sales partially offset by declines in existing NewGen products.
For the year ended December 31, 2016,
volume increased 4.9% and price/mix decreased 3.5%.
Gross Profit.
For the year ended December 31, 2016, overall gross profit increased to $100.4 million from $96.3 million for the year ended December 31, 2015, an increase of $4.1 million, or 4.2%, principally due to an increase in gross profit in the Smoking products segment, partially offset by a decrease in gross profit in the NewGen products segment.
For the year ended December 31, 2016, gross profit in the Smokeless products segment increased to $38.6 million from $38.5 million for the year ended December 31, 2015, an increase of $0.1 million, or 0.3%. Gross margin for this segment as a percentage of net sales decreased to 49.6% of net sales for the year ended December 31, 2016, from 51.9% in the year ended December 31, 2015, as MST, which is lower margin compared to chew, became a bigger portion of the segment sales. Gross profit was negatively impacted by non-cash inventory adjustments as a result of LIFO.
For the year ended December 31, 2016, gross profit in the Smoking products segment increased to $57.6 million from $52.8 million for the year ended December 31, 2015, an increase of $4.8 million, or 9.0%. Gross margin for this segment as a percentage of net sales increased to 51.9% of net sales for the year ended December 31, 2016, from 49.9% for the year ended December 31, 2015 as selling prices increased at a faster rate than the cost of the goods.
For the year ended December 31, 2016, gross profit in the NewGen products segment decreased to $4.1 million from $4.9 million for the year ended December 31, 2015, a decrease of $0.8 million, or 16.3%. Gross margin for this segment as a percentage of net sales decreased to 23.8% of net sales for the year ended December 31, 2016, from 28.9% for the year ended December 31, 2015, as increased product returns in 2016 led to higher costs.
Selling, General and Administrative Expenses
. For the year ended December 31, 2016, selling, general, and administrative expenses increased to $56.8 million from $51.8 million for the year ended December 31, 2015, an increase of $5.0 million, or 9.6%, due to increases in sales and marketing infrastructure, primarily due to increased headcount, IPO related compensation, transaction costs relating to our acquisitions, increased legal and litigation expenses and the inclusion of one month of VaporBeast expenses.
Interest Expense and Financing Costs
.
For the year ended December 31, 2016, interest expense and amortization of deferred financing costs decreased to $26.6 million from $34.3 million for the year ended December 31, 2015, a decrease of $7.7 million, or 22.4%, due to the pay-down of debt as a result of the IPO.
Investment Income
.
In 2016, we began to invest the MSA escrow deposits. For the year ended December 31, 2016, investment income was $0.8 million relating to these investments.
Loss on Extinguishment of Debt.
For the year ended December 31, 2016, loss on extinguishment of debt was $2.8 million as the result of retiring certain debt with proceeds from the IPO.
Income Tax Expense (Benefit).
For the year ended December 31, 2016, income tax benefit was $12.0 million primarily due to releasing the valuation allowance as we determined that it is more-likely than not that we will realize our deferred tax assets which consist primarily of an NOL carryforward. For the year ended December 31, 2015, income tax expense was $0.4 million primarily for state income taxes as federal income taxes were offset by our NOL carryforward.
Net Income.
For the year ended December 31, 2016, net income increased to $26.9 million from $9.1 million in the year ended December 31, 2015, an increase of $17.8 million for the reasons set forth above.
Liquidity and Capital Reserves
Our principal uses for cash are working capital, debt service, and capital expenditures. We believe our cash flows from operations and borrowing availability under our 2018 Revolving Credit Facility (as defined herein) are adequate to satisfy our operating cash requirements for the foreseeable future.
Our working capital, which we define as current assets less current liabilities, increased $4.0 million to $41.3 million at December 31, 2017, compared with $37.3 million at December 31, 2016. The increase in working capital is due to increases in accounts receivable, inventory, and accrued liabilities as a result of increased sales offset by decreases in accounts payable and our revolving credit facility balance as the 2016 revolving credit facility balance was abnormally high due to the acquisition of VaporBeast in November 2016.
|
(in thousands)
|
2017
|
2016
|
||||||
|
Current Assets
|
$
|
79,493
|
$
|
78,856
|
||||
|
Current Liabilities
|
38,230
|
41,567
|
||||||
|
Working Capital
|
$
|
41,263
|
$
|
37,289
|
||||
During the year ended December 31, 2017, we invested $2.0 million in capital expenditures. We had unrestricted cash on hand of $2.6 million and $2.9 million as of December 31, 2017 and 2016, respectively. We had restricted assets of $30.8 million and $30.4 million as of December 31, 2017 and 2016, respectively. Restricted assets consist of escrow deposits under the MSA. On the 25
th
anniversary of each annual deposit, we are entitled to receive reimbursement of the principal amount of escrow remaining for that year. See “Master Settlement Agreement” below for details.
Cash Flows from Operating Activities
For the year ended December 31, 2017, net cash provided by operating activities increased to $29.7 million from $9.1 million for the year ended December 31, 2016, an increase of $20.6 million or 225.3%, principally due to an increase in pre-tax income of $12.0 million as we currently do not pay federal income taxes and interest paid on the PIK Toggle Notes in 2016, which did not recur.
For the year ended December 31, 2016, net cash provided by operating activities decreased to $9.1 million from $
24.4
million for the year ended December 31, 2015, a decrease of $15.3 million, or
62.6
%,
principally due to increases in inventory and accounts payable.
Cash Flows from Investing Activities
For the year ended December 31, 2017, net cash used in investing activities decreased to $1.9 million from $26.8 million for the year ended December 31, 2016, a decrease of $24.9 million or 92.8%, principally due to the 2016 acquisitions of VaporBeast, certain brands from Wind River, and the land and building in Dresden, Tennessee.
For the year ended December 31, 2016, net cash used in investing activities increased to $
26.8
million from $
2.0
million for the year ended December 31, 2015, an increase of $
24.8
million or
1240.0
%,
principally due to the 2016 acquisitions of VaporBeast, certain brands from Wind River, and the land and building in Dresden, Tennessee.
Cash Flows from Financing Activities
For the year ended December 31, 2017, net cash used by financing activities was $28.0 million compared with net cash provided by financing activities of $15.7 million for the year ended December 31, 2016, a decrease of $43.8 million or 278.1%, principally due to proceeds from the issuance of stock from our IPO in May 2016 and refinancing costs associated with the 2017 Credit Facility in 2017.
For the year ended December 31, 2016, net cash provided by financing activities was $
15.7
million compared with net cash used of $
26.0
million for the year ended December 31, 2015, an increase of $41.8 million,
principally due to proceeds from the issuance of stock, partially offset by payments on a prior credit facility, PIK Toggle Notes, and redemption of warrants issued by Intrepid.
Long-Term Debt
On February 17, 2017, we entered into a new $250 million secured credit facility comprised of (i) a First Lien Credit Facility with Fifth Third Bank, as administrative agent, and other lenders (the “2017 First Lien Credit Facility”) and (ii) a Second Lien Credit Facility with Prospect Capital Corporation, as administrative agent, and other lenders (the “2017 Second Lien Credit Facility,” and together with the 2017 First Lien Credit Facility, the “2017 Credit Facility”). We used the proceeds of the 2017 Credit Facility to repay, in full, our prior credit facility and to pay related fees and expenses.
The 2017 Credit Facility contains customary events of default including payment defaults, breaches of representations and warranties, covenant defaults, cross-defaults to certain other material indebtedness in excess of specified amounts, certain events of bankruptcy and insolvency, certain ERISA events, judgments in excess of specified amounts, and change in control defaults. The 2017 Credit Facility also contains certain negative covenants customary for facilities of these types including covenants that, subject to exceptions described in the 2017 Credit Facility, restrict our ability: (i) to pledge assets, (ii) to incur additional indebtedness, (iii) to pay dividends, (iv) to make distributions, (v) to sell assets, and (vi) to make investments.
As of December 31, 2017, we were in compliance with the financial and restrictive covenants of the 2017 Credit Facility. The following table provides outstanding balances under our debt instruments.
|
December 31,
|
||||||||
|
2017
|
2016
|
|||||||
|
2017 Revolving Credit Facility
|
$
|
8,000
|
$
|
-
|
||||
|
2017 First Lien First Out Term Loan
|
105,875
|
-
|
||||||
|
2017 First Lien Second Out Term Loan
|
34,738
|
-
|
||||||
|
2017 Second Lien Term Loan
|
55,000
|
-
|
||||||
|
Notes payable - VaporBeast
|
2,000
|
2,000
|
||||||
|
Revolving Credit Facility
|
-
|
15,034
|
||||||
|
First Lien Term Loan
|
-
|
146,451
|
||||||
|
Second Lien Term Loan
|
-
|
59,128
|
||||||
|
205,613
|
222,613
|
|||||||
|
Less deferred financing charges
|
(3,573
|
)
|
(4,388
|
)
|
||||
|
Less revolving credit facility
|
(8,000
|
)
|
(15,034
|
)
|
||||
|
Less current maturities of long-term debt
|
(7,850
|
)
|
(1,650
|
)
|
||||
|
Notes payable and long-term debt
|
$
|
186,190
|
$
|
201,541
|
||||
2017 First Lien Credit Facility
The 2017 First Lien Credit Facility consists of: (i) a $50 million revolving credit facility (the “2017 Revolving Credit Facility”), (ii) a $110 million first out term loan facility (the “2017 First Out Term Loan”), and (iii) a $35 million second out term loan facility (the “2017 Second Out Term Loan”), which will be repaid in full only after repayment in full of the 2017 First Out Term Loan. The 2017 First Lien Credit Facility also includes an accordion feature allowing us to borrow up to an additional $40 million upon the satisfaction of certain conditions, including obtaining commitments from one or more lenders. Borrowings under the 2017 Revolving Credit Facility can be used for general corporate purposes, including acquisitions.
The 2017 First Out Term Loan and the 2017 Revolving Credit Facility have a maturity date of February 17, 2022, and the 2017 Second Out Term Loan has a maturity date of May 17, 2022. The 2017 First Out Term Loan and the 2017 Revolving Credit Facility bear interest at LIBOR plus a spread of 2.5% to 3.5% based on our senior leverage ratio. The 2017 First Out Term Loan has quarterly required payments of $1.4 million beginning June 30, 2017, increasing to $2.1 million on June 30, 2019, and increasing to $2.8 million on June 30, 2021. The 2017 Second Out Term Loan bears interest at LIBOR plus 6% (subject to a floor of 1.00%). The 2017 Second Out Term Loan has quarterly required payments of $0.1 million beginning June 30, 2017. The 2017 First Lien Credit Facility contains certain financial covenants including maximum senior leverage ratio of 3.75x with step-downs to 3.00x, a maximum total leverage ratio of 4.75x with step-downs to 4.00x, and a minimum fixed charge coverage ratio of 1.20x. The weighted average interest rate at December 31, 2017, on the 2017 Revolving Credit Facility was 5.05%. The weighted average interest rate at December 31, 2017, on the 2017 First Out Term Loan was 4.61%. The weighted average interest rate at December 31, 2017, on the 2017 Second Out Term Loan was 7.61%.
2017 Second Lien Credit Facility
The 2017 Second Lien Credit Facility consists of a $55 million second lien term loan (the “2017 Second Lien Term Loan”) having a maturity date of August 17, 2022. The 2017 Second Lien Term Loan bears interest at a fixed rate of 11%. The 2017 Second Lien Credit Facility contains certain financial covenants including a maximum senior leverage ratio of 4.25x with step-downs to 3.50x, a maximum total leverage ratio of 5.25x with step-downs to 4.50x, and a minimum fixed charge coverage ratio of 1.10x.
Note Payable – VaporBeast
On November 30, 2016, we issued a note payable to VaporBeast’s former shareholders (“VaporBeast Note”). The VaporBeast Note is $2.0 million principal with 6% interest compounded monthly and matures on May 30, 2018. The VaporBeast Note may be prepaid at any time without penalty and is subject to a late-payment penalty of 5% and a default rate of 13% per annum. The VaporBeast Note is subject to customary defaults including defaults for nonpayment, nonperformance, any material breach under the purchase agreement, and bankruptcy or insolvency.
First Lien Term Loan
All of NATC’s subsidiaries, as well as Turning Point Brands, Inc,, were guarantors under the First Lien Term Loan. TPLLC and its sole subsidiary at the date of the agreement, Intrepid, were not guarantors of the First Lien Term Loan. The First Lien Term Loan was secured by a first-priority lien on substantially all of the assets of the borrowers and the guarantors thereunder, including a pledge of the capital stock of NATC or any guarantor, other than certain excluded assets (the “Collateral”). The loans designated as LIBOR loans bore interest at the LIBOR then in effect (but not less than 1.25%) plus 6.50%, and the loans designated as base rate loans bore interest at (i) the highest of (A) the Prime Rate, (B) the Federal Funds Rate plus 0.50%, (C) LIBOR for an interest period of one month plus 1.00%, and (D) 2.25% per year plus (ii) 5.50%. The First Lien Term Loan was paid in full with proceeds from the 2017 Credit Facility.
Second Lien Term Loan
The Second Lien Term Loan was secured by a second priority security interest in the Collateral and was guaranteed by the same entities as the First Lien Term Loan. Under the Second Lien Term Loan, the loans designated as LIBOR loans bore interest at LIBOR then in effect (but not less than 1.25%) plus 10.25%. The loans designated as base rate loans bore interest at (i) the highest of (A) the Prime Rate, (B) the Federal Funds Rate plus 0.50%, (C) LIBOR for an interest period of one month plus 1.00%, and (D) 2.25% per year plus (ii) 9.25%. The Second Lien Term Loan was paid in full with proceeds from the 2017 Credit Facility.
Revolving Credit Facility
The Revolving Credit Facility provided for aggregate commitments of up to $40 million subject to a borrowing base, which was calculated as the sum of (i) 85% of eligible accounts receivable, plus (ii) the lesser of (A) the product of 70% and the value of eligible inventory or (B) the product of 85%, the net recovery percentage identified in the most recent inventory appraisal, and the value of eligible inventory, plus (iii) the lesser of (A) the product of 75% and the value of eligible inventory or (B) the product of 85%, the net recovery percentage identified in the most recent inventory appraisal, and the value of the eligible finished goods inventory, minus (iv) the aggregate amount of reserves established by the administrative agent. The outstanding balance on the Revolving Credit Facility was paid in full with proceeds from the 2017 Credit Facility.
PIK Toggle Notes
On January 13, 2014, we issued PIK Toggle Notes (“PIK Toggle Notes”) to Standard General Master Fund, L.P. (“Standard General”), with a principal amount of $45 million and warrants to purchase 42,424 of our common stock at $.01 per share, as adjusted for stock splits and other events specified in the agreement. After adjustment for the stock split effected in connection with the IPO of 10.43174381 to 1, the warrants provided for the purchase of 442,558 of our common stock. Due to the issuance of the warrants the PIK Toggle Notes had an original issue discount of $1.7 million and were initially valued at $43.3 million. The PIK Toggle Notes were scheduled to mature, and the warrants to expire, on January 13, 2021.
The PIK Toggle Notes accrued interest based on LIBOR then in effect (but not less than 1.25%) plus 13.75%. Interest was payable on the last day of each quarter and upon maturity. We had the flexibility to pay interest in kind through an increase in the principal amount at the same interest rate as the PIK Toggle Notes. We chose to increase the PIK Toggle Notes for all interest for the first three months of 2016.
In connection with the IPO, in May 2016, we redeemed and retired all of the outstanding PIK Toggle Notes in exchange for a combination of cash and shares of our voting common stock. As a result of this transaction, we incurred a loss on extinguishment of debt of $2.8 million during the second quarter of 2016. The warrants were exercised during 2016.
7% Senior Notes
In January 2014, we issued 7% Senior Notes to various stockholders with a principal amount of $11 million and warrants to purchase 11,000,000 units of membership interests in Intrepid, which represented 40% of the Intrepid Common Units outstanding on a fully diluted basis, at a purchase price of $1.00 per unit. Due to the issuance of the Intrepid warrants, the 7% Senior Notes had an original issue discount of $2.8 million and were initially valued at $8.2 million. The 7% Senior Notes were scheduled to mature, and the warrants to expire, on December 31, 2023.
The 7% Senior Notes accrued interest at a fixed rate of 7% per annum. The 7% Senior Notes were general unsecured obligations and ranked equally with our other unsecured and unsubordinated debt from time to time outstanding. Redemptions of the 7% Senior Notes could be made by us at any time without penalty or premium.
In connection with the IPO, in May 2016, we redeemed and retired all of the outstanding 7% Senior Notes and warrants in exchange for shares of our voting common stock.
Subsequent Event - Refinancing
On March 7, 2018, we entered into an agreement with
Fifth Third Bank, as administrative agent, and other lenders (the “2018 First Lien Credit Facility”) and an agreement with Prospect Capital Corporation, as administrative agent, and other lenders (the “2018 Second Lien Credit Facility,” and, together with the 2018 First Lien Credit Facility, the “2018 Credit Facility”), to amend and extend the 2017 Credit Facility. We are still evaluating the impact of the transaction; however, we expect a loss on extinguishment of debt of approximately $2.4 million in the first quarter of 2018.
The $250 million 2018 Credit Facility consists of the 2018 First Lien Credit Facility, with a $50 million Revolving Credit Facility and a $160 million First Lien Term Loan, and the 2018 Second Lien Credit Facility with a $40 million Second Lien Term Loan. The maturity of the First Lien Term Loan was extended to March 7, 2023, and the maturity of the Second Lien Term Loan was extended to March 7, 2024. The 2018 First Lien Credit Facility retains the accordion feature allowing the Company to borrow up to an additional $40 million upon the satisfaction of certain conditions, including obtaining commitments from one or more lenders. Borrowings under the Revolving Credit Facility may be used for general corporate purposes, including acquisitions.
The 2018 Credit Facility repaid the 2017 Second Out Term Loan, which had an interest rate of LIBOR plus 6% (subject to a floor of 1.00%) and required quarterly required payments of $0.1 million. The amendment also repaid $15 million of the 2017 Second Lien Term Loan.
The 2018 First Lien Credit Facility bear interest at LIBOR plus a spread of 2.75% to 3.50% based on the Company’s senior leverage ratio. The First Lien Term Loan has quarterly required payments of $1.9 million beginning June 30, 2018, increasing to $2.9 million on June 30, 2020, and increasing to $3.9 million on June 30, 2022. The 2018 First Lien Credit Facility contains certain financial covenants including maximum senior leverage ratio of 3.50x with step-downs to 3.00x, a maximum total leverage ratio of 4.50x with step-downs to 4.00x, and a minimum fixed charge coverage ratio of 1.20x.
The 2018 Second Lien Credit Facility bears interest at a rate of LIBOR plus 7.00%. The Second Lien Credit Facility contains certain financial covenants including a maximum senior leverage ratio of 4.00x with step-downs to 3.50x, a maximum total leverage ratio of 5.00x with step-downs to 4.50x, and a minimum fixed charge coverage ratio of 1.10x.
Distribution Agreements
For a description of our material distribution agreements, see “Business—Distribution and Supply Agreements.”
Master Settlement Agreement
On November 23, 1998, the major U.S. cigarette manufacturers, Philip Morris USA, Inc., Brown & Williamson Tobacco Corporation, Lorillard Tobacco Company and R.J. Reynolds Tobacco Company, entered into the MSA with attorneys general representing states that agreed to settle certain recovery actions (the “Settling States”). In order to be in compliance with the MSA and subsequent states’ statutes, we were required to fund an escrow account with each of the Settling States based on the number of cigarettes or cigarette equivalents (which is measured by pounds of MYO cigarette smoking tobacco) sold in such state. Funding of the escrow deposit by us in 2017 was less than $0.1 million in respect of sales of smoking products in 2017. We estimate the total deposits relating to 2017 sales will be less than $0.1 million. Under current MSA legislation, we will not be required to make escrow deposits after making deposits for 2017 sales as our last remaining product line subject to MSA legislation, MYO cigarette smoking tobacco, was discontinued in the third quarter of 2017. Each year’s deposit will be released from escrow after 25 years. We are scheduled to begin receiving payments as our escrow deposits are released from escrow beginning in 2024.
The following table summarizes our escrow deposit balances (in thousands) by sales year as of:
|
Deposits
|
||||||||
|
Sales
Year
|
December 31,
2017
|
December 31,
2016
|
||||||
|
1999
|
$
|
211
|
$
|
211
|
||||
|
2000
|
1,017
|
1,017
|
||||||
|
2001
|
1,673
|
1,673
|
||||||
|
2002
|
2,271
|
2,271
|
||||||
|
2003
|
4,249
|
4,249
|
||||||
|
2004
|
3,715
|
3,715
|
||||||
|
2005
|
4,552
|
4,552
|
||||||
|
2006
|
3,847
|
3,847
|
||||||
|
2007
|
4,167
|
4,167
|
||||||
|
2008
|
3,364
|
3,364
|
||||||
|
2009
|
1,626
|
1,626
|
||||||
|
2010
|
406
|
406
|
||||||
|
2011
|
193
|
193
|
||||||
|
2012
|
199
|
199
|
||||||
|
2013
|
173
|
173
|
||||||
|
2014
|
143
|
142
|
||||||
|
2015
|
101
|
100
|
||||||
|
2016
|
80
|
37
|
||||||
|
2017
|
70
|
-
|
||||||
|
Total
|
$
|
32,057
|
$
|
31,942
|
||||
Off-balance Sheet Arrangements
During 2017, we executed no forward contracts. During 2016, we executed various forward contracts for the purchase of €5.6 million with maturity dates from January 26, 2017, to July 17, 2017. At December 31, 2017 and 2016, we had forward contracts for the purchase of €0 and €4.9 million, respectively.
Contractual Obligations
The following table summarizes our contractual obligations at December 31, 2017 (in thousands):
|
Payments due by period
|
||||||||||||||||||||
|
Total
|
Less than 1
year
|
1-3 years
|
4-5 years
|
More than 5
years
|
||||||||||||||||
|
Long-term debt obligations, including interest
|
$
|
266,052
|
$
|
29,803
|
$
|
42,444
|
$
|
193,805
|
$
|
-
|
||||||||||
|
Operating lease obligations
|
3,462
|
1,713
|
1,749
|
-
|
-
|
|||||||||||||||
|
Purchase obligations
|
37,705
|
37,705
|
-
|
-
|
-
|
|||||||||||||||
|
$
|
307,219
|
$
|
69,221
|
$
|
44,193
|
$
|
193,805
|
$
|
-
|
|||||||||||
The total lease expense included in the consolidated statements of income for the years ended December 31, 2017, 2016, and 2015, was $2.6 million, $1.8 million, and $1.8 million, respectively.
Inflation
We believe that any effect of inflation at current levels will be minimal. Historically, we have been able to increase prices at a rate equal to or greater than that of inflation and believe that we will continue to be able to do so for the foreseeable future. In addition, we have been able to maintain a relatively stable variable cost structure for our products due, in part, to our successful procurement with regard to our tobacco products and, in part, to our existing contractual agreement for the purchase of our premium cigarette papers.
Foreign Currency Sensitivity
Our inventory purchases from Bolloré are denominated in euros. Accordingly, we have exposure to potentially adverse movements in the euro exchange rate. In addition, Bolloré provides a contractual hedge against catastrophic currency fluctuation in our agreement. We do not use derivative financial instruments for speculative trading purposes, nor do we hedge our foreign currency exposure in a manner that offsets the effects of changes in foreign exchange rates.
We regularly review our foreign currency risk and its hedging programs and may as part of that review determine at any time to change our hedging policy. During 2017, we executed no forward contracts, and at December 31, 2017, we had no forward contracts for purchase. A 10% change in the euro to U.S. dollars exchange rate would change pre-tax income by approximately $0.8 million per year.
Credit Risk
At December 31, 2017 and 2016, we had bank deposits, including MSA escrows, in excess of federally insured limits of approximately $5.0 million and $5.2 million, respectively. The Company has chosen to invest a portion of the MSA escrows in U.S. Government securities including Treasury Notes and Treasury Bonds.
We sell our products to distributors, retail establishments, and individual consumers (via online sales from the newly acquired VaporBeast and Vapor Shark) throughout the U.S. and also have sales of
Zig-Zag
®
premium cigarette papers in Canada. In 2017 and 2016, we had no customers that accounted for more than 10% of our gross sales. We perform periodic credit evaluations of our customers and generally do not require collateral on trade receivables. Historically, we have not experienced significant losses due to customer credit issues.
Interest Rate Sensitivity
We have exposure to interest rate volatility principally relating to interest rate changes applicable to loans under our 2017 Revolving Credit Facility and borrowings under the 2017 First Lien Term Loans. As of December 31, 2017, all of our debt with the exception of the 2017 Second Lien Term Loan and VaporBeast Note Payable bears interest at variable rates. We believe that the effect, if any, of reasonably possible near-term changes in interest rates on our consolidated financial position, results of operations or cash flows would not be significant. A 1% change in the interest rate would change pre-tax income by approximately $1.7 million per year.
TURNING POINT BRANDS, INC.
CONTENTS
| Page | |
|
Report of RSM US LLP
|
47
|
|
Financial Statements:
|
|
|
Consolidated Balance Sheets as of December 31, 2017 and 2016
|
48
|
|
Consolidated Statements of Income for the years ended December 31, 2017, 2016, and 2015
|
49
|
|
Consolidated Statements of Comprehensive Income for the years ended December 31, 2017, 2016, and 2015
|
50
|
|
Consolidated Statements of Cash Flows for the years ended December 31, 2017, 2016, and 2015
|
51
|
|
Consolidated Statements of Changes in Stockholders’ Equity (Deficit) for the years ended December 31, 2017, 2016, and 2015
|
53
|
|
Notes to Consolidated Financial Statements
|
54
|
Report of Independent Registered Public Accounting Firm
To the Stockholders and the Board of Directors of Turning Point Brands, Inc.
Opinion on the Financial Statements
We have audited the accompanying consolidated balance sheets of Turning Point Brands, Inc. and its subsidiaries (the Company) as of December 31, 2017 and 2016, the related consolidated statements of income, comprehensive income, changes in stockholders' equity (deficit) and cash flows for each of the three years in the period ended December 31, 2017, and the related notes to the consolidated financial statements (collectively, the financial statements). In our opinion, the financial statements present fairly, in all material respects, the financial position of the Company as of December 31, 2017 and 2016, and the results of its operations and its cash flows for each of the three years in the period ended December 31, 2017, in conformity with accounting principles generally accepted in the United States of America.
Basis for Opinion
These financial statements are the responsibility of the Company’s management. Our responsibility is to express an opinion on the Company’s financial statements based on our audits. We are a public accounting firm registered with the Public Company Accounting Oversight Board (United States) (PCAOB) and are required to be independent with respect to the Company in accordance with U.S. federal securities laws and the applicable rules and regulations of the Securities and Exchange Commission and the PCAOB.
We conducted our audits in accordance with the standards of the PCAOB. Those standards require that we plan and perform the audit to obtain reasonable assurance about whether the financial statements are free of material misstatement, whether due to error or fraud. The Company is not required to have, nor were we engaged to perform, an audit of its internal control over financial reporting. As part of our audits we are required to obtain an understanding of internal control over financial reporting but not for the purpose of expressing an opinion on the effectiveness of the Company's internal control over financial reporting. Accordingly, we express no such opinion.
Our audits included performing procedures to assess the risks of material misstatement of the financial statements, whether due to error or fraud, and performing procedures that respond to those risks. Such procedures included examining, on a test basis, evidence regarding the amounts and disclosures in the financial statements. Our audits also included evaluating the accounting principles used and significant estimates made by management, as well as evaluating the overall presentation of the financial statements. We believe that our audits provide a reasonable basis for our opinion.
/s/ RSM US LLP
We have served as the Company's auditor since 2006.
Greensboro, North Carolina
March 8, 2018
Turning Point Brands, Inc. and Subsidiaries
Consolidated Balance Sheets
December 31, 2017 and 2016
(dollars in thousands except share data)
|
ASSETS
|
December 31,
2017
|
December 31,
2016
|
||||||
|
Current assets:
|
||||||||
|
Cash
|
$
|
2,607
|
$
|
2,865
|
||||
|
Accounts receivable, net of allowances of $17 in 2017 and $35 in 2016
|
3,248
|
2,181
|
||||||
|
Inventories
|
63,296
|
62,185
|
||||||
|
Other current assets
|
10,342
|
11,625
|
||||||
|
Total current assets
|
79,493
|
78,856
|
||||||
|
Property, plant and equipment, net
|
8,859
|
7,590
|
||||||
|
Deferred income taxes
|
450
|
6,288
|
||||||
|
Deferred financing costs, net
|
630
|
139
|
||||||
|
Goodwill
|
134,620
|
134,390
|
||||||
|
Other intangible assets, net
|
26,436
|
27,138
|
||||||
|
Master Settlement Agreement - escrow deposits
|
30,826
|
30,410
|
||||||
|
Pension asset
|
396
|
-
|
||||||
|
Other assets
|
567
|
209
|
||||||
|
Total assets
|
$
|
282,277
|
$
|
285,020
|
||||
|
LIABILITIES AND STOCKHOLDERS' EQUITY
|
||||||||
|
Current liabilities:
|
||||||||
|
Accounts payable
|
$
|
3,686
|
$
|
9,153
|
||||
|
Accrued liabilities
|
18,229
|
15,336
|
||||||
|
Accrued interest expense
|
465
|
394
|
||||||
|
Current portion of long-term debt
|
7,850
|
1,650
|
||||||
|
Revolving credit facility
|
8,000
|
15,034
|
||||||
|
Total current liabilities
|
38,230
|
41,567
|
||||||
|
Notes payable and long-term debt
|
186,190
|
201,541
|
||||||
|
Postretirement benefits
|
3,962
|
4,407
|
||||||
|
Pension benefits
|
-
|
423
|
||||||
|
Other long-term liabilities
|
571
|
3,024
|
||||||
|
Total liabilities
|
228,953
|
250,962
|
||||||
|
Commitments and contingencies
|
||||||||
|
Stockholders' equity:
|
||||||||
|
Preferred stock; $0.01 par value; authorized shares 40,000,000; issued and outstanding shares -0-
|
-
|
-
|
||||||
|
Common stock, voting, $0.01 par value; authorized shares, 190,000,000; issued and outstanding shares, 2017 19,210,633 and 2016 18,402,022
|
192
|
184
|
||||||
|
Common stock, nonvoting, $0.01 par value; authorized shares, 10,000,000; issued and outstanding shares -0-
|
-
|
-
|
||||||
|
Additional paid-in capital
|
103,640
|
104,895
|
||||||
|
Accumulated other comprehensive loss
|
(2,973
|
)
|
(4,049
|
)
|
||||
|
Accumulated deficit
|
(47,535
|
)
|
(66,972
|
)
|
||||
|
Total stockholders' equity
|
53,324
|
34,058
|
||||||
|
Total liabilities and stockholders' equity
|
$
|
282,277
|
$
|
285,020
|
||||
The accompanying notes are an integral part of the consolidated financial statements.
Turning Point Brands, Inc. and Subsidiaries
Consolidated Statements of Income
for the years ended December 31, 2017, 2016, and 2015
(dollars in thousands except share data)
|
2017
|
2016
|
2015
|
||||||||||
|
Net sales
|
$
|
285,777
|
$
|
206,228
|
$
|
197,256
|
||||||
|
Cost of sales
|
160,908
|
105,872
|
100,960
|
|||||||||
|
Gross profit
|
124,869
|
100,356
|
96,296
|
|||||||||
|
Selling, general and administrative expenses
|
75,369
|
56,771
|
51,785
|
|||||||||
|
Operating income
|
49,500
|
43,585
|
44,511
|
|||||||||
|
Interest expense
|
16,889
|
26,621
|
34,284
|
|||||||||
|
Gain on investment
|
(438
|
)
|
(768
|
)
|
-
|
|||||||
|
Loss on extinguishment of debt
|
6,116
|
2,824
|
-
|
|||||||||
|
Income before income taxes
|
26,933
|
14,908
|
10,227
|
|||||||||
|
Income tax expense (benefit)
|
7,280
|
(12,005
|
)
|
1,078
|
||||||||
|
Consolidated net income
|
19,653
|
26,913
|
9,149
|
|||||||||
|
Net loss attributable to non-controlling interest
|
$
|
(556
|
)
|
$
|
-
|
$
|
-
|
|||||
|
Net income attributable to Turning Point Brands, Inc.
|
$
|
20,209
|
$
|
26,913
|
$
|
9,149
|
||||||
|
Basic income per common share:
|
||||||||||||
|
Net income attributable to Turning Point Brands, Inc.
|
$
|
1.06
|
$
|
1.63
|
$
|
1.27
|
||||||
|
Diluted income per common share:
|
||||||||||||
|
Net income attributable to Turning Point Brands, Inc.
|
$
|
1.04
|
$
|
1.49
|
$
|
1.10
|
||||||
|
Weighted average common shares outstanding:
|
||||||||||||
|
Basic
|
18,989,177
|
16,470,352
|
7,198,081
|
|||||||||
|
Diluted
|
19,513,008
|
18,015,545
|
8,354,387
|
|||||||||
The accompanying notes are an integral part of the consolidated financial statements.
Turning Point Brands, Inc. and Subsidiaries
Consolidated Statements of Comprehensive Income
for the years ended December 31, 2017, 2016, and 2015
(dollars in thousands)
|
2017
|
2016
|
2015
|
||||||||||
|
Net income attributable to Turning Point Brands, Inc.
|
$
|
20,209
|
$
|
26,913
|
$
|
9,149
|
||||||
|
Other comprehensive income (loss), net of tax -
|
||||||||||||
|
Pension and postretirement
|
||||||||||||
|
Amortization of unrealized (gains) losses recorded in cost of sales
|
(29
|
)
|
-
|
23
|
||||||||
|
Amortization of unrealized losses recorded in selling, general and administrative expenses
|
442
|
469
|
502
|
|||||||||
|
Actuarial gain (loss)
|
1,019
|
(56
|
)
|
51
|
||||||||
|
Tax effect
|
(543
|
)
|
-
|
-
|
||||||||
|
Unrealized gain (loss) on investments, net of tax of $114, 2017, and $582, 2016
|
187
|
(950
|
)
|
-
|
||||||||
|
1,076
|
(537
|
)
|
576
|
|||||||||
|
Comprehensive income
|
$
|
21,285
|
$
|
26,376
|
$
|
9,725
|
||||||
The accompanying notes are an integral part of the consolidated financial statements.
Turning Point Brands, Inc. and Subsidiaries
Consolidated Statements of Cash Flows
for the years ended December 31, 2017, 2016, and 2015
(dollars in thousands)
|
2017
|
2016
|
2015
|
||||||||||
|
Cash flows from operating activities:
|
||||||||||||
|
Consolidated net income
|
$
|
19,653
|
$
|
26,913
|
$
|
9,149
|
||||||
|
Adjustments to reconcile net income to net cash provided by operating activities:
|
||||||||||||
|
Loss on extinguishment of debt
|
6,116
|
2,824
|
-
|
|||||||||
|
(Gain) loss on sale of property, plant and equipment
|
150
|
-
|
(2
|
)
|
||||||||
|
Depreciation expense
|
1,626
|
1,227
|
1,059
|
|||||||||
|
Amortization of deferred financing costs
|
1,005
|
1,419
|
1,448
|
|||||||||
|
Amortization of original issue discount
|
66
|
724
|
1,048
|
|||||||||
|
Amortization of other intangible assets
|
702
|
58
|
-
|
|||||||||
|
Interest incurred but not paid on PIK Toggle Notes
|
-
|
3,422
|
8,229
|
|||||||||
|
Interest incurred but not paid on 7% Senior Notes
|
-
|
329
|
851
|
|||||||||
|
Interest paid on PIK Toggle Notes
|
-
|
(9,893
|
)
|
-
|
||||||||
|
Reserve of note receivable
|
-
|
430
|
-
|
|||||||||
|
Deferred income taxes
|
5,181
|
(12,719
|
)
|
51
|
||||||||
|
Stock compensation expense
|
720
|
180
|
234
|
|||||||||
|
Changes in operating assets and liabilities:
|
||||||||||||
|
Accounts receivable
|
(1,067
|
)
|
2,072
|
(1,407
|
)
|
|||||||
|
Inventories
|
495
|
(12,513
|
)
|
2,032
|
||||||||
|
Other current assets
|
1,495
|
1,361
|
49
|
|||||||||
|
Pension asset
|
(396
|
)
|
-
|
-
|
||||||||
|
Other assets
|
62
|
(100
|
)
|
(118
|
)
|
|||||||
|
Accounts payable
|
(5,702
|
)
|
3,631
|
1,784
|
||||||||
|
Accrued pension liabilities
|
588
|
262
|
163
|
|||||||||
|
Accrued postretirement liabilities
|
(24
|
)
|
(172
|
)
|
(179
|
)
|
||||||
|
Accrued liabilities and other
|
(980
|
)
|
(327
|
)
|
39
|
|||||||
|
Net cash provided by operating activities
|
29,690
|
9,128
|
24,430
|
|||||||||
|
Cash flows from investing activities:
|
||||||||||||
|
Capital expenditures
|
(2,021
|
)
|
(3,207
|
)
|
(1,602
|
)
|
||||||
|
Acquisitions
|
268
|
(23,625
|
)
|
-
|
||||||||
|
Payments for investments
|
(179
|
)
|
-
|
-
|
||||||||
|
Proceeds from sale of property, plant and equipment
|
-
|
-
|
2
|
|||||||||
|
Issuance of note receivable
|
-
|
-
|
(430
|
)
|
||||||||
|
Net cash used in investing activities
|
(1,932
|
)
|
(26,832
|
)
|
(2,030
|
)
|
||||||
Turning Point Brands, Inc. and Subsidiaries
Consolidated Statements of Cash Flows (cont.)
for the years ended December 31, 2017, 2016, and 2015
(dollars in thousands)
| 2017 | 2016 | 2015 | ||||||||||
|
Cash flows from financing activities:
|
||||||||||||
|
Proceeds from 2017 revolving credit facility
|
8,000
|
-
|
-
|
|||||||||
|
Proceeds from 2017 first lien term loans
|
145,000
|
-
|
-
|
|||||||||
|
Proceeds from 2017 second lien term loan
|
55,000
|
-
|
-
|
|||||||||
|
Payments of 2017 first lien term loans
|
(4,387
|
)
|
-
|
-
|
||||||||
|
Payments of financing costs
|
(4,783
|
)
|
(450
|
)
|
-
|
|||||||
|
Proceeds from (payments of) old revolving credit facility, net
|
(15,083
|
)
|
15,016
|
(7,335
|
)
|
|||||||
|
Payments of first lien term loan
|
(147,362
|
)
|
(4,388
|
)
|
(16,649
|
)
|
||||||
|
Payments of second lien term loan
|
(60,000
|
)
|
(20,000
|
)
|
-
|
|||||||
|
Prepaid equity issuance costs
|
(453
|
)
|
-
|
(2,049
|
)
|
|||||||
|
Payment of PIK Toggle Notes
|
-
|
(24,107
|
)
|
-
|
||||||||
|
Redemption of Intrepid options
|
-
|
(661
|
)
|
-
|
||||||||
|
Redemption of Intrepid warrants
|
-
|
(5,500
|
)
|
-
|
||||||||
|
Exercise of warrants
|
-
|
4
|
-
|
|||||||||
|
Exercise of options
|
1,431
|
169
|
1
|
|||||||||
|
Redemption of options
|
(1,740
|
)
|
(85
|
)
|
-
|
|||||||
|
Surrender of options
|
(1,000
|
)
|
-
|
-
|
||||||||
|
Proceeds from issuance of stock
|
-
|
55,736
|
-
|
|||||||||
|
Distribution to non-controlling interest
|
(4
|
)
|
-
|
-
|
||||||||
|
Payment of Vapor Shark loans
|
(1,867
|
)
|
-
|
-
|
||||||||
|
Payment of cash dividends
|
(768
|
)
|
-
|
-
|
||||||||
|
Net cash provided by (used in) financing activities
|
(28,016
|
)
|
15,734
|
(26,032
|
)
|
|||||||
|
Net decrease in cash
|
(258
|
)
|
(1,970
|
)
|
(3,632
|
)
|
||||||
|
Cash, beginning of period
|
2,865
|
4,835
|
8,467
|
|||||||||
|
Cash, end of period
|
$
|
2,607
|
$
|
2,865
|
$
|
4,835
|
||||||
|
Supplemental disclosures of cash flow information:
|
||||||||||||
|
Cash paid during the period for interest
|
$
|
15,828
|
$
|
34,553
|
$
|
23,157
|
||||||
|
Cash paid during the period for income taxes, net
|
$
|
1,811
|
$
|
623
|
$
|
1,027
|
||||||
|
Supplemental schedule of noncash financing activities:
|
||||||||||||
|
Issuance of restricted stock
|
$
|
-
|
$
|
279
|
$
|
-
|
||||||
|
Conversion of PIK Toggle Notes to equity
|
$
|
-
|
$
|
29,014
|
$
|
-
|
||||||
|
Conversion of 7% Senior Notes to equity
|
$
|
-
|
$
|
10,074
|
$
|
-
|
||||||
|
Accrued expenses incurred for prepaid equity issuance costs
|
$
|
-
|
$
|
-
|
$
|
1,129
|
||||||
The accompanying notes are an integral part of the consolidated financial statements.
Turning Point Brands, Inc. and Subsidiaries
Consolidated Statements of Changes in Stockholders’ Equity (Deficit)
for the years ended December 31, 2017, 2016, and 2015
(dollars in thousands)
|
Non-
Controlling
Interest
|
Common
Stock,
Voting
|
Common
Stock,
Non-Voting
|
Additional
Paid-In
Capital
|
Accumulated
Other
Comprehensive
Loss
|
Accumulated
Deficit
|
Total
|
||||||||||||||||||||||
|
Beginning balance January 1, 2015
|
$
|
-
|
$
|
72
|
$
|
-
|
$
|
12,393
|
$
|
(4,088
|
)
|
$
|
(99,949
|
)
|
(91,572
|
)
|
||||||||||||
|
Common stock voting converted to non-voting
|
$
|
-
|
(9
|
)
|
9
|
-
|
-
|
-
|
-
|
|||||||||||||||||||
|
Unrecognized pension and postretirement cost adjustment
|
$
|
-
|
-
|
-
|
-
|
576
|
-
|
576
|
||||||||||||||||||||
|
Stock compensation expense
|
$
|
-
|
-
|
-
|
234
|
-
|
-
|
234
|
||||||||||||||||||||
|
Exercise of options
|
$
|
-
|
-
|
-
|
1
|
-
|
-
|
1
|
||||||||||||||||||||
|
Net income
|
$
|
-
|
-
|
-
|
-
|
-
|
9,149
|
9,149
|
||||||||||||||||||||
|
Ending balance December 31, 2015
|
-
|
63
|
9
|
12,628
|
(3,512
|
)
|
(90,800
|
)
|
(81,612
|
)
|
||||||||||||||||||
|
Common stock non-voting converted to voting
|
$
|
-
|
9
|
(9
|
)
|
-
|
-
|
-
|
-
|
|||||||||||||||||||
|
Unrecognized pension and postretirement cost adjustment
|
$
|
-
|
-
|
-
|
-
|
413
|
-
|
413
|
||||||||||||||||||||
|
Unrealized loss on investments, net of tax of $582
|
$
|
-
|
-
|
-
|
-
|
(950
|
)
|
-
|
(950
|
)
|
||||||||||||||||||
|
Stock compensation expense
|
$
|
-
|
-
|
-
|
180
|
-
|
-
|
180
|
||||||||||||||||||||
|
Warrants exercised
|
$
|
-
|
4
|
-
|
-
|
-
|
-
|
4
|
||||||||||||||||||||
|
Stock issued in IPO
|
$
|
-
|
62
|
-
|
53,573
|
-
|
-
|
53,635
|
||||||||||||||||||||
|
Stock issued in exchange for debt
|
$
|
-
|
45
|
-
|
41,248
|
-
|
-
|
41,293
|
||||||||||||||||||||
|
Restricted stock grant, netted with (forfeitures)
|
$
|
-
|
-
|
-
|
259
|
-
|
-
|
259
|
||||||||||||||||||||
|
Exercise of options
|
$
|
-
|
1
|
-
|
168
|
-
|
-
|
169
|
||||||||||||||||||||
|
Redemption of options
|
$
|
-
|
-
|
-
|
(85
|
)
|
-
|
-
|
(85
|
)
|
||||||||||||||||||
|
Redemption of Intrepid options
|
$
|
-
|
-
|
-
|
(326
|
)
|
-
|
(335
|
)
|
(661
|
)
|
|||||||||||||||||
|
Redemption of Intrepid warrants
|
$
|
-
|
-
|
-
|
(2,750
|
)
|
-
|
(2,750
|
)
|
(5,500
|
)
|
|||||||||||||||||
|
Net income
|
$
|
-
|
-
|
-
|
-
|
-
|
26,913
|
26,913
|
||||||||||||||||||||
|
Ending balance December 31, 2016
|
$
|
-
|
$
|
184
|
$
|
-
|
$
|
104,895
|
$
|
(4,049
|
)
|
$
|
(66,972
|
)
|
$
|
34,058
|
||||||||||||
|
Unrecognized pension and postretirement cost adjustment
|
$
|
-
|
-
|
-
|
-
|
889
|
-
|
889
|
||||||||||||||||||||
|
Unrealized gain on MSA investments, net of tax of $113
|
$
|
-
|
-
|
-
|
-
|
185
|
-
|
185
|
||||||||||||||||||||
|
Unrealized gain on other investments, net of tax of $1
|
$
|
-
|
-
|
-
|
-
|
2
|
-
|
2
|
||||||||||||||||||||
|
Stock compensation expense
|
$
|
-
|
-
|
-
|
648
|
-
|
-
|
648
|
||||||||||||||||||||
|
Restricted stock forfeitures
|
$
|
-
|
-
|
-
|
(63
|
)
|
-
|
-
|
(63
|
)
|
||||||||||||||||||
|
Acquisition of non-controlling interest
|
$
|
560
|
-
|
-
|
(560
|
)
|
-
|
-
|
-
|
|||||||||||||||||||
|
Distribution to non-controlling interest
|
$
|
(4
|
)
|
-
|
-
|
-
|
-
|
-
|
(4
|
)
|
||||||||||||||||||
|
Exercise of options
|
$
|
-
|
9
|
-
|
1,422
|
-
|
-
|
1,431
|
||||||||||||||||||||
|
Surrender of options
|
$
|
-
|
-
|
-
|
(1,000
|
)
|
-
|
-
|
(1,000
|
)
|
||||||||||||||||||
|
Redemption of options
|
$
|
-
|
(1
|
)
|
-
|
(1,702
|
)
|
-
|
-
|
(1,703
|
)
|
|||||||||||||||||
|
Dividends
|
$
|
-
|
-
|
-
|
-
|
-
|
(772
|
)
|
(772
|
)
|
||||||||||||||||||
|
Net income (loss)
|
$
|
(556
|
)
|
-
|
-
|
-
|
-
|
20,209
|
19,653
|
|||||||||||||||||||
|
Ending balance December 31, 2017
|
$
|
-
|
$
|
192
|
$
|
-
|
$
|
103,640
|
$
|
(2,973
|
)
|
$
|
(47,535
|
)
|
$
|
53,324
|
||||||||||||
The accompanying notes are an integral part of the consolidated financial statements.
Turning Point Brands, Inc. and Subsidiaries
Notes to Consolidated Financial Statements
(dollars in thousands, except where designated and per share data)
Note 1. Organizations and Basis of Presentation:
Organizations
Turning Point Brands, Inc. (the “Company), is a holding company which owns North Atlantic Trading Company, Inc. (“NATC”), and its subsidiaries and Turning Point Brands, LLC (“TPLLC”), and its subsidiaries. Except where the context indicates otherwise, references to the Company include the Company; NATC and its subsidiaries National Tobacco Company, L.P. (“NTC”), National Tobacco Finance, LLC (“NTFLLC”), North Atlantic Operating Company, Inc. (“NAOC”), North Atlantic Cigarette Company, Inc. (“NACC”), and RBJ Sales, Inc. (“RBJ”); and TPLLC and its subsidiaries Intrepid Brands, LLC (“Intrepid”), VaporBeast, LLC (“VaporBeast,” f/k/a Smoke Free Technologies, Inc.), and Vapor Shark, LLC, and its subsidiaries (collectively, “Vapor Shark,” f/k/a The Hand Media). Effective December 31, 2017, the Company (1) merged Smoke Free Technologies, Inc., into VaporBeast, LLC, (2) transferred direct ownership of VaporBeast from NATC to TPLLC, and (3) converted National Tobacco Finance Corporation to an LLC—NTFLLC.
The Company is the second largest marketer of loose leaf chewing tobacco in the United States, selling its products under the
Beech-Nut
®
,
Trophy
®
,
Havana Blossom
®
,
Durango
®
,
Stoker’s
®
,
Our Pride
®
,
Big Mountain
®
,
Appalachia
™
, Springfield Standard
®
,
and Snake River
®
brands. NTC manufactures and markets
Stoker’s
®
moist snuff. NTC packages and markets for NAOC, on a contract basis,
Zig-Zag
®
cigar blend smoking tobacco; markets
Zig-Zag
®
make-your-own (“MYO”) cigar wraps and cigars; and processes, packages, and markets
Red Cap
™ pipe tobacco. NAOC is a leading importer in the United States of premium cigarette papers and related products, which are sold under the
Zig-Zag
®
brand name pursuant to an exclusive long-term distribution agreement with Bolloré, S.A. Intrepid markets products that do not contain tobacco leaf, including herbal products under the
Primal
brand, electronic cigarettes (“e-cigarettes”), vaporizers, liquid vapor products, and tobacco vaporizers under the
Zig-Zag
®
and V2 brands. VaporBeast and Vapor Shark are primarily e-commerce companies that focus on the sales, distribution, and development of alternatives to combustible cigarettes such as e-cigarettes, e-liquids, and accessories. Vapor Shark also owns and operates seven retail stores throughout southern Florida.
Basis of Presentation
The consolidated financial statements include the Company, as well as its wholly-owned subsidiaries. All intercompany transactions have been eliminated.
The preparation of financial statements in conformity with accounting principles generally accepted in the United States of America (“GAAP”) requires management to make estimates and assumptions that affect the amounts of assets and liabilities, disclosure of contingent assets and liabilities as of the dates of the financial statements, and the reported amounts of revenues and expenses during the reporting periods. Actual results could differ from those estimates. The Company’s significant estimates include those affecting the valuation of goodwill and other intangible assets, assumptions used in determining pension and postretirement benefit obligations, and deferred income tax valuation allowances.
Certain prior years’ amounts have been reclassified to conform to the current year’s presentation. The changes did not have an impact on the Company’s consolidated results of operations or cash flows in any of the periods presented.
Note 2. Summary of Significant Accounting Policies:
Consolidation
The consolidated financial statements include the accounts of the Company, its subsidiaries, all of which are wholly-owned, and the results of Vapor Shark from April 1, 2017, through June 30, 2017. All significant intercompany transactions have been eliminated. From April 1 through June 30, 2017, Vapor Shark was a variable interest entity (“VIE”) for which the Company was considered the primary beneficiary due to an April 2017 management agreement in which the Company was granted the right to purchase 100% of the equity interest of Vapor Shark. The Company did not own Vapor Shark during the second quarter of 2017; however, Vapor Shark’s financial results are included in the Company’s consolidated results as a VIE. On June 30, 2017, the Company exercised a warrant to purchase all of the issued and outstanding equity of Vapor Shark. Beginning June 30, 2017, Vapor Shark became a wholly owned subsidiary of the Company. See ‘Note 4 – Acquisitions’ for details regarding the warrant exercise.
Revenue Recognition
The Company recognizes revenues, net of sales incentives and sales returns, including shipping and handling charges billed to customers, upon delivery to the customer, at which time there is a transfer of title and risk of loss to the customer in accordance with the Financial Accounting Standards Board (“FASB”) Accounting Standards Codification
©
(“ASC”) 605-10-S99. The Company classifies customer rebates as sales deductions in accordance with the requirements of ASC 605-50-25.
Derivative Instruments
The Company enters into foreign currency forward contracts to hedge a portion of its exposure to changes in foreign currency exchange rates on inventory purchase commitments. The Company accounts for its forward contracts under the provisions of ASC 815, Derivatives and Hedging. Under the Company’s policy, as amended, the Company may hedge up to 100% of its anticipated purchases of inventory in the denominated invoice currency over a forward period not to exceed twelve months. The Company may also, from time to time, hedge up to ninety percent of its non-inventory purchases in the denominated invoice currency. Forward contracts that qualify as hedges are adjusted to their fair value through other comprehensive income as determined by market prices on the measurement date, except any hedge ineffectiveness which is recognized currently in income. Gains and losses on these forward contracts are transferred from other comprehensive income into net income as the related inventories are received. Changes in fair value of any contracts that do not qualify for hedge accounting or are not designated as hedges are recognized in income currently.
Shipping Costs
The Company records shipping costs incurred as a component of selling, general and administrative expenses. Shipping costs incurred were approximately $10.4 million, $6.5 million, and $6.4 million in 2017, 2016, and 2015, respectively.
Research and Development Costs
Research and development costs are expensed as incurred. These expenses, classified as selling, general and administrative expenses, were approximately $1.9 million, $1.8 million, and $1.4 million in 2017, 2016, and 2015, respectively.
Cash and Cash Equivalents
The Company considers any highly liquid investments with a maturity of three months or less from the date of purchase to be cash equivalents.
Inventories
Inventories are stated at the lower of cost or market. Cost is determined using the last-in, first-out (“LIFO”) method for approximately 51% of the inventories. Leaf tobacco is presented in current assets in accordance with standard industry practice, notwithstanding the fact that such tobaccos are carried longer than one year for the purpose of curing.
Property, Plant and Equipment
Property, Plant and Equipment are stated at cost less accumulated depreciation and impairment. Depreciation is provided using the straight-line method over the lesser of the estimated useful lives of the assets or the life of the leases for leasehold improvements (4 to 7 years for machinery, equipment and furniture, 10 to 15 years for leasehold improvements, and up to 15 years for buildings and building improvements). Expenditures for repairs and maintenance are charged to expense as incurred. The costs of major renewals and improvements are capitalized and depreciated over their estimated useful lives. Upon disposition of fixed assets, the costs and related accumulated depreciation amounts are relieved. Any resulting gain or loss is reflected in operations during the period of disposition. Long-lived assets are reviewed for impairment when changes in circumstances indicate that the carrying amount of an asset may not be recoverable.
Goodwill and Other Intangible Assets
The Company follows the provisions of ASC 350, Intangibles – Goodwill and Other. In accordance with ASC 350-20-35, goodwill and indefinite-lived intangible assets are reviewed for impairment annually on December 31, or more frequently if certain indicators are present. If the carrying value of the goodwill or indefinite-life intangible asset exceeds its fair value, which is determined using discounted cash flows, the goodwill or intangible asset is considered impaired. The carrying value of the goodwill or indefinite-life intangible asset would then be reduced to fair value. For goodwill, the determination of a reporting unit’s fair value involves, among other things, the Company’s market capitalization and application of the income approach, which includes developing forecasts of future cash flows and determining an appropriate discount rate.
Based on its annual goodwill impairment testing, the estimated fair values of each of the Company’s reporting units were substantially in excess of the respective carrying values. The Company had no such impairment of goodwill or other intangible assets during the year ended December 31, 2017.
Fair Value
GAAP establishes a framework for measuring fair value. That framework provides a fair value hierarchy that prioritizes the inputs to valuation techniques used to measure fair value. The hierarchy gives the highest priority to unadjusted quoted prices in active markets for identical assets or liabilities (level 1) and the lowest priority to unobservable inputs (level 3).
The three levels of the fair value hierarchy under GAAP are described below:
| · |
Level 1 – Inputs to the valuation methodology are unadjusted quoted prices for identical assets or liabilities in active markets at the measurement date.
|
| · |
Level 2 – Inputs to the valuation methodology include: quoted prices for similar assets or liabilities in active markets; quoted prices for identical or similar assets or liabilities in inactive markets; inputs other than quoted prices that are observable for the asset or liability; and inputs that are derived principally from or corroborated by observable market data by correlation or other means.
|
| · |
Level 3 – Unobservable inputs that reflect management’s best estimate of what market participants would use in pricing the asset or liability at the measurement date.
|
Retirement Plans
The Company follows the provisions of ASC 715, Compensation – Retirement Benefits. ASC 715-30, Defined Benefit Plans – Pensions, which requires an employer to (a) recognize in its statement of financial position the funded status of a benefit plan, measured as the difference between the fair value of plan assets and benefit obligations, (b) recognize net of tax, the gains or losses and prior service costs or credits that arise during the period but are not recognized as components of net periodic benefit cost, and (c) measure defined benefit plan assets and obligations as of the date of the employer’s statement of financial position.
Deferred Financing Costs
Deferred financing costs are amortized over the terms of the related debt obligations using the effective interest method. Unamortized amounts are expensed upon extinguishment of the related borrowings. Deferred financing costs are presented as a direct deduction from the carrying amount of that debt liability except for deferred financing costs relating to our revolving credit facility, which are presented as an asset.
Income Taxes
The Company records the effects of income taxes under the liability method in which deferred income tax assets and liabilities are recognized based on the difference between the financial and tax basis of assets and liabilities using the enacted tax rates in effect for the years in which the differences are expected to reverse. The Company assesses its ability to realize future benefits of deferred tax assets by determining if they meet the “more likely than not” criteria in ASC 740, Income Taxes. If the Company determines that future benefits do not meet the “more likely than not” criteria, a valuation allowance is recorded.
Advertising and Promotion
Advertising and promotion costs, including point of sale materials, are expensed as incurred and amounted to $3.4 million, $3.9 million, and $2.8 million for the years ending December 31, 2017, 2016, and 2015, respectively.
Stock-Based Compensation
The Company measures stock-based compensation costs related to its stock options on the fair value based method under the provisions of ASC 718, Compensation – Stock Compensation. The fair value based method requires compensation cost for stock options to be recognized over the requisite service period based on the fair value of stock options granted. The Company determined the fair value of these awards using the Black-Scholes option pricing model.
Risks and Uncertainties
Manufacturers and sellers of tobacco products are subject to regulation at the federal, state, and local levels. Such regulations include, among others, labeling requirements, limitations on advertising, and prohibition of sales to minors. The trend in recent years has been toward increased regulation of the tobacco industry. There can be no assurance as to the ultimate content, timing, or effect of any regulation of tobacco products by any federal, state, or local legislative or regulatory body, nor can there be any assurance that any such legislation or regulation would not have a material adverse effect on the Company’s financial position, results of operations, or cash flows.
The tobacco industry has experienced and is experiencing significant product liability litigation. Most tobacco liability lawsuits have been brought against manufacturers and sellers of cigarettes for injuries allegedly caused by smoking or exposure to smoke. However, several lawsuits have been brought against manufacturers and sellers of smokeless products for injuries to health allegedly caused by use of smokeless products. Typically, such claims assert that use of smokeless products is addictive and causes oral cancer. Additionally, several lawsuits have been brought against manufacturers and distributors of NewGen products due to malfunctioning devices. There can be no assurance the Company will not sustain losses in connection with such lawsuits and that such losses will not have a material adverse effect on the Company’s financial position, results of operations, or cash flows.
Master Settlement Agreement (MSA):
Forty-six states, certain U.S. territories, and the District of Columbia are parties to the Master Settlement Agreement (“MSA”) and the Smokeless Tobacco Master Settlement Agreement (“STMSA”). To the Company’s knowledge, signatories to the MSA include 49 cigarette manufacturers and/or distributors. The only signatory to the STMSA is US Smokeless Tobacco Company. In the Company’s opinion, the fundamental basis for each agreement is the states’ consents to withdraw all claims for monetary, equitable, and injunctive relief against certain tobacco products manufacturers and others and, in return, the signatories have agreed to certain marketing restrictions and regulations as well as certain payment obligations.
Pursuant to the MSA and subsequent states’ statutes, a “cigarette manufacturer” (which is defined to also include MYO cigarette tobacco) has the option of either becoming a signatory to the MSA or opening, funding, and maintaining an escrow account, with sub-accounts on behalf of each settling state. The STMSA has no similar provisions. The MSA escrow accounts are governed by states’ statutes that expressly give the manufacturers the option of opening, funding, and maintaining an escrow account in lieu of becoming a signatory to the MSA. The statutes require companies who are not signatories to the MSA to deposit, on an annual basis, into qualified banks, escrow funds based on the number of cigarettes or cigarette equivalents, i.e., the pounds of MYO tobacco, sold. The purpose of these statutes is expressly stated to be to eliminate the cost disadvantage the settling manufacturers have as a result of entering into the MSA. Such companies are entitled to direct the investment of the escrowed funds and withdraw any appreciation, but cannot withdraw the principal for twenty-five years from the year of each annual deposit, except to withdraw funds deposited pursuant to an individual state’s escrow statute to pay a final judgment to that state’s plaintiffs in the event of such a final judgment against the company. Either option – becoming a MSA signatory or establishing an escrow account – is permissible.
The Company chose to open and fund an MSA escrow account as its means of compliance. It is management’s opinion, due to the possibility of future federal or state regulations, though none have to date been enacted, that entering into one or both of the settlement agreements or establishing and maintaining an escrow account would not necessarily prevent future regulations from having a material adverse effect on the results of operations, financial position, and cash flows of the Company.
Various states have enacted or proposed complementary legislation intended to curb the activity of certain manufacturers and importers of cigarettes that are selling into MSA states without signing the MSA or who have failed to properly establish and fund a qualifying escrow account. To the best of the Company’s knowledge, no such statute has been enacted which could inadvertently and negatively impact the Company, which has been, and is currently, fully compliant with all applicable laws, regulations, and statutes. However, there can be no assurance that the enactment of any such complementary legislation in the future will not have a material adverse effect on the results of operations, financial position, or cash flows of the Company.
Pursuant to the MSA escrow account statutes, in order to be compliant with the MSA escrow requirements companies selling products covered by the MSA are required to deposit such funds for each calendar year into a qualifying escrow account by April 15 of the following year. At December 31, 2017, the Company had on deposit approximately $32.1 million, the fair value of which was approximately $30.8 million. The Company will be depositing less than $0.1 million into this account by April 15, 2018, relating to 2017 sales. During 2017, less than $0.1 million relating to 2016 sales was deposited into this qualifying escrow account. The investment vehicles available to the Company are specified in the state escrow agreements and are limited to low-risk government securities.
Effective April 1, 2009, the federal excise tax on MYO products was increased from $1.0969 per pound to $24.78 per pound of tobacco. With this significant increase in the federal excise tax, the Company discontinued its generic category of MYO. The Company’s
Zig-Zag
branded MYO cigarette smoking tobacco line was discontinued in the third quarter of 2017. Thus, pending a change in MSA legislation, the Company has no remaining product lines covered by the MSA and will not be required to make escrow deposits after making deposits for 2017 sales by April 15, 2018.
The Company has chosen to invest a portion of the MSA escrow in U.S. Government securities including TIPS, Treasury Notes, and Treasury Bonds. These investments are classified as available-for-sale and carried at fair value. Realized losses are prohibited under the MSA; thus, any investment in an unrealized loss position will be held until the value is recovered, or until maturity. The following shows the fair value of the MSA escrow account as of December 31, 2017:
|
December 31,
|
||||||||||||||||||||||||||||
|
2017
|
2016
|
|||||||||||||||||||||||||||
|
Cost
|
Gross
Unrealized
Losses
|
Estimated
Fair
Value
|
Cost
|
Gross
Unrealized
Gains
|
Gross
Unrealized
Losses
|
Estimated
Fair
Value
|
||||||||||||||||||||||
|
Cash and cash equivalents
|
$
|
3,602
|
$
|
-
|
$
|
3,602
|
$
|
2,786
|
$
|
-
|
$
|
-
|
$
|
2,786
|
||||||||||||||
|
Fair value level 2: U.S. Governmental agency obligations (unrealized loss position < 12 months)
|
722
|
(17
|
)
|
705
|
29,156
|
19
|
(1,551
|
)
|
27,624
|
|||||||||||||||||||
|
Fair value level 2: U.S. Governmental agency obligations (unrealized loss position > 12 months)
|
27,733
|
(1,214
|
)
|
26,519
|
-
|
-
|
-
|
-
|
||||||||||||||||||||
|
$
|
32,057
|
$
|
(1,231
|
)
|
$
|
30,826
|
$
|
31,942
|
$
|
19
|
$
|
(1,551
|
)
|
$
|
30,410
|
|||||||||||||
The following shows the maturities of the U.S. Governmental agency obligations:
|
December 31,
|
||||||||
|
2017
|
2016
|
|||||||
|
Less than five years
|
$
|
7,114
|
$
|
9,113
|
||||
|
Six to ten years
|
17,662
|
16,141
|
||||||
|
Greater than ten years
|
3,679
|
3,902
|
||||||
|
Total U.S. Governmental agency obligations
|
$
|
28,455
|
$
|
29,156
|
||||
The following shows the amount of deposits by sales year for the MSA escrow account:
|
Deposits
|
||||||||
|
Sales
Year
|
December 31,
2017
|
December 31,
2016
|
||||||
|
1999
|
$
|
211
|
$
|
211
|
||||
|
2000
|
1,017
|
1,017
|
||||||
|
2001
|
1,673
|
1,673
|
||||||
|
2002
|
2,271
|
2,271
|
||||||
|
2003
|
4,249
|
4,249
|
||||||
|
2004
|
3,715
|
3,715
|
||||||
|
2005
|
4,552
|
4,552
|
||||||
|
2006
|
3,847
|
3,847
|
||||||
|
2007
|
4,167
|
4,167
|
||||||
|
2008
|
3,364
|
3,364
|
||||||
|
2009
|
1,626
|
1,626
|
||||||
|
2010
|
406
|
406
|
||||||
|
2011
|
193
|
193
|
||||||
|
2012
|
199
|
199
|
||||||
|
2013
|
173
|
173
|
||||||
|
2014
|
143
|
142
|
||||||
|
2015
|
101
|
100
|
||||||
|
2016
|
80
|
37
|
||||||
|
2017
|
70
|
-
|
||||||
|
Total
|
$
|
32,057
|
$
|
31,942
|
||||
Federal Excise Taxes:
Tobacco products, cigarette papers, and cigarette tubes are subject to federal excise taxes. The following table outlines the federal excise tax rate by product category effective as of April 1, 2009:
|
Product
Category
|
Cigarette and Tobacco Rates
effective April 1, 2009
|
|
|
Cigarettes
|
$1.0066 per pack
|
|
|
Large Cigars
|
52.75% of manufacturer's price; cap of $0.4026 per cigar
|
|
|
Little Cigars
|
$1.0066 per pack
|
|
|
Pip Tobacco (including Shisha)
|
$2.8311 per pound
|
|
|
Chewing Tobacco
|
$0.5033 per pound
|
|
|
Snuff
|
$1.51 per pound
|
|
|
RYO/MYO and Cigar Wrappers
|
$24.78 per pound
|
|
|
Cigarette Papers
|
$0.0315 per 50 papers
|
|
|
Cigarette Tubes
|
$0.063 per 50 tubes
|
Any future enactment of increases in federal excise taxes on the Company’s products could have a material adverse effect on the results of operations or financial condition of the Company. The Company is unable to predict the likelihood of passage of future increases in federal excise taxes. As of December 31, 2017, federal excise taxes are not assessed on e-cigarettes and related products.
As of December 31, 2017, California, Louisiana, Minnesota, North Carolina, Pennsylvania, West Virginia and the District of Columbia have an excise tax on e-cigarettes. In addition, there are several taxing jurisdictions with an excise tax on e-cigarettes. Several states have also implemented additional measures on e-cigarettes, such as licensing and age restrictions.
Food and Drug Administration (“FDA”):
On June 22, 2009, the Family Smoking Prevention and Tobacco Control Act (“FSPTCA”) authorized the Food and Drug Administration (“FDA”) to immediately regulate the manufacture, sale, and marketing of four categories of tobacco products – cigarettes, cigarette tobacco, roll-your-own tobacco, and smokeless tobacco. On August 8, 2016, the FDA deeming regulation became effective. The deeming regulation gave the FDA the authority to additionally regulate
cigars, pipe tobacco, e-cigarettes, vaporizers, and e-liquids as “deemed” tobacco products under the FSPTCA.
The FDA assesses tobacco product user fees on six classes of regulated tobacco products and computes user fees using a methodology similar to the methodology used by the U.S Department of Agriculture to compute the Tobacco Transition Payment Program (“TTPP,” also known as the “Tobacco Buyout”) assessment. First, the total, annual, congressionally established user fee assessment is allocated among the various classes of tobacco products using the federal excise tax weighted market share of tobacco products subject to regulation. Then, the assessment for each class of tobacco products is divided among individual manufacturers and importers.
Prior to October 1, 2016, these FDA user fees applied only to those products then regulated by the FDA. Effective October 1, 2016, the FDA began additionally applying FDA user fees to newly deemed tobacco products subject to FDA user fees as described above, i.e., cigars and pipe tobacco.
On July 28, 2017, the FDA announced a new direction in regulating tobacco products, including the newly “deemed” markets such as cigars and vapor products. The FDA stated it intends to begin several new rulemaking processes, some of which will outline foundational rules governing the premarket application process for the deemed products, including Substantial Equivalence Applications and Premarket Tobacco Applications. Compliance and related costs could be significant and could increase the costs of operating in our NewGen segment. The original filing deadlines for newly “deemed” products on the market as of August 8, 2016, have been postponed until August 8, 2021, for “combustible” products (e.g., cigar and pipe) and August 8, 2022, for “non-combustible” products (e.g., vapor products). No other filing deadlines were altered. The FDA also acknowledged a “continuum of risk” among tobacco products (i.e., certain tobacco products pose a greater risk to individual and public health than others), that it intends to seek public comment on the role flavors play in attracting youth and the role flavors may play in helping some smokers switch to potentially less harmful forms of nicotine delivery, and that it would be increasing its focus on the regulation of cigarette products.
Consumer Product Safety Commission (“CPSC”):
On July 26, 2016, the CPSC began requiring that e-liquid containers be packaged in child-resistant packaging, as outlined in the Poison Prevention Packaging Act. We are not able to predict whether additional packaging requirements will be necessary for our e-liquid products in the future.
Concentration of Credit Risk:
At December 31, 2017 and 2016, the Company had bank deposits, including MSA escrow accounts, in excess of federally insured limits of approximately $5.0 million and $5.2 million, respectively. During 2016, the Company chose to begin investing a portion of the MSA escrow accounts into U.S. Government securities including TIPS, Treasury Notes, and Treasury Bonds.
The Company sells its products to distributors and retail establishments throughout the United States and also sells
Zig-Zag
®
premium cigarette papers in Canada. The Company had no customers that accounted for more than 10% of gross, annual sales for 2017, 2016, or 2015. The Company performs periodic credit evaluations of its customers and generally does not require collateral on trade receivables. Historically, the Company has not experienced significant credit losses.
Accounts Receivable
Accounts receivable are recognized at their net realizable value. All accounts receivable are trade related, recorded at the invoiced amount, and do not bear interest. The Company maintains allowances for doubtful accounts receivable for estimated uncollectible invoices resulting from a customer’s inability to pay (bankruptcy, out of business, etc., i.e. “bad debt” which results in write-offs). The activity of allowance for doubtful accounts during 2017 and 2016 is as follows:
|
2017
|
2016
|
|||||||
|
Balance at beginning of period
|
$
|
35
|
$
|
137
|
||||
|
Additions to allowance account during period
|
46
|
|||||||
|
Deductions of allowance account during period
|
(64
|
)
|
(117
|
)
|
||||
|
Other
|
-
|
15
|
||||||
|
Balance at end of period
|
$
|
17
|
$
|
35
|
||||
Recent Accounting Pronouncements Adopted
The Company adopted Accounting Standards Update (“ASU”) 2017-04,
Intangibles-Goodwill and Other (Topic 350): Simplifying the Test for Goodwill Impairment
in Q1 of 2017 on a prospective basis.
This ASU simplifies the measurement of goodwill by eliminating Step 2 from the goodwill impairment test. The adoption of the ASU had no effect on the Company’s consolidated financial statements.
The Company adopted ASU 2015-11,
Inventory (Topic 330): Simplifying the Measurement of Inventory
in Q1 of 2017 on a prospective basis. Amendments in this ASU require entities that measure inventory using the first-in, first-out or average cost methods to measure inventory at the lower of cost and net realizable value. Net realizable value is defined as estimated selling price in the ordinary course of business less reasonably predictable costs of completion, disposal, and transportation. The adoption of this ASU had no effect on the Company’s consolidated financial statements.
Recent Accounting Pronouncements
In May 2014, the FASB issued ASU 2014-09,
Revenue from Contracts with Customers (Topic 606)
, which supersedes nearly all existing revenue recognition guidance under U.S. GAAP. The underlying principle is that an entity will recognize revenue to depict the transfer of goods or services to customers at an amount that the entity expects to be entitled to in exchange for those goods or services. The guidance provides a five-step analysis of transactions to determine when and how revenue is recognized: (i)
identify the contract with the customer, (ii) identify the performance obligations in the contract, (iii) determine the transaction price, (iv) allocate the transaction price to the performance obligations, and (v) recognize revenue when (or as) performance obligations are satisfied.
Other major provisions include capitalization of certain contract costs, consideration of time value of money in the transaction price, and allowing estimates of variable consideration to be recognized before contingencies are resolved in certain circumstances. The guidance also requires enhanced disclosures regarding the nature, amount, timing, and uncertainty of revenue and cash flows arising from an entity’s contracts with customers. ASU 2014-09 is effective for interim and annual periods beginning on or after December 15, 2017. The guidance permits the use of either a retrospective or cumulative effect transition method. The Company has elected to use the modified retrospective transition method. The Company has completed its assessment and does not expect there will be a significant impact on the timing or amount of revenue recognition, or on net income, upon adoption of ASU 2014-09. Therefore, the Company will not be required to make a cumulative effect adjustment to beginning retained earnings upon adoption of ASU 2014-09 on January 1, 2018.
In February 2016, the FASB issued ASU 2016-02,
Leases (Topic 842),
which supersedes Topic 840,
Leases
. ASU 2016-02 requires a lessee to recognize in the statement of financial position a liability to make lease payments (the lease liability) and a right-of-use asset representing its right to use the underlying asset for the lease term. For leases with a term of 12 months or less for which there is not an option to purchase the underlying asset that the lessee is reasonably certain to exercise, a lessee is permitted to make an accounting policy election by class of underlying asset not to recognize lease assets and lease liabilities and should recognize lease expense for such leases generally on a straight-line basis over the lease term. Certain qualitative disclosures along with specific quantitative disclosures will be required so that users are able to understand more about the nature of an entity’s leasing activities. ASU 2016-02 is effective for fiscal years beginning after December 15, 2018, including interim periods within those fiscal years, with early adoption permitted. At transition, lessees are required to recognize and measure leases at the beginning of the earliest period presented using a modified retrospective approach, which includes a number of optional practical expedients related to the identification and classification of leases that commenced before the effective date of ASU 2016-02. An entity that elects to use the practical expedients will, in effect, continue to account for leases that commenced before the effective date in accordance with previous GAAP unless the lease is modified, except that lessees are required to recognize a right-of-use asset and a lease liability for all operating leases at each reporting date based on the present value of the remaining minimum rental payments that were tracked and disclosed under previous GAAP. The Company is currently evaluating the effect the adoption of this standard will have on its financial statements.
In November 2016, the FASB issued ASU 2016-18,
Statement of Cash Flows (Topic 230): Restricted Cash
. The amendments in this ASU require that a statement of cash flows explain the change during the period in the total of cash, cash equivalents, and amounts generally described as restricted cash or restricted cash equivalents. ASU 2016-18 is effective for financial statements issued for fiscal years, and interim periods within those fiscal years, beginning after December 15, 2017 on a retrospective basis. The Company is currently evaluating the effect the adoption of this standard will have on its financial statements.
In March 2017, the FASB issued ASU 2017-07,
Compensation—Retirement Benefits (Topic 715): Improving the Presentation of Net Periodic Pension Cost and Net Periodic Postretirement Benefit Cost.
This ASU requires an entity to report the service cost component in the same line item or items as other compensation costs arising from services rendered by the pertinent employees during the period. The other components of net benefit cost are required to be presented in the income statement separately from the service cost component and outside a subtotal of income from operations. ASU 2017-07 is effective for financial statements issued for annual periods beginning after December 15, 2017, including interim periods within those annual periods. The Company does not believe the adoption of this standard will have an effect on its financial statements.
In February 2018, the FASB issued ASU 2018-02,
Income Statement—Reporting Comprehensive Income (Topic 220): Reclassification of Certain Tax Effects from Accumulated Other Comprehensive Income.
The ASU allows entities to make a one-time reclassification from accumulated other comprehensive income (AOCI) to retained earnings for the effects of remeasuring deferred tax liabilities and assets originally recorded in other comprehensive income as a result of the change in the federal tax rate by the Tax Cut and Jobs Act (“TCJA”). The effective date for all entities that elect to make the reclassification is for fiscal years beginning after December 15, 2018, including interim periods within those years. Early adoption is permitted in financial statements for fiscal years or interim periods that have not been issued or made available for issuance as of February 14, 2018. Upon adoption, an entity can elect to apply the guidance either: (a) at the beginning of the period (annual or interim) of adoption or (b) retrospectively to each period (or periods) in which the income tax effects of the TCJA related to items remaining in AOCI are recognized. The Company is currently evaluating the effect the adoption of this standard will have on its financial statements.
Note 3. Initial Public Offering (“IPO”):
In April of 2016, the Company increased the total authorized shares of preferred and voting and non-voting common stock and effected a 10.43174381 for 1 stock split of the voting and non-voting common stock. As a result of the stock split, all previously reported share amounts (including options and warrants) in the accompanying financial statements and related notes have been retrospectively restated to reflect the stock split.
In May of 2016, the Company sold 6,210,000 shares of voting common stock in its IPO at a price of $10.00 per share. The gross proceeds totaled $62.1 million. The IPO proceeds were used as follows: (i) $3.9 million for the payment of expenses in connection with the IPO; (ii) $3.3 million to purchase and retire Intrepid Warrants (See Note 17, for definition and information); (iii) $34.0 million to redeem and retire PIK Toggle Notes (See Note 12, for definition and information); (iv) $20.2 million to redeem and retire $20.0 million in principal amount of Second Lien Term Notes and pay $0.2 million as a 1% prepayment penalty (See Note 12, for definition and information); (v) $0.7 million to purchase and retire all outstanding options to buy Intrepid Common Units which include $22 of payroll taxes (See Note 17, for definition and information); and (vi) increased cash of $83.
In addition, in connection with the IPO the Company also: 1) issued 1,289,819 shares of voting common stock in exchange for all of the outstanding 7% Senior Notes (See Note 12); 2) issued 3,168,438 shares of voting common stock in exchange for all of the remaining outstanding PIK Toggle Notes not repurchased for cash as described above (See Note 12); and 3) paid $2.3 million to retire all the remaining Intrepid Warrants (for a total expenditure of $5.5 million to retire all the Intrepid Warrants).
The Company had the following voting and non-voting shares of common stock outstanding after the transactions summarized above:
|
Voting shares outstanding before transactions
|
6,259,480
|
|||
|
Shared issued in the Initial Public Offering
|
6,210,000
|
|||
|
Shares issued for 7% Senior Notes
|
1,289,819
|
|||
|
Shares issued for PIK Toggle Notes
|
3,168,438
|
|||
|
Voting shares outstanding after transactions
|
16,927,737
|
|||
|
Non-voting shares outstanding before and after transactions
|
938,857
|
In June 2016, the Board of Directors of the Company approved the conversion of 938,857 shares of non-voting common stock to
shares of voting common stock. In August 2016, Standard General, L.P. (“Standard General”), exercised warrants to purchase 442,558 shares of the Company’s common stock.
The following schedule shows the change in activity from the IPO in May 2016 to December 31, 2017:
|
Voting shares outstanding after transactions above
|
16,927,737
|
|||
|
Non-voting shares converted to voting shares
|
938,857
|
|||
|
Voting shares issued as restricted stock, net of forfeitures
|
25,944
|
|||
|
Voting shares issued upon exercise of stock options
|
66,926
|
|||
|
Voting shares issued upon exercise of warrants
|
442,558
|
|||
|
Voting shares outstanding at December 31, 2016
|
18,402,022
|
|||
|
Voting shares issued upon exercise of stock options, net
|
813,442
|
|||
|
Forfeitures of restricted stock
|
(4,831
|
)
|
||
|
Voting shares outstanding at December 31, 2017
|
19,210,633
|
Note 4. Acquisitions:
Vapor Shark
In March 2017, the Company entered into a strategic partnership with Vapor Shark in which the Company committed to make a deposit up to $2.5 million to Vapor Shark in exchange for a warrant to purchase 100% of the equity interest in Vapor Shark on or before April 15, 2018. In the event the Company exercised the warrant, the Company granted Vapor Shark’s sole shareholder the option to purchase from Vapor Shark the retail stores it owns effective as of January 1, 2018. In April 2017, the Company entered into a management agreement with Vapor Shark whereby the Company obtained control of the operations.
As a result of the management agreement, Vapor Shark became a VIE. The Company determined that it was the primary beneficiary and consolidated Vapor Shark as of April 1, 2017. Since Vapor Shark is a business, the Company accounted for the consolidation of the VIE as if it were an acquisition and recorded the assets and liabilities at fair value. The Company exercised its warrant on June 30, 2017, and obtained 100% ownership of Vapor Shark as of that date for a nominal purchase price. There was no goodwill assigned as a result of the transaction. The Company acquired $3.9 million in assets and assumed $3.9 million in liabilities, which included a liability of $0.6 million relating to the option provided to Vapor Shark’s former sole shareholder to purchase the Vapor Shark branded retail stores it owns.
In December 2017, the Company offered to pay Vapor Shark’s former sole shareholder $1.5 million in exchange for his option to purchase the company-owned stores. The agreement was finalized in January 2018, and the Company paid $1.0 million in February 2018 with the remaining $0.5 million to be paid in 24 monthly installments. As a result of the transaction a $0.9 million charge was recorded, and is included, in selling, general, and administrative expenses in 2017.
VaporBeast
On November 30, 2016, the Company acquired all of the outstanding stock of VaporBeast for total consideration of $27.0 million, net of a working capital adjustment of $0.4 million. The purchase price was satisfied through $4.0 million in cash at closing, $19.0 million in short-term notes paid in December 2016, plus $4.0 million in payments deferred for eighteen months. Accounting for the acquisition was completed in 2017 and resulted in an increase to goodwill of $0.2 million. The following purchase price and goodwill are based on the excess of the acquisition price over the estimated fair value of the tangible and intangible assets acquired.
|
Purchase price:
|
||||
|
Total purchase price
|
$
|
27,000
|
||
|
Adjustments to purchase price:
|
||||
|
Working capital
|
(400
|
)
|
||
|
Fair value of holdback
|
(128
|
)
|
||
|
Adjusted purchase price
|
$
|
26,472
|
||
|
Assets acquired:
|
||||
|
Working capital
|
$
|
4,270
|
||
|
Property and equipment
|
7
|
|||
|
Other intangible assets
|
16,272
|
|||
|
Net assets acquired
|
$
|
20,549
|
||
|
Goodwill
|
$
|
5,923
|
||
The goodwill of $5.9 million consists of expected synergies and scale from combining the operations with our previously developed NewGen platform and is deductible for tax purposes.
Wind River
On November 18, 2016, the Company purchased five chewing tobacco brands from Wind River Tobacco Company (“Wind River”) for $2.5 million. The Company paid $0.6 million at closing with the remaining $1.9 million payable quarterly through November 2019, of which $1.3 million was outstanding at December 31, 2017. The transaction was accounted for as an asset purchase with the fair value of the purchase price of $2.4 million assigned to trade names, which have an indefinite life.
Note
5. Foreign Exchange Contracts:
The Company’s policy is to manage the risks associated with foreign exchange rate movements. The policy allows hedging up to 100% of its anticipated purchases of inventory over a forward period that will not exceed 12 rolling and consecutive months. The Company may, from time to time, hedge currency for non-inventory purchases, e.g., production equipment, not to exceed 90% of the purchase price. During 2017, we executed no forward contracts. During 2016, we executed various forward contracts, none of which met hedge accounting, for the purchase of €5.6 million with maturity dates from January 26, 2017, to July 17, 2017. At December 31, 2017 and 2016, we had forward contracts for the purchase of €0 and €4.9 million, respectively.
Note 6. Fair Value of Financial Instruments:
The estimated fair value amounts have been determined by the Company using the methods and assumptions described below. However, considerable judgment is required to interpret market data to develop estimates of fair value. Accordingly, the estimates presented herein are not necessarily indicative of the amounts the Company could realize in a current market exchange. The use of different market assumptions and/or estimation methodologies may have a material effect on the estimated fair value amounts.
Cash and Cash Equivalents
Cash and cash equivalents are, by definition, short-term. Thus, the carrying amount is a reasonable estimate of fair value.
Accounts Receivable
The fair value of accounts receivable approximates their carrying value due to their short-term nature.
Revolving Credit Facility
The fair value of the revolving credit facility approximates its carrying value as the interest rate fluctuates with changes in market rates.
Long-Term Debt
The fair value of the Company’s long-term debt is estimated based on the quoted market prices for the same or similar issues or on the current rates offered to the Company for debt of the same remaining maturities.
As of December 31, 2017, the fair values of the 2017 First Lien Term Loans and the 2017 Second Lien Term Loan approximated $140.6 million and $56.1 million, respectively.
See ‘Note 12: Notes Payable and Long-Term Debt’ for details regarding our credit facilities.
As of December 31, 2016, the fair values of the First Lien Term Loans and the Second Lien Term Loan approximated $147.3 million and $60.0 million, respectively.
See ‘Note 12: Notes Payable and Long-Term Debt’ for details regarding our credit facilities.
Foreign Exchange
At December 31, 2017 and 2016, we had forward contracts for the purchase of €0 and €4.9 million, respectively. The fair value of the foreign exchange contracts were based upon the quoted market price that resulted in an insignificant liability as of December 31, 2016.
Note 7. Inventories:
The components of inventories at December 31 are as follows:
|
2017
|
2016
|
|||||||
|
Raw materials and work in process
|
$
|
2,545
|
$
|
2,596
|
||||
|
Leaf tobacco
|
30,308
|
27,391
|
||||||
|
Finished goods - smokeless products
|
5,834
|
4,789
|
||||||
|
Finished goods - smoking products
|
14,110
|
18,384
|
||||||
|
Finished goods - electronic/vaporizer products
|
14,532
|
11,993
|
||||||
|
Other
|
1,290
|
1,232
|
||||||
|
68,619
|
66,385
|
|||||||
|
LIFO reserve
|
(5,323
|
)
|
(4,200
|
)
|
||||
|
$
|
63,296
|
$
|
62,185
|
|||||
The following represents the inventory valuation allowance roll-forward, for the years ended December 31:
|
2017
|
2016
|
|||||||
|
Balance at beginning of period
|
$
|
(600
|
)
|
$
|
(305
|
)
|
||
|
Charged to cost and expense
|
(469
|
)
|
(566
|
)
|
||||
|
Deductions for inventory disposed
|
805
|
527
|
||||||
|
Other
|
(195
|
)
|
(256
|
)
|
||||
|
Balance at end of period
|
$
|
(459
|
)
|
$
|
(600
|
)
|
||
Note 8. Property, Plant and Equipment:
Property, plant and equipment at December 31 consists of:
|
2017
|
2016
|
|||||||
|
Land
|
$
|
22
|
$
|
22
|
||||
|
Buildings and improvements
|
2,072
|
1,899
|
||||||
|
Leasehold improvements
|
1,873
|
1,666
|
||||||
|
Machinery and equipment
|
12,635
|
10,532
|
||||||
|
Furniture and fixtures
|
3,821
|
3,409
|
||||||
|
20,423
|
17,528
|
|||||||
|
Accumulated depreciation
|
(11,564
|
)
|
(9,938
|
)
|
||||
|
$
|
8,859
|
$
|
7,590
|
|||||
Note 9. Goodwill and Other Intangible Assets:
The following table summarizes goodwill by segment:
|
Smokeless
|
Smoking
|
NewGen
|
Total
|
|||||||||||||
|
Balance as of January 1, 2016
|
$
|
32,590
|
$
|
96,107
|
$
|
-
|
$
|
128,697
|
||||||||
|
Acquisitions
|
-
|
-
|
5,693
|
5,693
|
||||||||||||
|
Balance as of December 31, 2016
|
32,590
|
96,107
|
5,693
|
134,390
|
||||||||||||
|
Adjustments
|
-
|
-
|
230
|
230
|
||||||||||||
|
Balance as of December 31, 2017
|
$
|
32,590
|
$
|
96,107
|
$
|
5,923
|
$
|
134,620
|
||||||||
The following tables summarize information about the Company’s allocation of other intangible assets. Gross carrying amounts of unamortized, indefinite life intangible assets relating to Stoker’s and Wind River in the Smokeless segment and VaporBeast in the NewGen segment are shown below:
|
As of December 31,
|
||||||||||||||||||||||||
|
2017
|
2016
|
|||||||||||||||||||||||
|
Smokeless
|
NewGen
|
Total
|
Smokeless
|
NewGen
|
Total
|
|||||||||||||||||||
|
Unamortized, indefinite life intangible assets:
|
||||||||||||||||||||||||
|
Trade names
|
$
|
10,871
|
$
|
10,786
|
$
|
21,657
|
$
|
10,871
|
$
|
10,786
|
$
|
21,657
|
||||||||||||
|
Formulas
|
53
|
-
|
53
|
53
|
-
|
53
|
||||||||||||||||||
|
Total
|
$
|
10,924
|
$
|
10,786
|
$
|
21,710
|
$
|
10,924
|
$
|
10,786
|
$
|
21,710
|
||||||||||||
Amortized intangible assets relating to the purchase of VaporBeast, included within the NewGen segment, consist of:
|
As of December 31,
|
||||||||||||||||
|
2017
|
2016
|
|||||||||||||||
|
Gross Carrying
Amount
|
Accumulated
Amortization
|
Gross Carrying
Amount
|
Accumulated
Amortization
|
|||||||||||||
|
Amortized intangible assets:
|
||||||||||||||||
|
Customer relationships (useful life of 8 years)
|
$
|
5,386
|
$
|
729
|
$
|
5,386
|
$
|
55
|
||||||||
|
Non-compete agreements (useful life of 3.5 years)
|
100
|
31
|
100
|
3
|
||||||||||||
|
Total
|
$
|
5,486
|
$
|
760
|
$
|
5,486
|
$
|
58
|
||||||||
Note 10. Deferred Financing Costs:
Deferred financing costs relating to the revolving credit facility at December 31 consist of:
|
2017
|
2016
|
|||||||
|
Deferred financing costs, net of accumulated amortization of $134 and $202, respectively
|
$
|
630
|
$
|
139
|
||||
Note 11. Accrued Liabilities:
Accrued liabilities at December 31 consist of:
|
2017
|
2016
|
|||||||
|
Accrued payroll and related items
|
$
|
5,683
|
$
|
5,331
|
||||
|
Customer returns and allowances
|
2,707
|
2,818
|
||||||
|
Other
|
9,839
|
7,187
|
||||||
|
$
|
18,229
|
$
|
15,336
|
|||||
Note 12. Notes Payable and Long-Term Debt:
Notes payable and long-term debt at December 31 consists of the following in order of preference:
|
2017
|
2016
|
|||||||
|
2017 First Lien First Out Term Loan
|
$
|
105,875
|
$
|
-
|
||||
|
2017 First Lien Second Out Term Loan
|
34,738
|
-
|
||||||
|
2017 Second Lien Term Loan
|
55,000
|
-
|
||||||
|
Note payable - VaporBeast
|
2,000
|
2,000
|
||||||
|
First Lien Term Loan
|
-
|
146,451
|
||||||
|
Second Lien Term Loan
|
-
|
59,128
|
||||||
|
Total notes payable and long-term debt
|
197,613
|
207,579
|
||||||
|
Less deferred finance charges
|
(3,573
|
)
|
(4,388
|
)
|
||||
|
Less current maturities
|
(7,850
|
)
|
(1,650
|
)
|
||||
|
$
|
186,190
|
$
|
201,541
|
|||||
2017 Credit Facility
On February 17, 2017, the Company and NATC, entered into a new $250 million secured credit facility comprised of (i) a First Lien Credit Facility with Fifth Third Bank, as administrative agent, and other lenders (the “2017 First Lien Credit Facility”) and (ii) a Second Lien Credit Facility with Prospect Capital Corporation, as administrative agent, and other lenders (the “2017 Second Lien Credit Facility,” and together with the 2017 First Lien Credit Facility, the “2017 Credit Facility”). The Company used the proceeds of the 2017 Credit Facility to repay, in full, the Company’s First Lien Term Loan, Second Lien Term Loan, and Revolving Credit Facility and to pay related fees and expenses. As a result of this transaction, the Company incurred a loss on extinguishment of debt of $6.1 million during the first quarter of 2017.
The 2017 Credit Facility contains customary events of default including payment defaults, breaches of representations and warranties, covenant defaults, cross-defaults to certain other material indebtedness in excess of specified amounts, certain events of bankruptcy and insolvency, certain ERISA events, judgments in excess of specified amounts, and change in control defaults. The 2017 Credit Facility also contains certain negative covenants customary for facilities of these types including covenants that, subject to exceptions described in the 2017 Credit Facility, restrict the ability of the Company and its subsidiary guarantors: (i) to pledge assets, (ii) to incur additional indebtedness, (iii) to pay dividends, (iv) to make distributions, (v) to sell assets, and (vi) to make investments. Refer to Note 22 of Notes to Consolidated Financial Statements for further information regarding dividend restrictions.
2017 First Lien Credit Facility
The 2017 First Lien Credit Facility consists of: (i) a $50 million revolving credit facility (the “2017 Revolving Credit Facility”), (ii) a $110 million first out term loan facility (the “2017 First Out Term Loan”), and (iii) a $35 million second out term loan facility (the “2017 Second Out Term Loan”), which will be repaid in full only after repayment in full of the 2017 First Out Term Loan. The 2017 First Lien Credit Facility also includes an accordion feature allowing the Company to borrow up to an additional $40 million upon the satisfaction of certain conditions, including obtaining commitments from one or more lenders. Borrowings under the 2017 Revolving Credit Facility may be used for general corporate purposes, including acquisitions.
The 2017 First Out Term Loan and the 2017 Revolving Credit Facility have a maturity date of February 17, 2022, and the 2017 Second Out Term Loan has a maturity date of May 17, 2022. The 2017 First Out Term Loan and the 2017 Revolving Credit Facility bear interest at LIBOR plus a spread of 2.5% to 3.5% based on the Company’s senior leverage ratio. The 2017 First Out Term Loan has quarterly required payments of $1.4 million beginning June 30, 2017, increasing to $2.1 million on June 30, 2019, and increasing to $2.8 million on June 30, 2021. The 2017 Second Out Term Loan bears interest at LIBOR plus 6% (subject to a floor of 1.00%). The 2017 Second Out Term Loan has quarterly required payments of $0.1 million beginning June 30, 2017. The 2017 First Lien Credit Facility contains certain financial covenants including maximum senior leverage ratio of 3.75x with step-downs to 3.00x, a maximum total leverage ratio of 4.75x with step-downs to 4.00x, and a minimum fixed charge coverage ratio of 1.20x. The weighted average interest rate at December 31, 2017, on the 2017 Revolving Credit Facility was 5.05%. The weighted average interest rate at December 31, 2017, on the 2017 First Out Term Loan was 4.61%. The weighted average interest rate at December 31, 2017, on the 2017 Second Out Term Loan was 7.61%.
2017 Second Lien Credit Facility
The 2017 Second Lien Credit Facility consists of a $55 million second lien term loan (the “2017 Second Lien Term Loan”) having a maturity date of August 17, 2022. The 2017 Second Lien Term Loan bears interest at a fixed rate of 11%. The 2017 Second Lien Credit Facility contains certain financial covenants including a maximum senior leverage ratio of 4.25x with step-downs to 3.50x, a maximum total leverage ratio of 5.25x with step-downs to 4.50x, and a minimum fixed charge coverage ratio of 1.10x.
Note Payable – VaporBeast
On November 30, 2016, the Company issued a note payable to VaporBeast’s former shareholders (“VaporBeast Note”). The VaporBeast Note is $2.0 million principal with 6% interest compounded monthly and matures on May 30, 2018. The VaporBeast Note may be prepaid at any time without penalty and is subject to a late-payment penalty of 5% and a default rate of 13% per annum. The VaporBeast Note is subject to customary defaults, including defaults for nonpayment, nonperformance, any material breach under the purchase agreement, and bankruptcy or insolvency.
First Lien Term Loan
Turning Point Brands, Inc. (“TPBI”), along with NATC and its subsidiaries, were guarantors under the First Lien Term Loan. TPLLC and its sole subsidiary at the date of the agreement, Intrepid, were not guarantors of the First Lien Term Loan. The First Lien Term Loan was secured by a first-priority lien on substantially all of the assets of the borrowers and the guarantors thereunder, including a pledge of the capital stock of NATC or any guarantor, other than certain excluded assets (the “Collateral”). The loans designated as LIBOR loans bore interest at the LIBOR then in effect (but not less than 1.25%) plus 6.50%, and the loans designated as base rate loans bore interest at (i) the highest of (A) the Prime Rate, (B) the Federal Funds Rate plus 0.50%, (C) LIBOR for an interest period of one month plus 1.00%, and (D) 2.25% per year plus (ii) 5.50%. The First Lien Term Loan was paid in full with proceeds from the 2017 Credit Facility.
Second Lien Term Loan
The Second Lien Term Loan was secured by a second priority security interest in the Collateral and was guaranteed by the same entities as the First Lien Term Loan. Under the Second Lien Term Loan, the loans designated as LIBOR loans bore interest at LIBOR then in effect (but not less than 1.25%) plus 10.25%. The loans designated as base rate loans bore interest at (i) the highest of (A) the Prime Rate, (B) the Federal Funds Rate plus 0.50%, (C) LIBOR for an interest period of one month plus 1.00%, and (D) 2.25% per year plus (ii) 9.25%. The Second Lien Term Loan was paid in full with proceeds from the 2017 Credit Facility.
Revolving Credit Facility
The Revolving Credit Facility provided for aggregate commitments of up to $40 million subject to a borrowing base, which was calculated as (i) the sum of 85% of eligible accounts receivable, plus (ii) the lesser of (A) the product of 70% and the value of eligible inventory or (B) the product of 85%, the net recovery percentage identified in the most recent inventory appraisal, and the value of eligible inventory, plus (iii) the lesser of (A) the product of 75% and the value of eligible inventory or (B) the product of 85%, the net recovery percentage identified in the most recent inventory appraisal, and the value of the eligible finished goods inventory, minus (iv) the aggregate amount of reserves established by the administrative agent. The outstanding balance on the Revolving Credit Facility was paid in full with proceeds from the 2017 Credit Facility.
PIK Toggle Notes
On January 13, 2014, the Company issued PIK Toggle Notes (“PIK Toggle Notes”) to a fund managed by Standard General, with a principal amount of $45 million and warrants to purchase 42,424 of the Company’s common stock at $.01 per share, as adjusted for stock splits and other events specified in the agreement. After adjustment for the stock split effected in connection with the IPO of 10.43174381 to 1, the warrants provide for the purchase of 442,558 of the Company’s common stock. Due to the issuance of the warrants the PIK Toggle Notes had an original issue discount of $1.7 million and were initially valued at $43.3 million. The PIK Toggle Notes were scheduled to mature, and the warrants to expire, on January 13, 2021.
The PIK Toggle Notes accrued interest based on LIBOR then in effect (but not less than 1.25%) plus 13.75%. Interest was payable on the last day of each quarter and upon maturity. The Company had the flexibility to pay interest in kind through an increase in the principal amount at the same interest rate as the PIK Toggle Notes. The Company chose to increase the PIK Toggle Notes for all interest for the first three months of 2016.
In connection with the IPO, in May 2016 the Company redeemed and retired all of the outstanding PIK Toggle Notes in exchange for a combination of cash and shares of the Company’s voting common stock. As a result of this transaction, the Company incurred a loss on extinguishment of debt of $2.8 million during the second quarter of 2016. Standard General exercised the warrants in 2016.
7% Senior Notes
In January 2014, the Company issued 7% Senior Notes to various stockholders with a principal amount of $11 million and warrants to purchase 11,000,000 units of membership interests in Intrepid, which represented 40% of the Intrepid Common Units outstanding on a fully diluted basis, at a purchase price of $1.00 per unit. Due to the issuance of the Intrepid warrants, the 7% Senior Notes had an original issue discount of $2.8 million and were initially valued at $8.2 million. The 7% Senior Notes were scheduled to mature, and the warrants to expire, on December 31, 2023.
The 7% Senior Notes accrued interest at a fixed rate of 7% per annum. The 7% Senior Notes were general unsecured obligations of the Company and ranked equally with the Company’s other unsecured and unsubordinated debt from time to time outstanding. Redemptions of the 7% Senior Notes could be made by the Company at any time without penalty or premium. In connection with the IPO, in May 2016, the Company redeemed and retired all of the outstanding 7% Senior Notes in exchange for shares of the Company’s voting common stock.
Note
13. Income Taxes:
Income tax expense (benefit) for the years ended December 31 consists of the following components:
|
2017
|
2016
|
2015
|
||||||||||||||||||||||||||||||||||
|
Current
|
Deferred
|
Total
|
Current
|
Deferred
|
Total
|
Current
|
Deferred
|
Total
|
||||||||||||||||||||||||||||
|
Federal
|
$
|
329
|
$
|
4,772
|
$
|
5,101
|
$
|
(46
|
)
|
$
|
(12,655
|
)
|
$
|
(12,701
|
)
|
$
|
321
|
$
|
43
|
$
|
364
|
|||||||||||||||
|
State and Local
|
1,770
|
409
|
$
|
2,179
|
760
|
(64
|
)
|
696
|
706
|
8
|
714
|
|||||||||||||||||||||||||
|
$
|
2,099
|
$
|
5,181
|
$
|
7,280
|
$
|
714
|
$
|
(12,719
|
)
|
$
|
(12,005
|
)
|
$
|
1,027
|
$
|
51
|
$
|
1,078
|
|||||||||||||||||
Deferred tax assets and liabilities at December 31 consist of:
|
2017
|
2016
|
|||||||||||||||
|
Assets
|
Liabilities
|
Assets
|
Liabilities
|
|||||||||||||
|
Inventory
|
$
|
2,485
|
$
|
187
|
$
|
2,268
|
$
|
423
|
||||||||
|
Property, plant, and equipment
|
-
|
1,134
|
-
|
1,642
|
||||||||||||
|
Goodwill and other intangible assets
|
14
|
7,397
|
43
|
10,431
|
||||||||||||
|
Accrued pension and postretirement costs
|
621
|
-
|
1,964
|
-
|
||||||||||||
|
Federal NOL carryforward
|
3,736
|
-
|
11,911
|
-
|
||||||||||||
|
State NOL carryforward
|
3,071
|
-
|
3,083
|
-
|
||||||||||||
|
AMT credit carryforward
|
1,327
|
-
|
997
|
-
|
||||||||||||
|
Unrealized loss on investments
|
320
|
-
|
582
|
-
|
||||||||||||
|
Deferred income for tax purposes
|
-
|
486
|
-
|
1,419
|
||||||||||||
|
Other
|
1,441
|
290
|
2,867
|
429
|
||||||||||||
|
13,015
|
9,494
|
23,715
|
14,344
|
|||||||||||||
|
Valuation allowance
|
(3,071
|
)
|
(3,083
|
)
|
||||||||||||
|
Deferred income taxes
|
$
|
9,944
|
$
|
9,494
|
$
|
20,632
|
$
|
14,344
|
||||||||
At December 31, 2017, the Company had federal net operating loss (“NOL”) carryforwards for income tax purposes of approximately $17.8 million, which expire in 2034. At December 31, 2017, the Company had state NOL carryforwards for income tax purposes of approximately $63.1 million, which expire between 2018 and 2036. The Company has determined that, at December 31, 2017 and 2016, its ability to realize future benefits of its state NOL carryforwards does not meet the “more likely than not” criteria in ASC 740, Income Taxes. Therefore, a valuation allowance of $3.1 million has been recorded in each year, respectively.
ASC 740-10-25 prescribes a recognition threshold and measurement attribute for the financial statement recognition and measurement of a tax position taken or expected to be taken in a tax return. For those benefits to be recognized, a tax position must be more-likely-than-not to be sustained upon examination by taxing authorities. The amount recognized is measured as the largest amount of benefit that is greater than 50 percent likely of being realized upon ultimate settlement. The Company has determined that they did not have any uncertain tax positions requiring recognition as a result of the provisions of ASC 740-10-25. The Company’s policy is to recognize interest and penalties accrued on uncertain tax positions as part of interest expense. For the years ended December 31, 2017, 2016, and 2015, no estimated interest or penalties were recognized for the uncertainty of tax positions taken. The Company files income tax returns in the U.S. federal jurisdiction and various state jurisdictions. In general, the Company is no longer subject to U.S. federal and state tax examinations for years prior to 2014.
Reconciliation of the federal statutory rate and the effective income tax rate for the years ended December 31 is as follows:
|
2017
|
2016
|
2015
|
||||||||||
|
Federal statutory rate
|
35
|
%
|
35
|
%
|
35
|
%
|
||||||
|
State taxes
|
8.1
|
4.7
|
7.0
|
|||||||||
|
Permanent differences
|
-16.1
|
13.2
|
42.5
|
|||||||||
|
Valuation allowance
|
-
|
-133.4
|
-74.0
|
|||||||||
|
Effective income tax rate
|
27.0
|
%
|
-80.5
|
%
|
10.5
|
%
|
||||||
In December 2017, the U.S. Congress passed the TCJA which reduced the corporate income tax rate to 21%, effective January 1, 2018. Other significant changes accompanying the corporate income tax rate reduction include eliminating the corporate alternative minimum tax, limiting the interest expense deduction to 30% of adjusted taxable income, and limiting net operating losses to 80% of taxable income for losses arising in tax years beginning after 2017. As a result of the TCJA, the Company was required to remeasure its deferred tax assets and liabilities at the newly enacted rate, resulting in $0.2 million of income tax expense for the year ended December 31, 2017. The permanent differences for the year ended December 31, 2017, are primarily related to income tax benefits of $4.2 million as a result of stock option exercises.
Note 14. Pension and Postretirement Benefit Plans:
The Company has a defined benefit pension plan. Benefits for hourly employees were based on a stated benefit per year of service, reduced by amounts earned in a previous plan. Benefits for salaried employees were based on years of service and the employees’ final compensation. The defined benefit pension plan is frozen. The Company’s policy is to make the minimum amount of contributions that can be deducted for federal income taxes. The Company expects to make no contributions to the pension plan in the year ending December 31, 2018.
The Company sponsored a defined benefit postretirement plan that covered hourly employees. This plan provides medical and dental benefits. This plan is contributory with retiree contributions adjusted annually. The Company’s policy is to make contributions equal to benefits paid during the year. The Company expects to contribute approximately $0.3 million to its postretirement plan in 2018 for the payment of benefits.
The following tables provide a reconciliation of the changes in the plans’ benefit obligations and fair value of assets for the years ended December 31, 2017 and 2016, and a statement of the funded status:
|
Pension
Benefits
|
Postretirement
Benefits
|
|||||||||||||||
|
2017
|
2016
|
2017
|
2016
|
|||||||||||||
|
Reconciliation of benefit obligations:
|
||||||||||||||||
|
Benefit obligation at January 1
|
$
|
16,780
|
$
|
16,994
|
$
|
4,745
|
$
|
5,003
|
||||||||
|
Service cost
|
104
|
104
|
-
|
-
|
||||||||||||
|
Interest cost
|
649
|
699
|
144
|
173
|
||||||||||||
|
Actuarial loss (gain)
|
668
|
86
|
(472
|
)
|
(111
|
)
|
||||||||||
|
Benefits paid
|
(1,080
|
)
|
(1,103
|
)
|
(200
|
)
|
(320
|
)
|
||||||||
|
Benefit obligation at December 31
|
$
|
17,121
|
$
|
16,780
|
$
|
4,217
|
$
|
4,745
|
||||||||
|
Reconciliation of fair value of plan assets:
|
||||||||||||||||
|
Fair value of plan assets at January 1
|
$
|
16,357
|
$
|
16,507
|
$
|
-
|
$
|
-
|
||||||||
|
Actual return on plan assets
|
2,240
|
953
|
-
|
-
|
||||||||||||
|
Employer contributions
|
-
|
-
|
200
|
320
|
||||||||||||
|
Benefits paid
|
(1,080
|
)
|
(1,103
|
)
|
(200
|
)
|
(320
|
)
|
||||||||
|
Fair value of plan assets at December 31
|
$
|
17,517
|
$
|
16,357
|
$
|
-
|
$
|
-
|
||||||||
|
Funded status:
|
||||||||||||||||
|
Funded status at December 31
|
$
|
396
|
$
|
(423
|
)
|
$
|
(4,217
|
)
|
$
|
(4,745
|
)
|
|||||
|
Unrecognized net actuarial loss (gain)
|
3,443
|
4,454
|
(1,161
|
)
|
(741
|
)
|
||||||||||
|
Net amount recognized
|
$
|
3,839
|
$
|
4,031
|
$
|
(5,378
|
)
|
$
|
(5,486
|
)
|
||||||
The following schedule shows the pension plan in which accumulated benefit obligations exceed plan assets at December 31, 2016. Accumulated benefit obligations did not exceed plan assets at December 31, 2017.
|
2016
|
||||
|
Projected benefit obligation
|
$
|
16,780
|
||
|
Accumulated benefit obligation
|
16,780
|
|||
|
Fair value of plan assets
|
16,357
|
|||
The asset allocation for the Company’s defined benefit plan, by asset category, follows:
|
Target
Allocation
|
Percentage of
Plan Assets at
December 31,
|
|||||||||||
|
2018
|
2017
|
2016
|
||||||||||
|
Asset category:
|
||||||||||||
|
Equity securities
(1)
|
60.0
|
%
|
51.4
|
%
|
62.0
|
%
|
||||||
|
Debt securities
|
40.0
|
%
|
21.6
|
%
|
26.0
|
%
|
||||||
|
Cash
|
0.0
|
%
|
27.0
|
%
|
12.0
|
%
|
||||||
|
Total
|
100.0
|
%
|
100.0
|
%
|
100.0
|
%
|
||||||
|
(1)
|
No shares of the Company's common stock were included in equity securities at December 31, 2017 or 2016
|
The asset’s or liability’s fair value measurement level within the fair value hierarchy is based on the lowest level of any input that is significant to the fair value measurement. Valuation techniques used need to maximize the use of observable inputs and minimize the use of unobservable inputs.
Following is the description of the valuation methodologies used for assets measured at fair value subsequent to initial recognition. These methods may produce a fair value calculation that may not be indicative of net realizable value or reflective of future fair values. Furthermore, while the Company believes its valuation methods are appropriate and consistent with those of other market participants, the use of different methodologies or assumptions to determine the fair value of certain financial instruments could result in a different fair value measurement at the reporting date. There have been no changes in the methodologies used at December 31, 2017 and 2016.
| · |
Pooled Separate Accounts.
Valued at the net asset value (NAV) of shares held by the plan at year end.
|
| · |
Guaranteed Deposit Account.
Valued at contract value, which approximates fair value.
|
| · |
Assets measured at fair value on a recurring basis.
The table below presents the balances of the plan’s assets measured at fair value on a recurring basis by level within the fair value hierarchy:
|
|
Total
|
Level 1
|
Level 2
|
Level 3
|
|||||||||||||
|
Pooled separate accounts
|
$
|
12,796
|
$
|
-
|
$
|
12,796
|
$
|
-
|
||||||||
|
Guaranteed deposit account
|
4,721
|
-
|
-
|
4,721
|
||||||||||||
|
Total assets at fair value as of December 31, 2017
|
$
|
17,517
|
$
|
-
|
$
|
12,796
|
$
|
4,721
|
||||||||
|
Pooled separate accounts
|
$
|
14,391
|
$
|
-
|
$
|
14,391
|
$
|
-
|
||||||||
|
Guaranteed deposit account
|
1,966
|
-
|
-
|
1,966
|
||||||||||||
|
Total assets at fair value as of December 31, 2016
|
$
|
16,357
|
$
|
-
|
$
|
14,391
|
$
|
1,966
|
||||||||
The table below sets forth a summary of the changes in the fair value of the Guaranteed Deposit Account:
|
Guaranteed
Deposit
Account
|
||||
|
Balance at December 31, 2015
|
$
|
1,732
|
||
|
Total gains (losses), realized/unrealized
|
||||
|
Return on plan assets
|
60
|
|||
|
Purchases, sales, and settlements, net
|
174
|
|||
|
Balance at December 31, 2016
|
1,966
|
|||
|
Total gains (losses), realized/unrealized
|
||||
|
Return on plan assets
|
64
|
|||
|
Purchases, sales, and settlements, net
|
2,691
|
|||
|
Balance at December 31, 2017
|
$
|
4,721
|
||
The Company’s investment philosophy is to earn a reasonable return without subjecting plan assets to undue risk. The Company uses one management firm to manage plan assets, which are invested in equity and debt securities. The Company’s investment objective is to provide long-term growth of capital as well as current income.
The following table provides the amounts recognized in the consolidated balance sheets as of December 31:
|
Pension
Benefits
|
Postretirement
Benefits
|
|||||||||||||||
|
2017
|
2016
|
2017
|
2016
|
|||||||||||||
|
Prepaid asset
|
$
|
396
|
$
|
-
|
$
|
-
|
$
|
-
|
||||||||
|
Accrued benefit cost
|
-
|
(423
|
)
|
(4,217
|
)
|
(4,745
|
)
|
|||||||||
|
Accumulated other comprehensive loss, unrecognized net gain (loss)
|
3,443
|
4,454
|
(1,161
|
)
|
(741
|
)
|
||||||||||
|
$
|
3,839
|
$
|
4,031
|
$
|
(5,378
|
)
|
$
|
(5,486
|
)
|
|||||||
The amounts in accumulated other comprehensive income that are expected to be recognized in net periodic benefit costs in 2018 are gains of $0.3 million for pension and losses of less than $0.1 million for postretirement, respectively.
The following table provides the components of net periodic pension and postretirement benefit costs and total costs for the plans for the years ended December 31:
|
Pension
Benefits
|
Postretirement
Benefits
|
|||||||||||||||
|
2017
|
2016
|
2017
|
2016
|
|||||||||||||
|
Service cost
|
$
|
104
|
$
|
104
|
$
|
-
|
$
|
-
|
||||||||
|
Interest cost
|
649
|
699
|
144
|
173
|
||||||||||||
|
Expected return on plan assets
|
(1,024
|
)
|
(1,034
|
)
|
-
|
-
|
||||||||||
|
Amortization of (gains) losses
|
463
|
493
|
(52
|
)
|
(24
|
)
|
||||||||||
|
Net periodic benefit cost (income)
|
$
|
192
|
$
|
262
|
$
|
92
|
$
|
149
|
||||||||
The Company is required to make assumptions regarding such variables as the expected long-term rate of return on plan assets and the discount rate applied to determine service cost and interest cost. The rate of return on assets used is determined based upon analysis of the plans’ historical performance relative to the overall markets and mix of assets. The assumptions listed below represent management’s review of relevant market conditions and have been adjusted as appropriate. The weighted average assumptions used in the measurement of the Company’s benefit obligation are as follows:
|
Pension
Benefits
|
Postretirement
Benefits
|
|||||||||||||||
|
2017
|
2016
|
2017
|
2016
|
|||||||||||||
|
Discount rate
|
3.50
|
%
|
4.00
|
%
|
3.25
|
%
|
3.50
|
%
|
||||||||
The weighted average assumptions used to determine net periodic pension and postretirement costs are as follows:
|
Pension
Benefits
|
Postretirement
Benefits
|
|||||||||||||||
|
2017
|
2016
|
2017
|
2016
|
|||||||||||||
|
Discount rate
|
4.0
|
%
|
4.3
|
%
|
3.5
|
%
|
3.8
|
%
|
||||||||
|
Expected return on plan assets
|
6.5
|
%
|
6.5
|
%
|
-
|
-
|
||||||||||
For measurement purposes of the postretirement benefits, the assumed health care cost trend rate for participants as of December 31, 2017, was 6.0% reducing to 5.5% by 2018. Assumed health care cost trend rates could have a significant effect on the amounts reported for the postretirement benefit plans. A 1% increase in assumed health care cost trend rates would have the following effects:
|
2017
|
2016
|
2015
|
||||||||||
|
Effect on total of service and interest cost components of net periodic postretirement cost
|
$
|
4
|
$
|
3
|
$
|
4
|
||||||
|
Effect on the health care component of the accumulated postretirement benefit obligation
|
$
|
109
|
$
|
78
|
$
|
101
|
||||||
The following benefit payments, which reflect expected future service, as appropriate, are expected to be paid:
|
Period
|
Pension
Benefits
|
Postretirement
Benefits
|
||||||
|
2018
|
$
|
1,107
|
$
|
259
|
||||
|
2019
|
1,096
|
264
|
||||||
|
2020
|
1,093
|
269
|
||||||
|
2021
|
1,106
|
274
|
||||||
|
2022
|
1,109
|
279
|
||||||
|
2023-2027
|
$
|
5,347
|
$
|
1,422
|
||||
The Company also sponsors a voluntary 401(k) retirement savings plan. Eligible employees may elect to contribute up to 15% of their annual earnings subject to certain limitations. For the 2017 and 2016 Plan Years, the Company contributed 4% to those employees contributing 4% or greater. For those employees contributing less than 4%, the Company matched the contribution by 100%. Additionally, for all years presented, the Company made discretionary contributions of 1% to all employees, regardless of an employee’s contribution level. Company contributions to this plan were approximately $0.9 million for 2017, $0.8 million for 2016, and $0.7 million for 2015.
Note 15. Lease Commitments:
The Company leases certain office space and vehicles for varying periods. The acquisition of Vapor Shark, completed on June 30, 2017, added seven operating leases for retail store space. The following schedule details future minimum lease payments for operating leases that had initial or remaining non-cancelable lease terms in excess of one year as of December 31, 2017:
|
Year
|
Payments
|
|||
|
2018
|
1,713
|
|||
|
2019
|
963
|
|||
|
2020
|
786
|
|||
|
Total
|
$
|
3,462
|
||
The total lease expense included in the consolidated statements of income for the years ended December 31, 2017, 2016, and 2015, was $2.6 million, $1.8 million, and $1.8 million, respectively.
Note 16. Share Incentive Plans:
On April 28, 2016, the Board of Directors of the Company adopted the Turning Point Brands, Inc., 2015 Equity Incentive Plan (the “2015 Plan”), pursuant to which awards may be granted to employees, non-employee directors, and consultants. In addition, the 2015 Plan provides for the granting of nonqualified stock options to employees of the Company or any subsidiary of the Company. Pursuant to the 2015 Plan, 1,400,000 shares of the Company’s voting common stock are reserved for issuance as awards to employees, non-employee directors, and consultants as compensation for past or future services or the attainment of certain performance goals. The 2015 Plan is scheduled to terminate on April 27, 2026. The 2015 Plan is administrated by a committee (the “Committee”) of the Company’s Board of Directors. The Committee determines the vesting criteria for the awards, with such criteria to be specified in the award agreement. As of December 31, 2017, 21,103 shares of restricted stock, 94,000 performance-based restricted stock units, and 187,015 options have been granted to employees of the Company under the 2015 Plan. There are 1,097,882 shares available for grant under the 2015 Plan.
On February 7, 2017, the Board of Directors of the Company approved stock option cash-out agreements with three Company officers and a director for the surrender of 83,400 expiring stock options in exchange for payment to the option holders of $11.99 per share. This payment equaled the difference between the exercise price of $1.06 and closing stock price of $13.05 on the approval date, or an aggregate of $1.0 million.
On February 8, 2006, the Board of Directors of the Company adopted the 2006 Equity Incentive Plan (the “2006 Plan”) of North Atlantic Holding Company, Inc., pursuant to which awards may be granted to employees. The 2006 Plan provides for the granting of nonqualified stock options and restricted stock awards to employees. Upon the adoption of the Company’s 2015 Equity Incentive Plan in connection with its IPO, the Company determined no additional grants would be made under the 2006 Plan. However, all awards issued under the 2006 Plan that have not been previously terminated or forfeited remain outstanding and continue unaffected.
There are no shares available for grant under the 2006 Plan. Stock option activity for the 2006 and 2015 Plans is summarized below:
|
Stock
Option
Shares
|
Weighted
Average
Exercise
Price
|
Weighted
Average
Grant Date
Fair Value
|
||||||||||
|
Outstanding, December 31, 2015
|
1,667,671
|
$
|
2.19
|
$
|
1.20
|
|||||||
|
Granted
|
53,996
|
9.26
|
2.37
|
|||||||||
|
Exercised
|
(73,135
|
)
|
2.31
|
1.27
|
||||||||
|
Forfeited
|
(10,770
|
)
|
3.83
|
2.17
|
||||||||
|
Outstanding, December 31, 2016
|
1,637,762
|
2.41
|
1.23
|
|||||||||
|
Granted
|
133,819
|
14.69
|
4.41
|
|||||||||
|
Exercised
|
(923,708
|
)
|
1.55
|
0.83
|
||||||||
|
Forfeited
|
(801
|
)
|
15.37
|
4.59
|
||||||||
|
Surrendered
|
(83,400
|
)
|
1.06
|
0.54
|
||||||||
|
Outstanding, December 31, 2017
|
763,672
|
$
|
5.73
|
$
|
2.36
|
|||||||
Under the 2006 Plan, the total intrinsic value of options exercised during the years ended December 31, 2017, 2016, and 2015 was $11.9 million, $0.5 million, and less than $0.1 million, respectively. The total intrinsic value of options surrendered during the year ended December 31, 2017, was $1.0 million.
At December 31, 2017, under the 2006 Plan, the outstanding stock options’ exercise price for 102,536 options is $1.06 per share, all of which are exercisable. The outstanding stock options’ exercise price for 474,121 options is $3.83 per share, all of which are exercisable. The weighted average of the remaining lives of the outstanding stock options is approximately 0.92 years for the options with the $1.06 exercise price and 5.34 years for the options with the $3.83 exercise price. The Company estimates the expected life of these stock options is ten years from the date of grant. For the $1.06 per share options, the weighted average fair value of options was determined using the Black-Scholes model assuming a ten-year life from grant date, a current share price and exercise price of $1.06, a risk-free interest rate of 4.37%, a volatility of 30%, and no assumed dividend yield. Based on these assumptions, the fair value of these options is approximately $0.54 per share option granted. For the $3.83 per share options,
the weighted average fair value of options was determined using the Black-Scholes model assuming a ten-year life from grant date, a current share price and exercise price of $3.83, a risk-free interest rate of 3.57%, a volatility of 40%, and no assumed dividend yield. Based on these assumptions, the fair value of these options is approximately $2.17 per share option granted.
At December 31, 2017, under the 2015 Plan, the risk-free interest rate is based on the U.S. Treasury rate for the expected life at the time of grant. The expected volatility is based on the average long-term historical volatilities of peer companies. We intend to continue to consistently use the same group of publicly traded peer companies to determine expected volatility until sufficient information regarding volatility of our share price becomes available or the selected companies are no longer suitable for this purpose. Due to our limited trading history, we are using the “simplified method” to calculate expected holding periods, which represent the periods of time for which options granted are expected to be outstanding. We will continue to use this method until we have sufficient historical exercise experience to give us confidence in the reliability of our calculations. The fair values of these options were determined using the Black-Scholes option pricing model.
The following table outlines the assumptions based on the number of options granted under the 2015 Plan.
|
August
2016 Grant
|
February
2017 Grant
|
May
2017 Grant
|
||||||||||
|
Number of options granted
|
53,996
|
40,000
|
93,819
|
|||||||||
|
Options outstanding at December 31, 2017
|
53,996
|
40,000
|
93,019
|
|||||||||
|
Number exercisable at December 31, 2017
|
40,497
|
-
|
-
|
|||||||||
|
Exercise price
|
$
|
9.26
|
$
|
13.00
|
$
|
15.41
|
||||||
|
Remaining lives
|
8.58
|
9.17
|
9.42
|
|||||||||
|
Risk free interest rate
|
1.16
|
%
|
1.89
|
%
|
1.76
|
%
|
||||||
|
Expected volatility
|
25.40
|
%
|
27.44
|
%
|
26.92
|
%
|
||||||
|
Expected life
|
5.375
|
6.000
|
6.000
|
|||||||||
|
Dividend yield
|
-
|
-
|
-
|
|||||||||
|
Fair value at grant date
|
$
|
2.37
|
$
|
3.98
|
$
|
4.60
|
||||||
The Company has recorded compensation expense related to the options based on the provisions of ASC 718 under which the fixed portion of such expense is determined as the fair value of the options on the date of grant and amortized over the vesting period. The Company recorded compensation expense related to the options of approximately $0.4 million and $0.1 million for the years ended December 31, 2017 and 2016, respectively. Total unrecognized compensation expense related to options at December 31, 2017, is $0.3 million, which will be expensed over 2.0 years.
Performance-based restricted stock units (“PRSUs”) are restricted stock units subject to both performance-based and service-based vesting conditions. The number of shares of common stock a recipient will receive upon vesting of a PRSU will be calculated by reference to certain performance metrics related to the Company’s performance over a five-year period. PRSUs will vest on the measurement date, which is no more than 65 days after the performance period, provided the applicable service and performance conditions are satisfied. On March 31, 2017, the Committee granted 94,000 PRSUs to employees of the Company, all of which are unvested at December 31, 2017. The fair value of each PRSU is $15.60, the closing price of the stock on March 31, 2017, the date of grant. The Company recorded compensation expense related to the PRSUs of approximately $0.2 million in the consolidated statements of income for the years ended December 31, 2017, based on the probability of achieving the performance condition. Total unrecognized compensation expense related to these awards at December 31, 2017, is $1.2 million, which will be expensed over the service period based on the probability of achieving the performance condition.
Note 17. Unit Incentive Plans for Intrepid Brands, LLC:
Effective August 7, 2014, the Company adopted the Intrepid Brands, LLC 2014 Option Plan (“2014 Plan”) for units of ownership in Intrepid. The purpose of the 2014 Plan was to promote the success and enhance the value of the Company by linking the personal interests of the service providers (including employees, consultants, and managers) to those of Company equity holders and by providing such individuals with an incentive for outstanding performance to generate superior returns to Company equity holders.
In connection with the IPO, in May of 2016 all options outstanding under the 2014 Plan were repurchased for aggregate cash consideration of $0.7 million, which included payroll taxes (see Note 3). With the repurchase of the options, the 2014 Plan was terminated.
In January 2014, the Company issued warrants to purchase 11,000,000 units of membership interests in Intrepid (the “Intrepid Warrants”) concurrent with the 7% Senior Notes (see Note 12). This represented 40% of the Intrepid Common Units outstanding on a fully diluted basis, at a purchase price of $1.00 per unit. The warrants were exercisable beginning January 21, 2014 and were scheduled to expire on December 31, 2023.
In connection with the IPO, in May of 2016 all outstanding Intrepid Warrants were repurchased for aggregate cash consideration of approximately $5.5 million (see Note 3).
Note 18. Contingencies:
Other major tobacco companies are defendants in product liability claims. In a number of these cases, the amounts of punitive and compensatory damages sought are significant and could have a material adverse effect on our business and results of operations. The Company is a defendant in certain cases which have been dormant for many years. Plaintiffs’ counsel are in the process of voluntarily dismissing those claims.
The Company is subject to several lawsuits alleging personal injuries resulting from malfunctioning vaporizer devices and may be subject to claims in the future relating to other NewGen products. The Company is still evaluating these claims and the potential defenses to them. For example, the Company did not design or manufacture the products at issue; rather, the Company was merely the distributor. Nonetheless, there can be no assurance that the Company will prevail in these cases, and they could have a material adverse effect on the financial position, results of operations, or cash flows of the Company.
Note 19. Income Per Share:
The following is a reconciliation of the numerators and denominators of the basic and diluted EPS computations of net income:
|
December 31, 2017
|
December 31, 2016
|
December 31, 2015
|
||||||||||||||||||||||||||||||||||
|
Income
|
Shares
|
Per
Share
|
Income
|
Shares
|
Per
Share
|
Income
|
Shares
|
Per
Share
|
||||||||||||||||||||||||||||
|
Net income attributable to Turning Point Brands, Inc.
|
$
|
20,209
|
$
|
26,913
|
$
|
9,149
|
||||||||||||||||||||||||||||||
|
Basic EPS:
|
||||||||||||||||||||||||||||||||||||
|
Weighted average
|
18,989,177
|
$
|
1.06
|
16,470,352
|
$
|
1.63
|
7,198,081
|
$
|
1.27
|
|||||||||||||||||||||||||||
|
Diluted EPS:
|
||||||||||||||||||||||||||||||||||||
|
Effect of dilutive securities:
|
||||||||||||||||||||||||||||||||||||
|
Stock options and warrants
|
523,831
|
1,545,193
|
1,156,306
|
|||||||||||||||||||||||||||||||||
|
19,513,008
|
$
|
1.04
|
18,015,545
|
$
|
1.49
|
8,354,387
|
$
|
1.10
|
||||||||||||||||||||||||||||
Note 20. Segment Information:
In accordance with ASC 280, Segment Reporting, the Company has three reportable segments, (1) Smokeless products; (2) Smoking products; and (3) NewGen products. The Smokeless products segment (a) manufactures and markets moist snuff and (b) contracts for and markets chewing tobacco products. The Smoking products segment (a) imports and markets cigarette papers, tubes, and related products; (b) imports and markets finished cigars, MYO cigar tobaccos, and cigar wraps; and (c) processes, packages, and markets pipe tobaccos. The NewGen products segment (a) markets e-cigarettes, e-liquids, vaporizers, and other related products and (b) distributes a wide assortment of vaping products to non-traditional retail outlets via VaporBeast and Vapor Shark. Smokeless and Smoking products are distributed primarily through wholesale distributors in the United States while NewGen products are distributed primarily through e-commerce to non-traditional retail outlets in the United States. The Other segment includes the assets of the Company not assigned to one of the three reportable segments such as deferred taxes and deferred financing fees for the Revolving Credit Facility. The Company had no customer that accounted for more than 10% of gross sales in 2017, 2016, or 2015.
The accounting policies of these segments are the same as those of the Company. Segment data includes a charge allocating corporate costs to the three reportable segments based on their respective net sales. The Company evaluates the performance of its segments and allocates resources to them based on operating income.
The table below presents financial information about reported segments:
|
December 31,
|
||||||||||||
|
2017
|
2016
|
2015
|
||||||||||
|
Net sales
|
||||||||||||
|
Smokeless products
|
$
|
84,560
|
$
|
77,913
|
$
|
74,293
|
||||||
|
Smoking products
|
109,956
|
111,005
|
105,898
|
|||||||||
|
NewGen products
|
91,261
|
17,310
|
17,065
|
|||||||||
|
$
|
285,777
|
$
|
206,228
|
$
|
197,256
|
|||||||
|
Operating income (loss)
|
||||||||||||
|
Smokeless products
|
$
|
19,099
|
$
|
14,501
|
$
|
17,312
|
||||||
|
Smoking products
|
28,500
|
29,790
|
28,030
|
|||||||||
|
NewGen products
|
1,943
|
(510
|
)
|
(636
|
)
|
|||||||
|
Other
(1)
|
(42
|
)
|
(196
|
)
|
(195
|
)
|
||||||
|
$
|
49,500
|
$
|
43,585
|
$
|
44,511
|
|||||||
|
Interest expense
|
(16,889
|
)
|
(26,621
|
)
|
(34,284
|
)
|
||||||
|
Investment income
|
438
|
768
|
-
|
|||||||||
|
Loss on extinguishment of debt
|
(6,116
|
)
|
(2,824
|
)
|
-
|
|||||||
|
Income before income taxes
|
26,933
|
14,908
|
10,227
|
|||||||||
|
Capital expenditures
|
||||||||||||
|
Smokeless products
|
$
|
1,928
|
$
|
2,975
|
$
|
1,602
|
||||||
|
NewGen products
|
93
|
232
|
-
|
|||||||||
|
$
|
2,021
|
$
|
3,207
|
$
|
1,602
|
|||||||
|
Depreciation and amortization
|
||||||||||||
|
Smokeless products
|
$
|
1,400
|
$
|
1,227
|
$
|
1,059
|
||||||
|
NewGen products
|
928
|
58
|
-
|
|||||||||
|
$
|
2,328
|
$
|
1,285
|
$
|
1,059
|
|||||||
|
December 31,
|
||||||||
|
2017
|
2016
|
|||||||
|
Assets
|
||||||||
|
Smokeless products
|
$
|
94,559
|
$
|
89,835
|
||||
|
Smoking products
|
141,869
|
146,933
|
||||||
|
NewGen products
|
44,914
|
39,415
|
||||||
|
Other
(1)
|
935
|
8,837
|
||||||
|
$
|
282,277
|
$
|
285,020
|
|||||
(1) '"Other" includes our costs and assets that are not assigned to our three reportable segments, such as intercompany transfers, deferred taxes, and investments in subsidiaries. All goodwill has been allocated to our reportable segments.
Net Sales: Domestic and Foreign
The following table shows a breakdown of consolidated net sales between domestic and foreign.
|
2017
|
2016
|
2015
|
||||||||||
|
Domestic
|
$
|
272,927
|
$
|
196,348
|
$
|
188,647
|
||||||
|
Foreign
|
12,850
|
9,880
|
8,609
|
|||||||||
|
Total
|
$
|
285,777
|
$
|
206,228
|
$
|
197,256
|
||||||
Note 21. Selected Quarterly Financial Information (Unaudited):
The following table presents the quarterly operating results:
|
1st
|
2nd
|
3rd
|
4th
|
|||||||||||||
|
2017
|
||||||||||||||||
|
Net sales
|
$
|
66,788
|
$
|
72,086
|
$
|
73,340
|
$
|
73,563
|
||||||||
|
Gross profit
|
$
|
27,666
|
31,995
|
32,930
|
32,278
|
|||||||||||
|
Net income attributable to Turning Point Brands, Inc.
|
$
|
1,877
|
(1)
|
7,439
|
7,374
|
3,519
|
||||||||||
|
Basic net income per share
|
0.10
|
0.39
|
0.39
|
0.18
|
||||||||||||
|
Diluted net income per share
|
0.10
|
0.38
|
0.38
|
0.18
|
||||||||||||
|
2016
|
||||||||||||||||
|
Net sales
|
$
|
49,866
|
$
|
51,581
|
$
|
50,959
|
$
|
53,822
|
||||||||
|
Gross profit
|
24,647
|
24,874
|
24,618
|
26,217
|
||||||||||||
|
Net income
|
2,234
|
799
|
(2)
|
6,793
|
17,087
|
(3)
|
||||||||||
|
Basic net income per share
|
0.31
|
0.05
|
0.38
|
0.93
|
||||||||||||
|
Diluted net income per share
|
0.27
|
0.05
|
0.34
|
0.87
|
||||||||||||
|
(1)
|
Includes $3,792 of loss on extinguishment of debt, net of tax of $2,324
|
|
(2)
|
Includes $2,824 of loss on extinguishment of debt, net of tax of $0
|
|
(3)
|
Includes $12,719 of deferred income tax benefits
|
The amounts presented in the table above are computed independently for each quarter. As a result, their sum may not equal the total year amounts.
Note 22. Dividends:
On November 9, 2017, the Company’s Board of Directors approved the initiation of a cash dividend to shareholders. The initial quarterly dividend of $0.04 per common share was paid on December 15, 2017 to shareholders of record at the close of business on November 27, 2017.
Dividends, among other disbursements assets, are classified as restricted payments within the 2017 Credit Facility. The Company is generally permitted to make restricted payments provided that, at the time of payment, or as a result of payment, the Company is not in default. Additional restrictions limit the aggregate amount of restricted, quarterly dividends during a fiscal year to the aggregate amount of mandatory and voluntary principal payments made on the priority term loans during the fiscal year.
Note 23. Subsequent Events:
On March 7, 2018, the Company entered into an agreement with
Fifth Third Bank, as administrative agent, and other lenders (the “2018 First Lien Credit Facility”) and an agreement with Prospect Capital Corporation, as administrative agent, and other lenders (the “2018 Second Lien Credit Facility,” and, together with the 2018 First Lien Credit Facility, the “2018 Credit Facility”), to amend and extend the 2017 Credit Facility. The Company is still evaluating the impact of the transaction; however, it expects a loss on extinguishment of debt of approximately $2.4 million in the first quarter of 2018.
The $250 million 2018 Credit Facility consists of a First Lien Credit Facility, with a $50 million Revolving Credit Facility and a $160 million First Lien Term Loan, and a $40 million Second Lien Term Loan. The maturity of the First Lien Term Loan was extended to March 7, 2023, and the maturity of the Second Lien Term Loan was extended to March 7, 2024. The 2018 First Lien Credit Facility retains the accordion feature allowing the Company to borrow up to an additional $40 million upon the satisfaction of certain conditions, including obtaining commitments from one or more lenders. Borrowings under the Revolving Credit Facility may be used for general corporate purposes, including acquisitions.
The 2018 Credit Facility repaid the 2017 Second Out Term Loan, which had an interest rate of LIBOR plus 6% (subject to a floor of 1.00%) and required quarterly required payments of $0.1 million. The amendment also repaid $15 million of the 2017 Second Lien Term Loan.
The 2018 Credit Facility First Lien Term Loan and the Revolving Credit Facility bear interest at LIBOR plus a spread of 2.75% to 3.50% based on the Company’s senior leverage ratio. The First Lien Term Loan has quarterly required payments of $1.9 million beginning June 30, 2018, increasing to $2.9 million on June 30, 2020, and increasing to $3.9 million on June 30, 2022. The 2018 First Lien Credit Facility contains certain financial covenants including maximum senior leverage ratio of 3.50x with step-downs to 3.00x, a maximum total leverage ratio of 4.50x with step-downs to 4.00x, and a minimum fixed charge coverage ratio of 1.20x.
The 2018 Credit Facility Second Lien Term Loan bears interest at a rate of LIBOR plus 7.00%. The Second Lien Credit Facility contains certain financial covenants including a maximum senior leverage ratio of 4.00x with step-downs to 3.50x, a maximum total leverage ratio of 5.00x with step-downs to 4.50x, and a minimum fixed charge coverage ratio of 1.10x.
None.
Disclosure Controls and Procedures
As of December 31, 2017, the Company’s management, with participation of the Company’s President and Chief Executive Officer (“CEO”) and Chief Financial Officer (“CFO”), evaluated the effectiveness of the Company’s disclosure controls and procedures as defined in Exchange Act Rules 13a-15(e) and 15d-15(e). Based on that evaluation, the CEO and CFO concluded that the Company’s disclosure controls and procedures were effective as of December 31, 2017.
Internal Control
Pursuant to Section 404 of the Sarbanes-Oxley Act of 2002, we have included a report that provides management’s assessment of our internal control over financial reporting as part of this Annual Report on Form 10-K for the year ended December 31, 2017. Management’s report is included below under the caption entitled “Management’s Report on Internal Control Over Financial Reporting,” and is incorporated herein by reference. Our independent registered public accounting firm is not yet required to formally attest to the effectiveness of our internal controls over financial reporting and will not be required to do so for as long as we are an “emerging growth company” pursuant to the provisions of the Jumpstart Our Business Startups Act of 2012.
Changes in Internal Controls over Financial Reporting
There were no changes in the Company’s internal controls over financial reporting during the fourth quarter of 2017 that have materially affected, or are reasonably likely to materially affect, Turning Point Brand, Inc.’s internal controls over financial reporting.
Management’s Report on Internal Control over Financial Reporting
The consolidated financial statements appearing in this Annual Report have been prepared by the management that is responsible for their preparation, integrity, and fair presentation. The statements have been prepared in accordance with U.S. generally accepted accounting principles, which requires management to make estimates and assumptions that affect the amounts reported in the consolidated financial statements and accompanying notes.
Our management is responsible for establishing and maintaining adequate internal control over financial reporting (as defined in Rules 13a-15(f) and 15d-15(f) of the Securities Exchange Act of 1934, as amended). Our internal control system was designed to provide reasonable assurance regarding the reliability of financial reporting and the preparation of financial statements for external purposes in accordance with generally accepted accounting principles.
All internal control systems, no matter how well designed, have inherent limitations. Therefore, even those systems determined to be effective can provide only reasonable assurance with respect to financial statement preparation and presentation. Further, because of changes in conditions, the effectiveness of an internal control system may vary over time.
Under the supervision and with the participation of our management, including our President and Chief Executive Officer, we conducted an evaluation of the effectiveness of our internal control over financial reporting as of December 31, 2017, based on the framework in Internal Control — Integrated Framework issued by the Committee of Sponsoring Organizations of the Treadway Commission (2013 framework) (COSO). Based on that evaluation, our management concluded our internal control over financial reporting was effective based on the criteria described above as of December 31, 2017.
Our independent registered public accounting firm is not yet required to formally attest to the effectiveness of our internal controls over financial reporting and will not be required to do so for as long as we are an “emerging growth company” pursuant to the provisions of the Jumpstart Our Business Startups Act of 2012.
|
/s/ Lawrence S. Wexler
|
/s/ Mark A. Stegeman
|
|||
|
Lawrence S. Wexler
|
Mark A. Stegeman
|
|||
|
President and Chief Executive Officer
|
Chief Financial Officer
|
|||
|
Date: March 8, 2018
|
March 8, 2018
|
None.
PART III
The information required for this Item is incorporated by reference from our Proxy Statement to be filed in connection with our 2018 Annual Meeting of Stockholders within 120 days after the end of the fiscal year ended December 31, 2017.
The information required for this Item is incorporated by reference from our Proxy Statement to be filed in connection with our 2018 Annual Meeting of Stockholders within 120 days after the end of the fiscal year ended December 31, 2017.
The information required for this Item is incorporated by reference from our Proxy Statement to be filed in connection with our 2018 Annual Meeting of Stockholders within 120 days after the end of the fiscal year ended December 31, 2017.
The information required for this Item is incorporated by reference from our Proxy Statement to be filed in connection with our 2018 Annual Meeting of Stockholders within 120 days after the end of the fiscal year ended December 31, 2017.
The information required for this Item is incorporated by reference from our Proxy Statement to be filed in connection with our 2018 Annual Meeting of Stockholders within 120 days after the end of the fiscal year ended December 31, 2017.
PART IV
| a) | Financial Information |
| (1) |
Financial Statements: See “Index to Consolidated Financial Statements” in Part II, Item 8 of this Annual Report on Form 10-K.
|
|
| (2) | Financial Statement Schedule: Information required by this item is included within the consolidated financial statements or notes in Item 8 of this Annual Report on Form 10-K. | |
| (3) | Exhibits – See (b) below |
| b) | Exhibits | Index to Exhibits |
Index to Exhibits
|
Exhibit No.
|
Description
|
|
Stock Purchase Agreement dated as of November 17, 2016, by and among National Tobacco Company, L.P., the Sellers named therein and Smoke Free Technologies, Inc. (incorporated by reference to Exhibit 2.1 to the Registrant’s Current Report on Form 8-K filed on November 17, 2016).
|
|
|
Second Amended and Restated Certificate of Incorporation of Turning Point Brands, Inc. (incorporated by reference to Exhibit 3.1 to the Registrant’s Current Report on Form 8-K filed on May 16, 2016).
|
|
|
Amended and Restated By-laws (incorporated by reference to Exhibit 3.3 to the Registrant’s Registration Statement on Form S-1/A (File No. 333-207816) filed on November 24, 2015).
|
|
|
Registration Rights Agreement of Turning Point Brands, Inc. dated May 10, 2016, between Turning Point Brands, Inc. and the Stockholders named therein (incorporated by reference to Exhibit 4.1 to the Registrant’s Current Report on Form 8-K filed on May 16, 2016).
|
|
|
Turning Point Brands, Inc. 2015 Equity Incentive Plan (the “2015 Plan”) (incorporated by reference to Exhibit 10.1 to the Registrant’s Registration Statement on Form S-1/A (File No. 333-207816) filed on November 5, 2015).
|
|
|
Form of Stock Option Award Agreement under the 2015 Plan (incorporated by reference to Exhibit 10.2 to the Registrant’s Annual Report on Form 10-K filed on March 13, 2017).
|
|
|
2006 Equity Incentive Plan of Turning Point Brands, Inc. (incorporated by reference to Exhibit 10.3 to the Registrant’s Registration Statement on Form S-1/A (File No. 333-207816) filed on November 5, 2015).
|
|
|
Amendment No. 1 to the 2006 Equity Incentive Plan of North Atlantic Holding Company, Inc. (incorporated by reference to Exhibit 10.4 to the Registrant’s Annual Report on Form 10-K filed on March 13, 2017).
|
|
|
Amendment No. 2 to the 2006 Equity Incentive Plan of North Atlantic Holding Company, Inc. (incorporated by reference to Exhibit 10.5 to the Registrant’s Annual Report on Form 10-K filed on March 13, 2017).
|
|
|
Amendment No. 3 to the 2006 Equity Incentive Plan of North Atlantic Holding Company, Inc. (incorporated by reference to Exhibit 10.1 to the Registrant’s Current Report on Form 8-K filed on February 7, 2017).
|
|
|
Amendment No. 4 to the 2006 Equity Incentive Plan of North Atlantic Holding Company, Inc. (incorporated by reference to Exhibit 10.54 to the Registrant’s Annual Report on Form 10-K filed on March 13, 2017).
|
|
|
Form of Award Agreement under the 2006 Plan (incorporated by reference to Exhibit 10.4 to the Registrant’s Registration Statement on Form S-1/A (File No. 333-207816) filed on November 5, 2015).
|
|
|
Form of Cash-Out Agreement under the 2006 Plan (incorporated by reference to Exhibit 10.2 to the Registrant’s Current Report on Form 8-K filed on February 7, 2017).
|
|
|
Form of Indemnification Agreement between Turning Point Brands, Inc. and certain directors and officers (incorporated by reference to Exhibit 10.10 to the Registrant’s Registration Statement on Form S-1/A (File No. 333-207816) filed on November 24, 2015).
|
|
|
Form of Indemnification Agreement between Turning Point Brands, Inc. and Standard General Master Fund, L.P. (incorporated by reference to Exhibit 10.2 to the Registrant’s Registration Statement on Form S-1/A (File No. 333-207816) filed on November 24, 2015).
|
|
|
Employment Agreement between Turning Point Brands, Inc. and Lawrence Wexler dated November 23, 2015 (incorporated by reference to Exhibit 10.9 to the Registrant’s Current Report on Form 8-K filed on May 16, 2016).
|
|
|
Employment Agreement between Turning Point Brands, Inc. and James Dobbins dated November 23, 2015 (incorporated by reference to Exhibit 10.10 to the Registrant’s Current Report on Form 8-K filed on May 16, 2016).
|
|
Employment Agreement between Turning Point Brands, Inc. and Mark Stegeman, dated November 23, 2015 (incorporated by reference to Exhibit 10.11 to the Registrant’s Current Report on Form 8-K filed on May 16, 2016).
|
|
|
Amendment No. 1 to the Amended and Restated Employment Agreement between Turning Point Brands, Inc. and Thomas F. Helms, Jr. dated December 4, 2015 (incorporated by reference to Exhibit 10.8 to the Registrant’s Current Report on Form 8-K filed on May 16, 2016).
|
|
|
Contract Manufacturing, Packaging and Distribution Agreement dated as of September 4, 2008, between National Tobacco Company, L.P. and Swedish Match North America, Inc. (incorporated by reference to Exhibit 10.17 to the Registrant’s Registration Statement on Form S-1/A (File No. 333-207816) filed on November 24, 2015).
|
|
|
Amended and Restated Distribution and License Agreement dated as of November 30, 1992, between Bolloré Technologies, S.A. and North Atlantic Trading Company, Inc., as predecessor to North Atlantic Operating Company, Inc. (U.S.) (incorporated by reference to Exhibit 10.2 to Amendment No. 2 to the Registrant’s Registration Statement (Reg. No. 333-31931) on Form S-4/A filed with the Commission on September 17, 1997).
|
|
|
Amended and Restated Distribution and License Agreement dated as of November 30, 1992, between Bolloré Technologies, S.A. and North Atlantic Trading Company, Inc., as predecessor to North Atlantic Operating Company, Inc. (Canada) (incorporated by reference to Exhibit 10.4 to Amendment No. 2 to the Registrant’s Registration Statement (Reg. No. 333-31931) on Form S-4/A filed with the Commission on September 17, 1997).
|
|
|
Amendment to the Amended and Restated Distribution and License Agreement dated March 31, 1993 between Bolloré Technologies, S.A. and North Atlantic Trading Company, Inc. (U.S. & Canada) (incorporated by reference to Exhibit 10.22 to the Registrant’s Registration Statement on Form S-1 (File No. 333-207816) filed on November 5, 2015).
|
|
|
Amendment to the Amended and Restated Distribution and License Agreements dated June 10, 1996, between Bolloré Technologies, S.A. and North Atlantic Trading Company, Inc. (U.S. & Canada) (incorporated by reference to Exhibit 10.23 to the Registrant’s Registration Statement on Form S-1 (File No. 333-207816) filed on November 5, 2015).
|
|
|
Amendment to the Amended and Restated Distribution and License Agreement dated September 1996, between Bolloré Technologies, S.A. and North Atlantic Trading Company, Inc. (U.S. & Canada) (incorporated by reference to Exhibit 10.24 to the Registrant’s Registration Statement on Form S-1 (File No. 333-207816) filed on November 5, 2015).
|
|
|
Restated Amendment to the Amended and Restated Distribution and License Agreement between Bolloré Technologies, S.A. and North Atlantic Operating Company, Inc. dated June 25, 1997 (U.S. & Canada) (incorporated by reference to Exhibit 10.5 to Amendment No. 2 to the Registrant’s Registration Statement (Reg. No. 333-31931) on Form S-4/A filed with the Commission on September 17, 1997).
|
|
|
Amendment to the Amended and Restated Distribution and License Agreement dated October 22, 1997, between Bolloré Technologies, S.A. and North Atlantic Operating Company, Inc. (U.S. & Canada) (incorporated by reference to Exhibit 10.31 to the Registrant’s Annual Report on Form 10-K for the fiscal year ended December 31, 1997).
|
|
|
Amendment to the Amended and Restated Distribution and License Agreement dated June 19, 2002, between Bolloré S.A. and North Atlantic Operating Company, Inc. (U.S. & Canada) (incorporated by reference to Exhibit 10.31 to the Registrant’s Registration Statement on Form S-1 (File No. 333-207816) filed on November 5, 2015).
|
|
|
Trademark Consent Agreement, dated March 26, 1997, between Bolloré Technologies, S.A. and North Atlantic Trading Company, Inc. (incorporated by reference to Exhibit 10.25 to the Registrant’s Registration Statement on Form S-1 (File No. 333-207816) filed on November 5, 2015).
|
|
|
Amendment to the Amended and Restated Distribution and License Agreement dated February 28, 2005, between Bolloré S.A. and North Atlantic Operating Company, Inc. (U.S. & Canada) (incorporated by reference to Exhibit 10.33 to the Registrant’s Registration Statement on Form S-1 (File No. 333-207816) filed on November 5, 2015).
|
|
Amendment to the Amended and Restated Di stribution and License Agreement dated April 20, 2006, between Bolloré S.A. and North Atlantic Operating Company, Inc. (U.S. & Canada) (incorporated by reference to Exhibit 10.1 to the Registrant’s Quarterly Report on Form 10-Q for the fiscal quarter ended March 31, 2006).
|
|
|
Amendment to the Amended and Restated Distribution and License Agreement dated March 10, 2010, between Bolloré S.A. and North Atlantic Operating Company, Inc. (U.S. & Canada) (incorporated by reference to Exhibit 10.35 to the Registrant’s Registration Statement on Form S-1 (File No. 333-207816) filed on November 5, 2015).
|
|
|
Consent Agreement dated as of April 4, 1997, between Bolloré Technologies, S.A. and North Atlantic Trading Company, Inc. (incorporated by reference to Exhibit 10.26 to the Registrant’s Registration Statement on Form S-1 (File No. 333-207816) filed on November 5, 2015).
|
|
|
Amendment No. 1 to Consent Agreement dated as of April 9, 1997, between Bolloré Technologies, S.A. and North Atlantic Operating Company, Inc. (incorporated by reference to Exhibit 10.27 to the Registrant’s Registration Statement on Form S-1 (File No. 333-207816) filed on November 5, 2015).
|
|
|
Amendment No. 2 to Consent Agreement dated as of June 25, 1997, between Bolloré Technologies, S.A. and North Atlantic Operating Company, Inc. (incorporated by reference to Exhibit 10.28 to the Registrant’s Registration Statement on Form S-1 (File No. 333-207816) filed on November 5, 2015).
|
|
|
Trademark Consent Agreement dated July 31, 2003, among Bolloré Technologies, S.A., North Atlantic Trading Company, Inc. and North Atlantic Operating Company, Inc. (incorporated by reference to Exhibit 10.32 to the Registrant’s Registration Statement on Form S-1 (File No. 333-207816) filed on November 5, 2015).
|
|
|
Amendment No. 2 to Trademark Consent Agreement dated December 17, 2012, between Bolloré S.A. and North Atlantic Operating Company, Inc. (incorporated by reference to Exhibit 10.36 to the Registrant’s Registration Statement on Form S-1 (File No. 333-207816) filed on November 5, 2015).
|
|
|
License and Distribution Agreement dated March 19, 2013 between Bolloré S.A. and North Atlantic Operating Company, Inc. (incorporated by reference to Exhibit 10.37 to the Registrant’s Registration Statement on Form S-1 (File No. 333-207816) filed on November 5, 2015).
|
|
|
Distributors Supply Agreement dated as of April 1, 2013, between National Tobacco Company, L.P. and JJA Distributors, LLC (incorporated by reference to Exhibit 10.38 to the Registrant’s Registration Statement on Form S-1/A (File No. 333-207816) filed on November 24, 2015).
|
|
|
Amendment No. 1 to the Amended and Restated Exchange and Stockholders’ Agreement dated April 28, 2016 (incorporated by reference to Exhibit 10.44 to the Registrant’s Registration Statement on Form S-1/A (File No. 333-207816) filed on April 28, 2016).
|
|
|
First Lien Credit Agreement dated as of February 17, 2017, by and among Turning Point Brands, Inc., Fifth Third Bank, and the lenders party thereto (incorporated by reference to Exhibit 10.1 to the Registrant’s Current Report on Form 8-K filed on February 17, 2017).
|
|
|
Second Lien Credit Agreement dated as of February 17, 2017, by and among Turning Point Brands, Inc., as the Borrower, Prospect Capital Corporation, as administrative agent, and the lenders party thereto (incorporated by reference to Exhibit 10.2 to the Registrant’s Current Report on Form 8-K filed on February 17, 2017).
|
|
|
First Lien Guaranty and Security Agreement dated as of February 17, 2017, by and among Turning Point Brands, Inc., Fifth Third Bank, and the lenders party thereto (incorporated by reference to Exhibit 10.3 to the Registrant’s Current Report on Form 8-K filed on February 17, 2017).
|
|
|
Second Lien Guaranty and Security Agreement dated as of February 17, 2017, by and among Turning Point Brands, Inc., Prospect Capital Corporation, and the lenders party thereto (incorporated by reference to Exhibit 10.4 to the Registrant’s Current Report on Form 8-K filed on February 17, 2017).
|
|
|
Intercreditor Agreement dated as of February 17, 2017, by and among Turning Point Brands, Inc., the other grantors party thereto, Fifth Third Bank, as first lien collateral agent, and Prospect Capital Corporation, as second lien collateral agent (incorporated by reference to Exhibit 10.5 to the Registrant’s Current Report on Form 8-K filed on February 17, 2017).
|
|
Amended and Restated First Lien Credit Agreement, dated as of March 7, 2018, by and among Turning Point Brands, Inc. and its subsidiaries, as the obligors, Fifth Third Bank, as administrative agent, and the lenders party thereto (incorporated by reference to Exhibit 10.1 to the Registrant’s Current Report on Form 8-K filed on March 8, 2018).
|
|
|
Amended and Restated Second Lien Credit Agreement, dated as of March 7, 2018, by and among Turning Point Brands, Inc. and its subsidiaries, as obligors, Prospect Capital Corporation, as administrative agent, and the lenders party thereto (incorporated by reference to Exhibit 10.2 to the Registrant’s Current Report on Form 8-K filed on March 8, 2018).
|
|
|
Omnibus Amendment, Reaffirmation Agreement and Joinder, dated as of March 7, 2018, by and among Turning Point Brands, Inc. and its subsidiaries, as the Grantors, Fifth Third Bank, as administrative agent, and the lenders party thereto (incorporated by reference to Exhibit 10.3 to the Registrant’s Current Report on Form 8-K filed on March 8, 2018).
|
|
|
Second Lien Omnibus Amendment, Reaffirmation Agreement and Joinder, dated as of March 7, 2018, by and among Turning Point Brands, Inc. and its subsidiaries, as the Grantors, Fifth Third Bank, as administrative agent, and the lenders party thereto (incorporated by reference to Exhibit 10.4 to the Registrant’s Current Report on Form 8-K filed on March 8, 2018).
|
|
|
First Amendment to Second Lien Intercreditor Agreement, dated as of March 7, 2018, by and among Turning Point Brands, Inc., and the other grantors party thereto, Fifth Third Bank, as first lien collateral agent, and Prospect Capital Corporation, as second lien collateral agent (incorporated by reference to Exhibit 10.5 to the Registrant’s Current Report on Form 8-K filed on March 8, 2018).
|
|
|
Form of Installment Note issued to VaporBeast Stockholders on November 30, 2016 (incorporated by reference to Exhibit 10.1 to the Registrant’s Current Report on Form 8-K filed December 2, 2016).
|
|
|
Form of 18-Month Note issued to VaporBeast Stockholders on November 30, 2016 (incorporated by reference to Exhibit 10.2 to the Registrant’s Current Report on Form 8-K filed December 2, 2016).
|
|
|
Form of Guaranty to VaporBeast Shareholders dated November 17, 2016 (incorporated by reference to Exhibit 10.3 to the Registrant’s Current Report on Form 8-K filed December 2, 2016).
|
|
|
Subsidiaries of Turning Point Brands, Inc.*
|
|
|
Consent of RSM US, LLP.*
|
|
|
Certification of Principal Executive Officer pursuant to Section 302 of the Sarbanes-Oxley Act of 2002.*
|
|
|
Certification of Principal Financial Officer pursuant to Section 302 of the Sarbanes-Oxley Act of 2002.*
|
|
|
Certifications of Principal Executive Officer and Principal Financial Officer pursuant to 18 U.S.C. Section 1350, as adopted pursuant to Section 906 of the Sarbanes-Oxley Act of 2002.*
|
|
|
101
|
XBRL (eXtensible Business Reporting Language). The following materials from Turning Point Brands, Inc.’s Annual Report on Form 10-K for the years ended December 31, 2017, 2016, and 2015, formatted in XBRL: (i) consolidated balance sheets, (ii) consolidated statements of income, (iii) consolidated statements of comprehensive income, (iv) consolidated statements of changes in stockholder’s equity (deficit), (v) consolidated statements of cash flows, and (vi) notes to the consolidated financial statements.*
|
|
*
|
Filed herewith
|
|
†
|
Compensatory plan or arrangement
|
Not applicable.
Pursuant to the requirements of Section 13 or 15(d) of the Securities Exchange Act of 1934, as amended, the registrant has duly caused this report to be signed on its behalf by the undersigned thereunto duly authorized, on March 8, 2018.
| TURNING POINT BRANDS, INC. | |||
| By: |
/s/ Lawrence S. Wexler
|
||
| Name: Lawrence S. Wexler | |||
|
Title: Chief Executive Officer
|
|||
| By: |
/s/ Mark A. Stegeman
|
||
| Name: Mark A. Stegeman | |||
|
Title: Chief Financial and Accounting Officer
|
|||
Pursuant to the requirements of the Securities and Exchange Act of 1934, as amended, this report has been signed below by the following persons on behalf of the registrant and in the capacities and on the dates indicated.
|
Signature
|
Title
|
Date
|
|||||
|
By:
|
/s/ Lawrence S. Wexler
|
Director, Chief Executive Officer
|
March 8, 2018
|
||||
|
Lawrence S. Wexler
|
|||||||
|
By:
|
/s/ Mark A. Stegeman
|
Chief Financial and Accounting Officer
|
March 8, 2018
|
||||
|
Mark A. Stegeman
|
|||||||
|
By:
|
/s/ Thomas F. Helms, Jr.
|
Chairman of the Board of Directors
|
March 8, 2018
|
||||
|
Thomas F. Helms, Jr.
|
|||||||
|
By:
|
/s/ Gregory H. A. Baxter
|
Director
|
March 8, 2018
|
||||
|
Gregory H. A. Baxter
|
|||||||
|
By:
|
/s/ H. C. Charles Diao
|
Director
|
March 8, 2018
|
||||
|
H. C. Charles Diao
|
|||||||
|
By:
|
/s/ David Glazek
|
Director
|
March 8, 2018
|
||||
|
David Glazek
|
|||||||
|
By:
|
/s/ George W. Hebard III
|
Director
|
March 8, 2018
|
||||
|
George W. Hebard III
|
|||||||
|
By:
|
/s/ Arnold Zimmerman
|
Director
|
March 8, 2018
|
||||
|
Arnold Zimmerman
|
86
TABLE OF CONTENTS
Part IItem 1. BusinessItem 1A. Risk FactorsItem 1B. Unresolved Staff CommentsItem 2. PropertiesItem 3. Legal ProceedingsItem 4. Mine Safety DisclosuresPart IIItem 5. Market For Registrant S Common Equity, Related Stockholder Matters and Issuer Purchases Of Equity SecuritiesItem 6. Selected Financial DataItem 7. Management S Discussion and Analysis Of Financial Condition and Results Of OperationsItem 7A. Quantitative and Qualitative Disclosures About Market RiskItem 8. Financial Statements and Supplementary DataNote 1. Organizations and Basis Of Presentation:Note 2. Summary Of Significant Accounting Policies:Note 3. Initial Public Offering ( Ipo ):Note 4. Acquisitions:Note 5. Foreign Exchange Contracts:Note 6. Fair Value Of Financial Instruments:Note 7. Inventories:Note 8. Property, Plant and Equipment:Note 9. Goodwill and Other Intangible Assets:Note 10. Deferred Financing Costs:Note 11. Accrued Liabilities:Note 12. Notes Payable and Long-term Debt:Note 13. Income Taxes:Note 14. Pension and Postretirement Benefit Plans:Note 15. Lease Commitments:Note 16. Share Incentive Plans:Note 17. Unit Incentive Plans For Intrepid Brands, Llc:Note 18. Contingencies:Note 19. Income Per Share:Note 20. Segment Information:Note 21. Selected Quarterly Financial Information (unaudited):Note 22. Dividends:Note 23. Subsequent Events:Item 9. Changes in and Disagreements with Accountants on Accounting and Financial DisclosureItem 9A. Controls and ProceduresItem 9B. Other InformationPart IIIItem 10. Directors, Executive Officers and Corporate GovernanceItem 11. Executive CompensationItem 12. Security Ownership Of Certain Beneficial Owners and Management and Related Stockholder MattersItem 13. Certain Relationships and Related Transactions, and Director IndependenceItem 14. Principal Accountant Fees and ServicesPart IVItem 15. Exhibits and Financial Statement SchedulesItem 16. Form 10-k Summary