TAPESTRY, INC.
10-Ks and 10-Qs
|
|
|
|
|
|
|
|
|
|
|
|
|
|
|
|
|
|
|
|
|
|
|
|
|
|
|
|
|
|
|
|
|
|
|
|
|
|
|
|
|
|
|
|
|
|
|
|
|
|
|
|
|
|
|
|
UNITED STATES
SECURITIES AND EXCHANGE COMMISSION
Washington, D.C. 20549
FORM 10-K
|
þ
|
|
ANNUAL REPORT PURSUANT TO SECTION 13 OR 15(d) OF THE SECURITIES EXCHANGE ACT OF 1934
|
For the Fiscal Year Ended
June 28, 2014
OR
|
o
|
|
TRANSITION REPORT PURSUANT TO SECTION 13 OR 15(d) OF THE SECURITIES EXCHANGE ACT OF 1934
|
Commission file number: 1-16153
Coach, Inc.
(Exact name of registrant as specified in its charter)
|
Maryland
|
|
52-2242751
|
|
(State or other jurisdiction of incorporation or organization)
|
|
(I.R.S. Employer Identification No.)
|
516 West 34th Street, New York, NY 10001
(Address of principal executive offices); (Zip Code)
(212) 594-1850
(Registrant’s telephone number, including area code)
Securities Registered Pursuant to Section 12(b) of the Act:
|
Title of Each Class:
|
|
Name of Each Exchange on which Registered
|
|
Common Stock, par value $.01 per share
|
|
New York Stock Exchange
|
Securities Registered Pursuant to Section 12(g) of the Act: None
Indicate by check mark if the registrant is a well-known seasoned issuer, as defined in Rule 405 of the Securities Act.Yes
þ
No
o
Indicate by check mark if the registrant is not required to file reports pursuant to Section 13 or Section 15(d) of the Act.Yes
o
No
þ
Indicate by check mark whether the registrant (1) has filed all reports required to be filed by Section 13 or 15(d) of the Securities Exchange Act of 1934 during the preceding 12 months (or for such shorter period that the registrant was required to file such reports), and (2) has been subject to such filing requirements for the past 90 days. Yes
þ
No
o
Indicate by check mark whether the registrant has submitted electronically and posted on its corporate Web site, if any, every Interactive Data File required to be submitted and posted pursuant to Rule 405 of Regulation S-T (§232.405 of this chapter) during the preceding 12 months (or for such shorter period that the registrant was required to submit and post such files). Yes
þ
No
o
Indicate by check mark if disclosure of delinquent filers pursuant to Item 405 of Regulation S-K (§229.405 of this chapter) is not contained herein, and will not be contained, to the best of registrant's knowledge, in definitive proxy or information statements incorporated by reference in Part III of this Form 10-K or any amendment to this Form 10-K.
o
Indicate by check mark whether the registrant is a large accelerated filer, an accelerated filer, a non-accelerated filer, or a smaller reporting company. See the definitions of “large accelerated filer”, “accelerated filer” and “smaller reporting company” in Rule 12b-2 of the Exchange Act.
|
Large accelerated filer
þ
|
|
Accelerated filer
o
|
|
Non-accelerated filer
o
|
|
Smaller reporting company
o
|
Indicate by check mark whether the registrant is a shell Company (as defined in Rule 12b-2 of the Act).Yes
o
No
þ
The aggregate market value of Coach, Inc. common stock held by non-affiliates as of December 27, 2013 (the last business day of the most recently completed second fiscal quarter) was approximately
$15.5 billion
. For purposes of determining this amount only, the registrant has excluded shares of common stock held by directors and officers. Exclusion of shares held by any person should not be construed to indicate that such person possesses the power, direct or indirect, to cause the direction of the management or policies of the registrant, or that such person is controlled by or under common control with the registrant.
On
August 1, 2014
, the Registrant had
274,631,764
shares of common stock outstanding.
DOCUMENTS INCORPORATED BY REFERENCE
|
Documents
|
|
Form 10-K Reference
|
|
Proxy Statement for the 2014 Annual Meeting of Stockholders
|
|
Part III, Items 10 – 14
|
COACH, INC.
TABLE OF CONTENTS
|
Page Number
|
||
|
PART I
|
||
|
PART II
|
||
|
PART III
|
||
|
PART IV
|
||
i
SPECIAL NOTE ON FORWARD-LOOKING INFORMATION
This document, and the documents incorporated by reference in this document, in our press releases and in oral statements made from time to time by us or on our behalf, contain certain "forward-looking statements" within the meaning of the Private Securities Litigation Reform Act of 1995, and are based on management’s current expectations. These forward-looking statements can be identified by the use of forward-looking terminology such as “believes,” “may,” “will,” “should,” “expect,” “confidence,” “trends,” “intend,” “estimate,” “on track,” “are positioned to,” “on course,” “opportunity,” “continue,” “project,” “guidance,” “target,” “forecast,” “anticipated,” “plan,” “potential,” the negative of these terms or comparable terms. The Company assumes no obligation to revise or update any forward-looking statements for any reason, except as required by law.
Coach, Inc.’s actual results could differ materially from the results contemplated by these forward-looking statements due to a number of factors, including those discussed in the sections of this Form 10-K filing entitled “Risk Factors” and “Management’s Discussion and Analysis of Financial Condition and Results of Operations.” These factors are not necessarily all of the important factors that could cause actual results to differ materially from those expressed in any of the forward-looking statements contained in this Form 10-K.
INFORMATION REGARDING HONG KONG DEPOSITARY RECEIPTS
Coach’s Hong Kong Depositary Receipts are traded on The Stock Exchange of Hong Kong Limited under the symbol 6388. Neither the Hong Kong Depositary Receipts nor the Hong Kong Depositary Shares evidenced thereby have been or will be registered under the U.S. Securities Act of 1933, as amended (the “Securities Act”), and may not be offered or sold in the United States or to, or for the account of, a U.S. Person (within the meaning of Regulation S under the Securities Act), absent registration or an applicable exemption from the registration requirements. Hedging transactions involving these securities may not be conducted unless in compliance with the Securities Act.
1
In this Form 10-K, references to “Coach,” “we,” “our,” “us” and the “Company” refer to Coach, Inc., including consolidated subsidiaries. The fiscal years ended June 28, 2014 (“fiscal 2014”), June 29, 2013 (“fiscal 2013”) and June 30, 2012 (“fiscal 2012”) were each 52-week periods. The fiscal year ending June 27, 2015 (“fiscal 2015”) will be also be a 52-week period.
GENERAL DEVELOPMENT OF BUSINESS
Founded in 1941, Coach was acquired by Sara Lee Corporation (“Sara Lee”) in 1985. In June 2000, Coach was incorporated in the state of Maryland. In October 2000, Coach was listed on the New York Stock Exchange and sold approximately 68 million shares of common stock, split adjusted, representing 19.5% of the then outstanding shares. In April 2001, Sara Lee completed a distribution of its remaining ownership in Coach via an exchange offer, which allowed Sara Lee stockholders to tender Sara Lee common stock for Coach common stock.
Coach’s international expansion strategy is to enter into joint ventures and distributor relationships to build market presence and capability. To further accelerate brand awareness, aggressively grow market share and to exercise greater control of our brand, Coa
ch
has historically acquired its partner’s interests.
|
•
|
In June 2001, Coach Japan was initially formed as a joint venture with Sumitomo Corporation. On July 1, 2005, we purchased Sumitomo’s 50% interest in Coach Japan.
|
|
•
|
In fiscal 2011, the Company purchased a non-controlling interest in a joint venture with Hackett Limited to expand the Coach business in Europe. Through the joint venture, the Company opened retail locations in Spain, Portugal and the United Kingdom in fiscal 2011, in France and Ireland in fiscal 2012 and in Germany in fiscal 2013. In the beginning of fiscal 2014, the Company purchased Hackett Limited’s 50% interest in the joint venture.
|
|
•
|
Coach acquired the domestic retail businesses from its distributors as follows:
|
|
n
|
Fiscal 2009: Hong Kong, Macau and mainland China (“Coach China”).
|
|
n
|
Fiscal 2012: Singapore and Taiwan.
|
|
n
|
Fiscal 2013: Malaysia and South Korea.
|
FINANCIAL INFORMATION ABOUT SEGMENTS
See Note 16, "Segment Information" for more information.
NARRATIVE DESCRIPTION OF BUSINESS
Coach has grown from a family-run workshop in a Manhattan loft to a leading New York design house of modern luxury accessories and lifestyle collections. Coach is one of the most recognized fine accessories brands in the U.S. and in targeted international markets. We offer premium lifestyle accessories to a loyal and engaged customer base and provide consumers with fresh, compelling and innovative products that are extremely well made, at an attractive price. Coach’s product offering uses a broad range of high quality leathers, fabrics and materials. In response to our customer’s demands for both fashion and function, Coach offers updated styles and multiple product categories which address an increasing share of our customer’s accessory wardrobe. Coach created a sophisticated, modern and inviting environment to showcase our product assortment and reinforce a consistent brand positioning wherever the consumer may shop. We utilize a flexible, cost-effective global sourcing model, in which independent manufacturers supply our products, allowing us to bring our broad range of products to market rapidly and efficiently.
Coach offers a number of key differentiating elements that set it apart from the competition, including:
A Distinctive Brand
— The Coach brand represents a blend of classic American style with a distinctive New York spirit, offering a design that is known for a distinctive combination of style and function. Coach offers lifestyle products that are relevant, extremely well made and provide excellent value.
A Market Leadership Position With Growing International Recognition
— Coach is a global leader in premium handbags and lifestyle accessories. Our long-standing reputation and distinctive image have been consistently developed across an expanding number of products, sales channels and international markets, including within North America, in which Coach is the leading brand, and in Japan, where Coach is the leading imported luxury handbag and accessories brand by units sold. Coach is also gaining traction in China and other Asian markets, Europe and Latin America.
A Loyal And Involved Consumer
— Coach consumers have a strong emotional connection with the brand. Part of the Company’s everyday mission is to cultivate consumer relationships by strengthening this emotional connection.
2
A Multi-Channel Global Distribution Model
— Coach products are available in image-enhancing locations globally wherever our consumer chooses to shop including: retail and outlet stores, directly operated concession shop-in-shops, online, and department and specialty stores. This allows Coach to maintain a dynamic balance as results do not depend solely on the performance of a single channel or geographic area. Our stores showcase the world of Coach and enhance the shopping experience while reinforcing the image of the Coach brand. The modern store design creates a distinctive environment to display our products. Coach has committed a future investment of approximately $500 million to further elevate its in-store imagery. Store associates are trained to maintain high standards of visual presentation, merchandising and customer service.
Innovation With A Consumer-Centric Focus
— Coach listens to its consumer through rigorous consumer research and strong consumer orientation. To truly understand globalization and its impact on Coach, we also need to understand the local context in each market, learning about our consumer wherever Coach is sold. Coach works to anticipate the consumer’s changing needs by keeping the product assortment fresh and compelling.
PRODUCTS
Coach's product offerings include modern luxury accessories and lifestyle collections, including women's and men's bags, women’s and men’s small leather goods, business cases, footwear, wearables including outerwear, watches, weekend and travel accessories, scarves, sunwear, fragrance, jewelry, travel bags and other lifestyle products. The following table shows net sales for each product category represented:
|
Fiscal Year Ended
|
||||||||||||||||||||
|
(dollars in millions)
|
||||||||||||||||||||
|
June 28,
2014 |
June 29,
2013 |
June 30,
2012 |
||||||||||||||||||
|
Amount
|
% of total
net sales
|
Amount
|
% of total
net sales
|
Amount
|
% of total
net sales
|
|||||||||||||||
|
Women's Handbags
|
$
|
2,642
|
|
55
|
%
|
$
|
2,923
|
|
58
|
%
|
$
|
2,886
|
|
61
|
%
|
|||||
|
Women's Accessories
|
1,046
|
|
22
|
|
1,196
|
|
23
|
|
1,170
|
|
24
|
|
||||||||
|
Men's
|
692
|
|
14
|
|
600
|
|
12
|
|
424
|
|
9
|
|
||||||||
|
All Other Products
|
426
|
|
9
|
|
356
|
|
7
|
|
283
|
|
6
|
|
||||||||
|
Total Sales
|
$
|
4,806
|
|
100
|
%
|
$
|
5,075
|
|
100
|
%
|
$
|
4,763
|
|
100
|
%
|
|||||
Women’s Handbags
— Women’s handbag collections feature classically inspired designs as well as fashion designs. Typically, there are three to four collections per quarter and four to seven styles per collection. These collections are designed to meet the fashion and functional requirements of our broad and diverse consumer base.
Women’s Accessories
— Women’s accessories include small leather goods and novelty accessories. Women’s small leather goods, which complement our handbags, include money pieces, wristlets and cosmetic cases. Key rings and charms are also included in this category.
Men’s
— Men’s bag collections include business cases, computer bags, messenger-style bags and totes. Men’s small leather goods consist primarily of wallets, card cases and belts. Novelty accessories include time management and electronic accessories.
All Other Products
consist of the following:
Footwear
— Jimlar Corporation (“Jimlar”) has been Coach's footwear licensee since 1999. Footwear is distributed through select Coach retail stores our Internet sales sites and U.S. department stores and military locations. Footwear sales are comprised primarily of women’s styles.
Wearables
— This category is comprised of certain seasonal lifestyle apparel collections, including outerwear, ready-to-wear and cold weather accessories, such as gloves, scarves and hats. These products are primarily women's and contain a fashion assortment in all components of this category.
Jewelry
— This category is comprised of bracelets, necklaces, rings and earrings offered in sterling silver, leather and non-precious metals.
Travel Bags
— The travel collections are comprised of luggage and related accessories, such as travel kits and valet trays.
Sunwear
— Luxottica Group SPA (“Luxottica”) has been Coach’s eyewear licensee since 2012. This collection is a collaborative effort that combines the Coach aesthetic for fashion accessories with the latest fashion directions in sunglasses.
3
Coach sunglasses are sold in Coach retail stores and our Internet sales sites, department stores worldwide, select sunglass retailers and optical retailers in major global markets.
Watches
— Movado Group, Inc. (“Movado”) has been Coach's watch licensee since 1998 and has developed a distinctive collection of watches inspired primarily by women's collections with select men's styles. The Coach watch collection is currently sold in Coach retail stores and our Internet sales sites, department stores worldwide, and select watch retailers in major global markets.
Fragrance
— Starting in the spring of 2010, Estée Lauder Companies Inc. (“Estée Lauder”), through its subsidiary, Aramis Inc., became Coach's fragrance licensee. Fragrance is distributed through Coach retail stores, our Internet sales sites, department and specialty stores worldwide, and select perfumeries in major global markets. Coach offers women's fragrance collections which include eau de perfume spray, eau de toilette spray, purse spray, and body lotion. Coach also offers men's fragrance collections.
DESIGN AND MERCHANDISING
Coach's New York-based design team is responsible for conceptualizing and directing the design of all Coach products. Designers have access to Coach's extensive archives of product designs created since the Company's inception, which are a valuable resource for new product concepts. Coach designers are also supported by a strong merchandising team that analyzes sales, market trends and consumer preferences to identify market opportunities that help guide each season's design process. Merchandisers also analyze, edit, add and discontinue products to maximize sales across all channels. The product category teams, each comprised of design, merchandising/product development and sourcing specialists help Coach execute design concepts that are consistent with the brand's strategic direction.
Coach's design and merchandising teams work in close collaboration with all of our licensing partners to ensure that the licensed products (watches, footwear, eyewear and fragrance) are conceptualized and designed to address the intended market opportunity and convey the distinctive perspective and lifestyle associated with the Coach brand.
In the first quarter of fiscal 2014, Stuart Vevers joined the Company as Executive Creative Director, replacing Reed Krakoff, who departed from the Company in connection with the sale of the Reed Krakoff business.
SEGMENTS
In fiscal
2014
, the Company’s operations reflect five operating segments aggregated into two reportable segments:
|
•
|
North America, which includes sales to North American consumers through Coach-operated stores (including the Internet) and sales to wholesale customers. This segment represented approximately
65
% of Coach's total net sales in fiscal
2014
.
|
|
•
|
International, which includes sales to consumers through Coach-operated stores (including the Internet) and concession shop-in-shops in Japan and mainland China, Coach-operated stores and concession shop-in-shops in Hong Kong, Macau, Singapore, Taiwan, Malaysia, South Korea, the United Kingdom, France, Ireland, Spain, Portugal, Germany and Italy, as well as sales to wholesale customers and distributors in approximately
35
countries. This segment represented approximately
34
% of total net sales in fiscal
2014
.
|
Other, which is not a reportable segment, consists of sales and expenses generated in ancillary channels, including licensing and disposition.
North America Segment
North American Retail Stores
— Coach stores are located in regional shopping centers and metropolitan areas throughout the U.S. and Canada. The retail stores carry an assortment of products depending on their size, location and customer preferences. Our flagship stores, which offer the broadest assortment of Coach products, are located in high-visibility locations within New York City, Chicago, Beverly Hills, San Francisco, Toronto and Vancouver.
4
In fiscal 2014, we have reduced the number of both retail stores and total square footage, as we continue to optimize our real estate position. We expect this trend to accelerate in the next fiscal year with the anticipated closure of approximately 70 retail stores in fiscal 2015, attributable to our Transformation Plan, as described in Note 3, "Transformation, Restructuring and Other Related Actions." The number of Coach retail stores and their total and average square footage remained relatively constant in fiscal 2013 when compared from fiscal 2012.
|
Fiscal Year Ended
|
|||||||||
|
|
June 28,
2014
|
June 29,
2013
|
June 30,
2012
|
||||||
|
Retail stores
|
332
|
|
351
|
|
354
|
|
|||
|
Net (decrease) increase vs. prior year
|
(19
|
)
|
(3
|
)
|
9
|
|
|||
|
% (decrease) increase vs. prior year
|
(5.4
|
)%
|
(0.8
|
)%
|
2.6
|
%
|
|||
|
Retail square footage
|
910,003
|
|
952,422
|
|
959,099
|
|
|||
|
Net (decrease) increase vs. prior year
|
(42,419
|
)
|
(6,677
|
)
|
22,822
|
|
|||
|
% (decrease) increase vs. prior year
|
(4.5
|
)%
|
(0.7
|
)%
|
2.4
|
%
|
|||
|
Average square footage
|
2,741
|
|
2,713
|
|
2,709
|
|
|||
North American Outlet Stores
— Coach's outlet stores serve as an efficient means to sell manufactured-for-outlet product, including outlet exclusives, and to a lesser extent, discontinued and irregular inventory outside the retail channel. These stores operate under the Coach name and are geographically positioned primarily in established outlet centers that are generally more than 30 miles from major markets.
Coach’s outlet store design, visual presentations and customer service levels support and reinforce the brand's image. Through these outlet stores, Coach targets value-oriented customers.
The expansion in the number of North America Coach outlet stores and their total and average square footage is shown in the following table:
|
Fiscal Year Ended
|
|||||||||
|
|
June 28,
2014
|
June 29,
2013
|
June 30,
2012
|
||||||
|
Outlet stores
|
207
|
|
193
|
|
169
|
|
|||
|
Net increase vs. prior year
|
14
|
|
24
|
|
26
|
|
|||
|
% increase vs. prior year
|
7.3
|
%
|
14.2
|
%
|
18.2
|
%
|
|||
|
Outlet square footage
|
1,132,714
|
|
982,202
|
|
789,699
|
|
|||
|
Net increase vs. prior year
|
150,512
|
|
192,503
|
|
140,605
|
|
|||
|
% increase vs. prior year
|
15.3
|
%
|
24.4
|
%
|
21.7
|
%
|
|||
|
Average square footage
|
5,472
|
|
5,089
|
|
4,673
|
|
|||
Over the next few years, we expect to see modest to no growth in outlet store square footage as we continue to optimize our real estate position across channels by expanding our most productive stores to accommodate a broader expression of lifestyle assortment while also assessing opportunities to close under-performing stores.
Internet
— Coach views its website as a key communications vehicle for the brand to promote traffic in Coach retail stores and department store locations and build brand awareness. With approximately 76 million unique visits to www.coach.com in fiscal
2014
, our online store provides a showcase environment where consumers can browse through a selected offering of the latest styles and colors. Our e-commerce programs also include our invitation-only outlet Internet sales site.
North America Wholesale
— Coach began as a U.S. wholesaler to department stores and this channel continues to remain a part of our overall consumer reach. Today, we work closely with our partners to ensure a clear and consistent product presentation. Coach enhances its presentation through the creation of shop-in-shops with proprietary Coach fixtures within the department store environment. Coach custom tailors its assortments through wholesale product planning and allocation processes to match the attributes of our department store consumers in each local market. The Company continues to closely manage inventories in this channel given the highly promotional environment at point-of-sale. The Company has implemented automatic replenishment with major accounts in an effort to optimize inventory across wholesale doors. Over the next few years, we expect to make significant investment in the elevation of shop-in-shop environments in this channel.
5
Coach's products are sold in approximately 1,000 wholesale locations in the U.S. and Canada. Our most significant U.S. wholesale customers are Macy’s (including Bloomingdale's), Dillard's, Nordstrom, Lord & Taylor, The Bay, Bon Ton, Belk and Von Maur. Coach products are also available on these customers' websites.
International Segment
Our International Markets
operate department store concession shop-in-shop locations and freestanding flagship, retail and outlet stores as well as e-commerce websites. Flagship stores, which offer the broadest assortment of Coach products, are located in select high-visibility shopping districts within Tokyo, Shanghai, Hong Kong and London.
The following table shows the number of international directly-operated locations and their total and average square footage:
|
Fiscal Year Ended
|
|||||||||
|
|
June 28,
2014
|
June 29,
2013
|
June 30,
2012
|
||||||
|
Coach Japan:
|
|
|
|
|
|
|
|||
|
Locations:
|
198
|
|
191
|
|
180
|
|
|||
|
Net increase vs. prior year
|
7
|
|
11
|
|
11
|
|
|||
|
% increase vs. prior year
|
3.7
|
%
|
6.1
|
%
|
6.5
|
%
|
|||
|
Square footage:
|
355,014
|
|
350,994
|
|
320,781
|
|
|||
|
Net increase vs. prior year
|
4,020
|
|
30,213
|
|
16,856
|
|
|||
|
% increase vs. prior year
|
1.1
|
%
|
9.4
|
%
|
5.5
|
%
|
|||
|
Average square footage
|
1,793
|
|
1,838
|
|
1,782
|
|
|||
|
Coach International, excluding Japan:
|
|
|
|
|
|||||
|
Locations:
|
277
|
|
218
|
|
188
|
|
|||
|
Net increase vs. prior year
|
59
|
|
30
|
|
46
|
|
|||
|
% increase vs. prior year
|
27.1
|
%
|
16.0
|
%
|
32.4
|
%
|
|||
|
Square footage:
|
563,981
|
|
417,573
|
|
344,615
|
|
|||
|
Net increase vs. prior year
|
146,408
|
|
72,958
|
|
103,742
|
|
|||
|
% increase vs. prior year
|
35.1
|
%
|
21.2
|
%
|
43.1
|
%
|
|||
|
Average square footage
|
2,036
|
|
1,915
|
|
1,833
|
|
|||
Coach Japan plans to maintain a relatively consistent store count over the next several years. Furthermore, the balance of Coach International, excluding Japan, anticipates modest growth in our store count over the next few years.
International Wholesale
— In addition to our company-operated stores, this channel includes sales to international wholesale distributors and authorized retailers. Travel retail represents the largest portion of our customers’ sales in this channel. However, we continue to drive growth by expanding our distribution to reach local consumers in new markets. Coach has developed relationships with a select group of distributors who sell Coach products through department stores and freestanding retail locations in approximately 35 countries. Coach's current network of international distributors serve the following domestic and/or travel retail markets: Argentina, Aruba, Australia, Bahamas, Bahrain, Benelux, Brazil, Canada, China (including Hong Kong and Macau), Colombia, France, Germany, Indonesia, Italy, Japan, South Korea, Kuwait, Lebanon, Malaysia, Mexico, New Zealand, Panama, Peru, Philippines, Saudi Arabia, Singapore, Spain, Switzerland, Taiwan, Thailand, the United Arab Emirates, the United Kingdom, U.S. & Territories, Venezuela and Vietnam.
For locations not in freestanding stores, Coach has created shop-in-shops and other image enhancing environments to increase brand appeal and stimulate growth. Coach continues to improve productivity in this channel by opening larger image-enhancing locations, expanding existing stores and closing less productive stores. Coach's most significant international wholesale customers are the DFS Group, Everrich DFS Corp, Lotte Group, Shilla Group and Vantage Point. Coach's products are sold in approximately 280 wholesale locations.
6
Other
Licensing
— In our worldwide licensing relationships, Coach takes an active role in the design process and controls the marketing and distribution of products under the Coach brand. Licensing revenue of approximately $27.9 million and $32.1 million in fiscal
2014
and fiscal
2013
, respectively, is included Other sales. (Other, which is not a reportable segment, consists of sales generated in ancillary channels). The licensing relationships as of
June 28, 2014
are as follows:
|
|
|
|
||||
|
|
|
Date
|
||||
|
Category
|
|
Partner
|
|
Introduction
|
|
Expiration
|
|
Footwear
|
|
Jimlar
|
|
1999
|
|
2015
|
|
Eyewear
|
|
Luxottica
|
|
2012
|
|
2016
|
|
Watches
|
|
Movado
|
|
1998
|
|
2015
|
|
Fragrance
|
|
Estee Lauder
|
|
2010
|
|
2015
|
Products made under license are, in most cases, sold through all of the channels discussed above and, with Coach's approval, these licensees have the right to distribute Coach brand products selectively through several other channels: shoes in department store salons, watches in selected jewelry stores and eyewear and sunwear in selected optical retailers. These venues provide additional, yet controlled, exposure of the Coach brand. Coach's licensing partners pay royalties to Coach on their net sales of Coach branded products. However, such royalties are not material to the Coach business as they currently comprise less than 1% of Coach’s total net sales. The licensing agreements generally give Coach the right to terminate the license if specified sales targets are not achieved.
MARKETING
Coach’s global marketing strategy is to deliver a consistent, relevant and multi-layered message every time the consumer comes in contact with the Coach brand through our communications and visual merchandising. The Coach image is created and executed by our creative marketing, visual merchandising and public relations teams. Coach also has a sophisticated consumer and market research capability, which helps us assess consumer attitudes and trends.
In conjunction with promoting a consistent global image, Coach uses its extensive customer database and consumer knowledge to target specific products and communications to specific consumers to efficiently stimulate sales across all distribution channels.
Coach engages in several consumer communication initiatives, including direct marketing activities and national, regional and local advertising. Total expenses related to consumer communications in fiscal
2014
were $130.1 million, approximately 3% of net sales.
Coach’s wide range of direct marketing activities includes email contacts and catalogs targeted to promote sales to consumers in their preferred shopping venue. In addition to building brand awareness, the Company's website serves as an effective brand communication vehicle by providing a showcase environment where consumers can browse through a strategic offering of the latest styles and colors, which drives store traffic and enables the collection of customer data.
As part of Coach's direct marketing strategy, the Company uses its database primarily consisting of approximately 24 million households in North America and 10 million households in Asia. Email contacts and direct mail pieces are Coach's principal means of communication and are sent to selected households to stimulate consumer purchases and build brand awareness. The growing number of visitors to the Company's e-commerce sites in the U.S., Canada, Japan and China provides an opportunity to increase the size of these databases.
In fiscal
2014
, Coach had informational websites in Australia, Bahrain, Brazil, Chile, Colombia, France, Hong Kong, Indonesia, Ireland, South Korea, Kuwait, Malaysia, Mexico, Panama, Peru, Portugal, Saudi Arabia, Singapore, Spain, Taiwan, Thailand, UAE, United Kingdom, Venezuela and Vietnam. In addition, the Company utilizes and continues to explore new technologies such as blogs and social networking websites, including Twitter, Facebook, Instagram, Pinterest, WeChat and Sina Weibo, as a cost effective consumer communication opportunity to increase on-line and store sales, acquire new customers and build brand awareness.
The Company also runs national, regional and local marketing campaigns in support of its major selling seasons. In fiscal 2014, the Company refreshed its strategy to expand its marketing campaigns to more clearly message its brand and products under an effortless New York style positioning. We plan to continue to support this strategy in the future through an increased presence in relevant fashion, media events and publications.
7
MANUFACTURING
Coach carefully balances its commitments to a limited number of “better brand” partners with demonstrated integrity, quality and reliable delivery. Our manufacturers are located in many countries, including Vietnam, China, the Philippines, India, Thailand, Italy, Hong Kong and the United States. Coach continues to evaluate new manufacturing sources and geographies to deliver the finest quality products at the lowest cost and help limit the impact of manufacturing in inflationary markets. During fiscal
2014
, the Company had five vendors who each provided slightly over 10% of Coach’s total units. These five vendors are geographically dispersed and have multiple locations in different countries. No other individual vendor currently provides more than approximately 10% of Coach’s total units. Before partnering with a vendor, Coach evaluates each facility by conducting a quality and business practice standards audit. Periodic evaluations of existing, previously approved facilities are conducted on a random basis. We believe that all of our manufacturing partners are in material compliance with Coach’s integrity standards.
These independent manufacturers each or in aggregate support a broad mix of product types, materials and a seasonal influx of new, fashion oriented styles, which allows us to meet shifts in marketplace demand and changes in consumer preferences.
Our raw material suppliers, independent manufacturers and licensing partners, must achieve and maintain Coach's high quality standards, which are an integral part of the Coach identity. One of Coach's keys to success lies in the rigorous selection of raw materials. Coach has longstanding relationships with purveyors of fine leathers and hardware. Although Coach products are manufactured by independent manufacturers, we maintain control of the raw materials that are used in all of our products. Compliance with quality control standards is monitored through on-site quality inspections at all independent manufacturing facilities.
We maintain control of the supply chain process from design through manufacture. We are able to do this by qualifying raw material suppliers and by maintaining sourcing management offices in Vietnam, China, Hong Kong and the Philippines that work closely with our independent manufacturers. This broad-based, global manufacturing strategy is designed to optimize the mix of cost, lead times and construction capabilities. Over the last several years, we have increased the presence of our senior management in the countries of our manufacturers to enhance control over decision making and ensure the speed with which we bring new product to market is maximized.
DISTRIBUTION
In North America, Coach operates an 850,000 square foot distribution and consumer service facility in Jacksonville, Florida. This automated facility uses a bar code scanning warehouse management system. Coach's distribution center employees use handheld scanners to read product bar codes, which allow them to more accurately process and pack orders, track shipments, manage inventory and generally provide excellent service to our customers. Coach's products are primarily shipped to Coach retail stores and wholesale customers via express delivery providers and common carriers, and direct to consumers via express delivery providers.
Outside of North America, the Company has established regional distribution centers, through third-parties, in Shanghai, China and Oldenzaal, The Netherlands. The Company also operates local distribution centers, through third-parties, in Japan, China, Hong Kong, Singapore, Taiwan, Malaysia and South Korea.
INFORMATION SYSTEMS
The foundation of Coach's information systems is its Enterprise Resource Planning (“ERP”) system. This fully integrated system supports finance and accounting, procurement, inventory control, sales and store replenishment. The system functions as a central repository for all of Coach's transactional information, resulting in increased efficiencies, improved inventory control and a better understanding of consumer demand.
Complementing its ERP system are several other system solutions, each of which Coach believes is suitable for its needs. The data warehouse system summarizes the transaction information and provides a global platform for management reporting. The supply chain management systems support sales, procurement, inventory planning and reporting functions. In North America, product fulfillment is facilitated by Coach's highly automated warehouse management system and electronic data interchange system, while the unique requirements of Coach's Internet business are supported by Coach’s order management system. Internationally, Coach selectively relies on the warehouse and distribution systems owned by the third-parties that operate certain of our international distributions centers. Additionally, the point-of-sale system supports all in-store transactions, distributes management reporting to each store, and collects sales and payroll information on a daily basis. This daily collection of store sales and inventory information results in early identification of business trends and provides a detailed baseline for store inventory replenishment. Updates and upgrades of these systems are made on a periodic basis in order to ensure that we constantly improve our functionality.
TRADEMARKS AND PATENTS
Coach owns all of the material worldwide trademark rights used in connection with the production, marketing and distribution of all of its products. In addition, it licenses trademarks and copyrights used in connection with limited edition collaborative special
8
projects. Coach also owns and maintains worldwide registrations for trademarks in all relevant classes of products in each of the countries in which Coach products are sold. Major trademarks include COACH, COACH NEW YORK, COACH and Horse & Carriage Design, COACH and Story Patch Design, COACH and Lozenge Design, COACH and Tag Design, Signature C Design, and Op Art C Design, and COACH LEATHERWARE EST. 1941 (the "Heritage Logo"). Coach is not dependent on any one particular trademark or design patent although Coach believes that the Coach name is important for its business. In addition, several of Coach's products are covered by design patents and a utility patent application. Coach aggressively polices its trademarks and trade dress, and pursues infringers both domestically and internationally. It also pursues counterfeiters domestically and internationally through leads generated internally, as well as through its network of investigators, the Coach hotline and business partners around the world.
Coach expects that its material trademarks will remain in existence for as long as Coach continues to use and renew them.
SEASONALITY
Because Coach products are frequently given as gifts, Coach experiences seasonal variations in its net sales, operating cash flows and working capital requirements, primarily related to seasonal holiday shopping. During the first fiscal quarter, Coach builds inventory for the holiday selling season. In the second fiscal quarter, its working capital requirements are reduced substantially as Coach generates higher net sales and operating income, especially during the holiday months of November and December. Fluctuations in net sales, operating income and operating cash flows in any fiscal quarter may be affected by other events affecting retail sales, including adverse weather conditions.
GOVERNMENT REGULATION
Most of Coach's imported products are subject to duties, indirect taxes, quotas and non-tariff trade barriers that may limit the quantity of products that Coach may import into the U.S. and other countries or may impact the cost of such products. Coach is not materially restricted by quotas or other government restrictions in the operation of its business, however customs duties do represent a material part of total product cost. To maximize opportunities, Coach operates complex supply chains through foreign trade zones, bonded logistic parks and other strategic initiatives such as free trade agreements. Additionally, the Company operates a direct import business in many countries worldwide. As a result, Coach is subject to stringent government regulations and restrictions with respect to its cross-border activity either by the various customs and border protection agencies or by other government agencies which control the quality and safety of the Company’s products. Coach maintains an internal global trade and customs organization to help manage its import/export activity.
COMPETITION
The premium handbag and accessories industry is highly competitive. The Company competes primarily with European and American luxury and accessible luxury brands as well as private label retailers, including some of Coach’s wholesale customers. Over the last several years the category has grown, encouraging the entry of new competitors as well as increasing the competition from existing competitors. This increased competition drives consumer interest in this brand loyal category.
EMPLOYEES
As of
June 28, 2014
, Coach employed approximately 17,200 people globally, including both full and part time employees, but excluding seasonal and temporary employees. Of these employees, approximately 7,300 and 7,000 were full time and part time employees, respectively, in the global retail field. Approximately 60 of Coach’s employees are covered by a collective bargaining agreement. Coach believes that its relations with its employees are good, and has never encountered a strike or work stoppage.
FINANCIAL INFORMATION ABOUT GEOGRAPHIC AREAS
See the Note 16, "Segment Information" presented in the Notes to the Consolidated Financial Statements for geographic information.
AVAILABLE INFORMATION
Our Annual Reports on Form 10-K, Quarterly Reports on Form 10-Q, Current Reports on Form 8-K, and all amendments to these reports filed or furnished pursuant to Section 13(a) or 15(d) of the Securities Exchange Act of 1934, are available free of charge on our investor website, located at
www.coach.com/investors
under the caption “SEC Filings”, as soon as reasonably practicable after they are filed with or furnished to the Securities and Exchange Commission. These reports are also available on the Securities and Exchange Commission’s website at
www.sec.gov.
No information contained on any of our websites is intended to be included as part of, or incorporated by reference into, this Annual Report on Form 10-K.
The Company has included the Chief Executive Officer (“CEO”) and Chief Financial Officer certifications regarding its public disclosure required by Section 302 of the Sarbanes-Oxley Act of 2002 as Exhibit 31.1 to this report on Form 10-K. Additionally, the Company filed with the New York Stock Exchange (“NYSE”) the CEO’s certification regarding the Company’s
9
compliance with the NYSE’s Corporate Governance Listing Standards (“Listing Standards”) pursuant to Section 303A.12(a) of the Listing Standards, which indicated that the CEO was not aware of any violations of the Listing Standards by the Company.
10
You should consider carefully all of the information set forth or incorporated by reference in this document and, in particular, the following risk factors associated with the business of Coach and forward-looking information in this document. Please also see “Special Note on Forward-Looking Information” at the beginning of this report. The risks described below are not the only ones we face. Additional risks not presently known to us or that we currently deem immaterial may also have an adverse effect on us. If any of the risks below actually occur, our business, results of operations, cash flows or financial condition could suffer.
Economic conditions could materially adversely affect our financial condition, results of operations and consumer purchases of luxury items.
Our results can be impacted by a number of macroeconomic factors, including but not limited to consumer confidence and spending levels, unemployment, consumer credit availability, raw materials costs, fuel and energy costs, global factory production, commercial real estate market conditions, credit market conditions and the level of customer traffic in malls and shopping centers.
Demand for our products, and consumer spending in the premium handbag and accessories market generally, is significantly impacted by trends in consumer confidence, general business conditions, interest rates, the availability of consumer credit, and taxation. Consumer purchases of discretionary luxury items, such as Coach products, tend to decline during recessionary periods or periods of sustained high unemployment, when disposable income is lower.
The growth of our business depends on the successful execution of our growth strategies, including our efforts to expand internationally into a global lifestyle brand.
Our growth depends on the continued success of existing products, as well as the successful design and introduction of new products. Our ability to create new products and to sustain existing products is affected by whether we can successfully anticipate and respond to consumer preferences and fashion trends. The failure to develop and launch successful new products could hinder the growth of our business. Also, any delay in the development or launch of a new product could result in our company not being the first to bring product to market, which could compromise our competitive position.
Additionally, our current growth strategy includes plans to expand in a number of international regions, including Asia and Europe. We currently plan to open additional Coach stores in China, Europe and other international markets, and we have entered into strategic agreements with various partners to expand our operations in South America. In addition, we have taken control of certain of our retail operations in Europe and the Asia-Pacific region, including the United Kingdom, Spain, Ireland, Portugal, France and Germany during calendar 2013, and Malaysia and South Korea during calendar year 2012. We do not yet have significant experience directly operating in these countries, and in many of them we face established competitors. Many of these countries have different operational characteristics, including but not limited to employment and labor, transportation, logistics, real estate, environmental regulations and local reporting or legal requirements.
Furthermore, consumer demand and behavior, as well as tastes and purchasing trends may differ in these countries, and as a result, sales of our product may not be successful, or the margins on those sales may not be in line with those we currently anticipate. Further, such markets will have upfront short-term investment costs that may not be accompanied by sufficient revenues to achieve typical or expected operational and financial performance and therefore may be dilutive to Coach in the short-term. In many of these countries, there is significant competition to attract and retain experienced and talented employees.
Consequently, if our international expansion plans are unsuccessful, or we are unable to retain and/or attract key personnel, our business, financial condition and results of operation could be materially adversely affected.
The successful execution of our multi-year transformation initiatives is key to the long-term growth of our business.
During the fourth quarter of fiscal 2014, we announced a multi-year strategic plan with the objective of transforming the brand and reinvigorating growth, which will enable the Company to return to ‘best-in-class’ profitability. Key operational and cost elements in order to fund and execute this plan include: (i) the future investment of approximately $500 million in capital improvements in our stores and wholesale locations; (ii) the optimization of our North American store fleet including the closure of approximately 70 underperforming locations, (iii) the realignment of inventory levels to reflect our elevated product strategy; (iv) the investment of approximately $50 million in incremental advertising costs to further promote our new strategy; and (v) the significant scale-back of our promotional cadence, particularly within our outlet Internet sales site. The Company believes that long-term growth can be realized through its transformational efforts over time. However, there is no assurance that such efforts will be successful in achieving long-term growth or changing the perception of Coach from an accessories brand to a global lifestyle brand. Refer to Part II, Item 7, "Management's Discussion and Analysis of Financial Condition and Results of Operations" and Note 3, "Transformation, Restructuring and Other Related Actions," for further information regarding the Transformation Plan.
If the execution of our transformation plan falls short, our business, financial condition and results of operation could be materially adversely affected.
11
Our business is subject to increased costs due to excess inventories if we misjudge the demand for our products.
If Coach misjudges the market for its products it may be faced with significant excess inventories for some products and missed opportunities for other products. If that occurs, we may be forced to rely on destruction, donation, markdowns or promotional sales to dispose of excess, slow-moving inventory, which may negatively impact our gross margin, overall profitability and efficacy of our brand.
Significant competition in our industry could adversely affect our business.
We face intense competition in the product lines and markets in which we operate. Our competitors are European and American luxury brands, as well as private label retailers, including some of Coach’s wholesale customers. There is a risk that our competitors may develop new products or product categories that are more popular with our customers. We may be unable to anticipate the timing and scale of such product introductions by competitors, which could harm our business. Our ability to compete also depends on the strength of our brand, whether we can attract and retain key talent, and our ability to protect our trademarks and design patents. A failure to compete effectively could adversely affect our growth and profitability.
The success of our business depends on our ability to retain the value of the Coach brand and to respond to changing fashion and retail trends in a timely manner.
We believe that the Coach brand, established almost 75 years ago, is regarded as America's preeminent designer, producer, and marketer of fine accessories and gifts for women and men. We attribute the prominence of the Coach brand to the unique combination of our original American attitude and design, our heritage of fine leather goods and custom fabrics, our superior product quality and durability and our commitment to customer service. Any misstep in product quality or design, customer service, marketing, unfavorable publicity or excessive product discounting could negatively affect the image of our brand with our customers. Furthermore, the product lines we have historically marketed and those that we plan to market in the future are becoming increasingly subject to rapidly changing fashion trends and consumer preferences. If we do not anticipate and respond promptly to changing customer preferences and fashion trends in the design, production, and styling of our products, as well as create compelling marketing and retail environments that appeal to our customers, our sales and results of operations may be negatively impacted. Even if our products do meet changing customer preferences and/or stay ahead of changing fashion trends, our brand image could become tarnished or undesirable in the minds of our customers or target markets, which could materially adversely impact our business, financial condition, and results of operations.
We face risks associated with operating in international markets.
We operate on a global basis, with approximately
34
% of our net sales coming from operations outside of North America. While geographic diversity helps to reduce the Company’s exposure to risks in any one country, we are subject to risks associated with international operations, including, but not limited to:
|
•
|
changes in exchange rates for foreign currencies, which may adversely affect the retail prices of our products, result in decreased international consumer demand, or increase our supply costs in those markets, with a corresponding negative impact on our gross margin rates,
|
|
•
|
compliance with laws relating to foreign operations, including the Foreign Corrupt Practices Act and the U.K. Bribery Act, which in general concern the bribery of foreign public officials,
|
|
•
|
political or economic instability or changing macroeconomic conditions in our major markets,
|
|
•
|
the repatriation of foreign cash,
|
|
•
|
natural and other disasters, and
|
|
•
|
changes in legal and regulatory requirements, including, but not limited to safeguard measures, anti-dumping duties, cargo restrictions to prevent terrorism, restrictions on the transfer of currency, climate change legislation, product safety regulations or other charges or restrictions, resulting in the imposition of new or more onerous trade restrictions, tariffs, embargoes, exchange or other government controls.
|
We monitor our global foreign currency exposure. In order to minimize the impact on earnings of foreign currency rate movements, we hedge our subsidiaries’ U.S. dollar-denominated inventory purchases in Japan and Canada, as well as Coach’s cross currency denominated intercompany loan portfolio. We cannot ensure, however, that these hedges will fully offset the impact of foreign currency rate movements. Additionally, our international subsidiaries primarily use local currencies as the functional currency and translate their financial results from the local currency to U.S. dollars. If the U.S. dollar strengthens against these subsidiaries’ foreign currencies, the translation of their foreign currency denominated transactions may decrease consolidated net sales and profitability. Sales to our international wholesale customers are denominated in U.S. dollars.
12
Our stock price may periodically fluctuate based on the accuracy of our earnings guidance or other forward-looking statements regarding our financial performance.
Our business and long-range planning process is designed to maximize our long-term strength, growth, and profitability, and not to achieve an earnings target in any particular fiscal quarter. We believe that this longer-term focus is in the best interests of the Company and our stockholders. At the same time, however, we recognize that, from time to time, it may be helpful to provide investors with guidance as to our forecast of net sales, earnings per share and other financial metrics or projections. While we generally expect to provide updates to our financial guidance when we report our results each fiscal quarter, we assume no responsibility to update any of our forward-looking statements at such times or otherwise. In addition, any longer-term guidance that we provide is based on goals that we believe, at the time guidance is given, are reasonably attainable for growth and performance over a number of years. However, such long-range targets are more difficult to predict than our current quarter and fiscal year expectations. If, and when, we announce actual results that differ from those that have been predicted by us, outside investment analysts, or others, our stock price could be adversely affected. Investors who rely on these predictions when making investment decisions with respect to our securities do so at their own risk. We take no responsibility for any losses suffered as a result of such changes in our stock price.
Failure to adequately protect our intellectual property and curb the sale of counterfeit merchandise could injure the brand and negatively affect sales.
We believe our trademarks, copyrights, patents, and other intellectual property rights are extremely important to our success and our competitive position. We devote significant resources to the registration and protection of our trademarks and to anti-counterfeiting efforts worldwide. In spite of our efforts, counterfeiting still occurs and if we are unsuccessful in challenging a third-party’s rights related to trademark, copyright, or patent this could adversely affect our future sales, financial condition, and results of operations. We are aggressive in pursuing entities involved in the trafficking and sale of counterfeit merchandise through legal action or other appropriate measures. We cannot guarantee that the actions we have taken to curb counterfeiting and protect our intellectual property will be adequate to protect the brand and prevent counterfeiting in the future. Our trademark applications may fail to result in registered trademarks or provide the scope of coverage sought. Furthermore, our efforts to enforce our intellectual property rights are often met with defenses and counterclaims attacking the validity and enforceability of our intellectual property rights. Unplanned increases in legal fees and other costs associated with defending our intellectual property rights could result in higher operating expenses. Finally, many countries’ laws do not protect intellectual property rights to the same degree as U.S. laws.
Computer system disruption and cyber security threats, including a privacy or data security breach, could damage our relationships with our customers, harm our reputation, expose us to litigation and adversely affect our business.
We depend on digital technologies for the successful operation of our business, including corporate email communications to and from employees, customers and stores, the design, manufacture and distribution of our finished goods, digital marketing efforts, collection and retention of customer data, employee information, the processing of credit card transactions, online e-commerce activities and our interaction with the public in the social media space. The possibility of a cyber-attack on any one or all of these systems is a serious threat. As part of our business model, we collect, retain, and transmit confidential information over public networks. In addition to our own databases, we use third party service providers to store, process and transmit this information on our behalf. Although we contractually require these service providers to implement and use reasonable security measures, we cannot control third parties and cannot guarantee that a security breach will not occur in the future either at their location or within their systems. We also store all designs, goods specifications, projected sales and distribution plans for our finished products digitally. We have confidential security measures in place to protect both our physical facilities and digital systems from attacks. Despite these efforts, however, we may be vulnerable to targeted or random security breaches, acts of vandalism, computer viruses, misplaced or lost data, programming and/or human errors, or other similar events.
Consumer awareness and sensitivity to privacy breaches and cyber security threats is at an all-time high. Any misappropriation of confidential or personally identifiable information gathered, stored or used by us, be it intentional or accidental, could have a material impact on the operation of our business, including severely damaging our reputation and our relationships with our customers, employees and investors. We may also incur significant costs implementing additional security measures to comply with state, federal and international laws governing the unauthorized disclosure of confidential information as well as increased cyber security protection costs such as organizational changes, deploying additional personnel and protection technologies, training employees, and engaging third party experts and consultants and lost revenues resulting from unauthorized use of proprietary information including our intellectual property. Lastly, we could face increased litigation as a result of cyber security breaches.
In addition, we maintain e-commerce sites in the U.S., Canada, Japan and China and have plans for additional e-commerce sites in other parts of the world. Additionally, Coach has informational websites in various countries, as described in Item I, "Business." Lastly, our e-commerce programs also include an invitation-only Coach outlet flash sale site. Given the robust nature of our e-commerce presence and digital strategy, it is imperative that we and our e-commerce partners maintain uninterrupted operation of our: (i) computer hardware, (ii) software systems, (ii) customer marketing databases, and (iv) ability to email our
13
current and potential customers. Despite our preventative efforts, our systems are vulnerable from time-to-time to damage, disruption or interruption from, among other things, physical damage, natural disasters, inadequate system capacity, system issues, security breaches, email blocking lists, computer viruses or power outages. Any material disruptions in our e-commerce presence or information technology systems could have a material adverse effect on our business, financial condition and results of operations.
Our business is subject to the risks inherent in global sourcing activities.
As a Company engaged in sourcing on a global scale, we are subject to the risks inherent in such activities, including, but not limited to:
|
•
|
unavailability of, or significant fluctuations, in the cost of raw materials,
|
|
•
|
compliance with labor laws and other foreign governmental regulations,
|
|
•
|
imposition of additional duties, taxes and other charges on imports or exports,
|
|
•
|
increases in the cost of labor, fuel, travel and transportation,
|
|
•
|
compliance with our Global Business Integrity Program,
|
|
•
|
compliance with U.S. laws regarding the identification and reporting on the use of “conflict minerals” sourced from the Democratic Republic of the Congo in the Company’s products,
|
|
•
|
disruptions or delays in shipments,
|
|
•
|
loss or impairment of key manufacturing or distribution sites,
|
|
•
|
inability to engage new independent manufacturers that meet the Company’s cost-effective sourcing model,
|
|
•
|
product quality issues,
|
|
•
|
political unrest,
|
|
•
|
natural disasters or other extreme weather events, whether as a result of climate change or otherwise, and
|
|
•
|
acts of war or terrorism and other external factors over which we have no control.
|
While we require our independent manufacturers and suppliers to operate in compliance with applicable laws and regulations, as well as our Global Operating Principles and/or Supplier Selection Guidelines, we do not control these manufacturers or suppliers or their labor, environmental or other business practices. Copies of our Global Business Integrity Program, Global Operating Principles and Supplier Selection Guidelines are posted on our website, www.coach.com. The violation of labor, environmental or other laws by an independent manufacturer or supplier, or divergence of an independent manufacturer’s or supplier’s labor practices from those generally accepted as ethical or appropriate in the U.S., could interrupt or otherwise disrupt the shipment of our products, harm our trademarks or damage our reputation. The occurrence of any of these events could materially adversely affect our business, financial condition and results of operations.
We are dependent on a limited number of distribution and sourcing centers. While we have business continuity and contingency plans for our sourcing and distribution center sites, significant disruption of manufacturing or distribution for any of the above reasons could interrupt product supply, result in a substantial loss of inventory, increase our costs, disrupt deliveries to our customers and our retail stores, and, if not remedied in a timely manner, could have a material adverse impact on our business. Because our distribution centers include automated and computer controlled equipment, they are susceptible to risks including power interruptions, hardware and system failures, software viruses, and security breaches. We maintain a distribution center in Jacksonville, Florida, owned and operated by Coach. To support our growth in China and Europe, we established distribution centers in Shanghai, China and Oldenzaal, The Netherlands, owned and operated by a third-party, allowing us to better manage the logistics in these regions while reducing costs. We also operate distribution centers, through third-parties, in Japan, China, Hong Kong, Singapore, Taiwan, Malaysia and South Korea. The warehousing of Coach merchandise, store replenishment and processing direct-to-customer orders is handled by these centers and a prolonged disruption in any center’s operation could materially adversely affect our business and operations.
Increases in our costs, such as raw materials, labor or freight could negatively impact our gross margin. Labor costs at many of our manufacturers have been increasing significantly and, as the middle class in developing countries continues to grow, it is unlikely that such cost pressure will abate. The cost of transportation has been increasing as well and it is unlikely such cost pressure will abate if oil prices continue to increase. We may not be able to offset such increases in raw materials, labor or transportation costs through pricing measures or other means.
14
We are subject to risks associated with leasing retail space subject to long-term and non-cancelable leases. We may be unable to renew leases at the end of their terms. If we close a leased retail space, we remain obligated under the applicable lease.
We do not own any of our retail store locations. We lease our corporate-owned stores under long-term, non-cancelable leases, which usually have initial terms ranging from five and ten years, with renewal options typically in five year increments. We believe that the leases we enter into in the future will likely be long-term and non-cancelable and have similar renewal options. Generally, our leases are “net” leases, which require us to pay our proportionate share of the cost of insurance, taxes, maintenance and utilities. We generally cannot cancel these leases at our option. If we determine that it is no longer economic to operate a retail store subject to a lease and decide to close it as we have done in the past and will do in the future, we may remain obligated under the applicable lease for, among other things, payment of the base rent for the balance of the lease term. For example, in the fourth quarter of FY14, we announced that we will close approximately 70 retail stores in North America. In some instances, we may be unable to close an underperforming retail store due to continuous operation clauses in our lease agreements. In addition, as each of our leases expire, we may be unable to negotiate renewals, either on commercially acceptable terms or at all, which could cause us to close retail stores in desirable locations. Our inability to secure desirable retail space or favorable lease terms could impact our ability to grow. Likewise, our obligation to continue making lease payments in respect of leases for closed retail spaces could have a material adverse effect on our business, financial condition and results of operations.
Our success depends, in part, on attracting, developing and retaining qualified employees, including key personnel.
The ability to successfully execute against our goals is heavily dependent on attracting, developing and retaining qualified employees, including our senior management team. Competition in our industry to attract and retain these employees is intense and is influenced by: our ability to offer competitive compensation and benefits, employee morale, our reputation, recruitment by other employers, perceived internal opportunities, non-competition and non-solicitation agreements and macro unemployment rates. Our recently announced transformation plan and its attendant changes regarding organizational efficiencies may intensify this risk.
We depend on the guidance of our senior management team and other key employees who have significant experience and expertise in our industry and our operations. In recent years, we have experienced turnover of several senior management roles and we have focused time and resources on recruiting or promoting from within the new members of our current senior management team. The continued turnover of senior management or the unexpected loss of one or more of our key personnel or any negative public perception with respect to these individuals could also have a material adverse effect on our business, results of operations and financial condition. We do not maintain key-person or similar life insurance policies on any of senior management team or other key personnel.
Our North American wholesale business could suffer as a result of consolidations, liquidations, restructurings and other ownership changes in the retail industry.
Our wholesale business, primarily consisting of the U.S. Wholesale business, comprised approximately 5% of total net sales for fiscal
2014
. Continued consolidation in the retail industry could further decrease the number of, or concentrate the ownership of, stores that carry our and our licensees’ products. Furthermore, a decision by the controlling owner of a group of stores or any other significant customer, whether motivated by competitive conditions, financial difficulties or otherwise, to decrease or eliminate the amount of merchandise purchased from us or our licensing partners could result in an adverse effect on the sales and profitability within this channel.
We rely on our licensing partners to preserve the value of our licenses and the failure to maintain such partners could harm our business.
We currently have multi-year agreements with licensing partners for our footwear, eyewear, watches and fragrance products. See Item 1 — “
Business — Products
” where discussed further. In the future, we may enter into additional licensing arrangements. The risks associated with our own products also apply to our licensed products as well as unique problems that our licensing partners may experience, including risks associated with each licensing partner’s ability to obtain capital, manage its labor relations, maintain relationships with its suppliers, manage its credit and bankruptcy risks, and maintain customer relationships. While we maintain significant control over the products produced for us by our licensing partners, any of the foregoing risks, or the inability of any of our licensing partners to execute on the expected design and quality of the licensed products or otherwise exercise operational and financial control over its business, may result in loss of revenue and competitive harm to our operations in the product categories where we have entered into such licensing arrangements. Further, while we believe that we could replace our existing licensing partners if required, our inability to do so for any period of time could materially adversely affect our revenues and harm our business.
15
Our operating results are subject to seasonal and quarterly fluctuations, which could adversely affect the market price of Coach common stock.
Because Coach products are frequently given as gifts, Coach has historically realized, and expects to continue to realize, higher sales and operating income in the second quarter of its fiscal year, which includes the holiday months of November and December. Poor sales in Coach’s second fiscal quarter would have a material adverse effect on its full year operating results and result in higher inventories. In addition, fluctuations in sales and operating income in any fiscal quarter are affected by the timing of seasonal wholesale shipments and other events affecting retail sales.
If we are unable to pay quarterly dividends at intended levels, our reputation and stock price may be harmed.
The dividend program requires the use of a moderate portion of our cash flow. Our ability to pay dividends will depend on our ability to generate sufficient cash flows from operations in the future. This ability may be subject to certain economic, financial, competitive and other factors that are beyond our control. Our Board of Directors (“Board”) may, at its discretion, decrease the intended level of dividends or entirely discontinue the payment of dividends at any time. Any failure to pay dividends after we have announced our intention to do so may negatively impact our reputation, investor confidence in us and negatively impact our stock price.
Changes in our credit profile or deterioration in market conditions may limit our access to the credit and capital markets and adversely impact our financial results or our business initiatives.
We have maintained and accessed revolving credit facilities as a source of liquidity, along with cash flows generated from our operations, our available cash and cash equivalents and short-term investments, our non-current investments, and other available financing options. We remain committed to maintaining a strong financial profile with ample liquidity. To date, we have not accessed the capital markets in a meaningful way, and therefore are not currently rated by credit rating agencies. Our ability to access the capital markets in the future as a source of funding, and the borrowing costs associated with such financing, is dependent upon capital market conditions and our assigned credit rating and outlook.
Fluctuations in our tax obligations and effective tax rate may result in volatility of our financial results and stock price.
We are subject to income taxes in many U.S. and foreign jurisdictions. We record tax expense based on our estimates of taxable income and required reserves for uncertain tax positions in multiple tax jurisdictions. At any one time, many tax years are subject to audit by various taxing jurisdictions. The results of these audits and negotiations with taxing authorities may result in a settlement which differs from our original estimate. As a result, we expect that throughout the year there could be ongoing variability in our quarterly tax rates as events occur and exposures are evaluated. In addition, our effective tax rate in a given financial statement period may be materially impacted by changes in the mix and level of earnings. Further, proposed tax changes that may be enacted in the future could negatively impact our current or future tax structure and effective tax rates.
We could experience cost overruns and disruptions to our operations in connection with the construction of, and relocation to, our new global corporate headquarters.
The Company has entered into various agreements relating to the development of the Company’s new global corporate headquarters in a new office building to be located at the Hudson Yards development site in New York City. The financing, development and construction of the new building is taking place through a joint venture between the Company and the developers. Construction of the new building has commenced and occupancy in the new global headquarters is currently expected to take place in fiscal 2016. During fiscal 2014, the Company invested $87.2 million in the Hudson Yards joint venture. The Company expects to invest approximately $350 million in the joint venture over the next two years, with approximately $240 million estimated in fiscal 2015, depending on construction progress. Outside of the joint venture, the Company is directly investing in aspects of the new corporate headquarters. In fiscal 2014, $2.1 million was included in capital expenditures and we expect $188 million of additional expenditures over the remaining period of construction. The Company’s allocable share of the joint venture investments and capital expenditures will be financed by the Company with cash on hand, debt-related borrowings and approximately $130 million of proceeds from the sale of its current headquarters buildings.
Due to the inherent difficulty in estimating costs associated with projects of this scale and nature, together with the fact that we are in the early stages of construction of the project, certain of the costs associated with this project may be higher than estimated and it may take longer than expected to complete the project. In addition, the process of moving our headquarters is inherently complex and not part of our day to day operations. Thus, that process could cause significant disruption to our operations and cause the temporary diversion of management resources, all of which could have a material adverse effect on our business. In addition, we cannot give any assurance that our developer will complete its obligations in a timely manner or at all or how changes in the overall development of the Hudson Yards project may impact the development of, or value of, the building in which our new global headquarters will be located. Further, our developer has financing, construction and development obligations to parties other than us, and we cannot give any assurance as to how those obligations may impact the development of the project.
16
The ownership of real property, such as the new global corporate headquarters, also subjects us to various other risks, including, among others:
|
-
|
the possibility of environmental contamination and the costs associated with correcting any environmental problems;
|
|
-
|
the risk of financial loss in excess of amounts covered by insurance, or uninsured risks, such as the loss caused by damage to the new building as a result of fire, floods, or other natural disasters; and
|
|
-
|
adverse changes in the value of these properties, due to interest rate changes, changes in the neighborhood in which the property is located, or other factors.
|
Provisions in Coach’s charter, bylaws and Maryland law may delay or prevent an acquisition of Coach by a third party.
Coach’s charter, bylaws and Maryland law contain provisions that could make it more difficult for a third party to acquire Coach without the consent of Coach’s Board. Coach’s charter permits its Board, without stockholder approval, to amend the charter to increase or decrease the aggregate number of shares of stock or the number of shares of stock of any class or series that Coach has the authority to issue. In addition, Coach’s Board may classify or reclassify any unissued shares of common stock or preferred stock and may set the preferences, rights and other terms of the classified or reclassified shares. Although Coach’s Board has no intention to do so at the present time, it could establish a series of preferred stock that could have the effect of delaying, deferring or preventing a transaction or a change in control that might involve a premium price for Coach’s common stock or otherwise be in the best interest of Coach’s stockholders.
Coach’s bylaws can only be amended by Coach’s Board. Coach’s bylaws also provide that nominations of persons for election to Coach’s Board and the proposal of business to be considered at a stockholders meeting may be made only in the notice of the meeting, by Coach’s Board or by a stockholder who is entitled to vote at the meeting and has complied with the advance notice procedures of Coach’s bylaws. Also, under Maryland law, business combinations, including issuances of equity securities, between Coach and any person who beneficially owns 10% or more of Coach’s common stock or an affiliate of such person are prohibited for a five-year period, beginning on the date such person last becomes a 10% stockholder, unless exempted in accordance with the statute. After this period, a combination of this type must be approved by two super-majority stockholder votes, unless some conditions are met or the business combination is exempted by Coach’s Board.
Risks relating to our Hong Kong Depositary Receipts (“HDRs”)
An active trading market for the Hong Kong Depositary Receipts on the Hong Kong Stock Exchange might not develop or be sustained and their trading prices might fluctuate significantly.
We cannot assure you that an active trading market for the HDRs on the Hong Kong Stock Exchange can develop or be sustained. If an active trading market of the HDRs on the Hong Kong Stock Exchange does not develop or is not sustained, the market price and liquidity of the HDRs could be materially and adversely affected. As a result, the market price for HDRs in Hong Kong might not be indicative of the trading prices of Coach’s common stock on the NYSE, even allowing for currency differences.
The characteristics of the U.S. capital markets and the Hong Kong capital markets are different.
The NYSE and the Hong Kong Stock Exchange have different trading hours, trading characteristics (including trading volume and liquidity), trading and listing rules, and investor bases (including different levels of retail and institutional participation). As a result of these differences, the trading prices of common stock and the HDRs representing them might not be the same, even allowing for currency differences. Fluctuations in the price of our common stock due to circumstances peculiar to the U.S. capital markets could materially and adversely affect the price of the HDRs. Because of the different characteristics of the U.S. and Hong Kong equity markets, the historic market prices of our common stock may not be indicative of the performance of the HDRs.
We are a corporation incorporated in the State of Maryland in the United States and our corporate governance practices are principally governed by U.S. federal and Maryland state laws and regulations.
We are a corporation incorporated in the State of Maryland in the United States and our HDRs are listed on the Hong Kong Stock Exchange. Our corporate governance practices are primarily governed by and subject to U.S. federal and Maryland laws and regulations. U.S. federal and Maryland laws and regulations differ in a number of respects from comparable laws and regulations in Hong Kong. There are certain differences between the stockholder protection regimes in Maryland and the United States and in Hong Kong.
We have obtained a ruling from the Securities and Futures Commission of Hong Kong (the “SFC”) that we will not be regarded as a public Company in Hong Kong for the purposes of the Code on Takeovers and Mergers and the Share Repurchases Code of Hong Kong and hence, these codes will not apply to us. We have also obtained a partial exemption from the SFC in respect of the disclosure of interest provisions set out in the Securities and Futures Ordinance of Hong Kong. In addition, we have been granted waivers or exemptions by the Hong Kong Stock Exchange from certain requirements under its listing rules. Neither our stockholders
17
nor the HDR holders will have the benefit of those Hong Kong rules, regulations and the listing rules of the Hong Kong Stock Exchange for which we have applied, and been granted, waivers or exemptions by the Hong Kong Stock Exchange and SFC.
Additionally, if any of these waivers or exemptions were to be revoked in circumstances including our non-compliance with applicable undertakings for any reason, additional legal and compliance obligations might be costly and time consuming, and might result in issues of interjurisdictional compliance, which could adversely affect us and HDR holders.
As the SFC does not have extra-territorial jurisdiction on any of its powers of investigation and enforcement, it will also have to rely on the regulatory regimes of Maryland state authorities and the SEC to enforce any corporate governance breaches committed by us in the United States. Investors in the HDRs should be aware that it could be difficult to enforce any judgment obtained outside the United States against us or any of our associates.
Furthermore, prospective investors in the HDRs should be aware, among other things, that there are U.S. federal withholding and estate tax implications for HDR holders.
HDR holders are not stockholders of the Company and must rely on the depositary for the HDRs (the “HDR Depositary”) to exercise on their behalf the rights that are otherwise available to the stockholders of the Company.
HDR holders do not have the rights of stockholders. They only have the contractual rights set forth for their benefit under the deposit agreement for the HDRs (the “Deposit Agreement”). Holders of HDRs are not permitted to vote at stockholders’ meetings, and they may only vote by providing instructions to the HDR Depositary. There is no guarantee that holders of HDRs will receive voting materials in time to instruct the HDR Depositary to vote and it is possible that holders of HDRs, or persons who hold their Hong Kong depositary shares through brokers, dealers or other third parties, will not have the opportunity to exercise a right to vote, although both we and the HDR Depositary will endeavor to make arrangements to ensure as far as practicable that all holders of HDRs will be able to vote. As the HDR Depositary or its nominee will be the registered owner of the common stock underlying their HDRs, holders of HDRs must rely on the HDR Depositary (or its nominee) to exercise rights on their behalf. In addition, holders of HDRs will also incur charges on any cash distribution made pursuant to the Deposit Agreement and on transfers of certificated HDRs.
Holders of HDRs will experience dilution in their indirect interest in the Company in the event of an equity offering which is not extended to them.
If we decide to undertake an equity offering (that is not a rights or other offering that is extended to HDR holders), HDR holders may suffer a dilution in their indirect ownership and voting interest in the common stock, as compared to their holdings in the HDRs immediately prior to such an offering.
Holders of HDRs will be reliant upon the performance of several service providers. Any breach of those service providers of their contractual obligations could have adverse consequences for an investment in HDRs.
An investment in HDRs will depend for its continuing viability on the performance of several service providers, including but not limited to the HDR Depositary, the registrar for the HDRs, the custodian and any sub-custodian appointed in respect of the underlying common stock. A failure by any of those service providers to meet their contractual obligations, whether or not by culpable default, could detract from the continuing viability of the HDRs as an investment. Coach will not have direct contractual recourse against the custodian, any sub-custodian or the registrar; hence the potential for redress in circumstances of default will be limited. However, Coach and the HDR Depositary have executed a deed poll in favor of HDR holders in relation to the exercise by them of their rights as HDR holders under the Deposit Agreement against the Company or the HDR Depositary.
Withdrawals and exchanges of HDRs into common stock traded on the NYSE might adversely affect the liquidity of the HDRs.
Our common stock is presently traded on the NYSE. Any HDR holder may at any time request that their HDRs be withdrawn and exchanged into common stock for trading on the NYSE. Upon the exchange of HDRs into common stock, the relevant HDRs will be cancelled. In the event that a substantial number of HDRs are withdrawn and exchanged into Common Stock and subsequently cancelled, the liquidity of the HDRs on the Hong Kong Stock Exchange might be adversely affected.
The time required for HDRs to be exchanged into common stock (and vice versa) might be longer than expected and investors might not be able to settle or effect any sales of their securities during this period.
There is no direct trading or settlement between the NYSE and the Hong Kong Stock Exchange on which the common stock and the HDRs are respectively traded. In addition, the time differences between Hong Kong and New York and unforeseen market circumstances or other factors may delay the exchange of HDRs into common stock (and vice versa). Investors will be prevented from settling or effecting the sale of their securities across the various stock exchanges during such periods of delay. In addition, there is no assurance that any exchange of HDRs into common stock (and vice versa) will be completed in accordance with the timelines investors might anticipate.
18
Investors are subject to exchange rate risk between Hong Kong dollars and U.S. dollars.
The value of an investment in the HDRs quoted in Hong Kong dollars and the value of dividend payments in respect of the HDRs could be affected by fluctuations in the U.S. dollar/Hong Kong dollar exchange rate. While the Hong Kong dollar is currently linked to the U.S. dollar using a specified trading band, no assurance can be given that the Hong Kong government will maintain the trading band at its current limits or at all.
None.
19
The following table sets forth the location, use and size of Coach's key distribution, corporate and product development facilities as of
June 28, 2014
. The majority of the properties are leased, with the leases expiring at various times through 2028, subject to renewal options.
|
Location
|
Use
|
Approximate
Square Footage
|
|||
|
Jacksonville, Florida
|
North America distribution and consumer service
|
850,000
|
|
||
|
New York, New York
|
Corporate, design, sourcing and product development
|
465,000
(1)
|
|
||
|
Carlstadt, New Jersey
|
Corporate and product development
|
65,000
|
|
||
|
Tokyo, Japan
|
Coach Japan regional management
|
32,000
|
|
||
|
Hong Kong
|
Coach Hong Kong regional management
|
31,000
|
|
||
|
Dongguan, China
|
Corporate sourcing, quality control and product development
|
27,000
|
|
||
|
South Korea
|
Coach South Korea regional management
|
18,000
|
|
||
|
Shanghai, China
|
Coach Asia shared service center
|
17,700
|
|
||
|
Hong Kong
|
Corporate sourcing and quality control
|
17,000
(2)
|
|
||
|
Shanghai, China
|
Coach China regional management
|
15,800
|
|
||
|
Ho Chi Minh City, Vietnam
|
Corporate sourcing and quality control
|
10,200
|
|
||
|
Taipei City, Taiwan
|
Coach Taiwan regional management
|
6,400
|
|
||
|
London
|
Coach Europe regional management
|
4,000
|
|
||
|
Malaysia
|
Coach Malaysia regional management
|
3,800
|
|
||
|
Singapore
|
Coach Singapore regional management
|
2,900
|
|
||
|
Beijing, China
|
Coach China regional management
|
2,800
|
|
||
|
Clark, Philippines
|
Corporate sourcing and quality control
|
2,400
|
|
||
|
(1)
|
Includes approximately 285,000 square feet related to Coach-owned buildings.
|
|
(2)
|
Represents a Coach-owned location.
|
As of
June 28, 2014
, Coach also occupied 332 retail and 207 outlet leased stores located in North America, 198 Coach-operated concession shop-in-shops within department stores, retail stores and outlet stores in Japan, and 277 Coach-operated concession shop-in-shops within department stores, retail stores and outlet stores in our remaining international locations, excluding Japan. These leases expire at various times through 2026. Coach considers these properties to be in generally good condition and believes that its facilities are adequate for its operations and provide sufficient capacity to meet its anticipated requirements. Refer to Part II, Item 7, "Management's Discussion and Analysis of Financial Condition and Results of Operations" and Note 3, "Transformation, Restructuring and Other Related Actions," for further information regarding the Transformation Plan, and its impact on future store trends.
Coach is involved in various routine legal proceedings as both plaintiff and defendant incident to the ordinary course of its business, including proceedings to protect Coach’s intellectual property rights, litigation instituted by persons alleged to have been injured upon premises within Coach’s control and litigation with present or former employees.
As part of Coach’s policing program for its intellectual property rights, from time to time, Coach files lawsuits in the U.S. and abroad alleging acts of trademark counterfeiting, trademark infringement, patent infringement, trade dress infringement, copyright infringement, unfair competition, trademark dilution and/or state or foreign law claims. At any given point in time, Coach may have a number of such actions pending. These actions often result in seizure of counterfeit merchandise and/or out of court settlements with defendants. From time to time, defendants will raise, either as affirmative defenses or as counterclaims, the invalidity or unenforceability of certain of Coach’s intellectual properties.
Although Coach’s litigation with present or former employees is routine and incidental to the conduct of Coach’s business, as well as for any business employing significant numbers of employees, such litigation can result in large monetary awards when a civil jury is allowed to determine compensatory and/or punitive damages for actions claiming discrimination on the basis of age, gender, race, religion, disability or other legally protected characteristic or for termination of employment that is wrongful or in violation of implied contracts.
20
Coach believes that the outcome of all pending legal proceedings in the aggregate will not have a material effect on Coach’s business or consolidated financial statements.
Coach has not entered into any transactions that have been identified by the IRS as abusive or that have a significant tax avoidance purpose. Accordingly, we have not been required to pay a penalty to the IRS for failing to make disclosures required with respect to certain transactions that have been identified by the IRS as abusive or that have a significant tax avoidance purpose.
Not applicable.
21
Market and Dividend Information
Coach’s common stock is listed on the New York Stock Exchange and is traded under the symbol “COH.” Coach’s Hong Kong Depositary Receipts have been listed on the Hong Kong Stock Exchange since December 2011 and the issuance from time-to-time of these Hong Kong Depositary Receipts has not been registered under the Securities Act, or with any securities regulatory authority of any state or other jurisdiction of the United States and is being made pursuant to Regulation S of the Securities Act. Accordingly, they may not be re-offered, resold, pledged or otherwise transferred in the United States or to, or for the account of, a “U.S. person” (within the meaning of Regulation S promulgated under the Securities Act), unless the securities are registered under the Securities Act or pursuant to an exemption from, or in a transaction not subject to, the registration requirements of the Securities Act, and hedging transactions involving the Hong Kong Depositary Receipts may not be conducted unless in compliance with the Securities Act. No additional common stock was issued, nor capital raised through this listing.
The following table sets forth, for the fiscal periods indicated, the high, low and closing prices per share of Coach’s common stock as reported on the New York Stock Exchange Composite Index.
|
High
|
Low
|
Closing
|
Dividends Declared per Common Share
|
||||||||||||
|
Fiscal 2014 Quarter ended:
|
|
|
|
|
|
|
|
|
|||||||
|
September 28, 2013
|
$
|
59.58
|
|
$
|
51.53
|
|
|
|
$
|
0.3375
|
|
||||
|
December 28, 2013
|
57.95
|
|
47.89
|
|
|
|
0.3375
|
|
|||||||
|
March 29, 2014
|
56.72
|
|
44.31
|
|
|
|
0.3375
|
|
|||||||
|
June 28, 2014
|
50.86
|
|
33.60
|
|
$
|
34.47
|
|
0.3375
|
|
||||||
|
Fiscal 2013 Quarter ended:
|
|
|
|
|
|
|
|
|
|||||||
|
September 29, 2012
|
$
|
63.24
|
|
$
|
48.24
|
|
|
|
$
|
0.3000
|
|
||||
|
December 29, 2012
|
60.33
|
|
52.20
|
|
|
|
0.3000
|
|
|||||||
|
March 30, 2013
|
61.94
|
|
45.87
|
|
|
|
0.3000
|
|
|||||||
|
June 29, 2013
|
60.12
|
|
48.76
|
|
$
|
57.09
|
|
0.3375
|
|
||||||
As of August 1, 2014, there were 5,031 holders of record of Coach’s common stock.
Any future determination to pay cash dividends will be at the discretion of Coach’s Board and will be dependent upon Coach’s financial condition, operating results, capital requirements and such other factors as the Board deems relevant.
The information under the principal heading “Securities Authorized For Issuance Under Equity Compensation Plans” in the Company’s definitive Proxy Statement for the Annual Meeting of Stockholders to be held on November 6, 2014, to be filed with the Securities and Exchange Commission (The “Proxy Statement”), is incorporated herein by reference.
Performance Graph
The following graph compares the cumulative total stockholder return (assuming reinvestment of dividends) of Coach’s common stock with the cumulative total return of the S&P 500 Stock Index and the “peer set” companies listed below over the five-fiscal-year period ending
June 28, 2014
, the last trading day of Coach’s most recent fiscal year.
|
•
|
The Gap, Inc.,
|
|
•
|
Guess?, Inc.,
|
|
•
|
L Brands, Inc.,
|
|
•
|
PVH Corp.,
|
|
•
|
Ralph Lauren Corporation,
|
|
•
|
Tiffany & Co.,
|
|
•
|
V.F. Corporation, and
|
|
•
|
Williams-Sonoma, Inc.
|
22
Coach management selected the “peer set” on an industry/line-of -business basis and believes these companies represent good faith comparables based on their history, size, and business models in relation to Coach, Inc.
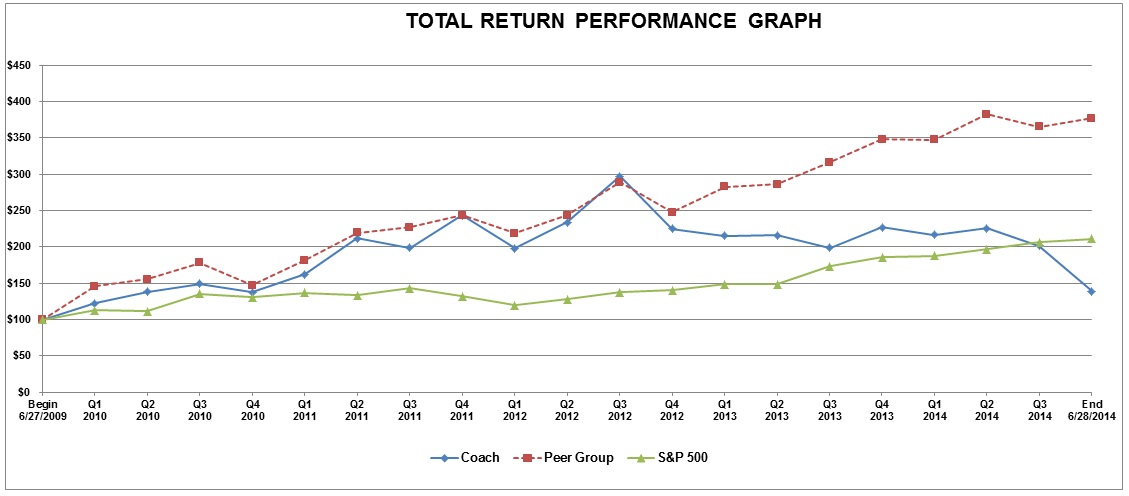
|
June-09
|
June-10
|
June-11
|
June-12
|
June-13
|
June-14
|
|||||||
|
COH
|
$100.00
|
$137.40
|
$243.47
|
$225.11
|
$227.13
|
$138.96
|
||||||
|
Peer Set
|
$100.00
|
$147.40
|
$243.56
|
$247.69
|
$348.08
|
$376.76
|
||||||
|
S&P 500
|
$100.00
|
$130.65
|
$131.90
|
$140.43
|
$185.47
|
$210.92
|
||||||
The graph assumes that $100 was invested on June 27, 2009 at the per share closing price in each of Coach’s common stock, the S&P 500 Stock Index and a peer set index compiled by us tracking the peer group companies listed above, and that all dividends were reinvested. The stock performance shown in the graph is not intended to forecast or be indicative of future performance.
Stock Repurchase Program
The Company did not repurchase any shares during the fourth quarter of fiscal
2014
. As of
June 28, 2014
, Coach had
$836,701
remaining in the stock repurchase program. The Company repurchases its common shares under the repurchase program that was approved by the Board as follows:
|
Date Share Repurchase Programs were
Publicly Announced
|
Total Dollar Amount Approved
|
Expiration Date of Plan
|
||
|
October 23, 2012
|
$1.5 billion
|
June 2015
|
||
23
The selected historical financial data presented below as of and for each of the fiscal years in the five-year period ended
June 28, 2014
has been derived from Coach’s audited Consolidated Financial Statements. The financial data should be read in conjunction with Item 7, “Management’s Discussion and Analysis of Financial Condition and Results of Operations,” the Consolidated Financial Statements and Notes thereto and other financial data included elsewhere herein.
|
Fiscal Year Ended
(1)
|
|||||||||||||||||||
|
|
June 28,
2014
(2)(3)
|
June 29,
2013 (2)(3) |
June 30,
2012 (2)(3) |
July 2,
2011 (3) |
July 3,
2010 |
||||||||||||||
|
Consolidated Statements of Income:
|
|
|
|
|
|
|
|
|
|
|
|||||||||
|
Net sales
|
$
|
4,806,226
|
|
$
|
5,075,390
|
|
$
|
4,763,180
|
|
$
|
4,158,507
|
|
$
|
3,607,636
|
|
||||
|
Gross profit
|
3,296,963
|
|
3,698,148
|
|
3,466,078
|
|
3,023,541
|
|
2,633,691
|
|
|||||||||
|
Selling, general and administrative ("SG&A") expenses
|
2,176,889
|
|
2,173,607
|
|
1,954,089
|
|
1,718,617
|
|
1,483,520
|
|
|||||||||
|
Operating income
|
1,120,074
|
|
1,524,541
|
|
1,511,989
|
|
1,304,924
|
|
1,150,171
|
|
|||||||||
|
Net income
|
781,336
|
|
1,034,420
|
|
1,038,910
|
|
880,800
|
|
734,940
|
|
|||||||||
|
Net income:
|
|
|
|
|
|
|
|
|
|||||||||||
|
Per basic share
|
$
|
2.81
|
|
$
|
3.66
|
|
$
|
3.60
|
|
$
|
2.99
|
|
$
|
2.36
|
|
||||
|
Per diluted share
|
2.79
|
|
3.61
|
|
3.53
|
|
2.92
|
|
2.33
|
|
|||||||||
|
Weighted-average basic shares outstanding
|
277,790
|
|
282,494
|
|
288,284
|
|
294,877
|
|
311,413
|
|
|||||||||
|
Weighted-average diluted shares outstanding
|
280,379
|
|
286,307
|
|
294,129
|
|
301,558
|
|
315,848
|
|
|||||||||
|
Dividends declared per common share
|
$
|
1.350
|
|
$
|
1.238
|
|
$
|
0.975
|
|
$
|
0.675
|
|
$
|
0.375
|
|
||||
|
Consolidated Percentage of Net Sales Data:
|
|
|
|
|
|
|
|
|
|||||||||||
|
Gross margin
|
68.6
|
%
|
72.9
|
%
|
72.8
|
%
|
72.7
|
%
|
73.0
|
%
|
|||||||||
|
Selling, general and administrative expenses
|
45.3
|
%
|
42.8
|
%
|
41.0
|
%
|
41.3
|
%
|
41.1
|
%
|
|||||||||
|
Operating margin
|
23.3
|
%
|
30.0
|
%
|
31.7
|
%
|
31.4
|
%
|
31.9
|
%
|
|||||||||
|
Net income
|
16.3
|
%
|
20.4
|
%
|
21.8
|
%
|
21.2
|
%
|
20.4
|
%
|
|||||||||
|
Consolidated Balance Sheet Data:
|
|
|
|
|
|
|
|
|
|||||||||||
|
Working capital
|
$
|
1,042,099
|
|
$
|
1,348,437
|
|
$
|
1,086,368
|
|
$
|
859,371
|
|
$
|
773,605
|
|
||||
|
Total assets
|
3,663,131
|
|
3,531,897
|
|
3,104,321
|
|
2,635,116
|
|
2,467,115
|
|
|||||||||
|
Cash, cash equivalents and investments
|
1,353,144
|
|
1,332,231
|
|
923,215
|
|
712,754
|
|
702,398
|
|
|||||||||
|
Inventory
|
526,175
|
|
524,706
|
|
504,490
|
|
421,831
|
|
363,285
|
|
|||||||||
|
Total debt
|
140,485
|
|
985
|
|
23,360
|
|
24,155
|
|
24,901
|
|
|||||||||
|
Stockholders' equity
|
2,420,653
|
|
2,409,158
|
|
1,992,931
|
|
1,612,569
|
|
1,505,293
|
|
|||||||||
24
|
Fiscal Year Ended
(1)
|
||||||||||||||
|
|
June 28,
2014
(2)(3)
|
June 29,
2013 (2)(3) |
June 30,
2012 (2)(3) |
July 2,
2011 (3) |
July 3,
2010 |
|||||||||
|
Coach Operated Store Data
|
|
|
|
|
|
|
|
|
|
|
||||
|
Stores open at fiscal year-end:
|
||||||||||||||
|
North American retail stores
|
332
|
|
351
|
|
354
|
|
345
|
|
342
|
|
||||
|
North American outlet stores
|
207
|
|
193
|
|
169
|
|
143
|
|
121
|
|
||||
|
Coach Japan locations
|
198
|
|
191
|
|
180
|
|
169
|
|
161
|
|
||||
|
Coach International, excluding Japan
|
277
|
|
218
|
|
188
|
|
142
|
|
101
|
|
||||
|
Total stores open at fiscal year-end
|
1,014
|
|
953
|
|
891
|
|
799
|
|
725
|
|
||||
|
Store square footage at fiscal year-end:
|
||||||||||||||
|
North American retail stores
|
910,003
|
|
952,422
|
|
959,099
|
|
936,277
|
|
929,580
|
|
||||
|
North American outlet stores
|
1,132,714
|
|
982,202
|
|
789,699
|
|
649,094
|
|
548,797
|
|
||||
|
Coach Japan locations
|
355,014
|
|
350,994
|
|
320,781
|
|
303,925
|
|
293,441
|
|
||||
|
Coach International, excluding Japan
|
563,981
|
|
417,573
|
|
344,615
|
|
240,873
|
|
164,522
|
|
||||
|
Total store square footage at fiscal year-end
|
2,961,712
|
|
2,703,191
|
|
2,414,194
|
|
2,130,169
|
|
1,936,340
|
|
||||
|
Average store square footage at fiscal year-end:
|
|
|
|
|
|
|
|
|
||||||
|
North American retail stores
|
2,741
|
|
2,713
|
|
2,709
|
|
2,714
|
|
2,718
|
|
||||
|
North American outlet stores
|
5,472
|
|
5,089
|
|
4,673
|
|
4,539
|
|
4,536
|
|
||||
|
Coach Japan locations
|
1,793
|
|
1,838
|
|
1,782
|
|
1,798
|
|
1,823
|
|
||||
|
Coach International, excluding Japan
|
2,036
|
|
1,915
|
|
1,833
|
|
1,696
|
|
1,629
|
|
||||
|
(1)
|
Coach’s fiscal year ends on the Saturday closest to June 30. Fiscal years 2014, 2013, 2012 and 2011 were each 52-week years. Fiscal year 2010 was a 53-week year.
|
|
(2)
|
The Company acquired its international businesses from its former distributors as follows: fiscal 2014 — the remaining 50% interest in Europe; fiscal 2013 — Malaysia and South Korea; fiscal 2012 — Singapore and Taiwan.
|
25
|
(3)
|
During fiscal years 2014, 2013, 2012 and 2011, the Company recorded certain items which affect the comparability of our results. See item 7, “Management’s Discussion and Analysis of Financial Condition and Results of Operations,” for further information on the items related to fiscal 2014, fiscal 2013 and fiscal 2012. Fiscal 2011 was impacted by the result of a favorable settlement of a multi-year tax return examination and charitable contributions. The following table reconciles the Company's reported results on a U.S. GAAP basis to our adjusted results that exclude these items:
|
|
Net Income
|
|||||||||||||||||||
|
Fiscal 2014
|
Gross Profit
|
SG&A
|
Operating Income
|
Amount
|
Per Diluted Share
|
||||||||||||||
|
As Reported: (GAAP Basis)
|
$
|
3,296,963
|
|
$
|
2,176,889
|
|
$
|
1,120,074
|
|
$
|
781,336
|
|
$
|
2.79
|
|
||||
|
Excluding items affecting comparability
|
82,192
|
|
(49,315
|
)
|
131,507
|
|
88,281
|
|
0.31
|
|
|||||||||
|
Adjusted: (Non-GAAP Basis)
|
$
|
3,379,155
|
|
$
|
2,127,574
|
|
$
|
1,251,581
|
|
$
|
869,617
|
|
$
|
3.10
|
|
||||
|
Net Income
|
|||||||||||||||||||
|
Fiscal 2013
|
Gross Profit
|
SG&A
|
Operating Income
|
Amount
|
Per Diluted Share
|
||||||||||||||
|
As Reported: (GAAP Basis)
|
$
|
3,698,148
|
|
$
|
2,173,607
|
|
$
|
1,524,541
|
|
$
|
1,034,420
|
|
$
|
3.61
|
|
||||
|
Excluding items affecting comparability
|
4,800
|
|
(48,402
|
)
|
53,202
|
|
32,568
|
|
0.11
|
|
|||||||||
|
Adjusted: (Non-GAAP Basis)
|
$
|
3,702,948
|
|
$
|
2,125,205
|
|
$
|
1,577,743
|
|
$
|
1,066,988
|
|
$
|
3.73
|
|
||||
|
Net Income
|
|||||||||||||||||||
|
Fiscal 2012
|
Gross Profit
|
SG&A
|
Operating Income
|
Amount
|
Per Diluted Share
|
||||||||||||||
|
As Reported: (GAAP Basis)
|
$
|
3,466,078
|
|
$
|
1,954,089
|
|
$
|
1,511,989
|
|
$
|
1,038,910
|
|
$
|
3.53
|
|
||||
|
Excluding items affecting comparability
|
—
|
|
(39,209
|
)
|
39,209
|
|
—
|
|
—
|
|
|||||||||
|
Adjusted: (Non-GAAP Basis)
|
$
|
3,466,078
|
|
$
|
1,914,880
|
|
$
|
1,551,198
|
|
$
|
1,038,910
|
|
$
|
3.53
|
|
||||
|
Net Income
|
|||||||||||||||||||
|
Fiscal 2011
|
Gross Profit
|
SG&A
|
Operating Income
|
Amount
|
Per Diluted Share
|
||||||||||||||
|
As Reported: (GAAP Basis)
|
$
|
3,023,541
|
|
$
|
1,718,617
|
|
$
|
1,304,924
|
|
$
|
880,800
|
|
$
|
2.92
|
|
||||
|
Excluding items affecting comparability
|
—
|
|
(25,678
|
)
|
25,678
|
|
—
|
|
—
|
|
|||||||||
|
Adjusted: (Non-GAAP Basis)
|
$
|
3,023,541
|
|
$
|
1,692,939
|
|
$
|
1,330,602
|
|
$
|
880,800
|
|
$
|
2.92
|
|
||||
26
The following discussion of Coach’s financial condition and results of operations should be read together with Coach’s consolidated financial statements and notes to those statements, included elsewhere in this document. When used herein, the terms “Coach,” “Company,” “we,” “us” and “our” refer to Coach, Inc., including consolidated subsidiaries.
EXECUTIVE OVERVIEW
Coach is a leading New York design house of modern luxury accessories and lifestyle collections. Our product offerings include fine accessories, gifts and certain seasonal lifestyle apparel collections for women and men.
Coach operates in two segments: North America and International. The North America segment includes sales to North American customers through Coach-operated stores (including the Internet) and sales to North American wholesale customers. The International segment includes sales to customers through Coach-operated stores (including the Internet) and concession shop-in-shops in Japan and mainland China, Coach-operated stores and concession shop-in-shops in Hong Kong, Macau, Singapore, Taiwan, Malaysia, South Korea, the United Kingdom, France, Ireland, Spain, Portugal, Germany and Italy, as well as sales to wholesale customers and distributors in approximately
35
countries. As Coach’s business model is based on multi-channel global distribution, our success does not depend solely on the performance of a single channel or geographic area.
In order to drive growth within our global business, we are focused on four key initiatives, which directly align with the Company's Transformation Plan, described below:
|
•
|
Grow our business in North America and worldwide, by transforming from a leading international accessories Company into a global lifestyle brand, anchored in luxury accessories.
|
|
•
|
Leverage the global opportunity for Coach by raising brand awareness and building market share in markets where Coach is under-penetrated, most notably in Asia and Europe. We are also developing the brand opportunity as we expand into South America and Central America.
|
|
•
|
Focus on the Men’s opportunity for the brand, by drawing on our long heritage in the category. We are capitalizing on this opportunity by opening new standalone and dual gender stores and broadening the men’s assortment in existing stores.
|
|
•
|
Harness the growing power of the digital world, accelerating the development of our digital programs and capabilities in North America and worldwide, reflecting the change in consumer shopping behavior globally. Our intent is to rapidly drive further innovation to engage with customers in this channel. Key elements include www.coach.com, our invitation-only outlet Internet site, our global e-commerce sites, marketing sites and social media.
|
In addition, during the fourth quarter of fiscal 2014, Coach announced a multi-year strategic plan with the objective of transforming the brand and reinvigorating growth, which will enable the Company to return to ‘best-in-class’ profitability. This multi-faceted, multi-year transformation plan (the "Transformation Plan") builds on the core brand equities of quality and craftsmanship with the aim of evolving our competitive value proposition. We believe our strategy offers significant growth opportunities in handbags and accessories, as well as in the broader set of lifestyle categories that we have operated in for some time but are less developed, including footwear and outerwear. This will require an integrated holistic approach, across product, stores and marketing and promotional activities. It will also entail the roll-out of carefully crafted aspirational marketing campaigns to define our brand to deliver a fuller and more consistent brand expression.
Key operational and cost measures needed in order to fund and execute this plan include: (i) the investment of approximately $500 million in capital improvements in our stores and wholesale locations in fiscal 2015 and fiscal 2016; (ii) the optimization of our North American store fleet including the closure of approximately 70 underperforming locations in fiscal 2015; (iii) the realignment of inventory levels to reflect our elevated product strategy in fiscal 2014; (iv) the investment of approximately $50 million in incremental advertising costs to further promote our new strategy starting in fiscal 2015; and (v) the significant scale-back of our promotional cadence, particularly within our outlet Internet sales site starting in fiscal 2014. The Company believes that long-term growth can be realized through its transformational efforts over time. For further discussion of charges incurred in connection with the Transformation Plan, see "Items Affecting Comparability," herein.
Current Trends and Outlook
In addition to the risks surrounding the successful execution of our Transformation Plan initiatives, our outlook reflects a certain level of uncertainty despite signs of improvement in the global economy. The global economic environment continues to negatively impact consumer confidence, which in turn influences the level of spending on discretionary items. Consumer retail traffic remains relatively weak and inconsistent, which has led to a more promotional environment due to increased competition and a desire to offset traffic declines with increased levels of conversion. If the global macroeconomic environment remains volatile
27
or worsens, the constrained level of worldwide consumer spending and modified consumption behavior may continue to have a negative effect on our trends in fiscal 2015.
We will continue to monitor these risks and evaluate and adjust our operating strategies and cost management opportunities to mitigate the related impact on our results of operations, while remaining focused on the long-term growth of our business and protecting the value of our brand.
For a detailed discussion of significant risk factors that have the potential to cause our actual results to differ materially from our expectations, see Part I, Item 1A - "Risk Factors" included in this Annual Report on Form 10-K.
28
SUMMARY — FISCAL
2014
In fiscal
2014
, we reported net sales of
$4.81 billion
, net income of
$781.3 million
and net income per diluted share of
$2.79
. This compares to net sales of
$5.08 billion
, net income of
$1.03 billion
, and net income per diluted share of
$3.61
in fiscal 2013. In fiscal 2014, the comparability of our operating results has been affected by
$131.5 million
of pretax charges ($88.3 million after tax or $0.31 per diluted share) related to our Transformation Plan. In fiscal 2013, the comparability of our operating results was affected by $53.2 million of pretax charges ($32.6 million after tax or $0.11 per diluted share) related to restructuring and transformation-related charges.
Our operating performance for fiscal
2014
reflected a decline in revenue of 5.3%, primarily due to decreased revenues from our North America business partially offset by gains in our International businesses. Excluding the effects of foreign currency, net sales decreased 3.1%. Our gross profit decreased by
10.8
% to
$3.30 billion
during fiscal
2014
which included the negative impact of charges under our Transformation Plan of $82.2 million. In fiscal 2013, restructuring and transformation-related charges negatively impacted gross profit by $4.8 million. Selling, general and administrative ("SG&A") expenses remained fairly consistent from fiscal 2013, however SG&A expense as a percentage of net sales increased by 250 basis points primarily due to higher selling expenses to support our International businesses as well as a decline in total Net sales. Excluding charges under our Transformation Plan in fiscal 2014 and restructuring and transformation-related charges in fiscal 2013, SG&A expenses remained fairly consistent.
Net income decreased in fiscal
2014
as compared to fiscal
2013
, primarily due to a decrease in operating income of
$404.4 million
, partially offset by a
$145.2 million
decrease in our provision for income taxes. Net income per diluted share decreased due to lower net income. Excluding charges under our Transformation Plan in fiscal 2014 and restructuring and transformation-related charges in fiscal 2013, net income decreased 18.5% and net income per diluted share decreased 16.9%.
FISCAL
2014
COMPARED TO FISCAL
2013
The following table summarizes results of operations for fiscal
2014
compared to fiscal
2013
. All percentages shown in the table below and the discussion that follows have been calculated using unrounded numbers.
|
Fiscal Year Ended
|
||||||||||||||||||||
|
|
June 28, 2014
|
June 29, 2013
|
Variance
|
|||||||||||||||||
|
|
(dollars in millions, except per share data)
|
|||||||||||||||||||
|
|
Amount
|
% of
net sales
|
Amount
|
% of
net sales
|
Amount
|
%
|
||||||||||||||
|
Net sales
|
$
|
4,806.2
|
|
100.0
|
%
|
$
|
5,075.4
|
|
100.0
|
%
|
$
|
(269.2
|
)
|
(5.3
|
)%
|
|||||
|
Gross profit
|
3,297.0
|
|
68.6
|
|
3,698.1
|
|
72.9
|
|
(401.1
|
)
|
(10.8
|
)
|
||||||||
|
Selling, general and administrative expenses
|
2,176.9
|
|
45.3
|
|
2,173.6
|
|
42.8
|
|
3.3
|
|
0.2
|
|
||||||||
|
Operating income
|
1,120.1
|
|
23.3
|
|
1,524.5
|
|
30.0
|
|
(404.4
|
)
|
(26.5
|
)
|
||||||||
|
Interest income, net
|
2.2
|
|
—
|
|
2.4
|
|
—
|
|
(0.2
|
)
|
(8.3
|
)
|
||||||||
|
Other expense
|
—
|
|
—
|
|
(6.4
|
)
|
(0.1
|
)
|
6.4
|
|
(100.0
|
)
|
||||||||
|
Provision for income taxes
|
340.9
|
|
7.1
|
|
486.1
|
|
9.6
|
|
(145.2
|
)
|
(29.9
|
)
|
||||||||
|
Net income
|
781.3
|
|
16.3
|
|
1,034.4
|
|
20.4
|
|
(253.1
|
)
|
(24.5
|
)
|
||||||||
|
Net income per share:
|
|
|
|
|
|
|
|
|
|
|
|
|
||||||||
|
Basic
|
$
|
2.81
|
|
|
|
$
|
3.66
|
|
|
|
$
|
(0.85
|
)
|
(23.2
|
)%
|
|||||
|
Diluted
|
2.79
|
|
|
|
3.61
|
|
|
|
(0.82
|
)
|
(22.7
|
)
|
||||||||
Items Affecting Comparability
The Company’s reported results are presented in accordance with accounting principles generally accepted in the United States of America (“GAAP”). The reported gross profit, selling, general and administrative expenses, operating income, income before provision for income taxes, provision for income taxes, net income and earnings per diluted share in fiscal
2014
and
2013
reflect certain items which affect the comparability of our results, as noted in the following tables. Refer to page 39 for a discussion on the Non-GAAP Measures.
29
COACH, INC.
GAAP TO NON-GAAP RECONCILIATION
For the Years Ended
June 28, 2014
and
June 29, 2013
(in millions, except per share data)
|
June 28, 2014
|
|||||||||||
|
|
GAAP Basis
(As Reported)
|
Transformation and Other Related Actions
|
Non-GAAP Basis
(Excluding Items)
|
||||||||
|
Gross profit
|
$
|
3,297.0
|
|
$
|
(82.2
|
)
|
$
|
3,379.2
|
|
||
|
Selling, general and administrative expenses
|
$
|
2,176.9
|
|
$
|
49.3
|
|
$
|
2,127.6
|
|
||
|
Operating income
|
$
|
1,120.1
|
|
$
|
(131.5
|
)
|
$
|
1,251.6
|
|
||
|
Income before provision for income taxes
|
$
|
1,122.3
|
|
$
|
(131.5
|
)
|
$
|
1,253.8
|
|
||
|
Provision for income taxes
|
$
|
340.9
|
|
$
|
(43.2
|
)
|
$
|
384.1
|
|
||
|
Net income
|
$
|
781.3
|
|
$
|
(88.3
|
)
|
$
|
869.6
|
|
||
|
Diluted net income per share
|
$
|
2.79
|
|
$
|
(0.31
|
)
|
$
|
3.10
|
|
||
|
June 29, 2013
|
|||||||||||
|
|
GAAP Basis
(As Reported)
|
Restructuring and Transformation-Related Charges
|
Non-GAAP Basis
(Excluding Items)
|
||||||||
|
Gross profit
|
$
|
3,698.1
|
|
$
|
(4.8
|
)
|
$
|
3,702.9
|
|
||
|
Selling, general and administrative expenses
|
$
|
2,173.6
|
|
$
|
48.4
|
|
$
|
2,125.2
|
|
||
|
Operating income
|
$
|
1,524.5
|
|
$
|
(53.2
|
)
|
$
|
1,577.7
|
|
||
|
Income before provision for income taxes
|
$
|
1,520.5
|
|
$
|
(53.2
|
)
|
$
|
1,573.7
|
|
||
|
Provision for income taxes
|
$
|
486.1
|
|
$
|
(20.6
|
)
|
$
|
506.7
|
|
||
|
Net income
|
$
|
1,034.4
|
|
$
|
(32.6
|
)
|
$
|
1,067.0
|
|
||
|
Diluted net income per share
|
$
|
3.61
|
|
$
|
(0.11
|
)
|
$
|
3.73
|
|
||
Items Affecting Comparability
Fiscal
2014
Items
Transformation and Other Related Actions
In fiscal
2014
, the Company incurred restructuring and transformation related charges of
$131.5 million
under its multi-year Transformation Plan as announced in the fourth quarter of fiscal 2014. The charges recorded in cost of sales and SG&A expenses were
$82.2 million
and
$49.3 million
, respectively. These charges, which are primarily associated with our North America business, relate to inventory and fleet related costs, including impairment, accelerated depreciation and severance related to store closures. Refer to the "Executive Overview" herein and Note 3, "Transformation, Restructuring and Other Related Actions," for further information regarding the Transformation Plan.
Additional actions will continue into fiscal 2015.
Fiscal
2013
Items
Restructuring and Transformation-Related Charges
In fiscal
2013
, the Company incurred restructuring and transformation related charges of $53.2 million. The charges recorded in selling, general and administrative expenses and cost of sales were $48.4 million and $4.8 million, respectively. The charges include the strategic reassessment of the Reed Krakoff business, streamlining our organizational model and reassessing the fleet of our retail stores and inventories.
Currency Fluctuation Effects
The change in net sales in fiscal
2014
has been presented both including and excluding currency fluctuation effects (primarily attributable to Coach Japan).
30
Net Sales
Net sales decreased 5.3% or
$269.2 million
to
$4.81 billion
. Excluding the effects of foreign currency, net sales decreased 3.1% or $155.9 million. The decrease was driven by lower sales in the North America business partially offset by gains in the International business. The following table presents net sales by reportable segment for fiscal
2014
compared to fiscal
2013
:
|
|
Fiscal Year Ended
|
||||||||||||||||||
|
|
Total Net Sales
|
Rate of
Change
|
Percentage of
Total Net Sales
|
||||||||||||||||
|
|
June 28,
2014 |
June 29, 2013
(1)
|
June 28,
2014 |
June 29, 2013
(1)
|
|||||||||||||||
|
|
(dollars in millions)
|
|
|
|
|||||||||||||||
|
North America
|
$
|
3,100.5
|
|
$
|
3,478.2
|
|
(10.9
|
)
|
%
|
64.5
|
|
%
|
68.5
|
|
%
|
||||
|
International
|
1,644.2
|
|
1,558.1
|
|
5.5
|
|
34.2
|
|
30.7
|
|
|||||||||
|
Other
(2)
|
61.5
|
|
39.1
|
|
57.5
|
|
1.3
|
|
0.8
|
|
|||||||||
|
Total net sales
|
$
|
4,806.2
|
|
$
|
5,075.4
|
|
(5.3
|
)
|
%
|
100.0
|
|
%
|
100.0
|
|
%
|
||||
|
(1)
|
In connection with the acquisition of the retail business in Europe, the Company evaluated the composition of its reportable segments and concluded that sales in this region should be included in the International segment. Accordingly, prior year comparable sales have been reclassified to conform to the current year presentation. See Note 7, "Acquisitions" and Note 16, "Segment Information" for more information.
|
|
(2)
|
Net sales in the Other category, which is not a reportable segment, consists of sales generated in ancillary channels, including licensing and disposition.
|
Comparable store sales measure sales performance at stores that have been open for at least 12 months, and includes sales from the Internet. Coach excludes new locations from the comparable store base for the first twelve months of operation. Comparable store sales have not been adjusted for store expansions given our planned capital investments in connection with the Transformation Plan.
North America Net Sales
decreased
10.9
% or $
377.7 million
to $
3.10 billion
. This decrease was primarily driven by lower comparable store sales of $460.5 million or 15% largely due to lower traffic, and lower wholesale sales of $26.1 million due to lower shipments. The Internet business had a negative impact, of over 1%, on comparable store sales which is attributable to the Company's decision to eliminate third-party Internet events and to limit access to our outlet Internet sales site. This decrease was partially offset by an increase of $143.5 million related to net new stores. Since the end of fiscal 2013, Coach opened a net 14 outlet stores, including one Men’s outlet store, and closed a net 19 retail stores.
International Net Sales
increased
5.5
% or $
86.1 million
to $
1.64 billion
. Excluding the unfavorable impact of foreign currency, primarily due to the Japanese yen, net sales increased $191.0 million or 12.3%. The increase in net sales was primarily due to double digit growth in China and Asia, excluding Japan, reflecting an increase of $152.4 million due to net new stores and positive comparable store sales, as well as a $40.5 million increase related to the acquisition of the Europe joint venture in the first quarter of fiscal 2014. Since fiscal 2013, excluding the impact of acquisitions, we opened 39 net new stores, with 34 net new stores in mainland China, Hong Kong and Macau and Japan, and five net new stores in the other regions. The acquisition of the European joint venture resulted in a transfer of an additional 18 stores to the Company’s direct control. Since the acquisition on July 1, 2013, Coach has also opened seven new stores and transitioned two stores from wholesale to direct control.
Gross Profit
Gross profit decreased
10.8
% or $401.1 million to $
3.30 billion
in fiscal
2014
from $
3.70 billion
in fiscal
2013
. Gross margin for fiscal
2014
was
68.6
% as compared to
72.9
% in fiscal
2013
. Excluding items affecting comparability of $82.2 million in fiscal 2014 and $4.8 million in fiscal 2013, gross profit decreased
8.7%
or $323.7 million to
$3.38 billion
from $3.70 billion in fiscal 2013, and gross margin was
70.3%
in fiscal 2014 as compared to 73.0% in fiscal 2013.
North America Gross Profit
decreased
15.1%
or $
353.1
million to $
1.99 billion
in fiscal
2014
. Gross margin decreased
310
basis points from
67.4%
in fiscal
2013
to
64.3%
in fiscal
2014
. The decrease in gross margin is due to a 210 basis point decline as a result of increased promotional activity, primarily in our outlet channel, and a 70 basis point decline as a result of selling products with a higher average unit cost as well as increased penetration of our broadened lifestyle categories.
31
International Gross Profit
increased
3.2%
or
$40.0
million to
$1.30
billion in fiscal
2014
. Gross margin decreased
180
basis points from
80.6%
in fiscal
2013
to
78.8%
in fiscal
2014
. The decrease in gross margin is primarily due to the negative translation effect of changes in foreign currency, primarily associated with fluctuations in the Japanese Yen. Other factors negatively impacting gross margin were increased promotions, selling products with a higher average unit cost, as well as increased penetration of our broadened lifestyle categories which were partially offset by the lower step-up of inventory as part of the purchase accounting related to our acquisitions.
Corporate Unallocated Gross Profit
decreased $92.6 million from $64.7 million in fiscal 2013 to a loss of $27.9 million in fiscal 2014. Excluding items affecting comparability of $82.2 million in fiscal 2014 and $4.8 million in fiscal 2013, gross profit decreased by $15.2 million from $69.5 million to $54.3 million in fiscal 2014, primarily due to less favorable production variances.
Selling, General and Administrative Expenses
SG&A expenses are comprised of four categories: (i) selling; (ii) advertising, marketing and design; (iii) distribution and customer service; and (iv) administrative. Selling expenses include store employee compensation, occupancy costs and supply costs, wholesale and retail account administration compensation globally and Coach international operating expenses. These expenses are affected by the number of Coach-operated stores open during any fiscal period and store performance, as compensation and rent expenses vary with sales. Advertising, marketing and design expenses include employee compensation, media space and production, advertising agency fees (primarily to support North America), new product design costs, public relations and market research expenses. Distribution and customer service expenses include warehousing, order fulfillment, shipping and handling, customer service and bag repair costs. Administrative expenses include compensation costs for “corporate” functions including: executive, finance, human resources, legal and information systems departments, as well as corporate headquarters occupancy costs, consulting and software expenses. Administrative expenses also include global equity compensation expense.
Coach includes inbound product-related transportation costs from our service providers within cost of sales. Coach, similar to some companies, includes certain transportation-related costs related to our distribution network in selling, general and administrative expenses rather than in cost of sales; for this reason, our gross margins may not be comparable to that of entities that include all costs related to their distribution network in cost of sales.
SG&A expenses increased
0.2%
or $3.3 million to
$2.18
billion in fiscal
2014
as compared to
$2.17
billion in fiscal
2013
, primarily driven by an increase in selling expenses. As a percentage of net sales, SG&A expenses increased to
45.3%
during fiscal
2014
as compared to
42.8%
during fiscal
2013
. Excluding items affecting comparability of $49.3 million in fiscal
2014
and $48.4 million in fiscal 2013, SG&A expenses increased $2.4 million from fiscal 2013; and SG&A expenses as a percentage of net sales increased, primarily due to the increase in selling expenses as a percentage of net sales, to 44.3% in fiscal 2014 from 41.9% in fiscal 2013.
Selling expenses were $1.55 billion, or 32.2% of net sales, in fiscal
2014
compared to $1.51 billion, or 29.8% of net sales, in fiscal
2013
. The dollar increase in selling expenses reflected increases in new store openings in our International business including the impact of acquiring our former partner Hackett’s 50% interest in our European joint venture. These expenses were mostly offset by a favorable impact of foreign currency exchange rates primarily related to Coach Japan and lower expenses in North America due to the divestiture of the Reed Krakoff business.
Advertising, marketing, and design costs were $242.3 million, or 5.0% of net sales, in fiscal
2014
, compared to $265.4 million, or 5.2% of net sales, during fiscal
2013
. The decrease was primarily due to the divestiture of the Reed Krakoff business. This decrease was partially offset by increased advertising, marketing, and design costs related to the Company’s transformation efforts.
Distribution and consumer service expenses of $87.2 million, or 1.8% of net sales, in fiscal
2014
, were fairly consistent with fiscal 2013 expenses of $86.1 million, or 1.7% of net sales.
Administrative expenses were $300.5 million, or 6.3% of net sales, in fiscal
2014
compared to $307.1 million, or 6.1% of net sales, during fiscal
2013
. Excluding items affecting comparability of $49.3 million in fiscal
2014
and $48.4 million in fiscal 2013, administrative expenses were $251.2 million, or 5.2% of net sales, in fiscal
2014
and $258.7 million, or 5.1% of net sales, in fiscal
2013
. Lower compensation expense was mostly offset by additional costs incurred as part of investments made in the business, particularly related to increased depreciation expense.
Operating Income
Operating income decreased
26.5%
or $404.4 million to
$1.12 billion
during fiscal
2014
as compared to
$1.52
billion in fiscal
2013
. Operating margin decreased to
23.3%
as compared to
30.0%
in fiscal
2013
. Excluding items affecting comparability of $131.5 million in fiscal 2014 and $53.2 million in fiscal 2013, operating income decreased 20.7% or $326.1 million to $1.25 billion from $1.58 billion in fiscal 2013; and operating margin was 26.0%, in fiscal
2014
as compared to 31.1% in fiscal 2013.
32
The following table presents operating income by reportable segment for fiscal
2014
compared to fiscal
2013
:
|
(dollars in millions)
|
|||||||||||||||
|
June 28, 2014
|
June 29, 2013
(1)
|
Variance
|
|||||||||||||
|
Amount
|
%
|
||||||||||||||
|
North America
|
$
|
1,164.1
|
|
$
|
1,460.0
|
|
$
|
(295.9
|
)
|
(20.3
|
)%
|
||||
|
International
|
555.7
|
|
582.2
|
|
(26.5
|
)
|
(4.6
|
)
|
|||||||
|
Other
(2)
|
34.2
|
|
30.0
|
|
4.2
|
|
14.0
|
|
|||||||
|
Corporate unallocated
|
(633.9
|
)
|
(547.7
|
)
|
(86.2
|
)
|
15.7
|
|
|||||||
|
Total operating income
|
$
|
1,120.1
|
|
$
|
1,524.5
|
|
$
|
(404.4
|
)
|
(26.5
|
)%
|
||||
|
(1)
|
In connection with the acquisition of the retail business in Europe, the Company evaluated the composition of its reportable segments and concluded that the operating income associated with this region should be included in the International segment. Accordingly, prior year comparable amounts have been reclassified to conform to the current year presentation. See Note 7, "Acquisitions" and Note 16, "Segment Information" for more information.
|
|
(2)
|
Operating income in the Other category, which is not a reportable segment, consists of sales and expenses generated in ancillary channels, including licensing and disposition.
|
North America Operating Income
decreased
20.3%
or
$295.9 million
to
$1.16 billion
in fiscal 2014 reflecting the decrease in gross profit of $
353.1
million which was partially offset by lower SG&A expenses of $57.2 million. The decrease in SG&A expenses was related to the absence of costs in fiscal 2014 related to the divestiture of the Reed Krakoff business and lower variable selling costs as a result of lower sales. Operating margin decreased
450
basis points to
37.5%
in fiscal 2014 from
42.0%
during the same period in the prior year due to lower gross margin of 310 basis points and higher SG&A expense as a percentage of net sales of 140 basis points.
International Operating Income
decreased
4.6%
or
$26.5 million
to
$555.7 million
primarily reflecting higher SG&A expenses of $66.5 million partially offset by higher gross profit of
$40.0 million
. The increase in SG&A expenses is related to a $53.7 million increase in China and Asia, excluding Japan, related to higher occupancy and employee costs associated with new store openings and a $45.8 million increase as a result of the recently acquired Europe business. The increase in SG&A costs was offset by foreign currency effects in Japan of $42.6 million. Operating margin decreased
360
basis points to
33.8%
in fiscal 2014 from
37.4%
during the same period in the prior year primarily due to lower gross margin of
180
basis points and higher overall selling expenses as a percentage of net sales which increased by 180 basis points.
Corporate Unallocated Operating Expense
increased $86.2 million to $633.9 million, an increase of 15.7%. This increase was primarily attributable higher charges incurred by the Company in fiscal 2014 as part its Transformation Plan. Excluding items affecting comparability, unallocated operating expenses increased by 1.6% or $7.9 million to $502.4 million from $494.5 million.
Provision for Income Taxes
The effective tax rate was 30.4% in fiscal 2014, as compared to 32.0% in fiscal 2013. Excluding the items affecting comparability, the effective tax rate was 30.6% and 32.2% in fiscal 2014 and fiscal 2013, respectively. Both fiscal 2014 and fiscal 2013 benefited from one-time discrete items. In fiscal 2014, the Company recognized a net benefit related to refinements of its various tax accounts which were partially offset by the loss of deductions related to changes in key executives. During fiscal 2013, the Company recognized a favorable tax settlement and the benefit of certain permanent adjustments related to executive compensation. These one-time discrete items favorably impacted our effective tax rate by approximately 220 basis points and 40 basis points in fiscal 2014 and fiscal 2013, respectively.
Net Income
Net income decreased
24.5%
or $253.1 million to
$781.3 million
in fiscal
2014
as compared to
$1.03
billion in fiscal
2013
. Excluding items of comparability, net income decreased 18.5% or $197.4 million to $869.6 million in fiscal
2014
from $1.07 billion in fiscal 2013. This decrease was primarily due to lower operating income partially offset by lower provision for income taxes.
Earnings per Share
Net income per diluted share decreased
22.7%
to
$2.79
in fiscal
2014
as compared to
$3.61
in fiscal
2013
. Excluding items of comparability, net income per diluted share decreased 16.9% or $0.63 to $3.10 in fiscal
2014
from $3.73 in fiscal 2013, due to lower net income.
33
FISCAL
2013
COMPARED TO FISCAL
2012
The following table summarizes results of operations for fiscal
2013
compared to fiscal
2012
. All percentages shown in the table below and the discussion that follows have been calculated using unrounded numbers.
|
Fiscal Year Ended
|
||||||||||||||||||||
|
|
June 29, 2013
|
June 30, 2012
|
Variance
|
|||||||||||||||||
|
|
(dollars in millions, except per share data)
|
|||||||||||||||||||
|
|
Amount
|
% of
net sales
|
Amount
|
% of
net sales
|
Amount
|
%
|
||||||||||||||
|
Net sales
|
$
|
5,075.4
|
|
100.0
|
%
|
$
|
4,763.2
|
|
100.0
|
%
|
$
|
312.2
|
|
6.6
|
%
|
|||||
|
Gross profit
|
3,698.1
|
|
72.9
|
|
3,466.1
|
|
72.8
|
|
232.0
|
|
6.7
|
|
||||||||
|
Selling, general and administrative expenses
|
2,173.6
|
|
42.8
|
|
1,954.1
|
|
41.0
|
|
219.5
|
|
11.2
|
|
||||||||
|
Operating income
|
1,524.5
|
|
30.0
|
|
1,512.0
|
|
31.7
|
|
12.5
|
|
0.8
|
|
||||||||
|
Provision for income taxes
|
486.1
|
|
9.6
|
|
466.8
|
|
9.8
|
|
19.3
|
|
4.1
|
|
||||||||
|
Net income
|
1,034.4
|
|
20.4
|
|
1,038.9
|
|
21.8
|
|
(4.5
|
)
|
(0.4
|
)
|
||||||||
|
Net Income per share:
|
|
|
|
|
|
|
|
|
||||||||||||
|
Basic
|
$
|
3.66
|
|
|
|
$
|
3.60
|
|
|
|
$
|
0.06
|
|
1.6
|
%
|
|||||
|
Diluted
|
3.61
|
|
|
|
3.53
|
|
|
|
0.08
|
|
2.3
|
|
||||||||
Items Affecting Comparability
The Company’s reported results are presented in accordance with GAAP. The reported gross profit, selling, general and administrative expenses, operating income, income before provision for income taxes, provision for income taxes, net income and earnings per diluted share in fiscal
2013
and
2012
reflect certain items which affect the comparability of our results, as noted in the following tables. Refer to page 39 for a discussion on the Non-GAAP Measures.
COACH, INC.
GAAP TO NON-GAAP RECONCILIATION
For the Years Ended
June 29, 2013
and
June 30, 2012
(in millions, except per share data)
|
June 29, 2013
|
|||||||||||
|
|
GAAP Basis
(As Reported)
|
Restructuring and
Transformation-Related Charges
|
Non-GAAP Basis
(Excluding Items)
|
||||||||
|
Gross profit
|
$
|
3,698.1
|
|
$
|
(4.8
|
)
|
$
|
3,702.9
|
|
||
|
Selling, general and administrative expenses
|
$
|
2,173.6
|
|
$
|
48.4
|
|
$
|
2,125.2
|
|
||
|
Operating income
|
$
|
1,524.5
|
|
$
|
(53.2
|
)
|
$
|
1,577.7
|
|
||
|
Income before provision for income taxes
|
$
|
1,520.5
|
|
$
|
(53.2
|
)
|
$
|
1,573.7
|
|
||
|
Provision for income taxes
|
$
|
486.1
|
|
$
|
(20.6
|
)
|
$
|
506.7
|
|
||
|
Net income
|
$
|
1,034.4
|
|
$
|
(32.6
|
)
|
$
|
1,067.0
|
|
||
|
Diluted net income per share
|
$
|
3.61
|
|
$
|
(0.11
|
)
|
$
|
3.73
|
|
||
34
|
June 30, 2012
|
|||||||||||||||
|
|
GAAP Basis
(As Reported)
|
Tax
Adjustment
|
Charitable Contribution
|
Non-GAAP Basis
(Excluding Items)
|
|||||||||||
|
Selling, general and administrative expenses
|
$
|
1,954.1
|
|
$
|
—
|
|
$
|
39.2
|
|
$
|
1,914.9
|
|
|||
|
Operating income
|
$
|
1,512.0
|
|
$
|
—
|
|
$
|
(39.2
|
)
|
$
|
1,551.2
|
|
|||
|
Income before provision for income taxes
|
$
|
1,505.7
|
|
$
|
—
|
|
$
|
(39.2
|
)
|
$
|
1,544.9
|
|
|||
|
Provision for income taxes
|
$
|
466.8
|
|
$
|
(23.9
|
)
|
$
|
(15.3
|
)
|
$
|
506.0
|
|
|||
|
Net income
|
$
|
1,038.9
|
|
$
|
23.9
|
|
$
|
(23.9
|
)
|
$
|
1,038.9
|
|
|||
|
Diluted net income per share
|
$
|
3.53
|
|
$
|
0.08
|
|
$
|
(0.08
|
)
|
$
|
3.53
|
|
|||
Items Affecting Comparability
Fiscal 2013 Items
Restructuring and Transformation-Related Charges
During fiscal
2013
, the Company incurred restructuring and transformation-related charges of $53.2 million. The charges recorded in selling, general and administrative expenses and cost of sales were $48.4 million and $4.8 million, respectively. The charges include the strategic reassessment of the Reed Krakoff business, streamlining our organizational model and reassessing the fleet of our retail stores and inventories.
Fiscal 2012 Items
Charitable Contributions and Tax Adjustments
During fiscal
2012
, the Company decreased the provision for income taxes by $23.9 million, primarily as a result of recording the effect of a revaluation of certain deferred tax asset balances due to a change in Japan’s corporate tax laws and the favorable settlement of a multi-year transfer pricing agreement with Japan. The Company used the net income favorability to contribute an aggregate $39.2 million to the Coach Foundation.
Currency Fluctuation Effects
The change in net sales in fiscal
2013
has been presented both including and excluding currency fluctuation effects (primarily attributable to Coach Japan).
Net Sales
Net sales increased 6.6% or $312.2 million to $5.08 billion. The increase was driven by gains in both the North American and International businesses.
The following table presents net sales by reportable segment for fiscal
2013
compared to fiscal
2012
:
|
Fiscal Year Ended
|
|||||||||||||||
|
|
Total Net Sales
|
Rate of
Change
|
Percentage of Total Net Sales
|
||||||||||||
|
|
June 29, 2013
(1)
|
June 30, 2012
(1)
|
June 29, 2013
(1)
|
June 30, 2012
(1)
|
|||||||||||
|
|
|||||||||||||||
|
(dollars in millions)
|
|||||||||||||||
|
North America
|
$
|
3,478.2
|
|
$
|
3,316.9
|
|
4.9%
|
68.5
|
%
|
69.7
|
%
|
||||
|
International
(1)
|
1,558.1
|
|
1,413.0
|
|
10.3
|
30.7
|
|
29.6
|
|
||||||
|
Other
(1)(2)
|
39.1
|
|
33.3
|
|
17.4
|
0.8
|
|
0.7
|
|
||||||
|
Total net sales
|
$
|
5,075.4
|
|
$
|
4,763.2
|
|
6.6%
|
100.0
|
%
|
100.0
|
%
|
||||
|
(1)
|
In connection with the acquisition of the retail business in Europe, the Company evaluated the composition of its reportable segments and concluded that sales in this region should be included in the International segment. Accordingly, fiscal 2013 and fiscal 2012 comparable sales have been reclassified to conform to the fiscal 2014 presentation. See Note 7, "Acquisitions" and Note 16, "Segment Information" for more information.
|
35
|
(2)
|
Net sales in the Other category, which is not a reportable segment, consists of sales generated in ancillary channels including licensing and disposition.
|
North America
Net sales increased
4.9%
to
$3.48 billion
during fiscal 2013 from
$3.32 billion
during fiscal 2012, primarily driven by sales from new and expanded stores. In fiscal 2013, North America comparable store sales increased $7.8 million or 0.3%, of which the North America Internet business contributed 9 points to comparable store sales growth. Since the end of fiscal 2012, Coach opened a net 24 factory stores, including 10 Men’s, closed three net retail stores, and expanded six factory and one retail store in North America.
International
Net sales increased
10.3
% to
$1.56
billion during fiscal
2013
from
$1.41
billion during fiscal
2012
, primarily driven by sales from new and acquisition-related stores. Strong comparable store sales performance in Asia, led by double-digit percentage growth in China, and increased shipments to international wholesale customers, driven by expanded distribution, were substantially offset by weak sales performance in Japan and by the negative foreign exchange impact of the Yen, which decreased net sales by $82.2 million. Since the end of fiscal 2012, International opened a net 42 new stores (excluding those acquired as a result of the acquisitions), with 30 net new stores in mainland China, Hong Kong and Macau, 11 net new stores in Japan and one net new store in the other regions. Fiscal 2013 results include net sales of the Company-operated Malaysia and South Korean businesses, which were acquired in the first quarter of 2013 as well as the benefit of a full year of net sales from Taiwan, which was purchased in the second quarter of fiscal 2012
Gross Profit
Gross profit increased 6.7% to $3.70 billion in fiscal 2013 from $3.47 billion during fiscal 2012. Gross margin in fiscal 2013 was 72.9% as compared to 72.8% during fiscal 2012. Excluding items affecting comparability of $4.8 million due to restructuring activities in 2013, gross profit increased 6.8% to $3.70 billion, or gross margin was 73.0%, in fiscal 2013.
North America Gross Profit
increased
3.7%
or
$82.7 million
to
$2.35 billion
in fiscal 2013. Gross margin decreased
80
basis points from
68.2%
in fiscal 2012 to
67.4%
in fiscal 2013, primarily due to increased promotional activity.
International Gross Profit
increased
10.2%
or
$116.1 million
to
$1.26 billion
in fiscal 2013. Gross margin remained consistent at
80.6%
both in fiscal 2013 and fiscal 2012.
Selling, General and Administrative Expenses
SG&A expenses increased 11.2% to $2.17 billion in fiscal 2013 as compared to $1.95 billion in fiscal 2012, driven by an increase in selling expenses. As a percentage of net sales, SG&A expenses increased to 42.8% during fiscal 2013 as compared to 41.0% during fiscal 2012. Excluding items affecting comparability of $48.4 million in fiscal 2013, SG&A expenses were 41.9% as a percentage of net sales, in fiscal 2013. Excluding items affecting comparability of $39.2 million in fiscal 2012, SG&A expenses were 40.2% as a percentage of net sales, in fiscal 2012.
Selling expenses were $1.51 billion, or 29.8% of net sales, in fiscal 2013 compared to $1.36 billion, or 28.5% of net sales, in fiscal 2012. The dollar increase in selling expenses was due to International stores reflecting higher sales and new store openings, and higher North American Internet expenses reflecting higher sales. International selling expenses overall increased as a percentage of sales, due to the acquisitions of the South Korea and Malaysia businesses and infrastructure investments to support Asia. China store expenses as a percentage of sales decreased primarily due to operating efficiencies and sales leverage.
Advertising, marketing, and design costs were $265.4 million, or 5.2% of net sales, in fiscal 2013, compared to $245.2 million, or 5.1% of net sales, during fiscal 2012. The dollar increase was primarily due to creative and design expenditures and marketing expenses related to digital media and consumer communications, which includes our digital strategy through www.coach.com, the launch of our Legacy line, marketing sites and social networking. The Company utilizes and continues to explore implementing new technologies such as our global web presence, social networking and blogs as cost-effective consumer communication opportunities to increase online and store sales and build brand awareness.
Distribution and consumer service expenses were $86.1 million, or 1.7% of net sales, in fiscal 2013, compared to $68.9 million, or 1.4% of net sales, in fiscal 2012. The increase in distribution and consumer service expenses is primarily the result of the change in sales mix to Internet purchases, resulting in increased packaging and shipping expense per dollar of sales.
Administrative expenses were $307.1 million, or 6.1% of net sales, in fiscal 2013 compared to $282.2 million, or 5.9% of net sales, during fiscal 2012. The dollar increase is due to the restructuring and transformation-related charges, increased equity compensation and systems investment to support international expansion. These increases were partially offset by the absence of a charitable contribution in fiscal 2013. Excluding items affecting comparability of $48.4 million in fiscal 2013, administrative expenses were $258.7 million, or 5.1% as a percentage of net sales, in fiscal 2013. Excluding items affecting comparability of $39.2 million in fiscal 2012, administrative expenses were $243.0 million, or 5.1% as a percentage of net sales, in fiscal 2012.
36
Operating Income
Operating income increased 0.8% or $12.5 million to $1.52 billion during fiscal 2013 as compared to $1.51 billion in fiscal 2012. Operating margin decreased to 30.0% as compared to 31.7% in fiscal 2012. Excluding items affecting comparability, operating income increased 1.7% or $26.5 million to $1.58 billion, and operating margin was 31.1%, in fiscal 2013. Excluding items affecting comparability, operating income was $1.55 billion, or operating margin was 32.6%, in fiscal 2012.
The following table presents operating income by reportable segment for fiscal 2013 compared to fiscal 2012:
|
(dollars in millions)
|
|||||||||||||||
|
June 29, 2013
(1)
|
June 30, 2012
(1)
|
Variance
|
|||||||||||||
|
Amount
|
%
|
||||||||||||||
|
North America
|
$
|
1,460.0
|
|
$
|
1,448.0
|
|
$
|
12.0
|
|
0.8
|
%
|
||||
|
International
|
582.2
|
|
557.7
|
|
24.5
|
|
4.4
|
|
|||||||
|
Other
(2)
|
30.0
|
|
26.5
|
|
3.5
|
|
13.2
|
|
|||||||
|
Corporate unallocated
|
(547.7
|
)
|
(520.2
|
)
|
(27.5
|
)
|
5.3
|
|
|||||||
|
Total operating income
|
$
|
1,524.5
|
|
$
|
1,512.0
|
|
$
|
12.5
|
|
0.8
|
%
|
||||
|
(1)
|
In connection with the acquisition of the retail business in Europe, the Company evaluated the composition of its reportable segments and concluded that the operating income associated with this region should be included in the International segment. Accordingly, fiscal 2013 and fiscal 2012 comparable amounts have been reclassified to conform to the fiscal 2014 presentation. See Note 7, "Acquisitions" and Note 16, "Segment Information" for more information.
|
|
(2)
|
Operating income in the Other category, which is not a reportable segment, consists of sales and expenses generated in ancillary channels, including licensing and disposition.
|
North America Operating Income
increased 0.8% or $12.0 million to $1.46 billion in fiscal 2013 reflecting the increase in gross profit of
$82.7 million
which was offset by higher SG&A expenses of $70.7 million. The increase in SG&A expenses was related to transformation-related store investments, distribution costs associated with higher internet sales, and higher overall selling expenses. Operating margin decreased 170 basis points to 42.0% in fiscal 2013 from 43.7% in fiscal 2012 primarily due to higher overall selling expenses as a percentage of revenues.
International Operating Income
increased 4.4% or $24.5 million to $582.2 million in fiscal 2013 primarily reflecting the increase in gross profit of
$116.1 million
which was partially offset by higher SG&A expenses of $91.6 million. SG&A expenses increased due to the acquisition of our distributor businesses in Asia and additional costs incurred related to increased sales. Operating margin decreased 210 basis points to 37.4% in fiscal 2013 from 39.5% in fiscal 2012 primarily due to investments made in the region.
Corporate Unallocated Operating Loss
increased $27.5 million to $547.7 million in fiscal 2013, an increase of 5.3%. Excluding items affecting comparability, net expenses related to Corporate Unallocated increased $13.5 million to $494.5 million, an increase of 2.8%. The increase in Corporate Unallocated loss was attributable to (i) higher administrative and information costs (ii) advertising, marketing and design costs and (iii) distribution and customer services expenses. These expenses were substantially offset by favorable production variances, particularly for labor.
Provision for Income Taxes
The effective tax rate was 32.0% in fiscal 2013, as compared to the 31.0% effective tax rate in fiscal 2012. During fiscal 2013, the Company recognized a favorable tax settlement and the benefit of certain permanent adjustments related to executive compensation. During fiscal 2012, the Company recorded the effect of a revaluation of certain deferred tax asset balances due to a change in Japan’s corporate tax laws, the favorable completion of a multi-year transfer pricing agreement with Japan and a favorable tax settlement. Excluding the items affecting comparability, the effective tax rate was 32.2% and 32.8% in fiscal 2013 and 2012, respectively. The decline reflects the favorable tax settlement and the benefit of certain permanent adjustments related to executive compensation, as well as the Company earning a higher proportion of its profits in lower tax rate jurisdictions.
Net Income
Net income decreased 0.4% to $1.03 billion in fiscal 2013 as compared to $1.04 billion in fiscal 2012. Excluding items affecting comparability, net income increased 2.7% to $1.07 billion in fiscal 2013, reflecting a 1.9% increase in income before provision for income taxes and the lower effective tax rate.
37
Earnings per Share
Diluted earnings per share grew 2.3% to $3.61 in fiscal 2013 as compared to $3.53 in fiscal 2012. Excluding items of comparability, net income per diluted share grew 5.5% to $3.73 in fiscal 2013, reflecting share leverage due to repurchases of Coach’s common stock and the higher net income.
38
FISCAL
2014
, FISCAL
2013
AND FISCAL
2012
ITEMS AFFECTING COMPARABILITY OF OUR FINANCIAL RESULTS
Non-GAAP Measures
The Company’s reported results are presented in accordance with GAAP. The reported gross profit, SG&A expenses, operating income, provision for income taxes, net income and earnings per diluted share in fiscal
2014
, fiscal
2013
and fiscal
2012
reflect certain items which affect the comparability of our results, including the impact of the fiscal 2014 Transformation Plan and fiscal 2013 restructuring and transformation-related charges. These metrics are also reported on a non-GAAP basis for these fiscal years to exclude the impact of these items.
These non-GAAP performance measures were used by management to conduct and evaluate its business during its regular review of operating results for the periods affected. Management and the Company’s Board utilized these non-GAAP measures to make decisions about the uses of Company resources, analyze performance between periods, develop internal projections and measure management performance. The Company’s primary internal financial reporting excluded these items affecting comparability. In addition, the compensation committee of the Company’s Board used these non-GAAP measures when setting and assessing achievement of incentive compensation goals.
Additionally, certain increases and decreases in operating results for the Company and its International segment (including Coach Japan) have been presented both including and excluding currency fluctuation effects from translating foreign-denominated amounts into U.S. dollars and compared to the same period in the prior fiscal year.
We believe these non-GAAP measures are useful to investors in evaluating the Company’s ongoing operating and financial results and understanding how such results compare with the Company’s historical performance. Additionally, we believe presenting certain increases and decreases that include and exclude the effect of foreign currency fluctuations helps investors and analysts understand the effect of significant year-over-year currency fluctuations. We believe excluding the items affecting comparability assists investors in developing expectations of future performance. By providing the non-GAAP measures, as a supplement to GAAP information, we believe we are enhancing investors’ understanding of our business and our results of operations. The non-GAAP financial measures are limited in their usefulness and should be considered in addition to, and not in lieu of, U.S. GAAP financial measures. Further, these non-GAAP measures may be unique to the Company, as they may be different from non-GAAP measures used by other companies.
For a detailed discussion on these non-GAAP measures, see the Results of Operations section within Item 7. "Management’s Discussion and Analysis of Financial Condition and Results of Operations."
39
The comparisons of our financial results are affected by the following items included in our reported results:
|
Fiscal Year Ended
|
|||||||||||
|
|
(dollars in millions, except per share data)
|
||||||||||
|
|
June 28, 2014
(1)
|
June 29, 2013
(1)
|
June 30, 2012
(2)
|
||||||||
|
Gross profit
|
|
|
|
|
|
|
|||||
|
Transformation and other related charges
|
$
|
(82.2
|
)
|
$
|
(4.8
|
)
|
$
|
—
|
|
||
|
Total Gross profit impact
|
$
|
(82.2
|
)
|
$
|
(4.8
|
)
|
$
|
—
|
|
||
|
SG&A
|
|
|
|
|
|||||||
|
Transformation and other related charges
|
$
|
49.3
|
|
$
|
48.4
|
|
$
|
—
|
|
||
|
Charitable foundation contribution
|
—
|
|
—
|
|
39.2
|
|
|||||
|
Total Operating income impact
|
$
|
49.3
|
|
$
|
48.4
|
|
$
|
39.2
|
|
||
|
Operating income
|
|
|
|
|
|||||||
|
Transformation and other related charges
|
$
|
(131.5
|
)
|
$
|
(53.2
|
)
|
$
|
—
|
|
||
|
Charitable foundation contribution
|
—
|
|
—
|
|
(39.2
|
)
|
|||||
|
Total Operating income impact
|
$
|
(131.5
|
)
|
$
|
(53.2
|
)
|
$
|
(39.2
|
)
|
||
|
Provision for income taxes
|
|
|
|
|
|||||||
|
Transformation and other related charges
|
$
|
(43.2
|
)
|
$
|
(20.6
|
)
|
$
|
—
|
|
||
|
Charitable foundation contribution
|
—
|
|
—
|
|
(15.3
|
)
|
|||||
|
Tax adjustments
|
—
|
|
—
|
|
(23.9
|
)
|
|||||
|
Total Provision for income taxes impact
|
$
|
(43.2
|
)
|
$
|
(20.6
|
)
|
$
|
(39.2
|
)
|
||
|
Net income
|
|
|
|
|
|||||||
|
Transformation and other related charges
|
$
|
(88.3
|
)
|
$
|
(32.6
|
)
|
$
|
—
|
|
||
|
Charitable foundation contribution
|
—
|
|
—
|
|
(23.9
|
)
|
|||||
|
Tax adjustments
|
—
|
|
—
|
|
23.9
|
|
|||||
|
Total Net income impact
|
$
|
(88.3
|
)
|
$
|
(32.6
|
)
|
$
|
—
|
|
||
|
Diluted earnings per share
|
|
|
|
|
|||||||
|
Transformation and other related charges
|
$
|
(0.31
|
)
|
$
|
(0.11
|
)
|
$
|
—
|
|
||
|
Charitable foundation contribution
|
—
|
|
—
|
|
(0.08
|
)
|
|||||
|
Tax adjustments
|
—
|
|
—
|
|
0.08
|
|
|||||
|
Total Diluted earnings per share impact
|
$
|
(0.31
|
)
|
$
|
(0.11
|
)
|
$
|
—
|
|
||
|
(1)
|
Fiscal 2014 charges relate to costs incurred under the Company's Transformation Plan. Fiscal 2013 charges primarily related to corporate restructuring-related expenses and impairment charges related to retail stores and inventory. See Note 3, "Transformation, Restructuring and Other Related Actions," for further information.
|
|
(2)
|
Charitable contributions precisely offset the benefit of tax settlements in fiscal 2012, representing a revaluation of certain Japan related deferred tax asset balances due to a change in Japan's corporate tax laws.
|
40
FINANCIAL CONDITION
Cash Flows
|
Fiscal Year Ended
|
||||||||||||
|
(dollars in millions)
|
June 28,
2014
|
June 29,
2013
|
Change
|
|||||||||
|
Net cash provided by operating activities
|
$
|
985,410
|
|
$
|
1,413,974
|
|
$
|
(428,564
|
)
|
|||
|
Net cash used in investing activities
|
(707,708
|
)
|
(570,500
|
)
|
(137,208
|
)
|
||||||
|
Net cash used in financing activities
|
(748,049
|
)
|
(689,106
|
)
|
(58,943
|
)
|
||||||
|
Effect of exchange rate changes on cash and cash equivalents
|
(515
|
)
|
(8,798
|
)
|
8,283
|
|
||||||
|
Net (decrease)/increase in cash and cash equivalents
|
$
|
(470,862
|
)
|
$
|
145,570
|
|
$
|
(616,432
|
)
|
|||
The Company’s cash and cash equivalents decreased
$470.9
million in fiscal 2014 compared to an increase of
$145.6
million in fiscal 2013. The year-over-year change is primarily driven by declines in net cash provided by operations as well as an increase in net investments purchased during fiscal 2014.
Net cash provided by operating activities
Net cash provided by operating activities decreased
$428.6
million primarily due to changes in our operating asset and liability balances and lower net income partially offset by higher non-cash expenses. Other balance sheet changes, which primarily relate to other assets, were a use of cash of $64.2 million in fiscal 2014 due to an increase in tax receivables. This compares to a $39.7 million source of cash in fiscal 2013. Accrued liabilities were a lower source of cash in fiscal 2014 of $14.1 million as compared to a source of cash of $98.9 million in fiscal 2013. This was primarily driven by lower compensation-related accruals at the end of fiscal 2014. Accounts payable were a use of cash in fiscal 2014 of $30.2 million as compared to a source of cash of $30.4 million in fiscal 2013, driven by the timing of payments related to inventory purchases. The increase in non-cash expenses reflected higher transformation and restructuring charges and higher depreciation and amortization expenses partially offset by lower share-based compensation expense and the year-over-year change in the deferred income tax provision.
Net cash used in investing activities
Net cash used in investing activities was
$707.7
million in fiscal
2014
compared to
$570.5
million in fiscal
2013
, with the increase of
$137.2
million primarily due to a net increase in our investment portfolio of $226.3 million, partially offset by a decline in cash used for acquisitions and related advances to distributors of $49.6 million.
Net cash used in financing activities
Net cash used in financing activities was
$748.0
million in fiscal
2014
, or an increase of
$58.9
million as compared to the prior fiscal year. This net increase was primarily attributable to higher cash used of $124.9 million related to common stock repurchases, higher dividend payments of $36.8 million as result of an increased dividend rate per share and $31.8 million due to lower net proceeds from share-based awards. These increases were partially offset by net borrowings of $140.0 million under the Company's revolving credit facility.
Revolving Credit Facilities
On June 18, 2012, the Company established a $400 million revolving credit facility with certain lenders and JP Morgan Chase Bank, N.A. as the primary lender and administrative agent (the “JP Morgan facility”) with a maturity date of June 2017. On March 26, 2013, the Company amended the JP Morgan facility to expand available aggregate revolving commitments to $700 million and to extend the maturity date to March 26, 2018. The JP Morgan facility is available to finance the seasonal working capital requirements and general corporate purposes of the Company and its subsidiaries. At Coach’s request and lenders’ consent, revolving commitments of the JP Morgan facility may be increased to $1 billion. At
June 28, 2014
there was $140.0 million outstanding under the JP Morgan facility. Our average borrowings outstanding for fiscal 2014 was $93.9 million. We had no revolving credit borrowings outstanding in fiscal 2013.
Borrowings under the JP Morgan Facility bear interest at a rate per annum equal to, at Coach’s option, either (a) a rate based on the rates applicable for deposits in the interbank market for U.S. dollars or the applicable currency in which the loans are made plus an applicable margin or (b) an alternate base rate (which is a rate equal to the greatest of (i) the Prime Rate in effect on such day, (ii) the Federal Funds Effective Rate in effect on such day plus ½ of 1% or (iii) the Adjusted LIBO Rate for a one month Interest Period on such day plus 1%). Additionally, Coach pays a commitment fee on the average daily unused amount of the JP Morgan Facility. At
June 28, 2014
, the commitment fee was 9 basis points.
The JP Morgan facility contains various covenants and customary events of default. As of June 28, 2014, no known events of default have occurred under the JP Morgan facility.
41
Coach Japan maintains credit facilities with several Japanese financial institutions to provide funding for working capital and general corporate purposes, with maximum borrowing capacity of 5.3 billion yen, or approximately $52 million at
June 28, 2014
. Interest is based on the Tokyo Interbank rate plus a margin of 25 to 30 basis points. At
June 28, 2014
and during fiscal
2014
, there were no outstanding borrowings under these facilities.
Coach Shanghai Limited maintains a credit facility to provide funding for working capital and general corporate purposes, with a maximum borrowing capacity of 63.0 million Chinese renminbi, or approximately $10 million at
June 28, 2014
. Interest is based on the People's Bank of China rate. At
June 28, 2014
and during fiscal
2014
, there were no outstanding borrowings under this facility.
Both the Coach Japan and Coach Shanghai Limited credit facilities can be terminated at any time by either party, and there is no guarantee that they will be available to the Company in future periods.
Common Stock Repurchase Program
In October 2012, the Company’s Board of Directors approved a common stock repurchase program to acquire up to $1.5 billion of Coach’s outstanding common stock through June 2015.
Purchases of Coach common stock are made subject to market conditions and at prevailing market prices, through open market purchases. Under Maryland law, Coach’s state of incorporation, treasury shares are not allowed. As a result, all repurchased shares are retired when acquired. The Company may terminate or limit the stock repurchase program at any time.
During fiscal
2014
and fiscal
2013
, the Company repurchased and retired
10.2
million and
7.1
million shares, respectively, or
$524.9
million and
$400.0
million of common stock, respectively, at an average cost of
$51.27
and
$56.61
, respectively. As of
June 28, 2014
, Coach had
$836.7
million remaining in the stock repurchase program.
Liquidity and Capital Resources
Our sources of liquidity are the cash flows generated from our operations, our available cash and cash equivalents and short-term investments, our non-current investments, the $700 million available under our JP Morgan facility, the availability under our Japan and Shanghai credit facilities, and other potential fixed-financing options available to us in the credit and capital markets. Substantially all of our cash and short-term investments are held outside the U.S. in jurisdictions where we intend to permanently reinvest our undistributed earnings to support our continued growth. We are not dependent on foreign cash to fund our domestic operations. We believe that our existing sources of liquidity, including our ability to access credit and capital markets when needed, will be sufficient to support our operating, capital, and debt service requirements for the foreseeable future, our plans for further business expansion and transformation-related initiatives.
We had $140 million in revolving credit borrowings outstanding under our credit facilities as of
June 28, 2014
. We will continue to draw on our credit facilities or access other sources of financing for, among other things, funding our investment in the Hudson Yards joint venture, our transformation-related initiatives, a material acquisition, settlement of a material contingency (including uncertain tax positions), or a material adverse business or macroeconomic development, as well as for other general corporate business purposes. This is expected to lead to increased outstanding debt during fiscal 2015.
We believe that our JP Morgan facility is adequately diversified with no undue concentrations in any one financial institution. As of
June 28, 2014
, there were nine financial institutions participating in the facility, with no one participant maintaining a maximum commitment percentage in excess of 16%. We have no reason at this time to believe that the participating institutions will be unable to fulfill their obligations to provide financing in accordance with the terms of the facility in the event we elect to draw funds in the foreseeable future.
For the fiscal year ending June 27, 2015, excluding expected capital expenditures related to the Hudson Yards joint venture of approximately $90 to $125 million, which are in addition to our joint venture contributions, the Company expects total capital expenditures to be approximately $300 to $350 million. Capital expenditures will be primarily for capital investments in stores in North America and new stores in Asia and Europe to support our transformation-related initiatives. We will also continue to invest in department store and distributor locations and corporate infrastructure, primarily technology.
Because Coach products are frequently given as gifts, Coach experiences seasonal variations in its net sales, operating cash flows and working capital requirements, primarily related to seasonal holiday shopping. During the first fiscal quarter, Coach builds inventory for the holiday selling season. In the second fiscal quarter, its working capital requirements are reduced substantially as Coach generates higher net sales and operating income, especially during the holiday months of November and December. Fluctuations in net sales, operating income and operating cash flows in any fiscal quarter may be affected by other events affecting retail sales, such as adverse weather conditions.
In April 2013, the Company entered into a joint venture agreement with the Related Companies, L.P. to develop a new office tower in Manhattan in the Hudson Yards district. The formation of the joint venture serves as a financing vehicle for the project, with the Company owning less than 43% of the joint venture. Upon completion of the office tower in fiscal 2016, the Company
42
will retain a condominium interest serving as its new corporate headquarters. During fiscal
2014
, the Company invested $87.2 million in the joint venture. The Company expects to invest approximately $350 million over the next two years, of which and depending on construction progress, the Company’s latest estimate contemplates an investment of approximately $240 million in fiscal 2015. Outside of the joint venture, Coach is directly investing in aspects of the new corporate headquarters. In fiscal
2014
, $2.1 million was included in capital expenditures and we expect an additional $188 million over the period of construction. The joint venture investments and capital expenditures will be financed by the Company with cash on hand, debt and approximately $130 million of proceeds from the sale of its current headquarters buildings expected in fiscal 2016.
Management believes that cash flow from operations, access to the credit and capital markets and our credit lines, on hand cash and cash equivalents and our investments will provide adequate funds for the foreseeable working capital needs, planned capital expenditures and dividend payments. Any future acquisitions or joint ventures, and other similar transactions may require additional capital. There can be no assurance that any such capital will be available to Coach on acceptable terms or at all. Coach’s ability to fund its working capital needs, planned capital expenditures, dividend payments and scheduled debt payments, as well as to comply with all of the financial covenants under its debt agreements, depends on its future operating performance and cash flow, which in turn are subject to prevailing economic conditions and to financial, business and other factors, some of which are beyond Coach’s control.
Contractual and Other Obligations
Firm Commitments
As of
June 28, 2014
, Coach’s contractual obligations are as follows:
|
(dollars in millions)
|
Total
|
Fiscal
2015
|
Fiscal
2016 – 2017
|
Fiscal
2018 – 2019
|
Fiscal 2020
and Beyond
|
|||||||||||||||
|
Capital expenditure commitments
|
$
|
15.9
|
|
$
|
15.9
|
|
$
|
—
|
|
$
|
—
|
|
$
|
—
|
|
|||||
|
Inventory purchase obligations
|
533.5
|
|
533.5
|
|
—
|
|
—
|
|
—
|
|
||||||||||
|
New corporate headquarters joint venture
(1)
|
350.0
|
|
240.0
|
|
110.0
|
|
—
|
|
—
|
|
||||||||||
|
Operating leases
|
1,210.9
|
|
208.5
|
|
353.1
|
|
243.4
|
|
405.9
|
|
||||||||||
|
Other
|
9.1
|
|
1.1
|
|
6.2
|
|
1.8
|
|
—
|
|
||||||||||
|
Total
|
$
|
2,119.4
|
|
$
|
999.0
|
|
$
|
469.3
|
|
$
|
245.2
|
|
$
|
405.9
|
|
|||||
|
(1)
|
Payments are estimated and may vary based on construction progress.
|
Excluded from the above contractual obligations table is the non-current liability for unrecognized tax benefits of $188.7 million as of June 28, 2014, as we cannot make a reliable estimate of the period in which the liability will be settled, if ever. The above table also excludes amounts included in current liabilities in the Consolidated Balance Sheet at
June 28, 2014
as these items will be paid within one year, certain long-term liabilities not requiring cash payments and cash contributions for the Company’s pension plans.
Off-Balance Sheet Arrangements
In addition to the commitments included in the table above, we have outstanding letters of credit $5.6 million as of
June 28, 2014
, primarily serving to collateralize our obligation to third parties for insurance claims and value-added tax refunds. These letters of credit expire at various dates through 2015.
As discussed earlier, the Company entered into a joint venture agreement with the Related Companies, L.P. to develop a new office tower in Manhattan in the Hudson Yards district, in April 2013. The formation of the Hudson Yards joint venture serves as a financing vehicle for the project. Construction of the new building has commenced and upon completion of the office tower in fiscal 2016, Coach will retain a condominium interest serving as its new corporate headquarters. The Hudson Yards joint venture is determined to be a variable interest entity primarily due to the fact that it has insufficient equity to finance its activities without additional subordinated financial support from its
two
joint venture partners. Coach is not considered the primary beneficiary of the entity primarily because we do not have the power to direct the activities that most significantly impact the entity’s economic performance. The Company’s maximum loss exposure is limited to the committed capital.
We do not maintain any other off-balance sheet arrangements, transactions, obligations, or other relationships with unconsolidated entities that would be expected to have a material current or future effect on our consolidated financial statements. Refer to Note 12, "Commitments and Contingencies," to the accompanying audited consolidated financial statements for further information.
43
CRITICAL ACCOUNTING POLICIES AND ESTIMATES
The preparation of financial statements in conformity with accounting principles generally accepted in the United States of America requires management to make estimates and assumptions that affect our results of operations, financial condition and cash flows as well as the disclosure of contingent assets and liabilities as of the date of the Company's financial statements. Actual results could differ from estimates in amounts that may be material to the financial statements. Predicting future events is inherently an imprecise activity and, as such, requires the use of judgment. Actual results could differ from estimates in amounts that may be material to the financial statements. The development and selection of the Company’s critical accounting policies and estimates are periodically reviewed with the Audit Committee of the Board.
The accounting policies discussed below are considered critical because changes to certain judgments and assumptions inherent in these policies could affect the financial statements. For more information on Coach’s accounting policies, please refer to the Notes to Consolidated Financial Statements.
Inventories
The Company’s inventories are reported at the lower of cost or market. Inventory costs include material, conversion costs, freight and duties and are determined by the first-in, first-out method. The Company reserves for slow-moving and aged inventory based on historical experience, current product demand and expected future demand. A decrease in product demand due to changing customer tastes, buying patterns or increased competition could impact Coach’s evaluation of its slow-moving and aged inventory and additional reserves might be required. Estimates may differ from actual results due to the quantity, quality and mix of products in inventory, consumer and retailer preferences and market conditions. At
June 28, 2014
, a 10% change in the reserve for slow-moving and aged inventory, excluding amounts associated with the Transformation Plan, would have resulted in an insignificant change in inventory and cost of sales. In fiscal 2014, the Company made a strategic decision to donate and destroy certain inventory items resulting in a charge to cost of sales of $82.2 million. Refer to Note 3, "Transformation, Restructuring and Other Related Actions," for charges related to inventory under the Company's Transformation Plan.
Revenue Recognition
Revenue is recognized by the Company when there is persuasive evidence of an arrangement, delivery has occurred (and risks and rewards of ownership have been transferred to the buyer), price has been fixed or is determinable, and collectability is reasonably assured.
Retail store and concession-based shop-in-shop revenues are recognized at the point of sale, which occurs when merchandise is sold in an over-the-counter consumer transaction. These revenues are recognized net of estimated returns at the time of sale to consumers. Internet revenue from sales of products ordered through the Company’s e-commerce sites is recognized upon delivery and receipt of the shipment by its customers and includes shipping and handling charges paid by customers. Internet revenue is also reduced by an estimate for returns.
Wholesale revenue is recognized at the time title passes and risk of loss is transferred to customers. Wholesale revenue is recorded net of estimates of returns, discounts, and markdown allowances. Returns and allowances require pre-approval from management and discounts are based on trade terms. Estimates for markdown reserves are based on historical trends, actual and forecasted seasonal results, an evaluation of current economic and market conditions, retailer performance, and, in certain cases, contractual terms. The Company reviews and refines these estimates on at least a quarterly basis. The Company’s historical estimates of these costs have not differed materially from actual results.
At
June 28, 2014
, a 10% change in the allowances for estimated uncollectible accounts, markdowns and returns would have resulted in an insignificant change in accounts receivable and net sales.
Gift cards issued by the Company are recorded as a liability until they are redeemed, at which point revenue is recognized. The Company recognizes income for unredeemed gift cards when the likelihood of a gift card being redeemed by a customer is remote, which is approximately two years after the gift card is issued, and the Company determines that it does not have a legal obligation to remit the value of the unredeemed gift card to the relevant jurisdiction as unclaimed or abandoned property. Revenue associated with gift card breakage is not material to the Company’s net operating results.
Goodwill and Other Intangible Assets
Goodwill and certain other intangible assets deemed to have indefinite useful lives are not amortized, but are assessed for impairment at least annually. The Company has no finite-lived intangible assets.
The Company uses a quantitative goodwill impairment test, which is a two-step process. The first step is to identify the existence of potential impairment by comparing the fair value of each reporting unit with its net book value, including goodwill. If the fair value of a reporting unit exceeds its carrying value, the reporting unit's goodwill is considered not to be impaired and performance of the second step of the quantitative goodwill impairment test is unnecessary.
44
If the carrying value of a reporting unit exceeds its fair value, the second step of the goodwill impairment test is performed to measure the amount of impairment loss, if any. The second step of the goodwill impairment test compares the implied fair value of the reporting unit’s goodwill with the carrying value of that goodwill. If the carrying value of the reporting unit’s goodwill exceeds the implied fair value of that goodwill, an impairment loss is recognized in an amount equal to that excess. The implied fair value of goodwill is determined in the same manner as the amount of goodwill that would be recognized in a business combination. In other words, the fair value of the reporting unit is allocated to all of the assets and liabilities of that unit as if the reporting unit had been acquired in a business combination and the fair value was the purchase price paid to acquire the reporting unit.
Determination of the fair value of a reporting unit and the fair value of individual assets and liabilities of a reporting unit is judgmental in nature and often involves the use of significant estimates and assumptions. These estimates and assumptions could have a significant impact on whether or not an impairment charge is recognized and the amount of any such charge. Estimates of fair value are primarily determined using discounted cash flows, market comparisons, and recent transactions. These approaches use significant estimates and assumptions, including projected future cash flows, discount rates, growth rates, and determination of appropriate market comparables.
The Company performs its annual impairment assessment of goodwill during the fourth quarter of each fiscal year. The Company determined that there was no impairment in fiscal
2014
, fiscal
2013
or fiscal
2012
.
Valuation of Long-Lived Assets
Long-lived assets, such as property and equipment, are evaluated for impairment whenever events or circumstances indicate that the carrying value of the assets may not be recoverable. The evaluation is based on a review of forecasted operating cash flows and the profitability of the related asset group. An impairment loss is recognized if the forecasted cash flows are less than the carrying amount of the asset. Similar to prior fiscal years, when assessing store assets for impairment in fiscal
2014
, the Company analyzed the cash flows at an individual store-by-store level, which is the lowest level of identifiable cash flows.
In determining future cash flows, we take various factors into account, including changes in merchandising strategy, the emphasis on retail store cost controls, the effects of macroeconomic trends such as consumer spending, the impacts of the experienced level of retail store managers, the level of advertising, promotional cadence and in-store capital investments. Since the determination of future cash flows is an estimate of future performance, there may be future impairments in the event that future cash flows do not meet expectations.
Share-Based Compensation
The Company recognizes the cost of equity awards to employees and the non-employee Directors, based on the grant-date fair value of those awards. The grant-date fair values of share unit awards are based on the fair value of the Company's common stock on the date of grant. The grant-date fair value of stock option awards is determined using the Black-Scholes option pricing model and involves several assumptions, including the expected term of the option, expected volatility and dividend yield. The expected term of options represents the period of time that the options granted are expected to be outstanding and is based on historical experience. Expected volatility is based on historical volatility of the Company’s stock as well as the implied volatility from publicly traded options on Coach’s stock. Dividend yield is based on the current expected annual dividend per share and the Company’s stock price. Changes in the assumptions used to determine the Black-Scholes value could result in significant changes in the Black-Scholes value.
For stock options and share unit awards, the Company recognizes share-based compensation net of estimated forfeitures and revises the estimates in subsequent periods if actual forfeitures differ from the estimates. We estimate the forfeiture rate based on historical experience as well as expected future behavior.
The Company grants performance-based share awards to certain key executives, the vesting of which is subject to the executive’s continuing employment and the Company's achievement of certain performance goals. On a quarterly basis, the Company assesses actual performance versus the predetermined performance goals, and adjusts the share-based compensation expense to reflect the relative performance achievement. Actual distributed shares are calculated upon conclusion of the service and performance periods, and include dividend equivalent shares. If the performance-based award incorporates a market condition, the grant-date fair value of such award is determined using a pricing model, such as a Monte Carlo Simulation.
A hypothetical 10% change in our stock-based compensation expense would have affected our fiscal 2014 net income by approximately $7 million.
Income Taxes
The Company’s effective tax rate is based on pre-tax income, statutory tax rates, tax laws and regulations, and tax planning strategies available in the various jurisdictions in which Coach operates. The Company classifies interest and penalties on uncertain tax positions in the provision for income taxes. We record net deferred tax assets to the extent we believe that it is more likely than not that these assets will be realized. In making such determination, we consider all available evidence, including scheduled
45
reversals of deferred tax liabilities, projected future taxable income, tax planning strategies and recent results of operation. We reduce our deferred tax assets by a valuation allowance if, based upon the weight of available evidence, it is more likely than not that some amount of deferred tax assets is not expected to be realized.
The Company recognizes the impact of tax positions in the financial statements if those positions will more likely than not be sustained on audit, based on the technical merits of the position. Although we believe that the estimates and assumptions we use are reasonable and legally supportable, the final determination of tax audits could be different than that which is reflected in historical tax provisions and recorded assets and liabilities. Tax authorities periodically audit the Company’s income tax returns, and in specific cases, the tax authorities may take a contrary position that could result in a significant impact on our results of operations. Significant management judgment is required in determining the effective tax rate, in evaluating our tax positions and in determining the net realizable value of deferred tax assets.
Recent Accounting Pronouncements
See Note 2, "Significant Accounting Policies," to the accompanying audited consolidated financial statements for a description of certain recently issued or proposed accounting standards which may impact our consolidated financial statements in future reporting periods.
46
Market Risk
The market risk inherent in our financial instruments represents the potential loss in fair value, earnings or cash flows, arising from adverse changes in foreign currency exchange rates or interest rates. Coach manages these exposures through operating and financing activities and, when appropriate, through the use of derivative financial instruments. The use of derivative financial instruments is in accordance with Coach’s risk management policies, and we do not enter into derivative transactions for speculative or trading purposes.
The quantitative disclosures in the following discussion are based on quoted market prices obtained through independent pricing sources for the same or similar types of financial instruments, taking into consideration the underlying terms and maturities and theoretical pricing models.
Foreign Currency Exchange Rate Risk
Foreign currency exposures arise from transactions, including firm commitments and anticipated contracts, denominated in a currency other than the entity’s functional currency, and from foreign-denominated revenues and expenses translated into U.S. dollars. Substantially all of Coach’s purchases and sales involving international parties, excluding international consumer sales, are denominated in U.S. dollars and, therefore, are not subject to foreign currency exchange risk. The Company is exposed to risk from foreign currency exchange rate fluctuations resulting from its foreign operating subsidiaries’ U.S. dollar denominated inventory purchases. To mitigate such risk, Coach Japan and Coach Canada enter into foreign currency derivative contracts, primarily zero-cost collar options. As of
June 28, 2014
and
June 29, 2013
, zero-cost collar options designated as cash flow hedges with a notional amount of
$90.3 million
and
$193.4 million
, respectively, were outstanding. As a result of the use of derivative instruments, we are exposed to the risk that counterparties to the derivative instruments will fail to meet their contractual obligations. To mitigate the counterparty credit risk, we only enter into derivative contracts with carefully selected financial institutions. The Company also reviews the creditworthiness of our counterparties on a regular basis. As a result of the above considerations, we do not believe that we are exposed to any undue concentration of counterparty credit risk associated with our derivative contracts as of June 28, 2014.
Coach is also exposed to market risk from foreign currency exchange rate fluctuations with respect to various cross-currency intercompany and related party loans which are not long term in investment nature. This primarily includes exposure to exchange rate fluctuations in the Hong Kong Dollar, the South Korean Won, the New Taiwan Dollar, and the British Pound Sterling. To manage the exchange rate risk related to these loans, the Company entered into forward exchange and cross-currency swap contracts, the terms of which include the exchange of foreign currency fixed interest for U.S. dollar fixed interest and an exchange of the foreign currency and U.S. dollar based notional values at the maturity dates of the contracts, the latest of which is November 2014. As of
June 28, 2014
and
June 29, 2013
, the total notional values of outstanding forward exchange and cross-currency swap contracts related to these loans were
$13.2 million
and
$147.6 million
, respectively.
The fair value of outstanding foreign currency derivatives included in current assets at
June 28, 2014
and
June 29, 2013
was
$0.5 million
and
$4.5 million
, respectively. The fair value of outstanding foreign currency derivatives included in current liabilities at
June 28, 2014
and
June 29, 2013
was
$0.9 million
and
$2.9 million
, respectively. The fair value of these contracts is sensitive to changes in foreign currency exchange rates. A sensitivity analysis of the effects of foreign exchange rate fluctuations on the fair values of our derivative contracts was performed to assess the risk of loss. As of
June 28, 2014
, a 10% devaluation of the U.S. Dollar against the exchange rates for foreign currencies under contract would result in an immaterial impact on derivative contract fair values.
Interest Rate Risk
Coach is exposed to interest rate risk in relation to its investments and revolving credit facilities.
The Company’s investment portfolio is maintained in accordance with the Company’s investment policy, which defines our investment principles including credit quality standards and limits the credit exposure of any single issuer. The primary objective of our investment activities is the preservation of principal while maximizing interest income and minimizing risk. We do not hold any investments for trading purposes.
See “Index to Financial Statements,” appearing at the end of this Annual Report on Form 10-K.
None.
47
Disclosure Controls and Procedures
Based on the evaluation of the Company’s disclosure controls and procedures, as that term is defined in Rule 13a-15(e) under the Securities Exchange Act of 1934, as amended, the Chief Executive Officer of the Company and the Chief Financial Officer of the Company, have concluded that the Company’s disclosure controls and procedures are effective as of
June 28, 2014
.
Management’s Report on Internal Control over Financial Reporting
The Company’s management is responsible for establishing and maintaining adequate internal controls over financial reporting. The Company’s internal control system was designed to provide reasonable assurance to the Company’s management and Board regarding the preparation and fair presentation of published financial statements. Management evaluated the effectiveness of the Company’s internal control over financial reporting using the criteria set forth by the Committee of Sponsoring Organizations (COSO) of the Treadway Commission in Internal Control — Integrated Framework in 1992. Management, under the supervision and with the participation of the Company’s Chief Executive Officer and Chief Financial Officer, assessed the effectiveness of the Company’s internal control over financial reporting as of
June 28, 2014
and concluded that it is effective.
The Company’s independent auditors have issued an audit report on the Company's internal control over financial reporting as included elsewhere herein.
Changes in Internal Control over Financial Reporting
There were no changes in internal control over financial reporting that occurred during the fourth fiscal quarter that have materially affected, or are reasonably likely to materially affect, the Company’s internal control over financial reporting.
None.
48
The information required to be included by Item 10 of Form 10-K will be included in the Proxy Statement for the
2014
Annual Meeting of Stockholders and such information is incorporated by reference herein. The Proxy Statement will be filed with the Commission within 120 days after the end of the fiscal year covered by this Form 10-K pursuant to Regulation 14A under the Securities Exchange Act of 1934, as amended.
The information regarding executive and director compensation set forth in the Proxy Statement for the
2014
Annual Meeting of Stockholders is incorporated herein by reference.
The information under the headings “Securities Authorized for Issuance Under Equity Compensation Plans” and “Coach Stock Ownership by Certain Beneficial Owners and Management” in the Company’s Proxy Statement for the
2014
Annual Meeting of Stockholders is incorporated herein by reference.
There are no arrangements known to the registrant that may at a subsequent date result in a change in control of the registrant.
The information required to be included by Item 13 of Form 10-K will be included in the Proxy Statement for the
2014
Annual Meeting of Stockholders and such information is incorporated by reference herein.
The information required by this item is incorporated herein by reference to the sections entitled “Fees For Audit and Other Services” and “Audit Committee Pre-Approval Policy” in the Proxy Statement for the
2014
Annual Meeting of Stockholders.
49
|
(a)
|
Financial Statements and Financial Statement Schedules. See “Index to Financial Statements,” appearing herein.
|
|
(b)
|
Exhibits. See the exhibit index which is included herein.
|
50
SIGNATURES
Pursuant to the requirements of Section 13 or 15(d) of the Securities Exchange Act of 1934, the Registrant has duly caused this report to be signed on its behalf by the undersigned, thereunto duly authorized.
COACH, INC.
|
Date: August 15, 2014
|
By:
|
/s/ Victor Luis
|
|
Name: Victor Luis
Title: Chief Executive Officer
|
||
Pursuant to the requirements of the Securities Exchange Act of 1934, this report has been signed below by the following persons on behalf of the Registrant and in the capacities indicated below on August 15, 2014.
|
Signature
|
|
Title
|
|
/s/ Victor Luis
|
|
Chief Executive Officer and Director
|
|
Victor Luis
|
(Principal Executive Officer)
|
|
|
/s/ Jane Nielsen
|
|
Chief Financial Officer
|
|
Jane Nielsen
|
(Principal Financial and Accounting Officer)
|
|
|
/s/ Lew Frankfort
|
|
Executive Chairman and Director
|
|
Lew Frankfort
|
||
|
/s/ David Denton
|
|
Director
|
|
David Denton
|
||
|
/s/ Susan Kropf
|
|
Director
|
|
Susan Kropf
|
||
|
/s/ Gary Loveman
|
|
Director
|
|
Gary Loveman
|
||
|
/s/ Ivan Menezes
|
|
Director
|
|
Ivan Menezes
|
||
|
/s/ Michael Murphy
|
|
Director
|
|
Michael Murphy
|
||
|
/s/ William Nuti
|
|
Director
|
|
William Nuti
|
||
|
/s/ Stephanie Tilenius
|
|
Director
|
|
Stephanie Tilenius
|
||
|
/s/ Jide Zeitlin
|
|
Director
|
|
Jide Zeitlin
|
||
51
COACH, INC.
INDEX TO CONSOLIDATED FINANCIAL STATEMENTS AND SUPPLEMENTARY INFORMATION
|
Page
Number
|
|
|
Consolidated Financial Statements:
|
|
|
Financial Statement Schedules:
|
|
All other schedules are omitted because they are not applicable or the required information is shown in the Consolidated Financial Statements or Notes thereto.
52
REPORT OF INDEPENDENT REGISTERED PUBLIC ACCOUNTING FIRM
To the Board of Directors and Stockholders of
Coach, Inc.
New York, New York
We have audited the accompanying consolidated balance sheets of Coach, Inc. and subsidiaries (the "Company") as of June 28, 2014 and June 29, 2013, and the related consolidated statements of income, comprehensive income, stockholders' equity, and cash flows for each of the three years in the period ended June 28, 2014. Our audits also included the financial statement schedule listed in the Index to the financial statements. These financial statements and financial statement schedule are the responsibility of the Company's management. Our responsibility is to express an opinion on the financial statements and financial statement schedule based on our audits.
We conducted our audits in accordance with the standards of the Public Company Accounting Oversight Board (United States). Those standards require that we plan and perform the audit to obtain reasonable assurance about whether the financial statements are free of material misstatement. An audit includes examining, on a test basis, evidence supporting the amounts and disclosures in the financial statements. An audit also includes assessing the accounting principles used and significant estimates made by management, as well as evaluating the overall financial statement presentation. We believe that our audits provide a reasonable basis for our opinion.
In our opinion, such consolidated financial statements present fairly, in all material respects, the financial position of Coach, Inc. and subsidiaries at June 28, 2014 and June 29, 2013, and the results of their operations and their cash flows for each of the three years in the period ended June 28, 2014, in conformity with accounting principles generally accepted in the United States of America. Also, in our opinion, such financial statement schedule, when considered in relation to the basic consolidated financial statements taken as a whole, present fairly, in all material respects, the information set forth therein.
We have also audited, in accordance with the standards of the Public Company Accounting Oversight Board (United States), the Company's internal control over financial reporting as of June 28, 2014, based on the criteria established in
Internal Control - Integrated Framework (1992)
issued by the Committee of Sponsoring Organizations of the Treadway Commission and our report dated August 15, 2014 expressed an unqualified opinion on the Company's internal control over financial reporting.
/s/ DELOITTE & TOUCHE LLP
New York, New York
August 15, 2014
53
REPORT OF INDEPENDENT REGISTERED PUBLIC ACCOUNTING FIRM
To the Board of Directors and Stockholders of
Coach, Inc.
New York, New York
We have audited the internal control over financial reporting of Coach, Inc. and subsidiaries (the "Company") as of June 28, 2014, based on criteria established in
Internal Control - Integrated Framework (1992)
issued by the Committee of Sponsoring Organizations of the Treadway Commission. The Company's management is responsible for maintaining effective internal control over financial reporting and for its assessment of the effectiveness of internal control over financial reporting, included in the accompanying Management’s Report on Internal Control over Financial Reporting. Our responsibility is to express an opinion on the Company's internal control over financial reporting based on our audit.
We conducted our audit in accordance with the standards of the Public Company Accounting Oversight Board (United States). Those standards require that we plan and perform the audit to obtain reasonable assurance about whether effective internal control over financial reporting was maintained in all material respects. Our audit included obtaining an understanding of internal control over financial reporting, assessing the risk that a material weakness exists, testing and evaluating the design and operating effectiveness of internal control based on the assessed risk, and performing such other procedures as we considered necessary in the circumstances. We believe that our audit provides a reasonable basis for our opinion.
A company's internal control over financial reporting is a process designed by, or under the supervision of, the company's principal executive and principal financial officers, or persons performing similar functions, and effected by the company's board of directors, management, and other personnel to provide reasonable assurance regarding the reliability of financial reporting and the preparation of financial statements for external purposes in accordance with generally accepted accounting principles. A company's internal control over financial reporting includes those policies and procedures that (1) pertain to the maintenance of records that, in reasonable detail, accurately and fairly reflect the transactions and dispositions of the assets of the company; (2) provide reasonable assurance that transactions are recorded as necessary to permit preparation of financial statements in accordance with generally accepted accounting principles, and that receipts and expenditures of the company are being made only in accordance with authorizations of management and directors of the company; and (3) provide reasonable assurance regarding prevention or timely detection of unauthorized acquisition, use, or disposition of the company's assets that could have a material effect on the financial statements.
Because of the inherent limitations of internal control over financial reporting, including the possibility of collusion or improper management override of controls, material misstatements due to error or fraud may not be prevented or detected on a timely basis. Also, projections of any evaluation of the effectiveness of the internal control over financial reporting to future periods are subject to the risk that the controls may become inadequate because of changes in conditions, or that the degree of compliance with the policies or procedures may deteriorate.
In our opinion, the Company maintained, in all material respects, effective internal control over financial reporting as of June 28, 2014, based on the criteria established in
Internal Control - Integrated Framework (1992)
issued by the Committee of Sponsoring Organizations of the Treadway Commission.
We have also audited, in accordance with the standards of the Public Company Accounting Oversight Board (United States), the consolidated financial statements and financial statement schedule as of and for the year ended June 28, 2014 of the Company and our report dated August 15, 2014 expressed an unqualified opinion on those financial statements and financial statement schedule.
/s/ DELOITTE & TOUCHE LLP
New York, New York
August 15, 2014
54
COACH, INC.
(in thousands except per share data)
|
June 28,
2014 |
June 29,
2013 |
||||||
|
ASSETS
|
|
|
|
|
|||
|
Current Assets:
|
|
|
|
|
|||
|
Cash and cash equivalents
|
$
|
591,923
|
|
$
|
1,062,785
|
|
|
|
Short-term investments
|
276,703
|
|
72,106
|
|
|||
|
Trade accounts receivable, less allowances of $1,419 and $1,138, respectively
|
198,577
|
|
175,477
|
|
|||
|
Inventories
|
526,175
|
|
524,706
|
|
|||
|
Deferred income taxes
|
112,630
|
|
111,118
|
|
|||
|
Prepaid expenses
|
45,473
|
|
37,956
|
|
|||
|
Other current assets
|
103,736
|
|
86,799
|
|
|||
|
Total current assets
|
1,855,217
|
|
2,070,947
|
|
|||
|
Property and equipment, net
|
713,900
|
|
694,771
|
|
|||
|
Long-term investments
|
484,518
|
|
197,340
|
|
|||
|
Goodwill
|
361,407
|
|
345,039
|
|
|||
|
Intangible assets
|
9,788
|
|
9,788
|
|
|||
|
Deferred income taxes
|
111,556
|
|
84,845
|
|
|||
|
Other assets
|
126,745
|
|
129,167
|
|
|||
|
Total assets
|
$
|
3,663,131
|
|
$
|
3,531,897
|
|
|
|
LIABILITIES AND STOCKHOLDERS’ EQUITY
|
|
|
|
|
|||
|
Current Liabilities:
|
|
|
|
|
|||
|
Accounts payable
|
$
|
153,870
|
|
$
|
178,857
|
|
|
|
Accrued liabilities
|
518,763
|
|
543,153
|
|
|||
|
Current debt
|
140,485
|
|
500
|
|
|||
|
Total current liabilities
|
813,118
|
|
722,510
|
|
|||
|
Long-term debt
|
—
|
|
485
|
|
|||
|
Other liabilities
|
429,360
|
|
399,744
|
|
|||
|
Total liabilities
|
1,242,478
|
|
1,122,739
|
|
|||
|
See Note 12 on commitments and contingencies
|
|
|
|
|
|||
|
Stockholders’ Equity:
|
|
|
|
|
|||
|
Preferred stock: (authorized 25,000 shares; $0.01 par value) none issued
|
—
|
|
—
|
|
|||
|
Common stock: (authorized 1,000,000 shares; $0.01 par value) issued and outstanding – 274,361 and 281,902, respectively
|
2,744
|
|
2,819
|
|
|||
|
Additional paid-in-capital
|
2,646,123
|
|
2,520,469
|
|
|||
|
Accumulated deficit
|
(219,455
|
)
|
(101,884
|
)
|
|||
|
Accumulated other comprehensive loss
|
(8,759
|
)
|
(12,246
|
)
|
|||
|
Total stockholders’ equity
|
2,420,653
|
|
2,409,158
|
|
|||
|
Total liabilities and stockholders’ equity
|
$
|
3,663,131
|
|
$
|
3,531,897
|
|
|
See accompanying Notes to Consolidated Financial Statements.
55
COACH, INC.
(in thousands except per share data)
|
Fiscal Year Ended
|
|||||||||||
|
|
June 28,
2014 |
June 29,
2013 |
June 30,
2012 |
||||||||
|
Net sales
|
$
|
4,806,226
|
|
$
|
5,075,390
|
|
$
|
4,763,180
|
|
||
|
Cost of sales
|
1,509,263
|
|
1,377,242
|
|
1,297,102
|
|
|||||
|
Gross profit
|
3,296,963
|
|
3,698,148
|
|
3,466,078
|
|
|||||
|
Selling, general and administrative expenses
|
2,176,889
|
|
2,173,607
|
|
1,954,089
|
|
|||||
|
Operating income
|
1,120,074
|
|
1,524,541
|
|
1,511,989
|
|
|||||
|
Interest income
|
2,181
|
|
2,369
|
|
720
|
|
|||||
|
Other expense
|
—
|
|
(6,384
|
)
|
(7,046
|
)
|
|||||
|
Income before provision for income taxes
|
1,122,255
|
|
1,520,526
|
|
1,505,663
|
|
|||||
|
Provision for income taxes
|
340,919
|
|
486,106
|
|
466,753
|
|
|||||
|
Net income
|
$
|
781,336
|
|
$
|
1,034,420
|
|
$
|
1,038,910
|
|
||
|
Net income per share
|
|
|
|
|
|
|
|||||
|
Basic
|
$
|
2.81
|
|
$
|
3.66
|
|
$
|
3.60
|
|
||
|
Diluted
|
$
|
2.79
|
|
$
|
3.61
|
|
$
|
3.53
|
|
||
|
Shares used in computing net income per share
|
|
|
|
|
|
|
|||||
|
Basic
|
277,790
|
|
282,494
|
|
288,284
|
|
|||||
|
Diluted
|
280,379
|
|
286,307
|
|
294,129
|
|
|||||
|
Cash dividends declared per common share
|
$
|
1.35
|
|
$
|
1.24
|
|
$
|
0.98
|
|
||
See accompanying Notes to Consolidated Financial Statements.
56
COACH, INC.
CONSOLIDATED STATEMENTS OF COMPREHENSIVE INCOME
(in thousands)
|
Fiscal Year Ended
|
|||||||||||
|
|
June 28,
2014 |
June 29,
2013 |
June 30,
2012 |
||||||||
|
Net Income
|
$
|
781,336
|
|
$
|
1,034,420
|
|
$
|
1,038,910
|
|
||
|
Other comprehensive income (loss), net of tax:
|
|
|
|
|
|
|
|||||
|
Unrealized (losses) gains on cash flow hedging derivatives, net
|
(3,151
|
)
|
4,202
|
|
1,004
|
|
|||||
|
Unrealized gains (losses) on available-for-sale investments, net
|
4,155
|
|
(1,276
|
)
|
—
|
|
|||||
|
Change in pension liability, net
|
105
|
|
1,343
|
|
(1,388
|
)
|
|||||
|
Foreign currency translation adjustments
|
2,378
|
|
(66,990
|
)
|
(4,052
|
)
|
|||||
|
Other comprehensive income (loss), net of tax
|
3,487
|
|
(62,721
|
)
|
(4,436
|
)
|
|||||
|
Comprehensive income
|
$
|
784,823
|
|
$
|
971,699
|
|
$
|
1,034,474
|
|
||
See accompanying Notes to Consolidated Financial Statements.
57
COACH, INC.
CONSOLIDATED STATEMENTS OF STOCKHOLDERS’ EQUITY
(amounts in thousands except per share data)
|
Shares of Common Stock
|
Common Stock
|
Additional Paid-in- Capital
|
Retained Earnings/ (Accumulated Deficit)
|
Accumulated Other Comprehensive Income/(Loss)
|
Total Stockholders' Equity
|
|||||||||||||||||
|
Balance at July 3, 2011
|
288,515
|
|
$
|
2,886
|
|
$
|
2,000,426
|
|
$
|
(445,654
|
)
|
$
|
54,911
|
|
$
|
1,612,569
|
|
|||||
|
Net income
|
—
|
|
—
|
|
—
|
|
1,038,910
|
|
—
|
|
1,038,910
|
|
||||||||||
|
Other comprehensive loss
|
—
|
|
—
|
|
—
|
|
—
|
|
(4,436
|
)
|
(4,436
|
)
|
||||||||||
|
Shares issued for stock options and employee benefit plans
|
7,291
|
|
72
|
|
151,061
|
|
—
|
|
—
|
|
151,133
|
|
||||||||||
|
Share-based compensation
|
—
|
|
—
|
|
107,511
|
|
—
|
|
—
|
|
107,511
|
|
||||||||||
|
Excess tax benefit from share-based compensation
|
—
|
|
—
|
|
68,057
|
|
—
|
|
—
|
|
68,057
|
|
||||||||||
|
Repurchase and retirement of common stock
|
(10,688
|
)
|
(107
|
)
|
—
|
|
(699,893
|
)
|
—
|
|
(700,000
|
)
|
||||||||||
|
Dividends declared ($0.98 per share)
|
—
|
|
—
|
|
—
|
|
(280,813
|
)
|
—
|
|
(280,813
|
)
|
||||||||||
|
Balance at June 30, 2012
|
285,118
|
|
2,851
|
|
2,327,055
|
|
(387,450
|
)
|
50,475
|
|
1,992,931
|
|
||||||||||
|
Net income
|
—
|
|
—
|
|
—
|
|
1,034,420
|
|
—
|
|
1,034,420
|
|
||||||||||
|
Other comprehensive loss
|
—
|
|
—
|
|
—
|
|
—
|
|
(62,721
|
)
|
(62,721
|
)
|
||||||||||
|
Shares issued for stock options and employee benefit plans
|
3,850
|
|
39
|
|
46,124
|
|
—
|
|
—
|
|
46,163
|
|
||||||||||
|
Share-based compensation
|
—
|
|
—
|
|
120,460
|
|
—
|
|
—
|
|
120,460
|
|
||||||||||
|
Excess tax benefit from share-based compensation
|
—
|
|
—
|
|
26,830
|
|
—
|
|
—
|
|
26,830
|
|
||||||||||
|
Repurchase and retirement of common stock
|
(7,066
|
)
|
(71
|
)
|
—
|
|
(399,929
|
)
|
—
|
|
(400,000
|
)
|
||||||||||
|
Dividends declared ($1.24 per share)
|
—
|
|
—
|
|
—
|
|
(348,925
|
)
|
—
|
|
(348,925
|
)
|
||||||||||
|
Balance at June 29, 2013
|
281,902
|
|
2,819
|
|
2,520,469
|
|
(101,884
|
)
|
(12,246
|
)
|
2,409,158
|
|
||||||||||
|
Net income
|
—
|
|
—
|
|
—
|
|
781,336
|
|
—
|
|
781,336
|
|
||||||||||
|
Other comprehensive income
|
—
|
|
—
|
|
—
|
|
—
|
|
3,487
|
|
3,487
|
|
||||||||||
|
Shares issued for stock options and employee benefit plans
|
2,698
|
|
27
|
|
9,178
|
|
—
|
|
—
|
|
9,205
|
|
||||||||||
|
Share-based compensation
|
—
|
|
—
|
|
104,940
|
|
—
|
|
—
|
|
104,940
|
|
||||||||||
|
Excess tax benefit from share-based compensation
|
—
|
|
—
|
|
11,536
|
|
—
|
|
—
|
|
11,536
|
|
||||||||||
|
Repurchase and retirement of common stock
|
(10,239
|
)
|
(102
|
)
|
—
|
|
(524,824
|
)
|
—
|
|
(524,926
|
)
|
||||||||||
|
Dividends declared ($1.35 per share)
|
—
|
|
—
|
|
—
|
|
(374,083
|
)
|
—
|
|
(374,083
|
)
|
||||||||||
|
Balance at June 28, 2014
|
274,361
|
|
$
|
2,744
|
|
$
|
2,646,123
|
|
$
|
(219,455
|
)
|
$
|
(8,759
|
)
|
$
|
2,420,653
|
|
|||||
See accompanying Notes to Consolidated Financial Statements.
58
COACH, INC.
(in thousands)
|
Fiscal Year Ended
|
|||||||||||
|
|
June 28,
2014 |
June 29,
2013 |
June 30,
2012 |
||||||||
|
CASH FLOWS FROM OPERATING ACTIVITIES
|
|
|
|
|
|
|
|||||
|
Net income
|
$
|
781,336
|
|
$
|
1,034,420
|
|
$
|
1,038,910
|
|
||
|
Adjustments to reconcile net income to net cash from operating activities:
|
|
|
|
|
|
|
|||||
|
Depreciation and amortization
|
189,360
|
|
162,987
|
|
132,909
|
|
|||||
|
Provision for bad debt
|
1,649
|
|
(529
|
)
|
595
|
|
|||||
|
Share-based compensation
|
95,106
|
|
120,460
|
|
107,511
|
|
|||||
|
Excess tax benefit from share-based compensation
|
(11,536
|
)
|
(26,830
|
)
|
(68,057
|
)
|
|||||
|
Transformation, restructuring and other related charges; sale of Reed Krakoff business
|
108,204
|
|
25,740
|
|
—
|
|
|||||
|
Deferred income taxes
|
(22,787
|
)
|
(6,520
|
)
|
27,568
|
|
|||||
|
Other noncash credits, net
|
6,481
|
|
1,157
|
|
217
|
|
|||||
|
Changes in operating assets and liabilities:
|
|
|
|
|
|
|
|||||
|
Trade accounts receivable
|
(23,713
|
)
|
(14,231
|
)
|
(26,565
|
)
|
|||||
|
Inventories
|
(64,074
|
)
|
(38,630
|
)
|
(71,680
|
)
|
|||||
|
Other liabilities
|
5,745
|
|
(12,974
|
)
|
(17,581
|
)
|
|||||
|
Accounts payable
|
(30,212
|
)
|
30,394
|
|
36,494
|
|
|||||
|
Accrued liabilities
|
14,070
|
|
98,865
|
|
84,180
|
|
|||||
|
Other balance sheet changes, net
|
(64,219
|
)
|
39,665
|
|
(22,812
|
)
|
|||||
|
Net cash provided by operating activities
|
985,410
|
|
1,413,974
|
|
1,221,689
|
|
|||||
|
CASH FLOWS FROM INVESTING ACTIVITIES
|
|
|
|
|
|
|
|||||
|
Acquisition of interest in equity method investment
|
(87,233
|
)
|
(93,930
|
)
|
—
|
|
|||||
|
Acquisitions (net of cash acquired) and related advances to distributors
|
(3,759
|
)
|
(53,337
|
)
|
(53,235
|
)
|
|||||
|
Purchases of property and equipment
|
(219,587
|
)
|
(241,353
|
)
|
(184,309
|
)
|
|||||
|
Loans to related parties
|
—
|
|
(11,088
|
)
|
(24,138
|
)
|
|||||
|
Purchases of investments
|
(543,389
|
)
|
(170,792
|
)
|
—
|
|
|||||
|
Proceeds from maturities and sales of investments
|
146,260
|
|
—
|
|
2,256
|
|
|||||
|
Net cash used in investing activities
|
(707,708
|
)
|
(570,500
|
)
|
(259,426
|
)
|
|||||
|
CASH FLOWS FROM FINANCING ACTIVITIES
|
|
|
|
|
|
|
|||||
|
Dividend payments
|
(376,498
|
)
|
(339,724
|
)
|
(260,276
|
)
|
|||||
|
Repurchase of common stock
|
(524,926
|
)
|
(400,000
|
)
|
(700,000
|
)
|
|||||
|
Repayment of debt
|
(500
|
)
|
(22,375
|
)
|
(795
|
)
|
|||||
|
Proceeds from share-based awards
|
48,678
|
|
80,436
|
|
185,071
|
|
|||||
|
Borrowings under revolving credit facility
|
450,000
|
|
—
|
|
—
|
|
|||||
|
Repayment of revolving credit facility
|
(310,000
|
)
|
—
|
|
—
|
|
|||||
|
Taxes paid to net settle share-based awards
|
(40,339
|
)
|
(34,273
|
)
|
(33,938
|
)
|
|||||
|
Excess tax benefit from share-based compensation
|
11,536
|
|
26,830
|
|
68,057
|
|
|||||
|
Acquisition-related payment of contingent consideration
|
(6,000
|
)
|
—
|
|
—
|
|
|||||
|
Net cash used in financing activities
|
(748,049
|
)
|
(689,106
|
)
|
(741,881
|
)
|
|||||
|
Effect of exchange rate changes on cash and cash equivalents
|
(515
|
)
|
(8,798
|
)
|
(2,949
|
)
|
|||||
|
(Decrease) increase in cash and cash equivalents
|
(470,862
|
)
|
145,570
|
|
217,433
|
|
|||||
|
Cash and cash equivalents at beginning of year
|
1,062,785
|
|
917,215
|
|
699,782
|
|
|||||
|
Cash and cash equivalents at end of year
|
$
|
591,923
|
|
$
|
1,062,785
|
|
$
|
917,215
|
|
||
|
Supplemental information:
|
|
|
|
|
|
|
|||||
|
Cash paid for income taxes
|
$
|
384,222
|
|
$
|
445,043
|
|
$
|
438,884
|
|
||
|
Cash paid for interest
|
$
|
1,255
|
|
$
|
1,341
|
|
$
|
1,793
|
|
||
|
Noncash investing activity – property and equipment obligations
|
$
|
28,720
|
|
$
|
34,311
|
|
$
|
31,363
|
|
||
See accompanying Notes to Consolidated Financial Statements.
59
COACH, INC.
Notes to Consolidated Financial Statements (Continued)
(dollars and shares in thousands, except per share data)
1. NATURE OF OPERATIONS
Coach, Inc. (the “Company”) is a leading New York design house of modern luxury accessories and lifestyle collections. The Company’s primary product offerings, manufactured by third-party suppliers, include women’s and men’s bags, women’s and men’s small leather goods, business cases, footwear, wearables including outerwear, watches, weekend and travel accessories, scarves, sunwear, fragrance, jewelry, travel bags and other lifestyle products. Coach’s products are sold through the North America and International reportable segments. The North America segment includes sales to North American consumers through Coach-operated stores (including the Internet), and sales to wholesale customers and distributors. The International segment includes sales to consumers through Coach-operated stores (including the Internet) and concession shop-in-shops in Japan and mainland China, Coach-operated stores and concession shop-in-shops in Hong Kong, Macau, Singapore, Taiwan, Malaysia, South Korea, the United Kingdom, France, Ireland, Spain, Portugal, Germany and Italy, as well as sales to wholesale customers and distributors in approximately
35
countries. The Company also records sales generated in ancillary channels including licensing and disposition.
2. SIGNIFICANT ACCOUNTING POLICIES
Fiscal Year
The Company’s fiscal year ends on the Saturday closest to June 30. Unless otherwise stated, references to years in the financial statements relate to fiscal years. The fiscal years ended
June 28, 2014
(“fiscal 2014”),
June 29, 2013
(“fiscal 2013”) and
June 30, 2012
(“fiscal 2012”) were each 52-week periods. The fiscal year ending June 27, 2015 (“fiscal 2015”) will be also be a 52-week period.
Use of Estimates
The preparation of financial statements in conformity with accounting principles generally accepted in the United States of America ("GAAP") requires management to make estimates and assumptions that affect the reported amounts of assets and liabilities and disclosure of contingent assets and liabilities at the date of the financial statements as well as the reported amounts of revenues and expenses during the reporting period. Actual results could differ from estimates in amounts that may be material to the financial statements.
Significant estimates inherent in the preparation of the consolidated financial statements include customer returns, discounts, end-of-season markdowns, and operational chargebacks; the realizability of inventory; reserves for contingencies; useful lives and impairments of long-lived tangible and intangible assets; accounting for income taxes and related uncertain tax positions; the valuation of stock-based compensation and related expected forfeiture rates; reserves for restructuring; and accounting for business combinations, amongst others.
Principles of Consolidation
The consolidated financial statements include the accounts of the Company and all 100% owned subsidiaries. All intercompany transactions and balances are eliminated in consolidation.
Cash and Cash Equivalents
Cash and cash equivalents consist of cash balances and highly liquid investments with a maturity of three months or less at the date of purchase.
Investments
Long-term investments primarily consist of high-credit quality U.S. and non-U.S. issued corporate debt securities, U.S. Treasuries and government agency securities, classified as available-for-sale, and recorded at fair value, with unrealized gains and losses recorded in other comprehensive income. Long-term investments also include the equity method investment related to the Hudson Yards joint venture and the Reed Krakoff cost method investment. Short-term investments consist primarily of time deposits, U.S. Treasuries and government agency securities, and high-credit quality U.S. and non-U.S. issued corporate debt securities with original maturities greater than three months and with maturities within one year of balance sheet date, classified as available-for-sale and held-to-maturity. Held-to-maturity investments are recorded at amortized cost, which approximates fair value. Dividend and interest income are recognized when earned.
Investments in companies in which the Company has significant influence, but less than a controlling financial interest, are accounted for using the equity method. Significant influence is generally presumed to exist when the Company owns between
60
COACH, INC.
Notes to Consolidated Financial Statements (Continued)
(dollars and shares in thousands, except per share data)
20% and 50% of the investee, however, other factors are considered, such as board representation and the rights to participate in the day-to-day operations of the business.
Additionally, GAAP requires the consolidation of all entities for which a Company has a controlling voting interest and all variable interest entities (“VIEs”) for which a Company is deemed to be the primary beneficiary. An entity is generally a VIE if it meets any of the following criteria: (i) the entity has insufficient equity to finance its activities without additional subordinated financial support from other parties, (ii) the equity investors cannot make significant decisions about the entity’s operations or (iii) the voting rights of some investors are not proportional to their obligations to absorb the expected losses of the entity or receive the expected returns of the entity and substantially all of the entity’s activities involve or are conducted on behalf of the investor with disproportionately few voting rights.
From time to time, Coach may make an investment that requires judgment in determining whether the entity is a VIE. If it is determined that the entity is a VIE, the Company must assess whether it is the primary beneficiary.
Concentration of Credit Risk
Financial instruments that potentially expose Coach to concentration of credit risk consist primarily of cash and cash equivalents, investments and accounts receivable. The Company places its cash investments with high-credit quality financial institutions and currently invests primarily in U.S. government and agency debt securities, municipal government and corporate debt securities, bank deposits, and money market instruments placed with major banks and financial institutions. Accounts receivable is generally diversified due to the number of entities comprising Coach’s customer base and their dispersion across many geographical regions. The Company believes no significant concentration of credit risk exists with respect to these investments and accounts receivable.
Inventories
The Company’s inventories are reported at the lower of cost or market. Inventory costs include material, conversion costs, freight and duties and are determined by the first-in, first-out method. The Company reserves for slow-moving and aged inventory based on historical experience, current product demand and expected future demand. A decrease in product demand due to changing customer tastes, buying patterns or increased competition could impact Coach’s evaluation of its slow-moving and aged inventory and additional reserves might be required.
Property and Equipment, Net
Property and equipment, net is stated at cost less accumulated depreciation including the impact long-lived asset impairment and disposals. Depreciation is calculated on a straight-line basis over the estimated useful lives of the assets. Buildings are depreciated over
40 years
. Machinery and equipment are depreciated over lives of
five
to
seven years
, furniture and fixtures are depreciated over lives of
three
to
five years
, and computer software is depreciated over lives of
three
to
seven years
. Leasehold improvements are amortized over the shorter of their estimated useful lives or the related lease terms. Maintenance and repair costs are charged to earnings as incurred while expenditures for major renewals and improvements are capitalized.
Valuation of Long-Lived Assets
Long-lived assets, such as property and equipment, are evaluated for impairment whenever events or circumstances indicate that the carrying value of the assets may not be recoverable. The evaluation is based on a review of forecasted operating cash flows and the profitability of the related asset group. An impairment loss is recognized if the forecasted cash flows are less than the carrying amount of the asset. Similar to prior fiscal years, when assessing store assets for impairment in fiscal
2014
, the Company analyzed the cash flows at an individual store-by-store level, which is the lowest level for identifiable cash flows. The Company recorded impairment losses of
$35,544
in fiscal
2014
and
$16,624
in fiscal 2013. The Company did not record any impairment losses in fiscal
2012
.
In determining future cash flows, Coach takes various factors into account, including changes in merchandising strategy, the emphasis on retail store cost controls, the effects of macroeconomic trends such as consumer spending, the impacts of the experienced level of retail store managers, the level of advertising, promotional cadence and in-store capital investments. Since the determination of future cash flows is an estimate of future performance, there may be future impairments in the event that future cash flows do not meet expectations.
Operating Leases
The Company’s leases for office space, retail locations and distribution facilities are accounted for as operating leases. Certain of the Company's leases contain renewal options, rent escalation clauses, and/or landlord incentives. Renewal terms generally reflect market rates at the time of renewal. Rent expense for noncancelable operating leases with scheduled rent increases and/or
61
COACH, INC.
Notes to Consolidated Financial Statements (Continued)
(dollars and shares in thousands, except per share data)
landlord incentives is recognized on a straight-line basis over the lease term, including any applicable rent holidays, beginning with the lease commencement date, or the date the Company takes control of the leased space, whichever is sooner. The excess of straight-line rent expense over scheduled payment amounts and landlord incentives is recorded as a deferred rent liability. As of the end of fiscal
2014
and fiscal
2013
, deferred rent obligations of
$135,154
and
$117,502
, respectively, were classified primarily within other non-current liabilities in the Company's consolidated balance sheets. Certain rentals are also contingent upon factors such as sales. Contingent rentals are recognized when the achievement of the target (i.e., sale levels), which triggers the related rent payment, is considered probable and estimable.
Asset retirement obligations represent legal obligations associated with the retirement of a tangible long-lived asset. The Company’s asset retirement obligations are primarily associated with leasehold improvements that we are contractually obligated to remove at the end of a lease to comply with the lease agreement. When such an obligation exists, the Company recognizes an asset retirement obligation at the inception of a lease at its estimated fair value. The asset retirement obligation is recorded in current liabilities or non-current liabilities (based on the expected timing of payment of the related costs) and is subsequently adjusted for any changes in estimates. The associated estimated asset retirement costs are capitalized as part of the carrying amount of the long-lived asset and depreciated over its useful life. As of the end of fiscal 2014 and fiscal 2013, the Company had asset retirement obligations of
$18,351
and
$16,497
, respectively, primarily classified within other non-current liabilities in the Company's consolidated balance sheets.
Goodwill and Other Intangible Assets
Goodwill and certain other intangible assets deemed to have indefinite useful lives are not amortized, but are assessed for impairment at least annually. The Company has no finite-lived intangible assets.
The Company uses a quantitative goodwill impairment test, which is a two-step process. The first step is to identify the existence of potential impairment by comparing the fair value of each reporting unit with its carrying value, including goodwill. If the fair value of a reporting unit exceeds its carrying value, the reporting unit's goodwill is considered not to be impaired and performance of the second step of the quantitative goodwill impairment test is unnecessary.
If the carrying value of a reporting unit exceeds its fair value, the second step of the goodwill impairment test is performed to measure the amount of impairment loss, if any. The second step of the goodwill impairment test compares the implied fair value of the reporting unit’s goodwill with the carrying value of that goodwill. If the carrying value of the reporting unit’s goodwill exceeds the implied fair value of that goodwill, an impairment loss is recognized in an amount equal to that excess. The implied fair value of goodwill is determined in the same manner as the amount of goodwill that would be recognized in a business combination. In other words, the fair value of the reporting unit is allocated to all of the assets and liabilities of that unit as if the reporting unit had been acquired in a business combination and the fair value was the purchase price paid to acquire the reporting unit.
Determination of the fair value of a reporting unit and the fair value of individual assets and liabilities of a reporting unit is judgmental in nature and often involves the use of significant estimates and assumptions. These estimates and assumptions could have a significant impact on whether or not an impairment charge is recognized and the amount of any such charge. Estimates of fair value are primarily determined using discounted cash flows, market comparisons, and recent transactions. These approaches use significant estimates and assumptions, including projected future cash flows, discount rates, growth rates, and determination of appropriate market comparables.
The Company performs its annual impairment assessment of goodwill during the fourth quarter of each fiscal year. The Company determined that there was no impairment in fiscal
2014
, fiscal
2013
or fiscal
2012
as the fair values of our reporting units significantly exceeded their respective carrying values.
Stock Repurchase and Retirement
Coach accounts for stock repurchases and retirements by allocating the repurchase price to common stock and retained earnings. The repurchase price allocation is based upon the equity contribution associated with historical issuances, beginning with the earliest issuance. Under Maryland law, Coach’s state of incorporation, treasury shares are not allowed. As a result, all repurchased shares are retired when acquired. During the second quarter of fiscal 2008, the Company’s total cumulative stock repurchases exceeded the total shares issued in connection with the Company’s October 2000 initial public offering, and stock repurchases in excess of this amount are assumed to be made from the Company’s April 2001 Sara Lee exchange offer. Shares issued in connection with this exchange offer were accounted for as a contribution to common stock and retained earnings. Therefore, stock repurchases and retirements associated with the exchange offer are accounted for by allocation of the repurchase price to common stock and retained earnings. During the fourth quarter of fiscal 2010, cumulative stock repurchases allocated to retained earnings resulted in an accumulated deficit balance. Since its initial public offering, the Company has not experienced a net loss in any fiscal year,
62
COACH, INC.
Notes to Consolidated Financial Statements (Continued)
(dollars and shares in thousands, except per share data)
and the net accumulated deficit balance in stockholders’ equity is attributable to the cumulative stock repurchase activity. The total cumulative amount of common stock repurchase price allocated to retained earnings as of
June 28, 2014
and
June 29, 2013
was approximately
$6,725,000
and
$6,200,000
, respectively.
Revenue Recognition
Revenue is recognized by the Company when there is persuasive evidence of an arrangement, delivery has occurred (and risks and rewards of ownership have been transferred to the buyer), price has been fixed or is determinable, and collectability is reasonably assured.
Retail store and concession-based shop-in-shop revenues are recognized at the point of sale, which occurs when merchandise is sold in an over-the-counter consumer transaction. These revenues are recognized net of estimated returns at the time of sale to consumers. Internet revenue from sales of products ordered through the Company’s e-commerce sites is recognized upon delivery and receipt of the shipment by its customers and includes shipping and handling charges paid by customers. Internet revenue is also reduced by an estimate for returns.
Wholesale revenue is recognized at the time title passes and risk of loss is transferred to customers. Wholesale revenue is recorded net of estimates of returns, discounts, and markdown allowances. Returns and allowances require pre-approval from management and discounts are based on trade terms. Estimates for markdown reserves are based on historical trends, actual and forecasted seasonal results, an evaluation of current economic and market conditions, retailer performance, and, in certain cases, contractual terms. The Company reviews and refines these estimates on at least a quarterly basis. The Company’s historical estimates of these costs have not differed materially from actual results.
Gift cards issued by the Company are recorded as a liability until they are redeemed, at which point revenue is recognized. The Company recognizes income for unredeemed gift cards when the likelihood of a gift card being redeemed by a customer is remote, which is approximately
two years
after the gift card is issued, and the Company determines that it does not have a legal obligation to remit the value of the unredeemed gift card to the relevant jurisdiction as unclaimed or abandoned property. Revenue associated with gift card breakage is not material to the Company’s net operating results.
The Company accounts for sales taxes and other related taxes on a net basis, excluding such taxes from revenue.
Cost of Sales
Cost of sales consists of inventory costs and other related costs such as changes in reserves for shrinkage and inventory realizability, destruction costs, damages and replacements.
Selling, General and Administrative Expenses ("SG&A")
Selling, general and administrative expenses are comprised of four categories: (1) selling; (2) advertising, marketing and design; (3) distribution and customer service; and (4) administrative. Selling expenses include store employee compensation, occupancy costs and supply costs, wholesale and retail account administration compensation globally and Coach international operating expenses. These expenses are affected by the number of Coach-operated stores open during any fiscal period and store performance, as compensation and rent expenses vary with sales. Advertising, marketing and design expenses include employee compensation, media space and production, advertising agency fees (primarily to support North America), new product design costs, public relations and market research expenses. Distribution and customer service expenses include warehousing, order fulfillment, shipping and handling, customer service and bag repair costs. Administrative expenses include compensation costs for “corporate” functions including: executive, finance, human resources, legal and information systems departments, as well as corporate headquarters occupancy costs, consulting and certain software expenses. Administrative expenses also include global equity compensation expense.
Shipping and Handling
Shipping and handling costs incurred were
$61,893
,
$66,828
and
$52,240
in fiscal
2014
, fiscal
2013
and fiscal
2012
, respectively, and are included in selling, general and administrative expenses.
Advertising
Advertising costs include expenses related to direct marketing activities, such as direct mail pieces, digital and other media and production costs. In fiscal
2014
, fiscal
2013
and fiscal
2012
, advertising expenses totaled
$130,122
,
$102,701
and
$89,159
respectively, and are included in selling, general and administrative expenses. Advertising costs are expensed when the advertising first appears.
63
COACH, INC.
Notes to Consolidated Financial Statements (Continued)
(dollars and shares in thousands, except per share data)
Share-Based Compensation
The Company recognizes the cost of equity awards to employees and the non-employee Directors based on the grant-date fair value of those awards. The grant-date fair values of share unit awards are based on the fair value of the Company's common stock on the date of grant. The grant-date fair value of stock option awards is determined using the Black-Scholes option pricing model and involves several assumptions, including the expected term of the option, expected volatility and dividend yield. The expected term of options represents the period of time that the options granted are expected to be outstanding and is based on historical experience. Expected volatility is based on historical volatility of the Company’s stock as well as the implied volatility from publicly traded options on Coach’s stock. Dividend yield is based on the current expected annual dividend per share and the Company’s stock price. Changes in the assumptions used to determine the Black-Scholes value could result in significant changes in the Black-Scholes value.
For stock options and share unit awards, the Company recognizes share-based compensation net of estimated forfeitures and revises the estimates in subsequent periods if actual forfeitures differ from the estimates. The Company estimates the forfeiture rate based on historical experience as well as expected future behavior.
The Company grants performance-based share awards to certain key executives, the vesting of which is subject to the executive’s continuing employment and the Company's achievement of certain performance goals. On a quarterly basis, the Company assesses actual performance versus the predetermined performance goals, and adjusts the share-based compensation expense to reflect the relative performance achievement. Actual distributed shares are calculated upon conclusion of the service and performance periods, and include dividend equivalent shares. If the performance-based award incorporates a market condition, the grant-date fair value of such award is determined using a pricing model, such as a Monte Carlo Simulation.
Income Taxes
The Company’s effective tax rate is based on pre-tax income, statutory tax rates, tax laws and regulations, and tax planning strategies available in the various jurisdictions in which Coach operates. The Company classifies interest and penalties on uncertain tax positions in the provision for income taxes. Coach records net deferred tax assets to the extent the Company believes that it is more likely than not that these assets will be realized. In making such determination, the Company considers all available evidence, including scheduled reversals of deferred tax liabilities, projected future taxable income, tax planning strategies and recent results of operation. The Company reduces deferred tax assets by a valuation allowance if, based upon the weight of available evidence, it is more likely than not that some amount of deferred tax assets is not expected to be realized. Deferred taxes are not provided on the undistributed earnings of subsidiaries as such amounts are considered to be permanently invested.
The Company recognizes the impact of tax positions in the financial statements if those positions will more likely than not be sustained on audit, based on the technical merits of the position. Although the Company believes that the estimates and assumptions used are reasonable and legally supportable, the final determination of tax audits could be different than that which is reflected in historical tax provisions and recorded assets and liabilities. Tax authorities periodically audit the Company’s income tax returns, and in specific cases, the tax authorities may take a contrary position that could result in a significant impact on our results of operations. Significant management judgment is required in determining the effective tax rate, in evaluating our tax positions and in determining the net realizable value of deferred tax assets.
Derivative Instruments
Substantially all of the Company’s transactions involving international parties, excluding international consumer sales, are denominated in U.S. dollars, which limits the Company’s exposure to the effects of foreign currency exchange rate fluctuations. However, the Company is exposed to foreign currency exchange risk related to its foreign operating subsidiaries’ U.S. dollar-denominated inventory purchases and various cross-currency intercompany and related party loans. Coach uses derivative financial instruments to manage these risks. These derivative transactions are in accordance with the Company’s risk management policies. Coach does not enter into derivative transactions for speculative or trading purposes.
The Company records all derivative contracts at fair value on the consolidated balance sheet. The fair values of foreign currency derivatives are based on the forward curves of the specific indices upon which settlement is based and include an adjustment for the Company’s credit risk. Judgment is required of management in developing estimates of fair value. The use of different market assumptions or methodologies could affect the estimated fair value.
For derivative instruments that qualify for hedge accounting, the effective portion of changes in the fair value of these instruments is either (i) offset against the changes in fair value of the hedged assets or liabilities through earnings or (ii) recognized as a component of accumulated other comprehensive income (loss) ("AOCI") until the hedged item is recognized in earnings, depending on whether the derivative is being used to hedge changes in fair value or cash flows, respectively.
64
COACH, INC.
Notes to Consolidated Financial Statements (Continued)
(dollars and shares in thousands, except per share data)
Each derivative instrument entered into by the Company that qualifies for hedge accounting is expected to be highly effective at reducing the risk associated with the exposure being hedged. For each derivative that is designated as a hedge, the Company documents the related risk management objective and strategy, including identification of the hedging instrument, the hedged item and the risk exposure, as well as how hedge effectiveness will be assessed over the term of the instrument. The extent to which a hedging instrument has been and is expected to remain highly effective in achieving offsetting changes in fair value or cash flows is assessed and documented by the Company on at least a quarterly basis.
To the extent that a derivative designated as a cash flow hedge is not considered to be effective, any change in its fair value related to such ineffectiveness is immediately recognized in earnings within foreign currency gains (losses). If it is determined that a derivative instrument has not been highly effective, and will continue not to be highly effective in hedging the designated exposure, hedge accounting is discontinued and further gains (losses) are recognized in earnings within foreign currency gains (losses). Upon discontinuance of hedge accounting, the cumulative change in fair value of the derivative previously recorded in AOCI is recognized in earnings when the related hedged item affects earnings, consistent with the original hedging strategy, unless the forecasted transaction is no longer probable of occurring, in which case the accumulated amount is immediately recognized in earnings within foreign currency gains (losses).
As a result of the use of derivative instruments, the Company may be exposed to the risk that the counterparties to such contacts will fail to meet their contractual obligations. To mitigate this counterparty credit risk, the Company has a policy of only entering into contracts with carefully selected financial institutions based upon an evaluation of their credit ratings, among other factors.
The fair values of the Company’s derivative instruments are recorded on its consolidated balance sheets on a gross basis. For cash flow reporting purposes, the Company classifies proceeds received or amounts paid upon the settlement of a derivative instrument in the same manner as the related item being hedged, primarily within cash from operating activities.
Hedging Portfolio
The Company enters into derivative contracts primarily to reduce its risks related to exchange rate fluctuations on U.S. dollar-denominated inventory purchases and various cross-currency intercompany and related party loans. To the extent its derivative contracts designated as cash flow hedges are highly effective in offsetting changes in the value of the hedged items, the related gains (losses) are initially deferred in AOCI and subsequently recognized in the consolidated statements of income as follows:
|
•
|
Zero-cost collars
- These derivatives are primarily executed by two of the Company’s businesses outside of the United States (Coach Japan and Coach Canada), and are recognized as part of the cost of the inventory purchases being hedged within cost of sales, when the related inventory is sold to a third party. Current maturity dates range from July 2014 to June 2015.
|
|
•
|
Cross currency swaps
- These derivatives relate to intercompany loans, and are recognized within foreign currency gains (losses) generally in the period in which the related payments being hedged are revalued or settled. Current maturity dates range from August 2014 to November 2014.
|
Forward foreign currency exchange contracts, designated as fair value hedges and associated with intercompany and other contractual obligations, are recognized within foreign currency gains (losses) generally in the period in which the related payments being hedged are revalued. Current maturity dates range from July 2014 to August 2014.
Foreign Currency
The functional currency of the Company's foreign operations is generally the applicable local currency. Assets and liabilities are translated into U.S. dollars using the current exchange rates in effect at the balance sheet date, while revenues and expenses are translated at the weighted-average exchange rates for the period. The resulting translation adjustments are included in the consolidated statements of comprehensive income as a component of other comprehensive income (loss) (“OCI”) and in the consolidated statements of equity within AOCI. Gains and losses on the translation of intercompany loans made to foreign subsidiaries that are of a long-term investment nature also are included within this component of equity.
The Company also recognizes gains and losses on transactions that are denominated in a currency other than the respective entity's functional currency in earnings. Foreign currency transaction gains and losses also include amounts realized on the settlement of certain intercompany loans with foreign subsidiaries.
Earnings per Share
Basic net income per share is calculated by dividing net income by the weighted-average number of shares outstanding during the period. Diluted net income per share is calculated similarly but includes potential dilution from the exercise of stock options and vesting of stock awards, or any other potentially dilutive instruments.
65
COACH, INC.
Notes to Consolidated Financial Statements (Continued)
(dollars and shares in thousands, except per share data)
Reclassifications
Certain prior year amounts, specifically related to disclosures of short-term investments in Note 10, "Fair Value Measurements" and amounts in connection with the acquisition of the retail business in Europe, have been reclassified to conform to the current year presentation in the consolidated financial statements.
Recent Accounting Pronouncements
In February 2013, the Financial Accounting Standards Board (“FASB”) issued Accounting Standards Update (“ASU”) No. 2013-02, “Reporting of Amounts Reclassified Out of Accumulated Other Comprehensive Income” (“ASU 2013-02”). ASU 2013-02 requires disclosure of significant amounts reclassified out of AOCI by component. If the amounts are required to be reclassified from AOCI to net income in their entirety in the same reporting period, the effect of such reclassifications on the relevant line items of net income must be presented either on the face of the financial statements or in the notes. For amounts that are not required to be reclassified to net income in their entirety in the same reporting period, cross-references to other disclosures that provide additional details about such reclassifications are required. ASU 2013-02 did not change the requirements for determining or reporting net income or OCI. The Company adopted the provisions of ASU 2013-02 as of the beginning of the first quarter of fiscal 2014, which resulted in expanded OCI-related disclosures (see Note 4), but did not have an impact on the Company’s Consolidated Financial Statements.
In May 2014, the FASB issued Accounting Standards Codification Topic 606, “Revenue from Contracts with Customers,” which provides a single, comprehensive revenue recognition model for all contracts with customers, and contains principles to determine the measurement of revenue and timing of when it is recognized. The requirements of the new standard will be effective for annual reporting periods beginning after December 15, 2016, and interim periods within those annual periods, which for the Company is the first quarter of fiscal 2018. The Company is currently evaluating this guidance, but does not expect its adoption to have a material effect on its Consolidated Financial Statements
.
3. TRANSFORMATION, RESTRUCTURING AND OTHER RELATED ACTIONS
Fiscal 2014 Charges
Transformation-Related Charges
During the fourth quarter of fiscal 2014, Coach announced a multi-year strategic plan to transform the brand and reinvigorate growth. This multi-faceted, multi-year transformation plan (the "Transformation Plan") includes key operational and cost measures needed in order to fund and execute this plan, including: (i) the investment in capital improvements in stores and wholesale locations in fiscal 2015 and fiscal 2016; (ii) the optimization of the North American store fleet including the closure of underperforming locations in fiscal 2015; (iii) the realignment of inventory levels to reflect the Company's elevated product strategy in fiscal 2014; (iv) the investment in incremental advertising costs to further promote this new strategy starting in fiscal 2015; and (v) the significant scale-back of the Company's promotional cadence, particularly within the outlet Internet sales site starting in fiscal 2014.
In fiscal
2014
, the Company incurred restructuring and transformation related charges of
$131,507
(
$88,281
after-tax, or
$0.31
per diluted share). The charges recorded in cost of sales and SG&A expenses were
$82,192
and
$49,315
, respectively, and primarily relate to the Company's North America business.
A summary of charges and related liabilities under the Company's Transformation Plan are as follows:
|
Inventory-Related Charges
|
Impairment
|
Store-Related Costs
(1)
|
Other
|
Total
|
|||||||||||||||
|
Fiscal 2014 charges
|
$
|
82,192
|
|
$
|
35,544
|
|
$
|
12,191
|
|
$
|
1,580
|
|
$
|
131,507
|
|
||||
|
Cash payments
|
—
|
|
—
|
|
—
|
|
—
|
|
—
|
|
|||||||||
|
Non-cash charges
|
(66,774
|
)
|
(35,544
|
)
|
(6,737
|
)
|
—
|
|
(109,055
|
)
|
|||||||||
|
Liability as of June 28, 2014
|
$
|
15,418
|
|
$
|
—
|
|
$
|
5,454
|
|
$
|
1,580
|
|
$
|
22,452
|
|
||||
(1)
Includes store closure costs, related severance and accelerated depreciation charges as a result of store updates.
Inventory-related charges, recorded within cost of sales, primarily relate to reserves for the donation and destruction of certain on-hand inventory and future non-cancelable inventory purchase commitments. Impairment charges, recorded within SG&A expenses, were based on discounted expected cash flows within certain impacted retail stores, and resulted in the reduction of the
66
COACH, INC.
Notes to Consolidated Financial Statements (Continued)
(dollars and shares in thousands, except per share data)
net carrying value of store-related long-lived assets to their estimated fair value. Store-related costs, recorded within SG&A expenses, primarily relate to accelerated depreciation charges associated with store assets that the Company will no longer benefit from as a result of the Transformation Plan, including certain store employee restructuring costs. The above charges were recorded as corporate unallocated expenses within the Company's Consolidated Statements of Income.
The Company expects to incur additional pre-tax charges of approximately
$120,000
to
$170,000
, primarily in fiscal 2015, in connection with the Transformation Plan. These costs will primarily consist of store-related costs (including accelerated depreciation charges as a result of store updates) and organizational efficiency charges (including employee severance costs).
Sale of Reed Krakoff Business
On
August 30, 2013
, the Company sold the Reed Krakoff business, involving the sale of the equity interests of Reed Krakoff LLC and certain assets, including the Reed Krakoff brand name and related intellectual property rights, to Reed Krakoff International LLC (“Buyer”). The sale was pursuant to the Asset Purchase and Sale Agreement dated
July 29, 2013
(the “Purchase Agreement”) with Buyer and Reed Krakoff, the Company’s former President and Executive Creative Director. Coach received a de minimus amount of cash and convertible preferred membership interests representing
8.0%
of Buyer’s issued and outstanding convertible preferred units and initial equity value immediately following such issuance. Coach recorded a cost method investment of $
3,261
, included in Long-term investments in the consolidated balance sheet at
June 28, 2014
.
Concurrent with the Closing under the Purchase Agreement, the parties executed certain ancillary agreements which included a transition services agreement between Coach and Buyer for up to nine months.
In connection with the Purchase Agreement, Mr. Krakoff’s resignation from Coach and the closing of the sale, Mr. Krakoff waived his right to receive compensation, salary, bonuses, equity vesting and certain other benefits. The Company recorded a loss of $
2,683
during the first quarter of fiscal
2014
related to the sale, which is recorded in SG&A expenses on the Consolidated Statements of Income.
Fiscal 2013 Charges
Restructuring and Transformation-Related Charges
In fiscal
2013
, the Company incurred restructuring and transformation related charges, which are not related to the Company's fiscal 2014 Transformation Plan, of
$53,202
(
$32,568
after-tax, or
$0.11
per diluted share). The charges recorded in SG&A expenses and cost of sales were
$48,402
and
$4,800
, respectively. The charges primarily related to our North America segment.
A summary of charges and related liabilities are as follows:
|
Severance and Related Costs
|
Impairment
|
Other
|
Total
|
||||||||||||
|
Fiscal 2013 charges
|
$
|
29,859
|
|
$
|
16,624
|
|
$
|
6,719
|
|
$
|
53,202
|
|
|||
|
Cash payments
|
—
|
|
—
|
|
—
|
|
—
|
|
|||||||
|
Non-cash charges
|
(1,980
|
)
|
$
|
(16,624
|
)
|
$
|
(6,636
|
)
|
$
|
(25,240
|
)
|
||||
|
Liability as of June 29, 2013
|
$
|
27,879
|
|
$
|
—
|
|
$
|
83
|
|
$
|
27,962
|
|
|||
|
(Income) expense
|
$
|
(1,732
|
)
|
$
|
—
|
|
$
|
1,903
|
|
$
|
171
|
|
|||
|
Non-cash charges
|
(345
|
)
|
—
|
|
(1,822
|
)
|
(2,167
|
)
|
|||||||
|
Cash payments and settlements
|
(25,245
|
)
|
$
|
—
|
|
$
|
(164
|
)
|
$
|
(25,409
|
)
|
||||
|
Liability as of June 28, 2014
|
$
|
557
|
|
$
|
—
|
|
$
|
—
|
|
$
|
557
|
|
|||
67
COACH, INC.
Notes to Consolidated Financial Statements (Continued)
(dollars and shares in thousands, except per share data)
4. ACCUMULATED OTHER COMPREHENSIVE INCOME
The components of accumulated other comprehensive income, as of the dates indicated, are as follows:
|
Gains
|
Unrealized
|
||||||||||||||||||
|
(Losses)
|
(Losses) Gains
|
||||||||||||||||||
|
on Cash
|
on Available-
|
Cumulative
|
|||||||||||||||||
|
Flow
|
for-Sale
|
Translation
|
|||||||||||||||||
|
Hedges
(1)
|
Securities
|
Adjustment
|
Other
(2)
|
Total
|
|||||||||||||||
|
Balance at June 30, 2012
|
$
|
(461
|
)
|
$
|
—
|
|
$
|
55,360
|
|
$
|
(4,424
|
)
|
$
|
50,475
|
|
||||
|
Other comprehensive income (loss) before reclassifications
|
8,005
|
|
(1,276
|
)
|
(66,990
|
)
|
1,343
|
|
(58,918
|
)
|
|||||||||
|
Less: gains reclassified from accumulated other comprehensive income
|
3,803
|
|
—
|
|
—
|
|
—
|
|
3,803
|
|
|||||||||
|
Net current-period other comprehensive income (loss)
|
4,202
|
|
(1,276
|
)
|
(66,990
|
)
|
1,343
|
|
(62,721
|
)
|
|||||||||
|
Balance at June 29, 2013
|
$
|
3,741
|
|
$
|
(1,276
|
)
|
$
|
(11,630
|
)
|
$
|
(3,081
|
)
|
$
|
(12,246
|
)
|
||||
|
Other comprehensive income before reclassifications
|
3,271
|
|
3,150
|
|
2,378
|
|
105
|
|
8,904
|
|
|||||||||
|
Less: gains (losses) reclassified from accumulated other comprehensive income
|
6,422
|
|
67
|
|
—
|
|
(1,072
|
)
|
5,417
|
|
|||||||||
|
Net current-period other comprehensive (loss) income
|
(3,151
|
)
|
3,083
|
|
2,378
|
|
1,177
|
|
3,487
|
|
|||||||||
|
Balance at June 28, 2014
|
$
|
590
|
|
$
|
1,807
|
|
$
|
(9,252
|
)
|
$
|
(1,904
|
)
|
$
|
(8,759
|
)
|
||||
|
(1)
|
The ending balances of accumulated other comprehensive income related to cash flow hedges are net of tax of
$(532)
and
$(2,338)
as of
June 28, 2014
and
June 29, 2013
, respectively. The amounts reclassified from accumulated other comprehensive income are net of tax of
$(3,432)
and
$(2,416)
as of
June 28, 2014
and
June 29, 2013
, respectively.
|
|
(2)
|
The components of Other include the accumulated loss on the Company's investment in an auction rate security and the minimum pension liability adjustment of
$0
and
$(1,904)
as of
June 28, 2014
and
$(1,072)
and
$(2,009)
as of
June 29, 2013
, respectively. As of
June 28, 2014
and
June 29, 2013
the balances of accumulated other comprehensive income are net of tax of
$1,531
and
$2,118
, respectively.
|
5. SHARE-BASED COMPENSATION
The Company maintains several share-based compensation plans which are more fully described below. The following table shows the total compensation cost charged against income for these plans and the related tax benefits recognized in the income statement:
|
June 28, 2014
(1)
|
June 29,
2013 |
June 30,
2012 |
|||||||||
|
Compensation expense
|
$
|
104,940
|
|
$
|
120,460
|
|
$
|
107,511
|
|
||
|
Related income tax benefit
|
33,095
|
|
39,436
|
|
37,315
|
|
|||||
(1)
Approximately
$9,834
of share based compensation expense and
$3,997
of related income tax benefit are related to the sale of the Reed Krakoff business and restructuring and transformation recognized by the Company in the first quarter of fiscal 2014. See Note 3 for information as it relates to the sale of the Reed Krakoff business.
68
COACH, INC.
Notes to Consolidated Financial Statements (Continued)
(dollars and shares in thousands, except per share data)
Coach Stock-Based Plans
Coach maintains the 2010 Stock Incentive Plan to award stock options and shares to certain members of Coach management and the outside members of its Board of Directors (“Board”). Coach maintains the 2000 Stock Incentive Plan and the 2004 Stock Incentive Plan for awards granted prior to the establishment of the 2010 Stock Incentive Plan. These plans were approved by Coach’s stockholders. The exercise price of each stock option equals
100%
of the market price of Coach’s stock on the date of grant and generally has a maximum term of
10 years
. Stock options and service based share awards that are granted as part of the annual compensation process generally vest ratably over
three
years. Other stock option and share awards are subject to forfeiture until completion of the vesting period, which ranges from
one
to
five
years. The Company issues new shares upon the exercise of stock options or vesting of share units.
Stock Options
A summary of stock option activity during the year ended
June 28, 2014
is as follows:
|
Number of
Options Outstanding
|
Weighted-
Average
Exercise
Price
|
Weighted-
Average
Remaining
Contractual
Term
(in years)
|
Aggregate
Intrinsic
Value
|
|||||||||
|
Outstanding at June 29, 2013
|
12,893
|
|
$
|
43.37
|
|
|
|
|
||||
|
Granted
|
2,440
|
|
52.52
|
|
|
|
|
|||||
|
Exercised
|
(1,380
|
)
|
32.27
|
|
|
|
|
|||||
|
Forfeited or expired
|
(2,274
|
)
|
55.60
|
|
||||||||
|
Outstanding at June 28, 2014
|
11,679
|
|
44.21
|
|
5.67
|
$
|
19,920
|
|
||||
|
Vested or expected to vest at June 28, 2014
|
11,419
|
|
43.96
|
|
5.55
|
19,920
|
|
|||||
|
Exercisable at June 28, 2014
|
7,550
|
|
38.92
|
|
4.07
|
19,920
|
|
|||||
The fair value of each Coach option grant is estimated on the date of grant using the Black-Scholes option pricing model and the following weighted-average assumptions:
|
June 28,
2014 |
June 29,
2013 |
June 30,
2012 |
||||||
|
Expected term (years)
|
3.1
|
|
3.1
|
|
3.1
|
|
||
|
Expected volatility
|
32.5
|
%
|
39.5
|
%
|
39.4
|
%
|
||
|
Risk-free interest rate
|
0.8
|
%
|
0.4
|
%
|
0.6
|
%
|
||
|
Dividend yield
|
2.6
|
%
|
2.2
|
%
|
1.5
|
%
|
||
The expected term of options represents the period of time that the options granted are expected to be outstanding and is based on historical experience. Expected volatility is based on historical volatility of the Company’s stock as well as the implied volatility from publicly traded options on Coach’s stock. The risk free interest rate is based on the zero-coupon U.S. Treasury issue as of the date of the grant. Dividend yield is based on the current expected annual dividend per share and the Company’s stock price.
The weighted-average grant-date fair value of options granted during fiscal 2014, fiscal 2013 and fiscal 2012 was
$9.79
,
$13.02
, and
$15.59
, respectively. The total intrinsic value of options exercised during fiscal 2014, fiscal 2013 and fiscal 2012 was
$28,028
,
$76,956
, and
$197,793
, respectively. The total cash received from option exercises was
$44,541
,
$74,277
, and
$178,292
in fiscal 2014, fiscal 2013 and fiscal 2012, respectively, and the cash tax benefit realized for the tax deductions from these option exercises was
$10,419
,
$29,230
, and
$73,982
, respectively.
At
June 28, 2014
,
$26,059
of total unrecognized compensation cost related to non-vested stock option awards is expected to be recognized over a weighted-average period of
1.0 year
.
69
COACH, INC.
Notes to Consolidated Financial Statements (Continued)
(dollars and shares in thousands, except per share data)
Service-based Restricted Stock Unit Awards (“RSUs”)
A summary of service-based RSU activity during the year ended
June 28, 2014
is as follows:
|
Number of
Non-vested
Share Units
|
Weighted-
Average
Grant-Date
Fair Value
|
|||||
|
Non-vested at June 29, 2013
|
3,269
|
|
$
|
54.06
|
|
|
|
Granted
|
2,018
|
|
52.93
|
|
||
|
Vested
|
(1,503
|
)
|
50.89
|
|
||
|
Forfeited
|
(563
|
)
|
54.88
|
|
||
|
Non-vested at June 28, 2014
|
3,221
|
|
54.68
|
|
||
At
June 28, 2014
,
$92,437
of total unrecognized compensation cost related to non-vested share awards is expected to be recognized over a weighted-average period of
1.0 year
.
The weighted-average grant-date fair value of share awards granted during fiscal
2014
, fiscal
2013
and fiscal
2012
was
$52.93
,
$54.49
and
$62.84
, respectively. The total fair value of shares vested during fiscal
2014
, fiscal
2013
and fiscal
2012
was
$78,692
,
$93,319
and
$99,488
, respectively.
Performance-based Restricted Stock Unit Awards (“PRSU”)
The Company grants performance-based share awards to key executives, the vesting of which is subject to the executive’s continuing employment and the Company's achievement of certain performance goals. A summary of performance-based share award activity during the year ended
June 28, 2014
is as follows:
|
Number of
Non-vested
Share Units
|
Weighted-
Average
Grant-Date
Fair Value
|
|||||
|
Non-vested at June 29, 2013
|
1,093
|
|
$
|
46.84
|
|
|
|
Granted
|
315
|
|
32.53
|
|
||
|
Change due to performance condition achievement
|
62
|
|
36.48
|
|
||
|
Vested
|
(453
|
)
|
40.96
|
|
||
|
Forfeited
|
(118
|
)
|
42.81
|
|
||
|
Non-vested at June 28, 2014
|
899
|
|
44.60
|
|
||
At
June 28, 2014
,
$14,535
of total unrecognized compensation cost related to non-vested share awards is expected to be recognized over a weighted-average period of
1.4 years
.
The weighted-average grant-date fair value of share awards granted during fiscal
2014
, fiscal
2013
and fiscal
2012
was
$32.53
,
$50.55
and
$62.07
, respectively. The total fair value of awards that vested during fiscal 2014 was
$23,754
. There were
no
vestings of performance-based shares during fiscal
2013
or fiscal
2012
.
During fiscal 2014, the Company granted
241
shares of common stock with a fair value of
$6,814
to selected executives as retention PRSU awards with a maximum potential number of shares issued and fair value (excluding dividends) of
321
shares and
$9,085
, respectively. These shares are included within the PRSU tables above. The shares of common stock under these PRSU awards will be earned and distributed based on performance criteria which compares the Company’s total stockholder return over the performance period to the total stockholder return of the companies included in the Standard & Poor’s 500 Index on the date of grant (excluding the Company). The grant date fair value of the PRSU awards was determined utilizing a Monte Carlo simulation and the following assumptions: expected volatility of
32.61%
, risk-free interest rate of
0.63%
, and dividend yield of
0.00%
.
In fiscal
2014
, fiscal
2013
and fiscal
2012
, the cash tax benefit realized for the tax deductions from all RSUs (service and performance-based) was $
33,523
, $
26,097
and $
30,740
, respectively.
70
COACH, INC.
Notes to Consolidated Financial Statements (Continued)
(dollars and shares in thousands, except per share data)
Employee Stock Purchase Plan
Under the 2001 Employee Stock Purchase Plan, full-time Coach employees are permitted to purchase a limited number of Coach common shares at
85%
of market value. Under this plan, Coach sold
119
,
122
, and
129
shares to employees in fiscal
2014
, fiscal
2013
and fiscal
2012
, respectively. Compensation expense is calculated for the fair value of employees’ purchase rights using the Black-Scholes model and the following weighted-average assumptions:
|
Fiscal Year Ended
|
||||||||
|
|
June 28,
2014 |
June 29,
2013 |
June 30,
2012 |
|||||
|
Expected term (years)
|
0.5
|
|
0.5
|
|
0.5
|
|
||
|
Expected volatility
|
29.5
|
%
|
34.1
|
%
|
45.6
|
%
|
||
|
Risk-free interest rate
|
0.1
|
%
|
0.1
|
%
|
0.1
|
%
|
||
|
Dividend yield
|
2.2
|
%
|
1.7
|
%
|
1.4
|
%
|
||
The weighted-average fair value of the purchase rights granted during fiscal
2014
, fiscal
2013
and fiscal
2012
was
$13.30
,
$15.08
, and
$17.31
, respectively. The Company issues new shares for employee stock purchases.
6. INVESTMENTS
The following table summarizes the Company’s investments, all of which are denominated in U.S. dollars, recorded within the consolidated balance sheets as of
June 28, 2014
and
June 29, 2013
:
|
June 28, 2014
|
June 29, 2013
|
||||||||||||||||||||||
|
|
Short-term
|
Long-Term
|
Total
|
Short-term
|
Long-term
|
Total
|
|||||||||||||||||
|
Available-for-sale investments:
|
|
|
|
|
|
|
|
|
|
|
|
|
|||||||||||
|
Government securities - U.S.
(1)
|
$
|
41,969
|
|
$
|
55,360
|
|
$
|
97,329
|
|
$
|
—
|
|
$
|
—
|
|
$
|
—
|
|
|||||
|
Corporate debt securities – U.S.
(1)
|
25,387
|
|
144,881
|
|
170,268
|
|
2,094
|
|
63,442
|
|
65,536
|
|
|||||||||||
|
Corporate debt securities – non-U.S.
(1)
|
34,683
|
|
98,766
|
|
133,449
|
|
—
|
|
33,968
|
|
33,968
|
|
|||||||||||
|
Auction rate security
(2)
|
—
|
|
—
|
|
—
|
|
—
|
|
6,000
|
|
6,000
|
|
|||||||||||
|
Asset backed securities
(3)
|
—
|
|
1,085
|
|
1,085
|
|
—
|
|
—
|
|
—
|
|
|||||||||||
|
Available-for-sale investments, total
|
$
|
102,039
|
|
$
|
300,092
|
|
$
|
402,131
|
|
$
|
2,094
|
|
$
|
103,410
|
|
$
|
105,504
|
|
|||||
|
Held to maturity:
|
|||||||||||||||||||||||
|
Government securities - U.S.
(4)
|
$
|
18,173
|
|
$
|
—
|
|
$
|
18,173
|
|
$
|
—
|
|
$
|
—
|
|
$
|
—
|
|
|||||
|
Corporate debt securities – U.S.
(4)
|
33,511
|
|
—
|
|
33,511
|
|
—
|
|
—
|
|
—
|
|
|||||||||||
|
Corporate debt securities – non-U.S.
(4)
|
24,370
|
|
—
|
|
24,370
|
|
—
|
|
—
|
|
—
|
|
|||||||||||
|
Commercial paper
(4)
|
23,541
|
|
—
|
|
23,541
|
|
—
|
|
—
|
|
—
|
|
|||||||||||
|
Other:
|
|
|
|
|
|
|
|
|
|
|
|
|
|||||||||||
|
Time deposits
(5)
|
75,069
|
|
—
|
|
75,069
|
|
70,012
|
|
—
|
|
70,012
|
|
|||||||||||
|
Other
(6)
|
—
|
|
184,426
|
|
184,426
|
|
—
|
|
93,930
|
|
93,930
|
|
|||||||||||
|
Total Investments
|
$
|
276,703
|
|
$
|
484,518
|
|
$
|
761,221
|
|
$
|
72,106
|
|
$
|
197,340
|
|
$
|
269,446
|
|
|||||
|
(1)
|
These securities have maturity dates between calendar years
2014
and
2017
and are recorded at fair value.
|
|
(2)
|
The investment was sold in the third quarter of fiscal 2014. Refer to Note 10, "Fair Value Measurements," for further information.
|
|
(3)
|
The security matures during calendar year 2016.
|
|
(4)
|
These securities have maturity dates of less than one year and are recorded at amortized cost which approximates fair value.
|
71
COACH, INC.
Notes to Consolidated Financial Statements (Continued)
(dollars and shares in thousands, except per share data)
|
(5)
|
These time deposits have original maturities greater than
3 months
and are recorded at fair value.
|
|
(6)
|
Primarily relates to the equity method investment related to an equity interest in an entity formed during fiscal 2013 for the purpose of developing a new office tower in Manhattan (the “Hudson Yards joint venture”), with the Company owning less than
43%
of the joint venture, and the Reed Krakoff cost method investment. As of June 28, 2014, the Company has recorded $
181,163
and $
3,261
in the Hudson Yards joint venture and the Reed Krakoff cost method investment, respectively. The Hudson Yards joint venture is determined to be a VIE primarily due to the fact that it has insufficient equity to finance its activities without additional subordinated financial support from its two joint venture partners. Coach is not considered the primary beneficiary of the entity primarily because the Company does not have the power to direct the activities that most significantly impact the entity’s economic performance. The Company’s maximum loss exposure is limited to the committed capital. Refer to Note 12, "Commitments and Contingencies" for further information.
|
The amortized cost, gross unrealized gains, gross unrealized losses and fair value of available-for-sale securities are presented below:
|
June 28, 2014
|
|||||||||||||||
|
Amortized Cost
|
Gross Unrealized Gains
|
Gross Unrealized Losses
|
Estimated Fair Value
|
||||||||||||
|
Government securities - U.S.
|
$
|
97,224
|
|
$
|
113
|
|
$
|
(8
|
)
|
$
|
97,329
|
|
|||
|
Corporate debt issues - U.S.
|
169,259
|
|
1,024
|
|
(15
|
)
|
170,268
|
|
|||||||
|
Corporate debt issues - non-U.S.
|
132,756
|
|
704
|
|
(11
|
)
|
133,449
|
|
|||||||
|
Asset backed securities
|
1,085
|
|
—
|
|
—
|
|
1,085
|
|
|||||||
|
Total
|
$
|
400,324
|
|
$
|
1,841
|
|
$
|
(34
|
)
|
$
|
402,131
|
|
|||
|
June 29, 2013
|
|||||||||||||||
|
Amortized Cost
|
Gross Unrealized Gains
|
Gross Unrealized Losses
|
Estimated Fair Value
|
||||||||||||
|
Corporate debt issues - U.S.
|
$
|
66,387
|
|
$
|
—
|
|
$
|
(851
|
)
|
$
|
65,536
|
|
|||
|
Corporate debt issues - non-U.S.
|
34,393
|
|
2
|
|
(427
|
)
|
33,968
|
|
|||||||
|
Auction rate security
|
6,000
|
|
—
|
|
—
|
|
6,000
|
|
|||||||
|
Total
|
$
|
106,780
|
|
$
|
2
|
|
$
|
(1,278
|
)
|
$
|
105,504
|
|
|||
7. ACQUISITIONS
Fiscal 2014 Acquisition
On July 1, 2013, Coach became the
100%
owner of its European joint venture by purchasing Hackett Limited’s
50%
interest in the joint venture, enabling Coach to assume direct control and consolidate its European retail business. The joint venture included
18
retail locations in Spain, Portugal, Great Britain, France, Ireland and Germany. The results of the acquired business have been included in the consolidated financial statements since the date of acquisition within the International segment. The purchase price consisted of cash payments of approximately
$15,105
and the forgiveness of a loan from Coach to Hackett Limited of approximately
$18,019
. The Company made cash payments of
$7,893
in fiscal 2013 and
$7,212
in fiscal 2014, which were partially offset by cash acquired as part of the acquisition of
$3,453
. The allocation of the purchase price acquisition has been completed resulting in goodwill of
$14,812
, which is not tax deductible.
Fiscal 2013 Acquisitions
On July 1, 2012, Coach acquired
100%
of its domestic retail business in Malaysia (consisting of
10
retail stores) from the former distributor, Valiram Group, and on August 5, 2012, acquired
100%
of its domestic retail business in South Korea (consisting of
47
retail and department store locations) from the former distributor, Shinsegae International. The results of the acquired businesses have been included in the consolidated financial statements since the dates of acquisition within the International segment. The aggregate cash paid in connection with the acquisitions of the Malaysia and South Korea businesses was
$8,593
and
72
COACH, INC.
Notes to Consolidated Financial Statements (Continued)
(dollars and shares in thousands, except per share data)
$36,851
, respectively. The Company made a contingent payment to Shinsegae International, of
$6,000
in fiscal 2014 (classified as financing activities within the Consolidated Statements of Cash Flows) and is scheduled to make a contingent payment of
$4,000
during the first quarter of fiscal 2015.
The following table summarizes the fair values of the assets acquired as part of the fiscal 2013 acquisitions:
|
Assets Acquired
|
Fair Value
|
||
|
Current assets
|
$
|
21,448
|
|
|
Fixed assets and other non-current assets
|
2,351
|
|
|
|
Goodwill
(1)
|
31,645
|
|
|
|
Total assets acquired
|
$
|
55,444
|
|
(1)
Approximately
$30,000
of the goodwill balance is tax deductible.
Unaudited pro forma information related to the fiscal 2014 and 2013 acquisitions is not included, as the impact of these transactions is not material to the consolidated results of the Company.
8. LEASES
Coach leases office, distribution and retail facilities. The lease agreements, which expire at various dates through
2028
, are subject, in most cases, to renewal options and provide for the payment of taxes, insurance and maintenance. Certain leases contain escalation clauses resulting from the pass-through of increases in operating costs, property taxes and the effect on costs from changes in consumer price indices. Certain rentals are also contingent upon factors such as sales.
Rent expense for the Company's operating leases consisted of the following:
|
Fiscal Year Ended
|
|||||||||||
|
|
June 28,
2014 |
June 29,
2013 |
June 30,
2012 |
||||||||
|
Minimum rent
|
$
|
172,768
|
|
$
|
169,737
|
|
$
|
153,577
|
|
||
|
Contingent rent
(1)
|
144,439
|
|
112,568
|
|
94,579
|
|
|||||
|
Total rent expense
|
$
|
317,207
|
|
$
|
282,305
|
|
$
|
248,156
|
|
||
|
(1)
|
A portion of the increase in contingent rent from fiscal 2013 is due to the inclusion of concession-based expense attributable to certain shop-in-shops in the International segment.
|
Future minimum rental payments under noncancelable operating leases are as follows:
|
Fiscal Year
|
Amount
|
|||
|
2015
|
$
|
208,519
|
|
|
|
2016
|
186,808
|
|
||
|
2017
|
166,338
|
|
||
|
2018
|
135,464
|
|
||
|
2019
|
107,937
|
|
||
|
Subsequent to 2019
|
405,891
|
|
||
|
Total minimum future rental payments
|
$
|
1,210,957
|
|
|
73
COACH, INC.
Notes to Consolidated Financial Statements (Continued)
(dollars and shares in thousands, except per share data)
9. DERIVATIVE INSTRUMENTS AND HEDGING ACTIVITIES
The following tables provide information related to the Company’s derivatives:
|
Notional Value
|
Derivative Assets
|
Derivative Liabilities
|
||||||||||||||||||||||||||
|
|
Fair Value
|
Fair Value
|
||||||||||||||||||||||||||
|
Designated Derivative Hedging Instruments
(1)
|
June 28, 2014
|
June 29, 2013
|
Balance Sheet Classification
|
June 28, 2014
|
June 29, 2013
|
Balance Sheet Classification
|
June 28, 2014
|
June 29, 2013
|
||||||||||||||||||||
|
C - Inventory purchases
|
$
|
90,274
|
|
$
|
193,352
|
|
Other Current Assets
|
$
|
439
|
|
$
|
1,592
|
|
Accrued Liabilities
|
$
|
(565
|
)
|
$
|
(2,555
|
)
|
||||||||
|
CCS - Intercompany loans
|
4,793
|
|
111,195
|
|
Other Current Assets
|
53
|
|
1,366
|
|
Accrued Liabilities
|
—
|
|
(85
|
)
|
||||||||||||||
|
FC - Intercompany & Related Party Loans
|
8,375
|
|
36,396
|
|
Other Current Assets
|
—
|
|
1,024
|
|
Accrued Liabilities
|
(9
|
)
|
—
|
|
||||||||||||||
|
FC - Contractual Obligations
(2)
|
4,000
|
|
16,944
|
|
Other Current Assets
|
—
|
|
523
|
|
Accrued Liabilities
|
(323
|
)
|
(255
|
)
|
||||||||||||||
|
Total Hedges
|
$
|
107,442
|
|
$
|
357,887
|
|
$
|
492
|
|
$
|
4,505
|
|
$
|
(897
|
)
|
$
|
(2,895
|
)
|
||||||||||
|
(1)
|
C = Zero-cost Collars; CCS = Cross Currency Swaps; FC = Forward foreign currency exchange contracts;
|
|
(2)
|
Contractual obligations as of fiscal 2014 and 2013 consist of
$4,000
and
$10,000
respectively, due to Shinsegae International, related to the acquisition of the domestic retail business in South Korea. Fiscal 2013 also had contractual obligations of
$6,944
due to Hackett Limited related to the acquired European joint venture.
|
|
Amount of Gain (Loss) Recognized in OCI on Derivatives (Effective Portion)
|
Amount of Net Gain (Loss) Reclassified from Accumulated OCI into Income (Effective Portion)
|
|||||||||||||||||||||||||
|
|
Fiscal Year Ended
(1)
|
Income
Statement
Classification
|
Fiscal Year Ended
(2)
|
|||||||||||||||||||||||
|
Designated Cash Flow Hedges:
|
June 28,
2014 |
June 29,
2013 |
June 30,
2012 |
June 28,
2014 |
June 29,
2013 |
June 30,
2012 |
||||||||||||||||||||
|
C - Inventory purchases
|
$
|
3,085
|
|
$
|
8,483
|
|
$
|
(2,568
|
)
|
Cost of Sales
|
$
|
6,422
|
|
$
|
3,803
|
|
$
|
(3,099
|
)
|
|||||||
|
CCS - Intercompany loans
|
186
|
|
(478
|
)
|
473
|
|
SG&A
|
—
|
|
—
|
|
—
|
|
|||||||||||||
|
Total Hedges
|
$
|
3,271
|
|
$
|
8,005
|
|
$
|
(2,095
|
)
|
$
|
6,422
|
|
$
|
3,803
|
|
$
|
(3,099
|
)
|
||||||||
|
(1)
|
For fiscal
2014
, fiscal
2013
and fiscal
2012
, the amounts above are net of tax of
$(1,626)
,
$(5,325)
and
$1,858
, respectively.
|
|
(2)
|
For fiscal
2014
, fiscal
2013
and fiscal
2012
, the amounts above are net of tax of
$(3,432)
,
$(2,416)
and
$2,181
, respectively.
|
During fiscal
2014
and fiscal
2013
, there were
no
material gains or losses recognized in income due to hedge ineffectiveness.
For forward foreign currency exchange contracts that are designated as fair value hedges, the gain (loss) on the derivative as well as the offsetting gain (loss) on the hedged item attributable to the hedged risk, both of which are recorded within SG&A, resulted in an immaterial net impact to the Company's statement of operations.
The Company expects that
$1,131
of net derivative gains included in accumulated other comprehensive income at
June 28, 2014
will be reclassified into earnings within the next
12 months
. This amount will vary due to fluctuations in foreign currency exchange rates.
10. FAIR VALUE MEASUREMENTS
The Company categorizes its assets and liabilities based on the priority of the inputs to the valuation technique into a three-level fair value hierarchy as set forth below. The three levels of the hierarchy are defined as follows:
Level 1 — Unadjusted quoted prices in active markets for identical assets or liabilities.
74
COACH, INC.
Notes to Consolidated Financial Statements (Continued)
(dollars and shares in thousands, except per share data)
Level 2 — Observable inputs other than quoted prices included in Level 1. Level 2 inputs include quoted prices for identical assets or liabilities in non-active markets, quoted prices for similar assets or liabilities in active markets, and inputs other than quoted prices that are observable for substantially the full term of the asset or liability.
Level 3 — Unobservable inputs reflecting management’s own assumptions about the input used in pricing the asset or liability.
The following table shows the fair value measurements of the Company’s financial assets and liabilities at
June 28, 2014
and
June 29, 2013
:
|
Level 1
|
Level 2
|
Level 3
|
|||||||||||||||||||||
|
|
June 28,
2014 |
June 29,
2013 |
June 28,
2014 |
June 29,
2013 |
June 28,
2014 |
June 29,
2013 |
|||||||||||||||||
|
Assets:
|
|
|
|
|
|
|
|
|
|
|
|
|
|||||||||||
|
Cash equivalents
(1)
|
$
|
1,188
|
|
$
|
124,420
|
|
$
|
45,169
|
|
$
|
337,239
|
|
$
|
—
|
|
$
|
—
|
|
|||||
|
Short-term investments:
|
|
|
|
|
|
|
|
|
|
|
|
|
|||||||||||
|
Time deposits
(2)
|
—
|
|
—
|
|
75,069
|
|
70,012
|
|
—
|
|
—
|
|
|||||||||||
|
Commercial paper
(2)
|
—
|
|
—
|
|
—
|
|
—
|
|
—
|
|
—
|
|
|||||||||||
|
Government securities - U.S.
(2)
|
41,969
|
|
—
|
|
—
|
|
—
|
|
—
|
|
—
|
|
|||||||||||
|
Corporate debt securities - U.S.
(2)
|
—
|
|
—
|
|
25,387
|
|
2,094
|
|
—
|
|
—
|
|
|||||||||||
|
Corporate debt securities - non U.S.
(2)
|
—
|
|
—
|
|
34,683
|
|
—
|
|
—
|
|
—
|
|
|||||||||||
|
Long-term investments:
|
|||||||||||||||||||||||
|
Asset backed securities
(3)
|
—
|
|
—
|
|
1,085
|
|
—
|
|
—
|
|
—
|
|
|||||||||||
|
Government securities - U.S.
(3)
|
55,360
|
|
—
|
|
—
|
|
—
|
|
—
|
|
—
|
|
|||||||||||
|
Corporate debt securities – U.S.
(3)
|
—
|
|
—
|
|
144,881
|
|
63,442
|
|
—
|
|
—
|
|
|||||||||||
|
Corporate debt securities - non U.S.
(3)
|
—
|
|
—
|
|
98,766
|
|
33,968
|
|
—
|
|
—
|
|
|||||||||||
|
Auction rate security
(4)
|
—
|
|
—
|
|
—
|
|
—
|
|
—
|
|
6,000
|
|
|||||||||||
|
Derivative Assets:
|
|||||||||||||||||||||||
|
Zero-cost collar options
(5)
|
—
|
|
—
|
|
439
|
|
1,592
|
|
—
|
|
—
|
|
|||||||||||
|
Forward contracts and cross currency swaps
(5)
|
—
|
|
—
|
|
53
|
|
2,913
|
|
—
|
|
—
|
|
|||||||||||
|
Total
|
$
|
98,517
|
|
$
|
124,420
|
|
$
|
425,532
|
|
$
|
511,260
|
|
$
|
—
|
|
$
|
6,000
|
|
|||||
|
Liabilities:
|
|
|
|
|
|
|
|
|
|
|
|
|
|||||||||||
|
Derivative liabilities:
|
|||||||||||||||||||||||
|
Zero-cost collar options
(5)
|
$
|
—
|
|
$
|
—
|
|
$
|
565
|
|
$
|
2,555
|
|
$
|
—
|
|
$
|
—
|
|
|||||
|
Forward contracts and cross currency swaps
(5)
|
—
|
|
—
|
|
332
|
|
340
|
|
—
|
|
—
|
|
|||||||||||
|
Total
|
$
|
—
|
|
$
|
—
|
|
$
|
897
|
|
$
|
2,895
|
|
$
|
—
|
|
$
|
—
|
|
|||||
75
COACH, INC.
Notes to Consolidated Financial Statements (Continued)
(dollars and shares in thousands, except per share data)
|
(1)
|
Cash equivalents consist of money market funds and time deposits with maturities of three months or less at the date of purchase. Due to their short term maturity, management believes that their carrying value approximates fair value.
|
|
(2)
|
Short-term available-for-sale investments are recorded at fair value, which approximates their carrying value, and are primarily based upon quoted vendor or broker priced securities in active markets. Short-term held to maturity investments are recorded at amortized cost, which approximates fair value (Level 2).
|
|
(3)
|
Fair value is primarily determined using vendor or broker priced securities in active markets. These securities have maturity dates between calendar years 2015 and 2017.
|
|
(4)
|
Fair value is determined using a valuation model that takes into consideration the financial conditions of the issuer and the bond insurer, current market conditions and the value of the collateral bonds. The Company has determined that the significant majority of the inputs used to value this security fall within Level 3 of the fair value hierarchy as the inputs are based on unobservable estimates.
This security was sold during the third quarter of fiscal 2014.
|
|
(5)
|
The fair value of these hedges is primarily based on the forward curves of the specific indices upon which settlement is based and includes an adjustment for the counterparty’s or Company’s credit risk.
|
The following table present a reconciliation of the assets measured at fair value on a recurring basis using significant unobservable inputs (Level 3) for the year ended
June 28, 2014
and
June 29, 2013
. Level 3 available-for-sale securities consisted of one auction rate security.
|
June 28,
|
June 29,
|
||||||
|
2014
|
2013
|
||||||
|
Balance, beginning of year
|
$
|
6,000
|
|
$
|
6,000
|
|
|
|
Losses reclassified out of other comprehensive income
|
1,072
|
|
—
|
|
|||
|
Loss on sale (included in "Income before taxes")
|
(25
|
)
|
—
|
|
|||
|
Sale of investment
|
(7,047
|
)
|
—
|
|
|||
|
Balance, end of year
|
$
|
—
|
|
$
|
6,000
|
|
|
Non-Financial Assets and Liabilities
The Company’s non-financial instruments, which primarily consist of goodwill and property and equipment, are not required to be measured at fair value on a recurring basis and are reported at carrying value. However, on a periodic basis whenever events or changes in circumstances indicate that their carrying value may not be fully recoverable (and at least annually for goodwill), non-financial instruments are assessed for impairment and, if applicable, written-down to and recorded at fair value, considering market participant assumptions.
The Company incurred impairment charges of
$35,544
in fiscal
2014
and
$16,624
in fiscal 2013, to reduce the carrying amount of certain store assets (primarily leasehold improvements at selected retail store locations) to their fair values of
$6,876
as of
June 28, 2014
and $
4,310
as of
June 29, 2013
. The fair values of these assets were determined based on Level 3 measurements. Inputs to these fair value measurements included estimates of the amount and the timing of the stores' net future discounted cash flows based on historical experience, current trends, and market conditions.
Revolving Credit Facilities
On June 18, 2012, the Company established a
$400,000
revolving credit facility with certain lenders and JP Morgan Chase Bank, N.A. as the primary lender and administrative agent (the “JP Morgan facility”) with a maturity date of
June 2017
. On March 26, 2013, the Company amended the JP Morgan facility to expand available aggregate revolving commitments to
$700,000
and to extend the maturity date to
March 2018
. The JP Morgan facility is available to finance the seasonal working capital requirements and general corporate purposes of the Company and its subsidiaries. At Coach’s request and lenders’ consent, revolving commitments of the JP Morgan facility may be increased to
$1,000,000
. As of
June 28, 2014
and June 29, 2013, there was
$140,000
and
$0
, respectively, of outstanding borrowings on the JP Morgan facility. Due to the short-term nature of this borrowing, the fair value approximates carrying value.
76
COACH, INC.
Notes to Consolidated Financial Statements (Continued)
(dollars and shares in thousands, except per share data)
Borrowings under the JP Morgan Facility bear interest at a rate per annum equal to, at Coach’s option, either (a) a rate based on the rates applicable for deposits in the interbank market for U.S. dollars or the applicable currency in which the loans are made plus an applicable margin or (b) an alternate base rate (which is a rate equal to the greatest of (1) the Prime Rate in effect on such day, (2) the Federal Funds Effective Rate in effect on such day plus ½ of
1%
or (3) the Adjusted LIBO Rate for a one month Interest Period on such day plus
1%
). Additionally, Coach pays a commitment fee on the average daily unused amount of the JP Morgan Facility. At
June 28, 2014
, the commitment fee was
9
basis points.
Coach Japan maintains credit facilities with several Japanese financial institutions to provide funding for working capital and general corporate purposes, with total maximum borrowing capacity of
5.3 billion
yen, or approximately
$52,300
at
June 28, 2014
. Interest is based on the Tokyo Interbank rate plus a margin of
25
to
30
basis points. At
June 28, 2014
and during fiscal
2014
, there were
no
outstanding borrowings under these facilities.
Coach Shanghai Limited maintains a credit facility to provide funding for working capital and general corporate purposes, with a maximum borrowing capacity of
63.0 million
Chinese renminbi, or approximately
$10,100
at
June 28, 2014
. Interest is based on the People's Bank of China rate. At
June 28, 2014
and during fiscal
2014
, there were
no
outstanding borrowings under this facility.
Both the Coach Japan and Coach Shanghai Limited credit facilities can be terminated at any time by either party, and there is
no
guarantee that they will be available to the Company in future periods.
12. COMMITMENTS AND CONTINGENCIES
As of
June 28, 2014
, the Company's equity method investment related to an equity interest in an entity formed during fiscal 2013 for the purpose of developing a new office tower in Manhattan, the Hudson Yards joint venture, with the Company owning less than
43%
of the joint venture. This investment is included in the Company’s long-term investments.
The formation of the Hudson Yards joint venture serves as a financing vehicle for the project. Construction of the new building has commenced and upon completion of the office tower in fiscal 2016, the Company will retain a condominium interest serving as its new corporate headquarters. During fiscal
2014
, the Company invested
$87,233
in the joint venture. Since the formation of the Hudson Yards joint venture, the Company has invested $
181,163
. The Company expects to invest approximately
$350,000
over the next two years, with approximately
$240,000
estimated in fiscal 2015, depending on construction progress. Outside of the joint venture, Coach is directly investing in a portion of the design and build-out of the new corporate headquarters. In fiscal
2014
,
$2,082
was included in capital expenditures and we expect approximately another
$188,000
over the period of construction.
The Hudson Yards joint venture is determined to be a VIE primarily due to the fact that it has insufficient equity to finance its activities without additional subordinated financial support from its
two
joint venture partners. Coach is not considered the primary beneficiary of the entity primarily because the Company does not have the power to direct the activities that most significantly impact the entity’s economic performance. The Company’s maximum loss exposure is limited to the committed capital.
At
June 28, 2014
and
June 29, 2013
, the Company had standby letters of credit totaling
$5,558
and
$14,885
outstanding. The letters of credit, which expire at various dates through
2015
, primarily collateralize the Company’s obligation to third parties for insurance claims and value-added tax refunds. Coach pays certain fees with respect to letters of credit that are issued.
The Company had other contractual cash obligations as of
June 28, 2014
, including
$533,504
related to inventory purchase obligations,
$15,900
related to capital expenditure purchase obligations, and
$9,100
of other purchase obligations. Refer to Note 8, "Leases," for a summary of the Company's future minimum rental payments under noncancelable leases.
In the ordinary course of business, Coach is a party to several pending legal proceedings and claims. Although the outcome of such items cannot be determined with certainty, Coach's general counsel and management are of the opinion that the final outcome will not have a material effect on Coach's cash flow, results of operations or financial position.
77
COACH, INC.
Notes to Consolidated Financial Statements (Continued)
(dollars and shares in thousands, except per share data)
13. GOODWILL AND OTHER INTANGIBLE ASSETS
The change in the carrying amount of the Company’s goodwill, all of which is included within the International reportable segment, is as follows:
|
Total
|
|||
|
Balance at June 30, 2012
|
$
|
376,035
|
|
|
Acquisition of Singapore and Taiwan retail businesses
|
31,645
|
|
|
|
Foreign exchange impact
|
(62,641
|
)
|
|
|
Balance at June 29, 2013
|
345,039
|
|
|
|
Acquisition of Europe retail business
|
14,812
|
|
|
|
Foreign exchange impact
|
1,556
|
|
|
|
Balance at June 28, 2014
|
$
|
361,407
|
|
At
June 28, 2014
and
June 29, 2013
, the Company’s intangible assets, which are not subject to amortization, consisted of
$9,788
of trademarks.
14. INCOME TAXES
The provisions for income taxes computed by applying the U.S. statutory rate to income before taxes as reconciled to the actual provisions were:
|
Fiscal Year Ended
|
||||||||||||||||||||
|
|
June 28, 2014
|
June 29, 2013
|
June 30, 2012
|
|||||||||||||||||
|
|
Amount
|
Percentage
|
Amount
|
Percentage
|
Amount
|
Percentage
|
||||||||||||||
|
Income before provision for income taxes:
|
|
|
|
|
|
|
|
|
|
|
|
|
||||||||
|
United States
|
$
|
818,610
|
|
72.9
|
%
|
$
|
1,116,819
|
|
73.4
|
%
|
$
|
1,152,576
|
|
76.5
|
%
|
|||||
|
Foreign
|
303,645
|
|
27.1
|
|
403,707
|
|
26.6
|
|
353,087
|
|
23.5
|
|
||||||||
|
Total income before provision for income taxes:
|
$
|
1,122,255
|
|
100.0
|
%
|
$
|
1,520,526
|
|
100.0
|
%
|
$
|
1,505,663
|
|
100.0
|
%
|
|||||
|
Tax expense at U.S. statutory rate
|
$
|
392,789
|
|
35.0
|
%
|
$
|
532,184
|
|
35.0
|
%
|
$
|
526,979
|
|
35.0
|
%
|
|||||
|
State taxes, net of federal benefit
|
34,581
|
|
3.1
|
|
51,036
|
|
3.4
|
|
46,233
|
|
3.1
|
|
||||||||
|
Effects of foreign operations
|
(93,125
|
)
|
(8.3
|
)
|
(119,218
|
)
|
(7.9
|
)
|
(120,642
|
)
|
(8.1
|
)
|
||||||||
|
Tax benefit related to agreements with tax authorities
|
—
|
|
—
|
|
(3,546
|
)
|
(0.2
|
)
|
(11,553
|
)
|
(0.7
|
)
|
||||||||
|
Other, net
|
6,674
|
|
0.6
|
|
25,650
|
|
1.7
|
|
25,736
|
|
1.7
|
|
||||||||
|
Taxes at effective worldwide rates
|
$
|
340,919
|
|
30.4
|
%
|
$
|
486,106
|
|
32.0
|
%
|
$
|
466,753
|
|
31.0
|
%
|
|||||
Current and deferred tax provision (benefit) was:
|
Fiscal Year Ended
|
|||||||||||||||||||||||
|
|
June 28, 2014
|
June 29, 2013
|
June 30, 2012
|
||||||||||||||||||||
|
|
Current
|
Deferred
|
Current
|
Deferred
|
Current
|
Deferred
|
|||||||||||||||||
|
Federal
|
$
|
283,391
|
|
$
|
(6,759
|
)
|
$
|
411,646
|
|
$
|
(11,596
|
)
|
$
|
398,494
|
|
$
|
9,676
|
|
|||||
|
Foreign
|
19,953
|
|
(5,745
|
)
|
12,944
|
|
4,146
|
|
(13,685
|
)
|
16,623
|
|
|||||||||||
|
State
|
60,362
|
|
(10,283
|
)
|
68,036
|
|
930
|
|
54,108
|
|
1,537
|
|
|||||||||||
|
Total current and deferred tax provision (benefit)
|
$
|
363,706
|
|
$
|
(22,787
|
)
|
$
|
492,626
|
|
$
|
(6,520
|
)
|
$
|
438,917
|
|
$
|
27,836
|
|
|||||
78
COACH, INC.
Notes to Consolidated Financial Statements (Continued)
(dollars and shares in thousands, except per share data)
The components of deferred tax assets and liabilities were:
|
June 28,
2014 |
June 29,
2013 |
||||||
|
Share-based compensation
|
$
|
66,793
|
|
$
|
66,590
|
|
|
|
Reserves not deductible until paid
|
97,917
|
|
49,531
|
|
|||
|
Employee benefits
|
39,465
|
|
62,628
|
|
|||
|
Net operating loss
|
23,197
|
|
25,413
|
|
|||
|
Other
|
9,716
|
|
(1,037
|
)
|
|||
|
Prepaid expenses
|
$
|
506
|
|
$
|
2,234
|
|
|
|
Property and equipment
|
18,505
|
|
(1,996
|
)
|
|||
|
Gross deferred tax assets
|
$
|
256,099
|
|
$
|
203,363
|
|
|
|
Goodwill
|
91,411
|
|
73,726
|
|
|||
|
Other
|
217
|
|
323
|
|
|||
|
Gross deferred tax liabilities
|
91,628
|
|
74,049
|
|
|||
|
Net deferred tax assets
|
$
|
164,471
|
|
$
|
129,314
|
|
|
|
Consolidated Balance Sheets Classification
|
|
|
|
|
|||
|
Deferred income taxes – current asset
|
$
|
112,630
|
|
$
|
111,118
|
|
|
|
Deferred income taxes – noncurrent asset
|
111,556
|
|
84,845
|
|
|||
|
Deferred income taxes – current liability
|
—
|
|
(14,424
|
)
|
|||
|
Deferred income taxes – noncurrent liability (included within "Other Liabilities")
|
(59,715
|
)
|
(52,225
|
)
|
|||
|
Net deferred tax asset
|
$
|
164,471
|
|
$
|
129,314
|
|
|
Significant judgment is required in determining the worldwide provision for income taxes, and there are many transactions for which the ultimate tax outcome is uncertain. It is the Company’s policy to establish provisions for taxes that may become payable in future years, including those due to an examination by tax authorities. The Company establishes the provisions based upon management’s assessment of exposure associated with uncertain tax positions. The provisions are analyzed at least quarterly and adjusted as appropriate based on new information or circumstances.
A reconciliation of the beginning and ending gross amount of unrecognized tax benefits is as follows:
|
June 28,
2014 |
June 29,
2013 |
June 30,
2012 |
|||||||||
|
Balance at beginning of fiscal year
|
$
|
148,810
|
|
$
|
155,599
|
|
$
|
162,060
|
|
||
|
Gross increase due to tax positions related to prior periods
|
14,673
|
|
5,335
|
|
1,271
|
|
|||||
|
Gross decrease due to tax positions related to prior periods
|
(3,317
|
)
|
(6,404
|
)
|
(7,264
|
)
|
|||||
|
Gross increase due to tax positions related to current period
|
28,684
|
|
33,637
|
|
28,151
|
|
|||||
|
Gross decrease due to tax positions related to current period
|
—
|
|
—
|
|
—
|
|
|||||
|
Decrease due to lapse of statutes of limitations
|
(17,309
|
)
|
(29,075
|
)
|
(15,187
|
)
|
|||||
|
Decrease due to settlements with taxing authorities
|
(848
|
)
|
(10,282
|
)
|
(13,432
|
)
|
|||||
|
Balance at end of fiscal year
|
$
|
170,693
|
|
$
|
148,810
|
|
$
|
155,599
|
|
||
Of the
$170,693
ending gross unrecognized tax benefit balance as of
June 28, 2014
,
$113,007
relates to items which, if recognized, would impact the effective tax rate. Of the
$148,810
ending gross unrecognized tax benefit balance as of
June 29, 2013
,
$89,360
relates to items which, if recognized, would impact the effective tax rate. As of
June 28, 2014
and
June 29, 2013
, gross interest and penalties payable was
$17,991
and
$17,301
, respectively, which are included in other liabilities. The Company
79
COACH, INC.
Notes to Consolidated Financial Statements (Continued)
(dollars and shares in thousands, except per share data)
recognized gross interest and penalty expense of
$767
in fiscal 2014, and gross interest and penalty income of
$7,037
and
$10,920
in fiscal 2013 and fiscal 2012, respectively.
The Company files income tax returns in the U.S. federal jurisdiction, as well as various state and foreign jurisdictions. Tax examinations are currently in progress in select foreign and state jurisdictions that are extending the years open under the statutes of limitation. Fiscal years 2011 to present are open to examination in the U.S. federal jurisdiction, fiscal 2007 to present in select state jurisdictions and fiscal 2005 to present in select foreign jurisdictions. The Company anticipates that one or more of these audits may be finalized in the foreseeable future. However, based on the status of these examinations, and the average time typically incurred in finalizing audits with the relevant tax authorities, we cannot reasonably estimate the impact these audits may have in the next 12 months, if any, to previously recorded uncertain tax positions. We accrue for certain known and reasonably anticipated income tax obligations after assessing the likely outcome based on the weight of available evidence. Although we believe that the estimates and assumptions we have used are reasonable and legally supportable, the final determination of tax audits could be different than that which is reflected in historical income tax provisions and recorded assets and liabilities. With respect to all jurisdictions, we believe we have made adequate provision for all income tax uncertainties.
For the years ended
June 28, 2014
and
June 29, 2013
, the Company had net operating loss carryforwards in foreign tax jurisdictions of
$526,681
and
$340,893
, the majority of which can be carried forward indefinitely. The deferred tax assets related to the carryforwards have been reflected net of
$131,788
and
$79,599
valuation allowances at
June 28, 2014
and
June 29, 2013
, respectively. The Company’s valuation allowance increased by
$52,189
in fiscal
2014
and
$26,096
in fiscal
2013
, primarily as the result of actual or anticipated results in the foreign jurisdictions.
The total amount of undistributed earnings of foreign subsidiaries as of
June 28, 2014
and
June 29, 2013
, was
$2,033,869
and
$1,601,637
, respectively. It is the Company’s intention to permanently reinvest undistributed earnings of its foreign subsidiaries and thereby indefinitely postpone their remittance. Accordingly, no provision has been made for foreign withholding taxes or United States income taxes which may become payable if undistributed earnings of foreign subsidiaries are paid as dividends. Determination of the amount of unrecognized deferred income tax liabilities on these earnings is not practicable because such liability, if any, is subject to many variables and is dependent on circumstances existing if and when remittance occurs.
15. DEFINED CONTRIBUTION PLAN
Coach maintains the Coach, Inc. Savings and Profit Sharing Plan, which is a defined contribution plan. Employees who meet certain eligibility requirements and are not part of a collective bargaining agreement may participate in this program. The annual expense incurred by Coach for this defined contribution plan was
$7,541
,
$16,274
, and
$18,641
in fiscal
2014
, fiscal
2013
and fiscal
2012
, respectively.
16. SEGMENT INFORMATION
In fiscal
2014
, the Company’s operations reflect
five
operating segments aggregated into
two
reportable segments:
|
•
|
North America, which includes sales to North American consumers through Company-operated stores, including the Internet, and sales to wholesale customers.
|
|
•
|
International, which includes sales to consumers through Coach-operated stores (including the Internet) and concession shop-in-shops in Japan and mainland China, Coach-operated stores and concession shop-in-shops in Hong Kong, Macau, Singapore, Taiwan, Malaysia, South Korea, the United Kingdom, France, Ireland, Spain, Portugal, Germany and Italy, as well as sales to wholesale customers and distributors in approximately
35
countries.
|
In deciding how to allocate resources and assess performance, Coach's chief operating decision maker regularly evaluates the sales and operating income of these segments. Operating income is the gross margin of the segment less direct expenses of the segment. Unallocated corporate expenses include inventory-related costs (such as production variances), advertising, marketing, design, administration and information systems, as well as distribution and consumer service expenses. Additionally, costs incurred by the Company as described in Note 3, "Transformation, Restructuring and Other Related Actions," are also included as unallocated corporate expenses.
80
COACH, INC.
Notes to Consolidated Financial Statements (Continued)
(dollars and shares in thousands, except per share data)
|
North
America
|
International
(1)
|
Other
(1)(2)
|
Corporate Unallocated
|
Total
|
|||||||||||||||
|
Fiscal 2014
|
|
|
|
|
|
|
|
|
|
|
|||||||||
|
Net sales
|
$
|
3,100,482
|
|
$
|
1,644,163
|
|
$
|
61,581
|
|
$
|
—
|
|
$
|
4,806,226
|
|
||||
|
Gross profit
|
1,992,693
|
|
1,295,253
|
|
36,893
|
|
(27,876
|
)
|
3,296,963
|
|
|||||||||
|
Operating income (loss)
|
1,164,088
|
|
555,714
|
|
34,147
|
|
(633,875
|
)
|
1,120,074
|
|
|||||||||
|
Income (loss) before provision for income taxes
|
1,164,088
|
|
555,714
|
|
34,147
|
|
(631,694
|
)
|
1,122,255
|
|
|||||||||
|
Depreciation and amortization expense
|
72,883
|
|
58,837
|
|
—
|
|
57,640
|
|
189,360
|
|
|||||||||
|
Total assets
|
432,566
|
|
1,128,509
|
|
5,663
|
|
2,096,393
|
|
3,663,131
|
|
|||||||||
|
Additions to long-lived assets
|
102,225
|
|
71,514
|
|
—
|
|
45,848
|
|
219,587
|
|
|||||||||
|
North
America |
International
(1)
|
Other
(1)(2)
|
Corporate Unallocated
|
Total
|
|||||||||||||||
|
Fiscal 2013
|
|
|
|
|
|
|
|
|
|
|
|||||||||
|
Net sales
|
$
|
3,478,198
|
|
$
|
1,558,104
|
|
$
|
39,088
|
|
$
|
—
|
|
$
|
5,075,390
|
|
||||
|
Gross profit
|
2,345,826
|
|
1,255,220
|
|
32,390
|
|
64,712
|
|
3,698,148
|
|
|||||||||
|
Operating income (loss)
|
1,459,974
|
|
582,202
|
|
30,065
|
|
(547,700
|
)
|
1,524,541
|
|
|||||||||
|
Income (loss) before provision for income taxes
|
1,459,974
|
|
582,202
|
|
30,065
|
|
(551,715
|
)
|
1,520,526
|
|
|||||||||
|
Depreciation and amortization expense
|
72,279
|
|
45,693
|
|
—
|
|
45,015
|
|
162,987
|
|
|||||||||
|
Total assets
|
459,835
|
|
894,785
|
|
34,788
|
|
2,142,489
|
|
3,531,897
|
|
|||||||||
|
Additions to long-lived assets
|
98,645
|
|
60,932
|
|
—
|
|
81,776
|
|
241,353
|
|
|||||||||
|
North
America |
International
(1)
|
Other
(1)(2)
|
Corporate Unallocated
|
Total
|
|||||||||||||||
|
Fiscal 2012
|
|
|
|
|
|
|
|
|
|
|
|||||||||
|
Net sales
|
$
|
3,316,895
|
|
$
|
1,413,021
|
|
$
|
33,264
|
|
$
|
—
|
|
$
|
4,763,180
|
|
||||
|
Gross profit
|
2,263,140
|
|
1,139,103
|
|
28,572
|
|
35,263
|
|
3,466,078
|
|
|||||||||
|
Operating income (loss)
|
1,447,964
|
|
557,715
|
|
26,526
|
|
(520,216
|
)
|
1,511,989
|
|
|||||||||
|
Income (loss) before provision for income taxes
|
1,447,964
|
|
557,715
|
|
26,526
|
|
(526,542
|
)
|
1,505,663
|
|
|||||||||
|
Depreciation and amortization expense
|
63,800
|
|
38,361
|
|
—
|
|
30,748
|
|
132,909
|
|
|||||||||
|
Total assets
|
441,826
|
|
985,098
|
|
32,379
|
|
1,645,018
|
|
3,104,321
|
|
|||||||||
|
Additions to long-lived assets
|
75,093
|
|
53,418
|
|
—
|
|
69,776
|
|
198,287
|
|
|||||||||
|
(1)
|
As a result of the acquisition of the European joint venture (as discussed in Note 7), certain amounts have been reclassed from Other to International to conform to the 2014 presentation of the European results. For fiscal 2013, amounts reclassified are net sales of
$17,411
, gross profit of
$8,368
, operating income of
$8,013
and income before provision for income taxes of
$8,013
. For fiscal 2012, amounts reclassified are net sales of
$11,232
, gross profit of
$5,276
, operating income of
$3,880
, and income before provision for income taxes of
$3,880
.
|
(2)
Other, which is not a reportable segment, consists of sales generated in ancillary channels including licensing and disposition.
81
COACH, INC.
Notes to Consolidated Financial Statements (Continued)
(dollars and shares in thousands, except per share data)
Coach's product offerings include modern luxury accessories and lifestyle collections, including women's and men's bags, women’s and men’s small leather goods, business cases, footwear, wearables including outerwear, watches, weekend and travel accessories, scarves, sunwear, fragrance, jewelry, travel bags and other lifestyle products. The following table shows net sales for each product category represented:
|
Fiscal Year Ended
|
||||||||||||||||||||
|
June 28,
2014 |
% of Total
|
June 29,
2013 |
% of Total
|
June 30,
2012 |
% of Total
|
|||||||||||||||
|
Women's Handbags
|
$
|
2,642,402
|
|
55
|
%
|
$
|
2,923,124
|
|
58
|
%
|
$
|
2,886,270
|
|
61
|
%
|
|||||
|
Women's Accessories
|
1,046,265
|
|
22
|
|
1,195,622
|
|
23
|
|
1,169,858
|
|
24
|
|
||||||||
|
Men's
|
691,764
|
|
14
|
|
599,531
|
|
12
|
|
423,524
|
|
9
|
|
||||||||
|
All Other Products
|
425,795
|
|
9
|
|
357,113
|
|
7
|
|
283,528
|
|
6
|
|
||||||||
|
Total Sales
|
$
|
4,806,226
|
|
100
|
%
|
$
|
5,075,390
|
|
100
|
%
|
$
|
4,763,180
|
|
100
|
%
|
|||||
The following is a summary of the all costs not allocated in the determination of segment operating income performance:
|
Fiscal Year Ended
|
|||||||||||
|
|
June 28,
2014 |
June 29,
2013 |
June 30,
2012 |
||||||||
|
Inventory-related costs
(1)
|
$
|
(27,875
|
)
|
$
|
64,712
|
|
$
|
35,262
|
|
||
|
Advertising, marketing and design
|
(238,064
|
)
|
(236,713
|
)
|
(217,167
|
)
|
|||||
|
Administration and information systems
(2)
|
(283,918
|
)
|
(292,985
|
)
|
(272,556
|
)
|
|||||
|
Distribution and customer service
|
(84,018
|
)
|
(82,714
|
)
|
(65,755
|
)
|
|||||
|
Total corporate unallocated
|
$
|
(633,875
|
)
|
$
|
(547,700
|
)
|
$
|
(520,216
|
)
|
||
(1)
Inventory-related costs consist of production variances and transformation-related costs. In fiscal 2014, 2013 and 2012 production variances were
$54,317
,
$69,512
and
$35,262
, respectively. In fiscal 2014 and fiscal 2013, transformation and other-related costs were
($82,192)
and
($4,800)
, respectively. There were no transformation and/or other-related charges in fiscal 2012.
|
(2)
|
Includes
($49,315)
in fiscal 2014 and
($48,402)
in fiscal 2013 related to transformation and other-related charges and
($39,209)
related to charitable contributions in fiscal 2012.
|
Geographic Area Information
As of
June 28, 2014
, Coach operated
303
retail stores and
199
outlet stores in the United States,
29
retail stores and
eight
outlet stores in Canada,
198
concession shop-in-shops within department stores, retail stores and outlet stores in Japan,
250
concession shop-in-shops within department stores, retail stores and outlet stores in Hong Kong, Macau, mainland China, Singapore, Taiwan, Malaysia and South Korea, and
27
concession shop-in-shops within department stores, retail stores and outlet stores in Europe. Coach also operates distribution, product development and quality control locations in the United States, Hong Kong, China, South Korea, Vietnam, Philippines and India. Geographic revenue information is based on the location of our customer. Geographic long-lived asset information is based on the physical location of the assets at the end of each fiscal year and includes property and equipment, net and other assets.
82
COACH, INC.
Notes to Consolidated Financial Statements (Continued)
(dollars and shares in thousands, except per share data)
|
United States
|
Japan
|
Other
International
(1)
|
Total
|
||||||||||||
|
Fiscal 2014
|
|
|
|
|
|
|
|
|
|||||||
|
Net sales
|
$
|
2,968,599
|
|
$
|
654,653
|
|
$
|
1,182,974
|
|
$
|
4,806,226
|
|
|||
|
Long-lived assets
|
594,731
|
|
70,436
|
|
175,478
|
|
840,645
|
|
|||||||
|
Fiscal 2013
|
|
|
|
|
|
|
|
|
|||||||
|
Net sales
|
$
|
3,334,479
|
|
$
|
760,941
|
|
$
|
979,970
|
|
$
|
5,075,390
|
|
|||
|
Long-lived assets
|
638,758
|
|
73,041
|
|
112,139
|
|
823,938
|
|
|||||||
|
Fiscal 2012
|
|
|
|
|
|
|
|
|
|||||||
|
Net sales
|
$
|
3,243,710
|
|
$
|
844,863
|
|
$
|
674,607
|
|
$
|
4,763,180
|
|
|||
|
Long-lived assets
|
631,979
|
|
74,324
|
|
108,334
|
|
814,637
|
|
|||||||
|
(1)
|
Other International sales reflect shipments to third-party distributors, primarily in East Asia, and sales from Coach-operated stores and concession shop-in-shops in Hong Kong, Macau, mainland China, Singapore, Taiwan, Malaysia, South Korea, Europe and Canada.
|
17. EARNINGS PER SHARE
The following is a reconciliation of the weighted-average shares outstanding and calculation of basic and diluted earnings per share:
|
Fiscal Year Ended
|
|||||||||||
|
|
June 28,
2014 |
June 29,
2013 |
June 30,
2012 |
||||||||
|
Net income
|
$
|
781,336
|
|
$
|
1,034,420
|
|
$
|
1,038,910
|
|
||
|
Total weighted-average basic shares
|
277,790
|
|
282,494
|
|
288,284
|
|
|||||
|
Dilutive securities:
|
|
|
|
|
|||||||
|
Share-based award plans
|
987
|
|
1,450
|
|
1,694
|
|
|||||
|
Stock option programs
|
1,602
|
|
2,363
|
|
4,151
|
|
|||||
|
Total weighted-average diluted shares
|
280,379
|
|
286,307
|
|
294,129
|
|
|||||
|
Net income per share:
|
|
|
|
|
|||||||
|
Basic
|
$
|
2.81
|
|
$
|
3.66
|
|
$
|
3.60
|
|
||
|
Diluted
|
$
|
2.79
|
|
$
|
3.61
|
|
$
|
3.53
|
|
||
At
June 28, 2014
, options to purchase
6,378
shares of common stock were outstanding but not included in the computation of diluted earnings per share, as these options’ exercise prices, ranging from
$43.39
to
$78.46
, were greater than the average market price of the common shares.
At
June 29, 2013
, options to purchase
2,145
shares of common stock were outstanding but not included in the computation of diluted earnings per share, as these options’ exercise prices, ranging from
$56.95
to
$78.46
, were greater than the average market price of the common shares.
At
June 30, 2012
, options to purchase
116
shares of common stock were outstanding but not included in the computation of diluted earnings per share, as these options’ exercise prices, ranging from
$72.06
to
$78.46
, were greater than the average market price of the common shares.
83
COACH, INC.
Notes to Consolidated Financial Statements (Continued)
(dollars and shares in thousands, except per share data)
18. STOCK REPURCHASE PROGRAM
Purchases of Coach’s com
mon stock are made from time to time, subject to market conditions and at prevailing market prices, through open market purchases. Under Maryland law, Coach’s state of incorporation, treasury shares are not allowed. As a result, all repurchased shares are retired when acquired. The Company may te
rminate or limit the stock repurchase program at any time.
During fiscal
2014
, fiscal
2013
, and fiscal
2012
, the Company repurchased and retired
10,239
,
7,066
and
10,688
shares, respectively, or
$524,926
,
$400,000
, and
$700,000
of common stock, respectively, at an average cost of
$51.27
,
$56.61
and
$65.49
per share, respectively. As of
June 28, 2014
, Coach had
$836,701
remaining in the stock repurchase program.
19. SUPPLEMENTAL BALANCE SHEET INFORMATION
The components of certain balance sheet accounts are as follows:
|
June 28,
2014 |
June 29,
2013 |
||||||
|
Property and equipment
|
|
|
|
|
|||
|
Land and building
|
$
|
168,550
|
|
$
|
168,550
|
|
|
|
Machinery and equipment
|
34,746
|
|
33,172
|
|
|||
|
Furniture and fixtures
|
544,580
|
|
564,574
|
|
|||
|
Leasehold improvements
|
648,592
|
|
632,550
|
|
|||
|
Construction in progress
|
85,150
|
|
67,665
|
|
|||
|
Less: accumulated depreciation
|
(767,718
|
)
|
(771,740
|
)
|
|||
|
Total property and equipment, net
|
$
|
713,900
|
|
$
|
694,771
|
|
|
|
Accrued liabilities
|
|
|
|
|
|||
|
Payroll and employee benefits
|
$
|
137,752
|
|
$
|
193,112
|
|
|
|
Accrued rent
|
50,946
|
|
39,984
|
|
|||
|
Dividends payable
|
92,582
|
|
94,998
|
|
|||
|
Operating expenses
|
237,483
|
|
215,059
|
|
|||
|
Total accrued liabilities
|
$
|
518,763
|
|
$
|
543,153
|
|
|
|
Other liabilities
|
|
|
|
|
|||
|
Deferred lease obligation
|
$
|
135,154
|
|
$
|
117,502
|
|
|
|
Gross unrecognized tax benefit
|
170,693
|
|
148,810
|
|
|||
|
Deferred tax liabilities
|
59,715
|
|
52,225
|
|
|||
|
Other
|
63,798
|
|
81,207
|
|
|||
|
Total other liabilities
|
$
|
429,360
|
|
$
|
399,744
|
|
|
84
COACH, INC.
Schedule II — Valuation and Qualifying Accounts
For the Fiscal Years Ended
June 28, 2014
,
June 29, 2013
and
June 30, 2012
(amounts in thousands)
|
Balance at Beginning
of Year
|
Provision Charged to Costs and Expenses
|
Write-offs/
Allowances Taken
|
Balance at
End of Year
|
||||||||||||
|
Fiscal 2014
|
|
|
|
|
|
|
|
|
|||||||
|
Allowance for bad debts
|
$
|
1,138
|
|
$
|
1,649
|
|
$
|
(1,368
|
)
|
$
|
1,419
|
|
|||
|
Allowance for returns
|
7,023
|
|
744
|
|
(4,902
|
)
|
2,865
|
|
|||||||
|
Allowance for markdowns
|
8,324
|
|
37,997
|
|
(34,714
|
)
|
11,607
|
|
|||||||
|
Valuation allowance
|
79,599
|
|
52,189
|
|
—
|
|
131,788
|
|
|||||||
|
Total
|
$
|
96,084
|
|
$
|
92,579
|
|
$
|
(40,984
|
)
|
$
|
147,679
|
|
|||
|
Fiscal 2013
|
|
|
|
|
|
|
|
|
|||||||
|
Allowance for bad debts
|
$
|
3,318
|
|
$
|
(529
|
)
|
$
|
(1,651
|
)
|
$
|
1,138
|
|
|||
|
Allowance for returns
|
2,810
|
|
8,644
|
|
(4,431
|
)
|
7,023
|
|
|||||||
|
Allowance for markdowns
|
3,685
|
|
22,484
|
|
(17,845
|
)
|
8,324
|
|
|||||||
|
Valuation allowance
|
53,503
|
|
29,252
|
|
(3,156
|
)
|
79,599
|
|
|||||||
|
Total
|
$
|
63,316
|
|
$
|
59,851
|
|
$
|
(27,083
|
)
|
96,084
|
|
||||
|
Fiscal 2012
|
|
|
|
|
|
|
|
|
|||||||
|
Allowance for bad debts
|
$
|
3,431
|
|
$
|
(117
|
)
|
$
|
4
|
|
$
|
3,318
|
|
|||
|
Allowance for returns
|
2,196
|
|
1,752
|
|
(1,138
|
)
|
2,810
|
|
|||||||
|
Allowance for markdowns
|
3,917
|
|
10,267
|
|
(10,499
|
)
|
3,685
|
|
|||||||
|
Valuation allowance
|
21,800
|
|
31,703
|
|
—
|
|
53,503
|
|
|||||||
|
Total
|
$
|
31,344
|
|
$
|
43,605
|
|
$
|
(11,633
|
)
|
$
|
63,316
|
|
|||
85
COACH, INC.
Quarterly Financial Data
(dollars and shares in thousands, except per share data)
(unaudited)
|
First Quarter
|
Second Quarter
|
Third Quarter
|
Fourth Quarter
|
||||||||||||
|
Fiscal 2014
(1)
|
|
|
|
|
|
|
|
|
|||||||
|
Net sales
|
$
|
1,150,760
|
|
$
|
1,419,624
|
|
$
|
1,099,626
|
|
$
|
1,136,216
|
|
|||
|
Gross profit
|
826,573
|
|
982,679
|
|
781,339
|
|
706,372
|
|
|||||||
|
Net income
|
217,883
|
|
297,438
|
|
190,740
|
|
75,275
|
|
|||||||
|
Net income per common share:
|
|||||||||||||||
|
Basic
|
0.77
|
|
1.07
|
|
0.69
|
|
0.27
|
|
|||||||
|
Diluted
|
0.77
|
|
1.06
|
|
0.68
|
|
0.27
|
|
|||||||
|
Fiscal 2013
(1)
|
|
|
|
|
|
|
|
|
|||||||
|
Net sales
|
$
|
1,161,350
|
|
$
|
1,503,774
|
|
$
|
1,187,578
|
|
$
|
1,222,688
|
|
|||
|
Gross profit
|
845,168
|
|
1,085,382
|
|
880,188
|
|
887,410
|
|
|||||||
|
Net income
|
221,381
|
|
352,764
|
|
238,932
|
|
221,343
|
|
|||||||
|
Net income per common share:
|
|
|
|
|
|
|
|
|
|||||||
|
Basic
|
0.78
|
|
1.25
|
|
0.85
|
|
0.79
|
|
|||||||
|
Diluted
|
0.77
|
|
1.23
|
|
0.84
|
|
0.78
|
|
|||||||
|
Fiscal 2012
(1)
|
|
|
|
|
|
|
|
|
|||||||
|
Net sales
|
$
|
1,050,359
|
|
$
|
1,448,649
|
|
$
|
1,108,981
|
|
$
|
1,155,191
|
|
|||
|
Gross profit
|
764,653
|
|
1,045,211
|
|
818,067
|
|
838,147
|
|
|||||||
|
Net income
|
214,983
|
|
347,495
|
|
225,002
|
|
251,430
|
|
|||||||
|
Net income per common share:
|
|
|
|
|
|
|
|
|
|||||||
|
Basic
|
0.74
|
|
1.20
|
|
0.78
|
|
0.88
|
|
|||||||
|
Diluted
|
0.73
|
|
1.18
|
|
0.77
|
|
0.86
|
|
|||||||
|
(1)
|
The sum of the quarterly earnings per share may not equal the full-year amount, as the computations of the weighted-average number of common basic and diluted shares outstanding for each quarter and the full year are performed independently.
|
86
EXHIBITS TO FORM 10-K
|
(a)
|
Exhibit Table (numbered in accordance with Item 601 of Regulation S-K)
|
|
Exhibit
|
|
Description
|
|
3.1
|
|
Amended and Restated Bylaws of Coach, Inc., dated February 7, 2008, which is incorporated herein by reference from Exhibit 3.1 to Coach’s Current Report on Form 8-K filed on February 13, 2008
|
|
3.2
|
|
Articles Supplementary of Coach, Inc., dated May 3, 2001, which is incorporated herein by reference from Exhibit 3.2 to Coach’s Current Report on Form 8-K filed on May 9, 2001
|
|
3.3
|
|
Articles of Amendment of Coach, Inc., dated May 3, 2001, which is incorporated herein by reference from Exhibit 3.3 to Coach’s Current Report on Form 8-K filed on May 9, 2001
|
|
3.4
|
|
Articles of Amendment of Coach, Inc., dated May 3, 2002, which is incorporated by reference from Exhibit 3.4 to Coach’s Annual Report on Form 10-K for the fiscal year ended June 29, 2002
|
|
3.5
|
|
Articles of Amendment of Coach, Inc., dated February 1, 2005, which is incorporated by reference from Exhibit 99.1 to Coach’s Current Report on Form 8-K filed on February 2, 2005
|
|
4.1
|
|
Specimen Certificate for Common Stock of Coach, which is incorporated herein by reference from Exhibit 4.1 to Coach's Registration Statement on Form S-1 (Registration No. 333-39502)
|
|
4.2
|
|
Deposit Agreement, dated November 24, 2011, between Coach, Inc. and JPMorgan Chase Bank, N.A., as depositary, which is incorporated by reference from Exhibit 4.1 to Coach’s Current Report on Form 8-K filed on November 25, 2011
|
|
4.3
|
|
Deed Poll, dated November 24, 2011, executed by Coach, Inc. and JPMorgan Chase Bank, N.A., as depositary, pursuant to the deposit agreement in favor of and in relation to the rights of the holders of the depositary receipts, which is incorporated by reference from Exhibit 4.1 to Coach’s Current Report on Form 8-K filed on November 25, 2011
|
|
10.1
|
|
Revolving Credit Agreement, dated as of June 18, 2012, by and between Coach, certain lenders and JPMorgan Chase Bank, N.A., as administrative agent, which is incorporated by reference from Exhibit 10.2 to Coach’s Annual Report on Form 10-K for the fiscal year ended June 30, 2012
|
|
10.2
|
|
Amendment No. 1 to the Revolving Credit Agreement, dated as of March 26, 2013, by and between Coach, certain lenders and JPMorgan Chase Bank N.A., as administrative agent, which is incorporated by reference from Exhibit 10.2 to Coach’s Quarterly Report on Form 10-Q for the period ended March 30, 2013
|
|
10.3~
|
|
Limited Liability Company Agreement, dated April 10, 2013, by and between Coach Legacy Yards LLC, an affiliate of Coach, and Podium Fund Tower C SPV LLC, which is incorporated herein by reference from Exhibit 10.3 to Coach’s Annual Report on Form 10-K for the fiscal year ended June 29, 2013
|
|
10.4~
|
|
Development Agreement, dated April 10, 2013, by and between Coach Legacy Yards LLC, an affiliate of Coach, and ERY Developer LLC, which is incorporated herein by reference from Exhibit 10.4 to Coach’s Annual Report on Form 10-K for the fiscal year ended June 29, 2013
|
|
10.5
|
|
Guaranty Agreement, dated April 10, 2013, by Coach, Inc., to and for the benefit of
ERY Developer LLC and Podium Fund Tower C SPV LLC, which is incorporated herein by reference from Exhibit 10.5 to Coach’s Annual Report on Form 10-K for the fiscal year ended June 29, 2013
|
|
10.6
|
|
Purchase and Sale Agreement, dated April 10, 2013, by and between 504-514 West 34
th
Street Corp. and 516 West 34
th
Street LLC, both subsidiaries of Coach, and ERY 34
th
Street Acquisition LLC, which is incorporated herein by reference from Exhibit 10.6 to Coach’s Annual Report on Form 10-K for the fiscal year ended June 29, 2013
|
|
10.7
|
|
Coach, Inc. 2000 Stock Incentive Plan, which is incorporated by reference from Exhibit 10.10 to Coach’s Annual Report on Form 10-K for the fiscal year ended June 28, 2003
|
|
10.8
|
|
Coach, Inc. Performance-Based Annual Incentive Plan, which is incorporated by reference from Appendix A to the Registrant’s Definitive Proxy Statement for the 2008 Annual Meeting of Stockholders, filed on September 19, 2008
|
|
10.9
|
|
Coach, Inc. 2000 Non-Employee Director Stock Plan, which is incorporated by reference from Exhibit 10.13 to Coach’s Annual Report on Form 10-K for the fiscal year ended June 28, 2003
|
|
10.10
|
|
Coach, Inc. Non-Qualified Deferred Compensation Plan for Outside Directors, which is incorporated by reference from Exhibit 10.14 to Coach’s Annual Report on Form 10-K for the fiscal year ended June 28, 2003
|
|
10.11
|
|
Coach, Inc. 2001 Employee Stock Purchase Plan, which is incorporated by reference from Exhibit 10.15 to Coach’s Annual Report on Form 10-K for the fiscal year ended June 29, 2002
|
|
10.12
|
|
Coach, Inc. 2004 Stock Incentive Plan, which is incorporated by reference from Appendix A to the Registrant’s Definitive Proxy Statement for the 2004 Annual Meeting of Stockholders, filed on September 29, 2004
|
87
|
Exhibit
|
|
Description
|
|
10.13
|
|
Employment Agreement dated June 1, 2003 between Coach and Lew Frankfort, which is incorporated by reference from Exhibit 10.20 to Coach’s Annual Report on Form 10-K for the fiscal year ended June 28, 2003
|
|
10.14
|
|
Employment Agreement dated June 1, 2003 between Coach and Reed Krakoff, which is incorporated by reference from Exhibit 10.21 to Coach’s Annual Report on Form 10-K for the fiscal year ended June 28, 2003
|
|
10.15
|
|
Branding Agreement dated August 5, 2010 between Coach and Reed Krakoff, which is incorporated by reference from Exhibit 10.10 to Coach’s Annual Report on Form 10-K for the fiscal year ended July 3, 2010
|
|
10.16
|
|
Amendment to Employment Agreement, dated August 22, 2005, between Coach and Lew Frankfort, which is incorporated by reference from Exhibit 10.23 to Coach’s Annual Report on Form 10-K for the fiscal year ended July 2, 2005
|
|
10.17
|
|
Amendment to Employment Agreement, dated August 22, 2005, between Coach and Reed Krakoff, which is incorporated by reference from Exhibit 10.23 to Coach’s Annual Report on Form 10-K for the fiscal year ended July 2, 2005
|
|
10.18
|
|
Performance Restricted Stock Unit Award Grant Notice and Agreement, dated August 6, 2009, between Coach and Lew Frankfort, which is incorporated by reference from Exhibit 10.13 to Coach’s Annual Report on Form 10-K for the fiscal year ended July 3, 2010
|
|
10.19
|
|
Employment Agreement dated November 8, 2005 between Coach and Michael Tucci, which is incorporated by reference from Exhibit 10.1 to Coach’s Quarterly Report on Form 10-Q for the period ended December 31, 2005
|
|
10.20
|
|
Amendment to Employment Agreement, dated March 11, 2008, between Coach and Reed Krakoff, which is incorporated herein by reference from Exhibit 10.16 to Coach’s Annual Report on Form 10-K for the fiscal year ended June 28, 2008
|
|
10.21
|
|
Amendment to Employment Agreement, dated August 5, 2008, between Coach and Michael Tucci, which is incorporated herein by reference from Exhibit 10.16 to Coach’s Annual Report on Form 10-K for the fiscal year ended June 28, 2008
|
|
10.22
|
|
Performance Restricted Stock Unit Award Grant Notice and Agreement, dated August 5, 2010, between Coach and Jerry Stritzke, which is incorporated herein by reference from Exhibit 10.19 to Coach’s Annual Report on Form 10-K for the fiscal year ended July 3, 2010
|
|
10.23
|
|
Coach, Inc. 2010 Stock Incentive Plan, which is incorporated by reference from Appendix A to the Registrant’s Definitive Proxy Statement for the 2010 Annual Meeting of Stockholders, filed on September 24, 2010
|
|
10.24
|
|
Amendment to Employment Agreement, dated May 7, 2012, between Coach and Lew Frankfort, which is incorporated herein by reference from Exhibit 10.1 to Coach’s Current Report on Form 8-K filed on May 8, 2012
|
|
10.25
|
|
Amendment to Employment Agreement, dated May 7, 2012, between Coach and Reed Krakoff, which is incorporated herein by reference from Exhibit 10.2 to Coach’s Current Report on Form 8-K filed on May 8, 2012
|
|
10.26
|
|
Amendment to Employment Agreement, dated May 7, 2012, between Coach and Michael Tucci, which is incorporated herein by reference from Exhibit 10.3 to Coach’s Current Report on Form 8-K filed on May 8, 2012
|
|
10.27
|
|
Performance Restricted Stock Unit Award Grant Notice and Agreement, dated August 4, 2011, between Coach and Michael Tucci, which is incorporated herein by reference from Exhibit 10.1 to Coach’s Quarterly Report on Form 10-Q for the fiscal period ended October 1, 2011
|
|
10.28
|
|
Employment Offer Letter, dated July 19, 2011, between Coach and Jane Nielsen, which is incorporated herein by reference from Exhibit 10.2 to Coach’s Quarterly Report on Form 10-Q for the fiscal period ended October 1, 2011
|
|
10.29
|
|
Letter Agreement, dated February 13, 2013, between Coach and Victor Luis, which is incorporated herein by reference from Exhibit 10.29 to Coach’s Annual Report on Form 10-K for the fiscal year ended June 29, 2013
|
|
10.30
|
|
Amendment to Employment Agreement, dated May 3, 2013, between Coach and Michael Tucci, which is incorporated herein by reference from Exhibit 10.30 to Coach’s Annual Report on Form 10-K for the fiscal year ended June 29, 2013
|
|
10.31
|
|
Letter Agreement, dated July 10, 2013, between Coach and Reed Krakoff, which is incorporated by reference from Exhibit 10.1 to Coach’s Current Report on Form 8-K filed on July 10, 2013
|
|
10.32
|
|
Sponsor Agreement, dated November 24, 2011, between Coach, Inc. and J.P. Morgan Securities (Asia Pacific) Limited, as sponsor, which is incorporated herein by reference from Exhibit 4.1 to Coach’s Current Report on Form 8-K filed on November 25, 2011
|
|
10.33
|
Coach, Inc. 2013 Performance-Based Annual Incentive Plan, which is incorporated herein by reference from Appendix B to the Registrant’s Definitive Proxy Statement for the 2013 Annual Meeting of Stockholders, filed on September 27, 2013
|
|
88
|
Exhibit
|
|
Description
|
|
10.34
|
Asset Purchase and Sale Agreement, dated as of July 29, 2013, by and among Reed Krakoff Investments LLC, Reed Krakoff and Coach, Inc., which is incorporated herein by reference from Exhibit 10.1 to Coach’s Quarterly Report on Form 10-Q for the fiscal period ended September 28, 2013
|
|
|
10.35
|
Resignation Letter, dated as of July 29, 2013, by and between Reed Krakoff and Coach, Inc., which is incorporated herein by reference from Exhibit 10.3 to Coach’s Quarterly Report on Form 10-Q for the fiscal period ended September 28, 2013
|
|
|
10.36
|
Amendment to Employment Agreement, dated December 23, 2013, between Coach and Lew Frankfort, which is incorporated by reference from Exhibit 10.1 to Coach’s Current Report on Form 8-K filed on December 23, 2013
|
|
|
10.37
|
Amendment No. 2 to the Revolving Credit Agreement, dated as of November 27, 2013, by and between Coach, certain lenders and JPMorgan Chase Bank N.A., as administrative agent, which is incorporated herein by reference from Exhibit 10.3 to Coach’s Quarterly Report on Form 10-Q for the fiscal period ended December 28, 2013
|
|
|
10.38
|
Amendment to Employment Agreement, dated June 30, 2014, between Coach and Lew Frankfort, which is incorporated by reference from Exhibit 10.1 to Coach’s Current Report on Form 8-K filed on July 2, 2014
|
|
|
18
|
|
Letter re: change in accounting principle, which is incorporated herein by reference from Exhibit 18 to Coach’s Quarterly Report on Form 10-Q for the period ended October 2, 2010
|
|
21.1*
|
|
List of Subsidiaries of Coach, Inc,
|
|
23.1*
|
|
Consent of Deloitte & Touche LLP
|
|
31.1*
|
|
Rule 13(a)-14(a)/15(d)-14(a) Certifications
|
|
32.1*
|
|
Section 1350 Certifications
|
|
101.INS*
|
|
XBRL Instance Document
|
|
101.SCH*
|
|
XBRL Taxonomy Extension Schema Document
|
|
101.CAL*
|
|
XBRL Taxonomy Extension Calculation Linkbase
|
|
101.LAB*
|
|
XBRL Taxonomy Extension Label Linkbase
|
|
101.PRE*
|
|
XBRL Taxonomy Extension Presentation Linkbase
|
|
101.DEF*
|
|
XBRL Taxonomy Extension Definition Linkbase
|
|
*
|
Filed herewith
|
|
~
|
The Registrant has requested confidential treatment for certain portions of this Exhibit pursuant to Rule 24b-2 under the Securities Exchange Act of 1934, as amended.
|
89
TABLE OF CONTENTS
Part IItem 1. BusinessItem 1A. Risk FactorsItem 1B. Unresolved Staff CommentsItem 2. PropertiesItem 3. Legal ProceedingsItem 4. Mine Safety DisclosuresPart IIItem 5. Market For Registrant S Common Equity, Related Stockholder Matters and Issuer Purchases Of Equity SecuritiesItem 6. Selected Financial Data (dollars and Shares in Thousands, Except Per Share Data)Item 7. Management S Discussion and Analysis Of Financial Condition and Results Of OperationsItem 7A. Quantitative and Qualitative Disclosures About Market RiskItem 8. Financial Statements and Supplementary DataItem 9. Changes in and Disagreements with Accountants on Accounting and Financial DisclosureItem 9A. Controls and ProceduresItem 9B. Other InformationPart IIIItem 10. Directors, Executive Officers and Corporate GovernanceItem 11. Executive CompensationItem 12. Security Ownership Of Certain Beneficial Owners and Management and Related Stockholder MattersItem 13. Certain Relationships and Related Transactions, and Director IndependenceItem 14. Principal Accounting Fees and ServicesPart IVItem 15. Exhibits, Financial Statement Schedules