PARK CITY GROUP INC
10-Ks and 10-Qs
|
|
|
|
|
|
|
|
|
|
|
|
|
|
|
|
|
|
|
|
|
|
|
|
|
|
|
|
|
|
|
|
|
|
|
|
|
|
|
|
|
|
|
|
|
|
|
|
|
|
|
|
|
|
|
|
|
|
|
|
|
|
UNITED STATES
SECURITIES AND EXCHANGE COMMISSION
Washington, D.C. 20549
FORM 10-K
|
[X]
|
ANNUAL REPORT PURSUANT TO SECTION 13 OR 15(d) OF THE SECURITIES
EXCHANGE ACT OF 1934
|
For
the fiscal year ended June 30, 2017
or
|
[
]
|
TRANSITION REPORT PURSUANT TO SECTION 13 OR 15(d) OF THE SECURITIES
EXCHANGE ACT OF 1934
|
001-34941
(Commission
file number)
PARK CITY GROUP, INC.
(Exact
name of registrant as specified in its charter)
|
Nevada
|
|
37-1454128
|
|
State
or other jurisdiction of incorporation
|
|
(IRS
Employer Identification No.)
|
|
|
|
|
|
299
South Main Street, Suite 2225
Salt Lake City,
Utah 84111
|
|
(435)
645-2000
|
|
(Address
of principal executive offices)
|
|
(Registrant's
telephone number, including area code)
|
Securities registered pursuant to Section 12(b) of the
Act:
|
Title of each
Class
|
|
Name of each
exchange on which registered
|
|
Common
Stock, $0.01 Par Value
|
|
NASDAQ
Capital Market
|
Securities registered pursuant to Section 12(g) of the
Act: None
Indicate
by check mark if the registrant is a well-known seasoned issuer, as
defined in Rule 405 of the Securities Act. [ ]
Yes [X] No
Indicate
by check mark if the registrant is not required to file reports
pursuant to Section 13 or Section 15(d) of the Act. [ ]
Yes [X] No
Indicate
by check mark whether the registrant (1) has filed all reports
required to be filed by Section 13 or 15(d) of the Securities
Exchange Act of 1934 during the preceding 12 months (or for such
shorter period that the registrant was required to file such
reports), and (2) has been subject to such filing requirements for
the past 90 days. [X] Yes [
] No
Indicate
by check mark whether the registrant has submitted electronically
and posted on its corporate Web site, if any, every Interactive
Data File required to be submitted and posted pursuant to Rule 405
of Regulation S-T (§ 229.405 of this chapter) during the
preceding 12 months (or for such shorter period that the registrant
was required to submit and post such files).
[X] Yes [ ] No
Indicate
by check mark if disclosure of delinquent filers pursuant to Item
405 of Regulation S-K (§ 229.405 of this chapter) is not
contained herein, and will not be contained, to the best of
registrant’s knowledge, in definitive proxy or information
statements incorporated by reference in Part III of this Form 10-K
or any amendment to this Form 10-K. [ ]
Indicate
by check mark whether the registrant is a large accelerated filer,
an accelerated filer, a non-accelerated filer, smaller reporting
company, or an emerging growth company. See the definitions of
“large accelerated filer,” “accelerated
filer,” “smaller reporting company,” and
“emerging growth company” in Rule 12b-2 of the Exchange
Act.
|
Large
accelerated filer
|
[
]
|
Accelerated
filer
|
[X]
|
|
Non-accelerated
filer
(Do
not check if a smaller reporting company)
|
[
]
|
Smaller
reporting company
|
[
]
|
|
|
|
Emerging
Growth Company
|
[
]
|
If an
emerging growth company, indicate by check mark if the registrant
has elected not to use the extended transition period for complying
with any new or revised financial accounting standards provided
pursuant to Section 13(a) of the Exchange Act. [
]
Indicate
by check mark whether the registrant is a shell company (as defined
in Rule 12b-2 of the Act).
[
] Yes [X] No
The
aggregate market value of the voting and non-voting common stock
held by non-affiliates of the issuer as of December 31, 2016, which
is the last business day of the registrant’s most recently
completed second fiscal quarter, was approximately
$163,445,000 (at a closing price of $12.70 per share).
As of
September 11, 2017, 19,423,821 shares of the Company’s common
stock, par value $0.01 per share, were
outstanding.
DOCUMENTS INCORPORATED BY REFERENCE
Items 10,
11, 12, 13 and 14 of Part III incorporate by reference certain
information from Park City Group, Inc.’s definitive proxy
statement, to be filed with the Securities and Exchange Commission
on or before October 28, 2017.
TABLE OF
CONTENTS TO ANNUAL REPORT
ON FORM 10-K
Y
EAR ENDED JUNE 30, 2017
|
PART I
|
||
|
1
|
||
|
5
|
||
|
11
|
||
|
11
|
||
|
11
|
||
|
|
||
|
PART II
|
||
|
|
||
|
12
|
||
|
13
|
||
|
15
|
||
|
23
|
||
|
23
|
||
|
23
|
||
|
24
|
||
|
24
|
||
|
|
||
|
PART III
|
||
|
|
||
|
25
|
||
|
25
|
||
|
25
|
||
|
25
|
||
|
25
|
||
|
|
||
|
PART IV
|
||
|
|
||
|
26
|
||
|
|
27
|
|
|
|
|
|
|
|
F-1
|
|
|
|
F-3
|
|
|
|
F-4
|
|
|
|
F-6
|
|
|
|
F-7
|
|
|
|
F-9
|
|
|
|
|
|
|
Exhibit
31
|
Certifications
of the Principal Executive Officer and Principal Financial Officer
pursuant to Section 302 of the Sarbanes-Oxley Act of
2002.
|
|
|
Exhibit
32
|
Certifications
pursuant to 18 U.S.C. Sec. 1350 as adopted pursuant to Section 906
of the Sarbanes-Oxley Act of 2002.
|
|
FORWARD-LOOKING STATEMENTS
This Annual Report on Form 10-K contains forward-looking
statements. The words or phrases “would be,”
“will allow,” “intends to,” “will
likely result,” “are expected to,” “will
continue,” “is anticipated,”
“estimate,” “project,” or similar
expressions are intended to identify “forward-looking
statements.” Actual results could differ
materially from those projected in the forward looking statements
as a result of a number of risks and uncertainties, including the
risk factors set forth below and elsewhere in this
Report. See “Risk Factors” and
“Management's Discussion and Analysis of Financial Condition
and Results of Operations.” Statements made herein
are as of the date of the filing of this Form 10-K with the
Securities and Exchange Commission and should not be relied upon as
of any subsequent date. Unless otherwise required by
applicable law, we do not undertake, and specifically disclaim any
obligation, to update any forward-looking statements to reflect
occurrences, developments, unanticipated events or circumstances
after the date of such statement.
Overview
Park
City Group, Inc. (the “
Company
”) is a
Software-as-a-Service (“
SaaS
”) provider. The
Company’s technology helps companies to synchronize their
systems with those of their trading partners to make more informed
business decisions. We provide companies with greater flexibility
in sourcing products by enabling them to choose new suppliers and
integrate them into their supply chain faster and more cost
effectively, and we help them to more efficiently manage these
relationships, enhancing revenue while lowering working capital,
labor costs and waste. Our ReposiTrak food safety solutions also
help reduce a company’s potential regulatory, legal, and
criminal risk from its supply chain partners by providing a way for
them to ensure these suppliers are compliant with food safety
regulations, such as the Food Safety Modernization Act
(“
FSMA
”).
The
Company’s services are delivered though proprietary software
products designed, developed, marketed and supported by the
Company. These products are designed to provide transparency and
facilitate improved business processes among all key constituents
in the supply chain, starting with the retailer and moving back to
suppliers and eventually to raw material providers. We provide
cloud-based applications and services that address e-commerce,
supply chain, and food safety and compliance activities. The
principal customers for the Company's products are multi-store food
retail store chains and their suppliers, branded food
manufacturers, food wholesalers and distributors, and other food
service businesses.
The
Company has a hub and spoke business model. We are typically
engaged by retailers and distributors (“
Hubs
”), which in turn have us
engage their suppliers (“
Spokes
”) to sign up for our
services. The bulk of the Company’s revenue is from recurring
subscription payments from these suppliers often based on a monthly
volume metric between the Hub and the Spoke. We also have a
professional services business, which conducts customization,
implementation, and training, for which revenue is recognized on a
percentage-of-completion or pro rata over the life of the
subscription, depending on the nature of the engagement. In a few
instances, the Company will also sell its software in the form of a
license.
The
Company is incorporated in the state of Nevada. The Company has
three principal subsidiaries: PC Group, Inc., a Utah corporation
(98.76% owned), Park City Group, Inc., a Delaware corporation (100%
owned) and ReposiTrak, Inc., a Utah corporation (100% owned). All
intercompany transactions and balances have been eliminated in
consolidation.
Our
principal executive offices of the Company are located at 299 South
Main Street, Suite 2225, Salt Lake City, Utah 84111. Our telephone
number is (435) 645-2000. Our website address is
http://www.parkcitygroup.com, and ReposiTrak’s website
address is http://repositrak.com.
Company History
The
Company’s technology has its genesis in the operations of
Mrs. Fields Cookies co-founded by Randall K. Fields, the
Company’s Chief Executive Officer. The Company
began operations utilizing patented computer software and profit
optimization consulting services to help its retail clients reduce
their inventory and labor costs - the two largest controllable
expenses in the retail industry. Because the product concepts
originated in the environment of actual multi-unit retail chain
ownership, the products are strongly oriented to an
operation’s bottom line results.
The
Company was originally incorporated in the State of Delaware on
December 8, 1964, and through a merger with and into Park City
Group, a Nevada corporation, in 2002. As a result, both
the parent-holding company (Nevada) and its operating subsidiary
(Delaware) were named Park City Group, Inc. In February
2014, Park City Group, Inc. (Delaware) was domesticated in Utah and
changed its name to PC Group, Inc. Park City Group, Inc.
(Nevada) has no business operations separate from the
operations conducted through its subsidiaries, including
ReposiTrak, Inc. and Park City Group, Inc., a Delaware
corporation
,
(formerly
Prescient Applied Intelligence, Inc. (“
Prescient
”).
On
January 13, 2009, the Company acquired 100% of Prescient, a leading
provider of on-demand solutions for the retail marketplace,
including both retailers and suppliers. Its solutions
capture information at the point of sale, provide greater
visibility into real-time demand and turn data into actionable
information across the entire supply chain. In February
2014, Prescient changed its name to Park City Group, Inc. The
Company’s consolidated financial statements contain the
results of operations of Park City Group, Inc. (Delaware).
Operations are conducted through this subsidiary.
ReposiTrak was
founded by Leavitt Partners, LP. It was originally incorporated as
Global Supply Chain Systems, Inc. on May 17, 2012 and on November
8, 2012 changed its name to ReposiTrak. ReposiTrak became a
wholly owned subsidiary of Park City Group, Inc. on June 30,
2015.
ReposiTrak was
developed in response to the passage of the FSMA. ReposiTrak helps
a company protect its brand and mitigate potential regulatory,
legal and criminal risk from its supply chain by helping to ensure
that all parties are compliant with best practices and food safety
regulations.
Target Industries Overview
The
Company develops its software for supermarkets, convenience stores
and other retailers. Our offerings include supply chain solutions
focused on large manufacturers, distributors and suppliers in the
consumer products industry. With the acquisition of ReposiTrak in
2015, this was expanded to include manufacturers, distributors and
suppliers in the food industry. The Company also provides
professional consulting services targeting implementation,
assessments, profit optimization and support functions for its
application and related products.
Backdrop
The
U.S. consumer retail sector has faced competitive pressure from a
number of significant forces including the rise of online retailers
with lower fixed operating costs as well as sector consolidation in
many categories. Retailers have responded to these pressures in a
number of ways including putting a greater emphasis on
specialization within their product mix through initiatives such as
local sourcing or the development of in-store brands or private
labels. Retailers have also attempted to lower their fixed cost by
shifting a greater percentage of their product mix to Direct Store
Delivery (“
DSD
”).
The
Company’s software and consulting services are designed to
address the business problems faced by our customers. Our
technology helps retailers to synchronize their business systems
with those of their suppliers in order to give a cohesive view of
their entire supply chain so as to enable them to make more
informed business decisions. Through our cloud-based infrastructure
we provide retailers with greater flexibility in sourcing products
by enabling them to choose new suppliers and integrate them into
their supply chain faster and more cost effectively, and we help
retailers to more efficiently manage their relationships with these
suppliers so that they can “stock less and sell more”
lowering working capital and labor costs while also increasing
revenue.
In
2010, the U.S. Congress passed the FSMA and it was subsequently
signed into law by President Obama in January 2011. The FMSA
essentially makes a food retailer responsible for the safety of its
supply chain and was the most sweeping change in food safety laws
in over 70 years. The law not only provides the U.S. Food and Drug
Administration (
“FDA”
) with new
enforcement authorities, it also sets cause for a whole host of
potential civil claims, significantly enhancing the regulatory
environment in which food growers, processors, distributors and
retailers compete.
ReposiTrak was
developed in response to the passage of the FSMA. ReposiTrak helps
a company to protect its brand from the degradation of value that
typically results from an outbreak of contamination or other
incidents adversely affecting the supply chain as well as mitigates
potential regulatory, legal and criminal risk from its supply chain
by helping a company to ensure that all parties in its supply chain
are compliant with best practices and food and drug safety
regulations.
Solutions and Services
Advanced Commerce and Supply-Chain Solutions
The Company
has been providing advanced commerce and supply-chain solutions to
its retail customers for over 15 years, and has stable and
successful engagements with many of the largest retailers in the
U.S. The Company’s primary advanced commerce and supply-chain
applications are Scan Based Trading, ScoreTracker, Vendor
Managed Inventory, Store Level Replenishment, Enterprise Supply
Chain Planning, Fresh Market Manager and ActionManager®,
all of which are designed to aid the retailer and supplier with
managing inventory, product mix and labor while improving sales
through the reduction of out of stocks by improving visibility and
forecasting.
ReposiTrak Food Safety Solutions
ReposiTrak
leverages the technology developed to help a company protect its
brand and mitigate potential regulatory, legal and criminal risk
from its supply chain by helping to ensure that all parties are
compliant with best practices and food and drug safety regulations
imposed by the FSMA. ReposiTrak® is powered by the
Company’s technology, and currently includes four main
applications: Vendor Validation, Compliance Management, Quality
Management Systems (“
QMS”
) and Track & Trace.
ReposiTrak also hosts and is integrated with the food safety audit
database of the Safe Quality Food Institute (“
SQFI”
). SQFI is one of the
leading schemas for certifying that a food retailer’s
suppliers are compliant with Global Food Safety Initiative
(“
GFSI”
)
standards, which many food retailers require of their suppliers as
a condition of doing business. SQFI is owned and operated by the
Food Marketing Institute (“
FMI”
), one of the food
industry’s largest trade associations.
Converged Business Platform
During
the year ending June 30, 2016, the Company began to embark on a
process of converging our legacy Park City supply-chain business
with our ReposiTrak food safety business. As of the year ending
June 30, 2017, this process has been substantially completed, in so
much as the Company has been able to repurpose its advanced
commerce and supply chain applications so that they can be deployed
and self-implemented by a suppler via ReposiTrak’s highly
scalable online infrastructure. As a result, the Company currently
has a platform-centric end-to-end solution encompassing (i)
ReposiTrak, a comprehensive compliance management platform, (ii)
Vendor Portal, a unified service delivery platform, which combines
the Company’s advanced commerce and supply chain technology
with its ReposiTrak food safety applications, and (iii)
MarketPlace, a compliant vendor sourcing solution which enables a
ReposiTrak HUB to find and engage new ReposiTrak compliant
suppliers.
Professional Services
The
Company has two professional services groups: The Business
Analytics Group offers business-consulting services to suppliers
and retailers in the grocery, convenience store and specialty
retail industries. The Professional Services Group
provides consulting services to ensure that our solutions are
seamlessly integrated into our customers’ business processes
as quickly and efficiently as possible.
Technology, Development and Operations
Product Development
The
products sold by the Company are subject to rapid and continual
technological change. Products available from the Company, as well
as from its competitors, increasingly offer a wider range of
features and capabilities. The Company believes that in order to
compete effectively in its selected markets, it must provide
compatible systems incorporating new technologies at competitive
prices. In order to achieve this, the Company has made a
substantial commitment to on-going development.
Our
product development strategy is focused on creating common
technology elements that can be leveraged in applications across
our core markets. Except for its supply chain application, which is
based on a proprietary architecture, the Company’s software
architecture is based on open platforms and is modular, thereby
allowing it to be phased into a customer’s operations. In
order to remain competitive, we are currently designing, coding and
testing a number of new products and developing expanded
functionality of our current products.
Operations
We
currently serve our customers from a third-party data center
hosting facility. Along with the Company’s Statement on
Standards for Attestation Engagements (“
SSAE
”) No. 16 certification
Service Organization Control (“
SOC2
”), the third-party facility
is also a SSAE No. 16 – SOC2 certified location and is
secured by around-the-clock guards, biometric screening and
escort-controlled access, and is supported by on-site backup
generators in the event of a power failure. As part of our current
disaster recovery arrangements, all of our customers’ data is
currently backed-up in near real-time. Even with the disaster
recovery arrangements, our service could be
interrupted.
Customers
We are
currently engaged by customers of all sizes. Our
customers primarily include food related consumer goods retailers,
suppliers, processors and manufacturers. However, the Company
is opportunistic and will offer its solutions to non-food consumer
goods related companies as well. No single customers
accounted for more than 10% percent of our revenue in fiscal
2017.
Sales, Marketing and Customer Support
Sales and Marketing
Through a focused
and dedicated sales effort designed to address the requirements of
each of its software and service solutions, we believe our sales
force is positioned to understand our customers’ businesses,
trends in the marketplace, competitive products and opportunities
for new product development. Our deep industry knowledge enables
the Company to take a consultative approach in working with our
prospects and customers. Our sales personnel focus on
selling our technology solutions to major customers, both
domestically and internationally.
To
date, our primary marketing objectives have been to increase
awareness of our technology solutions, generate sales leads and
develop new customer relationships. In addition, the
sales effort has been directed toward developing existing customers
by cross-selling ReposiTrak food safety services to legacy Park
City Group accounts as well as introducing our advanced commerce
and supply-chain solutions to ReposiTrak customers. To this end, we
attend industry trade shows, conduct direct marketing programs,
publish industry trade articles and white papers, participate in
interviews and selectively advertise in industry
publications.
During
the year ending June 30, 2016 the Company began to embark on a
process of converging our legacy supply-chain business with our
ReposiTrak food safety business. As part of this process, we have
begun to reorganize our sale force and reorient our marketing
efforts. This process has involved stream lining the sales force in
an effort to enable cross-selling by reducing regional account
managers and shifting our sales emphasis towards ReposiTrak’s
inside sales team located at our corporate headquarters in Salt
Lake City, Utah.
Customer Support
Our
global customer support group responds to both business and
technical inquiries from our customers relating to how to use our
products and is available to customers by telephone and email.
Basic customer support during business hours is available at no
charge to customers who purchase certain Company solutions. Premier
customer support includes extended availability and additional
services, such as an assigned support representative and/or
administrator. Premier customer support is available for an
additional fee. Additional support services include developer
support and partner support.
Competition
The
market for the Company’s products and services is very
competitive. We believe the principal competitive factors include
product quality, reliability, performance, price, vendor and
product reputation, financial stability, features and functions,
ease of use, quality of support and degree of integration effort
required with other systems. Our supply chain solution
competitors include supply chain vendors, major enterprise resource
planning (“
ERP
”) software vendors,
mid-market ERP vendors and niche players for VMI and SLR.
ReposiTrak’s competitors include a variety of food safety
consultants who may help a potential customer build their own
in-house solution as well as certain technology component
providers.
We
compete with large enterprise-wide software vendors, developers and
integrators, business-to-business exchanges, consulting firms,
focused solution providers, and business intelligence technology
platforms. While our competitors are often considerably larger
companies in size with larger sales forces and marketing budgets,
we believe that our deep industry knowledge, the breadth and depth
of our offerings, and our relationships with key industry,
wholesaler, and other trade groups and associations, give us a
competitive advantage. Our ability to continually
improve our products, processes and services, as well as our
ability to develop new products, enables the Company to meet
evolving customer requirements.
Patents and Proprietary Rights
The
Company relies on a combination of trademark, copyright, trade
secret and patent laws in the United States and other jurisdictions
as well as confidentiality procedures and contractual provisions to
protect our proprietary technology and our name. We also enter into
confidentiality agreements with our employees, consultants and
other third parties and control access to software, documentation
and other proprietary information.
The
Company has been awarded nine U.S. patents, eight U.S. registered
trademarks and has 37 U.S. copyrights relating to its software
technology and solutions. The Company’s patent portfolio has
been transferred to an unrelated third party, although the Company
retains the right to use the licensed patents in connection with
its business. However, Company policy is to continue to seek patent
protection for all developments, inventions and improvements that
are patentable and have potential value to the Company and to
protect its trade secrets and other confidential and proprietary
information. The Company intends to vigorously defend
its intellectual property rights to the extent its resources
permit.
The
Company is not aware of any patent infringement claims against it;
however, there are no assurances that litigation to enforce patents
issued to the Company to protect proprietary information, or to
defend against the Company’s alleged infringement of the
rights of others will not occur. Should any such
litigation occur, the Company may incur significant litigation
costs, Company resources may be diverted from other planned
activities, and while the outcome of any litigation is inherently
uncertain, any litigation result may cause a materially adverse
effect on the Company’s operations and financial condition.
Any intellectual property claims, with or without merit, could be
time-consuming and expensive to resolve, could divert management
attention from executing our business plan and could require us to
alter our technology, change our business methods and/or pay
monetary damages or enter into licensing
agreements.
Employees
As of
June 30, 2017, the Company employed a total of 77
employees. Of these employees, 11 are located
overseas. The Company plans to continue expanding its
offshore workforce to augment its analytics services offerings,
expand its professional services and to provide additional
programming resources. The employees are not represented
by any labor union.
Reports to Security Holders
The
Company is subject to the informational requirements of the
Securities Exchange Act of 1934. Accordingly, it files
annual, quarterly and other reports and information with the
Securities and Exchange Commission. You may read and
copy these reports and other information at the Securities and
Exchange Commission's public reference rooms in Washington, D.C.
and Chicago, Illinois. The Company’s filings are
also available to the public from commercial document retrieval
services and the website maintained by the Securities and Exchange
Commission at
http://www.sec.gov
.
Government Regulation and Approval
Like
all businesses, the Company is subject to numerous federal, state
and local laws and regulations, including regulations relating to
patent, copyright, and trademark law matters.
Cost of Compliance with Environmental Laws
The
Company currently has no costs associated with compliance with
environmental regulations, and does not anticipate any future costs
associated with environmental compliance; however, there can be no
assurance that it will not incur such costs in the
future.
An investment in our common stock is subject to many risks. You
should carefully consider the risks described below, together with
all of the other information included in this Annual Report on Form
10-K, including the financial statements and the related notes,
before you decide whether to invest in our common stock. Our
business, operating results and financial condition could be harmed
by any of the following risks. The trading price of our
common stock could decline due to any of these risks, and you could
lose all or part of your investment.
Risks Related to the Company
The Company has incurred losses in the past and there can be no
assurance that the Company will operate profitably in the
future.
The
Company’s marketing strategy emphasizes sales of
subscription-based services, instead of annual licenses, and
contracting with suppliers (
“Spokes
”) to connect to
our clients (
“Hubs
”). This
strategy has resulted in the development of a foundation of hubs to
which suppliers can be “connected”, thereby
accelerating future growth. If, however, this marketing strategy
fails, revenue and operations will be negatively
affected.
The
Company had net income of $3,777,532 for the year ended June 30,
2017, compared to a net income of $666,503 for the year ended June
30, 2016. Although the Company generated net income in the
year ended June 30, 2017, there can be no assurance that the
Company will achieve profitability in future periods. If the
Company does not operate profitably in the future, the
Company’s current cash resources will be used to fund the
Company’s operating losses. Continued losses would have
an adverse effect on the long-term value of the Company’s
common stock and any investment in the Company. The
Company cannot give any assurance that the Company will continue to
generate revenue or have sustainable profits.
Although the Company’s cash resources are currently
sufficient, the Company’s long-term liquidity and capital
requirements may be difficult to predict, which may adversely
affect the Company’s long-term cash position.
Historically, the
Company has been successful in raising capital when necessary,
including private placements, a registered direct offering, and
stock issuances from its officers and directors, including its
Chief Executive Officer and majority stockholder, in order to pay
its indebtedness and fund its operations, in addition to cash flow
from operations.
If the
Company is required to seek additional financing in the future in
order to fund its operations, retire its indebtedness and otherwise
carry out its business plan, there can be no assurance that such
financing will be available on acceptable terms, or at all, and
there can be no assurance that any such arrangement, if required or
otherwise sought, would be available on terms deemed to be
commercially acceptable and in the Company’s best
interests.
Quarterly and annual operating results may fluctuate, which makes
it difficult to predict future performance.
Management expects
a significant portion of the Company’s revenue stream to come
from the sale of subscriptions, and to a lesser extent, license
sales, maintenance and services charged to new
customers. These amounts will fluctuate because
predicting future sales is difficult and involves
speculation. In addition, the Company may potentially
experience significant fluctuations in future operating results
caused by a variety of factors, many of which are outside of
its control, including:
●
our
ability to retain and increase sales to existing customers, attract
new customers and satisfy our customers' requirements;
●
the
renewal rates for our service;
●
the
amount and timing of operating costs and capital expenditures
related to the operations and expansion of our
business;
●
changes in our
pricing policies whether initiated by us or as a result of
competition;
●
the
cost, timing and management effort for the introduction of new
features to our service;
●
the
rate of expansion and productivity of our sales force;
●
new
product and service introductions by our competitors;
●
variations in the
revenue mix of editions or versions of our service;
●
technical
difficulties or interruptions in our service;
●
general economic
conditions that may adversely affect either our customers' ability
or willingness to purchase additional subscriptions or upgrade
their service, or delay a prospective customers' purchasing
decision, or reduce the value of new subscription contracts or
affect renewal rates;
●
timing
of additional investments in our enterprise cloud computing
application and platform services and in our consulting
service;
●
regulatory
compliance costs;
●
the
timing of customer payments and payment defaults by
customers;
●
extraordinary
expenses such as litigation or other dispute-related settlement
payments;
●
the
impact of new accounting pronouncements; and
●
the
timing of stock awards to employees and the related financial
statement impact.
Future
operating results may fluctuate because of the foregoing factors,
making it difficult to predict operating
results. Period-to-period comparisons of operating
results are not necessarily meaningful and should not be relied
upon as an indicator of future performance. In addition,
a relatively large portion of the Company’s expenses will be
fixed in the short-term, particularly with respect to facilities
and personnel. Therefore, future operating results will
be particularly sensitive to fluctuations in revenue because of
these and other short-term fixed costs.
The Company will need to effectively manage its growth in order to
achieve and sustain profitability. The Company’s
failure to manage growth effectively could reduce its sales growth
and result in continued net losses.
To
achieve continual and consistent profitable operations on a fiscal
year on-going basis, the Company must have significant growth in
its revenue from its products and services, specifically
subscription-based services. If the Company is able to
achieve significant growth in future subscription sales, and
expands the scope of its operations, the Company’s
management, financial condition, operational capabilities, and
procedures and controls could be strained. The Company
cannot be certain that its existing or any additional capabilities,
procedures, systems, or controls will be adequate to support the
Company’s operations. The Company may not be able
to design, implement or improve its capabilities, procedures,
systems or controls in a timely and cost-effective
manner. Failure to implement, improve and expand the
Company’s capabilities, procedures, systems or controls in an
efficient and timely manner could reduce the Company’s sales
growth and result in a reduction of profitability or increase of
net losses.
The Company’s officers and directors have significant control
over it, which may lead to conflicts with other stockholders over
corporate governance.
The
Company’s officers and directors, including our Chief
Executive Officer, Randall K. Fields, control approximately
33% of the Company’s common stock. Mr.
Fields, individually, controls 26% of the
Company’s common stock. Consequently, Mr. Fields
individually, and the Company’s officers and directors, as
stockholders acting together, are able to significantly influence
all matters requiring approval by the Company’s stockholders,
including the election of directors and significant corporate
transactions, such as mergers or other business combination
transactions.
The Company’s corporate charter contains authorized, unissued
“blank check” preferred stock issuable without
stockholder approval with the effect of diluting then current
stockholder interests.
The
Company’s certificate of incorporation currently authorizes
the issuance of up to 30,000,000 shares of ‘blank
check’ preferred stock with designations, rights, and
preferences as may be determined from time to time by the
Company’s Board of Directors, of which 700,000 shares are
currently designated as Series B Convertible Preferred Stock
(“
Series B
Preferred
”) and 550,000 shares are designated as
Series B-1 Preferred Stock (“
Series B-1
Preferred
”). As of June 30, 2017, a total
of 625,375 shares of Series B Preferred and 285,859 shares of
Series B-1 Preferred were issued and outstanding. The
Company’s Board of Directors is empowered, without
stockholder approval, to issue one or more additional series of
preferred stock with dividend, liquidation, conversion, voting, or
other rights that could dilute the interest of, or impair the
voting power of, the Company’s common
stockholders. The issuance of an additional series of
preferred stock could be used as a method of discouraging, delaying
or preventing a change in control.
Because the Company has never paid dividends on its common stock,
investors should exercise caution before making an investment in
the Company.
The
Company has never paid dividends on its common stock and does not
anticipate the declaration of any dividends pertaining to its
common stock in the foreseeable future. The Company intends to
retain earnings, if any, to finance the development and expansion
of the Company’s business. The Company’s
Board of Directors will determine future dividend policy at their
sole discretion and future dividends will be contingent upon future
earnings, if any, obligations of the stock issued, the
Company’s financial condition, capital requirements, general
business conditions and other factors. Future dividends
may also be affected by covenants contained in loan or other
financing documents, which may be executed by the Company in the
future. Therefore, there can be no assurance that
dividends will ever be paid on its common stock.
The Company’s business is dependent upon the continued
services of the Company’s founder and Chief Executive
Officer, Randall K. Fields. Should the Company lose the
services of Mr. Fields, the Company’s operations will be
negatively impacted.
The
Company’s business is dependent upon the expertise of its
founder and Chief Executive Officer, Randall K. Fields. Mr. Fields
is essential to the Company’s operations. Accordingly, an
investor must rely on Mr. Fields’ management decisions that
will continue to control the Company’s business affairs. The
Company currently maintains key man insurance on Mr. Fields’
life in the amount of $5,000,000; however, that coverage would be
inadequate to compensate for the loss of his services. The loss of
the services of Mr. Fields would have a materially adverse effect
upon the Company’s business.
If the Company is unable to attract and retain qualified personnel,
the Company may be unable to develop, retain or expand the staff
necessary to support its operational business needs.
The
Company’s current and future success depends on its ability
to identify, attract, hire, train, retain and motivate various
employees, including skilled software development, technical,
managerial, sales, marketing and customer service personnel.
Competition for such employees is intense and the Company may be
unable to attract or retain such professionals. If the Company
fails to attract and retain these professionals, the
Company’s revenue and expansion plans may be negatively
impacted.
The Company’s officers and directors have limited liability
and indemnification rights under the Company’s organizational
documents, which may impact its results.
The
Company’s officers and directors are required to exercise
good faith and high integrity in the management of the
Company’s affairs. The Company’s certificate
of incorporation and bylaws, however, provide, that the officers
and directors shall have no liability to the stockholders for
losses sustained or liabilities incurred which arise from any
transaction in their respective managerial capacities unless they
violated their duty of loyalty, did not act in good faith, engaged
in intentional misconduct or knowingly violated the law, approved
an improper dividend or stock repurchase or derived an improper
benefit from the transaction. As a result, an investor may have a
more limited right to action than he would have had if such a
provision were not present. The Company’s certificate of
incorporation and bylaws also require it to indemnify the
Company’s officers and directors against any losses or
liabilities they may incur as a result of the manner in which they
operate the Company’s business or conduct the Company’s
internal affairs, provided that the officers and directors
reasonably believe such actions to be in, or not opposed to, the
Company’s best interests, and their conduct does not
constitute gross negligence, misconduct or breach of fiduciary
obligations.
Risks Related to the ReposiTrak
The Company faces risks associated with new product
introductions.
It may
be difficult for the company to assess risks associated with
potential new product offerings:
●
It may
be difficult for the Company to predict the amount of service and
technological resources that will be needed by customers of new
offerings, and if the Company underestimates the necessary
resources, the quality of its service will be negatively impacted
thereby undermining the value of the product to the
customer;
●
technological
issues between the Company and customers may be experienced in
capturing data necessary for new product offerings, and these
technological issues may result in unforeseen conflicts or
technological setbacks when implementing these products which could
result in material delays and even result in a termination of the
engagement;
●
a
customer’s experience with new offerings, if negative, may
prevent the Company from having an opportunity to sell additional
products and services to that customer;
●
if
customers do not use the Company’s products as recommends
and/or fails to implement any needed corrective action(s), it is
unlikely that customers will experience the business benefits from
these products and may therefore be hesitant to continue the
engagement as well as acquire any other products from the Company;
and
●
delays
in proceeding with the implementation of new products for a new
customer will negatively affect the Company’s cash flow and
its ability to predict cash flow.
If our products do not perform as expected, whether as a result of
operator error or otherwise, it would impair our operating results
and reputation.
Our
success depends on the food safety market’s confidence that
we can provide reliable, high-quality reporting for our customers.
We believe that our customers are likely to be particularly
sensitive to product defects and operator errors, including if our
systems fail to accurately report issues that could reduce the
liability of our clients in the event of a product recall. In
addition, our reputation and the reputation of our products can be
adversely affected if our systems fail to perform as
expected.
However, if our
customers or potential customers fail to implement and use our
systems as suggested by us, they may not be in a position to deal
with a recall as effectively as they could have. As a result, the
failure or perceived failure of our products to perform as
expected, could have a material adverse effect on our revenue,
results of operations and business.
If a customer is sued because of a recalled product we could be
joined in that suit, the defense of which would impair our
operating results.
We
believe our products would be helpful in the event of a recall.
However, their ultimate efficacy is dependent on how the customer
uses our products which is in many ways out of our control.
Similarly, a customer which is a defendant in a product liability
case could claim that had our services performed as represented the
extent of potential liability would have been minimized and
therefore the Company should have some contributory liability in
the case. Defending such a claim could have a material
adverse effect on our revenue, results of operations and
business.
The deployment of the Company’s services, or consultation
provided by Company personnel, could result in litigation naming
the Company as a party, which litigation could result in a material
and adverse effect on the Company, and its results from
operations.
Certain of the
Company’s services are marketed to potential customers based,
in part, on our service’s ability to reduce a company’s
potential regulatory, legal, and criminal risk from its supply
chain partners. In the event litigation is commenced against
a customer based on issues caused by a constituent in the supply
chain, or consultation provided by Company personnel, the Company
could be joined or named in such litigation. As a result, the
Company could face substantial defense costs. In addition,
any adverse determination resulting in such litigation could have a
material and adverse effect on the Company, and its results from
operations.
Business Operations Risks
If the Company’s marketing strategy fails, its revenue and
operations will be negatively affected.
The
Company plans to concentrate its future sales efforts towards
marketing the Company’s applications and services, and
specifically to contract with suppliers, our Spokes, to connect to
our existing Hubs previously signed up by the Company. These
applications and services are designed to be highly flexible so
that they can work in multiple retail and supplier environments
such as grocery stores, convenience stores, specialty retail and
route-based delivery environments. There is no assurance
that the public will accept the Company’s applications and
services in proportion to the Company’s increased marketing
of this product line, or that the Company will be able to
successfully leverage its hubs to increase revenue by connecting
suppliers. The Company may face significant competition
that may negatively affect demand for its applications and
services, including the public’s preference for the
Company’s competitors’ new product releases or updates
over the Company’s releases or updates. If the
Company’s applications and services marketing strategies
fail, the Company will need to refocus its marketing strategy
toward other product offerings, which could lead to increased
development and marketing costs, delayed revenue streams, and
otherwise negatively affect the Company’s
operations.
The Company faces threats from
competing and emerging technologies that may affect its
profitability
.
Markets for the
Company’s type of software products and that of its
competitors are characterized by:
●
development of new
software, software solutions or enhancements that are subject to
constant change;
●
rapidly evolving
technological change; and
●
unanticipated
changes in customer needs.
Because these
markets are subject to such rapid change, the life cycle of the
Company’s products is difficult to predict. As a
result, the Company is subject to the following risks:
●
whether or how the
Company will respond to technological changes in a timely or
cost-effective manner;
●
whether the
products or technologies developed by the Company’s
competitors will render the Company’s products and services
obsolete or shorten the life cycle of the Company’s products
and services; and
●
whether the
Company’s products and services will achieve market
acceptance.
Interruptions or delays in service from our third-party data center
hosting facility could impair the delivery of our service and harm
our business.
We
currently serve our customers from a third-party data center
hosting facility located in the United States. Any damage to, or
failure of, our systems generally could result in interruptions in
our service. As we continue to add capacity, we may move or
transfer our data and our customers' data. Despite precautions
taken during this process, any unsuccessful data transfers may
impair the delivery of our service. Further, any damage to, or
failure of, our systems generally could result in interruptions in
our service. Interruptions in our service may reduce our revenue,
cause us to issue credits or pay penalties, cause customers to
terminate their subscriptions and adversely affect our renewal
rates and our ability to attract new customers. Our business will
also be harmed if our customers and potential customers believe our
service is unreliable.
As
part of our current disaster recovery arrangements, our production
environment and all of our customers' data is currently replicated
in near real-time in a separate facility physically located in a
different geographic region of the United States. Companies and
products added through acquisition may be temporarily served
through an alternate facility. We do not control the operation of
these facilities, and they are vulnerable to damage or interruption
from earthquakes, floods, fires, power loss, telecommunications
failures and similar events. They may also be subject to break-ins,
sabotage, intentional acts of vandalism and similar misconduct.
Despite precautions taken at these facilities, the occurrence of a
natural disaster or an act of terrorism, a decision to close the
facilities without adequate notice or other unanticipated problems
at these facilities could result in lengthy interruptions in our
service. Even with the disaster recovery arrangements, our service
could be interrupted.
If our security measures are breached and unauthorized access is
obtained to a customer's data, our data or our information
technology systems, our service may be perceived as not being
secure, customers may curtail or stop using our service and we may
incur significant legal and financial exposure and
liabilities.
Our
service involves the storage and transmission of customers'
proprietary information, and security breaches could expose us to a
risk of loss of this information, litigation and possible
liability. These security measures may be breached as a result of
third-party action, including intentional misconduct by computer
hackers, employee error, malfeasance or otherwise during transfer
of data to additional data centers or at any time, and result in
someone obtaining unauthorized access to our customers' data or our
data, including our intellectual property and other confidential
business information, or our information technology systems.
Additionally, third parties may attempt to fraudulently induce
employees or customers into disclosing sensitive information such
as user names, passwords or other information in order to gain
access to our customers' data or our data, including our
intellectual property and other confidential business information,
or our information technology systems. Because the techniques used
to obtain unauthorized access, or to sabotage systems, change
frequently and generally are not recognized until launched against
a target, we may be unable to anticipate these techniques or to
implement adequate preventative measures. Any security breach could
result in a loss of confidence in the security of our service,
damage our reputation, disrupt our business, lead to legal
liability and negatively impact our future sales.
We cannot accurately predict subscription renewal or upgrade rates
and the impact these rates may have on our future revenue and
operating results.
Our
customers have no obligation to renew their subscriptions for our
service after the expiration of their initial subscription period.
Our renewal rates may decline or fluctuate as a result of a number
of factors, including customer dissatisfaction with our service,
customers' ability to continue their operations and spending
levels, and deteriorating general economic conditions. If our
customers do not renew their subscriptions for our service or
reduce the level of service at the time of renewal, our revenue
will decline and our business will suffer.
Our
future success also depends in part on our ability to sell
additional features and services, more subscriptions or enhanced
editions of our service to our current customers. This may also
require increasingly sophisticated and costly sales efforts that
are targeted at senior management. Similarly, the rate at which our
customers purchase new or enhanced services depends on a number of
factors, including general economic conditions. If our efforts to
upsell to our customers are not successful, our business may
suffer.
Weakened global economic conditions may adversely affect our
industry, business and results of operations.
Our
overall performance depends in part on worldwide economic
conditions. The United States and other key international economies
have experienced in the past a downturn in which economic activity
was impacted by falling demand for a variety of goods and services,
restricted credit, poor liquidity, reduced corporate profitability,
volatility in credit, equity and foreign exchange markets,
bankruptcies and overall uncertainty with respect to the economy.
These conditions affect the rate of information technology spending
and could adversely affect our customers' ability or willingness to
purchase our enterprise cloud computing services, delay prospective
customers' purchasing decisions, reduce the value or duration of
their subscription contracts or affect renewal rates, all of which
could adversely affect our operating results.
If the Company is unable to adapt to constantly changing markets
and to continue to develop new products and technologies to meet
the customers’ needs, the Company’s revenue and
profitability will be negatively affected.
The
Company’s future revenue is dependent upon the successful and
timely development and licensing of new and enhanced versions of
its products and potential product offerings suitable to the
customer’s needs. If the Company fails to
successfully upgrade existing products and develop new products,
and those new products do not achieve market acceptance, the
Company’s revenue will be negatively impacted.
The Company faces risks associated with proprietary protection of
the Company’s software.
The
Company’s success depends on the Company’s ability to
develop and protect existing and new proprietary technology and
intellectual property rights. The Company seeks to
protect its software, documentation and other written materials
primarily through a combination of patents, trademarks, and
copyright laws, trade secret laws, confidentiality procedures and
contractual provisions. While the Company has attempted
to safeguard and maintain the Company’s proprietary rights,
there are no assurances that the Company will be successful in
doing so. The Company’s competitors may
independently develop or patent technologies that are substantially
equivalent or superior to the Company’s.
Despite the
Company’s efforts to protect its proprietary rights,
unauthorized parties may attempt to copy aspects of the
Company’s products or obtain and use information that the
Company regards as proprietary. In some types of
situations, the Company may rely in part on ‘shrink
wrap’ or ‘point and click’ licenses that are not
signed by the end user and, therefore, may be unenforceable under
the laws of certain jurisdictions. Policing unauthorized
use of the Company’s products is difficult. While
the Company is unable to determine the extent to which piracy of
the Company’s software exists, software piracy can be
expected to be a persistent problem, particularly in foreign
countries where the laws may not protect proprietary rights as
fully as the United States. The Company can offer no
assurance that the Company’s means of protecting its
proprietary rights will be adequate or that the Company’s
competitors will not reverse engineer or independently develop
similar technology.
The Company may discover software errors in its products that may
result in a loss of revenue, injury to the Company’s
reputation or subject us to substantial liability.
Non-conformities or
bugs (“
errors
”) may be found from time
to time in the Company’s existing, new or enhanced products
after commencement of commercial shipments, resulting in loss of
revenue or injury to the Company’s reputation. In
the past, the Company has discovered errors in its products and as
a result, has experienced delays in the shipment of
products. Errors in the Company’s products may be
caused by defects in third-party software incorporated into the
Company’s products. If so, the Company may not be
able to fix these defects without the cooperation of these software
providers. Since these defects may not be as significant
to the software provider as they are to us, the Company may not
receive the rapid cooperation that may be required. The
Company may not have the contractual right to access the source
code of third-party software, and even if the Company does have
access to the code, the Company may not be able to fix the
defect. In addition, our customers may use our service in
unanticipated ways that may cause a disruption in service for other
customers attempting to access their data. Since the
Company’s customers use the Company’s products for
critical business applications, any errors, defects or other
performance problems could hurt the Company’s reputation and
may result in damage to the Company’s customers’
business. If that occurs, customers could elect not to
renew, delay or withhold payment to us, we could lose future sales
or customers may make warranty or other claims against us, which
could result in an increase in our provision for doubtful accounts,
an increase in collection cycles for accounts receivable or the
expense and risk of litigation. These potential scenarios,
successful or otherwise, would likely be time consuming and
costly.
Some competitors are larger and have greater financial and
operational resources that may give them an advantage in the
market.
Many
of the Company’s competitors are larger and have greater
financial and operational resources. This may allow them
to offer better pricing terms to customers in the industry, which
could result in a loss of potential or current customers or could
force us to lower prices. Any of these actions could
have a significant effect on revenue. In addition, the
competitors may have the ability to devote more financial and
operational resources to the development of new technologies that
provide improved operating functionality and features to their
product and service offerings. If successful, their
development efforts could render the Company’s product and
service offerings less desirable to customers, again resulting in
the loss of customers or a reduction in the price the Company can
demand for the Company’s offerings.
Risks Relating to the Company’s Common Stock
The limited public market for the Company’s securities may
adversely affect an investor’s ability to liquidate an
investment in the Company.
Although the
Company’s common stock is currently quoted on the NASDAQ
Capital Market, there is limited trading activity. The
Company can give no assurance that an active market will develop,
or if developed, that it will be sustained. If an
investor acquires shares of the Company’s common stock, the
investor may not be able to liquidate the Company’s shares
should there be a need or desire to do so.
Future issuances of the Company’s shares may lead to future
dilution in the value of the Company’s common stock, will
lead to a reduction in shareholder voting power and may prevent a
change in Company control.
The
shares may be substantially diluted due to the
following:
●
issuance of common
stock in connection with funding agreements with third parties and
future issuances of common and preferred stock by the Board of
Directors; and
●
the Board of
Directors has the power to issue additional shares of common stock
and preferred stock and the right to determine the voting,
dividend, conversion, liquidation, preferences and other conditions
of the shares without shareholder approval.
Stock
issuances may result in reduction of the book value or market price
of outstanding shares of common stock. If the Company
issues any additional shares of common or preferred stock,
proportionate ownership of common stock and voting power will be
reduced. Further, any new issuance of common or
preferred stock may prevent a change in control or
management.
Our
principal place of business operations is located at 299 South Main
Street, Suite 2225, Salt Lake City, UT 84111. We
lease approximately 6,700 square feet at this corporate office
location, consisting primarily of office space, conference rooms
and storage areas. Our telephone number is (435)
645-2000. Our website address is
http://www.parkcitygroup.com
.
We
are, from time to time, involved in various legal proceedings
incidental to the conduct of our business. Historically, the
outcome of all such legal proceedings has not, in the aggregate,
had a material adverse effect on our business, financial condition,
results of operations or liquidity. There are no pending
or threatened material legal proceedings at this time.
Not
applicable.
|
MARKET FOR COMMON EQUITY, RELATED STOCKHOLDER MATTERS AND ISSUER
PURCHASES OF EQUITY SECURITIES
|
Share Price History
Our
common stock is traded on the NASDAQ Capital Market under the
trading symbol “PCYG.” The following table sets forth
the high and low sales prices of our common stock for the
periods indicated.
|
|
Quarterly Common
Stock Price Ranges
|
|||
|
|
2017
|
2016
|
||
|
Fiscal Quarter
Ended
|
High
|
Low
|
High
|
Low
|
|
September
30
|
$
12.49
|
$
8.87
|
$
13.99
|
$
10.01
|
|
December
31
|
$
15.35
|
$
11.60
|
$
12.27
|
$
9.87
|
|
March
31
|
$
17.00
|
$
11.55
|
$
11.82
|
$
5.98
|
|
June
30
|
$
13.45
|
$
11.70
|
$
10.00
|
$
8.30
|
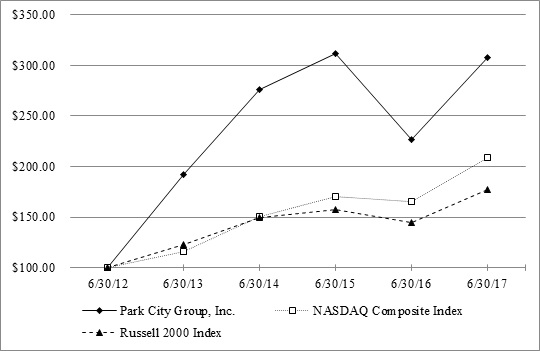
Stock Performance Graph
The
following graph compares the cumulative total shareholder return on
our common stock over the five-year period ending June 30, 2017,
with the cumulative total returns during the same period on the
NASDAQ Composite Index and the Russell 2000 Index. The graph
assumes that $100 was invested on June 30, 2012 in our common stock
and in the shares represented by each of the other indices, and
that all dividends were reinvested.
The
stock price performance included in this graph is not necessarily
indicative of future stock price performance.
|
Value of Investment ($)
|
||||||
|
|
06/30/12
|
06/30/13
|
06/30/14
|
06/30/15
|
06/30/16
|
06/30/17
|
|
Park City Group,
Inc.
|
$
100.00
|
$
191.90
|
$
275.70
|
$
311.14
|
$
227.09
|
$
307.59
|
|
NASDAQ
Composite
|
$
100.00
|
$
115.95
|
$
150.19
|
$
169.91
|
$
164.99
|
$
209.21
|
|
Russell 2000
Index
|
$
100.00
|
$
122.42
|
$
149.40
|
$
157.04
|
$
144.26
|
$
177.25
|
The stock performance graph above shall not be deemed incorporated
by reference into any filing by us under the Securities Act of
1933, as amended ("Securities Act"), or the Securities Exchange Act
of 1934, as amended ("Exchange Act"), except to the extent that we
specifically incorporate such information by reference, and shall
not otherwise be deemed filed under such Acts.
Dividend Policy
To
date, the Company has not paid dividends on its common stock. Our
present policy is to retain future earnings (if any) for use in our
operations and the expansion of our business.
Outstanding shares
of Series B Preferred and Series B-1 Preferred each accrue
dividends
at
the rate per share of 7% per annum if paid by the Company in cash,
and 9% per annum if paid by the Company in additional shares of
Series B-1 Preferred. Dividends on the Series B Preferred and
Series B-1 Preferred are payable quarterly.
Holders of Record
At
June 30, 2017 there were 649 holders of record of our common stock,
and 19,423,821 shares were issued and outstanding, three holders of
Series B Preferred and 625,375 shares issued and outstanding, and
four holders of Series B-1 Preferred and 285,859 shares issued and
outstanding. The number of holders of record and shares
of common stock issued and outstanding was calculated by reference
to the books and records of the Company’s transfer
agent.
Issuance of Securities
We
issued shares of our common stock in unregistered transactions
during fiscal year 2017. All of the shares of common stock issued
in non-registered transactions were issued in reliance on Section
3(a)(9) and/or Section 4(2) of the Securities Act, and were
reported in our Quarterly Reports on Form 10-Q and in our Current
Reports on Form 8-K filed with the Securities and Exchange
Commission during the fiscal year ended June 30, 2017. 20,000
shares of preferred stock were issued subsequent to June 30,
2017.
The
following data has been derived from our audited financial
statements, including the consolidated balance sheets at June 30,
2017 and 2016 and the related consolidated statements of operations
for the three years ended June 30, 2017 and related notes appearing
elsewhere in this report. The statement of operations data for
the years ended June 30, 2014 and 2013 and the balance sheet data
as of June 30, 2015, 2014 and 2013 are derived from our audited
consolidated financial statements that are not included in this
report. The following data should be read in conjunction with
“
Management’s
Discussion and Analysis of Financial Condition and Results of
Operations
” and our financial statements and related
notes included elsewhere in this report.
|
|
Fiscal Year Ended June 30,
|
||||
|
Consolidated Statement of Operations Data
|
2017
|
2016
|
2015
|
2014
|
2013
|
|
Revenue
|
$
18,939,263
|
$
14,010,693
|
$
13,648,715
|
$
11,928,416
|
$
11,318,574
|
|
Operating expense
(1)(2)
|
15,038,134
|
13,323,252
|
17,741,109
|
14,521,141
|
10,920,375
|
|
Income (loss) from
Operations
|
3,901,129
|
687,441
|
(4,092,394
)
|
(2,592,725
)
|
398,199
|
|
Net income
(loss)
|
3,777,532
|
666,503
|
(3,849,773
)
|
(2,490,145
)
|
257,487
|
|
|
As of June 30,
|
||||
|
Consolidated Balance Sheet Data
|
2017
|
2016
|
2015
|
2014
|
2013
|
|
Cash and Cash
Equivalents
|
$
14,054,006
|
$
11,443,388
|
$
11,325,572
|
$
3,352,559
|
$
3,616,585
|
|
Working
Capital
|
10,536,804
|
7,346,632
|
5,032,139
|
654,042
|
1,124,476
|
|
Total
Assets
|
45,912,476
|
38,589,892
|
36,406,784
|
16,937,632
|
15,932,898
|
|
Total
Liabilities
|
10,203,625
|
8,087,333
|
8,822,161
|
6,318,551
|
5,691,526
|
|
Deferred
Revenue
|
2,350,846
|
2,717,094
|
2,331,920
|
1,840,811
|
1,777,326
|
|
Total Debt
(current and long-term)
|
5,165,569
|
3,230,452
|
3,076,493
|
1,849,148
|
2,062,063
|
|
Stockholders'
Equity (deficit)
|
35,708,851
|
30,502,559
|
27,584,623
|
10,619,081
|
10,241,372
|
|
|
Fiscal Year Ended June 30,
|
||||
|
Operating Data
|
2017
|
2016
|
2015
|
2014
|
2013
|
|
Adjusted EBITDA
(3)
|
$
5,892,089
|
$
2,273,339
|
$
1,118,583
|
$
192,719
|
$
2,287,868
|
|
Non-GAAP income per
diluted common share
(4)
|
$
0.22
|
$
0.06
|
$
0.01
|
$
(0.05
)
|
$
(0.05
)
|
(1)
Includes
stock-based compensation expense as follows:
|
|
Fiscal Year Ended June 30,
|
||||
|
|
2017
|
2016
|
2015
|
2014
|
2013
|
|
Stock-based
compensation expense
|
$
1,266,805
|
$
1,010,312
|
$
2,760,329
|
$
1,719,375
|
$
843,645
|
(2)
For
2015, there was a one-time impairment of intangibles charge of
$1,495,703, related to the customer list acquired in connection
with the Prescient acquisition.
(3)
Adjusted EBITDA
consists of net income plus depreciation and amortization, interest
expense, interest income, stock-based compensation expense and
other adjustments as necessary for a fair presentation. We use
Adjusted EBITDA as a measure of operating performance because it
assists us in comparing performance on a consistent basis, as it
removes the impact of our capital structure from our operating
results. We believe Adjusted EBITDA is useful to an investor in
evaluating our operating performance because it is widely used to
measure a company’s operating performance without regard to
items such as depreciation and amortization, which can vary
depending upon accounting methods and the book value of assets, and
to present a meaningful measure of corporate performance exclusive
of our capital structure. The following table provides a
reconciliation of net income to Adjusted EBITDA:
|
|
Fiscal Year Ended June 30,
|
||||
|
|
2017
|
2016
|
2015
|
2014
|
2013
|
|
Net income
(loss)
|
$
3,777,532
|
$
666,503
|
$
(3,849,773
)
|
$
(2,490,145
)
|
$
257,487
|
|
Depreciation and
amortization
|
486,024
|
507,446
|
768,165
|
879,329
|
901,407
|
|
Interest (income)
loss, net
|
26,408
|
(5,190
)
|
(242,621
)
|
(102,580
)
|
140,712
|
|
Other
|
335,320
|
94,268
|
1,682,483
|
186,740
|
144,617
|
|
EBITDA
|
4,625,284
|
1,263,027
|
(1,641,746
)
|
(1,526,656
)
|
1,444,223
|
|
Stock-based
compensation expense
|
1,266,805
|
1,010,312
|
2,760,329
|
1,719,375
|
843,645
|
|
Adjusted
EBITDA
|
$
5,892,089
|
$
2,273,339
|
$
1,118,583
|
$
192,719
|
$
2,287,868
|
(4)
Non-GAAP income
per share consists of net income plus stock-based compensation
expense and amortization expense related to intangible assets
divided by the weighted average number of shares of common stock
outstanding during each period. We believe non-GAAP income per
share is useful to an investor because it is widely used to measure
a company’s operating performance. The following table
provides a reconciliation of net income to non-GAAP income per
share:
|
|
Fiscal Year Ended
June 30, 2017
|
||||
|
|
2017
|
2016
|
2015
|
2014
|
2013
|
|
Net income
(loss)
|
$
3,777,532
|
$
666,503
|
$
(3,849,773
)
|
$
(2,490,145
)
|
$
257,487
|
|
Stock-based
compensation expense
|
1,266,805
|
1,010,312
|
2,760,329
|
1,719,375
|
843,645
|
|
Acquisition
related amortization
|
131,400
|
131,400
|
1,918,019
|
462,557
|
502,798
|
|
Other
|
(10,380
)
|
26,128
|
-
|
-
|
-
|
|
Preferred
Dividends
|
(790,811
)
|
(729,288
)
|
(568,821
)
|
(617,891
)
|
(911,580
)
|
|
Non-GAAP net
income to common shareholders
|
$
4,374,546
|
$
1,105,055
|
$
259,754
|
$
(926,104
)
|
$
692,350
|
|
Non-GAAP income
per share
|
|
|
|
|
|
|
Basic
|
19,353,000
|
19,151,000
|
17,375,000
|
16,710,000
|
13,246,000
|
|
Diluted
|
20,264,000
|
19,332,000
|
18,253,000
|
16,710,000
|
13,253,000
|
|
Shares used to
compute non-GAAP income per share
|
|
|
|
|
|
|
Basic
|
$
0.23
|
$
0.06
|
$
0.01
|
$
(0.06
)
|
$
0.05
|
|
Diluted
|
$
0.22
|
$
0.06
|
$
0.01
|
$
(0.06
)
|
$
0.05
|
The following Management’s Discussion and Analysis is
intended to assist the reader in understanding our results of
operations and financial condition. Management’s
Discussion and Analysis is provided as a supplement to, and should
be read in conjunction with, our audited consolidated financial
statements beginning on page F-1 of this Annual Report. This Form
10-K includes certain statements that may be deemed to be
“forward-looking statements” within the meaning of
Section 27A of the Securities Act. All statements, other
than statements of historical fact, included in this Form 10-K that
address activities, events or developments that we expect, project,
believe, or anticipate will or may occur in the future, including
matters having to do with expected and future revenue, our ability
to fund our operations and repay debt, business strategies,
expansion and growth of operations and other such matters, are
forward-looking statements. These statements are based
on certain assumptions and analyses made by our management in light
of its experience and its perception of historical trends, current
conditions, expected future developments, and other factors it
believes are appropriate in the circumstances. These
statements are subject to a number of assumptions, risks and
uncertainties, including general economic and business conditions,
the business opportunities (or lack thereof) that may be presented
to and pursued by us, our performance on our current contracts and
our success in obtaining new contracts, our ability to attract and
retain qualified employees, and other factors, many of which are
beyond our control. You are cautioned that these
forward-looking statements are not guarantees of future performance
and those actual results or developments may differ materially from
those projected in such statements.
Overview
Park
City Group, Inc. (the “
Company
”) is a
Software-as-a-Service (“
SaaS
”) provider. The
Company’s technology helps companies to synchronize their
systems with those of their trading partners to make more informed
business decisions. We provide companies with greater flexibility
in sourcing products by enabling them to choose new suppliers and
integrate them into their supply chain faster and more cost
effectively, and we help them to more efficiently manage these
relationships, enhancing revenue while lowering working capital,
labor costs and waste. Our ReposiTrak food safety solutions also
help reduce a company’s potential regulatory, legal, and
criminal risk from its supply chain partners by providing a way for
them to ensure these suppliers are compliant with food safety
regulations, such as the Food Safety Modernization Act
(“
FSMA
”).
Fiscal Year
Our
fiscal year ends on June 30. References to fiscal 2017
refer to the fiscal year ended June 30, 2017.
Sources of Revenue
The
Company derives revenue from four sources: (i) subscription fees,
(ii) hosting, premium support and maintenance service fees beyond
the standard services offered, (iii) professional services
consisting of development services, consulting, training and
education, and (iv) license fees.
Subscription
revenue is driven primarily by the number of connections between
retailers and suppliers. Historically, subscription revenue was
largely based on some sort of volumetric metric, including the
number of stores and SKU’s, or the volume of economic
activity between a retailer and its suppliers. However, as our
ReposiTrak business has grown, and as it tends to encompass all of
a retailer’s suppliers, our subscription revenue is
increasingly based on a negotiated flat fee per supplier.
Subscription revenue contains arrangements with customers accessing
our applications, which includes the use of the application,
application and data hosting, subscription-based maintenance of the
application and standard support included with the
subscription.
Our
hosting services provide remote management and maintenance of our
software and customers’ data, which is physically located in
third party facilities. Customers access
‘hosted’ software and data through a secure internet
connection. Premium support services include technical
assistance for our software products and unspecified product
upgrades and enhancements on a when and if available basis beyond
what is offered with our basic subscription package.
Professional
services revenue is comprised of revenue from development,
consulting, education and training. Development services
include customizations and integrations for a client’s
specific business application. Consulting, education and
training include implementation and best practices
consulting. Our professional services fees are more
frequently billed on a fixed price/fixed scope, but may also be
billed on a time and materials basis. We have determined that the
professional services element of our software and subscription
arrangements is not essential to the functionality of the
software.
License
arrangements are a time-specific and perpetual license. Software
license maintenance agreements are typically annual contracts with
customers that are paid in advance or according to terms specified
in the contract. These agreements provide the customer with access
to new software enhancements, maintenance releases, patches,
updates and technical support personnel.
Other Metrics – Non-GAAP Financial Measures
To
supplement our financial statements, we also provide investors with
Adjusted EBITDA and non-GAAP income per share, both of which are
non-GAAP financial measures. We believe that these non-GAAP
measures provide useful information to management and investors
regarding certain financial and business trends relating to our
financial condition and results of operations. Our management uses
these non-GAAP measures to compare the Company’s performance
to that of prior periods for trend analyses and planning purposes.
These measures are also presented to our Board of
Directors.
These
non-GAAP measures should not be considered a substitute for, or
superior to, financial measures calculated in accordance with
generally accepted accounting principles in the United States of
America. These non-GAAP financial measures exclude significant
expenses and income that are required by GAAP to be recorded in the
company’s financial statements and are subject to inherent
limitations. Investors should review the reconciliations of
non-GAAP financial measures to the comparable GAAP financial
measures that are included in this “Management’s
Discussion and Analysis of Financial Condition and Results of
Operations.”
Critical Accounting Policies
This
Management’s Discussion and Analysis of Financial Condition
and Results of Operations discusses the Company’s financial
statements, which have been prepared in accordance with U.S.
generally accepted accounting principles.
We
commenced operations in the software development and professional
services business during 1990. The preparation of our financial
statements requires management to make estimates and assumptions
that affect reported amounts of assets and liabilities, the
disclosure of contingent assets and liabilities at the date of the
financial statements and the reported amount of revenue and
expenses during the reporting period. On an ongoing basis,
management evaluates its estimates and assumptions. Management
bases its estimates and judgments on historical experience of
operations and on various other factors that are believed to be
reasonable under the circumstances, the results of which form the
basis for making judgments about the carrying value of assets and
liabilities that are not readily apparent from other sources.
Actual results may differ from these estimates under different
assumptions or conditions.
Management
believes the following critical accounting policies, among others,
will affect its more significant judgments and estimates used in
the preparation of our consolidated financial
statements.
Income Taxes
In
determining the carrying value of the Company’s net deferred
income tax assets, the Company must assess the likelihood of
sufficient future taxable income in certain tax jurisdictions,
based on estimates and assumptions, to realize the benefit of these
assets. If these estimates and assumptions change in the future,
the Company may record a reduction in the valuation allowance,
resulting in an income tax benefit in the Company’s
statements of operations. Management evaluates whether or not to
realize the deferred income tax assets and assesses the valuation
allowance quarterly.
Goodwill and Other Long-Lived Asset Valuations
Goodwill is
assigned to specific reporting units and is reviewed for possible
impairment at least annually or more frequently upon the occurrence
of an event or when circumstances indicate that a reporting unit's
carrying amount is greater than its fair value. Management reviews
the long-lived tangible and intangible assets for impairment when
events or changes in circumstances indicate that the carrying value
of an asset may not be recoverable. Management evaluates, at each
balance sheet date, whether events and circumstances have occurred
which indicate possible impairment. The carrying value of a
long-lived asset is considered impaired when the anticipated
cumulative undiscounted cash flows of the related asset or group of
assets is less than the carrying value. In that event, a loss is
recognized based on the amount by which the carrying value exceeds
the estimated fair market value of the long-lived asset. Economic
useful lives of long-lived assets are assessed and adjusted as
circumstances dictate.
Revenue Recognition
We
recognize revenue when all of the following conditions are
satisfied: (i) there is persuasive evidence of an arrangement, (ii)
the service has been provided to the customer, (iii) the collection
of our fees is probable, and (iv) the amount of fees to be paid by
the customer is fixed or determinable.
We
recognize subscription, hosting, premium support, and maintenance
revenue ratably over the length of the agreement beginning on the
commencement dates of each agreement or when revenue recognition
conditions are satisfied. Revenue from license and professional
services agreements are recognized as delivered.
Amounts that have
been invoiced are recorded in accounts receivable and in deferred
revenue or revenue, depending on whether the revenue recognition
criteria have been met.
Agreements with
multiple deliverables such as subscriptions, support, and
professional services, are accounted for separately if the
deliverables have standalone value upon delivery. Subscription
services have standalone value as the services are typically sold
separately. When considering whether professional services have
standalone value, the Company considers the following factors: (i)
availability of services from other vendors, (ii) the nature and
timing of professional services, and (iii) sales of similar
services sold separately. Multiple deliverable arrangements are
separated into units of accounting and the total contract
consideration is allocated to each unit based on relative selling
prices.
Stock-Based Compensation
The
Company recognizes the cost of employee services received in
exchange for awards of equity instruments based on the grant-date
fair value of those awards. The Company records compensation
expense on a straight-line basis. The fair value of options granted
are estimated at the date of grant using a Black-Scholes option
pricing model with assumptions for the risk-free interest rate,
expected life, volatility, dividend yield and forfeiture
rate.
Capitalization of Software Development Costs
The
Company accounts for research costs of computer software to be
sold, leased or otherwise marketed as expense until technological
feasibility has been established for the product. Once
technological feasibility is established, all software costs are
capitalized until the product is available for general release to
customers. Judgment is required in determining when technological
feasibility of a product is established. We have determined that
technological feasibility for our software products is reached
shortly after a working prototype is complete and meets or exceeds
design specifications including functions, features, and technical
performance requirements. Costs incurred after
technological feasibility is established have been and will
continue to be capitalized until such time as when the product or
enhancement is available for general release to
customers.
Off-Balance Sheet Arrangements
The
Company does not have any off balance sheet arrangements that are
reasonably likely to have a current or future effect on our
financial condition, revenue and results of operation, liquidity or
capital expenditures.
Results of Operations – Fiscal Years Ended June 30, 2017,
2016 and 2015
Revenue
|
Revenue
|
Year
Ended
June
30, 2017
|
$
Change
|
%
Change
|
Year
Ended
June
30, 2016
|
$
Change
|
%
Change
|
Year
Ended
June
30, 2015
|
|
Revenue
|
$
18,939,263
|
$
4,928,570
|
35
%
|
$
14,010,693
|
$
361,978
|
3
%
|
$
13,648,715
|
During
the fiscal year ended June 30, 2017, the Company had revenue of
$18,939,263 compared to $14,010,693 for the year ended June 30,
2016, a 35% increase. This $4,928,570 increase in total revenue was
principally due to the growth of ReposiTrak related products. This
was partially offset by a decrease resulting from license and
maintenance fees in the prior year that did not recur in the
current period.
During
the fiscal year ended June 30, 2016, the Company had revenue of
$14,010,693 compared to $13,648,715 for the year ended June 30,
2015, a 3% increase. This $361,978 increase in total revenue was
principally due to $550,000 net decrease in revenue attributable to
ReposiTrak offset by a $912,000 increase in other
revenue. The decrease in the revenue attributable to
ReposiTrak was due to the acquisition of ReposiTrak which resulted
in the elimination of subscription and management fees. The
decreased fees from ReposiTrak as a customer were partially offset
by revenue generated by the ReposiTrak foods safety
offerings.
Management believes
that revenue will increase in subsequent periods primarily as a
result of growth in ReposiTrak customers and revenue, and
secondarily due to the Company’s strategy of pursuing new
contracts with suppliers (“
Spokes
”) to connect to retail
customers (“
Hubs
”).
Cost of Services and Product Support
|
|
Year Ended
June 30, 2017
|
$
Change
|
%
Change
|
Year Ended
June 30, 2016
|
$
Change
|
%
Change
|
Year Ended
June 30, 2015
|
|
Cost of service
and product support
|
$
5,318,042
|
$
1,038,318
|
24
%
|
$
4,279,724
|
$
(976,527
)
|
-19
%
|
$
5,256,251
|
|
Percent of total
revenue
|
28
%
|
|
|
31
%
|
|
|
39
%
|
Cost of
services and product support was $5,318,042 or 28% of total
revenue, and $4,279,724 or 31% of total revenue for the years ended
June 30, 2017 and 2016, respectively, a 24% increase.
This
period over period increase of $1,038,318 is principally due
to (i) a $450,000 increase in cost of goods sold, (ii) a $400,000
increase in employee related expense, (iii) capitalization of
software development costs of $183,000 in fiscal 2016, and (iv) a
$5,000 increase in other product support costs.
Cost of
services and product support was $4,279,724 or 31% of total
revenue, and $5,256,251 or 39% of total revenue for the years ended
June 30, 2016 and 2015, respectively, a 19% decrease.
This
period over period decrease of $976,527 is principally due to
(i) a $752,000 decrease in employee related expense, (ii)
capitalization of software development costs of $183,000 in the
second, third, and fourth quarters of fiscal 2016, and (iii) a
$42,000 decrease in other product support
costs.
Management expects service
and a product support to increase in absolute
value
in subsequent periods, but
to continue to fall as a percentage of total
revenue.
Sales and Marketing Expense
|
|
Year Ended
June 30, 2017
|
$
Change
|
%
Change
|
Year Ended
June 30, 2016
|
$
Change
|
%
Change
|
Year Ended
June 30, 2015
|
|
Sales and
marketing
|
$
5,097,072
|
$
(273,933
)
|
-5
%
|
$
5,371,005
|
$
(570,344
)
|
-10
%
|
$
5,941,349
|
|
Percent of total
revenue
|
27
%
|
|
|
38
%
|
|
|
44
%
|
The
Company’s sales and marketing expense was $5,097,072, or 27%
of total revenue, and $5,371,005 or 38% of total revenue, for the
fiscal years ended June 30, 2017 and 2016, respectively, a 5%
decrease.
Sales and marketing expense
decreased principally due to a decrease in marketing and
promotional expense of $283,000, which were partially offset by an
increase in other sales related costs of
$9,000.
The
Company’s sales and marketing expense was $5,371,005, or 38%
of total revenue, and $5,941,349 or 44% of total revenue, for the
fiscal years ended June 30, 2016 and 2015, respectively, a 10%
decrease.
Sales and marketing expense
decreased principally due to (i) a decrease in marketing and
promotional expense of $411,000, and (ii) a decrease of $230,000 in
employee related costs and travel expense, which were partially
offset by an increase in other sales related costs of
$70,000.
Management expects sales
and marketing expense to increase in absolute
value
in subsequent periods, but
to continue to fall as a percentage of total
revenue.
General and Administrative Expense
|
|
Year Ended
June 30, 2017
|
$
Change
|
%
Change
|
Year Ended
June 30, 2016
|
$
Change
|
%
Change
|
Year Ended
June 30, 2015
|
|
General and
administrative
|
$
4,136,996
|
$
971,919
|
31
%
|
$
3,165,077
|
$
(1,114,564
)
|
-26
%
|
$
4,279,641
|
|
Percent of total
revenue
|
22
%
|
|
|
23
%
|
|
|
31
%
|
The
Company’s general and administrative expense was $4,136,996,
or 22% of total revenue, and $3,165,077 or 23% of total revenue for
the years ended June 30, 2017 and 2016, respectively, a 31%
increase.
This $971,919 increase is
principally due to (i) employee related costs, and travel expense
of approximately $564,000, (ii) increased bad debt expense of
$278,000, and (iii) an increase of $130,000 related to
infrastructure, professional fees and
donations..
The
Company’s general and administrative expense was $3,165,077,
or 23% of total revenue, and $4,279,641 or 31% of total revenue for
the years ended June 30, 2016 and 2015, respectively, a 26%
decrease.
This $1,114,564 decrease is
principally due to (i) reductions in employee related costs, and
travel expense of approximately $1.2 million, and (ii) decreased
bad debt expense of $119,000. These decreases were
partially offset by increases in facility costs of $97,000 and
professional fees of $108,000 incurred in connection with the
acquisition of ReposiTrak.
Management expects general
and administrative expense to increase in absolute
value
in subsequent periods, but
to continue to fall as a percentage of total
revenue.
Depreciation and Amortization Expense
|
|
Year Ended
June 30, 2017
|
$
Change
|
%
Change
|
Year Ended
June 30, 2016
|
$
Change
|
%
Change
|
Year Ended
June 30, 2015
|
|
Depreciation and
amortization
|
$
486,024
|
$
(21,422
)
|
-4
%
|
$
507,446
|
$
(260,719)
|
-34
%
|
$
768,165
|
|
Percent of total
revenue
|
3
%
|
|
|
4
%
|
|
|
6
%
|
The
Company’s depreciation and amortization expense was $486,024
and $507,446 for the year ended June 30, 2017 and 2016,
respectively, a 4% decrease. Depreciation and
amortization expense decreased by $21,422 for the year ended, June
30, 2017 when compared to the year ended June 30, 2016 due to
decreased
depreciation expense as many assets have become fully depreciated,
this has been partially offset by the amortization of capitalized
software.
The
Company’s depreciation and amortization expense was $507,446
and $768,165 for the year ended June 30, 2016 and 2015,
respectively, a 34% decrease. Depreciation and
amortization expense decreased by $260,719 for the year ended, June
30, 2016 when compared to the year ended June 30, 2015 due to
decreased
customer list amortization due to the impairment charge taken in
the fiscal year ended June 30, 2015.
Impairment and Other Charges
The
Company recognized a non-cash impairment charge of $1.5 million
during the year ended June 30, 2015, due principally to decreased
margins on customers acquired in connection with the Prescient
acquisition. In management’s determination, the
carrying value of these relationships exceeded their estimated fair
values as determined by future discounted cash flow
projections. When projecting the stream of future cash
flows for purposes of determining long-lived asset recoverability,
management makes assumptions, incorporating market conditions,
sales growth rates, and operating expense.
Other Income and Expense
|
|
Year
Ended
June
30, 2017
|
$
Change
|
%
Change
|
Year
Ended
June
30, 2016
|
$
Change
|
%
Change
|
Year
Ended
June
30, 2015
|
|
Other (expense) and
income
|
$
(16,028
)
|
$
-4,910
|
-24
%
|
$
(20,938
)
|
$
(263,559
)
|
-109
%
|
$
242,621
|
|
Percent of total
revenue
|
<1
%
|
|
|
<1
%
|
|
|
2
%
|
Net
other income (expense) was net other expense of $16,028 when
compared with net other expense of $20,938 for the year ended June
30, 2017 and June 30, 2016, respectively. This decrease of $4,910
for the year ended June 30, 2017 when compared to the year ended
June 30, 2016 is primarily due an increase in net interest expense
partially offset by a gain on sale of furniture associated with the
Company’s relocation.
Net
other income (expense) was net other expense of $20,938 when
compared with net other income of $242,621 for the year ended June
30, 2016 and June 30, 2015, respectively. This decrease of $263,559
for the year ended June 30, 2016 when compared to the year ended
June 30, 2015 is primarily due to interest income on notes
receivable during the 2015 period that were eliminated as a result
of the consolidation of ReposiTrak for the same period in 2016 and
a loss on the disposition of investments of $26,128 for the year
ended June 30, 2016.
Preferred Dividends
|
|
Year Ended
June 30, 2017
|
$
Change
|
%
Change
|
Year Ended
June 30, 2016
|
$
Change
|
%
Change
|
Year Ended
June 30, 2015
|
|
Preferred
dividends
|
$
790,811
|
$
61,523
|
8
%
|
$
729,288
|
$
160,467
|
28
%
|
$
568,821
|
|
Percent of total
revenue
|
4
%
|
|
|
5
%
|
|
|
4
%
|
Dividends accrued
on the Company’s Series B Preferred and Series B-1 Preferred
was $790,811 for the year ended June 30, 2017, compared to
dividends accrued on the Series B Preferred of $729,288 for the
year ended June 30, 2016.
This $61,523 increase is
primarily attributable to the determination by the Company to pay
dividends in kind for the year ended June 30,
2017.
Dividends accrued
on the Company’s Series B Preferred and Series B-1 Preferred
was $729,288 for the year ended June 30, 2016, compared to
dividends accrued on the Series B Preferred of $568,821 for the
year ended June 30, 2015.
This $160,467 increase is
primarily attributable to the determination by the Company to pay
dividends in kind for the year ended June 30, 2015, which resulted
in an adjustment to dividends in the current period. All dividends
accrued were paid through the issuance of 66,013 shares of Series
B-1 Preferred.
Financial Position, Liquidity and Capital Resources
We
believe our existing cash and short-term investments, together with
funds generated from operations, are sufficient to fund operating
and investment requirements for at least the next twelve months.
Our future capital requirements will depend on many factors,
including our rate of revenue growth and expansion of our sales and
marketing activities, the timing and extent of spending required
for research and development efforts and the continuing market
acceptance of our products.
|
|
Year Ended
June 30, 2017
|
$
Change
|
%
Change
|
Year Ended
June 30, 2016
|
$
Change
|
%
Change
|
Year Ended
June 30, 2015
|
|
Cash and Cash
Equivalents
|
$
14,054,006
|
$
2,610,618
|
23
%
|
$
11,443,388
|
$
117,816
|
1
%
|
$
11,325,572
|
We have
historically funded our operations with cash from operations,
equity financings and debt borrowings. Cash and cash equivalents
was $14,054,006 and $11,443,388 at June 30, 2017, and June 30,
2016, respectively, a 23% increase, and $11,443,388 and $11,325,572
at June 30, 2016, and June 30, 2015, respectively, a 1% increase.
The $2,610,618 increase during the year ended June 30, 2017 when
compared to the year ended June 30, 2016 is principally the result
of cash flow from operations, due to increased net income during
the period, while the $117,816 increase from the year ended June
30, 2016 to the comparable period ended June 30, 2015
is
principally the
result of cash flow from operations
.
Net Cash Flows from Operating Activities
|
|
Year Ended
June 30, 2017
|
$
Change
|
%
Change
|
Year Ended
June 30, 2016
|
$
Change
|
%
Change
|
Year Ended
June 30, 2015
|
|
Cash flows
provided by operating activities
|
$
2,257,138
|
$
1,753,915
|
349
%
|
$
503,223
|
$
(1,204,374
)
|
-71
%
|
$
1,707,597
|
Net
cash provided by operating activities is summarized as
follows:
|
|
2017
|
2016
|
2015
|
|
Net income
(loss)
|
$
3,777,532
|
$
666,503
|
$
(3,849,773
)
|
|
Noncash expense
and income, net
|
2,088,149
|
1,612,026
|
5,368,927
|
|
Net changes in
operating assets and liabilities
|
(3,608,543
)
|
(1,775,306
)
|
188,443
|
|
|
$
2,257,138
|
$
503,223
|
$
1,707,597
|
Noncash
expense increased by $476,123 in the year ended June 30, 2017
compared to June 30, 2016.
Noncash
expense increased as a result of a $278,000 increase in bad
debt expense, a $256,000 increase in stock compensation expense,
partially offset by a $21,000 decrease in depreciation and
amortization expense, and a $47,000 decrease related to gains and
losses.
Noncash
expense decreased by $3,756,901 in the year ended June 30, 2016
compared to June 30, 2015.
Noncash
expense decreased as a result of a $1,750,000 decrease in
stock compensation expense, a $1,756,000 decrease in depreciation
and amortization expense, which includes a $1,496,000 impairment
charge, a $158,000 decrease in charitable non-cash donations, and a
decrease of $119,000 in bad debt expense, offset by a $26,000
increase on the loss of short-term marketable
securities.
Net Cash Flows used in Investing
Activities
|
|
Year Ended
June 30, 2017
|
$
Change
|
%
Change
|
Year Ended
June 30, 2016
|
$
Change
|
%
Change
|
Year Ended
June 30, 2015
|
|
Cash flows used in
investing activities
|
$
1,950,702
|
1,585,061
|
434
%
|
$
365,641
|
$
(2,241,236
)
|
-86
%
|
$
2,606,877
|
Net
cash flows used in investing activities for the year ended June 30,
2017 was $1,950,702 compared to net cash flows used in investing
activities of $365,641 for the year ended June 30,
2016. This $1,585,061 increase in cash used in investing
activities for the year ended June 30, 2017 when compared to the
same period in 2016 was purchases of property and equipment of
$1,957,000, which included approximately $1.6 million for the
purchase of a small aircraft to facilitate key personnel travelling
to the Company's growing network of customers.
Net
cash flows used in investing activities for the year ended June 30,
2016 was $365,641 compared to net cash flows used in investing
activities of $2,606,877 for the year ended June 30,
2015. This $2,241,236 decrease in cash used in investing
activities for the year ended June 30, 2016 when compared to the
same period in 2015 was the result of
funds loaned to
ReposiTrak during the year ended June 30, 2015, which were
eliminated due to the acquisition of ReposiTrak and consolidation
of the Company's financial statements. This decrease was partially
offset by the investment in long-term investments and
capitalization of software cost.
Net Cash Flows from Financing Activities
|
|
Year Ended
June 30, 2017
|
$
Change
|
%
Change
|
Year Ended
June 30, 2016
|
$
Change
|
%
Change
|
Year Ended
June 30, 2015
|
|
Cash flows
provided by (used in) financing activities
|
$
2,304,182
|
$
2,323,948
|
118
%
|
$
(19,766
)
|
$
(8,892,059
)
|
-100
%
|
$
8,872,293
|
Net
cash flows provided by financing activities totaled $2,304,182
for the year ended June 30, 2017 compared to cash flows used in
financing activities of $19,766 for the year ended June 30, 2016.
The change in
net cash related to financing activities is primarily attributable
to cash from the issuance of notes payable and increases in lines
of credit of $2,175,000 used primarily for the purchase property
and equipment. There were also increases in proceeds from employee
stock plans of $24,000 and from the issuance of stock upon exercise
of warrants of $123,000.
Net
cash flows used in financing activities totaled $19,766 for
the year ended June 30, 2016 compared to cash flows provided by
financing activities of $8,872,293 for the year ended June 30,
2015.
The
change in net cash related to financing activities is primarily
attributable to cash from the issuance of stock during the year
ended June 30, 2015 and increased proceeds from lines of credit,
partially offset by (i) a decrease in payments on notes payable,
and (ii) a decrease in dividends paid in cash. The
Company has the option to pay quarterly preferred dividends in kind
and has made this election for each quarter beginning with the
quarter ended December 31, 2015.
Liquidity and Working Capital
At June
30, 2017, the Company had positive working capital of $10,536,804,
as compared with positive working capital of $7,346,632 at June 30,
2016, and positive working capital of $5,032,139 at June 30,
2015. This $3,190,172 increase in working capital is
principally due to
the increased cash flows
from operations which is a result of increased net income.
The substantial increase in accounts receivable
in the year ended June 30, 2017 compared to the year ended June 30,
2016 is principally due to extended payment terms on long term
agreements. Increases in accrued liabilities in the year
ended June 30, 2017 compared to the year ended June 30, 2016 is
principally due to accruals related to stock based compensation and
other compensation based accruals.
While no assurances can be given, management currently believes
that the Company will increase its working capital position in
subsequent periods, and thereby reduce its indebtedness utilizing
existing cash resources and projected cash flow from operations,
and
that it will have
adequate cash resources to fund its operations and satisfy its debt
obligations for at least the next 12 months.
|
|
Year Ended
June 30, 2017
|
$
Change
|
%
Change
|
Year Ended
June 30, 2016
|
$
Change
|
%
Change
|
Year Ended
June 30, 2015
|
|
Current
assets
|
$
18,706,733
|
$
3,821,296
|
26
%
|
$
14,885,437
|
$
1,455,847
|
11
%
|
$
13,429,590
|
Current assets as of June 30, 2017, totaled $18,706,733, an
increase of $3,821,296 when compared to $14,885,437 as of June 30,
2016. The increase in current assets is attributable to an
increase in cash and accounts receivable.
Current assets as of June 30, 2016, totaled $14,885,437, an
increase of $1,455,847 when compared to $13,429,590 as of June 30,
2015. The increase in current assets is attributable to an
increase in accounts receivable.
|
|
Year Ended
June 30, 2017
|
$
Change
|
%
Change
|
Year Ended
June 30, 2016
|
$
Change
|
%
Change
|
Year Ended
June 30, 2015
|
|
Current
liabilities
|
$
8,169,929
|
$
631,124
|
8
%
|
$
7,538,805
|
$
(858,646
)
|
-10
%
|
$
8,397,451
|
Current
liabilities totaled $8,169,929 and $7,538,805 as of June 30, 2017,
and 2016, respectively.
The $631,124 comparative
increase in current liabilities is principally due to an increase
in accrued liabilities and an increase in lines of
credit. This increase was partially offset by a decrease
in deferred revenue.
Current
liabilities totaled $7,538,805 and $8,397,451 as of June 30, 2016,
and 2015, respectively.
The $858,646 comparative
decrease in current liabilities is principally due to a decrease in
accrued liabilities. This decrease was partially offset
by an increase in deferred revenue.
While
no assurances can be given, management currently intends to
continue to reduce its indebtedness in subsequent periods utilizing
existing cash resources and projected cash flow from
operations. In addition, management may also continue to
pay down, pay off or refinance certain of the Company’s
indebtedness. Management believes that these initiatives
will enable us to address our debt service requirements during the
next 12 months without negatively impacting our working
capital, as well as fund our currently anticipated operations and
capital spending requirements.
Contractual Obligations
Total
contractual obligations and commercial commitments as of June 30,
2017, are summarized in the following table:
|
|
Payment Due by Year
|
||||
|
|
Total
|
Less than
1 Year
|
1-3
Years
|
3-5
Years
|
More than
5 Years
|
|
Operating
lease obligations
|
$
438,725
|
$
275,709
|
$
163,016
|
$
-
|
$
-
|
Inflation
The
impact of inflation has historically not had a material effect on
the Company’s financial condition or results from operations;
however, higher rates of inflation may cause retailers to slow
their spending in the technology area, which could have an impact
on the Company’s sales.
Recent Accounting Pronouncements
In January 2017, the FASB issued ASU
2017-04,
Intangibles—Goodwill and
Other (Topic 350), Simplifying the Test for Goodwill
Impairment.
The amendment
in this Update simplify how an entity is required to test goodwill
for impairment by eliminating Step 2 from the goodwill impairment
test. An entity should apply the amendments in this Update on a
prospective basis In January 2017, the FASB issued ASU 2017-04,
Intangibles—Goodwill and Other (Topic 350), Simplifying the
Test for Goodwill Impairment. The amendment in this Update simplify
how an entity is required to test goodwill for impairment by
eliminating Step 2 from the goodwill impairment test. An entity
should apply the amendments in this Update on a prospective basis.
The Company notes that this guidance applies to its reporting
requirements and will implement the new guidance
accordingly.
In
August 2016, the FASB issued ASU 2016-15, Statement of Cash Flows
(Topic 230): Classification of Certain Cash Receipts and Cash
Payments. Historically, there has been a diversity in practice in
how certain cash receipts/payments are presented and classified in
the statement of cash flows under Topic 230. To reduce the existing
diversity in practice, this update addresses multiple cash flow
issues. The amendments in this update are effective for fiscal
years beginning after December 15, 2017, and interim periods within
those fiscal years. Early adoption is permitted. The Company notes
that this guidance applies to its reporting requirements and will
implement the new guidance accordingly.
Through December 2016, the Financial Accounting
Standards Board ("FASB") issued ASU 2014-09 (ASC Topic 606),
Revenue from Contracts with Customers, ASU 2015-14 (ASC Topic 606)
Revenue from Contracts with Customers, Deferral of the Effective
Date, ASU 2016-10 (ASC Topic 606) Revenue from Contracts with
Customers, Identifying Performance Obligations and Licensing, ASU
2016-12 (ASC Topic 606) Revenue from Contracts with Customers,
Narrow Scope Improvements and Practical Expedients, and ASU 2016-20
(ASC Topic 606) Technical Corrections and Improvements to Topic
606, Revenue from Contracts with Customers, respectively. ASC
Topic 606 outlines a single comprehensive model for entities to use
in accounting for revenue arising from contracts with customers and
supersedes most current revenue recognition guidance, including
industry specific guidance. It also requires entities to disclose
both quantitative and qualitative information that enable financial
statements users to understand the nature, amount, timing, and
uncertainty of revenue and cash flows arising from contracts with
customers. The amendments in these ASUs are effective for the
Company’s fiscal year starting July 1, 2018. The two
permitted transition methods under the new standard are the full
retrospective method, in which case the standard would be applied
to each prior reporting period presented, or the modified
retrospective method, in which case the cumulative effect of
applying the standard would be recognized at the date of initial
application. The Company currently anticipates adopting the
standard using the full retrospective method. We are in the process
of completing our analysis on the impact this guidance will have on
our Consolidated Financial Statementsand related disclosures, as
well as identifying the required changes to our policies, processes
and controls. The Company is still conducting its assessment and
will continue to evaluate the impact of this ASU on our financial
position and results of operation.
In
March 2016, the FASB issued ASU 2016-09 (ASC Topic 718), Stock
Compensation—Improvements to Employee Share-Based Payment
Accounting. The amendments in this ASU are intended to
simplify several areas of accounting for share-based compensation
arrangements, including the income tax consequences, classification
on the consolidated statement of cash flows and treatment of
forfeitures. The amendments in this ASU are effective for annual
periods beginning after December 15, 2016, and interim periods
within those annual periods. Early adoption is permitted. The
Company is in the process of assessing the impact, if any, of this
ASU on its consolidated financial statements.
In
February 2016, the FASB issued ASU 2016-02 (ASC Topic 842), Leases.
The ASU amends a number of aspects of lease accounting, including
requiring lessees to recognize operating leases with a term greater
than one year on their balance sheet as a right-of-use asset and
corresponding lease liability, measured at the present value of the
lease payments. The amendments in this ASU are effective for fiscal
years beginning after December 15, 2018, including interim
periods within those fiscal years. Early adoption is permitted. The
Company is in the process of assessing the impact on its
consolidated financial statements.
Each of our contracts require payment in U.S. dollars. We
therefore do not engage in hedging transactions to reduce our
exposure to changes in currency exchange rates, although in the
event any future contracts are denominated in a foreign currency,
we may do so in the future. As a result, our financial
results are not affected by factors such as changes in foreign
currency exchange rates.
The
information required hereunder in this Annual Report on Form 10-K
is set forth in the financial statements and the notes thereto
beginning on Page F-1.
Effective January
1, 2016 (the “
Effective Date
”) all of the
assets of HJ & Associates, LLC (“
HJ
”) were acquired by Haynie
& Company, Salt Lake City, Utah, and, as a result, HJ resigned
as the Company’s independent registered public accounting
firm because the firm is no longer an active entity. Therefore, on
January 1, 2016, the Company engaged Haynie & Company, Salt
Lake City, Utah, as its new independent registered public
accounting firm. The engagement of Haynie & Company was
unanimously approved by the Company’s audit
committee.
The
reports of HJ regarding the Company’s consolidated financial
statements for the two most recent fiscal years did not contain an
adverse or disclaimer of opinion and were not qualified or modified
as to uncertainty, audit scope, or accounting
principles.
During
the two most recent fiscal years and through the Effective Date,
there were (i) no disagreements between the Company and HJ on any
matter of accounting principles or practices, financial statement
disclosure, or auditing scope or procedures, which disagreement, if
not resolved to the satisfaction of HJ, would have caused HJ to
make reference thereto in their reports on the consolidated
financial statements for such years, and (ii) no “reportable
events” as that term is defined in Item 304(a)(1)(v) of
Regulation S-K.
During
the Company’s two most recent fiscal years and in the
subsequent interim period through the Effective Date, the Company
has not consulted with Haynie & Company regarding either (i)
the application of accounting principles to a specified
transaction, either completed or proposed, or the type of audit
opinion that might be rendered on the Company’s consolidated
financial statements, and neither a written report nor oral advice
was provided to the Company that Haynie & Company concluded was
an important factor considered by the Company in reaching a
decision as to the accounting, auditing or financial reporting
issue; or (ii) any matter that was either the subject of a
disagreement (as defined in Item 304(a)(1)(iv) of Regulation S-K
and the related instructions) or a reportable event (as described
in Item 304(a)(1)(v) of Regulation S-K).
The
Company disclosed the change in auditors in a Current Report on
Form 8-K filed with the Securities and Exchange Commission on
January 7, 2016.
|
(a)
|
Evaluation of disclosure controls and procedures.
|
Under
the supervision and with the participation of our Management,
including our principal executive officer and principal financial
officer, we conducted an evaluation of the effectiveness of the
design and operations of our disclosure controls and procedures, as
defined in Rules 13a-15(e) and 15d-15(e) under the Securities
Exchange Act of 1934, as of June 30, 2017. Based on this
evaluation, the Company’s Chief Executive Officer and Chief
Financial Officer concluded that our disclosure controls and
procedures are effective to ensure that information required to be
disclosed in the reports submitted under the Securities and
Exchange Act of 1934 is recorded, processed, summarized and
reported within the time periods specified in SEC rules and forms,
including to ensure that information required to be disclosed by
the Company is accumulated and communicated to management,
including the principal executive officer and principal financial
officer, as appropriate to allow timely decisions regarding
required disclosure.
|
(b)
|
Management's Annual Report on Internal Control over Financial
Reporting.
|
We are
responsible for establishing and maintaining adequate internal
control over financial reporting (as defined in Rule 13a-15(f)
under the Exchange Act). Our internal control over financial
reporting is a process designed to provide reasonable assurance
regarding the reliability of financial reporting and the
preparation of financial statements for external purposes of
accounting principles generally accepted in the United
States.
Because of its
inherent limitations, internal control over financial reporting may
not prevent or detect misstatements. Therefore, even those systems
determined to be effective can provide only reasonable assurance of
achieving their control objectives.
Management is
responsible for establishing and maintaining adequate internal
control over financial reporting for the Company. With our
participation, an evaluation of the effectiveness of our internal
control over financial reporting was conducted as of June 30, 2017,
based on the framework and criteria established in Internal Control
Integrated Framework (2013) issued by the Committee of Sponsoring
Organizations of the Treadway Commission. Based on this evaluation,
our Chief Executive Officer and Chief Financial Officer concluded
that our internal control over financial reporting was effective as
of June 30, 2017.
Haynie and Company, our independent registered public
accounting firm audited our consolidated financial statements
included in this Annual Report on Form 10-K, has issued an
attestation report on the effectiveness of our internal control
over financial reporting, which report is included in Part IV
below.
|
(c)
|
Changes in Internal Controls over Financial
Reporting.
|
Our
Chief Executive Officer and Chief Financial Officer have determined
that there have been no changes, in the Company’s internal
control over financial reporting during the period covered by this
report identified in connection with the evaluation described in
the above paragraph that have materially affected, or are
reasonably likely to materially affect, Company’s internal
control over financial reporting.
None.
The
information required by this item will be incorporated by reference
from Park City Group, Inc.’s definitive proxy statement, to
be filed with the Securities and Exchange Commission on or before
October 28, 2017.
The
information required by this item will be incorporated by reference
from Park City Group, Inc.’s definitive proxy statement, to
be filed with the Securities and Exchange Commission on or before
October 28, 2017.
|
SECURITY OWNERSHIP OF CERTAIN BENEFICIAL OWNERS AND MANAGEMENT AND
RELATED STOCKHOLDER MATTERS
|
The
information required by this item will be incorporated by reference
from Park City Group, Inc.’s definitive proxy statement, to
be filed with the Securities and Exchange Commission on or before
October 28, 2017.
The
information required by this item will be incorporated by reference
from Park City Group, Inc.’s definitive proxy statement, to
be filed with the Securities and Exchange Commission on or before
October 28, 2017.
The
information required by this item will be incorporated by reference
from Park City Group, Inc.’s definitive proxy statement, to
be filed with the Securities and Exchange Commission on or before
October 28, 2017.
Exhibits, Financial Statements and Schedules
|
Exhibit
Number
|
|
Description
|
|
|
Agreement
and Plan of Merger and Reorganization, Dated August 28,
2008
(1)
|
|
|
|
Form
of Stock Purchase Agreement
(1)
|
|
|
|
Form
of Stock Voting Agreement
(1)
|
|
|
|
Form
of Promissory Note
(2)
|
|
|
|
Articles
of Incorporation
(3)
|
|
|
|
Certificate
of Amendment
(4)
|
|
|
|
Certificate
of Amendment
(5)
|
|
|
|
Certificate
of Amendment
(21)
|
|
|
|
Bylaws
(3)
|
|
|
|
Amended
and Restated Bylaws
(19)
|
|
|
|
Certificate
of Designation of the Series A Convertible Preferred Stock
(6)
|
|
|
|
Certificate
of Designation of the Series B Convertible Preferred
Stock
(7)
|
|
|
|
Fourth
Amended and Restated Certificate of Designation of the Relative
Rights, Powers and Preferences of the Series B Preferred Stock of
Park City Group, Inc.
(17)
|
|
|
|
First
Amended and Restated Certificate of Designation of the Relative
Rights, Powers and Preferences of the Series B-1 Preferred Stock of
Park City Group, Inc.
(18)
|
|
|
|
Subordinated
Promissory Note, dated April 1, 2009, issued to Riverview Financial
Corporation
(8)
|
|
|
|
Amendment
to Loan Agreement and Note, by and between U.S. Bank National
Association and the Company, dated September 15, 2009
(9)
|
|
|
|
Term
Loan Agreement, by and between U.S. Bank National Association and
the Company, dated May 5, 2010
(10)
|
|
|
|
Amendment
to Loan Agreement and Note, by and between U.S. Bank National
Association and the Company, dated May 5, 2010
(10)
|
|
|
|
Promissory
Note, dated August 25, 2009, issued to Baylake Bank
(11)
|
|
|
|
ReposiTrak
Omnibus Subscription Agreement
(12)
|
|
|
|
ReposiTrak
Promissory Note
(12)
|
|
|
|
Fields
Employment Agreement
(14)
|
|
|
|
Services
Agreement
(14)
|
|
|
|
Form
of Securities Purchase Agreement
(15)
|
|
|
|
Employment
Agreement by and between Todd Mitchell and Park City Group, Inc.,
dated September 28, 2015
(16)
|
|
|
|
Amendment
No. 1 to the Employment Agreement, by and between Park City Group,
Inc., Randall K. Fields and Fields Management, Inc., dated July 1,
2016.
(20)
|
|
|
|
Code
of Ethics and Business Conduct
(13)
|
|
|
|
List
of Subsidiaries
*
|
|
|
|
Consent
of Haynie & Company, dated September 13, 2017 *
|
|
|
|
Certification
of Principal Executive Officer pursuant to Section 302 of Sarbanes
Oxley Act of 2002
|
|
|
|
Certification
of Principal Financial Officer pursuant to Section 302 of Sarbanes
Oxley Act of 2002
|
|
|
|
Certification
of Principal Executive Officer and Principal Financial Officer
pursuant to 18 U.S.C. Section 1350
|
|
(1)
|
Incorporated
by reference from our Form 8-K dated September 3,
2008.
|
|
(2)
|
Incorporated
by reference from our Form 8-K dated September 15,
2008.
|
|
(3)
|
Incorporated
by reference from our Form DEF 14C dated June 5, 2002.
|
|
(4)
|
Incorporated
by reference from our Form 10-QSB for the year ended Sept 30,
2005.
|
|
(5)
|
Incorporated
by reference from our Form 10-KSB dated September 29,
2006.
|
|
(6)
|
Incorporated
by reference from our Form 8-K dated June 27, 2007.
|
|
(7)
|
Incorporated
by reference from our Form 8-K dated July 21, 2010.
|
| (8) |
Incorporated
by reference from our Form 8-K dated June 5, 2009.
|
|
(9)
|
Incorporated
by reference from our Form 8-K dated September 30,
2009.
|
|
(10)
|
Incorporated
by reference from our Form 8-K dated May 6, 2010.
|
|
(11)
|
Incorporated
by reference from our Form 8-K dated August 25, 2009.
|
|
(12)
|
Incorporated
by reference from our Annual Report on Form 10-K dated September
23, 2013.
|
|
(13)
|
Incorporated
by reference from our Form 10-KSB dated September 29,
2008.
|
|
(14)
|
Incorporated
by reference from our Form 10-K dated September 11,
2014.
|
|
(15)
|
Incorporated
by reference from our Form 8-K dated May 13, 2015.
|
|
(16)
|
Incorporated
by reference from our Form 8-K dated September 30,
2015.
|
|
(17)
|
Incorporated
by reference from our Form 8-K dated January 14, 2016.
|
|
(18)
|
Incorporated
by reference from our Form 8-K dated January 14, 2016.
|
|
(19)
|
Incorporated
by reference from our Form 8-K dated October 21, 2016.
|
|
(20)
|
Incorporated
by reference from our Form 10-Q dated November 7,
2016.
|
|
(21)
|
Incorporated
by reference from our Form 8-K dated July 28, 2017.
|
|
*
|
Filed
herewith
|
SIGNATURES
In
accordance with Section 13 or 15(d) of the Exchange Act, the
registrant caused this report to be signed on its behalf by the
undersigned, thereunto duly authorized.
|
|
PARK CITY GROUP, INC.
|
|
|
(Registrant)
|
|
Date:
September 13, 2017
|
By: /s/
Randall K. Fields
|
|
|
Principal
Executive Officer,
Chairman
of the Board and Director
|
In
accordance with the Exchange Act, this report has been signed below
by the following persons on behalf of the registrant and in the
capacities and on the dates indicated.
|
Signature
|
Title
|
Date
|
|
|
|
|
|
/s/
Randall K. Fields
|
Chairman
of the Board and Director,
|
September
13, 2017
|
|
Randall
K. Fields
|
Chief
Executive Officer
(Principal
Executive Officer)
|
|
|
/s/
Todd Mitchell
|
Chief
Financial Officer
|
September
13, 2017
|
|
Todd
Mitchell
|
(Principal
Financial Officer &
Principal
Accounting Officer)
|
|
|
/s/
Robert W. Allen
|
Director,
and Compensation
|
September
13, 2017
|
|
Robert
W. Allen
|
Committee
Chairman
|
|
|
/s/
William S. Kies, Jr.
|
Director
|
September
13, 2017
|
|
William
S. Kies, Jr.
|
|
|
|
/s/
Richard Juliano
|
Director
|
September
13, 2017
|
|
Richard
Juliano
|
|
|
|
/s/
Austin F. Noll, Jr.
|
Director
|
September
13, 2017
|
|
Austin
F. Noll, Jr.
|
|
|
|
/s/
Ronald C. Hodge
|
Director,
and Audit Committee Chairman
|
September
13, 2017
|
|
Ronald
C. Hodge
|
|
|
REPORT OF INDEPENDENT REGISTERED PUBLIC ACCOUNTING
FIRM
To the
Board of Directors and
Stockholders
of Park City Group, Inc.
We have
audited the accompanying balance sheets of Park City Group, Inc.
and subsidiaries as of June 30, 2017 and 2016, and the related
statements of operations, comprehensive income, stockholders’
equity, and cash flows for each of the years in the three-year
period ended June 30, 2017. Park City Group, Inc.’s
management is responsible for these financial statements. Our
responsibility is to express an opinion on these financial
statements based on our audits.
We
conducted our audits in accordance with the standards of the Public
Company Accounting Oversight Board (United States). Those standards
require that we plan and perform the audit to obtain reasonable
assurance about whether the financial statements are free of
material misstatement. An audit includes examining, on a test
basis, evidence supporting the amounts and disclosures in the
financial statements. An audit also includes assessing the
accounting principles used and significant estimates made by
management, as well as evaluating the overall financial statement
presentation. We believe that our audits provide a reasonable basis
for our opinion.
In our
opinion, the financial statements referred to above present fairly,
in all material respects, the financial position of Park City
Group, Inc. as of June 30, 2017 and 2016, and the results of its
operations and its cash flows for each of the years in the
three-year period ended June 30, 2017, in conformity with
accounting principles generally accepted in the United States of
America.
We also
have audited, in accordance with the standards of the Public
Company Accounting Oversight Board (United States), Park City
Group, Inc.’s internal control over financial reporting as of
June 30, 2017, based on criteria established in
Internal Control—Integrated
Framework
issued by the Committee of Sponsoring
Organizations of the Treadway Commission (COSO), and our report
dated September 12, 2017, expressed an unqualified
opinion.
Haynie
& Company
Salt
Lake City, Utah
September
12, 2017
REPORT OF INDEPENDENT REGISTERED PUBLIC ACCOUNTING
FIRM
To the
Board of Directors and
Stockholders
of Park City Group, Inc.
We have
audited Park City Group, Inc. and Subsidiaries’ internal
control over financial reporting as of June 30, 2017, based on
criteria established in
Internal
Control—Integrated Framework
issued by the Committee
of Sponsoring Organizations of the Treadway Commission (COSO). Park
City Group, Inc. and Subsidiaries’ management is responsible
for maintaining effective internal control over financial reporting
and for its assessment of the effectiveness of internal control
over financial reporting included in the accompanying
Management’s Annual Report on Internal Control over Financial
Reporting. Our responsibility is to express an opinion on the
company’s internal control over financial reporting based on
our audit.
We
conducted our audit in accordance with the standards of the Public
Company Accounting Oversight Board (United States). Those standards
require that we plan and perform the audit to obtain reasonable
assurance about whether effective internal control over financial
reporting was maintained in all material respects. Our audit of
internal control over financial reporting included obtaining an
understanding of internal control over financial reporting,
assessing the risk that a material weakness exists, and testing and
evaluating the design and operating effectiveness of internal
control based on the assessed risk. Our audit also included
performing such other procedures as we considered necessary in the
circumstances. We believe that our audit provides a reasonable
basis for our opinion.
A
company’s internal control over financial reporting is a
process designed to provide reasonable assurance regarding the
reliability of financial reporting and the preparation of financial
statements for external purposes in accordance with generally
accepted accounting principles. A company’s internal control
over financial reporting includes those policies and procedures
that (1) pertain to the maintenance of records that, in reasonable
detail, accurately and fairly reflect the transactions and
dispositions of the assets of the company; (2) provide reasonable
assurance that transactions are recorded as necessary to permit
preparation of financial statements in accordance with generally
accepted accounting principles, and that receipts and expenditures
of the company are being made only in accordance with
authorizations of management and directors of the company; and (3)
provide reasonable assurance regarding prevention or timely
detection of unauthorized acquisition, use, or disposition of the
company’s assets that could have a material effect on the
financial statements.
Because
of its inherent limitations, internal control over financial
reporting may not prevent or detect misstatements. Also,
projections of any evaluation of effectiveness to future periods
are subject to the risk that controls may become inadequate because
of changes in conditions, or that the degree of compliance with the
policies or procedures may deteriorate.
In our
opinion, Park City Group, Inc. and Subsidiaries maintained, in all
material respects, effective internal control over financial
reporting as of June 30, 2017, based on criteria established in
Internal Control—Integrated
Framework
issued by the Committee of Sponsoring
Organizations of the Treadway Commission (COSO).
We have
also audited, in accordance with the standards of the Public
Company Accounting Oversight Board (United States), the
consolidated balance sheets and the related statements of income,
comprehensive income, stockholders’ equity, and cash flows of
Park City Group Inc. and Subsidiaries, and our report dated
September 12, 2017 expressed an unqualified opinion.
Haynie
& Company
Salt
Lake City, Utah
September
12, 2017
PARK CITY GROUP, INC.
|
Assets
|
June 30,
2017
|
June 30,
2016
|
|
Current Assets
|
|
|
|
Cash
|
$
14,054,006
|
$
11,443,388
|
|
Receivables, net
allowance for doubtful accounts of $392,250 and $75,000 at June 30,
2017 and 2016, respectively
|
4,009,127
|
3,048,774
|
|
Prepaid expense
and other current assets
|
643,600
|
393,275
|
|
|
|
|
|
Total Current Assets
|
18,706,733
|
14,885,437
|
|
|
|
|
|
Property and equipment, net
|
2,115,277
|
469,383
|
|
|
|
|
|
Other Assets:
|
|
|
|
Long-term receivables, deposits, and other
assets
|
2,540,291
|
514,060
|
|
Investments
|
477,884
|
471,584
|
|
Customer
relationships
|
1,051,200
|
1,182,600
|
|
Goodwill
|
20,883,886
|
20,883,886
|
|
Capitalized
software costs, net
|
137,205
|
182,942
|
|
|
|
|
|
Total Other Assets
|
25,090,466
|
23,235,072
|
|
|
|
|
|
Total Assets
|
$
45,912,476
|
$
38,589,892
|
|
|
|
|
|
Liabilities and Shareholders' Equity
|
|
|
|
Current liabilities
|
|
|
|
Accounts
payable
|
$
565,487
|
$
580,309
|
|
Accrued
liabilities
|
2,084,980
|
1,502,203
|
|
Deferred
revenue
|
2,350,846
|
2,717,094
|
|
Lines of
credit
|
2,850,000
|
2,500,000
|
|
Current portion of
notes payable
|
318,616
|
239,199
|
|
|
|
|
|
Total current liabilities
|
8,169,929
|
7,538,805
|
|
|
|
|
|
Long-term liabilities
|
|
|
|
Notes payable,
less current portion
|
1,996,953
|
491,253
|
|
Other long term
liabilities
|
36,743
|
57,275
|
|
|
|
|
|
Total liabilities
|
10,203,625
|
8,087,333
|
|
|
|
|
|
Commitments and contingencies
|
|
|
|
|
|
|
|
Stockholders' equity:
|
|
|
|
Preferred
stock; $0.01 par value, 30,000,000 shares
authorized;
|
|
|
|
Series
B Preferred, 625,375 shares issued and outstanding at June 30, 2017
and 2016;
|
6,254
|
6,254
|
|
Series
B-1 Preferred, 285,859 and 180,213 shares issued and outstanding at
June 30, 2017 and 2016, respectively
|
2,859
|
1,802
|
|
Common stock,
$0.01 par value, 50,000,000 shares authorized; 19,423,821 and
19,229,556 issued and outstanding at June 30, 2017 and 2016,
respectively
|
194,241
|
192,296
|
|
Additional paid-in
capital
|
75,489,189
|
73,272,620
|
|
Accumulated
deficit
|
(39,983,692
)
|
(42,970,413
)
|
|
|
|
|
|
Total stockholders equity
|
35,708,851
|
30,502,559
|
|
|
|
|
|
Total liabilities and stockholders' equity
|
$
45,912,476
|
$
38,589,892
|
See
accompanying notes to consolidated financial
statements.
PARK CITY GROUP, INC. AND SUBSIDIARIES
|
|
For the Years Ended June 30,
|
||
|
|
2017
|
2016
|
2015
|
|
|
|
|
|
|
Revenue
|
$
18,939,263
|
$
14,010,693
|
$
13,648,715
|
|
|
|
|
|
|
Operating
expense:
|
|
|
|
|
Cost of revenue
and product support
|
5,318,042
|
4,279,724
|
5,256,251
|
|
Sales and
marketing
|
5,097,072
|
5,371,005
|
5,941,349
|
|
General and
administrative
|
4,136,996
|
3,165,077
|
4,279,641
|
|
Depreciation and
amortization
|
486,024
|
507,446
|
768,165
|
|
Impairment of
intangibles
|
-
|
-
|
1,495,703
|
|
Total operating
expense
|
15,038,134
|
13,323,252
|
17,741,109
|
|
|
|
|
|
|
Income (loss) from
operations
|
3,901,129
|
687,441
|
(4,092,394
)
|
|
|
|
|
|
|
Other (expense)
income:
|
|
|
|
|
Interest income
(expense), net
|
(26,408
)
|
5,190
|
242,621
|
|
Gain (loss) on disposition of investment
|
10,380
|
(26,128
)
|
-
|
|
|
|
|
|
|
Income (loss)
before income taxes
|
3,885,101
|
666,503
|
(3,849,773
)
|
|
|
|
|
|
|
Provision for
income taxes
|
(107,569
)
|
-
|
-
|
|
|
|
|
|
|
Net income
(loss)
|
3,777,532
|
666,503
|
(3,849,773
)
|
|
|
|
|
|
|
Dividends on
preferred stock
|
(790,811
)
|
(729,288
)
|
(568,821
)
|
|
Restructuring of
Series B Preferred
|
-
|
-
|
(2,141,980
)
|
|
|
|
|
|
|
Net income (loss)
applicable to common shareholders
|
$
2,986,721
|
$
(62,785
)
|
$
(6,560,574
)
|
|
|
|
|
|
|
Weighted average
shares, basic
|
19,353,000
|
19,151,000
|
17,375,000
|
|
Weighted average
shares, diluted
|
20,264,000
|
19,151,000
|
17,375,000
|
|
Basic earnings
(loss) per share
|
$
0.15
|
$
(0.00
)
|
$
(0.38
)
|
|
Diluted earnings
(loss) per share
|
$
0.15
|
$
(0.00
)
|
$
(0.38
)
|
PARK CITY GROUP, INC. AND SUBSIDIARIES
Consolidated Statements of Comprehensive Income
|
|
For the Years Ended June 30,
|
||
|
|
2017
|
2016
|
2015
|
|
|
|
|
|
|
Net income
(loss)
|
$
3,777,532
|
$
666,503
|
$
(3,849,773
)
|
|
Other
Comprehensive Income (Loss):
|
|
|
|
|
Unrealized loss on
marketable securities
|
-
|
(26,128
)
|
-
|
|
Reclassification
adjustment
|
-
|
26,128
|
-
|
|
Net income (loss)
on marketable securities
|
-
|
-
|
-
|
|
Comprehensive
income (loss)
|
$
3,777,532
|
$
666,503
|
$
(3,849,773
)
|
See
accompanying notes to consolidated financial
statements.
PARK CITY GROUP, INC. AND SUBSIDIARIES
|
|
Series
B
Preferred
Stock
|
Series
B-1
Preferred
Stock
|
Common
Stock
|
Additional Paid-In
|
Accumulated
|
|
|||
|
|
Shares
|
Amount
|
Shares
|
Amount
|
Shares
|
Amount
|
Capital
|
Deficit
|
Total
|
|
|
|
|
|
|
|
|
|
|
|
|
Balance, June 30,
2014
|
411,927
|
4,119
|
-
|
-
|
16,928,025
|
169,280
|
46,792,736
|
(36,347,054
)
|
10,619,081
|
|
|
|
|
|
|
|
|
|
|
|
|
Series B
Restructure
|
214,198
|
2,142
|
-
|
-
|
-
|
-
|
2,139,838
|
(2,141,980
)
|
-
|
|
Series B
Redemption
|
(750
)
|
(7
)
|
-
|
-
|
-
|
-
|
(7,493
)
|
-
|
(7,500
)
|
|
Stock issued
for:
|
|
|
|
|
|
|
|
|
|
|
Accrued
compensation
|
-
|
-
|
30,000
|
300
|
366,033
|
3,664
|
2,156,229
|
-
|
2,160,193
|
|
Cash
|
-
|
-
|
-
|
-
|
693,090
|
6,931
|
7,802,664
|
-
|
7,809,595
|
|
Charitable
Contribution
|
-
|
-
|
-
|
-
|
15,000
|
150
|
157,800
|
-
|
157,950
|
|
Preferred
Dividends-PIK
|
-
|
-
|
44,200
|
442
|
-
|
-
|
441,560
|
-
|
442,002
|
|
Acquisition
|
-
|
-
|
-
|
-
|
873,438
|
8,734
|
10,813,162
|
-
|
10,821,896
|
|
Preferred
Dividends-Declared
|
|
|
|
|
|
|
|
(568,821
)
|
(568,821
)
|
|
|
|
|
|
|
|
|
|
|
|
|
Net
loss
|
-
|
-
|
-
|
-
|
-
|
-
|
-
|
(3,849,773
)
|
(3,849,773
)
|
|
Balance, June 30,
2015
|
625,375
|
6,254
|
74,200
|
742
|
18,875,586
|
188,759
|
70,296,496
|
(42,907,628
)
|
27,584,623
|
|
|
|
|
|
|
|
|
|
|
|
|
Stock issued
for:
|
|
|
|
|
|
|
|
|
|
|
Accrued
compensation
|
-
|
-
|
40,000
|
400
|
320,770
|
3,208
|
2,084,133
|
-
|
2,087,741
|
|
Cash
|
-
|
-
|
-
|
-
|
23,528
|
235
|
199,613
|
-
|
199,848
|
|
Preferred
Dividends-PIK
|
-
|
-
|
66,013
|
660
|
-
|
-
|
659,470
|
-
|
660,130
|
|
Preferred
Dividends-Declared
|
-
|
-
|
-
|
-
|
-
|
-
|
-
|
(729,288
)
|
(729,288
)
|
|
Exercise of
Option/Warrant
|
-
|
-
|
-
|
-
|
9,429
|
94
|
32,908
|
-
|
33,002
|
|
|
|
|
|
|
|
|
|
|
|
|
Net
income
|
-
|
-
|
-
|
-
|
-
|
-
|
-
|
666,503
|
666,503
|
|
Balance, June 30,
2016
|
625,375
|
6,254
|
180,213
|
1,802
|
19,229,313
|
192,296
|
73,272,620
|
(42,970,413
)
|
30,502,559
|
|
|
|
|
|
|
|
|
|
|
|
|
Stock issued
for:
|
|
|
|
|
|
|
|
|
|
|
Accrued
compensation
|
-
|
-
|
30,000
|
300
|
120,791
|
1,208
|
1,081,850
|
-
|
1,083,358
|
|
Cash
|
-
|
-
|
-
|
-
|
29,067
|
291
|
223,175
|
-
|
223,466
|
|
Preferred
Dividends-PIK
|
-
|
-
|
75,646
|
757
|
-
|
-
|
755,715
|
-
|
756,472
|
|
Preferred
Dividends-Declared
|
-
|
-
|
-
|
-
|
-
|
-
|
-
|
(790,811
)
|
(790,811
)
|
|
Exercise of
Option/Warrant
|
-
|
-
|
-
|
-
|
44,650
|
446
|
155,829
|
-
|
156,275
|
|
|
|
|
|
|
|
|
|
|
|
|
Net
income
|
-
|
-
|
-
|
-
|
-
|
-
|
-
|
3,777,532
|
3,777,532
|
|
Balance, June 30,
2017
|
625,375
|
$
6,254
|
285,859
|
$
2,859
|
19,423,821
|
$
194,241
|
$
75,489,189
|
$
(39,983,692
)
|
$
35,708,851
|
See
accompanying notes to consolidated financial
statements.
PARK CITY GROUP, INC. AND SUBSIDIARIES
|
|
For
the Years Ended June 30,
|
||
|
|
2017
|
2016
|
2015
|
|
Cash flows from
operating activities:
|
|
|
|
|
Net income
(loss)
|
$
3,777,532
|
$
666,503
|
$
(3,849,773
)
|
|
Adjustments to
reconcile net income (loss) to net cash provided by (used
in)
operating
activities:
|
|
||
|
Depreciation
and amortization
|
486,024
|
507,446
|
768,165
|
|
Impairment
of intangibles
|
-
|
-
|
1,495,703
|
|
Bad
debt expense
|
345,700
|
68,140
|
186,780
|
|
Stock
compensation expense
|
1,266,805
|
1,010,312
|
2,760,329
|
|
Charitable
non-cash donations
|
-
|
-
|
157,950
|
|
Loss on short-term marketable securities
|
-
|
26,128
|
-
|
|
Gain on sale
of fixed assets
|
(10,380
)
|
-
|
-
|
|
Decrease (increase) in:
|
|
|
|
|
Trade receivables
|
(2,325,075
)
|
(1,975,517
)
|
710,302
|
|
Prepaids and other assets
|
(1,257,534
)
|
70,152
|
(501,957
)
|
|
Increase (decrease) in:
|
|
|
|
|
Accounts payable
|
(14,822
)
|
(236,810
)
|
(49,296
)
|
|
Accrued liabilities
|
355,136
|
(18,305
)
|
136,517
|
|
Deferred revenue
|
(366,248
)
|
385,174
|
(107,123
)
|
|
|
|
|
|
|
Net
cash provided by operating activities
|
2,257,138
|
503,223
|
1,707,597
|
|
|
|
|
|
|
Cash flows from
investing activities:
|
|
|
|
|
Cash from sale of marketable securities
|
-
|
4,612,908
|
-
|
|
Payments
received on notes receivable
|
-
|
-
|
300,000
|
|
Net
cash received in acquisition
|
-
|
-
|
22,119
|
|
Cash
advanced on Note Receivable
|
-
|
-
|
(2,559,460
)
|
|
Cash
from sale of property & equipment
|
13,000
|
-
|
-
|
|
Purchase
of property and equipment
|
(1,957,402
)
|
(80,987
)
|
(369,536
)
|
|
Capitalization of software costs
|
-
|
(182,942
)
|
-
|
|
Purchase of long-term investments
|
(6,300
)
|
(75,584
)
|
-
|
|
Purchase of marketable securities
|
-
|
(4,639,036
)
|
-
|
|
|
|
|
|
|
Net
cash used in investing activities
|
(1,950,702
)
|
(365,641
)
|
(2,606,877
)
|
|
|
|
|
|
|
Cash flows from
financing activities:
|
|
|
|
|
Proceeds
from employee stock plans
|
223,465
|
199,848
|
203,211
|
|
Proceeds
from exercises of options and warrants
|
156,176
|
33,002
|
-
|
|
Proceeds from issuance of note payable
|
1,824,617
|
-
|
172,795
|
|
Proceeds
from issuance of stock
|
-
|
-
|
7,606,384
|
|
Net
increase in lines of credit
|
350,000
|
-
|
1,300,000
|
|
Preferred
stock redemption
|
-
|
-
|
(7,500
)
|
|
Dividends
paid
|
(10,576
)
|
(10,575
)
|
(157,147
)
|
|
Payments
on notes payable
|
(239,500
)
|
(242,041
)
|
(245,450
)
|
|
|
|
|
|
|
Net
cash provided by (used in) financing activities
|
2,304,182
|
(19,766
)
|
8,872,293
|
|
|
|
|
|
|
Net increase in
cash and cash equivalents
|
2,610,618
|
117,816
|
7,973,013
|
|
|
|
|
|
|
Cash and cash
equivalents at beginning of period
|
11,443,388
|
11,325,572
|
3,352,559
|
|
|
|
|
|
|
Cash and cash
equivalents at end of period
|
$
14,054,006
|
$
11,443,388
|
$
11,325,572
|
|
|
|
|
|
|
Supplemental
Disclosure of Cash Flow Information
|
|
|
|
|
Cash paid for
income taxes
|
$
66,163
|
$
-
|
$
-
|
|
Cash paid for
interest
|
$
22,452
|
$
46,508
|
$
80,534
|
|
|
|
|
|
|
Supplemental
Disclosure of Non-Cash Investing and Financing
Activities
|
|
|
|
|
Preferred Stock to
pay accrued liabilities
|
$
300,000
|
$
400,000
|
$
300,000
|
|
Common Stock to pay
accrued liabilities
|
$
783,457
|
$
1,687,741
|
$
1,860,191
|
|
Dividends accrued
on preferred stock
|
$
790,811
|
$
729,288
|
$
568,821
|
|
Dividends paid with
preferred stock
|
$
756,473
|
$
660,130
|
$
442,002
|
|
Series B
restructure
|
$
-
|
$
-
|
$
2,141,980
|
|
Note payable for
long-term investment
|
$
-
|
$
396,000
|
$
-
|
See
accompanying notes to consolidated financial
statements.
Supplemental Disclosure of Non-Cash Investing and Financing
Activities, continued
On
June 30, 2015, the Company purchased 100% of the outstanding common
stock of ReposiTrak, Inc. The fair values of
ReposiTrak’s assets and liabilities at the date of
acquisition and the consideration paid, net of cash acquired, are
as follows:
|
Receivables
|
$
152,340
|
|
Prepaid
expense
|
17,500
|
|
Customer
relationships
|
1,314,000
|
|
Goodwill
|
16,077,953
|
|
Accounts
payable
|
(128,126
)
|
|
Deferred
revenue
|
(598,232
)
|
|
|
|
|
Net assets
acquired
|
16,835,435
|
|
|
|
|
Common stock
issued
|
10,821,897
|
|
Receivables
eliminated in consolidation
|
6,035,657
|
|
|
|
|
Cash received in
acquisition
|
$
22,119
|
See
accompanying notes to consolidated financial
statements.
PARK CITY GROUP, INC. AND SUBSIDIARIES
June 30, 2017 and June 30, 2016
|
NOTE 1.
|
DESCRIPTION OF BUSINESS AND ACQUISITION OF REPOSITRAK,
INC.
|
Summary of Business
The
Company is incorporated in the state of Nevada. The
Company has three principal subsidiaries, PC Group, Inc. (formerly,
Park City Group, Inc.), a Utah Corporation (98.76% owned), and Park
City Group, Inc., (formerly, Prescient Applied Intelligence, Inc.),
a Delaware Corporation (100% owned) and ReposiTrak, Inc., a Utah
corporation (100% owned). All intercompany transactions
and balances have been eliminated in consolidation.
The
Company designs, develops, markets and supports proprietary
software products. These products are designed for businesses
having multiple locations to assist in the management of business
operations on a daily basis and communicate results of operations
in a timely manner. In addition, the Company has built a consulting
practice for business improvement that centers on the
Company’s proprietary software products. The principal
markets for the Company's products are multi-store retail and
convenience store chains, branded food manufacturers, suppliers and
distributors, and manufacturing companies, which have operations in
North America, Europe, Asia and the Pacific
Rim.
As a result of the
acquisition of ReposiTrak, Inc. (“
ReposiTrak
”)
in June 2015, as more particularly described below, the Company
also provides food, pharmaceutical, and dietary supplement
retailers and suppliers with a robust cloud-based solution to help
protect their brands and remain in compliance with business records
and regulatory requirements, such as the Food Safety Modernization
Act (“
FSMA
”)
.
|
NOTE 2.
|
SIGNIFICANT ACCOUNTING POLICIES
|
Principles of Consolidation
The
financial statements presented herein reflect the consolidated
financial position of Park City Group, Inc. and subsidiaries,
including ReposiTrak and Prescient. All inter-company
transactions and balances have been eliminated in
consolidation.
Use of Estimates
The
preparation of consolidated financial statements in conformity with
U.S. generally accepted accounting principles requires management
to make estimates and assumptions that materially affect the
amounts reported in the consolidated financial
statements. Actual results could differ from these
estimates. The methods, estimates and judgments the
Company uses in applying its most critical accounting policies have
a significant impact on the results it reports in its financial
statements. The Securities and Exchange
Commission has defined the most critical accounting policies
as those that are most important to the portrayal of the
Company’s financial condition and results, and require the
Company to make its most difficult and subjective judgments, often
as a result of the need to make estimates of matters that are
inherently uncertain. Based on this definition, the
Company’s most critical accounting policies
include: income taxes, goodwill and other long-lived
asset valuations, revenue recognition, stock-based compensation,
and capitalization of software development costs.
Concentration of Credit Risk and Significant Customers
The
Company maintains cash in bank deposit accounts, which, at times,
may exceed federally insured limits. The Company has not
experienced any losses in such accounts and believes it is not
exposed to any significant credit risk on cash and cash
equivalents.
Financial
instruments, which potentially subject the Company to concentration
of credit risk, consist primarily of trade receivables. In the
normal course of business, the Company provides credit terms to its
customers. Accordingly, the Company performs ongoing evaluations of
its customers and maintains allowances for possible losses.
The provision is based on the overall composition of our
accounts receivable aging, our prior history of accounts receivable
write-offs, and our experience with specific customers. Other
factors indicating significant risk include customers that have
filed for bankruptcy or customers for which we have less payment
history to rely upon. We rely on historical trends of bad debt as a
percentage of total revenue and apply these percentages to the
accounts receivable which when realized have been within the range
of management's expectations. The Company does not require
collateral from its customers. We write off accounts
receivable when they are determined to be uncollectible. Changes in
the allowances for doubtful accounts are recorded as bad debt
expense and are included in general and administrative expense in
our consolidated financial statements.
The
Company's accounts receivable are derived from sales of products
and services primarily to customers operating multilocation retail
and grocery stores. Amounts that have been invoiced are recorded in
accounts receivable (current and long-term), and in deferred
revenue or revenue, depending on whether the revenue recognition
criteria have been met.
During the years ended June 30, 2017, the Company had one customer
that accounted for greater than 10% of accounts receivable.
Customer A had a balance of $403,000. During the years ended
June 30, 2016, there were two customers that accounted for greater
than 10% of accounts receivable. Customer B had a balance of
$343,000 and Customer C had a balance of $327,000.
During the years ended June 30, 2017 and 2016, there were no
customers that accounted for greater than 10% of total revenue.
During the year ended June 30, 2015, the Company had one customer,
ReposiTrak, Inc. (acquired on June 30, 2015) that accounted for
greater than 10% of total revenue.
Prepaid expense and other current assets
Prepaid expenses and other current assets include amounts for which
payment has been made but the services have not yet been
consumed. The Company’s prepaid expenses are made up
primarily of prepayments for hosted software applications used in
the Company’s operations, maintenance agreements on hardware
and software, and other miscellaneous amounts for insurance,
membership fees and professional fees. Prepaid expenses are
amortized on a pro-rata basis to various expense accounts as the
services are consumed typically by the passage of time or as the
prepaid service is used.
Depreciation and Amortization
Depreciation and
amortization of property and equipment is computed using the
straight line method based on the following estimated useful
lives:
|
|
Years
|
|
Furniture and
fixtures
|
5-7
|
|
Computer
equipment
|
3
|
|
Equipment under
capital leases
|
3
|
|
Long-term use
equipment
|
10
|
|
Leasehold
improvements
|
See
below
|
Leasehold
improvements are amortized over the shorter of the remaining lease
term or the estimated useful life of the improvements.
Amortization of
intangible assets are computed using the straight-line method based
on the following estimated useful lives:
|
|
Years
|
|
Customer
relationships
|
10
|
|
Acquired developed
software
|
5
|
|
Developed
software
|
3
|
|
Goodwill
|
See
below
|
Goodwill and
intangible assets deemed to have indefinite lives are subject to
annual impairment tests. Other intangible assets are amortized over
their useful lives.
Warranties
The
Company offers a limited warranty against software defects.
Customers who are not completely satisfied with their software
purchase may attempt to be reimbursed for their purchases outside
the warranty period. For the years ending June 30, 2017, 2016
and 2015, the Company did not incur any expense associated with
warranty claims.
Revenue Recognition
The
Company recognizes revenue when all of the following
conditions are satisfied: (i) there is persuasive evidence of an
arrangement, (ii) the service has been provided to the customer,
(iii) the collection of our fees is probable and (iv) the amount of
fees to be paid by the customer is fixed or
determinable.
The
Company recognizes subscription, hosting, premium support, and
maintenance revenue ratably over the length of the agreement
beginning on the commencement dates of each agreement or when
revenue recognition conditions are satisfied. Revenue
from license and professional services agreements are recognized as
delivered.
Amounts that have
been invoiced are recorded in accounts receivable and in deferred
revenue or revenue, depending on whether the revenue recognition
criteria have been met.
Agreements with
multiple deliverables such as subscriptions, support, and
professional services, are accounted for separately if the
deliverables have standalone value upon
delivery. Subscription services have standalone value as
the services are typically sold separately. When
considering whether professional services have standalone value,
the Company considers the following factors: (i) availability of
services from other vendors, (ii) the nature and timing of
professional services, and (iii) sales of similar services sold
separately. Multiple deliverable arrangements are
separated into units of accounting and the total contract
consideration is allocated to each unit based on relative selling
prices.
Software Development Costs
The
Company accounts for research costs of computer software to be
sold, leased or otherwise marketed as expense until technological
feasibility has been established for the product. Once
technological feasibility is established, all software costs are
capitalized until the product is available for general release to
customers. Judgment is required in determining when technological
feasibility of a product is established. We have determined that
technological feasibility for our software products is reached
shortly after a working prototype is complete and meets or exceeds
design specifications including functions, features, and technical
performance requirements. Costs incurred after
technological feasibility is established have been and will
continue to be capitalized until such time as when the product or
enhancement is available for general release to
customers.
During
2017, 2016 and 2015 capitalized development costs of 45,736, $0 and
$0, respectively, were amortized into expense. The Company
amortizes its developed and purchased software on a straight-line
basis over three and five years, respectively.
Research and Development Costs
Research and
development costs include personnel costs, engineering, consulting,
and contract labor and are expensed as incurred for software that
has not achieved technological feasibility.
Advertising Costs
Advertising is
expensed as incurred. Advertising costs were approximately
$110,600, $113,000, and $21,000 for the years ended June 30, 2017,
2016 and 2015, respectively.
Income Taxes
The
Company recognizes deferred tax liabilities and assets for the
expected future tax consequences of temporary differences between
tax bases and financial reporting bases of other assets and
liabilities.
Earnings Per Share
Basic
net income or loss per common share (“
Basic EPS
”) excludes
dilution and is computed by dividing net income or loss by the
weighted average number of common shares outstanding during the
period. Diluted net income or loss per common share
(“
Diluted
EPS
”) reflects the potential dilution that could
occur if stock options or other contracts to issue shares of common
stock were exercised or converted into common stock. The
computation of Diluted EPS does not assume exercise or conversion
of securities that would have an anti-dilutive effect on net income
(loss) per common share.
For
the year ended June 30, 2016 and 2015 warrants to purchase
1,416,749 and 1,426,178 shares of common stock, respectively, were
not included in the computation of diluted EPS due to the
anti-dilutive effect. Warrants to purchase shares of
common stock were outstanding at prices ranging $3.50 from to $10
per share at June 30, 2017.
The
following table presents the components of the computation of basic
and diluted earnings per share for the periods
indicated:
|
|
Year ended June 30,
|
||
|
|
2017
|
2016
|
2015
|
|
Numerator
|
|
|
|
|
Net income (loss)
applicable to common shareholders
|
$
2,986,721
|
$
(62,785
)
|
$
(6,560,574
)
|
|
|
|
|
|
|
Denominator
|
|
|
|
|
Weighted average
common shares outstanding, basic
|
19,353,000
|
19,151,000
|
17,375,000
|
|
Warrants to
purchase common stock
|
911,000
|
-
|
-
|
|
|
|
|
|
|
Weighted average
common shares outstanding, diluted
|
20,264,000
|
19,151,000
|
17,375,000
|
|
|
|
|
|
|
Net income (loss)
per share
|
|
|
|
|
Basic
|
$
0.15
|
$
(0.00
)
|
$
(0.38
)
|
|
Diluted
|
$
0.15
|
$
(0.00
)
|
$
(0.38
)
|
Stock-Based Compensation
The
Company recognizes the cost of employee services received in
exchange for awards of equity instruments based on the grant-date
fair value of those awards. The Company records
compensation expense on a straight-line basis. The fair
value of options granted are estimated at the date of grant using a
Black-Scholes option pricing model with assumptions for the
risk-free interest rate, expected life, volatility, dividend yield
and forfeiture rate.
Cash and Cash Equivalents
The
Company considers all highly liquid investments purchased with an
original maturity of three months or less to be cash equivalents.
Cash and cash equivalents are stated at fair value.
Marketable Securities
Management
determines the appropriate classification of marketable securities
at the time of purchase and reevaluates such determination at each
balance sheet date. Securities are classified as available for sale
and are carried at fair value, with the change in unrealized gains
and losses, net of tax, reported as a separate component on the
consolidated statements of comprehensive income. Fair value is
determined based on quoted market rates when observable or
utilizing data points that are observable, such as quoted prices,
interest rates and yield curves. The cost of securities
sold is based on the specific-identification method. Interest on
securities classified as available for sale is also included as a
component of interest income.
Fair Value of Financial Instruments
The
Company's financial instruments consist of cash, cash equivalents,
receivables, payables, accruals and notes payable. The
carrying amount of cash, cash equivalents, receivables, payables
and accruals approximates fair value due to the short-term nature
of these items. The notes payable also approximate fair
value based on evaluations of market interest rates.
Reclassifications
Certain prior-year
amounts have been reclassified to conform with the current year's
presentation.
|
NOTE 3.
|
INVESTMENTS
|
Investee companies
that are not consolidated, but over which the Company exercises
significant influence, are accounted for under the equity method of
accounting. Whether or not the Company exercises significant
influence with respect to an investee depends on an evaluation of
several factors including, among others, representation on the
investee company’s board of directors and ownership level,
which is generally a 20% to 50% interest in the voting securities
of the investee company. Under the equity method of accounting, an
investee company’s accounts are not reflected within the
Company’s consolidated balance sheets and statements of
operations; however, the Company’s share of the earnings or
losses of the investee company is reflected in the consolidated
statements of operations. The Company’s carrying
value in an equity method investee company is reflected in the
caption ‘‘Investments’’ in the
Company’s consolidated balance sheets.
As of
June 30, 2017, investments represent a 36% ownership in a
privately-held corporation, and represents initial (January 2016)
and subsequent investments. There were nominal earnings for the
year ended June 30, 2017.
When
the Company’s carrying value in an equity method investee
company is reduced to zero, no further losses are recorded in the
Company’s consolidated financial statements unless the
Company guaranteed obligations of the investee company or has
committed additional funding. When the investee company
subsequently reports income, the Company will not record its share
of such income until it equals the amount of its share of losses
not previously recognized.
|
NOTE 4.
|
RECEIVABLES
|
Accounts
receivable consist of the following:
|
|
2017
|
2016
|
|
Accounts
receivable
|
$
4,401,377
|
$
3,123,774
|
|
Allowance for
doubtful accounts
|
(392,250
)
|
(75,000
)
|
|
|
$
4,009,127
|
$
3,048,774
|
Accounts
receivable consist of trade accounts receivable and unbilled
amounts recognized as revenue during the year for which invoicing
occurs subsequent to year-end. Amounts that have been
invoiced are recorded in accounts receivable and in deferred
revenue or revenue, depending on whether the revenue recognition
criteria have been met.
|
NOTE 5.
|
PROPERTY AND EQUIPMENT
|
Property and
equipment are stated at cost and consist of the following at June
30:
|
|
2017
|
2016
|
|
Computer
equipment
|
$
2,951,179
|
$
3,350,390
|
|
Furniture and
equipment
|
1,634,081
|
260,574
|
|
Leasehold
improvements
|
245,835
|
231,782
|
|
|
4,831,095
|
3,842,746
|
|
Less accumulated
depreciation and amortization
|
(2,715,818
)
|
(3,373,363
)
|
|
|
$
2,115,277
|
$
469,383
|
Depreciation
expense for the years ended June 30, 2017 and 2016 was $308,887 and
$376,046, respectively.
|
NOTE 6.
|
CAPITALIZED SOFTWARE COSTS
|
Capitalized
software costs consist of the following at June 30:
|
|
2017
|
2016
|
|
Capitalized
software costs
|
$
2,626,070
|
$
2,626,070
|
|
Less accumulated
amortization
|
(2,488,865
)
|
(2,443,128
)
|
|
|
$
137,205
|
$
182,942
|
Amortization
expense for the years ended June 30, 2017 and 2016 was $45,737 and
$0, respectively.
|
NOTE 7.
|
ACQUISITION RELATED INTANGIBLE ASSETS, NET
|
Customer
relationships consist of the following at June 30:
|
|
2017
|
2016
|
|
Customer
relationships
|
$
5,537,161
|
$
5,537,161
|
|
Less accumulated
amortization
|
(4,485,961
)
|
(4,354,561
)
|
|
|
$
1,051,200
|
$
1,182,600
|
Amortization
expense for the years ended June 30, 2017 and 2016 was $131,400 and
$131,400, respectively.
Estimated
aggregate amortization expense per year are as
follows:
|
Years ending June
30:
|
|
|
2018
|
131,400
|
|
2019
|
131,400
|
|
2020
|
131,400
|
|
2021
|
131,400
|
|
Thereafter
|
525,600
|
|
NOTE 8.
|
ACCRUED LIABILITIES
|
Accrued
liabilities consist of the following at June 30, 2017 and
2016:
|
|
2017
|
2016
|
|
Accrued stock-based
compensation
|
$
1,054,828
|
$
768,055
|
|
Accrued
compensation
|
296,553
|
336,957
|
|
Accrued other
liabilities
|
265,521
|
19,872
|
|
Accrued
taxes
|
261,561
|
194,560
|
|
Accrued
dividends
|
206,522
|
182,759
|
|
|
$
2,084,980
|
$
1,502,203
|
|
NOTE 9.
|
NOTES PAYABLE
|
The
Company had the following notes payable obligations at June 30,
2017 and 2016:
|
Notes Payable:
|
2017
|
2016
|
|
Note payable to a
bank, due in monthly installments of $7,860 bearing interest at
3.73% due February 9, 2017, this note is a conversion of a
multi-advance note payable initially put in place on February 19,
2012, secured by related capital equipment purchases.
|
-
|
62,445
|
|
Note payable to a
bank, due in monthly installments of $7,860 bearing interest at
4.17% due August 26, 2018, this note is a conversion of a
multi-advance note payable initially put in place on August 26,
2013, secured by related capital equipment purchases.
|
99,751
|
187,799
|
|
Note payable to a
bank, due in monthly installments of $4,932 bearing interest at
4.91% due March 18, 2018, secured by related capital equipment
purchases.
|
43,475
|
98,980
|
|
Note payable to an
entity, due in monthly installments of $4,009 bearing interest at
4.00% due July 1, 2019, secured by long-term
investments.
|
348,076
|
381,228
|
|
Note payable to a
bank, 12 month draw period interest only 2% + LIBOR, monthly
installments set after draw period, due March 31, 2021, secured by
related capital equipment purchase, NBV of approximately
$170,000
|
206,996
|
-
|
|
Note payable to a
bank, due in quarterly installments of $53,996 bearing interest at
4.21% balloon payment of $800,000 due July 28, 2022, secured by
related capital equipment, NBV of approximately
$1,550,000
|
1,617,271
|
-
|
|
|
$
2,315,569
|
$
730,452
|
|
Less current
portion notes payable
|
(318,616
)
|
(239,199
)
|
|
|
$
1,996,953
|
$
491,253
|
Maturities of
notes payable at June 30, 2017 are as follows:
|
Year ending June 30:
|
|
|
|
|
|
|
2018
|
|
|
$
|
318,616
|
|
|
2019
|
|
|
$
|
282,807
|
|
|
2020
|
|
|
$
|
269,932
|
|
|
2021
|
|
|
$
|
263,646
|
|
|
2022
|
|
|
$
|
1,180,568
|
|
|
NOTE 10.
|
LINES OF CREDIT
|
The
Company’s lines of credit with a bank has an annual interest
rate of 2.5% plus the greater of zero percent or LIBOR and allows
for borrowings up to $6,000,000, $1,500,000 unsecured and
$4,500,000 secured by accounts receivable and certain deposit
accounts. The line of credit is scheduled to mature on
December 31, 2018. The balance on the line of credit was $2,850,000
and $2,500,000 at June 30, 2017 and June 30, 2016,
respectively.
|
NOTE 11.
|
DEFERRED REVENUE
|
Deferred revenue
consisted of the following at June 30:
|
|
2017
|
2016
|
|
Subscription
|
$
2,083,070
|
$
2,221,264
|
|
Other
|
267,776
|
495,830
|
|
|
$
2,350,846
|
$
2,717,094
|
|
NOTE 12.
|
INCOME TAXES
|
Deferred taxes are
provided on a liability method whereby deferred tax assets are
recognized for deductible temporary differences and operating loss
and tax credit carry forwards and deferred tax liabilities are
recognized for taxable differences. Temporary
differences are the differences between the reported amounts of
assets and liabilities and their tax bases. Deferred tax
assets are reduced by a valuation allowance when, in the opinion of
management, it is more likely than not that some portion or all of
the deferred tax assets will not be realized. Deferred
tax assets and liabilities are adjusted for the effects of changes
in tax laws and rates on the date of enactment.
Net
deferred tax liabilities consist of the following components at
June 30:
|
|
2017
|
2016
|
|
Deferred tax
assets:
|
|
|
|
NOL
carryover
|
$
48,122,516
|
$
48,359,356
|
|
Allowance for bad
debts
|
152,978
|
29,250
|
|
Accrued
expense
|
365,370
|
254,971
|
|
Deferred
revenue
|
-
|
1,059,667
|
|
Deferred tax
liabilities:
|
|
|
|
Depreciation
|
(282,975
)
|
(88,495
)
|
|
Amortization
|
(335,797
)
|
(184,989
)
|
|
Valuation
allowance
|
(48,022,091
)
|
(49,429,760
)
|
|
Net deferred tax
asset
|
$
-
|
$
-
|
The
income tax provision differs from the amounts of income tax
determined by applying the US federal income tax rate to pretax
income from continuing operations for the years ended June 30, 2017
and 2016 due to the following:
|
|
2017
|
2016
|
|
Book income
(loss)
|
$
1,473,237
|
$
259,941
|
|
Stock for
services
|
(163,265
)
|
134,721
|
|
Change in accrual
stock
|
110,398
|
(394,664
)
|
|
Life
insurance
|
26,438
|
26,438
|
|
Meals &
entertainment
|
10,499
|
10,785
|
|
Change in deferred
revenue
|
-
|
383,528
|
|
Change in allowance
for doubtful accounts
|
123,728
|
(7,410
)
|
|
Change in
depreciation
|
(398,784
)
|
103,589
|
|
Loss on sale of assets
|
(18,852
)
|
-
|
|
NOL
utilization
|
(1,163,524
)
|
-
|
|
Valuation
allowance
|
-
|
(516,928
)
|
|
|
$
-
|
$
-
|
At
June 30, 2017, the Company had net operating loss carry-forwards of
approximately $123,391,100 that may be offset against past and
future taxable income from the year 2013 through
2035. No tax benefit has been reported in the June 30,
2017 consolidated financial statements since the potential tax
benefit is offset by a valuation allowance of the same
amount.
Due to
the change in ownership provisions of the Tax Reform Act of 1986,
net operating loss carryforwards for Federal income tax reporting
purposes are subject to annual limitations. In January
2009 the Company acquired Prescient Applied Intelligence, Inc.,
which had significant net operating loss carry-forwards. Due to
change in ownership, Prescient’s net operating loss
carryforwards may be limited as to use in future years. The
limitation will be determined on a year-to-year basis.
The
Company determines whether it is more likely than not that a tax
position will be sustained upon examination based upon the
technical merits of the position. If the
more-likely-than-not threshold is met, the Company measures the tax
position to determine the amount to recognize in the financial
statements. The Company performed a review of its
material tax positions in accordance with these recognition and
measurement standards.
The
Company has concluded that there are no significant uncertain tax
positions requiring disclosure, and there are not material amounts
of unrecognized tax benefits.
The
Company includes interest and penalties arising from the
underpayment of income taxes in the consolidated statements of
operations in the provision for income taxes. As of June
30, 2017, the Company had no accrued interest or penalties related
to uncertain tax positions.
The
Company files income tax returns in the U.S. federal jurisdiction
and various state jurisdictions. With few exceptions, the Company
is no longer subject to U.S. federal, state and local income tax
examinations by tax authorities for years before June 30,
2013.
|
NOTE 13.
|
COMMITMENTS AND CONTINGENCIES
|
Operating Leases
In
September 2012, the Company entered into an office lease at 299 So.
Main Street, Suite 2370, Salt Lake City, Utah, 84111, providing for
the lease of approximately 5,300 square feet for a period of seven
years, commencing on November 1, 2012. The monthly rent
is $13,122.
In February 2017,
the Company amended its office lease, as part of the amendment the
Company relocated to 6,700 square feet in Suite 2225. The new
monthly rent is $16,843.
Minimum future
rental payments under the non-cancelable operating leases are as
follows:
|
Year ending June
30:
|
|
|
2018
|
$
275,709
|
|
2019
|
$
163,016
|
|
2020
|
$
-
|
|
2021
|
$
-
|
|
2022
|
$
-
|
From
time to time the Company may enter into or exit from diminutive
operating lease agreements for equipment such as copiers, temporary
back up servers, etc. These leases are not of a material amount and
thus will not in the aggregate have a material adverse effect on
our business, financial condition, results of operation or
liquidity.
|
NOTE 14.
|
EMPLOYEE BENEFIT PLAN
|
The
Company offers an employee benefit plan under Benefit Plan Section
401(k) of the Internal Revenue Code. Employees who have
attained the age of 18 are eligible to participate. The
Company, at its discretion, may match employee’s
contributions at a percentage determined annually by the Board of
Directors. The Company does not currently match
contributions. There were no expenses for the years
ended June 30, 2017, 2016, and 2015.
|
NOTE 15.
|
STOCKHOLDERS EQUITY
|
Officers and Directors Stock Compensation
Effective November
2008, the Board of Directors approved the following compensation
for directors who are not employed by the Company:
●
Annual
cash compensation of $10,000 payable at the rate of $2,500 per
quarter. The Company has the right to pay this amount in the form
of shares of the Company’s common stock.
●
Upon
appointment, outside independent directors receive a grant of
$150,000 payable in shares of the Company’s restricted Common
Stock calculated based on the market value of the shares of Common
Stock on the date of grant. The shares vest ratably over a
five-year period.
●
Reimbursement of
all travel expenses related to performance of Directors’
duties on behalf of the Company.
Officers, Key Employees, Consultants and Directors Stock
Compensation.
In
January 2013, the Board of Directors approved the Second Amended
and Restated the 2011 Stock Plan (the “
Amended 2011 Plan
”), which
Amended 2011 Plan was approved by shareholders on March 29,
2013. Under the terms of the Amended 2011 Plan, all
employees, consultants and directors of the Company are eligible to
participate. The maximum aggregate number of shares of
common stock that may be granted under the 2011 Plan was increased
from 250,000 shares to 550,000 shares. A Committee of
independent members of the Company’s Board of Directors
administers the 2011 Plan. The exercise price for each
share of common stock purchasable under any incentive stock option
granted under the 2011 Plan shall be not less than 100% of the fair
market value of the common stock, as determined by the stock
exchange on which the common stock trades on the date of
grant. If the incentive stock option is granted to a
shareholder who possesses more than 10% of the Company's voting
power, then the exercise price shall be not less than 110% of the
fair market value on the date of grant. Each option
shall be exercisable in whole or in installments as determined by
the Committee at the time of the grant of such
options. All incentive stock options expire after 10
years. If the incentive stock option is held by a
shareholder who possesses more than 10% of the Company's voting
power, then the incentive stock option expires after five
years. If the option holder is terminated, then the
incentive stock options granted to such holder expire no later than
three months after the date of termination. For option
holders granted incentive stock options exercisable for the first
time during any fiscal year and in excess of $100,000 (determined
by the fair market value of the shares of common stock as of the
grant date), the excess shares of common stock shall not be deemed
to be purchased pursuant to incentive stock options.
During
the year ended June 30, 2017 and 2016 the Company issued 37,634 and
37,729 shares to its directors and 112,224 and 278,000 shares to
employees and consultants, respectively under these plans, 115,596
and 311,538, respectively are included in the rollforward of
Restricted Stock units below.
Restricted Stock Units
|
|
Restricted Stock Units
|
Weighted Average Grant Date Fair Value ($/share)
|
|
|
|
|
|
Outstanding at
July 1, 2015
|
1,350,970
|
$
5.51
|
|
Granted
|
48,228
|
10.51
|
|
Vested and
issued
|
(311,538
)
|
5.10
|
|
Forfeited
|
(36,516
)
|
6.51
|
|
Outstanding at
June 30, 2016
|
1,051,144
|
5.82
|
|
Granted
|
73,625
|
10.69
|
|
Vested and
issued
|
(115,596
)
|
6.28
|
|
Forfeited
|
(26,560
)
|
10.23
|
|
Outstanding at
June 30, 2017
|
982,613
|
$
6.01
|
The number
of restricted stock units outstanding at June 30, 2017 included
25,386 units that have vested but for which shares of common stock
had not yet been issued pursuant to the terms of the
agreement.
As of June
30, 2017, there was approximately $5.9 million of unrecognized
stock-based compensation expense under our equity compensation
plans, which is expected to be recognized on a straight-line basis
over a weighted average period of 4.6 years.
Warrants
Outstanding
warrants were issued in connection with private placements of the
Company's common stock and with the Series B Preferred Restructure.
The following table summarizes information about fixed stock
warrants outstanding at June 30, 2017:
|
|
Warrants Outstanding
at June 30, 2017
|
Warrants Exercisable
at June 30, 2017
|
|||
|
Range of
exercise prices
|
Number
Outstanding
|
Weighted average
remaining contractual life (years)
|
Weighted average exercise price
|
Number
exercisable
|
Weighted average
exercise price
|
|
$
3.45 – 4.00
|
1,271,618
|
2.32
|
$
3.94
|
1,271,618
|
$
3.94
|
|
$
6.45 – 10.00
|
100,481
|
1.49
|
$
7.29
|
100,481
|
$
7.29
|
|
|
1,372,099
|
2.26
|
$
4.18
|
1,372,099
|
$
2.26
|
Preferred Stock
The
Company’s certificate of incorporation currently authorizes
the issuance of up to 30,000,000 shares of ‘blank
check’ preferred stock with designations, rights, and
preferences as may be determined from time to time by the
Company’s Board of Directors, of which 700,000 shares are
currently designated as Series B Preferred Stock
(“
Series B
Preferred
”) and 550,000 shares are designated as
Series B-1 Preferred Stock (“
Series B-1 Preferred
”). As
of June 30, 2017, a total of 625,375 shares of Series B Preferred
and 285,859 shares of Series B-1 Preferred were issued and
outstanding. Both classes of Series B Preferred Stock pay
dividends at a rate of 7% per annum if paid by the Company in cash,
or 9% if paid by the Company in PIK Shares, the Company may elect
to pay accrued dividends on outstanding shares of Series B
Preferred in either cash or by the issuance of additional shares of
Series B Preferred (“
PIK
Shares
”).
During
the year ended June 30, 2017, the Company issued 75,646 shares for
dividends in kind and 30,000 shares in satisfaction of an
accrued bonus payable to the Company's Chief Executive
Officer.
|
NOTE 16.
|
REPOSITRAK
|
On
June 30, 2015, the Company consummated the acquisition of 100% of
the outstanding capital stock of ReposiTrak, Inc. The
accompanying consolidated financial statements of the Company for
the year ended June 30, 2015 contain the results of operations of
ReposiTrak from June 30, 2015. We issued 873,438 shares
of our common stock in connection with this
acquisition.
Unaudited
pro-forma results of operations for the twelve months ended June
30, 2015, as though ReposiTrak had been acquired as of July 1,
2014, are as follows:
|
|
Three
Months Ended
|
|
|||
|
|
Sep
30,
2014
|
Dec
31,
2014
|
Mar
31,
2015
|
Jun
30,
2015
|
Year
Ended
2015
|
|
Revenue
|
$
2,826,813
|
$
2,932,825
|
$
2,870,646
|
$
2,941,511
|
$
11,571,795
|
|
Loss from
Operations
|
(1,046,986
)
|
(1,290,524
)
|
(1,302,437
)
|
(3,222,538
)
|
(6,862,485
)
|
|
Net
Loss
|
(1,049,834
)
|
(1,317,510
)
|
(1,317,858
)
|
(3,241,545
)
|
(6,926,747
)
|
|
Net Loss Applicable
to Common Shareholders
|
(1,204,307
)
|
(1,471,983
)
|
(3,595,537
)
|
(3,365,721
)
|
(9,637,548
)
|
|
Basic and Diluted
EPS
|
(0.07
)
|
(0.08
)
|
(0.20
)
|
(0.18
)
|
(0.53
)
|
|
NOTE 17.
|
RECENT ACCOUNTING PRONOUNCEMENTS
|
In January 2017, the FASB issued ASU
2017-04,
Intangibles—Goodwill and
Other (Topic 350), Simplifying the Test for Goodwill
Impairment.
The amendment
in this Update simplify how an entity is required to test goodwill
for impairment by eliminating Step 2 from the goodwill impairment
test. An entity should apply the amendments in this Update on a
prospective basis In January 2017, the FASB issued ASU 2017-04,
Intangibles—Goodwill and Other (Topic 350), Simplifying the
Test for Goodwill Impairment. The amendment in this Update simplify
how an entity is required to test goodwill for impairment by
eliminating Step 2 from the goodwill impairment test. An entity
should apply the amendments in this Update on a prospective basis.
The Company notes that this guidance applies to its reporting
requirements and will implement the new guidance
accordingly.
In
August 2016, the FASB issued ASU 2016-15, Statement of Cash Flows
(Topic 230): Classification of Certain Cash Receipts and Cash
Payments. Historically, there has been a diversity in practice in
how certain cash receipts/payments are presented and classified in
the statement of cash flows under Topic 230. To reduce the existing
diversity in practice, this update addresses multiple cash flow
issues. The amendments in this update are effective for fiscal
years beginning after December 15, 2017, and interim periods within
those fiscal years. Early adoption is permitted. The Company notes
that this guidance applies to its reporting requirements and will
implement the new guidance accordingly.
Through December 2016, the Financial Accounting
Standards Board ("FASB") issued ASU 2014-09 (ASC Topic 606),
Revenue from Contracts with Customers, ASU 2015-14 (ASC Topic 606)
Revenue from Contracts with Customers, Deferral of the Effective
Date, ASU 2016-10 (ASC Topic 606) Revenue from Contracts with
Customers, Identifying Performance Obligations and Licensing, ASU
2016-12 (ASC Topic 606) Revenue from Contracts with Customers,
Narrow Scope Improvements and Practical Expedients, and ASU 2016-20
(ASC Topic 606) Technical Corrections and Improvements to Topic
606, Revenue from Contracts with Customers, respectively. ASC
Topic 606 outlines a single comprehensive model for entities to use
in accounting for revenue arising from contracts with customers and
supersedes most current revenue recognition guidance, including
industry specific guidance. It also requires entities to disclose
both quantitative and qualitative information that enable financial
statements users to understand the nature, amount, timing, and
uncertainty of revenue and cash flows arising from contracts with
customers. The amendments in these ASUs are effective for the
Company’s fiscal year starting July 1, 2018. The two
permitted transition methods under the new standard are the full
retrospective method, in which case the standard would be applied
to each prior reporting period presented, or the modified
retrospective method, in which case the cumulative effect of
applying the standard would be recognized at the date of initial
application. The Company currently anticipates adopting the
standard using the full retrospective method. We are in the process
of completing our analysis on the impact this guidance will have on
our Consolidated Financial Statements and related disclosures, as
well as identifying the required changes to our policies, processes
and controls. The Company is still conducting its assessment and
will continue to evaluate the impact of this ASU on our financial
position and results of operation.
In
January 2017, the FASB issued ASU 2017-04,
Intangibles—Goodwill and Other (Topic
350), Simplifying the Test for Goodwill Impairment.
The
amendment in this Update simplify how an entity is required to test
goodwill for impairment by eliminating Step 2 from the goodwill
impairment test. An entity should apply the amendments in this
Update on a prospective basis In January 2017, the FASB issued ASU
2017-04, Intangibles—Goodwill and Other (Topic 350),
Simplifying the Test for Goodwill Impairment. The amendment in this
Update simplify how an entity is required to test goodwill for
impairment by eliminating Step 2 from the goodwill impairment test.
An entity should apply the amendments in this Update on a
prospective basis. The Company notes that this guidance applies to
its reporting requirements and will implement the new guidance
accordingly and does not expect the implementation to have a
material impact on its financial position or results of
operations.
In
August 2016, the FASB issued ASU 2016-15, Statement of Cash Flows
(Topic 230): Classification of Certain Cash Receipts and Cash
Payments. Historically, there has been a diversity in practice in
how certain cash receipts/payments are presented and classified in
the statement of cash flows under Topic 230. To reduce the existing
diversity in practice, this update addresses multiple cash flow
issues. The amendments in this update are effective for fiscal
years beginning after December 15, 2017, and interim periods within
those fiscal years. Early adoption is permitted. The Company notes
that this guidance applies to its reporting requirements and will
implement the new guidance accordingly
and does not expect
the implementation to have a material impact on its financial
position or results of operations.
In
March 2016, the FASB issued ASU 2016-09 (ASC Topic 718), Stock
Compensation—Improvements to Employee Share-Based Payment
Accounting. The amendments in this ASU are intended to
simplify several areas of accounting for share-based compensation
arrangements, including the income tax consequences, classification
on the consolidated statement of cash flows and treatment of
forfeitures. The amendments in this ASU are effective for annual
periods beginning after December 15, 2016, and interim periods
within those annual periods. Early adoption is permitted. The
Company is in the process of assessing the impact, if any, of this
ASU on its consolidated financial statements.
In
February 2016, the FASB issued ASU 2016-02 (ASC Topic 842), Leases.
The ASU amends a number of aspects of lease accounting, including
requiring lessees to recognize operating leases with a term greater
than one year on their balance sheet as a right-of-use asset and
corresponding lease liability, measured at the present value of the
lease payments. The amendments in this ASU are effective for fiscal
years beginning after December 15, 2018, including interim
periods within those fiscal years. Early adoption is permitted. The
Company is in the process of assessing the impact on its
consolidated financial statements.
In
April 2015 and August 2015, the FASB issued ASU 2015-03 (ASC
Subtopic 835-30),
Interest-Imputation of Interest: Simplifying
the Presentation of Debt Issuance Costs
and ASU
2015-15 (ASC Subtopic 835-30),
Presentation and Subsequent Measurement of
Debt Issuance Costs Associated with Line-of-Credit Arrangements-
Amendments to SEC Paragraphs Pursuant to Staff Announcement at
June 18, 2015 EITF Meeting,
respectively.
The ASUs require that debt issuance costs related to a recognized
debt liability, with the exception of those related to
line-of-credit arrangements, be presented in the balance sheet as a
direct deduction from the carrying amount of that debt liability.
The amendments in these ASUs are effective for fiscal years, and
interim periods within those years, beginning after
December 15, 2015. Early adoption is permitted for financial
statements that have not been previously issued. The adoption of
this new guidance is not expected to have a material impact on the
Company's consolidated financial statements and
disclosures.
|
NOTE 18.
|
RELATED PARTY TRANSACTIONS
|
Series B Restructuring
On
February 4, 2015, holders of the Company’s Series B
Convertible Preferred Stock (“
Series B Preferred
”), consisting
of Randall K. Fields, the Company’s Chief Executive Officer,
his spouse, and Robert W. Allen, a director of the Company (the
“
Holders
”),
entered into a restructuring agreement (the “
Restructuring Agreement
”),
pursuant to which the Holders consented to the filing of an
amendment (the “
Series B
Amendment
”) to the Certificate of Designation of the
Relative Rights, Powers and Preference of the Series B Preferred
(the “
Series B Certificate
of Designation
”), pursuant to which (i) the rate at
which the Series B Preferred accrues dividends was lowered to 7%
per annum if paid by the Company in cash, or 9% if paid by the
Company in PIK Shares (as defined below), (ii) the Company may now
elect to pay accrued dividends on outstanding shares of Series B
Preferred in either cash or by the issuance of additional shares of
Series B Preferred (“
PIK
Shares
”), (iii) the conversion feature of the Series B
Preferred was eliminated, and (iv) the number of shares of the
Company's preferred stock designated as Series B Preferred was
increased from 600,000 to 900,000 shares (the “
Series B Restructuring
”). In
consideration for the Series B Restructuring, the Company issued to
the Holders: (y) an aggregate of 214,198 additional shares of
Series B Preferred, which shares had a stated value equal to the
amount that, but for the Series B Restructuring, would have been
paid to the Holders as dividends over the next five years
(“
Additional
Shares
”), and (z) five-year warrants to purchase an
aggregate of 1,085,068 shares of common stock for $4.00 per share
(“
Series B
Warrants
”), an amount and per share purchase price
equal to what the Holders would otherwise be entitled to receive
upon conversion of their shares of Series B Preferred
(“
Warrant
Shares
”).
The
terms of the Series B Restructuring were amended on March 31,
2015 as follows: (i) the Series B Certificate of Designation was
further amended (the “
Second Series B Amendment
”) to
(x) reduce the number of shares of the Company’s preferred
stock designated thereunder from 900,000 to 700,000, (y) require
that, should the Company pay dividends on the Series B Preferred in
PIK Shares, shares Series B-1 Preferred will be issued, rather than
shares of Series B Preferred, and (z) in the event any Holder
elects to exercise a Series B Warrant, one share of Series B
Preferred will be automatically converted into one share of Series
B-1 Preferred for every 2.5 Warrant Shares received by such Holder;
and (ii) the Restructuring Agreement was amended to substitute the
Additional Shares for shares of Series B-1 Preferred. The Second
Series B Amendment was filed with the Nevada Secretary of State on
March 31, 2015.
The
Company issued 58,103 and 7,910 PIK Shares to Messrs. Fields and
Allen in the year ended June 30, 2016, and 38,055, 5,488, and
657 PIK Shares to Messrs. Fields, Allen, and Ms.
Fields in the year ended June 30, 2015,
respectively.
Service Agreement.
During
the year ended June 30, 2017, the Company continued to be a party
to a Service Agreement with Fields Management, Inc.
(“
FMI
”),
pursuant to which FMI provided certain executive management
services to the Company, including designating Mr. Randall K.
Fields to perform the functions of President and Chief Executive
Officer for the Company. Randall K. Fields, FMI’s designated
Executive, who also serves as the Company’s Chairman of the
Board of Directors, controls FMI.
The
Company had payables of $77,628 and $32,253 to FMI at June 30, 2017
and 2016 respectively, under this Agreement. In addition, during
the year ended June 30, 2017, 30,000 shares of Series B-1 Preferred
were paid to FMI in satisfaction of an accrued bonus payable to Mr.
Fields. An additional 20,000 shares were issued in satisfaction of
an accrued bonus subsequent to June 30, 2017.
During
the year ended June 30, 2017, the Company also issued 75,646 PIK
Shares for accrued dividends payable with respect to the Series B
Preferred, of which 8,646 were issued to Robert W. Allen, a
director of the Company, and 67,000 were issued to Riverview
Financial Corp., an entity beneficially owned by Mr. Fields. In
addition, $10,576 was paid to Julie Fields, Mr. Fields spouse, as a
dividend paid with respect to the Series B Preferred beneficially
owned by Ms. Fields.
|
NOTE 19.
|
SUBSEQUENT EVENTS
|
Subsequent to June
30, 2017, on July 25, 2017, the Company filed Amendment No. 1 to
the First Amended and Restated Certificate of Designation of the
Relative Rights, Powers and Preferences of the Series B-1 Preferred
(the “
B-1
Amendment
”), which B-1 Amendment was effective July
21, 2017. The B-1 Amendment increased the number of shares of
Series B-1 Preferred from 400,000 to 550,000 shares.
In accordance with the Subsequent Events Topic of the FASB ASC 855,
we have evaluated subsequent events, through the filing date
and noted no additional subsequent events that are reasonably
likely to impact the financial statements.
F-19
TABLE OF CONTENTS
Part IItem I. BusinessItem 1A. Risk FactorsItem 2. PropertiesItem 3. Legal ProceedingsItem 4. Mine Safety DisclosuresPart IIItem 5. Market For Common Equity, Related Stockholder Matters and Issuer Purchases Of Equity SecuritiesItem 6. Selected Financial DataItem 7. Management S Discussion and Analysis Of Financial Condition and Results Of OperationsItem 7A. Quantitative and Qualitative Disclosures About Market RiskItem 8. Financial Statements and Supplementary DataItem 9. Changes in and Disagreements with Accountants on Accounting and Financial DisclosureItem 9A. Controls and ProceduresItem 9B. Other InformationPart IIIItem 10. Directors, Executive Officers and Corporate GovernanceItem 11. Executive CompensationItem 12. Security Ownership Of Certain Beneficial Owners and Management and Related Stockholder MattersItem 13. Certain Relationships and Related Transactions, and Director IndependenceItem 14. Principal Accounting Fees and ServicesPart IVItem 15. Exhibits, Financial Statement SchedulesNote 1. Description Of Business and Acquisition Of Repositrak, IncNote 2. Significant Accounting PoliciesNote 3. InvestmentsNote 4. ReceivablesNote 5. Property and EquipmentNote 6. Capitalized Software CostsNote 7. Acquisition Related Intangible Assets, NetNote 8. Accrued LiabilitiesNote 9. Notes PayableNote 10. Lines Of CreditNote 11. Deferred RevenueNote 12. Income TaxesNote 13. Commitments and ContingenciesNote 14. Employee Benefit PlanNote 15. Stockholders EquityNote 16. RepositrakNote 17. Recent Accounting PronouncementsNote 18. Related Party TransactionsNote 19. Subsequent Events