TEJON RANCH CO
10-Ks and 10-Qs
|
|
|
|
|
|
|
|
|
|
|
|
|
|
|
|
|
|
|
|
|
|
|
|
|
|
|
|
|
|
|
|
|
|
|
|
|
|
|
|
|
|
|
|
|
|
|
|
|
|
|
|
|
UNITED STATES
SECURITIES AND EXCHANGE COMMISSION
WASHINGTON, D.C. 20549
|
FORM 10-Q
|
(Mark One)
|
x
|
QUARTERLY REPORT PURSUANT TO SECTION 13 OR 15(d) OF THE SECURITIES EXCHANGE ACT OF 1934
|
For the quarterly period ended
June 30, 2018
Or
|
¨
|
TRANSITION REPORT PURSUANT TO SECTION 13 OR 15(d) OF THE SECURITIES EXCHANGE ACT OF 1934
|
For the transition period from to
Commission File Number: 1-7183
|
TEJON RANCH CO.
|
||
|
(Exact name of Registrant as specified in its charter)
|
||
|
Delaware
|
|
77-0196136
|
|
(State or other jurisdiction of
incorporation or organization)
|
|
(IRS Employer
Identification No.)
|
P.O. Box 1000, Tejon Ranch, California 93243
(Address of principal executive offices)
Registrant’s telephone number, including area code: (661) 248-3000
____________________________________________________
Indicate by check mark whether the registrant (1) has filed all reports required to be filed by Section 13 or 15(d) of the Securities Exchange Act of 1934 during the preceding 12 months (or for such shorter period that the registrant was required to file such reports), and (2) has been subject to such filing requirements for the past 90 days.
Yes
x
No
¨
Indicate by check mark whether the registrant has submitted electronically and posted on its corporate Web site, if any, every Interactive Data File required to be submitted and posted pursuant to Rule 405 of Regulation S-T during the preceding 12 months (or for such shorter period that the registrant was required to submit and post such files).
Yes
x
No
¨
Indicate by check mark whether the registrant is a large accelerated filer, an accelerated filer, a non-accelerated filer, smaller reporting company, or an emerging growth company. See the definitions of “large accelerated filer”, “accelerated filer,” “smaller reporting company,” and “emerging growth company” in Rule 12b-2 of the Exchange Act. (Check one):
Large accelerated filer
¨
Accelerated filer
x
Non-accelerated filer
¨
(Do not check if a smaller reporting company)
Smaller reporting company
¨
Emerging growth company
¨
If an emerging growth company, indicate by check mark if the registrant has elected not to use the extended transition period for complying with any new or revised financial accounting standards provided pursuant to Section 13(a) of the Exchange Act.
¨
Indicate by check mark whether the registrant is a shell company (as defined in Rule 12b-2 of the Exchange Act).
Yes
¨
No
x
The number of the Company’s outstanding shares of Common Stock on
July 31, 2018
was
25,960,262
.
TEJON RANCH CO. AND SUBSIDIARIES
TABLE OF CONTENTS
|
|
|
Page
|
|
PART I.
|
FINANCIAL INFORMATION
|
|
|
Item 1.
|
Financial Statements
|
|
|
Notes to Unaudited Consolidated Financial Statements
|
||
|
Item 2.
|
Management’s Discussion and Analysis of Financial Condition and Results of Operations
|
|
|
Item 3.
|
Quantitative and Qualitative Disclosures About Market Risk
|
|
|
Item 4.
|
Controls and Procedures
|
|
|
PART II.
|
OTHER INFORMATION
|
|
|
Item 1.
|
Legal Proceedings
|
|
|
Item 1A.
|
Risk Factors
|
|
|
Item 2.
|
Unregistered Sales of Equity Securities and Use of Proceeds
|
|
|
Item 3.
|
Defaults Upon Senior Securities
|
|
|
Item 4.
|
Mine Safety Disclosures
|
|
|
Item 5.
|
Other Information
|
|
|
Item 6.
|
Exhibits
|
|
|
SIGNATURES
|
||
2
TEJON RANCH CO. AND SUBSIDIARIES
(In thousands, except per share amounts)
|
Three Months Ended June 30,
|
Six Months Ended June 30,
|
||||||||||||||
|
|
2018
|
2017
|
2018
|
2017
|
|||||||||||
|
Revenues:
|
|||||||||||||||
|
Real estate - commercial/industrial
|
$
|
2,189
|
|
$
|
2,083
|
|
$
|
4,343
|
|
$
|
4,272
|
|
|||
|
Mineral resources
|
1,500
|
|
1,519
|
|
10,631
|
|
3,520
|
|
|||||||
|
Farming
|
542
|
|
1,501
|
|
1,737
|
|
1,932
|
|
|||||||
|
Ranch operations
|
839
|
|
860
|
|
1,828
|
|
1,941
|
|
|||||||
|
Total revenues
|
5,070
|
|
5,963
|
|
18,539
|
|
11,665
|
|
|||||||
|
Costs and Expenses:
|
|||||||||||||||
|
Real estate - commercial/industrial
|
1,388
|
|
1,902
|
|
2,707
|
|
3,645
|
|
|||||||
|
Real estate - resort/residential
|
433
|
|
500
|
|
848
|
|
1,130
|
|
|||||||
|
Mineral resources
|
595
|
|
529
|
|
4,826
|
|
1,853
|
|
|||||||
|
Farming
|
1,191
|
|
1,258
|
|
3,029
|
|
2,581
|
|
|||||||
|
Ranch operations
|
1,348
|
|
1,461
|
|
2,737
|
|
|
2,954
|
|
||||||
|
Corporate expenses
|
2,464
|
|
2,368
|
|
5,196
|
|
5,119
|
|
|||||||
|
Total expenses
|
7,419
|
|
8,018
|
|
19,343
|
|
17,282
|
|
|||||||
|
Operating loss
|
(2,349
|
)
|
(2,055
|
)
|
(804
|
)
|
(5,617
|
)
|
|||||||
|
Other Income:
|
|||||||||||||||
|
Investment income
|
346
|
|
95
|
|
629
|
|
198
|
|
|||||||
|
Other loss, net
|
(10
|
)
|
(275
|
)
|
(24
|
)
|
(289
|
)
|
|||||||
|
Total other income (loss)
|
336
|
|
(180
|
)
|
605
|
|
(91
|
)
|
|||||||
|
Loss from operations before equity in earnings of unconsolidated joint ventures
|
(2,013
|
)
|
(2,235
|
)
|
(199
|
)
|
(5,708
|
)
|
|||||||
|
Equity in earnings of unconsolidated joint ventures, net
|
652
|
|
1,560
|
|
819
|
|
1,788
|
|
|||||||
|
(Loss) income before income tax expense
|
(1,361
|
)
|
(675
|
)
|
620
|
|
(3,920
|
)
|
|||||||
|
Income tax (benefit) expense
|
(348
|
)
|
(472
|
)
|
178
|
|
(1,804
|
)
|
|||||||
|
Net (loss) income
|
(1,013
|
)
|
(203
|
)
|
442
|
|
(2,116
|
)
|
|||||||
|
Net loss attributable to non-controlling interest
|
(16
|
)
|
(27
|
)
|
(18
|
)
|
(38
|
)
|
|||||||
|
Net (loss) income attributable to common stockholders
|
$
|
(997
|
)
|
$
|
(176
|
)
|
$
|
460
|
|
$
|
(2,078
|
)
|
|||
|
Net (loss) income per share attributable to common stockholders, basic
|
$
|
(0.04
|
)
|
$
|
(0.01
|
)
|
$
|
0.02
|
|
$
|
(0.10
|
)
|
|||
|
Net (loss) income per share attributable to common stockholders, diluted
|
$
|
(0.04
|
)
|
$
|
(0.01
|
)
|
$
|
0.02
|
|
$
|
(0.10
|
)
|
|||
See accompanying notes.
3
TEJON RANCH CO. AND SUBSIDIARIES
UNAUDITED CONSOLIDATED STATEMENTS OF COMPREHENSIVE INCOME (LOSS)
(In thousands)
|
|
Three Months Ended June 30,
|
Six Months Ended June 30,
|
|||||||||||||
|
|
2018
|
2017
|
2018
|
2017
|
|||||||||||
|
Net (loss) income
|
$
|
(1,013
|
)
|
$
|
(203
|
)
|
$
|
442
|
|
$
|
(2,116
|
)
|
|||
|
Other comprehensive income (loss):
|
|||||||||||||||
|
Unrealized (loss) gain on available-for-sale securities
|
(68
|
)
|
17
|
|
(370
|
)
|
55
|
|
|||||||
|
Benefit plan adjustments
|
—
|
|
1,139
|
|
—
|
|
1,139
|
|
|||||||
|
SERP liability adjustments
|
—
|
|
487
|
|
—
|
|
487
|
|
|||||||
|
Unrealized gain (loss) on interest rate swap
|
528
|
|
(252
|
)
|
1,856
|
|
122
|
|
|||||||
|
Other comprehensive income before taxes
|
460
|
|
1,391
|
|
1,486
|
|
1,803
|
|
|||||||
|
Provision for income taxes related to other comprehensive income items
|
(96
|
)
|
(569
|
)
|
(312
|
)
|
(731
|
)
|
|||||||
|
Other comprehensive income
|
364
|
|
822
|
|
1,174
|
|
1,072
|
|
|||||||
|
Comprehensive (loss) income
|
(649
|
)
|
619
|
|
1,616
|
|
(1,044
|
)
|
|||||||
|
Comprehensive loss attributable to non-controlling interests
|
(16
|
)
|
(27
|
)
|
(18
|
)
|
(38
|
)
|
|||||||
|
Comprehensive (loss) income attributable to common stockholders
|
$
|
(633
|
)
|
$
|
646
|
|
$
|
1,634
|
|
$
|
(1,006
|
)
|
|||
See accompanying notes.
4
TEJON RANCH CO. AND SUBSIDIARIES
(In thousands, except per share data)
|
June 30, 2018
|
December 31, 2017
|
||||||
|
(unaudited)
|
|||||||
|
ASSETS
|
|||||||
|
Current Assets:
|
|||||||
|
Cash and cash equivalents
|
$
|
10,611
|
|
$
|
20,107
|
|
|
|
Marketable securities - available-for-sale
|
69,952
|
|
70,868
|
|
|||
|
Accounts receivable
|
2,715
|
|
7,608
|
|
|||
|
Inventories
|
7,335
|
|
2,469
|
|
|||
|
Prepaid expenses and other current assets
|
3,023
|
|
2,849
|
|
|||
|
Total current assets
|
93,636
|
|
103,901
|
|
|||
|
Real estate and improvements - held for lease, net
|
18,931
|
|
19,115
|
|
|||
|
Real estate development (includes $96,372 at June 30, 2018 and $94,271 at December 31, 2017, attributable to Centennial Founders, LLC, Note 15)
|
275,088
|
|
267,336
|
|
|||
|
Property and equipment, net
|
45,738
|
|
45,332
|
|
|||
|
Investments in unconsolidated joint ventures
|
30,742
|
|
30,031
|
|
|||
|
Net investment in water assets
|
49,034
|
|
47,130
|
|
|||
|
Deferred tax assets
|
1,250
|
|
1,562
|
|
|||
|
Other assets
|
4,341
|
|
3,792
|
|
|||
|
TOTAL ASSETS
|
$
|
518,760
|
|
$
|
518,199
|
|
|
|
LIABILITIES AND EQUITY
|
|||||||
|
Current Liabilities:
|
|||||||
|
Trade accounts payable
|
$
|
3,293
|
|
$
|
3,545
|
|
|
|
Accrued liabilities and other
|
2,832
|
|
1,810
|
|
|||
|
Deferred income
|
1,292
|
|
1,118
|
|
|||
|
Current maturities of long-term debt
|
4,103
|
|
4,004
|
|
|||
|
Total current liabilities
|
11,520
|
|
10,477
|
|
|||
|
Long-term debt, less current portion
|
63,694
|
|
65,816
|
|
|||
|
Long-term deferred gains
|
3,405
|
|
3,405
|
|
|||
|
Other liabilities
|
10,546
|
|
11,691
|
|
|||
|
Total liabilities
|
89,165
|
|
91,389
|
|
|||
|
Commitments and contingencies
|
|
|
|||||
|
Equity:
|
|||||||
|
Tejon Ranch Co. Stockholders’ Equity
|
|||||||
|
Common stock, $.50 par value per share:
|
|||||||
|
Authorized shares - 30,000,000
|
|||||||
|
Issued and outstanding shares - 25,952,943 at June 30, 2018 and 25,894,773 at December 31, 2017
|
12,976
|
|
12,947
|
|
|||
|
Additional paid-in capital
|
321,307
|
|
320,167
|
|
|||
|
Accumulated other comprehensive loss
|
(4,090
|
)
|
(5,264
|
)
|
|||
|
Retained earnings
|
70,852
|
|
70,392
|
|
|||
|
Total Tejon Ranch Co. Stockholders’ Equity
|
401,045
|
|
398,242
|
|
|||
|
Non-controlling interest
|
28,550
|
|
28,568
|
|
|||
|
Total equity
|
429,595
|
|
426,810
|
|
|||
|
TOTAL LIABILITIES AND EQUITY
|
$
|
518,760
|
|
$
|
518,199
|
|
|
See accompanying notes.
5
TEJON RANCH CO. AND SUBSIDIARIES
(In thousands)
|
Six Months Ended June 30,
|
|||||||
|
|
2018
|
2017
|
|||||
|
Operating Activities
|
|||||||
|
Net income (loss)
|
$
|
442
|
|
$
|
(2,116
|
)
|
|
|
Adjustments to reconcile net income (loss) to net cash provided by (used in) operating activities:
|
|||||||
|
Depreciation and amortization
|
2,220
|
|
2,282
|
|
|||
|
Amortization of premium of marketable securities
|
50
|
|
163
|
|
|||
|
Equity in earnings of unconsolidated joint ventures
|
(819
|
)
|
(1,788
|
)
|
|||
|
Non-cash retirement plan expense
|
82
|
|
366
|
|
|||
|
Gain on sale of property plant and equipment
|
48
|
|
—
|
|
|||
|
Deferred income taxes
|
—
|
|
48
|
|
|||
|
Stock compensation expense
|
1,776
|
|
1,694
|
|
|||
|
Excess tax benefit from stock-based compensation
|
18
|
|
143
|
|
|||
|
Changes in operating assets and liabilities:
|
|||||||
|
Receivables, inventories and other assets, net
|
(413
|
)
|
(3,069
|
)
|
|||
|
Current liabilities
|
1,154
|
|
635
|
|
|||
|
Net cash provided by (used in) operating activities
|
4,558
|
|
(1,642
|
)
|
|||
|
Investing Activities
|
|||||||
|
Maturities and sales of marketable securities
|
18,455
|
|
4,115
|
|
|||
|
Funds invested in marketable securities
|
(17,959
|
)
|
(255
|
)
|
|||
|
Real estate and equipment expenditures
|
(10,386
|
)
|
(10,943
|
)
|
|||
|
Communities Facilities District and other reimbursements
|
1,385
|
|
—
|
|
|||
|
Investment in unconsolidated joint ventures
|
—
|
|
(252
|
)
|
|||
|
Distribution of equity from unconsolidated joint ventures
|
373
|
|
2,848
|
|
|||
|
Investments in long-term water assets
|
(2,659
|
)
|
(4,468
|
)
|
|||
|
Other
|
(1
|
)
|
—
|
|
|||
|
Net cash used in investing activities
|
(10,792
|
)
|
(8,955
|
)
|
|||
|
Financing Activities
|
|||||||
|
Borrowings of short-term debt
|
—
|
|
12,300
|
|
|||
|
Repayments of long-term debt
|
(2,033
|
)
|
(1,899
|
)
|
|||
|
Rights offering costs
|
(166
|
)
|
—
|
|
|||
|
Taxes on vested stock grants
|
(1,063
|
)
|
(540
|
)
|
|||
|
Net cash (used in) provided by financing activities
|
(3,262
|
)
|
9,861
|
|
|||
|
Decrease in cash and cash equivalents
|
(9,496
|
)
|
(736
|
)
|
|||
|
Cash and cash equivalents at beginning of period
|
20,107
|
|
1,258
|
|
|||
|
Cash and cash equivalents at end of period
|
$
|
10,611
|
|
$
|
522
|
|
|
|
Supplemental cash flow information
|
|||||||
|
Accrued capital expenditures included in current liabilities
|
$
|
155
|
|
$
|
(463
|
)
|
|
|
Non cash capital contribution to unconsolidated joint venture
|
$
|
—
|
|
$
|
1,339
|
|
|
See accompanying notes.
6
TEJON RANCH CO. AND SUBSIDIARIES
UNAUDITED CONSOLIDATED STATEMENT OF CHANGES IN EQUITY AND NONCONTROLLING INTERESTS
(In thousands, except shares outstanding)
|
Common Stock Shares Outstanding
|
Common Stock
|
Additional Paid-In Capital
|
Accumulated Other Comprehensive Income (Loss)
|
Retained Earnings
|
Total Stockholders' Equity
|
Noncontrolling Interest
|
Total Equity
|
|||||||||||||||||||||||
|
Balance, December 31, 2017
|
25,894,773
|
|
$
|
12,947
|
|
$
|
320,167
|
|
$
|
(5,264
|
)
|
$
|
70,392
|
|
$
|
398,242
|
|
$
|
28,568
|
|
$
|
426,810
|
|
|||||||
|
Net income (loss)
|
—
|
|
—
|
|
—
|
|
—
|
|
460
|
|
460
|
|
(18
|
)
|
442
|
|
||||||||||||||
|
Other comprehensive income
|
—
|
|
—
|
|
—
|
|
1,174
|
|
—
|
|
1,174
|
|
—
|
|
1,174
|
|
||||||||||||||
|
Rights offering costs
|
—
|
|
—
|
|
(166
|
)
|
—
|
|
—
|
|
(166
|
)
|
—
|
|
(166
|
)
|
||||||||||||||
|
Restricted stock issuance
|
103,588
|
|
52
|
|
(52
|
)
|
—
|
|
—
|
|
—
|
|
—
|
|
—
|
|
||||||||||||||
|
Stock compensation
|
—
|
|
—
|
|
2,398
|
|
—
|
|
—
|
|
2,398
|
|
—
|
|
2,398
|
|
||||||||||||||
|
Shares withheld for taxes and tax benefit of vested shares
|
(45,418
|
)
|
(23
|
)
|
(1,040
|
)
|
—
|
|
—
|
|
(1,063
|
)
|
—
|
|
(1,063
|
)
|
||||||||||||||
|
Balance June 30, 2018
|
25,952,943
|
|
$
|
12,976
|
|
$
|
321,307
|
|
$
|
(4,090
|
)
|
$
|
70,852
|
|
$
|
401,045
|
|
$
|
28,550
|
|
$
|
429,595
|
|
|||||||
See accompanying notes.
7
TEJON RANCH CO. AND SUBSIDIARIES
NOTES TO UNAUDITED CONSOLIDATED FINANCIAL STATEMENTS
1. BASIS OF PRESENTATION
The summarized information of Tejon Ranch Co. and its subsidiaries (the Company, Tejon, we, us and our), provided pursuant to Part I, Item 1 of Form 10-Q, is unaudited and reflects all adjustments which are, in the opinion of the Company’s management, necessary for a fair statement of the results for the interim period. All such adjustments are of a normal recurring nature. We have evaluated subsequent events through the date of issuance of our consolidated financial statements.
The periods ending
June 30, 2018
and
2017
include the consolidation of Centennial Founders, LLC’s statement of operations within the resort/residential real estate development segment and statements of cash flows. The Company’s
June 30, 2018
and
December 31, 2017
balance sheets and statements of changes in equity and noncontrolling interests are presented on a consolidated basis, including the consolidation of Centennial Founders, LLC.
The Company has identified
five
reportable segments: commercial/industrial real estate development, resort/residential real estate development, mineral resources, farming, and ranch operations. Information for the Company’s reportable segments are presented in its Consolidated Statements of Operations. The Company’s reportable segments follow the same accounting policies used for the Company’s consolidated financial statements. We use segment profit or loss, along with equity in earnings of unconsolidated joint ventures, as the primary measure of profitability to evaluate operating performance and to allocate capital resources.
The results of the period reported herein are not indicative of the results to be expected for the full year due to the seasonal nature of the Company’s agricultural activities, water activities, and the timing of real estate sales and leasing activities. Historically, the Company’s largest percentages of farming revenues are recognized during the third and fourth quarters of the fiscal year.
For further information and a summary of significant accounting policies, refer to the Consolidated Financial Statements and notes thereto included in the Company’s Annual Report on Form 10-K for the year ended
December 31, 2017
.
Recent Accounting Pronouncements
Lease Accounting
In February 2016, the Financial Accounting Standards Board, or FASB, issued Accounting Standards Update, or ASU, No. 2016-02, "Leases." From the lessee's perspective, the new standard establishes a right-of-use, or ROU, model that requires a lessee to record a ROU asset and a lease liability on the balance sheet for all leases with terms longer than 12 months. Leases will be classified as either finance or operating, with classification affecting the pattern of expense recognition in the income statement for a lessee. From the lessor's perspective, the new standard requires a lessor to classify leases as either sales-type, finance or operating. A lease will be treated as a sale if it transfers all of the risks and rewards, as well as control of the underlying asset, to the lessee. If risks and rewards are conveyed without the transfer of control, the lease is treated as a financing lease. If the lessor doesn’t convey risks and rewards or control, an operating lease results.
The ASU is effective no later than January 1, 2019, with early adoption permitted. The ASU requires the identification of lease and non-lease components of a lease agreement. This ASU will govern the recognition of revenue for lease components. Revenue related to non-lease components under our lease agreements will be subject to the new revenue recognition standard effective upon adoption of the new
8
lease accounting standard. The Company is currently in the process of evaluating the impact of the adoption of this ASU on the Company’s consolidated financial statements.
Newly Adopted Accounting Pronouncements
Postretirement Benefits
In March 2017, the FASB issued ASU 2017-07 "Compensation - Retirement Benefits (Topic 715)", which requires employers who offer defined benefit pension plans or other post-retirement benefit plans to report the service cost component within the same income statement caption as other compensation costs arising from services rendered by employees during the period. The ASU also requires the other components of net periodic benefit cost to be presented separately from the service cost component, in a caption outside of a subtotal of income from operations. Additionally, the ASU provides that only the service cost component is eligible for capitalization. As a result of the adoption, the Company reclassified
$126,000
and
$320,000
from Corporate expenses to Other income, net for the three and
six
months ended
June 30, 2017
.
Other Income
In February 2017, the FASB issued ASU 2017-05 "Other Income-Gains and Losses from the Derecognition of Nonfinancial Assets (Subtopic 610-20)", effective for the annual reporting period beginning after the December 15, 2017, including the interim reporting period within that period. This update provides guidance on the recognition of gains and losses on transfers of nonfinancial assets and in substance nonfinancial assets to counterparties that are not customers.
As of January 1, 2018, the Company began accounting for the sale of real estate properties under Subtopic 610-20 which provides for revenue recognition based on transfer of ownership.
The new standard may be applied retrospectively to each prior period presented or prospectively with the cumulative effect, if any, recognized as of the date of adoption. The Company selected the modified retrospective transition method. The adoption of the standard did not result in a cumulative adjustment recognized as of January 1, 2018 and the standard did not have any impact on the Company’s prior period financial statements. During the six months ended
June 30, 2018
, the Company had no sales or transfers of nonfinancial assets to customers.
Financial Instruments
In January 2016, the FASB issued ASU 2016-01, "Financial Statements - Overall (Subtopic 825-10): Recognition and Measurement of Financial Assets and Financial Liabilities," which requires equity investments in unconsolidated entities (other than those accounted for using the equity method of accounting) to be measured at fair value with changes in fair value recognized in net income. There will no longer be an available-for-sale classification for equity securities with readily determinable fair values.
We adopted the new ASU during the first quarter of 2018. The ASU requires the use of the modified retrospective transition method, under which cumulative unrealized gains and losses related to equity investments with readily determinable fair values will be reclassified from accumulated other comprehensive income to retained earnings on January 1, 2018 upon adoption of this ASU. The guidance related to equity investments without readily determinable fair values will be applied prospectively to all investments that exist as of the date of adoption. The adoption of this new ASU did not impact the Company's investment portfolio as it is comprised of fixed income investments and not equity investments.
Revenue Recognition
In May 2014, the FASB issued ASU 2014-09 "Revenue from Contracts with Customers (Topic 606)." ASU 2014-09 supersedes the current revenue recognition guidance, including industry-specific guidance.
9
The guidance introduces a five-step model to achieve its core principal of the entity recognizing revenue to depict the transfer of goods or services to customers at an amount that reflects the consideration to which the entity expects to be entitled in exchange for those goods or services. The five-step model requires that we (i) identify the contract with the customer, (ii) identify the performance obligations in the contract, (iii) determine the transaction price, including variable consideration to the extent that it is probable that a significant future reversal will not occur, (iv) allocate the transaction price to the respective performance obligations in the contract, and (v) recognize revenue when (or as) we satisfy the performance obligation.
In March 2016, the FASB issued ASU 2016-08, "Revenue from Contracts with Customers: Principal versus Agent Considerations (Reporting Revenue Gross versus Net)." ASU 2016-08 provides specific guidance to determine whether an entity is providing a specified good or service itself or is arranging for the good or service to be provided by another party.
During the first quarter of 2018, we adopted the revenue recognition ASU using the full retrospective method. Under this method, all periods presented were restated upon adoption to conform to the new standard and a cumulative adjustment for effects on periods prior to 2016 was recorded to retained earnings as of January 2, 2016.
Based on our evaluation of all contracts within scope, under previous accounting standards, and under the new revenue recognition ASU, we noted no significant differences in the amounts recognized or the pattern of recognition. Management however noted that the application of Topic 606 impacts the accounting for land sales where the Company has continued involvement or performance obligations that are essential to the land sale. Previous guidance required the Company to recognize revenue from land sales with continued involvement using a percentage completion method based on the total cost of the performance obligations. After adopting Topic 606, the Company was required to allocate the transaction price, on land sales with multiple performance obligations, to the performance obligations in proportion to their standalone selling prices (i.e., on a relative standalone selling price basis) and not total costs.
During 2016, the Company sold a land parcel to a third party. Under the terms of the purchase and sale agreement, the Company was obligated to complete specific infrastructure and landscaping adjacent to the land parcel that were deemed essential to the third party. When applying the guidance under Topic 606, the purchase price allocated to the multiple performance obligations yielded a different result than when applying the current guidance.
During the second quarter of 2017, the Company recognized
$475,000
and
$411,000
of revenues and profit from the 2016 land sale, respectively, in the results of operations for the three-and six-months ended June 30, 2017. In applying the accounting principles under Topic 606, the Company appropriately applied the full retrospective method to this land sale during the three- and
six
-months ended
June 30, 2017
results of operations and recognized
$73,000
and
$9,000
of revenues and profit from the sale of land, respectively.
No other differences were noted during our evaluation.
Please also refer to Critical Accounting Policies in Part I, Item 2 of this report for discussion on changes to critical accounting policies.
10
2. EQUITY
Earnings Per Share (EPS)
Basic net income per share attributable to common stockholders is based upon the weighted average number of shares of common stock outstanding during the year. Diluted net income per share attributable to common stockholders is based upon the weighted-average number of shares of common stock outstanding and the weighted average number of shares outstanding assuming the vesting of restricted stock grants per ASC 260, “Earnings Per Share.”
|
Three Months Ended June 30,
|
Six Months Ended June 30,
|
||||||||||
|
|
2018
|
2017
|
2018
|
2017
|
|||||||
|
Weighted average number of shares outstanding:
|
|||||||||||
|
Common stock
|
25,950,851
|
|
20,855,112
|
|
25,931,940
|
|
20,841,627
|
|
|||
|
Common stock equivalents
|
19,748
|
|
22,837
|
|
29,198
|
|
44,003
|
|
|||
|
Diluted shares outstanding
|
25,970,599
|
|
20,877,949
|
|
25,961,138
|
|
20,885,630
|
|
|||
11
3. MARKETABLE SECURITIES
ASC 320, “Investments – Debt and Equity Securities” requires that an enterprise classify all debt securities as either held-to-maturity, trading or available-for-sale. The Company has elected to classify its securities as available-for-sale and therefore is required to adjust securities to fair value at each reporting date. All costs and both realized and unrealized gains and losses on securities are determined on a specific identification basis. The following is a summary of available-for-sale securities at:
|
($ in thousands)
|
|
June 30, 2018
|
December 31, 2017
|
|||||||||||||
|
Marketable Securities:
|
Fair Value
Hierarchy
|
Cost
|
Fair Value
|
Cost
|
Fair Value
|
|||||||||||
|
Certificates of deposit
|
||||||||||||||||
|
with unrecognized losses for less than 12 months
|
$
|
6,625
|
|
$
|
6,563
|
|
$
|
6,238
|
|
$
|
6,222
|
|
||||
|
with unrecognized losses for more than 12 months
|
987
|
|
984
|
|
102
|
|
100
|
|
||||||||
|
with unrecognized gains
|
—
|
|
—
|
|
2,088
|
|
2,089
|
|
||||||||
|
Total Certificates of deposit
|
Level 1
|
7,612
|
|
7,547
|
|
8,428
|
|
8,411
|
|
|||||||
|
U.S. Treasury and agency notes
|
||||||||||||||||
|
with unrecognized losses for less than 12 months
|
30,010
|
|
29,780
|
|
29,741
|
|
29,669
|
|
||||||||
|
with unrecognized losses for more than 12 months
|
137
|
|
136
|
|
137
|
|
135
|
|
||||||||
|
with unrecognized gains
|
3
|
|
4
|
|
152
|
|
153
|
|
||||||||
|
Total U.S. Treasury and agency notes
|
Level 2
|
30,150
|
|
29,920
|
|
30,030
|
|
29,957
|
|
|||||||
|
Corporate notes
|
||||||||||||||||
|
with unrecognized losses for less than 12 months
|
21,856
|
|
21,662
|
|
18,230
|
|
18,159
|
|
||||||||
|
with unrecognized losses for more than 12 months
|
2,499
|
|
2,479
|
|
2,804
|
|
2,788
|
|
||||||||
|
with unrecognized gains
|
—
|
|
—
|
|
—
|
|
—
|
|
||||||||
|
Total Corporate notes
|
Level 2
|
24,355
|
|
24,141
|
|
21,034
|
|
20,947
|
|
|||||||
|
Municipal notes
|
||||||||||||||||
|
with unrecognized losses for less than 12 months
|
6,995
|
|
6,948
|
|
10,298
|
|
10,288
|
|
||||||||
|
with unrecognized losses for more than 12 months
|
955
|
|
943
|
|
999
|
|
987
|
|
||||||||
|
with unrecognized gains
|
453
|
|
453
|
|
277
|
|
278
|
|
||||||||
|
Total Municipal notes
|
Level 2
|
8,403
|
|
8,344
|
|
11,574
|
|
11,553
|
|
|||||||
|
$
|
70,520
|
|
$
|
69,952
|
|
$
|
71,066
|
|
$
|
70,868
|
|
|||||
We evaluate our securities for other-than-temporary impairment based on the specific facts and circumstances surrounding each security valued below its cost. Factors considered include the length of time the securities have been valued below cost, the financial condition of the issuer, industry reports related to the issuer, the severity of any decline, our intention not to sell the security, and our assessment as to whether it is not more likely than not that we will be required to sell the security before a recovery of its amortized cost basis. We then segregate the loss between the amounts representing a decrease in cash flows expected to be collected, or the credit loss, which is recognized through earnings, and the balance of the loss, which is recognized through other comprehensive income. At
June 30, 2018
, the fair market value of investment securities was
$568,000
below the cost basis of securities.
As of
June 30, 2018
, the adjustment to accumulated other comprehensive loss in consolidated equity for the temporary change in the value of securities reflected an increase in the market value of available-for-sale securities of
$370,000
, which includes estimated taxes of
$79,000
. As of
June 30, 2018
, the Company’s gross unrealized holding gains equaled
$1,000
and gross unrealized holding losses equaled
$569,000
.
12
The following tables summarize the maturities, at par, of marketable securities as of:
|
June 30, 2018
|
|||||||||||||||||||
|
($ in thousands)
|
2018
|
2019
|
2020
|
2021
|
Total
|
||||||||||||||
|
Certificates of deposit
|
$
|
3,497
|
|
$
|
2,311
|
|
$
|
1,799
|
|
$
|
—
|
|
$
|
7,607
|
|
||||
|
U.S. Treasury and agency notes
|
4,176
|
|
16,924
|
|
9,174
|
|
—
|
|
30,274
|
|
|||||||||
|
Corporate notes
|
7,097
|
|
9,621
|
|
7,150
|
|
400
|
|
24,268
|
|
|||||||||
|
Municipal notes
|
1,243
|
|
5,157
|
|
2,000
|
|
—
|
|
8,400
|
|
|||||||||
|
$
|
16,013
|
|
$
|
34,013
|
|
$
|
20,123
|
|
$
|
400
|
|
$
|
70,549
|
|
|||||
|
December 31, 2017
|
|||||||||||||||||||
|
($ in thousands)
|
2018
|
2019
|
2020
|
2021
|
Total
|
||||||||||||||
|
Certificates of deposit
|
$
|
4,306
|
|
$
|
2,311
|
|
$
|
1,799
|
|
—
|
|
$
|
8,416
|
|
|||||
|
U.S. Treasury and agency notes
|
6,399
|
|
14,599
|
|
9,171
|
|
—
|
|
30,169
|
|
|||||||||
|
Corporate notes
|
7,954
|
|
6,430
|
|
6,450
|
|
—
|
|
20,834
|
|
|||||||||
|
Municipal notes
|
1,568
|
|
6,957
|
|
3,003
|
|
—
|
|
11,528
|
|
|||||||||
|
$
|
20,227
|
|
$
|
30,297
|
|
$
|
20,423
|
|
$
|
—
|
|
$
|
70,947
|
|
|||||
The Company’s investments in corporate notes are with companies that have an investment grade rating from Standard & Poor’s.
4. REAL ESTATE
|
($ in thousands)
|
June 30, 2018
|
December 31, 2017
|
|||||
|
Real estate development
|
|||||||
|
Mountain Village
|
$
|
134,970
|
|
$
|
132,034
|
|
|
|
Centennial
|
96,372
|
|
94,271
|
|
|||
|
Grapevine
|
29,466
|
|
28,139
|
|
|||
|
Tejon Ranch Commerce Center
|
14,280
|
|
12,892
|
|
|||
|
Real estate development
|
275,088
|
|
267,336
|
|
|||
|
Real estate and improvements - held for lease
|
|||||||
|
Tejon Ranch Commerce Center
|
21,123
|
|
21,123
|
|
|||
|
Real estate and improvements - held for lease
|
21,123
|
|
21,123
|
|
|||
|
Less accumulated depreciation
|
(2,192
|
)
|
(2,008
|
)
|
|||
|
Real estate and improvements - held for lease, net
|
$
|
18,931
|
|
$
|
19,115
|
|
|
13
5. LONG-TERM WATER ASSETS
Long-term assets consist of water and water contracts held for future use or sale. The water is held at cost, which includes the price paid for the water and the cost to pump and deliver the water from the California aqueduct into the water bank. Water is currently held in a water bank on Company land in southern Kern County. Company-banked water costs also include costs related to the right to receive additional acre-feet of water in the future from the Antelope Valley East Kern Water Agency, or AVEK. The Company has also banked water within an AVEK owned water bank.
We have also been purchasing water for future use or
sale. In 2008, we purchased
8,393
acre-feet of transferable water and in 2009 we purchased an additional
6,393
acre-feet of transferable wate
r, all of which was held on our behalf by AVEK but is now stored in the Company's water bank. We also have secured State Water Project, or SWP, entitlement under long-term SWP water contracts within the Tulare Lake Basin Water Storage District and the Dudley-Ridge Water District, totaling
3,444
acre-feet of SWP entitlement annually, subject to SWP allocations. These contracts extend through 2035 and have been transferred to AVEK for our use in the Antelope Valley. In 2013, the Company acquired a contract to purchase water that obligates the Company to purchase
6,693
acre-feet of water each year from the Nickel Family, LLC, or Nickel, a California limited liability company that is located in Kern County.
The initial term of the water purchase agreement with Nickel runs to 2044 and includes a Company option to extend the contract for an additional
35
years. The purchase cost of water in
2018
is
$738
per acre-foot. The purchase cost is subject to annual increases based on the greater of the consumer price index or
3%
.
The water purchased above will ultimately be used in the development of the Company’s land for commercial/industrial real estate development, resort/residential real estate development, and farming. Interim uses may include the sale of portions of this water to third party users on an annual basis until this water is fully allocated to Company uses, as just described.
During the
six
months ended
June 30, 2018
, we sold
7,442
acre-feet of water to three different customers totaling
$7,992,000
with a cost of
$3,679,000
, which was recorded in the mineral resources segment on the unaudited Consolidated Statements of Operations.
The costs assigned to water assets held for future use were as follows ($ in thousands):
|
June 30, 2018
|
December 31, 2017
|
||||||
|
Banked water and water for future delivery
|
$
|
5,428
|
|
$
|
5,220
|
|
|
|
Transferable water
|
15,725
|
|
13,351
|
|
|||
|
Total tangible water
|
$
|
21,153
|
|
$
|
18,571
|
|
|
14
Intangible Water Assets
The Company's carrying amounts of its intangible water assets were as follows ($ in thousands):
|
June 30, 2018
|
December 31, 2017
|
||||||||||||||
|
Costs
|
Accumulated Depreciation
|
Costs
|
Accumulated Depreciation
|
||||||||||||
|
Dudley Ridge water rights
|
$
|
12,203
|
|
$
|
(3,618
|
)
|
$
|
12,203
|
|
$
|
(3,377
|
)
|
|||
|
Nickel water rights
|
18,740
|
|
(2,998
|
)
|
18,740
|
|
(2,678
|
)
|
|||||||
|
Tulare Lake Basin water rights
|
5,857
|
|
(2,303
|
)
|
5,857
|
|
(2,186
|
)
|
|||||||
|
$
|
36,800
|
|
$
|
(8,919
|
)
|
$
|
36,800
|
|
$
|
(8,241
|
)
|
||||
|
Net intangible water assets
|
27,881
|
|
28,559
|
|
|||||||||||
|
Total tangible water assets
|
21,153
|
|
18,571
|
|
|||||||||||
|
Net investments in water assets
|
$
|
49,034
|
|
$
|
47,130
|
|
|||||||||
Water contracts with the Wheeler Ridge Maricopa Water Storage District, or WRMWSD, and the Tejon-Castac Water District, or TCWD, are also in place, but were entered into with each district at inception of the contract and not purchased later from third parties, and do not have a related financial value on the
books of the Company. Therefore, there is no amortization expense related to these contracts. Total water resources including recurring annual contract water were as follows:
|
(in acre-feet, unaudited)
|
June 30, 2018
|
December 31, 2017
|
|||
|
Water held for future use
|
|||||
|
AVEK water bank
|
13,033
|
|
13,033
|
|
|
|
Company water bank
|
33,634
|
|
31,497
|
|
|
|
TCWD - Banked water contracted with Company
|
49,184
|
|
49,184
|
|
|
|
Transferable water
|
6,082
|
|
6,169
|
|
|
|
Total water held for future use
|
101,933
|
|
99,883
|
|
|
|
Water contracts - annual availability
|
|||||
|
Dudley-Ridge, Nickel and Tulare
|
10,137
|
|
10,137
|
|
|
|
WRMWSD
|
15,547
|
|
15,547
|
|
|
|
TCWD
|
5,749
|
|
5,749
|
|
|
|
Total water contracts
|
31,433
|
|
31,433
|
|
|
|
Total water held for future use and water contracts
|
133,366
|
|
131,316
|
|
|
Tejon Ranchcorp, or Ranchcorp, a wholly-owned subsidiary of Tejon Ranch Co., entered into a Water Supply Agreement with Pastoria Energy Facility, L.L.C., or PEF in 2015. PEF is the current lessee under the power plant lease. Pursuant to the Water Supply Agreement, PEF may purchase from Ranchcorp up to
3,500
acre-feet of water per year from January 1, 2017 through July 31, 2030, with an option to extend the term. PEF is under no obligation to purchase water from Ranchcorp in any year but is required to pay Ranchcorp an annual option payment equal to
30%
of the maximum annual payment. The price of the water under the Water Supply Agreement for 2018 is
$1,088
per acre-foot of annual water, subject to
3%
annual increases over the life of the contract. The Water Supply Agreement contains other customary terms and conditions, including representations and warranties, which are typical for agreements of this type. The Company's commitments to sell water can be met through current water assets.
15
6. ACCRUED LIABILITIES AND OTHER
Accrued liabilities and other consists of the following:
|
($ in thousands)
|
June 30, 2018
|
December 31, 2017
|
|||||
|
Accrued vacation
|
$
|
780
|
|
$
|
824
|
|
|
|
Accrued paid personal leave
|
481
|
|
494
|
|
|||
|
Accrued bonus
|
1,323
|
|
126
|
|
|||
|
Other
|
248
|
|
366
|
|
|||
|
$
|
2,832
|
|
$
|
1,810
|
|
||
Debt consists of the following:
|
($ in thousands)
|
June 30, 2018
|
December 31, 2017
|
|||||
|
Revolving line of credit
|
$
|
—
|
|
$
|
—
|
|
|
|
Notes payable
|
67,835
|
|
69,741
|
|
|||
|
Other borrowings
|
91
|
|
218
|
|
|||
|
Total short-term and long-term debt
|
67,926
|
|
69,959
|
|
|||
|
Less: line-of-credit and current maturities of long-term debt
|
(4,103
|
)
|
(4,004
|
)
|
|||
|
Less: deferred loan costs
|
(129
|
)
|
(139
|
)
|
|||
|
Long-term debt, less current portion
|
$
|
63,694
|
|
$
|
65,816
|
|
|
On October 13, 2014, the Company as borrower entered into an Amended and Restated Credit Agreement, a Term Note and a Revolving Line of Credit Note, or collectively the Credit Facility, with Wells Fargo. The Credit Facility added a
$70,000,000
term loan, or Term Loan, to the existing
$30,000,000
revolving line of credit, or RLC. Funds from the Term Loan were used to finance the Company's purchase of DMB TMV LLC’s interest in TMV LLC. Any future borrowings under the RLC will be used for ongoing working capital requirements and other general corporate purposes. To maintain availability of funds under the RLC, undrawn amounts under the RLC will accrue a commitment fee of
10
basis points per annum. The Company's ability to borrow additional funds in the future under the RLC is subject to compliance with certain financial covenants and making certain representations and warranties.
As of
June 30, 2018
, and
December 31, 2017
, the RLC had no outstanding balance. At the Company’s option, the interest rate on this line of credit can float at
1.50%
over a selected LIBOR average or can be fixed at
1.50%
above LIBOR for a fixed rate term. During the term of the Credit Facility (which matures in
September 2019
), we can borrow at any time and partially or wholly repay any outstanding borrowings and then re-borrow, as necessary.
The Term Loan had outstanding balances of
$64,277,000
and
$66,046,000
as of
June 30, 2018
and
December 31, 2017
, respectively. The interest rate per annum applicable to the Term Loan is LIBOR (as defined in the Term Note) plus a margin of
170
basis points. The interest rate for the term of the Term Loan has been fixed through the use of an interest rate swap at a rate of
4.11%
. The Term Loan required interest-only payments for the first
two
years of the term and thereafter requires monthly amortization payments pursuant to a schedule set forth in the Term Note, with the final outstanding principal amount due October 5, 2024. The Company may make voluntary prepayments on the Term Loan at any time without penalty (excluding any applicable LIBOR or interest rate swap breakage costs). Each optional prepayment will be applied to reduce the most remote principal payment then unpaid. The Credit Facility is secured by the Company's farmland and farm assets, which include equipment, crops and crop
16
receivables, the power plant lease and lease site, and related accounts and other rights to payment and inventory.
The Credit Facility requires compliance with
three
financial covenants: (a) total liabilities divided by tangible net worth not greater than
0.75
to
1.0
at each quarter end; (b) a debt service coverage ratio not less than
1.25
to
1.00
as of each quarter end on a rolling four quarter basis; and (c) maintain liquid assets equal to or greater than
$20,000,000
. At
June 30, 2018
and
December 31, 2017
, we were in compliance with all financial covenants.
The Credit Facility also contains customary negative covenants that limit the ability of the Company to, among other things, make capital expenditures, incur indebtedness and issue guaranties, consummate certain assets sales, acquisitions or mergers, make investments, pay dividends or repurchase stock, or incur liens on any assets.
The Credit Facility contains customary events of default, including: failure to make required payments; failure to comply with terms of the Credit Facility; bankruptcy and insolvency; and a change in control without consent of the bank (which consent will not be unreasonably withheld). The Credit Facility contains other customary terms and conditions, including representations and warranties, which are typical for credit facilities of this type.
In 2013, we entered into a promissory note agreement with CMFG Life Insurance Company to pay a principal amount of
$4,750,000
with principal and interest due monthly starting on October 1, 2013. The interest rate on this promissory note is
4.25%
per annum, with monthly principal and interest payments of
$102,700
ending on September 1, 2028. The proceeds from this promissory note were used to eliminate debt that had been previously used to provide long-term financing for a building being leased to Starbucks and provide additional working capital for future investment. The current balance on the promissory note is
$3,558,000
. The balance of this long-term debt instrument included in "Notes payable" above approximates the fair value of the instrument.
8. OTHER LIABILITIES
Other liabilities consist of the following:
|
($ in thousands)
|
June 30, 2018
|
December 31, 2017
|
|||||
|
Pension liability (Note 13)
|
$
|
2,202
|
|
$
|
2,280
|
|
|
|
Interest rate swap liability (Note 10)
1
|
—
|
|
894
|
|
|||
|
Supplemental executive retirement plan liability (Note 13)
|
7,637
|
|
7,759
|
|
|||
|
Other
|
707
|
|
758
|
|
|||
|
Total
|
$
|
10,546
|
|
$
|
11,691
|
|
|
|
1
The Company's interest rate swap had an asset balance of $962,000 as of June 30, 2018 and is presented under the caption Other Assets on the Consolidated Balance Sheets.
|
|||||||
For the captions presented in the table above, please refer to the respective Notes to Unaudited Consolidated Financial Statements for further detail.
9. STOCK COMPENSATION - RESTRICTED STOCK AND PERFORMANCE SHARE GRANTS
The Company’s stock incentive plans provide for the making of awards to employees based upon a service condition or through the achievement of performance-related objectives. The Company has issued
three
types of stock grant awards under these plans: restricted stock with service condition vesting; performance share grants that only vest upon the achievement of specified performance conditions, such
17
as corporate cash flow goals; and performance share grants that include threshold, target, and maximum achievement levels based on the achievement of specific performance milestones. The Company has also granted performance share grants that contain both performance-based and market-based conditions. Compensation cost for these awards is recognized based on either the achievement of the performance-based conditions, if they are considered probable, or if they are not considered probable, on the achievement of the market-based condition. Failure to satisfy the threshold performance conditions will result in the forfeiture of shares. Forfeiture of share awards with service conditions or performance-based restrictions results in a reversal of previously recognized share-based compensation expense. Forfeiture of share awards with market-based restrictions does not result in a reversal of previously recognized share-based compensation expense.
The following is a summary of the Company's performance share grants with performance conditions for the
six
months ended
June 30, 2018
:
|
Performance Share Grants with Performance Conditions
|
||
|
Below threshold performance
|
—
|
|
|
Threshold performance
|
179,211
|
|
|
Target performance
|
407,950
|
|
|
Maximum performance
|
619,512
|
|
The following is a summary of the Company’s stock grant activity, both time and performance share grants, assuming target achievement for outstanding performance share grants for the following periods:
|
June 30, 2018
|
December 31, 2017
|
||||
|
Stock grants outstanding beginning of the period at target achievement
|
536,860
|
|
386,171
|
|
|
|
New stock grants/additional shares due to maximum achievement
|
97,529
|
|
295,243
|
|
|
|
Vested grants
|
(87,825
|
)
|
(99,769
|
)
|
|
|
Expired/forfeited grants
|
(551
|
)
|
(44,785
|
)
|
|
|
Stock grants outstanding end of period at target achievement
|
546,013
|
|
536,860
|
|
|
The unamortized costs associated with nonvested stock grants and the weighted average period over which it is expected to be recognized as of
June 30, 2018
were
$6,107,000
and
22 months
, respectively. The fair value of restricted stock with time-based vesting features is based upon the Company’s share price on the date of grant and is expensed over the service period. Fair value of performance share grants that cliff vest based on the achievement of performance conditions is based on the share price of the Company’s stock on the day of grant once the Company determines that it is probable that the award will vest. This fair value is expensed over the service period applicable to these grants. For performance share grants that contain a range of shares from zero to a maximum we determine based on historic and projected results, the probability of (1) achieving the performance objective, and (2) the level of achievement. Based on this information, we determine the fair value of the award and measure the expense over the service period related to these grants. Because the ultimate vesting of all performance share grants is tied to the achievement of a performance condition, we estimate whether the performance condition will be met and over what period of time. Ultimately, we adjust compensation cost according to the actual outcome of the performance condition.
Under the Non-Employee Director Stock Incentive Plan, or NDSI Plan, each non-employee director receives his or her annual compensation in stock. The stock is granted at the end of each quarter based on the quarter end stock price.
18
The following table summarizes stock compensation costs for the Company's 1998 Employee Stock Incentive Plan, or the Employee Plan, and NDSI Plan for the following periods:
|
($ in thousands)
|
Six Months Ended June 30,
|
||||||
|
Employee Plan:
|
2018
|
2017
|
|||||
|
Expensed
|
$
|
1,411
|
|
$
|
1,346
|
|
|
|
Capitalized
|
622
|
|
236
|
|
|||
|
2,033
|
|
1,582
|
|
||||
|
NDSI Plan - Expensed
|
365
|
|
348
|
|
|||
|
Total Stock Compensation Costs
|
$
|
2,398
|
|
$
|
1,930
|
|
|
10. INTEREST RATE SWAP
During October 2014, the Company entered into an interest rate swap agreement to hedge cash flows tied to changes in the underlying floating interest rate tied to LIBOR for the Term Note as discussed in Note 7 (Line of Credit and Long-Term Debt). The ineffective portion of the change in fair value of our interest rate swap agreement is required to be recognized directly in earnings. During the quarter ended
June 30, 2018
, our interest rate swap agreement was
100%
effective; because of this,
no
hedge ineffectiveness was recognized in earnings. Changes in fair value, including accrued interest and adjustments for non-performance risk, on the effective portion of our interest rate swap agreements that are designated and that qualify as cash flow hedges are classified in accumulated other comprehensive income. Amounts classified in accumulated other comprehensive income are subsequently reclassified into earnings in the period during which the hedged transactions affect earnings. As of
June 30, 2018
, the fair value of our interest rate swap agreement exceeds its cost basis and as such is recorded as an asset balance in Other Assets on the Consolidated Balance Sheets.
We had the following outstanding interest rate swap agreement designated as a cash flow hedge of interest rate risk as of
June 30, 2018
($ in thousands):
|
Effective Date
|
Maturity Date
|
Fair Value Hierarchy
|
Weighted Average Interest Rate
|
Fair Value
|
Notional Amount
|
|||||
|
October 15, 2014
|
October 5, 2024
|
Level 2
|
4.11%
|
$962
|
$64,277
|
|||||
11. INCOME TAXES
For the
six
months ended
June 30, 2018
, the Company's income tax expense was
$178,000
compared to income tax benefit of
$1,804,000
for the
six
months ended
June 30, 2017
. These represent effective income tax rates of approximately
29%
and
46%
for the
six
months ended
June 30, 2018
and,
2017
, respectively. The decrease in the effective income tax rate resulted from the Tax Cut Jobs Act which lowered the Company’s U.S. statutory federal income tax rate from 35% to 21% effective January 1, 2018. As of
June 30, 2018
, we had income tax receivable of
$1,243,000
. The Company classifies interest and penalties incurred on tax payments as income tax expense. During the
six
months ended
June 30, 2018
, the Company did not make any income tax payments. The Company did not record a provisional adjustment for the three- and six-months ended June 30, 2018. As the Company completes its analysis of the accounting for the tax effects of the U.S. Tax Reform, the Company may record additional provisional amounts or adjustments to provisional amounts as discrete items in future periods.
19
12. COMMITMENTS AND CONTINGENCIES
The Company's land is subject to water contracts with minimum annual payments in 2018 of approximately
$8,889,000
, of which
$8,202,000
was paid through the second quarter with the remainder to be paid throughout the year. These estimated water contract payments consist of SWP, contracts with Wheeler Ridge Maricopa Water Storage District, Tejon-Castac Water District, or TCWD, Tulare Lake Basin Water Storage District, Dudley-Ridge Water Storage District and the Nickel water contract. The SWP contracts run through 2035, and the Nickel water contract runs through 2044, with an option to extend an additional
35
years. As discussed in Note 5 (Long-Term Water Assets), we purchased the assignment of a contract to purchase water in late 2013. The assigned water contract is with Nickel and obligates us to purchase
6,693
acre-feet of water annually through the term of the contract.
The Company is obligated to make payments of approximately
$800,000
per year through 2021 to the Tejon Ranch Conservancy as prescribed in the Conservation Agreement we entered into with five major environmental organizations in 2008. Our advances to the Tejon Ranch Conservancy are dependent on the occurrence of certain events and their timing and are therefore subject to change in amount and period. These amounts are recorded in real estate development for the Centennial, Grapevine and Mountain Village, or MV, projects.
The Company exited a consulting contract during the second quarter of 2014 related to the Grapevine Development and is obligated to pay an earned incentive fee at the time of successful receipt of litigated project entitlements and at a value measurement date
five
-years after litigated entitlements have been achieved for Grapevine. The final amount of the incentive fees will not be finalized until the future payment dates. The Company believes that net savings from exiting the contract over this future time period will more than offset the incentive payment costs.
The Tejon Ranch Public Facilities Financing Authority, or TRPFFA, is a joint powers authority formed by Kern County and TCWD to finance public infrastructure within the Company’s Kern County developments. For the development of the Tejon Ranch Commerce Center, or TRCC, TRPFFA has created
two
Community Facilities Districts, or CFDs: the West CFD and the East CFD. The West CFD has placed liens on
420
acres of the Company’s land to secure payment of special taxes related to
$28,620,000
of bond debt sold by TRPFFA for TRCC-West. The East CFD has placed liens on
1,931
acres of the Company’s land to secure payments of special taxes related to
$55,000,000
of bond debt sold by TRPFFA for TRCC-East. At TRCC-West, the West CFD has
no
additional bond debt approved for issuance. At TRCC-East, the East CFD has approximately
$65,000,000
of additional bond debt authorized by TRPFFA that can be sold in the future.
In connection with the sale of bonds there is a standby letter of credit for
$4,921,000
related to the issuance of East CFD bonds. The standby letter of credit is in place to provide additional credit enhancement and cover approximately
two
years' worth of interest on the outstanding bonds. This letter of credit will not be drawn upon unless the Company, as the largest landowner in the CFD, fails to make its property tax payments. The Company believes that the letter of credit will never be drawn upon. The letter of credit is for
two years
and will be renewed in
two
-year intervals as necessary. The annual cost related to the letter of credit is approximately
$83,000
.
The Company is obligated, as a landowner in each CFD, to pay its share of the special taxes assessed each year. The secured lands include both the TRCC-West and TRCC-East developments. Proceeds from the sale of West CFD bonds went to reimburse the Company for public infrastructure costs related to the TRCC-West development. At
June 30, 2018
there were
no
additional improvement funds remaining from the West CFD bonds and there are
$6,383,000
in improvement funds within the East CFD bonds for reimbursement of public infrastructure costs during 2018 and future years. During 2018 the Company expects to pay approximately
$2,570,000
in special taxes. As development continues to occur at TRCC, new owners of land and new lease tenants, through triple net leases, will bear an increasing portion of the
20
assessed special tax. This amount could change in the future based on the amount of bonds outstanding and the amount of taxes paid by others. The assessment of each individual property sold or leased is not determinable at this time because it is based on the current tax rate and the assessed value of the property at the time of sale or on its assessed value at the time it is leased to a third-party. Accordingly, the Company is not required to recognize an obligation at
June 30, 2018
.
In July 2014, the Company received a copy of a Notice of Intent to Sue, dated July 17, 2014 indicating that the Center for Biological Diversity, or CBD, the Wishtoyo Foundation and Dee Dominguez intend to initiate a lawsuit against the U.S. Fish and Wildlife Service, or USFWS, under the federal Endangered Species Act challenging USFWS's approval of Ranchcorp's Tehachapi Uplands Multiple Species Habitat Conservation Plan, and USFWS's issuance of an Incidental Take Permit, to Ranchcorp for the take of federally-listed species. The foregoing approvals authorize, among other things, the removal of California condor habitat associated with Ranchcorp's potential future development of MV. No lawsuit has been filed at this time. It is not possible to predict whether any lawsuit will actually be filed or whether the Company or Ranchcorp will incur any damages from such a lawsuit.
National Cement
The Company leases land to National Cement Company of California Inc., or National, for the purpose of manufacturing Portland cement from limestone deposits on the leased acreage. The California Regional Water Quality Control Board, or RWQCB, for the Lahontan Region issued orders in the late 1990s with respect to environmental conditions on the property currently leased to National.
The Company's former tenant Lafarge Corporation, or Lafarge, and current tenant National, continue to remediate these environmental conditions consistent with the RWQCB orders.
The Company is not aware of any failure by Lafarge or National to comply with directives of the RWQCB. Under current and prior leases, National and Lafarge are obligated to indemnify the Company for costs and liabilities arising out of their use of the leased premises. The remediation of environmental conditions is included within the scope of the National or Lafarge indemnity obligations. If the Company were required to remediate the environmental conditions at its own cost, it is unlikely that the amount of any such expenditure by the Company would be material and there is no reasonable likelihood of continuing risk from this matter.
Antelope Valley Groundwater Cases
On November 29, 2004, a conglomerate of public water suppliers filed a cross-complaint in the Los Angeles Superior Court seeking a judicial determination of the rights to groundwater within the Antelope Valley basin, including the groundwater underlying the Company’s land near the Centennial project. Four phases of a multi-phase trial have been completed. Upon completion of the third phase, the court ruled that the groundwater basin was in overdraft and established a current total sustainable yield. The fourth phase of trial occurred in the first half of 2013 and resulted in confirmation of each party’s groundwater pumping for 2011 and 2012. The fifth phase of the trial commenced in February 2014, and concerned 1) whether the United States has a federal reserved water right to basin groundwater, and 2) the rights to return flows from imported water. The court heard evidence on the federal reserved right but continued the trial on the return flow issues while most of the parties to the adjudication discussed a settlement, including rights to return flows. In February 2015, more than
140
parties representing more than
99%
of the current water use within the adjudication boundary agreed to a settlement. On March 4, 2015, the settling parties, including Tejon, submitted a Stipulation for Entry of Judgment and Physical Solution to the court for approval. On December 23, 2015, the court entered Judgment approving the Stipulation for Entry of Judgment and Physical Solution. The Company’s water supply plan for the Centennial project anticipated reliance on, among other sources, a certain quantity of groundwater underlying the Company’s lands in the Antelope Valley. The Company’s allocation in the Judgment is consistent with that amount.
21
Prior to the Judgment becoming final, on February 19 and 22, 2016, several parties, including the Willis Class and Phelan Pinon Hills Community Services District, filed notices of appeal from the Judgment. The Appeal has been transferred from the Fourth Appellate District to the Fifth Appellate District.
Appellate briefing will likely occur during 2018. Notwithstanding the appeals, the parties with assistance from the Court have established the Watermaster Board, hired the Watermaster Engineer and Watermaster Legal Counsel, and begun administering the Physical Solution, consistent with the Judgment.
Summary and Status of Kern Water Bank Lawsuits
On June 3, 2010, the Central Delta and South Delta Water Agencies and several environmental groups, including the CBD (collectively, Central Delta), filed a complaint in the Sacramento County Superior Court against the California Department of Water Resources, or DWR, Kern County Water Agency and a number of “real parties in interest,” including the Company and TCWD. The lawsuit challenges certain amendments to the SWP contracts that were originally approved in 1995, known as the Monterey Amendments. Petitioners in this action sought to invalidate environmental documentation prepared pursuant to the California Environmental Quality Act, or CEQA, pertaining to the Kern Water Bank, or KWB.
The original Environmental Impact Report, or EIR, for the Monterey Amendments was determined to be insufficient in an earlier lawsuit. The current lawsuit principally (i) challenges the adequacy of the remedial EIR that DWR prepared as a result of the original lawsuit and (ii) challenges the validity of the Monterey Amendments on various grounds, including the transfer of the KWB lands, from DWR to the Kern County Water Agency and in turn to the Kern Water Bank Authority, or KWBA, whose members are various Kern and Kings County interests, including TCWD, which has a
2%
interest in the KWBA. A parallel lawsuit was also filed by Central Delta in Kern County Superior Court on July 2, 2010, against Kern County Water Agency, also naming the Company and TCWD as real parties in interest, which has been stayed pending the outcome of the other action against DWR. The Company is named on the ground that it “controls” TCWD. This lawsuit has since been moved to the Sacramento County Superior Court. Another lawsuit was filed in Kern County Superior Court on June 3, 2010, by two districts adjacent to the KWB, namely Rosedale Rio Bravo and Buena Vista Water Storage Districts, or Rosedale, asserting that the remedial EIR did not adequately evaluate potential impacts arising from operations of the KWB, but this lawsuit did not name the Company, only TCWD. TCWD has a contract right for water stored in the KWB and rights to recharge and withdraw water. This lawsuit has since been moved to the Sacramento County Superior Court. In an initial favorable ruling on January 25, 2013, the court, in the Central Delta lawsuit, determined that the challenges to the validity of the Monterey Amendments, including the transfer of the KWB lands, were not timely and were barred by the statutes of limitation, the doctrine of laches, and by the annual validating statute. The substantive hearing on the challenges to the EIR was held on January 31, 2014. On March 5, 2014 the court issued a decision, rejecting all of Central Delta’s CEQA, claims, except the Rosedale claim, joined by Central Delta, that the EIR did not adequately evaluate future impacts from operation of the KWB, in particular the potential impacts on groundwater and water quality.
On November 24, 2014, the court issued a writ of mandate (the 2014 Writ) that required DWR to prepare a revised EIR regarding the Monterey Amendments evaluating the potential operational impacts of the KWB. The 2014 Writ authorized the continued operation of the KWB pending completion of the revised EIR subject to certain conditions, including those described in an interim operating plan negotiated between the KWBA and Rosedale. The 2014 Writ, as revised by the court, required DWR to certify the revised EIR and file the return to the 2014 Writ by September 28, 2016. On September 20, 2016, the Director of DWR (a) certified the revised EIR prepared by DWR, or the Revised EIR, as in compliance with CEQA, (b) adopted findings, a statement of overriding considerations, and a mitigation, monitoring and reporting program as required by CEQA, (c) made a new finding pertaining to carrying out the Monterey Amendments through continued use and operation of the KWB by the KWBA, and (d) caused a
22
notice of determination to be filed with the Office of Planning and Resources of the State of California on September 22, 2016. On September 28, 2016, DWR filed with the Sacramento Superior Court its return to the 2014 Writ.
On November 24, 2014, the court entered a judgment in the Central Delta case (1) dismissing the challenges to the validity of the Monterey Amendments and the transfer of the KWB lands in their entirety and (2) granting in part and denying in part the CEQA petition for writ of mandate. Central Delta has appealed the judgment and the KWBA and certain other parties have filed a cross-appeal with regard to certain defenses to the CEQA cause of action. The appeals are pending in the California Court of Appeal.
On December 3, 2014, the court entered judgment in the Rosedale case (i) in favor of Rosedale in the CEQA cause of action, and (ii) dismissing the declaratory relief cause of action. No appeal of the Rosedale judgment has been filed. Rosedale has stipulated to the discharge of the 2014 Writ.
On October 21, 2016, the Central Delta petitioners and a new party, the Center for Food Safety (CFS Petitioners), filed a new lawsuit (the CFS Petition) against DWR and naming a number of real parties in interest, including KWBA and TCWD (but not including the Company). The new lawsuit challenges DWR’s (i) certification of the Revised EIR, (ii) compliance with the 2014 Writ and CEQA, and (iii) finding concerning the continued use and operation of the KWB by KWBA. In response to a motion filed by the CFS Petitioners, on April 7, 2017, the Superior Court denied the CFS Petitioners’ motion to stay the Superior Court proceedings on the return to the 2014 Writ and CFS petition pending appeal. The Superior Court subsequently modified the 2014 Writ to authorize the KWBA to construct an additional
190
acres of recharge ponds within the KWB pending the court's consideration of DWR's return to the 2014 Writ and the petition in CFS vs DWR. On August 18, 2017, the Superior Court held a hearing on the return to the 2014 Writ and on the CFS Petition. On October 2, 2017, the Superior Court issued a ruling that the court shall deny the CFS Petition and shall discharge the 2014 Writ. CFS has appealed the Superior Court judgment denying the CFS Petition. The Court of Appeal granted DWR’s motion to consolidate the CFS appeal, for hearing, with the pending appeals in the Central Delta case. Briefing on the appeal of the judgment regarding the CFS Petition is anticipated to be completed in the fourth quarter of 2018.
To the extent there may be an adverse outcome of the claims still pending as described above, the monetary value cannot be estimated at this time.
Grapevine
On December 6, 2016 the Kern County Board of Supervisors granted entitlement approval for the Grapevine project (described below). On January 5, 2017 the CBD, and the Center for Food Safety, or CFS, filed an action in Kern County Superior Court pursuant to CEQA, against Kern County and the Kern County Board of Supervisors (collectively, the County) concerning the County’s granting of approvals for the Grapevine project, including certification of the final EIR and related findings; approval of associated general plan amendments; adoption of associated zoning maps; adoption of Specific Plan Amendment No. 155, Map No. 500; adoption of Special Plan No. 1, Map No. 202; exclusion from Agricultural Preserve No. 19; and adoption of a development agreement, among other associated approvals. The Company and its wholly-owned subsidiary, Ranchcorp, are named as real parties in interest in this action.
The action alleges that the County failed to properly follow the procedures and requirements of CEQA, including failure to identify, analyze and mitigate impacts to air quality, greenhouse gas emissions, biological resources, traffic, water supply and hydrology, growth inducing impacts, failure to adequately consider project alternatives and to provide support for the County’s findings and statement of overriding considerations in adopting the EIR and failure to adequately describe the environmental setting and project description. On December 6, 2017, the County served a responsive pleading answering petitioners' allegations and denying that relief should be granted. Petitioners seek to invalidate the
23
County's approval of the project, the environmental approvals and require the County to revise the environmental documentation.
On July 27, 2018 the court held a hearing on the petitioners’ claims. At that hearing, the court rejected all of petitioners’ claims raised in the litigation, except petitioners’ claims that (i) the project description was inadequate and (ii) such inadequacy resulted in aspects of certain environmental impacts being improperly analyzed. As to the claims described in romanettes “(i)” and “(ii)” in the foregoing sentence, the court determined that the EIR was inadequate. In that regard, the court determined the Grapevine project description contained in the EIR allowed development to occur in the time and manner determined by the real parties in interest and, as a consequence, such development flexibility could result in the project’s internal capture rate (ICR) - the percent of vehicle trips remaining within the project - actually being lower than the projected ICR levels used in the EIR to analyze various environmental impacts.
The court tentatively granted a writ of mandate ordering the County to prepare a supplemental environmental impact report to address potential environmental effects resulting from the Grapevine project’s actual ICR being lower than projected in the EIR with respect to traffic, air quality, greenhouse gas emissions, noise, public health and growth inducing impacts. The court did not issue a final ruling at the July 27, 2018 hearing, reserving the scope of the writ for further hearing. The court set a February 15, 2019 hearing to consider and rule on what remedies it may impose as part of a final ruling, including whether to invalidate the Grapevine project approvals. The parties will submit briefs to the court on their respective position as to what remedies should apply. Following the February 15, 2019 hearing, the court will then issue a final judgment issuing a writ of mandate and ordering whatever lawful remedy it deems appropriate. Following issuance of the final ruling, either party may appeal the court’s decision.
Proceedings Incidental to Business
From time to time, we are involved in other proceedings incidental to our business, including actions relating to employee claims, real estate disputes, contractor disputes and grievance hearings before labor regulatory agencies.
The outcome of these other proceedings is not predictable. However, based on current circumstances, we do not believe that the ultimate resolution of these other proceedings, after considering available defenses and any insurance coverage or indemnification rights, will have a material adverse effect on our financial position, results of operations or cash flows either individually or in the aggregate.
13. RETIREMENT PLANS
The Company has a defined benefit plan that covers many of its employees, or the Benefit Plan. The benefits are based on years of service and the employee’s
five
-year final average salary. Contributions are intended to provide for benefits attributable to service both to-date and expected-to-be provided in the future. The Company funds the Benefit Plan in accordance with the Employee Retirement Income Security Act of 1974 (ERISA) and the Pension Protection Act. In April 2017, the Company froze the Benefit Plan as it relates to future benefit accruals for participants. The Benefit Plan was closed to new participants in February 2007. The Company expects to contribute
$160,000
to the Benefit Plan during
2018
.
24
Benefit Plan assets consist of equity, debt and short-term money market investment funds. The Benefit Plan’s current investment policy targets
65%
equities,
25%
debt and
10%
money market funds. Equity and debt investment percentages are generally allowed to fluctuate plus or minus
20%
to take advantage of market conditions. As an example, equities could fluctuate from
78%
to
52%
of plan assets. At
June 30, 2018
, the investment mix was approximately
60%
equity,
37%
debt, and
3%
money market funds. At
December 31, 2017
, the investment mix was approximately
57%
equity,
37%
debt, and
6%
money market funds. Equity investments consist of a combination of individual equity securities plus value funds, growth funds, large cap funds and international stock funds. Debt investments consist of U.S. Treasury securities and investment grade corporate debt. The weighted average discount rates used in determining periodic pension cost were
3.7%
and
3.9%
in
2018
and
2017
, respectively. The expected long-term rate of return on plan assets is
7.5%
in
2018
and
2017
. The long-term rate of return on Benefit Plan assets is based on the historical returns within the plan and expectations for future returns.
The expected total pension and retirement expense for the Benefit Plan was as follows:
|
Six Months Ended June 30,
|
|||||||
|
($ in thousands)
|
2018
|
2017
|
|||||
|
Cost components:
|
|||||||
|
Service cost-benefits earned during the period
|
$
|
—
|
|
$
|
(45
|
)
|
|
|
Interest cost on projected benefit obligation
|
(182
|
)
|
(198
|
)
|
|||
|
Expected return on plan assets
|
292
|
|
263
|
|
|||
|
Net amortization and deferral
|
(32
|
)
|
(73
|
)
|
|||
|
Total net periodic pension earnings (cost)
|
$
|
78
|
|
$
|
(53
|
)
|
|
The Company has a Supplemental Executive Retirement Plan, or SERP, to restore to executives designated by the Compensation Committee of the Board of Directors the full benefits under the pension plan that would otherwise be restricted by certain limitations now imposed under the Internal Revenue Code. The SERP is currently unfunded. The Company in April 2017, froze the SERP plan as it relates to the accrual of additional benefits. The pension and retirement expense for the SERP was as follows:
|
Six Months Ended June 30,
|
|||||||
|
($ in thousands)
|
2018
|
2017
|
|||||
|
Cost components:
|
|||||||
|
Interest cost on projected benefit obligation
|
$
|
(128
|
)
|
$
|
(146
|
)
|
|
|
Net amortization and deferral
|
(32
|
)
|
(166
|
)
|
|||
|
Total net periodic pension cost
|
$
|
(160
|
)
|
$
|
(312
|
)
|
|
14. REPORTING SEGMENTS AND RELATED INFORMATION
We currently operate in
five
reporting segments: commercial/industrial real estate development, resort/residential real estate development, mineral resources, farming, and ranch operations.
Commercial lease revenue consists of land and building leases to tenants at our commercial retail and industrial developments, base and percentage rents from our Pastoria Energy Facility power plant lease, communication tower rents, and payments from easement leases.
25
The revenue components of the commercial/industrial real estate development segment were as follows:
|
Three Months Ended June 30,
|
Six Months Ended June 30,
|
||||||||||||||
|
($ in thousands)
|
2018
|
2017
|
2018
|
2017
|
|||||||||||
|
Pastoria Energy Facility
|
$
|
877
|
|
$
|
881
|
|
$
|
1,901
|
|
$
|
1,725
|
|
|||
|
TRCC Leasing
|
429
|
|
392
|
|
836
|
|
919
|
|
|||||||
|
TRCC management fees and reimbursements
|
187
|
|
238
|
|
400
|
|
450
|
|
|||||||
|
Commercial leases
|
185
|
|
156
|
|
345
|
|
306
|
|
|||||||
|
Communication leases
|
297
|
|
167
|
|
481
|
|
374
|
|
|||||||
|
Landscaping and other
|
214
|
|
176
|
|
380
|
|
425
|
|
|||||||
|
Land sale
|
—
|
|
73
|
|
—
|
|
73
|
|
|||||||
|
Commercial/industrial revenues
|
2,189
|
|
2,083
|
|
4,343
|
|
4,272
|
|
|||||||
|
Equity in earnings from unconsolidated joint ventures
|
652
|
|
1,560
|
|
819
|
|
1,788
|
|
|||||||
|
Total commercial/industrial revenues and equity in earnings from unconsolidated joint ventures
|
2,841
|
|
3,643
|
|
5,162
|
|
6,060
|
|
|||||||
|
Profit from commercial/industrial and unconsolidated joint ventures
|
$
|
1,453
|
|
$
|
1,741
|
|
$
|
2,455
|
|
$
|
2,415
|
|
|||
The resort/residential real estate development segment is actively involved in the land entitlement and development process internally and through a joint venture. The segment incurs costs and expenses related to its development activities, but currently generates
no
revenue. The segment produced losses of
$848,000
and
$1,130,000
for the
six
months ended
June 30, 2018
and
2017
, respectively. The segment produced losses of
$433,000
and
$500,000
for the three months ended
June 30, 2018
and
2017
, respectively.
The mineral resources segment receives oil and mineral royalties from exploration and development companies that extract or mine the natural resources from our land in addition to periodic reimbursable costs from lessors. The segment also, as opportunities arise periodically, may generate revenues through water transactions. The revenue components of the mineral resources segment were as follows:
|
Three Months Ended June 30,
|
Six Months Ended June 30,
|
||||||||||||||
|
($ in thousands)
|
2018
|
2017
|
2018
|
2017
|
|||||||||||
|
Oil and gas
|
$
|
623
|
|
$
|
429
|
|
$
|
1,161
|
|
$
|
805
|
|
|||
|
Cement
|
477
|
|
519
|
|
828
|
|
797
|
|
|||||||
|
Rock aggregate
|
344
|
|
248
|
|
546
|
|
428
|
|
|||||||
|
Exploration leases
|
|
—
|
|
|
|
||||||||||
|
Water Sales
|
—
|
|
146
|
|
7,992
|
|
1,254
|
|
|||||||
|
Reimbursables and other
|
56
|
|
177
|
|
104
|
|
236
|
|
|||||||
|
Total mineral resources revenues
|
1,500
|
|
1,519
|
|
10,631
|
|
3,520
|
|
|||||||
|
Profit from mineral resources
|
$
|
905
|
|
$
|
990
|
|
$
|
5,805
|
|
$
|
1,667
|
|
|||
26
The farming segment produces revenues from the sale of almonds, pistachios, wine grapes, and hay. The revenue components of the farming segment were as follows:
|
Three Months Ended June 30,
|
Six Months Ended June 30,
|
||||||||||||||
|
($ in thousands)
|
2018
|
|
2017
|
2018
|
2017
|
||||||||||
|
Almonds
|
$
|
250
|
|
|
$
|
790
|
|
$
|
1,174
|
|
$
|
790
|
|
||
|
Pistachios
|
41
|
|
|
312
|
|
84
|
|
568
|
|
||||||
|
Other
|
251
|
|
|
399
|
|
479
|
|
574
|
|
||||||
|
Total farming revenues
|
542
|
|
1,501
|
|
1,737
|
|
1,932
|
|
|||||||
|
(Loss) profit from farming
|
$
|
(649
|
)
|
$
|
243
|
|
$
|
(1,292
|
)
|
$
|
(650
|
)
|
|||
Ranch operations consists of game management revenues and ancillary land uses such as grazing leases and filming. Within game management we operate our High Desert Hunt Club, a premier upland bird hunting club. The High Desert Hunt Club offers over
6,400
acres and
35
hunting fields, each field providing different terrain and challenges. The hunting season runs from mid-October through March. We sell individual hunting packages as well as memberships. Ranch operations also includes Hunt at Tejon, which offers a wide variety of guided big game hunts including trophy Rocky Mountain elk, deer, turkey and wild pig. We offer guided hunts and memberships for both the Spring and Fall hunting seasons. The revenue components of the segment were as follows:
|
Three Months Ended June 30,
|
Six Months Ended June 30,
|
||||||||||||||
|
($ in thousands)
|
2018
|
2017
|
2018
|
2017
|
|||||||||||
|
Game management
|
$
|
308
|
|
$
|
277
|
|
$
|
604
|
|
$
|
578
|
|
|||
|
Grazing
|
401
|
|
474
|
|
807
|
|
898
|
|
|||||||
|
High Desert Hunt Club
|
17
|
|
24
|
|
183
|
|
190
|
|
|||||||
|
Filming and other
|
113
|
|
85
|
|
234
|
|
275
|
|
|||||||
|
Total ranch operations revenues
|
839
|
|
860
|
|
1,828
|
|
1,941
|
|
|||||||
|
Loss from ranch operations
|
$
|
(509
|
)
|
$
|
(601
|
)
|
$
|
(909
|
)
|
$
|
(1,013
|
)
|
|||
15. INVESTMENT IN UNCONSOLIDATED AND CONSOLIDATED JOINT VENTURES
The Company maintains investments in joint ventures. The Company accounts for its investments in unconsolidated joint ventures using the equity method of accounting unless the venture is a variable interest entity, or VIE, and meets the requirements for consolidation. The Company’s investment in its unconsolidated joint ventures at
June 30, 2018
was
$30,742,000
. The equity in the income of the unconsolidated joint ventures was
$819,000
for the
six
months ended
June 30, 2018
. The unconsolidated joint ventures have not been consolidated as of
June 30, 2018
, because the Company does not control the investments. The Company’s current joint ventures are as follows:
|
•
|
Petro Travel Plaza Holdings LLC – TA/Petro is an unconsolidated joint venture with TravelCenters of America, LLC for the development and management of travel plazas and convenience stores. The Company has
50%
voting rights and shares
60%
of profit and losses in this joint venture. It houses multiple commercial eating establishments as well as diesel and gasoline operations in TRCC. The Company does not control the investment due to its having only
50%
voting rights, and because our partner in the joint venture is the managing partner and performs all of the day-to-day operations and has significant decision making authority regarding key business components such as fuel inventory and pricing at the facility. At
June 30, 2018
, the Company had an equity investment balance of
$19,128,000
in this joint venture.
|
27
|
•
|
Majestic Realty Co. – Majestic Realty Co., or Majestic, is a privately-held developer and owner of master planned business parks in the United States. The Company partnered with Majestic to form
two
50%/
50%
joint ventures to acquire, develop, manage, and operate industrial real estate at TRCC. The partners have equal voting rights and equally share in the profit and loss of the joint venture. At
June 30, 2018
, the Company's investment balance in these joint ventures was in deficit position of
$770,000
, based on the reasons discussed below.
|
|
◦
|
TRC-MRC 2, LLC was formed to acquire, lease, and maintain a fully occupied warehouse at TRCC-West. The partnership acquired the
651,909
square foot building for
$24,773,000
and was largely financed through a promissory note guaranteed by both partners. The promissory note was refinanced on June 1, 2018 with a
$25,240,000
promissory note (Note II), also guaranteed by both partners. Note II matures on July 1, 2028 and currently has an outstanding principal balance of
$25,240,000
. Since inception, we have received excess distributions resulting in a deficit balance of
$716,000
. In accordance with the applicable accounting guidance, these excess distributions are reclassified to the liabilities section of our consolidated balance sheet. We will continue to record our equity in the net income as a debit to the investment account, and if it becomes positive, it will again be shown as an asset on our consolidated balance sheet. If it becomes obvious that any excess distribution may not be returned (upon joint venture liquidation or otherwise), we will recognize any balance classified as a liability as income immediately.
|
|
◦
|
TRC-MRC 1, LLC was formed to develop and operate an approximately
480,480
square foot industrial building at TRCC-East. The joint venture completed construction of the building during the third quarter of 2017. Since inception, we have received excess distributions resulting in a deficit balance of
$54,000
. In accordance with the applicable accounting guidance, these excess distributions are reclassified to the liabilities section of our consolidated balance sheet. We will continue to record our equity in the net income as a debit to the investment account, and if it becomes positive, it will again be shown as an asset on our consolidated balance sheet. If it becomes obvious that any excess distribution may not be returned (upon joint venture liquidation or otherwise), we will recognize any balance classified as a liability as income immediately. The joint venture currently has borrowings under a
$25,000,000
construction loan which has a current balance of
$21,779,000
. Half of the facility is currently leased to Dollar General while the other half is under lease negotiations with a prospective tenant.
|
|
•
|
Rockefeller Joint Ventures – The Company has
three
joint ventures with Rockefeller Group Development Corporation, or Rockefeller. At
June 30, 2018
, the Company’s combined equity investment balance in these
three
joint ventures was
$11,614,000
.
|
|
◦
|
Two
joint ventures are for the development of buildings on approximately
91
acres and are part of an agreement for the potential development of up to
500
acres of land in TRCC. The Company owns a
50%
interest in each of the joint ventures. Currently, the Five West Parcel LLC joint venture owns and leases a
606,000
square foot building to Dollar General, which has options to extend the lease to April 2022. For operating revenue, please see the following table. The Five West Parcel LLC joint venture currently has an outstanding term loan with a balance of
$9,442,000
that matures on May 5, 2022. The Company and Rockefeller guarantee the performance of the debt. The second of these joint ventures, 18-19 West LLC, was formed in August 2009 through the contribution of
61.5
acres of land by the Company, which is being held for future development. Both of these joint ventures are being accounted for under the equity method due to both members having significant participating rights in the management of the ventures.
|
28
|
◦
|
The third joint venture is the TRCC/Rock Outlet Center LLC joint venture, which was formed during the second quarter of 2013 to develop, own, and manage a net leasable
326,000
square-foot outlet center on land at TRCC-East. The cost of the outlet center was approximately
$87,000,000
and was funded through a construction loan for up to
60%
of the costs. The remaining
40%
was funded through equity contributions from the
two
members. The Company has
50%
of the voting interests of TRCC/Rock Outlet Center LLC, thus it does not control by voting interest alone. The Company is the named managing member, and as such we considered the presumption that a managing member controls the limited liability company. The managing member's responsibilities relate to the routine day-to-day activities of TRCC/Rock Outlet Center LLC. However, all operating decisions during development and operations, including the setting and monitoring of the budget, leasing, marketing, financing and selection of the contractor for any of the project's construction, are jointly made by both members of the joint venture. Therefore, the Company concluded that both members have significant participating rights that are sufficient to overcome the presumption of the Company controlling the joint venture through it being named the managing member. Therefore, the investment in TRCC/Rock Outlet Center LLC is being accounted for under the equity method. The TRCC/Rock Outlet Center LLC joint venture is separate from the aforementioned agreement to potentially develop up to
500
acres of land in TRCC. During the fourth quarter of 2013, the TRCC/Rock Outlet Center LLC joint venture entered into a construction line of credit agreement with a financial institution for
$52,000,000
that, as of
June 30, 2018
, had an outstanding balance of
$47,798,000
. The Company and Rockefeller guarantee the performance of the debt.
|
|
•
|
Centennial Founders, LLC – Centennial Founders, LLC, or CFL, is a joint venture with TRI Pointe Homes and CalAtlantic that was organized to pursue the entitlement and development of land that the Company owns in Los Angeles County. Based on the Second Amended and Restated Limited Company Agreement of CFL and the change in control and funding that resulted from the amended agreement, CFL qualified as a VIE, beginning in the third quarter of 2009, and the Company was determined to be the primary beneficiary. As a result, CFL has been consolidated into our financial statements beginning in that quarter. Our partners retained a noncontrolling interest in the joint venture. On November 30, 2016, CFL and Lewis Investment Company, or Lewis, entered a Redemption and Withdrawal Agreement, whereby Lewis irrevocably and unconditionally withdrew as a member of CFL, CFL redeemed Lewis' entire interest for no consideration. As a result, our noncontrolling interest balance was reduced by
$11,039,000
. At
June 30, 2018
, the Company owned
90.89%
of CFL.
|
The Company’s investment balance in its unconsolidated joint ventures differs from its respective capital accounts in the respective joint ventures. The differential represents the difference between the cost basis of assets contributed by the Company and the agreed upon contribution value of the assets contributed.
29
Unaudited condensed statement of operations for the
six
months ended
June 30, 2018
and condensed balance sheet information of the Company’s unconsolidated joint ventures as of
June 30, 2018
are as follows:
|
Three Months Ended June 30,
|
|||||||||||||||||||||||
|
2018
|
2017
|
2018
|
2017
|
2018
|
2017
|
||||||||||||||||||
|
Joint Venture
|
TRC
|
||||||||||||||||||||||
|
($ in thousands)
|
Revenues
|
Earnings(Loss)
|
Equity in Earnings(Loss)
|
||||||||||||||||||||
|
Petro Travel Plaza Holdings, LLC
|
$
|
30,384
|
|
$
|
30,825
|
|
$
|
1,957
|
|
$
|
3,021
|
|
$
|
1,174
|
|
$
|
1,813
|
|
|||||
|
Five West Parcel, LLC
|
698
|
|
702
|
|
226
|
|
231
|
|
112
|
|
116
|
|
|||||||||||
|
18-19 West, LLC
|
3
|
|
2
|
|
(26
|
)
|
(30
|
)
|
(13
|
)
|
(14
|
)
|
|||||||||||
|
TRCC/Rock Outlet Center, LLC
1
|
2,032
|
|
2,726
|
|
(1,259
|
)
|
(82
|
)
|
(629
|
)
|
(41
|
)
|
|||||||||||
|
TRC-MRC 1, LLC
|
139
|
|
—
|
|
(101
|
)
|
—
|
|
(50
|
)
|
—
|
|
|||||||||||
|
TRC-MRC 2, LLC
2
|
979
|
|
905
|
|
115
|
|
(629
|
)
|
58
|
|
(314
|
)
|
|||||||||||
|
$
|
34,235
|
|
$
|
35,160
|
|
$
|
912
|
|
$
|
2,511
|
|
$
|
652
|
|
$
|
1,560
|
|
||||||
|
Centennial Founders, LLC
|
$
|
(76
|
)
|
$
|
—
|
|
$
|
(194
|
)
|
$
|
(207
|
)
|
Consolidated
|
||||||||||
|
(1) Revenues for TRCC/Rock Outlet Center are presented net of non-cash tenant allowance amortization of $0.4 million and $0.5 million as of June 30, 2018 and 2017, respectively.
|
|||||||||||||||||||||||
|
(2) Earnings for TRC-MRC 2, LLC include non-cash amortization of purchase accounting adjustments related to in-place leases of $0.2 million and $1.0 million as of June 30, 2018 and 2017, respectively.
|
|||||||||||||||||||||||
|
Six Months Ended June 30,
|
|||||||||||||||||||||||
|
2018
|
2017
|
2018
|
2017
|
2018
|
2017
|
||||||||||||||||||
|
Joint Venture
|
TRC
|
||||||||||||||||||||||
|
($ in thousands)
|
Revenues
|
Earnings(Loss)
|
Equity in Earnings(Loss)
|
||||||||||||||||||||
|
Petro Travel Plaza Holdings, LLC
|
$
|
55,061
|
|
$
|
57,232
|
|
$
|
2,844
|
|
$
|
4,523
|
|
$
|
1,706
|
|
$
|
2,714
|
|
|||||
|
Five West Parcel, LLC
|
1,395
|
|
1,418
|
|
417
|
|
500
|
|
208
|
|
250
|
|
|||||||||||
|
18-19 West, LLC
|
6
|
|
5
|
|
(53
|
)
|
(54
|
)
|
(26
|
)
|
(27
|
)
|
|||||||||||
|
TRCC/Rock Outlet Center, LLC
1
|
3,507
|
|
5,275
|
|
(2,354
|
)
|
(1,091
|
)
|
(1,177
|
)
|
(546
|
)
|
|||||||||||
|
TRC-MRC 1, LLC
|
139
|
|
—
|
|
(102
|
)
|
(2
|
)
|
(51
|
)
|
(1
|
)
|
|||||||||||
|
TRC-MRC 2, LLC
2
|
1,957
|
|
1,840
|
|
317
|
|
(1,204
|
)
|
159
|
|
(602
|
)
|
|||||||||||
|
$
|
62,065
|
|
$
|
65,770
|
|
$
|
1,069
|
|
$
|
2,672
|
|
$
|
819
|
|
$
|
1,788
|
|
||||||
|
Centennial Founders, LLC
|
$
|
11
|
|
$
|
1
|
|
$
|
(212
|
)
|
$
|
(317
|
)
|
Consolidated
|
||||||||||
|
(1) Revenues for TRCC/Rock Outlet Center are presented net of non-cash tenant allowance amortization of $0.8 million and $1.0 million as of June 30, 2018 and 2017, respectively.
|
|||||||||||||||||||||||
|
(2) Earnings for TRC-MRC 2, LLC include non-cash amortization of purchase accounting adjustments related to in-place leases of $0.4 million and $2.0 million as of June 30, 2018 and 2017, respectively.
|
|||||||||||||||||||||||
30
|
June 30, 2018
|
December 31, 2017
|
||||||||||||||||||||||||
|
Joint Venture
|
TRC
|
Joint Venture
|
TRC
|
||||||||||||||||||||||
|
($ in thousands)
|
Assets
|
Debt
|
Equity
|
Equity
|
Assets
|
Debt
|
Equity
|
Equity
|
|||||||||||||||||
|
Petro Travel Plaza Holdings, LLC
|
$
|
70,625
|
|
$
|
(15,281
|
)
|
$
|
52,548
|
|
$
|
19,128
|
|
$
|
67,435
|
|
$
|
(15,280
|
)
|
$
|
49,705
|
|
$
|
17,422
|
|
|
|
Five West Parcel, LLC
|
15,902
|
|
(9,442
|
)
|
6,389
|
|
3,010
|
|
15,738
|
|
(9,711
|
)
|
5,972
|
|
2,802
|
|
|||||||||
|
18-19 West, LLC
|
4,652
|
|
—
|
|
4,652
|
|
1,756
|
|
4,704
|
|
—
|
|
4,704
|
|
1,782
|
|
|||||||||
|
TRCC/Rock Outlet Center, LLC
|
78,098
|
|
(47,798
|
)
|
29,822
|
|
6,848
|
|
81,610
|
|
(48,769
|
)
|
32,177
|
|
8,025
|
|
|||||||||
|
TRC-MRC 1, LLC
|
26,510
|
|
(21,779
|
)
|
4,439
|
|
—
|
|
25,380
|
|
(19,433
|
)
|
4,541
|
|
—
|
|
|||||||||
|
TRC-MRC 2, LLC
|
24,144
|
|
(25,240
|
)
|
(1,432
|
)
|
—
|
|
20,336
|
|
(21,080
|
)
|
(992
|
)
|
—
|
|
|||||||||
|
Total
|
$
|
219,931
|
|
$
|
(119,540
|
)
|
$
|
96,418
|
|
$
|
30,742
|
|
$
|
215,203
|
|
$
|
(114,273
|
)
|
$
|
96,107
|
|
$
|
30,031
|
|
|
|
Centennial Founders, LLC
|
$
|
90,811
|
|
$
|
—
|
|
$
|
90,425
|
|
***
|
|
$
|
89,721
|
|
$
|
—
|
|
$
|
88,862
|
|
***
|
|
|||
|
*** Centennial Founders, LLC is consolidated within the Company's financial statements.
|
|||||||||||||||||||||||||
16. RELATED PARTY TRANSACTIONS
TCWD is a not-for-profit governmental entity, organized on December 28, 1965, pursuant to Division 13 of the Water Code, State of California. TCWD is a landowner voting district, which requires an elector, or voter, to be an owner of land located within the district. TCWD was organized to provide the water needs for future municipal and industrial development. The Company is the largest landowner and taxpayer within TCWD. The Company has a water service contract with TCWD that entitles us to receive all of TCWD’s State Water Project entitlement and all of TCWD’s banked water. TCWD is also entitled to make assessments of all taxpayers within the district, to the extent funds are required to cover expenses and to charge water users within the district for the use of water. From time to time, we transact with TCWD in the ordinary course of business. We believe that the terms negotiated for all transactions are no less favorable than those that could be negotiated in arm's length transactions.
31
Forward-Looking Statements
This Quarterly Report on Form 10-Q contains forward-looking statements, including without limitation statements regarding strategic alliances, the almond, pistachio and grape industries, the future plantings of permanent crops, future yields, prices and water availability for our crops and real estate operations, future prices, production and demand for oil and other minerals, future development of our property, future revenue and income of our jointly-owned travel plaza and other joint venture operations, potential losses to the Company as a result of pending environmental proceedings, the adequacy of future cash flows to fund our operations, market value risks associated with investment and risk management activities and with respect to inventory, accounts receivable and our own outstanding indebtedness and other future events and conditions. In some cases these statements are identifiable through the use of words such as “anticipate”, “believe”, “estimate”, “expect”, “intend”, “plan”, “project”, “target”, “can”, “could”, “may”, “will”, “should”, “would”, “likely”, and similar expressions. In addition, any statements that refer to projections of our future financial performance, our anticipated growth, and trends in our business and other characterizations of future events or circumstances are forward-looking statements. We caution you not to place undue reliance on these forward-looking statements. These forward-looking statements are not a guarantee of future performances and are subject to assumptions and involve known and unknown risks, uncertainties and other important factors that could cause the actual results, performance or achievements of the Company, or industry results, to differ materially from any future results, performance, or achievement implied by such forward- looking statements. These risks, uncertainties and important factors include, but are not limited to, weather, market and economic forces, availability of financing for land development activities, competition and success in obtaining various governmental approvals and entitlements for land development activities. No assurance can be given that the actual future results will not differ materially from the forward-looking statements that we make for a number of reasons including those described above in the section entitled “Risk Factors” in this report and our Annual Report on Form 10-K.
OVERVIEW
We are a diversified real estate development and agribusiness company committed to responsibly using our land and resources to meet the housing, employment, and lifestyle needs of Californians and to create value for our shareholders. In support of these objectives, we have been investing in land planning and entitlement activities for new industrial and master planned communities and in infrastructure improvements within our active industrial development. Our prime asset is approximately 270,000 acres of contiguous, largely undeveloped land that, at its most southerly border, is 60 miles north of Los Angeles and, at its most northerly border, is 15 miles east of Bakersfield.
Business Objectives and Strategies
Our primary business objective is to maximize long-term shareholder value through the monetization of our land-based assets. A key element of our strategy is to entitle and then develop large-scale mixed-use master planned residential and commercial/industrial real estate projects to serve the growing populations of Southern and Central California. Once all entitlements are approved, our mixed-use master planned residential developments collectively may include up to 35,000 housing units, with 15,450 units currently approved, and more than 35 million square feet of commercial space, with 25 million square feet currently approved. We have obtained entitlements on Mountain Village at Tejon Ranch, or MV, and Grapevine at Tejon Ranch, or Grapevine, and are currently in the entitlement process with Centennial at Tejon Ranch, or Centennial. We are currently engaged in entitlement, construction, commercial sales and leasing at our fully operational commercial/industrial center Tejon Ranch Commerce Center, or TRCC. All of these
32
efforts are supported by diverse revenue streams generated from other operations, including farming, mineral resources, ranch operations, and our various joint ventures.
Our Business
We currently operate in five reporting segments: commercial/industrial real estate; resort/residential real estate development; mineral resources; farming; and ranch operations.
Activities within the commercial/industrial real estate segment include: entitling, planning, and permitting of land for development; construction of infrastructure; construction of pre-leased buildings; construction of buildings to be leased or sold; and the sale of land to third parties for their own development. The commercial/industrial segment generates revenues from building and land lease activities, power plant leases, communications leases, and landscape maintenance services. The primary commercial/industrial development is TRCC. TRCC includes developments east and west of Interstate 5 at TRCC-East and TRCC-West, respectively.
We are also involved in multiple joint ventures with several partners:
|
•
|
Our joint venture with TravelCenters of America, or TA/Petro, owns and operates two travel and truck stop facilities, and also operates five separate gas stations with convenience stores within TRCC-West and TRCC-East.
|
|
•
|
Three joint ventures with Rockefeller Development Group:
|
|
◦
|
Five West Parcel LLC, which owns a 606,000 square foot building in TRCC-West that is fully leased;
|
|
◦
|
18-19 West LLC, which owns 61.5 acres of land for future development within TRCC-West;
|
|
◦
|
TRCC/Rock Outlet Center LLC, which operates the Outlets at Tejon, a net leasable 326,000 square foot shopping experience;
|
|
•
|
Two joint ventures with Majestic Realty Co. to develop, manage, and operate industrial buildings within TRCC:
|
|
◦
|
TRC-MRC 1, LLC, was formed to develop and operate an approximately 480,480 square foot industrial building, which was completed during 2017 and partially leased during the first quarter of 2018 with lease negotiations for the remaining space ongoing;
|
|
◦
|
TRC-MRC 2, LLC, which owns a 651,909 square foot building in TRCC-West that is fully leased;
|
These joint ventures help us to expand our commercial/industrial business activities within TRCC.
The resort/residential real estate segment is actively involved in the land entitlement and development process through wholly-owned subsidiaries and a joint venture. Our active developments within resort/residential are MV, Centennial, and Grapevine.
|
•
|
MV encompasses a total of 26,417 acres, of which 5,082 acres will be used for the mixed-use development that will include housing, retail, and commercial components. MV is entitled for 3,450 homes, 160,000 square feet of commercial development, 750 hotel keys, and more than 21,335 acres of open space.
|
|
•
|
The Centennial development is a mixed-use master planned community development encompassing 12,323 acres of our land within Los Angeles County. Upon completion of Centennial, it is estimated that the community will include approximately 19,333 homes, and 10.1 million square feet of commercial development.
|
33
|
•
|
Grapevine is an 8,010-acre potential development area located on the San Joaquin Valley floor area of our lands, adjacent to TRCC. Grapevine has received approval for 12,000 homes, 5.1 million square feet for commercial development, and more than 3,367 acres of open space and parks.
|
Please refer to our Annual Report on Form 10-K for the year ended
December 31, 2017
, for a more detailed description of our active developments within the resort/residential segment.
Our mineral resources segment generates revenues from oil and gas royalty leases, rock and aggregate mining leases, a lease with National Cement, and water sales.
The farming segment produces revenues from the sale of wine grapes, almonds, pistachios, and hay.
Our ranch operations segment consists of game management revenues and ancillary land uses such as grazing leases and filming. Ranch operations is charged with the upkeep, maintenance, and security of all 270,000 acres of land. Within game management we operate High Desert Hunt Club, an upland bird hunting club, along with various game hunting memberships.
For the first
six
months of
2018
we had a net income attributable to common stockholders of
$460,000
compared to net loss attributable to common stockholders of
$2,078,000
for the first
six
months of 2017. The key driver for this is a
$4,138,000
improvement within our mineral resources segment driven by improved water sales. Offsetting this improvement were reductions in farming and joint venture operating results of
$643,000
and
$969,000
, respectively.
This Management’s Discussion and Analysis of Financial Condition and Results of Operations provides a narrative discussion of our results of operations. It contains the results of operations for each reporting segment of the business and is followed by a discussion of our financial position. It is useful to read the reporting segment information in conjunction with Note 14 (Reporting Segments and Related Information) of the Notes to Unaudited Consolidated Financial Statements.
Critical Accounting Policies
The preparation of our interim financial statements in accordance with GAAP requires us to make estimates and judgments that affect the reported amounts of assets, liabilities, revenues and expenses, and related disclosure of contingent assets and liabilities. We consider an accounting estimate to be critical if (1) the accounting estimate requires us to make assumptions about matters that were highly uncertain at the time the accounting estimate was made, and (2) changes in the estimates that are likely to occur from period to period, or use of different estimates that we reasonably could have used in the current period, would have a material impact on our financial condition or results of operations. On an on-going basis, we evaluate our estimates, including those related to revenue recognition, impairment of long-lived assets, capitalization of costs, profit recognition related to land sales, stock compensation, and our defined benefit retirement plan. We base our estimates on historical experience and on various other assumptions that are believed to be reasonable under the circumstances, the results of which form the basis for making judgments about the carrying values of assets and liabilities that are not readily apparent from other sources. Actual results may differ from these estimates under different assumptions or conditions.
During the six months ended June 30, 2018, other than the following, our critical accounting policies have not changed since the filing of our Annual Report on Form 10-K for the year ended
December 31, 2017
. Please refer to that filing for a description of our critical accounting policies. Please also refer to Note 1 (Basis of Presentation) in the Notes to Unaudited Consolidated Financial Statements in this report for newly adopted accounting principles.
The accounting policy change is attributable to the adoption of the Financial Accounting Standards Board (“FASB”) Accounting Standards Update (“ASU”) No. 2014-09, Revenue from Contracts with Customers (the “new revenue standard” or Accounting Standards Codification Topic 606, (“ASC 606”)) on January
34
1, 2018. These revenue recognition policy updates are applied retrospectively in our financial statements from December 1, 2017 forward. Reported financial information for the historical comparable period was revised and reported under the new accounting standard in effect.
ASC 606 - "Revenue from Contracts with Customers"
Leases subject to ASC 840 - "Leases"
Commercial Leases:
Rental income from leases is recognized on a straight-line basis over the respective lease terms. We classify amounts currently recognized as income, and amounts expected to be received in later years, as an asset in deferred rent in the accompanying consolidated balance sheets. Amounts received currently, but recognized as income in future years, are classified in accounts payable, accrued expenses, and tenant security deposits in the accompanying consolidated balance sheets. We commence recognition of rental income at the date the property is ready for its intended use and the client tenant takes possession of or controls the physical use of the property. During the term of each lease, we monitor the credit quality of our tenants by (i) reviewing the credit rating of tenants that are rated by a nationally recognized credit rating agency, (ii) reviewing financial statements of the client tenants that are publicly available or that are required to be delivered to us pursuant to the applicable lease, (iii) monitoring news reports regarding our tenants and their respective businesses, and (iv) monitoring the timeliness of lease payments. We have employees who are assigned the responsibility for assessing and monitoring the credit quality of our tenants and any material changes in credit quality. The Company’s commercial sales, or land sales, are non-reoccurring in nature, however, for any new land sale, we apply the concepts of this new accounting standard, as amended.
Production Leases:
The Company leases land to third parties and recognizes contingent revenue based on the royalty rate that is tied to production for oil and minerals. Royalty revenues are contractually defined as to the percentage of royalty and are tied to production and market prices. The Company’s royalty arrangements generally require payment on a monthly basis with the payment based on the previous month’s activity. The Company accrues monthly royalty revenues based upon estimates and adjusts to actual as the Company receives payments. Productions leases included the following: Oil and gas, cement, and rock aggregate, refer to Note 14, Reporting Segments and Related Information, for further discussion.
Grazing:
The Company leases land to third parties for grazing of cattle. Under the terms the lease, we recognize revenue based on the number of cattle the grazing land will support, calculated in arrears.
Revenue from Contracts with Customers subject to ASC 606:
A portion of the Company’s revenues result from the sale of goods or services and reflect the consideration to which the Company expects to be entitled. The Company records revenue based on a five-step model in accordance with ASC 606. For its customer contracts, the Company identifies the performance obligations (goods or services), determines the transaction price, allocates the contract transaction price to the performance obligations, and recognizes the revenue when (or as) the performance obligation is transferred to the customer. A good or service is transferred when (or as) the customer obtains control of that good or service. The majority of the Company’s revenues are recorded at a point in time from the sale of tangible products.
Farming
|
•
|
Almonds and Pistachios:
Almond and pistachio revenues are based upon the contract settlement price or estimated selling price. Estimated prices for almonds and pistachios are based upon the quoted estimate of what the final market price established by processors. These market price estimates are updated through the crop installment payments as new information is received as to the final settlement price for the crop sold. This method of recognizing revenues on the sale of orchard crops is a standard practice within the agribusiness community. Adjustments for differences between original estimates and actual revenues received are recorded during the period
|
35
in which such amounts become known. Revenue for almonds and pistachios is recognized based on market price estimates when delivered to buyers.
|
•
|
Wine grapes:
The Company sells wine grapes based on contracts with third parties. Wine grapes revenue is recognized based on the contract selling price when delivered to buyers.
|
|
•
|
Hay:
Hay sales are recognized at a point in time when the related transaction is completed.
|
Water sales
Water sales are recognized at a point in time when the related transaction is completed.
Other
|
•
|
Game Management:
The Company provides memberships for hunting seasons both on an annual and seasonal basis. Revenue from memberships are recognized over the passage of time, generally this corresponds to the hunting season. Revenues from individual non-member hunts are recognized when the related transaction is completed.
|
|
•
|
Equestrian Center:
The Company recognizes revenue from monthly rental fees charged for boarding facilities.
|
|
•
|
Filming:
Tejon Ranch provides access for on-site filming of commercials, movies and photo opportunities, revenues are recognized at a point in time when the related transaction, or access, is provided.
|
|
•
|
Landscaping:
Tejon Ranch provides landscaping services to third parties, revenues are recognized at a point in time when the related transaction, or service, is provided.
|
|
•
|
Management Fees:
Management fees are generally recognized at the end of each month based on the contractual amounts agreed upon by third parties and the Company.
|
For disaggregated revenue information on the aforementioned, refer to Note 14, Reporting Segments and Related Information, for further discussion.
The Company does not offer volume rebates, product returns, discounts and allowances as such, no variable consideration impacts the recording of revenue.
The Company’s revenues can be generated from contracts with multiple performance obligations. When a sales agreement involves multiple performance obligations, each obligation is separately identified, and the transaction price is allocated based on the amount of consideration the Company expects to be entitled to in exchange for transferring the promised good or service to the customer.
For performance obligations that the Company satisfies over time, revenue is recognized by consistently applying a method of measuring progress toward complete satisfaction of that performance obligation. The Company utilizes the method that most accurately depicts the progress toward completion of the performance obligation.
Contract assets or liabilities result from transactions with revenue recorded over time. If the measure of remaining rights exceeds the measure of the remaining performance obligations the Company records a contract asset. Conversely, if the measure of the remaining performance obligations exceeds the measure of the remaining rights, the Company records a contract liability.
36
The adoption of ASC 606 did not have an impact on our accounts receivables. Accounts receivables resulting from contracts with customers are as follows:
|
June 30, 2018
|
December 31, 2017
|
||||
|
Subject to ASC 606
|
|||||
|
Farming
|
1,067
|
|
5,745
|
|
|
|
Management Fees
|
281
|
|
744
|
|
|
|
Ranch Operations
|
260
|
|
209
|
|
|
|
Total Subject to ASC 606
|
1,608
|
|
6,698
|
|
|
|
Not Subject to ASC 606
|
|||||
|
Leases
|
1,074
|
|
885
|
|
|
|
Other
|
33
|
|
25
|
|
|
|
Total Not Subject to ASC 606
|
1,107
|
|
910
|
|
|
|
Total Accounts Receivable
|
2,715
|
|
7,608
|
|
|
37
Results of Operations
Comparison of
six
months ended
June 30, 2018
to
six
months ended
June 30, 2017
Total revenues for the first
six
months of
2018
were
$18,539,000
compared to
$11,665,000
for the first
six
months of
2017
, representing
an increase
of
$6,874,000
, or
59%
. The increase is attributed to increased mineral resource revenues of
$7,111,000
resulting from Kern County's moderate drought conditions allowing for water sales opportunities during the first
six
months of 2018.
Real Estate – Commercial/Industrial:
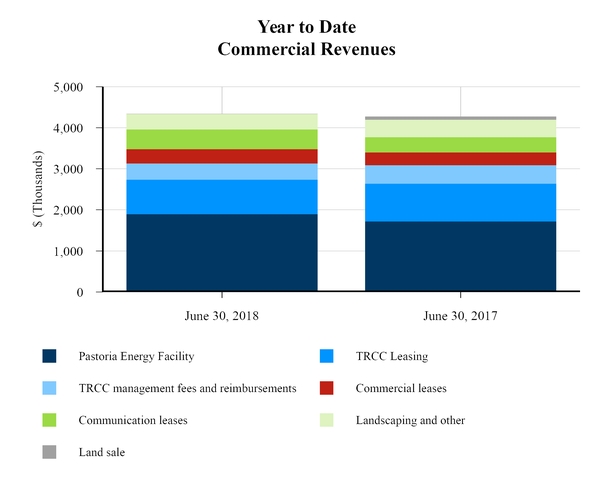
Commercial/industrial real estate segment revenues were
$4,343,000
for the first
six
months of
2018
,
an increase
of
$71,000
, or
2%
, from
$4,272,000
when compared to the first
six
months of
2017
. The increase is primarily attributed to rent escalations of $166,000 associated with our Pastoria Energy Facility and commercial leases. The increase was offset by the absence of land sales revenues of $73,000.
Commercial/industrial real estate segment expenses were
$2,707,000
during the first
six
months of
2018
,
a decrease
of
$938,000
, or
26%
, from
$3,645,000
when compared to the same period in
2017
. This decrease is attributed to reduced payroll and overhead of $525,000 and stock compensation of $133,000. We also saw decreases in land sales costs and professional services of $64,000 and $76,000, respectively.
Real Estate – Resort/Residential:
Resort/residential real estate segment expenses were
$848,000
during the first
six
months of
2018
,
a decrease
of
$282,000
, or
25%
. The decrease is attributed to reduced professional expenses, namely consulting costs, of $294,000.
38
Mineral Resources:

Mineral resources segment revenues were
$10,631,000
for the first
six
months of
2018
,
an increase
of
$7,111,000
, or
202%
, from
$3,520,000
when compared to the same period in
2017
. During the first quarter, Kern County was under moderate drought conditions increasing water sales opportunities. Comparatively, we sold 7,442 acre-feet and 939 acre-feet as of
June 30, 2018
and 2017, respectively. We have entered into a contract with a third-party to sell 7,000 acre-feet of water over the next two years. We also saw an increase in oil royalties of $360,000 resulting from increased commodity prices. The average price per barrel of oil was $67 and $35 as of the
six
months ended
June 30, 2018
and 2017, respectively.
Mineral resources segment expenses were
$4,826,000
for the first
six
months of
2018
,
an increase
of
$2,973,000
, or
160%
, compared to the same period in
2017
. The increase in costs is related to the increased water sales discussed above.
39
Farming:

Farming segment revenues were
$1,737,000
for the first
six
months of
2018
,
a decrease
of
$195,000
, or
10%
, from
$1,932,000
when compared to the same period in
2017
. The
$195,000
decrease is primarily attributable to a $485,000 decrease in 2017 carryover pistachio sales. Comparatively we sold 38,000 pounds and 148,000 pounds as of
June 30, 2018
and 2017, respectively. We also saw a $105,000 decrease in other revenues resulting from a reduction in the number of farm acres leased. Offsetting the revenue declines were increases in 2017 carryover almond sales of $384,000. Comparatively we sold 412,000 pounds and 177,000 pounds as of
June 30, 2018
and 2017, respectively.
Farming segment expenses were
$3,029,000
for the first
six
months of
2018
,
an increase
of
$448,000
, or
17%
, from
$2,581,000
when compared to the same period in
2017
. During this period, we saw an increase in almond cost of sales of $648,000 and a decrease in pistachio cost of sales of $196,000 for the reasons discussed above.
Ranch Operations:
Ranch operations revenues were
$1,828,000
for the first
six
months of
2018
,
a decrease
of
$113,000
, or
6%
, from
$1,941,000
for the same period in
2017
. The decrease is attributed to reductions in grazing revenues of $91,000 and filming revenues of $21,000.
Ranch operations expenses were
$2,737,000
for the first
six
months of
2018
,
a decrease
of
$217,000
, or
7%
, from
$2,954,000
for the same period in
2017
. The drivers of this decrease include reduced payroll and overhead costs of $128,000, depreciation expense of $30,000, fees $21,000 and repairs and maintenance of $18,000.
40
Corporate and Other:
Corporate general and administrative costs were
$5,196,000
,
an increase
of
$77,000
, or
2%
, from
$5,119,000
for the same period in
2017
. The increase is attributed to an increase in professional services of $119,000 offset by a reduced costs related to supplies and utility charges during the period when compared to prior year.
Joint Ventures:
Our share of earnings from our joint ventures for the first
six
months of
2018
was
$819,000
,
a decrease
of
$969,000
, or
54%
, from
$1,788,000
for the same period in
2017
. The primary drivers include the following:
|
•
|
There was a
$1,008,000
decrease
in our share of earnings from our TA/Petro joint venture. The decline is driven by reduced fuel margins as a result of increased gasoline and diesel costs. Comparatively diesel margins were 20 cents and 31 cents per gallon as of
June 30, 2018
and
2017
, respectively. Comparatively gasoline margins were 49 cents and 66 cents per gallon as of
June 30, 2018
and
2017
, respectively. Diesel sales volumes were 7.9 million and 8.4 million gallons as of
June 30, 2018
and
2017
, respectively. Gasoline sales volumes were 6.6 million and 6.4 million gallons as of
June 30, 2018
and
2017
, respectively.
|
|
•
|
Our share of earnings from our TRCC/Rock Outlet Center joint venture
decreased
$631,000
resulting from acceleration of amortization of lease intangibles driven by the removal of poor preforming tenants. We are actively seeking tenants for the vacated retail space.
|
|
•
|
There was a
$761,000
improvement from our TRC-MRC 2 joint venture. Throughout 2017, TRC-MRC 2 incurred significant non-cash GAAP accounting losses that did not reoccur in 2018. Please refer to "Non-GAAP Measures" for further financial discussion on our joint ventures.
|
41
Comparison of
three
months ended
June 30, 2018
to
three
months ended
June 30, 2017
Total revenues for the
three
months ended
June 30, 2018
were
$5,070,000
compared to
$5,963,000
for the
three
months ended
June 30, 2017
representing
a decrease
of
$893,000
, or
15%
. The decrease is primarily attributable to a decline in farming revenues of
$959,000
. The decrease was offset by improvements seen within our commercial/industrial segment.
Real Estate – Commercial/Industrial:
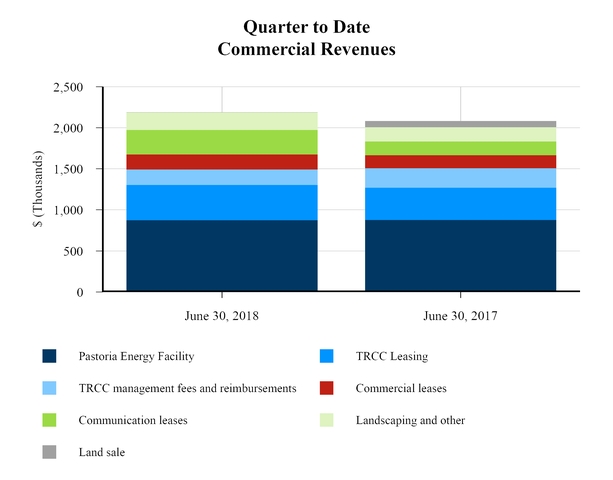
Commercial/industrial real estate segment revenues were
$2,189,000
for the
three
months ended
June 30, 2018
,
an increase
of
$106,000
, or
5%
, from
$2,083,000
for the
three
months ended
June 30, 2017
. The improvement is attributed to rent escalations on our leases discussed for the six-months ended June 30, 2018 above.
Commercial/industrial real estate segment expenses were
$1,388,000
during the
three
months ended
June 30, 2018
,
a decrease
of
$514,000
, or
27%
, from
$1,902,000
for the same period in
2017
. This decrease is attributed to reductions in payroll, overhead and stock compensation of $309,000. Additionally, in the absence of a land sale we saw reduction in the cost of sales of land of $64,000.
Real Estate – Resort/Residential:
Resort/residential real estate segment expenses were
$433,000
during the
three
months ended
June 30, 2018
,
a decrease
of
$67,000
, or
13%
, from
$500,000
for the same period in
2017
. The decrease is attributed to reduced professional service costs for the same reasons discussed for the six-months ended June 30, 2018 above.
42
Mineral Resources:

Mineral resources segment revenues were
$1,500,000
for the
three
months ended
June 30, 2018
,
a decrease
of
$19,000
, or
1%
, from
$1,519,000
for the same period in
2017
. Although we saw increases in oil royalties resulting from an increase in average commodity prices, we experienced reductions in areas such as cement production and reimbursements from our mineral lease tenants. Please refer to Footnote 14 - Reporting Segments and Related Information for further details regarding revenue components of the mineral resources segment.
Mineral resources segment expenses were
$595,000
for the
three
months ended
June 30, 2018
,
an increase
of
$66,000
, or
12%
, from
$529,000
for the same period in
2017
. The increase resulted from consulting costs associated with our water activities.
43
Farming:
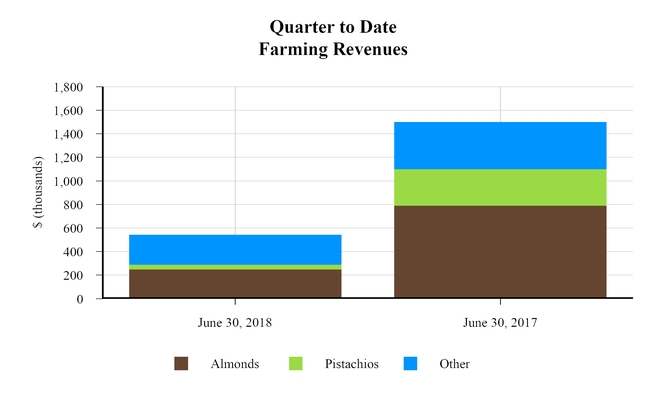
Farming segment revenues were
$542,000
for the
three
months ended
June 30, 2018
,
a decrease
of
$959,000
, or
64%
, compared to
$1,501,000
for the same period in
2017
. The
$959,000
change is primarily attributable to the following:
|
•
|
Almond revenues decreased $540,000 resulting from reduced 2017 carryover almond sales. During the comparative periods, we sold 86,000 and 177,000 pounds during the quarters ended
June 30, 2018
and 2017, respectively.
|
|
•
|
Pistachio revenues decreased $271,000 resulting from reduced 2017 carryover pistachio sales. During the comparative periods, we sold 38,000 and 148,000 pounds during the quarters ended
June 30, 2018
and 2017, respectively.
|
|
•
|
The remainder of the decrease is attributed to reduced farm land lease revenues resulting from fewer acres leased as discussed above.
|
Farming segment expenses were
$1,191,000
for the
three
months ended
June 30, 2018
,
a decrease
of
$67,000
, or
5%
, compared to
$1,258,000
for the same period in
2017
. The decrease is attributed to the reduced pistachio and almond sales discussed above.
Ranch Operations:
Ranch operations revenues were
$839,000
for the
three
months ended
June 30, 2018
,
a decrease
of
$21,000
, or
2%
, from
$860,000
during the same period in
2017
. The decrease is largely attributed to a decrease in grazing revenues of $73,000, this decrease is offset by increases in game management of $31,000 and filming of $28,000. Please refer to Footnote 14 - Reporting Segments and Related Information for further details regarding revenue components of the ranch operations segment.
.
44
Ranch operations expenses were
$1,348,000
for the
three
months ended
June 30, 2018
,
a decrease
of
$113,000
, or
8%
, compared
$1,461,000
for the same period in
2017
. The decrease is primarily attributed to reductions in payroll, overhead, and bonuses of $103,000. All other decreases are attributed to declines in repairs and maintenance and supply costs.
Corporate and Other:
Corporate general and administrative costs were
$2,464,000
,
an increase
of
$96,000
, or
4%
, compared to the same period in
2017
. This increase is mainly attributed to an increase of $30,000 in depreciation as we placed in service more assets in the quarter when compared to the prior period. In addition, we experienced an increase in insurance charges of $45,000 stemming from a refund received in 2017.
Joint Ventures:
Our share of earnings from our joint ventures was
$652,000
,
a decrease
of
$908,000
, or
58%
, during the
second
quarter of
2018
when compared to the same period in
2017
. The primary drivers include the following:
|
•
|
There was a
$639,000
decrease
in our share of earnings from our TA/Petro joint venture driven by reduced fuel margins resulting from increased fuel costs. Comparatively diesel margins were 22 cents and 34 cents per gallon as of the quarters ended
June 30, 2018
and
2017
, respectively. Comparatively gasoline margins were 52 cents and 68 cents per gallon as of the quarters ended
June 30, 2018
and
2017
, respectively. Diesel sales volumes were 4.1 million and 4.2 million gallons as of the quarters ended
June 30, 2018
and
2017
, respectively. Gasoline sales volumes were 3.6 million and 3.7 million gallons as of the quarters ended
June 30, 2018
and
2017
, respectively.
|
|
•
|
Our share of earnings from our TRCC/Rock Outlet Center
decreased
$588,000
resulting from acceleration of amortization of lease intangibles driven by the removal of poor preforming tenants. We are actively seeking tenants for the vacated retail space.
|
|
•
|
There was a
$372,000
improvement from our TRC-MRC 2 joint venture. Throughout 2017, TRC-MRC 2 incurred significant non-cash GAAP accounting losses that did not reoccur in 2018. Please refer to "Non-GAAP Measures" for further financial discussion on our joint ventures.
|
General Outlook
The operations of the Company are seasonal and future results of operations cannot be predicted based on quarterly results. Historically, the Company's largest percentages of farming revenues are recognized during the third and fourth quarters of the fiscal year. Real estate activity and leasing activities are dependent on market circumstances and specific opportunities and therefore are difficult to predict from period to period.
Commercial
For the
six
months ended
June 30, 2018
we had no leases that expired, nor did we have any material lease renewals.
The logistics operators currently located within our commerce center have demonstrated success in serving all of California and the western region of the United States, and we are building from their success in our marketing efforts. We will continue to focus our marketing strategy for TRCC-East and TRCC-West on the significant labor and logistical benefits of our site, the pro-business approach of Kern County, and the demonstrated success of the current tenants and owners within our development. Our strategy fits within the logistics model that many companies are using, which favors large, centralized
45
distribution facilities which have been strategically located to maximize the balance of inbound and outbound efficiencies, rather than a number of decentralized smaller distribution centers. The world class logistics operators located within TRCC have demonstrated success through utilization of this model. With access to markets of over 40 million people for next-day delivery service, they are also demonstrating success with e-commerce fulfillment.
During 2018, approval for expansion of the Foreign Trade Zone (FTZ) was granted by the U.S. Department of Commerce. The expanded FTZ now covers all the industrial sites within TRCC, an area totaling 1,094 acres. The FTZ designation allows the user to secure the many benefits and cost reductions associated with streamlined movement of goods in and out of the zone. This FTZ designation is further supplemented by the Economic Development Incentive Policy, or EDIP adopted by the Kern County Board of Supervisors. EDIP is aimed to expand and enhance the County's competitiveness by taking affirmative steps to attract new businesses and to encourage the growth and resilience of existing businesses. The EDIP provides incentives such as tax breaks, building supporting infrastructure, or workforce development.
We believe that the FTZ and EDIP along with our ability to provide fully-entitled, shovel-ready land parcels to support buildings of any size, especially buildings 1.0 million square feet or larger, can provide us with a potential marketing advantage in the future. We are also expanding our marketing efforts to include industrial space users in the Santa Clarita Valley of northern Los Angeles County, and the northern part of the San Fernando Valley due to the limited availability of new product and high real estate costs in these locations. Tenants in these geographic areas are typically users of relatively smaller facilities. In pursuit of such opportunities, the Company partnered with Majestic Realty Co. in the development of a 480,000 square foot, state-of-the-art distribution facility that was completed in the third quarter of 2017. Currently, half the building is leased while the other half is under lease negotiations.
A potential disadvantage to our development strategy is our distance from the ports of Los Angeles and Long Beach in comparison to the warehouse/distribution centers located in the Inland Empire, a large industrial area located east of Los Angeles, which continues its expansion eastward beyond Riverside and San Bernardino, to include Perris, Moreno Valley, and Beaumont. As development in the Inland Empire continues to move east and farther away from the ports, our potential disadvantage of our distance from the ports is being mitigated. Strong demand for large distribution facilities is driving development farther east in a search for large entitled parcels.
During the quarter ended
June 30, 2018
, vacancy rates in the Inland Empire increased from 3.7% to end at 3.8% when compared to
December 31, 2017
, primarily due to strong absorption. Lease rates have increased in the Inland Empire by $0.04 per square foot over the past 12 months, this increase may begin to give us a greater pricing advantage due to our low land basis.
During the quarter ended June 31, 2018, vacancy rates in the northern Los Angeles industrial market, which includes the San Fernando Valley and Santa Clarita Valley, increased 20 basis points from 1.7% to end at 1.9% when compared to
December 31, 2017
. The northern Los Angeles industrial market continues to see available supply remain at extremely low levels, and with limited new construction, this will result in vacancy remaining at all-time lows and rental rates anticipated to continue to increase. Demand for industrial space in this market will continue to be driven by domestic and global consumption levels.
We expect that the commercial/industrial real estate segment will continue to incur costs at current levels, net of amounts capitalized, primarily related to marketing costs, commissions, planning costs, and staffing costs as we continue forward with our development plans.
Resort Residential
Most of the expenditures and capital investment to be incurred within our resort/residential real estate segment will continue to focus on the following:
46
|
•
|
For Grapevine, we are working with Kern County to defend litigation related to the approved EIR. The entire litigation and permitting process for Grapevine will take several years and the investment of several million dollars to successfully complete.
|
|
•
|
For Centennial, we are working with the Los Angeles County Department of Regional Planning to prepare the release of the Final Environmental Impact Report that will be considered first by the Los Angeles County Regional Planning Commission during the third quarter of 2018, and later by the Board of Supervisors.
|
|
•
|
For MV, we have a fully permitted and entitled project and received approval of Tentative Tract Map 1 for our first three phases of development. The timing of MV development in the coming years will be dependent on the strength of both the economy and the real estate market including both primary and second home markets. In moving the project forward, we will focus on the preparation of engineering leading to the final map for the first phases of MV, consumer and market research studies and fine tuning of development business plans as well as defining the possible capital funding sources for this development. We also obtained approval on the Farm Village commercial site plan from Kern County. Farm Village will serve as the “front door” to MV. Farm Village will include fresh culinary offerings, artisan markets, boutique lodging, and an array of trails, gardens, and agriculture that will be intertwined to create the most unique, relaxing and “edu-taining” experience while fulfilling the needs of residents of Mountain Village.
|
Farming
Freezing temperatures experienced in February appear to have not impacted production within California's almond industry in any significant amount at this time. Our almond crops did not experience any significant level of frost damage; however the suboptimal weather conditions may have prevented bees from adequately pollinating our almonds. Harvest has not begun, and at this time it is still too early to determine 2018 almond, pistachio and wine grape yields will be. Due to our exposure to the commodity markets, we are unable to accurately predict revenue and we cannot pass on to our customers any cost increases caused by general inflation, except to the extent such inflation is reflected in market conditions and commodity prices. Additionally, we are unable to predict the outcome of ongoing trade discussions with foreign nations nor are we able to predict the resulting impact over crop demand or pricing. Lastly, increased tariffs from China and India which are major customers of almonds and pistachios, can make American products less competitive and push customers to switch to another producing country. All of our crops are sensitive to the size of each year’s world crop. Large crops in California and abroad can rapidly depress prices. Thus far in 2018, prices for almonds and pistachios have seen some decline due to the uncertainly surrounding trade tariffs.
Mineral Resources
As anticipated changes come in the future related to groundwater management within California, such as limited pumping in the over drafted groundwater basins outside of our lands, we believe that water banking operations, ground water recharge programs, and access to water contracts as we have purchased in the past will become even more important and valuable in servicing our projects. The 2018 moderate drought conditions have led to water sales opportunities, including multi-year agreements as we have done in the past. We expect to only have limited water sales opportunities for the remainder of the year.
47
For further discussion of the risks and uncertainties that could potentially adversely affect us, please refer to Part I, Item 7 – “Management’s Discussion and Analysis of Financial Condition and Results of Operations” in the Company’s Annual Report on Form 10-K for the year ended
December 31, 2017
, or Annual Report, and to Part I, Item 1A - "Risk Factors" of our Annual Report. We continue to be involved in various legal proceedings related to leased acreage. For a further discussion, please refer to Note 12 (Commitments and Contingencies) of the Notes to Unaudited Consolidated Financial Statements in this report.
Income Taxes
For the
six
months ended
June 30, 2018
, the Company had net income tax expense of
$178,000
compared to a net income tax benefit of
$1,804,000
for the
six
months ended
June 30, 2017
. These represent effective tax rates of approximately
29%
and
46%
for the
six
months ended
June 30, 2018
and,
2017
, respectively. As of
June 30, 2018
, income tax receivables were
$1,243,000
. The Company classifies interest and penalties incurred on tax payments as income tax expenses.
48
Cash Flow and Liquidity
Our financial position allows us to pursue our strategies of land entitlement, development, and conservation. Accordingly, we have established well-defined priorities for our available cash, including investing in core reporting segments to achieve profitable future growth. We have historically funded our operations with cash flows from operating activities, investment proceeds, and short-term borrowings from our bank credit facilities. In the past, we have also issued common stock and used the proceeds for capital investment activities.
To enhance shareholder value, we will continue to make investments in our real estate segments to secure land entitlement approvals, build infrastructure for our developments, ensure adequate future water supplies, and provide funds for general land development activities. Within our farming segment, we will make investments as needed to improve efficiency and add capacity to its operations when it is profitable to do so.
On October 27, 2017, the Company completed a Rights Offering raising $90,000,000 in new capital.
Our cash, cash equivalents and marketable securities totaled
$80,563,000
at
June 30, 2018
, a decrease of
$10,412,000
from
$90,975,000
as of
December 31, 2017
. The use of cash is attributed to ongoing development costs associated with our commercial/industrial and resort/residential segments.
The following table shows our cash flow activities for the
six
months ended
June 30,
|
(in thousands)
|
2018
|
2017
|
|||||
|
Operating activities
|
$
|
4,558
|
|
$
|
(1,642
|
)
|
|
|
Investing activities
|
$
|
(10,792
|
)
|
$
|
(8,955
|
)
|
|
|
Financing activities
|
$
|
(3,262
|
)
|
$
|
9,861
|
|
|
Operating Activities
During the first
six
months of
2018
, our operations generated
$4,558,000
in cash largely due to the water sales discussed above and collection of accounts receivable offset by the buildup of inventoried crop costs.
During the first six months of 2017, our operations used $1,642,000 of cash in order to fund crop growing costs.
Investing Activities
During the first
six
months of
2018
, investing activities used
$10,792,000
of cash, in part, as a result of
$10,386,000
in capital expenditures. Capital expenditures, inclusive of capitalized interest and payroll, include predevelopment activities for our master planned communities which include tentative tract maps and planning and design for Farm Village totaling
$2,086,000
for MV; expenditures relating to regulatory permits and litigation of
$1,188,000
for Grapevine, and costs related to approval of specific plan of
$1,913,000
for Centennial. At TRCC, we spent
$2,723,000
on water treatment facility improvements, water infrastructure improvements and planning. Within our farming segment, we spent $2,061,000 replacing old machinery and equipment along with developing new almond orchards. We also purchased marketable securities and water for
$17,959,000
and
$2,659,000
, respectively. Our capital outlays were offset by distributions from unconsolidated joint ventures of
$373,000
, CFD reimbursements of
$1,385,000
and proceeds from maturity of marketable securities of
$18,455,000
. As we move forward, we will continue to use cash from operations, proceeds from the maturity of securities, and anticipated distributions from joint ventures to fund real estate project investment.
During the first six months of 2017, investing activities used $8,955,000 of cash as a result of $10,943,000 in capital expenditures. Capital expenditures, inclusive of capitalized interest and payroll, include predevelopment activities for our master planned communities which amounted to $2,551,000 for MV,
49
$2,063,000 for Grapevine, and $1,810,000 for Centennial. At TRCC East, we spent $2,481,000 for infrastructure projects. Within our farming segment, we spent $1,340,000 replacing old machinery and equipment along with developing a new almond orchard. We spent $404,000 within our mineral resources group for new wells and water turnouts. Additionally, we used $4,468,000 for our purchase of water under the Nickel water contract along with water recharge costs. Our capital outlays were offset by distributions from unconsolidated joint ventures of $2,848,000 and proceeds from maturity of marketable securities of $4,115,000.
Our estimated capital investment, inclusive of capitalized interest and payroll, for the remainder of
2018
will be primarily related to real estate projects. Estimated capital investment includes approximately
$5,387,000
of infrastructure development at TRCC-East. This new infrastructure is to support continued commercial retail and industrial development within TRCC-East and to expand water facilities to support future anticipated absorption. We expect to possibly invest
$2,322,000
in permitting and planning activities and defending the approved EIR for Grapevine,
$3,832,000
for final approval of tentative tract maps and design activities related to commercial development for MV, and
$3,788,000
related to the specific plan EIR, approval of EIR, and mapping activities for Centennial.
We capitalize interest cost as a cost of the project only during the period for which activities necessary to prepare an asset for its intended use are ongoing, provided that expenditures for the asset have been made and interest cost has been incurred. Capitalized interest for the
six
months ended
June 30, 2018
and
2017
, of
$1,479,000
and
$1,745,000
, respectively, is classified in real estate development. We also capitalized payroll and overhead costs related to development, pre-construction, and construction projects which aggregated
$2,073,000
and
$842,167
for the
six
months ended
June 30, 2018
and
2017
, respectively. The increase in capitalized payroll and overhead costs is attributed to additional employees working on our real estate development projects. Expenditures for repairs and maintenance are expensed as incurred.
Financing Activities
During the first
six
months of
2018
, financing activities used
$3,262,000
in cash primarily for servicing of long-term debt of
$2,033,000
and tax payments on vested share grants of
$1,063,000
.
During the first six months of 2017, financing activities provided $9,861,000 in cash primarily through $12,300,000 in drawdowns from our line of credit. As of June 30, 2017, there was an outstanding balance of $20,000,000 on our revolving line of credit. The use of our line of credit primarily reflects the cyclical nature of cash flow in our farming segment as inventory costs build as we move into the second half of the year and the harvest season begins and to water activity during the quarter. The cash inflows were offset by servicing of long-term debt of $1,899,000 and tax payments on vested share grants of $540,000.
It is difficult to accurately predict cash flows due to the nature of our business segments and fluctuating economic conditions. Our earnings and cash flows will be affected from period to period by the commodity nature of our farming and mineral operations, the timing of sales and leases of property within our development projects, and the beginning of development within our residential projects. The timing of sales and leases within our development projects is difficult to predict due to the time necessary to complete the development process and negotiate sales or lease contracts. Often, the timing aspect of land development can lead to particular years or periods having more or less earnings than comparable periods. Based on our experience, we believe we will have adequate cash flows, cash balances, and availability on our line of credit over the next twelve months to fund internal operations. As we move forward with the completion of the entitlement process for our master planned communities and prepare to move into the development stage, we will need to secure additional funding through the issuance of equity and secure other forms of financing such as joint ventures and possibly debt financing.
50
We continuously evaluate our short-term and long-term capital investment needs. Based on the timing of capital investments, we may supplement our current cash, marketable securities, and operational funding sources through the sale of common stock and the use of additional debt.
Capital Structure and Financial Condition
At
June 30, 2018
, total capitalization at book value was $
497,521,000
consisting of
$67,926,000
of debt and
$429,595,000
of equity, resulting in a long-term debt-to-total-capitalization ratio of approximately
13.7%
.
The Company has a Term Loan and a Revolving Line of Credit Note, or collectively the Credit Facility, with Wells Fargo. The Credit Facility consists of a $70,000,000 term note, or Term Loan, and a
$30,000,000
revolving line of credit, or RLC. Any future borrowings under the RLC will be used for ongoing working capital requirements and other general corporate purposes. To maintain availability of funds under the RLC, undrawn amounts under the RLC will accrue a commitment fee of 10 basis points per annum. The Company's ability to borrow additional funds in the future under the RLC is subject to compliance with certain financial covenants and making certain representations and warranties. At the Company’s option, the interest rate on the RLC can float at 1.50% over a selected LIBOR average or can be fixed at 1.50% above LIBOR for a fixed rate term. During the term of the Credit Facility (which matures in September 2019), we can borrow at any time and partially or wholly repay any outstanding borrowings and then re-borrow, as necessary. At
June 30, 2018
and December 31, 2017, the RLC had an outstanding balance of
$0
. The Term Loan had outstanding balances of
$64,277,000
and
$66,046,000
as of
June 30, 2018
and
December 31, 2017
, respectively.
The interest rate per annum applicable to the Term Loan is LIBOR (as defined in the Term Note) plus a margin of 170 basis points. The interest rate for the term of the note has been fixed through the use of an interest rate swap at a rate of 4.11%. The Term Loan required interest only payments for the first two years of the term and thereafter requires monthly amortization payments pursuant to a schedule set forth in the Term Loan, with the final outstanding principal amount due October 5, 2024. The Company may make voluntary prepayments on the Term Loan at any time without penalty (excluding any applicable LIBOR or interest rate swap breakage costs). Each optional prepayment will be applied to reduce the most remote principal payment then unpaid. The Credit Facility is secured by the Company's farmland and farm assets, which include equipment, crops and crop receivables and the power plant lease and lease site, and related accounts and other rights to payment and inventory.
The Credit Facility requires compliance with three financial covenants: (a) total liabilities divided by tangible net worth not greater than 0.75 to 1.0 at each quarter end; (b) a debt service coverage ratio not less than 1.25 to 1.00 as of each quarter end on a rolling four quarter basis; and (c) maintain liquid assets equal to or greater than $20,000,000. At
June 30, 2018
and
December 31, 2017
, we were in compliance with all financial covenants.
We also have a promissory note agreement to pay a principal amount of $4,750,000 with CMFG Life Insurance Company, to pay principal and interest due monthly. The interest rate on this promissory note is 4.25% per annum, with principal and interest payments of
$102,700
ending on September 1, 2028. The current outstanding balance is
$3,558,000
. The proceeds from this promissory note were used to eliminate debt that had been previously used to provide long-term financing for a building being leased to Starbucks and provide additional working capital for future investment. The balance of this long-term debt instrument listed above approximates the fair value of the instrument.
Our current and future capital resource requirements will be provided by current cash and marketable securities, cash flow from on-going operations, proceeds from the sale of developed and undeveloped parcels, potential sales of assets, joint venture agreements, additional use of debt, proceeds from the reimbursement of public infrastructure costs through Community Facilities District bond debt (described
51
below under “Off-Balance Sheet Arrangements”), and the issuance of common stock. During April 2016, we filed a shelf registration statement on Form S-3 that went effective in May 2016. Under the shelf registration statement, we may offer and sell in the future one or more offerings, consisting of common stock, preferred stock, debt securities, warrants or any combination of the foregoing. On October 27, 2017, the Company completed a Rights Offering raising $90,000,000 in new capital.
At
June 30, 2018
, we had
$80,563,000
in cash and securities and had
$30,000,000
available on our RLC to meet any short-term liquidity needs.
We continue to expect that substantial investments will be required in order to develop our land assets. To meet these future capital requirements, we may need to secure additional debt financing and continue to renew our existing credit facilities. In addition to debt financing, we will use other capital alternatives such as joint ventures with financial partners, sales of assets, and the issuance of common stock. We will use a combination of the above funding sources to properly match funding requirements with the assets or development project being funded. There is no assurance that we can obtain financing or that we can obtain financing at favorable terms. We believe we have adequate capital resources to fund our cash needs and our capital investment requirements in the near-term as described earlier in the cash flow and liquidity discussions.
Contractual Cash Obligations
The following table summarizes our contractual cash obligations and commercial commitments as of
June 30, 2018
, to be paid over the next five years and thereafter:
|
|
Payments Due by Period
|
||||||||||||||||||
|
(In thousands)
|
Total
|
One Year or Less
|
Years 2-3
|
Years 4-5
|
Thereafter
|
||||||||||||||
|
CONTRACTUAL OBLIGATIONS:
|
|||||||||||||||||||
|
Estimated water payments
|
$
|
253,795
|
|
$
|
687
|
|
$
|
18,218
|
|
$
|
18,846
|
|
$
|
216,044
|
|
||||
|
Long-term debt
|
67,926
|
|
4,012
|
|
8,367
|
|
9,115
|
|
46,432
|
|
|||||||||
|
Interest on long-term debt
|
13,995
|
|
2,603
|
|
4,885
|
|
4,162
|
|
2,345
|
|
|||||||||
|
Revolving line of credit borrowings
|
—
|
|
—
|
|
—
|
|
—
|
|
—
|
|
|||||||||
|
Cash contract commitments
|
10,308
|
|
8,099
|
|
1,138
|
|
—
|
|
1,071
|
|
|||||||||
|
Defined Benefit Plan
|
3,558
|
|
100
|
|
546
|
|
585
|
|
2,327
|
|
|||||||||
|
SERP
|
4,682
|
|
250
|
|
979
|
|
956
|
|
2,497
|
|
|||||||||
|
Tejon Ranch Conservancy
|
2,800
|
|
400
|
|
1,600
|
|
800
|
|
—
|
|
|||||||||
|
Financing fees and interest
|
163
|
|
163
|
|
—
|
|
—
|
|
—
|
|
|||||||||
|
Total contractual obligations
|
$
|
357,227
|
|
$
|
16,314
|
|
$
|
35,733
|
|
$
|
34,464
|
|
$
|
270,716
|
|
||||
The categories above include purchase obligations and other long-term liabilities reflected on our balance sheet under GAAP. A “purchase obligation” is defined in Item 303(a)(5)(ii)(D) of Regulation S-K as “an agreement to purchase goods or services that is enforceable and legally binding on the registrant that specifies all significant terms, including: fixed or minimum quantities to be purchased; fixed, minimum or variable price provisions; and the approximate timing of the transaction.” Based on this definition, the table above includes only those contracts that include fixed or minimum obligations. It does not include normal purchases, which are made in the ordinary course of business.
Our financial obligations to the Tejon Ranch Conservancy are prescribed in the Conservation Agreement. Our advances to the Tejon Ranch Conservancy are dependent on the occurrence of certain events and their timing, and are therefore subject to change in amount and period. The amounts included above are the
52
minimum amounts we anticipate contributing through the year 2021, at which time our current contractual obligation terminates.
As discussed in Note 13 (Retirement Plans) of the Notes to Unaudited Consolidated Financial Statements, we have long-term liabilities for deferred employee compensation, including pension and supplemental retirement plans. Payments in the above table reflect estimates of future defined benefit plan contributions from the Company to the plan trust, estimates of payments to employees from the plan trust, and estimates of future payments to employees from the Company that are in the SERP program. We plan to contribute $160,000 to our defined benefit plan in 2018.
Our cash contract commitments consist of contracts in various stages of completion related to infrastructure development within our industrial developments and entitlement costs related to our industrial and residential development projects.
Our operating lease obligations are for office equipment, several vehicles, and a temporary trailer providing office space and average approximately $25,000 per month. At the present time, we do not have any capital lease obligations or purchase obligations outstanding.
Estimated water payments include the Nickel water contract, which obligates us to purchase 6,693 acre-feet of water annually through 2044 and SWP contracts with Wheeler Ridge Maricopa Water Storage District, Tejon-Castac Water District, Tulare Lake Basin Water Storage District, and Dudley-Ridge Water Storage District. These contracts for the supply of future water run through 2035. Please refer to Note 5 (Long-Term Water Assets) of the Notes to Consolidated Financial Statements for additional information regarding water assets.
53
Off-Balance Sheet Arrangements
The following table shows contingent obligations we have with respect to certain bonds issued by the CFDs:
|
|
Amount of Commitment Expiration Per Period
|
||||||||||||||||||
|
($ in thousands)
|
Total
|
< 1 year
|
2 -3 Years
|
4 -5 Years
|
After 5 Years
|
||||||||||||||
|
OTHER COMMERCIAL COMMITMENTS:
|
|||||||||||||||||||
|
Standby letter of credit
|
$
|
4,921
|
|
$
|
—
|
|
$
|
4,921
|
|
$
|
—
|
|
$
|
—
|
|
||||
|
Total other commercial commitments
|
$
|
4,921
|
|
$
|
—
|
|
$
|
4,921
|
|
$
|
—
|
|
$
|
—
|
|
||||
The Tejon Ranch Public Facilities Financing Authority, or TRPFFA, is a joint powers authority formed by Kern County and TCWD to finance public infrastructure within the Company’s Kern County developments. TRPFFA created two CFDs, the West CFD and the East CFD. The West CFD has placed liens on
420
acres of the Company’s land to secure payment of special taxes related to
$28,620,000
of bond debt sold by TRPFFA for TRCC-West. The East CFD has placed liens on
1,931
acres of the Company’s land to secure payments of special taxes related to
$55,000,000
of bond debt sold by TRPFFA for TRCC-East. At TRCC-West, the West CFD has no additional bond debt approved for issuance. At TRCC-East, the East CFD has approximately
$65,000,000
of additional bond debt authorized by TRPFFA.
In connection with the sale of bonds there is a standby letter of credit for
$4,921,000
related to the issuance of East CFD bonds. The standby letter of credit is in place to provide additional credit enhancement and cover approximately two years of interest on the outstanding bonds. This letter of credit will not be drawn upon unless the Company, as the largest landowner in the CFD, fails to make its property tax payments. As development occurs within TRCC-East there is a mechanism in the bond documents to reduce the amount of the letter of credit. The Company believes that the letter of credit will never be drawn upon. This letter of credit is for a two-year period of time and will be renewed in two-year intervals as necessary. The annual cost related to the letter of credit is approximately
$83,000
. The assessment of each individual property sold or leased within each CFD is not determinable at this time because it is based on the current tax rate and the assessed value of the property at the time of sale or on its assessed value at the time it is leased to a third-party. Accordingly, the Company is not required to recognize an obligation at
June 30, 2018
.
At
June 30, 2018
, aggregate outstanding debt of unconsolidated joint ventures was
$119,540,000
. We provided a guarantee on
$104,259,000
of this debt, relating to our joint ventures with Rockefeller and Majestic. Because of positive cash flow generation within the Rockefeller and Majestic joint ventures with operating assets, we do not expect the guarantee to ever be called upon. We do not provide a guarantee on the
$15,281,000
of debt related to our joint venture with TA/Petro.
54
Non-GAAP Financial Measures
EBITDA represents earnings before interest, taxes, depreciation, and amortization, a non-GAAP financial measure, and is used by us and others as a supplemental measure of performance and liquidity. We use Adjusted EBITDA to assess the performance of our core operations, for financial and operational decision making, and as a supplemental or additional means of evaluating period-to-period comparisons on a consistent basis. Adjusted EBITDA is calculated as EBITDA, excluding stock compensation expense. We believe Adjusted EBITDA provides investors relevant and useful information because it permits investors to view income from our operations on an unleveraged basis before the effects of taxes, depreciation and amortization, and stock compensation expense. By excluding interest expense and income, EBITDA and Adjusted EBITDA allow investors to measure our performance independent of our capital structure and indebtedness and, therefore, allow for a more meaningful comparison of our performance to that of other companies, both in the real estate industry and in other industries. We believe that excluding charges related to share-based compensation facilitates a comparison of our operations across periods and among other companies without the variances caused by different valuation methodologies, the volatility of the expense (which depends on market forces outside our control), and the assumptions and the variety of award types that a company can use. EBITDA and Adjusted EBITDA have limitations as measures of our performance. EBITDA and Adjusted EBITDA do not reflect our historical cash expenditures or future cash requirements for capital expenditures or contractual commitments and they should not be considered as alternatives to those indicators in evaluating performance or liquidity. While EBITDA and Adjusted EBITDA are relevant and widely used measures of performance, they do not represent net income or cash flows from operations as defined by GAAP. Further, our computation of EBITDA and Adjusted EBITDA may not be comparable to similar measures reported by other companies.
55
The following schedule reconciles Adjusted EBITDA and EBITDA to net income.
|
Three Months Ended June 30,
|
Six Months Ended June 30,
|
||||||||||||||
|
($ in thousands)
|
2018
|
2017
|
2018
|
2017
|
|||||||||||
|
Net (loss) income
|
$
|
(1,013
|
)
|
$
|
(203
|
)
|
|
$
|
442
|
|
$
|
(2,116
|
)
|
||
|
Net loss attributable to non-controlling interest
|
(16
|
)
|
(27
|
)
|
(18
|
)
|
(38
|
)
|
|||||||
|
Interest, net
|
|||||||||||||||
|
Consolidated
|
(346
|
)
|
(95
|
)
|
(629
|
)
|
(198
|
)
|
|||||||
|
Our share of interest expense from unconsolidated joint ventures
|
554
|
|
428
|
|
1,056
|
|
832
|
|
|||||||
|
Total interest, net
|
208
|
|
333
|
|
427
|
|
634
|
|
|||||||
|
Income taxes
|
(348
|
)
|
(472
|
)
|
178
|
|
(1,804
|
)
|
|||||||
|
Depreciation and amortization:
|
|||||||||||||||
|
Consolidated
|
1,149
|
|
1,132
|
|
2,220
|
|
2,282
|
|
|||||||
|
Our share of depreciation and amortization from unconsolidated joint ventures
|
1,135
|
|
1,322
|
|
2,053
|
|
2,638
|
|
|||||||
|
Total depreciation and amortization
|
2,284
|
|
2,454
|
|
|
4,273
|
|
4,920
|
|
||||||
|
EBITDA
|
1,147
|
|
2,139
|
|
|
5,338
|
|
1,672
|
|
||||||
|
Stock compensation expense
|
828
|
|
883
|
|
1,776
|
|
1,694
|
|
|||||||
|
Adjusted EBITDA
|
$
|
1,975
|
|
$
|
3,022
|
|
|
$
|
7,114
|
|
$
|
3,366
|
|
||
Net operating income (NOI) is a non-GAAP financial measure calculated as operating income, the most directly comparable financial measure calculated and presented in accordance with GAAP, excluding general and administrative expenses, interest expense, depreciation and amortization, and gain or loss on sales of real estate. We believe NOI provides useful information to investors regarding our financial condition and results of operations because it primarily reflects those income and expense items that are incurred at the property level. Therefore, we believe NOI is a useful measure for evaluating the operating performance of our real estate assets.
|
($ in thousands)
|
Three Months Ended June 30,
|
Six Months Ended June 30,
|
||||||||||||
|
Net operating income
|
2018
|
2017
|
2018
|
2017
|
||||||||||
|
Pastoria Energy Facility
|
$
|
877
|
|
$
|
881
|
|
$
|
1,901
|
|
$
|
1,725
|
|
||
|
TRCC
|
357
|
|
337
|
|
715
|
|
788
|
|
||||||
|
Communication leases
|
296
|
|
161
|
|
470
|
|
364
|
|
||||||
|
Other commercial leases
|
186
|
|
143
|
|
344
|
|
290
|
|
||||||
|
Total Commercial/Industrial net operating income
|
$
|
1,716
|
|
$
|
1,522
|
|
$
|
3,430
|
|
$
|
3,167
|
|
||
56
|
Three Months Ended June 30,
|
Six Months Ended June 30,
|
|||||||||||||
|
($ in thousands)
|
2018
|
2017
|
2018
|
2017
|
||||||||||
|
Commercial/Industrial operating income
|
$
|
801
|
|
$
|
181
|
|
$
|
1,636
|
|
$
|
627
|
|
||
|
Plus: Depreciation and amortization
|
182
|
|
140
|
|
331
|
|
302
|
|
||||||
|
Plus: General, administrative and other expenses
|
1,135
|
|
1,687
|
|
2,243
|
|
3,187
|
|
||||||
|
Less: Other revenues including land sales
|
(402
|
)
|
(486
|
)
|
(780
|
)
|
(949
|
)
|
||||||
|
Total Commercial/Industrial net operating income
|
$
|
1,716
|
|
$
|
1,522
|
|
$
|
3,430
|
|
$
|
3,167
|
|
||
The Company utilizes net operating income (NOI) of unconsolidated joint ventures, a non-GAAP financial measure, as a measure of financial or operating performance. We believe NOI of unconsolidated joint ventures provides investors with useful information concerning operating performance because it illustrates the profitability of our unconsolidated joint ventures after taking into account operating expenses and before taking into account that interest expense and depreciation and amortization associated with our unconsolidated joint ventures, which costs may vary as a result of credit ratings and cost of capital. We also use this measure internally to monitor the operating performance of our unconsolidated joint ventures. Our computation of this non-GAAP measure may not be the same as similar measures reported by other companies. This non-GAAP financial measure should not be considered as an alternative to net income as a measure of the operating performance of our unconsolidated joint ventures or to cash flows computed in accordance with GAAP as a measure of liquidity, nor are they indicative of cash flows from operating and financial activities of our unconsolidated joint ventures.
The following schedule reconciles net income of unconsolidated joint ventures to NOI of unconsolidated joint ventures. Please refer to Note 15 (Investment in Unconsolidated and Consolidated Joint Ventures) of the Notes to Unaudited Consolidated Financial Statements for further discussion on joint ventures.
|
Three Months Ended June 30,
|
Six Months Ended June 30,
|
||||||||||||||
|
($ in thousands)
|
2018
|
2017
|
2018
|
2017
|
|||||||||||
|
Net income of unconsolidated joint ventures
|
$
|
912
|
|
$
|
2,511
|
|
$
|
1,069
|
|
$
|
2,672
|
|
|||
|
Interest expense of unconsolidated joint ventures
|
1,078
|
|
832
|
|
2,052
|
|
786
|
|
|||||||
|
Operating income of unconsolidated joint ventures
|
1,990
|
|
3,343
|
|
3,121
|
|
3,458
|
|
|||||||
|
Depreciation and amortization of unconsolidated joint ventures
|
2,118
|
|
2,529
|
|
3,844
|
|
2,521
|
|
|||||||
|
Net operating income of unconsolidated joint ventures
|
$
|
4,108
|
|
|
$
|
5,872
|
|
$
|
6,965
|
|
$
|
5,979
|
|
||
57
Market risk represents the risk of loss that may impact the financial position, results of operations, or cash flows of the Company due to adverse changes in financial or commodity market prices or rates. We are exposed to market risk in the areas of interest rates and commodity prices.
Financial Market Risks
Our exposure to financial market risks includes changes to interest rates and credit risks related to marketable securities, interest rates related to our outstanding indebtedness and market and credit risks related to trade receivables.
The primary objective of our investment activities is to preserve principal while at the same time maximizing yields and prudently managing risk. To achieve this objective and limit interest rate exposure, we limit our investments to securities with a maturity of less than five years and an investment grade rating from Moody’s or Standard & Poor’s. See Note 3 (Marketable Securities) of the Notes to Unaudited Consolidated Financial Statements.
We do not have an outstanding balance on our RLC. At the Company's option, the interest rate on the RLC can either float at 1.50% over a selected LIBOR average, or can be fixed at 1.50% above LIBOR for a fixed term for a limited period of time and change only at maturity of the fixed rate portion. The floating rate and fixed rate options within our RLC help us manage our interest rate exposure on any outstanding balances.
We are exposed to interest rate risk on our long-term debt. Long-term debt consists of two term loans. The first term loan is for
$64,277,000
and has a rate that is tied to LIBOR plus a margin of 1.70%. The interest rate for the term of this loan has been fixed through the use of an interest rate swap that fixed the rate at 4.11%. The second term loan has an outstanding balance of
$3,558,000
and has a fixed rate of 4.25%. We believe it is prudent at times to limit the variability of floating-rate interest payments and have from time-to-time entered into interest rate swap arrangements to manage those fluctuations, as we did with the first loan mentioned above.
Market risk related to our farming inventories ultimately depends on the value of almonds, grapes, and pistachios at the time of payment or sale. Market risk related to our farming inventories is discussed below in the section pertaining to commodity price exposure. Credit risk related to our receivables depends upon the financial condition of our customers. Based on historical experience with our current customers and our periodic credit evaluations of our customers’ financial conditions, we believe our credit risk is minimal.
The following tables provide information about our financial instruments that are sensitive to changes in interest rates. The tables present our debt obligations and marketable securities and their related weighted average interest rates by expected maturity dates.
58
Interest Rate Sensitivity Financial Market Risks
Principal Amount by Expected Maturity
At
June 30, 2018
(In thousands except percentage data)
|
2018
|
2019
|
2020
|
2021
|
2022
|
Thereafter
|
Total
|
Fair Value
|
||||||||
|
Assets:
|
|||||||||||||||
|
Marketable securities
|
$16,033
|
$33,980
|
$20,104
|
$403
|
—
|
—
|
70,520
|
$69,952
|
|||||||
|
Weighted average interest rate
|
1.70%
|
1.90%
|
2.09%
|
2.51%
|
—
|
—
|
1.91%
|
||||||||
|
Liabilities:
|
|||||||||||||||
|
Long-term debt ($4.75M note)
|
$140
|
$289
|
$302
|
$315
|
$328
|
$2,184
|
$3,558
|
$3,558
|
|||||||
|
Weighted average interest rate
|
4.25%
|
4.25%
|
4.25%
|
4.25%
|
4.25%
|
4.25%
|
4.25%
|
||||||||
|
Long-term debt ($70.0M note)
|
$1,794
|
$3,715
|
$3,881
|
$4,051
|
$4,221
|
$46,615
|
$64,277
|
$64,277
|
|||||||
|
Weighted average interest rate
|
4.11%
|
4.11%
|
4.11%
|
4.11%
|
4.11%
|
4.11%
|
4.11%
|
||||||||
|
Long-term debt (other)
|
$43
|
$43
|
$5
|
—
|
—
|
—
|
$91
|
$91
|
|||||||
|
Weighted average interest rate
|
3.35%
|
3.35%
|
3.35%
|
—
|
—
|
—
|
3.35%
|
||||||||
59
Interest Rate Sensitivity Financial Market Risks
Principal Amount by Expected Maturity
At
December 31, 2017
(In thousands except percentage data)
|
2018
|
2019
|
2020
|
2021
|
2022
|
Thereafter
|
Total
|
Fair Value
|
||||||||
|
Assets:
|
|||||||||||||||
|
Marketable securities
|
$20,227
|
$30,315
|
$20,420
|
36
|
68
|
—
|
$71,066
|
$70,868
|
|||||||
|
Weighted average interest rate
|
1.61%
|
1.83%
|
2.02%
|
—
|
—
|
—
|
1.83%
|
||||||||
|
Liabilities:
|
|||||||||||||||
|
Long-term debt ($4.75M note)
|
$277
|
$289
|
$302
|
$315
|
$328
|
$2,184
|
$3,695
|
$3,695
|
|||||||
|
Weighted average interest rate
|
4.25%
|
4.25%
|
4.25%
|
4.25%
|
4.25%
|
4.25%
|
4.25%
|
||||||||
|
Long-term debt ($70.0M note)
|
$3,563
|
$3,715
|
$3,881
|
$4,051
|
$4,221
|
$46,615
|
$66,046
|
$66,046
|
|||||||
|
Weighted average interest rate
|
4.11%
|
4.11%
|
4.11%
|
4.11%
|
4.11%
|
4.11%
|
4.11%
|
||||||||
|
Long-term debt (other)
|
$163
|
$55
|
—
|
—
|
—
|
—
|
$218
|
$218
|
|||||||
|
Weighted average interest rate
|
3.35%
|
3.35%
|
—
|
—
|
—
|
—
|
3.35%
|
||||||||
Commodity Price Exposure
As of
June 30, 2018
, we have exposure to adverse price fluctuations associated with certain inventories and accounts receivable. Farming inventories consist of farming cultural and processing costs related to 2017 crop production. The farming costs inventoried are recorded at actual costs incurred. Historically, these costs have been recovered each year when that year’s crop harvest has been sold.
With respect to accounts receivable, the amount at risk relates primarily to farm crops. These receivables are recorded as estimates of the prices that ultimately will be received for the crops. The final price is generally not known for several months following the close of our fiscal year. Of the
$2,715,000
of accounts receivable outstanding at
June 30, 2018
, $992,000 or 24%, is at risk to changing prices. Of the amount at risk to changing prices, $163,000 is attributable to pistachios and $829,000 is attributable to almonds. The comparable amount of accounts receivable at risk to price changes at
December 31, 2017
was $3,670,000, or 46% of the total accounts receivable of
$7,608,000
.
The price estimated for the remaining accounts receivable for pistachios at
June 30, 2018
was $2.00 per pound compared to $2.03 per pound at
December 31, 2017
. For each $0.01 change in the price of pistachios, our receivable for pistachios increases or decreases by $800. Although the final price of pistachios (and therefore the extent of the risk) is not presently known, over the last three years prices have ranged from $2.00 to $2.45. With respect to almonds, the preliminary price estimate for the remaining receivable was $2.52 per pound compared to $2.51 per pound at
December 31, 2017
. For each $0.01 change in the price of almonds, our receivable for almonds increases or decreases by $3,300. The range of final prices over the last three years for almonds has ranged from $2.58 to $3.67 per pound.
60
|
(a)
|
Evaluation of Disclosure Controls and Procedures
|
As of the end of the period covered by this report, our management, carried out an evaluation, under the supervision and with the participation of our Chief Executive Officer and Chief Financial Officer, of the effectiveness of the design and operation of our disclosure controls and procedures pursuant to Rules 13a-15 and 15d-15 of the Securities Exchange Act of 1934, as amended, or the Exchange Act. Based upon that evaluation, the Chief Executive Officer and Chief Financial Officer concluded that our disclosure controls and procedures are effective in ensuring that all information required in the reports we file or submit under the Exchange Act is accumulated and communicated to our management, including our Chief Executive Officer and Chief Financial Officer, as appropriate to allow timely decisions regarding required disclosure and is recorded, processed, summarized and reported within the time period required by the rules and regulations of the SEC.
|
(b)
|
Changes in Internal Control over Financial Reporting
|
There have been no changes in our internal control over financial reporting identified in connection with the evaluation required by paragraph (d) of Rule 13a-15 or Rule 15d-15 under the Exchange Act that occurred during our last fiscal quarter that has materially affected, or is reasonably likely to materially affect, our internal control over financial reporting.
Please refer to Note 12 (Commitments and Contingencies) in the Notes to Unaudited Consolidated Financial Statements in this report.
Except for the addition of the risk factor set forth below, there have been no material changes to the risk factors disclosed in Item 1A or elsewhere in our most recent Annual Report on Form 10-K.
Government policies and regulations, particularly those affecting the agricultural sector and related industries, could adversely affect our operations and profitability.
Agricultural commodity production and trade flows are significantly affected by government policies and regulations. Governmental policies affecting the agricultural industry, such as taxes, trade tariffs, duties, subsidies, import and export restrictions on commodities and commodity products, can influence industry profitability, the planting of certain crops, the location and size of crop production, whether unprocessed or processed commodity products are traded, and the volume and types of imports and exports. In addition, international trade disputes can adversely affect trade flows by limiting or disrupting trade between countries or regions. Future governmental policies, regulations or actions affecting our industry may adversely affect the supply of, demand for and prices of our products, restrict our ability to do business and cause our financial results to suffer.
We may experience negative impacts of higher pistachio and almond tariffs and other disruptions to international agricultural trade related to current trade actions announced by the Trump administration and responsive actions announced by trading partners, including by China. Thus far during 2018, the Chinese government has increased the tariff on U.S. pistachio and almond imports into China to 45% and 50%, respectively, from 5% and 10% at the beginning of 2018. We cannot estimate the exact effect this tariff increase will have on the overall domestic almond and pistachio markets. However, the increased tariff is
61
expected to reduce overall U.S. almond and pistachio export demand, which could have a negative effect on U.S. domestic almond and pistachio prices.
Not applicable.
Not applicable.
Not applicable.
Not applicable.
|
|
|||||
|
3.1
|
|
Restated Certificate of Incorporation
|
FN 1
|
||
|
3.2
|
|
FN 2
|
|||
|
4.1
|
|
FN 3
|
|||
|
4.2
|
|
FN 4
|
|||
|
4.3
|
|
FN 5
|
|||
|
10.1
|
|
Water Service Contract with Wheeler Ridge-Maricopa Water Storage District (without exhibits), amendments originally filed under Item 11 to Registrant's Annual Report on Form 10-K
|
FN 6
|
||
|
10.7
|
|
FN 7
|
|||
|
10.8
|
|
FN 7
|
|||
|
10.9
|
|
FN 8
|
|||
|
10.9(1)
|
|
FN 7
|
|||
|
10.10
|
|
FN 9
|
|||
|
10.10(1)
|
|
FN 7
|
|||
|
10.12
|
|
FN 10
|
|||
|
10.15
|
|
FN 11
|
|||
|
10.16
|
|
FN 12
|
|||
|
10.17
|
|
FN 13
|
|||
|
10.18
|
|
FN 13
|
|||
|
10.19
|
|
FN 13
|
|||
|
10.23
|
|
FN 14
|
|||
62
|
10.24
|
|
FN 15
|
|||
|
10.25
|
|
FN 16
|
|||
|
10.26
|
|
FN 17
|
|||
|
10.27
|
|
FN 18
|
|||
|
10.28
|
|
FN 19
|
|||
|
10.29
|
|
FN 20
|
|||
|
10.30
|
|
FN 21
|
|||
|
10.31
|
|
FN 22
|
|||
|
10.32
|
|
FN 22
|
|||
|
10.33
|
|
FN 22
|
|||
|
10.34
|
|
FN 23
|
|||
|
10.35
|
|
FN 24
|
|||
|
10.36
|
|
FN 25
|
|||
|
10.37
|
|
FN 26
|
|||
|
10.38
|
|
FN 27
|
|||
|
10.39
|
|
FN 28
|
|||
|
10.40
|
|
FN 29
|
|||
|
10.41
|
|
FN 30
|
|||
|
31.1
|
|
Filed herewith
|
|||
|
31.2
|
|
Filed herewith
|
|||
|
32
|
|
Filed herewith
|
|||
|
101.INS
|
XBRL Instance Document.
|
Filed herewith
|
|||
|
101.SCH
|
XBRL Taxonomy Extension Schema Document.
|
Filed herewith
|
|||
|
101.CAL
|
XBRL Taxonomy Extension Calculation Linkbase Document.
|
Filed herewith
|
|||
63
|
101.DEF
|
XBRL Taxonomy Extension Definition Linkbase Document.
|
Filed herewith
|
|||
|
101.LAB
|
XBRL Taxonomy Extension Label Linkbase Document.
|
Filed herewith
|
|||
|
101.PRE
|
XBRL Taxonomy Extension Presentation Linkbase Document.
|
Filed herewith
|
|||
|
*
|
Management contract, compensatory plan or arrangement.
|
64
|
FN 1
|
|
This document, filed with the Securities and Exchange Commission in Washington D.C. (file number 1-7183) under Item 14 to our Annual Report on Form 10-K for year ended December 31, 1987, is incorporated herein by reference. This Exhibit was not filed with the Securities and Exchange Commission in an electronic format.
|
|
FN 2
|
|
This document, filed with the Securities and Exchange Commission in Washington, D.C. (file number 1-7183) as Exhibit 99.1 to our Current Report on Form 8-K filed on September 20, 2017, is incorporated herein by reference.
|
|
FN 3
|
|
This document, filed with the Securities and Exchange Commission in Washington, D.C. (file number 1-7183) as Exhibit 4.3 to our Current Report on Form 8-K filed on May 7, 2004, is incorporated herein by reference.
|
|
FN 4
|
|
This document, filed with the Securities and Exchange Commission in Washington, D.C. (file number 1-7183) as Exhibit 4.4 to our Current Report on Form 8-K filed on May 7, 2004, is incorporated herein by reference.
|
|
FN 5
|
|
This document, filed with the Securities and Exchange Commission in Washington, D.C. (file number 1-7183) as Exhibit 4.1 to our Current Report on Form 8-K filed on December 20, 2005, is incorporated herein by reference.
|
|
FN 6
|
|
This document, filed with the Securities and Exchange Commission in Washington D.C. (file number 1-7183) under Item 14 to our Annual Report on Form 10-K for the year ended December 31, 1994, is incorporated herein by reference. This Exhibit was not filed with the Securities and Exchange Commission in an electronic format.
|
|
FN 7
|
|
This document, filed with the Securities and Exchange Commission in Washington D.C. (file number 1-7183) under Item 14 to our Annual Report on Form 10-K, was filed on March 27, 1998, for the year ended December 31, 1997, is incorporated herein by reference.
|
|
FN 8
|
|
This document, filed with the Securities and Exchange Commission in Washington, D.C. (file number 1-7183) as Exhibit 10.9 to our Annual Report on Form 10-K filed on March 2, 2009, for the year ended December 31, 2008, is incorporated herein by reference.
|
|
FN 9
|
|
This document, filed with the Securities and Exchange Commission in Washington, D.C. (file number 1-7183) as Exhibit 10.10 to our Annual Report on Form 10-K filed on March 2, 2009, for the year ended December 31, 2008, is incorporated herein by reference
|
|
FN 10
|
|
This document filed with the Securities and Exchange Commission in Washington D.C. (file number 1-7183) as Exhibit 10.16 to our Annual Report on Form 10-K filed on April 1, 2002, for the year ended December 31, 2001, is incorporated herein by reference.
|
|
FN 11
|
|
This document, filed with the Securities and Exchange Commission in Washington, D.C. (file number 1-7183) as Exhibit 4.1 to our Current Report on Form 8-K filed on May 7, 2004, is incorporated herein by reference.
|
|
FN 12
|
|
This document, filed with the Securities and Exchange Commission in Washington, D.C. (file number 1-7183) as Exhibit 4.2 to our Current Report on Form 8-K filed on May 7, 2004, is incorporated herein by reference.
|
|
FN 13
|
|
This document, filed with the Securities and Exchange Commission in Washington D.C. (file number 1-7183) as Exhibits 10.21-10.23 to our Annual Report on Form 10-K filed on March 16, 2005, for the year ended December 31, 2004, is incorporated herein by reference.
|
|
FN 14
|
|
This document, filed with the Securities and Exchange Commission in Washington D.C. (file number 1-7183) as Exhibit 10.24 to our Current Report on Form 8-K filed on May 24, 2006, is incorporated herein by reference.
|
|
FN 15
|
|
This document, filed with the Securities and Exchange Commission in Washington, D.C. (file number 1-7183) as Exhibit 10.28 to our Current Report on Form 8-K filed on June 23, 2008, is incorporated herein by reference.
|
|
FN 16
|
This document, filed with the Securities and Exchange Commission in Washington, D.C. (file number 1-7183) as Exhibit 10.25 to our Quarterly Report on Form 10-Q filed on August 10, 2009, for the period ending June 30, 2009, is incorporated herein by reference.
|
|
65
|
FN 17
|
This document, filed with the Securities and Exchange Commission in Washington, D.C. (file number 1-7183) as Exhibit 10.26 to our Quarterly Report on Form 10-Q filed on May 8, 2013, for the period ending March 31, 2013, is incorporated herein by reference.
|
|
|
FN 18
|
This document, filed with the Securities and Exchange Commission in Washington, D.C. (file number 1-7183) as Exhibit 10.27 to our Current Report on Form 8-K filed on June 4, 2013, is incorporated herein by reference.
|
|
|
FN 19
|
This document, filed with the Securities and Exchange Commission in Washington, D.C. (file number 1-7183) as Exhibit 10.1 to our Current Report on Form 8-K filed on August 8, 2013, is incorporated herein by reference.
|
|
|
FN 20
|
This document, filed with the Securities and Exchange Commission in Washington, D.C. (file number 1-7183) as Exhibit 10.29 to our Amended Annual Report on Form 10-K/A filed March 31, 2014, for the year ended December 31, 2013, is incorporated herein by reference.
|
|
|
FN 21
|
This document, filed with the Securities and Exchange Commission in Washington, D.C. (file number 1-7183) as Exhibit 10.30 to our Current Report on Form 8-K filed on July 16, 2014, is incorporated herein by reference.
|
|
|
FN 22
|
This document, filed with the Securities and Exchange Commission in Washington, D.C. (file number 1-7183) as Exhibits 10.31-10.33 to our Current Report on Form 8-K filed on October 17, 2014, is incorporated herein by reference.
|
|
|
FN 23
|
This document, filed with the Securities and Exchange Commission in Washington, D.C. (file number 1-7183) as Exhibit 10.34 to our Annual Report on Form 10-K filed March 16, 2015, for the year ended December 31, 2014, is incorporated herein by reference.
|
|
|
FN 24
|
This document, filed with the Securities and Exchange Commission in Washington, D.C. (file number 1-7183) as Exhibit 10.35 to our Quarterly Report on Form 10-Q filed August 10, 2015, for the period ending June 30, 2015, is incorporated herein by reference.
|
|
|
FN 25
|
This document, filed with the Securities and Exchange Commission in Washington, D.C. (file number 1-7183) as Exhibit 10.36 to our Quarterly Report on Form 10-Q filed November 9, 2015, for the period ending September 30, 2015, is incorporated herein by reference.
|
|
|
FN 26
|
This document, filed with the Securities and Exchange Commission in Washington, D.C. (file number 1-7183) as Exhibit 10.37 to our Quarterly Report on Form 10-Q filed August 9, 2016, for the period ending June 30, 2016, is incorporated herein by reference.
|
|
|
FN 27
|
This document, filed with the Securities and Exchange Commission in Washington, D.C. (file number 1-7183) as Exhibit 10.38 to our Quarterly Report on Form 10-Q filed November 8, 2016, for the period ending September 30, 2016, is incorporated herein by reference.
|
|
|
FN 28
|
This document, filed with the Securities and Exchange Commission in Washington, D.C. (file number 1-7183) as Exhibit 10.39 to our Annual Report on Form 10-K filed MArch 13, 2017, for the year ended December 31, 2016, is incorporated herein by reference.
|
|
|
FN 29
|
This document, filed with the Securities and Exchange Commission in Washington, D.C. (file number 1-7183) as Exhibit 10.40 to our Annual Report on Form 10-K filed March 13, 2017, for the year ended December 31, 2016, is incorporated herein by reference.
|
|
|
FN 30
|
This document, filed with the Securities and Exchange Commission in Washington, D.C. (file number 1-7183) as Exhibit 10.41 to our Annual Report on Form 10-K filed March 13, 2017, for the year ended December 31, 2016, is incorporated herein by reference.
|
|
66
SIGNATURES
Pursuant to the requirements of the Securities Exchange Act of 1934, the Company has duly caused this report to be signed on its behalf by the undersigned thereunto duly authorized, on
August 7, 2018
.
|
TEJON RANCH CO.
|
|
(The Company)
|
|
/s/ Allen E. Lyda
|
|
Allen E. Lyda
|
|
Executive Vice President, Chief Financial Officer and Corporate Treasurer
|
|
(Principle Financial Officer)
|
|
/s/ Robert D. Velasquez
|
|
Robert D. Velasquez
|
|
Senior Vice President, Finance and Chief Accounting Officer
|
|
(Principle Accounting Officer)
|
67
TABLE OF CONTENTS
Part I - Financial InformationItem 1. Financial StatementsItem 2. Management's Discussion and Analysis Of Financial Condition and Results Of OperationsItem 3. Quantitative and Qualitative Disclosures About Market RiskItem 4. Controls and ProceduresPart II - Other InformationItem 1. Legal ProceedingsItem 1A. Risk FactorsItem 2. Unregistered Sales Of Equity Securities and Use Of ProceedsItem 3. Defaults Upon Senior SecuritiesItem 4. Mine Safety DisclosuresItem 5. Other InformationItem 6. Exhibits: