TARGA RESOURCES CORP.
10-Ks and 10-Qs
|
|
|
|
|
|
|
|
|
|
|
|
|
|
|
|
|
|
|
|
|
|
|
|
|
|
|
|
|
|
|
|
|
|
|
|
|
|
|
|
|
|
|
|
|
|
|
|
|
|
|
|
|
UNITED STATES
SECURITIES AND EXCHANGE COMMISSION
Washington, D.C. 20549
FORM 10-K
þ
ANNUAL REPORT PURSUANT TO SECTION 13 OR 15(d) OF THE SECURITIES EXCHANGE ACT OF 1934
For the fiscal year ended December 31, 2013
or
¨
TRANSITION REPORT PURSUANT TO SECTION 13 OR 15(d) OF THE SECURITIES EXCHANGE ACT OF 1934
For the transition period from _____ to _____
Commission File Number: 001-34991
TARGA RESOURCES CORP.
(Exact name of registrant as specified in its charter)
|
Delaware
|
|
20-3701075
|
|
(State or other jurisdiction of incorporation or organization)
|
|
(I.R.S. Employer Identification No.)
|
|
|
|
|
|
1000 Louisiana St, Suite 4300, Houston, Texas
|
|
77002
|
|
(Address of principal executive offices)
|
|
(Zip Code)
|
(713) 584-1000
(Registrant’s telephone number, including area code
)
Securities registered pursuant to section 12(b) of the Act:
|
Title of each class
|
|
Name of each exchange on which registered
|
|
Common Stock
|
|
New York Stock Exchange
|
Securities registered pursuant to section 12(g) of the Act:
None
Indicate by check mark if the registrant is a well-known seasoned issuer, as defined in Rule 405 of the Securities Act. Yes
þ
No
o
Indicate by check mark if the registrant is not required to file reports pursuant to Section 13 or Section 15(d) of the Act. Yes
o
No
þ
Indicate by check mark whether the registrant (1) has filed all reports required to be filed by Section 13 or 15(d) of the Securities Exchange Act of 1934 during the preceding 12 months (or for such shorter period that the registrant was required to file such reports), and (2) has been subject to such filing requirements for the past 90 days. Yes
þ
No
o
Indicate by check mark whether the registrant has submitted electronically and posted on its corporate Web site, if any, every Interactive Data File required to be submitted and posted pursuant to Rule 405 of Regulation S-T (§232.405 of this chapter) during the preceding 12 months (or for such shorter period that the registrant was required to submit and post such files).
Yes
þ
No
o
Indicate by check mark if disclosure of delinquent filers pursuant to Item 405 of Regulation S-K (
§229.405 of this chapter) is not contained herein, and will not be contained, to the best of registrant’s knowledge, in definitive proxy or information statements incorporated by reference in Part III of this Form 10-K or any amendment to this Form 10-K.
o
Indicate by check mark whether the registrant is a large accelerated filer, an accelerated filer, a non-accelerated filer, or a smaller reporting company. See the definitions of “large accelerated filer,” “accelerated filer” and “smaller reporting company” in Rule 12b-2 of the Exchange Act.
|
Large accelerated filer
þ
|
Accelerated filer
o
|
Non-accelerated filer
o
|
Smaller reporting company
o
|
(Do not check if a smaller reporting company)
Indicate by check mark whether the registrant is a shell company (as defined in Rule 12b-2 of the Act). Yes
o
No
þ
.
The aggregate market value of the common stock held by non-affiliates of the registrant was approximately $2,119.3 million on June 28, 2013, based on $64.33 per share, the closing price of the common stock as reported on the New York Stock Exchange (NYSE) on such date.
As of February 10, 2014, there were 42,167,343 shares of the registrant’s common stock, $0.001 par value, outstanding.
DOCUMENTS INCORPORATED BY REFERENCE
None
PART I
|
4
|
|
|
|
|
|
32
|
|
|
|
|
|
53
|
|
|
|
|
|
53
|
|
|
|
|
|
53
|
|
|
|
|
|
53
|
|
|
|
|
|
PART II
|
|
|
|
|
|
54
|
|
|
|
|
|
57
|
|
|
|
|
|
58
|
|
|
|
|
|
98
|
|
|
|
|
|
101
|
|
|
|
|
|
101
|
|
|
|
|
|
101
|
|
|
|
|
|
101
|
|
|
|
|
|
PART III
|
|
|
|
|
|
102
|
|
|
|
|
|
108
|
|
|
|
|
|
138
|
|
|
|
|
|
140
|
|
|
|
|
|
145
|
|
|
|
|
|
PART IV
|
|
|
|
|
|
146
|
|
CAUTIONARY STATEMENT ABOUT FORWARD-LOOKING STATEMENTS
Targa Resources Corp.’s (together with its subsidiaries, other than Targa Resources Partners LP (the “Partnership”), collectively “we,” “us,” “Targa,” “TRC,” or the “Company”) reports, filings and other public announcements may from time to time contain statements that do not directly or exclusively relate to historical facts. Such statements are “forward-looking statements.” You can typically identify forward-looking statements within the meaning of Section 27A of the Securities Act of 1933, as amended, and Section 21E of the Securities Exchange Act of 1934, as amended, by the use of forward-looking statements, such as “may,” “could,” “project,” “believe,” “anticipate,” “expect,” “estimate,” “potential,” “plan,” “forecast” and other similar words.
All statements that are not statements of historical facts, including statements regarding our future financial position, business strategy, budgets, projected costs and plans and objectives of management for future operations, are forward-looking statements.
These forward-looking statements reflect our intentions, plans, expectations, assumptions and beliefs about future events and are subject to risks, uncertainties and other factors, many of which are outside our control. Important factors that could cause actual results to differ materially from the expectations expressed or implied in the forward-looking statements include known and unknown risks. Known risks and uncertainties include, but are not limited to, the risks set forth in “Part I, Item 1A. Risk Factors.” of this Annual Report on Form 10-K (“Annual Report”) as well as the following risks and uncertainties:
| · | the Partnership’s and our ability to access the debt and equity markets, which will depend on general market conditions and the credit ratings for our debt obligations; |
| · | the amount of collateral required to be posted from time to time in the Partnership’s transactions; |
| · | the Partnership’s success in risk management activities, including the use of derivative instruments to hedge commodity risks; |
| · | the level of creditworthiness of counterparties to various transactions with the Partnership; |
| · | changes in laws and regulations, particularly with regard to taxes, safety and protection of the environment; |
| · | the timing and extent of changes in natural gas, natural gas liquids (“NGL”), crude oil and other commodity prices, interest rates and demand for the Partnership’s services; |
| · | weather and other natural phenomena; |
| · | industry changes, including the impact of consolidations and changes in competition; |
| · | the Partnership’s ability to obtain necessary licenses, permits and other approvals; |
| · | the level and success of crude oil and natural gas drilling around the Partnership’s assets, its success in connecting natural gas supplies to its gathering and processing systems, oil supplies to its gathering systems and NGL supplies to its logistics and marketing facilities and the Partnership’s success in connecting its facilities to transportation and markets; |
| · | the Partnership’s and our ability to grow through acquisitions or internal growth projects and the successful integration and future performance of such assets; |
| · | general economic, market and business conditions; and |
| · | the risks described elsewhere in “Part I, Item 1A. Risk Factors.” in this Annual Report and our reports and registration statements filed from time to time with the United States Securities and Exchange Commission (“SEC”). |
Although we believe that the assumptions underlying our forward-looking statements are reasonable, any of the assumptions could be inaccurate, and, therefore, we cannot assure you that the forward-looking statements included in this Annual Report will prove to be accurate. Some of these and other risks and uncertainties that could cause actual results to differ materially from such forward-looking statements are more fully described in “Part I, Item 1A. Risk Factors.” in this Annual Report. Except as may be required by applicable law, we undertake no obligation to publicly update or advise of any change in any forward-looking statement, whether as a result of new information, future events or otherwise.
As generally used in the energy industry and in this Annual Report, the identified terms have the following meanings:
|
Bbl
|
Barrels (equal to 42 U.S. gallons)
|
|
Bcf
|
Billion cubic feet
|
|
Btu
|
British thermal units, a measure of heating value
|
|
BBtu
|
Billion British thermal units
|
|
/d
|
Per day
|
|
/hr
|
Per hour
|
|
gal
|
U.S. gallons
|
|
GPM
|
Liquid volume equivalent expressed as gallons per 1000 cu. ft. of natural gas
|
|
LPG
|
Liquefied petroleum gas
|
|
MBbl
|
Thousand barrels
|
|
MMBbl
|
Million barrels
|
|
MMBtu
|
Million British thermal units
|
|
MMcf
|
Million cubic feet
|
|
NGL(s)
|
Natural gas liquid(s)
|
|
NYMEX
|
New York Mercantile Exchange
|
|
GAAP
|
Accounting principles generally accepted in the United States of America
|
|
LIBOR
|
London Interbank Offer Rate
|
|
NYSE
|
New York Stock Exchange
|
|
Price Index Definitions
|
|
|
IF-NGPL MC
|
Inside FERC Gas Market Report, Natural Gas Pipeline, Mid-Continent
|
|
IF-PB
|
Inside FERC Gas Market Report, Permian Basin
|
|
IF-WAHA
|
Inside FERC Gas Market Report, West Texas WAHA
|
|
NY-WTI
|
NYMEX, West Texas Intermediate Crude Oil
|
|
OPIS-MB
|
Oil Price Information Service, Mont Belvieu, Texas
|
PART I
Overview
Targa Resources Corp. (NYSE: TRGP) is a publicly traded Delaware corporation formed in October 2005. We do not directly own any operating assets; our main source of future revenue therefore is from general and limited partner interests, including incentive distribution rights (“IDRs”), in the Partnership, a publicly traded Delaware limited partnership (NYSE: NGLS) that is a leading provider of midstream natural gas and natural gas liquid services in the United States. The Partnership is engaged in the business of gathering, compressing, treating, processing and selling natural gas and storing, fractionating, treating, transporting, terminaling and selling NGLs and NGL products, and gathering, storing and terminaling crude oil, and storing, terminaling and selling refined petroleum products.
On December 10, 2010, we completed an initial public offering (“IPO”) of common shares in the Company. In the IPO, the selling shareholders, including a member of our senior management, sold 18,831,250 common shares at a price of $22.00 per share. We did not receive any proceeds from the sale of shares by the selling shareholders. On completion of the IPO, there were 42,292,348 shares outstanding.
Financial Presentation
One of our indirect subsidiaries is the sole general partner of the Partnership. Because we control the general partner, under generally accepted accounting principles we must reflect our ownership interest in the Partnership on a consolidated basis. Accordingly, the Partnership’s financial results are included in our consolidated financial statements even though the distribution or transfer of Partnership assets are limited by the terms of the partnership agreement, as well as restrictive covenants in the Partnership’s lending agreements. The limited partner interests in the Partnership not owned by us are reflected in our results of operations as net income attributable to noncontrolling interests. Throughout this Annual Report, we make a distinction where relevant between financial results and disclosures applicable to the Partnership versus those applicable to us as a standalone parent including our non-Partnership subsidiaries (“Non-Partnership”). In addition, we provide condensed Parent only financial statements as required by the SEC.
The Partnership files its own separate Annual Report. The financial results presented in our consolidated financial statements will differ from the financial statements of the Partnership primarily due to the effects of:
|
·
|
our separate debt obligations; |
|
·
|
federal income taxes; |
|
·
|
certain retained general and administrative costs applicable to us as a public company; |
|
·
|
certain administrative assets and liabilities incumbent as a provider of operational and support services to the Partnership; |
|
·
|
certain non-operating assets and liabilities that we retained; |
|
·
|
Partnership distributions and earnings allocable to third-party common unitholders which are included in non-controlling interest in our statements; and |
|
·
|
Partnership distributions applicable to our General Partner interest, Incentive Distribution Rights and investment in Partnership common units. While these are eliminated when preparing our consolidated financial statements, they nonetheless are the primary source of cash flow that supports the payment of dividends to our stockholders. |
Overview of the Business of Targa Resources Corp.
Our primary business objective is to increase our cash available for dividends to our stockholders by assisting the Partnership in executing its business strategy. We may facilitate the Partnership’s growth through various forms of financial support, including, but not limited to, modifying the Partnership’s IDRs, exercising the Partnership’s IDR reset provision contained in its partnership agreement, making loans, making capital contributions in exchange for yielding or non-yielding equity interests or providing other financial support to the Partnership, if needed, to support its ability to make distributions. In addition, we may acquire assets that could be candidates for acquisition by the Partnership, potentially after operational or commercial improvement or further development.
At February 10, 2014, our interests in the Partnership consist of the following:
|
·
|
a 2% general partner interest, which we hold through our 100% ownership interest in the general partner; |
|
·
|
all of the outstanding IDRs; and |
|
·
|
12,945,659 of the 112,390,094 outstanding common units of the Partnership, representing an 11.5% limited partnership interest. |
Our cash flows are generated from the cash distributions we receive from the Partnership. The Partnership is required to distribute all available cash at the end of each quarter after establishing reserves to provide for the proper conduct of its business or to provide for future distributions. Our ownership of the general partner interest entitles us to receive 2% of all cash distributed in a quarter.
Our ownership of the IDRs of the Partnership entitles us to receive:
|
·
|
13% of all cash distributed in a quarter after $0.3881 has been distributed in respect of each common unit of the Partnership for that quarter; |
|
·
|
23% of all cash distributed in a quarter after $0.4219 has been distributed in respect of each common unit of the Partnership for that quarter; and |
|
·
|
48% of all cash distributed in a quarter after $0.50625 has been distributed in respect of each common unit of the Partnership for that quarter. |
The Partnership Agreement between the Partnership and us governs our relationship regarding certain reimbursement and indemnification matters. So long as our only cash generating assets are our interests in the Partnership, we will continue to allocate to the Partnership substantially all of our general and administrative costs other than our direct costs of being a reporting company. See “Item 13. Certain Relationships and Related Transactions, and Director Independence.”
We employ 1,277 people. See “—Employees.” The Partnership does not have any employees to carry out its operations.
Overview of the Business of the Partnership
We formed the Partnership in October 2006 to own, operate, acquire and develop a diversified portfolio of complementary midstream energy assets. The Partnership is a leading provider of midstream natural gas, and NGL services in the United States, with a growing presence in crude oil gathering and petroleum terminaling.
The Partnership is engaged in the business of:
|
·
|
gathering, compressing, treating, processing and selling natural gas; |
|
·
|
storing, fractionating, treating, transporting, terminaling and selling NGLs and NGL products; |
|
·
|
gathering, storing and terminaling crude oil; and |
|
·
|
storing, terminaling and selling refined petroleum products. |
To provide these services, the Partnership operates in two primary divisions: (i) Gathering and Processing, consisting of two reportable segments—(a) Field Gathering and Processing and (b) Coastal Gathering and Processing; and (ii) Logistics and Marketing (also referred to as the Partnership’s Downstream Business), consisting of two reportable segments—(a) Logistics Assets and (b) Marketing and Distribution. For a detailed description of these assets, please see “—The Partnership’s Business Operations.”
The Partnership’s midstream natural gas and NGL services footprint was initially established through several acquisitions from us, totaling $3.1 billion, that occurred from 2007 through 2010. In these transactions the Partnership acquired (1) natural gas gathering, processing and treating assets in North Texas, West Texas, New Mexico and the Louisiana Gulf Coast and (2) NGL assets consisting of fractionation, transport, storage and terminaling facilities, low sulfur natural gasoline treating facilities (“LSNG”), pipeline transportation and distribution assets, propane storage and truck terminals primarily located near Houston, Texas and in Lake Charles, Louisiana.
Since the completion of the final drop down acquisitions from us in 2010, the Partnership has grown substantially, with large increases in a number of metrics as of year-end 2013, including its total assets (95%), adjusted EBITDA (70%), distributable cash flow (69%) and distributions to its common unitholders (39%). The expansion of the Partnership’s business has been fueled by a combination of major organic growth investments in its businesses and acquisitions.
Organic Growth Projects
The Partnership continues to invest significant capital to expand through organic growth projects. The Partnership has invested approximately $1.9 billion in growth capital expenditures since 2007, including approximately $1 billion in 2013. These expansion investments were distributed across its businesses, with 54% related to Logistics and Marketing and 46% to Gathering and Processing. The Partnership will continue to invest in both large and small organic growth projects in 2014, with $650 million of estimated growth capital expenditures for announced projects.
Major organic growth projects completed or underway include:
|
·
|
International Exports.
In September 2013, the Partnership commissioned Phase I of its international export expansion project, which includes facilities at both of its Mont Belvieu facility and at its Galena Park Marine Terminal near Houston, Texas. Phase I of this project expanded the Partnership’s export capability to approximately 3.5 to 4 MMBbl per month of propane and/or butane. Included in the Partnership’s Phase I expansion is the capability to export international grade low ethane propane. With the completion of Phase I, the Partnership’s capabilities expanded to include loading very large gas carrier (“VLGC”) vessels in addition to the small and medium-sized vessels that the Partnership load for export. Construction is underway to further expand our propane and butane international export capacity by approximately 2 MMBbl per month, with an expected completion of Phase II in the third quarter of 2014. The Partnership expects that the total cost of both phases of its international export project to be approximately $480 million.
|
|
·
|
Cedar Bayou Fractionator Train 4. In August 2013, the Partnership commissioned an additional fractionator, Train 4, at its 88%-owned Cedar Bayou Fractionator (“CBF”) in Mont Belvieu, Texas. This expansion added 100 MBbl/d of fractionation capacity at CBF. The gross cost of Train 4 was approximately $385 million (the Partnership net cost was approximately $352 million). |
|
·
|
Badlands expansion program. During 2013, the Partnership invested approximately $250 million to expand its gathering and processing business in the Williston Basin, North Dakota assets. The Partnership increased its crude gathering and natural gas gathering operations substantially with the addition of pipelines, and associated facilities and added an additional 20 MMcf/d natural gas processing plant. During 2014, the Partnership anticipates an investment of approximately $180 million for further expansion of this business, including an additional cryogenic processing plant. |
|
·
|
North Texas Longhorn plant. The Partnership is constructing a new 200 MMcf/d cryogenic processing plant and related gathering and compression facilities for North Texas to meet increasing production and continued producer activity in the area, with an anticipated completion in the second quarter of 2014. The Partnership expects a total estimated cost of approximately $150 million for the plant and associated projects. |
|
·
|
SAOU High Plains plant. The Partnership is constructing a new 200 MMcf/d cryogenic processing plant and related gathering and compression facilities for SAOU to meet increasing production and continued producer activity on the eastern side of the Permian Basin, with an anticipated completion date in mid-2014. The Partnership expects a total estimated cost of approximately $225 million for the plant and associated projects. |
Additionally, the Partnership expects to have other growth capital expenditures in 2014 related to the continued build out of its gathering and processing systems and logistics capabilities.
Acquisitions of Businesses and Assets
In addition to the Partnership’s organic growth projects, the Partnership has made several business and asset acquisitions, including:
Badlands
On December 31, 2012, the Partnership acquired Saddle Butte Pipeline LLC’s crude oil gathering pipeline and terminal system and natural gas gathering and processing operations, collectively referred to as “Badlands” for cash consideration of approximately $976 million. The business is located in the Bakken and Three Forks Shale plays of the Williston Basin in North Dakota.
Petroleum Logistics
During 2011 and 2012, the Partnership acquired refined petroleum products and crude oil storage facilities, including potential export capabilities in a series of transactions. Facilities acquired were located on the Houston Ship Channel, the Hylebos Waterway in the Port of Tacoma, Washington (the “Sound Terminal”) and on the Patapsco River in Baltimore, Maryland (the “Baltimore Terminal”).
Growth Drivers
The Partnership believes its near-term growth will be driven by significant organic growth investments to meet strong supply and demand fundamentals for its existing businesses. The Partnership believes its assets are not easily duplicated and are located in active producing areas and near key markets and logistics centers. Over the longer term, the Partnership expects its growth will continue to be driven by production from shale plays and by the deployment of shale exploration and production technologies in both liquids-rich natural gas and crude oil resource plays. The Partnership expects that third-party acquisitions will also continue to be a focus of its growth strategy.
Strong supply and demand fundamentals for the Partnership’s existing businesses
The Partnership believes that the current levels of oil, condensate and NGL prices and the forecasted prices for these energy commodities have caused producers in and around its crude oil gathering and natural gas gathering and gas processing areas of operation to focus their drilling programs on regions rich in these forms of hydrocarbons. Liquids rich gas is prevalent from oil wells in the Wolfberry, Cline and Canyon Sands plays, which are accessible by the SAOU processing business in the Permian Basin; from the oil wells in the Wolfberry and Bone Springs plays and re-development of the Central Basin, which are accessible by the Sand Hills system and the Versado system; from “oilier” portions of the Barnett Shale natural gas play, especially portions of Montague, Cooke, Clay and Wise counties, which are accessible by the North Texas System
and from oil wells in the Bakken and Three Forks plays, which are accessible by its Badlands business in North Dakota.
The impact of high producer activity and resulting NGL supplies from areas rich in oil, condensate and NGLs continue to
generate demand for the Partnership’s fractionation services at the Mont Belvieu market hub. As a result of increasing demand, since 2010 the Partnership has added 178 MBbl/d of fractionation capacity with the additions of CBF Trains 3 and 4. The Partnership also funded its share of the NGL fractionation expansion at Gulf Coast Fractionators (“GCF”). The strength of demand continues to benefit fractionation service providers in the form of long-term, “take-or-pay” contracts for new and existing fractionation capacity. We believe that the higher volumes of fractionated NGLs will also result in increased demand for other related fee-based services provided by the Partnership’s Downstream Business. Continued demand for fractionation capacity will lead to other growth opportunities, such as the potential to
provide fractionation services at Mont Belvieu for producers in the Utica and Marcellus Shale plays in Ohio, West Virginia and Pennsylvania.
As domestic producers have focused their drilling in crude oil and liquids-rich areas, new gas processing facilities are being built to accommodate liquids-rich gas, which results in an increasing supply of NGLs. As drilling in these areas continues, demand for NGLs requiring transportation and fractionation to market hubs is expected to continue. As the supply of NGLs increase, the Partnership’s integrated Mont Belvieu and Galena Park Terminal assets allow the Partnership to provide the raw product, fractionation, storage, interconnected terminaling, refrigeration and ship loading capabilities to support exports by third party customers.
Active drilling and production activity from liquids-rich natural gas shale plays and similar crude oil resource plays
The Partnership is actively pursuing natural gas gathering and processing and NGL fractionation opportunities associated with liquids-rich natural gas from shale and other resource plays, such as portions of the Barnett, Eagle Ford, Utica and Marcellus Shales and with even richer casinghead gas opportunities from active crude oil resource plays, such as the Wolfberry (and other named variants of Wolfcamp, Spraberry, Dean and other geologic cross-section combinations) and the Bone Springs, Avalon and Bakken Shale plays. We believe that the Partnership’s leadership position in the Downstream Business, which includes its fractionation services, provides it with a competitive advantage relative to other gathering and processing companies without these capabilities.
Bakken Shale / Three Forks opportunities
The production from the Bakken Shale and Three Forks plays is expected to make the Williston Basin one of the fastest growing crude oil basins in the world. As producers increased their knowledge of the basin, drilling efficiencies and completion techniques have improved and production has increased significantly. Currently, much of the current oil production is transported by truck from wells to terminals to be loaded onto rail cars or injected into pipelines. In addition, much of the current gas production is being flared. The Partnership believes that competition with trucking and incentives to reduce flaring provide opportunities to grow volumes and expand its crude gathering and natural gas gathering and processing infrastructure; and that its position in the Williston Basin should allow us to compete for expansion opportunities. In addition, the significant amount of uncommitted acreage in proximity to its system should provide further opportunities for system expansions.
Third party acquisitions
While the Partnership’s growth through 2010 was primarily driven by the implementation of a focused drop down strategy, the Partnership and Targa also have a record of completing third party acquisitions. Since their formation, their strategy has included approximately $5.3 billion in acquisitions and growth capital expenditures of which approximately $1.2 billion was for acquisitions from third-parties. The Partnership expects that third-party acquisitions will continue to be a focus of its growth strategy.
Competitive Strengths and Strategies
We believe that the Partnership is well positioned to execute its business strategies due to the following competitive strengths:
Strategically located gathering and processing asset base
Its gathering and processing businesses are predominantly located in active and growth-oriented oil and gas producing basins. Activity in the shale resource plays underlying its gathering assets is driven by oil, condensate and NGL production and currently favorable prices for those energy commodities. Increased drilling and production activities in these areas would likely increase the volumes of natural gas and crude oil available to its gathering and processing systems.
Leading fractionation and NGL infrastructure position
The Partnership is one of the largest fractionators of NGLs in the Gulf Coast. Its primary fractionation assets are located in Mont Belvieu, Texas and Lake Charles, Louisiana, which are key market centers for NGLs and most are located at the major U.S. hub of NGL infrastructure, Mont Belvieu, which includes a number of mixed NGL (“mixed NGLs” or “Y-grade”) supply pipelines, storage, takeaway pipelines and other transportation infrastructure. Its Logistics assets, including fractionation facilities, storage wells, its marine export/import terminal and related pipeline systems and interconnects, are also located near and connected to key consumers of NGL products including the petrochemical and industrial markets. The location and interconnectivity of these assets are not easily replicated, and the Partnership has sufficient additional capability to expand their capacity. The Partnership has extensive experience in operating these assets and developing, permitting and constructing new midstream assets.
Comprehensive package of midstream services
The Partnership provides a comprehensive package of services to natural gas and crude oil producers. These services are essential to gather crude and to process and treat wellhead gas to meet pipeline standards and to extract NGLs for sale into petrochemical, industrial, commercial and export markets. We believe that the Partnership’s ability to provide these integrated services provides an advantage in competing for new supplies because the Partnership can provide substantially all of the services producers, marketers and others require for moving natural gas and NGLs from wellhead to market on a cost-effective basis. Additionally, the Partnership believes the barriers to enter the midstream sector on a scale similar to the Partnership’s are reasonably high due to the high cost of replicating assets in key strategic positions, the difficulty of permitting and constructing new midstream assets and the difficulty of developing the expertise necessary to operate them.
High quality and efficient assets
The Partnership’s gathering and processing systems and Logistics assets consist of high-quality, well-maintained facilities, resulting in low-cost, efficient operations. Advanced technologies have been implemented for processing plants (primarily cryogenic units utilizing centralized control systems), measurements (essentially all electronic and electronically linked to a central data-base) and operations and maintenance to manage work orders and implement preventative maintenance schedules (computerized maintenance management systems). These applications have allowed proactive management of its operations resulting in lower costs and minimal downtime. The Partnership has established a reputation in the midstream industry as a reliable and cost-effective supplier of services to its customers and has a track record of safe and efficient operation of its facilities. The Partnership intends to continue to pursue new contracts, cost efficiencies and operating improvements of its assets. Such improvements in the past have included new production and acreage commitments, reducing fuel gas and flare volumes and improving facility capacity and NGL recoveries. The Partnership will also continue to optimize existing plant assets to improve and maximize capacity and throughput.
In addition to routine annual maintenance expenses, the Partnership’s maintenance capital expenditures have averaged approximately $80 million per year over the last three years. We believe that the Partnership’s assets are well-maintained and anticipate that a similar level of maintenance capital expenditures will be sufficient for the Partnership to continue to operate these assets in a prudent and cost-effective manner.
Large, diverse business mix with favorable contracts and increasing fee-based business
The Partnership maintains gas gathering and processing positions in strategic oil and gas producing areas across multiple basins and provides services under attractive contract terms to a diverse mix of customers across its areas of operation. Consequently, the Partnership is not dependent on any one oil and gas basin or customer. The Partnership’s Logistics and Marketing assets are typically located near key market hubs and near its NGL customers. They also serve must-run portions of the natural gas value chain, are primarily fee-based and have a diverse mix of customers.
The Partnership’s contract portfolio has attractive rate and term characteristics, with a heavy fee-based component, especially in its Downstream Business and its Badlands operations. The Partnership expects an increasing percentage of its net operating cash flows to be fee-based given the higher rates for logistics assets contracts that are being newly executed or renewed under long-term contracts, the new projects underway, and continuing strong supply and demand fundamentals for this business. The Partnership’s continuous growth of the fee-based Badlands business in North Dakota will also contribute to increasing fee-based cash flow.
Financial flexibility
The Partnership has historically maintained a conservative leverage ratio and ample liquidity and has funded its growth investments with a mix of equity and debt over time. Disciplined management of leverage, liquidity and commodity price volatility allows the Partnership to be flexible in its long-term growth strategy and enables it to pursue strategic acquisitions and large growth projects.
Experienced and long-term focused management team
The executive management team that formed us in 2004 continues to manage us today. They possess a breadth and depth of combined experience working in the midstream energy business. Other officers and key operational, commercial and financial employees provide significant experience in the industry and with its assets and businesses.
Attractive cash flow characteristics
The Partnership believes that its strategy, combined with its high-quality asset portfolio and strong industry fundamentals, allows it to generate attractive cash flows. Geographic, business and customer diversity enhances its cash flow profile. The Partnership’s Field Gathering and Processing segment has a favorable contract mix that is primarily percent-of-proceeds, but also has increasing fee-based revenues from natural gas treating and compression, natural gas gathering, and processing and crude oil gathering in its Bakken Shale assets. Contracts in its Coastal Gathering and Processing segment are primarily hybrid (percent-of-liquids with a fee floor) or percent-of-liquids contracts. The Partnership’s favorable contract mix, along with its commodity hedging program, serves to mitigate the impact of commodity price movements on cash flow.
The Partnership has hedged the commodity price risk associated with a portion of its expected natural gas equity volumes through 2016 and NGL and condensate equity volumes through 2014 by entering into financially settled derivative transactions. Historically, these transactions have included both swaps and purchased puts (or floors). The primary purpose of its commodity risk management activities is to hedge its exposure to price risk and to mitigate the impact of fluctuations in commodity prices on cash flow. The Partnership has intentionally tailored its hedges to approximate specific NGL products and to approximate its actual NGL and residue natural gas delivery points. Although the degree of hedging will vary, the Partnership intends to continue to manage some of its exposure to commodity prices by entering into similar hedge transactions as market conditions permit. The Partnership also monitors and manages its inventory levels with a view to mitigate losses related to downward price exposure.
Asset base well-positioned for organic growth
We believe that the Partnership’s asset platform and strategic locations allow the Partnership to maintain and potentially grow its volumes and related cash flows as its supply areas continue to benefit from exploration and development. At current and recent historical prices, technology advances have resulted in increased domestic oil and liquids-rich gas drilling and production activity. The location of its assets provides the Partnership with access to stable natural gas and crude oil supplies and proximity to end-use markets and liquid market hubs while positioning the Partnership to capitalize on drilling and production activity in those areas. The Partnership’s existing infrastructure has the capacity to handle some incremental increases in volumes without significant investments as well as opportunities to leverage existing assets with meaningful expansions. We believe that as domestic supply and demand for natural gas, crude oil and NGLs, and services for each, grows over the long term, the Partnership’s infrastructure will increase in value as such infrastructure takes on increasing importance in meeting that growing supply and demand.
While we have set forth the Partnership’s strategies and competitive strengths above, its business involves numerous risks and uncertainties which may prevent the Partnership from executing its strategies or impact the amount of distributions to unitholders. These risks include the adverse impact of changes in natural gas, NGL and condensate/crude oil prices or in the supply of or demand for these commodities, and its inability to access sufficient additional production to replace natural declines in production. For a more complete description of the risks associated with an investment in the Partnership, see “Item 1A. Risk Factors.”
The Partnership’s Relationship with Us
We have used the Partnership as a growth vehicle to pursue the acquisition and expansion of midstream natural gas, NGL, oil and other complementary energy businesses and assets as evidenced by the Partnership’s acquisitions of businesses from us. However, we are not prohibited from competing with the Partnership and may evaluate acquisitions and dispositions that do not involve the Partnership. In addition, through its relationship with us, the Partnership has access to a significant pool of management talent, strong commercial relationships throughout the energy industry and access to our broad operational, commercial, technical, risk management and administrative infrastructure.
As of December 31, 2013, we and our named executive officers and directors have a significant ownership interest in the Partnership through our ownership of a 12.0% limited partner interest and our 2% general partner interest. In addition, we own incentive distribution rights that entitle us to receive an increasing percentage of quarterly distributions of available cash from the Partnership’s operating surplus after the minimum quarterly distribution and the target distribution levels have been achieved. The Partnership Agreement with us governs its relationship regarding certain reimbursement and indemnification matters. See “Item 13. Certain Relationships and Related Transactions and Director Independence.”
The Partnership does not have any employees to carry out its operations. We employ 1,277 people. See “—Employees.” Following the conveyance of assets to the Partnership in September 2010, we charge the Partnership for all the direct costs of the employees assigned to its operations, as well as all general and administrative support costs other than its direct support costs of being a separate reporting company and our cost of providing management and support services to certain unaffiliated spun-off entities. The Partnership generally reimburses us for cost allocations to the extent that the Partnership has required a current cash outlay by us.
The Partnership’s Challenges
The Partnership faces a number of challenges in implementing its business strategy. For example:
|
·
|
The Partnership has a substantial amount of indebtedness which may adversely affect its financial position. |
|
·
|
The Partnership’s cash flow is affected by supply and demand for oil, natural gas and NGL products and by natural gas, NGL and condensate prices, and decreases in these prices could adversely affect its results of operations and financial condition. |
|
·
|
The Partnership’s long-term success depends on its ability to obtain new sources of supplies of natural gas, crude oil and NGLs, which is subject to certain factors beyond its control. Any decrease in supplies of natural gas, crude oil or NGLs could adversely affect the Partnership’s business and operating results. |
|
·
|
If the Partnership does not successfully integrate assets from acquisitions, its results of operations and financial condition could be adversely affected. |
|
·
|
If the Partnership does not make acquisitions or investments in new assets on economically acceptable terms or efficiently and effectively integrate new assets, its results of operations and financial condition could be adversely affected. |
|
·
|
The Partnership is subject to regulatory, environmental, political, legal and economic risks, which could adversely affect its results of operations and financial condition. |
|
·
|
The Partnership’s growth strategy requires access to new capital. Tightened capital markets or increased competition for investment opportunities could impair the Partnership’s ability to grow. |
|
·
|
The Partnership’s hedging activities may not be effective in reducing the variability of its cash flows and may, in certain circumstances, increase the variability of its cash flows. |
|
·
|
The Partnership’s industry is highly competitive, and increased competitive pressure could adversely affect its business and operating results. |
For a further discussion of these and other challenges the Partnership faces, please read “Item 1A. Risk Factors.”
The Partnership’s Business Operations
The Partnership’s operations are reported in two divisions: (i) Gathering and Processing, consisting of two segments—(a) Field Gathering and Processing and (b) Coastal Gathering and Processing; and (ii) Logistics and Marketing, consisting of two segments—(a) Logistics Assets and (b) Marketing and Distribution.
Gathering and Processing Division
The Partnership’s Gathering and Processing Division consists of gathering, compressing, dehydrating, treating, conditioning, processing and marketing natural gas and gathering crude oil. The gathering of natural gas consists of aggregating natural gas produced from various wells through small diameter gathering lines to processing plants. Natural gas has a widely varying composition depending on the field, the formation and the reservoir from which it is produced. The processing of natural gas consists of the extraction of imbedded NGLs and the removal of water vapor and other contaminants to form (i) a stream of marketable natural gas, commonly referred to as residue gas, and (ii) a stream of mixed NGLs. Once processed, the residue gas is transported to markets through pipelines that are owned by either the gatherers and processors or third parties. End-users of residue gas include large commercial and industrial customers, as well as natural gas and electric utilities serving individual consumers. The Partnership sells its residue gas either directly to such end-users or to marketers into intrastate or interstate pipelines, which are typically located in close proximity or with ready access to the Partnership’s facilities.
The gathering of crude oil consists of aggregating crude oil production primarily through gathering pipeline systems, which deliver crude to a combination of other pipelines, rail and truck.
The Partnership continually seeks new supplies of natural gas and crude oil, both to offset the natural decline in production from connected wells and to increase throughput volumes. The Partnership obtains additional natural gas and crude oil supply in its operating areas by contracting for production from new wells or by capturing existing production currently gathered by others. Competition for new natural gas and crude oil supplies is based primarily on location of assets, commercial terms, service levels and access to markets. The commercial terms of natural gas gathering and processing arrangements and crude oil gathering are driven, in part, by capital costs, which are impacted by the proximity of systems to the supply source and by operating costs, which are impacted by operational efficiencies, facility design and economies of scale.
The Partnership believes that its extensive asset base and scope of operations in the regions in which it operates provides it with significant opportunities to add both new and existing natural gas and crude oil production to its areas of operations. We believe that the Partnership’s size and scope gives it a strong competitive position through close proximity to a large number of existing and new producing wells in its areas of operations allowing the Partnership to generate economies of scale and to provide its customers with access to its existing facilities and to multiple end-use markets and market hubs. Additionally, we believe that the Partnership’s ability to serve its customers’ needs across the natural gas and NGL value chain further augments its ability to attract new customers.
Field Gathering and Processing Segment
In 2013, the Field Gathering and Processing segment gathered and processed natural gas from the Permian Basin in West Texas and Southeast New Mexico, the Fort Worth Basin, including the Barnett Shale, in North Texas and the Williston Basin in North Dakota. The natural gas processed in this segment is supplied through the Partnership’s gathering systems which, in aggregate, consist of approximately 11,300 miles of natural gas pipelines and include ten owned and operated processing plants. During 2013, the Partnership processed an average of a 780.1 MMcf/d of natural gas and produced an average of 91.9 MBbl/d of NGLs.
In addition to the Partnership natural gas gathering and processing, its Badlands operations include a crude oil gathering system and two terminals with crude oil operational storage capacity of 70 MBbl.
The Partnership believes that it is well positioned as a gatherer and processor in the Permian, Fort Worth and Williston Basins. The Partnership believes that its proximity to production and development activities allows the Partnership to compete for new supplies of natural gas and crude oil because of its lower competitive costs to connect new wells and to process additional natural gas in its existing processing plants. Additionally, because the Partnership operates all of its plants in these regions, it is often able to redirect natural gas among its processing plants, providing operational flexibility and allowing it to optimize processing efficiency and further improve the profitability of its operations.
The Field Gathering and Processing segment’s operations consist of Sand Hills, Versado, SAOU, North Texas and Badlands, each as described below.
Sand Hills
The Sand Hills operations consist of the Sand Hills and Puckett gathering systems in West Texas. These systems consist of approximately 1,500 miles of natural gas gathering pipelines. These gathering systems are low-pressure gathering systems with significant compression assets. The Sand Hills refrigerated cryogenic processing plant has a gross processing capacity of 175 MMcf/d and residue gas connections to pipelines owned by affiliates of Enterprise Products Partners L.P. (“EPP”), Kinder Morgan, Inc. (“Kinder Morgan”) and ONEOK, Inc. (“ONEOK”).
Versado
Versado consists of the Saunders, Eunice and Monument gas processing plants and related gathering systems in Southeastern New Mexico and in West Texas. Versado consists of approximately 3,350 miles of natural gas gathering pipelines. The Saunders, Eunice and Monument refrigerated cryogenic processing plants have aggregate processing capacity of 240 MMcf/d (151 MMcf/d, net to the Partnership’s ownership interest). These plants have residue gas connections to pipelines owned by affiliates of Kinder Morgan and MidAmerican Energy Company. The Partnership’s ownership in Versado is held through Versado Gas Processors, L.L.C., a consolidated joint venture that is 63% owned by the Partnership and 37% owned by Chevron U.S.A. Inc.
SAOU
SAOU includes approximately 1,800 miles of pipelines in the Permian Basin that gathers natural gas for delivery to the Mertzon, Sterling and Conger processing plants. SAOU is connected to thousands of producing wells and over 840 central delivery points. SAOU’s processing facilities are refrigerated cryogenic processing plants, with an aggregate processing capacity of approximately 169 MMcf/d. These plants have residue gas connections to pipelines owned by affiliates of Atmos Energy Corporation (“Atmos”), EPP, Kinder Morgan, Northern Natural Gas Company and ONEOK.
The Partnership is currently constructing the High Plains plant, a new 200 MMcf/d cryogenic processing plant and related gathering and compression facilities with an anticipated completion date in mid-2014. The new plant will enable SAOU to meet increasing production and continued producer activity on the eastern side of the Permian Basin.
North Texas
North Texas includes two interconnected gathering systems with approximately 4,500 miles of pipelines, gathering wellhead natural gas for the Chico and Shackelford natural gas processing facilities. These plants have residue gas connections to pipelines owned by affiliates of Atmos, Energy Transfer Fuel LP, EPP and Natural Gas Pipeline Company of America LLC.
The Chico gathering system consists of approximately 2,400 miles of gathering pipelines. Wellhead natural gas is either gathered for the Chico plant located in Wise County, Texas, and then compressed for processing, or it is compressed in the field at numerous compressor stations and then moved via one of several high-pressure gathering pipelines to the Chico plant. The plant has an aggregated processing capacity of 265 MMcf/d and an integrated fractionation capacity of 15 MBbl/d. The Shackelford gathering system includes approximately 2,100 miles of gathering pipelines and gathers wellhead natural gas largely for the Shackelford plant in Albany, Texas. Natural gas gathered from the northern and eastern portions of the Shackelford gathering system is typically compressed in the field at numerous compressor stations and then transported to the Chico plant for processing. The Shackelford plant has an aggregate processing capacity of 13 MMcf/d.
To meet increasing production and producer activity in North Texas, the Partnership is currently constructing the Longhorn plant, a new 200 MMcf/d cryogenic processing plant, with expected completion in the second quarter of 2014.
Badlands
The Badlands operations are located in the Bakken and Three Forks Shale of the Williston Basin in North Dakota and include crude oil gathering pipelines, 40 MBbl of operational crude storage capacity at the Johnsons Corner Terminal, and 30 MBbl of operational crude storage capacity at the Alexander Terminal. The Partnership has an additional 30 MBbl of operational crude oil storage under construction at New Town and 25 MBbl of operational crude oil storage under construction at Stanley. Badlands also includes natural gas gathering pipelines and a natural gas processing plant that was expanded in the third quarter of 2013 by 20 MMcf/d to a gross processing capacity of about 38 MMcf/d.
During 2013, the Partnership invested approximately $250 million to expand its Badlands crude oil gathering and gas gathering and processing systems, including the natural gas processing plant expansion mentioned above.
The following table lists the Field Gathering and Processing segment’s processing plants and related volumes for the year ended December 31, 2013:
|
Facility
|
% Owned
|
Location
|
Estimated Gross
Processing
Capacity
(MMcf/d)(1)
|
Gross Plant Natural
Gas Inlet Throughput
Volume (MMcf/d) (9)
|
Gross NGL Production (MBbl/d) (9)
|
Process
Type (8)
|
Operated or Non-Operated
|
|||||||||||||
|
Sand Hills
|
|
|
|
|
|
|
|
|||||||||||||
|
Sand Hills
|
100
|
Crane, TX
|
175.0
|
148.8
|
17.4
|
Cryo
|
Operated
|
|||||||||||||
|
Puckett (2)
|
|
7.0
|
0.1
|
|
|
|||||||||||||||
|
|
Area Total
|
175.0
|
155.8
|
17.5
|
|
|
||||||||||||||
|
Versado
|
|
|
|
|||||||||||||||||
|
Saunders (3), (4)
|
63
|
Lea, NM
|
60.0
|
29.4
|
3.1
|
Cryo
|
Operated
|
|||||||||||||
|
Eunice (3), (4)
|
63
|
Lea, NM
|
95.0
|
75.4
|
9.7
|
Cryo
|
Operated
|
|||||||||||||
|
Monument (3), (4)
|
63
|
Lea, NM
|
85.0
|
51.5
|
6.0
|
Cryo
|
Operated
|
|||||||||||||
|
|
Area Total
|
240.0
|
156.3
|
18.8
|
|
|
||||||||||||||
|
SAOU
|
|
|
|
|||||||||||||||||
|
Mertzon
|
100
|
Irion, TX
|
52.0
|
52.8
|
8.3
|
Cryo
|
Operated
|
|||||||||||||
|
Sterling
|
100
|
Sterling, TX
|
92.0
|
77.2
|
11.1
|
Cryo
|
Operated
|
|||||||||||||
|
Conger
|
100
|
Sterling, TX
|
25.0
|
23.3
|
3.0
|
Cryo
|
Operated
|
|||||||||||||
|
|
Area Total (7)
|
169.0
|
153.3
|
22.4
|
|
|
||||||||||||||
|
North Texas
|
|
|
|
|||||||||||||||||
|
Chico (5)
|
100
|
Wise, TX
|
265.0
|
284.4
|
30.0
|
Cryo
|
Operated
|
|||||||||||||
|
Shackelford
|
100
|
Shackelford, TX
|
13.0
|
9.2
|
1.1
|
Cryo
|
Operated
|
|||||||||||||
|
|
Area Total (7)
|
278.0
|
293.6
|
31.1
|
|
|
||||||||||||||
|
Badlands
|
|
|
|
|||||||||||||||||
|
Little Missouri (6)
|
100
|
McKenzie, ND
|
38.0
|
21.4
|
1.9
|
RA
|
Operated
|
|||||||||||||
|
|
Segment System Total
|
900.0
|
780.4
|
91.7
|
|
|
||||||||||||||
| (1) | Gross processing capacity may differ from nameplate processing capacity due to multiple factors including items such as compression limitations, and quality and composition of the gas being processed. |
| (2) | Puckett volumes are gathered in our pipelines and processed at third-party plants. |
| (3) | Includes throughput other than plant inlet, primarily from compressor stations. |
| (4) | These plants are part of our Versado joint venture. Capacity and volumes represent 100% of ownership interest. |
| (5) | The Chico plant has fractionation capacity of approximately 15 MBbl/d. |
| (6) | Additional refrigerated compression will be installed in March 2014, bringing the gas plant throughput capacity to 44 MMcf/d. |
| (7) | Includes volumes gathered in our pipelines that are beyond our current plant capacity and are processed at other third-party plants. |
| (8) | Cryo – Cryogenic; RA – Refrigerated Absorption Processing. |
|
(9)
|
Operational reports are used as the source of the Gross Inlet Throughput and NGL Production for certain plant statistics listed above, which may vary from financial statistics by insignificant amounts.
|
Coastal Gathering and Processing Segment
The Partnership’s Coastal Gathering and Processing segment assets are located in the onshore region of the Louisiana Gulf Coast, accessing natural gas from the Gulf Coast and the Gulf of Mexico. With the strategic location of its assets in Louisiana, the Partnership has access to the Henry Hub, the largest natural gas hub in the U.S., and to a substantial NGL distribution system with access to markets throughout Louisiana and the southeast U.S. The Coastal Gathering and Processing segment’s assets consist of LOU and the Coastal Straddles, each as described below. For the year ended 2013, the Partnership processed an average of 1,330.1 MMcf/d of plant natural gas inlet and produced an average of 44.9 MBbl/d of NGLs.
LOU
LOU consists of approximately 1,000 miles of gathering system pipelines in Southwest Louisiana. The gathering system is connected to numerous producing wells, central delivery points and/or pipeline interconnects in the area between Lafayette and Lake Charles, Louisiana. The gathering system is a high-pressure gathering system that delivers natural gas for processing to either the Acadia or Gillis plants via three main trunk lines. The processing facilities include the Gillis and Acadia processing plants, both of which are cryogenic plants. The Big Lake plant, also cryogenic, is located near the LOU gathering system. These processing plants have an aggregate processing capacity of approximately 440 MMcf/d. In addition, the Gillis plant has integrated fractionation with operating capacity of approximately 11 MBbl/d.
Coastal Straddles
Coastal Straddles process natural gas produced from shallow-water central and western Gulf of Mexico natural gas wells and from deep shelf and deepwater Gulf of Mexico production via connections to third-party pipelines or through pipelines owned by the Partnership. Coastal Straddles has access to markets across the U.S. through the interstate natural gas pipelines to which they are interconnected. The industry continues to rationalize gas processing capacity along the Gulf Coast by moving gas from older, less efficient plants to higher efficiency cryogenic plants. In the last two years, the Yscloskey, Calumet and other third-party plants have been shut-down, with most of the producer volumes going to more efficient plants such as its Venice, Lowry and Barracuda plants.
VESCO
Through the Partnership’s 76.8% ownership interest in Venice Energy Services Company, L.L.C., it operates the Venice gas plant, which has a aggregate processing capacity of 750 MMcf/d and the Venice Gathering System (“VGS”) that is approximately 150 miles in length and has a nominal capacity of 320 MMcf/d (collectively “VESCO”). VESCO receives unprocessed gas directly or indirectly from seven offshore pipelines and gas gathering systems including the VGS system. VGS gathers natural gas from the shallow waters of the eastern Gulf of Mexico and supplies the VESCO gas plant.
Other Coastal Straddles
Other Coastal Straddles consists of three wholly owned and operated gas processing plants (one now idled) and three partially owned plants which are not operated by the Partnership. These plants, having an aggregate processing capacity of approximately 3,555 MMcf/d, are generally situated on mainline natural gas pipelines near the coastline and process volumes of natural gas collected from multiple offshore gathering systems and pipelines throughout the Gulf of Mexico. Coastal Straddles also has ownership in two offshore gathering systems that are operated by the Partnership. The Pelican and Seahawk gathering systems have a combined length of approximately 175 miles and a combined capacity of approximately 230 MMcf/d. These systems gather natural gas from the shallow waters of the central Gulf of Mexico and supply a portion of the natural gas delivered to the Barracuda and Lowry processing facilities.
The following table lists the Coastal Gathering and Processing segment’s natural gas processing plants and related volumes for the year ended December 31, 2013:
|
Facility
|
% Owned
|
Location Parish, State
|
Estimated Gross
Processing
Capacity
(MMcf/d) (1)
|
Plant Natural Gas
Inlet Throughput
Volume (MMcf/d)
|
NGL Production
(MBbl/d)
|
Process
Type (2)
|
Operated or Non-operated
|
|||||||||||||
|
|
|
|
|
|
|
|
|
|||||||||||||
|
LOU
|
|
|
|
|
|
|
|
|||||||||||||
|
Gillis (3)
|
100
|
Calcasieu, LA
|
180
|
171.0
|
6.8
|
Cryo
|
Operated
|
|||||||||||||
|
Acadia
|
100
|
Acadia, LA
|
80
|
21.8
|
0.9
|
Cryo
|
Operated
|
|||||||||||||
|
Big Lake
|
100
|
Calcasieu, LA
|
180
|
158.1
|
2.6
|
Cryo
|
Operated
|
|||||||||||||
|
|
Area Total
|
440
|
350.9
|
10.3
|
|
|
||||||||||||||
|
|
|
|
|
|||||||||||||||||
|
VESCO (4), (5)
|
76.8
|
Plaquemines, LA
|
750
|
515.5
|
21.5
|
Cryo
|
Operated
|
|||||||||||||
|
|
|
|
|
|||||||||||||||||
|
Other Coastal Straddles (6)
|
|
|
||||||||||||||||||
|
Barracuda
|
100
|
Cameron, LA
|
190
|
58.9
|
1.7
|
Cryo
|
Operated
|
|||||||||||||
|
Stingray (7)
|
100
|
Cameron, LA
|
300
|
96.6
|
2.5
|
RA
|
Operated
|
|||||||||||||
|
Lowry
|
100
|
Cameron, LA
|
265
|
176.8
|
4.3
|
Cryo
|
Operated
|
|||||||||||||
|
Terrebonne (8), (9)
|
4.6
|
Terrebonne, LA
|
950
|
19.6
|
0.6
|
RA
|
Non-operated
|
|||||||||||||
|
Toca (8), (9)
|
9.2
|
St. Bernard, LA
|
1,150
|
38.3
|
1.2
|
Cryo/RA
|
Non-operated
|
|||||||||||||
|
Sea Robin (8)
|
0.8
|
Vermillion, LA
|
700
|
15.9
|
0.5
|
Cryo
|
Non-operated
|
|||||||||||||
|
Other (10)
|
|
57.6
|
2.3
|
|
|
|||||||||||||||
|
|
Area Total
|
3,555
|
463.7
|
13.1
|
|
|
||||||||||||||
|
|
|
|
|
|||||||||||||||||
|
|
Consolidated System Total
|
4,745
|
1,330.1
|
44.9
|
|
|
||||||||||||||
| (1) | Gross processing capacity may differ from nameplate processing capacity due to multiple factors including items such as compression limitations, and the quality and composition of the gas being processed |
| (2) | Cryo – Cryogenic Processing; RA – Refrigerated Absorption Processing. |
| (3) | The Gillis plant has fractionation capacity of approximately 11 MBbl/d. |
| (4) | Plant natural gas inlet throughput volumes for VESCO represent 100% of the volumes associated with the plant as we consolidate VESCO’s results due to our 76.8% ownership interest. |
| (5) | VESCO also includes an offshore gathering system with a combined length of approximately 150 miles. |
| (6) | Other Coastal Straddles also includes two offshore gathering systems which have a combined length of approximately 175 miles. |
| (7) | The Stingray Plant was idled on December 8, 2013. Most of the producer volumes from this plant were moved to either the Barracuda or Lowry Plants. |
| (8) | Plant natural gas inlet throughput volumes for non-operated plants represent volumes associated with our ownership percentages. |
| (9) | Our ownership is adjustable and subject to annual redetermination based on our proportionate share of owners production. |
| (10) | Other includes Sabine Pass and Neptune volumes processed at plants not owned by us. The Sabine Pass Plant was shut down on January 3, 2013 with most of the producer volumes going to our Barracuda Plant. |
Logistics and Marketing Division
The Partnership’s Logistics and Marketing Division is also referred to as the Downstream Business. It includes the activities necessary to convert mixed NGLs into NGL products and provide certain value-added services such as the fractionation, storage, terminaling, transportation, distribution and marketing of NGLs and NGL products; the storing and terminaling of refined petroleum products and crude oil; and certain natural gas supply and marketing activities in support of the Partnership’s other businesses. These products are delivered to end-users through pipelines, barges, trucks and rail cars. End-users of NGL products include petrochemical and refining companies and propane markets for heating, cooking or crop drying applications.
Logistics Assets Segment
The Logistics Assets segment uses its platform of integrated assets to receive, fractionate, store, treat, transport and deliver NGLs typically under fee-based arrangements. For NGLs to be used by refineries, petrochemical manufacturers, propane distributors and other industrial end-users, they must be fractionated into their component products and delivered to various points throughout the U.S. The Partnership’s logistics assets are generally connected to, and supplied in part by, its gathering and processing assets and are primarily located at Mont Belvieu and Galena Park near Houston, Texas and in Lake Charles, Louisiana. This segment also contains refined petroleum product and crude oil storage and terminaling.
Fractionation
After being extracted in the field, mixed NGLs, sometimes referred to as “Y-grade” or “raw NGL mix,” are typically transported to a centralized facility for fractionation where the mixed NGLs are separated into discrete NGL products: ethane, ethane-propane mix, propane, normal butane, iso-butane and natural gasoline.
The Partnership’s fractionation assets include ownership interests in three stand-alone fractionation facilities that are located on the Gulf Coast, two of which it operates, one at Mont Belvieu, Texas and the other at Lake Charles, Louisiana. The Partnership has an equity investment in the third fractionator, GCF, also located at Mont Belvieu. The Partnership is subject to a consent decree with the Federal Trade Commission, issued December 12, 1996, that, among other things, prevents it from participating in commercial decisions regarding rates paid by third parties for fractionation services at GCF. This restriction on the Partnership’s activity at GCF will terminate on December 12, 2016, twenty years after the date the consent order was issued. In addition to the three stand-alone facilities in the Logistics Assets segment, see the description of fractionation assets in the North Texas System and LOU in the Gathering and Processing division.
The Partnership expanded the fractionation capacity of its assets during 2011 through 2013 with the following projects:
|
·
|
CBF Train 3 and 4. In the second quarter of 2011, the Partnership commissioned 78 MBbl/d of additional fractionation capacity, Train 3, at CBF, in Mont Belvieu, Texas, at a cost of approximately $64 million. Train 3 is supported by long-term fee-based contracts that have certain guaranteed volume commitments or provisions for deficiency payments. In August 2013, the Partnership commissioned an additional fractionator, Train 4. This expansion added 100 MBbl/d of fractionation capacity. The gross cost of Train 4 was approximately $385 million (the Partnership’s net cost was approximately $345 million) and is also supported by long-term contracts that have certain guaranteed volume commitments or provisions for deficiency payments. |
The majority of the Partnership’s NGL fractionation business is under fee-based arrangements. These fees are subject to adjustment for changes in certain fractionation expenses, including energy costs. The operating results of the Partnership’s NGL fractionation business are dependent upon the volume of mixed NGLs fractionated and the level of fractionation fees charged.
The Partnership believes that sufficient volumes of mixed NGLs will be available for fractionation in commercially viable quantities for the foreseeable future due to increases in NGL production expected from shale plays and other shale-technology-driven resource plays in areas of the U.S. that include North Texas, South Texas, the Permian Basin, Oklahoma and the Rockies and certain other basins accessed by pipelines to Mont Belvieu, as well as from conventional production of NGLs in areas such as the Permian Basin, Mid-Continent, East Texas, South Louisiana and shelf and deepwater Gulf of Mexico. Hydrocarbon dew point specifications implemented by individual natural gas pipelines and the Policy Statement on
Provisions Governing Natural Gas Quality and Interchangeability in Interstate Natural Gas Pipeline Company Tariffs
enacted in 2006 by the Federal Energy Regulatory Commission (“FERC”) should result in volumes of mixed NGLs being available for fractionation because natural gas requires processing or conditioning to meet pipeline quality specifications. These requirements establish a base volume of mixed NGLs during periods when it might be otherwise uneconomical to process certain sources of natural gas. Furthermore, significant volumes of mixed NGLs are contractually committed to the Partnerships NGL fractionation facilities.
Although competition for NGL fractionation services is primarily based on the fractionation fee, the ability of an NGL fractionator to obtain mixed NGLs and distribute NGL products is also an important competitive factor. This ability is a function of the existence of storage infrastructure and supply and market connectivity necessary to conduct such operations. The Partnership believes that the location, scope and capability of the Partnership’s logistics assets, including its transportation and distribution systems, gives the Partnership access to both substantial sources of mixed NGLs and a large number of end-use markets.
The Partnership also has a natural gasoline hydrotreater at Mont Belvieu, Texas that removes sulfur from natural gasoline, allowing customers to meet new, more stringent environmental standards. The facility has a capacity of 30 MBbl/d and is supported by long-term fee-based contracts that have certain guaranteed volume commitments or provisions for deficiency payments. In 2012, the Partnership completed modifications to the hydrotreater to add the capability to reduce benzene content of natural gasoline to meet new, even more stringent environmental standards for one of its long-term customer accounts. Similar to the hydrotreater, the benzene saturation process is supported by fee-based contracts that have certain guaranteed volume commitments or provisions for deficiency payments. The following table details the Logistics Assets segment’s fractionation and treating facilities:
|
Facility
|
% Owned
|
Gross Capacity (MBbl/d)
(1)
|
Gross Throughput for 2013
(MBbl/d)(2)
|
|||||||||
|
Operated Facilities:
|
|
|
|
|||||||||
|
Lake Charles Fractionator (Lake Charles, LA)
|
100.0
|
55.0
|
24.0
|
|||||||||
|
Cedar Bayou Fractionator (Mont Belvieu, TX) (3)
|
88.0
|
393.0
|
278.1
|
|||||||||
|
Targa LSNG Hydrotreater (Mont Belvieu, TX)
|
100.0
|
30.0
|
20.2
|
|||||||||
|
Non-operated Facilities:
|
||||||||||||
|
Gulf Coast Fractionator (Mont Belvieu, TX)
|
38.8
|
125.0
|
115.8
|
|||||||||
| (1) | Actual fractionation capacities may also vary due to the Y-grade composition of the gas being processed and does not assume ethane rejection. |
| (2) | Gross throughput for 2013 only includes a partial year for Train 4, which was placed in service in August 2013. |
| (3) | Gross capacity represents 100% of the volume associated with the plant following the completion of Train 4. Capacity includes 40 MBbl/d of additional butane/gasoline fractionation capacity. |
Storage, Terminaling and Petroleum Logistics
In general, the Partnership’s NGL storage assets provide warehousing of mixed NGLs, NGL products and petrochemical products in underground wells, which allows for the injection and withdrawal of such products at various times in order to meet supply and demand cycles. Similarly, the Partnership’s terminaling operations provide the inbound/outbound logistics and warehousing of mixed NGLs, NGL products and petrochemical products in above-ground storage tanks. The Partnership’s NGL underground storage and terminaling facilities serve single markets, such as propane, as well as multiple products and markets. For example, the Mont Belvieu and Galena Park facilities have extensive pipeline connections for mixed NGL supply and delivery of component NGLs. In addition, some of the Partnership’s facilities are connected to marine, rail and truck loading and unloading facilities that provide services and products to customers. The Partnership provides long and short-term storage and terminaling services and throughput capability to third-party customers for a fee.
The Partnership’s Petroleum Logistics business consists of storage and terminaling facilities in Texas (the Channelview Terminal and the Patriot facility), Maryland (the Baltimore Terminal) and Washington (the Sound Terminal). These facilities primarily serve the refined petroleum products and crude oil markets, but potentially may also include LPG and biofuels.
Across the Logistics Assets segment, the Partnership owns or operates a total of 39 storage wells at its facilities with a net storage capacity of approximately 64 MMBbl, the usage of which may be limited by brine handling capacity, which is utilized to displace NGLs from storage.
The Partnership operates its storage and terminaling facilities based on the needs and requirements of its customers. The Partnership usually experiences an increase in demand for storage and terminaling of mixed NGLs during the summer months when gas plants typically reach peak NGL production, and refineries have excess NGL products. Demand for storage and terminaling at its propane facilities typically peaks during fall, winter and early spring. In September 2013, the Partnership commissioned Phase I of its international export expansion project that includes facilities at both of its Mont Belvieu facility and its Galena Park Marine Terminal near Houston, Texas. Phase I of this project expanded its export capability to approximately 3.5 to 4 MMBbl per month of propane and/or butane. Included in the Phase I expansion was the capability to export international grade low ethane propane. With the completion of Phase I, the Partnership also added capabilities to load VLGC vessels alongside the small and medium sized export vessels that we load for export. The Partnership expects completion of Phase II of its International Exports project by the third quarter of 2014, which will add another estimated 2 MMBbl per month of export capacity. The Partnership continues to experience significant demand growth for NGL (primarily propane) exports.
The Partnership’s fractionation, storage and terminaling business is supported by approximately 900 miles of company-owned pipelines to transport mixed NGLs and specification products.
The following table details the Logistics Assets NGL storage facilities at December 31, 2013:
|
Facility
|
% Owned
|
County/Parish, State
|
Number of Permitted
Wells
|
Gross Storage Capacity
(MMBbl)
|
|||||||||
|
Hackberry Storage (Lake Charles)
|
100
|
Cameron, LA
|
12
|
(1)
|
20.0
|
||||||||
|
Mont Belvieu Storage
|
100
|
Chambers, TX
|
20
|
(2)
|
43.0
|
||||||||
|
Easton Storage
|
100
|
Evangeline, LA
|
1
|
0.8
|
|||||||||
| (1) | Five of twelve owned wells leased to CITGO under long-term leases. |
| (2) | The Partnership owns 20 wells and operates 6 wells owned by Chevron Phillips Chemical Company LLC. (“CPC”) |
The following table details the Logistics Assets NGL and Petroleum Terminal Facilities for the year ended December 31, 2013:
|
Facility
|
%
Owned
|
County/Parish,
State
|
Description
|
Throughput for 2013 (Million gallons)
|
Usable
Storage
Capacity
(MMBbl)
|
||||||||||
|
Galena Park Terminal (1)
|
100
|
Harris, TX
|
NGL import/export terminal, chemicals
|
1,900.0
|
0.7
|
||||||||||
|
Mont Belvieu Terminal
|
100
|
Chambers, TX
|
Transport and storage terminal
|
4,965.0
|
39.0
|
||||||||||
|
Hackberry Terminal
|
100
|
Cameron, LA
|
Storage terminal
|
889.3
|
17.8
|
||||||||||
|
Channelview Terminal
|
100
|
Harris, TX
|
Refined products, crude - transport and storage terminal
|
153.8
|
0.5
|
||||||||||
|
Baltimore Terminal
|
100
|
Baltimore, MD
|
Refined products - transport and storage terminal
|
8.0
|
0.5
|
||||||||||
|
Sound Terminal
|
100
|
Pierce, WA
|
Refined products, crude oil/propane - transport and storage terminal
|
422.4
|
0.9
|
||||||||||
|
Patriot
|
100
|
Harris, TX
|
Dock and land for expansion (Not in service)
|
N/A
|
N/A
|
||||||||||
| (1) | Volumes reflect total import and export across the dock/terminal and may also include volumes that have also been handled at the Mont Belvieu Terminal. |
Marketing and Distribution Segment
The Marketing and Distribution segment transports, distributes and markets NGLs via terminals and transportation assets across the U.S. The Partnership owns or commercially manages terminal facilities in a number of states, including Texas, Louisiana, Arizona, Nevada, California, Florida, Alabama, Mississippi, Tennessee, Kentucky, New Jersey and Washington. The geographic diversity of the Partnership’s assets provide direct access to many NGL customers as well as markets via trucks, barges, rail cars and open-access regulated NGL pipelines owned by third parties. The Marketing and Distribution segment consists of (i) NGL Distribution and Marketing, (ii) Wholesale Marketing, (iii) Refinery Services, (iv) Commercial Transportation, (v) Natural Gas Marketing and (vi) Terminal Facilities, each as described below.
NGL Distribution and Marketing
The Partnership markets its own NGL production and also purchases component NGL products from other NGL producers and marketers for resale. Additionally, the Partnership also purchases product for resale in its Logistics segment, including exports. During the year ended December 31, 2013, its distribution and marketing services business sold an average of approximately 318.4 MBbl/d of NGLs.
The Partnership generally purchases mixed NGLs at a monthly pricing index less applicable fractionation, transportation and marketing fees and resell these products to petrochemical manufacturers, refineries and other marketing and retail companies. This is primarily a physical settlement business in which the Partnership earns margins from purchasing and selling NGL products from customers under contract. The Partnership also earns margins by purchasing and reselling NGL products in the spot and forward physical markets. To effectively serve its Distribution and Marketing customers, the Partnership contracts for and uses many of the assets included in its Logistics Assets segment.
Wholesale Marketing
The Partnership’s wholesale propane marketing operations primarily sell propane and related logistics services to major multi-state retailers, independent retailers and other end-users. The Partnership’s propane supply primarily originates from both its refinery/gas supply contracts and other owned or managed logistics and marketing assets. The Partnership generally sells propane at a fixed or posted price at the time of delivery and, in some circumstances, it earns margin on a netback basis.
The wholesale propane marketing business is significantly impacted by weather-driven demand, particularly in the winter, which can impact the price of propane in the markets the Partnership serves and impact the ability to deliver propane to satisfy peak demand.
Refinery Services
In the Partnership’s refinery services business, it typically provides NGL balancing services via contractual arrangements with refiners to purchase and/or market propane and to supply butanes. The Partnership uses its commercial transportation assets (discussed below) and contracts for and uses the storage, transportation and distribution assets included in its Logistics Assets segment to assist refinery customers in managing their NGL product demand and production schedules. This includes both feedstocks consumed in refinery processes and the excess NGLs produced by those same refining processes. Under typical netback purchase contracts, the Partnership generally retains a portion of the resale price of NGL sales or receives a fixed minimum fee per gallon on products sold. Under netback sales contracts, fees are earned for locating and supplying NGL feedstocks to the refineries based on a percentage of the cost to obtain such supply or a minimum fee per gallon.
Key factors impacting the results of the Partnership’s refinery services business include production volumes, prices of propane and butanes, as well as its ability to perform receipt, delivery and transportation services in order to meet refinery demand.
Commercial Transportation
The Partnership’s NGL transportation and distribution infrastructure includes a wide range of assets supporting both third-party customers and the delivery requirements of its marketing and asset management business. The Partnership provides fee-based transportation services to refineries and petrochemical companies throughout the Gulf Coast area. The Partnership’s assets are also deployed to serve its wholesale distribution terminals, fractionation facilities, underground storage facilities and pipeline injection terminals. These distribution assets provide a variety of ways to transport products to and from the Partnership’s customers.
The Partnership’s transportation assets, as of December 31, 2013, include:
|
·
|
approximately 700 railcars that the Partnership leases and manages; |
|
·
|
approximately 80 owned and leased transport tractors; and |
|
·
|
18 company-owned pressurized NGL barges. |
Natural Gas Marketing
The Partnership also markets natural gas available to it from the Gathering and Processing segments, purchases and resells natural gas in selected United States markets, and manages the scheduling and logistics for these activities.
The following table details the Marketing and Distribution segment’s Terminal Facilities:
|
Facility
|
% Owned
|
County/Parish, State
|
Description
|
Throughput for 2013
(Million gallons) (1)
|
Usable Storage Capacity
(Million gallons)
|
|||||||||
|
Calvert City Terminal
|
100
|
Marshall, KY
|
Propane terminal
|
12.2
|
0.1
|
|||||||||
|
Greenville Terminal
|
100
|
Washington, MS
|
Marine propane terminal
|
18.3
|
1.5
|
|||||||||
|
Port Everglades Terminal
|
100
|
Broward, FL
|
Marine propane terminal
|
8.8
|
1.6
|
|||||||||
|
Tyler Terminal
|
100
|
Smith, TX
|
Propane terminal
|
12.8
|
0.2
|
|||||||||
|
Abilene Transport (2)
|
100
|
Taylor, TX
|
Raw NGL transport terminal
|
0.8
|
Less than 0.1
|
|||||||||
|
Bridgeport Transport (2)
|
100
|
Jack, TX
|
Raw NGL transport terminal
|
0.3
|
0.1
|
|||||||||
|
Gladewater Transport (2)
|
100
|
Gregg, TX
|
Raw NGL transport terminal
|
3.9
|
0.3
|
|||||||||
|
Chattanooga Terminal
|
100
|
Hamilton, TN
|
Propane terminal
|
9.1
|
0.9
|
|||||||||
|
Sparta Terminal
|
100
|
Sparta, NJ
|
Propane terminal
|
16.0
|
0.2
|
|||||||||
|
Hattiesburg Terminal (3)
|
50
|
Forrest, MS
|
Propane terminal
|
259.6
|
269.6
|
|||||||||
|
Winona Terminal
|
100
|
Flagstaff, AZ
|
Propane terminal
|
14.6
|
0.3
|
|||||||||
|
Sound Terminal (4)
|
100
|
Pierce, WA
|
Propane terminal
|
3.3
|
0.2
|
|||||||||
| (1) | Throughputs include volumes related to exchange agreements and third-party storage agreements. |
| (2) | Volumes reflect total transport and injection volumes. |
| (3) | Throughput volume reflects 100% of the facility volumes. |
| (4) | Operated by Logistics Assets segment. |
Operational Risks and Insurance
The Partnership is subject to all risks inherent in the midstream natural gas, crude oil and petroleum logistics businesses. These risks include, but are not limited to, explosions, fires, mechanical failure, terrorist attacks, product spillage, weather, nature and inadequate maintenance of rights-of-way and could result in damage to or destruction of operating assets and other property, or could result in personal injury, loss of life or environmental pollution, as well as curtailment or suspension of operations at the affected facility. We maintain, on behalf of ourselves and our subsidiaries, including the Partnership, general public liability, property, boiler and machinery and business interruption insurance in amounts that we consider to be appropriate for such risks. Such insurance is subject to deductibles that we consider reasonable and not excessive given the current insurance market environment. The costs associated with this insurance coverage increased significantly following Hurricanes Katrina and Rita in 2005 and then again following Hurricanes Gustav and Ike and as a result of volatile conditions in the financial markets in 2008. Insurance premiums, deductibles and co-insurance requirements increased substantially, and terms were generally less favorable than terms that were obtained prior to these events.
The occurrence of a significant loss that is not fully insured or indemnified against, or the failure of a party to meet its indemnification obligations, could materially and adversely affect the Partnership’s operations and the Partnership’s and our financial condition. While we currently maintain levels and types of insurance that we believe to be prudent under current insurance industry market conditions, our inability to secure these levels and types of insurance in the future could negatively impact the Partnership business operations and the Partnership’s and our financial stability, particularly if an uninsured loss were to occur. No assurance can be given that we will be able to maintain these levels of insurance in the future at rates considered commercially reasonable, particularly named windstorm coverage and contingent business interruption coverage for our onshore operations.
Significant Customers
The following table lists the percentage of the Partnership’s consolidated sales with its significant customer:
|
|
2013
|
2012
|
2011
|
|||||||||
|
% of consolidated revenues
|
|
|
|
|||||||||
|
Chevron Phillips Chemical Company LLC
|
8
|
%
|
10
|
%
|
12
|
%
|
||||||
The Partnership has agreements with Chevron Phillips Chemical Company LLC (“CPC”), pursuant to which it supplies a significant portion of CPC’s NGL feedstock needs for petrochemical plants in the Texas Gulf Coast area and a related services agreement, pursuant to which the Partnership provides storage and logistical services to CPC for feedstocks and products produced from the petrochemical plants. The services contract was renegotiated in 2008 with key components having a ten-year term. In September 2009, the Partnership executed a new feedstock and storage agreement with CPC for a term of five years, and the Partnership amended these agreements in 2013, with a new term through August 2019. We believe that the Partnership is well positioned to retain CPC as a customer based on the Partnership’s long-standing history of customer service, the criticality of the service provided, the integrated nature of facilities and the difficulty and high cost associated with replicating the Partnership’s assets.
No customer accounted for more than 10% of the Partnership’s consolidated revenues during the year ended December 31, 2013.
Competition
The Partnership faces strong competition in acquiring new natural gas or crude oil supplies. Competition for natural gas supplies is primarily based on the location of gathering and processing facilities, pricing arrangements, reputation, efficiency, flexibility, reliability and access to end-use markets or liquid marketing hubs. Competitors to the Partnership’s gathering and processing operations include other natural gas gatherers and processors, such as major interstate and intrastate pipeline companies, master limited partnerships and oil and gas producers. The Partnership’s major competitors for natural gas supplies in our current operating regions include Atlas Gas Pipeline Company, Kinder Morgan Energy Partners, L.P., WTG Gas Processing, L.P. (“WTG”), DCP Midstream Partners LP (“DCP”), Devon Energy Corporation (“Devon”), Enbridge Inc, ONEOK – Rockies Midstream, L.L.C., GulfSouth Pipeline Company, LP, Hanlon Gas Processing, Ltd., J W Operating Company, Louisiana Intrastate Gas and several other interstate pipeline companies. The Partnership’s competitors for crude oil gathering services in North Dakota include Arrow Midstream Holdings, LLC, Hiland Partners, LP, Great Northern Midstream LLC, Caliber Midstream Partners, LP and Bridger Pipeline LLC. The Partnership’s competitors may have greater financial resources than it possesses.
The Partnership also competes for NGL products to market through its Logistics and Marketing division. The Partnership’s competitors include major oil and gas producers who market NGL products for their own account and for others. Additionally, the Partnership competes with several other NGL marketing companies, including Enterprise Products Partners L.P. (“EPP”), DCP, ONEOK and BP p.l.c.
Additionally, the Partnership faces competition for mixed NGLs supplies at its fractionation facilities. Its competitors include large oil, natural gas and petrochemical companies. The fractionators in which the Partnership owns an interest in the Mont Belvieu region compete for volumes of mixed NGLs with other fractionators also located at Mont Belvieu. Among the primary competitors are EPP, ONEOK, Inc. and LoneStar NGL LLC. In addition, certain producers fractionate mixed NGLs for their own account in captive facilities. The Mont Belvieu fractionators also compete on a more limited basis with fractionators in Conway, Kansas and a number of decentralized, smaller fractionation facilities in Texas, Louisiana and New Mexico. The Partnership’s other fractionation facilities compete for mixed NGLs with the fractionators at Mont Belvieu as well as other fractionation facilities located in Louisiana. The Partnership’s customers who are significant producers of mixed NGLs and NGL products or consumers of NGL products may develop their own fractionation facilities in lieu of using the Partnerships’ services. Its primary competitor in providing export services to its customers is EPP.
Regulation of Operations
Regulation of pipeline gathering and transportation services, natural gas sales and transportation of NGLs may affect certain aspects of the Partnership’s business and the market for its products and services.
Regulation of Interstate Natural Gas Pipelines
VGS is regulated by FERC under the Natural Gas Act of 1938 (“NGA”), and the Natural Gas Policy Act of 1978 (“NGPA”). VGS operates under a FERC-approved, open-access tariff that establishes the rates and the terms and conditions under which the system provides services to its customers. Pursuant to FERC’s jurisdiction, existing pipeline rates and/or terms and conditions of service may be challenged by customer complaint or by FERC and proposed rate changes or changes in the terms and conditions of service may be challenged by protest. Generally, FERC’s authority extends to: transportation of natural gas; rates and charges for natural gas transportation; certification and construction of new facilities; extension or abandonment of services and facilities; maintenance of accounts and records; commercial relationships and communications between pipelines and certain affiliates; terms and conditions of service and service contracts with customers; depreciation and amortization policies; and acquisition and disposition of facilities.
VGS holds a certificate of public convenience and necessity issued by FERC permitting the construction, ownership, and operation of its interstate natural gas pipeline facilities and the provision of transportation services. This certificate authorization requires VGS to provide on a nondiscriminatory basis open-access services to all customers who qualify under its FERC gas tariff. FERC has the power to prescribe the accounting treatment of items for regulatory purposes. Thus, the books and records of VGS may be periodically audited by FERC.
The maximum recourse rates that may be charged by VGS for its services are established through FERC’s ratemaking process. Generally, the maximum filed recourse rates for interstate pipelines are based on the cost of service, including recovery of and a return on the pipeline’s investment. Key determinants in the ratemaking process are costs of providing service, allowed rate of return and volume throughput and contractual capacity commitment assumptions. VGS is permitted to discount its firm and interruptible rates without further FERC authorization down to the variable cost of performing service, provided they do not “unduly discriminate.” The applicable recourse rates and terms and conditions for service are set forth in each pipeline’s FERC-approved tariff. Rate design and the allocation of costs also can impact a pipeline’s profitability.
Gathering Pipeline Regulation
The Partnership’s natural gas gathering operations are typically subject to ratable take and common purchaser statutes in the states in which it operates. The common purchaser statutes generally require gathering pipelines to purchase or take without undue discrimination as to source of supply or producer. These statutes are designed to prohibit discrimination in favor of one producer over another or one source of supply over another. The regulations under these statutes can have the effect of imposing some restrictions on the Partnership’s ability as an owner of gathering facilities to decide with whom it contracts to gather natural gas. The states in which the Partnership operates have adopted complaint-based regulation of natural gas gathering activities, which allows natural gas producers and shippers to file complaints with state regulators in an effort to resolve grievances relating to gathering access and rate discrimination. The rates the Partnership charges for gathering are deemed just and reasonable unless challenged in a complaint. We cannot predict whether such a complaint will be filed against the Partnership in the future. Failure to comply with state regulations can result in the imposition of administrative, civil and criminal penalties.
Section 1(b) of the NGA exempts natural gas gathering facilities from regulation as a natural gas company by FERC under the NGA. The Partnership believes that the natural gas pipelines in its gathering systems, including the gas gathering systems that are part of the Badlands and of the Pelican and Seahawk gathering systems, meet the traditional tests FERC has used to establish a pipeline’s status as a gatherer not subject to regulation as a natural gas company. However, to the extent the Partnership’s gathering systems buy and sell natural gas, such gatherers, in their capacity as buyers and sellers of natural gas, are now subject to Order No. 704. See “—Other Federal Laws and Regulation Affecting Our Industry—FERC Market Transparency Rules.”
Intrastate Pipeline Regulation
Though the Partnership’s natural gas intrastate pipelines are not subject to regulation by FERC as natural gas companies under the NGA, the Partnership’s intrastate pipelines may be subject to certain FERC-imposed reporting requirements depending on the volume of natural gas purchased or sold in a given year. See “—Other Federal Laws and Regulation Affecting Our Industry—FERC Market Transparency Rules.”
The Partnership’s intrastate pipelines located in Texas are regulated by the Railroad Commission of Texas (the “RRC”). The Partnership’s Texas intrastate pipeline, Targa Intrastate Pipeline LLC (“Targa Intrastate”), owns the intrastate pipeline that transports natural gas from the Partnership’s Shackelford processing plant to an interconnect with Atmos Pipeline-Texas that in turn delivers gas to the West Texas Utilities Company’s Paint Creek Power Station. Targa Intrastate also owns a 1.65-mile, ten-inch diameter intrastate pipeline that transports natural gas from a third-party gathering system into the Chico system in Denton County, Texas. Targa Intrastate is a gas utility subject to regulation by the RRC and has a tariff on file with such agency. The Partnership’s other intrastate pipeline, Targa Gas Pipeline LLC, owns a multi-county intrastate pipeline that transports gas in Crane, Ector, Midland, and Upton Counties, Texas, as well as some line in North Texas. Targa Gas Pipeline LLC is a gas utility subject to regulation by the RRC.
The Partnership’s Louisiana intrastate pipeline, Targa Louisiana Intrastate LLC (“TLI”) owns an approximately 60-mile intrastate pipeline system that receives all of the natural gas it transports within or at the boundary of the State of Louisiana. Because all such gas ultimately is consumed within Louisiana, and since the pipeline’s rates and terms of service are subject to regulation by the Office of Conservation of the Louisiana Department of Natural Resources (“DNR”), the pipeline qualifies as a Hinshaw pipeline under Section 1(c) of the NGA and thus is exempt from most FERC regulation.
Texas and Louisiana have adopted complaint-based regulation of intrastate natural gas transportation activities, which allows natural gas producers and shippers to file complaints with state regulators in an effort to resolve grievances relating to pipeline access and rate discrimination. The rates the Partnership charges for intrastate transportation are deemed just and reasonable unless challenged in a complaint. We cannot predict whether such a complaint will be filed against the Partnership in the future. Failure to comply with state regulations can result in the imposition of administrative, civil and criminal penalties.
The Partnership’s intrastate NGL pipelines in Louisiana gather mixed NGLs streams that we own from processing plants in Louisiana and deliver such streams to the Gillis fractionators in Lake Charles, Louisiana, where the mixed NGLs streams are fractionated into various products. We deliver such refined petroleum products (ethane, propane, butanes and natural gasoline) out of its fractionator to and from Targa-owned storage, to other third-party facilities and to various third-party pipelines in Louisiana. These pipelines are not subject to FERC regulation or rate regulation by the DNR, but are regulated by United States Department of Transportation (“DOT”) safety regulations.
The Partnership’s intrastate pipelines in North Dakota are subject to the various regulations of the State of North Dakota. In addition, various federal agencies within the U.S. Department of the Interior, particularly the Bureau of Land Management, Office of Natural Resources Revenue (formerly the Minerals Management Service) and the Bureau of Indian Affairs, as well as the Three Affiliated Tribes, promulgate and enforce regulations pertaining to operations on the Fort Berthold Indian Reservation, on which the Partnership operates a significant portion of its Badlands gathering and processing assets. The Three Affiliated Tribes is a sovereign nation having the right to enforce certain laws and regulations independent from federal, state and local statutes and regulations.
Natural Gas Processing
The Partnership’s natural gas gathering and processing operations are not presently subject to FERC regulation. However, since May 2009, the Partnership has been required to report to FERC information regarding natural gas sale and purchase transactions for some of its operations depending on the volume of natural gas transacted during the prior calendar year. See “—Other Federal Laws and Regulation Affecting Our Industry—FERC Market Transparency Rules.” There can be no assurance that the Partnership’s processing operations will continue to be exempt from other FERC regulation in the future.
Sales of Natural Gas and NGLs
The price at which the Partnership buys and sells natural gas and NGLs is currently not subject to federal rate regulation and, for the most part, is not subject to state regulation. However, with regard to the Partnership’s physical purchases and sales of these energy commodities and any related hedging activities that the Partnership undertakes, it is required to observe anti-market manipulation laws and related regulations enforced by FERC and/or the Commodities Futures Trading Commission (“CFTC”). See “—Other Federal Laws and Regulation Affecting Our Industry—Energy Policy Act of 2005.” Since May 1, 2009, the Partnership has been required to report to FERC information regarding natural gas sale and purchase transactions for some of the Partnership’s operations depending on the volume of natural gas transacted during the prior calendar year. See “—Other Federal Laws and Regulation Affecting Our Industry—FERC Market Transparency Rules.” Should the Partnership violate the anti-market manipulation laws and regulations, it could also be subject to related third-party damage claims by, among others, market participants, sellers, royalty owners and taxing authorities.
Other State and Local Regulation of Operations
The Partnership’s business activities are subject to various state and local laws and regulations, as well as orders of regulatory bodies pursuant thereto, governing a wide variety of matters, including marketing, production, pricing, community right-to-know, protection of the environment, safety and other matters. In addition, the Three Affiliated Tribes promulgate and enforce regulations pertaining to operations on the Fort Berthold Indian Reservation, on which the Partnership operates a significant portion of its Badlands gathering and processing assets. The Three Affiliated Tribes is a sovereign nation having the right to enforce certain laws and regulations independent from federal, state and local statutes and regulations. For additional information regarding the potential impact of federal, state, tribal or local regulatory measures on the Partnership’s business, see “Risk Factors—Risks Related to Our Business.”
Interstate Common Carrier Liquids Pipeline Regulation
Targa NGL Pipeline Company LLC (“Targa NGL”) has interstate NGL pipelines that are considered common carrier pipelines subject to regulation by FERC under the Interstate Commerce Act (the “ICA”). More specifically, Targa NGL owns a regulated twelve-inch diameter pipeline that runs between Lake Charles, Louisiana and Mont Belvieu, Texas. This pipeline can move mixed NGLs and purity NGL products. Targa NGL also owns an eight-inch diameter pipeline and a twenty-inch diameter pipeline, each of which runs between Mont Belvieu, Texas and Galena Park, Texas. The eight-inch and the twenty-inch pipelines are also regulated and are part of an extensive mixed NGL and purity NGL pipeline receipt and delivery system that provides services to domestic and foreign import and export customers. The ICA requires that the Partnership maintain tariffs on file with FERC for each of these pipelines. Those tariffs set forth the rates the Partnership charges for providing transportation services as well as the rules and regulations governing these services. The ICA requires, among other things, that rates on interstate common carrier pipelines be “just and reasonable” and non-discriminatory. All shippers on these pipelines are subsidiaries of the Partnership.
The crude oil pipeline system that is part of the Badlands assets has qualified for a temporary waiver of applicable FERC regulatory requirements under the ICA based on current circumstances. Such waivers are subject to revocation, however, and should the pipeline’s circumstances change. FERC could, either at the request of other entities or on its own initiative, assert that some or all of the transportation on this pipeline system is within its jurisdiction. In the event that FERC were to determine that this pipeline system no longer qualified for waiver, the Partnership would likely be required to file a tariff with FERC, provide a cost justification for the transportation charge, and provide service to all potential shippers without undue discrimination. Such a change in the jurisdictional status of transportation on this pipeline could adversely affect the Partnership’s results of operations.
Other Federal Laws and Regulations Affecting Our Industry
Domenici-Barton Energy Policy Act of 2005 (“EP Act of 2005”)
The EP Act of 2005 is a comprehensive compilation of tax incentives, authorized appropriations for grants and guaranteed loans, and significant changes to the statutory policy that affects all segments of the energy industry. Among other matters, the EP Act of 2005 amends the NGA to add an anti-market manipulation provision which makes it unlawful for any entity to engage in prohibited behavior to be prescribed by FERC, and furthermore provides FERC with additional civil penalty authority. The EP Act of 2005 provides FERC with the power to assess civil penalties of up to $1 million per day for violations of the NGA and $1 million per violation per day for violations of the NGPA. The civil penalty provisions are applicable to entities that engage in the sale of natural gas for resale in interstate commerce, including VGS. In 2006, FERC issued Order No. 670 to implement the anti-market manipulation provision of the EP Act of 2005. Order No. 670 does not apply to activities that relate only to intrastate or other non-jurisdictional sales or gathering, but does apply to activities of gas pipelines and storage companies that provide interstate services, as well as otherwise non-jurisdictional entities to the extent the activities are conducted “in connection with” gas sales, purchases or transportation subject to FERC jurisdiction, which includes the annual reporting requirements under a final rule on the annual natural gas transaction reporting requirements, as amended by subsequent orders on rehearing (Order No.704), and the quarterly reporting requirement under Order No. 735. The anti-market manipulation rule and enhanced civil penalty authority reflect an expansion of FERC’s NGA enforcement authority.
FERC Market Transparency Rules
Beginning in 2007, FERC has issued a number of rules intended to provide for greater marketing transparency in the natural gas industry, including Order Nos. 704, 720, and 735. Under Order No. 704, wholesale buyers and sellers of more than 2.2 Bcf of physical natural gas in the previous calendar year, including interstate and intrastate natural gas pipelines, natural gas gatherers, natural gas processors and natural gas marketers, are now required to report, on May 1 of each year, aggregate volumes of natural gas purchased or sold at wholesale in the prior calendar year to the extent such transactions utilize, contribute to, or may contribute to the formation of price indices.
Under Order No. 720, certain non-interstate pipelines delivering, on an annual basis, more than an average of 50 MMBtu of gas over the previous three calendar years, are required to post on a daily basis certain information regarding the pipeline’s capacity and scheduled flows for each receipt and delivery point that has a design capacity equal to or greater than 15,000 MMBtu/d and interstate pipelines are required to post information regarding the provision of no-notice service. In October 2011, Order No. 720, as clarified, was vacated by the Court of Appeals for the Fifth Circuit. We take the position that, at this time, all of the Partnership’s entities are exempt from Order No. 720 as currently effective.
Under Order No. 735, intrastate pipelines providing transportation services under Section 311 of the NGPA and “Hinshaw” pipelines operating under Section 1(c) of the NGA are required to report on a quarterly basis more detailed transportation and storage transaction information, including: rates charged by the pipeline under each contract; receipt and delivery points and zones or segments covered by each contract; the quantity of natural gas the shipper is entitled to transport, store, or deliver; the duration of the contract; and whether there is an affiliate relationship between the pipeline and the shipper. Order No. 735 also extends FERC’s periodic review of the rates charged by the subject pipelines from three years to five years. On rehearing, FERC reaffirmed Order No. 735 with some modifications. As currently written, this rule does not apply to the Partnership’s Hinshaw pipelines.
Additional proposals and proceedings that might affect the natural gas industry are pending before Congress, FERC and the courts. We cannot predict the ultimate impact of these or the above regulatory changes to the Partnership’s natural gas operations. We do not believe that we would be affected by any such FERC action materially differently than other midstream natural gas companies with whom we compete.
Environmental and Operational Health and Safety Matters
General
The Partnership’s operations are subject to stringent and complex federal, regional, state and local laws and regulations governing the discharge of materials into the environment, worker health and safety, or otherwise relating to environmental protection. As with the industry generally, compliance with current and anticipated environmental laws and regulations increases the Partnership’s overall cost of business, including its capital costs to construct, maintain and upgrade equipment and facilities. These laws and regulations may, among other things; require the acquisition of various permits to conduct regulated activities; require the installation of pollution control equipment or otherwise restrict the way the Partnership can handle or dispose of wastes; limit or prohibit construction activities in sensitive areas such as wetlands, wilderness or urban areas or areas inhabited by endangered or threatened species; impose specific health and safety criteria addressing worker protection; require investigatory and remedial action to mitigate pollution conditions caused by its operations or attributable to former operations; and enjoin some or all of the operations of facilities deemed in non-compliance with permits issued pursuant to such environmental laws and regulations. Failure to comply with these laws and regulations may result in assessment of administrative, civil and criminal sanctions including penalties, the imposition of removal or remedial obligations and the issuance of injunctions limiting or prohibiting the Partnership’s activities.
The Partnership has implemented programs and policies designed to keep its pipelines, plants and other facilities in compliance with existing environmental laws and regulations. The clear trend in environmental regulation, however, is to place more restrictions and limitations on activities that may affect the environment, and thus any changes in environmental laws and regulations or reinterpretation of enforcement policies that result in more stringent and costly waste management or disposal, pollution control or remediation requirements could have a material adverse effect on the Partnership’s operations and financial position. The Partnership may be unable to pass on such increased compliance costs to its customers. Moreover, accidental releases or spills may occur in the course of the Partnership’s operations and we cannot assure you that the Partnership will not incur significant costs and liabilities as a result of such releases or spills, including any third-party claims for damage to property or natural resources or injury to persons. While we believe that the Partnership is in substantial compliance with existing environmental laws and regulations and that continued compliance with current legal requirements would not have a material adverse effect on the Partnership, there is no assurance that the current regulatory standards will not become more onerous in the future, resulting in more significant costs to maintain compliance or increased exposure to significant liabilities, which could diminish the Partnership’s ability to make distributions to its unitholders. For example, following the collapse of a cavern wall in a salt dome being developed by a third party and the resulting creation of a sinkhole near the community of Bayou Corne in Assumption Parish, Louisiana, the Louisiana Department of Natural Resources issued a proposed rulemaking in late 2013 that, if adopted, would impose more stringent requirements in the operation of Class III injection wells and hydrocarbon storage wells in salt dome caverns including, among other things, placing strict distance limitations on the location of solution-mined caverns in relation to the outer boundaries of a salt stock within a salt dome. As proposed, the rulemaking, if adopted, would require the Partnership to abandon the operation of at least one storage well. The Partnership is continuing to assess the effect that this proposed rulemaking might have on its operations in the state.
The following is a summary of the more significant existing environmental and worker health and safety laws and regulations to which the Partnership’s business operations are subject and for which compliance may have a material adverse impact on the Partnership’s capital expenditures, results of operations or financial position.
Hazardous Substances and Waste
The Comprehensive Environmental Response, Compensation, and Liability Act, as amended (“CERCLA”), and comparable state laws impose liability, without regard to fault or the legality of the original conduct, on certain classes of persons who are considered to be responsible for the release of a “hazardous substance” into the environment. These persons include current and prior owners or operators of the site where the release occurred and entities that disposed or arranged for the disposal of the hazardous substances found at the site. Under CERCLA, these “responsible persons” may be subject to joint and several, strict liability for the costs of cleaning up the hazardous substances that have been released into the environment, for damages to natural resources and for the costs of certain health studies. CERCLA also authorizes the Environmental Protection Agency (“EPA”) and, in some instances, third-parties to act in response to threats to the public health or the environment and to seek to recover from the responsible classes of persons the costs they incur. It is not uncommon for neighboring landowners and other third parties to file claims for personal injury and property damage allegedly caused by the release of hazardous substances or other pollutants into the environment. The Partnership generates materials in the course of its operations that are regulated as “hazardous substances” under CERCLA or similar state statutes and, as a result, may be jointly and severally liable under CERCLA or such statutes for all or part of the costs required to clean up sites at which these hazardous substances have been released into the environment.
The Partnership also generates solid wastes, including hazardous wastes that are subject to the requirements of the Resource Conservation and Recovery Act, as amended (“RCRA”), and comparable state statutes. While RCRA regulates both solid and hazardous wastes, it imposes strict requirements on the generation, storage, treatment, transportation and disposal of hazardous wastes. In the course of the Partnership’s operations, it generates petroleum product wastes and ordinary industrial wastes such as paint wastes, waste solvents and waste compressor oils that are regulated as hazardous wastes. Certain materials generated in the exploration, development or production of crude oil and natural gas are excluded from RCRA’s hazardous waste regulations. However, it is possible that future changes in law or regulation could result in these wastes, including wastes currently generated during the Partnership’s operations, being designated as “hazardous wastes” and therefore subject to more rigorous and costly disposal requirements. Any such changes in the laws and regulations could have a material adverse effect on the Partnership’s capital expenditures and operating expenses as well as those of the oil and gas industry in general.
The Partnership currently owns or leases and has in the past owned or leased properties that for many years have been used for midstream natural gas and NGL activities and refined petroleum product and crude oil storage and terminaling activities. Although the Partnership has utilized operating and disposal practices that were standard in the industry at the time, hydrocarbons or other substances and wastes may have been disposed of or released on or under the properties owned or leased by the Partnership or on or under the other locations where these hydrocarbons or other substances and wastes have been taken for treatment or disposal. In addition, certain of these properties have been operated by third parties whose treatment and disposal or release of hydrocarbons or other substances and wastes was not under the Partnership’s control. These properties and any hydrocarbons, substances and wastes disposed thereon may be subject to CERCLA, RCRA and analogous state laws. Under these laws, the Partnership could be required to remove or remediate previously disposed wastes (including wastes disposed of or released by prior owners or operators), to clean up contaminated property (including contaminated groundwater) and to perform remedial operations to prevent future contamination. We are not currently aware of any facts, events or conditions relating to such requirements that would reasonably be expected to have a material adverse effect on the Partnership’s results of operations or financial condition.
Air Emissions
The federal Clean Air Act, as amended, and comparable state laws and regulations restrict the emission of air pollutants from many sources, including processing plants and compressor stations, and also impose various monitoring and reporting requirements. These laws and regulations may require the Partnership to obtain pre-approval for the construction or modification of certain projects or facilities expected to produce or significantly increase air emissions, obtain and strictly comply with stringent air permit requirements or utilize specific equipment or technologies to control emissions. The need to obtain permits has the potential to delay the development of oil and natural gas related projects. Over the next several years, the Partnership may be required to incur certain capital expenditures for air pollution control equipment or other air emissions related issues. For example, on August 16, 2012, the EPA published final rules under the Clean Air Act that subject oil and natural gas production, processing, transmission and storage operations to regulation under the New Source Performance Standards and National Emission Standards for Hazardous Air Pollutants federal programs. These final rules, among other things, revise existing requirements for volatile organic compound emissions from equipment leaks at onshore natural gas processing plants by lowering the leak definition for valves from 10,000 parts per million to 500 parts per million and requires monitoring of connectors, pumps, pressure relief devices and open-ended lines. In addition, these rules establish requirements regarding emissions from: (i) wet seal and reciprocating compressors at gathering systems, boosting facilities, and onshore natural gas processing plants; (ii) specified pneumatic controllers at gathering systems, boosting facilities and onshore natural gas processing plants; and (iii) specified storage vessels at gathering systems, boosting facilities and onshore natural gas processing plants. Compliance with these requirements could increase the Partnership’s operational costs for upstream and midstream activities, which could be significant.
Climate Change
In December 2009, the EPA published its findings that emissions of carbon dioxide, methane and other greenhouse gases (“GHGs”) present an endangerment to public health and the environment because emissions of such gases are, according to the EPA, contributing to warming of the earth’s atmosphere and other climatic changes. Based on these findings, the EPA has adopted regulations under the Clean Air Act that, among other things, establish GHG emission limits from motor vehicles as well as establish Prevention of Significant Deterioration (“PSD”) construction and Title V operating permit reviews for certain large stationary sources that are potential major sources of GHG emissions. Facilities required to obtain PSD permits for their GHG emissions also will be required to meet “best available control technology” standards that will be established by the states or, in some cases, by the EPA on a case-by-case basis. In October 2013, the U.S. Supreme Court agreed to hear a lawsuit challenging whether the EPA permissibly determined that the regulation of GHG emissions from new motor vehicles triggered permitting requirements under the Clean Air Act for stationary sources that emit GHGs, with a decision expected in 2014. In addition, the EPA has adopted rules requiring the monitoring and reporting of GHG emissions from specified onshore and offshore production sources, specified onshore and offshore production facilities and onshore processing, transmission and storage facilities in the United States on an annual basis. We are monitoring GHG emissions from the Partnership’s operations in accordance with the GHG emissions reporting rule and believe that the Partnership’s monitoring and reporting activities are in substantial compliance with applicable reporting obligations.
While Congress has from time to time considered legislation to reduce emissions of GHGs, there has not been significant activity in the form of adopted legislation to reduce emissions of GHGs in recent years. In the absence of such federal climate legislation, a number of state and regional efforts have emerged that are aimed at tracking and/or reducing emissions by means of cap and trade programs that typically require major sources of GHG emissions to acquire and surrender emission allowances in return for emitting those GHGs. The adoption of any legislation or regulations that requires reporting of GHGs or otherwise restricts emissions of GHGs from the Partnership’s equipment and operations could require it to incur significant added costs to reduce emissions of GHGs or could adversely affect demand for the natural gas and NGLs it gathers and processes or fractionates. Moreover, if Congress undertakes comprehensive tax reform in the coming year, it is possible that such reform may include a carbon tax, which could impose additional direct costs on operations and reduce demand for refined products, which could adversely affect the services the Partnership provides. Finally, some scientists have concluded that increasing concentrations of GHGs in the Earth’s atmosphere may produce climate change that could have significant physical effects, such as increased frequency and severity of storms, droughts, and floods and other climatic events; if such effects were to occur, they could have an adverse effect on the Partnership’s operations.
Water Discharges
The Federal Water Pollution Control Act, as amended (“Clean Water Act” or “CWA”), and analogous state laws impose restrictions and strict controls regarding the discharge of pollutants into navigable waters. Pursuant to the CWA and analogous state laws, permits must be obtained to discharge pollutants into state waters or waters of the United States. Any such discharge of pollutants into regulated waters must be performed in accordance with the terms of the permit issued by the EPA or the analogous state agency. Spill prevention, control and countermeasure requirements under federal law require appropriate containment berms and similar structures to help prevent the contamination of navigable waters in the event of a petroleum hydrocarbon tank spill, rupture or leak. In addition, the CWA and analogous state laws require individual permits or coverage under general permits for discharges of storm water runoff from certain types of facilities. The CWA also prohibits the discharge of dredge and fill material in regulated waters, including wetlands, unless authorized by permit. The CWA and analogous state laws can impose substantial administrative, civil and criminal penalties for non-compliance including spills and other non-authorized discharges.
The Federal Oil Pollution Act of 1990, as amended (“OPA”), which amends the CWA, establishes strict liability for owners and operators of facilities that are the site of a release of oil into waters of the United States. The OPA and its associated regulations impose a variety of requirements on responsible parties related to the prevention of oil spills and liability for damages resulting from such spills. A “responsible party” under the OPA includes owners and operators of onshore facilities, such as the Partnership’s plants, and pipelines. Under the OPA, owners and operators of facilities that handle, store, or transport oil are required to develop and implement oil spill response plans, and establish and maintain evidence of financial responsibility sufficient to cover liabilities related to an oil spill for which such parties could be statutorily responsible. We believe that the Partnership is in substantial compliance with the CWA, the OPA and analogous state laws.
Hydraulic Fracturing
It is customary to recover natural gas from deep shale formations through the use of hydraulic fracturing, combined with sophisticated horizontal drilling. Hydraulic fracturing involves the injection of water, sand and chemical additives under pressure into rock formations to stimulate gas production. The process is typically regulated by state oil and gas commissions but the EPA has asserted limited regulatory authority over hydraulic fracturing, and has indicated it may seek to further expand its regulation of hydraulic fracturing. Also, the Bureau of Land Management has proposed regulations applicable to hydraulic fracturing conducted on federal and Indian oil and gas leases. In addition, Congress has from time to time considered the adoption of legislation to provide for federal regulation of hydraulic fracturing. At the state level, a growing number of states have adopted or are considering legal requirements that could impose more stringent permitting, disclosure, or well construction requirements on hydraulic fracturing activities. In addition, local governments may seek to adopt ordinances within their jurisdictions regulating the time, place and manner of drilling activities in general or hydraulic fracturing activities in particular. Further, several federal governmental agencies are conducting reviews and studies on the environmental aspects of hydraulic fracturing activities, including the White House Council on Environmental Quality, the EPA and the U.S. Department of Energy. These studies, depending on their degree of pursuit and any meaningful results obtained, could spur initiatives to further regulate hydraulic fracturing. While the Partnership does not conduct hydraulic fracturing, if new or more stringent federal, state, or local legal restrictions relating to the hydraulic fracturing process are adopted in areas where the Partnership’s oil and natural gas exploration and production customers operate, those customers could incur potentially significant added costs to comply with such requirements and experience delays or curtailment in the pursuit of exploration, development, or production activities, which could reduce demand for the Partnership’s gathering, processing and fractionation services.
The federal Endangered Species Act, as amended (“ESA”), restricts activities that may affect endangered or threatened species or their habitats. While some of the Partnership’s facilities may be located in areas that are designated as habitat for endangered or threatened species, we believe that the Partnership is in substantial compliance with the ESA. If endangered species are located in areas of the underlying properties where the Partnership wishes to conduct development activities, such work could be prohibited or delayed or expensive mitigation may be required. Moreover, as a result of a settlement approved by the U.S. District Court for the District of Columbia in September 2011, the U.S. Fish and Wildlife Service is required to make a determination on the listing of numerous species as endangered or threatened under the ESA before the completion of the agency’s 2017 fiscal year. The designation of previously unprotected species as threatened or endangered in areas where the Partnership or its oil and natural gas exploration and production customers operate could cause the Partnership or its customers to incur increased costs arising from species protection measures and could result in delays or limitations in its customers’ performance of operations, which could reduce demand for the Partnership’s midstream services.
The Partnership is subject to a number of federal and state laws and regulations, including the federal Occupational Safety and Health Act, as amended (“OSHA”), and comparable state statutes, whose purpose is to protect the health and safety of workers, both generally and within the pipeline industry. In addition, the OSHA hazard communication standard, the EPA community right-to-know regulations under Title III of the Federal Superfund Amendment and Reauthorization Act and comparable state statutes require that information be maintained concerning hazardous materials used or produced in the Partnership’s operations and that this information be provided to employees, state and local government authorities and citizens. The Partnership and the entities in which it owns an interest are also subject to OSHA Process Safety Management regulations, which are designed to prevent or minimize the consequences of catastrophic releases of toxic, reactive, flammable or explosive chemicals. The regulations apply to any process that (1) involves a listed chemical in a quantity at or above the threshold quantity specified in the regulation for that chemical, or (2) involves certain flammable gases or flammable liquids present on site in one location in a quantity of 10,000 pounds or more.
Flammable liquids stored in atmospheric tanks below their normal boiling point without the benefit of chilling or refrigeration is exempt. The Partnership has an internal program of inspection designed to monitor and enforce compliance with worker safety requirements. We believe that the Partnership is in substantial compliance with all applicable laws and regulations relating to worker health and safety.
Pipeline Safety
Many of the Partnership’s natural gas, NGL and crude pipelines are subject to regulation by the Pipeline and Hazardous Materials Safety Administration (“PHMSA”) of the DOT under the Natural Gas Pipeline Safety Act of 1968, as amended (“NGPSA”), with respect to natural gas, and the Hazardous Liquids Pipeline Safety Act of 1979, as amended (“HLPSA”), with respect to crude oil, NGLs and condensates. Both the NGPSA and the HLPSA were amended by the Pipeline Safety Improvement Act of 2002 (“PSI Act”) and the Pipeline Inspection, Protection, Enforcement, and Safety Act of 2006 (“PIPES Act”). The NGPSA and HLPSA, as amended, govern the design, installation, testing, construction, operation, replacement and management of natural gas as well as crude oil, NGL and condensate pipeline facilities. Pursuant to these acts, PHMSA has promulgated regulations governing pipeline wall thickness, design pressures, maximum operating pressures, pipeline patrols and leak surveys, minimum depth requirements, and emergency procedures, as well as other matters intended to ensure adequate protection for the public and to prevent accidents and failures. Additionally, PHMSA has established a series of rules requiring pipeline operators to develop and implement integrity management programs for gas transmission and hazardous liquid pipelines that, in the event of a pipeline leak or rupture, could affect “high consequence areas,” which are areas where a release could have the most significant adverse consequences, including high-population areas, certain drinking water sources and unusually sensitive ecological areas. We believe that the Partnership’s pipeline operations are in substantial compliance with applicable NGPSA and HLPSA requirements; however, due to the possibility of new or amended laws and regulations or reinterpretation of existing laws and regulations, future compliance with the NGPSA and HLPSA could result in increased costs.
Most recently, these pipeline safety laws were amended on January 3, 2012, when President Obama signed the Pipeline Safety, Regulatory Certainty, and Job Creation Act of 2011 (“2011 Pipeline Safety Act”), which act requires increased safety measures for gas and hazardous liquids transportation pipelines. Among other things, the 2011 Pipeline Safety Act directs the Secretary of Transportation to promulgate rules or standards relating to expanded integrity management requirements, automatic or remote-controlled valve use, excess flow valve use, leak detection system installation, testing to confirm that the material strength of certain pipelines are above 30% of specified minimum yield strength, and operator verification of records confirming the maximum allowable pressure of certain intrastate gas transmission pipelines. The 2011 Pipeline Safety Act also increases the maximum penalty for violation of pipeline safety regulations from $100,000 to $200,000 per violation per day of violation and also from $1 million to $2 million for a related series of violations. The safety enhancement requirements and other provisions of the 2011 Pipeline Safety Act as well as any implementation of PHMSA rules thereunder or any issuance or reinterpretation of PHMSA guidance with respect thereto could require us to install new or modified safety controls, pursue additional capital projects or conduct maintenance programs on an accelerated basis, any or all of which tasks could result in our incurring increased operating costs that could be significant and have a material adverse effect on our results of operations or financial position.
In addition, states have adopted regulations, similar to existing PHMSA regulations, for intrastate gathering and transmission lines. Texas, Louisiana and New Mexico have developed regulatory programs that parallel the federal regulatory scheme and are applicable to intrastate pipelines transporting natural gas and NGLs. North Dakota has similarly implemented regulatory programs applicable to intrastate natural gas pipelines. The Partnership currently estimates an annual average cost of $2.3 million for years 2014 through 2016 to perform necessary integrity management program testing on its pipelines required by existing PHMSA and state regulations. This estimate does not include the costs, if any, of any repair, remediation, preventative or mitigating actions that may be determined to be necessary as a result of the testing program, which costs could be substantial. However, we do not expect that any such costs would be material to the Partnership’s financial condition or results of operations.
The Partnership, or the entities in which it owns an interest, inspect our pipelines regularly in compliance with state and federal maintenance requirements. Nonetheless, the adoption of new or amended regulations by PHMSA or the states that result in more stringent or costly pipeline integrity management or safety standards could have a significant adverse effect on the Partnership and similarly situated midstream operators. For instance, in August 2011, PHMSA published an advance notice of proposed rulemaking in which the agency was seeking public comment on a number of changes to regulations governing the safety of gas transmission pipelines and gathering lines, including, for example, revising the definitions of “high consequence areas” and “gathering lines” and strengthening integrity management requirements as they apply to existing regulated operators and to currently exempt operators should certain exemptions be removed. PHMSA continues to evaluate the public comments received with respect to more stringent integrity management programs and recently, pursuant to one of the requirements in the 2011 Pipeline Safety Act, published a proposed rulemaking on August 1, 2013, seeking comments on whether an expansion of high consequence areas would mitigate the need for class location requirements that have been used in the past primarily to differentiate risk along a pipeline.
Finally, notwithstanding the applicability of the OSHA’s Process Safety Management (“PSM”) regulations and the EPA’s Risk Management Plan (“RMP”) requirements at regulated facilities, PHMSA and one or more state regulators, including the RRC, have in the recent past expanded the scope of their regulatory inspections to include certain in-plant equipment and pipelines found within NGL fractionation facilities and associated storage facilities, in order to assess compliance of such equipment and pipelines with hazardous liquid pipeline safety requirements. These recent actions by PHMSA are currently subject to judicial and administrative challenges by one or more midstream operators; however, to the extent that such legal challenges are unsuccessful, midstream operators of NGL fractionation facilities and associated storage facilities subject to such inspection may be required to make operational changes or modifications at their facilities to meet standards beyond current PSM and RMP requirements, which changes or modifications may result in additional capital costs, possible operational delays and increased costs of operation that, in some instances, may be significant.
Title to Properties and Rights-of-Way
The Partnership’s real property falls into two categories: (1) parcels that it owns in fee and (2) parcels in which its interest derives from leases, easements, rights-of-way, permits or licenses from landowners or governmental authorities permitting the use of such land for its operations. Portions of the land on which the Partnership’s plants and other major facilities are located are owned by the Partnership in fee title and we believe that the Partnership has satisfactory title to these lands. The remainder of the land on which the Partnership plant sites and major facilities are located is held by the Partnership pursuant to ground leases between the Partnership, as lessee, and the fee owner of the lands, as lessors. The Partnership and its predecessors have leased these lands for many years without any material challenge known to the Partnership relating to the title to the land upon which the assets are located, and we believe that the Partnership has satisfactory leasehold estates to such lands. We have no knowledge of any challenge to the underlying fee title of any material lease, easement, right-of-way, permit, lease or license; and we believe that the Partnership has satisfactory title to all of its material leases, easements, rights-of-way, permits, leases and licenses.
Employees
Through a wholly-owned subsidiary of ours, we employ 1,277 people who primarily support the Partnership’s operations. None of those employees are covered by collective bargaining agreements. We consider our employee relations to be good.
Financial Information by Reportable Segment
See “Segment Information” included under Note 23 of the “Consolidated Financial Statements” for a presentation of financial results by reportable segment and see “Management’s Discussion and Analysis of Financial Condition and Results of Operations– Results of Operations– By Segment” for a discussion of our and the Partnership’s financial results by segment.
Available Information
We make certain filings with the Securities and Exchange Commission (“SEC”), including our Annual Report on Form 10-K, quarterly reports on Form 10-Q, current reports on Form 8-K, and all amendments and exhibits to those reports. We make such filings available free of charge through our website,
http://www.targaresources.com
, as soon as reasonably practicable after they are filed with the SEC. The filings are also available through the SEC at the SEC’s Public Reference Room at 100 F Street, N.E., Washington, D.C. 20549 or by calling 1-800-SEC-0330. Also, these filings are available on the internet at
http
://
www.sec.gov
. Our press releases and recent analyst presentations are also available on our website.
The nature of our business activities subjects us to certain hazards and risks. You should consider carefully the following risk factors together with all of the other information contained in this report. If any of the following risks were actually to occur, then our business, financial condition, cash flows and results of operations could be materially adversely affected.
Risks Related to Our Business
Our cash flow is dependent upon the ability of the Partnership to make cash distributions to us.
Our cash flow consists entirely of cash distributions from the Partnership. The amount of cash that the Partnership will be able to distribute to its partners, including us, each quarter principally depends upon the amount of cash it generates from its business. For a description of certain factors that can cause fluctuations in the amount of cash that the Partnership generates from its business, please read “—Risks Inherent in the Partnership’s Business” and “Management’s Discussion and Analysis of Financial Condition and Results of Operations—Factors That Significantly Affect Our Results.” The Partnership may not have sufficient available cash each quarter to continue paying distributions at their current level or at all. If the Partnership reduces its per unit distribution, because of reduced operating cash flow, higher expenses, capital requirements or otherwise, we will have less cash available to pay dividends to our stockholders and would probably be required to reduce the dividend per share of common stock. The amount of cash the Partnership has available for distribution depends primarily upon the Partnership’s cash flow, including cash flow from the release of reserves as well as borrowings, and is not solely a function of profitability, which will be affected by non-cash items. As a result, the Partnership may make cash distributions during periods when it records losses and may not make cash distributions during periods when it records profits.
Once we receive cash from the Partnership and the general partner, our ability to distribute the cash received to our stockholders is limited by a number of factors, including:
|
·
|
our obligation to satisfy tax obligations associated with previous sales of assets to the Partnership; |
|
·
|
interest expense and principal payments on any indebtedness we incur; |
|
·
|
restrictions on distributions contained in any existing or future debt agreements; |
|
·
|
our general and administrative expenses, including expenses we incur as a result of being a public company as well as other operating expenses; |
|
·
|
expenses of the general partner; |
|
·
|
income taxes; |
|
·
|
reserves we establish in order for us to maintain our 2% general partner interest in the Partnership upon the issuance of additional partnership securities by the Partnership; and |
|
·
|
reserves our board of directors establishes for the proper conduct of our business, to comply with applicable law or any agreement binding on us or our subsidiaries or to provide for future dividends by us. |
The actual amount of cash that is available for dividends to our stockholders will depend on numerous factors, many of which are beyond our control.
A reduction in the Partnership’s distributions will disproportionately affect the amount of cash distributions to which we are entitled.
Our ownership of the IDRs in the Partnership entitles us to receive specified percentages of the amount of cash distributions made by the Partnership to its limited partners only in the event that the Partnership distributes more than $0.3881 per unit for such quarter. As a result, the holders of the Partnership’s common units have a priority over our IDRs to the extent of cash distributions by the Partnership up to and including $0.3881 per unit for any quarter.
Our IDRs entitle us to receive increasing percentages, up to 48%, of all cash distributed by the Partnership. Because the Partnership’s distribution rate is currently above the maximum target cash distribution level on the IDRs, future growth in distributions we receive from the Partnership will not result from an increase in the target cash distribution level associated with the IDRs. Furthermore, a decrease in the amount of distributions by the Partnership to less than $0.50625 per unit per quarter would reduce the general partner’s percentage of the incremental cash distributions above $0.3881 per common unit per quarter from 48% to 23%. As a result, any such reduction in quarterly cash distributions from the Partnership would have the effect of disproportionately reducing the distributions that we receive from the Partnership based on our IDRs as compared to distributions we receive from the Partnership with respect to our 2% general partner interest and our common units.
If the Partnership’s unitholders remove the general partner, we would lose our general partner interest and IDRs in the Partnership and the ability to manage the Partnership.
We currently manage our investment in the Partnership through our ownership interest in the general partner. The Partnership’s partnership agreement, however, gives unitholders of the Partnership the right to remove the general partner upon the affirmative vote of holders of 66⅔% of the Partnership’s outstanding units. If the general partner were removed as general partner of the Partnership, it would receive cash or common units in exchange for its 2% general partner interest and the IDRs and would also lose its ability to manage the Partnership. While the cash or common units the general partner would receive are intended under the terms of the Partnership’s partnership agreement to fully compensate us in the event such an exchange is required, the value of the investments we make with the cash or the common units may not over time be equivalent to the value of the general partner interest and the IDRs had the general partner retained them.
In addition, if the general partner is removed as general partner of the Partnership, we would face an increased risk of being deemed an investment company. Please read “—If in the future we cease to manage and control the Partnership, we may be deemed to be an investment company under the Investment Company Act of 1940.”
The Partnership, without our stockholders’ consent, may issue additional common units or other equity securities, which may increase the risk that the Partnership will not have sufficient available cash to maintain or increase its cash distribution level per common unit.
Because the Partnership distributes to its partners most of the cash generated by its operations, it relies primarily upon external financing sources, including debt and equity issuances, to fund its acquisitions and expansion capital expenditures. Accordingly, the Partnership has wide latitude to issue additional common units on the terms and conditions established by its general partner. We receive cash distributions from the Partnership on the general partner interest, IDRs and common units that we own. Because a significant portion of the cash we receive from the Partnership is attributable to our ownership of the IDRs, payment of distributions on additional Partnership common units may increase the risk that the Partnership will be unable to maintain or increase its quarterly cash distribution per unit, which in turn may reduce the amount of distributions we receive attributable to our common units, general partner interest and IDRs and the available cash that we have to pay as dividends to our stockholders.
The general partner, with our consent but without the consent of our stockholders, may limit or modify the incentive distributions we are entitled to receive, which may reduce cash dividends to you.
We own the general partner, which owns the IDRs in the Partnership that entitle us to receive increasing percentages, up to a maximum of 48% of any cash distributed by the Partnership as certain target distribution levels are reached in excess of $0.3881 per common unit in any quarter. A substantial portion of the cash flow we receive from the Partnership is provided by these IDRs. Because of the high percentage of the Partnership’s incremental cash flow that is distributed to the IDRs, certain potential acquisitions might not increase cash available for distribution per Partnership unit. In order to facilitate acquisitions by the Partnership or for other reasons, the board of directors of the general partner may elect to reduce the IDRs payable to us with our consent. These reductions may be permanent reductions in the IDRs or may be reductions with respect to cash flows from the potential acquisition. If distributions on the IDRs were reduced for the benefit of the Partnership units, the total amount of cash distributions we would receive from the Partnership, and therefore the amount of cash dividends we could pay to our stockholders, would be reduced.
In the future, we may not have sufficient cash to pay estimated dividends.
Because our only source of operating cash flow consists of cash distributions from the Partnership, the amount of dividends we are able to pay to our stockholders may fluctuate based on the level of distributions the Partnership makes to its partners, including us. The Partnership may not continue to make quarterly distributions at the 2013 fourth quarter distribution level of $0.7475
per common unit, or may not distribute any other amount, or increase its quarterly distributions in the future. In addition, while we would expect to increase or decrease dividends to our stockholders if the Partnership increases or decreases distributions to us, the timing and amount of such changes in distributions, if any, will not necessarily be comparable to the timing and amount of any changes in dividends made by us. Factors such as reserves established by our board of directors for our estimated general and administrative expenses as well as other operating expenses, reserves to satisfy our debt service requirements, if any, and reserves for future dividends by us may affect the dividends we make to our stockholders. The actual amount of cash that is available for dividends to our stockholders will depend on numerous factors, many of which are beyond our control.
Our cash dividend policy limits our ability to grow.
Because we plan on distributing a substantial amount of our cash flow, our growth may not be as fast as the growth of businesses that reinvest their available cash to expand ongoing operations. In fact, because currently our only cash-generating assets are common units and general partner interests in the Partnership, our growth will be substantially dependent upon the Partnership. If we issue additional shares of common stock or we incur debt, the payment of dividends on those additional shares or interest on that debt could increase the risk that we will be unable to maintain or increase our cash dividend levels.
Our rate of growth may be reduced to the extent we purchase additional units from the Partnership, which will reduce the relative percentage of the cash we receive from the IDRs.
Our business strategy includes, where appropriate, supporting the growth of the Partnership by purchasing the Partnership’s units or lending funds or providing other forms of financial support to the Partnership to provide funding for the acquisition of a business or asset or for a growth project. To the extent we purchase common units or securities not entitled to a current distribution from the Partnership, the rate of our distribution growth may be reduced, at least in the short term, as less of our cash distributions will come from our ownership of IDRs, whose distributions increase at a faster rate than those of our other ownership interests.
We have a credit facility that contains various restrictions on our ability to pay dividends to our stockholders, borrow additional funds or capitalize on business opportunities.
We have a credit facility that contains various operating and financial restrictions and covenants. Our ability to comply with these restrictions and covenants may be affected by events beyond our control, including prevailing economic, financial and industry conditions. If we are unable to comply with these restrictions and covenants, any future indebtedness under this credit facility may become immediately due and payable and our lenders’ commitments to make further loans to us may terminate. We might not have, or be able to obtain, sufficient funds to make these accelerated payments.
Our credit facility limits our ability to pay dividends to our stockholders during an event of default or if an event of default would result from such dividend. In addition, any future borrowings may:
|
·
|
adversely affect our ability to obtain additional financing for future operations or capital needs; |
|
·
|
limit our ability to pursue acquisitions and other business opportunities; |
|
·
|
make our results of operations more susceptible to adverse economic or operating conditions; or |
|
·
|
limit our ability to pay dividends. |
Our payment of any principal and interest will reduce our cash available for dividends to our stockholders. In addition, we are able to incur substantial additional indebtedness in the future. If we incur additional debt, the risks associated with our leverage would increase. For more information regarding our credit facility, please read “Management’s Discussion and Analysis of Financial Condition and Results of Operations—Liquidity and Capital Resources.”
If dividends on our shares of common stock are not paid with respect to any fiscal quarter, our stockholders will not be entitled to receive that quarter’s payments in the future.
Dividends to our stockholders are not cumulative. Consequently, if dividends on our shares of common stock are not paid with respect to any fiscal quarter, our stockholders will not be entitled to receive that quarter’s payments in the future.
The Partnership’s practice of distributing all of its available cash may limit its ability to grow, which could impact distributions to us and the available cash that we have to dividend to our stockholders.
Because currently our only cash-generating assets are common units and general partner interests in the Partnership, including the IDRs, our growth will be dependent upon the Partnership’s ability to increase its quarterly cash distributions. The Partnership has historically distributed to its partners most of the cash generated by its operations. As a result, it relies primarily upon external financing sources, including debt and equity issuances, to fund its acquisitions and expansion capital expenditures. Accordingly, to the extent the Partnership is unable to finance growth externally, its ability to grow will be impaired because it distributes substantially all of its available cash. Also, if the Partnership incurs additional indebtedness to finance its growth, the increased interest expense associated with such indebtedness may reduce the amount of available cash that the Partnership distributes to us, which in turn may reduce the amount of available cash that we can distribute to our stockholders. In addition, to the extent the Partnership issues additional common units in connection with any acquisitions or growth capital expenditures, the payment of distributions on those additional common units may increase the risk that the Partnership will be unable to maintain or increase its per unit distribution level, which in turn may impact the cash available for dividends to our stockholders.
Restrictions in the Partnership’s Senior Secured Revolving Credit Facility (the “TRP Revolver”) and indentures could limit its ability to make distributions to us.
The TRP Revolver and indentures contain covenants limiting its ability to incur indebtedness, grant liens, engage in transactions with affiliates and make distributions. The TRP Revolver also contains covenants requiring the Partnership to maintain certain financial ratios. The Partnership is prohibited from making any distribution to unitholders if such distribution would cause an event of default or otherwise violate a covenant under the TRP Revolver or the indentures, which in turn may impact the cash available for dividends to our stockholders.
If in the future we cease to manage and control the Partnership, we may be deemed to be an investment company under the Investment Company Act of 1940.
If we cease to manage and control the Partnership and are deemed to be an investment company under the Investment Company Act of 1940, we would either have to register as an investment company under the Investment Company Act of 1940, obtain exemptive relief from the SEC or modify our organizational structure or our contractual rights to fall outside the definition of an investment company. Registering as an investment company could, among other things, materially limit our ability to engage in transactions with affiliates, including the purchase and sale of certain securities or other property to or from our affiliates, restrict our ability to borrow funds or engage in other transactions involving leverage and require us to add additional directors who are independent of us and our affiliates, and adversely affect the price of our common stock.
If we lose any of our named executive officers, our business may be adversely affected.
Our success is dependent upon the efforts of the named executive officers. Our named executive officers are responsible for executing our and the Partnership’s business strategies and, when appropriate to our primary business objective, facilitating the Partnership’s growth through various forms of financial support provided by us, including, but not limited to, modifying the Partnership’s IDRs, exercising the Partnership’s IDR reset provision contained in its partnership agreement, making loans, making capital contributions in exchange for yielding or non-yielding equity interests or providing other financial support to the Partnership. There is substantial competition for qualified personnel in the midstream natural gas industry. We may not be able to retain our existing named executive officers or fill new positions or vacancies created by expansion or turnover. We have not entered into employment agreements with any of our named executive officers. In addition, we do not maintain “key man” life insurance on the lives of any of our named executive officers. A loss of one or more of our named executive officers could harm our and the Partnership’s business and prevent us from implementing our and the Partnership’s business strategies.
If we fail to maintain an effective system of internal controls, we may not be able to accurately report our financial results or prevent fraud. In addition, potential changes in accounting standards might cause us to revise our financial results and disclosure in the future.
Effective internal controls are necessary for us to provide timely and reliable financial reports and effectively prevent fraud. If we cannot provide timely and reliable financial reports or prevent fraud, our reputation and operating results would be harmed. We continue to enhance our internal controls and financial reporting capabilities. These enhancements require a significant commitment of resources, personnel and the development and maintenance of formalized internal reporting procedures to ensure the reliability of our financial reporting. Our efforts to update and maintain our internal controls may not be successful, and we may be unable to maintain adequate controls over our financial processes and reporting in the future, including future compliance with the obligations under Section 404 of the Sarbanes-Oxley Act of 2002. Any failure to maintain effective controls or difficulties encountered in the effective improvement of our internal controls could prevent us from timely and reliably reporting our financial results and may harm our operating results. Ineffective internal controls could also cause investors to lose confidence in our reported financial information. In addition, the Financial Accounting Standards Board or the SEC could enact new accounting standards that might impact how we or the Partnership are required to record revenues, expenses, assets and liabilities. Any significant change in accounting standards or disclosure requirements could have a material effect on our business, results of operations, financial condition and ability to comply with our and the Partnership’s debt obligations.
An increase in interest rates may cause the market price of our common stock to decline.
Like all equity investments, an investment in our common stock is subject to certain risks. In exchange for accepting these risks, investors may expect to receive a higher rate of return than would otherwise be obtainable from lower-risk investments. Accordingly, as interest rates rise, the ability of investors to obtain higher risk-adjusted rates of return by purchasing government-backed debt securities may cause a corresponding decline in demand for riskier investments generally, including yield-based equity investments. Reduced demand for our common stock resulting from investors seeking other more favorable investment opportunities may cause the trading price of our common stock to decline.
Future sales of our common stock in the public market could lower our stock price, and any additional capital raised by us through the sale of equity or convertible securities may dilute your ownership in us.
We or our stockholders may sell shares of common stock in subsequent public offerings. We may also issue additional shares of common stock or convertible securities. As of December 31, 2013, we have 42,162,178 outstanding shares of common stock. Certain of our existing stockholders, including our executive officers, and certain of our directors are party to a registration rights agreement with us which requires us to affect the registration of their shares in certain circumstances no earlier than the expiration of the lock-up period contained in the underwriting agreement of our initial public offering.
We cannot predict the size of future issuances of our common stock or the effect, if any, that future issuances and sales of shares of our common stock will have on the market price of our common stock. Sales of substantial amounts of our common stock (including shares issued in connection with an acquisition), or the perception that such sales could occur, may adversely affect prevailing market prices of our common stock.
Our amended and restated certificate of incorporation and amended and restated bylaws, as well as Delaware law, contain provisions that could discourage acquisition bids or merger proposals, which may adversely affect the market price of our common stock.
Our amended and restated certificate of incorporation authorizes our board of directors to issue preferred stock without stockholder approval. If our board of directors elects to issue preferred stock, it could be more difficult for a third-party to acquire us. In addition, some provisions of our amended and restated certificate of incorporation and amended and restated bylaws could make it more difficult for a third-party to acquire control of us, even if the change of control would be beneficial to our stockholders, including provisions which require:
|
·
|
a classified board of directors, so that only approximately one-third of our directors are elected each year; |
|
·
|
limitations on the removal of directors; and |
|
·
|
limitations on the ability of our stockholders to call special meetings and establish advance notice provisions for stockholder proposals and nominations for elections to the board of directors to be acted upon at meetings of stockholders. |
Delaware law prohibits us from engaging in any business combination with any “interested stockholder,” meaning generally that a stockholder who beneficially owns more than 15% of our stock cannot acquire us for a period of three years from the date this person became an interested stockholder, unless various conditions are met, such as approval of the transaction by our board of directors. Please read “Description of Our Capital Stock—Anti-Takeover Effects of Provisions of Our Amended and Restated Certificate of Incorporation, Our Amended and Restated Bylaws and Delaware Law.”
The duties of our officers and directors may conflict with those owed to the Partnership and these officers and directors may face conflicts of interest in the allocation of administrative time among our business and the Partnership’s business.
Substantially all of our officers and certain members of our board of directors are officers and/or directors of the general partner and, as a result, have separate duties that govern their management of the Partnership’s business. These officers and directors may encounter situations in which their obligations to us, on the one hand, and the Partnership, on the other hand, are in conflict. The resolution of these conflicts may not always be in our best interest or that of our stockholders.
In addition, our officers who also serve as officers of the general partner may face conflicts in allocating their time spent on our behalf and on behalf of the Partnership. These time allocations may adversely affect our or the Partnership’s results of operations, cash flows and financial condition. For a discussion of our officers and directors that will serve in the same capacity for the general partner and the amount of time we expect them to devote to our business, please read “Management.”
Risks Inherent in the Partnership’s Business
Because we are directly dependent on the distributions we receive from the Partnership, risks to the Partnership’s operations are also risks to us. We have set forth below risks to the Partnership’s business and operations, the occurrence of which could negatively impact the Partnership’s financial performance and decrease the amount of cash it is able to distribute to us.
The Partnership has a substantial amount of indebtedness which may adversely affect its financial position.
The Partnership has a substantial amount of indebtedness. As of December 31, 2013 the Partnership had $395.0 million of borrowings outstanding, $86.8 million of letters of credit outstanding and $718.2 million of additional borrowing capacity under the TRP Revolver. In addition, the Partnership had $2,258.6 million outstanding under its senior unsecured notes, excluding $28.0 million in unamortized discounts. The Partnership also had $279.7 million of borrowings outstanding under its accounts receivable securitization facility (the “Securitization Facility”). The $1.2 billion TRP Revolver allows it to request increases in commitments up to an additional $300 million. For the years ended December 31, 2013, 2012 and 2011, the Partnership’s consolidated interest expense was $131.0 million, $116.8 million and $107.7 million, respectively.
This substantial level of indebtedness increases the possibility that the Partnership may be unable to generate cash sufficient to pay, when due, the principal of, interest on or other amounts due in respect of indebtedness. This substantial indebtedness, combined with lease and other financial obligations and contractual commitments, could have other important consequences to the Partnership, including the following:
|
·
|
its ability to obtain additional financing, if necessary, for working capital, capital expenditures, acquisitions or other purposes may be impaired or such financing may not be available on favorable terms; |
|
·
|
satisfying its obligations with respect to indebtedness may be more difficult and any failure to comply with the obligations of any debt instruments could result in an event of default under the agreements governing such indebtedness; |
|
·
|
the Partnership will need a portion of cash flow to make interest payments on debt, reducing the funds that would otherwise be available for operations and future business opportunities; |
|
·
|
the Partnership’s debt level will make it more vulnerable to competitive pressures or a downturn in its business or the economy generally; and |
|
·
|
the Partnership’s debt level may limit flexibility in planning for, or responding to, changing business and economic conditions. |
The Partnership’s ability to service its debt will depend upon, among other things, its future financial and operating performance, which will be affected by prevailing economic conditions and financial, business, regulatory and other factors, some of which are beyond its control. If the Partnership’s operating results are not sufficient to service its current or future indebtedness, it will be forced to take actions such as reducing or delaying business activities, acquisitions, investments or capital expenditures, selling assets, restructuring or refinancing debt, or seeking additional equity capital, and its ability to make cash distributions may be adversely affected. The Partnership may not be able to affect any of these actions on satisfactory terms, or at all.
Increases in interest rates could adversely affect the Partnership’s business.
The Partnership has significant exposure to increases in interest rates. As of December 31, 2013, its total indebtedness was $2,933.3 million, excluding $28.0 million in unamortized discounts, of which $2,258.6 million was at fixed interest rates and $674.7 million was at variable interest rates. A one percentage point increase in the interest rate on the Partnership’s variable interest rate debt would have increased its consolidated annual interest expense by approximately $6.7 million. As a result of this significant amount of variable interest rate debt, the Partnership’s financial condition could be adversely affected by increases in interest rates.
Despite current indebtedness levels, the Partnership may still be able to incur substantially more debt. This could increase the risks associated with the Partnership’s substantial leverage.
The Partnership may be able to incur substantial additional indebtedness in the future. As of December 31, 2013, the Partnership had $395.0 million of borrowings outstanding, $86.8 million of letters of credit outstanding and $718.2 million of additional borrowing capacity available under the TRP Revolver. In addition, the Partnership had $279.7 million of borrowings outstanding under its Securitization Facility. The Partnership may be able to incur an additional $300 million of debt under the TRP Revolver if the Partnership requests and is able to obtain commitments from lenders for such additional amounts. Although the TRP Revolver contains restrictions on the incurrence of additional indebtedness, these restrictions are subject to a number of significant qualifications and exceptions, and any indebtedness incurred in compliance with these restrictions could be substantial. If the Partnership incurs additional debt, the risks associated with its substantial leverage would increase.
The terms of the TRP Revolver and indentures may restrict its current and future operations, particularly its ability to respond to changes in business or to take certain actions.
The credit agreement governing the TRP Revolver, the agreements governing the Securitization Facility and the indentures governing its senior notes contain, and any future indebtedness the Partnership incurs will likely contain, a number of restrictive covenants that impose significant operating and financial restrictions, including restrictions on its ability to engage in acts that may be in its best long-term interests. These agreements include covenants that, among other things, restrict the Partnership’s ability to:
|
·
|
incur or guarantee additional indebtedness or issue preferred stock; |
|
·
|
pay distributions on its equity securities or redeem, repurchase or retire its equity securities or subordinated indebtedness; |
|
·
|
make investments and certain acquisitions; |
|
·
|
create restrictions on the payment of distributions to its equity holders; |
|
·
|
sell or transfer assets, including equity securities of its subsidiaries; |
|
·
|
engage in affiliate transactions, |
|
·
|
consolidate or merge; |
|
·
|
incur liens; |
|
·
|
prepay, redeem and repurchase certain debt, other than loans under the TRP Revolver; |
|
·
|
enter into sale and lease-back transactions or take-or-pay obligations; and |
|
·
|
change business activities conducted by it. |
In addition, the TRP Revolver requires the Partnership to satisfy and maintain specified financial ratios and other financial condition tests. The Partnership’s ability to meet those financial ratios and tests can be affected by events beyond its control, and we cannot assure you that the Partnership will meet those ratios and tests.
A breach of any of these covenants could result in an event of default under the TRP Revolver, the indentures, or the Securitization Facility, as applicable. Upon the occurrence of such an event of default, all amounts outstanding under the applicable debt agreements could be declared to be immediately due and payable and all applicable commitments to extend further credit could be terminated. If the Partnership is unable to repay the accelerated debt under the TRP Revolver, the lenders under the TRP Revolver could proceed against the collateral granted to them to secure that indebtedness. If the Partnership is unable to repay the accelerated debt under the Securitization Facility, the lenders under the Securitization Facility could proceed against the collateral granted to them to secure the indebtedness. The Partnership has pledged substantially all of its assets as collateral under the TRP Revolver and the accounts receivables of Targa Receivables LLC under the Securitization Facility. If the indebtedness under the TRP Revolver, the indentures, or the Securitization Facility is accelerated, we cannot assure you that the Partnership will have sufficient assets to repay the indebtedness. The operating and financial restrictions and covenants in these debt agreements and any future financing agreements may adversely affect the Partnership’s ability to finance future operations or capital needs or to engage in other business activities.
The Partnership’s cash flow is affected by supply and demand for natural gas and NGL products and by natural gas, NGL, crude oil and condensate prices, and decreases in these prices could adversely affect its results of operations and financial condition.
The Partnership’s operations can be affected by the level of natural gas and NGL prices and the relationship between these prices. The prices of oil, natural gas and NGLs have been volatile and we expect this volatility to continue. The Partnership’s future cash flow may be materially adversely affected if it experiences significant, prolonged price deterioration. The markets and prices for natural gas and NGLs depend upon factors beyond the Partnership’s control. These factors include demand for these commodities, which fluctuates with changes in market and economic conditions, and other factors, including:
|
·
|
the impact of seasonality and weather; |
|
·
|
general economic conditions and economic conditions impacting the Partnership’s primary markets; |
|
·
|
the economic conditions of the Partnership’s customers; |
|
·
|
the level of domestic crude oil and natural gas production and consumption; |
|
·
|
the availability of imported natural gas, liquefied natural gas, NGLs and crude oil; |
|
·
|
actions taken by foreign oil and gas producing nations; |
|
·
|
the availability of local, intrastate and interstate transportation systems and storage for residue natural gas and NGLs; |
|
·
|
the availability and marketing of competitive fuels and/or feedstocks; |
|
·
|
the impact of energy conservation efforts; and |
|
·
|
the extent of governmental regulation and taxation. |
The Partnership’s primary natural gas gathering and processing arrangements that expose it to commodity price risk are its percent-of-proceeds arrangements. For the years ended December 31, 2013 and 2012, the Partnership’s percent-of-proceeds arrangements accounted for approximately 48% and 43%, respectively, of its gathered natural gas volume. Under these arrangements, the Partnership generally processes natural gas from producers and remits to the producers an agreed percentage of the proceeds from the sale of residue gas and NGL products at market prices or a percentage of residue gas and NGL products at the tailgate of the Partnership’s processing facilities. In some percent-of-proceeds arrangements, the Partnership remits to the producer a percentage of an index-based price for residue gas and NGL products, less agreed adjustments, rather than remitting a portion of the actual sales proceeds. Under these types of arrangements, the Partnership’s revenues and cash flows increase or decrease, whichever is applicable, as the prices of natural gas, NGLs and crude oil fluctuates. Please see “Management’s Discussion and Analysis of Financial Condition and Results of Operations—Quantitative and Qualitative Disclosures about Market Risk.”
Because of the natural decline in production in the Partnership’s operating regions and in other regions from which it sources NGL supplies, its long-term success depends on its ability to obtain new sources of supplies of natural gas, NGLs and crude oil which depends on certain factors beyond its control. Any decrease in supplies of natural gas, NGLs or crude oil could adversely affect the Partnership’s business and operating results.
The Partnership’s gathering systems are connected to oil and natural gas wells from which production will naturally decline over time, which means that the cash flows associated with these sources of natural gas and crude oil will likely also decline over time. The Partnership’s logistics assets are similarly impacted by declines in NGL supplies in the regions in which it operates as well as other regions from which it sources NGLs. To maintain or increase throughput levels on the Partnership’s gathering systems and the utilization rate at its processing plants and it’s treating and fractionation facilities, the Partnership must continually obtain new natural gas, NGL and crude oil supplies. A material decrease in natural gas production from producing areas on which the Partnership relies, as a result of depressed commodity prices or otherwise, could result in a decline in the volume of natural gas or crude oil that it processes, NGL products delivered to its fractionation facilities or crude oil that the Partnership gathers. The Partnership’s ability to obtain additional sources of natural gas, NGLs and crude oil depends, in part, on the level of successful drilling and production activity near its gathering systems and, in part, on the level of successful drilling and production in other areas from which it sources NGL and crude oil supplies. The Partnership has no control over the level of such activity in the areas of its operations, the amount of reserves associated with the wells or the rate at which production from a well will decline. In addition, the Partnership has no control over producers or their drilling or production decisions, which are affected by, among other things, prevailing and projected energy prices, demand for hydrocarbons, the level of reserves, geological considerations, governmental regulations, the availability of drilling rigs, other production and development costs and the availability and cost of capital.
Fluctuations in energy prices can greatly affect production rates and investments by third parties in the development of new oil and natural gas reserves. Drilling and production activity generally decreases as oil and natural gas prices decrease. Prices of oil and natural gas have been historically volatile, and we expect this volatility to continue. Consequently, even if new natural gas or crude oil reserves are discovered in areas served by the Partnership’s assets, producers may choose not to develop those reserves.
For example, current low prices for natural gas combined with relatively high levels of natural gas in storage could result in curtailment or shut-in of natural gas production.
Reductions in exploration and production activity, competitor actions or shut-ins by producers in the areas in which the Partnership operates may prevent it from obtaining supplies of natural gas or crude oil to replace the natural decline in volumes from existing wells, which could result in reduced volumes through its facilities and reduced utilization of its gathering, treating, processing and fractionation assets.
If the Partnership does not make acquisitions or develop growth projects for expanding existing assets or constructing new midstream assets on economically acceptable terms or fails to efficiently and effectively integrate acquired or developed assets with its asset base, its future growth will be limited.
In addition, any acquisitions the Partnership completes are subject to substantial risks that could adversely affect its financial condition and results of operations and reduce its ability to make distributions to unitholders.
The Partnership’s ability to grow depends, in part, on its ability to make acquisitions or develop growth projects that result in an increase in cash generated from operations per unit. The Partnership is unable to acquire businesses from us in order to grow because our only assets are the interests in the Partnership that we own. As a result, the Partnership will need to focus on third-party acquisitions and organic growth. If the Partnership is unable to make accretive acquisitions or develop accretive growth projects because it is (1) unable to identify attractive acquisition candidates and negotiate acceptable acquisition agreements or develop growth projects economically, (2) unable to obtain financing for these acquisitions or projects on economically acceptable terms, or (3) unable to compete successfully for acquisitions or growth projects, then the Partnership’s future growth and ability to increase distributions will be limited.
Any acquisition or growth project involves potential risks, including, among other things:
|
·
|
operating a significantly larger combined organization and adding new or expanded operations; |
|
·
|
difficulties in the assimilation of the assets and operations of the acquired businesses or growth projects, especially if the assets acquired are in a new business segment and/or geographic area; |
|
·
|
the risk that crude oil and natural gas reserves expected to support the acquired assets may not be of the anticipated magnitude or may not be developed as anticipated; |
|
·
|
the failure to realize expected volumes, revenues, profitability or growth; |
|
·
|
the failure to realize any expected synergies and cost savings; |
|
·
|
coordinating geographically disparate organizations, systems and facilities; |
|
·
|
the assumption of environmental and other unknown liabilities; |
|
·
|
limitations on rights to indemnity from the seller in an acquisition or the contractors and suppliers in growth projects; |
|
·
|
failure to attain or maintain compliance with environmental and other governmental regulations; |
|
·
|
inaccurate assumptions about the overall costs of equity or debt; |
|
·
|
the diversion of management’s and employees’ attention from other business concerns; and |
|
·
|
customer or key employee losses at the acquired businesses or to a competitor. |
If these risks materialize, any acquired assets or growth project may inhibit the Partnership’s growth, fail to deliver expected benefits and/or add further unexpected costs. Challenges may arise whenever businesses with different operations or management are combined, and the Partnership may experience unanticipated delays in realizing the benefits of an acquisition or growth project. If the Partnership consummates any future acquisition or growth project, its capitalization and results of operations may change significantly and you may not have the opportunity to evaluate the economic, financial and other relevant information that the Partnership will consider in evaluating future acquisitions or growth projects.
The Partnership’s acquisition and growth strategy is based, in part, on its expectation of ongoing divestitures of energy assets by industry participants and new opportunities created by industry expansion. A material decrease in such divestitures or in opportunities for economic commercial expansion would limit the Partnership’s opportunities for future acquisitions or growth projects and could adversely affect its operations and cash flows available for distribution to its unitholders.
Acquisitions may significantly increase the Partnership’s size and diversify the geographic areas in which it operates and growth projects may increase its concentration in a line of business or geographic region. The Partnership may not achieve the desired effect from any future acquisitions or growth projects.
The Partnership’s expansion or modification of existing assets or the construction of new assets may not result in revenue increases and is subject to regulatory, environmental, political, legal and economic risks, which could adversely affect its results of operations and financial condition.
The construction of additions or modifications to the Partnership’s existing systems and the construction of new midstream assets involve numerous regulatory, environmental, political and legal uncertainties beyond its control and may require the expenditure of significant amounts of capital. If the Partnership undertakes these projects, they may not be completed on schedule or at the budgeted cost or at all. Moreover, the Partnership’s revenues may not increase immediately upon the expenditure of funds on a particular project. For instance, if the Partnership builds a new fractionation facility or gas processing plant, the construction may occur over an extended period of time and the Partnership will not receive any material increases in revenues until the project is completed. Moreover, the Partnership may construct facilities to capture anticipated future growth in production in a region in which such growth does not materialize. Since the Partnership is not engaged in the exploration for and development of natural gas and oil reserves, it does not possess reserve expertise and it often does not have access to third-party estimates of potential reserves in an area prior to constructing facilities in such area. To the extent the Partnership relies on estimates of future production in any decision to construct additions to its systems, such estimates may prove to be inaccurate because there are numerous uncertainties inherent in estimating quantities of future production. As a result, new facilities may not be able to attract enough throughput to achieve the Partnership’s expected investment return, which could adversely affect its results of operations and financial condition. In addition, the construction of additions to the Partnership’s existing gathering and transportation assets may require it to obtain new rights-of-way prior to constructing new pipelines. The Partnership may be unable to obtain such rights-of-way to connect new natural gas supplies to its existing gathering lines or capitalize on other attractive expansion opportunities. Additionally, it may become more expensive for the Partnership to obtain new rights-of-way or to renew existing rights-of-way. If the cost of renewing or obtaining new rights-of-way increases, the Partnership’s cash flows could be adversely affected.
The Partnership’s acquisition and growth strategy requires access to new capital. Tightened capital markets or increased competition for investment opportunities could impair the Partnership’s ability to grow through acquisitions or growth projects.
The Partnership continuously considers and enters into discussions regarding potential acquisitions and growth projects. Any limitations on the Partnership’s access to capital will impair its ability to execute this strategy. If the cost of such capital becomes too expensive, the Partnership’s ability to develop or acquire strategic and accretive assets will be limited. The Partnership may not be able to raise the necessary funds on satisfactory terms, if at all. The primary factors that influence the Partnership’s initial cost of equity include market conditions, fees it pays to underwriters and other offering costs, which include amounts it pays for legal and accounting services. The primary factors influencing the Partnership’s cost of borrowing include interest rates, credit spreads, covenants, underwriting or loan origination fees and similar charges it pays to lenders. These factors may impair the Partnership’s ability to execute its acquisition and growth strategy.
In addition, the Partnership is experiencing increased competition for the types of assets it contemplates purchasing or developing. Current economic conditions and competition for asset purchases and development opportunities could limit its ability to fully execute its acquisition and growth strategy.
Demand for propane is significantly impacted by weather conditions and therefore seasonal, and requires increases in inventory to meet seasonal demand.
Weather conditions have a significant impact on the demand for propane because end-users principally utilize propane for heating purposes. Warmer-than-normal temperatures in one or more regions in which the Partnership operates can significantly decrease the total volume of propane it sells. Lack of consumer demand for propane may also adversely affect the retailers with which the Partnership transacts its wholesale propane marketing operations, exposing the Partnership to retailers’ inability to satisfy their contractual obligations to the Partnership.
If the Partnership fails to balance its purchases of natural gas and its sales of residue gas and NGLs, its exposure to commodity price risk will increase.
The Partnership may not be successful in balancing its purchases of natural gas and its sales of residue gas and NGLs. In addition, a producer could fail to deliver promised volumes to the Partnership or deliver in excess of contracted volumes, or a purchaser could purchase less than contracted volumes. Any of these actions could cause an imbalance between the Partnership’s purchases and sales. If the Partnership’s purchases and sales are not balanced, it will face increased exposure to commodity price risks and could have increased volatility in its operating income.
The Partnership’s hedging activities may not be effective in reducing the variability of its cash flows and may, in certain circumstances, increase the variability of its cash flows. Moreover, the Partnership’s hedges may not fully protect it against volatility in basis differentials. Finally, the percentage of the Partnership’s expected equity commodity volumes that are hedged decreases substantially over time.
The Partnership has entered into derivative transactions related to only a portion of its equity volumes. As a result, it will continue to have direct commodity price risk to the unhedged portion. The Partnership’s actual future volumes may be significantly higher or lower than it estimated at the time it entered into the derivative transactions for that period. If the actual amount is higher than the Partnership estimated, it will have greater commodity price risk than it intended. If the actual amount is lower than the amount that is subject to its derivative financial instruments, the Partnership might be forced to satisfy all or a portion of its derivative transactions without the benefit of the cash flow from its sale of the underlying physical commodity. The percentages of the Partnership’s expected equity volumes that are covered by its hedges decrease over time. To the extent the Partnership hedges its commodity price risk, it may forego the benefits it would otherwise experience if commodity prices were to change in its favor. The derivative instruments the Partnership utilizes for these hedges are based on posted market prices, which may be higher or lower than the actual natural gas, NGL and condensate prices that it realizes in its operations. These pricing differentials may be substantial and could materially impact the prices the Partnership ultimately realizes. In addition, market and economic conditions may adversely affect the Partnership’s hedge counterparties’ ability to meet their obligations. Given volatility in the financial and commodity markets, the Partnership may experience defaults by its hedge counterparties in the future. As a result of these and other factors, the Partnership’s hedging activities may not be as effective as it intended in reducing the variability of its cash flows, and in certain circumstances may actually increase the variability of its cash flows. Please see “Management’s Discussion and Analysis of Financial Condition and Results of Operations—Quantitative and Qualitative Disclosures about Market Risk.”
If third-party pipelines and other facilities interconnected to the Partnership’s natural gas and crude oil gathering systems, terminals and processing facilities become partially or fully unavailable to transport natural gas and NGLs, its revenues could be adversely affected.
The Partnership depends upon third-party pipelines, storage and other facilities that provide delivery options to and from its gathering and processing facilities. Since the Partnership does not own or operate these pipelines or other facilities, their continuing operation in their current manner is not within its control. If any of these third-party facilities become partially or fully unavailable, or if the quality specifications for their facilities change so as to restrict the Partnership’s ability to utilize them, its revenues could be adversely affected.
The Partnership’s industry is highly competitive, and increased competitive pressure could adversely affect its business and operating results.
The Partnership competes with similar enterprises in its respective areas of operation. Some of the Partnership’s competitors are large oil, natural gas and NGL companies that have greater financial resources and access to supplies of natural gas and NGLs than it does. Some of these competitors may expand or construct gathering, processing, storage, terminaling and transportation systems that would create additional competition for the services the Partnership provides to its customers. In addition, customers who are significant producers of natural gas may develop their own gathering, processing, storage, terminaling and transportation systems in lieu of using those operated by the Partnership. The Partnership’s ability to renew or replace existing contracts with its customers at rates sufficient to maintain current revenues and cash flows could be adversely affected by the activities of its competitors and its customers. All of these competitive pressures could have a material adverse effect on the Partnership’s business, results of operations and financial condition.
The Partnership typically does not obtain independent evaluations of natural gas or crude oil reserves dedicated to its gathering pipeline systems; therefore, supply volumes on its systems in the future could be less than it anticipates.
The Partnership typically does not obtain independent evaluations of natural gas or crude oil reserves connected to its gathering systems due to the unwillingness of producers to provide reserve information as well as the cost of such evaluations. Accordingly, the Partnership does not have independent estimates of total reserves dedicated to its gathering systems or the anticipated life of such reserves. If the total reserves or estimated life of the reserves connected to the Partnership’s gathering systems is less than it anticipates and it is unable to secure additional sources of supply, then the volumes of natural gas transported on its gathering systems in the future could be less than it anticipates. A decline in the volumes on the Partnership’s systems could have a material adverse effect on its business, results of operations and financial condition.
A reduction in demand for NGL products by the petrochemical, refining or other industries or by the fuel markets, or a significant increase in NGL product supply relative to this demand, could materially adversely affect the Partnership’s business, results of operations and financial condition.
The NGL products the Partnership produces have a variety of applications, including as heating fuels, petrochemical feedstocks and refining blend stocks. A reduction in demand for NGL products, whether because of general or industry-specific economic conditions, new government regulations, global competition, reduced demand by consumers for products made with NGL products (for example, reduced petrochemical demand observed due to lower activity in the automobile and construction industries), reduced demand for propane or butane exports whether for price or other reasons, increased competition from petroleum-based feedstocks due to pricing differences, mild winter weather for some NGL applications or other reasons, could result in a decline in the volume of NGL products the Partnership handles or reduce the fees it charges for its services. Also, increased supply of NGL products could reduce the value of NGLs handled by the Partnership and reduce the margins realized. The Partnership’s NGL products and their demand are affected as follows:
Ethane.
Ethane is typically supplied as purity ethane and as part of an ethane-propane mix. Ethane is primarily used in the petrochemical industry as feedstock for ethylene, one of the basic building blocks for a wide range of plastics and other chemical products. Although ethane is typically extracted as part of the mixed NGL stream at gas processing plants, if natural gas prices increase significantly in relation to NGL product prices or if the demand for ethylene falls, it may be more profitable for natural gas processors to leave the ethane in the natural gas stream, thereby reducing the volume of NGLs delivered for fractionation and marketing.
Propane.
Propane is used as a petrochemical feedstock in the production of ethylene and propylene, as a heating, engine and industrial fuel, and in agricultural applications such as crop drying. Changes in demand for ethylene and propylene could adversely affect demand for propane. The demand for propane as a heating fuel is significantly affected by weather conditions. The volume of propane sold is at its highest during the six-month peak heating season of October through March. Demand for the Partnership’s propane may be reduced during periods of warmer-than-normal weather.
Normal Butane.
Normal butane is used in the production of isobutane, as a refined petroleum product blending component, as a fuel gas (either alone or in a mixture with propane) and in the production of ethylene and propylene. Changes in the composition of refined petroleum products resulting from governmental regulation, changes in feedstocks, products and economics, and demand for heating fuel, ethylene and propylene could adversely affect demand for normal butane.
Isobutane.
Isobutane is predominantly used in refineries to produce alkylates to enhance octane levels. Accordingly, any action that reduces demand for motor gasoline or demand for isobutane to produce alkylates for octane enhancement might reduce demand for isobutane.
Natural Gasoline.
Natural gasoline is used as a blending component for certain refined petroleum products and as a feedstock used in the production of ethylene and propylene. Changes in the mandated composition of motor gasoline resulting from governmental regulation, and in demand for ethylene and propylene, could adversely affect demand for natural gasoline.
NGLs and products produced from NGLs also compete with products from global markets. Any reduced demand or increased supply for ethane, propane, normal butane, isobutane or natural gasoline in the markets the Partnership accesses for any of the reasons stated above could adversely affect both demand for the services it provides and NGL prices, which could negatively impact its results of operations and financial condition.
The Partnership has significant relationships with CPC as a customer for its marketing and refinery services. In some cases, these agreements are subject to renegotiation and termination rights.
For the years ended December 31, 2013 and 2012, approximately 8% and 10%, respectively, of the Partnership’s consolidated revenues were derived from transactions with CPC. Under many of the Partnership’s CPC contracts where it purchases or markets NGLs on CPC’s behalf, CPC may elect to terminate the contracts or renegotiate the price terms. To the extent CPC reduces the volumes of NGLs that it purchases from the Partnership or reduces the volumes of NGLs that the Partnership markets on its behalf or to the extent the economic terms of such contracts are changed, the Partnership’s revenues and its cash flow from operating activities could decline.
The tax treatment of the Partnership depends on its status as a partnership for U.S. federal income tax purposes as well as its not being subject to a material amount of entity-level taxation by individual states. If the Internal Revenue Service (“IRS”) were to treat the Partnership as a corporation for federal income tax purposes or the Partnership becomes subject to a material amount of entity-level taxation for state tax purposes, then its cash available for distribution to its unitholders, including us, would be substantially reduced.
We currently own an approximate 11.5% limited partner interest, a 2% general partner interest and the IDRs in the Partnership. The anticipated after-tax economic benefit of our investment in the Partnership depends largely on its being treated as a partnership for federal income tax purposes.
A publicly traded partnership such as the Partnership may be treated as a corporation for federal income tax purposes unless it satisfies a “qualifying income” requirement. Based on the Partnership’s current operations we believe that the Partnership satisfies the qualifying income requirement and will be treated as a partnership. Failing to meet the qualifying income requirement or a change in current law could cause the Partnership to be treated as a corporation for federal income tax purposes or otherwise subject the Partnership to taxation as an entity.
The Partnership has not requested and does not plan to request a ruling from the IRS with respect to its treatment as a partnership for federal income tax purposes.
If the Partnership were treated as a corporation for federal income tax purposes, it would pay federal income tax on its taxable income at the corporate tax rate, which is currently a maximum of 35%, and would likely pay state income tax at varying rates. Distributions to the Partnership’s unitholders, including us, would generally be taxed again as corporate distributions and no income, gains, losses or deductions would flow through to the Partnership’s unitholders, including us. If such tax was imposed upon the Partnership as a corporation, its cash available for distribution would be substantially reduced. Therefore, treatment of the Partnership as a corporation would result in a material reduction in the anticipated cash flow and after-tax return to the Partnership’s unitholders, including us, and would likely cause a substantial reduction in the value of our investment in the Partnership.
At the state level, because of widespread state budget deficits and other reasons, several states are evaluating ways to subject partnerships to entity-level taxation through the imposition of state income and franchise taxes and other forms of taxation. For example, the Partnership is required to pay Texas franchise tax at a maximum effective rate of 0.7% of its gross income apportioned to Texas in the prior year. Imposition of any similar tax on the Partnership by additional states would reduce the cash available for distribution to Partnership unitholders, including us.
Current law may change so as to cause the Partnership to be treated as a corporation for federal income tax purposes or otherwise subject the Partnership to entity-level taxation for state or local income tax purposes. The present U.S. federal income tax treatment of publicly traded partnerships, including the Partnership, or an investment in the Partnership’s common units may be modified by administrative, legislative or judicial changes or differing interpretations at any time. For example, from time to time, members of Congress propose and consider substantive changes to the existing federal income tax laws that affect publicly traded partnerships. One such legislative proposal would eliminate the qualifying income exception to the treatment of all publicly traded partnerships as corporations upon which the Partnership relies for its treatment as a partnership for U.S. federal income tax purposes. We are unable to predict whether any of these changes or other proposals will be reintroduced or will ultimately be enacted. Any such changes could negatively impact the value of our investment in the Partnership’s common units.
The Partnership’s partnership agreement provides that if a law is enacted or existing law is modified or interpreted in a manner that subjects it to taxation as a corporation or otherwise subjects it to entity-level taxation for federal, state or local income tax purposes, the minimum quarterly distribution amount and the target distribution amounts may be adjusted to reflect the impact of that law on the Partnership.
The Partnership does not own most of the land on which its pipelines, terminals and compression facilities are located, which could disrupt its operations.
The Partnership does not own most of the land on which its pipelines, terminals and compression facilities are located, and the Partnership is therefore subject to the possibility of more onerous terms and/or increased costs to retain necessary land use if it does not have valid rights-of-way or leases or if such rights-of-way or leases lapse or terminate. The Partnership sometimes obtains the rights to land owned by third parties and governmental agencies for a specific period of time. The Partnership’s loss of these rights, through its inability to renew right-of-way contracts or leases, or otherwise, could cause it to cease operations on the affected land, increase costs related to continuing operations elsewhere and reduce its revenue.
The Partnership may be unable to cause its majority-owned joint ventures to take or not to take certain actions unless some or all of its joint venture participants agree.
The Partnership participates in several majority-owned joint ventures whose corporate governance structures require at least a majority in interest vote to authorize many basic activities and require a greater voting interest (sometimes up to 100%) to authorize more significant activities. Examples of these more significant activities include, among others, large expenditures or contractual commitments, the construction or acquisition of assets, borrowing money or otherwise raising capital, making distributions, transactions with affiliates of a joint venture participant, litigation and transactions not in the ordinary course of business. Without the concurrence of joint venture participants with enough voting interests, the Partnership may be unable to cause any of its joint ventures to take or not take certain actions, even though taking or preventing those actions may be in the best interests of the Partnership or the particular joint venture.
In addition, subject to certain conditions, any joint venture owner may sell, transfer or otherwise modify its ownership interest in a joint venture, whether in a transaction involving third parties or the other joint owners. Any such transaction could result in the Partnership partnering with different or additional parties.
Weather may limit the Partnership’s ability to operate its business and could adversely affect its operating results.
The weather in the areas in which the Partnership operates can cause disruptions and in some cases suspension of its operations. For example, unseasonably wet weather, extended periods of below freezing weather, or hurricanes may cause disruptions or suspensions of the Partnership’s operations, which could adversely affect its operating results. Potential climate changes may have significant physical effects, such as increased frequency and severity of storms, floods and other climatic events and could have an adverse effect on the Partnership’s operations.
The Partnership’s business involves many hazards and operational risks, some of which may not be insured or fully covered by insurance. If a significant accident or event occurs for which it is not fully insured, if the Partnership fails to recover all anticipated insurance proceeds for significant accidents or events for which it is insured, or if the Partnership fails to rebuild facilities damaged by such accidents or events, its operations and financial results could be adversely affected.
The Partnership’s operations are subject to many hazards inherent in gathering, compressing, treating, processing and selling natural gas; storing, fractionating, treating, transporting and selling NGLs and NGL products; gathering, storing and terminaling crude oil; and storing and terminaling refined petroleum products, including:
|
·
|
damage to pipelines and plants, related equipment and surrounding properties caused by hurricanes, tornadoes, floods, fires and other natural disasters, explosions and acts of terrorism; |
|
·
|
inadvertent damage from third parties, including from motor vehicles and construction, farm or utility equipment; |
|
·
|
damage that is the result of the Partnership’s negligence or any of its employees’ negligence; |
|
·
|
leaks of natural gas, NGLs, crude oil and other hydrocarbons or losses of natural gas or NGLs as a result of the malfunction of equipment or facilities; |
|
·
|
spills or other unauthorized releases of natural gas, NGLs, crude oil, other hydrocarbons or waste materials that contaminate the environment, including soils, surface water and groundwater, and otherwise adversely impact natural resources; and |
|
·
|
other hazards that could also result in personal injury, loss of life, pollution and/or suspension of operations. |
These risks could result in substantial losses due to personal injury, loss of life, severe damage to and destruction of property and equipment, and pollution or other environmental damage, and may result in curtailment or suspension of the Partnership’s related operations. A natural disaster or other hazard affecting the areas in which the Partnership operates could have a material adverse effect on its operations. For example, in 2005 Hurricanes Katrina and Rita damaged gathering systems, processing facilities, NGL fractionators and pipelines along the Gulf Coast, including certain of the Partnership’s facilities, and curtailed or suspended the operations of various energy companies with assets in the region. The Louisiana and Texas Gulf Coast was similarly impacted in September 2008 as a result of Hurricanes Gustav and Ike. The Partnership is not fully insured against all risks inherent to its business. Additionally, while the Partnership is insured for pollution resulting from environmental accidents that occur on a sudden and accidental basis, it may not be insured against all environmental accidents that might occur, some of which may result in toxic tort claims. If a significant accident or event occurs that is not fully insured, if the Partnership fails to recover all anticipated insurance proceeds for significant accidents or events for which it is insured, or if the Partnership fails to rebuild facilities damaged by such accidents or events, its operations and financial condition could be adversely affected. In addition, the Partnership may not be able to maintain or obtain insurance of the type and amount it desires at reasonable rates. As a result of market conditions, premiums and deductibles for certain of the Partnership’s insurance policies have increased substantially, and could escalate further. For example, following Hurricanes Katrina and Rita, insurance premiums, deductibles and co-insurance requirements increased substantially, and terms were generally less favorable than terms that could be obtained prior to such hurricanes. Insurance market conditions worsened as a result of the losses sustained from Hurricanes Gustav and Ike in September 2008. As a result, the Partnership experienced further increases in deductibles and premiums, and further reductions in coverage and limits, with some coverage unavailable at any cost.
The Partnership may incur significant costs and liabilities resulting from performance of pipeline integrity programs and related repairs.
Pursuant to the authority under the NGPSA and HLPSA, as amended by the PSI Act, the PIPES Act and the 2011 Pipeline Safety Act, PHMSA has established a series of rules requiring pipeline operators to develop and implement integrity management programs for gas transmission and hazardous liquid pipelines that, in the event of a pipeline leak or rupture could affect “high consequence areas,” which are areas where a release could have the most significant adverse consequences, including high-population areas, certain drinking water sources and unusually sensitive ecological areas. These regulations require operators of covered pipelines to:
|
·
|
perform ongoing assessments of pipeline integrity; |
|
·
|
identify and characterize applicable threats to pipeline segments that could impact a high consequence area; |
|
·
|
improve data collection, integration and analysis; |
|
·
|
repair and remediate the pipeline as necessary; and |
|
·
|
implement preventive and mitigating actions. |
In addition, states have adopted regulations similar to existing PHMSA regulations for intrastate gathering and transmission lines. The Partnership currently estimates
an annual average cost of
$2.3 million between 2014 and 2016 to implement pipeline integrity management program testing along certain segments of its natural gas and NGL pipelines. This estimate does not include the costs, if any, of any repair, remediation, preventative or mitigating actions that may be determined to be necessary as a result of the testing program, which costs could be substantial. At this time, the Partnership cannot predict the ultimate cost of compliance with applicable pipeline integrity management regulations, as the cost will vary significantly depending on the number and extent of any repairs found to be necessary as a result of the pipeline integrity testing. The Partnership will continue its pipeline integrity testing programs to assess and maintain the integrity of its pipelines. The results of these tests could cause the Partnership to incur significant and unanticipated capital and operating expenditures for repairs or upgrades deemed necessary to ensure the continued safe and reliable operation of its pipelines.
Moreover, changes to pipeline safety laws by Congress and regulations by PHMSA that result in more stringent or costly safety standards could have a significant adverse effect on the Partnership and similarly situated midstream operators. For instance, in August 2011, PHMSA published an advance notice of proposed rulemaking in which the agency sought public comment on a number of changes to regulations governing the safety of gas transmission pipelines and gathering lines, including, for example, revisions to the definitions of “high consequence areas” and “gathering lines” and strengthening integrity management requirements as they apply to existing regulated operators and to currently exempt operators should certain exemptions be removed. PHMSA continues to evaluate the public comments received with respect to more stringent integrity management programs and recently, pursuant to one of the requirements in the 2011 Pipeline Safety Act, published a proposed rulemaking on August 1, 2013, seeking comments on whether an expansion of high consequence areas would mitigate the need for class location requirements that have been used in the past primarily to differentiate risk along a pipeline.
Unexpected volume changes due to production variability or to gathering, plant or pipeline system disruptions may increase the Partnership’s exposure to commodity price movements.
The Partnership sells processed natural gas to third parties at plant tailgates or at pipeline pooling points. Sales made to natural gas marketers and end-users may be interrupted by disruptions to volumes anywhere along the system. The Partnership attempts to balance sales with volumes supplied from processing operations, but unexpected volume variations due to production variability or to gathering, plant or pipeline system disruptions may expose it to volume imbalances which, in conjunction with movements in commodity prices, could materially impact its income from operations and cash flow.
The Partnership requires a significant amount of cash to service its indebtedness. The Partnership’s ability to generate cash depends on many factors beyond its control.
The Partnership’s ability to make payments on and to refinance its indebtedness and to fund planned capital expenditures depends on its ability to generate cash in the future. This, to a certain extent, is subject to general economic, financial, competitive, legislative, regulatory and other factors that are beyond the Partnership’s control. We cannot assure you that the Partnership will generate sufficient cash flow from operations, that future borrowings will be available to it under the TRP Revolver, that it will be able to sell its accounts receivables or make borrowings under its Securitization Facility, or otherwise in an amount sufficient to enable it to pay its indebtedness or to fund its other liquidity needs. The Partnership may need to refinance all or a portion of its indebtedness at or before maturity. We cannot assure you that the Partnership will be able to refinance any of its indebtedness on commercially reasonable terms or at all.
Failure to comply with existing or new environmental laws or regulations or an accidental release of hazardous substances, hydrocarbons or wastes into the environment may cause the Partnership to incur significant costs and liabilities.
The Partnership’s operations are subject to stringent federal, regional, state and local environmental laws and regulations governing the discharge of pollutants into the environment or otherwise relating to environmental protection. These laws and regulations may impose numerous obligations that are applicable to its operations including acquisition of a permit before conducting regulated activities, restrictions on the types, quantities and concentration of materials that can be released into the environment; limitation or prohibition of construction and operating activities in environmentally sensitive areas such as wetlands, urban areas, wilderness regions and other protected areas; requiring capital expenditures to comply with pollution control requirements and imposition of substantial liabilities for pollution resulting from its operations. Numerous governmental authorities, such as the EPA and analogous state agencies, have the power to enforce compliance with these laws and regulations and the permits issued under them, which can often require difficult and costly actions. Failure to comply with these laws and regulations or any newly adopted laws or regulations may trigger a variety of administrative, civil and criminal enforcement measures, including the assessment of monetary penalties or other sanctions, the imposition of remedial obligations and the issuance of orders enjoining future operations or imposing additional compliance requirements on such operations. Certain environmental laws impose strict, joint and several liability for costs required to clean up and restore sites where hazardous substances, hydrocarbons or waste products have been disposed or otherwise released, even under circumstances where the substances, hydrocarbons or waste have been released by a predecessor operator. Moreover, it is not uncommon for neighboring landowners and other third parties to file claims for personal injury and property damage allegedly caused by noise, odor or the release of hazardous substances, hydrocarbons or waste products into the environment.
There is inherent risk of incurring environmental costs and liabilities in connection with the Partnership’s operations due to its handling of natural gas, NGLs, crude oil and other petroleum products because of air emissions and product-related discharges arising out of its operations, and as a result of historical industry operations and waste disposal practices. For example, an accidental release from one of the Partnership’s facilities could subject it to substantial liabilities arising from environmental cleanup and restoration costs, claims made by neighboring landowners and other third parties for personal injury, natural resource and property damages and fines or penalties for related violations of environmental laws or regulations. Moreover, stricter laws, regulations or enforcement policies could significantly increase the Partnership’s operational or compliance costs and the cost of any remediation that may become necessary. Additionally, environmental groups have, from time to time, advocated increased regulation on the issuance of drilling permits for new oil or gas wells in areas where the Partnership operates, including the Barnett Shale area. The adoption of any laws, regulations or other legally enforceable mandates that result in more stringent air emission limitations or that restrict or prohibit the drilling of new natural gas wells for any extended period of time could increase the Partnership’s natural gas customers’ operating and compliance costs as well as reduce the rate of production of natural gas or crude oil from operators with whom the Partnership has a business relationship, which could have a material adverse effect on its results of operations and cash flows.
Increased regulation of hydraulic fracturing could result in reductions or delays in drilling and completing new oil and natural gas wells, which could adversely impact the Partnership’s revenues by decreasing the volumes of natural gas, NGLs or crude oil through its facilities and reducing the utilization of its assets.
Hydraulic fracturing is a process used by oil and gas exploration and production operators in the completion of certain oil and gas wells whereby water, sand and chemicals are injected under pressure into subsurface formations to stimulate gas and, to a lesser extent, oil production. The process is typically regulated by state oil and gas commissions, but the EPA has asserted limited regulatory authority over hydraulic fracturing, and has indicated it might seek to further expand its regulation of hydraulic fracturing. Also, the Bureau of Land Management has proposed regulations applicable to hydraulic fracturing conducted on federal and Indian oil and gas leases. In addition, Congress has from time to time considered the adoption of legislation to provide for federal regulation of hydraulic fracturing. At the state level, a growing number of states have adopted or are considering legal requirements that could impose more stringent permitting, disclosure or well construction requirements on hydraulic fracturing activities. In addition, local governments may seek to adopt ordinances within their jurisdictions regulating the time, place and manner of drilling activities in general or hydraulic fracturing activities in particular. If new or more stringent federal, state or local legal restrictions related to the hydraulic fracturing process are adopted in areas where the Partnership’s oil and natural gas exploration and production customers operate, those customers could incur potentially significant added costs to comply with such requirements and experience delays or curtailment in the pursuit of exploration, development or production activities, which could reduce demand for the Partnership’s gathering, processing and fractionation services. Further several federal governmental agencies are conducting reviews and studies on the environmental aspects of hydraulic fracturing activities, including the White House Council on Environmental Quality, the EPA and the U.S. Department of Energy. These studies, depending on their degree of pursuit and any meaningful results obtained, could spur initiatives to further regulate hydraulic fracturing, which events could delay or curtail production of natural gas by exploration and production operators, some of which are the Partnership’s customers, and thus reduce demand for the Partnership’s midstream services.
A change in the jurisdictional characterization of some of the Partnership’s assets by federal, state, tribal or local regulatory agencies or a change in policy by those agencies may result in increased regulation of its assets, which may cause its revenues to decline and operating expenses to increase or delay or increase the cost of expansion projects.
With the exception of the Partnership’s interest in VGS, its operations are generally exempt from FERC regulation under the NGA, but FERC regulation still affects its non-FERC jurisdictional businesses and the markets for products derived from these businesses, including certain FERC reporting and posting requirements in a given year. The Partnership believes that the natural gas pipelines in its gathering systems meet the traditional tests FERC has used to establish a pipeline’s status as a gatherer not subject to regulation as a natural gas company. However, the distinction between FERC-regulated transmission services and federally unregulated gathering services is the subject of substantial, ongoing litigation, so the classification and regulation of the Partnership’s gathering facilities are subject to change based on future determinations by FERC, the courts or Congress. In addition, the courts have determined that certain pipelines that would otherwise be subject to the ICA are exempt from regulation by FERC under the ICA as proprietary lines. The classification of a line as a proprietary line is a fact-based determination subject to FERC and court review. Accordingly, the classification and regulation of some of the Partnership’s gathering facilities and transportation pipelines may be subject to change based on future determinations by FERC, the courts or Congress.
The crude oil pipeline system that is part of the Badlands assets has qualified for a temporary waiver of applicable FERC regulatory requirements under the ICA based on current circumstances. Such waivers are subject to revocation, however, and should the pipeline’s circumstances change, FERC could, either at the request of other entities or on its own initiative, assert that some or all of the transportation on this pipeline system is within its jurisdiction. In the event that FERC were to determine that this pipeline system no longer qualified for a waiver, the Partnership would likely be required to file a tariff with FERC, provide a cost justification for the transportation charge, and provide service to all potential shippers without undue discrimination. Such a change in the jurisdictional status of transportation on this pipeline could adversely affect the Partnership’s results of operations.
Various federal agencies within the U.S. Department of the Interior, particularly the Bureau of Land Management, Office of Natural Resources Revenue (formerly the Minerals Management Service) and the Bureau of Indian Affairs, along with the Three Affiliated Tribes, promulgate and enforce regulations pertaining to operations on the Fort Berthold Indian Reservation, on which the Partnership operates a significant portion of its Badlands gathering and processing assets. The Three Affiliated Tribes is a sovereign nation having the right to enforce certain laws and regulations independent from federal, state and local statutes and regulations. These tribal laws and regulations include various taxes, fees and other conditions that apply to lessees, operators and contractors conducting operations on Native American tribal lands. Lessees and operators conducting operations on tribal lands can generally be subject to the Native American tribal court system. One or more of these factors may increase the Partnership’s costs of doing business on the Fort Berthold Indian Reservation and may have an adverse impact on its ability to effectively transport products within the Fort Berthold Indian Reservation or to conduct its operations on such lands.
Other FERC regulations may indirectly impact the Partnership’s businesses and the markets for products derived from these businesses. FERC’s policies and practices across the range
of its natural gas regulatory activities, including, for example, its policies on open access transportation, gas quality, ratemaking, capacity release and market center promotion, may indirectly affect the intrastate natural gas market. In recent years, FERC has pursued pro-competitive policies in its regulation of interstate natural gas pipelines. However, we cannot assure you that FERC will continue this approach as it considers matters such as pipeline rates and rules and policies that may affect rights of access to transportation capacity. For more information regarding the regulation of the Partnership’s operations, see “Item 1. Business—Regulation of Operations.”
Should the Partnership fail to comply with all applicable FERC-administered statutes, rules, regulations and orders, it could be subject to substantial penalties and fines.
Under the Energy Policy Act of 2005, FERC has civil penalty authority under the NGA to impose penalties for current violations of up to $1 million per day for each violation and disgorgement of profits associated with any violation. While the Partnership’s systems other than VGS have not been regulated by FERC as a natural gas company under the NGA, FERC has adopted regulations that may subject certain of its otherwise non-FERC jurisdictional facilities to FERC annual reporting and daily scheduled flow and capacity posting requirements. Additional rules and legislation pertaining to those and other matters may be considered or adopted by FERC from time to time. Failure to comply with those regulations in the future could subject the Partnership to civil penalty liability. For more information regarding regulation of the Partnership’s operations, see “Item 1. Business—Regulation of Operations.”
The adoption of climate change legislation or regulations restricting emissions of GHGs could result in increased operating costs and reduced demand for the products and services the Partnership provides.
In December 2009, the EPA published its findings that emissions of carbon dioxide, methane and other GHGs present an endangerment to public health and the environment because emissions of such gases are, according to the EPA, contributing to warming of the earth’s atmosphere and other climatic changes. Based on these findings, the EPA has adopted rules under the Clean Air Act that, among other things, establish PSD construction and Title V operating permit reviews for certain large stationary sources, which reviews could require securing PSD permits at covered facilities emitting GHGs and meeting “best available control technology” standards for those GHG emissions. In addition, the EPA has adopted rules requiring the monitoring and reporting of GHG emissions from specified onshore and offshore production facilities and onshore processing, transmission and storage facilities in the United States on an annual basis, which include certain of the Partnership’s operations. While Congress has from time to time considered adopting legislation to reduce emissions of GHGs, there has not been significant activity in the form of adopted legislation. In the absence of such federal climate legislation, a number of state and regional efforts have emerged that are aimed at tracking and/or reducing GHG emissions by means of cap and trade programs. The adoption of any legislation or regulations that requires reporting of GHGs or otherwise restricts emissions of GHGs from the Partnership’s equipment and operations could require us to incur significant added costs to reduce emissions of GHGs or could adversely affect demand for the natural gas and NGLs the Partnership gathers and processes or fractionates. Moreover, if Congress undertakes comprehensive tax reform in the coming year, it is possible that such reform may include a carbon tax, which could impose additional direct costs on operations and reduce demand for refined products, which could adversely affect the services the Partnership provides.
Federal and state legislative and regulatory initiatives relating to pipeline safety that require the use of new or more stringent safety controls or result in more stringent enforcement of applicable legal requirements could subject the Partnership to increased capital costs, operational delays and costs of operation.
The 2011 Pipeline Safety Act is the most recent federal legislation to amend the NGPSA and HLPSA pipeline safety laws, requiring increased safety measures for gas and hazardous liquids transportation pipelines. Among other things, the 2011 Pipeline Safety Act directs the Secretary of Transportation to promulgate rules or standards relating to expanded integrity management requirements, automatic or remote-controlled valve use, excess flow valve use, leak detection system installation, testing to confirm that the material strength of certain pipelines is above 30% of specified minimum yield strength, and operator verification of records confirming the maximum allowable pressure of certain intrastate gas transmission pipelines. The 2011 Pipeline Safety Act also increases the maximum penalty for violation of pipeline safety regulations from $100,000 to $200,000 per violation per day and also from $1 million to $2 million for a related series of violations. The safety enhancement requirements and other provisions of the 2011 Pipeline Safety Act as well as any implementation of PHMSA rules thereunder or any issuance or reinterpretation of guidance by PHMSA or any state agencies with respect thereto could require us to install new or modified safety controls, pursue additional capital projects or conduct maintenance programs on an accelerated basis, any or all of which tasks could result in
the Partnership’s
incurring increased operating costs that could be significant and have a material adverse effect on
the Partnership’s
results of operations or financial position. For example, PHMSA and one or more state regulators, including the RRC, have in the recent past, expanded the scope of their regulatory inspections to include certain in-plant equipment and pipelines found within NGL fractionation facilities and associated storage facilities, in order to assess compliance of such equipment and pipelines with hazardous liquid pipeline safety requirements. These recent actions by PHMSA are currently subject to judicial and administrative challenges by one or more midstream operators; however, to the extent that such legal challenges are unsuccessful, midstream operators of NGL fractionation facilities and associated storage facilities subject to such inspection may be required to make operational changes or modifications at their facilities to meet standards beyond current OSHA PSM and EPA RMP requirements, which changes or modifications may result in additional capital costs, possible operational delays and increased costs of operation that, in some instances, may be significant.
The enactment of derivatives legislation could have an adverse effect on the Partnership's ability to use derivative instruments to reduce the effect of commodity price, interest rate and other risks associated with its business.
The Dodd-Frank Wall Street Reform and Consumer Protection Act (the "Dodd-Frank Act"), enacted on July 21, 2010, established federal oversight and regulation of the over-the-counter derivatives market and entities, such as the Partnership, that participate in that market. The Dodd-Frank Act requires the CFTC and the SEC to promulgate rules and regulations implementing the Dodd-Frank Act. Although the CFTC has finalized certain regulations, others remain to be finalized or implemented and it is not possible at this time to predict when this will be accomplished.
In October 2011, the CFTC issued regulations to set position limits for certain futures and option contracts in the major energy markets and for swaps that are their economic equivalents. The initial position limits rule was vacated by the United States District Court for the District of Columbia in September 2012. However, in November 2013, the CFTC proposed new rules that would place limits on positions in certain core futures and equivalent swaps contracts for or linked to certain physical commodities, subject to exceptions for certain bona fide hedging transactions. As these new position limit rules are not yet final, the impact of those provisions on us is uncertain at this time.
The CFTC has designated certain interest rate swaps and credit default swaps for mandatory clearing and the associated rules also will require the Partnership, in connection with covered derivative activities, to comply with clearing and trade-execution requirements or take steps to qualify for an exemption to such requirements. Although the Partnership expects to qualify for the end-user exception from the mandatory clearing requirements for swaps entered to hedge its commercial risks, the application of the mandatory clearing and trade execution requirements to other market participants, such as swap dealers, may change the cost and availability of the swaps that the Partnership uses for hedging. In addition, for uncleared swaps, the CFTC or federal banking regulators may require end-users to enter into credit support documentation and/or post initial and variation margin. Posting of collateral could impact liquidity and reduce cash available to the Partnership for capital expenditures, therefore reducing its ability to execute hedges to reduce risk and protect cash flows. The proposed margin rules are not yet final, and therefore the impact of those provisions to the Partnership is uncertain at this time.
The Dodd-Frank Act also may require the counterparties to the Partnership's derivative instruments to spin off some of their derivatives activities to a separate entity, which may not be as creditworthy as the current counterparty.
The full impact of the Dodd-Frank Act and related regulatory requirements upon the Partnership’s business will not be known until the regulations are implemented and the market for derivatives contracts has adjusted. The Dodd-Frank Act and any new regulations could significantly increase the cost of derivative contracts, materially alter the terms of derivative contracts, reduce the availability of derivatives to protect against risks the Partnership encounters, reduce its ability to monetize or restructure its existing derivative contracts or increase its exposure to less creditworthy counterparties. If the Partnership reduces its use of derivatives as a result of the Dodd-Frank Act and regulations implementing the Dodd-Frank Act, its results of operations may become more volatile and its cash flows may be less predictable, which could adversely affect its ability to plan for and fund capital expenditures.
Finally, the Dodd-Frank Act was intended, in part, to reduce the volatility of oil and natural gas prices, which some legislators attributed to speculative trading in derivatives and commodity instruments related to oil and natural gas. The Partnership's revenues could therefore be adversely affected if a consequence of the Dodd-Frank Act and implementing regulations is to lower commodity prices.
Any of these consequences could have a material adverse effect on the Partnership, its financial condition and its results of operations.
The Partnership’s interstate common carrier liquids pipeline is regulated by the FERC.
Targa NGL has interstate NGL pipelines that are considered common carrier pipelines subject to regulation by FERC under the ICA. More specifically, Targa NGL owns a twelve-inch diameter pipeline that runs between Lake Charles, Louisiana and Mont Belvieu, Texas. This pipeline can move mixed NGL and purity NGL products. Targa NGL also owns an eight-inch diameter pipeline and a twenty-inch diameter pipeline, each of which run between Mont Belvieu, Texas and Galena Park, Texas. The eight-inch and the twenty-inch pipelines are part of an extensive mixed NGL and purity NGL pipeline receipt and delivery system that provides services to domestic and foreign import and export customers. The ICA requires that the Partnership maintain tariffs on file with FERC for each of these pipelines. Those tariffs set forth the rates the Partnership charges for providing transportation services as well as the rules and regulations governing these services. The ICA requires, among other things, that rates on interstate common carrier pipelines be “just and reasonable” and nondiscriminatory. All shippers on these pipelines are the Partnership’s subsidiaries.
Terrorist attacks and the threat of terrorist attacks have resulted in increased costs to the Partnership’s business. Continued hostilities in the Middle East or other sustained military campaigns may adversely impact the Partnership’s results of operations.
The long-term impact of terrorist attacks, such as the attacks that occurred on September 11, 2001, and the threat of future terrorist attacks on the Partnership’s industry in general and on the Partnership in particular is not known at this time. However, resulting regulatory requirements and/or related business decisions associated with security are likely to increase the Partnership’s costs.
Increased security measures taken by the Partnership as a precaution against possible terrorist attacks have resulted in increased costs to its business. Uncertainty surrounding continued hostilities in the Middle East or other sustained military campaigns may affect the Partnership’s operations in unpredictable ways, including disruptions of crude oil supplies and markets for its products, and the possibility that infrastructure facilities could be direct targets, or indirect casualties, of an act of terror.
Changes in the insurance markets attributable to terrorist attacks may make certain types of insurance more difficult for the Partnership to obtain. Moreover, the insurance that may be available to the Partnership may be significantly more expensive than its existing insurance coverage or coverage may be reduced or unavailable. Instability in the financial markets as a result of terrorism or war could also affect the Partnership’s ability to raise capital.
None.
A description of our properties is contained in “Item 1. Business” of this Annual Report.
Our principal executive offices are located at 1000 Louisiana Street, Suite 4300, Houston, Texas 77002 and our telephone number is 713-584-1000.
We are not a party to any legal proceedings other than legal proceedings arising in the ordinary course of our business. We are a party to various administrative and regulatory proceedings that have arisen in the ordinary course of our business. See “Item 1. Business—Regulation of Operations” and “Item 1. Business—Environmental, Health and Safety Matters.”
Not applicable.
PART II
|
Market for Registrant’s Common Equity, Related Stockholder Matters and Issuer Purchases of Equity Securities.
|
Market Information
Our common stock is listed on the New York Stock Exchange (“NYSE”) under the symbol “TRGP.”
The following table sets forth the high and low sales prices of the common stock at the end of each subsequent quarter, as reported by the NYSE through December 31, 2013 and the amount of cash dividends declared since our IPO. As of February 7, 2014, there were approximately 188 stockholders of record of our common stock. This number does not include stockholders whose shares are held in trust by other entities. The actual number of stockholders is greater than the number of holders of record. As of February 10, 2014, there were 42,167,343 shares of common stock outstanding.
|
|
Stock Prices
|
Dividends
|
||||||||||
|
Quarter Ended
|
High
|
Low
|
Declared
|
|||||||||
|
December 31, 2013
|
$
|
89.74
|
$
|
72.24
|
$
|
0.60750
|
||||||
|
September 30, 2013
|
74.94
|
64.40
|
0.57000
|
|||||||||
|
June 30, 2013
|
69.43
|
60.01
|
0.53250
|
|||||||||
|
March 31, 2013
|
68.42
|
54.31
|
0.49500
|
|||||||||
|
December 31, 2012
|
53.38
|
45.74
|
0.45750
|
|||||||||
|
September 30, 2012
|
51.43
|
41.46
|
0.42250
|
|||||||||
|
June 30, 2012
|
49.91
|
39.89
|
0.39375
|
|||||||||
|
March 31, 2012
|
48.28
|
38.70
|
0.36500
|
|||||||||
Stock Performance Graph
The graph below compares the cumulative return to holders of Targa Resources Corp.'s common stock, the NYSE Composite Index (the “NYSE Index”) and the Alerian MLP Index (“the MLP Index”). The performance graph was prepared based on the following assumptions: (i) $100 was invested in our common stock at $24.70 per share (the closing market price at the end of our first trading day), in the NYSE Index, and the MLP Index on December 7, 2010 (our first day of trading) and (ii) dividends were reinvested on the relevant payment dates. The stock price performance included in this graph is historical and not necessarily indicative of future stock price performance.
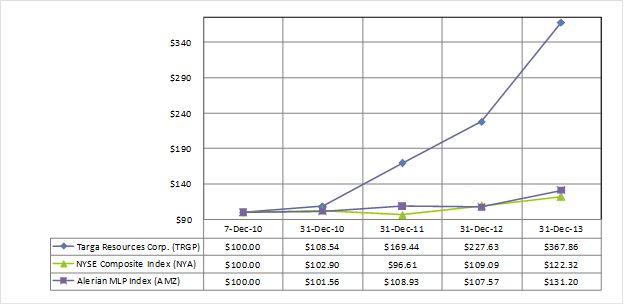
Pursuant to Instruction 7 to Item 201(e) of Regulation S-K, the above stock performance graph and related information is being furnished and is not being filed with the SEC, and as such shall not be deemed to be incorporated by reference into any filing that incorporates this Annual Report by reference.
Our Dividend Policy
We intend to pay to our stockholders, on a quarterly basis, dividends equal to the cash we receive from our Partnership distributions, less reserves for expenses, future dividends and other uses of cash, including:
|
·
|
federal income taxes, which we are required to pay because we are taxed as a corporation; |
|
·
|
the expenses of being a public company; |
|
·
|
other general and administrative expenses; |
|
·
|
general and administrative reimbursements to the Partnership; |
|
·
|
capital contributions to the Partnership upon the issuance by it of additional partnership securities if we choose to maintain the general partner’s 2.0% interest; |
|
·
|
reserves our board of directors believes prudent to maintain; |
|
·
|
our obligation to satisfy tax obligations associated with previous sales of assets to the Partnership; and |
|
·
|
interest expense or principal payments on any indebtedness we incur. |
If the Partnership is successful in implementing its business strategy and increasing distributions to its partners, we would generally expect to increase dividends to our stockholders, although the timing and amount of any such increased dividends will not necessarily be comparable to the increased Partnership distributions. We cannot assure you that any dividends will be declared or paid in the future.
The determination of the amount of cash dividends, including the quarterly dividend referred to above, if any, to be declared and paid will depend upon our financial condition, results of operations, cash flow, the level of our capital expenditures, future business prospects and any other matters that our board of directors deems relevant. The Partnership’s debt agreements contain restrictions on the payment of distributions and prohibit the payment of distributions if the Partnership is in default. If the Partnership cannot make incentive distributions to the general partner or limited partner distributions to us, we will be unable to pay dividends on our common stock.
The Partnership’s Cash Distribution Policy
Under the Partnership’s partnership agreement, available cash is defined, for each fiscal quarter, as the sum of all cash and cash equivalents on hand at the end of that quarter and all additional cash and cash equivalents on hand immediately prior to the date of the distribution of available cash resulting from borrowings for working capital purposes subsequent to the end of that quarter, less the amount of any cash reserves established by the general partner to:
|
·
|
provide for the proper conduct of the Partnership’s business including reserves for future capital expenditures and for anticipated future credit needs; |
|
·
|
comply with applicable law or any loan agreements, security agreements, mortgages, debt instruments or other agreements binding on the Partnership and its subsidiaries; or |
|
·
|
provide funds for distributions to the Partnership’s unitholders and to the general partner for any one or more of the next four quarters. |
The determination of available cash takes into account the possibility of establishing cash reserves in some quarterly periods that the Partnership may use to pay cash distributions in other quarterly periods, thereby enabling it to maintain relatively consistent cash distribution levels even if the Partnership’s business experiences fluctuations in its cash from operations due to seasonal and cyclical factors. The general partner’s determination of available cash also allows the Partnership to maintain reserves to provide funding for its growth opportunities. The Partnership makes its quarterly distributions from cash generated from its operations, and those distributions have grown over time as its business has grown, primarily as a result of numerous acquisitions and organic expansion projects that have been funded through external financing sources and cash from operations.
The actual cash distributions paid by the Partnership to its partners occur within 45 days after the end of each quarter. Since the second quarter of 2007, the Partnership has increased its quarterly cash distribution nineteen times. During that time period, the Partnership has increased its quarterly distribution by 121% from $0.3375 per common unit, or $1.35 on an annualized basis, to $0.7475 per common unit, or $2.99 on an annualized basis.
For a discussion of restrictions on our and our subsidiaries’ ability to pay dividends or make distributions, please see “Management’s Discussion and Analysis of Financial Condition and Results of Operations—Credit Facilities and Long-Term Debt” and Note 10, “Debt Obligations” of our consolidated financial statements beginning on page F-1 of this Form 10-K.
Recent Sales of Unregistered Stock
None.
Repurchase of Equity by Targa Resources Corp, or Affiliated Purchasers.
None.
The following table presents selected historical consolidated financial and operating data of Targa Resources Corp. for the periods ended, and as of, the dates indicated. We derived this information from our historical “Consolidated Financial Statements” and accompanying notes. This information should be read together with, and is qualified in its entirety, by reference to those financial statements and notes of this Annual Report.
|
|
2013
|
2012
|
2011
|
2010
|
2009
|
|||||||||||||||
|
|
(In millions, except per share amounts)
|
|||||||||||||||||||
|
Statement of operations data:
|
|
|
|
|
|
|||||||||||||||
|
Revenues
|
$
|
6,556.0
|
$
|
5,885.7
|
$
|
6,994.5
|
$
|
5,476.1
|
$
|
4,542.3
|
||||||||||
|
Income from operations
|
368.2
|
336.3
|
351.1
|
196.1
|
217.2
|
|||||||||||||||
|
Net income
|
201.3
|
159.3
|
215.4
|
63.3
|
79.1
|
|||||||||||||||
|
Net income (loss) attributable to Targa Resources Corp.
|
65.1
|
38.1
|
30.7
|
(15.0
|
)
|
29.3
|
||||||||||||||
|
Dividends on Series B preferred stock
|
-
|
-
|
-
|
(9.5
|
)
|
(17.8
|
)
|
|||||||||||||
|
Net income (loss) available to common shareholders
|
65.1
|
38.1
|
30.7
|
(202.3
|
)
|
-
|
||||||||||||||
|
Net income (loss) per common share - basic
|
1.56
|
0.93
|
0.75
|
(30.94
|
)
|
-
|
||||||||||||||
|
Net income (loss) per common share - diluted
|
1.55
|
0.91
|
0.74
|
(30.94
|
)
|
-
|
||||||||||||||
|
Balance sheet data (at end of period):
|
||||||||||||||||||||
|
Total assets
|
$
|
6,048.6
|
$
|
5,105.0
|
$
|
3,831.0
|
$
|
3,393.8
|
$
|
3,367.5
|
||||||||||
|
Long-term debt
|
2,989.3
|
2,475.3
|
1,567.0
|
1,534.7
|
1,593.5
|
|||||||||||||||
|
Convertible cumulative participating series B preferred stock
|
-
|
-
|
-
|
-
|
308.4
|
|||||||||||||||
|
Total owners' equity
|
2,091.3
|
1,753.4
|
1,330.7
|
1,036.1
|
754.9
|
|||||||||||||||
|
Other:
|
||||||||||||||||||||
|
Dividends declared per share
|
$
|
2.2050
|
$
|
1.6388
|
$
|
1.2063
|
$
|
0.0616
|
N/A
|
|||||||||||
|
Dividends paid on series B preferred shares
|
$
|
-
|
$
|
-
|
$
|
-
|
$
|
238.0
|
$
|
-
|
||||||||||
The following discussion and analysis of our financial condition and results of operations should be read in conjunction with our historical financial statements and notes included in Part IV of this Annual Report. Also, the Partnership files a separate Annual Report on Form 10-K with the SEC.
Overview
Financial Presentation
Targa Resources Corp. is a publicly traded Delaware corporation formed in October 2005. Our common stock is listed on the NYSE under the symbol “TRGP.” In this Annual Report, unless the context requires otherwise, references to “we,” “us,” “our,” the “Company,” or “Targa” are intended to mean our consolidated business and operations.
We own general and limited partner interests, including Incentive Distribution Rights (“IDRs”), in Targa Resources Partners LP (the “Partnership”) a publicly traded Delaware limited partnership that is a leading United States provider of midstream natural gas and NGL services, with a growing presence in crude oil gathering and petroleum terminaling. Common units of the Partnership are listed on the NYSE under the symbol “NGLS.”
Our primary business objective is to increase our cash available for dividends to our stockholders by assisting the Partnership in executing its business strategy. We may facilitate the Partnership’s growth through various forms of financial support, including, but not limited to, modifying the Partnership’s IDRs, exercising the Partnership’s IDR reset provision contained in its partnership agreement, making loans, making capital contributions in exchange for yielding or non-yielding equity interests or providing other financial support to the Partnership, if needed, to support its ability to make distributions. We also may enter into other economic transactions intended to increase our ability to make cash available for dividends over time. In addition, we may acquire assets that could be candidates for acquisition by the Partnership, potentially after operational or commercial improvement or further development.
An indirect subsidiary of ours is the general partner of the Partnership. Because we control the general partner, under GAAP we must reflect our ownership interest in the Partnership on a consolidated basis. Accordingly, the Partnership’s financial results are included in our consolidated financial statements even though the distribution or transfer of Partnership assets are limited by the terms of the partnership agreement, as well as restrictive covenants in the Partnership’s lending agreements. The limited partner interests in the Partnership not owned by us are reflected in our results of operations as net income attributable to noncontrolling interests. Therefore, throughout this discussion, we make a distinction where relevant between financial results of the Partnership versus those of us as a standalone parent including our non-Partnership subsidiaries.
The Partnership files its own separate Annual Report. The financial results presented in our consolidated financial statements will differ from the financial statements of the Partnership primarily due to the effects of:
|
·
|
our separate debt obligations; |
|
·
|
federal income taxes; |
|
·
|
certain retained general and administrative costs applicable to us as a public company; |
|
·
|
certain administrative assets and liabilities incumbent as a provider of operational and support services to the Partnership; |
|
·
|
certain non-operating assets and liabilities that we retained; |
|
·
|
Partnership distributions and earnings allocable to third-party common unitholders which are included in non-controlling interest in our statements; and |
|
·
|
Partnership distributions applicable to our General Partner interest, Incentive Distribution Rights and investment in Partnership common units. While these are eliminated when preparing our consolidated financial statements, they nonetheless are the primary source of cash flow that supports the payment of dividends to our stockholders. |
Our Operations
Currently, we have no separate, direct operating activities apart from those conducted by the Partnership. As such, our cash inflows will primarily consist of cash distributions from our interests in the Partnership. The Partnership is required to distribute all available cash at the end of each quarter after establishing reserves to provide for the proper conduct of its business or to provide for future distributions.
The Partnership’s Operations
The Partnership is a leading provider of midstream natural gas and NGL services in the United States, with a growing presence in crude oil gathering and petroleum terminaling.
The Partnership is engaged in the business of:
|
·
|
gathering, compressing, treating, processing and selling natural gas; |
|
·
|
storing, fractionating, treating, transporting, terminaling and selling NGLs and NGL products; |
|
·
|
gathering, storing and terminaling crude oil; and |
|
·
|
storing, terminaling and selling refined petroleum products. |
The Partnership reports its operations in two divisions: (i) Gathering and Processing, consisting of two reportable segments – (a) Field Gathering and Processing and (b) Coastal Gathering and Processing; and (ii) Logistics and Marketing consisting of two reportable segments – (a) Logistics Assets and (b) Marketing and Distribution. The financial results of its hedging activities are reported in Other.
The Partnership’s Gathering and Processing division includes assets used in the gathering of natural gas produced from oil and gas wells and processing this raw natural gas into merchantable natural gas by extracting NGLs and removing impurities; and assets used for crude oil gathering and terminaling. The Field Gathering and Processing segment's assets are located in North Texas, the Permian Basin of West Texas, New Mexico and in North Dakota. The Coastal Gathering and Processing segment's assets are located in the onshore and near offshore regions of the Louisiana Gulf Coast and the Gulf of Mexico.
The Partnership’s Logistics and Marketing division is also referred to as its Downstream Business. The Partnership’s Downstream Business includes all the activities necessary to convert mixed NGLs into NGL products and provides certain value added services such as the storing, terminaling, distributing and marketing of NGLs and refined petroleum products. It also includes certain natural gas supply and marketing activities in support of the Partnership’s other operations, as well as transporting natural gas and NGLs.
The Partnership’s Logistics Assets segment is involved in transporting, storing, and fractionating mixed NGLs; storing, terminaling, and transporting finished NGLs, including services for exporting LPGs; and storing and terminaling of refined petroleum products. These assets are generally connected to and supplied in part by the Partnership’s Gathering and Processing segments and are predominantly located in Mont Belvieu and Galena Park, Texas and in Lake Charles, Louisiana.
The Partnership’s Marketing and Distribution segment covers activities required to distribute and market raw and finished NGLs and all natural gas marketing activities. It includes (1) marketing the Partnership’s own NGL production and purchasing NGL products in selected United States markets; (2) providing LPG balancing services to refinery customers; (3) transporting, storing and selling propane and providing related propane logistics services to multi-state retailers, independent retailers and other end-users; (4) providing propane, butane and services to LPG exporters; and (5) marketing natural gas available to the Partnership from its Gathering and Processing division and the purchase and resale and other value added activities related to third-party natural gas in selected United States markets.
Other contains the results of the Partnership’s commodity hedging activities included in operating margin.
2013 Developments
Badlands Expansion Program
On January 1, 2013, the Partnership assumed operational control of the Badlands assets in the Williston Basin of North Dakota and commenced integration activities. The Badlands operational results are included as part of the Field Gathering and Processing segment.
During 2013, the Partnership invested approximately $250 million to expand the gathering and processing capabilities of Badlands. The Partnership added an additional 20 MMcf/d natural gas processing plant, and increased its crude gathering and natural gas gathering and processing operations substantially with the addition of pipelines and associated oil and gas facilities. During 2014 we anticipate that the Partnership will invest another $180 million for further expansion of its gathering and processing assets.
The acquisition agreement also provided for a contingent payment of $50 million conditioned on achieving stipulated crude gathering volumes by mid-2014. Management does not believe that those thresholds will be achieved during the contingency period. At December 31, 2012, based on a probability-based model measuring the likelihood of meeting the thresholds, the Partnership recorded a $15.3 million accrued liability representing the fair value of this contingent consideration. During 2013, the contingent consideration was re-estimated to be $0, resulting in the elimination of the contingent liability.
Cedar Bayou Fractionators Train 4
In August 2013, the Partnership commissioned an additional fractionator, Train 4, at CBF. This expansion added 100 MBbl/d of fractionation capacity at CBF. The gross cost of Train 4 was approximately $385 million (net cost to the Partnership was approximately $345 million).
International Export Project
In September 2013, the Partnership commissioned Phase I of its international export expansion project, which includes facilities at both the Partnership’s Mont Belvieu facility and Galena Park Marine Terminal near Houston, Texas. Phase I of this project expanded the Partnership’s export capability to approximately 3.5 to 4 MMBbl per month of propane and/or butane. Included in its Phase I expansion is the capability to export international grade low ethane propane. With the completion of Phase I, the Partnership also added capabilities to load VLGC vessels in addition to the small and medium-sized export vessels that it loads for export. Construction is underway to further expand the Partnership’s propane and butane international export capacity by approximately 2 MMBbl per month, with an expected completion of Phase II in the third quarter of 2014. The Partnership expects that the total cost of both phases of the international export project to be approximately $480 million.
North Texas Longhorn Plant
The Partnership started construction of a new 200 MMcf/d cryogenic processing plant for North Texas to meet increasing production and continued producer activity, with an anticipated completion in the second quarter of 2014. The Partnership expects to invest an estimated $150 million for the plant and associated projects.
SAOU High Plains Plant
The Partnership has
started construction of a new 200 MMcf/d cryogenic processing plant and related gathering and compression facilities for SAOU to meet increasing production and continued producer activity on the eastern side of the Permian Basin, with an anticipated completion date in mid-2014. The Partnership expects to invest an estimated $225 million for the plant and associated projects.
Accounts Receivable Securitization Facility
In January 2013, the Partnership entered into a Securitization Facility that provides up to $200 million of borrowing capacity at commercial paper or LIBOR market index rates plus a margin through January 2014. Under this Securitization Facility, one of the Partnership’s consolidated subsidiaries (Targa Liquids Marketing and Trade LLC or “TLMT”) sells or contributes receivables, without recourse, to another of its consolidated subsidiaries (Targa Receivables LLC or “TRLLC”), a special purpose consolidated subsidiary created for the sole purpose of this Securitization Facility. TRLLC, in turn, sells an undivided percentage ownership in the eligible receivables to a third-party financial institution. Receivables up to the amount of the outstanding debt under the Securitization Facility are not available to satisfy the claims of the creditors of TLMT or the Partnership. Any excess receivables are eligible to satisfy the claims of creditors of TLMT or the Partnership.
In December 2013, the Partnership entered into an amendment to the Securitization Facility to increase the borrowing capacity to $300 million and extend the termination date to December 12, 2014. As of December 31, 2013, total funding under this Securitization Facility was $279.7 million.
Other Financing Activities
In 2012, the Partnership filed with the SEC a universal shelf registration statement that, subject to effectiveness at the time of use, allows the Partnership to issue up to an aggregate of $300 million of debt or equity securities (the “2012 Shelf”).
In August 2012, the Partnership entered into an Equity Distribution Agreement (the “2012 EDA”) with Citigroup Global Markets Inc. (“Citigroup”) pursuant to which the Partnership may sell, at its option, up to an aggregate of $100 million of its common units through Citigroup, as sales agent, under the 2012 Shelf. During 2012, there were no sales of common units pursuant to this program. During 2013,
the Partnership issued 2,420,046 common units under the 2012 EDA, receiving net proceeds of $94.8 million. We contributed $2.0 million to maintain our 2% general partner interest.
In March 2013, the Partnership entered into a second EDA under the Partnership’s 2012 Shelf (“March
2013
EDA”) with Citigroup, Deutsche Bank Securities Inc. (“Deutsche Bank”), Raymond James & Associates, Inc. (“Raymond James”) and UBS Securities LLC (“UBS”), as its sales agents,
pursuant to which the Partnership may sell, at its option, up to an aggregate of $200 million of its debt or equity securities. During 2013, the Partnership issued 4,204,751 common units under the March 2013 EDA, receiving net proceeds of $197.5
million. We contributed $4.1 million to maintain our 2% general partner interest. The 2012 Shelf expires in August 2015.
In April 2013, the Partnership filed with the SEC a universal shelf registration statement (the “April 2013 Shelf”), which provides the Partnership with the ability to offer and sell an unlimited amount of debt and equity securities, subject to market conditions and the Partnership’s capital needs. The April 2013 Shelf expires in April 2016. There was no activity under the April 2013 Shelf during the year ended December 31, 2013.
In May 2013, the Partnership privately placed $625.0 million in aggregate principal amount of its 4¼% Senior Notes due 2023 (the “4¼% Notes”). The 4¼% Notes resulted in approximately $618.1 million of net proceeds, which were used to reduce borrowings under the Partnership’s TRP Revolver and for general partnership purposes.
In June 2013, the Partnership redeemed $100 million of the outstanding 6⅜% Senior Notes due 2022 (the “6⅜% Notes”) at a redemption price of 106.375% plus accrued interest through the redemption date. The redemption resulted in a $7.4 million loss, including the write-off of unamortized debt issue costs.
In
July 2013, the Partnership redeemed the outstanding 11¼% Senior Notes due 2017 (the “11¼% Notes”) at a price of 105.625% plus accrued interest through July 15, 2013. The redemption resulted in a $7.4 million loss, including the write-off of unamortized debt issue costs.
In July 2013, the Partnership filed with the SEC a universal shelf registration statement (the “July 2013 Shelf”) that allows it to issue up to an aggregate of $800 million of debt or equity securities. The July 2013 Shelf expires in August 2016.
In August 2013, the Partnership entered into an Equity Distribution Agreement under its July 2013 Shelf (the “August 2013 EDA”) with Citigroup, Deutsche Bank, Morgan Stanley & Co. LLC, Raymond James, RBC Capital Markets, LLC, UBS and Wells Fargo Securities, LLC, as its sales agents, pursuant to which it may sell, at its option, up to an aggregate of $400 million of its common units. During the year ended December 31, 2013,
the Partnership issued 4,529,641 common units under the August 2013 EDA, receiving net proceeds of $225.6 million, which were used to reduce borrowings under the Partnership’s TRP Revolver and for general partnership purposes. We contributed $4.7
million to maintain our 2% general partner interest. Based upon market conditions and the Partnership’s capital needs, the Partnership at its option, can sell additional common units up to an aggregate amount of $172.0 million under this agreement.
During the year ended December 31, 2013, pursuant to both the 2012 Shelf and 2013 Shelf, the Partnership issued a total of 11,154,438 common units representing total net proceeds of $517.9 million, which were used to reduce borrowings under the TRP Revolver and for general partnership purposes. We contributed $10.8 million to the Partnership to maintain our 2% general partner interest during this period.
Recent Accounting Pronouncements
In January 2013, the Financial Accounting Standards Board (“FASB”) issued Accounting Standards Update (“ASU”) No. 2013-01,
Balance Sheet (Topic 210): Clarifying the Scope of Disclosures about Offsetting Assets and Liabilities,
which clarifies that ASU No. 2011-11,
Balance Sheet (Topic 210): Disclosures about Offsetting Assets and Liabilities,
applies to financial instruments or derivative transactions accounted for under Accounting Standards Codification (“ASC”) Topic 815. We currently present the Partnership’s derivative assets and liabilities gross on our statement of financial position. The amendments require disclosure of both gross and net amounts of derivative assets and liabilities that are subject to master netting arrangements with counterparties. We have provided additional disclosures regarding the gross and net amounts of derivative assets and liabilities in Note 14 of the “Consolidated Financial Statements.”
In February 2013, the FASB issued ASU No. 2013-02,
Comprehensive Income (Topic 220): Reporting of Amounts Reclassified Out of Accumulated Other Comprehensive Income
. The amendment, required to be applied prospectively for reporting periods beginning after December 15, 2012, requires entities to present, either on the face of the statement where net income is presented or in the notes, significant amounts reclassified out of accumulated other comprehensive income by the respective line item of net income. Our financial statement presentation complies with this standards update.
Factors That Significantly Affect the Partnership’s Results
The Partnership’s results of operations are substantially impacted by the volumes that move through its gathering, processing and logistics assets, changes in commodity prices, contract terms, the impact of hedging activities and the cost to operate and support assets.
Volumes
In the Partnership’s gathering and processing operations, plant inlet volumes and capacity utilization rates generally are driven by wellhead production and the Partnership’s competitive and contractual position on a regional basis and more broadly by the impact of prices for oil, natural gas and NGLs on exploration and production activity in the areas of the Partnership’s operations. The factors that impact the gathering and processing volumes also impact the total volumes that flow to the Downstream Business. In addition, fractionation volumes are also affected by the location of the resulting mixed NGLs, available pipeline capacity to transport NGLs to the Partnership’s fractionators and its competitive and contractual position relative to other fractionators.
Commodity Prices
The following table presents selected annual and quarterly industry index prices for natural gas, selected NGL products and crude oil for the periods presented:
|
Average Quarterly & Annual Prices
|
Natural Gas $/MMBtu (1)
|
Illustrative Targa NGL
$/gal (2)
|
Crude Oil $/Bbl (3)
|
|||||||||
|
2013
|
|
|
|
|||||||||
|
4th Quarter
|
$
|
3.61
|
$
|
0.92
|
$
|
97.50
|
||||||
|
3rd Quarter
|
3.58
|
0.86
|
105.82
|
|||||||||
|
2nd Quarter
|
4.10
|
0.81
|
94.23
|
|||||||||
|
1st Quarter
|
3.34
|
0.86
|
94.35
|
|||||||||
|
2013 Average
|
$
|
3.65
|
$
|
0.86
|
$
|
97.98
|
||||||
|
|
||||||||||||
|
2012
|
||||||||||||
|
4th Quarter
|
$
|
3.41
|
$
|
0.88
|
$
|
88.23
|
||||||
|
3rd Quarter
|
2.80
|
0.86
|
92.20
|
|||||||||
|
2nd Quarter
|
2.21
|
0.94
|
93.35
|
|||||||||
|
1st Quarter
|
2.72
|
1.18
|
103.03
|
|||||||||
|
2012 Average
|
$
|
2.79
|
$
|
0.97
|
$
|
94.20
|
||||||
|
|
||||||||||||
|
2011
|
||||||||||||
|
4th Quarter
|
$
|
3.54
|
$
|
1.37
|
$
|
91.88
|
||||||
|
3rd Quarter
|
4.20
|
1.37
|
89.54
|
|||||||||
|
2nd Quarter
|
4.32
|
1.36
|
102.34
|
|||||||||
|
1st Quarter
|
4.11
|
1.23
|
94.60
|
|||||||||
|
2011 Average
|
$
|
4.04
|
$
|
1.33
|
$
|
94.59
|
||||||
| (1) | Natural gas prices are based on average quarterly and annual prices from Henry Hub I-FERC commercial index prices. |
| (2) | NGL prices are based on quarterly and annual averages of prices from Mont Belvieu Non-TET monthly commercial index prices. Illustrative Targa NGL contains 44% ethane, 30% propane, 11% natural gasoline, 5% isobutane and 10% normal butane. |
| (3) | Crude oil prices are based on quarterly and annual averages of daily prices from West Texas Intermediate commercial index prices as measured on the NYMEX. |
Contract Terms, Contract Mix and the Impact of Commodity Prices
Because of the potential for significant volatility of natural gas and NGL prices, the contract mix of the Partnership’s Gathering and Processing division, other than fee-based contracts in Badlands and certain other gathering and processing services, can have a material impact on its profitability, especially those contracts that create direct exposure to changes in energy prices by paying the Partnership for gathering and processing services with a portion of the commodities handled (“equity volumes”).
Contract terms in the Gathering and Processing division are based upon a variety of factors, including natural gas and crude quality, geographic location, competitive commodities and the pricing environment at the time the contract is executed, and customer requirements. The Partnership’s gathering and processing contract mix and, accordingly, their exposure to crude, natural gas and NGL prices may change as a result of producer preferences, competition and changes in production as wells decline at different rates or are added, their expansion into regions where different types of contracts are more common and other market factors. For example, the Partnership’s Badlands crude and natural gas contracts are essentially 100% fee-based.
The contract terms and contract mix of our Downstream Business can also have a significant impact on the Partnership’s results of operations. During periods of low relative demand for available fractionation capacity, rates were low and frac-or-pay contracts were not readily available. The current demand for fractionation services has grown resulting in increases in fractionation fees and contract term. In addition, reservation fees are required. Increased demand for export services also supports fee-based contracts. Contracts in the Logistics Assets segment are primarily fee-based arrangements while the Marketing and Distribution segment includes both fee-based and percent-of-proceeds contracts.
Impact of the Partnership’s Commodity Price Hedging Activities
In an effort to reduce the variability of its cash flows, the Partnership has hedged the commodity price associated with a portion of its expected natural gas equity volumes through 2016 and NGL and condensate equity volumes through 2014 by entering into derivative financial instruments including swaps. With these arrangements, the Partnership has attempted to mitigate some of its exposure to commodity price movements with respect to its forecasted volumes for these periods. The Partnership also actively manages the Downstream Business product inventory and other working capital levels to reduce exposure to changing NGL prices. For additional information regarding the Partnership’s hedging activities, see “Item 7A. Quantitative and Qualitative Disclosures About Market Risk—Commodity Price Risk.”
Operating Expenses
Variable costs such as fuel, utilities, power, service and repairs can impact the Partnership’s results as volumes fluctuate through its systems. Continued expansion of existing assets will also give rise to additional operating expenses, which will affect the Partnership’s results. The employees supporting the Partnership’s operations are employees of Targa Resources LLC, a Delaware limited liability company, and an indirect wholly-owned subsidiary of us. The Partnership reimburses us for the payment of certain operating expenses, including compensation and benefits of operating personnel assigned to the Partnership’s assets.
General and Administrative Expenses
We perform centralized corporate functions for the Partnership, such as legal, accounting, treasury, insurance, risk management, health, safety, environmental, information technology, human resources, credit, payroll, internal audit, taxes engineering and marketing. Other than our direct costs of being a separate public reporting company, these costs are reimbursed by the Partnership.
See “Item 13. Certain Relationships and Related Transactions, and Director Independence.”
General Trends and Outlook
We expect the midstream energy business environment to continue to be affected by the following key trends: demand for the Partnership’s services, commodity prices, volatile capital markets and increased regulation. These expectations are based on assumptions made by us and information currently available to us. To the extent our underlying assumptions about or interpretations of available information prove to be incorrect, the Partnership’s actual results may vary materially from our expected results.
Demand for the Partnership’s Services
Fluctuations in energy prices can affect production rates and investments by third parties in the development of oil and natural gas reserves. Generally, drilling and production activity will increase as energy prices increase. We believe that the current strength of oil, condensate and NGL prices as compared to natural gas prices has caused producers in and around the Partnership’s gathering and processing areas of operation to focus their drilling programs on regions rich in liquid forms of hydrocarbons. This focus is reflected in increased drilling permits and higher rig counts in these areas, and we expect these activities to lead to higher natural gas and crude oil volumes in the Field Gathering and Processing segment over the next several years. While we expect demand for the Partnership’s NGL products to remain strong, a reduction in demand for NGL products or a significant increase in NGL product supply relative to this demand, could impact the Partnership’s business. Increases in demand for international grade propane, along with expansion in the petrochemical industry, which relies on ethane as a feedstock, point towards sustained demand for the Partnership’s terminaling and storage services in the Downstream Business. Producer activity in areas rich in oil, condensate and NGLs is currently generating increased demand for the Partnership’s fractionation services and for related fee-based services provided by the Downstream Business. While we expect development activity to remain robust with respect to oil and liquids-rich gas development and production, currently depressed natural gas prices have resulted in reduced activity levels surrounding comparatively dry natural gas reserves, whether conventional or unconventional.
Commodity Prices
There has been, and we believe there will continue to be, significant volatility in commodity prices and in the relationships among NGL, crude oil and natural gas prices. In addition, the volatility and uncertainty of natural gas, crude oil and NGL prices impact drilling, completion and other investment decisions by producers and ultimately supply to the Partnership’s systems.
The Partnership’s operating income generally improves in an environment of higher natural gas, NGL and condensate prices, primarily as a result of its percent-of-proceeds contracts. The Partnership’s processing profitability is largely dependent upon pricing, the supply of and market demand for natural gas, NGLs and condensate, which are beyond its control and have been volatile. In a declining commodity price environment, without taking into account the Partnership’s hedges, the Partnership will realize a reduction in cash flows under its percent-of-proceeds contracts proportionate to average price declines. The Partnership has attempted to mitigate its exposure to commodity price movements by entering into hedging arrangements. For additional information regarding the Partnership’s hedging activities, see “Item 7A. Quantitative and Qualitative Disclosures about Market Risk—Commodity Price Risk.”
Volatile Capital Markets
The Partnership is dependent on its abilities to access equity and debt capital markets in order to fund acquisitions and expansion expenditures. Global financial markets have been, and are expected to continue to be, volatile and disrupted and weak economic conditions may cause a significant decline in commodity prices. As a result, we and the Partnership may be unable to raise equity or debt capital on satisfactory terms, or at all, which may negatively impact the timing and extent to which we and the Partnership execute growth plans. Prolonged periods of low commodity prices or volatile capital markets may impact our and the Partnership’s ability or willingness to enter into new hedges, fund organic growth, connect to new supplies of natural gas, execute acquisitions or implement expansion capital expenditures.
Increased Regulation
Additional regulation in various areas has the potential to materially impact the Partnership’s operations and financial condition. For example, increased regulation of hydraulic fracturing used by producers may cause reductions in supplies of natural gas, NGLs, and crude oil from producers. Please read “Risk Factors—Increased regulation of hydraulic fracturing could result in reductions or delays in drilling and completing new oil and natural gas wells, which could adversely impact the Partnership’s revenues by decreasing the volumes of natural gas, NGLs or crude oil through its facilities and reducing the utilization of its assets.” Similarly, the forthcoming rules and regulations of the CFTC may limit the Partnership’s ability or increase the cost to use derivatives, which could create more volatility and less predictability in its results of operations. Please read “Risk Factors—The recent adoption of derivatives legislation by the United States Congress could have an adverse effect on the Partnership’s ability to use derivative instruments to reduce the effect of commodity price, interest rate and other types of risks associated with its business.”
How We Evaluate Our Operations
Our consolidated operations include the operations of the Partnership due to our ownership and control of the general partner. We currently have no direct operating activities separate from those conducted by the Partnership. Our financial results differ from the Partnership’s due to the financial effects of: noncontrolling interests in the Partnership, our separate debt obligations, certain non-operating costs associated with assets and liabilities that we retained and were not included in asset conveyances to the Partnership, and certain general and administrative costs applicable to us as a separate public company. Management’s primary measure of analyzing our performance is the non-GAAP measure distributable cash flow.
Distributable Cash Flow
We define distributable cash flow as distributions due to us from the Partnership, less our specific general and administrative costs as a separate public reporting entity, the interest carry costs associated with our debt and taxes attributable to our earnings. Distributable cash flow is a significant performance metric used by us and by external users of our financial statements, such as investors, commercial banks, research analysts and others to compare basic cash flows generated by us to the cash dividends we expect to pay our shareholders. Using this metric, management and external users of our financial statements can quickly compute the coverage ratio of estimated cash flows to planned cash dividends. Distributable cash flow is also an important financial measure for our shareholders since it serves as an indicator of our success in providing a cash return on investment. Specifically, this financial measure indicates to investors
whether or not we are generating cash flow at a level that can sustain or support an increase in our quarterly dividend rates. Distributable cash flow is also a quantitative standard used throughout the investment community because the share value is generally determined by the share’s yield (which in turn is based on the amount of cash dividends the entity pays to a shareholder).
The economic substance behind our use of distributable cash flow is to measure the ability of our assets to generate cash flow sufficient to pay dividends to our investors.
The GAAP measure most directly comparable to distributable cash flow is net income. Distributable cash flow should not be considered as an alternative to GAAP net income. Distributable cash flow is not a presentation made in accordance with GAAP and has important limitations as an analytical tool. Investors should not consider distributable cash flow in isolation or as a substitute for analysis of our results as reported under GAAP. Because distributable cash flow excludes some, but not all, items that affect net income and is defined differently by different companies in our industry, our definition of distributable cash flow may not be comparable to similarly titled measures of other companies, thereby diminishing its utility.
Our Non-GAAP Measures
Management compensates for the limitations of distributable cash flow as an analytical tool by reviewing the comparable GAAP measure, understanding the differences between the measures and incorporating these insights into its decision making process.
|
|
2013
|
2012
|
2011
|
|||||||||
|
|
(In millions)
|
|||||||||||
|
Reconciliation of Net Income attributable to Targa Resources Corp. to Distributable Cash Flow
|
|
|
|
|||||||||
|
Net income of Targa Resources Corp.
|
$
|
201.3
|
$
|
159.3
|
$
|
215.4
|
||||||
|
Less: Net income of Targa Resources Partners LP
|
(258.6
|
)
|
(203.2
|
)
|
(245.5
|
)
|
||||||
|
Net loss for TRC Non-Partnership
|
(57.3
|
)
|
(43.9
|
)
|
(30.1
|
)
|
||||||
|
TRC Non-Partnership income tax expense
|
45.3
|
32.7
|
22.3
|
|||||||||
|
Distributions from the Partnership
|
149.0
|
103.3
|
66.9
|
|||||||||
|
Non-cash loss (gain) on hedges
|
0.3
|
(2.2
|
)
|
(4.4
|
)
|
|||||||
|
Loss on debt redemptions and amendments
|
-
|
0.2
|
-
|
|||||||||
|
Depreciation - Non-Partnership assets
|
0.3
|
0.3
|
2.8
|
|||||||||
|
Current cash tax expense (1)
|
(31.0
|
)
|
(20.8
|
)
|
(7.4
|
)
|
||||||
|
Taxes funded with cash on hand (2)
|
10.0
|
8.7
|
10.1
|
|||||||||
|
Distributable cash flow
|
$
|
116.6
|
$
|
78.3
|
$
|
60.2
|
||||||
| (1) | Excludes $4.7 million of non-cash current tax expense arising from amortization of deferred long-term tax assets from drop down gains realized for tax purposes and paid in 2010 for the years ended December 31, 2013, 2012, and 2011 and includes 2012 cash tax overpayment applied to 2013 cash tax liability. |
| (2) | Current period portion of amount established at our IPO to fund taxes on deferred gains related to drop down transactions that were treated as sales for income tax purposes. |
|
|
2013
|
2012
|
2011
|
|||||||||
|
|
(In millions)
|
|||||||||||
|
Targa Resources Corp. Distributable Cash Flow
|
|
|
||||||||||
|
Distributions declared by Targa Resources Partners LP associated with:
|
|
|||||||||||
|
General Partner Interests
|
$
|
8.4
|
$
|
6.2
|
$
|
4.8
|
||||||
|
Incentive Distribution Rights
|
103.1
|
63.3
|
34.4
|
|||||||||
|
Common Units
|
37.5
|
33.8
|
27.7
|
|||||||||
|
Total distributions declared by Targa Resources Partners LP
|
149.0
|
103.3
|
66.9
|
|||||||||
|
Income (expenses) of TRC Non-Partnership
|
||||||||||||
|
General and administrative expenses
|
(8.4
|
)
|
(8.2
|
)
|
(8.3
|
)
|
||||||
|
Interest expense, net
|
(3.1
|
)
|
(4.0
|
)
|
(4.0
|
)
|
||||||
|
Current cash tax expense (1)
|
(31.0
|
)
|
(20.8
|
)
|
(7.4
|
)
|
||||||
|
Taxes funded with cash on hand (2)
|
10.0
|
8.7
|
10.1
|
|||||||||
|
Other income (expense)
|
0.1
|
(0.7
|
)
|
2.9
|
||||||||
|
Distributable cash flow
|
$
|
116.6
|
$
|
78.3
|
$
|
60.2
|
||||||
| (1) | Excludes $4.7 million of non-cash current tax expense arising from amortization of deferred long-term tax assets from drop down gains realized for tax purposes and paid in 2010 for the years ended December 31, 2013, 2012 and 2011, and includes 2012 cash tax overpayment applied to 2013 cash tax liability. |
| (2) | Current period portion of amount established at our IPO to fund taxes on deferred gains related to drop down transactions that were treated as sales for income tax purposes. |
How We Evaluate the Partnership’s Operations
The Partnership’s profitability is a function of the difference between: (i) the revenues the Partnership receives from its operations, including fee-based revenues from services and revenues from the natural gas, NGLs and condensate the Partnership sells, and (ii) the costs associated with conducting the Partnership’s operations, including the costs of wellhead natural gas and mixed NGLs that the Partnership purchases as well as operating, general and administrative costs and the impact of commodity hedging activities. Because commodity price movements tend to impact both revenues and costs, increases or decreases in the Partnership’s revenues alone are not necessarily indicative of increases or decreases in its profitability. The Partnership’s contract portfolio, the prevailing pricing environment for crude oil, natural gas and NGLs, and the volumes of crude oil, natural gas and NGL throughput on its systems are important factors in determining its profitability. The Partnership’s profitability is also affected by the NGL content in gathered wellhead natural gas, supply and demand for its products and services, utilization of its assets and changes in its customer mix.
The Partnership’s profitability is also impacted by fee-based revenues. The Partnership’s growth strategy, based on expansion of existing facilities as well as third-party acquisitions of businesses and assets, has been increasing the percentage of our revenues that are fee-based. Fixed fees for services such as fractionation, storage, terminaling and crude oil gathering are not directly tied to changes in market prices for commodities.
Management uses a variety of financial measures and operational measurements to analyze the Partnership’s performance. These include: (1) throughput volumes, facility efficiencies and fuel consumption, (2) operating expenses, (3) capital expenditures and (4) the following non-GAAP measures: —gross margin, operating margin, adjusted EBITDA and distributable cash flow.
Throughput Volumes, Facility Efficiencies and Fuel Consumption
The Partnership’s profitability is impacted by its ability to add new sources of natural gas supply and crude oil supply to offset the natural decline of existing volumes from oil and natural gas wells that are connected to its gathering and processing systems. This is achieved by connecting new wells and adding new volumes in existing areas of production, as well as by capturing crude oil and natural gas supplies currently gathered by third-parties. Similarly, the Partnership’s profitability is impacted by its ability to add new sources of mixed NGL supply, typically connected by third-party transportation, to its Downstream Business’ fractionation facilities. The Partnership fractionates NGLs generated by its gathering and processing plants, as well as by contracting for mixed NGL supply from third-party facilities.
In addition, the Partnership seeks to increase operating margin by limiting volume losses, reducing fuel consumption and by increasing efficiency. With its gathering systems’ extensive use of remote monitoring capabilities, the Partnership monitors the volumes received at the wellhead or central delivery points along its gathering systems, the volume of natural gas received at its processing plant inlets and the volumes of NGLs and residue natural gas recovered by its processing plants. The Partnership also monitors the volumes of NGLs received, stored, fractionated and delivered across its logistics assets. This information is tracked through its processing plants and Downstream Business facilities to determine customer settlements for sales and volume related fees for service and helps the Partnership increase efficiency and reduces fuel consumption.
As part of monitoring the efficiency of its operations, the Partnership measures the difference between the volume of natural gas received at the wellhead or central delivery points on its gathering systems and the volume received at the inlet of its processing plants as an indicator of fuel consumption and line loss. The Partnership also tracks the difference between the volume of natural gas received at the inlet of the processing plant and the NGLs and residue gas produced at the outlet of such plant to monitor the fuel consumption and recoveries of its facilities. Similar tracking is performed for its crude oil gathering and logistics assets. These volume, recovery and fuel consumption measurements are an important part of the Partnership’s operational efficiency analysis and safety programs.
Operating Expenses
Operating expenses are costs associated with the operation of specific assets. Labor, contract services, repair and maintenance, utilities and ad valorem taxes comprise the most significant portion of the Partnership’s operating expenses. These expenses, other than fuel and power, generally remain relatively stable and independent of the volumes through its systems but fluctuate depending on the scope of the activities performed during a specific period.
Capital Expenditures
Capital projects associated with growth and maintenance projects are closely monitored. Return on investment is analyzed before a capital project is approved, spending is closely monitored throughout the development of the project, and the subsequent operational performance is compared to the assumptions used in the economic analysis performed for the capital investment approval. The Partnership has seen a substantial increase in its total capital spent over the last three years and currently has significant internal growth projects that it closely monitors.
Gross Margin
The Partnership defines gross margin as revenues less purchases. It is impacted by volumes and commodity prices as well as by the Partnership’s contract mix and commodity hedging program. The Partnership defines Gathering and Processing gross margin as total operating revenues from (1) the sale of natural gas, condensate and NGLs (2) natural gas and crude oil gathering and service fee revenues and (3) settlement gains and losses on commodity hedges, less product purchases, which consist primarily of producer payments and other natural gas purchases. Logistics Assets gross margin consists primarily of service fee revenue. Gross margin for Marketing and Distribution equals total revenue from service fees, NGL and natural gas sales, less cost of sales, which consists primarily of NGL and natural gas purchases, transportation costs and changes in inventory valuation. The gross margin impacts of cash flow hedge settlements are reported in Other.
Operating Margin
The Partnership defines operating margin as gross margin less operating expenses. Operating margin is an important performance measure of the core profitability of the Partnership’s operations.
Management reviews business segment gross margin and operating margin monthly as a core internal management process. We believe that investors benefit from having access to the same financial measures that management uses in evaluating the Partnership’s operating results. Gross margin and operating margin provide useful information to investors because they are used as supplemental financial measures by management and by external users of the Partnership’s financial statements, including investors and commercial banks, to assess:
|
·
|
the financial performance of the Partnership’s assets without regard to financing methods, capital structure or historical cost basis; |
|
·
|
the Partnership’s operating performance and return on capital as compared to other companies in the midstream energy sector, without regard to financing or capital structure; and |
|
·
|
the viability of acquisitions and capital expenditure projects and the overall rates of return on alternative investment opportunities. |
Gross margin and operating margin are non-GAAP measures. The GAAP measure most directly comparable to gross margin and operating margin is net income. Gross margin and operating margin are not alternatives to GAAP net income and have important limitations as analytical tools. Investors should not consider gross margin and operating margin in isolation or as a substitute for analysis of the Partnership’s results as reported under GAAP. Because gross margin and operating margin exclude some, but not all, items that affect net income and are defined differently by different companies in our industry, the Partnership’s definition of gross margin and operating margin may not be comparable to similarly titled measures of other companies, thereby diminishing their utility.
Management compensates for the limitations of gross margin and operating margin as analytical tools by reviewing the comparable GAAP measures, understanding the differences between the measures and incorporating these insights into its decision-making processes.
Adjusted EBITDA
The Partnership defines Adjusted EBITDA as net income attributable to Targa Resources Partners LP before: interest; income taxes; depreciation and amortization; gains or losses on debt repurchases and redemptions, early debt extinguishments and asset disposals; non-cash risk management activities related to derivative instruments; changes in the fair value of the Badlands acquisition contingent consideration and the non-controlling interest portion of depreciation and amortization expenses. Adjusted EBITDA is used as a supplemental financial measure by the Partnership and by external users of its financial statements such as investors, commercial banks and others. The economic substance behind the Partnership’s use of Adjusted EBITDA is to measure the ability of its assets to generate cash sufficient to pay interest costs, support its indebtedness and make distributions to its investors.
Adjusted EBITDA is a non-GAAP financial measure. The GAAP measures most directly comparable to Adjusted EBITDA are net cash provided by operating activities and net income attributable to Targa Resources Partners LP. Adjusted EBITDA should not be considered as an alternative to GAAP net cash provided by operating activities or GAAP net income. Adjusted EBITDA has important limitations as an analytical tool. Investors should not consider Adjusted EBITDA in isolation or as a substitute for analysis of the Partnership’s results as reported under GAAP. Because Adjusted EBITDA excludes some, but not all, items that affect net income and net cash provided by operating activities and is defined differently by different companies in the Partnership’s industry, the Partnership’s definition of Adjusted EBITDA may not be comparable to similarly titled measures of other companies, thereby diminishing its utility.
Management compensates for the limitations of Adjusted EBITDA as an analytical tool by reviewing the comparable GAAP measures, understanding the differences between the measures and incorporating these insights into its decision-making processes.
Distributable Cash Flow
The Partnership defines distributable cash flow as net income attributable to Targa Resources Partners LP plus depreciation and amortization, deferred taxes and amortization of debt issue costs included in interest expense, adjusted for non-cash risk management activities related to derivative instruments, debt repurchases and redemptions, early debt extinguishments and asset disposals, less maintenance capital expenditures (net of any reimbursements of project costs) and changes in the fair value of the Badlands acquisition contingent consideration. This measure includes any impact of noncontrolling interests.
Distributable cash flow is a significant performance metric used by the Partnership and by external users of the Partnership’s financial statements, such as investors, commercial banks and research analysts, to compare basic cash flows generated by the Partnership (prior to the establishment of any retained cash reserves by the board of directors of its general partner) to the cash distributions the Partnership expects to pay the Partnership’s unitholders. Using this metric, the Partnership’s management and external users of its financial statements can quickly compute the coverage ratio of estimated cash flows to cash distributions. Distributable cash flow is also an important financial measure for the Partnership’s unitholders since it serves as an indicator of the Partnership’s success in providing a cash return on investment. Specifically, this financial measure indicates to investors whether or not the Partnership is generating cash flow at a level that can sustain or support an increase in the Partnership’s quarterly distribution rates. Distributable cash flow is also a quantitative standard used throughout the investment community with respect to publicly-traded partnerships and limited liability companies because the value of a unit of such an entity is generally determined by the unit’s yield (which in turn is based on the amount of cash distributions the entity pays to a unitholder).
Distributable cash flow is a non-GAAP financial measure. The GAAP measure most directly comparable to distributable cash flow is net income attributable to Targa Resources Partners LP. Distributable cash flow should not be considered as an alternative to GAAP net income attributable to Targa Resources Partners LP. It has important limitations as an analytical tool. Investors should not consider distributable cash flow in isolation or as a substitute for analysis of the Partnership’s results as reported under GAAP. Because distributable cash flow excludes some, but not all, items that affect net income and is defined differently by different companies in the Partnership’s industry, the Partnership’s definition of distributable cash flow may not be comparable to similarly titled measures of other companies, thereby diminishing its utility.
Management compensates for the limitations of distributable cash flow as an analytical tool by reviewing the comparable GAAP measure, understanding the differences between the measures and incorporating these insights into its decision-making processes.
Non-GAAP Financial Measures of the Partnership
The following tables reconcile the non-GAAP financial measures of the Partnership used by management to the most directly comparable GAAP measures for the periods indicated:
|
|
2013
|
2012
|
2011
|
|||||||||
|
|
(In millions)
|
|||||||||||
|
Reconciliation of Targa Resources Partners LP gross margin and operating margin to net income:
|
|
|
|
|||||||||
|
Gross margin
|
$
|
1,177.7
|
$
|
1,004.7
|
$
|
948.1
|
||||||
|
Operating expenses
|
(376.2
|
)
|
(313.0
|
)
|
(287.0
|
)
|
||||||
|
Operating margin
|
801.5
|
691.7
|
661.1
|
|||||||||
|
Depreciation and amortization expenses
|
(271.6
|
)
|
(197.3
|
)
|
(178.2
|
)
|
||||||
|
General and administrative expenses
|
(143.1
|
)
|
(131.6
|
)
|
(127.8
|
)
|
||||||
|
Interest expense, net
|
(131.0
|
)
|
(116.8
|
)
|
(107.7
|
)
|
||||||
|
Income tax expense
|
(2.9
|
)
|
(4.2
|
)
|
(4.3
|
)
|
||||||
|
Loss on sale or disposition of assets
|
(3.9
|
)
|
(15.6
|
)
|
(0.2
|
)
|
||||||
|
Loss on debt redemptions and amendments
|
(14.7
|
)
|
(12.8
|
)
|
-
|
|||||||
|
Change in contingent consideration
|
15.3
|
-
|
-
|
|||||||||
|
Other, net
|
9.0
|
(10.2
|
)
|
2.6
|
||||||||
|
Targa Resources Partners LP net income
|
$
|
258.6
|
$
|
203.2
|
$
|
245.5
|
||||||
|
|
2013
|
2012
|
2011
|
|||||||||
|
|
(In millions)
|
|||||||||||
|
Reconciliation of net cash provided by Targa Resources Partners LP operating activities to Adjusted EBITDA:
|
|
|
|
|||||||||
|
Net cash provided by operating activities
|
$
|
411.4
|
$
|
465.4
|
$
|
400.9
|
||||||
|
Net income attributable to noncontrolling interests
|
(25.1
|
)
|
(28.6
|
)
|
(41.0
|
)
|
||||||
|
Interest expense, net (1)
|
115.5
|
99.2
|
95.3
|
|||||||||
|
Loss on debt redemptions and amendments
|
(14.7
|
)
|
(12.8
|
)
|
-
|
|||||||
|
Change in contingent consideration
|
(15.3
|
)
|
-
|
-
|
||||||||
|
Current income tax expense
|
2.0
|
2.5
|
3.5
|
|||||||||
|
Other (2)
|
(5.0
|
)
|
(6.4
|
)
|
7.9
|
|||||||
|
Changes in operating assets and liabilities which used (provided) cash:
|
||||||||||||
|
Accounts receivable and other assets
|
230.3
|
(96.1
|
)
|
150.3
|
||||||||
|
Accounts payable and other liabilities
|
(69.9
|
)
|
91.7
|
(126.1
|
)
|
|||||||
|
Targa Resources Partners LP Adjusted EBITDA
|
$
|
629.2
|
$
|
514.9
|
$
|
490.8
|
||||||
| (1) | N et of amortization of debt issuance costs, discount and premium included in interest expense of $15.5 million, $17.6 million and $12.4 million for 2013, 2012 and 2011. |
| (2) | Includes equity earnings from unconsolidated investments – net of distributions, accretion expense associated with asset retirement obligations, amortization of stock-based compensation and gain on sale or disposal of assets. |
|
|
2013
|
2012
|
2011
|
|||||||||
|
|
(In millions)
|
|||||||||||
|
|
|
|
||||||||||
|
Reconciliation of Net Income attributable to Targa Resources Partners LP to Adjusted EBITDA:
|
|
|
|
|||||||||
|
Net income attributable to Targa Resources Partners LP
|
$
|
233.5
|
$
|
174.6
|
$
|
204.5
|
||||||
|
Interest expense, net
|
131.0
|
116.8
|
107.7
|
|||||||||
|
Income tax expense
|
2.9
|
4.2
|
4.3
|
|||||||||
|
Depreciation and amortization expenses
|
271.6
|
197.3
|
178.2
|
|||||||||
|
Loss on sale or disposition of assets
|
3.9
|
15.6
|
-
|
|||||||||
|
Loss on debt redemptions and amendments
|
14.7
|
12.8
|
-
|
|||||||||
|
Change in contingent consideration
|
(15.3
|
)
|
-
|
-
|
||||||||
|
Risk management activities
|
(0.5
|
)
|
5.4
|
7.2
|
||||||||
|
Noncontrolling interests adjustment (1)
|
(12.6
|
)
|
(11.8
|
)
|
(11.1
|
)
|
||||||
|
Targa Resources Partners LP Adjusted EBITDA
|
$
|
629.2
|
$
|
514.9
|
$
|
490.8
|
||||||
| (1) | Noncontrolling interest portion of depreciation and amortization expenses. |
|
|
2013
|
2012
|
2011
|
|||||||||
|
|
(In millions)
|
|||||||||||
|
Reconciliation of Net Income attributable to Targa Resources Partners LP to Distributable Cash flow:
|
|
|
|
|||||||||
|
Net income attributable to Targa Resources Partners LP
|
$
|
233.5
|
$
|
174.6
|
$
|
204.5
|
||||||
|
Depreciation and amortization expenses
|
271.6
|
197.3
|
178.2
|
|||||||||
|
Deferred income tax expense
|
0.9
|
1.7
|
0.8
|
|||||||||
|
Amortization in interest expense
|
15.5
|
17.6
|
12.4
|
|||||||||
|
Loss on debt redemptions and amendments
|
14.7
|
12.8
|
-
|
|||||||||
|
Change in contingent consideration
|
(15.3
|
)
|
-
|
-
|
||||||||
|
Loss on sale or disposition of assets
|
3.9
|
15.6
|
-
|
|||||||||
|
Risk management activities
|
(0.5
|
)
|
5.4
|
7.2
|
||||||||
|
Maintenance capital expenditures
|
(79.9
|
)
|
(67.6
|
)
|
(81.8
|
)
|
||||||
|
Other (1)
|
(4.1
|
)
|
(3.5
|
)
|
15.4
|
|||||||
|
Targa Resources Partners LP distributable cash flow
|
$
|
440.3
|
$
|
353.9
|
$
|
336.7
|
||||||
| (1) | Includes the noncontrolling interest portion of maintenance capital expenditures, depreciation and amortization expenses. |
Financial Information – Partnership versus Non-Partnership
As a supplement to the financial statements included in this Annual Report, we present the following tables, which segregate our consolidated balance sheet, results of operations and statement of cash flows between Partnership and Non-Partnership activities. Partnership results are presented on a common control accounting basis – the same basis reported in the Partnership’s Annual Report on Form 10-K. Except when otherwise noted, the remainder of this management’s discussion and analysis refers to these disaggregated results.
Balance Sheets – Partnership versus Non-Partnership
|
|
December 31, 2013
|
December 31, 2012
|
||||||||||||||||||||||
|
|
Targa Resources Corp. Consolidated
|
Targa Resources Partners LP
|
TRC - Non-Partnership
|
Targa Resources Corp. Consolidated
|
Targa Resources Partners LP
|
TRC - Non-Partnership
|
||||||||||||||||||
|
|
(In millions)
|
|||||||||||||||||||||||
|
ASSETS
|
|
|
|
|
|
|
||||||||||||||||||
|
Current assets:
|
|
|
|
|
|
|
||||||||||||||||||
|
Cash and cash equivalents (1)
|
$
|
66.7
|
$
|
57.5
|
$
|
9.2
|
$
|
76.3
|
$
|
68.0
|
$
|
8.3
|
||||||||||||
|
Trade receivables, net
|
658.8
|
658.6
|
0.2
|
514.9
|
514.9
|
-
|
||||||||||||||||||
|
Inventory
|
150.7
|
150.7
|
-
|
99.4
|
99.4
|
-
|
||||||||||||||||||
|
Deferred income taxes (2)
|
0.1
|
-
|
0.1
|
-
|
-
|
-
|
||||||||||||||||||
|
Assets from risk management activities
|
2.0
|
2.0
|
-
|
29.3
|
29.3
|
-
|
||||||||||||||||||
|
Other current assets (1)
|
18.9
|
7.1
|
11.8
|
13.4
|
3.3
|
10.1
|
||||||||||||||||||
|
Total current assets
|
897.2
|
875.9
|
21.3
|
733.3
|
714.9
|
18.4
|
||||||||||||||||||
|
Property, plant and equipment, at cost (1)
|
5,758.4
|
5,751.6
|
6.8
|
4,708.0
|
4,701.2
|
6.8
|
||||||||||||||||||
|
Accumulated depreciation
|
(1,408.5
|
)
|
(1,406.2
|
)
|
(2.3
|
)
|
(1,170.0
|
)
|
(1,168.0
|
)
|
(2.0
|
)
|
||||||||||||
|
Property, plant and equipment, net
|
4,349.9
|
4,345.4
|
4.5
|
3,538.0
|
3,533.2
|
4.8
|
||||||||||||||||||
|
Other Intangible assets, net
|
653.4
|
653.4
|
-
|
680.8
|
680.8
|
-
|
||||||||||||||||||
|
Long-term assets from risk management activities
|
3.1
|
3.1
|
-
|
5.1
|
5.1
|
-
|
||||||||||||||||||
|
Other long-term assets (2)
|
145.0
|
93.6
|
51.4
|
147.8
|
91.7
|
56.1
|
||||||||||||||||||
|
Total assets
|
$
|
6,048.6
|
$
|
5,971.4
|
$
|
77.2
|
$
|
5,105.0
|
$
|
5,025.7
|
$
|
79.3
|
||||||||||||
|
|
||||||||||||||||||||||||
|
LIABILITIES AND OWNERS' EQUITY
|
||||||||||||||||||||||||
|
Current liabilities:
|
||||||||||||||||||||||||
|
Accounts payable and accrued liabilities (3)
|
$
|
761.8
|
$
|
721.2
|
$
|
40.6
|
$
|
679.0
|
$
|
639.8
|
$
|
39.2
|
||||||||||||
|
Affiliate payable (receivable) (4)
|
-
|
52.4
|
(52.4
|
)
|
-
|
61.4
|
(61.4
|
)
|
||||||||||||||||
|
Deferred income taxes (5)
|
0.6
|
-
|
0.6
|
0.2
|
-
|
0.2
|
||||||||||||||||||
|
Liabilities from risk management activities
|
8.0
|
8.0
|
-
|
7.4
|
7.4
|
-
|
||||||||||||||||||
|
Total current liabilities
|
770.4
|
781.6
|
(11.2
|
)
|
686.6
|
708.6
|
(22.0
|
)
|
||||||||||||||||
|
Long-term debt
|
2,989.3
|
2,905.3
|
84.0
|
2,475.3
|
2,393.3
|
82.0
|
||||||||||||||||||
|
Long-term liabilities from risk management activities
|
1.4
|
1.4
|
-
|
4.8
|
4.8
|
-
|
||||||||||||||||||
|
Deferred income taxes (5)
|
135.5
|
12.1
|
123.4
|
131.2
|
11.2
|
120.0
|
||||||||||||||||||
|
Other long-term liabilities (6)
|
60.7
|
52.6
|
8.1
|
53.7
|
47.7
|
6.0
|
||||||||||||||||||
|
Total liabilities
|
3,957.3
|
3,753.0
|
204.3
|
3,351.6
|
3,165.6
|
186.0
|
||||||||||||||||||
|
Total owners' equity
|
2,091.3
|
2,218.4
|
(127.1
|
)
|
1,753.4
|
1,860.1
|
(106.7
|
)
|
||||||||||||||||
|
Total liabilities and owners' equity
|
$
|
6,048.6
|
$
|
5,971.4
|
$
|
77.2
|
$
|
5,105.0
|
$
|
5,025.7
|
$
|
79.3
|
||||||||||||
The major Non-Partnership balance sheet items relate to:
| (1) | Corporate assets consisting of cash and prepaid insurance, as applicable. |
| (2) | Long-term tax assets primarily related to gains on 2010 drop-down transactions recognized as sales of assets for tax purposes. |
| (3) | Accrued current employee liabilities related to payroll and incentive compensation plans and taxes payable. |
| (4) | Intercompany receivable with the Partnership. |
| (5) | Current and long-term deferred income tax balances. |
| (6) | Long-term liabilities related to incentive compensation plans and deferred rent related to the headquarters office lease. |
Results of Operations – Partnership versus Non-Partnership
|
|
Year Ended December 31,
|
|||||||||||||||||||||||||||||||||||
|
|
2013
|
2012
|
2011
|
|||||||||||||||||||||||||||||||||
|
|
Targa Resources Corp. Consolidated
|
Targa Resources Partners LP
|
TRC - Non-Partnership
|
Targa Resources Corp. Consolidated
|
Targa Resources Partners LP
|
TRC - Non-Partnership
|
Targa Resources Corp. Consolidated
|
Targa Resources Partners LP
|
TRC - Non-Partnership
|
|||||||||||||||||||||||||||
|
|
(In millions)
|
|||||||||||||||||||||||||||||||||||
|
Revenues (1)
|
$
|
6,556.0
|
$
|
6,556.2
|
$
|
(0.2
|
)
|
$
|
5,885.7
|
$
|
5,883.6
|
$
|
2.1
|
$
|
6,994.5
|
$
|
6,987.1
|
$
|
7.4
|
|||||||||||||||||
|
Costs and Expenses:
|
||||||||||||||||||||||||||||||||||||
|
Product purchases
|
5,378.5
|
5,378.5
|
-
|
4,879.0
|
4,878.9
|
0.1
|
6,039.0
|
6,039.0
|
-
|
|||||||||||||||||||||||||||
|
Operating expenses
|
376.3
|
376.2
|
0.1
|
313.1
|
313.0
|
0.1
|
287.1
|
287.0
|
0.1
|
|||||||||||||||||||||||||||
|
Depreciation and amortization (2)
|
271.9
|
271.6
|
0.3
|
197.6
|
197.3
|
0.3
|
181.0
|
178.2
|
2.8
|
|||||||||||||||||||||||||||
|
General and administrative (3)
|
151.5
|
143.1
|
8.4
|
139.8
|
131.6
|
8.2
|
136.1
|
127.8
|
8.3
|
|||||||||||||||||||||||||||
|
Other operating (income) expense
|
9.6
|
9.6
|
-
|
19.9
|
19.9
|
-
|
0.2
|
0.2
|
-
|
|||||||||||||||||||||||||||
|
Income from operations
|
368.2
|
377.2
|
(9.0
|
)
|
336.3
|
342.9
|
(6.6
|
)
|
351.1
|
354.9
|
(3.8
|
)
|
||||||||||||||||||||||||
|
Other income (expense):
|
||||||||||||||||||||||||||||||||||||
|
Interest expense, net - third party (4)
|
(134.1
|
)
|
(131.0
|
)
|
(3.1
|
)
|
(120.8
|
)
|
(116.8
|
)
|
(4.0
|
)
|
(111.7
|
)
|
(107.7
|
)
|
(4.0
|
)
|
||||||||||||||||||
|
Equity earnings
|
14.8
|
14.8
|
-
|
1.9
|
1.9
|
-
|
8.8
|
8.8
|
-
|
|||||||||||||||||||||||||||
|
Loss on debt redemptions and amendments
|
(14.7
|
)
|
(14.7
|
)
|
-
|
(12.8
|
)
|
(12.8
|
)
|
-
|
-
|
-
|
-
|
|||||||||||||||||||||||
|
Gain (loss) on mark-to-market derivative instruments
|
-
|
-
|
-
|
-
|
-
|
-
|
(5.0
|
)
|
(5.0
|
)
|
-
|
|||||||||||||||||||||||||
|
Other income (expense)
|
15.3
|
15.2
|
0.1
|
(8.4
|
)
|
(7.8
|
)
|
(0.6
|
)
|
(1.2
|
)
|
(1.2
|
)
|
-
|
||||||||||||||||||||||
|
Income (loss) before income taxes
|
249.5
|
261.5
|
(12.0
|
)
|
196.2
|
207.4
|
(11.2
|
)
|
242.0
|
249.8
|
(7.8
|
)
|
||||||||||||||||||||||||
|
Income tax expense (5)
|
(48.2
|
)
|
(2.9
|
)
|
(45.3
|
)
|
(36.9
|
)
|
(4.2
|
)
|
(32.7
|
)
|
(26.6
|
)
|
(4.3
|
)
|
(22.3
|
)
|
||||||||||||||||||
|
Net income (loss)
|
201.3
|
258.6
|
(57.3
|
)
|
159.3
|
203.2
|
(43.9
|
)
|
215.4
|
245.5
|
(30.1
|
)
|
||||||||||||||||||||||||
|
Less: Net income attributable to noncontrolling interests (6)
|
136.2
|
25.1
|
111.1
|
121.2
|
28.6
|
92.6
|
184.7
|
41.0
|
143.7
|
|||||||||||||||||||||||||||
|
Net income (loss) after noncontrolling interests
|
$
|
65.1
|
$
|
233.5
|
$
|
(168.4
|
)
|
$
|
38.1
|
$
|
174.6
|
$
|
(136.5
|
)
|
$
|
30.7
|
$
|
204.5
|
$
|
(173.8
|
)
|
|||||||||||||||
The major Non-Partnership results of operations relate to:
| (1) | Amortization of AOCI related to Versado hedges dropped down to the Partnership, and OCI related to terminated hedges. |
| (2) | Depreciation on assets excluded from drop-down transactions. |
| (3) | General and administrative expenses retained by TRC related to its status as a public entity. |
| (4) | Interest expense related to TRC debt obligations. |
| (5) | Reflects TRC’s federal and state income taxes. |
| (6) | TRC noncontrolling interest in the Partnership. |
Statements of Cash Flows – Partnership versus Non-Partnership
|
|
Year Ended December 31,
|
|||||||||||||||||||||||||||||||||||
|
|
2013
|
2012
|
2011
|
|||||||||||||||||||||||||||||||||
|
|
Targa Resources Corp. Consolidated
|
Targa Resources Partners LP
|
TRC - Non-Partnership
|
Targa Resources Corp. Consolidated
|
Targa Resources Partners LP
|
TRC - Non-Partnership
|
Targa Resources Corp. Consolidated
|
Targa Resources Partners LP
|
TRC - Non-Partnership
|
|||||||||||||||||||||||||||
|
|
(In millions)
|
|||||||||||||||||||||||||||||||||||
|
Cash flows from operating activities
|
|
|
|
|
|
|
|
|
|
|||||||||||||||||||||||||||
|
Net income (loss)
|
$
|
201.3
|
$
|
258.6
|
$
|
(57.3
|
)
|
$
|
159.3
|
$
|
203.2
|
$
|
(43.9
|
)
|
$
|
215.4
|
$
|
245.5
|
$
|
(30.1
|
)
|
|||||||||||||||
|
Adjustments to reconcile net income to net cash provided by operating activities:
|
||||||||||||||||||||||||||||||||||||
|
Amortization in interest expense (1)
|
15.9
|
15.5
|
0.4
|
18.2
|
17.6
|
0.6
|
13.0
|
12.4
|
0.6
|
|||||||||||||||||||||||||||
|
Compensation on equity grants (2)
|
13.2
|
6.0
|
7.2
|
17.5
|
3.6
|
13.9
|
15.2
|
1.5
|
13.7
|
|||||||||||||||||||||||||||
|
Depreciation and amortization expense (3)
|
271.9
|
271.6
|
0.3
|
197.6
|
197.3
|
0.3
|
181.0
|
178.2
|
2.8
|
|||||||||||||||||||||||||||
|
Accretion of asset retirement obligations
|
4.0
|
3.9
|
0.1
|
4.0
|
3.9
|
0.1
|
3.6
|
3.6
|
-
|
|||||||||||||||||||||||||||
|
Deferred income tax expense (4)
|
5.4
|
0.9
|
4.5
|
9.0
|
1.7
|
7.3
|
12.3
|
0.8
|
11.5
|
|||||||||||||||||||||||||||
|
Equity earnings, net of distributions
|
(2.8
|
)
|
(2.8
|
)
|
-
|
-
|
-
|
-
|
(0.4
|
)
|
(0.4
|
)
|
-
|
|||||||||||||||||||||||
|
Risk management activities (5)
|
(0.3
|
)
|
(0.5
|
)
|
0.2
|
3.6
|
5.3
|
(1.7
|
)
|
(21.2
|
)
|
(16.7
|
)
|
(4.5
|
)
|
|||||||||||||||||||||
|
Loss on sale of assets
|
3.9
|
3.9
|
-
|
15.6
|
15.6
|
-
|
0.2
|
0.2
|
-
|
|||||||||||||||||||||||||||
|
Loss on debt redemptions and amendments
|
14.7
|
14.7
|
-
|
12.8
|
12.8
|
-
|
-
|
-
|
-
|
|||||||||||||||||||||||||||
|
Changes in operating assets and liabilities (6)
|
(144.5
|
)
|
(160.4
|
)
|
15.9
|
(9.4
|
)
|
4.4
|
(13.8
|
)
|
(39.8
|
)
|
(24.2
|
)
|
(15.6
|
)
|
||||||||||||||||||||
|
Net cash provided by (used in) operating activities
|
382.7
|
411.4
|
(28.7
|
)
|
428.2
|
465.4
|
(37.2
|
)
|
379.3
|
400.9
|
(21.6
|
)
|
||||||||||||||||||||||||
|
Cash flows from investing activities
|
||||||||||||||||||||||||||||||||||||
|
Outlays for property, plant and equipment (3)
|
(1,013.6
|
)
|
(1,013.6
|
)
|
-
|
(582.7
|
)
|
(582.3
|
)
|
(0.4
|
)
|
(331.9
|
)
|
(328.7
|
)
|
(3.2
|
)
|
|||||||||||||||||||
|
Business acquisitions, net of cash acquired
|
-
|
-
|
-
|
(996.2
|
)
|
(996.2
|
)
|
-
|
(156.5
|
)
|
(156.5
|
)
|
-
|
|||||||||||||||||||||||
|
Purchase of materials and supplies
|
(17.7
|
)
|
(17.7
|
) -
|
-
|
-
|
-
|
-
|
-
|
-
|
-
|
|||||||||||||||||||||||||
|
Investment in unconsolidated affiliate
|
-
|
-
|
-
|
(16.8
|
)
|
(16.8
|
)
|
-
|
(21.2
|
)
|
(21.2
|
)
|
-
|
|||||||||||||||||||||||
|
Return of capital from unconsolidated affiliate
|
-
|
-
|
-
|
0.5
|
0.5
|
-
|
-
|
-
|
-
|
|||||||||||||||||||||||||||
|
Other, net
|
5.0
|
5.0
|
-
|
4.5
|
1.0
|
3.5
|
0.3
|
0.3
|
-
|
|||||||||||||||||||||||||||
|
Net cash provided by (used in) investing activities
|
(1,026.3
|
)
|
(1,026.3
|
)
|
-
|
(1,590.7
|
)
|
(1,593.8
|
)
|
3.1
|
(509.3
|
)
|
(506.1
|
)
|
(3.2
|
)
|
||||||||||||||||||||
|
Cash flows from financing activities
|
||||||||||||||||||||||||||||||||||||
|
Loan Facilities - Partnership:
|
||||||||||||||||||||||||||||||||||||
|
Borrowings
|
2,238.0
|
2,238.0
|
-
|
2,595.0
|
2,595.0
|
-
|
2,112.0
|
2,112.0
|
-
|
|||||||||||||||||||||||||||
|
Repayments
|
(2,021.2
|
)
|
(2,021.2
|
)
|
-
|
(1,690.7
|
)
|
(1,690.7
|
)
|
-
|
(2,082.0
|
)
|
(2,082.0
|
)
|
-
|
|||||||||||||||||||||
|
Accounts receivable securitization facility - Partnership
|
||||||||||||||||||||||||||||||||||||
|
Borrowings
|
373.3
|
373.3
|
-
|
-
|
-
|
-
|
-
|
-
|
-
|
|||||||||||||||||||||||||||
|
Repayments
|
(93.6
|
)
|
(93.6
|
)
|
-
|
-
|
-
|
-
|
-
|
-
|
-
|
|||||||||||||||||||||||||
|
Loan Facilities - Non-Partnership:
|
||||||||||||||||||||||||||||||||||||
|
Borrowings (1)
|
65.0
|
-
|
65.0
|
90.0
|
-
|
90.0
|
-
|
-
|
-
|
|||||||||||||||||||||||||||
|
Repayments (1)
|
(63.0
|
)
|
-
|
(63.0
|
)
|
(96.8
|
)
|
-
|
(96.8
|
)
|
-
|
-
|
-
|
|||||||||||||||||||||||
|
Costs incurred in connection with financing arrangements
|
(15.3
|
)
|
(15.3
|
)
|
-
|
(36.6
|
)
|
(35.7
|
)
|
(0.9
|
)
|
(18.2
|
)
|
(18.2
|
)
|
-
|
||||||||||||||||||||
|
Proceeds from sale of common units of the Partnership, net (7)
|
524.7
|
535.5
|
(10.8
|
)
|
514.0
|
575.0
|
(61.0
|
)
|
310.0
|
316.1
|
(6.1
|
)
|
||||||||||||||||||||||||
|
Distributions to owners (8)
|
(274.4
|
)
|
(412.3
|
)
|
137.9
|
(211.5
|
)
|
(303.8
|
)
|
92.3
|
(196.2
|
)
|
(256.6
|
)
|
60.4
|
|||||||||||||||||||||
|
Dividends to common and common equivalent shareholders
|
(87.8
|
)
|
-
|
(87.8
|
)
|
(62.2
|
)
|
-
|
(62.2
|
)
|
(38.2
|
)
|
-
|
(38.2
|
)
|
|||||||||||||||||||||
|
Repurchase of common stock
|
(13.3
|
)
|
-
|
(13.3
|
)
|
(9.5
|
)
|
-
|
(9.5
|
)
|
-
|
-
|
-
|
|||||||||||||||||||||||
|
Excess tax benefit from stock-based awards
|
1.6
|
-
|
1.6
|
1.3
|
-
|
1.3
|
-
|
-
|
-
|
|||||||||||||||||||||||||||
|
Contributions (distributions) (9)
|
-
|
-
|
-
|
-
|
1.0
|
(1.0
|
)
|
-
|
13.2
|
(13.2
|
)
|
|||||||||||||||||||||||||
|
Net cash provided by (used in) financing activities
|
634.0
|
604.4
|
29.6
|
1,093.0
|
1,140.8
|
(47.8
|
)
|
87.4
|
84.5
|
2.9
|
||||||||||||||||||||||||||
|
Net change in cash and cash equivalents
|
(9.6
|
)
|
(10.5
|
)
|
0.9
|
(69.5
|
)
|
12.4
|
(81.9
|
)
|
(42.6
|
)
|
(20.7
|
)
|
(21.9
|
)
|
||||||||||||||||||||
|
Cash and cash equivalents, beginning of period
|
76.3
|
68.0
|
8.3
|
145.8
|
55.6
|
90.2
|
188.4
|
76.3
|
112.1
|
|||||||||||||||||||||||||||
|
Cash and cash equivalents, end of period
|
$
|
66.7
|
$
|
57.5
|
$
|
9.2
|
76.3
|
68.0
|
$
|
8.3
|
$
|
145.8
|
$
|
55.6
|
$
|
90.2
|
||||||||||||||||||||
The major Non-Partnership cash flow items relate to:
| (1) | Cash and non-cash activity related to TRC debt obligations. |
| (2) | Compensation on TRC’s equity grants. |
| (3) | Cash and non-cash activity related to corporate administrative assets. |
| (4) | TRC’s federal and state income taxes. |
| (5) | Non-cash OCI hedge realizations related to predecessor operations. |
| (6) | See Balance Sheet – Partnership versus Non-Partnership for a description of the Non-Partnership operating assets and liabilities. |
| (7) | Contributions to the Partnership to maintain 2% General Partner ownership and in 2012 to purchase limited partner units. |
| (8) | Distributions received by TRC from the Partnership for its general partner interest, limited partner interest and IDRs. |
| (9) | Other activity with the Partnership. |
Consolidated Results of Operations
The following table and discussion is a summary of our consolidated results of operations:
|
|
2013
|
2012
|
2011
|
2013 vs. 2012
|
2012 vs. 2011
|
|||||||||||||||||||||||
|
|
(In millions, except operating statistics and price amounts)
|
|||||||||||||||||||||||||||
|
Revenues
|
$
|
6,556.0
|
$
|
5,885.7
|
$
|
6,994.5
|
$
|
670.3
|
11
|
%
|
$
|
(1,108.8
|
)
|
(16
|
%)
|
|||||||||||||
|
Product purchases
|
5,378.5
|
4,879.0
|
6,039.0
|
499.5
|
10
|
%
|
(1,160.0
|
)
|
(19
|
%)
|
||||||||||||||||||
|
Gross margin (1)
|
1,177.5
|
1,006.7
|
955.5
|
170.8
|
17
|
%
|
51.2
|
5
|
%
|
|||||||||||||||||||
|
|
376.3
|
313.1
|
287.1
|
63.2
|
20
|
%
|
26.0
|
9
|
%
|
|||||||||||||||||||
|
Operating margin (2)
|
801.2
|
693.6
|
668.4
|
107.6
|
16
|
%
|
25.2
|
4
|
%
|
|||||||||||||||||||
|
Depreciation and amortization expenses
|
271.9
|
197.6
|
181.0
|
74.3
|
38
|
%
|
16.6
|
9
|
%
|
|||||||||||||||||||
|
General and administrative expenses
|
151.5
|
139.8
|
136.1
|
11.7
|
8
|
%
|
3.7
|
3
|
%
|
|||||||||||||||||||
|
Other operating expense
|
9.6
|
19.9
|
0.2
|
(10.3
|
)
|
(52
|
%)
|
19.7
|
NM
|
|||||||||||||||||||
|
Income from operations
|
368.2
|
336.3
|
351.1
|
31.9
|
9
|
%
|
(14.8
|
)
|
(4
|
%)
|
||||||||||||||||||
|
Interest expense, net
|
(134.1
|
)
|
(120.8
|
)
|
(111.7
|
)
|
(13.3
|
)
|
11
|
%
|
(9.1
|
)
|
8
|
%
|
||||||||||||||
|
Equity earnings
|
14.8
|
1.9
|
8.8
|
12.9
|
NM
|
(6.9
|
)
|
(78
|
%)
|
|||||||||||||||||||
|
|
||||||||||||||||||||||||||||
|
Loss on debt redemptions and amendments
|
(14.7
|
)
|
(12.8
|
)
|
-
|
(1.9
|
)
|
15
|
%
|
(12.8
|
)
|
-
|
||||||||||||||||
|
Loss on mark-to-market derivative instruments
|
-
|
-
|
(5.0
|
)
|
-
|
-
|
5.0
|
-
|
||||||||||||||||||||
|
Other
|
15.3
|
(8.4
|
)
|
(1.2
|
)
|
23.7
|
(282
|
%)
|
(7.2
|
)
|
600
|
%
|
||||||||||||||||
|
Income tax expense
|
(48.2
|
)
|
(36.9
|
)
|
(26.6
|
)
|
(11.3
|
)
|
31
|
%
|
(10.3
|
)
|
39
|
%
|
||||||||||||||
|
Net income
|
201.3
|
159.3
|
215.4
|
42.0
|
26
|
%
|
(56.1
|
)
|
(26
|
%)
|
||||||||||||||||||
|
Less: Net income attributable to noncontrolling interests
|
136.2
|
121.2
|
184.7
|
15.0
|
12
|
%
|
(63.5
|
)
|
(34
|
%)
|
||||||||||||||||||
|
Net income (loss) available to common shareholders
|
$
|
65.1
|
$
|
38.1
|
$
|
30.7
|
$
|
27.0
|
71
|
%
|
$
|
7.4
|
24
|
%
|
||||||||||||||
|
|
||||||||||||||||||||||||||||
|
Operating statistics:
|
||||||||||||||||||||||||||||
|
Crude oil gathered, MBbl/d
|
46.9
|
-
|
- |
46.9
|
-
|
-
|
-
|
|||||||||||||||||||||
|
Plant natural gas inlet, MMcf/d (3) (4)
|
2,110.2
|
2,098.3
|
2,162.1
|
11.9
|
1
|
%
|
(63.8
|
)
|
(3
|
%)
|
||||||||||||||||||
|
Gross NGL production, MBbl/d
|
136.8
|
128.7
|
123.9
|
8.1
|
6
|
%
|
4.8
|
4
|
%
|
|||||||||||||||||||
|
Export volumes, MBbl/d (5)
|
66.6
|
31.6
|
17.2
|
35.0
|
111
|
%
|
14.4
|
84
|
%
|
|||||||||||||||||||
|
Natural gas sales, BBtu/d (4)
|
928.2
|
927.6
|
779.3
|
0.6
|
0
|
%
|
148.3
|
19
|
%
|
|||||||||||||||||||
|
NGL sales, MBbl/d
|
316.6
|
284.5
|
269.6
|
32.1
|
11
|
%
|
14.9
|
6
|
%
|
|||||||||||||||||||
|
Condensate sales, MBbl/d
|
3.5
|
3.5
|
3.0
|
-
|
0
|
%
|
0.5
|
17
|
%
|
|||||||||||||||||||
| (1) | Gross margin is a non-GAAP financial measure and is discussed under “Management’s Discussion and Analysis of Financial Condition and Results of Operations – How We Evaluate the Partnership’s Operations” and “Non-GAAP Financial Measures.” |
| (2) | Operating margin is a non-GAAP financial measure and is discussed under “Management’s Discussion and Analysis of Financial Condition and Results of Operations – How We Evaluate the Partnership’s Operations” and “Non-GAAP Financial Measures.” |
| (3) | Plant natural gas inlet represents the volume of natural gas passing through the meter located at the inlet of a natural gas processing plant, other than in Badlands, where it represents total wellhead gathered volume. |
| (4) | Plant natural gas inlet volumes include producer take-in-kind volumes, while natural gas sales exclude producer take-in-kind volumes. |
| (5) | Export volumes represent the quantity of NGL products delivered to third-party customers at our Galena Park Marine terminal that are destined for international markets. |
2013 Compared to 2012
Revenues, including the impacts of hedging, increased due to the impact of higher commodity volumes ($446.8 million), higher realized prices on natural gas, condensate, and petroleum products ($258.4 million) and higher fee-based and other revenues ($227.8 million), offset by lower realized prices on NGLs ($262.7 million).
Higher consolidated gross margin in 2013 includes the contribution of the Partnership’s Badlands acquisition. Other favorable gross margin factors were increased volumes from system expansions and higher gas prices in the Partnership’s Field Gathering and Processing segment and higher fractionation fees and increased export activities in the Partnership’s Logistics and Marketing segments. This significant growth in the Partnership’s asset base brought a higher level of operating expenses in 2013. See “—Results of Operations—By Reportable Segment” for additional information regarding changes in the components of gross and operating margin on a disaggregated basis.
The increase in depreciation and amortization expenses was primarily due to tangible and intangible assets acquired in the Badlands acquisition and the timing of major organic investments placed in service including CBF Train 4, Phase I of the international export expansion project, and Badlands expansion.
General and administrative expenses increased, reflecting increased compensation related costs to support the Partnership’s expanding business operations.
Other operating expense in 2013 includes the Versado joint venture cost of repairs less amounts covered by insurance ($4.0 million) related to a fire at the Saunders plant. Other operating expense in 2012 reflects a $15.4 million loss due to a write-off of the Partnership’s investment in the Yscloskey joint venture processing plant in Southeastern Louisiana. Following Hurricane Isaac, the joint venture owners elected not to restart the plant. Additionally, other operating (income) expense in 2012 includes $3.6 million in costs associated with the clean-up and repairs necessitated by Hurricane Isaac at the Partnership’s Coastal Straddle plants.
The increase in interest expense primarily reflects higher borrowings ($36.2 million), partially offset by the impact of lower effective interest rates ($7.7 million) and increases in capitalized interest attributable to our major expansion projects ($14.4 million).
The increase in equity earnings relates to the Partnership’s investment in GCF, which was profitable in 2013 compared to a loss in 2012 due to a planned shutdown of operations related to the expansion of the facility.
Losses on debt redemptions and amendments during 2013 are attributable to premiums paid and write-off of debt issue costs in connection with the redemption of the outstanding balance of the Partnership’s 11¼% Notes and the redemption of $100 million of the Partnership’s 6⅜% Notes.
The increase in other income was attributable to the elimination of the contingent consideration associated with the Badlands acquisition, reflecting management’s current assessment that the stipulated volumetric thresholds will not be met.
The increase in earnings attributable to noncontrolling interests is primarily due to higher Partnership earnings. Despite an increase in the noncontrolling interests of the Partnership of 1.3% during 2013, higher incentive distributions were responsible for the decrease in the weighted average percentage of the net income allocable to noncontrolling interests to 47.6% in 2013 from 53.1% in 2012. Additionally, net income attributable to noncontrolling interests was $3.5 million lower due to decreased net income of Versado and VESCO, partially offset by increased net income at CBF.
2012 Compared to 2011
Revenues, including the impacts of hedging, decreased due to the impact of lower realized prices on commodities ($1,965.3 million), partially offset by higher commodity sales volumes ($769.7 million) and higher fee-based and other revenues ($86.8 million).
The increase in gross margin reflects lower revenues more than offset by lower product purchases. See “—Results of Operations—By Reportable Segment” for additional information regarding changes in the components of gross and operating margin on a disaggregated basis.
The increase in operating expenses reflects expansion and acquisition activities. See “– Results of Operations – By Reportable Segment” for additional discussion regarding changes in operating expenses.
The increase in depreciation and amortization expenses is attributable to the impact of new assets placed in service as well as assets associated with business acquisitions.
General and administrative expenses increased due to higher compensation and benefits.
Other operating expense in 2012 relate to the Yscloskey plant closure and Hurricane Isaac clean-up and repair cost as discussed above.
The increase in interest expense primarily reflects higher borrowings ($22.3 million), which was offset by the impact of lower effective interest rates ($3.0 million) and increases in capitalized interest that was attributable to our major expansion projects ($10.2 million).
Lower equity earnings from the Partnership’s non-operated GCF equity investment, resulted from the planned shutdown of operations associated with 43 MBbl/d capacity expansion project. GCF operations were also affected by start-up issues associated with the expansion.
Losses on a debt redemption and amendment during 2012 are largely attributable to premiums and write-off of debt issue costs in connection with the redemption of the Partnership’s 8¼% Senior Notes due 2016 (the “8¼% Notes”) and the amendment to the TRP Revolver. See Note 10 of the “Consolidated Financial Statements” of this Annual Report for additional details.
The mark-to-market loss in 2011 was attributable to interest rate swaps that were de-designated as hedging instruments during the second quarter of that year. Consequently, the Partnership discontinued hedge accounting on those swaps, and all subsequent changes in fair value settlements were recorded as mark-to-market losses until September 2011 when the Partnership terminated all of its interest rate swaps.
The increase in other expenses is attributable to fees and expenses related to completing the Badlands acquisition.
The decrease in net income attributable to noncontrolling interests reflects the impact of the weaker price environment on the Partnership’s Versado and VESCO joint ventures, as well as the disruption of operations at VESCO due to Hurricane Isaac. These factors were partially offset by increased net income at CBF.
Results of Operations—By Reportable Segment
We have segregated the following segment operating margins between Partnership and TRC Non-Partnership activities. Partnership activities have been presented on a common control accounting basis, which reflects the dropdown transactions between Targa and the Partnership as if they occurred in prior periods. TRC Non-Partnership segment results include certain assets and liabilities contractually excluded from the dropdown transactions and certain historical hedge activities that could not be reflected as such under GAAP in the Partnership common control results. See “—Financial Information – Partnership Versus Non-Partnership.”
|
|
Partnership
|
|
|
|||||||||||||||||||||||||
|
|
Field Gathering and Processing
|
Coastal Gathering and Processing
|
Logistics Assets
|
Marketing and Distribution
|
Other
|
TRC Non- Partnership
|
Consolidated
Operating Margin
|
|||||||||||||||||||||
|
|
(In millions)
|
|||||||||||||||||||||||||||
|
|
|
|
|
|
|
|||||||||||||||||||||||
|
2013
|
$
|
270.5
|
$
|
85.4
|
$
|
282.3
|
$
|
141.9
|
$
|
21.4
|
$
|
(0.3
|
)
|
$
|
801.2
|
|||||||||||||
|
2012
|
231.2
|
115.1
|
188.3
|
116.0
|
41.1
|
1.9
|
693.6
|
|||||||||||||||||||||
|
2011
|
287.9
|
174.3
|
123.1
|
113.4
|
(37.6
|
)
|
7.3
|
668.4
|
||||||||||||||||||||
Results of Operations of the Partnership – By Reportable Segment
Gathering and Processing Segments
Field Gathering and Processing
|
|
2013
|
2012
|
2011
|
2013 vs. 2012
|
2012 vs. 2011
|
|||||||||||||||||||||||
|
|
($ in millions, except operating statistics and price amounts)
|
|||||||||||||||||||||||||||
|
Gross margin
|
$
|
435.7
|
$
|
357.4
|
$
|
403.6
|
$
|
78.3
|
22
|
%
|
$
|
(46.2
|
)
|
(11
|
%)
|
|||||||||||||
|
Operating expenses
|
165.2
|
126.2
|
115.7
|
39.0
|
31
|
%
|
10.5
|
9
|
%
|
|||||||||||||||||||
|
Operating margin
|
$
|
270.5
|
$
|
231.2
|
$
|
287.9
|
$
|
39.3
|
17
|
%
|
$
|
(56.7
|
)
|
(20
|
%)
|
|||||||||||||
|
Operating statistics (1):
|
||||||||||||||||||||||||||||
|
Plant natural gas inlet, MMcf/d (2),(3)
|
||||||||||||||||||||||||||||
|
Sand Hills
|
155.8
|
145.2
|
134.2
|
10.6
|
7
|
%
|
11.0
|
8
|
%
|
|||||||||||||||||||
|
SAOU
|
154.1
|
124.8
|
111.0
|
29.3
|
23
|
%
|
13.8
|
12
|
%
|
|||||||||||||||||||
|
North Texas System
|
292.4
|
244.5
|
203.5
|
47.9
|
20
|
%
|
41.0
|
20
|
%
|
|||||||||||||||||||
|
Versado
|
156.4
|
167.4
|
162.8
|
(11.0
|
)
|
(7
|
%)
|
4.6
|
3
|
%
|
||||||||||||||||||
|
Badlands (4)
|
21.4
|
-
|
-
|
21.4
|
-
|
-
|
-
|
|||||||||||||||||||||
|
|
780.1
|
681.9
|
611.5
|
98.2
|
14
|
%
|
70.4
|
12
|
%
|
|||||||||||||||||||
|
Gross NGL production, MBbl/d (3)
|
||||||||||||||||||||||||||||
|
Sand Hills
|
17.5
|
16.9
|
15.7
|
0.6
|
4
|
%
|
1.2
|
8
|
%
|
|||||||||||||||||||
|
SAOU
|
22.5
|
19.2
|
17.4
|
3.3
|
17
|
%
|
1.8
|
10
|
%
|
|||||||||||||||||||
|
North Texas System
|
31.1
|
26.8
|
22.9
|
4.3
|
16
|
%
|
3.9
|
17
|
%
|
|||||||||||||||||||
|
Versado
|
18.9
|
19.7
|
18.2
|
(0.8
|
)
|
(4
|
%)
|
1.5
|
8
|
%
|
||||||||||||||||||
|
Badlands
|
1.9
|
-
|
-
|
1.9
|
-
|
-
|
-
|
|||||||||||||||||||||
|
|
91.9
|
82.6
|
74.2
|
9.3
|
11
|
%
|
8.4
|
11
|
%
|
|||||||||||||||||||
|
Crude oil gathered, MBbl/d
|
46.9
|
-
|
-
|
46.9
|
-
|
-
|
-
|
|||||||||||||||||||||
|
Natural gas sales, BBtu/d (3)
|
376.3
|
325.0
|
285.5
|
51.3
|
16
|
%
|
39.5
|
14
|
%
|
|||||||||||||||||||
|
NGL sales, MBbl/d
|
71.4
|
68.5
|
59.8
|
2.9
|
4
|
%
|
8.7
|
15
|
%
|
|||||||||||||||||||
|
Condensate sales, MBbl/d
|
3.2
|
3.2
|
2.8
|
-
|
|
0
|
%
|
0.4
|
14
|
%
|
||||||||||||||||||
|
Average realized prices (5):
|
||||||||||||||||||||||||||||
|
Natural gas, $/MMBtu
|
3.44
|
2.60
|
3.80
|
0.84
|
32
|
%
|
(1.20
|
)
|
(32
|
%)
|
||||||||||||||||||
|
NGL, $/gal
|
0.76
|
0.87
|
1.23
|
(0.11
|
)
|
(13
|
%)
|
(0.36
|
)
|
(29
|
%)
|
|||||||||||||||||
|
Condensate, $/Bbl
|
92.89
|
88.49
|
91.55
|
4.40
|
5
|
%
|
(3.06
|
)
|
(3
|
%)
|
||||||||||||||||||
| (1) | Segment operating statistics include the effect of intersegment amounts, which have been eliminated from the consolidated presentation. For all volume statistics presented, the numerator is the total volume during the year and the denominator is the number of calendar days during the year. |
| (2) | Plant natural gas inlet represents the volume of natural gas passing through the meter located at the inlet of a natural gas processing plant. |
| (3) | Plant natural gas inlet volumes and gross NGL production volumes include producer take-in-kind volumes, while natural gas sales exclude producer take-in-kind volumes. |
| (4) | Badlands natural gas inlet represents the total wellhead gathered volume. |
| (5) | Average realized prices exclude the impact of hedging settlements presented in Other. |
2013 Compared to 2012
The increase in gross margin was primarily due to the inclusion of Badlands operations in 2013, higher overall throughput volumes and higher natural gas and condensate sales prices partially offset by lower NGL sales prices. The increase in plant inlet volumes was largely attributable to new well connects which increased available supply across each of our areas of operations, offset by the Saunders fire at Versado and by other operational issues and severe cold weather.
The increase in operating expenses was primarily due to the inclusion of Badlands operations in 2013 and additional compression and system maintenance related expenses attributable to increased volumes across our business and system expansions.
2012 Compared to 2011
The decrease in gross margin was primarily due to lower commodity sales prices, partially offset by higher throughput volumes. The increase in plant inlet volumes was largely attributable to new well connects, particularly North Texas, Sand Hills and SAOU, partially offset by pipeline curtailments and operational issues.
The increase in operating expenses was primarily due to additional compression related expenses due to system expansions and higher system maintenance and repair costs.
Coastal Gathering and Processing
|
|
2013
|
2012
|
2011
|
2013 vs. 2012
|
2012 vs. 2011
|
|||||||||||||||||||||||
|
|
($ in millions, except operating statistics and price amounts)
|
|||||||||||||||||||||||||||
|
Gross margin
|
$
|
132.3
|
$
|
162.2
|
$
|
221.6
|
$
|
(29.9
|
)
|
(18
|
%)
|
$
|
(59.4
|
)
|
(27
|
%)
|
||||||||||||
|
Operating expenses
|
46.9
|
47.1
|
47.3
|
(0.2
|
)
|
0
|
%
|
(0.2
|
)
|
0
|
%
|
|||||||||||||||||
|
Operating margin
|
$
|
85.4
|
$
|
115.1
|
$
|
174.3
|
$
|
(29.7
|
)
|
(26
|
%)
|
$
|
(59.2
|
)
|
(34
|
%)
|
||||||||||||
|
Operating statistics (1):
|
||||||||||||||||||||||||||||
|
Plant natural gas inlet, MMcf/d (2),(3)
|
||||||||||||||||||||||||||||
|
LOU (4)
|
350.9
|
260.6
|
175.7
|
90.3
|
35
|
%
|
84.9
|
48
|
%
|
|||||||||||||||||||
|
VESCO
|
515.5
|
479.6
|
498.5
|
35.9
|
7
|
%
|
(18.9
|
)
|
(4
|
%)
|
||||||||||||||||||
|
Other Coastal Straddles
|
463.7
|
676.2
|
876.4
|
(212.5
|
)
|
(31
|
%)
|
(200.2
|
)
|
(23
|
%)
|
|||||||||||||||||
|
|
1,330.1
|
1,416.4
|
1,550.6
|
(86.3
|
)
|
(6
|
%)
|
(134.2
|
)
|
(9
|
%)
|
|||||||||||||||||
|
Gross NGL production, MBbl/d (3)
|
||||||||||||||||||||||||||||
|
LOU
|
10.2
|
8.6
|
7.4
|
1.6
|
19
|
%
|
1.2
|
16
|
%
|
|||||||||||||||||||
|
VESCO
|
21.5
|
22.1
|
25.9
|
(0.6
|
)
|
(3
|
%)
|
(3.8
|
)
|
(15
|
%)
|
|||||||||||||||||
|
Other Coastal Straddles
|
13.2
|
15.4
|
16.5
|
(2.2
|
)
|
(14
|
%)
|
(1.1
|
)
|
(7
|
%)
|
|||||||||||||||||
|
|
44.9
|
46.1
|
49.8
|
(1.2
|
)
|
(3
|
%)
|
(3.7
|
)
|
(7
|
%)
|
|||||||||||||||||
|
Natural gas sales, BBtu/d (3)
|
296.0
|
298.5
|
268.4
|
(2.5
|
)
|
(1
|
%)
|
30.1
|
11
|
%
|
||||||||||||||||||
|
NGL sales, MBbl/d
|
41.8
|
42.5
|
43.5
|
(0.7
|
)
|
(2
|
%)
|
(1.0
|
)
|
(2
|
%)
|
|||||||||||||||||
|
Condensate sales, MBbl/d
|
0.4
|
0.3
|
0.3
|
0.1
|
19
|
%
|
-
|
0
|
%
|
|||||||||||||||||||
|
Average realized prices:
|
||||||||||||||||||||||||||||
|
Natural gas, $/MMBtu
|
3.73
|
2.78
|
4.02
|
0.95
|
34
|
%
|
(1.24
|
)
|
(31
|
%)
|
||||||||||||||||||
|
NGL, $/gal
|
0.83
|
0.96
|
1.31
|
(0.13
|
)
|
(14
|
%)
|
(0.35
|
)
|
(27
|
%)
|
|||||||||||||||||
|
Condensate, $/Bbl
|
104.38
|
103.57
|
105.10
|
0.81
|
1
|
%
|
(1.53
|
)
|
(1
|
%)
|
||||||||||||||||||
| (1) | Segment operating statistics include intersegment amounts, which have been eliminated from the consolidated presentation. For all volume statistics presented, the numerator is the total volume during the year and the denominator is the number of calendar days during the year. |
| (2) | Plant natural gas inlet represents the volume of natural gas passing through the meter located at the inlet of a natural gas processing plant. |
| (3) | Plant natural gas inlet volumes and gross NGL production volumes include producer take-in-kind volumes, while natural gas sales exclude producer take-in-kind volumes. |
| (4) | Includes volumes from the Big Lake processing plant acquired in July 2012. |
2013 Compared to 2012
The decrease in gross margin was primarily due to lower NGL prices, less favorable frac spread and lower throughput volumes at VESCO and the Other Coastal Straddles. The decrease in plant inlet volumes was largely attributable to the decline in offshore and off-system supply volumes and the impact of the Yscloskey, Calumet and other third-party plant shutdowns. In addition, volumes were constrained by operational issues at VESCO and LOU. This volume decrease was partially offset by the addition of the Big Lake plant in the third quarter 2012 and 2012 volumes also reflect the shutdown of Coastal Straddle plant operations during Hurricane Isaac. Operational issues at VESCO included the impact of damage to one of the two third-party pipelines that provide NGL takeaway capacity for VESCO which constrained NGL production until repairs were completed in June 2013.
Operating expenses were relatively flat.
2012 Compared to 2011
The decrease in gross margin was primarily due to lower commodity sales prices, less favorable frac spread and lower throughput volumes. The decrease in plant inlet volumes was largely attributable to the decline in offshore and off-system supply volumes and planned operational outages at VESCO in the second quarter of 2012, as well as the impact of Hurricane Isaac in the third quarter of 2012 and the post-Isaac shutdown of the Yscloskey plant. The volume decreases were partially offset by increased LOU supply volumes, the July 2012 acquisition of the Big Lake plant and gas purchased for processing at VESCO and Lowry. NGL production and sales at LOU increased on higher throughput volumes, partially offset by lower average system liquids content of the natural gas. Natural gas sales volumes increased due to an increase in demand from industrial customers.
Operating expenses were relatively flat as higher system maintenance and repair costs at VESCO were offset by operating cost reductions attributable to the Yscloskey and Calumet plant shutdowns in 2012.
Logistics and Marketing Segments
Logistics Assets
|
|
2013
|
2012
|
2011
|
2013 vs. 2012
|
2012 vs. 2011
|
|||||||||||||||||||||||
|
|
($ in millions, except operating statistics)
|
|||||||||||||||||||||||||||
|
Gross margin
|
$
|
408.2
|
$
|
286.0
|
$
|
221.1
|
$
|
122.2
|
43
|
%
|
$
|
64.9
|
29
|
%
|
||||||||||||||
|
Operating expenses
|
125.9
|
97.7
|
98.0
|
28.2
|
29
|
%
|
(0.3
|
)
|
0
|
%
|
||||||||||||||||||
|
Operating margin
|
$
|
282.3
|
$
|
188.3
|
$
|
123.1
|
$
|
94.0
|
50
|
%
|
$
|
65.2
|
53
|
%
|
||||||||||||||
|
Operating statistics MBbl/d (1):
|
||||||||||||||||||||||||||||
|
Fractionation volumes
|
287.6
|
299.2
|
268.4
|
(11.6
|
)
|
(4
|
%)
|
30.8
|
11
|
%
|
||||||||||||||||||
|
LSNG treating volumes
|
20.1
|
22.4
|
15.3
|
(2.3
|
)
|
(10
|
%)
|
7.1
|
46
|
%
|
||||||||||||||||||
|
Benzene treating volumes
|
17.5
|
19.0
|
-
|
(1.5
|
)
|
(8
|
%)
|
19.0
|
-
|
|||||||||||||||||||
| (1) | For all volume statistics presented, the numerator is the total volume during the year and the denominator is the number of calendar days during the year. |
2013 Compared to 2012
Gross margin increased primarily due to fractionation operations and LPG export activity. The lower year-to-date 2013 fractionation volumes were due to the planned maintenance turnaround at the Cedar Bayou Facility, ethane rejection at certain gas processing plants and pipeline operating issues at non-Partnership facilities. Improvements in 2013 resulted from higher fractionation fees, CBF Train 4 which commenced commercial operations during the third quarter of 2013 and higher contractual capacity reservation fees. Gross margin results also include the impact of higher fuel prices which pass through to operating expenses. LPG export volumes, which benefit both the Logistics Assets and Marketing and Distribution segments, averaged 67 MBbl/d in 2013, compared to 32 MBbl/d for the previous year. The higher volumes reflect a significant increase in ongoing LPG export activity primarily due to our international export expansion project, which was placed into service in September 2013. Terminaling rates per unit volume were also higher and storage revenues increased due to increased rates and new customers. Gross margin for 2013 also benefitted from the renewable fuels project in our Petroleum Logistics business.
The increase in operating expenses primarily reflects increased power and fuel prices (which have a corresponding impact on fractionating and treating fee revenues); expenses related to the start-up and operations of Train 4 at CBF and increased maintenance costs, partially offset by higher system product gains.
2012 Compared to 2011
The increase in gross margin was primarily due to increased export and storage fee revenue, higher treating volumes, increased petroleum logistics activities and higher fractionation volumes. Export and storage fees increased due to higher export shipments. Treating fees increased due to the operational startup of the benzene treating and de-pentanizer units in the first quarter of 2012 and increased hydrotreating fees associated with increased volumes in 2012. Terminaling gross margin for 2012 improved as a result of the impact of the October 2011 Sound Terminal acquisition. Higher fractionation volumes and fees were primarily attributable to the CBF Train 3 expansion, which came on line in mid-year 2011, partially offset by the impact of lower fuel prices which pass through to expenses.
Operating expenses were essentially flat as favorable system product gains and lower fuel costs (which have a corresponding impact on fractionation revenues) were offset by higher operating costs due to greater hydrotreating, benzene and de-pentanizer unit run-times, higher maintenance activities and the impact of a full twelve months in 2012 of operating costs associated with petroleum logistics operations acquired in April and October of 2011.
Marketing and Distribution
|
|
2013
|
2012
|
2011
|
2013 vs. 2012
|
2012 vs. 2011
|
|||||||||||||||||||||||
|
|
(In millions, except operating statistics and price amounts)
|
|||||||||||||||||||||||||||
|
Gross margin
|
$
|
185.2
|
$
|
154.1
|
$
|
156.4
|
$
|
31.1
|
20
|
%
|
$
|
(2.3
|
)
|
(1
|
%)
|
|||||||||||||
|
Operating expenses
|
43.3
|
38.1
|
43.0
|
5.2
|
14
|
%
|
(4.9
|
)
|
(11
|
%)
|
||||||||||||||||||
|
Operating margin
|
$
|
141.9
|
$
|
116.0
|
$
|
113.4
|
$
|
25.9
|
22
|
%
|
$
|
2.6
|
2
|
%
|
||||||||||||||
|
Operating statistics (1):
|
||||||||||||||||||||||||||||
|
NGL sales, MBbl/d
|
318.4
|
289.8
|
272.5
|
28.6
|
10
|
%
|
17.3
|
6
|
%
|
|||||||||||||||||||
|
Average realized prices:
|
||||||||||||||||||||||||||||
|
NGL realized price, $/gal
|
0.93
|
0.98
|
1.34
|
(0.05
|
)
|
(5
|
%)
|
(0.36
|
)
|
(27
|
%)
|
|||||||||||||||||
| (1) | Segment operating statistics include intersegment amounts, which have been eliminated from the consolidated presentation. For all volume statistics presented, the numerator is the total volume sold during the year and the denominator is the number of calendar days during the year. |
2013 Compared to 2012
Gross margin increased primarily due to significantly higher terminaling fees from LPG export activity (which benefit both the Logistics Assets and Marketing and Distribution segments). The favorable impacts of higher barge and wholesale terminal utilization and of higher wholesale margins were offset by lower natural gas marketing processing opportunities during 2013.
Operating expenses increased primarily due to higher barge and truck utilization and increased terminal operating costs.
2012 Compared to 2011
Gross margin decreased primarily due to a much weaker price environment and lower barge activity in 2012, partially offset by increased LPG export activity, increased trucking activity, favorable short-term wholesale propane marketing opportunities and higher NGL and natural gas sales volumes.
Operating expenses decreased due to lower barge activity, partially offset by increased truck operating costs.
Other
|
|
2013
|
2012
|
2011
|
2013 vs. 2012
|
2012 vs. 2011
|
|||||||||||||||
|
|
($ in millions)
|
|||||||||||||||||||
|
Gross margin
|
$
|
21.4
|
$
|
41.1
|
$
|
(37.6
|
)
|
$
|
(19.7
|
)
|
$
|
78.7
|
||||||||
|
Operating margin
|
$
|
21.4
|
$
|
41.1
|
$
|
(37.6
|
)
|
$
|
(19.7
|
)
|
$
|
78.7
|
||||||||
Other contains the financial effects of the Partnership’s hedging program on operating margin. It typically represents the cash settlements on the Partnership’s derivative contracts. Other also includes deferred gains or losses on previously terminated or de-designated hedge contracts that are reclassified to revenues upon the occurrence of the underlying physical transactions.
The primary purpose of the Partnership’s commodity risk management activities is to manage its exposure to commodity price risk and reduce volatility in its operating cash flow due to fluctuations in commodity prices. The Partnership has hedged the commodity price associated with a portion of its expected (i) natural gas equity volumes in Field Gathering and Processing operations and (ii) NGL and condensate equity volumes predominately in Field Gathering and Processing as well as in the LOU portion of the Coastal Gathering and Processing Operations that result from its percent-of-proceeds or liquids processing arrangements by entering into derivative instruments.
The following table provides a breakdown of the Partnership’s hedge revenue by product:
|
|
2013
|
2012
|
2011
|
2013 vs. 2012
|
2012 vs. 2011
|
|||||||||||||||
|
|
($ in millions)
|
|||||||||||||||||||
|
Natural gas
|
$
|
11.2
|
$
|
33.8
|
$
|
21.2
|
$
|
(22.6
|
)
|
$
|
12.6
|
|||||||||
|
NGL
|
12.8
|
9.1
|
(53.1
|
)
|
3.7
|
62.2
|
||||||||||||||
|
Crude oil
|
(2.6
|
)
|
(1.8
|
)
|
(5.7
|
)
|
(0.8
|
)
|
3.9
|
|||||||||||
|
|
$
|
21.4
|
$
|
41.1
|
$
|
(37.6
|
)
|
$
|
(19.7
|
)
|
$
|
78.7
|
||||||||
Because we are essentially forward-selling a portion of our plant equity volumes, these hedge positions will move favorably in periods of falling prices and unfavorably in periods of rising prices.
Our Liquidity and Capital Resources
We have no separate, direct operating activities apart from those conducted by the Partnership. As such, our ability to finance our operations, including payment of dividends to our common stockholders, funding capital expenditures and acquisitions, or to meet our indebtedness obligations, will depend on cash inflows from future cash distributions to us from our interests in the Partnership. The Partnership is required to distribute all available cash at the end of each quarter after establishing reserves to provide for the proper conduct of its business or to provide for future distributions. See “Item 1A. Risk Factors.” As of February 10, 2014, our interests in the Partnership consisted of the following:
|
·
|
a 2% general partner interest, which we hold through our 100% ownership interest in the general partner of the Partnership; |
|
·
|
all of the outstanding IDRs; and |
|
·
|
12,945,659 of the 112,390,094 outstanding common units of the Partnership, representing an 11.5% limited partnership interest. |
Our future cash flows will consist of distributions to us from our interests in the Partnership, from which we intend to make quarterly cash dividends to our stockholders from available cash. Based on our anticipated levels of distributions that we expect to receive from the Partnership, cash generated from this interest should provide sufficient resources to finance our operations, long-term debt and quarterly cash dividends for at least the next twelve months.
The impact on us of changes in the Partnership’s distribution levels will vary depending on several factors, including the Partnership’s total outstanding partnership interests on the record date for the distribution, the aggregate cash distributions made by the Partnership and the interests in the Partnership owned by us. If the Partnership increases distributions to its unitholders, including us, we would expect to increase dividends to our stockholders, although the timing and amount of such increased dividends, if any, will not necessarily be comparable to the timing and amount of the increase in distributions made by the Partnership. In addition, the level of distributions we receive and of dividends we pay to our stockholders may be affected by the various risks associated with an investment in us and the underlying business of the Partnership. Please read “Item 1A. Risk Factors” for more information about the risks that may impact your investment in us.
As of January 31, 2014, our liquidity consisted of the following:
|
|
January 31, 2014
|
|||
|
|
(In millions)
|
|||
|
Cash on hand
|
$
|
15.5
|
||
|
Total availability under TRC's credit facility
|
150.0
|
|||
|
Less: Outstanding borrowings under TRC's credit facility
|
(88.0
|
)
|
||
|
Less: Outstanding letters of credit outstanding under TRC's credit facility
|
-
|
|||
|
Total liquidity
|
$
|
77.5
|
||
We have sufficient liquidity to satisfy over the next 12 years the $60.6 million tax liability we incurred as a result of our sales of assets to the Partnership.
Subsequent Event
On January 14, 2014, the Partnership announced that the board of directors of its general partner declared a quarterly distribution for the three months ended December 31, 2013 of $0.7475 per common unit, or an annual rate of $2.99 per common unit. This distribution will be paid on February 14, 2014. Based on these current distribution rates, we will receive approximate distributions in future quarters and years of:
|
·
|
$9.7 million or $38.7 million annually based on our common unit ownership in the Partnership; |
|
·
|
$29.5 million or $118.1 million annually based on our IDRs; and |
|
·
|
$2.3 million or $9.3 million annually based on our 2% general partner interests. |
We intend to pay to our stockholders, on a quarterly basis, dividends equal to the cash the Partnership distributes to us based on our ownership of Partnership securities, less the expenses of being a public company, other general and administrative expenses, federal income taxes, capital contributions to the Partnership and reserves established by our board of directors.
The following table details the dividends declared and/or paid
by us for the three years ended December 31, 2013, 2012 and 2011
:
|
Three Months Ended
|
Date Paid or To Be Paid
|
Total
Dividend Declared
|
Amount of Dividend Paid
|
Accrued Dividends (1)
|
Dividend Declared
per Share of
Common Stock
|
|||||||||||||
|
(In millions, except per share amounts)
|
||||||||||||||||||
|
2013
|
|
|
|
|
|
|||||||||||||
|
December 31, 2013
|
February 18, 2014
|
$
|
25.6
|
$
|
25.5
|
$
|
0.1
|
$
|
0.60750
|
|||||||||
|
September 30, 2013
|
November 15, 2013
|
24.1
|
23.7
|
0.4
|
0.57000
|
|||||||||||||
|
June 30, 2013
|
August 15, 2013
|
22.5
|
22.1
|
0.4
|
0.53250
|
|||||||||||||
|
March 31, 2013
|
May 16, 2013
|
21.0
|
20.6
|
0.4
|
0.49500
|
|||||||||||||
|
|
|
|||||||||||||||||
|
2012
|
|
|||||||||||||||||
|
December 31, 2012
|
February 15, 2013
|
$
|
19.4
|
$
|
19.0
|
$
|
0.4
|
$
|
0.45750
|
|||||||||
|
September 30, 2012
|
November 15, 2012
|
18.0
|
17.3
|
0.7
|
0.42250
|
|||||||||||||
|
June 30, 2012
|
August 15, 2012
|
16.7
|
16.1
|
0.6
|
0.39375
|
|||||||||||||
|
March 31, 2012
|
May 16, 2012
|
15.5
|
15.0
|
0.5
|
0.36500
|
|||||||||||||
|
|
|
|||||||||||||||||
|
2011
|
|
|||||||||||||||||
|
December 31, 2011
|
February 15, 2012
|
$
|
14.3
|
$
|
13.8
|
$
|
0.5
|
$
|
0.33625
|
|||||||||
|
September 30, 2011
|
November 15, 2011
|
13.0
|
12.6
|
0.4
|
0.30750
|
|||||||||||||
|
June 30, 2011
|
August 16, 2011
|
12.3
|
11.9
|
0.4
|
0.29000
|
|||||||||||||
|
March 31, 2011
|
May 13, 2011
|
11.6
|
11.2
|
0.4
|
0.27250
|
|||||||||||||
| (1) | Represents accrued dividends on restricted stock and restricted stock units that are payable upon vesting. |
The Partnership’s Liquidity and Capital Resources
The Partnership’s ability to finance its operations, including funding capital expenditures and acquisitions, meeting the Partnership’s indebtedness obligations, refinancing its indebtedness and meeting its collateral requirements, will depend on its ability to generate cash in the future. The Partnership’s ability to generate cash is subject to a number of factors, some of which are beyond its control. These include weather, commodity prices (particularly for natural gas and NGLs) and ongoing efforts to manage operating costs and maintenance capital expenditures, as well as general economic, financial, competitive, legislative, regulatory and other factors.
The Partnership’s main sources of liquidity and capital resources are internally generated cash flow from operations, borrowings under the TRP Revolver, borrowings under the Securitization Facility, the issuance of additional common units and access to debt markets. The capital markets continue to experience volatility. The Partnership’s exposure to current credit conditions includes its credit facility, cash investments and counterparty performance risks. The Partnership continually monitors its liquidity and the credit markets, as well as events and circumstances surrounding each of the lenders to the TRP Revolver and Securitization Facility.
As of January 31, 2014, the Partnership’s liquidity consisted of the following:
|
|
January 31, 2014
|
|||
|
|
(In millions)
|
|||
|
Cash on hand
|
$
|
133.4
|
||
|
Total availability under the TRP Revolver
|
1,200.0
|
|||
|
Total availability under the Securitization Facility
|
270.5
|
|||
|
|
1,603.9
|
|||
|
Less: Outstanding borrowings under the TRP Revolver
|
(365.0
|
)
|
||
|
Outstanding borrowings under the Securitization Facility
|
(270.5
|
)
|
||
|
Outstanding letters of credit under the TRP Revolver
|
(95.3
|
)
|
||
|
Total liquidity
|
$
|
873.1
|
||
In addition to amounts in the table above, the TRP Revolver allows the Partnership to request an additional $300.0 million in commitment increases. The Partnership may also issue additional equity or debt securities under its outstanding shelf registration statements to assist it in meeting future liquidity and capital spending requirements (see Notes 10 and 11 of the “Consolidated Financial Statements”).
The April 2013 Shelf provides the Partnership with the ability to offer and sell an unlimited amount of debt and equity securities, subject to market conditions and its capital needs. The April 2013 Shelf expires in April 2016. As of February 10, 2014, there had been no activity under the April 2013 Shelf.
The July 2013 Shelf allows the Partnership to issue up to an aggregate of $800 million of debt or equity securities. The July 2013 Shelf expires in August 2016. As of February 10, 2014, the Partnership has the ability to sell additional debt or equity securities up to an aggregate amount of $515.3 million under the July 2013 Shelf.
A portion of the Partnership’s capital resources may be utilized in the form of letters of credit to satisfy certain counterparty credit requirements. While the Partnership’s credit ratings have improved over time, these letters of credit reflect its non-investment grade status, as assigned to the Partnership by Moody’s Investors Service, Inc. and Standard & Poor’s Corporation and counterparties’ views of its financial condition and ability to satisfy its performance obligations, as well as commodity prices and other factors. As of December 31, 2013, the Partnership had $86.8 million in letters of credit outstanding.
Risk Management
The Partnership evaluates counterparty risks related to its commodity derivative contracts and trade credit. The Partnership has all of its commodity derivatives with major financial institutions or major oil companies. Should any of these financial counterparties not perform, the Partnership may not realize the benefit of some of its hedges under lower commodity prices, which could have a material adverse effect on its results of operation. The Partnership sells its natural gas, NGLs and condensate to a variety of purchasers. Non-performance by a trade creditor could result in losses.
Crude oil, NGL and natural gas prices are also volatile. In an effort to reduce the variability of the Partnership’s cash flows, the Partnership has entered into derivative instruments to hedge the commodity price associated with a portion of its expected natural gas equity volumes through 2016 and our NGL and condensate equity volumes through 2014. See “Quantitative and Qualitative Disclosures About Market Risk—Commodity Price Risk.” The current market conditions may also impact the Partnership’s ability to enter into future commodity derivative contracts.
The Partnership’s risk management position has moved from a net asset position of $22.2 million at December 31, 2012 to a net liability position of $4.3 million at December 31, 2013. Aggregate forward prices for commodities are above the fixed prices the Partnership currently expects to receive on those derivative contracts, creating this net liability position. The Partnership accounts for derivatives that mitigate commodity price risk as cash flow hedges. Changes in fair value are deferred in other comprehensive income (“OCI”) until the underlying hedged transactions settle.
Working Capital
Working capital is the amount by which current assets exceed current liabilities. On a consolidated basis at the end of any given month, accounts receivable and payable tied to commodity sales and purchases are relatively balanced with receivables from NGL customers offset by plant settlements payable to producers. The factors that typically cause overall variability in the Partnership’s reported total working capital are: (1) the Partnership’s cash position; (2) liquids inventory levels and valuation, which the Partnership closely manages; (3) changes in the fair value of the current portion of derivative contracts; and (4) major structural changes in the Partnership’s asset base or business operations, such as acquisitions or divestitures and certain organic growth projects.
For 2013, the Partnership’s working capital increased $88.0 million, primarily due to the international export project which requires higher levels of accounts receivable and inventory, partially offset by an increase in accounts payable related to third party propane purchases. Other changes included decreases in affiliate payables due to the timing of reimbursements between the Partnership and us, decreases in the cash balance, and decreases in current liabilities due to the reversal of the Badlands contingent liability, partially offset by increased gas plant producer settlement payables due to higher commodity prices and higher volumes. The Partnership’s net risk management working capital position also decreased due to changes in the forward prices of commodities.
Based on the Partnership’s anticipated levels of operations and absent any disruptive events, we believe that the Partnership’s internally generated cash flow, borrowings available under the TRP R
evolver
and the Securitization Facility and proceeds from equity offerings and debt offerings should provide sufficient resources to finance its operations, capital expenditures, long-term debt obligations, collateral requirements and minimum quarterly cash distributions for at least the next twelve months.
Cash Flow
The following table and discussion summarize our consolidated cash flows provided by or used in operating activities, investing activities and financing activities for the periods indicated. See “Statement of Cash Flows – Partnership versus Non-Partnership” for a detailed presentation of cash flow activity:
|
2013
|
Targa Resources
Corp.
Consolidated
|
Targa Resources Partners LP
|
TRC - Non-Partnership
|
|||||||||
|
|
(In millions)
|
|||||||||||
|
Net cash provided by (used in):
|
|
|
|
|||||||||
|
Operating activities
|
$
|
382.7
|
$
|
411.4
|
$
|
(28.7
|
))
|
|||||
|
Investing activities
|
(1,026.3
|
)
|
(1,026.3
|
)
|
-
|
|||||||
|
Financing activities
|
634.0
|
604.4
|
29.6
|
|||||||||
|
2012
|
||||||||||||
|
Net cash provided by (used in):
|
||||||||||||
|
Operating activities
|
$
|
428.2
|
$
|
465.4
|
$
|
(37.2
|
)
|
|||||
|
Investing activities
|
(1,590.7
|
)
|
(1,593.8
|
)
|
3.1
|
|||||||
|
Financing activities
|
1,093.0
|
1,140.8
|
(47.8
|
)
|
||||||||
|
2011
|
||||||||||||
|
Net cash provided by (used in):
|
||||||||||||
|
Operating activities
|
$
|
379.3
|
$
|
400.9
|
$
|
(21.6
|
)
|
|||||
|
Investing activities
|
(509.3
|
)
|
(506.1
|
)
|
(3.2
|
)
|
||||||
|
Financing activities
|
87.4
|
84.5
|
2.9
|
|||||||||
Cash Flow from Operating Activities
The Consolidated Statement of Cash Flows included in the historical consolidated financial statements employs the traditional indirect method of presenting cash flows from operating activities. Under the indirect method, net cash provided by operating activities is derived by adjusting the net income for non-cash items related to operating activities. An alternative GAAP presentation employs the direct method in which the actual cash receipts and outlays comprising cash flow are presented.
The following table displays the Partnership versus Non-Partnership’s operating cash flows using the direct method as a supplement to the presentation in the consolidated financial statements:
|
|
2013
|
2012
|
2013 vs. 2012
|
|||||||||||||||||||||||||||||||||
|
|
Targa Resources Corp. Consolidated
|
Targa Resources Partners LP
|
TRC-Non Partnership
|
Targa Resources Corp. Consolidated
|
Targa Resources Partners LP
|
TRC-Non Partnership
|
Targa Resources Corp. Consolidated
|
Targa Resources Partners LP
|
TRC-Non Partnership
|
|||||||||||||||||||||||||||
|
|
(In millions)
|
|||||||||||||||||||||||||||||||||||
|
Cash flows from operating activities:
|
|
|
|
|
|
|
|
|
|
|||||||||||||||||||||||||||
|
Cash received from customers
|
$
|
6,388.0
|
$
|
6,388.3
|
$
|
(0.3
|
)
|
$
|
5,948.7
|
$
|
5,948.9
|
$
|
(0.2
|
)
|
$
|
439.3
|
$
|
439.4
|
$
|
(0.1
|
)
|
|||||||||||||||
|
Cash received from (paid to) derivative counterparties
|
20.9
|
20.9
|
-
|
47.3
|
47.3
|
-
|
(26.4
|
)
|
(26.4
|
)
|
-
|
|||||||||||||||||||||||||
|
Cash outlays for:
|
||||||||||||||||||||||||||||||||||||
|
Product purchases
|
(5,364.8
|
)
|
(5,364.8
|
)
|
-
|
(4,973.1
|
)
|
(4,972.9
|
)
|
(0.2
|
)
|
(391.7
|
)
|
(391.9
|
)
|
0.2
|
||||||||||||||||||||
|
Operating expenses
|
(377.4
|
)
|
(377.3
|
)
|
(0.1
|
)
|
(339.9
|
)
|
(339.6
|
)
|
(0.3
|
)
|
(37.5
|
)
|
(37.7
|
)
|
0.2
|
|||||||||||||||||||
|
General and administrative expenses
|
(137.6
|
)
|
(145.3
|
)
|
7.7
|
(121.1
|
)
|
(117.8
|
)
|
(3.3
|
)
|
(16.5
|
)
|
(27.5
|
)
|
11.0
|
||||||||||||||||||||
|
Cash distributions from equity investment (1)
|
12.0
|
12.0
|
-
|
1.8
|
1.8
|
-
|
10.2
|
10.2
|
-
|
|||||||||||||||||||||||||||
|
Interest paid, net of amounts capitalized (2)
|
(121.7
|
)
|
(119.1
|
)
|
(2.6
|
)
|
(95.5
|
)
|
(92.5
|
)
|
(3.0
|
)
|
(26.2
|
)
|
(26.6
|
)
|
0.4
|
|||||||||||||||||||
|
Income taxes paid
|
(35.7
|
)
|
(2.3
|
)
|
(33.4
|
)
|
(31.8
|
)
|
(2.2
|
)
|
(29.6
|
)
|
(3.9
|
)
|
(0.1
|
)
|
(3.8
|
)
|
||||||||||||||||||
|
Other cash receipts (payments)
|
(1.0
|
)
|
(1.0
|
)
|
-
|
(8.2
|
)
|
(7.6
|
)
|
(0.6
|
)
|
7.2
|
6.6
|
0.6
|
||||||||||||||||||||||
|
Net cash provided by operating activities
|
$
|
382.7
|
$
|
411.4
|
$
|
(28.7
|
)
|
$
|
428.2
|
$
|
465.4
|
$
|
(37.2
|
)
|
$
|
(45.5
|
)
|
$
|
(54.0
|
)
|
$
|
8.5
|
||||||||||||||
| (1) | Excludes $0.5 million included in investing activities for 2012 related to distributions from GCF that exceeded cumulative equity earnings. The Partnership did not have distributions that exceeded cumulative equity earnings for 2013. |
| (2) | Net of capitalized interest paid of $28.0 million and $13.6 million included in investing activities for 2013 and 2012. |
Higher natural gas prices, higher plant throughput volumes and increased export activities contributed to increased cash collections in 2013 compared to 2012, as well as higher cash payments to producers and for commodity products. The change in cash received related to derivatives reflects higher aggregate commodity prices paid to counterparties compared to the aggregate fixed price the Partnership received on those derivative contracts. The decrease in other cash payments during 2013 was mainly attributable to the fees related to the Badlands acquisition paid in 2012.
|
|
2012
|
2011
|
2012 vs. 2011
|
|||||||||||||||||||||||||||||||||
|
|
Targa Resources Corp. Consolidated
|
Targa Resources Partners LP
|
TRC-Non Partnership
|
Targa Resources Corp. Consolidated
|
Targa Resources Partners LP
|
TRC-Non Partnership
|
Targa Resources Corp. Consolidated
|
Targa Resources Partners LP
|
TRC-Non Partnership
|
|||||||||||||||||||||||||||
|
|
(In millions)
|
|||||||||||||||||||||||||||||||||||
|
Cash flows from operating activities:
|
|
|
|
|
|
|
|
|
|
|||||||||||||||||||||||||||
|
Cash received from customers
|
$
|
5,948.7
|
$
|
5,948.9
|
$
|
(0.2
|
)
|
$
|
6,918.6
|
$
|
6,916.0
|
$
|
2.6
|
$
|
(969.9
|
)
|
$
|
(967.1
|
)
|
$
|
(2.8
|
)
|
||||||||||||||
|
Cash received from (paid to) derivative counterparties
|
47.3
|
47.3
|
-
|
(55.1
|
)
|
(56.6
|
)
|
1.5
|
102.4
|
103.9
|
(1.5
|
)
|
||||||||||||||||||||||||
|
Cash outlays for:
|
||||||||||||||||||||||||||||||||||||
|
Product purchases
|
(4,973.1
|
)
|
(4,972.9
|
)
|
(0.2
|
)
|
(5,963.3
|
)
|
(5,960.1
|
)
|
(3.2
|
)
|
990.2
|
987.2
|
3.0
|
|||||||||||||||||||||
|
Operating expenses
|
(339.9
|
)
|
(339.6
|
)
|
(0.3
|
)
|
(287.0
|
)
|
(286.1
|
)
|
(0.9
|
)
|
(52.9
|
)
|
(53.5
|
)
|
0.6
|
|||||||||||||||||||
|
General and administrative expenses
|
(122.4
|
)
|
(117.8
|
)
|
(4.6
|
)
|
(110.6
|
)
|
(124.1
|
)
|
13.5
|
(11.8
|
)
|
6.3
|
(18.1
|
)
|
||||||||||||||||||||
|
Cash distributions from equity investment (1)
|
1.8
|
1.8
|
-
|
8.3
|
8.3
|
-
|
(6.5
|
)
|
(6.5
|
)
|
-
|
|||||||||||||||||||||||||
|
Interest paid, net of amounts capitalized (2)
|
(95.5
|
)
|
(92.5
|
)
|
(3.0
|
)
|
(96.1
|
)
|
(92.7
|
)
|
(3.4
|
)
|
0.6
|
0.2
|
0.4
|
|||||||||||||||||||||
|
Income taxes paid
|
(30.5
|
)
|
(2.2
|
)
|
(28.3
|
)
|
(33.8
|
)
|
(2.5
|
)
|
(31.3
|
)
|
3.3
|
0.3
|
3.0
|
|||||||||||||||||||||
|
Other cash receipts (payments)
|
(8.2
|
)
|
(7.6
|
)
|
(0.6
|
)
|
(1.7
|
)
|
(1.3
|
)
|
(0.4
|
)
|
(6.5
|
)
|
(6.3
|
)
|
(0.2
|
)
|
||||||||||||||||||
|
Net cash provided by operating activities
|
$
|
428.2
|
$
|
465.4
|
$
|
(37.2
|
)
|
$
|
379.3
|
$
|
400.9
|
$
|
(21.6
|
)
|
$
|
48.9
|
$
|
64.5
|
$
|
(15.6
|
)
|
|||||||||||||||
| (1) | Excludes $0.5 million included in investing activities for 2012 related to distributions from GCF that exceeded cumulative equity earnings. We did not have distributions that exceeded cumulative equity earnings for 2011. |
| (2) | Net of capitalized interest paid of $13.6 million and $3.4 million included in investing activities for 2012 and 2011. |
Lower aggregate commodity prices were the primary factor in the changes in cash from customers, cash from derivative contracts, and cash paid for purchases in 2012 compared to 2011. In 2012, our derivative settlements were a net cash inflow, as opposed to a net outflow for 2011. The change in cash related to derivative counterparties reflects lower aggregate commodity prices compared to the higher aggregate fixed prices we receive on those derivative contracts. The increase in cash payments in other cash receipts (payments) during 2012 was mainly attributable to the fees related to the Badlands acquisition.
Cash Flow from Investing Activities - Partnership
The decrease in net cash used in investing activities for 2013 compared to 2012 was primarily due to a decrease in outlays for business acquisitions of $996.2 million and the absence of capital calls in 2013 at GCF ($16.8 million), partially offset by an increase in current capital expansion projects of $413.9 million and the purchase of material and supplies of $17.7 million related to our Badlands expansion.
The increase in net cash used in investing activities for 2012 compared to 2011 was primarily due to an increase in outlays for business acquisitions of $839.7 million and current capital expansion projects of $289.0 million, partially offset by lower maintenance capital expenditures of $5.8 million.
Cash Flow from Financing Activities - Partnership
The decrease in net cash provided by the Partnership’s financing activities for 2013 compared to 2012 was primarily due to a reduction in net borrowing under the TRP Revolver ($347.0 million), lower long-term issuance of Senior Notes ($375.0 million) and an increase in distributions to owners ($111.6 million), offset by higher net borrowings under the Securitization Facility of $279.7 million.
The Partnership’s primary financing activities during the periods are summarized in the following tables.
|
2013
|
Financing Activity
|
Source (Use)
(In millions)
|
Use of proceeds
|
|||
|
May
|
Issuance of the 4¼% Notes in May 2013
|
$
|
618.1
|
Redeem borrowings under 11¼% Notes; reduce outstanding borrowings under TRP Revolver and for general Partnership purposes
|
||
|
June
|
Redemption of $100.0 million face - 6⅜% Notes
|
(106.4
|
)
|
|
||
|
July
|
Redemption of $72.7 million face - 11¼% Note
|
(76.8
|
)
|
|
||
|
Various
|
Net repayments under TRP Revolver
|
(225.0
|
)
|
|
||
|
Various
|
Sale of common units - 2012 and 2013 EDAs
|
517.9
|
Redeem borrowings under 6⅜% Notes, reduce outstanding borrowings under TRP Revolver and general Partnership purposes
|
|||
|
Various
|
General partner contributions to maintain 2% interest
|
10.8
|
Reduce outstanding borrowings under the TRP Revolver and for general Partnership purposes
|
|||
|
Various
|
Net borrowings under the Securitization Facility
|
279.7
|
||||
|
|
|
|
||||
|
2012
|
Financing Activity
|
Source (Use)
(In millions)
|
Use of proceeds
|
|||
|
January
|
Sale of common units in a public offering
|
$
|
164.9
|
Reduce outstanding borrowings under the TRP Revolver and for general Partnership purposes
|
||
|
January
|
Issuance of the 6⅜% Notes
|
400.0
|
||||
|
October
|
Issuance of the 5¼% Senior Notes due 2023
|
400.0
|
Redeem remaining 8¼% Senior Notes and reduce borrowings under the TRP Revolver
|
|||
|
November/ December
|
Sale of common units in a public offering
|
378.6
|
Partially fund the Badlands acquisition
|
|||
|
December
|
Issuance of additional 5¼% Senior Notes due 2023
|
200.0
|
Partially fund the Badlands acquisition
|
|||
|
Various
|
Net borrowings under TRP Revolver
|
122.0
|
Reduce outstanding borrowings under the TRP Revolver and for general Partnership purposes
|
|||
|
Various
|
General partner contributions to maintain 2% interest
|
11.4
|
||||
|
|
|
|
||||
|
2011
|
Financing Activity
|
Source (Use)
(In millions)
|
Use of proceeds
|
|||
|
January/ February
|
Sale of common units in a public offering
|
$
|
298.0
|
Reduce outstanding borrowings under the TRP Revolver and for general Partnership purposes
|
||
|
February
|
Issuance of 6⅞% Notes
|
318.8
|
||||
|
February
|
Exchanged $158.6 million principal amount of our 6⅞% Notes for $158.6 million principal amount of our 11¼% Notes
|
158.6
|
Reduce outstanding borrowings under the 11¼% Notes
|
|||
|
Various
|
General partner contributions to maintain 2% interest
|
6.3
|
Reduce outstanding borrowings under the TRP Revolver and for general Partnership purposes
|
|||
Cash Flow Financing Activities - Non-Partnership
Financing activities provided a net source of cash compared to a use in 2012 primarily due to the purchase in 2012 of Partnership units for $47.0 million and an increase in distributions received of $45.6 million and an increase in borrowings on the TRC Revolver of $8.8 million, partially offset by an increase in dividends paid of $25.6 million.
The decrease in net cash provided by financing activities for 2012 compared to 2011 was primarily attributable to the purchase of 1,300,000 of the Partnership’s common units in January 2012, purchase of general partner units of the Partnership, payment of dividends, purchase of treasury stock and net payments to reduce long-term debt, partially offset by an increase in distributions received from the Partnership.
Distributions from the Partnership and Dividends of TRC
The following table details the distributions declared and/or paid by the Partnership for three years ended December 31, 2013 with respect to our 2% general partner interest, the associated IDRs and common units that we held during the periods indicated along with dividends declared by us to our shareholders for the same periods:
|
|
|
|
Cash Distributions
|
Dividend
|
Total
|
|||||||||||||||||||||||||
|
|
|
Cash
|
|
|
|
Distributions
|
Declared
|
Dividend
|
||||||||||||||||||||||
|
|
|
Distribution
|
Limited
|
General
|
|
to Targa
|
Per TRC
|
Declared to
|
||||||||||||||||||||||
|
For the Three
|
Date Paid
|
Per Limited
|
Partner
|
Partner
|
|
Resources
|
Common
|
Common
|
||||||||||||||||||||||
|
Months Ended
|
or to be Paid
|
Partner Unit
|
Units
|
Interest
|
IDRs
|
Corp. (1)
|
Share
|
Shareholders
|
||||||||||||||||||||||
|
|
|
|
|
|
|
|
|
|
||||||||||||||||||||||
|
|
|
(In millions, except per unit amounts)
|
||||||||||||||||||||||||||||
|
2013
|
|
|
|
|
|
|
|
|
||||||||||||||||||||||
|
December 31, 2013
|
February 14, 2014
|
$
|
0.7475
|
$
|
9.7
|
$
|
2.3
|
$
|
29.5
|
$
|
41.5
|
$
|
0.60750
|
$
|
25.6
|
|||||||||||||||
|
September 30, 2013
|
November 14, 2013
|
0.7325
|
9.5
|
2.2
|
26.9
|
38.6
|
0.57000
|
24.1
|
||||||||||||||||||||||
|
June 30, 2013
|
August 14, 2013
|
0.7150
|
9.3
|
2.0
|
24.6
|
35.9
|
0.53250
|
22.5
|
||||||||||||||||||||||
|
March 31, 2013
|
May 15, 2013
|
0.6975
|
9.0
|
1.9
|
22.1
|
33.0
|
0.49500
|
21.0
|
||||||||||||||||||||||
|
|
|
|||||||||||||||||||||||||||||
|
2012
|
|
|||||||||||||||||||||||||||||
|
December 31, 2012
|
February 14, 2013
|
$
|
0.6800
|
$
|
8.8
|
$
|
1.8
|
$
|
20.1
|
$
|
30.7
|
$
|
0.45750
|
$
|
19.4
|
|||||||||||||||
|
September 30, 2012
|
November 14, 2012
|
0.6625
|
8.6
|
1.5
|
16.1
|
26.2
|
0.42250
|
18.0
|
||||||||||||||||||||||
|
June 30, 2012
|
August 14, 2012
|
0.6425
|
8.3
|
1.5
|
14.4
|
24.2
|
0.39375
|
16.7
|
||||||||||||||||||||||
|
March 31, 2012
|
May 15, 2012
|
0.6225
|
8.1
|
1.4
|
12.7
|
22.2
|
0.36500
|
15.5
|
||||||||||||||||||||||
|
|
|
|||||||||||||||||||||||||||||
|
2011
|
|
|||||||||||||||||||||||||||||
|
December 31, 2011
|
February 14, 2012
|
$
|
0.6025
|
$
|
7.8
|
$
|
1.3
|
$
|
11.0
|
$
|
20.1
|
$
|
0.33625
|
$
|
14.3
|
|||||||||||||||
|
September 30, 2011
|
November 14, 2011
|
0.5825
|
6.8
|
1.2
|
8.8
|
16.8
|
0.30750
|
13.0
|
||||||||||||||||||||||
|
June 30, 2011
|
August 12, 2011
|
0.5700
|
6.6
|
1.2
|
7.8
|
15.6
|
0.29000
|
12.3
|
||||||||||||||||||||||
|
March 31, 2011
|
May 13, 2011
|
0.5575
|
6.5
|
1.1
|
6.8
|
14.4
|
0.27250
|
11.5
|
||||||||||||||||||||||
| (1) | Distributions to us comprise amounts attributable to our (i) limited partner units, (ii) general partner units, and (iii) IDRs. |
Capital Requirements
The Partnership’s capital requirements relate to capital expenditures, which are classified as expansion expenditures, maintenance expenditures or business acquisitions. Expansion capital expenditures improve the service capability of the existing assets, extend asset useful lives, increase capacities from existing levels, add capabilities, reduce costs or enhance revenues, and fund acquisitions of businesses or assets. Maintenance capital expenditures are those expenditures that are necessary to maintain the service capability of the Partnership’s existing assets, including the replacement of system components and equipment, which are worn, obsolete or completing their useful life, and expenditures to remain in compliance with environmental laws and regulations.
|
|
2013
|
2012
|
2011
|
|||||||||||||||||||||||||||||||||
|
|
Targa Resources Corp. Consolidated
|
Targa Resources Partners LP
|
TRC - Non-Partnership
|
Targa Resources Corp. Consolidated
|
Targa Resources Partners LP
|
TRC - Non-Partnership
|
Targa Resources Corp. Consolidated
|
Targa Resources Partners LP
|
TRC - Non-Partnership
|
|||||||||||||||||||||||||||
|
|
|
|
|
|
|
|
|
|
|
|||||||||||||||||||||||||||
|
|
(In millions)
|
|||||||||||||||||||||||||||||||||||
|
Capital expenditures:
|
|
|
|
|
|
|
|
|
|
|||||||||||||||||||||||||||
|
Business acquisitions, net of cash acquired (1)
|
$
|
-
|
$
|
-
|
$
|
-
|
$
|
996.2
|
$
|
996.2
|
$
|
-
|
$
|
156.5
|
$
|
156.5
|
$
|
-
|
||||||||||||||||||
|
Expansion
|
954.6
|
954.6
|
-
|
540.7
|
540.7
|
-
|
252.3
|
251.7
|
0.6
|
|||||||||||||||||||||||||||
|
Maintenance
|
79.9
|
79.9
|
-
|
76.3
|
76.0
|
0.3
|
83.4
|
81.8
|
1.6
|
|||||||||||||||||||||||||||
|
Gross
additions
|
1,034.5
|
1,034.5
|
-
|
1,613.2
|
1,612.9
|
0.3
|
492.2
|
490.0
|
2.2
|
|||||||||||||||||||||||||||
|
Transfers from materials and supplies to property, plant and equipment
|
(17.7
|
)
|
(17.7
|
)
|
- |
-
|
-
|
-
|
-
|
-
|
-
|
|||||||||||||||||||||||||
|
Change in capital project payables and accruals
|
(0.4
|
)
|
(0.4
|
)
|
-
|
(34.3
|
)
|
(34.4
|
)
|
0.1
|
(3.8
|
)
|
(4.8
|
)
|
1.0
|
|||||||||||||||||||||
|
Cash outlays for capital projects
|
$
|
1,013.6
|
$
|
1,013.6
|
$
|
-
|
$
|
1,578.9
|
$
|
1,578.5
|
$
|
0.4
|
$
|
488.4
|
$
|
485.2
|
$
|
3.2
|
||||||||||||||||||
| (1) | Excludes the Partnership’s investment in GCF of $16.8 million and $21.2 million for 2012 and 2011, which is accounted for as an equity investment. The Partnership did not have additional investment in GCF for 2013. Cash calls for expansion are reflected in Investment in unconsolidated affiliate in cash flows from investing activities on our Consolidated Statements of Cash Flows in our Consolidated Financial Statements. |
The Partnership estimates that its total growth capital expenditures for 2014 will be approximately $650 million on a gross basis, and maintenance capital expenditures net to its interest will be approximately $90 million. Given the Partnership’s objective of growth through acquisitions, expansions of existing assets and other internal growth projects, it anticipates that over time that it will invest significant amounts of capital to grow and acquire assets. Future expansion capital expenditures may vary significantly based on investment opportunities. The Partnership expects to fund future capital expenditures with funds generated from its operations, borrowings under the TRP Revolver and the Securitization Facility and proceeds from issuances of additional equity and debt offerings. Major organic growth projects for 2014 include:
|
·
|
International Exports.
The Partnership has commenced construction of Phase II of its international export expansion project at its Mont Belvieu facility and Galena Park Marine Terminal. Phase II will further expand the Partnership’s propane and butane international export capacity by approximately 2 MMBbl per month, with an expected completion during the third quarter of 2014. The Partnership expects that the total cost of both phases of its international export project to be approximately $480 million.
|
|
·
|
Badlands expansion program. During 2014, the Partnership anticipates that it will invest another $180 million for further expansion of its gathering and processing assets in North Dakota. |
|
·
|
North Texas Longhorn plant. The Partnership has started construction of a new 200 MMcf/d cryogenic processing plant for North Texas to meet increasing production and continued producer activity, with an anticipated completion in mid-2014. The Partnership expects to invest an estimated $180 million for the plant and associated projects. |
|
·
|
SAOU High Plains plant. The Partnership has started construction of a new 200 MMcf/d cryogenic processing plant and related gathering and compression facilities for SAOU to meet increasing production and continued producer activity on the eastern side of the Permian Basin, with an anticipated completion date in mid-2014. The Partnership expects to invest an estimated $225 million for the plant and associated projects. |
Additionally, the Partnership expects to have other growth capital expenditures in 2014 related to the continued build out of its gathering and processing systems and logistics capabilities.
Credit Facilities and Long-Term Debt
The following table summarizes our debt obligation as of December 31, 2013 (in millions):
|
Non-Partnership Obligations:
|
|
|||
|
TRC Senior secured revolving credit facility due October 2017
|
$
|
84.0
|
||
|
Partnership Obligations
|
||||
|
Senior secured revolving credit facility, due October 2017
|
395.0
|
|||
|
Senior unsecured notes, 7⅞% fixed rate, due July 2018
|
250.0
|
|||
|
Senior unsecured notes, 6⅞% fixed rate, due July 2021
|
483.6
|
|||
|
Unamortized discount
|
(28.0
|
)
|
||
|
Senior unsecured notes, 6⅜% fixed rate, due August 2022
|
300.0
|
|||
|
Senior unsecured notes, 5¼% fixed rate, due May 2023
|
600.0
|
|||
|
Senior unsecured notes, 4¼% fixed rate, due November 2023
|
625.0
|
|||
|
Accounts receivable Securitization Facility, due January 2014
|
279.7
|
|||
|
Total debt
|
$
|
2,989.3
|
||
We consolidate the debt of the Partnership with that of our own; however, we do not have the contractual obligation to make interest or principal payments with respect to the debt of the Partnership. Our debt obligations do not restrict the ability of the Partnership to make distributions to us. TRC’s Credit Agreement has restrictions and covenants that may limit our ability to pay dividends to our stockholders. Please read “—TRC Senior Secured Credit Agreement” for a discussion of the restrictions and covenants in TRC’s Credit Agreement.
Compliance with Debt Covenants
As of December 31, 2013, both we and the Partnership were in compliance with the covenants contained in our various debt agreements.
TRC Senior Secured Credit Agreement
In October 2012, we entered into a Credit Agreement that replaced our existing variable rate Senior Secured Revolving Credit Facility due July 2014 with a new variable rate Senior Secured Credit Facility due October 3, 2017 (the “TRC Revolver”). The TRC Revolver increases available commitments to $150.0 million from $75.0 million, allows us to request up to an additional $100.0 million in commitment increases and includes a $30.0 million swing line sub-facility. Outstanding letters of credit and related outstanding reimbursement obligations may not exceed $50.0 million in the aggregate.
In October 2012, using proceeds from our TRC Revolver and cash on hand, we paid $88.8 million to acquire the remaining $89.3 million of outstanding borrowings under the TRC Holdco Loan Facility.
The TRC Revolver bears interest, at our option, at either (a) a base rate equal to the highest of the prime rate of Deutsche Bank Trust Company Americas, the administrative agent, the federal funds rate plus 0.5% and the one-month LIBOR rate plus 1.0%, plus an applicable margin ranging from 1.75% to 2.5% (dependent upon the Company’s consolidated leverage ratio), or (b) LIBOR plus an applicable margin ranging from 2.75% to 3.5% (dependent upon the Company’s consolidated leverage ratio).
We are required to pay a commitment fee ranging from 0.375% to 0.5% (dependent upon the Company’s consolidated leverage ratio) on the daily average unused portion of the TRC Revolver. Additionally, issued and undrawn letters of credit bear interest at an applicable ranging from 2.75% to 3.5% (dependent upon the Company’s consolidated leverage ratio).
The TRC Revolver is secured by substantially all of the Company’s assets. The TRC Revolver requires us to maintain a consolidated leverage ratio (the ratio of consolidated funded indebtedness to consolidated adjusted EBITDA) of no more than 4.00 to 1.00. The TRC Revolver restricts our ability to make dividends to shareholders if, on a pro forma basis after giving effect to such dividend, (a) any default or event of default has occurred and is continuing or (b) our consolidated leverage ratio exceeds 4.00 to 1.00. In addition, the TRC Revolver includes various covenants that may limit, among other things, our ability to incur indebtedness, grant liens, make investments, repay or amend the terms of certain other indebtedness, merge or consolidate, sell assets and engage in transactions with affiliates.
The Partnership’s Revolving Credit Agreement
In October 2012, the Partnership entered into a Second Amended and Restated Credit Agreement that amended and replaced the Partnership’s existing variable rate Senior Secured Credit Facility due July 2015 (the “Previous Revolver”) to provide for the TRP Revolver due October 3, 2017. The TRP Revolver increased available commitments to $1.2
billion from $1.1
billion and allows the Partnership to request up to an additional $300.0
million in commitment increases.
For 2013, the Partnership had gross borrowings under its TRP Revolver of $1,613.0 million, and repayments totaling $1,838.0 million, for a net decrease for the year ended December 31, 2013 of $225.0 million. The TRP Revolver balance at December 31, 2013 was $395.0 million.
The TRP Revolver bears interest, at the Partnership’s option, either at the base rate or the Eurodollar rate. The base rate is equal to the highest of: (i) Bank of America’s prime rate; (ii) the federal funds rate plus 0.5%; or (iii) the one-month LIBOR rate plus 1.0%, plus an applicable margin ranging from 0.75% to 1.75%. The Eurodollar rate is equal to LIBOR plus an applicable margin ranging from 1.75% to 2.75%.
The Partnership is required to pay a commitment fee equal to an applicable rate ranging from 0.3% to 0.5% times the actual daily average unused portion of the TRP Revolver. Additionally, issued and undrawn letters of credit bear interest at an applicable rate ranging from 1.75% to 2.75%.
The TRP Revolver is collateralized by a majority of the Partnership’s assets. Borrowings are guaranteed by the Partnership’s restricted subsidiaries.
The TRP Revolver restricts the Partnership’s ability to make distributions of available cash to unitholders if a default or an event of default (as defined in the TRP Revolver) exists or would result from such distribution. The TRP Revolver requires the Partnership to maintain a ratio of consolidated funded indebtedness to consolidated adjusted EBITDA of no more than 5.50 to 1.00. The TRP Revolver also requires the Partnership to maintain a ratio of consolidated EBITDA to consolidated interest expense of no less than 2.25 to 1.00. In addition, the TRP Revolver contains various covenants that may limit, among other things, the Partnership’s ability to incur indebtedness, grant liens, make investments, repay or amend the terms of certain other indebtedness, merge or consolidate, sell assets, and engage in transactions with affiliates (in each case, subject to the Partnership’s right to incur indebtedness or grant liens in connection with, and convey accounts receivable as part of, a permitted receivables financing).
The Partnership’s Senior Unsecured Notes
In February 2011, the Partnership exchanged $158.6 million principal amount of its 6⅞% Senior Notes due 2021 (the “6⅞% Notes”) plus payments of $28.6 million, including $0.9 million of accrued interest, for $158.6 million aggregate principal amount of its 11¼% Notes. The holders of the exchanged Notes are subject to the provisions of the 6⅞% Notes described below. The debt covenants related to the remaining $72.7 million of face value of the 11¼% Notes were removed. This exchange was accounted for as a debt modification whereby the financial effects of the exchange will be recognized over the term of the new debt issue.
In January 2012, the Partnership privately placed $400.0 million in aggregate principal amount of its 6⅜% Notes. The 6⅜% Notes resulted in approximately $395.5 million of net proceeds,
which were used to reduce borrowings under the TRP Revolver and for general partnership purposes.
In October 2012, $400.0 million in aggregate principal amount of the Partnership’s 5¼% Notes were issued by the Partnership at 99.5% of the face amount, resulting in gross proceeds of $398.0 million. An additional $200.0 million in aggregate principal amount of 5¼% Notes were issued in December 2012 at 101.0% of the face amount, resulting in gross proceeds of $202.0 million. Both issuances are treated as a single class of debt securities and have identical terms.
In November 2012, the Partnership redeemed the outstanding 8¼% Notes at a price of 104.125% plus accrued interest through the redemption date. The redemption resulted in an $11.1 million loss, including the write off of unamortized debt issue costs.
In May 2013, the Partnership privately placed $625.0 million in aggregate principal amount of the 4¼% Notes. The 4¼% Notes resulted in approximately $618.1 million of net proceeds, which were used to reduce borrowings under the Partnership’s TRP Revolver and for general partnership purposes.
In June 2013, the Partnership redeemed $100 million of the outstanding 6⅜% Notes at a redemption price of 106.375% plus accrued interest through the redemption date. The redemption resulted in a $7.4 million loss, including the write-off of unamortized debt issue costs.
In July 2013, the Partnership redeemed the outstanding 11¼% Notes at a price of 105.625% plus accrued interest through the redemption date. The redemption resulted in a $7.4 million loss, including the write-off of unamortized debt issue costs.
The terms of the Partnership’s senior unsecured notes outstanding as of December 31, 2013 were as follows:
|
Note Issue
|
|
Issue Date
|
|
Per Annum Interest Rate
|
|
Due Date
|
|
Dates Interest Paid
|
|
"7
⅞
% Notes"
|
|
August 2010
|
|
7
⅞
%
|
|
October 15, 2018
|
|
April & October 15
th
|
|
"6
⅞
% Notes"
|
|
February 2011
|
|
6
⅞
%
|
|
February 1, 2021
|
|
February & August 1
st
|
|
"6
⅜
% Notes"
|
|
January 2012
|
|
6
⅜
%
|
|
August 1, 2022
|
|
February & August 1
st
|
|
"5
¼
% Notes"
|
|
Oct / Dec 2012
|
|
5
¼
%
|
|
May 1, 2023
|
|
May & November 1
st
|
|
"4
¼
% Notes"
|
|
May 2013
|
|
4¼
%
|
|
November 15, 2023
|
|
May & November 15
th
|
All issues of unsecured senior notes are obligations that rank pari passu in right of payment with existing and future senior indebtedness, including indebtedness under the TRP Revolver. They are senior in right of payment to any of the Partnership’s future subordinated indebtedness and are unconditionally guaranteed by the Partnership. These notes are effectively subordinated to all secured indebtedness under the TRP Revolver, which is secured by a majority of its assets and the Securitization Facility, which is secured by accounts receivable pledged under it, to the extent of the value of the collateral securing that indebtedness. Interest on all issues of senior unsecured notes is payable semi-annually in arrears.
The Partnership’s senior unsecured notes and associated indenture agreements restrict its ability to make distributions to unitholders in the event of default (as defined in the indentures). The indentures also restrict the Partnership’s ability and the ability of certain of the Partnership’s subsidiaries to: (i) incur additional debt or enter into sale and leaseback transactions; (ii) pay certain distributions on or repurchase equity interests (only if such distributions do not meet specified conditions); (iii) make certain investments; (iv) incur liens; (v) enter into transactions with affiliates; (vi) merge or consolidate with another company; and (vii) transfer and sell assets. These covenants are subject to a number of important exceptions and qualifications. If at any time when the notes are rated investment grade by both Moody’s Investors Service, Inc. and Standard & Poor’s Corporation and no Default or Event of Default (each as defined in the indentures) has occurred and is continuing, many of such covenants will terminate and we will cease to be subject to such covenants.
Accounts Receivable Securitization Facility
In January 2013, the Partnership entered into a Securitization Facility that provides up to $200 million of borrowing capacity at commercial paper or LIBOR market index rates plus a margin through January 2014. Under this Securitization Facility, one of the Partnership’s consolidated subsidiaries (TLMT) sells or contributes receivables, without recourse, to another of the Partnership’s consolidated subsidiaries (TRLLC), a special purpose consolidated subsidiary created for the sole purpose of this Securitization Facility. TRLLC, in turn, sells an undivided percentage ownership in the eligible receivables to a third-party financial institution. Receivables up to the amount of the outstanding debt under the Securitization Facility are not available to satisfy the claims of the creditors of TLMT or us. Any excess receivables are eligible to satisfy the claims of creditors of TLMT or us.
In December 2013, the Partnership entered into an amendment to its Securitization Facility to increase the borrowing capacity to $300 million and extend the termination date to December 12, 2014. As of December 31, 2013, total funding under this Securitization Facility was $279.7 million.
Off-Balance Sheet Arrangements
We currently have no off-balance sheet arrangements as defined by the SEC. See “Contractual Obligations” below and “Commitments and Contingencies” included under Note 17 of our “Consolidated Financial Statements” for a discussion of our commitments and contingencies.
Contractual Obligations
The following is a summary of certain contractual obligations over the next several years, including the disclosures related to debt and lease obligations, contained in Notes 10 and 16 of the “Consolidated Financial Statements” of this Annual Report.
|
|
Payments Due By Period
|
|||||||||||||||||||
|
|
|
Less Than
|
|
|
More Than
|
|||||||||||||||
|
Contractual Obligations
|
Total
|
1 Year
|
1-3 Years
|
3-5 Years
|
5 Years
|
|||||||||||||||
|
|
(In millions, except volumetric information)
|
|||||||||||||||||||
|
Non-Partnership Obligations:
|
|
|
|
|
|
|||||||||||||||
|
Debt obligations (1)
|
$
|
84.0
|
$
|
-
|
$
|
-
|
$
|
84.0
|
$
|
-
|
||||||||||
|
Interest on debt obligations (2)
|
12.7
|
2.6
|
5.4
|
4.7
|
-
|
|||||||||||||||
|
Operating leases (3)
|
10.3
|
2.7
|
5.4
|
2.2
|
-
|
|||||||||||||||
|
Partnership Obligations:
|
||||||||||||||||||||
|
Debt obligations (1)
|
2,933.3
|
279.7
|
-
|
645.0
|
2,008.6
|
|||||||||||||||
|
Interest on debt obligations (2)
|
937.3
|
106.3
|
227.0
|
252.0
|
352.0
|
|||||||||||||||
|
Operating leases (3)
|
42.3
|
8.0
|
15.2
|
10.7
|
8.4
|
|||||||||||||||
|
Pipeline capacity and throughput agreements (4), (8)
|
152.3
|
19.1
|
34.8
|
32.8
|
65.6
|
|||||||||||||||
|
Land site lease and right-of-way (5)
|
7.9
|
1.7
|
3.2
|
3.0
|
-
|
|||||||||||||||
|
Commodities (6), (8)
|
495.0
|
495.0
|
-
|
-
|
-
|
|||||||||||||||
|
Purchase commitments (7), (8)
|
240.9
|
236.8
|
4.1
|
-
|
-
|
|||||||||||||||
|
|
$
|
4,916.0
|
$
|
1,151.9
|
$
|
295.1
|
$
|
1,034.4
|
$
|
2,434.6
|
||||||||||
|
Commodity volumetric commitments:
|
||||||||||||||||||||
|
Natural Gas (MMBtu)
|
40.9
|
40.9
|
-
|
-
|
-
|
|||||||||||||||
|
NGL and petroleum products (millions of gallons)
|
235.6
|
235.6
|
-
|
-
|
-
|
|||||||||||||||
|
(1)
|
Represents scheduled future maturities of consolidated debt obligations for the periods indicated.
|
|
(2)
|
Represents interest expense on debt obligations based on both fixed debt interest rates and prevailing December 31, 2013 rates for floating debt.
|
|
(3)
|
Includes minimum payments on lease obligations for office space, railcars and tractors.
|
|
(4)
|
Consists of pipeline capacity payments for firm transportation and throughput and deficiency agreements.
|
|
(5)
|
Land site lease and right-of-way provides for surface and underground access for gathering, processing and distribution assets that are located on property not owned by the Partnership. These agreements expire at various dates through 2099.
|
|
(6)
|
Includes natural gas and NGL purchase commitments.
|
|
(7)
|
Includes commitments for capital expenditures and operating expenses.
|
| (8) |
A purchase obligation means an agreement to purchase goods or services that is enforceable, legally binding and specifies all significant terms, including: fixed minimum or variable prices provisions; and the approximate timing of the transaction.
|
Critical Accounting Policies and Estimates
The preparation of financial statements in accordance with GAAP requires our management to make estimates and assumptions that affect the reported amounts of assets and liabilities and disclosure of contingent assets and liabilities at the date of the financial statements and the reported amounts of revenues and expenses during the period. Actual results could differ from these estimates. The policies and estimates discussed below are considered by management to be critical to an understanding of our financial statements because their application requires the most significant judgments from management in estimating matters for financial reporting that are inherently uncertain. See the description of our accounting policies in the notes to the financial statements for additional information about our critical accounting policies and estimates.
Property, Plant and Equipment and Intangibles
In general, depreciation and amortization is the systematic and rational allocation of an asset’s cost, less its residual value (if any), to the period it benefits. Our and the Partnership’s property, plant and equipment are depreciated using the straight-line method over the estimated useful lives of the assets. The estimate of depreciation incorporates assumptions regarding the useful economic lives and residual values of our assets. Amortization expense attributable to intangible assets is recorded in a manner that closely resembles the expected pattern in which the Partnership benefits from services provided to its customers. At the time assets are placed in service, we believe such assumptions are reasonable; however, circumstances may develop that would cause us to change these assumptions, which would change our depreciation/amortization amounts prospectively. Examples of such circumstances include:
|
·
|
changes in energy prices; |
|
·
|
changes in competition; |
|
·
|
changes in laws and regulations that limit the estimated economic life of an asset; |
|
·
|
changes in technology that render an asset obsolete; |
|
·
|
changes in expected salvage values; and |
|
·
|
changes in the forecast life of applicable resources basins. |
We and the Partnership evaluate long-lived assets, including related intangibles, of identifiable business activities for impairment when events or changes in circumstances indicate, in management's judgment, that the carrying value of such assets may not be recoverable.
There have been no material changes impacting long-lived assets.
Revenue Recognition
The Partnership’s operating revenues are primarily derived from the following activities:
|
·
|
sales of natural gas, NGLs, condensate and petroleum products; |
|
·
|
services related to compressing, gathering, treating, and processing of natural gas; |
|
·
|
services related to gathering, storing and terminaling of crude oil; and |
|
·
|
services related to NGL fractionation, terminaling and storage, transportation and treating. |
We recognize revenues when all of the following criteria are met: (1) persuasive evidence of an exchange arrangement exists, if applicable; (2) delivery has occurred or services have been rendered; (3) the price is fixed or determinable and (4) collectability is reasonably assured.
Price Risk Management (Hedging)
The Partnership’s net income and cash flows are subject to volatility stemming from changes in commodity prices and interest rates. To reduce the volatility of our cash flows, the Partnership has entered into derivative financial instruments related to a portion of its equity volumes to manage the purchase and sales prices of commodities. We are exposed to the credit risk of the Partnership’s counterparties in these derivative financial instruments. We also monitor NGL inventory levels with a view to mitigating losses related to downward price exposure.
The Partnership’s cash flow is affected by the derivative financial instruments it enters into to the extent these instruments are settled by (i) making or receiving a payment to/from the counterparty or (ii) making or receiving a payment for entering into a contract that exactly offsets the original derivative financial instrument. Typically a derivative financial instrument is settled when the physical transaction that underlies the derivative financial instrument occurs.
One of the primary factors that can affect the Partnership’s operating results each period is the price assumptions used to value the Partnership’s derivative financial instruments, which are reflected at their fair values in the balance sheet. The relationship between the derivative financial instruments and the hedged item must be highly effective in achieving the offset of changes in cash flows attributable to the hedged risk both at the inception of the derivative financial instrument and on an ongoing basis. Hedge accounting is discontinued prospectively when a derivative financial instrument becomes ineffective. Gains and losses deferred in other comprehensive income related to cash flow hedges for which hedge accounting has been discontinued remain deferred until the forecasted transaction occurs. If it is probable that a hedged forecasted transaction will not occur, deferred gains or losses on the derivative financial instrument are reclassified to earnings immediately.
The estimated fair value of the Partnership’s derivative financial instruments was a net liability of $4.3 million as of December 31, 2013, net of an adjustment for credit risk. The credit risk adjustment is based on the default probabilities by year as indicated by the counterparties’ credit default swap transactions. These default probabilities have been applied to the unadjusted fair values of the derivative financial instruments to arrive at the credit risk adjustment, which is immaterial for all periods covered by this Annual Report. The Partnership has an active credit management process which is focused on controlling loss exposure to bankruptcies or other liquidity issues of counterparties. If a financial instrument counterparty were to declare bankruptcy, we and the Partnership would be exposed to the loss of fair value of the financial instrument transaction with that counterparty, less any liability from the partnership’s master netting arrangements. Ignoring the adjustment for credit risk, if a bankruptcy by a financial instrument counterparty impacted 10% of the fair value of commodity-based financial instruments that are in an asset position, we estimate that the Partnership’s operating income would decrease by $0.3 million in the year of the bankruptcy.
Use of Estimates
When preparing financial statements in conformity with GAAP, management must make estimates and assumptions based on information available at the time. These estimates and assumptions affect the reported amounts of assets, liabilities, revenues and expenses, as well as the disclosures of contingent assets and liabilities as of the date of the financial statements. Estimates and judgments are based on information available at the time such estimates and judgments are made. Adjustments made with respect to the use of these estimates and judgments often relate to information not previously available. Uncertainties with respect to such estimates and judgments are inherent in the preparation of financial statements. Estimates and judgments are used in, among other things, (1) estimating unbilled revenues, product purchases and operating and general and administrative costs, (2) developing fair value assumptions, including estimates of future cash flows and discount rates, (3) analyzing long-lived assets for possible impairment, (4) estimating the useful lives of assets and (5) determining amounts to accrue for contingencies, guarantees and indemnifications. Actual results, therefore, could differ materially from estimated amounts.
Recent Accounting Pronouncements
For a discussion of recent accounting pronouncements that will affect us, see “Recent Accounting Pronouncements” included under Note 3 of our “Consolidated Financial Statements.”
Our exposure to market risk is largely derivative of the Partnership’s exposure to market risk. The Partnership’s principal market risks are its exposure to changes in commodity prices, particularly to the prices of natural gas, NGLs and crude oil, changes in interest rates, and nonperformance by its customers. Neither we nor the Partnership use risk-sensitive instruments for trading purposes.
Commodity Price Risk
A significant portion of the Partnership’s revenues are derived from percent-of-proceeds contracts under which it receives a portion of the natural gas and/or NGLs or equity volumes as payment for services. The prices of natural gas and NGLs are subject to fluctuations in response to changes in supply, demand, market uncertainty and a variety of additional factors beyond the Partnership’s control. The Partnership monitors these risks and enters into hedging transactions designed to mitigate the impact of commodity price fluctuations on its business. Cash flows from a derivative instrument designated as a hedge are classified in the same category as the cash flows from the item being hedged.
The primary purpose of the commodity risk management activities is to hedge some of the exposure to commodity price risk and reduce fluctuations in the Partnership’s operating cash flow despite fluctuations in commodity prices. In an effort to reduce the variability of the Partnership’s cash flows, as of December 31, 2013, the Partnership has hedged the commodity price associated with a portion of its expected (i) natural gas equity volumes in Field Gathering and Processing Operations and (ii) NGL and condensate equity volumes predominately in Field Gathering and Processing Operations as well as in the LOU portion of the Coastal Gathering and Processing operations that result from its percent-of-proceeds processing arrangements by entering into derivative instruments. The Partnership hedges a higher percentage of its expected equity volumes in the current year compared to future years, in which it hedges incrementally lower percentages of expected equity volumes. With swaps, the Partnership typically receives an agreed fixed price for a specified notional quantity of natural gas or NGL and it pays the hedge counterparty a floating price for that same quantity based upon published index prices. Since the Partnership receives from its customers substantially the same floating index price from the sale of the underlying physical commodity, these transactions are designed to effectively lock-in the agreed fixed price in advance for the volumes hedged. In order to avoid having a greater volume hedged than its actual equity volumes, the Partnership typically limits its use of swaps to hedge the prices of less than its expected natural gas and NGL equity volumes. The Partnership utilizes purchased puts (or floors) and calls (or caps) to hedge additional expected equity commodity volumes without creating volumetric risk. The Partnership may buy calls in connection with swap positions to create a price floor with upside. The Partnership intends to continue to manage its exposure to commodity prices in the future by entering into derivative transactions using swaps, collars, purchased puts (or floors) or other derivative instruments as market conditions permit.
The Partnership has tailored its hedges to generally match the NGL product composition and the NGL and natural gas delivery points to those of its physical equity volumes. The NGL hedges cover specific NGL products based upon the expected equity NGL composition. The Partnership believes this strategy avoids uncorrelated risks resulting from employing hedges on crude oil or other petroleum products as “proxy” hedges of NGL prices. The natural gas and NGL hedges’ fair values are based on published index prices for delivery at various locations which closely approximate the actual natural gas and NGL delivery points. A portion of the Partnership’s condensate sales are hedged using crude oil hedges that are based on the NYMEX futures contracts for West Texas Intermediate light, sweet crude.
These commodity price hedging transactions are typically documented pursuant to a standard International Swap Dealers Association form with customized credit and legal terms. The principal counterparties (or, if applicable, their guarantors) have investment grade credit ratings. The Partnership’s payment obligations in connection with substantially all of these hedging transactions and any additional credit exposure due to a rise in natural gas and NGL prices relative to the fixed prices set forth in the hedges are secured by a first priority lien in the collateral securing its senior secured indebtedness that ranks equal in right of payment with liens granted in favor of its senior secured lenders. Absent federal regulations resulting from the Dodd-Frank Act, and as long as this first priority lien is in effect, the Partnership expects to have no obligation to post cash, letters of credit or other additional collateral to secure these hedges at any time, even if a counterparty’s exposure to the Partnership’s credit increases over the term of the hedge as a result of higher commodity prices or because there has been a change in the Partnership’s creditworthiness. A purchased put (or floor) transaction does not expose the Partnership’s counterparties to credit risk, as the Partnership has no obligation to make future payments beyond the premium paid to enter into the transaction, however, the Partnership is exposed to the risk of default by the counterparty, which is the risk that the counterparty will not honor its obligation under the put transaction.
For all periods presented, the Partnership has entered into hedging arrangements for a portion of its forecasted equity volumes. Floor volumes and floor pricing are based solely on purchased puts (or floors). During the years ended December 31, 2013, 2012 and 2011, our operating revenues were increased (decreased) by net hedge adjustments on commodity derivative contracts of $21.2 million, $43.2 million and $(33.9) million. The net hedge adjustments that impact our consolidated revenues (but do not affect the Partnership’s revenues) include amortization of OCI related to hedges terminated and re-assigned upon the Partnership’s acquisition of Versado in 2010, as well as OCI related to terminations of commodity derivatives in July 2008.
As of December 31, 2013, the Partnership had the following derivative instruments, which are designated as hedging instruments, and that will settle during the years ending below:
|
Natural Gas
|
||||||||||||||||||||||
|
Instrument
|
|
Price
|
MMBtu/d
|
|
||||||||||||||||||
|
Type
|
Index
|
$/MMBtu
|
2014
|
2015
|
2016
|
Fair Value
|
||||||||||||||||
|
|
|
|
|
|
|
(In millions)
|
||||||||||||||||
|
Swap
|
IF-WAHA
|
3.88
|
29,780
|
|
|
$
|
(1.9
|
)
|
||||||||||||||
|
Swap
|
IF-WAHA
|
3.97
|
18,736
|
|
(0.1
|
)
|
||||||||||||||||
|
Swap
|
IF-WAHA
|
4.02
|
14,436
|
0.3
|
||||||||||||||||||
|
Total Swaps
|
|
29,780
|
18,736
|
14,436
|
||||||||||||||||||
|
Swap
|
IF-PB
|
3.80
|
11,966
|
(0.9
|
)
|
|||||||||||||||||
|
Swap
|
IF-PB
|
4.02
|
11,076
|
0.2
|
||||||||||||||||||
|
Swap
|
IF-PB
|
4.22
|
7,608
|
0.6
|
||||||||||||||||||
|
Total Swaps
|
|
11,966
|
11,076
|
7,608
|
||||||||||||||||||
|
Swap
|
IF-NGPL MC
|
3.58
|
6,304
|
(0.9
|
)
|
|||||||||||||||||
|
Swap
|
IF-NGPL MC
|
3.84
|
4,739
|
0.1
|
||||||||||||||||||
|
Swap
|
IF-NGPL MC
|
3.93
|
3,456
|
0.4
|
||||||||||||||||||
|
Total Swaps
|
|
6,304
|
4,739
|
3,456
|
||||||||||||||||||
|
Total
|
|
48,050
|
34,551
|
25,500
|
||||||||||||||||||
|
|
|
$
|
(2.2
|
)
|
||||||||||||||||||
|
NGL
|
||||||||||||||
|
Instrument
|
|
Price
|
Bbl/d
|
|
||||||||||
|
Type
|
Index
|
$/Gal
|
2014
|
Fair Value
|
||||||||||
|
|
|
|
|
(In millions)
|
||||||||||
|
Swap
|
OPIS-MB
|
1.31
|
1,125
|
$
|
1.5
|
|||||||||
|
Total
|
|
1,125
|
||||||||||||
|
|
|
$
|
1.5
|
|||||||||||
|
Condensate
|
||||||||||||||
|
Instrument
|
|
Price
|
Bbl/d
|
|
||||||||||
|
Type
|
Index
|
$/Bbl
|
2014
|
Fair Value
|
||||||||||
|
|
|
|
|
(In millions)
|
||||||||||
|
Swap
|
NY-WTI
|
91.86
|
2,450
|
$
|
(3.3
|
)
|
||||||||
|
Total
|
|
2,450
|
||||||||||||
|
|
|
$
|
(3.3
|
)
|
||||||||||
These contracts may expose the Partnership to the risk of financial loss in certain circumstances. Generally, the Partnership’s hedging arrangements provide protection on the hedged volumes if prices decline below the prices at which these hedges are set. If prices rise above the prices at which they have been hedged, the Partnership will receive less revenue on the hedged volumes than it would receive in the absence of hedges (other than with respect to purchased calls).
The Partnership accounts for the fair value of its financial assets and liabilities using a three-tier fair value hierarchy, which prioritizes the significant inputs used in measuring fair value. These tiers include: Level 1, defined as observable inputs such as quoted prices in active markets; Level 2, defined as inputs other than quoted prices in active markets that are either directly or indirectly observable; and Level 3, defined as unobservable inputs in which little or no market data exists, therefore requiring an entity to develop its own assumptions. The Partnership values its derivative contracts utilizing a discounted cash flow model for swaps and a standard option pricing model for options, based on inputs that are readily available in public markets. For the contracts that have inputs from quoted prices, the classification of these instruments is Level 2 within the fair value hierarchy. For those contracts which the Partnership is unable to obtain quoted prices for at least 90% of the full term of the commodity swap and options, the valuations are classified as Level 3 within the fair value hierarchy. See Note 15 of the “Consolidated Financial Statements” in this Annual Report for more information regarding classifications within the fair value hierarchy.
Interest Rate Risk
We are exposed to the risk of changes in interest rates, primarily as a result of variable rate borrowings under the TRC Revolver. The Partnership is exposed to the risk of changes in interest rates, primarily as a result of variable rate borrowings under its TRP Revolver and its securitization facility. As of December 31, 2013, neither we nor the Partnership have any interest rate hedges. However, we or the Partnership may in the future enter into interest rate hedges intended to mitigate the impact of changes in interest rates on cash flows. To the extent that interest rates increase, interest expense for the TRC Revolver, the TRP Revolver and the Partnership’s Securitization Facility will also increase. As of December 31, 2013, the Partnership had $674.7 million in variable rate borrowings under its TRP Revolver and its Securitization Facility, and we had variable rate borrowings of $84.0 million under our TRC Revolver. A hypothetical change of 100 basis points in the interest rate of variable rate debt would impact the Partnership’s annual interest expense by $6.7 million and the TRC Non-Partnership annual interest expense by $0.8 million.
Counterparty Credit Risk
The Partnership is subject to risk of losses resulting from nonpayment or nonperformance by its counterparties. The credit exposure related to commodity derivative instruments is represented by the fair value of the asset position (i.e. the fair value of expected future receipts) at the reporting date. Should the creditworthiness of one or more of the counterparties decline, the Partnership’s ability to mitigate nonperformance risk is limited to a counterparty agreeing to either a voluntary termination and subsequent cash settlement or a novation of the derivative contract to a third party. In the event of a counterparty default, the Partnership may sustain a loss and its cash receipts could be negatively impacted.
As of December 31, 2013 affiliates of Bank of America Merrill Lynch (“BAML”), Natixis Securities Americas LLC (“Natixis”) and Barclays PLC (“Barclays”) accounted for 37%, 26% and 24% of the Partnership’s counterparty credit exposure related to commodity derivative instruments. BAML, Natixis and Barclays are major financial institutions that possess investment grade credit ratings based upon minimum credit ratings assigned by Moody’s Investors Service, Inc. and Standard & Poor’s Corporation.
Customer Credit Risk
The Partnership extends credit to customers and other parties in the normal course of business. The Partnership has established various procedures to manage its credit exposure, including initial credit approvals, credit limits and terms, letters of credit and rights of offset. The Partnership also uses prepayments and guarantees to limit credit risk to ensure that its established credit criteria are met.
The Partnership has an active credit management process which is focused on controlling loss exposure to bankruptcies or other liquidity issues of counterparties. If an assessment of uncollectible accounts resulted in a 1% reduction of the Partnership’s third-party accounts receivable, annual operating income would decrease by $6.6 million in the year of the assessment.
Our “Consolidated Financial Statements,” together with the report of our independent registered public accounting firm, begin on page F-1 of this Annual Report.
None.
Evaluation of Disclosure Controls and Procedures
Management, under the supervision of and with the participation of our Chief Executive Officer and Chief Financial Officer, has evaluated the design and effectiveness of our disclosure controls and procedures, as such term is defined in Rules 13a-15(e) and 15d-15(e) under the Securities Exchange Act of 1934, as amended (the “Exchange Act”) as of the end of the period covered in this Annual Report. Based on such evaluation, our Chief Executive Officer and Chief Financial Officer have concluded that, as of December 31, 2013, our disclosure controls and procedures were designed at the reasonable assurance level and, as of the end of the period covered in this Annual Report, our disclosure controls and procedures are effective at the reasonable assurance level to provide that information required to be disclosed in our reports filed or submitted under the Exchange Act is (i) recorded, processed, summarized and reported within the time periods specified in the rules and forms of the SEC and (ii) accumulated and communicated to management, including our principal executive officer and principal financial officer, as appropriate, to allow for timely decisions regarding required disclosure.
Internal Control Over Financial Reporting
(a) Management’s Report on Internal Control Over Financial Reporting
Management is responsible for establishing and maintaining adequate internal control over financial reporting, as such term is defined in Exchange Act Rules 13a-15(f) and 15d-15(f). Management, including the Chief Executive Officer and Chief Financial Officer, conducted an evaluation of the effectiveness of the internal control over financial reporting based on the report entitled “Internal Control — Integrated Framework” issued by the Committee of Sponsoring Organizations of the Treadway Commission in 1992. Based on the results of this evaluation, management concluded that the internal control over financial reporting was effective as of December 31, 2013, as stated in its report included in our “Consolidated Financial Statements” on page F-2 of this Annual Report, which is incorporated herein by reference.
(b) Changes in Internal Control Over Financial Reporting
During the three months ended December 31, 2013, there were no changes in our internal control over financial reporting that have materially affected or are reasonably likely to materially affect, our internal control over financial reporting.
None.
PART III
Our executive officers listed below serve in the same capacity for the general partner and devote their time as needed to conduct the business and affairs of both the Company and the Partnership. Because our only cash-generating assets are direct and indirect partnership interests in the Partnership, we expect that our executive officers will devote a substantial majority of their time to the Partnership’s business. We expect the amount of time that our executive officers devote to our business as opposed to the Partnership’s business in future periods will not be substantial unless significant changes are made to the nature of our business.
Our directors hold office until the earlier of their death, resignation, removal or disqualification or until their successors have been elected and qualified. Officers serve at the discretion of the board of directors. There are no family relationships among any of our directors or executive officers.
The following table sets forth certain information with respect to our directors, executive officers and other officers as of February 10, 2014:
|
Name
|
|
Age
|
|
Position
|
|
Rene R. Joyce
|
|
66
|
|
Executive Chairman of the Board and Director
|
|
Joe Bob Perkins
|
|
53
|
|
Chief Executive Officer and Director
|
|
James W. Whalen
|
|
72
|
|
Advisor to Chairman and CEO and Director
|
|
Michael A. Heim
|
|
65
|
|
President and Chief Operating Officer
|
|
Jeffrey J. McParland
|
|
59
|
|
President-Finance and Administration
|
|
Roy E. Johnson
|
|
69
|
|
Executive Vice President
|
|
Paul W. Chung
|
|
53
|
|
Executive Vice President, General Counsel and Secretary
|
|
Matthew J. Meloy
|
|
36
|
|
Senior Vice President, Chief Financial Officer and Treasurer
|
|
John R. Sparger
|
|
60
|
|
Senior Vice President and Chief Accounting Officer
|
|
Charles R. Crisp
|
|
66
|
|
Director
|
|
Peter R. Kagan
|
|
45
|
|
Director
|
|
Chris Tong
|
|
57
|
|
Director
|
|
Ershel C. Redd Jr.
|
|
66
|
|
Director
|
|
Laura C. Fulton
|
|
50
|
|
Director
|
Rene R. Joyce
has served as
Executive Chairman of the Board of TRC, the general partner and TRI since January 1, 2012 and as a director of the Company since its formation on October 27, 2005 and of the general partner since October 2006. Mr. Joyce previously served as Chief Executive Officer of the Company between October 27, 2005 and December 31, 2011, the general partner between October 2006 and December 31, 2011 and TRI between February 2004 and December 31, 2011. He also served as director of TRI between 2004 and December 31, 2011 and was a consultant for the TRI predecessor company during 2003. He is also a member of the supervisory directors of Core Laboratories N.V. Mr. Joyce served as a consultant in the energy industry from 2000 through 2003 providing advice to various energy companies and investors regarding their operations, acquisitions and dispositions. Mr. Joyce served as President of onshore pipeline operations of Coral Energy, LLC, a subsidiary of Shell Oil Company (“Shell”) from 1998 through 1999 and President of energy services of Coral Energy Holding, L.P. (“Coral”), a subsidiary of Shell which was the gas and power marketing joint venture between Shell and Tejas Gas Corporation (“Tejas”), during 1999. Mr. Joyce served as President of various operating subsidiaries of Tejas, a natural gas pipeline company, from 1990 until 1998 when Tejas was acquired by Shell. As the founding Chief Executive Officer of TRI, Mr. Joyce brings deep experience in the midstream business, expansive knowledge of the oil and gas industry, as well as relationships with chief executives and other senior management at peer companies, customers and other oil and natural gas companies throughout the world. His experience and industry knowledge, complemented by an engineering and legal educational background, enable Mr. Joyce to provide the board with executive counsel on the full range of business, technical, and professional matters.
Joe Bob Perkins
has served as Chief Executive Officer and director of the Company, the general partner and TRI since January 1, 2012. Mr. Perkins previously served as President of the Company between the date of its formation on October 27, 2005 and December 31, 2011, of the general partner between October 2006 and December 31, 2011 and of TRI between February 2004 and December 31, 2011. He was a consultant for the TRI predecessor company during 2003. Mr. Perkins was an independent consultant in the energy industry from 2002 through 2003 and was an active partner in an outdoor advertising firm during a portion of such time period. Mr. Perkins served as President and Chief Operating Officer for the Wholesale Businesses, Wholesale Group and Power Generation Group of Reliant Resources, Inc. and its parent/predecessor companies, from 1998 to 2002 and Vice President, Corporate Planning and Development, of Houston Industries from 1996 to 1998. He served as Vice President, Business Development, of Coral from 1995 to 1996 and as Director, Business Development, of Tejas from 1994 to 1995. Prior to 1994, Mr. Perkins held various positions with the consulting firm of McKinsey & Company and with an exploration and production company.
Mr. Perkins’ intimate knowledge of all facets of the Company, derived from his service as President from its founding through 2011 and his current service as Chief Executive Officer and director, coupled with his broad experience in the oil and gas industry, and specifically in the midstream sector, his engineering and business educational background and his experience with the investment community enable Mr. Perkins to provide a valuable and unique perspective to the board on a range of business and management matters.
James W. Whalen
has served as Advisor to Chairman and CEO of the Company, the general partner and TRI since January 1, 2012 and as a director of the Company since its formation on October 27, 2005, of the general partner since February 2007 and of TRI between 2004 and December 2010. Mr. Whalen previously served as Executive Chairman of the Board of the Company and TRI between October 25, 2010 and December 31, 2011 and of the general partner between December 15, 2010 and December 31, 2011. He also served as President-Finance and Administration of the Company and TRI between January 2006 and October 2010 and the general partner between October 2006 and December 2010 and for various Targa subsidiaries since November 2005. Between October 2002 and October 2005, Mr. Whalen served as the Senior Vice President and Chief Financial Officer of Parker Drilling Company. Between January 2002 and October 2002, he was the Chief Financial Officer of Diversified Diagnostic Products, Inc. He served as Chief Commercial Officer of Coral from February 1998 through January 2000. Previously, he served as Chief Financial Officer for Tejas from 1992 to 1998. Mr. Whalen brings a breadth and depth of experience as an executive, board member, and audit committee member across several different companies and in energy and other industry areas. His valuable management and financial expertise includes an understanding of the accounting and financial matters that the Partnership and industry address on a regular basis.
Michael A. Heim
has served as President and Chief Operating Officer of the Company, the general partner and TRI since January 1, 2012. Mr. Heim previously served as Executive Vice President and Chief Operating Officer of the Company between the date of its formation on October 27, 2005 and December 2011, of the general partner between October 2006 and December 2011 and of TRI between April 2004 and December 2011 and was a consultant for the TRI predecessor company during 2003. Mr. Heim also served as a consultant in the energy industry from 2001 through 2003 providing advice to various energy companies and investors regarding their operations, acquisitions and dispositions. Mr. Heim served as Chief Operating Officer and Executive Vice President of Coastal Field Services, a subsidiary of The Coastal Corp. (“Coastal”) a diversified energy company, from 1997 to 2001 and President of Coastal States Gas Transmission Company from 1997 to 2001. In these positions, he was responsible for Coastal’s midstream gathering, processing, and marketing businesses. Prior to 1997, he served as an officer of several other Coastal exploration and production, marketing and midstream subsidiaries.
Jeffrey J. McParland
has served as President — Finance and Administration of the Company and TRI since October 25, 2010 and of the general partner since December 15, 2010. He has also served as a director of TRI since December 16, 2010. Mr. McParland served as Executive Vice President and Chief Financial Officer of the Company between October 27, 2005 and October 25, 2010 and of TRI between April 2004 and October 25, 2010 and was a consultant for the TRI predecessor company during 2003. He served as Executive Vice President and Chief Financial Officer of the general partner between October 2006 and December 15, 2010 and served as a director of the general partner from October 2006 to February 2007. Mr. McParland served as Treasurer of the Company from October 27, 2005 until May 2007, of the general partner from October 2006 until May 2007 and of TRI from April 2004 until May 2007. Mr. McParland served as Secretary of TRI between February 2004 and May 2004, at which time he was elected as Assistant Secretary. Mr. McParland served as Senior Vice President, Finance of Dynegy Inc., a company engaged in power generation, the midstream natural gas business and energy marketing, from 2000 to 2002. In this position, he was responsible for corporate finance and treasury operations activities. He served as Senior Vice President, Chief Financial Officer and Treasurer of PG&E Gas Transmission, a midstream natural gas and regulated natural gas pipeline company, from 1999 to 2000. Prior to 1999, he worked in various engineering and finance positions with companies in the power generation and engineering and construction industries.
Roy E. Johnson
has served as Executive Vice President of the Company since its formation on October 27, 2005, of the general partner since October 2006 and of TRI since April 2004 and was a consultant for the TRI predecessor company during 2003. Mr. Johnson also served as a consultant in the energy industry from 2000 through 2003 providing advice to various energy companies and investors regarding their operations, acquisitions and dispositions. He served as Vice President, Business Development and President of the International Group of Tejas from 1995 to 2000. In these positions, he was responsible for acquisitions, pipeline expansion and development projects in North and South America. Mr. Johnson served as President of Louisiana Resources Company, a company engaged in intrastate natural gas transmission, from 1992 to 1995. Prior to 1992, Mr. Johnson held various positions with a number of different companies in the upstream and downstream energy industry.
Paul W. Chung
has served as Executive Vice President, General Counsel and Secretary of the Company since its formation on October 27, 2005, of the general partner since October 2006 and of TRI since May 2004. Mr. Chung served as Executive Vice President and General Counsel of Coral from 1999 to April 2004; Shell Trading North America Company, a subsidiary of Shell, from 2001 to April 2004; and Coral Energy, LLC from 1999 to 2001. In these positions, he was responsible for all legal and regulatory affairs. He served as Vice President and Assistant General Counsel of Tejas from 1996 to 1999. Prior to 1996, Mr. Chung held a number of legal positions with different companies, including the law firm of Vinson & Elkins L.L.P.
Matthew J. Meloy
has served as Senior Vice President, Chief Financial Officer and Treasurer of the Company and TRI since October 25, 2010
and of the general partner since December 15, 2010.
Mr. Meloy served as Vice President — Finance and Treasurer of the Company and TRI between April 2008 and October 2010, and as Director, Corporate Development of the Company and
TRI between March 2006 and March 2008 and of
the general partner between March 2006 and March 2008. He has served as Vice President — Finance and Treasurer of the general partner between April 2008
and December 15, 2010.
Mr. Meloy was with The Royal Bank of Scotland in the structured finance group, focusing on the energy sector from October 2003 to March 2006, most recently serving as Assistant Vice President.
John R. Sparger
has served as Senior Vice President and Chief Accounting Officer of the Company and TRI since January
2006 and of the general partner since October 2006.
Mr. Sparger served as Vice President, Internal Audit of the Company between October 2005 and January 2006 and of TRI between November 2004 and January 2006. Mr. Sparger served as a consultant in the energy industry from 2002 through September 2004, including TRI between February 2004 and September 2004, providing advice to various energy companies and entities regarding processes, systems, accounting and internal controls. Prior to 2002, he worked in various accounting and administrative positions with companies in the energy industry, audit and consulting positions in public accounting and consulting positions with a large international consulting firm.
Charles R. Crisp
has served as a director of the Company since its formation on October 27, 2005 and of TRI between February 2004 and December 2010. Mr. Crisp was President and Chief Executive Officer of Coral Energy, LLC, a subsidiary of Shell Oil Company from 1999 until his retirement in November 2000, and was President and Chief Operating Officer of Coral from January 1998 through February 1999. Prior to this, Mr. Crisp served as President of the power generation group of Houston Industries and, between 1988 and 1996, as President and Chief Operating Officer of Tejas. Mr. Crisp is also a director of AGL Resources Inc., EOG Resources Inc. and IntercontinentalExchange Group, Inc. Mr. Crisp brings extensive energy experience, a vast understanding of many aspects of our industry and experience serving on the boards of other public companies in the energy industry. His leadership and business experience and deep knowledge of various sectors of the energy industry bring a crucial insight to the board of directors.
Peter R. Kagan
has served as a director of the Company since its formation on October 27, 2005, of the general partner between February 2007 and February 2013 and of TRI between February 2004 and December 2010. Mr. Kagan is a Managing director and Member of Warburg Pincus LLC, a New York limited liability company and a partner of Warburg Pincus & Co., a New York general partnership, where he has been employed since 1997. He became a partner of Warburg Pincus & Co. in 2002. He is also a member of Warburg Pincus’ Executive Management Group. Mr. Kagan currently serves on the board of Antero Resources Corporation, AAG Energy Limited, Brigham Resources LLC, Canbriam Energy Inc., Delonex Energy Limited, Fairfield Energy Limited, Hawkwood Energy LLC, Laredo Petroleum, Inc., MEG Energy Corp. and Venari Resources LLC. Mr. Kagan has significant experience with energy companies and investments and broad familiarity with the industry and related transactions and capital markets activity, which enhance his contributions to the board of directors.
L
au
r
a
C
.
F
u
lt
o
n
h
a
s
s
e
r
v
ed
as
a
d
ire
c
t
o
r
o
f
t
h
e
C
o
m
p
a
n
y
s
i
n
ce
Fe
br
u
a
r
y 26,
2013
.
Ms.
F
u
lt
o
n
h
a
s
s
e
r
v
ed
a
s
the Chief Financial Officer of Hi-Crush Proppants LLC since April 2012 and Hi-Crush GP LLC, the general partner of Hi-Crush Partners LP, since May 2012. From March 2008 to October 2011, Ms. Fulton served as Executive Vice President, Accounting and then Executive Vice President, Chief Financial Officer of AEI Services, LLC, an owner and operator of essential energy infrastructure assets in emerging markets. Prior to AEI, Ms. Fulton spent 12 years with Lyondell Chemical Company in various capacities, including as general auditor responsible for internal audit and the Sarbanes-Oxley certification process, and as the assistant controller. Prior to that, she spent 11 years with Deloitte & Touche in public accounting, with a focus on audit and assurance. As a chief financial officer, general auditor and external auditor, Ms. Fulton brings to the company extensive financial, accounting and compliance process experience. Ms. Fulton’s experience as a financial executive in the energy industry, including her current position with an MLP, also brings industry and capital markets experience to the board.
Chris Tong
has served as a director of the Company since January 2006 and of TRI between January 2006 and December 2010. Mr. Tong is a director of
Kosmos Energy Ltd.
He also served as a director of Cloud Peak Energy Inc. from October 2009 until May 2012. He served as Senior Vice President and Chief Financial Officer of Noble Energy, Inc. from January 2005 until August 2009. He also served as Senior Vice President and Chief Financial Officer for Magnum Hunter Resources, Inc. from August 1997 until December 2004. Prior thereto, he was Senior Vice President of Finance of Tejas Acadian Holding Company and its subsidiaries, including Tejas Gas Corp., Acadian Gas Corporation and Transok, Inc., all of which were wholly-owned subsidiaries of Tejas Gas Corporation. Mr. Tong held these positions from August 1996 until August 1997, and had served in other treasury positions with Tejas since August 1989. Mr. Tong brings a breadth and depth of experience as a chief financial officer in the energy industry, a financial executive, a director of other public companies and a member of other audit committees. He brings significant financial, capital markets and energy industry experience to the board and in his position as the chairman of our Audit Committee.
Ershel C. Redd Jr.
has served as a director of the Company since February 2011. Mr. Redd has served as a consultant in the energy industry since 2008 providing advice to various energy companies and investors regarding their operations, acquisitions and dispositions. Mr. Redd was President and Chief Executive Officer of El Paso Electric Company, a public utility company, from May 2007 until March 2008. Prior to this, Mr. Redd served in various positions with NRG Energy, Inc., a wholesale energy company, including as Executive Vice President – Commercial Operations from October 2002 through July 2006, as President – Western Region from February 2004 through July 2006, and as a director between May 2003 and December 2003. On May 14, 2003, NRG filed for protection under Chapter 11 of the Federal Bankruptcy Code. On November 24, 2003, NRG's Chapter 11 Plan of Reorganization was confirmed. Mr. Redd served as Vice President of Business Development for Xcel Energy Markets, a unit of Xcel Energy Inc., from 2000 through 2002, and as President and Chief Operating Officer for New Century Energy’s (predecessor to Xcel Energy Inc.) subsidiary, Texas Ohio Gas Company, from 1997 through 2000. Mr. Redd brings to the Company extensive energy industry experience, a vast understanding of varied aspects of the energy industry and experience in corporate performance, marketing and trading of natural gas and natural gas liquids, risk management, finance, acquisitions and divestitures, business development, regulatory relations and strategic planning. His leadership and business experience and deep knowledge of various sectors of the energy industry bring a crucial insight to the board of directors.
Board of Directors
Our board of directors consists of eight members. The board reviewed the independence of our directors using the independence standards of the NYSE and, based on this review, determined that Messrs. Crisp, Kagan, Redd and Tong and Ms. Fulton are independent within the meaning of the NYSE listing standards currently in effect.
Our directors are divided into three classes serving staggered three-year terms. Class I, Class II and Class III directors will serve until our annual meetings of stockholders in 2014, 2015 and 2016, respectively. The Class I directors are Messrs. Crisp and Whalen and Ms. Fulton the Class II directors are Messrs. Redd, and Perkins and the Class III directors are Messrs. Kagan, Tong and Joyce. At each annual meeting of stockholders, directors will be elected to succeed the class of directors whose terms have expired. This classification of our board of directors could have the effect of increasing the length of time necessary to change the composition of a majority of the board of directors. In general, at least two annual meetings of stockholders will be necessary for stockholders to effect a change in a majority of the members of the board of directors.
Committees of the Board of Directors
Our board of directors has four standing committees - an Audit Committee, a Compensation Committee, a Nominating and Governance Committee and a Conflicts Committee - and may have such other committees as the board of directors shall determine from time to time. Each of the standing committees of the board of directors has the composition and responsibilities described below.
Audit Committee
The members of our Audit Committee are Messrs. Tong and Redd and Ms. Fulton. Mr. Tong is the Chairman of this committee. Our board of directors has affirmatively determined that Messrs. Tong and Redd, and Ms. Fulton are independent as described in the rules of the NYSE and the Exchange Act. Our board of directors has also determined that, based upon relevant experience, Mr. Tong is an “audit committee financial expert” as defined in Item 407 of Regulation S-K of the Exchange Act.
This committee oversees, reviews, acts on and reports on various auditing and accounting matters to our board of directors, including: the selection of our independent accountants, the scope of our annual audits, fees to be paid to the independent accountants, the performance of our independent accountants and our accounting practices. In addition, the Audit Committee oversees our compliance programs relating to legal and regulatory requirements. We have adopted an Audit Committee charter defining the committee’s primary duties in a manner consistent with the rules of the SEC and NYSE or market standards.
Compensation Committee
The members of our Compensation Committee are Messrs. Kagan, Crisp and Redd. Mr. Redd is the Chairman of this committee. This committee establishes salaries, incentives and other forms of compensation for officers and other employees. Our Compensation Committee also administers our incentive compensation and benefit plans. We have adopted a Compensation Committee charter defining the committee’s primary duties in a manner consistent with the rules of the SEC and NYSE or market standards.
In July 2013, the Compensation Committee considered the independence of BDO USA, LLP (“BDO”), our compensation consultant, in light of new SEC rules and the NYSE listing standards. The Compensation Committee requested and received a letter from BDO addressing the consulting firm’s independence, including the following factors:
|
·
|
Other services provided to us by BDO; |
|
·
|
Fees paid by us as a percentage of BDO total revenue; |
|
·
|
Policies or procedures maintained by BDO that are designed to prevent a conflict of interest; |
|
·
|
Any business or personal relationships between the individual consultants involved in the engagement and members of the Compensation Committee; |
|
·
|
Any stock of the Company owned by the individual consultants involved in the engagement; and |
|
·
|
Any business or personal relationships between our executive officers and BDO or the individual consultants involved in the engagement. |
The Compensation Committee discussed these considerations and concluded that the work of BDO did not raise any conflict of interest.
Nominating and Governance Committee
The members of our Nominating and Governance Committee are Messrs. Kagan, Crisp and Tong. Mr. Kagan is the Chairman of this committee. This committee identifies, evaluates and recommends qualified nominees to serve on our board of directors, develops and oversees our internal corporate governance processes and maintains a management succession plan. We have adopted a Nominating and Governance Committee charter defining the committee’s primary duties in a manner consistent with the rules of the SEC and NYSE or market standards.
In evaluating director candidates, the Nominating and Governance Committee assesses whether a candidate possesses the integrity, judgment, knowledge, experience, skills and expertise that are likely to enhance the board’s ability to manage and direct the affairs and business of the Company, including, when applicable, to enhance the ability of committees of the board to fulfill their duties.
Conflicts Committee
The members of our Conflicts Committee are Messrs. Crisp, Redd and Tong. Mr. Redd is the Chairman of this committee. This Committee reviews matters of potential conflicts of interest, as directed by our board of directors. We adopted a Conflicts Committee charter defining the committee’s primary duties.
Corporate Governance
Code of Business Conduct and Ethics
Our board of directors has adopted a Code of Ethics For Chief Executive Officer and Senior Financial Officers (the “Code of Ethics”), which applies to our Chief Executive Officer, Chief Financial Officer, Chief Accounting Officer, Controller and all of our other senior financial and accounting officers, and our Code of Conduct (the “Code of Conduct”), which applies to our and our subsidiaries’ officers, directors and employees. In accordance with the disclosure requirements of applicable law or regulation, we intend to disclose any amendment to, or waiver from, any provision of the Code of Ethics or Code of Conduct under Item 5.05 of a current report on Form 8-K.
Available Information
We make available, free of charge within the “Corporate Governance” section of our website at
http://www.targaresources.com
and in print to any stockholder who so requests, our Corporate Governance Guidelines, Code of Ethics, Code of Conduct, Audit Committee Charter, Compensation Committee charter and Nominating and Governance Committee charter. Requests for print copies may be directed to: Investor Relations, Targa Resources Corp., 1000 Louisiana, Suite 4300, Houston, Texas 77002 or made by telephone by calling (713) 584-1000. The information contained on or connected to, our internet website is not incorporated by reference into this Annual Report and should not be considered part of this or any other report that we file with or furnish to the SEC.
Corporate Governance Guidelines
Our board of directors has adopted corporate governance guidelines in accordance with the corporate governance rules of the NYSE.
Executive Sessions of Non-Management Directors
Our non-management directors meet in executive session without management participation at regularly scheduled executive sessions. These meetings are chaired by Mr. Peter Kagan.
Interested parties may communicate directly with our non-management directors by writing to: Non-Management Directors, Targa Resources Corp., 1000 Louisiana, Suite 4300, Houston, Texas 77002.
Section 16(a) Beneficial Ownership Reporting Compliance
Section 16(a) of the Securities Exchange Act of 1934 requires our directors, executive officers and 10% stockholders to file with the SEC reports of ownership and changes in ownership of our equity securities. Based solely upon a review of the copies of the Form 3, 4 and 5 reports furnished to us and certifications from our directors and executive officers, we believe that during 2013, all of our directors, executive officers and beneficial owners of more than 10% of our common units complied with Section 16(a) filing requirements applicable to them.
Compensation Discussion and Analysis
The following Compensation Discussion and Analysis (“CD&A”) contains statements regarding our compensation programs and our executive officers’ business priorities related to our compensation programs and target payouts under the programs. These business priorities are disclosed in the limited context of our compensation programs and should not be understood to be statements of management’s expectations or estimates of results or other guidance.
Overview
Compensatory arrangements with our executive officers identified in the Summary Compensation Table (“named executive officers”) are approved by the Compensation Committee of our Board of Directors (the “Compensation Committee”). For 2013, our named executive officers were:
|
·
|
Rene R. Joyce – Executive Chairman of the Board; |
|
·
|
Joe Bob Perkins – Chief Executive Officer; |
|
·
|
James W. Whalen – Advisor to Chairman and CEO; |
|
·
|
Michael A. Heim – President and Chief Operating Officer; and |
|
·
|
Matthew J. Meloy – Senior Vice President, Chief Financial Officer and Treasurer. |
Our named executive officers also serve as executive officers of Targa Resources GP LLC (the “general partner”), which is the general partner of Targa Resources Partners LP (the “Partnership”), a publicly traded Delaware limited partnership. The Company owns a 13.3% interest in the Partnership, including the 2% general partner interest, and is the indirect parent of the general partner. The compensation information described in this CD&A and contained in the tables that follow reflects all compensation received by our named executive officers for the services they provide to us and for the services they provide to the general partner and the Partnership for the years covered.
All decisions regarding this compensation are made by the Compensation Committee, except that long-term equity incentive awards recommended by the Compensation Committee under the Targa Resources Partners Long-Term Incentive Plan are approved by the board of directors of the general partner who oversees that plan. The named executive officers devote their time as needed to the conduct of our business and affairs and the conduct of the Partnership’s business and affairs. During 2013, the Partnership reimbursed us and our affiliates for the compensation of our named executive officers pursuant to the Partnership’s partnership agreement and, until its expiration in April 2013, the terms, and subject to the limitations, of the Omnibus Agreement. See “—Transactions with Related Persons—Omnibus Agreement” for additional information regarding the Partnership’s reimbursement obligations for 2013 following the expiration of the Omnibus Agreement.
The Compensation Committee believes that the actions it has taken to govern compensation in a responsible way as described in this CD&A and the Company’s performance over its trading history demonstrate that our compensation programs are structured to pay reasonable amounts for performance based on our understanding of the markets and that our shareholders have realized substantial returns since our 2010 initial public offering.
We held our first advisory say on pay vote regarding executive compensation at our 2011 Annual Meeting. At that meeting, more than 99% of the votes cast by our shareholders approved the compensation paid to our named executive officers as described in the CD&A and the other related compensation tables and disclosures contained in our Proxy Statement filed with the SEC on April 4, 2011. The Board of Directors and the Compensation Committee reviewed the results of this vote and concluded that with this level of support, no changes to our compensation design and philosophy needed to be considered as a result of the vote. In accordance with the preference expressed by our shareholders to conduct an advisory vote on executive compensation every three years, the next advisory vote will occur as part of our 2014 Annual Meeting.
Summary of Key Strategic Results
Our main source of cash flow is from our general and limited partner interests and our incentive distribution rights in the Partnership. As described in “Management’s Discussion and Analysis of Financial Conditions and Results of Operations” in our Annual Report on Form 10-K, our 2013 strategic and operational accomplishments, our 2013 financial results and the 2013 financial results of the Partnership demonstrate the significant increases in both our business scale and diversity and in our results of operations in comparison to 2012. In summary, some of our more significant financial, operational and strategic highlights in 2013 included
:
|
·
|
On balance, excellent execution across our businesses, including strong financial performance, with the Partnership’s EBITDA for 2013 22% higher than 2012 and slightly above the mid-range of public guidance; |
|
·
|
Excellent execution on announced expansion projects, with over $1 billion of capital expenditures for growth projects that were placed in service during 2013 and completed on or ahead of schedule and on or below budget, and with projects scheduled for completion in 2014 on track; |
|
·
|
Continued development of our potential future expansion project portfolio, with over $1.5 billion of identified growth projects; |
|
·
|
Tremendous effort and solid growth of our recently acquired Bakken shale midstream business; and |
|
·
|
A continued strong track record and performance regarding safety, with several industry safety recognitions in 2013, and compliance in all aspects of our business, including environmental and regulatory compliance. |
See “Components of Executive Compensation Program for 2013—Annual Cash Incentive Bonus” for further discussion of these summary highlights.
Summary of 2013 and 2014 Compensation Decisions
While the compensation arrangements for our named executive officers during fiscal 2013 remained substantially similar to those in place during fiscal 2012, specific compensatory changes in 2013 included the following:
|
·
|
Base salary raises were approved for certain named executive officers, ranging from 5% to 18%. Messrs. Joyce and Whalen did not receive base salary increases for 2013 at their request. The Compensation Committee authorized base salary increases for the other named executive officers in order to align the total direct compensation of these individuals more closely with the total direct compensation provided to similarly situated executives at companies within our 2013 Peer Group, adjusted for company size, and to reflect professional growth and the assumption of additional responsibilities. See “—Methodology and Process—Role of Peer Group and Benchmarking” for a description of the companies that comprise the 2013 Peer Group and of the methodology employed by the independent compensation consultant to adjust Peer Group total direct compensation for company size. |
|
·
|
Mr. Perkins’ target bonus percentage for 2013 under our annual incentive plan was increased from 80% of base salary to 100% of base salary in order to align his total direct compensation more closely with the total direct compensation provided to similarly situated chief executive officers at companies within our 2013 Peer Group, adjusted for company size. For similar reasons, the long-term equity incentive award opportunity for 2013 for Messrs. Perkins and Heim was also increased. |
|
·
|
Provisions were added to our restricted stock awards and equity settled performance unit awards to permit continued vesting of the awards following an executive’s retirement from employment with us, subject to certain conditions. Additional information is provided below under “—Components of Executive Compensation Program for Fiscal 2013—Long-Term Equity Incentive Awards—Equity-Settled Performance Unit Awards.” |
Consistent with, and in recognition of, our achievements in 2013 described above under “Summary of Key Strategic Results,” in January 2014 the Compensation Committee approved 2013 annual cash incentive bonuses to our named executive officers at 175% of the target level. The Compensation Committee also approved base salary raises and increases in the target bonus percentages and long-term incentive plan opportunities for certain named executive officers for 2014 to bring the total direct compensation of our named executive officers more closely in line with the total direct compensation provided to similarly situated executives at companies within our 2014 Peer Group, adjusted for company size. See “Changes for 2014” for additional information regarding base salary, target bonus percentage and long-term incentive plan opportunity increases effected for fiscal 2014 and for a description of our Peer Group companies for 2014.
Discussion and Analysis of Executive Compensation
Compensation Philosophy and Elements
The following compensation objectives guide the Compensation Committee in its deliberations about executive compensation matters:
|
·
|
Competition Among Peers . The Compensation Committee believes our executive compensation program should enable us to attract and retain key executives by providing a total compensation program that is competitive with the market in which we compete for executive talent, which encompasses not only midstream natural gas companies but also other energy industry companies as described in “Role of Peer Group and Benchmarking” below. |
|
·
|
Accountability for Performance . The Compensation Committee believes our executive compensation program should ensure an alignment between our strategic, operational and financial performance and the total compensation received by our named executive officers. This includes providing compensation for performance that reflects individual and company performance both in absolute terms and relative to our Peer Group. |
|
·
|
Alignment with Shareholder Interests . The Compensation Committee believes our executive compensation program should ensure a balance between short-term and long-term compensation while emphasizing at-risk or variable compensation as a valuable means of supporting our strategic goals and aligning the interests of our named executive officers with those of our shareholders. |
|
·
|
Supportive of Business Goals . The Compensation Committee believes that our total compensation program should support our business objectives and priorities. |
Consistent with this philosophy and the compensation objectives, our 2013 executive compensation program was comprised of the following elements of compensation:
|
Compensation Element
|
Description
|
Role in Total Compensation
|
||
|
Base Salary
|
Competitive fixed cash compensation based on individual’s role, experience, qualifications and performance
|
·
A core element of competitive total compensation, important in attracting and retaining key executives
|
||
|
Annual Cash Incentive Bonus
|
Variable cash payouts tied to achievement of annual financial, operational and strategic business priorities and determined in the sole discretion of the Compensation Committee
|
·
Aligns named executive officers with annual strategic, operational and financial results
·
Recognizes individual and performance-based contributions to annual results
·
Supplements base salary to help attract and retain executives
|
||
|
Long-Term Equity Incentive Awards
|
Restricted stock awards granted under our Stock Incentive Plan
Equity-settled performance unit awards granted under the Partnership’s Long-Term Incentive Plan
|
·
Aligns named executive officers with sustained long-term value creation
·
Creates opportunity for a meaningful and sustained ownership stake
·
Combined with salary and annual bonus, provides a competitive target total direct compensation opportunity substantially contingent on our performance relative to our LTIP Peer Group
|
||
|
Benefits
|
401(k) plan, health and welfare benefits
|
·
Our named executive officers are eligible to participate in benefits provided to other Company employees
·
Contributes toward financial security for various life events (
e.g
., disability or death)
·
Generally competitive with companies in the midstream sector
|
||
|
Post-Termination Compensation
|
“Double trigger” cash change in control payments
|
·
Helps mitigate possible disincentives to pursue value-added merger or acquisition transactions if employment prospects are uncertain
·
Provides assistance with transition if post-transaction employment is not offered
|
||
|
Perquisites
|
None, other than minimal parking subsidies
|
·
Compensation Committee’s policy is not to pay for perquisites for any of our named executive officers, other than minimal parking subsidies
|
Fiscal 2013 Total Direct Compensation
We review the mix of base salary, annual cash incentive bonuses and long-term equity incentive awards (
i.e
., total direct compensation) each year for the Company and for our Peer Group. We view the various components of total direct compensation as related but distinct and emphasize pay for performance, with a significant portion of total direct compensation reflecting a risk aspect tied to long- and short-term financial and strategic goals. Although we typically target annual long-term equity incentive awards as a percentage of base salary, we have historically not operated under any formal policies or guidelines for allocating compensation between long-term and currently paid out compensation, between cash and non-cash compensation, or among different forms of non-cash compensation. However, we believe that our compensation packages are representative of an appropriate mix of compensation components, and we anticipate that we will continue to utilize a similar, though not identical, mix of compensation in future years.
The approximate allocation of target total direct compensation for our named executive officers in fiscal 2013 is presented below. This reflects (i) the salary rates in effect as of December 31, 2013, (ii) target annual cash incentive bonuses for services performed in fiscal 2013, and (iii) the grant date fair value of long-term equity incentive awards granted during fiscal 2013.
Fiscal 2013 Target Total Direct Compensation
|
|
Rene J. Joyce
|
Joe Bob Perkins
|
James W. Whalen
|
Michael A. Heim
|
Matthew J. Meloy
|
|
Base Salary
|
26%
|
25%
|
31%
|
27%
|
38%
|
|
Annual Cash Incentive Bonus
|
26%
|
25%
|
25%
|
22%
|
19%
|
|
Long-Term Equity Incentive Awards
|
48%
|
50%
|
44%
|
51%
|
43%
|
|
Total
|
100%
|
100%
|
100%
|
100%
|
100%
|
In the three full calendar years since our December 2010 public offering, the target total direct compensation (salary plus target bonus plus grant value of annual equity awards) available to our Chief Executive Officer has been set by the Compensation Committee at a level that is approximately 75% of the market total compensation level. Market compensation level is determined by the independent Compensation Consultant, BDO USA, LLP, using a regression analysis for our Peer Group that adjusts for company size and that predicts total direct compensation as correlated to market capitalization and total assets. The following chart illustrates the relationship between the target total direct compensation available to our Chief Executive Officer and the market level developed by our Compensation Consultant for the last three years. The compensation shown for the Chief Executive Officer in 2011 relates to the last year Mr. Joyce served in that capacity. Mr. Perkins became the Chief Executive Officer effective January 1, 2012.
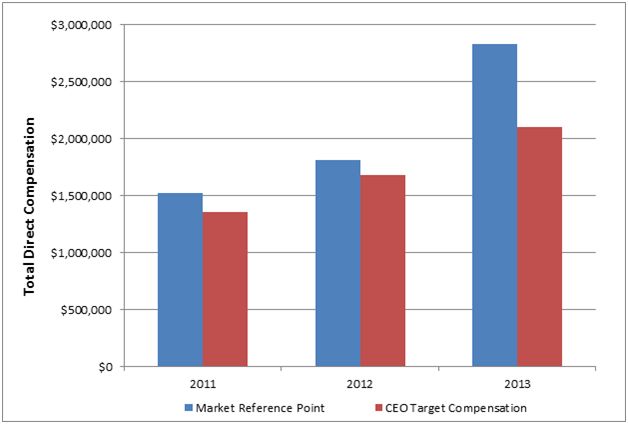
Because incentive compensation (
i.e
., target annual cash incentive bonus and grant date fair value of long-term equity incentive awards) comprised 75% of our Chief Executive Officer’s total compensation opportunity for 2013, the amount of compensation he ultimately realizes from these awards may be more or less than the target amount as determined in particular by our Compensation Committee’s evaluation of our performance, the total unitholder return on the Partnership’s common units on both an absolute basis and relative to peer companies and the total shareholder return on our common stock.
Annual Total Shareholder Return
In the three full calendar years since our 2010 initial public offering, we have delivered annual total return to our shareholders of 70.8% (for 2013), 33.6% (for 2012) and 55.2% (for 2011).
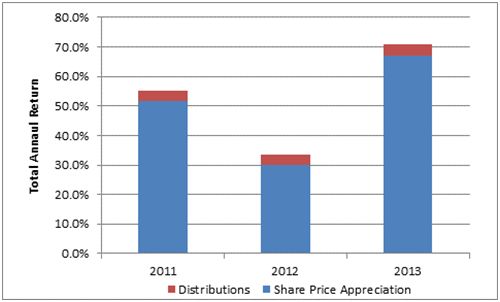
Methodology and Process
Role of Compensation Consultant in Setting Compensation
The Compensation Committee retained BDO USA, LLP as its independent Compensation Consultant to advise the Compensation Committee on matters related to executive and non-management director compensation for 2013. During 2012 and 2013, the Compensation Committee received advice from the Compensation Consultant with respect to the development and structure of our 2013 executive compensation program. As discussed above under “Meetings and Committees of Directors—Committees of the Board of Directors—Compensation Committee,” the Compensation Committee has concluded that we do not have any conflicts of interest with the Compensation Consultant.
Role of Peer Group and Benchmarking
When evaluating annual compensation levels for each named executive officer, the Compensation Committee, with the assistance of the Compensation Consultant and senior management, reviews publicly available compensation data for executives in our Peer Group as well as compensation surveys. The Compensation Committee then uses that information to help set compensation levels for the named executive officers in the context of their roles, levels of responsibility, accountability and decision-making authority within our organization and in the context of company size relative to the other Peer Group members. While compensation data from other companies is considered, the Compensation Committee and senior management do not attempt to set compensation components to meet specific benchmarks.
The Peer Group company data that is reviewed by senior management and the Compensation Committee is simply one factor out of many that is used in connection with the establishment of compensation opportunities for our officers. The other factors considered include, but are not limited to, (i) available compensation data, rankings and comparisons, (ii) effort and accomplishment on a group and individual basis, (iii) challenges faced and challenges overcome, (iv) unique skills, (v) contribution to the management team and (vi) the perception of both the Board of Directors and the Compensation Committee of our performance relative to expectations and actual market/business conditions. All of these factors, including Peer Group company data and analysis, are utilized in a subjective assessment of each year’s decisions relating to base salary, annual cash incentive bonus, and long-term equity incentive award decisions.
To reflect the market in which we compete for executive talent, the Peer Group considered by the Compensation Committee in consultation with senior management for compensation comparison purposes each year includes companies in three comparator groups: (1) midstream master limited partnerships (“MLPs”), (2) exploration and production companies (“E&Ps”), and (3) energy utilities. Our analysis places greater weight on the compensation data reported by other publicly-traded midstream MLPs. E&Ps and utilities selected for the Peer Group, in the Compensation Committee’s opinion, provide relevant reference points because they have similar or related operations, compete in the same or similar markets, face similar regulatory challenges and require similar skills, knowledge and experience of their executive officers as we require of our executive officers.
Because many companies in the Peer Group may be larger than we are as measured by market capitalization and total assets, with the assistance of the Compensation Consultant, compensation data for the Peer Group companies is analyzed using multiple regression analysis to develop a prediction of the total compensation that Peer Group companies of comparable size to us would offer similarly-situated executives.
The regressed data is analyzed separately for each of the three comparator groups and is then weighted as follows to develop a reference point for assessing our total executive pay opportunity relative to market practice: (1) MLPs (given a 70% weighting), (2) E&Ps (given a 15% weighting) and (3) utility companies (given a 15% weighting). For 2013, the “Peer Group” companies (for purposes of determining 2013 compensation levels) were:
| • | MLP peer companies : Atlas Pipeline Partners, L.P., Copano Energy, L.L.C., Crosstex Energy, L.P., DCP Midstream Partners, LP, Enbridge Energy Partners L.P., Energy Transfer Partners, L.P., Enterprise Products Partners L.P., Magellan Midstream Partners, L.P., MarkWest Energy Partners, L.P., NuStar Energy L.P., ONEOK Partners, L.P., Plains All American Pipeline, L.P., Regency Energy Partners LP and Williams Partners L.P. |
| • | E&P peer companies : Apache Corporation, Anadarko Petroleum Corporation, Cabot Oil & Gas Corporation, Cimarex Energy Company, Denbury Resources Inc., Devon Energy Corporation, EOG Resources, Inc., Murphy Oil Corporation, Newfield Exploration Company, Noble Energy Inc., Penn Virginia Corporation, Pioneer Natural Resources Company, Southwestern Energy Company and Ultra Petroleum Corporation |
| • | Utility peer companies : CenterPoint Energy, Inc., Dominion Resources Services, Inc., Enbridge Inc., EQT Corporation, National Fuel Gas Company, NiSource Inc., ONEOK, Inc., Questar Corporation, Sempra Energy, Spectra Energy Company, TransCanada Corporation and The Williams Companies Inc. |
Based upon the recommendation of our Compensation Consultant, we made the following changes to the 2012 Peer Group to create the 2013 Peer Group: (i) removed two companies, Petrohawk Energy Corp. and Southern Union Co., which were no longer publicly traded, and (ii) added Plains All American Pipeline, L.P.
Senior management and the Compensation Committee review our compensation-setting practices and Peer Group companies on at least an annual basis. See “Changes for 2014”
for a description of the changes that were made to the Peer Group for 2014 compensation purposes.
Role of Senior Management in Establishing Compensation for Named Executive Officers
Typically, under the direction of the Compensation Committee, senior management consults with the Compensation Consultant and reviews market data and evaluates relevant compensation levels and compensation program elements towards the end of each fiscal year. Based on these consultations and assessments of performance relative to business priorities, senior management submits emerging conclusions and, subsequently, a proposal to the Chairman of the Compensation Committee. The proposal includes a recommendation of base salary, target annual cash incentive bonus opportunity and long-term equity incentive awards to be paid or awarded to executive officers for the next fiscal year. In addition, the proposal includes a recommendation regarding the annual cash incentive bonus amount to be paid for the current fiscal year.
The Chairman of the Compensation Committee reviews and discusses the proposal with senior management and the Compensation Consultant and may discuss it with the other members of the Compensation Committee, other members of the Board of Directors, the full Board of Directors and/or the full board of directors of the general partner. The Chairman of the Compensation Committee may request that senior management provide him with additional information or reconsider or revise the proposal. The resulting recommendation is then submitted to the full Compensation Committee for consideration, which typically invites other members of the Board of Directors and the directors of the general partner, and also meets separately with the Compensation Consultant. The final compensation decisions are reported to the Board of Directors.
Our senior management typically has no other role in determining compensation for our named executive officers. The Compensation Committee may delegate the approval of equity based award grants and other transactions and responsibilities regarding the administration of our equity compensation program to the Executive Chairman of the Board or the Chief Executive Officer with respect to employees other than our Section 16 officers. Our executive officers are delegated the authority and responsibility to determine the compensation for all other employees.
Components of Executive Compensation Program for Fiscal 2013
Base Salary
The base salaries for our named executive officers are set and reviewed annually by the Compensation Committee. Base salaries for our named executive officers have been established based on Peer Group analysis and historical salary levels for these officers, as well as the relationship of their salaries to those of our other executive officers, taking into consideration the value of the total direct compensation opportunities available to our executive officers, including the annual cash incentive and long-term equity incentive award components of our compensation program. The other factors listed above under “—Methodology and Process—Role of Peer Group and Benchmarking” are also considered.
For 2013, the Compensation Committee authorized increases in base salary for certain of our named executive officers, effective March 1, 2013, as set forth in the following table. Salaries were increased to better align total direct compensation opportunities with the target total direct compensation provided to similarly situated executives at companies within our 2013 Peer Group, adjusted for company size and, in the case of Messrs. Perkins and Meloy, to reflect increased responsibilities within the organization.
Messrs. Joyce and Whalen did not receive a base salary increase for 2013 at their request.
|
|
Prior Salary
|
Base Salary Effective
March 1, 2013
|
Percent Increase
|
|||||||||
|
Rene R. Joyce
|
$
|
560,000
|
$
|
560,000
|
$
|
0
|
%
|
|||||
|
Joe Bob Perkins
|
480,000
|
525,000
|
9
|
%
|
||||||||
|
James W. Whalen
|
480,000
|
480,000
|
0
|
%
|
||||||||
|
Michael A. Heim
|
460,000
|
485,000
|
5
|
%
|
||||||||
|
Matthew J. Meloy
|
275,000
|
325,000
|
18
|
%
|
||||||||
Annual Cash Incentive Bonus
For 2013, our named executive officers were eligible to receive annual cash incentive bonuses under the 2013 Annual Incentive Plan (the “2013 Bonus Plan”), which was approved by the Compensation Committee in January 2013. The funding of the cash bonus pool and the payment of individual cash bonuses to executive management, including our named executive officers, are subject to the sole discretion of the Compensation Committee and will generally be determined near or following the end of the year to which the bonus relates.
The target amount of the cash bonus pool for all employees is equal to the sum of the target bonus amounts for all participants in the 2013 Bonus Plan. Each participant’s target bonus amount is equal to the product of the participant’s base salary (at the rate in effect as of the last day of the year to which the bonus relates) and the participant’s target bonus percentage, which may generally range from 6% to
100%. For purposes of the 2013 Bonus Plan, the percentage of base salary that was set as the “target” amount for each named executive officer’s bonus was as follows:
|
|
Target Bonus Percentage
(as a % of Base Salary)
|
Target Bonus Amount
|
||||||
|
Rene R. Joyce
|
100
|
%
|
$
|
560,000
|
||||
|
Joe Bob Perkins
|
100
|
%
|
525,000
|
|||||
|
James W. Whalen
|
80
|
%
|
384,000
|
|||||
|
Michael A. Heim
|
80
|
%
|
388,000
|
|||||
|
Matthew J. Meloy
|
50
|
%
|
162,500
|
|||||
For 2013, Mr. Perkin’s target bonus percentage was increased from 80% to 100% to align his total direct compensation more closely with the total direct compensation provided to similarly situated chief executive officers at companies within our Peer Group, adjusted for company size. The target bonus percentages for the other named executive officers did not change from the level in effect in 2012.
The Chief Executive Officer and the
Compensation Committee relied on the Compensation Consultant and market data from Peer Group companies and broader industry compensation practices to establish the target bonus percentages for the named executive officers and the applicable threshold, target and maximum percentage levels for funding the cash bonus pool, which are generally consistent with both Peer Group company and broader energy compensation practices.
The Compensation Committee, after consultation with the Chief Executive Officer, established the following overall threshold, target and maximum levels for the 2013 Bonus Plan: (i) 50% of the target amount of the cash bonus pool would be funded in the event that the Compensation Committee determined that our business priorities had been met for the year at a threshold level; (ii) 100% of the target amount of the cash bonus pool would be funded in the event that the Compensation Committee determined that our business priorities had been met for the year at a target level; and (iii) 200% of the target amount of the cash bonus pool would be funded in the event that the Compensation Committee determined that our business priorities had been met for the year at a maximum level. While the established threshold, target and maximum levels provide general guidelines in determining the funding level of the cash bonus pool each year, senior management recommends a funding level to the Compensation Committee based on our achievement of specified business priorities for the year, and the Compensation Committee ultimately determines the total amount to be allocated to the cash bonus pool in its sole discretion based on its assessment of the business priorities and our overall performance for the year.
For purposes of determining the actual funding level of the cash bonus pool and the amount of individual bonus awards under the 2013 Bonus Plan, the Compensation Committee focused on the business priorities listed in the table below. These priorities are not objective in nature—they are subjective, and performance in regard to these priorities is ultimately evaluated by the Compensation Committee in its sole discretion. As such, success does not depend on achieving a particular target; rather, success is evaluated based on past norms, expectations and unanticipated obstacles or opportunities that arise. For example, hurricanes and deteriorating or changing market conditions may alter the priorities initially established by the Compensation Committee such that certain performance that would otherwise be deemed a negative may, in context, be a positive result. This subjectivity allows the Compensation Committee to account for the full industry and economic context of our actual performance and that of our personnel. The Compensation Committee considers all strategic priorities and reviews performance against the priorities and context but does not apply a formula or assign specific weightings to the strategic priorities in advance.
|
2013 Business Priority
|
Committee
Consensus
|
Overall Assessment
|
|
Continue to control all operating, capital and general and administrative (“G&A”) costs
|
Exceeded
|
·
On balance, excellent execution across our businesses, including strong financial performance, with the Partnership’s Adjusted EBITDA for 2013 22% higher than 2012 and slightly above the mid-range of public guidance:
o
Excellent execution on: volume growth for Field Gathering and Processing, fractionation and exports; major project execution; expense control; distribution and dividend growth; credit, inventory, hedging and balance sheet management; and capital markets execution, including equity under the Partnership’s “At the Market” equity sales program
o
Somewhat offset by lower Coastal Gathering and Processing volumes, project delays at Sound and Channelview and startup/ integration challenges at Badlands
·
Excellent execution on announced expansion projects including: Phase I of the low ethane propane export project; CBF Train 4 expansion, and High Plains Plant, Longhorn Plant and Phase II of the low ethane propane export project under construction; over $1 billion of capital expenditures for growth projects placed in service during 2013 that were completed on or ahead of schedule and on or below budget; projects scheduled for completion in 2014 on track.
·
Continued development of our potential future expansion project portfolio, with over $1.5 billion of identified growth projects, including: CBF Train 5; condensate splitter; potential pipeline and/or processing plant projects in the Permian Basin; and additional processing in Badlands.
·
Tremendous effort and solid growth of Badlands operations in the Bakken in challenging environment: including producer deals and connections, progress on growth projects and strong year-end volume ramp.
·
Strong track record and performance regarding safety and compliance in all aspects of our business, including environmental and regulatory compliance; continued industry recognition through safety awards.
·
Expansion construction programs in 2013 involved over 2000 contractor full time equivalents at our facilities with no significant safety incidents.
|
|
Continue priority emphasis and strong performance relative to a safe workplace
|
Exceeded
|
|
|
Reinforce business philosophy and mindset that promotes compliance with all aspects of our business including environmental and regulatory compliance
|
Achieved
|
|
|
Continue to tightly manage credit, inventory, interest rate and commodity price exposures
|
Achieved
|
|
|
Execute on major capital and development projects, such as finalizing negotiations, completing projects on time and on budget, and optimizing economics and capital funding
|
Exceeded
|
|
|
Pursue selected growth opportunities, including new gathering and processing build-outs, fee-based capital expenditure projects and potential purchases of strategic assets
|
Exceeded
|
|
|
Pursue commercial and financial approaches to achieve maximum value and manage risks
|
Exceeded
|
|
|
Execute on all business dimensions, including 2013 guidance for EBITDA and distribution / dividend growth as furnished from time to time
|
Exceeded
|
|
|
Successfully integrate and commercialize the Bakken Shale midstream business including contribution to 2013 guidance
|
Achieved
|
|
|
Continue to attract and retain needed operational and professional talent
|
Achieved
|
After assessing the results of the 2013 business priorities as summarized above, in January, 2014, the Compensation Committee, in its sole discretion, approved a cash bonus pool equal to 175% of the target level under the 2013 Bonus Plan. The Compensation Committee determined to fund the bonus pool above the target level because it considered overall performance, including organizational performance, to have substantially exceeded expectations based on its assessment of the 2013 business priorities.
This subjective assessment that performance substantially exceeded expectations was based on a qualitative evaluation rather than a mechanical, quantitative determination of results across each of the business priorities, and occurred with the background and ongoing context of (i) refinements of the 2013 business priorities by the Board of Directors and the Compensation Committee, (ii) continued discussion and active dialogue between the Board of Directors and the Compensation Committee and management about priorities and performance, including routine reports sent to the Board of Directors and the Compensation Committee, (iii) detailed monthly performance communications to the Board of Directors, (iv) presentations and discussions in subsequent Board of Directors and Compensation Committee meetings, and (v) further discussion among the Board of Directors and Compensation Committee of our performance relative to expectations near the end and following the end of 2013. The extensive business and board of director experience of the members of the Compensation Committee and of our Board of Directors provides the perspective to make this subjective assessment in a qualitative manner and to evaluate management performance overall and the performance of individual executive officers.
In connection with determining the funding level of the cash bonus pool, the Compensation Committee also determined the amount of the annual cash incentive bonus payments to be made to each named executive officer under the 2013 Bonus Plan based on an evaluation of the executive group and each officer’s individual performance for the year. Because the funding level of the cash bonus pool was set at 175% of the target amount, each named executive officer was awarded a bonus amount equal to 175%
of his respective target bonus amount, multiplied by a designated multiple determined by the Compensation Committee for each named executive officer based on his individual performance.
The Compensation Committee determined that a performance multiplier of 1.25x should be applied to Mr. Meloy’s bonus amount for the year, based on his individual performance including his role in leading the Partnership’s capital market activities during 2013 and in leading our and the Partnership’s overall financial strategies. All other named executive officers received a 1.0x multiplier. The dollar amounts of the annual cash incentive bonus awards received by the named executive officers under the 2013 Bonus Plan to be paid by February 28, 2014 are as follows:
|
|
Target Bonus Amount
|
Individual Performance Factor
|
Company Performance Factor
|
Actual Bonus Amount
|
||||||||||||
|
Rene R. Joyce
|
$
|
560,000
|
1.0
|
1.75
|
$
|
980,000
|
||||||||||
|
Joe Bob Perkins
|
525,000
|
1.0
|
1.75
|
918,750
|
||||||||||||
|
James W. Whalen
|
384,000
|
1.0
|
1.75
|
672,000
|
||||||||||||
|
Michael A. Heim
|
388,000
|
1.0
|
1.75
|
679,000
|
||||||||||||
|
Matthew J. Meloy
|
162,500
|
1.25
|
1.75
|
355,469
|
||||||||||||
Long-Term Equity Incentive Awards
In connection with our initial public offering in December 2010, we adopted the 2010 Stock Incentive Plan (the “Stock Incentive Plan”) under which we may grant to the named executive officers, other key employees, consultants and directors certain equity-based awards, including restricted stock, restricted stock units, bonus stock and performance-based awards. In addition, the general partner sponsors and maintains the Targa Resources Partners Long-Term Incentive Plan (the “Long-Term Incentive Plan”), under which the general partner may grant equity-based awards related to the Partnership’s common units to individuals, including the named executive officers, who provide services to the Partnership.
The Compensation Committee determines the amount of long-term equity incentive awards under the Stock Incentive Plan and recommends to the board of directors of the general partner an amount of long-term equity incentive awards under the Partnership’s Long-Term Incentive Plan that it believes is appropriate as a component of total compensation for each named executive officer for a given year based on its decisions regarding each named executive officer’s total compensation targets. The Long-Term Incentive Plan awards are ultimately determined and approved by the general partner’s board of directors. Long-term incentive awards to our named executive officers under the Stock Incentive Plan and the Long-Term Incentive Plan are made near the beginning of each year.
For 2013, the value of the long-term equity incentive component of our named executive officers’ compensation was allocated approximately (i) twenty-five (25%) to restricted stock awards under the Stock Incentive Plan and (ii) seventy-five (75%) to equity-settled performance unit awards under the Partnership’s Long-Term Incentive Plan. This allocation is based on the dollar value of the awards on the date of grant. The total dollar value of long-term equity incentive awards for each named executive officer for a given year is typically equal to a specified percentage of the officer’s base salary; however, the Compensation Committee may, in its discretion, award additional long-term equity incentive awards if deemed appropriate. The number of shares or units subject to each award is determined by dividing the total dollar value allocated to the award by the ten day average closing price of the shares or units for the period ending five business days prior to the date of grant. For 2013, the specified percentage of each named executive officer’s base salary used for purposes of determining the amount of long-term equity incentive awards granted and the corresponding dollar values as of the date of grant are set forth in the following table.
|
|
Percentage of Base Salary
|
Total Dollar Value of Long-Term Equity
Incentive Awards
as of the Date of Grant
|
||||||
|
Rene R. Joyce
|
190
|
%
|
$
|
1,064,000
|
||||
|
Joe Bob Perkins
|
200
|
%
|
1,050,000
|
|||||
|
James W. Whalen
|
143
|
%
|
686,400
|
|||||
|
Michael A. Heim
|
190
|
%
|
921,500
|
|||||
|
Matthew J. Meloy
|
115
|
%
|
373,750
|
|||||
For Messrs. Perkins, Heim and Meloy, the base salary percentages used to determine the dollar values of the long-term equity incentive awards were increased from the percentages used in 2012 (170%, 155% and 110%, respectively) to align their total direct compensation more closely with similarly situated executives at companies within our 2013 Peer Group, adjusted for company size. The percentages for the other named executive officers were unchanged from those used in 2012.
The Compensation Committee believes that the combination of equity awards consisting of restricted stock or restricted stock units (25% of award value) and equity-settled performance units (75% of award value) granted to our named executive officers provides a balance of performance-based long-term incentives and of parent and subsidiary MLP equity. The restricted stock or restricted stock unit awards are time-based awards that capture absolute total return performance of our common stock, and the equity-settled performance unit awards reflect both the absolute total return of the Partnership’s common units with variable performance based on the total return of the Partnership’s units in relation to the LTIP Peer Group (defined below). Also, this mix effectively aligns the named executive officer’s interests with both the interests of our stockholders and the interests of the Partnership’s unitholders. The Compensation Committee allocates a larger portion of each named executive officer’s long-term equity incentive compensation to equity-settled performance unit awards because these awards link executive compensation not only to the value of Partnership equity over time, but also to the relative performance of the Partnership compared to other midstream partnerships with which the Partnership competes.
Restricted Stock Awards.
On January 15, 2013, our named executive officers were awarded restricted shares of our common stock under the Stock Incentive Plan in the following amounts: (i) 4,960 restricted shares to Mr. Joyce, (ii) 4,895 restricted shares to Mr. Perkins, (iii) 3,200 restricted shares to Mr. Whalen, (iv) 4,296 restricted shares to Mr. Heim, and (v) 1,742 restricted shares to Mr. Meloy. These restricted stock awards vest in full on the third anniversary of the grant date, subject to the officer’s continued service. Accelerated vesting provisions applicable to these awards in the event of certain terminations of employment and/or a change in control are described in detail below under “—Potential Payments Upon Termination or Change in Control—Stock Incentive Plan.” During the period the restricted shares are outstanding and unvested, we accrue any dividends paid by us in an amount equal to the dividends paid with respect to a share of common stock times the number of restricted shares awarded. At the time the restricted shares vest, the named executive officers will receive a cash payment equal to the amount of dividends accrued with respect to such named executive officer’s vested shares.
On July 15, 2013, we approved amendments to our outstanding restricted stock awards granted in 2011, 2012 and 2013, including awards to our executive officers, to permit continued vesting of the awards following retirement. The amendments provide that an executive’s awards will continue to vest on the third anniversary of the grant date if, from the date of the executive’s retirement through the third anniversary date, the executive has either performed consulting services for us or refrained from working for one of our competitors or in a similar role for another company; however, directorships at non-competitors are permitted. These revised vesting provisions also apply to future equity awards granted following July 15, 2013, including the restricted stock unit awards described below under “—Changes for 2014—Long-Term Equity Incentive Awards.” In deciding to adopt the amendments, the Compensation Committee consulted with the Compensation Consultant, who reviewed industry practices regarding vesting at or during retirement and advised the committee that a majority of companies allow awards to either vest fully or vest pro rata upon retirement, while a minority of companies require forfeiture of awards. Senior management proposed the continued vesting of awards for all employees following retirement if certain service-related conditions are met, as opposed to automatic accelerated vesting at the retirement date, so that our company would be able to benefit from employee non-compete obligations and ongoing access to cooperative former employees. The Compensation Committee agreed that the continued vesting construct was the most desirable and appropriate approach for our company and approved these changes to the vesting schedule of the restricted stock awards to further align our executives’ interests with those of our shareholders and to help attract and retain key employees.
Beginning in 2014, we will award restricted stock units under the Stock Incentive Plan instead of restricted stock. See “—Changes for 2014—Long-Term Equity Incentive Awards” for additional information regarding our decision to award restricted stock units.
Equity-Settled Performance Unit Awards.
Our named executive officers also receive annual awards of equity-settled performance unit awards under the Partnership’s Long-Term Incentive Plan. The vesting of these awards is dependent on the satisfaction of certain service-related conditions and the Partnership’s performance relative to the performance of a specified comparator group of publicly-traded partnerships (the “LTIP Peer Group”). The LTIP Peer Group is not composed of the same companies as the peer group companies employed for developing market reference points for executive pay because the companies in those groups are those with which we compete for executive talent. Companies in the LTIP Peer Group are principally those companies with which the Partnership competes to varying extents in the midstream sector. The performance unit awards, which are settled in Partnership common units, are designed to align the interests of the named executive officers and other key employees with those of the Partnership’s equity holders.
On January 15, 2013, our named executive officers were awarded equity-settled performance units under the Partnership’s Long-Term Incentive Plan in the following amounts: (i) 21,251 performance units to Mr. Joyce, (ii) 20,971 performance units to Mr. Perkins, (iii) 13,709 performance units to Mr. Whalen, (iv) 18,405 performance units to Mr. Heim, and (v) 7,465 performance units to Mr. Meloy.
The performance period for the 2013 performance unit awards began on June 30, 2013 and ends on June 30, 2016. Provided a named executive officer remains continuously employed throughout the performance period, his 2013 performance units will vest on June 30, 2016 and will be settled as soon as practicable following the vesting date by the issuance of Partnership common units. As with the outstanding restricted stock awards, on July 15, 2013, the Partnership approved amendments to outstanding equity-settled performance unit awards granted in 2011, 2012 and 2013, including awards to our executive officers, to permit continued vesting of the awards following retirement. The amendments provide that an executive’s awards will continue to vest on the last day of the applicable performance period if, from the date of the executive’s retirement through the last day of the performance period, the executive has either performed consulting services for us or refrained from working for one of our competitors or in a similar role for another company; however, directorships at non-competitors are permitted. The performance unit awards remain subject to applicable performance based vesting requirements during the post-retirement period. These revised vesting provisions also apply to future performance unit awards granted following July 15, 2013 but were not applicable to the 2010 awards that vested in June 2013. For a discussion of the rationale for these changes, see “—Components of Executive Compensation Program for Fiscal 2013—Long-Term Equity Incentive Awards—Restricted Stock Awards.”
In addition to the service-related conditions, certain performance objectives must be achieved in order for the performance unit awards to vest. If the service-related conditions are satisfied, the number of Partnership common units issued will be equal to the number of performance units awarded multiplied by the “performance vesting percentage,” which may range from 0% to 150%, dependent upon the relative total return performance of the Partnership’s common units compared to the LTIP Peer Group. For performance results that fall between the 25th percentile and the 50th percentile of the LTIP Peer Group, the performance vesting percentage will be interpolated between 25% and 100% and, for performance results that fall between the 50th percentile and 75th percentile, the performance vesting percentage will be interpolated between 100% and 150%. If the Partnership’s performance is above the 75th percentile of the LTIP Peer Group, the performance vesting percentage will be 150% of the award. If the Partnership’s performance is below the 25th percentile of the LTIP Peer Group, the performance vesting percentage will be 0%.
For the 2013 performance unit awards, the LTIP Peer Group is composed of the Partnership and the following other companies (ticker noted in parenthesis):
|
Atlas Pipeline Partners, L.P. (APL)
|
MarkWest Energy Partners, L.P. (MWE)
|
|
Crosstex Energy, L.P. (XTEX)
|
Martin Midstream Partners L.P. (MMLP)
|
|
DCP Midstream Partners, LP (DPM)
|
ONEOK Partners, L.P. (OKS)
|
|
Enbridge Energy Partners L.P. (EEP)
|
Plains All American Pipeline L.P. (PAA)
|
|
Energy Transfer Partners, L.P. (ETP)
|
Regency Energy Partners LP (RGP)
|
|
Magellan Midstream Partners, L.P. (MMP)
|
Williams Partners L.P. (WPZ)
|
The board of directors of the general partner has the ability to modify the LTIP Peer Group in the event a company listed above ceases to be publicly traded or another significant event occurs and a company is determined to no longer be one of the Partnership’s peers. Effective May 1, 2013, the Compensation Committee removed Copano Energy, L.L.C. (“Copano”) from the LTIP Peer Group due to its acquisition by Kinder Morgan Energy Partners L.P. as of that date. Copano was replaced with Atlas Pipeline Partners L.P. (“Atlas”), as reflected above. For the 2010 performance unit awards that vested in June 2013, Copano’s performance through May 1, 2013, including the acquisition premium, was used for the peer group performance ranking in determining vesting. For outstanding 2011 and 2012 performance unit awards, Copano will remain in the peer group through May 1, 2013, and Atlas will be substituted for Copano’s position in the performance ranking as of May 2, 2013.
For purposes of the performance unit awards, the Partnership’s performance is determined based on the comparison of “total return” of a Partnership common unit for the performance period to the “total return” of a common share/unit of each member of the LTIP Peer Group for the performance period. “Total return” is measured by (i) subtracting (a) the average closing price per share/unit for the first ten trading days of the performance period (the “Beginning Price”) from (b) the sum of (1) the average closing price per share/unit for the last ten trading days of the performance period, plus (2) the aggregate amount of dividends/distributions paid with respect to a share/unit during such period (such result is referred to as the “Value Increase”), and (ii) dividing the Value Increase by the Beginning Price. In connection with the amendments to allow continued vesting of the performance unit awards following retirement, we also amended the dates used to calculate “total return” as described above. Prior to the amendment, the Value Increase was determined using the average closing price per share/unit for the ten trading days ending fifteen days prior to the last trading day of the performance period. The Compensation Committee determined that the change was warranted in order to capture performance over the full period and that it would apply to all future awards, as well as awards granted in 2011, 2012 and 2013 but not to the 2010 awards that vested in June 2013.
During the period the performance unit awards are outstanding, the Partnership accrues any cash distributions paid by the Partnership in an amount equal to the cash distributions paid with respect to a common unit times the number of performance units awarded. At the time the performance unit awards are settled, the named executive officers will also receive a cash payment equal to the product of the performance vesting percentage times the amount of cash distributions accrued with respect to a common unit times the number of such named executive officer’s vested units.
The following charts illustrate the total return for the Partnership’s common units compared to the total return of each other company in the LTIP Peer Group and of the Alerian MLP Index (AMZx) measured over the period beginning on June 30 of each year in which the long-term incentive awards were made, using the Beginning Price described above, and continuing through December 31, 2013.
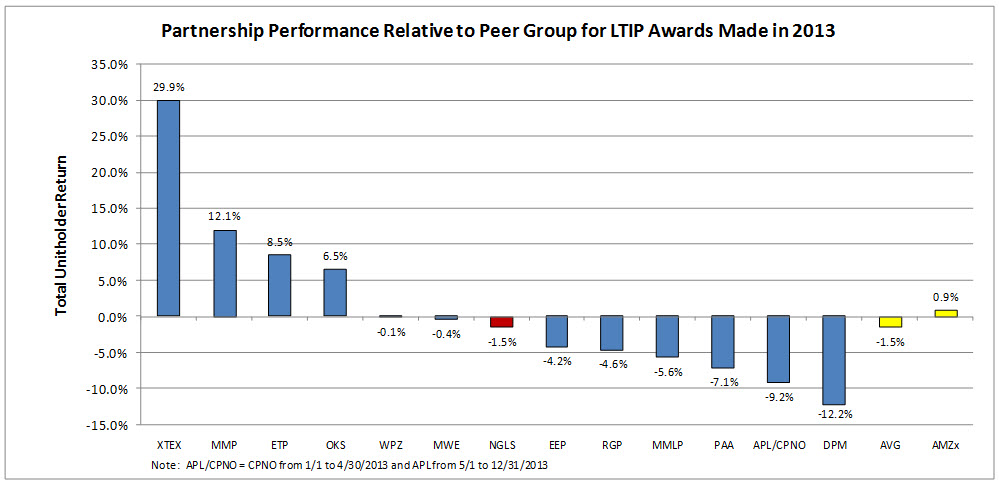

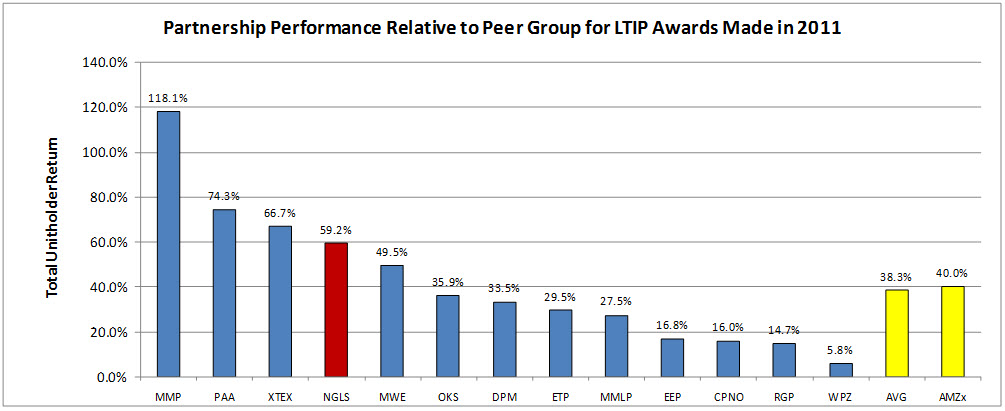
With respect to the 2010 equity-settled performance unit awards, which have a performance period that ended June 30, 2013, the Partnership’s total return rank was fourth among the LTIP Peer Group, and the Compensation Committee certified that the performance goal was achieved with a 107.96% total return, resulting in a performance vesting percentage of 142.9%. See “Options Exercised and Stock Vested” for more information.
Severance and Change in Control Benefits.
The Executive Officer Change in Control Program (the “Change in Control Program”), in which each of our named executive officers is eligible to participate, provides for post-termination payments following a qualifying termination of employment in connection with a change in control event, or what is commonly referred to as a “double trigger” benefit. The vesting of certain of our long-term equity incentive compensation awards accelerates upon a change in control irrespective of whether the officer is terminated, and/or upon certain termination of employment events, such as death, disability or a termination by us without cause. Please see “—Potential Payments Upon Termination or Change in Control” below for further information.
We believe that the Change in Control Program and the accelerated vesting provisions in our long-term equity incentive awards create important retention tools for us and are consistent with the practices of most of our industry peers. Accelerated vesting of long-term equity incentive awards upon a change in control enables our named executive officers to realize value from these awards consistent with value created for investors upon the closing of a transaction. In addition, we believe that post-termination benefits may, in part, mitigate some of the potential uncertainty created by a potential or actual change in control transaction, including the future employment of the named executive officers, thus allowing management to focus on the business transaction at hand.
Retirement, Health and Welfare, and Other Benefits.
We offer eligible employees participation in a section 401(k) tax-qualified, defined contribution plan (the “401(k) Plan”) to enable employees to save for retirement through a tax-advantaged combination of employee and company contributions and to provide employees the opportunity to manage directly their retirement plan assets through a variety of investment options. Our employees, including our named executive officers, are eligible to participate in our 401(k) Plan and may elect to defer up to 30% of their eligible compensation on a pre-tax basis (or on a post-tax basis via a Roth contribution) and have it contributed to the 401(k) Plan, subject to certain limitations under the Internal Revenue Code of 1986, as amended (the “Code”). In addition, we make the following contributions to the 401(k) Plan for the benefit of our employees, including our named executive officers: (i) 3% of the employee’s eligible compensation, and (ii) an amount equal to the employee’s contributions to the 401(k) Plan up to 5% of the employee’s eligible compensation. In addition, we may also make discretionary contributions to the 401(k) Plan for the benefit of employees depending on our performance. Company contributions to the 401(k) Plan may be subject to certain limitations under the Code for certain employees. We do not maintain a defined benefit pension plan or a nonqualified deferred compensation plan for our named executive officers or other employees.
All full-time employees, including our named executive officers, may participate in our health and welfare benefit programs, including medical, life insurance, dental coverage and disability insurance. It is the Compensation Committee’s policy not to pay for perquisites for any of our named executive officers, other than minimal parking subsidies.
Changes for 2014
In consultation with the Compensation Consultant, the Compensation Committee has reviewed our executive compensation program and has made certain changes for 2014, which are described in more detail below. The analysis provided by the Compensation Consultant indicated that the compensation of chief executive officers and chief financial officers at companies within our 2014 Peer Group has substantially increased over the 2013 levels. Specifically, the analysis provided to the Compensation Committee by the Compensation Consultant indicates that the current total target direct compensation of our Chief Executive Officer remains more than 35% below the competitive market level adjusted for company size using the regression analysis of 2014 Peer Group pay programs.
In order to align the total compensation of our named executive officers more closely with that of similarly situated officers within the 2014 Peer Group, we have generally made modest increases in the salary levels and more substantial increases in the incentive based compensation opportunities of certain named executive officers.
Base Salary
The Compensation Committee authorized, and executive management will implement, the following base salaries for our named executive officers effective March 1, 2014.
|
|
Effective March 1, 2014
|
Current Salary
|
||||||
|
Rene R. Joyce
|
$
|
560,000
|
$
|
560,000
|
||||
|
Joe Bob Perkins
|
560,000
|
525,000
|
||||||
|
James W. Whalen
|
430,000
|
480,000
|
||||||
|
Michael A. Heim
|
535,000
|
485,000
|
||||||
|
Matthew J. Meloy
|
375,000
|
325,000
|
||||||
Mr. Joyce did not receive a base salary increase for 2014 at his request
and Mr. Whalen’s base salary was reduced approximately 10% at his request to reflect a reduced work schedule in 2014. The Compensation Committee authorized base salary increases for other named executive officers along with adjustments in annual cash bonus incentive targets and grant date values of long-term incentives in order to align the total direct compensation of these individuals more closely with the total direct compensation provided to similarly situated executives at companies within our 2014 Peer Group, adjusted for company size, and to reflect professional growth and the assumption of additional responsibilities.
Annual Cash Incentive Bonus
In preparing our business plan for 2014, senior management developed and proposed a set of business priorities to the Compensation Committee. The Compensation Committee discussed and adopted the business priorities proposed by senior management for purposes of the 2014 Annual Incentive Plan (the “2014 Bonus Plan”). The 2014 business priorities are similar to those in effect for 2013 and have been revised to reflect our goal of continuing the expansion and commercialization of our recently acquired Bakken shale midstream business, and specifically include the following:
| · | execute on all business dimensions, including 2014 guidance for EBITDA and distribution/dividend growth as furnished from time to time, |
| · | continue the expansion of system capabilities and the commercialization of our Bakken shale midstream business including volume targets for 2014, |
| · | continue priority emphasis and strong performance relative to a safe workplace, |
| · | reinforce business philosophy and mindset that promotes compliance in all aspects of our business including environmental and regulatory compliance, |
| · | continue to attract and retain the operational and professional talent needed in our businesses, |
| · | continue to control all costs—operating, capital and G&A, |
| · | continue to manage tightly credit, inventory, interest rate and commodity price exposures, |
| · | execute on major capital and development projects—finalizing negotiations, completing projects on time and on budget, and optimizing economics and capital funding, |
| · | pursue selected growth opportunities including G&P build outs, fee-based capex projects, and potential purchases of strategic assets, and |
| · | pursue commercial and financial approaches to achieve maximum value and manage risks. |
The overall threshold, target and maximum funding percentages for the 2014 Bonus Plan remain the same as for the 2013 Bonus Plan. The target bonus percentage (as a percentage of base salary) for Mr. Heim and Mr. Meloy has been increased for 2014. As with the 2013 Bonus Plan, funding of the cash bonus pool and the payment of individual cash bonuses to executive management, including our named executive officers, is subject to the sole discretion of the Compensation Committee.
The following table shows the target bonus percentages for our named executive officers effective March 1, 2014.
|
|
Effective March 1, 2014
|
Current Percentage
|
||||||
|
Rene R. Joyce
|
100
|
%
|
100
|
%
|
||||
|
Joe Bob Perkins
|
100
|
%
|
100
|
%
|
||||
|
James W. Whalen
|
80
|
%
|
80
|
%
|
||||
|
Michael A. Heim
|
90
|
%
|
80
|
%
|
||||
|
Matthew J. Meloy
|
75
|
%
|
50
|
%
|
||||
Long-Term Equity Incentive Awards
For 2014, the Compensation Committee approved increases in the percentage of base salary used to determine the total dollar value of the annual long-term equity incentive awards granted to Mr. Perkins, Mr. Heim and Mr. Meloy.
The following table shows the percentages used for long-term incentive awards for our named executive officers effective March 1, 2014.
|
|
Effective March 1, 2014
|
Current Percentage
|
||||||
|
Rene R. Joyce
|
190
|
%
|
190
|
%
|
||||
|
Joe Bob Perkins
|
300
|
%
|
200
|
%
|
||||
|
James W. Whalen
|
143
|
%
|
143
|
%
|
||||
|
Michael A. Heim
|
225
|
%
|
190
|
%
|
||||
|
Matthew J. Meloy
|
150
|
%
|
115
|
%
|
||||
The value of long-term equity incentive awards for 2014, as in 2013, was allocated approximately (i) twenty-five percent (25%) to awards under the Stock Incentive Plan, and (ii) seventy-five percent (75%) to awards under the Partnership’s Long-Term Incentive Plan, as described in greater detail below.
Restricted Stock Unit Awards.
In 2013 and prior years, the Compensation Committee awarded restricted stock awards to the named executive officers under the terms of our Stock Incentive Plan. For 2014, the Compensation Committee determined to award restricted stock units, which will settle in shares of our common stock, instead of restricted stock awards. The terms and conditions of the restricted stock unit awards are substantially similar to the terms and conditions of the previously granted restricted stock awards, except that under the restricted stock unit awards, shares of stock are not delivered until the awards vest. The Compensation Committee determined that the use of restricted stock units provided greater design flexibility in our equity award program than restricted stock awards. On January 14, 2014, our named executive officers were awarded equity-settled restricted stock units under the Stock Incentive Plan in the following amounts: (i) 3,054 restricted stock units to Mr. Joyce, (ii) 4,823 restricted stock units to Mr. Perkins, (iii) 1,765 restricted stock units to Mr. Whalen, (iv) 3,456 restricted stock units to Mr. Heim, and (v) 1,615 restricted stock units to Mr. Meloy. These restricted stock units vest in full on the third anniversary of the grant date, subject to the officer’s continued service or fulfillment of certain service related requirements following retirement.
Equity-Settled Performance Unit Awards.
On January 14, 2014, our named executive officers were awarded equity-settled performance units under the Partnership’s Long-Term Incentive Plan in the following amounts: (i) 15,503 performance units to Mr. Joyce, (ii) 24,478 performance units to Mr. Perkins, (iii) 8,959 performance units to Mr. Whalen, (iv) 17,539 performance units to Mr. Heim, and (v) 8,196 performance units to Mr. Meloy. The vesting and settlement value of these performance unit awards will be determined using the formula adopted for the performance unit awards granted on January 15, 2013 (taking into account the July 2013 amendments), except that the performance period for the 2014 awards will begin on June 30, 2014 and end on June 30, 2017. Please see “Components of Executive Compensation Program for Fiscal 2013– Long-Term Equity Incentive Awards—Equity-Settled Performance Unit Awards.”
2014 Peer Group
The Peer Group companies we have historically used for compensation comparison purposes have remained fundamentally unchanged since our current approach using regression analysis was developed in 2010. During 2013, we worked with our Compensation Consultant to make a number of changes to the composition of our Peer Group used for 2014 compensation purposes in order to create more balance in the make-up of the Peer Group. Based upon the recommendation of our Compensation Consultant, we made the following changes to the 2013 Peer Group to create the 2014 Peer Group: (i) removed two companies—El Paso Corporation and Copano Energy, L.L.C.—that are no longer publicly traded, (ii) removed two companies which are “sponsored” MLPs for which relevant information is not publicly available— ONEOK Partners, L.P.
and Williams Partners L.P.—and replaced them with their publicly traded general partners (the two general partners were then moved from our utility comparator group to our MLP comparator group), (iii) removed certain companies that were no longer considered to be appropriate for compensation comparison purposes for other reasons, such as being either too large or too small, and (iv) added new companies that are better alternatives to replace the companies that were removed in order to increase the number of companies in each comparator group to fifteen. After these adjustments, the 2014 Peer Group companies (for purposes of determining 2014 compensation levels) are:
| • | MLP peer companies : Access Midstream Partners, L.P., Atlas Pipeline Partners, L.P., Buckeye Partners, L.P., Crosstex Energy, L.P., DCP Midstream Partners, LP, Enbridge Energy Partners L.P., Energy Transfer Partners, L.P., Enterprise Products Partners L.P., Genesis Energy, L.P., Magellan Midstream Partners, L.P., MarkWest Energy Partners, L.P., NuStar Energy L.P., ONEOK, Inc., Plains All American Pipeline, L.P., Regency Energy Partners LP and Williams Companies, Inc. |
| • | E&P peer companies : Apache Corporation, Cabot Oil & Gas Corporation, Cimarex Energy Company, Denbury Resources Inc., Devon Energy Corporation, EOG Resources, Inc., Halcon Resources Corporation, Murphy Oil Corporation, Newfield Exploration Company, Noble Energy Inc., Pioneer Natural Resources Company, QEP Resources, Inc., SM Energy Company, Southwestern Energy Company and Ultra Petroleum Corporation |
| • | Utility peer companies : AGL Resources, Inc., Ameren Corporation, Atmos Energy Corporation, CenterPoint Energy, Inc., Dominion Resources Services Inc., DTE Energy Company, Enbridge Inc., EQT Corporation, National Fuel Gas Company, NiSource Inc., Questar Corporation, Sempra Energy, Spectra Energy Corporation, and TransCanada Corporation |
Other Compensation Matters
Accounting Considerations.
We account for the equity compensation expense for our employees, including our named executive officers, under the rules of Financial Accounting Standards Board, Accounting Standards Codification Topic 718 (“FASB ASC Topic 718”), which requires us to estimate and record an expense for each award of long-term equity incentive compensation over the vesting period of the award. Accounting rules also require us to record cash compensation as an expense at the time the obligation is accrued.
Clawback Policy.
To date, we have not adopted a formal clawback policy to recoup incentive based compensation upon the occurrence of a financial restatement, misconduct, or other specified events. However, restricted stock and/or restricted stock unit agreements covering grants made to our named executive officers and other employees in 2011 and later years do include language providing that any compensation, payments or benefits provided under such an award (including profits realized from the sale of earned shares) are subject to clawback to the extent required by applicable law.
Securities Trading Policy.
All of our officers, employees and directors are subject to our Insider Trading Policy, which, among other things, prohibits officers, employees and directors from engaging in certain short-term or speculative transactions involving our securities. Specifically, the policy provides that officers, employees and directors may not engage in the following transactions: (i) purchasing our common stock on margin, (ii) short sales of our common stock, or (iii) the purchase or sale of options of any kind, whether puts or calls, or other derivative securities, relating to our common stock.
Compensation Risk Assessment
The Compensation Committee reviews the relationship between our risk management policies and compensation policies and practices each year and, for 2013, has concluded that we do not have any compensation policies or practices that expose us to excessive or unnecessary risks that are reasonably likely to have a material adverse effect on us. Because our Compensation Committee retains the sole discretion for determining the actual amount paid to executives pursuant to our annual cash incentive bonus program, our Compensation Committee is able to assess the actual behavior of our executives as it relates to risk-taking in awarding bonus amounts. In addition, the performance objectives applicable to our annual bonus program consist of a combination of six or more diverse company-wide and business unit goals, including commercial, operational and financial goals to support our business plan and priorities, which we believe lessens the potential incentive to focus on meeting certain short term goals at the expense of longer term risk. Further, our use of long-term equity incentive compensation with three year vesting and performance periods serves our executive compensation program’s goal of aligning the interests of executives and shareholders, thereby reducing the incentives to unnecessary risk-taking.
Compensation Committee Report
Messrs.
Crisp, Kagan and Redd
are the current members of our Compensation Committee. Effective February 11, 2014, Mr. Crisp resigned as Chairman of the Compensation Committee, while remaining on the Committee, and the Board of Directors appointed Mr. Redd as Chairman. In fulfilling its oversight responsibilities, the Compensation Committee, as composed prior to February 11, 2014, has reviewed and discussed with management the Compensation Discussion and Analysis contained in our Annual Report on Form 10-K for the year ended December 31, 2013. Based on these reviews and discussions, the Compensation Committee, as composed prior to February 11, 2014, recommended to our Board of Directors that the Compensation Discussion and Analysis be included in our Annual Report on Form 10-K for the year ended December 31, 2013 for filing with the SEC.
The information contained in this report shall not be deemed to be “soliciting material” or to be “filed” with the SEC, nor shall such information be incorporated by reference into any future filings with the SEC, or subject to the liabilities of Section 18 of the Exchange Act, except to the extent that we specifically incorporate it by reference into a document filed under the Securities Act of 1933, as amended, or the Exchange Act.
The Compensation Committee
|
Charles R. Crisp, Chairman
|
Peter R. Kagan
|
Ershel C. Redd Jr.
|
Executive Compensation Tables
Summary Compensation Table for 2013
The following Summary Compensation Table sets forth the compensation of our named executive officers for 2013, 2012 and 2011. Additional details regarding the applicable elements of compensation in the Summary Compensation Table are provided in the footnotes following the table.
|
Name and Principal Position
|
Year
|
Salary
|
Bonus (1)
|
Stock
Awards
($)(2)
|
All Other
Compensation (3)
|
Total
Compensation
|
||||||||||||||||
|
Joe Bob Perkins
|
2013
|
$
|
517,500
|
$
|
918,750
|
$
|
1,012,070
|
$
|
21,456
|
$
|
2,469,776
|
|||||||||||
|
Chief Executive Officer
|
2012
|
478,000
|
633,600
|
784,417
|
20,488
|
1,916,505
|
||||||||||||||||
|
2011
|
454,000
|
748,800
|
542,079
|
20,390
|
1,765,269
|
|||||||||||||||||
|
|
|
|||||||||||||||||||||
|
Matthew J. Meloy
|
2013
|
316,667
|
355,469
|
360,238
|
21,046
|
1,053,420
|
||||||||||||||||
|
Senior Vice President, Chief
|
2012
|
268,333
|
283,594
|
290,776
|
20,274
|
862,977
|
||||||||||||||||
|
Financial Officer and Treasurer
|
2011
|
228,125
|
235,000
|
160,859
|
19,997
|
643,981
|
||||||||||||||||
|
|
|
|||||||||||||||||||||
|
Rene R. Joyce
|
2013
|
560,000
|
980,000
|
1,025,563
|
21,542
|
2,587,105
|
||||||||||||||||
|
Executive Chairman of
|
2012
|
557,833
|
924,000
|
1,022,777
|
20,569
|
2,525,179
|
||||||||||||||||
|
the Board of Directors
|
2011
|
529,000
|
1,094,000
|
979,380
|
20,520
|
2,622,900
|
||||||||||||||||
|
|
|
|||||||||||||||||||||
|
James W. Whalen
|
2013
|
480,000
|
672,000
|
661,608
|
21,378
|
1,834,986
|
||||||||||||||||
|
Advisor to Chairman and CEO
|
2012
|
478,000
|
633,600
|
659,793
|
20,488
|
1,791,881
|
||||||||||||||||
|
2011
|
454,000
|
748,800
|
542,079
|
20,390
|
1,765,269
|
|||||||||||||||||
|
|
|
|||||||||||||||||||||
|
Michael A. Heim
|
2013
|
480,833
|
679,000
|
888,231
|
21,381
|
2,069,445
|
||||||||||||||||
|
President and Chief Operating Officer
|
2012
|
452,500
|
607,200
|
685,357
|
20,462
|
1,765,519
|
||||||||||||||||
|
2011
|
403,500
|
664,000
|
480,517
|
20,302
|
1,568,319
|
|||||||||||||||||
| (1) | For 2013, represents payments pursuant to our 2013 Bonus Plan. Please see “—Components of Executive Compensation Program for Fiscal 2013—Annual Cash Incentive Bonus.” As discussed above, payments pursuant to our Bonus Plan are discretionary and not based on objective performance measures. |
| (2) | Amounts reported in the “Stock Awards” column represent the aggregate grant date fair value of restricted stock awards under our Stock Incentive Plan and of equity-settled performance unit awards under the Partnership’s Long-Term Incentive Plan, in each case, granted in 2013 and computed in accordance with FASB ASC Topic 718. Assumptions used in the calculation of these amounts are included in Note 22 to our “Consolidated Financial Statements” beginning on page F-1 of our Annual Report on Form 10-K for fiscal year 2013. Detailed information about the amount recognized for specific awards is reported in the table under “—Grants of Plan-Based Awards for 2013” below. The grant date fair value of each restricted share subject to the restricted stock awards granted on January 15, 2013, assuming vesting will occur, is $57.015. The aggregate grant date fair value for the equity-settled performance unit awards granted on January 15, 2013 is determined by multiplying a number of units equal to approximately 87% of the number of performance units awarded by $40.30, and is consistent with the estimate of aggregate compensation cost to be recognized over the service period of the awards, excluding the effect of estimated forfeitures. Assuming, instead, a payout percentage for these performance unit awards of 150%, which is the maximum payout percentage under the awards, the aggregate grant date fair value of the equity-settled performance unit awards granted on January 15, 2013 for each named executive officer is as follows: Mr. Joyce - $1,284,623; Mr. Meloy - $451,259; Mr. Perkins - $1,267,697; Mr. Whalen - $828,709; and Mr. Heim - $1,112,582. |
| (3) | For 2013 “All Other Compensation” includes (i) the aggregate value of all employer-provided contributions to our 401(k) plan and (ii) the dollar value of life insurance premiums paid by the Company with respect to life insurance for the benefit of each named executive officer. |
|
Name
|
401(k) and Profit Sharing Plan
|
Dollar Value of Life Insurance
|
Total
|
|||||||||
|
Joe Bob Perkins
|
$
|
20,400
|
$
|
1,056
|
$
|
21,456
|
||||||
|
Matthew J. Meloy
|
20,400
|
646
|
21,046
|
|||||||||
|
Rene R. Joyce
|
20,400
|
1,142
|
21,542
|
|||||||||
|
James W. Whalen
|
20,400
|
979
|
21,379
|
|||||||||
|
Michael A. Heim
|
20,400
|
981
|
21,381
|
|||||||||
Grants of Plan Based Awards for 2013
The following table and the footnotes thereto provide information regarding grants of plan-based equity awards made to the named executive officers during 2013.
|
|
|
Estimated Future Payouts Under
Equity Incentive Plan Awards (#) (1)
|
All Other Stock Awards: Number of Shares of Stock or Units (1)
|
Grant Date Fair Value of Equity Awards (2)
|
||||||||||||||||||
|
Name
|
Grant Date
|
Threshold (#)
|
Target (#)
|
Maximum (#)
|
||||||||||||||||||
|
Mr. Perkins
|
01/15/13
|
|
|
|
4,895
|
$
|
279,088
|
|||||||||||||||
|
01/15/13
|
7,487
|
20,971
|
31,457
|
732,982
|
||||||||||||||||||
|
|
|
|||||||||||||||||||||
|
Mr. Meloy
|
01/15/13
|
1,742
|
99,320
|
|||||||||||||||||||
|
01/15/13
|
2,665
|
7,465
|
11,198
|
260,918
|
||||||||||||||||||
|
|
|
|||||||||||||||||||||
|
Mr. Joyce
|
01/15/13
|
4,960
|
282,794
|
|||||||||||||||||||
|
01/15/13
|
7,587
|
21,251
|
31,877
|
742,769
|
||||||||||||||||||
|
|
|
|||||||||||||||||||||
|
Mr. Whalen
|
01/15/13
|
3,200
|
182,448
|
|||||||||||||||||||
|
01/15/13
|
4,894
|
13,709
|
20,564
|
479,160
|
||||||||||||||||||
|
|
|
|||||||||||||||||||||
|
Mr. Heim
|
01/15/13
|
4,296
|
244,936
|
|||||||||||||||||||
|
01/15/13
|
6,571
|
18,405
|
27,608
|
643,295
|
||||||||||||||||||
| (1) | The grants on January 15, 2013 are restricted stock awards granted under our Stock Incentive Plan and equity-settled performance units granted under the Partnership’s Long-Term Incentive Plan. For a detailed description of how performance achievements will be determined for the equity-settled performance units, see “—Components of Executive Compensation Program for Fiscal 2013—Long-Term Equity Incentive Awards—Equity-Settled Performance Unit Awards.” |
| (2) | The dollar amounts shown for the restricted stock awards granted on January 15, 2013 are determined by multiplying the shares reported in the table by $57.015, which is the grant date fair value of awards computed in accordance with FASB ASC Topic 718. The dollar amounts shown for the equity-settled performance units granted on January 15, 2013 are determined by multiplying a number of units equal to approximately 87% of the number of units reported in the table under the “Target” column by $40.30, which is the grant date fair value of awards computed in accordance with FASB ASC Topic 718 and is consistent with the estimate of aggregate compensation cost to be recognized over the service period of the awards, excluding the effect of estimated forfeitures. |
Narrative Disclosure to Summary Compensation Table and Grants of Plan Based Awards Table
A discussion of 2013 salaries, bonuses, incentive plans and awards is set forth in “—Compensation Discussion and Analysis,” including a discussion of the material terms and conditions of the 2013 restricted stock awards under our Stock Incentive Plan and the 2013 equity-settled performance unit awards under the Partnership’s Long-Term Incentive Plan, such as the vesting schedule of such awards, any applicable performance-based conditions, and the extent to which dividends and distributions are paid with respect to such awards.
Outstanding Equity Awards at 2013 Fiscal Year-End
The following table and the footnotes related thereto provide information regarding equity-based awards outstanding as of December 31, 2013 for each of our named executive officers.
|
|
Stock Awards
|
|||||||||||||||
|
Name
|
Number of Shares of Stock That Have Not Vested (1)
|
Market Value of Shares of Stock That Have Not Vested (2)
|
Equity Incentive Plan Awards: Number of Unearned Units That Have Not Vested (3)
|
Equity Incentive Plan Awards: Market or Payout Value of Unearned Units That Have Not Vested (4)
|
||||||||||||
|
Joe Bob Perkins
|
14,180
|
$
|
1,250,251
|
65,940
|
$
|
3,448,662
|
||||||||||
|
Matthew J. Meloy
|
4,868
|
429,212
|
22,796
|
1,192,231
|
||||||||||||
|
Rene R. Joyce
|
19,215
|
1,694,187
|
87,815
|
4,592,725
|
||||||||||||
|
James W. Whalen
|
11,685
|
1,030,266
|
53,757
|
2,811,491
|
||||||||||||
|
Michael A. Heim
|
12,465
|
1,099,039
|
57,927
|
3,029,582
|
||||||||||||
| (1) | Represents the following shares of restricted stock under our Stock Incentive Plan held by our named executive officers: |
|
|
February 14, 2011 Award (a)
|
January 12, 2012 Award (b)
|
January 15, 2013 Award (c)
|
Total
|
||||||||||||
|
Joe Bob Perkins
|
4,250
|
5,035
|
4,895
|
14,180
|
||||||||||||
|
Matthew J. Meloy
|
1,260
|
1,866
|
1,742
|
4,868
|
||||||||||||
|
Rene R. Joyce
|
7,690
|
6,565
|
4,960
|
19,215
|
||||||||||||
|
James W. Whalen
|
4,250
|
4,235
|
3,200
|
11,685
|
||||||||||||
|
Michael A. Heim
|
3,770
|
4,399
|
4,296
|
12,465
|
||||||||||||
| (a) | The restricted shares subject to the February 14, 2011 awards are subject to the following vesting schedule: 100% of the restricted shares vest on February 14, 2014, contingent upon continuous employment at the end of the vesting period. |
| (b) | The restricted shares subject to the January 12, 2012 awards are subject to the following vesting schedule: 100% of the restricted shares vest on January 12, 2015, contingent upon continuous employment at the end of the vesting period. |
| (c) | The restricted shares subject to the January 15, 2013 awards are subject to the following vesting schedule: 100% of the restricted shares vest on January 15, 2016, contingent upon continuous employment at the end of the vesting period. |
The treatment of the outstanding restricted stock awards upon certain terminations of employment (including retirement) or the occurrence of a change in control is described below under “—Potential Payments Upon Termination or Change in Control.”
| (2) | The dollar amounts shown are determined by multiplying the number of shares of restricted stock reported in the table by the closing price of a share of our common stock on December 31, 2013 ($88.17). The amounts do not include any related dividends accrued with respect to the awards. |
| (3) | Represents the following performance units linked to the performance of the Partnership’s common units held by our named executive officers: |
|
|
February 17, 2011
Award (a)
|
January 12, 2012 Award (b)
|
January 15, 2013 Award (c)
|
Total
|
||||||||||||
|
Joe Bob Perkins
|
17,535
|
24,435
|
23,970
|
65,940
|
||||||||||||
|
Matthew J. Meloy
|
5,206
|
9,059
|
8,532
|
22,796
|
||||||||||||
|
Rene R. Joyce
|
31,665
|
31,860
|
24,290
|
87,815
|
||||||||||||
|
James W. Whalen
|
17,535
|
20,553
|
15,669
|
53,757
|
||||||||||||
|
Michael A. Heim
|
15,540
|
21,350
|
21,037
|
57,927
|
||||||||||||
| (a) | Reflects the target number of performance units granted to the named executive officers on February 17, 2011 multiplied by a performance percentage of 150%, which is the performance level under the award and in accordance with SEC rules is the next higher performance measure that exceeds 2013 performance. Vesting of these awards is contingent upon continuous employment at the end of the performance period, which ends June 30, 2014, and the Partnership’s performance over the applicable performance period measured against a peer group of companies. |
| (b) | Reflects the target number of performance units granted to the named executive officers on January 12, 2012 multiplied by a performance percentage of 150%, which is the maximum performance level under the award that would have been attained based on 2013 performance. Vesting of these awards is contingent upon continuous employment at the end of the performance period, which ends June 30, 2015, and the Partnership’s performance over the applicable performance period measured against a peer group of companies. |
| (c) | Reflects the target number of performance units granted to the named executive officers on January 15, 2013 multiplied by a performance percentage of 114.3%, which in accordance with SEC rules is the next higher performance measure that exceeds 2013 performance. Vesting of these awards is contingent upon continuous employment at the end of the performance period, which ends June 30, 2016, and the Partnership’s performance over the applicable performance period measured against a peer group of companies. |
The treatment of the outstanding performance units upon certain terminations of employment (including retirement) or the occurrence of a change in control is described below under “—Potential Payments Upon Termination or Change in Control.”
| (4) | The dollar amounts shown are determined by multiplying the number of performance units reported in the table by the closing price of a common unit of the Partnership on December 31, 2013 ($52.30). The amounts do not include any related cash distributions accrued with respect to the awards. |
Option Exercises and Stock Vested in 2013
The following table provides the amount realized during 2013 by each named executive officer upon the vesting of restricted stock and performance unit awards. None of our named executive officers exercised any option awards during the 2013 year and, currently, there are no options outstanding under any of our plans.
|
|
Stock Vested for 2013
|
Units Vested for 2013
|
||||||||||||||
|
Name
|
Number of Shares Acquired on Vesting (1)
|
Value Realized on Vesting (2)
|
Number of Units Acquired on Vesting (3)
|
Value Realized on Vesting (4)
|
||||||||||||
|
Joe Bob Perkins
|
27,192
|
$
|
2,148,440
|
19,806
|
$
|
999,210
|
||||||||||
|
Matthew J. Meloy
|
8,970
|
708,720
|
5,716
|
288,372
|
||||||||||||
|
Rene R. Joyce
|
48,450
|
3,828,035
|
25,758
|
1,299,477
|
||||||||||||
|
James W. Whalen
|
27,192
|
2,148,440
|
19,240
|
970,661
|
||||||||||||
|
Michael A. Heim
|
24,354
|
1,924,210
|
14,139
|
713,289
|
||||||||||||
| (1) | Shares of restricted stock granted under our Stock Incentive Plan on December 10, 2010, which vested on December 10, 2013 (40% of the total number of restricted shares subject to each grant). |
| (2) | Computed with respect to the restricted stock awards granted under our Stock Incentive Plan by multiplying the number of shares of stock vesting by the closing price of a share of common stock on the December 10, 2013 vesting date ($79.01) and does not include associated dividends accrued during the vesting period. |
| (3) | Performance units linked to the performance of the Partnership’s common units granted under the Partnership’s Long-Term Incentive Plan in December 2009 (in August 2010 with respect to Mr. Meloy), which vested on June 30, 2013, at the 142.9% payout level |
| (4) | Computed as the number of performance units vested multiplied by the closing price of a Partnership common unit on June 28, 2013 ($50.45), the last trading day preceding June 30, 2013 since the June 30, 2013 vesting date was not a trading day, and does not include associated distributions accrued during the vesting period. |
Pension Benefits
Other than our 401(k) Plan, we do not have any plan that provides for payments or other benefits at, following, or in connection with, retirement.
Non-Qualified Deferred Compensation
We do not have any plan that provides for the deferral of compensation on a basis that is not tax qualified.
Potential Payments Upon Termination or Change in Control
Aggregate Payments
The table below reflects the aggregate amount of payments and benefits that we believe our named executive officers would have received under our Executive Officer Change in Control Severance Program (the “Change in Control Program”), our Stock Incentive Plan and the Partnership’s Long-Term Incentive Plan upon certain specified termination of employment and/or a change in control events, in each case, had such event occurred on December 31, 2013. Details regarding individual plans and arrangements follow the table. The amounts below constitute estimates of the amounts that would be paid to our named executive officers upon each designated event, and do not include any amounts accrued through fiscal 2013 year-end that would be paid in the normal course of continued employment, such as accrued but unpaid salary and benefits generally available to all salaried employees. The actual amounts to be paid are dependent on various factors, which may or may not exist at the time a named executive officer is actually terminated and/or a change in control actually occurs. Therefore, such amounts and disclosures should be considered “forward-looking statements.”
|
Name
|
Change in Control (No Termination)
|
Qualifying Termination Following Change in Control
|
Termination by us without Cause
|
Termination for Death or Disability
|
||||||||||||
|
Joe Bob Perkins
|
$
|
4,029,328
|
$
|
7,229,857
|
$
|
4,007,045
|
$
|
5,302,530
|
||||||||
|
Matthew J. Meloy
|
1,390,497
|
2,903,526
|
1,385,803
|
1,830,232
|
||||||||||||
|
Rene R. Joyce
|
5,341,977
|
8,739,994
|
5,329,864
|
7,089,653
|
||||||||||||
|
James W. Whalen
|
3,266,916
|
5,896,933
|
3,263,960
|
4,333,388
|
||||||||||||
|
Michael A. Heim
|
3,540,489
|
6,210,018
|
3,520,031
|
4,658,883
|
||||||||||||
Executive Officer Change in Control Severance Program
We adopted the Executive Officer Change in Control Program, referred to herein as the Change in Control Program, on and effective as of January 12, 2012. Each of our named executive officers was an eligible participant in the Change in Control Program during the 2013 calendar year.
The Change in Control Program is administered by our Vice President – Human Resources. The Change in Control Program provides that if, in connection with or within 18 months after a “Change in Control,” a participant suffers a “Qualifying Termination,” then the individual will receive a severance payment, paid in a single lump sum cash payment within 60 days following the date of termination, equal to three times (i) the participant’s annual salary as of the date of the Change in Control or the date or termination, whichever is greater, and (ii) the amount of the participant’s annual salary multiplied by the participant’s most recent “target” bonus percentage specified by the Compensation Committee prior to the Change in Control. In addition, the participant (and his eligible dependents, as applicable) will receive the continuation of their medical and dental benefits until the earlier to occur of (a) three years from the date of termination, or (b) the date the participant becomes eligible for coverage under another employer’s plan.
For purposes of the Change in Control Program, the following terms will generally have the meanings set forth below:
| · | Cause means discharge of the participant by us on the following grounds: (i) the participant’s gross negligence or willful misconduct in the performance of his duties, (ii) the participant’s conviction of a felony or other crime involving moral turpitude, (iii) the participant’s willful refusal, after 15 days’ written notice, to perform his material lawful duties or responsibilities, (iv) the participant’s willful and material breach of any corporate policy or code of conduct, or (v) the participant’s willfully engaging in conduct that is known or should be known to be materially injurious to us or our subsidiaries. |
| · | Change in Control means any of the following events: (i) any person (other than the Partnership) becomes the beneficial owner of more than 20% of the voting interest in us or in the general partner, (ii) any sale, lease, exchange or other transfer (in one transaction or a series of related transactions) of all or substantially all of the assets of the Company or the general partner (other than to the Partnership or its affiliates), (iii) a transaction resulting in a person other than Targa Resources GP LLC or an affiliate being the general partner of the Partnership, (iv) the consummation of any merger, consolidation or reorganization involving us or the general partner in which less than 51% of the total voting power of outstanding stock of the surviving or resulting entity is beneficially owned by the stockholders of the Company or the general partner, immediately prior to the consummation of the transaction, or (v) a majority of the members of the Board of Directors or the Board of Directors of the general partner is replaced during any 12 month period by directors whose appointment or election is not endorsed by a majority of the members of the applicable Board of Directors before the date of the appointment or election . |
| · | Good Reason means : (i) a material reduction in the participant’s authority, duties or responsibilities, (ii) a material reduction in the participant’s base compensation, or (iii) a material change in the geographical location at which the participant must perform services. The individual must provide notice to us of the alleged Good Reason event within 90 days of its occurrence and we have the opportunity to remedy the alleged Good Reason event within 30 days from receipt of the notice of such allegation. |
| · | Qualifying Termination means (i) an involuntary termination of the individual’s employment by us without Cause or (ii) a voluntary resignation of the individual’s employment for Good Reason. |
All payments due under the Change in Control Program will be conditioned on the execution and nonrevocation of a release for our benefit and the benefit of our related entities and agents. The Change in Control Program will supersede any other severance program for eligible participants in the event of a Change in Control, but will not affect accelerated vesting of any equity awards under the terms of the plans governing such awards.
If amounts payable to a named executive officer under the
Change in Control Program (together with any other amounts that are payable by us as a result of a Change in Control (collectively, the “Payments”) exceed the amount allowed under section 280G of the Internal Revenue Code for such individual, thereby subjecting the individual to an excise tax under section 4999 of the Internal Revenue Code, then, depending on which method produces the largest net after-tax benefit for the recipient, the Payments shall either be: (i) reduced to the level at which no excise tax applies or (ii) paid in full, which would subject the individual to the excise tax.
The following table reflects payments that would have been made to each of the named executive officers under the Change in Control Program in the event there was a Change in Control and the officer incurred a Qualifying Termination, in each case, as of December 31, 2013.
|
Name
|
Qualifying Termination Following Change in Control (1)
|
|||
|
Joe Bob Perkins
|
$
|
3,200,529
|
||
|
Matthew J. Meloy
|
1,513,029
|
|||
|
Rene R. Joyce
|
3,398,017
|
|||
|
James W. Whalen
|
2,630,017
|
|||
|
Michael A. Heim
|
2,669,529
|
|||
| (1) | Includes 3 years’ worth of continued participation in our medical and dental plans, calculated based on the monthly employer-paid portion of the premiums for our medical and dental plans as of December 31, 2013 for each named executive officer and his eligible dependents in the following amounts: (a) Mr. Perkins – $50,529, (b) Mr. Meloy – $50,529, (c) Mr. Joyce – $38,017, (d) Mr. Whalen – $38,017, and (e) Mr. Heim – $50,529. |
Stock Incentive Plan
Each of our named executive officers held outstanding restricted stock awards under our form of restricted stock agreement (the “Stock Agreement”) and the Stock Incentive Plan as of December 31, 2013. If a “Change in Control” occurs and the named executive officer has (i) remained continuously employed by us from the date of grant to the date upon which such Change in Control occurs or (ii) retired following the date of grant and either performed consulting services for us or refrained from working for one of our competitors or in a similar role for another company, through the date of the Change in Control, then, in either case, the restricted stock granted to him under the Stock Agreements, and related dividends then credited to him, will fully vest on the date upon which such Change in Control occurs.
Restricted stock granted to a named executive officer under the Stock Agreements, and related dividends then credited to him, will also fully vest if the named executive officer’s employment is terminated by reason of death or a “Disability”. If a named executive officer’s employment with us is terminated for any reason other than death or Disability, then his unvested restricted stock is forfeited to us for no consideration, except that, if a named executive officer retires, his awards will continue to vest on the third anniversary of the date of grant if, from the date of his retirement through the third anniversary date, the named executive officer has either performed consulting services for us or refrained from working for one of our competitors or in a similar role for another company.
The following terms generally have the following meanings for purposes of the Stock Incentive Plan and Stock Agreements:
| · | Affiliate means an entity or organization which, directly or indirectly, controls, is controlled by, or is under common control with, us. |
| · | Change in Control means the occurrence of one of the following events: (i) any person or group acquires or gains ownership or control (including, without limitation, the power to vote), by way of merger, consolidation, recapitalization, reorganization or otherwise, of more than 50% of the outstanding shares of the our voting stock or more than 50% of the combined voting power of the equity interests in the Partnership or the general partner; (ii) the liquidation or dissolution of us or the approval by the limited partners of the Partnership of a plan of complete liquidation of the Partnership; (iii) the sale or other disposition by us of all or substantially all of our assets in one or more transactions to any person other than Warburg Pincus LLC or any other Affiliate; (iv) the sale or disposition by either the Partnership or the general partner of all or substantially all of its assets in one or more transactions to any person other than to Warburg Pincus LLC, the general partner, or any other Affiliate; (v) a transaction resulting in a person other than Targa Resources GP LLC or an Affiliate being the general partner of the Partnership; or (vi) as a result of or in connection with a contested election of directors, the persons who were our directors before such election shall cease to constitute a majority of our Board of Directors. |
| · | Disability means a disability that entitles the named executive officer to disability benefits under our long-term disability plan. |
The following table reflects amounts that would have been received by each of the named executive officers under the Stock Incentive Plan and related Stock Agreements in the event there was a Change in Control or their employment was terminated due to death or Disability, each as of December 31, 2013. The amounts reported below assume that the price per share of our common stock was $88.17, which was the closing price per share of our common stock on December 31, 2013. No amounts are reported assuming retirement as of December 31, 2013, since additional conditions must be met following a named executive officer’s retirement in order for any restricted stock awards to become vested.
|
Name
|
Change in Control
|
|
Termination for Death or Disability
|
|
||||||||
|
Joe Bob Perkins
|
$
|
1,295,485
|
(1
|
)
|
$
|
1,295,485
|
(1
|
)
|
||||
|
Matthew J. Meloy
|
444,429
|
(2
|
)
|
444,429
|
(2
|
)
|
||||||
|
Rene R. Joyce
|
1,759,789
|
(3
|
)
|
1,759,789
|
(3
|
)
|
||||||
|
James W. Whalen
|
1,069,428
|
(4
|
)
|
1,069,428
|
(4
|
)
|
||||||
|
Michael A. Heim
|
1,138,852
|
(5
|
)
|
1,138,852
|
(5
|
)
|
||||||
| (1) | Of the amount reported under each of the “Change in Control” column and the “Termination for Death or Disability” column: (a) $374,723 and $18,880, respectively, relate to the restricted shares and related dividend rights granted on February 14, 2011, which are scheduled to vest February 14, 2014; (b) $443,936 and $16,295, respectively, relate to the restricted shares and related dividend rights granted on January 12, 2012, which are scheduled to vest on January 12, 2015 and (c) $431,592 and $10,059, respectively, relate to the restricted shares and related dividend rights granted on January 15, 2013, which are scheduled to vest January 15, 2016. |
| (2) | Of the amount reported under each of the “Change in Control” column and the “Termination for Death or Disability” column: (a) $111,094 and $5,598, respectively, relate to the restricted shares and related dividend rights granted on February 14, 2011, which are scheduled to vest February 14, 2014; (b) $164,525 and $6,039, respectively, relate to the restricted shares and related dividend rights granted on January 12, 2012, which are scheduled to vest on January 12, 2015; and (c) $153,592 and $3,580, respectively, relate to the restricted shares and related dividend rights granted on January 15, 2013, which are scheduled to vest January 15, 2016. |
| (3) | Of the amount reported under each of the “Change in Control” column and the “Termination for Death or Disability” column: (a) $678,027 and $34,163, respectively, relate to the restricted shares and related dividend rights granted on February 14, 2011, which are scheduled to vest February 14, 2014; (b) $578,836 and $21,246, respectively, relate to the restricted shares and related dividend rights granted on January 12, 2012, which are scheduled to vest on January 12, 2015; and (c) $437,323 and $10,193, respectively, relate to the restricted shares and related dividend rights granted on January 15, 2013, which are scheduled to vest January 15, 2016. |
| (4) | Of the amount reported under each of the “Change in Control” column and the “Termination for Death or Disability” column: (a) $374,723 and $18,880, respectively, relate to the restricted shares and related dividend rights granted on February 14, 2011, which are scheduled to vest February 14, 2014; (b) $373,400 and $13,706, respectively, relate to the restricted shares and related dividend rights granted on January 12, 2012, which are scheduled to vest on January 12, 2015; and (c) $282,144 and $6,576, respectively, relate to the restricted shares and related dividend rights granted on January 15, 2013, which are scheduled to vest January 15, 2016. |
| (5) | Of the amount reported under each of the “Change in Control” column and the “Termination for Death or Disability” column: (a) $332,401 and $16,748, respectively, relate to the restricted shares and related dividend rights granted on February 14, 2011, which are scheduled to vest February 14, 2014; (b) $387,860 and $14,236, respectively, relate to the restricted shares and related dividend rights granted on January 12, 2012, which are scheduled to vest on January 12, 2015; and (c) $378,778 and $8,829, respectively, relate to the restricted shares and related dividend rights granted on January 15, 2013, which are scheduled to vest January 15, 2016. |
Partnership’s Long-Term Incentive Plan
Each of our named executive officers held outstanding performance unit awards under the Partnership’s form of performance unit grant agreement (the “Performance Unit Agreement”) and the Partnership’s Long-Term Incentive Plan as of December 31, 2013. If a “Change in Control” occurs during the performance period established for the performance units and related distribution rights granted to a named executive officer under the Performance Unit Agreements, the performance units will be settled upon the occurrence of the Change in Control by providing the named executive officer with a number of common units of the Partnership equal to the target number of performance units granted to the named executive officer plus a cash payment in the amount of distribution equivalent rights then credited to the named executive officer, if any. The general partner may elect to settle the performance unit awards in cash instead of in common units.
Generally, performance units and the related distribution equivalent rights granted to a named executive officer under a Performance Unit Agreement will be automatically forfeited without payment upon the termination of the named executive officer’s employment with us and our affiliates. However, if a named executive officer’s employment is terminated by reason of his death or “Disability” or is terminated by us other than for “Cause,” or if the executive has retired and he has either performed consulting services for us or refrained from working for one of our competitors or in a similar role for another company, through the end of the performance period, he will become vested in the performance units that he is otherwise qualified to receive payment for based on achievement of the performance goal at the end of the performance period as if the named executive officer had remained continuously employed through the end of the performance period. The named executive officer will also receive a cash payment in the amount of the distribution equivalent rights that would have accrued through the end of the performance period.
The following terms generally have the meanings specified below for purposes of the Partnership’s Long-Term Incentive Plan:
| · | Change in Control means (i) any person or group, other than an affiliate, becomes the beneficial owner, by way of merger, consolidation, recapitalization, reorganization or otherwise, of 50% or more of the combined voting power of the equity interests in the Partnership or the general partner, (ii) the limited partners of the Partnership approve a plan of complete liquidation of the Partnership, (iii) the sale or other disposition by either the Partnership or the general partner of all or substantially all of its assets in one or more transactions to any person other than the general partner or one of the general partner’s affiliates, or (iv) a transaction resulting in a person other than Targa Resources GP LLC or one of its affiliates being the general partner of the Partnership. |
| · | Cause means (i) failure to perform assigned duties and responsibilities, (ii) engaging in conduct which is injurious (monetarily or otherwise) to us or our affiliates, (iii) breach of any corporate policy or code of conduct established by us or our affiliates, or breach of any agreement between the named executive officer and us or our affiliates, or (iv) conviction of a misdemeanor involving moral turpitude or a felony. If the named executive officer is a party to an agreement with us or our affiliates in which this term is defined, then that definition will apply for purposes of the Long-Term Incentive Plan and the Performance Unit Agreement. |
| · | Disability means a disability that entitles the named executive officer to disability benefits under our long-term disability plan. |
The following table reflects amounts that would have been received by each of the named executive officers under the Partnership’s Long-Term Incentive Plan and related Performance Unit Agreements in the event there was a Change in Control (in which case the performance percentage is deemed to be 100%) or their employment was terminated due to death or Disability or by us without Cause, each as of December 31, 2013. No amounts are reported assuming retirement as of December 31, 2013, since additional conditions must be met following a named executive officer’s retirement in order for any performance unit awards to become vested. The amounts reported below assume that the price per Partnership common unit was $52.30, which was the closing price per common unit on December 31, 2013. In addition, the amounts reported below in the “Termination for Death or Disability or Without Cause” column assume that the applicable performance period for each award ended December 31, 2013 and are based on achieving the next higher performance level for the award (if any) that exceeds performance for the 2013 fiscal year; however, the distribution amounts reported in this column are calculated through the end of the actual applicable performance period assuming the distribution level in effect as of December 31, 2013.
|
Name
|
Change in
Control
|
|
Termination for
Death or Disability
|
|
||||||||
|
Joe Bob Perkins
|
$
|
2,733,843
|
(1
|
)
|
$
|
4,007,045
|
(1
|
)
|
||||
|
Matthew J. Meloy
|
946,068
|
(2
|
)
|
1,385,803
|
(2
|
)
|
||||||
|
Rene R. Joyce
|
3,582,188
|
(3
|
)
|
5,329,864
|
(3
|
)
|
||||||
|
James W. Whalen
|
2,197,488
|
(4
|
)
|
3,263,960
|
(4
|
)
|
||||||
|
Michael A. Heim
|
2,401,637
|
(5
|
)
|
3,520,031
|
(5
|
)
|
||||||
| (1) | Of the amount reported under the “Change in Control” column: (a) $611,387 and $76,073, respectively, relate to the performance units and related distribution equivalent rights granted on February 17, 2011; (b) $851,967 and $67,278, respectively, relate to the performance units and related distribution equivalent rights granted on January 12, 2012; and (c) $1,096,783 and $30,355, respectively, relate to the performance units and related distribution equivalent rights granted on January 15, 2013. Of the amount reported under the “Termination for Death or Disability or Without Cause” column: (a) $917,081 and $139,798, respectively, relate to the performance units and related distribution equivalent rights granted on February 17, 2011; (b) $1,277,951 and $208,308, respectively, relate to the performance units and related distribution equivalent rights granted on January 12, 2012; and (c) $1,253,630 and $210,277, respectively, relate to the performance units and related distribution equivalent rights granted on January 15, 2013. |
| (2) | Of the amount reported under the “Change in Control” column: (a) $181,481 and $22,581, respectively, relate to the performance units and related distribution equivalent rights granted on February 17, 2011; (b) $315,840 and $24,941, respectively, relate to the performance units and related distribution equivalent rights granted on January 12, 2012; and (c) $390,420 and $10,805, respectively, relate to the performance units and related distribution equivalent rights granted on January 15, 2013. Of the amount reported under the “Termination for Death or Disability or Without Cause” column: (a) $272,222 and $41,497, respectively, relate to the performance units and related distribution equivalent rights granted on February 17, 2011; (b) $473,786 and $77,228, respectively, relate to the performance units and related distribution equivalent rights granted on January 12, 2012; and (c) $446,223 and $74,847, respectively, relate to the performance units and related distribution equivalent rights granted on January 15, 2013. |
| (3) | Of the amount reported under each of the “Change in Control” column: (a) $1,104,053 and $137,373, respectively, relate to the performance units and related distribution equivalent rights granted on February 17, 2011; (b) $1,110,852 and $87,721, respectively, relate to the performance units and related distribution equivalent rights granted on January 12, 2012; and (c) $1,111,427 and $30,762, respectively, relate to the performance units and related distribution equivalent rights granted on January 15, 2013. Of the amount reported under the “Termination for Death or Disability or Without Cause” column: (a) $1,656,080 and $252,449, respectively, relate to the performance units and related distribution equivalent rights granted on February 17, 2011; (b) $1,666,278 and $271,607, respectively, relate to the performance units and related distribution equivalent rights granted on January 12, 2012; and (c) $1,270,366 and $213,084, respectively, relate to the performance units and related distribution equivalent rights granted on January 15, 2013. |
| (4) | Of the amount reported under the “Change in Control” column: (a) $611,387 and $76,073, respectively, relate to the performance units and related distribution equivalent rights granted on February 17, 2011; (b) $716,615 and $56,589, respectively, relate to the performance units and related distribution equivalent rights granted on January 12, 2012; and (c) $716,981 and $19,843, respectively, relate to the performance units and related distribution equivalent rights granted on January 15, 2013. Of the amount reported under the “Termination for Death or Disability or Without Cause” column: (a) $917,081 and $139,798, respectively, relate to the performance units and related distribution equivalent rights granted on February 17, 2011; (b) $1,074,922 and $175,214, respectively, relate to the performance units and related distribution equivalent rights granted on January 12, 2012; and (c) $819,489 and $137,456, respectively, relate to the performance units and related distribution equivalent rights granted on January 15, 2013. |
| (5) | Of the amount reported under the “Change in Control” column: (a) $541,828 and $67,418, respectively, relate to the performance units and related distribution equivalent rights granted on February 17, 2011; (b) $744,386 and $58,782, respectively, relate to the performance units and related distribution equivalent rights granted on January 12, 2012; and (c) $962,582 and $26,641, respectively, relate to the performance units and related distribution equivalent rights granted on January 15, 2013. Of the amount reported under the “Termination for Death or Disability or Without Cause” column: (a) $812,742 and $123,893, respectively, relate to the performance units and related distribution equivalent rights granted on February 17, 2011; (b) $1,116,605 and $182,009, respectively, relate to the performance units and related distribution equivalent rights granted on January 12, 2012; and (c) $1,100,235 and $184,547, respectively, relate to the performance units and related distribution equivalent rights granted on January 15, 2013. |
Director Compensation
The following table sets forth the compensation earned by our non-employee directors for 2013:
|
Name
|
Fees Earned or Paid in Cash
|
Stock Awards $ (2)
|
Total Compensation
|
|||||||||
|
Charles R. Crisp
|
$
|
93,500
|
$
|
85,066
|
$
|
178,566
|
||||||
|
Ershel C. Redd Jr.
|
83,000
|
85,066
|
168,066
|
|||||||||
|
Chris Tong
|
98,500
|
85,066
|
183,566
|
|||||||||
|
Peter R. Kagan (1)
|
84,000
|
85,066
|
169,066
|
|||||||||
|
In Seon Hwang (1)
|
15,333
|
85,066
|
100,399
|
|||||||||
|
Laura C. Fulton
|
66,333
|
89,281
|
155,614
|
|||||||||
| (1) | Each of Messrs. Kagan and Hwang earned compensation for service on the Board of Directors of the general partner in 2013 that is not included in the amounts reported above. Please see “Director Compensation” in the Partnership’s Annual Report on Form 10-K for the fiscal year ended December 31, 2013 for additional information. |
| (2) | Amounts reported in the “Stock Awards” column represent the aggregate grant date fair value of fully vested shares of our common stock awarded to the non-employee directors under our Stock Incentive Plan, computed in accordance with FASB ASC Topic 718. For a discussion of the assumptions and methodologies used to value the awards reported in this column, see the discussion contained in the Notes to Consolidated Financial Statements at Note 22 included in our Annual Report on Form 10-K for the year ended December 31, 2013. On January 15, 2013, each director received 1,492 fully vested shares of our common stock in connection with their 2013 service on our Board of Directors, and the grant date fair value of each share of common stock computed in accordance with FASB ASC Topic 718 was $57.015. As of December 31, 2013, none of our non-employee directors held any outstanding stock options or any outstanding, unvested shares of our common stock. |
Narrative to Director Compensation Table
For 2013, all non-employee directors received an annual cash retainer of $56,000. The Chairman of the Audit Committee received an additional annual retainer of $20,000, the Chairman of the Compensation Committee received an additional annual retainer of $15,000 and the Chairman of the Nominating and Governance Committee received an additional retainer of $10,000. All of our non-employee directors receive $1,500 for each Board of Directors, Audit Committee, Compensation Committee, Nominating and Governance Committee, and Conflicts Committee meeting attended. Payment of non-employee director fees is generally made twice annually, at the second regularly scheduled meeting of the Board of Directors and at the final regularly scheduled meeting of the Board of Directors for the fiscal year. All non-employee directors are reimbursed for out-of-pocket expenses incurred in attending Board of Director and committee meetings.
A director who is also an employee receives no additional compensation for services as a director. Accordingly, the Summary Compensation Table reflects total compensation received by Messrs. Joyce, Perkins and Whalen for services performed for us and our affiliates.
Director Long-term Equity Incentives.
We granted equity awards in January 2013 to our non-employee directors under the Stock Incentive Plan. Each of these directors received an award of 1,492 fully vested shares of our common stock, which reflected our intent to provide them with a target value of approximately $80,000 in annual long-term incentive awards. The awards are intended to align the long-term interests of our directors with those of our shareholders.
Changes for 2014
In January 2014, the Board of Directors approved changes to our non-employee director compensation for the 2014 fiscal year by increasing the annual cash retainer for service on our Board of Directors to $61,000 per year.
Director Long-term Equity Incentives.
In January 2014, each of our non-employee directors received an award of 1,033 fully vested shares of our common stock under the Stock Incentive Plan, which reflects our desire to increase the target value of the annual awards from approximately $80,000 to $90,000 per year.
Item 12. Security Ownership of Certain Beneficial Owners and Management and Related Stockholder Matters.
The following table sets forth information regarding the beneficial ownership of our common stock and the beneficial ownership of the Partnership’s common units as of February 10, 2014 (unless otherwise indicated) held by:
| • | each person who beneficially owns 5% or more of our the then outstanding shares of common stock; |
| • | each of our named executive officers; |
| • | each of our directors; and |
| • | all of our executive officers and directors as a group. |
Beneficial ownership is determined under the rules of the Securities and Exchange Commission. In general, these rules attribute beneficial ownership of securities to persons who possess sole or shared voting power and/or investment power with respect to those securities and include, among other things, securities that an individual has the right to acquire within 60 days. Unless otherwise indicated, the stockholders and unitholders identified in the table below have sole voting and investment power with respect to all securities shown as beneficially owned by them. Percentage ownership calculations for any security holder listed in the table below are based on 42,167,343 shares of our common stock and 112,390,094 common units of the Partnership outstanding on February 10, 2014.
|
|
Targa Resources Partners LP
|
Targa Resources Corp.
|
||||||||||||||
|
Name of Beneficial Owner
(1)
|
Common Units Beneficially Owned
(8)
|
Percentage of Common Units Beneficially Owned
(8)
|
Common Stock Beneficially Owned
|
Percentage of Common Stock Beneficially Owned
|
||||||||||||
|
Prudential Financial, Inc. (2)
|
-
|
-
|
4,459,190
|
10.6
|
%
|
|||||||||||
|
BAMCO Inc (3)
|
-
|
-
|
2,367,798
|
5.6
|
%
|
|||||||||||
|
Rene R. Joyce (4)
|
81,000
|
*
|
1,090,361
|
2.6
|
%
|
|||||||||||
|
Joe Bob Perkins (5)
|
32,100
|
*
|
618,404
|
1.5
|
%
|
|||||||||||
|
Michael A. Heim (6)
|
8,000
|
*
|
599,172
|
1.4
|
%
|
|||||||||||
|
James W. Whalen (7)
|
111,152
|
*
|
635,472
|
1.5
|
%
|
|||||||||||
|
Matthew J Meloy
|
6,000
|
*
|
70,017
|
*
|
||||||||||||
|
Peter R. Kagan
|
16,496
|
*
|
47,012
|
*
|
||||||||||||
|
Chris Tong
|
23,150
|
*
|
62,625
|
*
|
||||||||||||
|
Charles R. Crisp
|
11,350
|
*
|
153,966
|
*
|
||||||||||||
|
Ershel C. Redd Jr.
|
1,100
|
*
|
6,886
|
*
|
||||||||||||
|
Laura C. Fulton
|
-
|
*
|
2,525
|
*
|
||||||||||||
|
|
||||||||||||||||
|
All directors and executive officers as a group (14 persons)
|
398,756
|
*
|
4,630,766
|
11.0
|
%
|
|||||||||||
* Less than 1%.
| (1) | Unless otherwise indicated, the address for all beneficial owners in this table is 1000 Louisiana, Suite 4300, Houston, Texas 77002. |
| (2) | As reported on Schedule 13G/A as of December 31, 2013 and filed with the SEC on January 29, 2014, the business address for Prudential Financial, Inc. (“Prudential”) is 751 Broad Street, Newark, New Jersey 07102-3777. Through its parent/subsidiary relationship, Prudential may be deemed the beneficial owner of securities owned by Jennison Associates LLC, Prudential Investment Management, Inc. and Quantitative Management Associates LLC and may have direct or indirect voting and/or investment discretion over 4,459,190 shares. Of the 4,459,190 shares reported as beneficially held by Prudential, Prudential has reported that it has shared voting and dispositive power with respect to 4,140,389 of these shares. |
| (3) | As reported on Form 13F as of September 30, 2013 and filed with the SEC on November 14, 2013, the business address for BAMCO Inc (“BAMCO”) is 767 Fifth Avenue, 49th Floor, New York, NY 10153. Of the 2,367,798 shares reported as beneficially held by BAMCO, BAMCO has reported that it has no voting power with respect to 200,000 shares. |
| (4) | Shares of common stock beneficially owned by Mr. Joyce include: (i) 230,959 shares issued to The Rene Joyce 2010 Grantor Retained Annuity Trust, of which Mr. Joyce and his wife are co-trustees and have shared voting and investment power; and (ii) 561,292 shares issued to The Kay Joyce 2010 Family Trust, of which Mr. Joyce’s wife is trustee and has sole voting and investment power. |
| (5) | Shares of common stock beneficially owned by Mr. Perkins include 407,370 shares issued to the Perkins Blue House Investments Limited Partnership ("PBHILP"). Mr. Perkins is the sole member of JBP GP, L.L.C., one of the general partners of PBHILP. |
| (6) | Shares of common stock beneficially owned by Mr. Heim include: (i) 187,378 shares issued to The Michael Heim 2009 Family Trust, of which Mr. Heim and his son are co-trustees and have shared voting and investment power; (ii) 116,672 shares issued to The Patricia Heim 2009 Grantor Retained Annuity Trust, of which Mr. Heim and his wife are co-trustees and have shared voting and investment power; (iii) 63,973 shares issued to the Pat Heim 2012 Family Trust, of which Mr. Heim’s wife and son serve as co-trustees and have shared voting and investment power; (iv) 42,000 shares issued to the Heim 2012 Children’s Trust, of which Mr. Heim serves as trustee; and (v) 21,972 shares held by Mr. Heim’s wife of which Mr. Heim and his wife have shared voting and investment power. |
| (7) | Shares of common stock beneficially owned by Mr. Whalen include 459,249 shares issued to the Whalen Family Investments Limited Partnership. |
| (8) | The common units of the Partnership presented as being beneficially owned by our directors and officers do not include the common units held indirectly by us that may be attributable to such directors and officers based on their ownership of equity interests in us. |
Securities Authorized for Issuance under Equity Compensation Plans
The following table sets forth certain information as of December 31, 2013 regarding our long-term incentive plans, under which our common stock is authorized for issuance to employees, consultants and directors of us, our general partner and its affiliates. Our sole equity compensation plan, under which we will make equity grants in the future, is our long-term incentive plan, which was approved by our stockholders prior to our initial public offering.
|
Plan category
|
Number of securities to be issued upon exercise of outstanding options, warrants and rights
|
Weighted average exercise price of outstanding options, warrants and rights
|
Number of securities remaining available for future issuance under equity compensation plans (excluding securities reflected in column (a))
|
|||||||||
|
|
(a)
|
(b)
|
(c)
|
|||||||||
|
Equity compensation plans approved by security holders
|
-
|
-
|
3,168,126
|
(1) | ||||||||
|
Equity compensation plans not approved by security holders
|
-
|
-
|
-
|
|||||||||
|
Total
|
-
|
-
|
3,168,126
|
|||||||||
| (1) | Generally, awards of restricted stock to our officers and employees under the 2010 Incentive Plan are subject to vesting over time as determined by the Compensation Committee and, prior to vesting, are subject to forfeiture. Stock incentive plan awards may vest in other circumstances, as approved by the Compensation Committee and reflected in an award agreement. Restricted stock is issued, subject to vesting, on the date of grant. The Compensation Committee may provide that dividends on restricted stock are subject to vesting and forfeiture provisions, in which cash such dividends would be held, without interest, until they vest or are forfeited. |
Our Relationship with Targa Resources Partners LP and its General Partner
Our only cash generating assets consist of our interests in the Partnership, which as of February 10, 2014 consists of the following:
| • | a 2.0% general partner interest in the Partnership, which we hold through our 100% ownership interests in the general partner; |
| • | all of the outstanding IDRs of the Partnership; and |
| • | 12,945,659 of the 112,390,094 outstanding common units of the Partnership, representing an 11.5% limited partnership interest. |
Reimbursement of Operating and General and Administrative Expense
Under the terms of the Partnership Agreement, the Partnership reimburses us for all direct and indirect expenses, as well as expenses otherwise allocable to the Partnership in connection with the operation of the Partnership’s business, incurred on the Partnership’s behalf, which includes operating and direct expenses, including compensation and benefits of operating personnel, and for the provision of various general and administrative services for the Partnership’s benefit. We perform centralized corporate functions for the Partnership, such as legal, accounting, treasury, insurance, risk management, health, safety and environmental, information technology, human resources, credit, payroll, internal audit, taxes, engineering and marketing. The Partnership reimburses us for the direct expenses to provide these services as well as other direct expenses we incur on the Partnership’s behalf, such as compensation of operational personnel performing services for the Partnership’s benefit and the cost of their employee benefits, including 401(k), pension and health insurance benefits. The general partner determines the amount of general and administrative expenses to be allocated to the Partnership in accordance with the partnership agreement. Other than our direct costs of being a reporting company, so long as our only cash-generating asset consists of our interests in the Partnership, substantially all of our general and administrative costs have been, and will continue to be, allocated to the Partnership.
Competition
We are not restricted, under the Partnership’s partnership agreement, from competing with the Partnership. We may acquire, construct or dispose of additional midstream energy or other assets in the future without any obligation to offer the Partnership the opportunity to purchase or construct those assets.
Registration Rights Agreement
Agreement with Series B Preferred Stock Investors
On October 31, 2005, we entered into an amended and restated registration rights agreement with the holders of our then outstanding Series B preferred stock that received or purchased 6,453,406 shares of preferred stock pursuant to a stock purchase agreement dated October 31, 2005. Pursuant to the registration rights agreement, we agreed to register the sale of shares of our common stock that holders of such preferred stock received upon conversion of the preferred stock, under certain circumstances.
Demand Registration Rights
At any time, the qualified holders have the right to require us by written notice to register a specified number of shares of common stock in accordance with the Securities Act and the registration rights agreement. The qualified holders have the right to request up to an aggregate of five registrations; provided that such qualified holders are not limited in the number of demand registrations that constitute “shelf” registrations pursuant to Rule 415 under the Securities Act. In no event shall more than one demand registration occur during any six-month period or within 120 days after the effective date of a registration statement we file, provided that no demand registration may be prohibited for that 120-day period more than once in any 12-month period.
Piggy-back Registration Rights
If, at any time, we propose to file a registration statement under the Securities Act with respect to an offering of common stock (subject to certain exceptions), for our own account, then we must give at least 15 days’ notice prior to the anticipated filing date to all holders of registrable securities to allow them to include a specified number of their shares in that registration statement. We will be required to maintain the effectiveness of that registration statement until the earlier of 180 days after the effective date and the consummation of the distribution by the participating holders.
Conditions and Limitations; Expenses
These registration rights are subject to certain conditions and limitations, including the right of the underwriters to limit the number of shares to be included in a registration and our right to delay or withdraw a registration statement under certain circumstances. We will generally pay all registration expenses in connection with our obligations under the registration rights agreement, regardless of whether a registration statement is filed or becomes effective.
Contracts with Affiliates
Indemnification Agreements with Directors and Officers
In February 2007, the Partnership and the general partner entered into indemnification agreements with each independent director of the general partner. Each indemnification agreement provides that each of the Partnership and the general partner will indemnify and hold harmless each indemnitee against Expenses (as defined in the indemnification agreement) to the fullest extent permitted or authorized by law, including the Delaware Revised Uniform Limited Partnership Act and the Delaware Limited Liability Company Act in effect on the date of the agreement or as such laws may be amended to provide more advantageous rights to the indemnitee. If such indemnification is unavailable as a result of a court decision and if the Partnership or the general partner is jointly liable in the proceeding with the indemnitee, the Partnership and the general partner will contribute funds to the indemnitee for his Expenses (as defined in the in the Indemnification Agreement) in proportion to relative benefit and fault of the Partnership or the general partner on the one hand and indemnitee on the other in the transaction giving rise to the proceeding.
Each indemnification agreement also provides that the Partnership and the general partner will indemnify and hold harmless the indemnitee against Expenses incurred for actions taken as a director or officer of the Partnership or the general partner or for serving at the request of the Partnership or the general partner as a director or officer or another position at another corporation or enterprise, as the case may be, but only if no final and non-appealable judgment has been entered by a court determining that, in respect of the matter for which the indemnitee is seeking indemnification, the indemnitee acted in bad faith or engaged in fraud or willful misconduct or, in the case of a criminal proceeding, the indemnitee acted with knowledge that the indemnitee’s conduct was unlawful. The indemnification agreement also provides that the Partnership and the general partner must advance payment of certain Expenses to the indemnitee, including fees of counsel, subject to receipt of an undertaking from the indemnitee to return such advance if it is ultimately determined that the Indemnitee is not entitled to indemnification.
We have entered into parent indemnification agreements with each of our directors and officers, including directors and officers who serve or served as directors and/or officers of the general partner. Each parent indemnification agreement provides that we will indemnify and hold harmless each indemnitee for Expenses (as defined in the parent indemnification agreement) to the fullest extent permitted or authorized by law, including the Delaware General Corporation Law, in effect on the date of the agreement or as it may be amended to provide more advantageous rights to the indemnitee. If such indemnification is unavailable as a result of a court decision and if we and the indemnitee are jointly liable in the proceeding, we will contribute funds to the indemnitee for his Expenses in proportion to relative benefit and fault of us and indemnitee in the transaction giving rise to the proceeding.
Each parent indemnification agreement also provides that we will indemnify the indemnitee for monetary damages for actions taken as our director or officer or for serving at our request as a director or officer or another position at another corporation or enterprise, as the case may be but only if (i) the indemnitee acted in good faith and, in the case of conduct in his official capacity, in a manner he reasonably believed to be in our best interests and, in all other cases, not opposed to our best interests and (ii) in the case of a criminal proceeding, the indemnitee must have had no reasonable cause to believe that his conduct was unlawful. The parent indemnification agreement also provides that we must advance payment of certain Expenses to the indemnitee, including fees of counsel, subject to receipt of an undertaking from the indemnitee to return such advance if it is it is ultimately determined that the indemnitee is not entitled to indemnification.
Indemnification Agreements with the Partnership
We have agreed to indemnify the Partnership for losses relating to income tax liabilities attributable to pre-IPO operations that are not reserved on the books of the Predecessor Business of the North Texas System as of February 14, 2007. We do not have any obligation under this indemnification until the Partnership’s aggregate losses exceed $250,000. Our obligation under this indemnification will terminate upon the expiration of any applicable statute of limitations. The Partnership will indemnify us for all losses attributable to the post-IPO operations of the North Texas System.
Transactions with Related Persons
Relationship with Sajet Resources LLC
Former holders of our pre-IPO common equity, including certain of our executive managers and directors, own a controlling interest in Sajet Resources LLC (“Sajet”), which was spun-off in December 2010 prior to the IPO. Sajet owns certain technology rights, real property and ownership interests in Allied CNG Ventures LLC. The Partnership provides general and administrative services to Sajet and is reimbursed for these amounts at its actual cost. During 2013, the Partnership was reimbursed $1.5 million for such services provided.
Relationship with Tesla Resources LLC
In September 2012, Tesla Resources LLC (“Tesla”) was spun-off from Sajet. Tesla has ownership interests in Floridian Natural Gas Storage Company LLC (“Floridian”). The Partnership provides general and administrative services to Tesla and Floridian and is reimbursed for these amounts at its actual cost. During 2013, the Partnership was reimbursed $0.2 million for such services provided.
Relationship with Laredo Petroleum Holdings Inc.
Peter Kagan, one of our directors, is a Managing Director of Warburg Pincus LLC and is also a director of Laredo Petroleum Holdings Inc. (“Laredo”) from whom the Partnership buys natural gas and NGL products. Affiliates of Warburg Pincus LLC own a controlling interest in Laredo. Purchases from Laredo during 2013 totaled $108.6 million. These transactions were at market prices consistent with similar transactions with other nonaffiliated entities.
Relationship with Total Safety US Inc.
Joe Bob Perkins, our Chief Executive Officer, is also a member of the Board of Managers of W3 Holdings, LLC, parent company of Total Safety US Inc. (“Total Safety”) which provides the Partnership safety services and equipment, including detection and monitoring systems. Affiliates of Warburg Pincus own a controlling interest in Total Safety. During 2013, the Partnership made payments of $0.3 million to Total Safety. These transactions were at market prices consistent with similar transactions with other nonaffiliated entities.
Relationships with Sequent Energy Management, LP, EOG Resources Inc. and IntercontinentalExchange, Inc.
Charles R. Crisp, one of our directors, is a director of AGL Resources, Inc., parent company of Sequent Energy Management, LP (“Sequent”) and Northern Illinois Gas Company d/b/a NICOR Energy (“NICOR”). The Partnership purchases and sells natural gas and NGL products from and to Sequent and sells natural gas products to NICOR. Mr. Crisp also serves as a director of EOG Resources Inc. (“EOG”) from whom the Partnership purchases natural gas and NGL products. Mr. Crisp is also a director of IntercontinentalExchange Group Inc., parent company of ICE US OTC Commodity Markets LLC (“ICE”) from whom the Partnership purchases brokerage services. The following table shows the Partnership’s transactions with each of these entities during 2013.
|
|
Sales
|
Purchases
|
||||||
|
|
(In millions)
|
|||||||
|
Sequent
|
$
|
9.3
|
$
|
8.2
|
||||
|
EOG
|
12.8
|
14.9
|
||||||
|
ICE
|
-
|
0.1
|
||||||
|
NICOR
|
42.6
|
-
|
||||||
These transactions were at market prices consistent with similar transactions with other nonaffiliated entities.
Relationships with Martin Gas Sales and Southwest Energy LP
Ershel C. Redd, one of our directors, has an immediate family member who is an officer of Martin Gas Sales, which is a subsidiary of Martin Midstream Partners LP (“Martin”) and an immediate family member who is an officer and part owner of Southwest Energy LP (“Southwest Energy”) from and to whom the Partnership purchases and sells natural gas and NGL products. The following table shows the Partnership’s transactions with each of these entities during 2013.
|
|
Sales
|
Purchases
|
||||||
|
|
(In millions)
|
|||||||
|
Martin Gas
|
$
|
7.3
|
$
|
1.2
|
||||
|
Southwest Energy
|
3.8
|
16.3
|
||||||
These transactions were at market prices consistent with similar transactions with other nonaffiliated entities.
Conflicts of Interest
Conflicts of interest exist and may arise in the future as a result of the relationships between the general partner and its affiliates (including us), on the one hand, and the Partnership and its other limited partners, on the other hand. The directors and officers of the general partner have fiduciary duties to manage the general partner and us, if applicable, in a manner beneficial to our owners. At the same time, the general partner has a fiduciary duty to manage the Partnership in a manner beneficial to it and its unitholders. Please see “—Review, Approval or Ratification of Transactions with Related Persons” below for additional detail of how these conflicts of interest will be resolved.
Review, Approval or Ratification of Transactions with Related Persons
Our policies and procedures for approval or ratification of transactions with “related persons” are not contained in a single policy or procedure. Instead, they are reflected in the general operation of our board of directors, consistent with past practice. Prior to our IPO, an agreement among our stockholders prohibited us from entering into, modifying, amending or terminating any transaction (other than certain compensatory arrangements and sales or purchases of capital stock) with an executive officer, director or affiliate without the prior written consent of the holders of at least a majority of our outstanding shares. We distribute and review a questionnaire to our executive officers and directors requesting information regarding, among other things, certain transactions with us in which they or their family members have an interest. If a conflict or potential conflict of interest arises between us and our affiliates (excluding the Partnership) on the one hand and the Partnership and its limited partners (other than us and our affiliates), on the other hand, the resolution of any such conflict or potential conflict is addressed as described under “—Conflicts of Interest.” Pursuant to our Code of Conduct, our officers and directors are required to abandon or forfeit any activity or interest that creates a conflict of interest between them and us or any of our subsidiaries, unless the conflict is pre-approved by our board of directors.
Whenever a conflict arises between the general partner or its affiliates, on the one hand, and the Partnership or any other partner, on the other hand, the general partner will resolve that conflict. The Partnership’s partnership agreement contains provisions that modify and limit the general partner’s fiduciary duties to the Partnership’s unitholders. The partnership agreement also restricts the remedies available to unitholders for actions taken that, without those limitations, might constitute breaches of fiduciary duty.
The general partner will not be in breach of its obligations under the partnership agreement or its duties to the Partnership or its unitholders if the resolution of the conflict is:
•
approved by the general partner’s conflicts committee, although the general partner is not obligated to seek such approval;
•
approved by the vote of a majority of the Partnership’s outstanding common units, excluding any common units owned by the general partner or any of its affiliates;
•
on terms no less favorable to the Partnership than those generally being provided to or available from unrelated third parties; or
•
fair and reasonable to the Partnership, taking into account the totality of the relationships among the parties involved, including other transactions that may be particularly favorable or advantageous to the Partnership.
The general partner may, but is not required to, seek the approval of such resolution from the conflicts committee of its board of directors. If the general partner does not seek approval from the conflicts committee and its board of directors determines that the resolution or course of action taken with respect to the conflict of interest satisfies either of the standards set forth in the third or fourth bullet points above, then it will be presumed that, in making its decision, the board of directors acted in good faith and in any proceeding brought by or on behalf of any limited partner of the Partnership, the person bringing or prosecuting such proceeding will have the burden of overcoming such presumption. Unless the resolution of a conflict is specifically provided for in the partnership agreement, the general partner or its conflicts committee may consider any factors they determine in good faith to consider when resolving a conflict. When the partnership agreement provides that someone act in good faith, it requires that person to believe he is acting in the best interests of the Partnership.
Director Independence
Messrs. Crisp, Kagan, Redd and Tong and Ms. Fulton are our independent directors under the NYSE’s listing standards. Please see “Item 10. Directors, Executive Officers and Corporate Governance.” Our board of directors examined the commercial relationships between us and companies for whom our independent directors serve as directors or with whom family members of our independent directors have an employment relationship. The commercial relationships reviewed consisted of product and services purchases and product sales at market prices consistent with similar arrangements with unrelated entities.
We have engaged PricewaterhouseCoopers LLP as our principal accountant. The following table summarizes fees we were billed by PricewaterhouseCoopers LLP for independent auditing, tax and related services for each of the last two fiscal years:
|
|
2013
|
2012
|
||||||
|
|
(In millions)
|
|||||||
|
Audit fees (1)
|
$
|
3.0
|
$
|
3.1
|
||||
|
Audit related fees (2)
|
-
|
-
|
||||||
|
Tax fees (3)
|
-
|
-
|
||||||
|
All other fees (4)
|
-
|
-
|
||||||
|
|
$
|
3.0
|
$
|
3.1
|
||||
| (1) | Audit fees represent amounts billed for each of the years presented for professional services rendered in connection with (i) the integrated audit of our annual financial statements and internal control over financial reporting, (ii) the review of our quarterly financial statements or (iii) those services normally provided in connection with statutory and regulatory filings or engagements including comfort letters, consents and other services related to SEC matters. This information is presented as of the latest practicable date for this Annual Report. |
| (2) | Audit-related fees represent amounts we were billed in each of the years presented for assurance and related services that are reasonably related to the performance of the annual audit or quarterly reviews of our financial statements and are not reported under audit fees. |
| (3) | Tax fees represent amounts we were billed in each of the years presented for professional services rendered in connection with tax compliance, tax advice and tax planning. |
| (4) | All other fees represent amounts we were billed in each of the years presented for services not classifiable under the other categories listed in the table above. No such services were rendered by PricewaterhouseCoopers LLP during the last two years. |
The
Audit Committee has approved the use of PricewaterhouseCoopers LLP as our independent principal accountant. All services provided by our independent auditor are subject to pre-approval by the Audit Committee. The Audit Committee is informed of each engagement of the independent auditor to provide services to us.
PART IV
(a)(1) Financial Statements
Our Consolidated Financial Statements are included under Part II, Item 8 of the Annual Report. For a listing of these statements and accompanying footnotes, see “Index to Consolidated Financial Statements” on Page F-1 of this Annual Report.
(a)(2) Financial Statement Schedules
All schedules have been omitted because they are either not applicable, not required or the information called for therein appears in the consolidated financial statements or notes thereto.
(a)(3) Exhibits
|
Number
|
Description
|
| 2.1*** | Purchase and Sale Agreement, dated September 18, 2007, by and between Targa Resources Holdings LP and Targa Resources Partners LP (incorporated by reference to Exhibit 2.1 to Targa Resources Partners LP’s Current Report on Form 8-K filed September 21, 2007 (File No. 001-33303)). |
| 2.2 | Amendment to Purchase and Sale Agreement, dated October 1, 2007, by and between Targa Resources Holdings LP and Targa Resources Partners LP (incorporated by reference to Exhibit 2.2 to Targa Resources Partners LP’s Current Report on Form 8-K filed October 24, 2007 (File No. 001-33303)). |
| 2.3 | Purchase and Sale Agreement dated July 27, 2009, by and between Targa Resources Partners LP, Targa GP Inc. and Targa LP Inc. (incorporated by reference to Exhibit 2.1 to Targa Resources Partners LP’s Current Report on Form 8-K filed July 29, 2009 (File No. 001-33303)). |
| 2.4 | Purchase and Sale Agreement, dated March 31, 2010, by and among Targa Resources Partners LP, Targa LP Inc., Targa Permian GP LLC and Targa Midstream Holdings LLC (incorporated by reference to Exhibit 2.1 to Targa Resources Partners LP’s Current Report on Form 8-K filed April 1, 2010 (File No. 001-33303)). |
| 2.5 | Purchase and Sale Agreement, dated August 6, 2010, by and between Targa Resources Partners LP and Targa Versado Holdings LP (incorporated by reference to Exhibit 2.1 to Targa Resources Partners LP’s Current Report on Form 8-K filed August 9, 2010 (File No. 001-33303)). |
| 2.6 | Purchase and Sale Agreement, dated September 13, 2010, by and between Targa Resources Partners LP and Targa Versado Holdings LP (incorporated by reference to Exhibit 2.1 to Targa Resources Partners LP’s Current Report on Form 8-K filed September 17, 2010 (File No. 001-33303)). |
| 3.1 | Amended and Restated Certificate of Incorporation of Targa Resources Corp. (incorporated by reference to Exhibit 3.1 to Targa Resources Corp.’s Current Report on Form 8-K filed December 16, 2010 (File No. 001-34991)). |
| 3.2 | Amended and Restated Bylaws of Targa Resources Corp. (incorporated by reference to Exhibit 3.2 to Targa Resources Corp.’s Current Report on Form 8-K filed December 16, 2010 (File No. 001-34991)). |
| 3.3 | Certificate of Limited Partnership of Targa Resources Partners LP (incorporated by reference to Exhibit 3.2 to Targa Resources Partners LP’s Registration Statement on Form S-1 filed November 16, 2006 (File No. 333-138747)). |
| 3.4 | Certificate of Formation of Targa Resources GP LLC (incorporated by reference to Exhibit 3.3 to Targa Resources Partners LP’s Registration Statement on Form S-1/A filed January 19, 2007 (File No. 333-138747)). |
| 3.5 | First Amended and Restated Agreement of Limited Partnership of Targa Resources Partners LP (incorporated by reference to Exhibit 3.1 to Targa Resources Partners LP’s Current Report on Form 8-K filed February 16, 2007 (File No. 001-33303)). |
| 3.6 | Amendment No. 1 to First Amended and Restated Agreement of Limited Partnership of Targa Resources Partners LP, dated May 13, 2008 (incorporated by reference to Exhibit 3.5 to Targa Resources Partners LP’s Quarterly Report on Form 10-Q filed May 14, 2008 (File No. 001-33303)). |
| 3.7 | Amendment No. 2 to First Amended and Restated Agreement of Limited Partnership of Targa Resources Partners LP dated May 25, 2012 (incorporated by reference to Exhibit 3.1 to Targa Resources Partners LP’s Current Report on Form 8-K filed May 25, 2012 (File No. 001-33303)). |
| 3.8 | Limited Liability Company Agreement of Targa Resources GP LLC (incorporated by reference to Exhibit 3.4 to Targa Resources Partners LP’s Registration Statement on Form S-1/A filed January 19, 2007 (File No. 333-138747)). |
| 3.9 | Amended and Restated Certificate of Incorporation of Targa Resources, Inc. (incorporated by reference to Exhibit 3.1 to Targa Resources, Inc.’s Registration Statement on Form S-4 filed October 31, 2007 (File No. 333-147066)). |
| 3.10 | Amendment to Amended and Restated Certificate of Incorporation of Targa Resources, Inc. (incorporated by reference to Exhibit 3.9 of Targa Resources Corp.’s Annual Report on Form 10-K filed February 28, 2011 (File No. 001-34991)). |
| 3.11 | Amended and Restated Bylaws of Targa Resources, Inc. (incorporated by reference to Exhibit 3.2 to Targa Resources, Inc.’s Registration Statement on Form S-4 filed October 31, 2007 (File No. 333-147066)). |
| 4.1 | Specimen Common Stock Certificate (incorporated by reference to Exhibit 4.1 to Targa Resources Corp.’s Registration Statement on Form S-1/A filed November 12, 2010 (File No. 333-169277)). |
| 10.1 | Credit Agreement, dated October 3, 2012, by and among Targa Resources Corp., Deutsche Bank Trust Company Americas, as Administrative Agent, Collateral Agent, Swing Line Lender and the L/C Issuer and each lender from time to time party thereto (incorporated by reference to Exhibit 10.1 to Targa Resources Corp.’s Current Report on Form 8-K filed October 9, 2012 (File No. 001-34991)). |
| 10.2 | Second Amended and Restated Credit Agreement, dated October 3, 2012, by and among Targa Resources Partners LP, Bank of America, N.A. and the other parties signatory thereto (incorporated by reference to Exhibit 10.1 to Targa Resources Partners LP’s Current Report on Form 8-K filed October 9, 2012 (File No. 001-33303)). |
| 10.3 | Targa Resources Investments Inc. Amended and Restated Stockholders’ Agreement dated as of October 28, 2005 (incorporated by reference to Exhibit 10.2 to Targa Resources Inc.’s Registration Statement on Form S-4/A filed December 18, 2007 (File No. 333-147066)). |
| 10.4 | First Amendment to Amended and Restated Stockholders’ Agreement, dated January 26, 2006 (incorporated by reference to Exhibit 10.3 to Targa Resources Inc.’s Registration Statement on Form S-4/A filed December 18, 2007 (File No. 333-147066)). |
| 10.5 | Second Amendment to Amended and Restated Stockholders’ Agreement, dated March 30, 2007 (incorporated by reference to Exhibit 10.4 to Targa Resources Inc.’s Registration Statement on Form S-4/A filed December 18, 2007 (File No. 333-147066)). |
| 10.6 | Third Amendment to Amended and Restated Stockholders’ Agreement, dated May 1, 2007 (incorporated by reference to Exhibit 10.5 to Targa Resources Inc.’s Registration Statement on Form S-4/A filed December 18, 2007 (File No. 333-147066)). |
| 10.7 | Fourth Amendment to Amended and Restated Stockholders’ Agreement, dated December 7, 2007 (incorporated by reference to Exhibit 10.6 to Targa Resources Inc.’s Registration Statement on Form S-4/A filed December 18, 2007 (File No. 333-147066)). |
| 10.8 | Fifth Amendment to Amended and Restated Stockholders’ Agreement, dated December 1, 2009 (incorporated by reference to Exhibit 10.1 to Targa Resources, Inc.’s Current Report on Form 8-K filed December 2, 2009 (File No. 333-147066)). |
| 10.9 | Form of Sixth Amendment to Amended and Restated Stockholders’ Agreement (incorporated by reference to Exhibit 10.11 to Targa Resources Corp.’s Registration Statement on Form S-1/A filed November 12, 2010 (File No. 333-169277)). |
| 10.10+ | Targa Resources Investments Inc. 2005 Stock Incentive Plan (incorporated by reference to Exhibit 10.10 to Targa Resources Inc.’s Registration Statement on Form S-4/A filed December 18, 2007 (File No. 333-147066)). |
| 10.11+ | First Amendment to Targa Resources Investments Inc. 2005 Stock Incentive Plan (incorporated by reference to Exhibit 10.11 to Targa Resources Inc.’s Registration Statement on Form S-4/A filed December 18, 2007 (File No. 333-147066)). |
| 10.12+ | Second Amendment to Targa Resources Investments Inc. 2005 Stock Incentive Plan (incorporated by reference to Exhibit 10.12 to Targa Resources Inc.’s Registration Statement on Form S-4/A filed December 18, 2007 (File No. 333-147066)). |
| 10.13+ | Form of Targa Resources Investments Inc. Nonstatutory Stock Option Agreement (Non-Employee Director) (incorporated by reference to Exhibit 10.13 to Targa Resources Inc.’s Registration Statement on Form S-4/A filed December 18, 2007 (File No. 333-147066)). |
| 10.14+ | Form of Targa Resources Investments Inc. Nonstatutory Stock Option Agreement (Non-Director Management and Other Employees) (incorporated by reference to Exhibit 10.14 to Targa Resources Inc.’s Registration Statement on Form S-4/A filed December 18, 2007 (File No. 333-147066)). |
| 10.15+ | Form of Targa Resources Investments Inc. Incentive Stock Option Agreement (incorporated by reference to Exhibit 10.15 to Targa Resources Inc.’s Registration Statement on Form S-4/A filed December 18, 2007 (File No. 333-147066)). |
| 10.16+ | Form of Targa Resources Investments Inc. Restricted Stock Agreement (incorporated by reference to Exhibit 10.16 to Targa Resources Inc.’s Registration Statement on Form S-4/A filed December 18, 2007 (File No. 333-147066)). |
| 10.17+ | Form of Targa Resources Investments Inc. Restricted Stock Agreement (relating to preferred stock option exchange for directors) (incorporated by reference to Exhibit 10.17 to Targa Resources Inc.’s Registration Statement on Form S-4/A filed December 18, 2007 (File No. 333-147066)). |
| 10.18+ | Form of Targa Resources Investments Inc. Restricted Stock Agreement (relating to preferred stock option exchange for employees) (incorporated by reference to Exhibit 10.18 to Targa Resources Inc.’s Registration Statement on Form S-4/A filed December 18, 2007 (File No. 333-147066)). |
| 10.19+ | Targa Resources Corp. 2010 Stock Incentive Plan (incorporated by reference to Exhibit 4.3 of Targa Resources Corp’s Registration Statement on Form S-8 filed December 9, 2010 (File No. 333-171082)). |
| 10.20+ | Form of Targa Resources Corp. 2010 Restricted Stock Agreement (incorporated by reference to Exhibit 4.4 of Targa Resources Corp.’s Registration Statement on Form S-8 filed December 9, 2010 (File No. 333-171082)). |
| 10.21+ | Form of Targa Resources Corp. 2011 Restricted Stock Agreement (incorporated by reference to Exhibit 10.2 of Targa Resources Corp.’s Current Report on Form 8-K filed February 18, 2011 (File No. 001-34991)). |
| 10.22+ | Restricted Stock Unit Agreement (incorporated by reference to Exhibit 10.1 to Targa Resources Corp.’s Current Report on Form 8-K filed July 18, 2013 (File No. 001-34991)). |
| 10.23+ | Form of Restricted Stock Agreement (incorporated by reference to Exhibit 10.2 to Targa Resources Corp.’s Current Report on Form 8-K filed July 18, 2013 (File No. 001-34991)). |
| 10.24+ | Amendment to Restricted Stock Agreement (incorporated by reference to Exhibit 10.3 to Targa Resources Corp.’s Current Report on Form 8-K filed July 18, 2013 (File No. 001-34991)). |
| 10.25+ | Targa Resources Corp. Amendment to Targa Resources Partner LP Outstanding Performance Units (incorporated by reference to Exhibit 10.5 to Targa Resources Partners LP’s Current Report on Form 8-K/A filed July 24, 2013 (File No. 001-33303)). |
| 10.26+ | Targa Resources Investments Inc. Long-Term Incentive Plan (incorporated by reference to Exhibit 10.27 to Targa Resources Inc.’s Registration Statement on Form S-4/A filed December 18, 2007 (File No. 333-147066)). |
| 10.27+ | First Amendment to Targa Resources Investments Inc. Long-Term Incentive Plan (incorporated by reference to Exhibit 10.3 to Targa Resources Partners LP’s Current Report on Form 8-K/A filed July 24, 2013 (File No. 001-33303)). |
| 10.28+ | Targa Resources Investments Inc. 2008 Annual Incentive Compensation Plan (incorporated by reference to Exhibit 10.13 to Targa Resources Partners LP’s Annual Report on Form 10-K filed February 27, 2009 (File No. 001-33303)). |
| 10.29+ | Targa Resources Investments Inc. 2009 Annual Incentive Compensation Plan (incorporated by reference to Exhibit 10.14 to Targa Resources Partners LP’s Annual Report on Form 10-K filed February 27, 2009 (File No. 001-33303)). |
| 10.30+ | Targa Resources Investments Inc. 2010 Annual Incentive Compensation Plan (incorporated by reference to Exhibit 10.22 to Targa Resources Partners LP’s Annual Report on Form 10-K filed March 4, 2010 (File No. 001-33303)). |
| 10.31+ | Targa Resources Corp. 2011 Annual Incentive Compensation Plan (incorporated by reference to Exhibit 10.27 to Targa Resources Partners LP’s Annual Report on Form 10-K filed February 28, 2011 (File No. 001-33303)). |
| 10.32+ | Targa Resources Corp. 2012 Annual Incentive Compensation Plan (incorporated by reference to Exhibit 10.31 to Targa Resources Partners LP’s Annual Report on Form 10-K filed February 27, 2012 (File No. 001-33303)). |
| 10.33+ | Targa Resources Corp. 2013 Annual Incentive Compensation Plan (incorporated by reference to Exhibit 10.3 to Targa Resources Partners LP’s Current Report on Form 8-K filed January 18, 2013 (File No. 001-33303)). |
| 10.34+ | Targa Resources Corp. 2014 Annual Incentive Compensation Plan (incorporated by reference to Exhibit 10.1 to Targa Resources Partners LP’s Current Report on Form 8-K filed January 21, 2014 (File No. 001-33303)). |
| 10.35+ | Targa Resources Partners Long-Term Incentive Plan (incorporated by reference to Exhibit 10.2 to Targa Resources Partners LP’s Registration Statement on Form S-1/A filed February 1, 2007 (File No. 333-138747)). |
| 10.36+ | Form of Targa Resources Partners LP Restricted Unit Grant Agreement — 2007 (incorporated by reference to Exhibit 10.2 to Targa Resources Partners LP’s Current Report on Form 8-K filed February 13, 2007 (File No. 001-33303)). |
| 10.37+ | Form of Targa Resources Partners LP Restricted Unit Grant Agreement — 2010 (incorporated by reference to Exhibit 10.15 to Targa Resources Partners LP’s Form 10-K filed March 4, 2010 (File No. 001-33303)). |
| 10.38+ | Form of Targa Resources Partners LP Performance Unit Grant Agreement — 2007 (incorporated by reference to Exhibit 10.3 to Targa Resources Partners LP’s Current Report on Form 8-K filed with the SEC on February 13, 2007 (File No. 001-33303)). |
| 10.39+ | Form of Targa Resources Partners LP Performance Unit Grant Agreement — 2008 (incorporated by reference to Exhibit 10.2 to Targa Resources Partners LP’s Current Report on Form 8-K filed January 22, 2008 (File No. 001-33303)). |
| 10.40+ | Form of Targa Resources Partners LP Performance Unit Grant Agreement — 2009 (incorporated by reference to Exhibit 10.2 to Targa Resources Partners LP’s Current Report on Form 8-K filed January 28, 2009 (File No. 001-33303)). |
| 10.41+ | Form of Targa Resources Partners LP Performance Unit Grant Agreement — 2010 (incorporated by reference to Exhibit 10.2 to Targa Resources Partners LP’s Current Report on Form 8-K filed December 7, 2009 (File No. 001-33303)). |
| 10.42+ | Form of Targa Resources Partners LP Performance Unit Grant Agreement — 2011 (incorporated by reference to Exhibit 10.2 to Targa Resources Partners LP’s Current Report on Form 8-K filed February 18, 2011) (File No. 001-33303)). |
| 10.43+ | Targa Resources Partners LP Performance Unit Grant Agreement (incorporated by reference to Exhibit 10.1 to Targa Resources Partners LP’s Current Report on Form 8-K/A filed July 24, 2013 (File No. 001-33303)). |
| 10.44+ | Targa Resources Partners LP Amendment to Outstanding Performance Units (incorporated by reference to Exhibit 10.2 to Targa Resources Partners LP’s Current Report on Form 8-K/A filed July 24, 2013 (File No. 001-33303)). |
| 10.45+ | Targa Resources Partners LP Performance Unit Grant Agreement under the Targa Resources Corp. Long-Term Incentive Plan (incorporated by reference to Exhibit 10.4 to Targa Resources Partners LP’s Current Report on Form 8-K/A filed July 24, 2013 (File No. 001-33303)). |
| 10.46+ | Targa Resources Executive Officer Change in Control Severance Program (incorporated by reference to Exhibit 10.3 to Targa Resources Corp.’s Current Report on Form 8-K filed January 19, 2012 (File No. 001-34991)). |
| 10.47 | Indenture dated August 13, 2010 among the Issuers and the Guarantors and U.S. Bank National Association, as trustee (incorporated by reference to Exhibit 4.1 to Targa Resources Partners LP’s Current Report on Form 8-K filed August 16, 2010 (File No. 001-33303)). |
| 10.48 | Registration Rights Agreement dated August 13, 2010 among the Issuers, the Guarantors and Banc of America Securities LLC, as representative of the several initial purchasers (incorporated by reference to Exhibit 4.2 to Targa Resources Partners LP’s Current Report on Form 8-K filed August 16, 2010 (File No. 001-33303)). |
| 10.49 | Supplemental Indenture dated September 20, 2010 to Indenture dated August 13, 2010, among Targa Versado LP and Targa Versado GP LLC, subsidiaries of Targa Resources Partners LP, Targa Resources Partners Finance Corporation, the other Subsidiary Guarantors and U.S. Bank National Association (incorporated by reference to Exhibit 4.5 to Targa Resources Partners LP’s Quarterly Report on Form 10-Q filed November 5, 2010 (File No. 001- 33303)). |
| 10.50 | Supplemental Indenture dated October 25, 2010 to Indenture dated August 13, 2010, among Targa Capital LLC, a subsidiary of Targa Resources Partners LP, Targa Resources Partners Finance Corporation, the other Subsidiary Guarantors and U.S. Bank National Association (incorporated by reference to Exhibit 4.8 to Targa Resources Partners LP’s Quarterly Report on Form 10-Q filed November 5, 2010 (File No. 001-33303)). |
| 10.51 | Supplemental Indenture dated April 8, 2011 to Indenture dated August 13, 2010, among Targa Terminals LLC, a subsidiary of Targa Resources Partners LP, Targa Resources Partners Finance Corporation, the other Subsidiary Guarantors and U.S. Bank National Association (incorporated by reference to Exhibit 4.6 to Targa Resources Partners LP’s Quarterly Report on Form 10-Q filed May 6, 2011 (File No. 001-33303)). |
| 10.52 | Supplemental Indenture dated October 28, 2011 to Indenture dated August 13, 2010, among Targa Gas Processing LLC, Targa Sound Terminal LLC and Sound Pipeline Company, LLC, subsidiaries of Targa Resources Partners LP, Targa Resources Partners Finance Corporation, the other Subsidiary Guarantors and U.S. Bank National Association (incorporated by reference to Exhibit 4.2 to Targa Resources Partners LP’s Quarterly Report on Form 10-Q filed November 7, 2011 (File No. 001-33303)). |
| 10.53 | Supplemental Indenture dated April 20, 2012 to Indenture dated August 13, 2010, among Targa Cogen LLC, a subsidiary of Targa Resources Partners LP, Targa Resources Partners Finance Corporation, the other Subsidiary Guarantors and U.S. Bank National Association (incorporated by reference to Exhibit 4.2 to Targa Resources Partners LP’s Quarterly Report on Form 10-Q filed August 6, 2012 (File No. 001-33303)). |
| 10.54 | Supplemental Indenture dated February 14, 2013 to Indenture dated August 13, 2010, among Targa Badlands LLC, Targa Assets LLC and Targa Fort Berthold Gathering LLC, subsidiaries of Targa Resources Partners LP, Targa Resources Partners Finance Corporation, the other Subsidiary Guarantors and U.S. Bank National Association (incorporated by reference to Exhibit 4.60 to Targa Resources Partners LP’s Annual Report on Form 10-K filed February 19, 2013 (File No. 001-33303)). |
| 10.55 | Indenture dated February 2, 2011 among the Issuers, the Guarantors and U.S. Bank National Association, as trustee thereto (incorporated by reference to Exhibit 4.1 to Targa Resources Partners LP’s Current Report on Form 8-K filed February 2, 2011 (File No. 001-33303)). |
| 10.56 | Registration Rights Agreement dated February 2, 2011 among the Issuers, the Guarantors, Deutsche Bank Securities Inc., as representative of the several initial purchasers, and the Dealer Managers (incorporated by reference to Exhibit 4.2 to Targa Resources Partners LP’s Current Report on Form 8-K filed February 3, 2011 (File No. 001-33303)). |
| 10.57 | Supplemental Indenture dated April 8, 2011 to Indenture dated February 2, 2011, among Targa Terminals LLC, a subsidiary of Targa Resources Partners LP, Targa Resources Partners Finance Corporation, the other Subsidiary Guarantors and U.S. Bank National Association (incorporated by reference to Exhibit 4.7 to Targa Resources Partners LP’s Quarterly Report on Form 10-Q filed May 6, 2011 (File No. 001-33303)). |
| 10.58 | Supplemental Indenture dated October 28, 2011 to Indenture dated February 2, 2011, among Targa Gas Processing LLC, Targa Sound Terminal LLC and Sound Pipeline Company, LLC, subsidiaries of Targa Resources Partners LP, Targa Resources Partners Finance Corporation, the other Subsidiary Guarantors and U.S. Bank National Association (incorporated by reference to Exhibit 4.3 to Targa Resources Partners LP’s Quarterly Report on Form 10-Q filed November 7, 2011 (File No. 001-33303)). |
| 10.59 | Supplemental Indenture dated April 20, 2012 to Indenture dated February 2, 2011, among Targa Cogen LLC, a subsidiary of Targa Resources Partners LP, Targa Resources Partners Finance Corporation, the other Subsidiary Guarantors and U.S. Bank National Association (incorporated by reference to Exhibit 4.3 to Targa Resources Partners LP’s Quarterly Report on Form 10-Q filed August 6, 2012 (File No. 001-33303)). |
| 10.60 | Supplemental Indenture dated February 14, 2013 to Indenture dated February 2, 2011, among Targa Badlands LLC, Targa Assets LLC and Targa Fort Berthold Gathering LLC, subsidiaries of Targa Resources Partners LP, Targa Resources Partners Finance Corporation, the other Subsidiary Guarantors and U.S. Bank National Association (incorporated by reference to Exhibit 4.66 to Targa Resources Partners LP’s Annual Report on Form 10-K filed February 19, 2013 (File No. 001-33303)). |
| 10.61 | Indenture dated as of January 31, 2012 among Targa Resources Partners LP, Targa Resources Partners Finance Corporation, the Guarantors named therein and U.S. Bank National Association (incorporated by reference to Exhibit 4.1 to Targa Resources Partners LP’s Current Report on Form 8-K filed January 31, 2012 (File No. 001-33303)). |
| 10.62 | Registration Rights Agreement dated as of January 31, 2012 among Targa Resources Partners LP, Targa Resources Partners Finance Corporation, the Guarantors named therein and the initial purchasers named therein (incorporated by reference to Exhibit 4.2 to Targa Resources Partners LP’s Current Report on Form 8-K filed January 31, 2012 (File No. 001-33303)). |
| 10.63 | Supplemental Indenture dated April 20, 2012 to Indenture dated January 31, 2012, among Targa Cogen LLC, a subsidiary of Targa Resources Partners LP, Targa Resources Partners Finance Corporation, the other Subsidiary Guarantors and U.S. Bank National Association (incorporated by reference to Exhibit 4.4 to Targa Resources Partners LP’s Quarterly Report on Form 10-Q filed August 6, 2012 (File No. 001-33303)). |
| 10.64 | Supplemental Indenture dated February 14, 2013 to Indenture dated January 31, 2012, among Targa Badlands LLC, Targa Assets LLC and Targa Fort Berthold Gathering LLC, subsidiaries of Targa Resources Partners LP, Targa Resources Partners Finance Corporation, the other Subsidiary Guarantors and U.S. Bank National Association (incorporated by reference to Exhibit 4.70 to Targa Resources Partners LP’s Annual Report on Form 10-K filed February 19, 2013 (File No. 001-33303)). |
| 10.65 | Purchase Agreement dated as of October 22, 2012 among Targa Resources Partners LP, Targa Resources Partners Finance Corporation, the Guarantors named therein and Merrill Lynch, Pierce, Fenner & Smith Incorporated, Deutsche Bank Securities Inc., Wells Fargo Securities, LLC, Barclays Capital Inc. and RBS Securities Inc., as representatives of the several initial purchasers (incorporated by reference to Exhibit 10.1 to Targa Resources Partners LP’s Current Report on Form 8-K filed October 26, 2012 (File No. 001-33303)). |
| 10.66 | Indenture dated as of October 25, 2012 among Targa Resources Partners LP, Targa Resources Partners Finance Corporation and the Guarantors named therein and U.S. Bank National Association, as trustee (incorporated by reference to Exhibit 4.1 to Targa Resources Partners LP’s Current Report on Form 8-K filed October 26, 2012 (File No. 001-33303)). |
| 10.67 | Registration Rights Agreement dated as of October 25, 2012 among Targa Resources Partners LP, Targa Resources Partners Finance Corporation, the Guarantors and Merrill Lynch, Pierce, Fenner & Smith Incorporated, Deutsche Bank Securities Inc., Wells Fargo Securities, LLC, Barclays Capital Inc. and RBS Securities Inc., as representatives of the several initial purchasers (incorporated by reference to Exhibit 4.2 to Targa Resources Partners LP’s Current Report on Form 8-K filed October 26, 2012 (File No. 001-33303)). |
| 10.68 | Supplemental Indenture dated February 14, 2013 to Indenture dated October 25, 2012, among Targa Badlands LLC, Targa Assets LLC and Targa Fort Berthold Gathering LLC, subsidiaries of Targa Resources Partners LP, Targa Resources Partners Finance Corporation, the other Subsidiary Guarantors and U.S. Bank National Association (incorporated by reference to Exhibit 4.73 to Targa Resources Partners LP’s Annual Report on Form 10-K filed February 19, 2013 (File No. 001-33303)). |
| 10.69 | Indenture dated as of May 14, 2013 among the Issuers and the Guarantors and U.S. Bank National Association, as trustee (incorporated by reference to Exhibit 4.1 to Targa Resources Partners LP’s Current Report on Form 8-K filed May 14, 2013 (File No. 001-33303)). |
| 10.70 | Registration Rights Agreement dated as of May 14, 2013 among the Issuers, the Guarantors and Wells Fargo Securities, LLC, Barclays Capital Inc., Deutsche Bank Securities Inc., J.P. Morgan Securities LLC and RBC Capital Markets, LLC, as representatives of the several initial purchasers (incorporated by reference to Exhibit 4.2 to Targa Resources Partners LP’s Current Report on Form 8-K filed May 14, 2013 (File No. 001-33303)). |
| 10.71 | Purchase Agreement dated as of December 4, 2012 among the Issuers, the Guarantors and Merrill Lynch, Pierce, Fenner & Smith Incorporated, Deutsche Bank Securities Inc., Wells Fargo Securities, LLC, Barclays Capital Inc. and RBS Securities Inc., as representatives of the several initial purchasers (incorporated by reference to Exhibit 10.1 to Targa Resources Partners LP’s Current Report on Form 8-K filed December 10, 2012 (File No. 001-33303)). |
| 10.72 | Registration Rights Agreement dated as of December 10, 2012 among the Issuers, the Guarantors and Merrill Lynch, Pierce, Fenner & Smith Incorporated, Deutsche Bank Securities Inc., Wells Fargo Securities, LLC, Barclays Capital Inc. and RBS Securities Inc., as representatives of the several initial purchasers. (incorporated by reference to Exhibit 4.2 to Targa Resources Partners LP’s Current Report on Form 8-K filed December 10, 2012 (File No. 001-33303)). |
| 10.73 | Purchase Agreement dated as of May 9, 2013 among the Issuers, the Guarantors and Wells Fargo Securities, LLC, Barclays Capital Inc., Deutsche Bank Securities Inc., J.P. Morgan Securities LLC and RBC Capital Markets, LLC, as representatives of the several initial purchasers (incorporated by reference to Exhibit 10.1 to Targa Resources Partners LP’s Current Report on Form 8-K filed May 14, 2013 (File No. 001-33303)). |
| 10.74 | Contribution, Conveyance and Assumption Agreement, dated February 14, 2007, by and among Targa Resources Partners LP, Targa Resources Operating LP, Targa Resources GP LLC, Targa Resources Operating GP LLC, Targa GP Inc., Targa LP Inc., Targa Regulated Holdings LLC, Targa North Texas GP LLC and Targa North Texas LP (incorporated by reference to Exhibit 10.2 to Targa Resources Partners LP’s Current Report on Form 8-K filed February 16, 2007 (File No. 001-33303)). |
| 10.75 | Contribution, Conveyance and Assumption Agreement, dated October 24, 2007, by and among Targa Resources Partners LP, Targa Resources Holdings LP, Targa TX LLC, Targa TX PS LP, Targa LA LLC, Targa LA PS LP and Targa North Texas GP LLC (incorporated by reference to Exhibit 10.4 to Targa Resources Partners LP’s Current Report on Form 8-K filed October 24, 2007 (File No. 001-33303)). |
| 10.76 | Contribution, Conveyance and Assumption Agreement, dated September 24, 2009, by and among Targa Resources Partners LP, Targa GP Inc., Targa LP Inc., Targa Resources Operating LP and Targa North Texas GP LLC (incorporated by reference to Exhibit 10.1 to Targa Resources Partners LP’s Current Report on Form 8-K filed September 24, 2009 (File No. 001-33303)). |
| 10.77 | Contribution, Conveyance and Assumption Agreement, dated April 27, 2010, by and among Targa Resources Partners LP, Targa LP Inc., Targa Permian GP LLC, Targa Midstream Holdings LLC, Targa Resources Operating LP, Targa North Texas GP LLC and Targa Resources Texas GP LLC (incorporated by reference to Exhibit 10.1 to Targa Resources Partners LP’s Current Report on Form 8-K filed April 29, 2010 (File No. 001-33303)). |
| 10.78 | Contribution, Conveyance and Assumption Agreement, dated August 25, 2010, by and among Targa Resources Partners LP, Targa Versado Holdings LP and Targa North Texas GP LLC (incorporated by reference to Exhibit 10.1 to Targa Resources Partners LP’s Current Report on Form 8-K filed August 26, 2010 (File No. 001-33303)). |
| 10.79 | Second Amended and Restated Omnibus Agreement, dated September 24, 2009, by and among Targa Resources Partners LP, Targa Resources, Inc., Targa Resources LLC and Targa Resources GP LLC (incorporated by reference to Exhibit 10.2 to Targa Resources Partners LP’s Current Report on Form 8-K filed September 24, 2009 (file No. 001-33303)). |
| 10.80 | First Amendment to Second Amended and Restated Omnibus Agreement, dated April 27, 2010, by and among Targa Resources Partners LP, Targa Resources, Inc., Targa Resources LLC and Targa Resources GP LLC (incorporated by reference to Exhibit 10.2 to Targa Resources Partners LP’s Current Report on Form 8-K filed April 29, 2010 (File No. 001-33303)). |
| 10.81 | Contribution, Conveyance and Assumption Agreement, dated September 28, 2010, by and among Targa Resources Partners LP, Targa Versado Holdings LP and Targa North Texas GP LLC (incorporated by reference to Exhibit 10.1 to Targa Resources Partners LP’s Current Report on Form 8-K filed October 4, 2010 (File No. 001-33303)). |
| 10.82+ | Form of Indemnification Agreement between Targa Resources Investments Inc. and each of the directors and officers thereof (incorporated by reference to Exhibit 10.4 to Targa Resources Corp.’s Registration Statement on Form S-1/A filed November 8, 2010 (File No. 333-169277)). |
| 10.83+ | Targa Resources Partners LP Indemnification Agreement for Robert B. Evans dated February 14, 2007 (incorporated by reference to Exhibit 10.11 to Targa Resources Partners LP’s Annual Report on Form 10-K filed April 2, 2007 (File No. 001-33303)). |
| 10.84+ | Targa Resources Partners LP Indemnification Agreement for Barry R. Pearl dated February 14, 2007 (incorporated by reference to Exhibit 10.12 to Targa Resources Partners LP’s Annual Report on Form 10-K filed April 2, 2007 (File No. 001-33303)). |
| 10.85+ | Targa Resources Partners LP Indemnification Agreement for William D. Sullivan dated February 14, 2007 (incorporated by reference to Exhibit 10.13 to Targa Resources Partners LP’s Annual Report on Form 10-K filed April 2, 2007 (File No. 001-33303)). |
| 10.86+ | Targa Resources Partners LP Indemnification Agreement for Ruth I. Dreessen dated February 6, 2013(incorporated by reference to Exhibit 10.44 to Targa Resource Partners LP’s Annual Report on Form 10-K filed February 19, 2013 (File No. 001-33303)). |
| 10.87+ | Indemnification Agreement by and between Targa Resources Corp. and Laura C. Fulton, dated February 26, 2013 (incorporated by reference to Exhibit 10.1 to Targa Resources Corp.’s Current Report on Form 8-K filed March 1, 2013 (File No. 001-34991)). |
| 10.88 | Amended and Restated Registration Rights Agreement dated as of October 31, 2005 (incorporated by reference to Exhibit 10.1 to Targa Resources Corp.’s Registration Statement on Form S-1/A filed November 12, 2010 (File No. 333-169277)). |
| 10.89 | Receivables Purchase Agreement, dated January 10, 2013, by and among Targa Receivables LLC, the Partnership, as initial Servicer, the various conduit purchasers from time to time party thereto, the various committed purchasers from time to time party thereto, the various purchaser agents from time to time party thereto, the various LC participants from time to time party thereto and PNC Bank, National Association as Administrator and LC Bank (incorporated by reference to Exhibit 10.1 to Targa Resources Partners LP’s Current Report on Form 8-K filed January 14, 2013 (File No. 001-33303)). |
| 10.90 | Second Amendment to Receivables Purchase Agreement, dated December 13, 2013, by and among Targa Receivables LLC, as seller, the Partnership, as servicer, the various conduit purchasers, committed purchasers, purchaser agents and LC participants party thereto and PNC Bank, National Association, as administrator and LC Bank (incorporated by reference to Exhibit 10.1 to Targa Resources Partners LP’s Current Report on Form 8-K filed December 17, 2013 (File No. 001-33303)). |
| 21.1* | List of Subsidiaries of Targa Resources Corp. |
| 23.1* | Consent of Independent Registered Public Accounting Firm. |
| 31.1* | Certification of the Chief Executive Officer pursuant to Rule 13a-14(a)/15d-14(a) of the Securities Exchange Act of 1934. |
| 31.2* | Certification of the Chief Financial Officer pursuant to Rule 13a-14(a)/15d-14(a) of the Securities Exchange Act of 1934. |
| 32.1** | Certification of the Chief Executive Officer pursuant to 18 U.S.C. Section 1350, as adopted pursuant to Section 906 of the Sarbanes-Oxley Act of 2002. |
| 32.2** | Certification of the Chief Financial Officer pursuant to 18 U.S.C. Section 1350, as adopted pursuant to Section 906 of the Sarbanes-Oxley Act of 2002. |
| 101.INS** | XBRL Instance Document |
| 101.SCH** | XBRL Taxonomy Extension Schema Document |
| 101.CAL** | XBRL Taxonomy Extension Calculation Linkbase Document |
| 101.DEF** | XBRL Taxonomy Extension Definition Linkbase Document |
| 101.LAB** | XBRL Taxonomy Extension Label Linkbase Document |
| 101.PRE** | XBRL Taxonomy Extension Presentation Linkbase Document |
* Filed herewith
** Furnished herewith
*** Pursuant to Item 601(b)(2) of Regulation S-K, the Company agrees to furnish supplementally a copy of any omitted exhibit or Schedule to the SEC upon request.
+ Management contract or compensatory plan or arrangement
SIGNATURES
Pursuant to the requirements of Section 13 or 15(d) of the Securities Exchange Act of 1934, the registrant has duly caused this report to be signed on its behalf by the undersigned thereunto duly authorized.
|
|
|
Targa Resources Corp.
|
|
|
|
|
(Registrant)
|
|
|
|
|
|
|
|
Date: February 14, 2014
|
By:
|
/s/ Matthew J. Meloy
|
|
|
|
|
Matthew J. Meloy
|
|
|
|
|
Senior Vice President, Chief Financial Officer and Treasurer
|
|
|
|
|
(Principal Financial Officer)
|
Pursuant to the requirements of the Securities Exchange Act of 1934, this report has been signed by the following persons on behalf of the registrant and in the capacities indicated on February 14, 2014.
|
Signature
|
|
Title (Position with Targa Resources Corp.)
|
|
|
|
|
|
/s/ Joe Bob Perkins
|
|
Chief Executive Officer and Director
|
|
Joe Bob Perkins
|
|
(Principal Executive Officer)
|
|
|
|
|
|
/s/ Matthew J. Meloy
|
|
Senior Vice President, Chief Financial Officer and Treasurer
|
|
Mathew J. Meloy
|
|
(Principal Financial Officer)
|
|
|
|
|
|
/s/ John R. Sparger
|
|
Senior Vice President and Chief Accounting Officer
|
|
John R. Sparger
|
|
(Principal Accounting Officer)
|
|
|
|
|
|
/s/ Rene R. Joyce
|
|
Executive Chairman of the Board
|
|
Rene R. Joyce
|
|
|
|
|
|
|
|
/s/ James W. Whalen
|
|
Advisor to Chairman and CEO and Director
|
|
James W. Whalen
|
|
|
|
|
|
|
|
/s/ Charles R. Crisp
|
|
Director
|
|
Charles R. Crisp
|
|
|
|
|
|
|
|
/s/ Peter R. Kagan
|
|
Director
|
|
Peter R. Kagan
|
|
|
|
|
|
|
|
/s/ Ershel C. Redd Jr.
|
|
Director
|
|
Ershel C. Redd Jr.
|
|
|
|
/s/ Chris Tong
|
|
Director
|
|
Chris Tong
|
|
|
|
|
|
|
|
/s/ Laura Fulton
|
|
Director
|
|
Laura Fulton
|
|
|
INDEX TO CONSOLIDATED FINANCIAL STATEMENTS
TARGA RESOURCES CORP. AUDITED CONSOLIDATED FINANCIAL STATEMENTS
|
Management's Report on Internal Control Over Financial Reporting
|
F-2
|
|
|
|
|
Report of Independent Registered Public Accounting Firm
|
F-3
|
|
|
|
|
Consolidated Balance Sheets as of December 31, 2013 and December 31, 2012
|
F-4
|
|
|
|
|
Consolidated Statements of Operations for the Years Ended December 31, 2013, 2012, and 2011
|
F-5
|
|
|
|
|
Consolidated Statements of Comprehensive Income (Loss) for the Years Ended December 31, 2013, 2012 and 2011
|
F-6
|
|
|
|
|
Consolidated Statements of Changes in Owners' Equity for the Years Ended December 31, 2013, 2012 and 2011
|
F-7
|
|
|
|
|
Consolidated Statements of Cash Flows for the Years Ended December 31, 2013, 2012 and 2011
|
F-8
|
|
|
|
|
Notes to Consolidated Financial Statements
|
F-9
|
|
Note 1 ― Organization
|
F-9
|
|
Note 2 ― Basis of Presentation
|
F-9
|
|
Note 3 ― Significant Accounting Policies
|
F-9
|
|
Note 4 ― Business Acquisitions
|
F-15
|
|
Note 5 ― Inventories
|
F-17
|
|
Note 6 ― Property
, Plant and Equipment and Intangible Assets
|
F-17
|
|
Note 7 ― Asset Retirement Obligations
|
F-18
|
|
Note 8 ― Investment in Unconsolidated Affiliate
|
F-18
|
|
Note 9 ― Accounts Payable and Accrued Liabilities
|
F-18
|
|
Note 10 ― Debt Obligations
|
F-19
|
|
Note 11 ― Partnersh
ip Units and Related Matters
|
F-24
|
|
Note 12 ― Common Stock and Related Matters
|
F-26
|
|
Note 13 ― Earnings Per Common Share
|
F-26
|
|
Note 14 ― Derivative Instruments and Hedging Activities
|
F-27
|
|
Note 15 ― Fair Value Measurements
|
F-30
|
|
Note 16 ― Related Party Tran
sactions
|
F-32
|
|
Note 17 ― Commitments and Contingencies
|
F-33
|
|
Note 18 ― Significant Risks and Uncertainties
|
F-34
|
|
Note 19 ― Other Operating Expense
|
F-36
|
|
Note 20 ― Income Taxes
|
F-37
|
|
Note 21 ― Supplemental Cash Flow Information
|
F-38
|
|
Note 22 ― Stock and Oth
er Compensation Plans
|
F-38
|
|
Note 23 ― Segment Information
|
F-42
|
|
Note 24 ― Selected Quarterly Financial Data (Unaudited)
|
F-46
|
|
Note 25 ― Condensed Parent Only Financial Statements
|
F-47
|
MANAGEMENT’S REPORT ON INTERNAL CONTROL OVER FINANCIAL REPORTING
Management is responsible for establishing and maintaining adequate internal control over financial reporting. Our internal control over financial reporting is a process designed to provide reasonable assurance regarding the reliability of financial reporting and the preparation of financial statements for external purposes in accordance with generally accepted accounting principles.
Internal control over financial reporting cannot provide absolute assurance of achieving financial reporting objectives because of its inherent limitations. Internal control over financial reporting is a process that involves human diligence and compliance and is subject to lapses in judgment and breakdowns resulting from human failures. Internal control over financial reporting also can be circumvented by collusion or improper management override. Because of such limitations, there is a risk that material misstatements may not be prevented or detected on a timely basis by internal control over financial reporting. However, these inherent limitations are known features of the financial reporting process. Therefore, it is possible to design into the process safeguards to reduce, though not eliminate, this risk.
Management has used the framework set forth in the report entitled “Internal Control—Integrated Framework” issued by the Committee of Sponsoring Organizations of the Treadway Commission (“COSO”) in 1992 to evaluate the effectiveness of the internal control over financial reporting. Based on that evaluation, management has concluded that the internal control over financial reporting was effective as of December 31, 2013.
The effectiveness of our internal control over financial reporting as of December 31, 2013 has been audited by PricewaterhouseCoopers LLP, an independent registered public accounting firm, as stated in their report which appears on page F-3.
/s/ Joe Bob Perkins
Joe Bob Perkins
Chief Executive Officer
(Principal Executive Officer)
/s/ Matthew J. Meloy
Matthew J. Meloy
Senior Vice President, Chief Financial Officer and Treasurer
(Principal Financial Officer)
Report of Independent Registered Public Accounting Firm
To
the Board of Directors and Stockholders of Targa Resources Corp.:
In our opinion, the accompanying consolidated balance sheets and the related consolidated statements of operations, of comprehensive income (loss), of changes in owners' equity and of cash flows present fairly, in all material respects, the financial position of Targa Resources Corp. and its subsidiaries (the “Company”) at December 31, 2013 and 2012, and the results of their operations and their cash flows for each of the three years in the period ended December 31, 2013
in conformity with accounting principles generally accepted in the United States of America. Also in our opinion, the Company maintained, in all material respects, effective internal control over financial reporting as of December 31, 2013, based on criteria established in
Internal Control - Integrated Framework
(1992) issued by the Committee of Sponsoring Organizations of the Treadway Commission (COSO). The Company's management is responsible for these financial statements, for maintaining effective internal control over financial reporting and for its assessment of the effectiveness of internal control over financial reporting, included in the accompanying Management's Report on Internal Control over Financial Reporting. Our responsibility is to express opinions on these financial statements and on the Company's internal control over financial reporting based on our integrated audits. We conducted our audits in accordance with the standards of the Public Company Accounting Oversight Board (United States). Those standards require that we plan and perform the audits to obtain reasonable assurance about whether the financial statements are free of material misstatement and whether effective internal control over financial reporting was maintained in all material respects. Our audits of the financial statements included examining, on a test basis, evidence supporting the amounts and disclosures in the financial statements, assessing the accounting principles used and significant estimates made by management, and evaluating the overall financial statement presentation. Our audit of internal control over financial reporting included obtaining an understanding of internal control over financial reporting, assessing the risk that a material weakness exists, and testing and evaluating the design and operating effectiveness of internal control based on the assessed risk. Our audits also included performing such other procedures as we considered necessary in the circumstances. We believe that our audits provide a reasonable basis for our opinions.
A company’s internal control over financial reporting is a process designed to provide reasonable assurance regarding the reliability of financial reporting and the preparation of financial statements for external purposes in accordance with generally accepted accounting principles. A company’s internal control over financial reporting includes those policies and procedures that (i) pertain to the maintenance of records that, in reasonable detail, accurately and fairly reflect the transactions and dispositions of the assets of the company; (ii) provide reasonable assurance that transactions are recorded as necessary to permit preparation of financial statements in accordance with generally accepted accounting principles, and that receipts and expenditures of the company are being made only in accordance with authorizations of management and directors of the company; and (iii) provide reasonable assurance regarding prevention or timely detection of unauthorized acquisition, use, or disposition of the company’s assets that could have a material effect on the financial statements.
Because of its inherent limitations, internal control over financial reporting may not prevent or detect misstatements. Also, projections of any evaluation of effectiveness to future periods are subject to the risk that controls may become inadequate because of changes in conditions, or that the degree of compliance with the policies or procedures may deteriorate.
/s/PricewaterhouseCoopers LLP
Houston, Texas
February 14, 2014
PART I – FINANCIAL INFORMATION
Item 1. Financial Statements.
TARGA RESOURCES CORP.
CONSOLIDATED BALANCE SHEETS
|
|
December 31,
|
|||||||
|
|
2013
|
2012
|
||||||
|
|
(In millions)
|
|||||||
|
ASSETS
|
||||||||
|
Current assets:
|
|
|
||||||
|
Cash and cash equivalents
|
$
|
66.7
|
$
|
76.3
|
||||
|
Trade receivables, net of allowances of $1.1 million and $0.9 million
|
658.8
|
514.9
|
||||||
|
Inventories
|
150.7
|
99.4
|
||||||
|
Deferred income taxes
|
0.1
|
-
|
||||||
|
Assets from risk management activities
|
2.0
|
29.3
|
||||||
|
Other current assets
|
18.9
|
13.4
|
||||||
|
Total current assets
|
897.2
|
733.3
|
||||||
|
Property, plant and equipment
|
5,758.4
|
4,708.0
|
||||||
|
Accumulated depreciation
|
(1,408.5
|
)
|
(1,170.0
|
)
|
||||
|
Property, plant and equipment, net
|
4,349.9
|
3,538.0
|
||||||
|
Intangible assets, net
|
653.4
|
680.8
|
||||||
|
Long-term assets from risk management activities
|
3.1
|
5.1
|
||||||
|
Investment in unconsolidated affiliate
|
55.9
|
53.1
|
||||||
|
Other long-term assets
|
89.1
|
94.7
|
||||||
|
Total assets
|
$
|
6,048.6
|
$
|
5,105.0
|
||||
|
|
||||||||
|
LIABILITIES AND OWNERS' EQUITY
|
||||||||
|
Current liabilities:
|
||||||||
|
Accounts payable and accrued liabilities
|
$
|
761.8
|
$
|
679.0
|
||||
|
Deferred income taxes
|
0.6
|
0.2
|
||||||
|
Liabilities from risk management activities
|
8.0
|
7.4
|
||||||
|
Total current liabilities
|
770.4
|
686.6
|
||||||
|
Long-term debt
|
2,989.3
|
2,475.3
|
||||||
|
Long-term liabilities from risk management activities
|
1.4
|
4.8
|
||||||
|
Deferred income taxes
|
135.5
|
131.2
|
||||||
|
Other long-term liabilities
|
60.7
|
53.7
|
||||||
|
|
||||||||
|
Commitments and contingencies (see Note 17)
|
||||||||
|
|
||||||||
|
Owners' equity:
|
||||||||
|
Targa Resources Corp. stockholders' equity:
|
||||||||
|
Common stock ($0.001 par value, 300,000,000 shares authorized, 42,529,068 shares issued and 42,162,178 shares outstanding as of December 31, 2013, and 42,492,233 shares issued and 42,294,502 shares outstanding as of December 31, 2012)
|
-
|
-
|
||||||
|
Preferred stock ($0.001 par value, 100,000,000 shares authorized, no shares issued and outstanding as of December 31, 2013 and December 31, 2012)
|
-
|
-
|
||||||
|
Additional paid-in capital
|
151.6
|
184.4
|
||||||
|
Retained earnings (accumulated deficit)
|
20.5
|
(32.0
|
)
|
|||||
|
Accumulated other comprehensive income (loss)
|
(0.5
|
)
|
1.2
|
|||||
|
Treasury stock, at cost (366,890 shares as of December 31, 2013 and 197,731 as of December 31, 2012)
|
(22.8
|
)
|
(9.5
|
)
|
||||
|
Total Targa Resources Corp. stockholders' equity
|
148.8
|
144.1
|
||||||
|
Noncontrolling interests in subsidiaries
|
1,942.5
|
1,609.3
|
||||||
|
Total owners' equity
|
2,091.3
|
1,753.4
|
||||||
|
Total liabilities and owners' equity
|
$
|
6,048.6
|
$
|
5,105.0
|
||||
See notes to consolidated financial statements.
TARGA RESOURCES CORP.
CONSOLIDATED STATEMENTS OF OPERATIONS
|
|
Year Ended December 31,
|
|||||||||||
|
|
2013
|
2012
|
2011
|
|||||||||
|
|
(In millions, except per share amounts)
|
|||||||||||
|
Revenues
|
$
|
6,556.0
|
$
|
5,885.7
|
$
|
6,994.5
|
||||||
|
Costs and expenses:
|
||||||||||||
|
Product purchases
|
5,378.5
|
4,879.0
|
6,039.0
|
|||||||||
|
Operating expenses
|
376.3
|
313.1
|
287.1
|
|||||||||
|
Depreciation and amortization expenses
|
271.9
|
197.6
|
181.0
|
|||||||||
|
General and administrative expenses
|
151.5
|
139.8
|
136.1
|
|||||||||
|
Other operating (income) expense (See Note 19)
|
9.6
|
19.9
|
0.2
|
|||||||||
|
Income from operations
|
368.2
|
336.3
|
351.1
|
|||||||||
|
Other income (expense):
|
||||||||||||
|
Interest expense, net
|
(134.1
|
)
|
(120.8
|
)
|
(111.7
|
)
|
||||||
|
Equity earnings
|
14.8
|
1.9
|
8.8
|
|||||||||
|
Loss on debt redemptions and amendments (See Note 10)
|
(14.7
|
)
|
(12.8
|
)
|
-
|
|||||||
|
Loss on mark-to-market derivative instruments
|
-
|
-
|
(5.0
|
)
|
||||||||
|
Other
|
15.3
|
(8.4
|
)
|
(1.2
|
)
|
|||||||
|
Income before income taxes
|
249.5
|
196.2
|
242.0
|
|||||||||
|
Income tax expense:
|
||||||||||||
|
Current
|
(42.8
|
)
|
(27.9
|
)
|
(14.3
|
)
|
||||||
|
Deferred
|
(5.4
|
)
|
(9.0
|
)
|
(12.3
|
)
|
||||||
|
|
(48.2
|
)
|
(36.9
|
)
|
(26.6
|
)
|
||||||
|
Net income
|
201.3
|
159.3
|
215.4
|
|||||||||
|
Less: Net income attributable to noncontrolling interests
|
136.2
|
121.2
|
184.7
|
|||||||||
|
Net income available to common shareholders
|
$
|
65.1
|
$
|
38.1
|
$
|
30.7
|
||||||
|
|
||||||||||||
|
Net income available per common share - basic
|
$
|
1.56
|
$
|
0.93
|
$
|
0.75
|
||||||
|
Net income available per common share - diluted
|
$
|
1.55
|
$
|
0.91
|
$
|
0.74
|
||||||
|
Weighted average shares outstanding - basic
|
41.6
|
41.0
|
41.0
|
|||||||||
|
Weighted average shares outstanding - diluted
|
42.1
|
41.8
|
41.4
|
|||||||||
See notes to consolidated financial statements.
TARGA RESOURCES CORP.
CONSOLIDATED STATEMENTS OF COMPREHENSIVE INCOME (LOSS)
|
|
Year Ended December 31,
|
|||||||||||||||||||||||||||||||||||
|
|
2013
|
2012
|
2011
|
|||||||||||||||||||||||||||||||||
|
|
Pre-Tax
|
Related Income Tax
|
After Tax
|
Pre-Tax
|
Related Income Tax
|
After Tax
|
Pre-Tax
|
Related Income Tax
|
After Tax
|
|||||||||||||||||||||||||||
|
|
|
|
|
|
|
|
|
|
|
|||||||||||||||||||||||||||
|
|
(In millions)
|
|||||||||||||||||||||||||||||||||||
|
Net income attributable to Targa Resources Corp.
|
|
|
$
|
65.1
|
|
|
$
|
38.1
|
|
|
$
|
30.7
|
||||||||||||||||||||||||
|
Other comprehensive income (loss) attributable to Targa Resources Corp.
|
|
|
|
|
|
|
||||||||||||||||||||||||||||||
|
Commodity hedging contracts:
|
|
|
|
|
|
|
||||||||||||||||||||||||||||||
|
Change in fair value
|
$
|
(0.8
|
)
|
$
|
0.4
|
(0.4
|
)
|
$
|
11.9
|
$
|
(4.4
|
)
|
7.5
|
$
|
(5.2
|
)
|
$
|
2.1
|
(3.1
|
)
|
||||||||||||||||
|
Settlements reclassified to revenues
|
(2.8
|
)
|
1.1
|
(1.7
|
)
|
(9.0
|
)
|
3.3
|
(5.7
|
)
|
1.0
|
(0.4
|
)
|
0.6
|
||||||||||||||||||||||
|
Interest rate swaps:
|
||||||||||||||||||||||||||||||||||||
|
Change in fair value
|
-
|
-
|
-
|
-
|
-
|
(0.3
|
)
|
0.1
|
(0.2
|
)
|
||||||||||||||||||||||||||
|
Settlements reclassified to interest expense, net
|
0.8
|
(0.3
|
)
|
0.5
|
1.3
|
(0.6
|
)
|
0.7
|
1.3
|
(0.5
|
)
|
0.8
|
||||||||||||||||||||||||
|
Other comprehensive income (loss) attributable to Targa Resources Corp.
|
$
|
(2.8
|
)
|
$
|
1.2
|
(1.6
|
)
|
$
|
4.2
|
$
|
(1.7
|
)
|
2.5
|
$
|
(3.2
|
)
|
$
|
1.3
|
(1.9
|
)
|
||||||||||||||||
|
Comprehensive income attributable to Targa Resources Corp.
|
$
|
63.5
|
$
|
40.6
|
$
|
28.8
|
||||||||||||||||||||||||||||||
|
|
||||||||||||||||||||||||||||||||||||
|
Net income attributable to noncontrolling interests
|
$
|
136.2
|
$
|
121.2
|
$
|
184.7
|
||||||||||||||||||||||||||||||
|
Other comprehensive income (loss) attributable to noncontrolling interests
|
||||||||||||||||||||||||||||||||||||
|
Commodity hedging contracts:
|
||||||||||||||||||||||||||||||||||||
|
Change in fair value
|
$
|
(5.0
|
)
|
$
|
-
|
(5.0
|
)
|
$
|
64.9
|
$
|
-
|
64.9
|
$
|
(28.4
|
)
|
$
|
-
|
(28.4
|
)
|
|||||||||||||||||
|
Settlements reclassified to revenues
|
(18.2
|
)
|
-
|
(18.2
|
)
|
(37.0
|
)
|
-
|
(37.0
|
)
|
29.3
|
-
|
29.3
|
|||||||||||||||||||||||
|
Interest rate swaps:
|
||||||||||||||||||||||||||||||||||||
|
Change in fair value
|
-
|
-
|
-
|
-
|
-
|
-
|
(4.0
|
)
|
-
|
(4.0
|
)
|
|||||||||||||||||||||||||
|
Settlements reclassified to interest expense, net
|
5.3
|
-
|
5.3
|
6.6
|
-
|
6.6
|
6.8
|
-
|
6.8
|
|||||||||||||||||||||||||||
|
Other comprehensive income (loss) attributable to noncontrolling interests
|
$
|
(17.9
|
)
|
$
|
-
|
(17.9
|
)
|
$
|
34.5
|
$
|
-
|
34.5
|
$
|
3.7
|
$
|
-
|
3.7
|
|||||||||||||||||||
|
Comprehensive income attributable to noncontrolling interests
|
118.3
|
155.7
|
188.4
|
|||||||||||||||||||||||||||||||||
|
|
||||||||||||||||||||||||||||||||||||
|
Total comprehensive income
|
$
|
181.8
|
$
|
196.3
|
$
|
217.2
|
||||||||||||||||||||||||||||||
See notes to consolidated financial statements.
TARGA RESOURCES CORP.
CONSOLIDATED STATEMENTS OF CHANGES IN OWNERS' EQUITY
|
|
|
|
|
Retained
|
Accumulated
|
|
|
|
|
|||||||||||||||||||||||||||
|
|
|
|
Additional
|
Earnings
|
Other
|
|
|
|
|
|||||||||||||||||||||||||||
|
|
Common Stock
|
Paid in
|
(Accumulated
|
Comprehensive
|
Treasury Shares
|
Noncontrolling
|
|
|||||||||||||||||||||||||||||
|
|
Shares
|
Amount
|
Capital
|
Deficit)
|
Income (Loss)
|
Shares
|
Amount
|
Interests
|
Total
|
|||||||||||||||||||||||||||
|
|
|
|
|
|
|
|
|
|
|
|||||||||||||||||||||||||||
|
|
(In millions, except shares in thousands)
|
|||||||||||||||||||||||||||||||||||
|
Balance, December 31, 2010
|
42,292
|
$
|
-
|
$
|
244.5
|
$
|
(100.8
|
)
|
$
|
0.6
|
-
|
$
|
-
|
$
|
891.8
|
$
|
1,036.1
|
|||||||||||||||||||
|
Compensation on equity grants
|
106
|
-
|
14.2
|
-
|
-
|
-
|
-
|
1.0
|
15.2
|
|||||||||||||||||||||||||||
|
Sale of Partnership limited partner interests
|
-
|
-
|
-
|
-
|
-
|
-
|
-
|
298.0
|
298.0
|
|||||||||||||||||||||||||||
|
Impact of Partnership equity transactions
|
-
|
-
|
10.3
|
-
|
-
|
-
|
-
|
(10.3
|
)
|
-
|
||||||||||||||||||||||||||
|
Dividends
|
-
|
-
|
(39.5
|
)
|
-
|
-
|
-
|
-
|
(0.1
|
)
|
(39.6
|
)
|
||||||||||||||||||||||||
|
Distributions to owners
|
-
|
-
|
-
|
-
|
-
|
-
|
-
|
(196.2
|
)
|
(196.2
|
)
|
|||||||||||||||||||||||||
|
Other comprehensive income (loss)
|
-
|
-
|
-
|
-
|
(1.9
|
)
|
-
|
-
|
3.7
|
1.8
|
||||||||||||||||||||||||||
|
Net income
|
-
|
-
|
-
|
30.7
|
-
|
-
|
-
|
184.7
|
215.4
|
|||||||||||||||||||||||||||
|
Balance, December 31, 2011
|
42,398
|
-
|
229.5
|
(70.1
|
)
|
(1.3
|
)
|
-
|
-
|
1,172.6
|
1,330.7
|
|||||||||||||||||||||||||
|
Compensation on equity grants
|
95
|
-
|
15.3
|
-
|
-
|
-
|
-
|
3.5
|
18.8
|
|||||||||||||||||||||||||||
|
Accrual of distribution equivalent rights
|
-
|
-
|
-
|
-
|
-
|
-
|
-
|
(0.5
|
)
|
(0.5
|
)
|
|||||||||||||||||||||||||
|
Repurchase of common stock
|
(198
|
)
|
-
|
-
|
-
|
-
|
198
|
(9.5
|
)
|
-
|
(9.5
|
)
|
||||||||||||||||||||||||
|
Sale of Partnership limited partner interests
|
-
|
-
|
-
|
-
|
-
|
-
|
-
|
493.5
|
493.5
|
|||||||||||||||||||||||||||
|
Impact of Partnership equity transactions
|
-
|
-
|
5.2
|
-
|
-
|
-
|
-
|
(5.2
|
)
|
-
|
||||||||||||||||||||||||||
|
Dividends
|
-
|
-
|
(64.4
|
)
|
-
|
-
|
-
|
-
|
-
|
|
(64.4
|
)
|
||||||||||||||||||||||||
|
Distributions to owners
|
-
|
-
|
(1.2
|
)
|
-
|
-
|
-
|
-
|
(210.3
|
)
|
(211.5
|
)
|
||||||||||||||||||||||||
|
Other comprehensive income (loss)
|
-
|
-
|
-
|
-
|
2.5
|
-
|
-
|
34.5
|
37.0
|
|||||||||||||||||||||||||||
|
Net income
|
-
|
-
|
-
|
38.1
|
-
|
-
|
-
|
121.2
|
159.3
|
|||||||||||||||||||||||||||
|
Balance, December 31, 2012
|
42,295
|
-
|
184.4
|
(32.0
|
)
|
1.2
|
198
|
(9.5
|
)
|
1,609.3
|
1,753.4
|
|||||||||||||||||||||||||
|
Compensation on equity grants
|
36
|
-
|
8.8
|
-
|
-
|
-
|
-
|
6.0
|
14.8
|
|||||||||||||||||||||||||||
|
Accrual of distribution equivalent rights
|
-
|
-
|
-
|
-
|
-
|
-
|
-
|
(1.7
|
)
|
(1.7
|
)
|
|||||||||||||||||||||||||
|
Repurchase of common stock
|
(169
|
)
|
-
|
-
|
-
|
-
|
169
|
(13.3
|
)
|
-
|
(13.3
|
)
|
||||||||||||||||||||||||
|
Sale of Partnership limited partner interests
|
-
|
-
|
-
|
-
|
-
|
-
|
-
|
517.7
|
517.7
|
|||||||||||||||||||||||||||
|
Impact of Partnership equity transactions
|
-
|
-
|
32.7
|
-
|
-
|
-
|
-
|
(32.7
|
)
|
-
|
||||||||||||||||||||||||||
|
Dividends
|
-
|
-
|
(74.3
|
)
|
(12.6
|
)
|
-
|
-
|
-
|
-
|
(86.9
|
)
|
||||||||||||||||||||||||
|
Distributions
|
-
|
-
|
-
|
-
|
-
|
-
|
(274.4
|
)
|
(274.4
|
)
|
||||||||||||||||||||||||||
|
Other comprehensive income (loss)
|
-
|
-
|
-
|
-
|
(1.7
|
)
|
-
|
-
|
(17.9
|
)
|
(19.6
|
)
|
||||||||||||||||||||||||
|
Net income
|
-
|
-
|
-
|
65.1
|
-
|
-
|
-
|
136.2
|
201.3
|
|||||||||||||||||||||||||||
|
Balance, December 31, 2013
|
42,162
|
$
|
-
|
$
|
151.6
|
$
|
20.5
|
$
|
(0.5
|
)
|
367
|
$
|
(22.8
|
)
|
$
|
1,942.5
|
$
|
2,091.3
|
||||||||||||||||||
|
See notes to consolidated financial statements.
|
||||||||||||||||||||||||||||||||||||
TARGA RESOURCES CORP.
CONSOLIDATED STATEMENTS OF CASH FLOWS
|
|
Year Ended December 31,
|
|||||||||||
|
|
2013
|
2012
|
2011
|
|||||||||
|
Cash flows from operating activities
|
(In millions)
|
|||||||||||
|
Net income
|
$
|
201.3
|
$
|
159.3
|
$
|
215.4
|
||||||
|
Amortization in interest expense
|
15.9
|
18.2
|
13.0
|
|||||||||
|
Compensation on equity grants
|
13.2
|
17.5
|
15.2
|
|||||||||
|
Depreciation and amortization expense
|
271.9
|
197.6
|
181.0
|
|||||||||
|
Accretion of asset retirement obligations
|
4.0
|
4.0
|
3.6
|
|||||||||
|
Deferred income tax expense
|
5.4
|
9.0
|
12.3
|
|||||||||
|
Equity earnings, net of distributions
|
(2.8
|
)
|
-
|
(0.4
|
)
|
|||||||
|
Risk management activities
|
(0.3
|
)
|
3.6
|
(21.2
|
)
|
|||||||
|
Loss on sale or disposition of assets
|
3.9
|
15.6
|
0.2
|
|||||||||
|
Loss on debt redemptions and amendments
|
14.7
|
12.8
|
-
|
|||||||||
|
Changes in operating assets and liabilities:
|
||||||||||||
|
Receivables and other assets
|
(143.6
|
)
|
98.0
|
(101.3
|
)
|
|||||||
|
Inventory
|
(84.5
|
)
|
6.0
|
(41.1
|
)
|
|||||||
|
Accounts payable and other liabilities
|
83.6
|
(113.4
|
)
|
102.6
|
||||||||
|
Net cash provided by operating activities
|
382.7
|
428.2
|
379.3
|
|||||||||
|
Cash flows from investing activities
|
||||||||||||
|
Outlays for property, plant and equipment
|
(1,013.6
|
)
|
(582.7
|
)
|
(331.9
|
)
|
||||||
|
Business acquisitions, net of cash acquired
|
-
|
(996.2
|
)
|
(156.5
|
)
|
|||||||
|
Purchase of materials and supplies
|
(17.7
|
)
|
-
|
-
|
||||||||
|
Investment in unconsolidated affiliate
|
-
|
(16.8
|
)
|
(21.2
|
)
|
|||||||
|
Return of capital from unconsolidated affiliate
|
-
|
0.5
|
-
|
|||||||||
|
Other, net
|
5.0
|
4.5
|
0.3
|
|||||||||
|
Net cash used in investing activities
|
(1,026.3
|
)
|
(1,590.7
|
)
|
(509.3
|
)
|
||||||
|
Cash flows from financing activities
|
||||||||||||
|
Partnership loan facilities:
|
||||||||||||
|
Proceeds
|
2,238.0
|
2,595.0
|
2,112.0
|
|||||||||
|
Repayments
|
(2,021.2
|
)
|
(1,690.7
|
)
|
(2,054.3
|
)
|
||||||
|
Cash paid on note exchange
|
-
|
-
|
(27.7
|
)
|
||||||||
|
Partnership accounts receivable securitization facility:
|
||||||||||||
|
Borrowings
|
373.3
|
-
|
-
|
|||||||||
|
Repayments
|
(93.6
|
)
|
-
|
-
|
||||||||
|
Non-Partnership loan facilities:
|
||||||||||||
|
Proceeds
|
65.0
|
90.0
|
-
|
|||||||||
|
Repayments
|
(63.0
|
)
|
(96.8
|
)
|
-
|
|||||||
|
Costs incurred in connection with financing arrangements
|
(15.3
|
)
|
(36.6
|
)
|
(18.2
|
)
|
||||||
|
Distributions to owners
|
(274.4
|
)
|
(211.5
|
)
|
(196.2
|
)
|
||||||
|
Proceeds from sale of common units of the Partnership
|
524.7
|
514.0
|
310.0
|
|||||||||
|
Dividends to common and common equivalent shareholders
|
(87.8
|
)
|
(62.2
|
)
|
(38.2
|
)
|
||||||
|
Repurchase of common stock
|
(13.3
|
)
|
(9.5
|
)
|
-
|
|||||||
|
Excess tax benefit from stock-based awards
|
1.6
|
1.3
|
-
|
|||||||||
|
Net cash provided by financing activities
|
634.0
|
1,093.0
|
87.4
|
|||||||||
|
Net change in cash and cash equivalents
|
(9.6
|
)
|
(69.5
|
)
|
(42.6
|
)
|
||||||
|
Cash and cash equivalents, beginning of period
|
76.3
|
145.8
|
188.4
|
|||||||||
|
Cash and cash equivalents, end of period
|
$
|
66.7
|
$
|
76.3
|
$
|
145.8
|
||||||
|
See notes to consolidated financial statements.
|
||||||||||||
TARGA RESOURCES CORP.
NOTES TO CONSOLIDATED FINANCIAL STATEMENTS
Except as noted within the context of each footnote disclosure, the dollar amounts presented in the tabular data within these footnote disclosures are stated in millions of dollars.
Note 1 — Organization
Targa Resources Corp. (“TRC”) is a Delaware corporation formed in October 2005. Our common stock is listed on the New York Stock Exchange under the symbol “TRGP.” In this Annual Report, unless the context requires otherwise, references to “we,” “us,” “our,” “the Company” or “Targa” are intended to mean our consolidated business and operations.
Note 2
—
Basis of Presentation
These accompanying financial statements and related notes present our consolidated financial position as of December 31, 2013 and 2012, and the results of operations, comprehensive income, cash flows, and changes in owners’ equity for the years ended December 31, 2013, 2012 and 2011.
We have prepared our consolidated financial statements in accordance with accounting principles generally accepted in the United States of America (“GAAP”). All significant intercompany balances and transactions have been eliminated. Certain amounts in prior periods have been reclassified to conform to the current year presentation.
One of our indirect subsidiaries is the sole general partner of Targa Resources Partners LP (the “Partnership”). Because we control the general partner of the Partnership, under GAAP, we must reflect our ownership interests in the Partnership on a consolidated basis. Accordingly, the Partnership’s financial results are included in our consolidated financial statements even though the distribution or transfer of Partnership assets is limited by the terms of the Partnership’s partnership agreement, as well as restrictive covenants in the Partnership’s lending agreements. The limited partner interests in the Partnership not owned by us are reflected in our results of operations as net income attributable to noncontrolling interests and in our balance sheet equity section as noncontrolling interests in subsidiaries. Throughout these footnotes, we make a distinction where relevant between financial results of the Partnership versus those of a standalone parent and its non-partnership subsidiaries.
As of December 31, 2013, our interests in the Partnership consist of the following:
| · | a 2% general partner interest, which we hold through our 100% ownership interest in the general partner of the Partnership; |
| · | all Incentive Distribution Rights (“IDRs”); and |
| · | 12,945,659 common units of the Partnership, representing an 11.6% limited partnership interest. |
The Partnership is engaged in the business of gathering, compressing, treating, processing and selling natural gas; storing, fractionating, treating, transporting and selling NGL and NGL products; gathering, storing and terminaling crude oil; and storing, terminaling and selling refined petroleum products. See Note 23 for an analysis of our and the Partnership’s operations by business segment.
Note 3 — Significant Accounting Policies
Consolidation Policy
Our consolidated financial statements include our accounts and those of our subsidiaries in which we have a controlling interest. We hold varying undivided interests in various gas processing facilities in which we are responsible for our proportionate share of the costs and expenses of the facilities. Our consolidated financial statements reflect our proportionate share of the revenues, expenses, assets and liabilities of these undivided interests.
We follow the equity method of accounting if our ownership interest is between 20% and 50% and we exercise significant influence over the operating and financial policies of the investee.
Cash and Cash Equivalents
Cash and cash equivalents include all cash on hand, demand deposits, and investments with original maturities of three months or less. We consider cash equivalents to include short-term, highly liquid investments that are readily convertible to known amounts of cash and which are subject to an insignificant risk of changes in value.
Comprehensive Income
Comprehensive income includes net income and other comprehensive income (“OCI”), which includes unrealized gains and losses on derivative instruments that are designated as hedges.
Allowance for Doubtful Accounts
Estimated losses on accounts receivable are provided through an allowance for doubtful accounts. In evaluating the adequacy of the allowance, we make judgments regarding each party’s ability to make required payments, economic events and other factors. As the financial condition of any party changes, circumstances develop or additional information becomes available, adjustments to an allowance for doubtful accounts may be required.
Inventories
The Partnership’s inventories consist primarily of NGL product inventories. Most NGL product inventories turn over monthly, but some inventory, primarily propane, is acquired and held during the year to meet anticipated heating season requirements of the Partnership’s customers. NGL product inventories are valued at the lower of cost or market using the average cost method. Commodity inventories that are not physically or contractually available for sale under normal operations (“deadstock”) are classified as Property, Plant and Equipment. Inventories also include materials and supplies required for our Badlands expansion activities in North Dakota, which are valued using the specific identification method.
Product Exchanges
Exchanges of NGL products are executed to satisfy timing and logistical needs of the exchange parties. Volumes received and delivered under exchange agreements are recorded as inventory. If the locations of receipt and delivery are in different markets, a price differential may be billed or owed. The price differential is recorded as either accounts receivable or accrued liabilities.
Gas Processing Imbalances
Quantities of natural gas and/or NGLs over-delivered or under-delivered related to certain gas plant operational balancing agreements are recorded monthly as inventory or as a payable using the weighted average price at the time the imbalance was created. Inventory imbalances receivable are valued at the lower of cost or market; inventory imbalances payable are valued at replacement cost. These imbalances are settled either by current cash-out settlements or by adjusting future receipts or deliveries of natural gas or NGLs.
Derivative Instruments
The Partnership employs derivative instruments to manage the volatility of cash flows due to fluctuating energy prices and interest rates. All derivative instruments not qualifying for the normal purchase and normal sale exception are recorded on the balance sheets at fair value. The treatment of the periodic changes in fair value will depend on whether the derivative is designated and effective as a hedge for accounting purposes. The Partnership has designated certain liquids marketing contracts that meet the definition of a derivative as normal purchases and normal sales, which under GAAP, are not accounted for as derivatives.
If a derivative qualifies for hedge accounting and is designated as a cash flow hedge, the effective portion of the unrealized gain or loss on the derivative is deferred in Accumulated Other Comprehensive Income (“AOCI”), a component of owners’ equity, and reclassified to earnings when the forecasted transaction occurs. Cash flows from a derivative instrument designated as a hedge are classified in the same category as the cash flows from the item being hedged. As such, we include the cash flows from commodity derivative instruments in revenues and from interest rate derivative instruments in interest expense.
If a derivative does not qualify as a hedge or is not designated as a hedge, the gain or loss on the derivative is recognized currently in earnings. The ultimate gain or loss on the derivative transaction upon settlement is also recognized as a component of other income and expense.
The Partnership formally documents all relationships between hedging instruments and hedged items, as well as its risk management objectives and strategy for undertaking the hedge. This documentation includes the specific identification of the hedging instrument and the hedged item, the nature of the risk being hedged and the manner in which the hedging instrument’s effectiveness will be assessed. At the inception of the hedge, and on an ongoing basis, the Partnership assesses whether the derivatives used in hedging transactions are highly effective in offsetting changes in cash flows of hedged items.
The relationship between the hedging instrument and the hedged item must be highly effective in achieving the offset of changes in cash flows attributable to the hedged risk both at the inception of the contract and on an ongoing basis. The Partnership measures hedge ineffectiveness on a quarterly basis and reclassify any ineffective portion of the unrealized gain or loss to earnings in the current period.
The Partnership will discontinue hedge accounting on a prospective basis when a hedge instrument is terminated or ceases to be highly effective. Gains and losses deferred in AOCI related to cash flow hedges for which hedge accounting has been discontinued remain deferred until the forecasted transaction occurs. If it is no longer probable that a hedged forecasted transaction will occur, deferred gains or losses on the hedging instrument are reclassified to earnings immediately.
For balance sheet classification purposes, the Partnership analyzes the fair values of the derivative contracts on a deal by deal basis.
Property, Plant and Equipment
Property, plant and equipment are stated at acquisition value less accumulated depreciation. All of the property, plant and equipment sold to the Partnership from 2007 to 2010 in drop-down transactions were stated at historical cost in the transactions recorded under common control accounting. Depreciation is computed using the straight-line method over the estimated useful lives of the assets.
Expenditures for maintenance and repairs are expensed as incurred. Expenditures to refurbish assets that extend the useful lives or prevent environmental contamination are capitalized and depreciated over the remaining useful life of the asset or major asset component. We also capitalize certain costs directly related to the construction of assets, including internal labor costs, interest and engineering costs.
The determination of the useful lives of property, plant and equipment requires us to make various assumptions, including the supply of and demand for hydrocarbons in the markets served by our assets, normal wear and tear of the facilities, and the extent and frequency of maintenance programs.
We evaluate the recoverability of our property, plant and equipment when events or circumstances such as economic obsolescence, the business climate, legal and other factors indicate we may not recover the carrying amount of the assets. Asset recoverability is measured by comparing the carrying value of the asset with the asset’s expected future undiscounted cash flows. These cash flow estimates require us to make projections and assumptions for many years into the future for pricing, demand, competition, operating cost and other factors. If the carrying amount exceeds the expected future undiscounted cash flows we recognize an impairment loss to write down the carrying amount of the asset to its fair value as determined by quoted market prices in active markets or present value techniques if quotes are unavailable. The determination of the fair value using present value techniques requires us to make projections and assumptions regarding the probability of a range of outcomes and the rates of interest used in the present value calculations. Any changes we make to these projections and assumptions could result in significant revisions to our evaluation of recoverability of our property, plant and equipment and the recognition of an impairment loss in our consolidated statements of operations. Upon disposition or retirement of property, plant and equipment, any gain or loss is recorded to operations. See Note 6.
Intangible Assets
Intangible assets arose from producer dedications under long-term contracts and customer relationships associated with businesses acquisitions. The fair value of these acquired intangible assets was determined at the date of acquisition based on the present value of estimated future cash flows. Amortization expense attributable to these assets is recorded in a manner that closely resembles the expected pattern in which we benefit from services provided to customers. See Note 6.
Asset Retirement Obligations
(“
AROs
”)
AROs are legal obligations associated with the retirement of tangible long-lived assets that result from an asset’s acquisition, construction, development and/or normal operation. An ARO is initially measured at its estimated fair value. Upon initial recognition of an ARO, we record an increase to the carrying amount of the related long-lived asset and an offsetting ARO liability. The consolidated cost of the asset and the capitalized asset retirement obligation is depreciated using the straight-line method over the period during which the long-lived asset is expected to provide benefits. After the initial period of ARO recognition, the ARO will change as a result of either the passage of time or revisions to the original estimates of either the amounts of estimated cash flows or their timing.
Changes due to the passage of time increase the carrying amount of the liability because there are fewer periods remaining from the initial measurement date until the settlement date; therefore, the present values of the discounted future settlement amount increases. These changes are recorded as a period cost called accretion expense. Changes resulting from revisions to the timing or the amount of the original estimate of undiscounted cash flows shall be recognized as an increase or a decrease in the carrying amount of the liability for an asset retirement obligation and the related asset retirement cost capitalized as part of the carrying amount of the related long-lived asset. Upon settlement, AROs will be extinguished by us at either the recorded amount or we will recognize a gain or loss on the difference between the recorded amount and the actual settlement cost. See Note 7.
Debt Issue Costs
Costs incurred in connection with the issuance of long-term debt are deferred and charged to interest expense over the term of the related debt. Gains or losses on debt repurchases, redemptions and debt extinguishments include any associated unamortized debt issue costs.
Accounts Receivable Securitization Facility
Proceeds from the sale or contribution of certain receivables under the Partnership’s Accounts Receivable Securitization Facility (the “Securitization Facility”) are treated as collateralized borrowings in our financial statements. Such borrowings are reflected as long-term debt on our balance sheets to the extent that the Partnership has the ability and intent to fund the Securitization Facility’s borrowings on a long-term basis. Proceeds and repayments under the Securitization Facility are reflected as cash flows from financing activities on our statements of cash flows.
Environmental Liabilities and Other Loss Contingencies
Liabilities for loss contingencies, including environmental remediation costs arising from claims, assessments, litigation, fines, penalties and other sources are charged to expense when it is probable that a liability has been incurred and the amount of the loss can be reasonably estimated. See Note 17.
Income Taxes
We account for income taxes using the asset and liability method of accounting for deferred income taxes and provide deferred income taxes for all significant temporary differences.
As part of the process of preparing our consolidated financial statements, we are required to estimate our income taxes in each of the jurisdictions in which we operate. This process involves estimating our actual current tax payable and related tax expense together with assessing temporary differences resulting from differing treatment of certain items, such as depreciation, for tax and accounting purposes. These differences can result in deferred tax assets and liabilities, which are included within our consolidated balance sheets.
We must then assess the likelihood that our deferred tax assets will be recovered from future taxable income and, to the extent we believe that it is more likely than not (a likelihood of more than 50%) that some portion or all of the deferred tax assets will not be realized, we establish a valuation allowance. Any change in the valuation allowance would impact our income tax provision and net income in the period in which such a determination is made. We consider all available evidence, both positive and negative, to determine whether, based on the weight of the evidence, a valuation allowance is needed. Evidence used includes information about our current financial position and our results of operations for the current and preceding years, as well as all currently available information about future years, including our anticipated future performance, the reversal of deferred tax liabilities and tax planning strategies.
We believe future sources of taxable income, reversing temporary differences and other tax planning strategies will be sufficient to realize assets for which no reserve has been established.
Noncontrolling Interests
Third-party ownership in the net assets of our consolidated subsidiaries is shown as noncontrolling interests within the equity section of the balance sheet. In the statements of operations and statements of comprehensive income, noncontrolling interests reflects the allocation of results to third-party investors, which for the Partnership gives effect to the incentive distribution rights
declared for each period. We account for the difference between the carrying amount of our investment in the Partnership and the underlying book value arising from issuance of common units by the Partnership, where we maintain control, as an equity transaction. If the Partnership issues common units at a price different than our carrying value per unit, we account for the premium or deficiency as an adjustment to paid-in capital.
Revenue Recognition
Our operating revenues are primarily derived from the following activities:
| • | sales of natural gas, NGLs, condensate, crude oil and petroleum products; |
| • | services related to compressing, gathering, treating, and processing of natural gas; and |
| • | services related to NGL fractionation, terminaling and storage, transportation and treating. |
We recognize revenues when all of the following criteria are met: (1) persuasive evidence of an exchange arrangement exists, if applicable, (2) delivery has occurred or services have been rendered, (3) the price is fixed or determinable and (4) collectability is reasonably assured.
For natural gas processing activities, we receive either fees or a percentage of commodities as payment for these services, depending on the type of contract. Under fee-based contracts, we receive a fee based on throughput volumes. Under percent-of-proceeds contracts, we receive either an agreed upon percentage of the actual proceeds that we receive from our sales of the residue natural gas and NGLs or an agreed upon percentage based on index related prices for the natural gas and NGLs. Percent-of-value and percent-of-liquids contracts are variations on this arrangement. Under keep-whole contracts, we retain the NGLs extracted and return the processed natural gas or value of the natural gas to the producer. A significant portion of our Straddle plant processing contracts are hybrid contracts under which settlements are made on a percent-of-liquids basis or a fee basis, depending on market conditions. Natural gas or NGLs that we receive for services or purchase for resale are in turn sold and recognized in accordance with the criteria outlined above.
We generally report sales revenues gross in our consolidated statements of operations, as we typically act as the principal in the transactions where we receive commodities, take title to the natural gas and NGLs, and incur the risks and rewards of ownership. However, buy-sell transactions with the same counterparty are reported on a net basis.
Share-Based Compensation
We award share-based compensation to employees, directors and non-management directors in the form of restricted stock, restricted stock units, stock options and performance units. Compensation expense on restricted common units and performance unit awards that qualify as equity arrangements are measured by the fair value of the award as determined by the market at the date of grant. Compensation expense on performance unit awards that qualify as liability arrangements is initially measured by the fair value of the award at the date of grant, and re-measured subsequently at each reporting date through the settlement period. Compensation expense is recognized in general and administrative expense over the requisite service period of each award. See Note 22.
Earnings per Share
We account for earnings per share (“EPS”) in accordance with Accounting Standards Codification (“ASC”) Topic 260 – Earnings per Share. Diluted EPS reflects the potential dilution that could occur if securities or other contracts to issue common stock were exercised or converted into common stock or resulted in the issuance of common stock so long as it does not have an anti-dilutive effect on EPS. The dilutive effect is determined through the application of the treasury method. Securities that meet the definition of a participating security are required to be considered for inclusion in the computation of basic EPS.
Use of Estimates
When preparing financial statements in conformity with GAAP, management must make estimates and assumptions based on information available at the time. These estimates and assumptions affect the reported amounts of assets, liabilities, revenues and expenses, as well as the disclosures of contingent assets and liabilities as of the date of the financial statements. Estimates and judgments are based on information available at the time such estimates and judgments are made. Adjustments made with respect to the use of these estimates and judgments often relate to information not previously available. Uncertainties with respect to such estimates and judgments are inherent in the preparation of financial statements. Estimates and judgments are used in, among other things, (1) estimating unbilled revenues, product purchases and operating and general and administrative costs, (2) developing fair value assumptions, including estimates of future cash flows and discount rates, (3) analyzing long-lived assets for possible impairment, (4) estimating the useful lives of assets and (5) determining amounts to accrue for contingencies, guarantees and indemnifications. Actual results, therefore, could differ materially from estimated amounts.
Recent Accounting Pronouncements
In January 2013, the Financial Accounting Standards Board (“FASB”) issued Accounting Standards Update (“ASU”) No. 2013-01,
Balance Sheet (Topic 210): Clarifying the Scope of Disclosures about Offsetting Assets and Liabilities,
which clarifies that ASU No. 2011-11,
Balance Sheet (Topic 210): Disclosures about Offsetting Assets and Liabilities,
applies to financial instruments or derivative transactions accounted for under ASC Topic 815. We currently present the Partnership’s derivative assets and liabilities on a gross basis on our statement of financial position. The amendments require disclosure of both gross and net amounts of derivative assets and liabilities that are subject to master netting arrangements with counterparties. We have provided these additional disclosures regarding the gross and net amounts of derivative assets and liabilities in Note 14.
In February 2013, the FASB issued ASU No. 2013-02,
Comprehensive Income (Topic 220): Reporting of Amounts Reclassified Out of Accumulated Other Comprehensive Income
. The amendment, required to be applied prospectively for reporting periods beginning after December 15, 2012, requires entities to present, either on the face of the statement where net income is presented or in the notes, significant amounts reclassified out of accumulated other comprehensive income by the respective line item of net income. Our financial statement presentation complies with this standards update.
Note 4 –Business Acquisitions
2012 Acquisition
Badlands
On December 31, 2012, the Partnership completed the acquisition of Saddle Butte Pipeline, LLC’s ownership of its Williston Basin crude oil pipeline and terminal system and its natural gas gathering and processing operations (collectively “Badlands”), for cash consideration of $975.8 million, subject to
a contingent payment.
The acquired business is located in the Bakken and Three Forks Shale plays of the Williston Basin in North Dakota, expands the Partnership's portfolio of midstream assets and diversifies its business with the addition of fee-based crude oil gathering and natural gas gathering and processing. The Badlands financial results are included in the Partnership’s Field Gathering and Processing business segment.
Pursuant to the Membership Interest Purchase and Sale Agreement (“MIPSA”), the acquisition is subject to a contingent payment of $50 million (the “contingent consideration”) if aggregate crude oil gathering volumes exceed certain stipulated monthly thresholds during the period from January 2013 through June 2014. If the threshold is not attained during the contingency period, no payment is owed. Accounting standards require that the contingent consideration be recorded at fair value at the date of acquisition and revalued at subsequent reporting dates under the acquisition method of accounting. At December 31, 2012, the Partnership recorded a $15.3 million accrued liability representing the fair value of this contingent consideration, determined by a probability based model measuring the likelihood of meeting certain volumetric measures identified in the MIPSA.
Changes in the fair value of this accrued liability are included in earnings and reported as Other income (expense) in the Consolidated Statement of Operations. During 2013, the contingent consideration was re-estimated to be $0, resulting in an increase in Other income of $15.3 million in 2013. The elimination of the contingent liability reflects management’s belief that these stipulated volumetric thresholds will not be achieved during the contingency period.
The following table summarizes the consideration paid for the Badlands acquisition and the determination of the assets and liabilities acquired at the December 31, 2012 acquisition date.
|
|
December 31, 2012
|
|||
|
Cash
|
$
|
975.8
|
||
|
Contingent consideration
|
15.3
|
|||
|
Total consideration
|
$
|
991.1
|
||
|
|
||||
|
Assets acquired and liabilities assumed
|
||||
|
Financial assets
|
$
|
35.4
|
||
|
Inventory
|
16.2
|
|||
|
Property, plant and equipment
|
295.3
|
|||
|
Intangible assets
|
679.6
|
|||
|
Financial liabilities
|
(35.4
|
)
|
||
|
Total net assets
|
$
|
991.1
|
||
Intangible assets consist of customer contracts and relationships acquired in the Badlands acquisition. Using relevant information and assumptions, the fair value of acquired identifiable intangible assets at the date of acquisition was determined. Fair value is generally calculated as the present value of estimated future cash flows. Key assumptions include probability of contracts under negotiation, renewals of existing contracts, economic incentives to retain customers, past and future volumes, current and future capacity of the gathering system, pricing volatility and the discount rate. See Note 6 for details of amortization method for intangible assets.
Pro Forma Results
As the Badlands acquisition was completed on December 31, 2012, there were no results of operations attributable to this acquisition for 2012. In 2012, t
he Partnership incurred $6.1 million of acquisition-related costs associated with the Badlands acquisition (included in Other expense in its consolidated statement of operations).
The Partnership’s Annual Report for the year ended 2012 included preliminary pro forma information assuming that the Badlands acquisition had been completed on January 1, 2011. In 2013, the Partnership finalized amortization methods for Badlands intangible assets and estimated useful lives for both tangible and intangible assets of Badlands.
The following unaudited pro forma consolidated results of operations for the years ended 2012 and 2011 has been updated to include the effects of the Partnership’s 2013 amortization method policy decisions.
|
|
2012
|
2011
|
||||||
|
|
( In millions except per share amounts)
|
|||||||
|
Revenues
|
$
|
5,909.9
|
$
|
6,998.1
|
||||
|
Net income
|
129.5
|
174.5
|
||||||
|
Less: Net income attributable to noncontrolling interests
|
83.5
|
133.1
|
||||||
|
Net income attributable to Targa Resources Corp.
|
$
|
46.0
|
$
|
41.4
|
||||
|
|
||||||||
|
Net income per common share - Basic
|
$
|
1.12
|
$
|
1.01
|
||||
|
Net income per common share - Diluted
|
$
|
1.10
|
$
|
1.00
|
||||
The pro forma consolidated results of operations include adjustments to include the reported results of the acquired company for 2012 and 2011, as adjusted to:
| · | exclude the financial results of assets retained by the seller; |
| · | report revenues from the purchase and sale of crude oil inventory with the same counterparty on a net basis to conform to our accounting policy; |
| · | report revenues from the purchases and sales of certain Badlands natural gas processing agreements in which we are in substance an agent rather than a principal on a net basis; |
| · | include the incremental depreciation expenses associated with the fair value adjustments to property, plant and equipment as a result of applying the acquisition method of accounting (assumed straight-line method over useful lives of 15-20 years); |
| · | include the amortization expense associated with the fair value adjustments to definite-lived intangibles in a manner that follows the expected pattern of services provided to customers, over a useful life of 20 years. |
| · | include the financing costs associated with the Partnership’s debt offering and borrowings under the TRP Revolver used to fund a portion of the acquisition; |
| · | adjust the attribution of net income to noncontrolling interests to give effect to the pro forma adjustments on the Partnership’s net income; |
| · | include the income tax effect for us; and |
| · | exclude $6.1 million of acquisition costs incurred in 2012 that were directly related to the transaction. |
The pro forma information is not necessarily indicative of the results of operations that would have occurred had the transactions been made at the beginning of the periods presented or the future results of the combined operations.
2011 Acquisitions
In March 2011, the Partnership acquired a refined petroleum products and crude oil storage and terminaling facility in Channelview, Texas on Carpenter's Bayou along the Houston Ship Channel (the "Channelview Terminal") for $29.0 million. The Channelview Terminal, with storage capacity of 544,000 barrels, can handle multiple grades of blend stocks, petroleum products and crude oil and has potential for expansion, as well as integration with the Partnership’s other logistics operations.
In September 2011, the Partnership acquired two refined petroleum products and crude oil storage and terminaling facilities. At the time of the acquisition the facility on the Hylebos Waterway in the Port of Tacoma, Washington has 758 MBbl of capacity and handles refined petroleum products, crude oil, LPGs and biofuels, including ethanol and biodiesel. The facility on the Patapsco River in Baltimore, Maryland has approximately 505 MBbl of storage capacity. Both terminals contain blending and heating capabilities, and have tanker truck and barge loading and unloading infrastructure. Total cash consideration including working capital for both facilities was $135 million.
Note 5 — Inventories
The components of inventories consisted of the following:
|
|
December 31, 2013
|
December 31, 2012
|
||||||
|
Commodities
|
$
|
136.4
|
$
|
82.3
|
||||
|
Materials and supplies
|
14.3
|
17.1
|
||||||
|
|
$
|
150.7
|
$
|
99.4
|
||||
Note 6 — Property, Plant and Equipment and Intangible Assets
|
|
December 31, 2013
|
December 31, 2012
|
|
|||||||||||||||||||||||||
|
|
Targa Resources Partners LP
|
TRC Non-Partnership
|
Targa Resources Corp. Consolidated
|
Targa Resources Partners LP
|
TRC Non-Partnership
|
Targa Resources Corp. Consolidated
|
Estimated Useful Lives (In Years)
|
|||||||||||||||||||||
|
Gathering systems
|
$
|
2,230.1
|
$
|
-
|
$
|
2,230.1
|
$
|
1,975.3
|
$
|
-
|
$
|
1,975.3
|
5 to 20
|
|||||||||||||||
|
Processing and fractionation facilities
|
1,598.0
|
6.6
|
1,604.6
|
1,251.6
|
6.6
|
1,258.2
|
5 to 25
|
|||||||||||||||||||||
|
Terminaling and storage facilities
|
715.2
|
-
|
715.2
|
462.0
|
-
|
462.0
|
5 to 25
|
|||||||||||||||||||||
|
Transportation assets
|
294.7
|
-
|
294.7
|
292.5
|
-
|
292.5
|
10 to 25
|
|||||||||||||||||||||
|
Other property, plant and equipment
|
121.3
|
0.2
|
121.5
|
84.6
|
0.2
|
84.8
|
3 to 25
|
|||||||||||||||||||||
|
Land
|
89.5
|
-
|
89.5
|
87.1
|
-
|
87.1
|
-
|
|||||||||||||||||||||
|
Construction in progress
|
702.8
|
-
|
702.8
|
548.1
|
-
|
548.1
|
-
|
|||||||||||||||||||||
|
Property, plant and equipment
|
5,751.6
|
6.8
|
5,758.4
|
4,701.2
|
6.8
|
4,708.0
|
||||||||||||||||||||||
|
Accumulated depreciation
|
(1,406.2
|
)
|
(2.3
|
)
|
(1,408.5
|
)
|
(1,168.0
|
)
|
(2.0
|
)
|
(1,170.0
|
)
|
||||||||||||||||
|
Property, plant and equipment, net
|
$
|
4,345.4
|
$
|
4.5
|
$
|
4,349.9
|
$
|
3,533.2
|
$
|
4.8
|
$
|
3,538.0
|
||||||||||||||||
|
|
||||||||||||||||||||||||||||
|
Intangible assets
|
$
|
681.8
|
$
|
-
|
$
|
681.8
|
$
|
681.9
|
$
|
-
|
$
|
681.9
|
20
|
|||||||||||||||
|
Accumulated amortization
|
(28.4
|
)
|
-
|
(28.4
|
)
|
(1.1
|
)
|
-
|
(1.1
|
)
|
||||||||||||||||||
|
Intangible assets, net
|
$
|
653.4
|
$
|
-
|
$
|
653.4
|
$
|
680.8
|
$
|
-
|
$
|
680.8
|
||||||||||||||||
Intangible assets consist of customer contracts and customer relationships acquired in business acquisitions. The fair value of these acquired intangible assets was determined at the date of acquisition based on the present value of estimated future cash flows. Key valuation assumptions include probability of contracts under negotiation, renewals of existing contracts, economic incentives to retain customers, past and future volumes, current and future capacity of the gathering system, pricing volatility and the discount rate.
Amortization expense attributable to these intangible assets is recorded using a method that closely reflects the cash flow pattern underlying the intangible asset valuation. Amortization of these assets was $27.3 million in 2013. The estimated amortization expense for these intangible assets is approximately $61.4 million, $80.1 million, $88.3 million, $81.5 million and $67.8 million for each of years 2014 through 2018.
Note 7 – Asset Retirement Obligations
Our asset retirement obligations primarily relate to certain of the Partnership’s gas gathering pipelines and processing facilities and are included in our consolidated balance sheets as a component of other long-term liabilities. The changes in our aggregate asset retirement obligations are as follows:
|
|
2013
|
2012
|
2011
|
|||||||||
|
Beginning of period
|
$
|
45.3
|
$
|
42.3
|
$
|
37.5
|
||||||
|
Change in cash flow estimate
|
1.6
|
(1.0
|
)
|
1.2
|
||||||||
|
Accretion expense
|
4.0
|
4.0
|
3.6
|
|||||||||
|
End of period
|
$
|
50.9
|
$
|
45.3
|
$
|
42.3
|
||||||
Note 8 – Investment in Unconsolidated Affiliate
At December 31, 2013, 2012 and 2011, the Partnership’s unconsolidated investment consisted of a 38.8% ownership interest in Gulf Coast Fractionators LP (“GCF”).
The following table shows the activity related to the Partnership’s investment in an unconsolidated affiliate for the years indicated:
|
|
2013
|
2012
|
2011
|
|||||||||
|
Equity earnings
|
$
|
14.8
|
$
|
1.9
|
$
|
8.8
|
||||||
|
Cash distributions
|
12.0
|
2.3
|
8.4
|
|||||||||
|
Cash calls for expansion projects
|
-
|
16.8
|
21.2
|
|||||||||
Note 9
—
Accounts Payable and Accrued Liabilities
The components of accounts payable and accrued liabilities consisted of the following:
|
|
December 31, 2013
|
December 31, 2012
|
||||||
|
Commodities
|
$
|
520.8
|
$
|
416.8
|
||||
|
Other goods and services
|
146.8
|
154.4
|
||||||
|
Interest
|
35.9
|
39.5
|
||||||
|
Compensation and benefits
|
40.3
|
40.7
|
||||||
|
Other
|
18.0
|
27.6
|
||||||
|
|
$
|
761.8
|
$
|
679.0
|
||||
Note 10 — Debt Obligations
|
|
December 31, 2013
|
December 31, 2012
|
||||||
|
Long-term debt:
|
|
|
||||||
|
Non-Partnership obligations:
|
|
|
||||||
|
TRC Senior secured revolving credit facility, variable rate, due October 2017 (1)
|
$
|
84.0
|
$
|
82.0
|
||||
|
Obligations of the Partnership: (2)
|
||||||||
|
Senior secured revolving credit facility, variable rate, due October 2017 (3)
|
395.0
|
620.0
|
||||||
|
Senior unsecured notes, 11¼% fixed rate, due July 2017 (4)
|
-
|
72.7
|
||||||
|
Unamortized discount
|
-
|
(2.5
|
)
|
|||||
|
Senior unsecured notes, 7
⅞
% fixed rate, due October 2018
|
250.0
|
250.0
|
||||||
|
Senior unsecured notes, 6
⅞
% fixed rate, due February 2021
|
483.6
|
483.6
|
||||||
|
Unamortized discount
|
(28.0
|
)
|
(30.5
|
)
|
||||
|
Senior unsecured notes, 6
⅜
% fixed rate, due August 2022
|
300.0
|
400.0
|
||||||
|
Senior unsecured notes, 5
¼
% fixed rate, due May 2023
|
600.0
|
600.0
|
||||||
|
Senior unsecured notes, 4¼% fixed rate, due November 2023
|
625.0
|
-
|
||||||
|
Accounts receivable securitization facility, due December 2014 (5)
|
279.7
|
-
|
||||||
|
Total long-term debt
|
$
|
2,989.3
|
$
|
2,475.3
|
||||
|
Irrevocable standby letters of credit:
|
||||||||
|
Letters of credit outstanding under TRC Senior secured credit facility (1)
|
$
|
-
|
$
|
-
|
||||
|
Letters of credit outstanding under the Partnership senior secured revolving credit facility (3)
|
86.8
|
45.3
|
||||||
|
|
$
|
86.8
|
$
|
45.3
|
||||
| (1) | As of December 31, 2013 , availability under TRC’s $150 million senior secured revolving credit facility was $66.0 million. |
| (2) | While we consolidate the debt of the Partnership in our financial statements, we do not have the obligation to make interest payments or debt payments with respect to the debt of the Partnership. |
| (3) | As of December 31, 2013 , availability under the Partnership’s $1.2 billion senior secured revolving credit facility was $718.2 million. |
| (4) | The outstanding balance of the 11¼% Notes was redeemed on July 15, 2013. See “Senior Notes Repayments and Redemptions” below. |
| (5) | All amounts outstanding under the Partnership’s Securitization Facility are reflected as long-term debt in our balance sheet because the Partnership has the ability and intent to fund the Securitization Facility’s borrowings on a long-term basis. |
The following table shows the contractually scheduled maturities of our and the Partnership’s debt obligations outstanding at December 31, 2013 for the next five years, and in total thereafter:
|
|
|
Scheduled Maturities of Debt
|
||||||||||||||||||
|
|
Total
|
2014
|
2017
|
2018
|
After 2018
|
|||||||||||||||
|
TRC Senior secured credit facility
|
$
|
84.0
|
$
|
-
|
84.0
|
$
|
-
|
$
|
-
|
|||||||||||
|
TRP Revolver
|
395.0
|
-
|
395.0
|
-
|
-
|
|||||||||||||||
|
Partnership's Senior unsecured notes
|
2,258.6
|
-
|
-
|
250.0
|
2,008.6
|
|||||||||||||||
|
Partnership's Securitization Facility
|
279.7
|
279.7
|
-
|
-
|
-
|
|||||||||||||||
|
Total
|
$
|
3,017.3
|
$
|
279.7
|
$
|
479.0
|
$
|
250.0
|
$
|
2,008.6
|
||||||||||
The following table shows the range of interest rates and weighted average interest rate incurred on our and the Partnership’s variable-rate debt obligations during the year ended December 31, 2013:
|
|
Range of Interest Rates
Incurred
|
|
Weighted Average Interest
Rate Incurred
|
|
TRC senior secured revolving credit facility
|
2.9% - 3.0%
|
|
2.9%
|
|
Partnership's senior secured revolving credit facility
|
1.9% - 4.5%
|
|
2.4%
|
|
Partnership's accounts receivable securitization facility
|
0.9%
|
|
0.9%
|
Compliance with Debt Covenants
As of December 31, 2013, both we and the Partnership were in compliance with the covenants contained in our various debt agreements.
TRC Revolving Credit Agreement
In October 2012, we entered into a Credit Agreement that replaced our existing variable rate Senior Secured Revolving Credit Facility due July 2014 with a new variable rate Senior Secured Credit Facility due October 3, 2017 (the “TRC Revolver”). The TRC Revolver increases available commitments to $150.0 million from $75.0
million, allows us to request up to an additional $100.0
million in commitment increases
and includes a $30.0 million swing line sub-facility.
Outstanding letters of credit and related outstanding reimbursement obligations may not exceed $50.0
million in the aggregate.
We incurred a charge of $0.2 million related to a partial write-off of debt issue costs associated with the previous credit facility as a result of a change in syndicate members under the new TRC Revolver. The remaining deferred debt issue costs along with the issue costs associated with the October 2012 amendment are amortized on a straight-line basis over the life of the TRC Revolver.
The TRC Revolver bears interest, at our option, at either (a) a base rate equal to the highest of the prime rate of Deutsche Bank Trust Company Americas, the administrative agent, the federal funds rate plus 0.5% and the one-month LIBOR rate plus 1.0%, plus an applicable margin ranging from 1.75% to 2.5% (dependent upon the Company’s consolidated leverage ratio), or (b) LIBOR plus an applicable margin ranging from 2.75% to 3.5% (dependent upon the Company’s consolidated leverage ratio).
We are required to pay a commitment fee ranging from 0.375% to 0.5% (dependent upon the Company’s consolidated leverage ratio) on the daily average unused portion of the TRC Revolver. Additionally, issued and undrawn letters of credit bear interest at an applicable ranging from 2.75% to 3.5% (dependent upon the Company’s consolidated leverage ratio).
The TRC Revolver is secured by substantially all of the Company’s assets. The TRC Revolver requires us to maintain a consolidated leverage ratio (the ratio of consolidated funded indebtedness to consolidated adjusted EBITDA) of no more than 4.00
to
1.00. The TRC Revolver restricts our ability to make dividends to shareholders if, on a pro forma basis after giving effect to such dividend, (a) any default or event of default has occurred and is continuing or (b) our consolidated leverage ratio exceeds 4.00 to 1.00. In addition, the TRC Revolver includes various covenants that may limit, among other things, our ability to incur indebtedness, grant liens, make investments, repay or amend the terms of certain other indebtedness, merge or consolidate, sell assets, and engage in transactions with affiliates.
TRC Holdco Loan Facility
In August 2007, we borrowed $450 million under the TRC Holdco loan facility (“Holdco debt”).
The following subsidiary repurchases of Holdco debt have been recognized as extinguishments of debt:
| · | In 2012, using proceeds from our TRC Revolver, we paid $88.8 million to extinguish the remaining $89.3 million outstanding borrowings of Holdco debt, resulting in a pretax gain of $0.5 million. In addition, we wrote-off $0.3 million of associated unamortized deferred debt issue costs. |
The Partnership’s Revolving Credit Agreement
In October 2012, the Partnership entered into a Second Amended and Restated Credit Agreement that amended and replaced its variable rate Senior Secured Credit Facility due July 2015 (the “Previous Revolver”) to provide a variable rate Senior Secured Credit Facility due October 3, 2017 (the “TRP Revolver”). The TRP Revolver increased available commitments to $1.2
billion from $1.1
billion and allows the Partnership to request up to an additional $300.0
million in commitment increases.
The Partnership incurred a $1.7 million loss related to a partial write-off of debt issue costs associated with the Previous Revolver as a result of a change in syndicate members under the new TRP Revolver. The remaining deferred debt issue costs along with the issue costs associated with the October 2012 amendment are amortized on a straight-line basis over the life of the TRP Revolver.
The TRP Revolver bears interest, at the Partnership’s option, either at the base rate or the Eurodollar rate. The base rate is equal to the highest of: (i) Bank of America’s prime rate; (ii) the federal funds rate plus 0.5%; or (iii) the one-month LIBOR rate plus 1.0%, plus an applicable margin ranging from 0.75% to 1.75%. The Eurodollar rate is equal to LIBOR plus an applicable margin ranging from 1.75% to 2.75%.
The Partnership is required to pay a commitment fee equal to an applicable rate ranging from 0.3% to 0.5% times the actual daily average unused portion of the TRP Revolver. Additionally, issued and undrawn letters of credit bear interest at an applicable ranging from 1.75% to 2.75%.
The TRP Revolver is collateralized by a majority of the Partnership’s assets. Borrowings are guaranteed by the Partnership’s restricted subsidiaries.
The TRP Revolver restricts the Partnership’s ability to make distributions of available cash to unitholders if a default or an event of default (as defined in the TRP Revolver) exists or would result from such distribution. The TRP Revolver requires the Partnership to maintain a ratio of consolidated funded indebtedness to consolidated adjusted EBITDA of no more than 5.50 to 1.00. The TRP Revolver also requires the Partnership to maintain a ratio of consolidated EBITDA to consolidated interest expense of no less than 2.25 to 1.00. In addition, the TRP Revolver contains various covenants that may limit, among other things, the Partnership’s ability to incur indebtedness, grant liens, make investments, repay or amend the terms of certain other indebtedness, merge or consolidate, sell assets, and engage in transactions with affiliates (in each case, subject to the Partnership’s right to incur indebtedness or grant liens in connection with, and convey accounts receivable as part of, a permitted receivables financing).
The Partnership’s Senior Unsecured Notes
In February 2011, the Partnership exchanged $158.6 million principal amount of its 6⅞% Notes plus payments of $28.6 million, including $0.9 million of accrued interest, for $158.6 million aggregate principal amount of its 11¼% Notes. The holders of the exchanged Notes are subject to the provisions of the 6⅞% Notes described below. The debt covenants related to the remaining $72.7 million of face value of the 11¼% Notes were removed. This exchange was accounted for as a debt modification whereby the financial effects of the exchange will be recognized over the term of the new debt issue.
In January 2012, the Partnership privately placed $400.0 million in aggregate principal amount of its 6⅜% Notes, resulting in approximately $395.5 million of net proceeds, which were used to reduce borrowings under the TRP Revolver and for general partnership purposes.
In October 2012, $400.0 million in aggregate principal amount of 5¼% Notes were issued by the Partnership at 99.5% of the face amount, resulting in gross proceeds of $398.0 million. An additional $200.0 million in aggregate principal amount of 5¼% Notes were issued in December 2012 at 101.0% of the face amount, resulting in gross proceeds of $202.0 million. Both issuances are treated as a single class of debt securities and have identical terms.
In November 2012, the Partnership redeemed all of the outstanding 8¼% Notes at a redemption price of 104.125% plus accrued interest through the redemption date. The redemption resulted in a premium paid on the redemption of $8.6 million, which is included as a cash outflow from financing activities in the Consolidated Statement of Cash Flows, and a write off of $2.5 million of unamortized debt issue costs.
In May 2013, the Partnership privately placed $625.0 million in aggregate principal amount of 4¼% Senior Notes. The 4¼% Notes resulted in approximately $618.1 million of net proceeds, which were used to reduce borrowings under the TRP Revolver and for general partnership purposes.
In June 2013, the Partnership paid $106.4 million plus accrued interest, which included a premium of $6.4 million, to redeem $100.0 million of the outstanding 6⅜% Notes. The redemption resulted in a $7.4 million loss on debt redemption, including the write-off of $1.0 million of unamortized debt issue costs.
In July 2013, the Partnership paid $76.8 million plus accrued interest, which included a premium of $4.1 million, per the terms of the note agreement to redeem the outstanding balance of the 11¼% Notes. The redemption resulted in a $7.4 million loss on debt redemption in the third quarter 2013, including the write-off of $1.0 million of unamortized debt issue costs.
The terms of the senior unsecured notes outstanding as of December 31, 2013 were as follows:
|
Note Issue
|
|
Issue Date
|
|
Per Annum Interest Rate
|
|
Due Date
|
|
Dates Interest Paid
|
|
"7
⅞
% Notes"
|
|
August 2010
|
|
7
⅞
%
|
|
October 15, 2018
|
|
April & October 15
th
|
|
"6
⅞
% Notes"
|
|
February 2011
|
|
6
⅞
%
|
|
February 1, 2021
|
|
February & August 1
st
|
|
"6
⅜
% Notes"
|
|
January 2012
|
|
6
⅜
%
|
|
August 1, 2022
|
|
February & August 1
st
|
|
"5
¼
% Notes"
|
|
Oct / Dec 2012
|
|
5
¼
%
|
|
May 1, 2023
|
|
May & November 1
st
|
|
"4¼% Notes"
|
|
May 2013
|
|
4¼%
|
|
November 15, 2023
|
|
May & November 15
th
|
All issues of unsecured senior notes are obligations that rank pari passu in right of payment with existing and future senior indebtedness, including indebtedness under the Partnership’s TRP Revolver. They are senior in right of payment to any of our future subordinated indebtedness and are unconditionally guaranteed by the Partnership and the Partnership’s restricted subsidiaries. These notes are effectively subordinated to all secured indebtedness under the Partnership’s TRP Revolver, which is secured by substantially all of the Partnership’s assets and the Partnership’s Securitization Facility, which is secured by accounts receivable pledged under the facility, to the extent of the value of the collateral securing that indebtedness. Interest on all issues of senior unsecured notes is payable semi-annually in arrears.
The Partnership’s senior unsecured notes and associated indenture agreements restrict the Partnership’s ability to make distributions to unitholders in the event of default (as defined in the indentures). The indentures also restrict the Partnership’s ability and the ability of certain of its subsidiaries to: (i) incur additional debt or enter into sale and leaseback transactions; (ii) pay certain distributions on or repurchase equity interests (only if such distributions do not meet specified conditions); (iii) make certain investments; (iv) incur liens; (v) enter into transactions with affiliates; (vi) merge or consolidate with another company; and (vii) transfer and sell assets. These covenants are subject to a number of important exceptions and qualifications. If at any time when the notes are rated investment grade by both Moody’s Investors Service, Inc. and Standard & Poor’s Corporation and no Default or Event of Default (each as defined in the indentures) has occurred and is continuing, many of such covenants will terminate and the Partnership and its subsidiaries will cease to be subject to such covenants.
The Partnership may redeem up to 35% of the aggregate principal amount of Notes at the redemption dates and prices set forth below (expressed as percentages of principal amounts) plus accrued and unpaid interest and liquidation damages, if any, with the net cash proceeds of one or more equity offerings, provided that: (i) at least 65% of the aggregate principal amount of each of the notes (excluding notes held by us) remains outstanding immediately after the occurrence of such redemption; and (ii) the redemption occurs within 90 days (180 days for the 6⅜% Notes, 5¼% Notes and 4¼% Notes) of the date of the closing of such equity offering.
|
Note Issue
|
|
Any Date Prior To
|
|
Price
|
|
7⅞% Notes
|
|
October 15, 2013
|
|
107.875%
|
|
6⅞% Notes
|
|
February 1, 2014
|
|
106.875%
|
|
6⅜% Notes
|
|
February 1, 2015
|
|
106.375%
|
|
5¼% Notes
|
|
November 1, 2015
|
|
105.250%
|
|
4¼% Notes
|
|
May 15, 2016
|
|
104.250%
|
The Partnership may also redeem all or part of each of the series of notes on or after the redemption dates set forth below at the price for each respective year (expressed as percentages of principal amount) plus accrued and unpaid interest and liquidation damages, if any, on the notes redeemed.
|
7
⅞
% Notes
|
6
⅞
% Notes
|
6
⅜
% Notes
|
5
¼
% Notes
|
4
¼
% Notes
|
||||||||||||||||||||||||||||||||
|
Redemption Date:
|
Redemption Date:
|
Redemption Date:
|
Redemption Date:
|
Redemption Date:
|
||||||||||||||||||||||||||||||||
|
October 15
|
February 1
|
February 1
|
November 1
|
May 15
|
||||||||||||||||||||||||||||||||
|
Year
|
Price
|
Year
|
Price
|
Year
|
Price
|
Year
|
Price
|
Year
|
Price
|
|||||||||||||||||||||||||||
|
2014
|
103.938
|
%
|
2016
|
103.438
|
%
|
2017
|
103.188
|
%
|
2017
|
102.625
|
%
|
2018
|
102.125
|
%
|
||||||||||||||||||||||
|
2015
|
101.969
|
%
|
2017
|
102.292
|
%
|
2018
|
102.125
|
%
|
2018
|
101.750
|
%
|
2019
|
101.417
|
%
|
||||||||||||||||||||||
|
2016 and thereafter
|
100
|
%
|
2018
|
101.146
|
%
|
2019
|
101.063
|
%
|
2019
|
100.875
|
%
|
2020
|
100.708
|
%
|
||||||||||||||||||||||
|
2019 and thereafter
|
100
|
%
|
2020 and thereafter
|
100
|
%
|
2020 and thereafter
|
100
|
%
|
2021 and thereafter
|
100
|
%
|
|||||||||||||||||||||||||
The Partnership’s Accounts Receivable Securitization Facility
In January 2013, the Partnership entered into the Securitization Facility to provide up to $200.0 million of borrowing capacity at commercial paper or LIBOR market index rates plus a margin through January 2014. Under this Securitization Facility, one of the Partnership’s consolidated subsidiaries (Targa Liquids Marketing and Trade LLC or “TLMT”) sells or contributes receivables, without recourse, to another of the Partnership’s consolidated subsidiaries (Targa Receivables LLC or “TRLLC”), a special purpose consolidated subsidiary created for the sole purpose of this Securitization Facility. TRLLC, in turn, sells an undivided percentage ownership in the eligible receivables to a third-party financial institution. Eligible TRLLC receivables up to the amount of the outstanding debt under the Securitization Facility are not available to satisfy the claims of the creditors of TLMT or the Partnership.
Any excess receivables are eligible to satisfy the claims of creditors of TLMT or the Partnership.
In December 2013, the Partnership entered into a Second Amendment to the Securitization Facility to increase the borrowing capacity to $300.0 million and extend the termination date to December 12, 2014.
The Partnership’s April 2013 Shelf
In April 2013, the Partnership filed with the SEC a universal shelf registration statement (the “April 2013 Shelf”), which provides the Partnership with the ability to offer and sell an unlimited amount of debt and equity securities, subject to market conditions and the Partnership’s capital needs. The April 2013 Shelf expires in April 2016. There was no activity under the April 2013 Shelf during the year ended December 31, 2013.
The Partnership’s July 2013 Shelf
In July 2013, the Partnership filed with the SEC a universal shelf registration statement that allows it to issue up to an aggregate of $800.0 million of debt or equity securities (the “July 2013 Shelf”). The July 2013 Shelf expires in August 2016. See Note 11 for equity issuances under the July 2013 Shelf.
Debt Re-acquisitions Summary
The debt re-acquisitions described above were reported as follows in our Consolidated Statements of Operations:
|
|
2013
|
2012
|
||||||
|
Premium over face value paid upon redemption:
|
|
|
||||||
|
Partnership 6⅜ Notes
|
$
|
6.4
|
$
|
-
|
||||
|
Partnership 8¼ Notes
|
-
|
8.6
|
||||||
|
Partnership 11¼ Notes
|
4.1
|
-
|
||||||
|
Recognition of unamortized discount
|
||||||||
|
Partnership 11¼ Notes
|
2.2
|
-
|
||||||
|
Write-off of deferred debt issue cost
|
||||||||
|
Partnership 8¼ Notes
|
-
|
2.5
|
||||||
|
Partnership 6⅜ Notes
|
1.0
|
-
|
||||||
|
Partnership 11¼ Notes
|
1.0
|
-
|
||||||
|
TRC Holdco Notes
|
-
|
0.3
|
||||||
|
Partial write-off of deferred debt issue cost related to amendments:
|
||||||||
|
TRP Revolver
|
-
|
1.7
|
||||||
|
TRC Revolver
|
-
|
0.2
|
||||||
|
Gain on acquisition of TRC Holdco Notes
|
-
|
(0.5
|
)
|
|||||
|
Loss on debt redemptions and amendments
|
$
|
14.7
|
$
|
12.8
|
||||
Note 11 — Partnership Units and Related Matters
In accordance with the Partnership agreement, the Partnership must distribute all of its available cash, as determined by us as the general partner, to unitholders of record within 45 days after the end of each quarter.
Public Offerings of Common Units
In 2010, the Partnership filed with the SEC a universal shelf registration statement (the “2010 Shelf”), which provides the Partnership with the ability to offer and sell an unlimited amount of debt and equity securities, subject to market conditions and the Partnership’s capital needs. The 2010 Shelf expired in April 2013. The following transactions were completed under the 2010 Shelf:
| · | August 2010 – 7,475,000 common units (including underwriters’ overallotment option) at a price of $24.80 per common unit, providing net proceeds of $177.8 million. We contributed $3.8 million to maintain our 2% general partner interest. The Partnership used the net proceeds from this offering to reduce borrowings under its Previous Revolver. |
| · | January 2011 – 9,200,000 common units (including underwriters’ overallotment option) at a price of $33.67 per common unit, providing net proceeds of $298.0 million. We contributed $6.3 million to maintain our 2% general partner interest. The Partnership used the net proceeds from the offering for general partnership purposes, which included reducing borrowings under its Previous Revolver. |
| · | January 2012 – 4,405,000 common units (including underwriters’ overallotment option) at a price of $38.30 per common unit, providing net proceeds of $164.8 million. As part of this offering, we purchased 1,300,000 common units with an aggregate value of $49.8 million. We contributed $3.5 million to maintain our 2% general partner interest. The Partnership used the net proceeds from this offering for general partnership purposes, including the repayment of indebtedness. |
| · | November 2012 – 10,925,000 common units (including underwriters’ overallotment option) at a price of $36.00 per common unit, providing net proceeds of $378.2 million. We contributed $8.0 million to maintain our 2% general partner interest. The Partnership used the net proceeds from this offering to fund a portion of the $975.8 million purchase price of the Badlands acquisition. |
In July 2012, the Partnership filed with the SEC a universal shelf registration statement that, subject to effectiveness at the time of use, allows the Partnership to issue up to an aggregate of $300.0 million of debt or equity securities (the “2012 Shelf”). The 2012 Shelf expires in August 2015.
In August 2012, the Partnership entered into an Equity Distribution Agreement (the “2012 EDA”) with Citigroup Global Markets Inc. (“Citigroup”) pursuant to which the Partnership may sell, at its option, up to an aggregate of $100.0 million of its common units through Citigroup, as sales agent, under the 2012 Shelf. Settlement for sales of common units occurs on the third business day following the date on which any sales were made. During the year ended December 31, 2013,
the Partnership issued 2,420,046 common units under the 2012 EDA, receiving net proceeds of $94.8 million. We contributed $2.0 million to maintain our 2% general partner interest.
In March 2013, the Partnership entered into a second Equity Distribution Agreement under the 2012 Shelf (the “March 2013 EDA”) with Citigroup, Deutsche Bank Securities Inc. (“Deutsche Bank”), Raymond James & Associates, Inc. (“Raymond James”) and UBS Securities LLC (“UBS”), as sales agents,
pursuant to which the Partnership may sell, at its option, up to an aggregate of $200.0 million of the Partnership common units. During the
year ended December 31
, 2013, the Partnership issued 4,204,751 common units, receiving net proceeds of $197.5 million. We contributed $4.1 million to maintain our 2% general partner interest.
In August 2013, the Partnership entered into an Equity Distribution Agreement under the July 2013 Shelf (the “August 2013 EDA”) with Citigroup, Deutsche Bank, Morgan Stanley & Co. LLC, Raymond James, RBC Capital Markets, LLC, UBS and Wells Fargo Securities, LLC, as its sales agents, pursuant to which the Partnership may sell, at its option, up to an aggregate of $400.0 million of the Partnership’s common units. During the year ended 2013,
the Partnership issued 4,529,641 common units under the August 2013 EDA, receiving net proceeds of $225.6 million. We contributed $4.7
million to the Partnership to maintain our 2% general partner interest.
Subsequent Event
In January 2014, the Partnership issued 1,118,147 common units and received net proceeds of $56.2 million, pursuant to the August 2013 EDA. We contributed $1.2 million to maintain our 2% general partner interest.
Distributions
In accordance with the Partnership Agreement, the Partnership must distribute all of its available cash, as determined by the general partner, to unitholders of record within 45 days after the end of each quarter.
The following table details the distributions declared and/or paid by the Partnership for the years presented.
|
|
|
Distributions
|
|
|
||||||||||||||||||||||
|
Three Months
Ended
|
Date Paid or to be
Paid
|
Limited Partners
|
General Partner
|
|
Distributions to Targa Resources Corp.
|
Distributions per limited partner unit
|
||||||||||||||||||||
|
Common
|
Incentive
|
2%
|
Total
|
|||||||||||||||||||||||
|
(In millions, except per unit amounts)
|
||||||||||||||||||||||||||
|
2013
|
|
|
|
|
|
|
||||||||||||||||||||
|
December 31, 2013
|
February 14, 2014
|
$
|
84.0
|
$
|
29.5
|
$
|
2.3
|
$
|
115.8
|
$
|
41.5
|
$
|
0.7475
|
|||||||||||||
|
September 30, 2013
|
November 14, 2013
|
79.4
|
26.9
|
2.2
|
108.5
|
38.6
|
0.7325
|
|||||||||||||||||||
|
June 30, 2013
|
August 14, 2013
|
75.8
|
24.6
|
2.0
|
102.4
|
35.9
|
0.7150
|
|||||||||||||||||||
|
March 31, 2013
|
May 15, 2013
|
71.7
|
22.1
|
1.9
|
95.7
|
33.0
|
0.6975
|
|||||||||||||||||||
|
|
|
|||||||||||||||||||||||||
|
2012
|
|
|||||||||||||||||||||||||
|
December 31, 2012
|
February 14, 2013
|
$
|
69.0
|
$
|
20.1
|
$
|
1.8
|
$
|
90.9
|
$
|
30.7
|
$
|
0.6800
|
|||||||||||||
|
September 30, 2012
|
November 14, 2012
|
59.1
|
16.1
|
1.5
|
76.7
|
26.2
|
0.6625
|
|||||||||||||||||||
|
June 30, 2012
|
August 14, 2012
|
57.3
|
14.4
|
1.5
|
73.2
|
24.2
|
0.6425
|
|||||||||||||||||||
|
March 31, 2012
|
May 15, 2012
|
55.5
|
12.7
|
1.4
|
69.6
|
22.2
|
0.6225
|
|||||||||||||||||||
|
|
|
|||||||||||||||||||||||||
|
2011
|
|
|||||||||||||||||||||||||
|
December 31, 2011
|
February 14, 2012
|
$
|
53.7
|
$
|
11.0
|
$
|
1.3
|
$
|
66.0
|
$
|
20.1
|
$
|
0.6025
|
|||||||||||||
|
September 30, 2011
|
November 14, 2011
|
49.4
|
8.8
|
1.2
|
59.4
|
16.8
|
0.5825
|
|||||||||||||||||||
|
June 30, 2011
|
August 12, 2011
|
48.3
|
7.8
|
1.2
|
57.3
|
15.6
|
0.5700
|
|||||||||||||||||||
|
March 31, 2011
|
May 13, 2011
|
47.3
|
6.8
|
1.1
|
55.2
|
14.4
|
0.5575
|
|||||||||||||||||||
Note 12 — Common Stock and Related Matters
The following table details the dividends declared and/or paid
by us for the years ended December 31, 2013, 2012 and 2011:
|
Three Months
Ended
|
Date Paid or To Be
Paid
|
Total Dividend Declared
|
Amount of Dividend Paid
|
Accrued Dividends (1)
|
Dividend Declared per Share of Common Stock
|
|||||||||||||
|
(In millions, except per share amounts)
|
||||||||||||||||||
|
2013
|
|
|
|
|
|
|||||||||||||
|
December 31, 2013
|
February 18, 2014
|
$
|
25.6
|
$
|
25.5
|
$
|
0.1
|
$
|
0.60750
|
|||||||||
|
September 30, 2013
|
November 15, 2013
|
24.1
|
23.7
|
0.4
|
0.57000
|
|||||||||||||
|
June 30, 2013
|
August 15, 2013
|
22.5
|
22.1
|
0.4
|
0.53250
|
|||||||||||||
|
March 31, 2013
|
May 16, 2013
|
21.0
|
20.6
|
0.4
|
0.49500
|
|||||||||||||
|
|
|
|||||||||||||||||
|
2012
|
|
|||||||||||||||||
|
December 31, 2012
|
February 15, 2013
|
$
|
19.4
|
$
|
19.0
|
$
|
0.4
|
$
|
0.45750
|
|||||||||
|
September 30, 2012
|
November 15, 2012
|
18.0
|
17.3
|
0.7
|
0.42250
|
|||||||||||||
|
June 30, 2012
|
August 15, 2012
|
16.7
|
16.1
|
0.6
|
0.39375
|
|||||||||||||
|
March 31, 2012
|
May 16, 2012
|
15.5
|
15.0
|
0.5
|
0.36500
|
|||||||||||||
|
|
|
|||||||||||||||||
|
2011
|
|
|||||||||||||||||
|
December 31, 2011
|
February 15, 2012
|
$
|
14.3
|
$
|
13.8
|
$
|
0.5
|
$
|
0.33625
|
|||||||||
|
September 30, 2011
|
November 15, 2011
|
13.0
|
12.6
|
0.4
|
0.30750
|
|||||||||||||
|
June 30, 2011
|
August 16, 2011
|
12.3
|
11.9
|
0.4
|
0.29000
|
|||||||||||||
|
March 31, 2011
|
May 13, 2011
|
11.6
|
11.2
|
0.4
|
0.27250
|
|||||||||||||
| (1) | Represents accrued dividends on restricted stock and restricted stock units that are payable upon vesting. |
Note 13 — Earnings per Common Share
Basic earnings per share are computed using the weighted average number of common shares outstanding during the period. Diluted earnings per share are computed using weighted average shares outstanding during the period, incorporated with the dilutive effect of restricted stock awards and stock options. The dilutive effect was determined through the application of the treasury method.
The following table sets forth a reconciliation of net income and weighted average shares outstanding used in computing basic and diluted net income per common share:
|
|
2013
|
2012
|
2011
|
|||||||||
|
Net income
|
$
|
201.3
|
$
|
159.3
|
$
|
215.4
|
||||||
|
Less: Net income attributable to noncontrolling interests
|
136.2
|
121.2
|
184.7
|
|||||||||
|
Net income attributable to common shareholders
|
$
|
65.1
|
$
|
38.1
|
$
|
30.7
|
||||||
|
|
||||||||||||
|
Weighted average shares outstanding - basic
|
41.6
|
41.0
|
41.0
|
|||||||||
|
|
||||||||||||
|
Net income available per common share - basic
|
$
|
1.56
|
$
|
0.93
|
$
|
0.75
|
||||||
|
|
||||||||||||
|
Weighted average shares outstanding
|
41.6
|
41.0
|
41.0
|
|||||||||
|
Dilutive effect of unvested stock awards
|
0.5
|
0.8
|
0.4
|
|||||||||
|
Weighted average shares outstanding - diluted
|
42.1
|
41.8
|
41.4
|
|||||||||
|
|
||||||||||||
|
Net income available per common share - diluted
|
$
|
1.55
|
$
|
0.91
|
$
|
0.74
|
||||||
Note 14 — Derivative Instruments and Hedging Activities
Partnership Commodity Hedges
The primary purpose of the Partnership’s commodity risk management activities is to manage its exposure to commodity price risk and reduce volatility in its operating cash flow due to fluctuations in commodity prices. The Partnership has hedged the commodity prices associated with a portion of its expected (i) natural gas equity volumes in Field Gathering and Processing operations and (ii) NGL and condensate equity volumes predominately in the Field Gathering and Processing segment and the LOU business unit in the Coastal Gathering and Processing segment that result from its percent-of-proceeds processing arrangements. These hedge positions will move favorably in periods of falling prices and unfavorably in periods of rising prices. The Partnership has designated these derivative contracts as cash flow hedges for accounting purposes.
The hedges generally match the NGL product composition and the NGL and natural gas delivery points to those of the Partnership’s physical equity volumes. The NGL hedges may be transacted as specific NGL hedges or as baskets of ethane, propane, normal butane, isobutane and natural gasoline based upon the Partnership’s expected equity NGL composition. We believe this approach avoids uncorrelated risks resulting from employing hedges on crude oil or other petroleum products as “proxy” hedges of NGL prices. The Partnership’s natural gas and NGL hedges are settled using published index prices for delivery at various locations, which closely approximate the Partnership’s actual natural gas and NGL delivery points.
The Partnership hedges a portion of its condensate sales using crude oil hedges that are based on the New York Mercantile Exchange (“NYMEX”) futures contracts for West Texas Intermediate light, sweet crude, which approximates the prices received for condensate. This necessarily exposes the Partnership to a market differential risk if the NYMEX futures do not move in exact parity with the sales price of its underlying condensate equity volumes.
At December 31, 2013, the notional volumes of the Partnership’s commodity hedges for equity volumes were:
|
Commodity
|
|
Instrument
|
|
Unit
|
|
|
2014
|
|
2015
|
|
2016
|
|
Natural Gas
|
|
Swaps
|
|
MMBtu/d
|
|
|
48,050
|
|
34,551
|
|
25,500
|
|
NGL
|
|
Swaps
|
|
Bbl/d
|
|
|
1,125
|
|
-
|
|
-
|
|
Condensate
|
|
Swaps
|
|
Bbl/d
|
|
|
2,450
|
|
-
|
|
-
|
The Partnership also enters into derivative instruments to help manage other short-term commodity-related business risks. The Partnership has not designated these derivatives as hedges, and records changes in fair value and cash settlements to revenues.
The Partnership’s derivative contracts are subject to netting arrangements that allow net cash settlement of offsetting asset and liability positions with the same counterparty. We record derivative assets and liabilities on our Consolidated Balance Sheets on a gross basis, without considering the effect of master netting arrangements. The following schedules reflect the fair values of our derivative instruments and their location in our Consolidated Balance Sheets as well as pro forma reporting assuming that we reported derivatives subject to master netting agreements on a net basis:
|
|
Fair Value as of December 31, 2013
|
Fair Value as of December 31, 2012
|
|||||||||||||||
|
Balance Sheet
|
Derivative
|
Derivative
|
Derivative
|
Derivative
|
|||||||||||||
|
Location
|
Assets
|
Liabilities
|
Assets
|
Liabilities
|
|||||||||||||
|
Derivatives designated as hedging instruments
|
|
|
|
|
|||||||||||||
|
Commodity contracts
|
Current
|
$
|
2.0
|
$
|
(7.7
|
)
|
$
|
29.2
|
$
|
(7.2
|
)
|
||||||
|
Long-term
|
3.1
|
(1.4
|
)
|
5.1
|
(4.8
|
)
|
|||||||||||
|
Total derivatives designated as hedging instruments
|
$
|
5.1
|
$
|
(9.1
|
)
|
$
|
34.3
|
$
|
(12.0
|
)
|
|||||||
|
|
|||||||||||||||||
|
Derivatives not designated as hedging instruments
|
|||||||||||||||||
|
Commodity contracts
|
Current
|
$
|
-
|
$
|
(0.3
|
)
|
$
|
0.1
|
$
|
(0.2
|
)
|
||||||
|
Total derivatives not designated as hedging instruments
|
$
|
-
|
$
|
(0.3
|
)
|
$
|
0.1
|
$
|
(0.2
|
)
|
|||||||
|
|
|||||||||||||||||
|
Total current position
|
$
|
2.0
|
$
|
(8.0
|
)
|
$
|
29.3
|
$
|
(7.4
|
)
|
|||||||
|
Total long-term position
|
3.1
|
(1.4
|
)
|
5.1
|
(4.8
|
)
|
|||||||||||
|
Total derivatives
|
$
|
5.1
|
$
|
(9.4
|
)
|
$
|
34.4
|
$
|
(12.2
|
)
|
|||||||
|
|
|||||||||||||||||
|
The pro forma impact of reporting derivatives in the Consolidated Balance Sheet is as follows:
|
||||||||||||||||
|
|
|
|
|
|
||||||||||||
|
|
Gross Presentation
|
Pro forma Net Presentation
|
||||||||||||||
|
|
Asset
|
Liability
|
Asset
|
Liability
|
||||||||||||
|
December 31, 2013
|
Position
|
Position
|
Position
|
Position
|
||||||||||||
|
Current position
|
|
|
|
|
||||||||||||
|
Counterparties with offsetting position
|
$
|
1.9
|
$
|
(4.4
|
)
|
$
|
-
|
$
|
(2.5
|
)
|
||||||
|
Counterparties without offsetting position - assets
|
0.1
|
-
|
0.1
|
-
|
||||||||||||
|
Counterparties without offsetting position - liabilities
|
-
|
(3.6
|
)
|
-
|
(3.6
|
)
|
||||||||||
|
|
2.0
|
(8.0
|
)
|
0.1
|
(6.1
|
)
|
||||||||||
|
Long-term position
|
||||||||||||||||
|
Counterparties with offsetting position
|
0.7
|
(1.2
|
)
|
-
|
(0.5
|
)
|
||||||||||
|
Counterparties without offsetting position - assets
|
2.4
|
-
|
2.4
|
-
|
||||||||||||
|
Counterparties without offsetting position - liabilities
|
-
|
(0.2
|
)
|
-
|
(0.2
|
)
|
||||||||||
|
|
3.1
|
(1.4
|
)
|
2.4
|
(0.7
|
)
|
||||||||||
|
Total derivatives
|
||||||||||||||||
|
Counterparties with offsetting position
|
2.6
|
(5.6
|
)
|
-
|
(3.0
|
)
|
||||||||||
|
Counterparties without offsetting position - assets
|
2.5
|
-
|
2.5
|
-
|
||||||||||||
|
Counterparties without offsetting position - liabilities
|
-
|
(3.8
|
)
|
-
|
(3.8
|
)
|
||||||||||
|
|
$
|
5.1
|
$
|
(9.4
|
)
|
$
|
2.5
|
$
|
(6.8
|
)
|
||||||
|
|
||||||||||||||||
|
December 31, 2012
|
||||||||||||||||
|
Current position
|
||||||||||||||||
|
Counterparties with offsetting position
|
$
|
23.8
|
$
|
(7.4
|
)
|
$
|
16.4
|
$
|
-
|
|||||||
|
Counterparties without offsetting position - assets
|
5.5
|
-
|
5.5
|
-
|
||||||||||||
|
Counterparties without offsetting position - liabilities
|
-
|
-
|
-
|
-
|
||||||||||||
|
|
29.3
|
(7.4
|
)
|
21.9
|
-
|
|||||||||||
|
Long-term position
|
||||||||||||||||
|
Counterparties with offsetting position
|
4.4
|
(2.8
|
)
|
1.6
|
-
|
|||||||||||
|
Counterparties without offsetting position - assets
|
0.7
|
-
|
0.7
|
-
|
||||||||||||
|
Counterparties without offsetting position - liabilities
|
-
|
(2.0
|
)
|
-
|
(2.0
|
)
|
||||||||||
|
|
5.1
|
(4.8
|
)
|
2.3
|
(2.0
|
)
|
||||||||||
|
Total derivatives
|
||||||||||||||||
|
Counterparties with offsetting position
|
28.2
|
(10.2
|
)
|
18.0
|
-
|
|||||||||||
|
Counterparties without offsetting position - assets
|
6.2
|
-
|
6.2
|
-
|
||||||||||||
|
Counterparties without offsetting position - liabilities
|
-
|
(2.0
|
)
|
-
|
(2.0
|
)
|
||||||||||
|
|
$
|
34.4
|
$
|
(12.2
|
)
|
$
|
24.2
|
$
|
(2.0
|
)
|
||||||
The fair value of the Partnership’s derivative instruments, depending on the type of instrument, was determined by the use of present value methods or standard option valuation models with assumptions about commodity prices based on those observed in underlying markets.
The estimated fair value of the Partnership’s derivative instruments was a net liability of $4.3 million as of December 31, 2013. The estimated fair value is net of an adjustment for credit risk based on the default probabilities by year as indicated by market quotes for the counterparties’ credit default swap rates. The credit risk adjustment was immaterial for all periods presented.
The Partnership’s payment obligations in connection with substantially all of these hedging transactions are secured by a first priority lien in the collateral securing its senior secured indebtedness that ranks equal in right of payment with liens granted in favor of its senior secured lenders.
The following tables reflect amounts recorded in OCI and amounts reclassified from OCI to revenue and expense for the periods indicated:
|
Derivatives in Cash Flow
|
Gain (Loss) Recognized in OCI on
Derivatives (Effective Portion)
|
|||||||||||
|
Hedging Relationships
|
2013
|
2012
|
2011
|
|||||||||
|
Interest rate contracts
|
$
|
-
|
$
|
-
|
$
|
(4.3
|
)
|
|||||
|
Commodity contracts
|
$
|
(5.8
|
)
|
$
|
76.8
|
$
|
(33.6
|
)
|
||||
|
|
$
|
(5.8
|
)
|
$
|
76.8
|
$
|
(37.9
|
)
|
||||
|
|
Gain (Loss) Reclassified from OCI into
Income (Effective Portion)
|
|||||||||||
|
Location of Gain (Loss)
|
2013
|
2012
|
2011
|
|||||||||
|
Interest expense, net
|
$
|
(6.1
|
)
|
$
|
(7.9
|
)
|
$
|
(8.1
|
)
|
|||
|
Revenues
|
21.0
|
46.0
|
(30.3
|
)
|
||||||||
|
|
$
|
14.9
|
$
|
38.1
|
$
|
(38.4
|
)
|
|||||
Hedge ineffectiveness was immaterial for all periods presented.
Our consolidated earnings are also affected by the Partnership’s use of the mark-to-market method of accounting for derivative instruments that do not qualify for hedge accounting or that have not been designated as hedges. The changes in fair value of these instruments are recorded on the balance sheet and through earnings (i.e., using the “mark-to-market” method) rather than being deferred until the anticipated transaction settles. The use of mark-to-market accounting for financial instruments can cause non-cash earnings volatility due to changes in the underlying commodity price indices. Gain (loss) recognized on commodity derivatives not designated as hedging instruments was immaterial for all periods presented.
|
Gain (Loss) Recognized in Income on Derivatives
|
||||||||||||||
|
Derivatives Not Designated as
Hedging Instruments
|
Location of Gain Recognized in
Income on Derivatives
|
2013
|
2012
|
2011
|
||||||||||
|
Commodity contracts
|
Revenue
|
$
|
(0.1
|
)
|
$
|
0.7
|
$
|
1.7
|
||||||
|
Interest rate swaps
|
Other income (expense)
|
-
|
-
|
(5.0
|
)
|
|||||||||
The following table shows the deferred gains (losses) included in accumulated OCI that will be reclassified into earnings through the end of 2016:
|
|
December 31, 2013
|
December 31, 2012
|
||||||
|
Commodity hedges, before tax
|
$
|
(0.5
|
)
|
$
|
3.2
|
|||
|
Commodity hedges, after tax
|
(0.3
|
)
|
1.9
|
|||||
|
Interest rate hedges, before tax
|
(0.3
|
)
|
(1.2
|
)
|
||||
|
Interest rate hedges, after tax
|
(0.2
|
)
|
(0.7
|
)
|
||||
As of December 31, 2013, net losses of
$5.6 million
on commodity hedges and net losses of
$2.4 million
on terminated interest rate swaps recorded in OCI are expected to be reclassified to revenue and interest expense during the next twelve months.
See Note 15 for additional disclosures related to derivative instruments and hedging activities.
Note 15 — Fair Value Measurements
Under GAAP, our Consolidated Balance Sheets reflect a mixture of measurement methods for financial assets and liabilities (“financial instruments”). Derivative financial instruments are reported at fair value in our consolidated balance sheet. Other financial instruments are reported at historical cost or amortized cost in our consolidated balance sheet, with fair value measurements for these instruments provided as supplemental information.
The following are additional qualitative and quantitative disclosures regarding fair value measurements of financial instruments.
Fair Value of Derivative Financial Instruments
The Partnership’s derivative instruments consist of financially settled commodity swaps and option contracts and fixed price commodity contracts with certain counterparties. The Partnership determines the fair value of its derivative contracts using a discounted cash flow model for swaps and a standard option pricing-model for options, based on inputs that are readily available in public markets. The Partnership has consistently applied these valuation techniques in all periods presented and we believe the Partnership has obtained the most accurate information available for the types of derivative contracts the Partnership holds.
The fair values of the Partnership’s derivative instruments, which aggregate to a net liability position of $4.3 million as of December 31, 2013, are sensitive to changes in forward pricing on natural gas, NGLs and crude oil. This liability position reflects the present value, adjusted for counterparty credit risk, of the amount the Partnership expects to receive in the future on its derivative contracts. If forward pricing on natural gas, NGLs and crude oil were to increase by 10%, the result would be a fair value reflecting a net liability of $29.9 million, ignoring an adjustment for counterparty credit risk. If forward pricing on natural gas, NGLs and crude oil were to decrease by 10%, the result would be a fair value reflecting a net asset of $21.3 million, ignoring an adjustment for counterparty credit risk.
Fair Value of Other Financial Instruments
The contingent consideration obligation related to the Partnership’s Badlands acquisition is reported at fair value. Due to their cash or near-cash nature, the carrying value of other financial instruments included in working capital (i.e., cash and cash equivalents, accounts receivable, accounts payable) approximates their fair value. As such, long-term debt is primarily the other financial instrument for which our carrying value could vary significantly from fair value. We determined the supplemental fair value disclosures for our long-term debt as follows:
| • | Senior secured revolving credit facilities and the Partnership’s Securitization Facility are based on carrying value which approximates fair value as its interest rate is based on prevailing market rates; and |
| • | Senior unsecured notes are based on quoted market prices derived from trades of the debt. |
Fair Value Hierarchy
We categorize the inputs to the fair value measurements using a three-tier fair value hierarchy that prioritizes the significant inputs used in measuring fair value:
| • | Level 1 – observable inputs such as quoted prices in active markets; |
| • | Level 2 – inputs other than quoted prices in active markets that we can directly or indirectly observe to the extent that the markets are liquid for the relevant settlement periods; and |
| • | Level 3 – unobservable inputs in which little or no market data exists, therefore we must develop our own assumptions. |
The following table shows a breakdown by fair value hierarchy category for (1) financial instruments measurements included in our Consolidated Balance Sheets at fair value and (2) supplemental fair value disclosures for other financial instruments:
|
|
December 31, 2013
|
|||||||||||||||||||
|
|
Fair Value
|
|||||||||||||||||||
|
Carrying Value
|
Total
|
Level 1
|
Level 2
|
Level 3
|
||||||||||||||||
|
Financial Instruments Recorded on Our Consolidated Balance Sheet at Fair Value:
|
|
|
|
|
||||||||||||||||
|
Assets from commodity derivative contracts
|
$
|
5.1
|
$ |
5.1
|
$
|
-
|
$
|
3.4
|
$
|
1.7
|
||||||||||
|
Liabilities from commodity derivative contracts
|
9.4
|
9.4
|
-
|
8.4
|
1.0
|
|||||||||||||||
|
Badlands contingent consideration liability
|
-
|
-
|
-
|
-
|
-
|
|||||||||||||||
|
Financial Instruments Recorded on Our Consolidated Balance Sheet at Carrying Value:
|
||||||||||||||||||||
|
Cash and cash equivalents
|
66.7
|
66.7
|
-
|
-
|
-
|
|||||||||||||||
|
TRC Senior secured revolving credit facility
|
84.0
|
84.0
|
-
|
84.0
|
-
|
|||||||||||||||
|
Partnership's Senior secured revolving credit facility
|
395.0
|
395.0
|
-
|
395.0
|
-
|
|||||||||||||||
|
Partnership's Senior unsecured notes
|
2,230.6
|
2,253.5
|
-
|
2,253.5
|
-
|
|||||||||||||||
|
Partnership's accounts receivable securitization facility
|
279.7
|
279.7
|
-
|
279.7
|
-
|
|||||||||||||||
|
|
December 31, 2012
|
|||||||||||||||||||
|
|
Fair Value
|
|||||||||||||||||||
| Carrying Value |
Total
|
Level 1
|
Level 2
|
Level 3
|
||||||||||||||||
|
Financial Instruments Recorded on Our Consolidated Balance Sheet at Fair Value:
|
||||||||||||||||||||
|
Assets from commodity derivative contracts
|
$
|
34.4
|
$
|
34.4
|
$
|
-
|
$
|
34.4
|
$
|
-
|
||||||||||
|
Liabilities from commodity derivative contracts
|
12.2
|
12.2
|
-
|
11.6
|
0.6
|
|||||||||||||||
|
Badlands contingent consideration liability
|
15.3
|
15.3
|
-
|
-
|
15.3
|
|||||||||||||||
|
Financial Instruments Recorded on Our Consolidated Balance Sheet at Carrying Value:
|
||||||||||||||||||||
|
Cash and cash equivalents
|
76.3
|
76.3
|
-
|
-
|
-
|
|||||||||||||||
|
TRC Senior secured revolving credit facility
|
82.0
|
82.0
|
-
|
82.0
|
-
|
|||||||||||||||
|
Partnership's Senior secured revolving credit facility
|
620.0
|
620.0
|
-
|
620.0
|
-
|
|||||||||||||||
|
Partnership's Senior unsecured notes
|
1,773.3
|
1,945.2
|
-
|
1,945.2
|
-
|
|||||||||||||||
Additional Information Regarding Level 3 Fair Value Measurements Included in Our Consolidated Balance Sheets
As of December 31, 2013, we reported certain of the Partnership’s natural gas basis swaps at fair value using Level 3 inputs due to such derivatives not having observable market prices for substantially the full term of the derivative asset or liability. For valuations that include both observable and unobservable inputs, if the unobservable input is determined to be significant to the overall inputs, the entire valuation is categorized in Level 3. This includes derivatives valued using indicative price quotations whose contract length extends into unobservable periods.
The fair value of these natural gas basis swaps is determined using a discounted cash flow valuation technique based on a forward commodity basis curve. For these derivatives, the primary input to the valuation model is the forward commodity basis curve, which is based on observable or public data sources and extrapolated when observable prices are not available.
As of December 31, 2013, the Partnership had thirteen natural gas basis swaps categorized as Level 3. The significant unobservable inputs used in the fair value measurements of the Partnership’s Level 3 derivatives are the forward natural gas basis curves, for which a significant portion of the derivative’s term is beyond available forward pricing. The change in the fair value of Level 3 derivatives associated with a 10% change in the forward basis curve where prices are not observable is immaterial.
The Badlands acquisition agreement also provided for a contingent payment of $50 million conditioned on achieving stipulated crude gathering volumes by mid-2014. In 2012, the Partnership recorded a contingent consideration liability of $15.3 million as part of the purchase consideration for the Badlands acquisition (see Note 4).
The fair value of this contingent liability was determined using a probability-based model measuring the likelihood of meeting certain volumetric measures identified in the MIPSA
. These probability-based inputs are not observable; the entire valuation of the contingent consideration is categorized in Level 3. As of December 2013, the Partnership’s management does not believe that these thresholds will be achieved during the contingency period.
T
he following table summarizes the changes in fair value of our financial instruments classified as Level 3 in the fair value hierarchy:
|
|
Commodity Derivative Contracts Liability/ (Asset)
|
Long-term Debt
|
Contingent Liability
|
|||||||||
|
Balance, December 31, 2010
|
$
|
(11.6
|
)
|
$
|
86.8
|
$
|
-
|
|||||
|
Change in fair value
|
-
|
0.7
|
-
|
|||||||||
|
Settlements included in Revenue
|
3.7
|
-
|
-
|
|||||||||
|
Transfers out of Level 3
|
7.9
|
-
|
-
|
|||||||||
|
Balance, December 31, 2011
|
-
|
$
|
87.5
|
$
|
-
|
|||||||
|
Issuances
|
-
|
-
|
15.3
|
|||||||||
|
Settlements included in Revenue
|
(0.1
|
)
|
-
|
-
|
||||||||
|
Unrealized losses included in OCI
|
0.7
|
-
|
-
|
|||||||||
|
Debt extinguishment
|
-
|
(87.5
|
)
|
-
|
||||||||
|
Balance, December 31, 2012
|
0.6
|
$
|
-
|
$
|
15.3
|
|||||||
|
Settlements included in Revenue
|
(1.3
|
)
|
-
|
-
|
||||||||
|
Change in valuation of contingent liability included in Other Income
|
-
|
(15.3
|
)
|
|||||||||
|
Balance, December 31, 2013
|
$
|
(0.7
|
)
|
$
|
-
|
$
|
-
|
|||||
During 2011, we transferred $7.9 million in Partnership derivative assets out of Level 3 and into Level 2. This transfer related to long-term OTC swaps executed in 2010 for NGL products with calendar year 2013 deliveries for which pricing was extrapolated (Level 3) for some periods. As of December 31, 2011, all products had actively traded contracts through December 2013 with open interest and settlement prices. Accordingly, we were no longer required to extrapolate to value the Partnership’s derivative contracts and reclassified these instruments as Level 2.
There has been no material transfer of assets or liabilities among the three levels of the fair value hierarchy during the years ended December 31, 2013 or 2012.
Note 16 — Related Party Transactions
Transactions with Unconsolidated Affiliate
For the years 2013, 2012 and 2011, transactions with GCF included in revenues were $0.4 million, $0.1 million and $0.8 million. For the same periods, transactions with GCF included in costs and expenses were $6.3 million, $1.9 million and $0.4 million. These transactions were at market prices consistent with similar transactions with other nonaffiliated entities. The Partnership is subject to paying a deficiency fee in instances where the Partnership does not deliver its minimum volume requirements as outlined in the partnership and fractionation agreements with GCF.
Relationship with Targa Resources Partners LP
We provide general and administrative and other services to the Partnership, associated with the Partnership’s existing assets and assets acquired from third parties. The Partnership Agreement between the Partnership and us, as general partner of the Partnership, governs the reimbursement of costs incurred on the behalf of the Partnership.
The employees supporting the Partnership’s operations are employees of us. The Partnership reimburses us for the payment of certain operating expenses, including compensation and benefits of operating personnel assigned to the Partnership’s assets, and for the provision of various general and administrative services for the benefit of the Partnership. We perform centralized corporate functions for the Partnership, such as legal, accounting, treasury, insurance, risk management, health, safety and environmental, information technology, human resources, credit, payroll, internal audit, taxes, engineering and marketing. Since October 1, 2010, after the final conveyance of assets by us to the Partnership, substantially all of the Partnership’s general and administrative costs have been and will continue to be allocated to the Partnership, other than our direct costs of being a separate public reporting company.
We have reimbursed the Partnership for maintenance capital expenditures totaling $17.0 million as of December 31, 2013, which are required to be made in connection with a settlement agreement with the New Mexico Environment Department relating to air emissions at three gas processing plants operated by the Versado Gas Processors, LLC joint venture, with $0.2 million reimbursed during the year ended December 31, 2013. These capital projects are substantially complete.
Relationship with Laredo Petroleum Holdings Inc.
Peter Kagan, one of our directors of the general partner of the Partnership, is a Managing Director of Warburg Pincus LLC and is also a director of Laredo Petroleum Holdings Inc. (“Laredo”) from whom the Partnership buys natural gas and NGL products. Affiliates of Warburg Pincus LLC own a controlling interest in Laredo. Purchases from Laredo during 2013 totaled $108.6 million. These transactions were at market prices consistent with similar transactions with other nonaffiliated entities.
Note 17
—
Commitments and Contingencies
Future lease obligations are presented below in aggregate and for each of the next five fiscal years.
|
|
In Aggregate
|
2014
|
2015
|
2016
|
2017
|
2018
|
||||||||||||||||||
|
Non-Partnership obligations:
|
|
|
|
|
|
|
||||||||||||||||||
|
Operating leases (1)
|
$
|
10.3
|
$
|
2.7
|
$
|
2.7
|
$
|
2.7
|
$
|
2.2
|
$
|
-
|
||||||||||||
|
Partnership obligations:
|
||||||||||||||||||||||||
|
Operating leases (2)
|
33.9
|
8.0
|
7.8
|
7.4
|
6.1
|
4.6
|
||||||||||||||||||
|
Land site lease and right-of-way (3)
|
7.9
|
1.7
|
1.6
|
1.6
|
1.6
|
1.4
|
||||||||||||||||||
|
|
$
|
52.1
|
$
|
12.4
|
$
|
12.1
|
$
|
11.7
|
$
|
9.9
|
$
|
6.0
|
||||||||||||
|
(1)
|
Includes minimum payments on lease obligation for corporate office space.
|
|
(2)
|
Includes minimum payments on lease obligations for office space, railcars and tractors.
|
|
(3)
|
Land site lease and right-of-way provides for surface and underground access for gathering, processing and distribution assets that are located on property not owned by the Partnership. These agreements expire at various dates through 2099.
|
Total expenses on lease obligations were:
|
|
2013
|
2012
|
2011
|
|||||||||
|
Non-Partnership:
|
|
|
|
|||||||||
|
Operating leases
|
$
|
2.8
|
$
|
2.1
|
$
|
2.0
|
||||||
|
Partnership:
|
||||||||||||
|
Operating leases (1)
|
23.3
|
16.1
|
14.2
|
|||||||||
|
Land site lease and right-of-way
|
3.6
|
3.3
|
2.8
|
|||||||||
| (1) | Includes short-term leases for items such as compressors and equipment. |
Environmental
The Partnership’s environmental liabilities were not significant as of December 31, 2013.
Legal Proceedings
We are a party to various legal proceedings and/or regulatory proceedings and certain claims, suits and complaints arising in the ordinary course of business that have been filed or are pending against us. We believe all such matters are without merit or involve amounts which, if resolved unfavorably, would not have a material effect on our financial position, results of operations, or cash flows.
Note 18 – Significant Risks and Uncertainties
Our primary business objective is to increase our available cash for dividends to our stockholders by assisting the Partnership in executing its business strategy. We may facilitate the Partnership’s growth through various forms of financial support, including, but not limited to, modifying the Partnership’s IDRs, exercising the Partnership’s IDR reset provision contained in its partnership agreement, making loans, making capital contributions in exchange for yielding or non-yielding equity interests or providing other financial support to the Partnership, if needed, to support its ability to make distributions. In addition, we may acquire assets that could be candidates for acquisition by the Partnership, potentially after operational or commercial improvement or further development.
Nature of the Partnership’s Operations in Midstream Energy Industry
The Partnership operates in the midstream energy industry. Its business activities include gathering, processing, fractionating and storage of natural gas, NGLs and crude oil. The Partnership’s results of operations, cash flows and financial condition may be affected by changes in the commodity prices of these hydrocarbon products and changes in the relative price levels among these hydrocarbon products. In general, the prices of natural gas, NGLs, condensate and other hydrocarbon products are subject to fluctuations in response to changes in supply, market uncertainty and a variety of additional factors that are beyond our control.
The Partnership’s profitability could be impacted by a decline in the volume of natural gas, NGLs and condensate transported, gathered or processed at our facilities. A material decrease in natural gas or condensate production or condensate refining, as a result of depressed commodity prices, a decrease in exploration and development activities, or otherwise, could result in a decline in the volume of natural gas, NGLs and condensate handled by our facilities.
A reduction in demand for NGL products by the petrochemical, refining or heating industries, whether because of (i) general economic conditions, (ii) reduced demand by consumers for the end products made with NGL products, (iii) increased competition from petroleum-based products due to the pricing differences, (iv) adverse weather conditions, (v) government regulations affecting commodity prices and production levels of hydrocarbons or the content of motor gasoline or (vi) other reasons, could also adversely affect the Partnership’s results of operations, cash flows and financial position.
The principal market risks are exposure to changes in commodity prices, as well as changes in interest rates.
Commodity Price Risk
A majority of the revenues from the gathering and processing business are derived from percent-of-proceeds contracts under which the Partnership receives a portion of the natural gas and/or NGLs or equity volumes as payment for services. The prices of natural gas and NGLs are subject to market fluctuations in response to changes in supply, demand, market uncertainty and a variety of additional factors beyond the Partnership’s control.
In an effort to reduce the variability of our cash flows, the Partnership has hedged the commodity price associated with a significant portion of its expected natural gas equity volumes through 2016 and its NGL and condensate equity volumes through 2014 by entering into derivative financial instruments including swaps and purchased puts (or floors). The Partnership hedges a higher percentage of its expected equity volumes in the current year as compared to future years where the volume forecasting risk is greater. With swaps, the Partnership typically receives an agreed upon fixed price for a specified notional quantity of natural gas or NGLs and pays the hedge counterparty a floating price for that same quantity based upon published index prices. Since the Partnership receives from its customers substantially the same floating index price from the sale of the underlying physical commodity, these transactions are designed to effectively lock-in the agreed fixed price in advance for the volumes hedged. In order to avoid having a greater volume hedged than actual equity volumes, the Partnership typically limits its use of swaps to hedge the prices of less than its expected natural gas and NGL equity volumes. The Partnership utilizes purchased puts (or floors) to hedge additional expected equity commodity volumes without creating volumetric risk. The Partnership’s commodity hedges may expose it to the risk of financial loss in certain circumstances.
The fair value of commodity derivative instruments, depending on the type of instrument, was determined by the use of present value methods or standard option valuation models with assumptions about commodity prices based on those observed in underlying markets.
See Note 14.
Interest Rate Risk
We and the Partnership are exposed to changes in interest rates, primarily as a result of variable rate borrowings under our and the Partnership’s credit facilities.
Counterparty Risk – Credit and Concentration
Derivative Counterparty Risk
Where the Partnership is exposed to credit risk in our financial instrument transactions, management analyzes the counterparty’s financial condition prior to entering into an agreement, establishes credit and/or margin limits and monitors the appropriateness of these limits on an ongoing basis. Generally, management does not require collateral and does not anticipate nonperformance by our counterparties.
The Partnership has master netting provisions in the International Swap Dealers Association agreements with all of its derivative counterparties. These netting provisions allow the Partnership to net settle asset and liability positions with the same counterparties, and would reduce its maximum loss due to counterparty credit risk by $2.2 million as of December 31, 2013. The range of losses attributable to the Partnership’s individual counterparties would be between $1.0 million and $1.2 million, depending on the counterparty in default.
The credit exposure related to commodity derivative instruments is represented by the fair value of contracts with a net positive fair value, representing expected future receipts, at the reporting date. At such times, these outstanding instruments expose the Partnership to losses in the event of nonperformance by the counterparties to the agreements. Should the creditworthiness of one or more of the counterparties decline, the ability to mitigate nonperformance risk is limited to a counterparty agreeing to either a voluntary termination and subsequent cash settlement or a novation of the derivative contract to a third party. In the event of a counterparty default, the Partnership may sustain a loss and its cash receipts could be negatively impacted.
As of December 31, 2013, affiliates of Bank of America Merrill Lynch (“BAML”), Securities Americas LLC (“Natixis”) and Barclays PLC (“Barclays”), accounted for 37%, 26% and 24%, of the Partnership’s counterparty credit exposure related to commodity derivative instruments. BAML, Natixis and Barclays are major financial institutions that possess investment grade credit ratings based upon minimum credit ratings assigned by Moody’s Investors Service, Inc. and Standard & Poor’s Corporation.
Customer Credit Risk
We extend credit to customers and other parties in the normal course of business. We have established various procedures to manage our credit exposure, including initial credit approvals, credit limits and terms, letters of credit, and rights of offset. We also use prepayments and guarantees to limit credit risk to ensure that our established credit criteria are met. The following table summarizes the activity affecting our allowance for bad debts:
|
|
2013
|
2012
|
2011
|
|||||||||
|
Balance at beginning of year
|
$
|
0.9
|
$
|
2.4
|
$
|
7.9
|
||||||
|
Additions
|
0.2
|
-
|
0.5
|
|||||||||
|
Deductions
|
-
|
(1.5
|
)
|
(6.0
|
)
|
|||||||
|
Balance at end of year
|
$
|
1.1
|
$
|
0.9
|
$
|
2.4
|
||||||
Significant Commercial Relationships
No customer accounted for more than 10% of our consolidated revenues for 2013.
|
|
2013
|
2012
|
2011
|
|||||||||
|
% of consolidated revenues
|
|
|
|
|||||||||
|
Chevron Phillips Chemical Company LLC
|
8
|
%
|
10
|
%
|
12
|
%
|
||||||
All transactions in the above table were associated with the Marketing and Distribution segment.
Casualty or Other Risks
We maintain coverage in various insurance programs, which provides us and the Partnership with property damage, business interruption and other coverages which are customary for the nature and scope of our operations. A portion of the insurance costs described above is allocated to the Partnership by us through the Partnership Agreement described in Note 16.
Management believes that we have adequate insurance coverage, although insurance will not cover every type of interruption that might occur. As a result of insurance market conditions, premiums and deductibles for certain insurance policies have increased substantially, and in some instances, certain insurance may become unavailable, or available for only reduced amounts of coverage. As a result, we may not be able to renew existing insurance policies or procure other desirable insurance on commercially reasonable terms, if at all.
If we or the Partnership were to incur a significant liability for which we were not fully insured, it could have a material impact on our consolidated financial position and results of operations. In addition, the proceeds of any such insurance may not be paid in a timely manner and may be insufficient if such an event were to occur. Any event that interrupts the revenues generated by us or the Partnership, or which causes us or the Partnership to make significant expenditures not covered by insurance, could reduce our or the Partnership’s ability to meet our financial obligations. Furthermore, even when a business interruption event is covered, it could affect interperiod results as we would not recognize the contingent gain until realized in a period following the incident.
Note 19 – Other Operating Expense
|
|
2013
|
2012
|
2011
|
|||||||||
|
Loss on sale or disposal of assets
|
$
|
3.9
|
$
|
15.6
|
(1) |
$
|
0.2
|
|||||
|
Casualty loss
|
4.3
|
3.6
|
-
|
|||||||||
|
Miscellaneous business tax
|
0.7
|
0.7
|
-
|
|||||||||
|
Abandoned project costs
|
0.7
|
-
|
-
|
|||||||||
|
|
$
|
9.6
|
$
|
19.9
|
$
|
0.2
|
||||||
| (1) | Includes a $15.4 million loss due to a write-off of the Partnership’s investment in the Yscloskey joint interest processing plant in Southeastern Louisiana. Following Hurricane Isaac, the joint venture owners elected not to restart the plant. |
Note 20—Income Taxes
Our provisions for income taxes for the periods indicated are as follows:
|
|
2013
|
2012
|
2011
|
|||||||||
|
Current expense
|
$
|
42.8
|
$
|
27.9
|
$
|
14.3
|
||||||
|
Deferred expense
|
5.4
|
9.0
|
12.3
|
|||||||||
|
|
$
|
48.2
|
$
|
36.9
|
$
|
26.6
|
||||||
Our deferred income tax assets and liabilities at December 31, 2013 and 2012 consist of differences related to the timing of recognition of certain types of costs as follows:
|
|
2013
|
2012
|
||||||
|
Deferred tax assets:
|
|
|
||||||
|
Net operating loss
|
$
|
-
|
$
|
-
|
||||
|
Other
|
3.5
|
3.5
|
||||||
|
Deferred tax assets before valuation allowance
|
3.5
|
3.5
|
||||||
|
Valuation allowance
|
(3.5
|
)
|
(3.5
|
)
|
||||
|
|
-
|
-
|
||||||
|
Deferred tax liabilities:
|
||||||||
|
Investments (1)
|
(115.2
|
)
|
(118.5
|
)
|
||||
|
Debt related deferreds
|
(17.2
|
)
|
(9.9
|
)
|
||||
|
Other
|
(7.1
|
)
|
(6.5
|
)
|
||||
|
|
(139.5
|
)
|
(134.9
|
)
|
||||
|
|
$
|
(139.5
|
)
|
$
|
(134.9
|
)
|
||
|
Net deferred tax liability:
|
||||||||
|
Federal
|
$
|
(121.0
|
)
|
$
|
(120.1
|
)
|
||
|
Foreign
|
0.6
|
0.6
|
||||||
|
State
|
(19.1
|
)
|
(15.4
|
)
|
||||
|
|
$
|
(139.5
|
)
|
$
|
(134.9
|
)
|
||
|
Balance sheet classification of deferred tax assets (liabilities):
|
||||||||
|
Long-term asset
|
$
|
(3.5
|
)
|
$
|
(3.5
|
)
|
||
|
Current liability
|
(0.5
|
)
|
(0.2
|
)
|
||||
|
Long-term liability
|
(135.5
|
)
|
(131.2
|
)
|
||||
|
|
$
|
(139.5
|
)
|
$
|
(134.9
|
)
|
||
| (1) | Our deferred tax liability attributable to investments reflects the differences between the book and tax carrying values of the assets and liabilities of our investments. |
Set forth below is the reconciliation between our income tax provision (benefit) computed at the United States statutory rate on income before income taxes and the income tax provision in the accompanying consolidated statements of operations for the periods indicated:
|
Income tax reconciliation:
|
2013
|
2012
|
2011
|
|||||||||
|
Income before income taxes
|
$
|
249.5
|
$
|
196.2
|
$
|
242.0
|
||||||
|
Less: Net income attributable to noncontrolling interest
|
(136.2
|
)
|
(121.2
|
)
|
(184.7
|
)
|
||||||
|
Less: Income taxes included in noncontrolling interest
|
(2.5
|
)
|
(3.5
|
)
|
(3.6
|
)
|
||||||
|
Income attributable to TRC before income taxes
|
110.8
|
71.5
|
53.7
|
|||||||||
|
Federal statutory income tax rate
|
35
|
%
|
35
|
%
|
35
|
%
|
||||||
|
Provision for federal income taxes
|
38.8
|
25.0
|
18.8
|
|||||||||
|
State income taxes, net of federal tax benefit
|
4.4
|
6.8
|
2.6
|
|||||||||
|
Amortization of deferred charge on 2010 transactions
|
4.7
|
4.7
|
4.7
|
|||||||||
|
Other, net
|
0.3
|
0.4
|
0.5
|
|||||||||
|
Income Tax Provision
|
$
|
48.2
|
$
|
36.9
|
$
|
26.6
|
||||||
We have not identified any uncertain tax positions. We believe that our income tax filing positions and deductions will be sustained on audit and do not anticipate any adjustments that will result in a material adverse effect on our financial condition, results of operations or cash flow. Therefore, no reserves for uncertain income tax positions have been recorded.
Note 21 - Supplemental Cash Flow Information
|
|
2013
|
2012
|
2011
|
|||||||||
|
Cash:
|
|
|
|
|||||||||
|
Interest paid, net of capitalized interest (1)
|
$
|
121.7
|
$
|
95.6
|
$
|
96.1
|
||||||
|
Income taxes paid, net of refunds
|
34.1
|
30.5
|
33.8
|
|||||||||
|
Non-cash:
|
||||||||||||
|
Deadstock inventory transferred to property, plant and equipment
|
30.4
|
3.0
|
0.7
|
|||||||||
|
Accrued dividends on unvested equity awards
|
1.6
|
2.7
|
1.4
|
|||||||||
|
Badlands acquisition contingent consideration
|
-
|
15.3
|
-
|
|||||||||
|
Change in capital accruals
|
(0.4
|
)
|
(34.3
|
)
|
(3.8
|
)
|
||||||
|
Transfers from materials and supplies to property, plant and equipment
|
20.5
|
-
|
-
|
|||||||||
|
Change in ARO estimate
|
1.6
|
(1.0
|
)
|
1.2
|
||||||||
| (1) | Interest capitalized on expansion projects was $28.0 million, $13.6 million and $3.4 million for the years ended December 31, 2013, 2012 and 2011. |
Note 22 – Stock and Other Compensation Plans
For the years ended December 31, 2013, 2012 and 2011 our results include compensation expenses from the following sources:
| · | 2010 TRC Stock Incentive Plan |
| o | Restricted Stock Awards |
| o | Restricted Stock Units Awards |
| o | TRC Director Grants |
| o | TRC Equity-Settled Awards |
| · | Targa 401(k) Plan |
| · | Targa Resources Investments Inc. Long-Term Incentive Plan — Cash-settled Performance Units |
| · | Partnership Long-Term Incentive Plan |
| o | Performance Units |
| o | Director grants |
2010 TRC Stock Incentive Plan
In December 2010, we adopted the Targa Resources Corp. 2010 Stock Incentive Plan (“TRC Plan”) for employees, consultants and non-employee directors of the Company. The TRC Plan allows for the grant of (i) incentive stock options qualified as such under U.S. federal income tax laws (“Incentive Options”), (ii) stock options that do not qualify as incentive options (“Non-statutory Options,” and together with Incentive Options, “Options”), (iii) stock appreciation rights (“SARs”) granted in conjunction with Options or Phantom Stock Awards, (iv) restricted stock awards (“Restricted Stock Awards”), (v) phantom stock awards (“Phantom Stock Awards”), (vi) bonus stock awards, (vii) performance unit awards, or (viii) any combination of such awards (collectively referred to a “Awards”).
Restricted Stock
- Total shares authorized under this plan are 5,000,000. Restricted stock entitles the recipient to cash dividends. Dividends on unvested restricted stock will be accrued when declared and recorded as short-term or long-term liabilities, dependent on the time remaining until payment of the dividends. The following table summarizes the restricted stock awards in shares and in dollars for the years indicated:
|
|
Number of shares
|
Weighted-average
Grant-Date Fair Value
|
||||||
|
Outstanding at December 31, 2010 (1)
|
1,350,000
|
$
|
22.00
|
|||||
|
Granted (2)
|
84,220
|
33.39
|
||||||
|
Outstanding at December 31, 2011
|
1,434,220
|
22.67
|
||||||
|
Granted (2)
|
91,090
|
42.50
|
||||||
|
Forfeited
|
(8,930
|
)
|
23.99
|
|||||
|
Vested (3)
|
(805,350
|
)
|
22.00
|
|||||
|
Outstanding at December 31, 2012
|
711,030
|
25.95
|
||||||
|
Granted (2)
|
30,623
|
57.59
|
||||||
|
Forfeited
|
(2,740
|
)
|
27.28
|
|||||
|
Vested (3)
|
(534,940
|
)
|
22.00
|
|||||
|
Outstanding at December 31, 2013
|
203,973
|
41.05
|
||||||
| (1) | These awards were issued in conjunction with the Targa IPO and vest over a three year period at 60% in 2012 and the remaining 40% in 2013. |
| (2) | These awards will cliff vest at the end of three years. |
| (3) | Awards vested in 2013 and 2012 were 40% and 60% of the awards issued in conjunction with the Targa IPO, net of forfeitures. Targa repurchased 169,159 and 197,731 shares from employees at $79.01 and $47.88 per share in 2013 and 2012 to satisfy the employees’ minimum statutory tax withholdings on the vested awards. The repurchased shares are recorded in treasury stock at cost. |
The compensation expense of the restricted stock was calculated based on the fair value of the stock at the grant date.
Restricted Stock Units (“RSUs”) –
RSUs are similar to restricted stock, except that shares of common stock are not issued until the RSUs vest. The following table summarizes the restricted stock awards in shares and in dollars for the years indicated.
|
|
Number of shares
|
Weighted-average
Grant-Date Fair Value
|
||||||
|
Outstanding at December 31, 2012
|
-
|
$
|
-
|
|||||
|
Granted
|
55,790
|
69.90
|
||||||
|
Forfeited
|
(240
|
)
|
67.07
|
|||||
|
Outstanding at December 31, 2013
|
55,550
|
69.92
|
||||||
Subsequent Events
On January 14, 2014, the compensation committee (the “Committee”) made restricted stock awards of 22,017 shares to executive management under the TRC Plan for the 2014 compensation cycle that will cliff vest in three years from the grant date.
On January 14, 2014, the Committee awarded 5,165 shares of our common stock to our outside directors. The awards vested at grant date.
Long-Term Incentive Plans
Performance Units
In 2007 both we and the Partnership adopted Long-Term Incentive Plans (“LTIP”) for employees, consultants, directors and non-employee directors of us and our affiliates who perform services for us or our affiliates. The performance units granted under these plans are linked to the performance of the Partnership’s common units. These plans provide for, among other things, the grant of both cash-settled and equity-settled performance units. Performance unit awards may also include distribution equivalent rights (“DERs”). The LTIPs are administered by the Committee of the Targa Board of Directors. Total units authorized under the LTIPs are 1,680,000.
Each performance unit will entitle the grantee to the value of our common unit on the vesting date multiplied by a stipulated vesting percentage determined from our ranking in a defined peer group. Currently, the performance period for most awards is three years, except for certain awards granted in December 2013, which provide for two, three or four-year vesting periods. The grantee will receive the vested unit value in cash or common units depending on the terms of the grant. The grantee may also be entitled to the value of any DERs based on the notional distributions accumulated during the vesting period times the vesting percentage. DERs are cash settled for both paid in cash and equity-settled performance units
Compensation cost for equity-settled performance units is recognized as an expense over the performance period based on fair value at the grant date. Fair value is calculated using a simulated unit price that incorporates peer ranking. DERs associated with equity-settled performance units are accrued over the performance period as a reduction of owners’ equity.
Compensation expense for cash-settled performance units and any related DERs will ultimately be equal to the cash paid to the grantee upon vesting. However, throughout the performance period we must record an accrued expense based on an estimate of that future pay-out. We have used a Monte Carlo simulation model to estimate accruals throughout the vesting period. In 2012, we changed the volatility assumption in the Monte Carlo simulation model from implied volatility to historical volatility. We consider historical volatility to be more appropriate than implied volatility because it provides a more reliable indication of future volatility.
TRC LTIP -- Cash-settled Performance Units
The following table summarizes the cash-settled performance units for the year ended 2013 awarded under the Targa LTIP (in units and millions of dollars):
|
|
Program Year
|
|
||||||||||||||||||
|
|
2010 Plan
|
2011 Plan
|
2012 Plan
|
2013 Plan
|
Total
|
|||||||||||||||
|
Units outstanding January 1, 2013
|
306,253
|
122,550
|
140,820
|
-
|
569,623
|
|||||||||||||||
|
Granted
|
-
|
3,000
|
3,200
|
145,970
|
152,170
|
|||||||||||||||
|
Vested and paid
|
(305,853
|
)
|
-
|
-
|
-
|
(305,853
|
)
|
|||||||||||||
|
Forfeited
|
(400
|
)
|
(680
|
)
|
(1,560
|
)
|
(1,010
|
)
|
(3,650
|
)
|
||||||||||
|
Units outstanding December 31, 2013
|
-
|
124,870
|
142,460
|
144,960
|
412,290
|
|||||||||||||||
|
|
||||||||||||||||||||
|
Calculated fair market value as of December 31, 2013
|
$
|
10.6
|
$
|
10.4
|
$
|
7.6
|
$
|
28.6
|
||||||||||||
|
|
||||||||||||||||||||
|
Current liability
|
$
|
8.7
|
$
|
-
|
$
|
-
|
$
|
8.7
|
||||||||||||
|
Long-term liability
|
-
|
4.9
|
1.0
|
5.9
|
||||||||||||||||
|
Liability as of December 31, 2013
|
$
|
8.7
|
$
|
4.9
|
$
|
1.0
|
$
|
14.6
|
||||||||||||
|
|
||||||||||||||||||||
|
To be recognized in future periods
|
$
|
1.9
|
$
|
5.5
|
$
|
6.6
|
$
|
14.0
|
||||||||||||
|
|
||||||||||||||||||||
|
Vesting date
|
June 2014
|
June 2015
|
June 2016
|
|||||||||||||||||
The remaining weighted average recognition period for the unrecognized compensation cost is approximately 1.8 years.
Partnership LTIP – Equity-Settled Performance Units
The Partnership started issuing equity-settled performance units in 2011. The following table summarizes activities of our equity-settled performance units for the years ended December 31, 2013, 2012, and 2011:
|
|
Number
of units
|
Weighted Average Grant-Date Fair Value
|
||||||
|
Outstanding at December 31, 2010
|
-
|
$
|
-
|
|||||
|
Granted
|
135,870
|
33.94
|
||||||
|
Outstanding at December 31, 2011
|
135,870
|
33.94
|
||||||
|
Granted
|
171,750
|
41.94
|
||||||
|
Outstanding at December 31, 2012
|
307,620
|
38.40
|
||||||
|
Granted
|
244,578
|
46.54
|
||||||
|
Outstanding at December 31, 2013
|
552,198
|
42.01
|
||||||
Subsequent Event.
On January 14, 2014, the compensation committee (the “Committee”) made awards to the executive management for the 2014 compensation cycle of 111,745 equity-settled performance units under our LTIP that will vest in June 2017.
Partnership Director Grants
Starting in 2011, the common units granted to the Partnership’s non-management directors were vested immediately at the grant date. The awards granted before 2011 settled with the delivery of common units and were subject to three-year vesting, without a performance condition, and vested ratably on each anniversary of the grant date. In 2013, the awards granted before 2011 vested.
The following table summarizes activity of the common unit-based awards granted to the Partnership’s Directors for the years ended December 31,
2013, 2012 and 2011
(in units and dollars):
|
|
Number of units
|
Weighted Average Grant-
Date Fair Value
|
||||||
|
Outstanding at December 31, 2010
|
39,074
|
$
|
16.12
|
|||||
|
Granted
|
10,600
|
33.53
|
||||||
|
Vested and paid
|
(29,843
|
)
|
22.18
|
|||||
|
Outstanding at December 31, 2011
|
19,831
|
16.31
|
||||||
|
Granted
|
9,980
|
38.72
|
||||||
|
Vested and paid
|
(25,311
|
)
|
23.86
|
|||||
|
Outstanding at December 31, 2012
|
4,500
|
23.51
|
||||||
|
Granted
|
12,780
|
39.33
|
||||||
|
Vested and paid
|
(17,280
|
)
|
35.21
|
|||||
|
Outstanding at December 31, 2013
|
-
|
-
|
||||||
Subsequent Event
.
On January 14, 2014, the compensation committee (“Committee”) made awards of 8,740 of our common units (1,748 units to each of our non-management directors). The awards vested immediately at the grant date.
The following table summarizes the compensation expenses under the various compensation plans recognized for the years indicated:
|
|
2013
|
2012
|
2011
|
|||||||||
|
2010 TRC Stock Incentive Plan - Director Grants
|
$
|
0.5
|
$
|
0.4
|
$
|
0.8
|
||||||
|
Partnership LTIP - Equity-Settled Performance Units
|
5.5
|
3.1
|
1.0
|
|||||||||
|
Partnership Director Grants
|
0.5
|
0.5
|
0.5
|
|||||||||
|
Allocated to the Partnership
|
||||||||||||
|
2010 TRC Stock Incentive Plan - Restricted Stock
|
6.3
|
13.7
|
13.4
|
|||||||||
|
2010 TRC Stock Incentive Plan - Restricted Stock Unit
|
0.4
|
-
|
-
|
|||||||||
|
TRC LTIP - Cash-Settled Performance Units
|
21.9
|
14.2
|
13.3
|
|||||||||
The table below summarizes the unrecognized compensation expenses and the approximate remaining weighted average vesting periods related to our various compensation plans as of December 31, 2013:
|
|
|
Weighted Average
|
||||||
|
|
December 31,
|
Remaining
|
||||||
|
|
2013
|
Vesting Period
|
||||||
|
|
(In millions)
|
(In years)
|
||||||
|
Partnership LTIP Equity-Settled Performance Units
|
$
|
16.3
|
2.0
|
|||||
|
2010 TRC Stock Incentive Plan - Restricted Stock
|
3.3
|
1.6
|
||||||
|
2010 TRC Stock Incentive Plan - Restricted Stock Units
|
3.6
|
2.8
|
||||||
The total fair values of share-based awards on the dates they vested are as follows:
|
|
2013
|
2012
|
2011
|
|||||||||
|
TRC LTIP - Cash-Settled Performance Units
|
$
|
25.2
|
$
|
22.2
|
$
|
5.5
|
||||||
|
Partnership Director Grants
|
0.7
|
1.0
|
1.0
|
|||||||||
|
2010 TRC Stock Incentive Plan - Restricted Stock (1)
|
42.2
|
40.3
|
-
|
|||||||||
|
Accrued dividends settled
|
2.4
|
2.0
|
-
|
|||||||||
| (1) | We recognized $1.6 million and $1.3 million tax benefits associated with the vesting of 40% and 60% of the restricted stock related to our IPO in 2013 and 2012. |
401(k) Plan
We have a 401(k) plan whereby we match 100% of up to 5% of an employee’s contribution (subject to certain limitations in the plan). We also contribute an amount equal to 3% of each employee’s eligible compensation to the plan as a retirement contribution and may make additional contributions at our sole discretion. All Targa contributions are made 100% in cash. We made contributions to the 401(k) plan totaling $9.6 million, $8.7 million and $7.8 million during 2013, 2012, and 2011.
Note 23 — Segment Information
The Partnership reports its operations in two divisions: (i) Gathering and Processing, consisting of two reportable segments – (a) Field Gathering and Processing and (b) Coastal Gathering and Processing; and (ii) Logistics and Marketing consisting of two reportable segments – (a) Logistics Assets and (b) Marketing and Distribution. The financial results of its hedging activities are reported in Other.
The Partnership’s Gathering and Processing division includes assets used in the gathering of natural gas produced from oil and gas wells and processing this raw natural gas into merchantable natural gas by extracting NGLs and removing impurities. The Field Gathering and Processing segment's assets are located in North Texas and the Permian Basin of West Texas and New Mexico. With the Badlands acquisition on December 31, 2012, this segment's assets now includes the Badlands crude oil and natural gas gathering, terminaling and processing assets in North Dakota. Because the acquisition closed on December 31, 2012, Badlands had no operational impact for 2012. The Coastal Gathering and Processing segment's assets are located in the onshore and near offshore regions of the Louisiana Gulf Coast and the Gulf of Mexico.
The Partnership’s Logistics and Marketing division is also referred to as its Downstream Business. The Partnership’s Downstream Business includes all the activities necessary to convert mixed NGLs into NGL products and provides certain value added services such as storing, terminaling, distributing and marketing of NGLs, refined petroleum products and crude oil. It also includes certain natural gas supply and marketing activities in support of the Partnership’s other operations, as well as transporting natural gas and NGLs.
The Partnership’s Logistics Assets segment is involved in transporting, storing, and fractionating mixed NGLs; storing, terminaling, and transporting finished NGLs, including services for exported LPGs; and storing and terminaling refined petroleum products and crude oil. These assets are generally connected to and supplied in part by the Partnership’s Gathering and Processing segments and are predominantly located in Mont Belvieu and Galena Park, Texas and Lake Charles, Louisiana.
The Partnership’s Marketing and Distribution segment covers activities required to distribute and market raw and finished NGLs and all natural gas marketing activities. It includes (1) marketing the Partnership’s own NGL production and purchasing NGL products in selected United States markets; (2) providing LPG balancing services to refinery customers; (3) transporting, storing and selling propane and providing related propane logistics services to multi-state retailers, independent retailers and other end-users; providing propane, butane and services to LPG exporters; and (4) marketing natural gas available to the Partnership from its Gathering and Processing division and the purchase and resale and other value added activities related to third-party natural gas in selected United States markets.
Other
contains the results of the Partnership’s commodity hedging activities included in operating margin.
Eliminations of inter-segment transactions are reflected in the corporate and eliminations column.
Segment information is shown in the following tables. We have segregated the following segment information between Partnership and non-Partnership activities. Partnership activities have been presented on a common control accounting basis, which reflects the drop-down transactions between us and the Partnership as if they occurred in prior periods similar to a pooling of interests. The non-Partnership results include activities related to certain assets and liabilities contractually excluded from the drop-down transactions and certain historical hedge activities that could not be reflected under GAAP in the Partnership common control results.
|
|
Year Ended December 31, 2013
|
|||||||||||||||||||||||||||||||
|
|
Partnership
|
|
|
|||||||||||||||||||||||||||||
|
|
Field
Gathering
and
Processing
|
Coastal
Gathering
and
Processing
|
Logistics
Assets
|
Marketing
and
Distribution
|
Other
|
Corporate
and
Eliminations
|
TRC Non-
Partnership
|
Consolidated
|
||||||||||||||||||||||||
|
Revenues
|
|
|
|
|
|
|
|
|
||||||||||||||||||||||||
|
Sales of commodities
|
$
|
188.8
|
$
|
305.0
|
$
|
140.5
|
$
|
5,319.3
|
$
|
21.4
|
$
|
0.1
|
$
|
(0.2
|
)
|
$
|
5,974.9
|
|||||||||||||||
|
Fees from midstream services
|
112.8
|
33.4
|
216.0
|
217.1
|
-
|
(0.1
|
)
|
-
|
579.2
|
|||||||||||||||||||||||
|
Business interruption insurance
|
1.1
|
0.2
|
-
|
0.6
|
-
|
-
|
-
|
1.9
|
||||||||||||||||||||||||
|
|
302.7
|
338.6
|
356.5
|
5,537.0
|
21.4
|
-
|
(0.2
|
)
|
6,556.0
|
|||||||||||||||||||||||
|
Intersegment revenues
|
||||||||||||||||||||||||||||||||
|
Sales of commodities
|
1,218.9
|
642.2
|
3.9
|
478.6
|
-
|
(2,343.6
|
)
|
-
|
-
|
|||||||||||||||||||||||
|
Fees from midstream services
|
3.4
|
1.0
|
176.5
|
29.8
|
-
|
(210.7
|
)
|
-
|
-
|
|||||||||||||||||||||||
|
|
1,222.3
|
643.2
|
180.4
|
508.4
|
-
|
(2,554.3
|
)
|
-
|
-
|
|||||||||||||||||||||||
|
Revenues
|
$
|
1,525.0
|
$
|
981.8
|
$
|
536.9
|
$
|
6,045.4
|
$
|
21.4
|
$
|
(2,554.3
|
)
|
$
|
(0.2
|
)
|
$
|
6,556.0
|
||||||||||||||
|
Operating margin
|
$
|
270.5
|
$
|
85.4
|
$
|
282.3
|
$
|
141.9
|
$
|
21.4
|
$
|
-
|
$
|
(0.3
|
)
|
$
|
801.2
|
|||||||||||||||
|
Other financial information:
|
||||||||||||||||||||||||||||||||
|
Total assets
|
$
|
3,200.7
|
$
|
383.8
|
$
|
1,503.6
|
$
|
756.1
|
$
|
5.1
|
$
|
122.1
|
$
|
77.2
|
$
|
6,048.6
|
||||||||||||||||
|
Capital expenditures
|
$
|
557.8
|
$
|
20.6
|
$
|
444.7
|
$
|
6.3
|
$
|
-
|
$
|
5.1
|
$
|
-
|
$
|
1,034.5
|
||||||||||||||||
|
|
Year Ended December 31, 2012
|
|||||||||||||||||||||||||||||||
|
|
Partnership
|
|
|
|||||||||||||||||||||||||||||
|
|
Field Gathering and Processing
|
Coastal Gathering and Processing
|
Logistics Assets
|
Marketing and Distribution
|
Other
|
Corporate and Eliminations
|
TRC Non-Partnership
|
Consolidated
|
||||||||||||||||||||||||
|
Revenues
|
|
|
|
|
|
|
|
|
||||||||||||||||||||||||
|
Sales of commodities
|
$
|
172.7
|
$
|
240.6
|
$
|
184.4
|
$
|
4,890.2
|
$
|
41.1
|
$
|
-
|
$
|
2.1
|
$
|
5,531.1
|
||||||||||||||||
|
Fees from midstream services
|
39.5
|
23.6
|
170.7
|
120.9
|
-
|
(0.1
|
)
|
-
|
354.6
|
|||||||||||||||||||||||
|
|
212.2
|
264.2
|
355.1
|
5,011.1
|
41.1
|
(0.1
|
)
|
2.1
|
5,885.7
|
|||||||||||||||||||||||
|
Intersegment revenues
|
||||||||||||||||||||||||||||||||
|
Sales of commodities
|
1,150.7
|
701.1
|
1.8
|
565.0
|
-
|
(2,418.6
|
)
|
-
|
-
|
|||||||||||||||||||||||
|
Fees from midstream services
|
1.3
|
0.1
|
106.5
|
32.0
|
-
|
(139.9
|
)
|
-
|
-
|
|||||||||||||||||||||||
|
|
1,152.0
|
701.2
|
108.3
|
597.0
|
-
|
(2,558.5
|
)
|
-
|
-
|
|||||||||||||||||||||||
|
Revenues
|
$
|
1,364.2
|
$
|
965.4
|
$
|
463.4
|
$
|
5,608.1
|
$
|
41.1
|
$
|
(2,558.6
|
)
|
$
|
2.1
|
$
|
5,885.7
|
|||||||||||||||
|
Operating margin
|
$
|
231.2
|
$
|
115.1
|
$
|
188.3
|
$
|
116.0
|
$
|
41.1
|
$
|
-
|
$
|
1.9
|
$
|
693.6
|
||||||||||||||||
|
Other financial information:
|
||||||||||||||||||||||||||||||||
|
Total assets
|
$
|
2,797.9
|
$
|
414.1
|
$
|
1,100.9
|
$
|
548.6
|
$
|
34.4
|
$
|
129.8
|
$
|
79.3
|
$
|
5,105.0
|
||||||||||||||||
|
Capital expenditures
|
$
|
222.1
|
$
|
9.4
|
$
|
359.0
|
$
|
12.3
|
$
|
-
|
$
|
13.9
|
$
|
0.3
|
$
|
617.0
|
||||||||||||||||
|
Business acquisitions
|
$
|
970.4
|
$
|
25.8
|
$
|
-
|
$
|
-
|
$
|
-
|
$
|
-
|
$
|
-
|
$
|
996.2
|
||||||||||||||||
|
|
Year Ended December 31, 2011
|
|||||||||||||||||||||||||||||||
|
|
Partnership
|
|||||||||||||||||||||||||||||||
|
|
Field Gathering and Processing
|
Coastal Gathering and Processing
|
Logistics Assets
|
Marketing and Distribution
|
Other
|
Corporate and Eliminations
|
TRC Non-Partnership
|
Consolidated
|
||||||||||||||||||||||||
|
Revenues
|
||||||||||||||||||||||||||||||||
|
Sales of commodities
|
$
|
184.9
|
$
|
325.7
|
$
|
43.2
|
$
|
6,209.9
|
$
|
(37.6
|
)
|
$
|
-
|
$
|
4.4
|
$
|
6,730.5
|
|||||||||||||||
|
Fees from midstream services
|
27.5
|
19.8
|
130.0
|
83.8
|
-
|
(0.1
|
)
|
-
|
261.0
|
|||||||||||||||||||||||
|
Business interruption insurance
|
-
|
-
|
-
|
-
|
-
|
-
|
3.0
|
3.0
|
||||||||||||||||||||||||
|
|
212.4
|
345.5
|
173.2
|
6,293.7
|
(37.6
|
)
|
(0.1
|
)
|
7.4
|
6,994.5
|
||||||||||||||||||||||
|
Intersegment revenues
|
||||||||||||||||||||||||||||||||
|
Sales of commodities
|
1,428.4
|
952.9
|
1.0
|
636.5
|
-
|
(3,018.8
|
)
|
-
|
-
|
|||||||||||||||||||||||
|
Fees from midstream services
|
1.1
|
0.4
|
89.3
|
36.6
|
-
|
(127.4
|
)
|
-
|
-
|
|||||||||||||||||||||||
|
|
1,429.5
|
953.3
|
90.3
|
673.1
|
-
|
(3,146.2
|
)
|
-
|
-
|
|||||||||||||||||||||||
|
Revenues
|
$
|
1,641.9
|
$
|
1,298.8
|
$
|
263.5
|
$
|
6,966.8
|
$
|
(37.6
|
)
|
$
|
(3,146.3
|
)
|
$
|
7.4
|
$
|
6,994.5
|
||||||||||||||
|
Operating margin
|
$
|
287.9
|
$
|
174.3
|
$
|
123.1
|
$
|
113.4
|
$
|
(37.6
|
)
|
$
|
-
|
$
|
7.3
|
$
|
668.4
|
|||||||||||||||
|
Other financial information:
|
||||||||||||||||||||||||||||||||
|
Total assets
|
$
|
1,666.2
|
$
|
427.5
|
$
|
775.4
|
$
|
650.5
|
$
|
51.9
|
$
|
86.5
|
$
|
173.0
|
$
|
3,831.0
|
||||||||||||||||
|
Capital expenditures
|
$
|
167.5
|
$
|
12.8
|
$
|
147.4
|
$
|
3.5
|
$
|
-
|
$
|
2.3
|
$
|
2.2
|
$
|
335.7
|
||||||||||||||||
|
Business acquisitions
|
$
|
-
|
$
|
-
|
$
|
156.5
|
$
|
-
|
$
|
-
|
$
|
-
|
$
|
-
|
$
|
156.5
|
||||||||||||||||
The following table shows our consolidated revenues by product and service for the periods presented:
|
|
2013
|
2012
|
2011
|
|||||||||
|
Sales of commodities
|
|
|
|
|||||||||
|
Natural gas
|
$
|
1,224.7
|
$
|
926.9
|
$
|
1,120.7
|
||||||
|
NGL
|
4,470.9
|
4,265.7
|
5,496.9
|
|||||||||
|
Condensate
|
121.8
|
114.1
|
103.0
|
|||||||||
|
Petroleum products
|
136.0
|
180.1
|
43.1
|
|||||||||
|
Derivative activities
|
21.5
|
44.3
|
(33.2
|
)
|
||||||||
|
|
5,974.9
|
5,531.1
|
6,730.5
|
|||||||||
|
Fees from midstream services
|
||||||||||||
|
Fractionating and treating
|
152.0
|
115.6
|
86.7
|
|||||||||
|
Storage, terminaling, transportation and export
|
275.5
|
159.2
|
110.4
|
|||||||||
|
Gathering and processing
|
114.1
|
45.0
|
33.1
|
|||||||||
|
Other
|
37.6
|
34.8
|
30.8
|
|||||||||
|
|
579.2
|
354.6
|
261.0
|
|||||||||
|
Business interruption insurance
|
1.9
|
-
|
3.0
|
|||||||||
|
Total revenues
|
$
|
6,556.0
|
$
|
5,885.7
|
$
|
6,994.5
|
||||||
The following table shows a reconciliation of operating margin to net income for the periods presented:
|
|
2013
|
2012
|
2011
|
|||||||||
|
|
|
|
|
|||||||||
|
Operating margin
|
$
|
801.2
|
$
|
693.6
|
$
|
668.4
|
||||||
|
Depreciation and amortization expense
|
(271.9
|
)
|
(197.6
|
)
|
(181.0
|
)
|
||||||
|
General and administrative expense
|
(151.5
|
)
|
(139.8
|
)
|
(136.1
|
)
|
||||||
|
Interest expense, net
|
(134.1
|
)
|
(120.8
|
)
|
(111.7
|
)
|
||||||
|
Income tax expense
|
(48.2
|
)
|
(36.9
|
)
|
(26.6
|
)
|
||||||
|
Other, net
|
5.8
|
(39.2
|
)
|
2.4
|
||||||||
|
Net income
|
$
|
201.3
|
$
|
159.3
|
$
|
215.4
|
||||||
Note 24 — Selected Quarterly Financial Data (Unaudited)
Our results of operations by quarter for the years ended December 31, 2013 and 2012 were as follows:
|
|
First
|
Second
|
Third
|
Fourth
|
|
|||||||||||||||
|
|
Quarter
|
Quarter
|
Quarter
|
Quarter
|
Total
|
|||||||||||||||
|
|
(In millions, except per share amounts)
|
|||||||||||||||||||
|
2013
|
|
|
|
|
|
|||||||||||||||
|
Revenues
|
$
|
1,397.8
|
$
|
1,441.6
|
$
|
1,556.8
|
$
|
2,159.8
|
$
|
6,556.0
|
||||||||||
|
Gross margin
|
260.3
|
265.2
|
297.0
|
355.0
|
1,177.5
|
|||||||||||||||
|
Operating income
|
73.9
|
60.9
|
88.5
|
144.9
|
368.2
|
|||||||||||||||
|
Net income
|
33.8
|
22.5
|
49.4
|
95.6
|
201.3
|
|||||||||||||||
|
Net income attributable to Targa / common shareholders
|
13.4
|
15.0
|
16.3
|
20.4
|
65.1
|
|||||||||||||||
|
Net income per common share - basic
|
$
|
0.32
|
$
|
0.36
|
$
|
0.39
|
$
|
0.49
|
$
|
1.56
|
||||||||||
|
Net income per common share - diluted
|
$
|
0.32
|
$
|
0.36
|
$
|
0.39
|
$
|
0.48
|
$
|
1.55
|
||||||||||
|
|
||||||||||||||||||||
|
2012
|
||||||||||||||||||||
|
Revenues
|
$
|
1,645.8
|
$
|
1,319.1
|
$
|
1,393.5
|
$
|
1,527.3
|
$
|
5,885.7
|
||||||||||
|
Gross margin
|
261.6
|
244.5
|
240.5
|
260.1
|
1,006.7
|
|||||||||||||||
|
Operating income
|
107.7
|
83.2
|
59.0
|
86.4
|
336.3
|
|||||||||||||||
|
Net income
|
69.2
|
43.5
|
19.0
|
27.6
|
159.3
|
|||||||||||||||
|
Net income attributable to Targa / common shareholders
|
9.6
|
8.6
|
8.7
|
11.2
|
38.1
|
|||||||||||||||
|
Net income per common share - basic
|
$
|
0.23
|
$
|
0.21
|
$
|
0.21
|
$
|
0.27
|
$
|
0.93
|
||||||||||
|
Net income per common share - diluted
|
$
|
0.23
|
$
|
0.21
|
$
|
0.21
|
$
|
0.27
|
$
|
0.91
|
||||||||||
Note 25— Condensed Parent Only Financial Statements
The condensed parent only financial statements represent the financial information required by Rule 5-04 of the Securities and Exchange Commission Regulation S-X for Targa Resources Corp.
In the condensed financial statements, Targa’s investments in consolidated subsidiaries are presented under the equity method of accounting. Under this method, the assets and liabilities of affiliates are not consolidated. The investments in net assets of the consolidated subsidiaries are recorded in the balance sheets. The income (loss) from operations of the consolidated subsidiaries is reported as equity in income (loss) of consolidated subsidiaries.
A substantial amount of Targa’s operating, investing and financing activities are conducted by its affiliates. The condensed financial statements should be read in conjunction with Targa’s consolidated financial statements, which begin on page F-1 of this Annual Report.
TARGA RESOURCES CORP.
PARENT ONLY
CONDENSED BALANCE SHEETS
|
|
December 31,
|
|||||||
|
|
2013
|
2012
|
||||||
|
|
|
|
||||||
|
|
(In millions)
|
|||||||
|
ASSETS
|
||||||||
|
Current assets:
|
|
|
||||||
|
Investment in consolidated subsidiaries
|
$
|
208.1
|
$
|
206.1
|
||||
|
Deferred income taxes
|
24.1
|
20.0
|
||||||
|
Long-term debt issue costs
|
1.4
|
1.7
|
||||||
|
Total assets
|
$
|
233.6
|
$
|
227.8
|
||||
|
|
||||||||
|
LIABILITIES AND STOCKHOLDERS' EQUITY
|
||||||||
|
Accrued current liabilities
|
$
|
0.6
|
$
|
1.5
|
||||
|
Long-term debt
|
84.0
|
82.0
|
||||||
|
Other long-term liabilities
|
0.2
|
0.2
|
||||||
|
|
||||||||
|
Commitments and contingencies
|
||||||||
|
|
||||||||
|
Targa Resources Corp. stockholders' equity
|
148.8
|
144.1
|
||||||
|
Total liabilities and stockholders' equity
|
$
|
233.6
|
$
|
227.8
|
||||
TARGA RESOURCES CORP.
PARENT ONLY
CONDENSED STATEMENTS OF OPERATIONS
|
|
Year Ended December 31,
|
|||||||||||
|
|
2013
|
2012
|
2011
|
|||||||||
|
|
|
|
|
|||||||||
|
|
(In millions, except per share amounts)
|
|||||||||||
|
Equity in net income (loss) of consolidated subsidiaries
|
$
|
72.6
|
$
|
45.4
|
$
|
38.9
|
||||||
|
General and administrative expenses
|
(8.4
|
)
|
(8.2
|
)
|
(8.5
|
)
|
||||||
|
Gain on sale of assets
|
-
|
-
|
-
|
|||||||||
|
Income (loss) from operations
|
64.2
|
37.2
|
30.4
|
|||||||||
|
Other income (expense):
|
||||||||||||
|
Gain on debt extinguishment
|
-
|
0.2
|
-
|
|||||||||
|
Interest expense
|
(3.2
|
)
|
(3.2
|
)
|
(3.1
|
)
|
||||||
|
Income (loss) before income taxes
|
61.0
|
34.2
|
27.3
|
|||||||||
|
Deferred income tax (expense) benefit
|
4.1
|
3.9
|
3.4
|
|||||||||
|
Net income (loss) attributable to Targa Resources Corp.
|
65.1
|
38.1
|
30.7
|
|||||||||
|
Dividends on Series B preferred stock
|
-
|
-
|
-
|
|||||||||
|
Dividends on common equivalents
|
-
|
-
|
-
|
|||||||||
|
Net income (loss) available to common shareholders
|
$
|
65.1
|
$
|
38.1
|
$
|
30.7
|
||||||
|
Net income (loss) available per common share - basic
|
$
|
1.56
|
$
|
0.93
|
$
|
0.75
|
||||||
|
Net income (loss) available per common share - diluted
|
$
|
1.55
|
$
|
0.91
|
$
|
0.74
|
||||||
|
Weighted average shares outstanding - basic
|
41.6
|
41.0
|
41.0
|
|||||||||
|
Weighted average shares outstanding - diluted
|
42.1
|
41.8
|
41.4
|
|||||||||
TARGA RESOURCES CORP.
PARENT ONLY
CONDENSED STATEMENTS OF CASH FLOWS
|
|
Year Ended December 31,
|
|||||||||||
|
|
2013
|
2012
|
2011
|
|||||||||
|
|
|
|
|
|||||||||
|
|
(In millions)
|
|||||||||||
|
Net cash provided by operating activities
|
$
|
(4.1
|
)
|
$
|
0.8
|
$
|
-
|
|||||
|
|
||||||||||||
|
Investing activities:
|
||||||||||||
|
Distribution and return of advances from consolidated subsidiaries
|
101.6
|
78.6
|
38.2
|
|||||||||
|
Net cash provided by investing activities
|
101.6
|
78.6
|
38.2
|
|||||||||
|
|
||||||||||||
|
Financing activities:
|
||||||||||||
|
Long-term debt borrowings
|
65.0
|
90.0
|
-
|
|||||||||
|
Long-term debt repayments
|
(63.0
|
)
|
(96.8
|
)
|
-
|
|||||||
|
Costs incurred in connection with financing arrangements
|
-
|
(1.0
|
)
|
-
|
||||||||
|
Issuance of common stock
|
-
|
-
|
-
|
|||||||||
|
Repurchase of common stock
|
(13.3
|
)
|
(9.5
|
)
|
-
|
|||||||
|
Dividends to common and common equivalent shareholders
|
(87.8
|
)
|
(62.2
|
)
|
(38.2
|
)
|
||||||
|
Dividends to preferred shareholders
|
-
|
-
|
-
|
|||||||||
|
Excess tax benefit from stock-based awards
|
1.6
|
1.3
|
-
|
|||||||||
|
Distribution to owners
|
-
|
(1.2
|
)
|
-
|
||||||||
|
Net cash used in financing activities
|
(97.5
|
)
|
(79.4
|
)
|
(38.2
|
)
|
||||||
|
|
||||||||||||
|
Net increase (decrease) in cash and cash equivalents
|
-
|
-
|
-
|
|||||||||
|
Cash and cash equivalents - beginning of year
|
-
|
-
|
-
|
|||||||||
|
Cash and cash equivalents - end of year
|
$
|
-
|
$
|
-
|
$
|
-
|
||||||
F-49
TABLE OF CONTENTS
Part I Financial InformationItem 1. Financial StatementsNote 1 OrganizationNote 2 Basis Of PresentationNote 3 Significant Accounting PoliciesNote 4 Business AcquisitionsNote 5 InventoriesNote 6 Property, Plant and Equipment and Intangible AssetsNote 7 Asset Retirement ObligationsNote 8 Investment in Unconsolidated AffiliateNote 9 Accounts Payable and Accrued LiabilitiesNote 10 Debt ObligationsNote 11 Partnership Units and Related MattersNote 12 Common Stock and Related MattersNote 13 Earnings Per Common ShareNote 14 Derivative Instruments and Hedging ActivitiesNote 15 Fair Value MeasurementsNote 16 Related Party TransactionsNote 17 Commitments and ContingenciesNote 18 Significant Risks and UncertaintiesNote 19 Other Operating ExpenseNote 20 Income TaxesNote 21 - Supplemental Cash Flow InformationNote 22 Stock and Other Compensation PlansNote 23 Segment InformationNote 24 Selected Quarterly Financial Data (unaudited)Note 25 Condensed Parent Only Financial Statements