As filed with the Securities and Exchange Commission on October 31, 2016
UNITED STATES
SECURITIES AND EXCHANGE COMMISSION
Washington, D.C. 20549
FORM 10-K
(Mark One)
|
☒
|
ANNUAL REPORT PURSUANT TO SECTION 13 OR 15(d) OF THE SECURITIES EXCHANGE ACT OF 1934
|
For the fiscal year ended December 31, 2015
or
|
☐
|
TRANSITION REPORT PURSUANT TO SECTION 13 OR 15(d) OF THE SECURITIES EXCHANGE ACT OF 1934
|
For the transition period from to
Commission File Number 000-50266

TRINITY CAPITAL CORPORATION
(Exact name of registrant as specified in its charter)
|
New Mexico
|
85-0242376
|
|
|
(State or other jurisdiction of incorporation or organization)
|
(I.R.S. Employer Identification No.)
|
|
|
1200 Trinity Drive
Los Alamos, New Mexico
|
87544
|
|
|
(Address of principal executive offices)
|
(Zip Code)
|
Registrant’s telephone number, including area code
(505) 662-5171
Securities registered pursuant to Section 12(b) of the Act:
None
Securities registered pursuant to Section 12(g) of the Act:
Common Stock, no par value per share
(Title of class)
Indicate by check mark if the registrant is a well-known seasoned issuer, as defined in Rule 405 of the Securities Act.
☐ Yes ☒ No
Indicate by check mark if the registrant is not required to file reports pursuant to Section 13 or Section 15(d) of the Act.
☐ Yes ☒ No
Indicate by check mark whether the registrant (1) has filed all reports required to be filed by Section 13 or 15(d) of the Securities Exchange Act of 1934 during the preceding 12 months (or for such shorter period that the registrant was required to file such reports), and (2) has been subject to such filing requirements for the past 90 days.
☐ Yes ☒ No
Indicate by check mark whether the registrant has submitted electronically and posted on its corporate Web site, if any, every Interactive Data File required to be submitted and posted pursuant to Rule 405 of Regulation S-T during the preceding 12 months (or for such shorter period that the registrant was required to submit and post such files).
☐ Yes ☒ No
Indicate by check mark if disclosure of delinquent filers pursuant to Item 405 of Regulation S-K (§ 229.405 of this chapter) is not contained herein, and will not be contained, to the best of registrant’s knowledge, in definitive proxy or information statements incorporated by reference in Part III of this Form 10-K or any amendment to this Form 10-K.
☒ Yes ☐ No
Indicate by check mark whether registrant is a large accelerated filer, an accelerated filer, a non-accelerated filer, or a smaller reporting company. See the definitions of “large accelerated filer,” “accelerated filer” and “smaller reporting company” in Rule 12b-2 of the Act. (Check one):
|
Large accelerated filer ☐
|
Accelerated filer
☐
|
|
|
Non-accelerated filer ☐
|
(do not check if a smaller reporting company)
|
Smaller reporting company
☒
|
Indicate by check mark whether the registrant is a shell company (as defined in Rule 12b-2 of the Act).
☐ Yes ☒ No
The aggregate market value of the registrant’s common stock (“Common Stock”) held by non-affiliates as of June 30, 2016, the last business day of the registrant’s most recently completed second fiscal quarter, was approximately $26,105,000 (based on the last sale price of the Common Stock at September 30, 2016 of $4.00 per share).
As of September 30, 2016, there were 6,526,302 shares of Common Stock outstanding.
|
PART I
|
|
|
2
|
|
|
19
|
|
|
34
|
|
|
34
|
|
|
35
|
|
|
36
|
|
|
PART II
|
|
|
36
|
|
|
39
|
|
|
41
|
|
|
64
|
|
|
67
|
|
|
119
|
|
|
120
|
|
|
124
|
|
|
PART III
|
|
|
125
|
|
|
132
|
|
|
137
|
|
|
140
|
|
|
141
|
|
|
PART IV
|
|
|
141
|
|
|
145
|
Please note: Unless the context clearly suggests otherwise, references in this Form 10-K to “us,” “we,” “our,” “Trinity” or “the Company” include Trinity Capital Corporation and its wholly owned subsidiaries.
Special Note Concerning Forward-Looking Statements
This document contains forward-looking statements of the Company and its management within the meaning of such term in the Private Securities Litigation Reform Act of 1995, with respect to the financial condition, results of operations, plans, objectives, future performance and business of the Company. Forward-looking statements, which may be based upon beliefs, expectations and assumptions of the Company’s management and on information currently available to management, are generally identifiable by the use of words such as “believe,” “expect,” “anticipate,” “plan,” “intend,” “estimate,” “may,” “will,” “would,” “could,” “should” or other similar expressions. Additionally, all statements in this document, including forward-looking statements, speak only as of the date they are made, and the Company undertakes no obligation to update or revise any statement in light of new information or future events, except as required by law.
The Company’s ability to predict results or the actual effect of future plans or strategies is inherently uncertain. The factors that could cause actual results and outcomes to differ materially from those contained in the forward-looking statements included herein and that could have a material adverse effect on the operations and future prospects of the Company and its subsidiaries are detailed under “Risk Factors” and elsewhere in this report. These risks and uncertainties should be considered in evaluating forward-looking statements and undue reliance should not be placed on such statements.
PART I
Explanatory Note
This Annual Report on Form 10-K for the year ended December 31, 2015 (this “Form 10-K) is the Company’s first report since the Company filed its Annual Report on Form 10-K for the year ended December 31, 2014 on May 9, 2016. This Form 10-K for the year ended December 31, 2015 contains: (i) the consolidated financial information for the years ended December 31, 2015 and 2014 and the consolidated statements of operations, comprehensive income (loss), changes in stockholders equity and cash flows for the years ended December 31, 2015, 2014, and 2013; and (ii) the selected consolidated financial data for the years ended December 31, 2015, 2014, 2013, 2012, and 2011 (unaudited) required pursuant to Item 6 of this Form 10-K. The consolidated financial information as of and for the quarterly periods ended September 30, 2015, June 30, 2015, March 30, 2015, September 30, 2014, June 30, 2014, March 31, 2014, which have not been filed with the Securities and Exchange Commission (the “SEC”), will not be separately presented as the Company determined that due to the length of time that has passed the separate presentation is not material. Comparative quarterly information will, however, be provided in the Company’s Quarterly Reports on Form 10-Q for the quarterly periods beginning March 31, 2016.
As discussed in the Company’s Annual Report on Form 10-K for the year ended December 31, 2014 filed on May 9, 2016, subsequent to the issuance of the Company’s consolidated financial information on Form 10-Q as of and for the quarterly period ended June 30, 2012, the Company’s management determined that Los Alamos National Bank, the Company’s wholly-owned bank subsidiary (the “Bank”), had not properly recognized certain losses and risks inherent in its loan portfolio on a timely basis as disclosed in the Company’s Current Report on Form 8-K filed on November 13, 2012, April 26, 2013 and October 27, 2014 with the Securities and Exchange Commission (“SEC”). This failure was caused by the override of controls by certain former members of management and material weaknesses in internal control over financial reporting and disclosure controls. As a result, the Company restated its consolidated financial data for the years ended December 31, 2006 through 2011 and the consolidated financial information for the quarterly periods ended March 31, 2012 and June 30, 2012 (the “Restated Periods”). The Company filed the Annual Report on Form 10-K for the year ended December 31, 2013 on December 12, 2014, which included: (i) consolidated financial data for the years ended December 31, 2013, 2012, 2011, 2010 (unaudited) and 2009 (unaudited); and (ii) the consolidated financial statements for the Company for the years ended December 31, 2013 and 2012.
Financial information for the Restated Periods included in the Company’s Annual Reports on Form 10-K and Quarterly Reports on Form 10-Q and earnings press releases and similar communications issued prior to May 9, 2016, are superseded in their entirety by the Annual Report on Form 10-K for the year ended December 31, 2014 filed with the SEC on May 9, 2016.
As detailed in Item 9A, “Controls and Procedures” in this Form 10-K, there are material weaknesses in our internal control over financial reporting and disclosure controls dating to 2006, that have not yet been fully remediated. The override of controls by former members of management and these material weaknesses, caused the misstatements of the Company’s financial statements noted above.
For more information regarding the impact on the Company’s financial results, refer to Part I, Item 1A, “Risk Factors;” Part II, Item 6, “Selected Financial Data;” and Item 7, “Management's Discussion and Analysis of Financial Condition and Results of Operations;” and to our consolidated financial statements included in Part II, Item 8 of this Form 10K. Information regarding the internal control deficiencies identified by management and management's efforts to remediate those deficiencies can be found in Part II, Item 9A, “Controls and Procedures” of this Form 10-K.
Recent Developments
Stock Purchase Agreement with Certain Institutional and Accredited Investors
As previously disclosed, on September 8, 2016, the Company entered into a stock purchase agreement with Castle Creek Capital Partners VI, L.P. (“Castle Creek”), Patriot Financial Partners II, L.P., Patriot Financial Partners Parallel II, L.P. (together with Patriot Financial Partners II, L.P., “Patriot”) and Strategic Value Bank Partners LLC, through its fund, Strategic Value Investors LP (“SVBP”, and collectively, the “Investors”), pursuant to which the Company expects to raise gross proceeds of $52 million in a private placement transaction and to issue shares of the Company’s common stock, no par value, at a purchase price of $4.75 per share, and shares of a new series of nonvoting noncumulative convertible perpetual preferred stock, Series C, no par value, at a purchase price of $475.00 per share (the “Series C Preferred Stock”). Prior to the closing of the private placement transaction, the Company intends to file articles of amendment to the Company’s articles of incorporation setting forth the rights, preferences, and privileges of the Series C Preferred Stock. The private placement transaction is subject to customary closing conditions, including receipt of necessary regulatory approvals or nonobjections for the use of proceeds described below.
The Company intends to use the net proceeds of the private placement to repurchase all of the shares of the Company’s outstanding Series A Preferred Stock and Series B Preferred Stock, to pay the deferred interest on its trust preferred securities, and for general corporate purposes.
In connection with the private placement, the Company entered into a registration rights agreement (the “Registration Rights Agreement”) with each of Castle Creek and Patriot. Pursuant to the terms of the Registration Rights Agreement, the Company has agreed to file a resale registration statement for the purpose of registering the resale of the shares of the common stock and Series C preferred stock issued in the private placement and the underlying shares of common stock or non-voting common stock into which the shares of Series C Preferred Stock are convertible, as appropriate. The Company is obligated to file the registration statement no later than the third anniversary after the closing of the private placement.
In addition, prior to closing, Castle Creek and Patriot will enter into side letter agreements with us. Under the terms of a side letter agreements, each Investor will be entitled to have one representative appointed to our Board of Directors for so long as such investor, together with its respective affiliates, owns, in the aggregate, 5% or more of all of the outstanding shares of common stock (including shares of common stock issuable upon conversion of the Series C Preferred Stock or non-voting common stock). In addition, the Company agreed to reimburse certain of Castle Creek’s and Patriot’s legal fees and out-of-pocket expenses incurred in connection with their participation in the private placement.
The Company anticipates that the private placement transaction will close in fourth quarter 2016. Following the closing of the private placement transaction, the Company intends to conduct a $10.0 million registered public offering to its existing shareholders on the same terms as in the private placement transaction. The Investors are not entitled to participate in the rights offering pursuant to the stock purchase agreement.
Trinity Capital Corporation
General.
Trinity Capital Corporation, a bank holding company organized under the laws of the State of New Mexico, is the sole stockholder of the Bank and the sole stockholder of Title Guaranty & Insurance Company (“Title Guaranty”). The Bank is the sole stockholder of TCC Advisors Corporation (“TCC Advisors”), the sole member of LANB Investment Advisors, LLC, a New Mexico limited liability company (“LANB Investment Advisors”), the sole member of Triscensions ABQ, LLC, a New Mexico limited liability company, and the sole member of FNM Investment Fund IV, LLC, a Delaware Limited Liability Company (“FNM Investment Fund IV”). The Bank is also a member of Cottonwood Technology Group, LLC (“Cottonwood”), a management consulting and counseling company for technology startup companies, which is also designed to manage venture capital funds. FNM Investment Fund IV is a member of Finance New Mexico—Investor Series IV, LLC, a New Mexico Limited Liability Company (“FNM CDE IV”), an entity created by the Bank to fund loans and investments in a New Market Tax Credit project. In addition, Trinity owns all the common shares of four business trusts, created by Trinity for the sole purpose of issuing trust preferred securities that had an aggregate outstanding balance of $37.1 million as of December 31, 2015.
Trinity is located in Los Alamos, New Mexico, a small community in the Jemez Mountains of Northern New Mexico. Los Alamos County has approximately 17,800 residents. Los Alamos National Laboratory (the “Laboratory”) is a pre-eminent research facility for scientific and technological development in numerous scientific fields. As of December 31, 2015, the Laboratory employed (directly and indirectly) approximately 10,500 people, making it the largest employer in Los Alamos County. The Laboratory is the cornerstone of the community and has attracted numerous other scientific businesses to the area.
As a bank holding company, Trinity is regulated primarily by the Federal Reserve Bank of Kansas City. The primary business of Trinity is the operation of the Bank. The Bank was founded in 1963 by local investors to provide convenient, full-service banking to the unique scientific community that developed around the Laboratory. Trinity acquired the stock of the Bank in 1977. The Bank is a full-service commercial banking institution with seven bank offices in Los Alamos, White Rock, Santa Fe and Albuquerque, New Mexico and is regulated by the Office of the Comptroller of the Currency (“OCC”). The Bank provides a broad range of banking products and services, including credit, cash management, deposit, asset management and trust and investment services to our targeted customer base of individuals and small and medium-sized businesses. As of December 31, 2015, Trinity had total assets of $1.4 billion, net loans of $822.4 million and deposits (net of deposits of affiliates) of $1.3 billion.
In 2000, Trinity elected to become, and was approved as, a financial holding company, as defined in the BHCA, and purchased Title Guaranty. Title Guaranty was a title insurance company organized under the laws of the State of New Mexico doing business in Los Alamos and Santa Fe Counties. In August 2012, Trinity sold substantially all of the assets of Title Guaranty and exited the title insurance line of business. Trinity elected to resume its status as a bank holding company in 2013 and is no longer a financial holding company. As of December 31, 2015, Title Guaranty existed as a subsidiary of Trinity with effectively no assets. Trinity is in the process of dissolving Title Guaranty.
The Bank created TCC Advisors in February 2006 to enable Trinity to manage certain assets. In April 2010, the Bank activated TCC Advisors as a business unit operating one of the Bank's foreclosed properties, Santa Fe Equestrian Park, in Santa Fe, New Mexico, while seeking a sale of the property. Substantially all of the assets of TCC Advisors were sold in January 2015. Trinity is in the process of dissolving this entity. In February 2006, TCC Funds, a Delaware statutory trust was created with Trinity as its sponsor, to allow for the creation of a mutual fund. TCC Funds remains dormant with no planned use at this time. In August 2008, the Bank invested in Cottonwood. Cottonwood assists in the management of, and counsels, startup companies involved in technology transfer from research institutions in New Mexico, as well as establishing and managing venture funds. Additionally, the Bank is participating in a venture capital fund managed by Cottonwood. In 2009, the Bank created FNM Investment Fund IV to acquire a 99.99% interest in FNM CDE IV. Both of these entities were created for the sole purpose of funding loans to, and investments in, a New Market Tax Credit project located in downtown Albuquerque, New Mexico. In September 2010, the Bank invested in Southwest Medical Technologies, LLC (“SWMT”). In November 2015, the Bank sold its interests in SWMT and wrote down its remaining interest to zero. The Bank initially formed LANB Investment Advisors in October 2012 to house a Registered Investment Advisor as part of its Trust and Investment Department operations. This entity has remained dormant since its creation with no planned use at this time. Trinity is also in the process of dissolving this entity.
Corporate Information.
The address of our headquarters is 1200 Trinity Drive, Los Alamos, New Mexico 87544, our main telephone number is (505) 662-5171 and our general email address is
tcc@lanb.com
.
Trinity maintains a website at
https://www.lanb.com/home/tcc-investor-relations.
We make available free of charge on or through our website, Annual Reports on Form 10-K, proxy statements, Quarterly Reports on Form 10-Q, Current Reports on Form 8-K and amendments to those reports filed or furnished pursuant to Section 13(a) or 15(d) of the Securities Exchange Act of 1934, as amended (the “Exchange Act”) as soon as reasonably practicable after the Company electronically files such material with, or furnishes it to, the SEC. The Company will also provide copies of its filings free of charge upon written request to: TCC Stock Representative, Trinity Capital Corporation, Post Office Box 60, Los Alamos, New Mexico 87544. In addition, any materials we file with the SEC can be read and copied at the SEC’s Public Reference Room at 110 F Street, N.E., Washington, D.C. 20549. Information on the operation of the Public Reference Room can be obtained by calling the SEC at 1-800-SEC-0330. The SEC also maintains an internet site that contains reports, proxy and information statements, and other information regarding issuers such as Trinity. Trinity’s filings are available free of charge on the SEC’s website at
http://www.sec.gov
.
Los Alamos National Bank
General.
The Bank is a national banking organization created under the laws of the United States of America. The Bank is regulated primarily by the Office of the Comptroller of the Currency (“OCC”).
Products and Services.
The Bank provides a full range of financial services for deposit customers and lends money to creditworthy borrowers at competitive interest rates. The Bank’s products include certificates of deposit, checking and saving accounts, on-line banking, Individual Retirement Accounts, loans, mortgage loan servicing, trust and investment services, international services and safe deposit boxes. These business activities make up the Bank’s three key processes: investment of funds, generation of funds and service-for-fee income. The profitability of operations depends primarily on the Bank’s net interest income, which is the difference between total interest earned on interest-earning assets and total interest paid on interest-bearing liabilities, and its ability to maintain efficient operations. In addition to the Bank’s net interest income, it produces income through mortgage servicing operations and noninterest income processes, such as trust and investment services.
Lending Activities.
General.
The Bank provides a broad range of commercial and retail lending services to corporations, partnerships, individuals and government agencies primarily within the Bank’s existing market areas. The Bank actively markets its services to qualified borrowers. Lending officers build relationships with new borrowers entering the Bank’s market areas as well as long-standing members of the local business community. The Bank has established lending policies that include a number of underwriting factors to be considered in making a loan, including location, loan-to-value ratio, cash flow and the credit history of the borrower. As of December 31, 2015, the Bank’s maximum legal lending limit to one borrower was $22.1 million; however, the Bank may impose additional limitations on the amount it is willing to lend to one borrower as part of its credit risk management policies. The Bank’s loan portfolio is comprised primarily of loans in the areas of commercial real estate, residential real estate, construction, general commercial and consumer lending. In addition, Trinity has one construction loan. As of December 31, 2015, commercial real estate loans comprised approximately 44.2% of the total loan portfolio; residential real estate mortgages made up approximately 30.7%; general commercial loans comprised 11.1%; construction real estate loans comprised 10.6%; and consumer lending comprised 3.4%. In addition, the Bank originates residential mortgage loans for sale to third parties, primarily the Federal National Mortgage Association (“Fannie Mae”), and services most of these loans for the buyers; however, beginning in late 2015, management began moving toward a strategy to sell most newly originated mortgage loans with servicing released. In 2016, the Bank then made a further strategy change to an outsourced solution whereby the Bank generates residential mortgage applications for non-affiliated residential mortgage companies on a fee basis. These changes in strategy were primarily based upon new compliance requirements and capital treatment relating to residential mortgage loans.
Commercial Real Estate Loans.
The Bank’s commercial real estate lending concentrates on loans to building contractors and developers, as well as owner occupied properties. The Bank collateralizes these loans and, in most cases, obtains personal guarantees to help ensure repayment. The Bank’s commercial real estate loans are primarily made based on the identified cash flow of the borrower and secondarily on the underlying real estate collateral. Credit support provided by the borrower for most of these loans and the probability of repayment is based on the liquidation of the real estate and enforcement of a personal guarantee, if any exists. The primary repayment risk for a commercial real estate loan is the potential loss of revenue of the business which could impact the cash flows, and fair value of the property.
Residential Real Estate Loans.
Residential real estate lending has been an important part of the Bank’s business since its formation in 1963. The majority of the residential real estate loans originated and retained by the Bank are in the form of 15- and 30-year variable rate loans. The Bank also originates 15- to 30-year fixed rate residential mortgages and sells most of these loans to outside investors. In 2015, the Bank originated approximately $68.3 million in residential real estate loans sold to third parties. As of December 31, 2015, the total sold residential mortgage loan portfolio serviced by the Bank on behalf of third parties was $865.6 million. The Bank does not engage in financing sub-prime loans nor does it participate in any sub-prime lending programs. The Bank participates in the current U.S. Department of the Treasury (the “Treasury”) programs, including the Home Affordable Modification Program, to work with borrowers who are in danger of, or who have defaulted on residential mortgage loans.
Construction Loans.
The Bank is active in financing the construction of residential and commercial properties in New Mexico, primarily in Northern New Mexico. Management continues to de-emphasize this type of lending in favor of other types of loans. The Bank manages the risks of construction lending through the use of underwriting and construction loan guidelines and requires work be conducted by reputable contractors. Construction loans are structured either to convert to permanent loans at the end of the construction phase or to be paid off upon receiving financing from another financial institution. The amount financed on construction loans is based on the appraised value of the property, as determined by an independent appraiser, and an analysis of the potential marketability and profitability of the project and the costs of construction. Approximately 40% of all construction loans have terms that do not exceed 24 months. Loan proceeds are typically disbursed on a percentage of completion basis, as determined by inspections, with all construction required to be completed prior to the final disbursement of funds.
Construction loans afford the Bank an opportunity to receive yields higher than those obtainable on adjustable rate mortgage loans secured by existing residential properties. However, these higher yields correspond to the higher risks associated with construction lending.
Commercial Loans.
The Bank is an active commercial lender. The Bank’s focus in commercial lending concentrates on loans to business services companies and retailers. The Bank provides various credit products to commercial customers, including lines of credit for working capital and operational purposes and term loans for the acquisition of equipment and other purposes. Collateral on commercial loans typically includes accounts receivable, furniture, fixtures, inventory and equipment. In addition, most commercial loans have personal guarantees to ensure repayment. The terms of approximately 60% of commercial loans range from one to seven years. A significant portion of the Bank’s commercial business loans reprice within one year or have floating interest rates.
Consumer Loans.
The Bank also provides all types of consumer loans, including motor vehicle, home improvement, credit cards, signature loans and small personal credit lines. Consumer loans typically have shorter terms and lower balances with higher yields compared to the Bank’s other loans, but generally carry higher risks of default. Consumer loan collections are dependent on the borrower’s continuing financial stability, and thus are more likely to be affected by adverse personal circumstances.
Additional information on the risks associated with banking activities and products and concentrations can be found under Part I, Item 1A, “Risk Factors” of this Form 10-K.
Competition.
There is strong competition, both in originating loans and in attracting deposits, in the Bank’s market areas. Competition in originating real estate loans comes primarily from large regional banks, other commercial banks, credit unions, savings institutions and mortgage bankers making loans secured by real estate located in the Bank’s market areas. Commercial banks, credit unions and finance companies, including finance company affiliates of automobile manufacturers, provide vigorous competition in consumer lending. The Bank competes for real estate and other loans principally on the basis of the interest rates and loan fees charged, the types of loans originated and the quality and speed of services provided to borrowers. Insurance companies and internet-based financial institutions present growing areas of competition both for loans and deposits.
There is substantial competition in attracting deposits from other commercial banks, savings institutions, money market and mutual funds, credit unions and other investment vehicles. The Bank’s ability to attract and retain deposits depends on its ability to provide investment opportunities that satisfy the requirements of investors as to rate of return, liquidity, risk and other factors. The financial services industry has become more competitive as technological advances enable companies to provide financial services to customers outside their traditional geographic markets and provide alternative methods for financial transactions. These technological advances may diminish the importance of depository institutions and other financial intermediaries in the transfer of funds between parties.
Employees.
As of December 31, 2015, we had 307 full time-equivalent employees. As of June 30, 2016, the number of full-time equivalent employees has been reduced to 296. We are not a party to any collective bargaining agreements.
Supervision and Regulation
General.
Financial institutions, their holding companies and their affiliates are extensively regulated under federal and state law. As a result, the growth and earnings performance of Trinity may be affected not only by management decisions and general economic conditions, but also by requirements of federal and state statutes and by the regulations and policies of various bank regulatory agencies, including the OCC, the Board of Governors of the Federal Reserve System (the “FRB”), the Federal Deposit Insurance Corporation (the “FDIC”) and the Consumer Financial Protection Bureau (the “CFPB”). Furthermore, taxation laws administered by the Internal Revenue Service and state taxing authorities, accounting rules developed by the Financial Accounting Standards Board (the “FASB”) and securities laws administered by the SEC and state securities authorities have an impact on the business of Trinity. The effect of these statutes, regulations, regulatory policies and accounting rules are significant to the operations and results of Trinity and the Bank, and the nature and extent of future legislative, regulatory or other changes affecting financial institutions are impossible to predict with any certainty.
Federal and state banking laws impose a comprehensive system of supervision, regulation and enforcement on the operations of financial institutions, their holding companies and affiliates that is intended primarily for the protection of the FDIC-insured deposits and depositors of banks, rather than stockholders. These federal and state laws, and the regulations of the bank regulatory agencies issued under them, affect, among other factors, the scope of business, the kinds and amounts of investments banks may make, reserve requirements, capital levels relative to operations, the nature and amount of collateral for loans, the establishment of branches, the ability to merge, consolidate and acquire, dealings with insiders and affiliates and the payment of dividends. The nature and extent of future legislative, regulatory or other changes affecting financial institutions are impossible to predict with any certainty.
This supervisory and regulatory framework subjects banks and bank holding companies to regular examination by their respective regulatory agencies, which results in examination reports and ratings that are not publicly available and that can impact the conduct and growth of their business. These examinations consider not only compliance with applicable laws and regulations, but also capital levels, asset quality and risk, management ability and performance, earnings, liquidity, and various other factors. The regulatory agencies generally have broad discretion to impose restrictions and limitations on the operations of a regulated entity where the agencies determine, among other factors, that such operations are unsafe or unsound, fail to comply with applicable law or are otherwise inconsistent with laws and regulations or with the supervisory policies of these agencies.
The following is a summary of the material elements of the supervisory and regulatory framework applicable to Trinity and the Bank. It does not describe all of the statutes, regulations and regulatory policies that apply, nor does it restate all of the requirements of those that are described. The descriptions are qualified in their entirety by reference to the particular statutory and regulatory provision.
Financial Regulatory Reform.
On July 21, 2010, President Obama signed the Dodd-Frank Wall Street Reform and Consumer Protection Act (the “Dodd-Frank Act”) into law. The Dodd-Frank Act represents a sweeping reform of the U.S. supervisory and regulatory framework applicable to financial institutions and capital markets in the wake of the global financial crisis, certain aspects of which are described below in more detail. In particular, and among other
factors
, the Dodd-Frank Act: created a Financial Stability Oversight Council as part of a regulatory structure for identifying emerging systemic risks and improving interagency cooperation; created the CFPB, which is authorized to regulate providers of consumer credit, savings, payment and other consumer financial products and services; narrowed the scope of federal preemption of state consumer laws enjoyed by national banks and federal savings associations and expanded the authority of state attorneys general to bring actions to enforce federal consumer protection legislation; imposed more stringent capital requirements on bank holding companies and subjected certain activities, including interstate mergers and acquisitions, to heightened capital conditions; with respect to mortgage lending, (i) significantly expanded requirements applicable to loans secured by 1-4 family residential real property, (ii) imposed strict rules on mortgage servicing, and (iii) required the originator of a securitized loan, or the sponsor of a securitization, to retain at least 5% of the credit risk of securitized exposures unless the underlying exposures are qualified residential mortgages or meet certain underwriting standards; repealed the prohibition on the payment of interest on business checking accounts; restricted the interchange fees payable on debit card transactions for issuers with $10 billion in assets or greater; in the so-called “Volcker Rule,” subject to numerous exceptions, prohibited depository institutions and affiliates from certain investments in, and sponsorship of, hedge funds and private equity funds and from engaging in proprietary trading; provided for enhanced regulation of advisers to private funds and of the derivatives markets; enhanced oversight of credit rating agencies; and prohibited banking agency requirements tied to credit ratings. These statutory changes shifted the regulatory framework for financial institutions, impacted the way in which they do business and have the potential to constrain revenues.
Numerous provisions of the Dodd-Frank Act are required to be implemented through rulemaking by the appropriate federal regulatory agencies. Although the majority of the Dodd-Frank Act’s rulemaking requirements have been met with finalized rules, approximately one-third of the rulemaking requirements are either still in the proposal stage or have not yet been proposed. Accordingly, it is difficult to anticipate the continued impact this expansive legislation will have on Trinity, the Bank, its customers and the financial industry generally. Furthermore, while the reforms primarily target systemically important financial service providers, their influence is expected to filter down in varying degrees to smaller institutions over time. Management of Trinity and the Bank will continue to evaluate the effect of the Dodd-Frank Act changes; however
n
o current assurance may be given that the Dodd-Frank Act, or any other new legislative changes, will not have a negative impact on the results of operations and financial condition of Trinity and the Bank.
Trinity and Bank Required Capital Levels.
Due to the risks to their business, depository institutions are generally required to hold more capital than other businesses, which directly affects earnings capabilities. While capital has historically been one of the key measures of the financial health of both bank holding companies and banks, its role is becoming fundamentally more important in the wake of the global financial crisis, as the banking regulators recognized that the amount and quality of capital held by banks prior to the crisis was insufficient to absorb losses during periods of severe stress. Certain provisions of the Dodd-Frank Act and Basel III, discussed below, establish strengthened capital standards for banks and bank holding companies, require more capital to be held in the form of common stock and disallow certain funds from being included in capital determinations. Once fully implemented, these standards will represent regulatory capital requirements that are meaningfully more stringent than those in place historically.
Bank regulatory agencies are uniformly encouraging banks and bank holding companies to be “well-capitalized” and, to that end, federal law and regulations provide various incentives for banking organizations to maintain regulatory capital at levels in excess of minimum regulatory requirements. For example, a banking organization that is “well-capitalized” may: (i) qualify for exemptions from prior notice or application requirements otherwise applicable to certain types of activities; (ii) qualify for expedited processing of other required notices or applications; and (iii) accept brokered deposits.
The OCC and FRB guidelines also provide that banks and bank holding companies experiencing internal growth or making acquisitions will be expected to maintain capital positions substantially above the minimum supervisory levels without significant reliance on intangible assets. Furthermore, the guidelines indicate that the agencies will continue to consider a “tangible Tier 1 leverage ratio” (deducting all intangibles) in evaluating proposals for expansion or to engage in new activities.
Higher capital levels may also be required if warranted by the particular circumstances or risk profiles of individual banking organizations. For example, the FRB’s capital guidelines contemplate that additional capital may be required to take adequate account of, among other factors, interest rate risk, or the risks posed by concentrations of credit, nontraditional activities or securities trading activities. Further, any banking organization experiencing or anticipating significant growth would be expected to maintain capital ratios, including tangible capital positions (i.e., Tier 1 Capital less all intangible assets), well above the minimum levels.
As of December 31, 2015, the Bank exceeded its minimum regulatory capital requirements under OCC capital adequacy guidelines. However, as discussed under “– The Bank – Enforcement Action,” the Bank has agreed with the OCC to maintain certain heightened regulatory capital ratios. As of December 31, 2015, the Bank exceeded the heightened regulatory capital ratios to which it had agreed. As of December 31, 2015, Trinity had regulatory capital in excess of the FRB’s requirements and met the Dodd-Frank Act requirements.
Basel III.
After an extended rulemaking process that included a prolonged comment period, in July 2013, the U.S. federal banking agencies approved the implementation of the Basel III regulatory capital reforms in pertinent part, and, at the same time, promulgated rules effecting certain changes required by the Dodd-Frank Act (the “Basel III Rule”). In contrast to capital requirements historically, which were in the form of guidelines, Basel III was released in the form of regulations by each of the agencies. The Basel III Rule is applicable to all U.S. banks that are subject to minimum capital requirements, including federal and state banks and savings and loan associations, as well as to bank and savings and loan holding companies other than “small bank holding companies” (generally bank holding companies with consolidated assets of less than $1 billion).
The Basel III Rule not only increases most of the required minimum capital ratios, but it introduces the concept of Common Equity Tier 1 Capital, which consists primarily of common stock, related surplus (net of Treasury stock), retained earnings, and Common Equity Tier 1 minority interests subject to certain regulatory adjustments. The Basel III Rule also expanded the definition of capital as in effect currently by establishing more stringent criteria that instruments must meet to be considered Additional Tier 1 Capital (Tier 1 Capital in addition to Common Equity) and Tier 2 Capital. A number of instruments qualified as Tier 1 Capital prior to Basel III implementation do not qualify, or their qualifications have changed. For example, cumulative preferred stock and certain hybrid capital instruments, including trust preferred securities, no longer qualify as Tier 1 Capital of any kind, with the exception, subject to certain restrictions, of such instruments issued before May 10, 2010, by bank holding companies with total consolidated assets of less than $15 billion as of December 31, 2009. For those institutions, trust preferred securities and other non-qualifying capital instruments currently included in consolidated Tier 1 Capital are permanently grandfathered under the Basel III Rule, subject to certain restrictions. Noncumulative perpetual preferred stock, which now qualifies as simple Tier 1 Capital, will not qualify as Common Equity Tier 1 Capital, but will qualify as Additional Tier 1 Capital. The Basel III Rule also constrains the inclusion of minority interests, mortgage-servicing assets, and deferred tax assets in capital and requires deductions from Common Equity Tier 1 Capital in the event such assets exceed a certain percentage of a bank’s Common Equity Tier 1 Capital.
The Basel III Rule requires:
| · |
A new required ratio of minimum Common Equity Tier 1 equal to 4.5% of risk-weighted assets;
|
| · |
An increase in the minimum required amount of Tier 1 Capital from the current level of 4% of total assets to 6% of risk-weighted assets;
|
| · |
A continuation of the current minimum required amount of Total Capital (Tier 1 plus Tier 2) at 8% of risk-weighted assets; and
|
| · |
A minimum leverage ratio of Tier 1 Capital to total assets equal to 4% in all circumstances.
|
Trinity and the Bank are also required to maintain a “capital conservation buffer” of 2.5% above the new regulatory minimum risk-based capital requirements. The purpose of the conservation buffer is to ensure that banks maintain a buffer of capital that can be used to absorb losses during periods of financial and economic stress. The capital conservation buffer will begin to be phased in beginning in January 2016 at 0.625% of risk-weighted assets and will increase by that amount each year until fully implemented in January 2019. An institution would be subject to limitations on certain activities, including payment of dividends, share repurchases and discretionary bonuses to executive officers, if its capital level is below the buffered ratio. Factoring in the fully phased-in conservation buffer increases the minimum ratios described above to 7.0% for Common Equity Tier 1, 8.5% for Tier 1 Capital and 10.5% for Total Capital.
The Basel III Rule maintains the general structure of the current prompt corrective action framework, while incorporating the increased requirements. The prompt corrective action guidelines were also revised to add the Common Equity Tier 1 Capital ratio. In order to be a “well-capitalized” depository institution under the new regime, a bank must maintain a Common Equity Tier 1 Capital ratio of 6.5% or more; a Tier 1 Capital ratio of 8.0% or more; a Total Capital ratio of 10.0% or more; and a leverage ratio of 5.0% or more. It is possible under the Basel III Rule to be well-capitalized while remaining out of compliance with the capital conservation buffer discussed above.
The Basel III Rule revises a number of the risk weightings (or their methodologies) for bank assets that are used to determine the capital ratios. For nearly every class of assets, the Basel III Rule requires a more complex, detailed and calibrated assessment of credit risk and calculation of risk weightings. While Basel III would have changed the risk-weighting for residential mortgage loans based on loan-to-value ratios and certain product and underwriting characteristics, there was concern in the United States that the proposed methodology for risk weighting residential mortgage exposures and the higher risk weightings for certain types of mortgage products would increase costs to consumers and reduce their access to mortgage credit. As a result, the Basel III Rule does not effect this change, and banks will continue to apply a risk weight of 50% or 100% to their exposure from residential mortgages, with the risk weighting depending on, among other factors, whether the mortgage was a prudently underwritten first lien mortgage.
Furthermore, there was significant concern noted by the financial industry in connection with the Basel III rulemaking as to the proposed treatment of accumulated other comprehensive income (“AOCI”). Basel III requires unrealized gains and losses on available-for-sale securities to flow through to regulatory capital as opposed to the current treatment, which neutralizes such effects. Recognizing the problem for community banks, the U.S. bank regulatory agencies adopted the Basel III Rule with a one-time election for smaller institutions like Trinity and the Bank to opt out of including most elements of AOCI in regulatory capital. This opt-out, which was required to be made in the first quarter of 2015, excluded from regulatory capital both unrealized gains and losses on available-for-sale debt securities and accumulated net gains and losses on cash-flow hedges and amounts attributable to defined benefit post-retirement plans. Trinity made the opt-out election in the first quarter of 2015.
Generally, financial institutions (except for large, internationally active financial institutions) became subject to the new rules on January 1, 2015. However, there are separate phase-in/phase-out periods for: (i) the capital conservation buffer; (ii) regulatory capital adjustments and deductions; (iii) non-qualifying capital instruments; and (iv) changes to the prompt corrective action rules. The phase-in periods commence on January 1, 2016 and extend until 2019.
Prompt Corrective Action
.
A banking organization’s capital plays an important role in connection with regulatory enforcement as well. Federal law provides the federal banking regulators with broad power to take prompt corrective action to resolve the problems of undercapitalized institutions. The extent of the regulators’ powers depends on whether the institution in question is “adequately capitalized,” “undercapitalized,” “significantly undercapitalized” or “critically undercapitalized,” in each case as defined by regulation. Depending upon the capital category to which an institution is assigned, the regulators’ corrective powers include: (i) requiring the institution to submit a capital restoration plan; (ii) limiting the institution’s asset growth and restricting its activities; (iii) requiring the institution to issue additional capital stock (including additional voting stock) or to be acquired; (iv) restricting transactions between the institution and its affiliates; (v) restricting the interest rate that the institution may pay on deposits; (vi) ordering a new election of directors of the institution; (vii) requiring that senior executive officers or directors be dismissed; (viii) prohibiting the institution from accepting deposits from correspondent banks; (ix) requiring the institution to divest certain subsidiaries; (x) prohibiting the payment of principal or interest on subordinated debt; and (xi) ultimately, appointing a receiver for the institution.
As of December 31, 2015, the Bank exceeded its minimum regulatory capital requirements under OCC capital adequacy guidelines and the heightened regulatory capital ratios discussed under “The Bank – Enforcement Action”. As of December 31, 2015, Trinity had regulatory capital in excess of the FRB’s requirements and met the Dodd-Frank Act requirements.
Trinity
General.
Trinity, as the sole stockholder of the Bank, is a bank holding company. As a bank holding company, Trinity is registered with, and is subject to regulation and examination by, the FRB under the BHCA. In accordance with FRB policy, and as now codified by the Dodd-Frank Act, Trinity is legally obligated to act as a source of financial strength to the Bank and to commit resources to support the Bank in circumstances where Trinity might not otherwise do so. Trinity is required to file with the FRB periodic reports of Trinity’s operations and such additional information regarding Trinity and its subsidiaries as the FRB may require.
Enforcement Action.
On September 26, 2013, the FRB entered into a Written Agreement with Trinity (the “Written Agreement”). The Written Agreement requires Trinity to serve as a source of strength to the Bank and restricts Trinity’s ability to issue dividends and other capital distributions and to repurchase or redeem any Trinity stock without the prior written approval of the FRB. The Written Agreement further requires that Trinity implement a capital plan, subject to approval by the FRB, and submit cash flow projections to the FRB. Finally, the Written Agreement requires Trinity to comply with all applicable laws and regulations and to provide quarterly progress reports to the FRB.
Because Trinity is deemed to be in “troubled condition” by virtue of the Written Agreement, it also is required to: (i) obtain the prior approval of the FRB for the appointment of new directors and the hiring or promotion of senior executive officers; and (ii) comply with restrictions on severance payments and indemnification payments to institution-affiliated parties.
Acquisitions, Change in Control, and Activities
.
The primary purpose of a bank holding company is to control and manage banks.
The BHCA generally requires the prior approval of the FRB for any merger involving a bank holding company or any acquisition by a bank holding company of another bank or bank holding company. Subject to certain conditions (including deposit concentration limits established by the BHCA and the Dodd-Frank Act), the FRB may allow a bank holding company to acquire banks located in any state of the United States. In approving interstate acquisitions, the FRB is required to give effect to applicable state law limitations on the aggregate amount of deposits that may be held by the acquiring bank holding company and its insured depository institution affiliates in the state in which the target bank is located (provided that those limits do not discriminate against out-of-state depository institutions or their holding companies) and state laws that require the target bank be in existence for a minimum period of time (not to exceed five years) before being acquired by an out-of-state bank holding company. Furthermore, in accordance with the Dodd-Frank Act, bank holding companies must be well-capitalized and well-managed in order to effect interstate mergers or acquisitions.
Under the BHCA, Trinity must obtain prior approval of the FRB or, acting under delegated authority, the appropriate Federal Reserve Bank before (1) acquiring direct or indirect ownership or control of any class of voting securities of any bank or bank holding company if, after the acquisition, Trinity would directly or indirectly own or control 5% or more of the class; (2) acquiring all or substantially all of the assets of another bank or bank holding company; or (3) merging or consolidating with another bank holding company.
Under the BHCA, any company must obtain approval of the FRB or, acting under delegated authority, the appropriate Federal Reserve Bank, prior to acquiring control of Trinity or the Bank. For purposes of the BHCA, “control” is defined as ownership of 25% or more of any class of voting securities of Trinity or the Bank, the ability to control the election of a majority of the directors, or exercise of a controlling influence over management or policies of Trinity or the Bank.
The Change in Bank Control Act, as amended (the “CIBC”), and the related regulations of the FRB require any person or groups of persons acting in concert (except for companies required to make application under the BHCA), to file a written notice with the FRB or, acting under delegated authority, the appropriate Federal Reserve Bank, before the person or group acquires control of Trinity. The CIBC defines “control” as the direct or indirect power to vote 25% or more of any class of voting securities or to direct the management or policies of a bank holding company or an insured bank. A rebuttable presumption of control arises under the CIBC where a person or group controls 10% or more, but less than 25%, of a class of the voting stock of a company or insured bank which is a reporting company under the Exchange Act, such as Trinity, or such ownership interest is greater than the ownership interest held by any other person or group.
In addition, the CIBC prohibits any entity from acquiring 25% (5% in the case of an acquirer that is a bank holding company) or more of a bank holding company’s or bank’s voting securities, or otherwise obtaining control or a controlling influence over a bank holding company or bank without the approval of the FRB. On September 22, 2008, the FRB issued a policy statement on equity investments in bank holding companies and banks, which allows the FRB to generally be able to conclude that an entity’s investment is not “controlling” if the investment in the form of voting and nonvoting shares represents in the aggregate (i) less than one-third of the total equity of the banking organization (and less than one-third of any class of voting securities, assuming conversion of all convertible nonvoting securities held by the entity) and (ii) less than 15% of any class of voting securities of the banking organization.
The BHCA generally prohibits Trinity from acquiring direct or indirect ownership or control of more than 5% of the voting shares of any company that is not a bank and from engaging in any business other than that of banking, managing and controlling banks or furnishing services to banks and their subsidiaries. This general prohibition is subject to a number of exceptions. The principal exception allows bank holding companies to engage in, and to own shares of companies engaged in, certain businesses found by the FRB prior to November 11, 1999 to be “so closely related to banking ... as to be a proper incident thereto.” This authority would permit Trinity to engage in a variety of banking-related businesses, including the ownership and operation of a savings association, or any entity engaged in consumer finance, equipment leasing, the operation of a computer service bureau (including software development) and mortgage banking and brokerage. The BHCA generally does not place territorial restrictions on the domestic activities of non-bank subsidiaries of bank holding companies.
Additionally, bank holding companies that meet certain eligibility requirements prescribed by the BHCA and elect to operate as financial holding companies may engage in, or own shares in companies engaged in, a wider range of nonbanking activities, including securities and insurance underwriting and sales, merchant banking and any other activity that the FRB, in consultation with the Secretary of the Treasury, determines by regulation or order is financial in nature or incidental to any such financial activity or that the FRB determines by order to be complementary to any such financial activity and does not pose a substantial risk to the safety or soundness of depository institutions or the financial system generally. Trinity does not currently operate as a financial holding company.
U.S. Government Investment in Bank Holding Companies.
In response to the 2008 financial crisis affecting the U.S. banking system and financial markets, on October 3, 2008, the U.S. Congress passed, and President Bush signed into law, the Emergency Economic Stabilization Act of 2008 (the “EESA”). The EESA authorized the Secretary of the Treasury to implement various temporary emergency programs designed to strengthen the capital positions of financial institutions and stimulate the availability of credit within the U.S. financial system. Financial institutions participating in certain of the programs established under the EESA are required to adopt the Treasury’s standards for executive compensation and corporate governance.
On October 14, 2008, the Treasury announced a program that provided Tier 1 Capital (in the form of perpetual preferred stock and common stock warrants) to eligible financial institutions. This program, known as the TARP Capital Purchase Program (the “CPP”), allocated $250 billion from the $700 billion authorized by EESA to the Treasury for the purchase of senior preferred shares from qualifying financial institutions. Eligible institutions were able to sell equity interests to the Treasury in amounts equal to between 1% and 3% of the institution’s risk-weighted assets. Trinity determined participation in the CPP to be in its best interests based upon the economic uncertainties of the deep recession, the benefits of holding additional capital and the relatively low cost of participation.
As part of this program, on March 27, 2009, Trinity participated in this program by issuing 35,539 shares of Trinity’s Fixed Rate Cumulative Perpetual Preferred Stock, Series A (the “Series A Preferred Stock”) to the Treasury for a purchase price of $35.5 million in cash and issued warrants that were immediately exercised by the Treasury for 1,777 shares of Trinity’s Fixed Rate Cumulative Perpetual Preferred Stock, Series B (the “Series B Preferred Stock”). The Series A Preferred Stock is non-voting and pays dividends at the rate of 5% per annum for the first five years and thereafter at a rate of 9% per annum. The Series B Preferred Stock is also non-voting and pays dividends at the rate of 9% per annum from the date of the transaction.
Participating financial institutions were required to adopt the Treasury’s standards for executive compensation and corporate governance for the period during which the Treasury held equity issued under the CPP. These requirements were no longer applicable to Trinity effective August 10, 2012, the date Treasury sold its ownership of the Series A Preferred Stock and the Series B Preferred Stock to third parties.
Dividend Payments.
In addition to applicable restrictions in the Written Agreement, Trinity’s ability to pay dividends to its stockholders also may be affected by both general corporate law considerations and policies of the FRB applicable to bank holding companies. New Mexico law prohibits Trinity from paying dividends if, after giving effect to the dividend: (i) Trinity would be unable to pay its debts as they become due in the usual course of its business; or (ii) Trinity’s total assets would be less than the sum of its total liabilities and (unless Trinity’s articles of incorporation otherwise permit) the maximum amount that then would be payable, in any liquidation, in respect of all outstanding shares having preferential rights in liquidation.
Further, the terms of the Series A Preferred Stock and the Series B Preferred Stock (collectively “Preferred Stock”) provide that no dividends on any common or preferred stock that ranks equal to or junior to the Preferred Stock may be paid unless and until all accrued and unpaid dividends for all past dividend periods on the Preferred Stock have been fully paid. Similarly, the terms of the trust preferred securities include a restriction on the payment of dividends on any common or preferred stock that ranks equal or junior to such trust preferred securities unless and until all accrued and unpaid interest for all past periods have been fully paid. As discussed in Part II, Item 8, Footnote 10 of this Form 10-K, Trinity is currently deferring dividends and interest payments on these securities in accordance with their terms.
As a general matter, the FRB has indicated that the board of directors of a bank holding company should eliminate, defer or significantly reduce dividends to stockholders if: (i) the company’s net income available to stockholders for the past four quarters, net of dividends previously paid during that period, is not sufficient to fully fund the dividends; (ii) the prospective rate of earnings retention is inconsistent with the company’s capital needs and overall current and prospective financial condition; or (iii) the company will not meet, or is in danger of not meeting, its minimum regulatory capital adequacy ratios. The FRB also possesses enforcement powers over bank holding companies and their non-bank subsidiaries to prevent or remedy actions that represent unsafe or unsound practices or violations of applicable statutes and regulations. Among these powers is the ability to proscribe the payment of dividends by banks and bank holding companies. As discussed above in “Trinity – Enforcement Action,” the Written Agreement restricts the ability of Trinity to pay dividends without FRB approval.
Source of Strength.
Under the FRB's “source-of-strength” doctrine, a bank holding company is required to act as a source of financial and managerial strength to any of its subsidiary banks. The holding company is expected to commit resources to support a subsidiary bank, including at times when the holding company may not be in a financial position to provide such support. A bank holding company's failure to meet its source-of-strength obligations may constitute an unsafe and unsound practice or a violation of the FRB's regulations, or both. The source-of-strength doctrine most directly affects bank holding companies in situations where the bank holding company's subsidiary bank fails to maintain adequate capital levels. This doctrine was codified by the Dodd-Frank Act, but the FRB has not yet adopted regulations to implement this requirement.
Federal Securities Regulation.
Trinity’s common stock is registered with the SEC under the Securities Act of 1933, as amended, and the Exchange Act. Consequently, Trinity is subject to the information, proxy solicitation, insider trading and other restrictions and requirements of the SEC under the Exchange Act.
Corporate Governance
.
The Dodd-Frank Act addresses many investor protections, corporate governance and executive compensation matters that will affect most U.S. publicly traded companies. T
he Dodd-Frank Act will increase stockholder influence over boards of directors by requiring companies to give stockholders a non-binding vote on executive compensation and so-called “golden parachute” payments, and authorizing the SEC to promulgate rules that would allow stockholders to nominate and solicit voters for their own candidates using a company’s proxy materials. The legislation also directs the FRB to promulgate rules prohibiting excessive compensation paid to executives of bank holding companies, regardless of whether such companies are publicly traded.
The Bank
General.
The Bank is a national bank, chartered by the OCC under the National Bank Act. The deposit accounts of the Bank are insured by the FDIC’s Deposit Insurance Fund (the “DIF”) to the maximum extent provided under federal law and FDIC regulations, and the Bank is a member of the Federal Reserve System. As a national bank, the Bank is subject to the examination, supervision, reporting and enforcement requirements of the OCC. The FDIC, as administrator of the DIF, also has regulatory authority over the Bank. The Bank is also a member of the Federal Home Loan Bank System, which provides a central credit facility primarily for member institutions.
Enforcement Actions.
On November 30, 2012, the Bank entered into a Formal Agreement with the OCC (the “Formal Agreement”). On December 17, 2013, the Bank entered into a Consent Order with the OCC (the “Consent Order”). The focus of the Consent Order, which terminated the Bank’s Formal Agreement, is on improving the Bank’s credit administration, credit underwriting, internal controls, compliance and management supervision. Additionally, the Consent Order requires that the Bank maintain certain capital ratios and receive approval of the OCC prior to declaring dividends. The Consent Order requires the Bank to maintain the following minimum capital ratios: (i) a Tier 1 leverage ratio of at least 8%; and (ii) a Total risk-based capital ratio of at least 11%. This requirement to meet and maintain a specific capital level in the Consent Order means that the Bank may not be deemed to be “well capitalized” under the prompt corrective action rules.
Because the Bank is deemed to be in “troubled condition” by virtue of the Consent Order, it also is required to: (i) obtain the prior approval of the OCC for the appointment of new directors and the hiring or promotion of senior executive officers; and (ii) comply with restrictions on severance payments and indemnification payments to institution-affiliated parties.
Deposit Insurance
.
The Dodd-Frank Act permanently increases the maximum amount of deposit insurance for bank, savings institutions, and credit unions to $250,000 per insured depositor, retroactive to January 1, 2009. As an FDIC-insured institution, the Bank is required to pay deposit insurance premium assessments to the FDIC. The FDIC has adopted a risk-based assessment system whereby FDIC-insured depository institutions pay insurance premiums at rates based on their risk classification. An institution’s risk classification is assigned based on its capital levels and the level of supervisory concern the institution poses to the regulators.
Under the Federal Deposit Insurance Act an institution’s assessment base is calculated based on its average consolidated total assets less its average tangible equity. This may shift the burden of deposit insurance premiums toward those large depository institutions that rely on funding sources other than U.S. deposits. Additionally, the Dodd-Frank Act makes changes to the minimum designated reserve ratio of the DIF, increasing the minimum from 1.15% to 1.35% of the estimated amount of total insured deposits, and eliminating the requirement that the FDIC pay dividends to depository institutions when the reserve ratio exceeds certain thresholds. The FDIC has until September 3, 2020 to meet the 1.35% reserve ratio target. Several of these provisions could increase the Bank’s FDIC deposit insurance premiums.
In addition, all FDIC-insured institutions are required to pay assessments to the FDIC to fund interest payments on bonds issued by the Financing Corporation (“FICO”), an agency of the federal government established to recapitalize the predecessor to the DIF. These assessments, which are included in Deposit Insurance Premiums on the Consolidated Statements of Income, will continue until the FICO bonds mature between 2017 and 2019.
Supervisory Assessments
.
National banks are required to pay supervisory assessments to the OCC to fund the operations of the OCC. The amount of the assessment is calculated using a formula that takes into account the bank’s size and its supervisory condition.
During the years ended December 31, 2015 and 2014, the Bank paid supervisory assessments to the OCC totaling $648 thousand and $662 thousand, respectively.
Dividend Payments.
The primary source of funds for Trinity is dividends from the Bank. Under the National Bank Act, a national bank may pay dividends out of its undivided profits in such amounts and at such times as the bank’s board of directors deems prudent. Without prior OCC approval, however, a national bank may not pay dividends in any calendar year that, in the aggregate, exceed the bank’s year-to-date net income plus the bank’s retained net income for the two preceding years.
The payment of dividends by any financial institution is affected by the requirement to maintain adequate capital pursuant to applicable capital adequacy guidelines and regulations, and a financial institution generally is prohibited from paying any dividends if, following payment thereof, the institution would be undercapitalized.
The Bank may not pay any dividend unless it complies with certain provisions of the Consent Order and receives a prior written determination of no supervisory objection from the OCC.
Insider Transactions.
The Bank is subject to certain restrictions imposed by federal law on “covered transactions” between the Bank and its “affiliates.” Trinity is an affiliate of the Bank for purposes of these restrictions, and covered transactions subject to the restrictions include extensions of credit to Trinity, investments in the stock or other securities of Trinity and the acceptance of the stock or other securities of Trinity as collateral for loans made by the Bank. The Dodd-Frank Act enhances the requirements for certain transactions with affiliates as of July 21, 2011, including an expansion of the definition of “covered transactions” and an increase in the amount of time for which collateral requirements regarding covered transactions must be maintained.
Certain limitations and reporting requirements are also placed on extensions of credit by the Bank to its directors and officers, to directors and officers of Trinity and its subsidiaries, to principal stockholders of Trinity and to “related interests” of such directors, officers and principal stockholders. In addition, federal law and regulations may affect the terms upon which any person who is a director or officer of Trinity or the Bank, or a principal stockholder of Trinity, may obtain credit from banks with which the Bank maintains a correspondent relationship.
Safety and Soundness Standards/ Risk Management.
The federal banking agencies have adopted guidelines that establish operational and managerial standards to promote the safety and soundness of federally insured depository institutions. The guidelines set forth standards for internal controls, information systems, internal audit systems, loan documentation, credit underwriting, interest rate exposure, asset growth, compensation, fees and benefits, asset quality and earnings.
In general, the safety and soundness guidelines prescribe the goals to be achieved in each area, and each institution is responsible for establishing its own procedures to achieve those goals. If an institution fails to comply with any of the standards set forth in the guidelines, the institution’s primary federal regulator may require the institution to submit a plan for achieving and maintaining compliance. If an institution fails to submit an acceptable compliance plan, or fails in any material respect to implement a compliance plan that has been accepted by its primary federal regulator, the regulator is required to issue an order directing the institution to cure the deficiency. Until the deficiency cited in the regulator’s order is cured, the regulator may restrict the institution’s rate of growth, require the institution to increase its capital, restrict the rates the institution pays on deposits or require the institution to take any action the regulator deems appropriate under the circumstances. Noncompliance with the standards established by the safety and soundness guidelines may also constitute grounds for other enforcement action by the federal banking regulators, including cease and desist orders and civil money penalty assessments.
During the past decade, the bank regulatory agencies have increasingly emphasized the importance of sound risk management processes and strong internal controls when evaluating the activities of the institutions they supervise. Properly managing risks has been identified as critical to the conduct of safe and sound banking activities and has become even more important as new technologies, product innovation, and the size and speed of financial transactions have changed the nature of banking markets. The agencies have identified a spectrum of risks facing a banking institution including, but not limited to, credit, market, liquidity, operational, legal, and reputational risk. In particular, recent regulatory pronouncements have focused on operational risk, which arises from the potential that inadequate information systems, operational problems, breaches in internal controls, fraud, or unforeseen catastrophes will result in unexpected losses. The Bank is expected to have active board and senior management oversight; adequate policies, procedures, and limits; adequate risk measurement, monitoring, and management information systems; and comprehensive internal controls.
Branching Authority
.
National banks headquartered in New Mexico, such as the Bank, have the same branching rights in New Mexico as banks chartered under New Mexico law, subject to OCC approval. New Mexico law grants New Mexico-chartered banks the authority to establish branches anywhere in the State of New Mexico, subject to receipt of all required regulatory approvals.
Federal law permits state and national banks to merge with banks in other states subject to: (i) regulatory approval; (ii) federal and state deposit concentration limits; and (iii) state law limitations requiring the merging bank to have been in existence for a minimum period of time (not to exceed five years) prior to the merger. The establishment of new interstate branches or the acquisition of individual branches of a bank in another state (rather than the acquisition of an out-of-state bank in its entirety) has historically been permitted only in those states in which the laws expressly authorize such expansion. However, the Dodd-Frank Act permits well-capitalized and well-managed banks to establish new branches across state lines without these impediments.
Financial Subsidiaries.
Under federal law and OCC regulations, national banks are authorized to engage,
through “financial subsidiaries,” in any activity that is permissible for a financial holding company and any activity that the Secretary of the Treasury, in consultation with the FRB, determines is financial in nature or incidental to any such financial activity, except (i) insurance underwriting, (ii) real estate development or real estate investment activities (unless otherwise permitted by law), (iii) insurance company portfolio investments and (iv) merchant banking. The authority of a national bank to invest in a financial subsidiary is subject to a number of conditions, including, among other factors, requirements that the bank must be well-managed and well-capitalized (after deducting from capital the bank’s outstanding investments in financial subsidiaries). The Bank has not applied for approval to establish any financial subsidiaries.
Transaction Account Reserves.
FRB regulations require depository institutions to maintain reserves against their transaction accounts (primarily negotiable order of withdrawal and regular checking accounts). For 2015, the first $14.5 million of otherwise reservable balances are exempt from the reserve requirements; for transaction accounts aggregating more than $14.5 million to $103.6 million, the reserve requirement is 3% of total transaction accounts; and for net transaction accounts in excess of $103.6 million, the reserve requirement is $2.67 million plus 10% of the aggregate amount of total transaction accounts in excess of $103.6 million. These reserve requirements are subject to annual adjustment by the FRB. The Bank is in compliance with the foregoing requirements.
Federal Home Loan Bank System.
The Bank is a member of the Federal Home Loan Bank of Dallas (the “FHLB”), which serves as a central credit facility for its members. The FHLB is funded primarily from proceeds from the sale of obligations of the FHLB system. It makes loans to member banks in the form of FHLB advances. All advances from the FHLB are required to be fully collateralized as determined by the FHLB.
Community Reinvestment Act Requirements.
The Community Reinvestment Act requires the Bank to help meet the credit needs of its entire community, including low- and moderate-income neighborhoods. Federal regulators regularly assess the Bank’s record of meeting the credit needs of its communities. Applications for additional acquisitions would be affected by the evaluation of the Bank’s effectiveness in meeting its Community Reinvestment Act obligations.
Anti-Money Laundering and Know-Your-Customer.
The Uniting and Strengthening America by Providing Appropriate Tools Required to Intercept and Obstruct Terrorism Act of 2001 (the “Patriot Act”) is designed to deny terrorists and criminals the ability to obtain access to the U.S. financial system and has significant implications for depository institutions, brokers, dealers and other businesses involved in the transfer of money. The Patriot Act mandates financial services companies to have policies and procedures with respect to measures designed to address any or all of the following matters: (i) customer identification programs; (ii) money laundering; (iii) terrorist financing; (iv) identifying and reporting suspicious activities and currency transactions; (v) currency crimes; and (vi) cooperation between financial institutions and law enforcement authorities. The Financial Crimes Enforcement Network has proposed new regulations that would require financial institutions to obtain beneficial ownership information for certain accounts, however, it has yet to establish final regulations on this topic.
Bank Secrecy Act, Anti-Money Laundering and Know-Your-Customer.
Trinity and the Bank are also subject to the Bank Secrecy Act, as amended by the USA PATRIOT Act, which gives the federal government powers to address money laundering and terrorist threats through enhanced domestic security measures, expanded surveillance powers, and mandatory transaction reporting obligations. The Bank Secrecy Act imposes an affirmative obligation on the Bank to report currency transactions that exceed certain thresholds and to report other transactions determined to be suspicious. The Bank Secrecy Act requires that all banking institutions develop and provide for the continued administration of a program reasonably designed to assure and monitor compliance with certain recordkeeping and reporting requirements regarding both domestic and international currency transactions. These programs must, at a minimum, provide for a system of internal controls to assure ongoing compliance, provide for independent testing of such systems and compliance, designate individuals responsible for such compliance and provide appropriate personnel training.
UDAP and UDAAP.
Banking regulatory agencies use a general consumer protection statute to address “unethical” or otherwise “bad” business practices that may not necessarily fall directly under the purview of a specific banking or consumer finance law. The law of choice for enforcement against such business practices has been Section 5 of the Federal Trade Commission Act, referred to as the FTC Act, which is the primary federal law that prohibits unfair or deceptive acts or practices, referred to as UDAP, and unfair methods of competition in or affecting commerce. “Unjustified consumer injury” is the principal focus of the FTC Act. Prior to the Dodd-Frank Act, there was little formal guidance to provide insight to the parameters for compliance with UDAP laws and regulations. However, UDAP laws and regulations have been expanded under the Dodd-Frank Act to apply to “unfair, deceptive or abusive acts or practices,” referred to as UDAAP, which have been delegated to the CFPB for rule-making. The federal banking agencies have the authority to enforce such rules and regulations.
Commercial Real Estate Guidance.
The interagency Concentrations in Commercial Real Estate Lending, Sound Risk Management Practices guidance (“CRE Guidance”) provides supervisory criteria, including the following numerical indicators, to assist bank examiners in identifying banks with potentially significant commercial real estate loan concentrations that may warrant greater supervisory scrutiny: (i) commercial real estate loans exceeding 300% of capital and increasing 50% or more in the preceding three years; or (ii) construction and land development loans exceeding 100% of capital. The CRE Guidance does not limit banks’ levels of commercial real estate lending activities, but rather guides institutions in developing risk management practices and levels of capital that are commensurate with the level and nature of their commercial real estate concentrations. Based on the Bank’s current loan portfolio, the Bank does not exceed these guidelines. On December 18, 2015, the federal banking agencies jointly issued a “Statement on Prudent Risk Management for Commercial Real Estate Lending” reminding banks of the need to engage in risk management practices for commercial real estate lending.
Consumer Financial Protection Bureau.
The CFPB was created under the Dodd-Frank Act to centralize responsibility for consumer financial protection with broad rulemaking, supervision and enforcement authority for a wide range of consumer protection laws that would apply to all banks and thrifts, including the Equal Credit Opportunity Act, Truth-in Lending Act (“TILA”), Real Estate Settlement Procedures Act (“RESPA”), Fair Credit Reporting Act, Fair Debt Collection Act, the Consumer Financial Privacy provisions of the Gramm-Leach-Bliley Act and certain other statutes. Banking institutions with total assets of $10 billion or less, such as the Bank, remain subject to the supervision and enforcement of their primary federal banking regulator with respect to the federal consumer financial protection laws and such additional regulations as may be adopted by the CFPB.
Effective January 10, 2013, the CFPB released its final “Ability-to-Repay/Qualified Mortgage” rules, which amended TILA’s implementing regulation, Regulation Z. Regulation Z currently prohibits a creditor from making a higher-priced mortgage loan without regard to the consumer's ability to repay the loan. The final rule implements sections 1411 and 1412 of the Dodd-Frank Act, which generally require creditors to make a reasonable, good faith determination of a consumer's ability to repay any consumer credit transaction secured by a dwelling (excluding an open-end credit plan, timeshare plan, reverse mortgage, or temporary loan) and establishes certain protections from liability under this requirement for “qualified mortgages.” The final rule also implements section 1414 of the Dodd-Frank Act, which limits prepayment penalties. Finally, the final rule requires creditors to retain evidence of compliance with the rule for three years after a covered loan is consummated. This rule became effective January 10, 2014. The CFPB allowed for a small creditor exemption for banks with assets under $2 billion and that originate less than 500 mortgage loans in 2015. Beginning January 1, 2016, the small creditor exemption will be allowed for banks with assets under $2 billion and that originate less than 2,000 mortgage loans.
On November 20, 2013, pursuant to section 1032(f) of the Dodd-Frank Act, the CFPB issued the Know Before You Owe TILA/RESPA Integrated Disclosure Rule (“TRID”), which combined the disclosures required under TILA and sections 4 and 5 of RESPA, into a single, integrated disclosure for mortgage loan transactions covered by those laws. TRID, which requires the use of a Loan Estimate that must be delivered or placed in the mail no later than the third business day after receiving the consumer’s application and a Closing Disclosure that must be provided to the consumer at least three business days prior to consummation, became effective for applications received on or after October 3, 2015 for applicable closed-end consumer credit transactions secured by real property. Creditors must only use the Loan Estimate and Closing Disclosure forms for mortgage loan transactions subject to TRID. All other mortgage loan transactions continue to use the Good Faith Estimate and the Initial Truth-in-Lending Disclosure at application and the HUD-1 Settlement Statement and the Final Truth-in-Lending Disclosure at closing. TRID also has changed the scope of transactions applicable, and adjusted the tolerance requirements and record retention requirements. Of note, the creditor must retain evidence of compliance with the Loan Estimate requirements, including providing the Loan Estimate, and the Closing Disclosure requirements for three years after the later of the date of consummation, the date disclosures are required to be made or the date the action is required to be taken. Additionally, the creditor must retain copies of the Closing Disclosure, including all documents related to the Closing Disclosure, for five years after consummation.
Foreclosure and Loan Modifications.
Federal and state laws further impact foreclosures and loan modifications, with many of such laws having the effect of delaying or impeding the foreclosure process on real estate secured loans in default. Mortgages on commercial property can be modified, such as by reducing the principal amount of the loan or the interest rate, or by extending the term of the loan, through plans confirmed under Chapter 11 of the Bankruptcy Code. In recent years, legislation has been introduced in the U.S. Congress that would amend the Bankruptcy Code to permit courts to modify mortgages secured by residences, although at this time the enactment of such legislation is not presently proposed. The scope, duration and terms of potential future legislation with similar effect continue to be discussed. Trinity cannot predict whether any such legislation will be passed or the impact, if any, it would have on Trinity’s business.
Servicing.
On January 17, 2013, the CFPB announced rules to implement certain provisions of the Dodd-Frank Act relating to mortgage servicing. The new servicing rules require servicers to meet certain benchmarks for loan servicing and customer service in general. Servicers must provide periodic billing statements and certain required notices and acknowledgments, promptly credit borrowers’ accounts for payments received and promptly investigate complaints by borrowers and are required to take additional steps before purchasing insurance to protect the lender’s interest in the property. The servicing rules also call for additional notice, review and timing requirements with respect to delinquent borrowers, including early intervention, ongoing access to servicer personnel and specific loss mitigation and foreclosure procedures. The rules provide for an exemption from most of these requirements for “small servicers.” A small servicer is defined as a loan servicer that services 5,000 or fewer mortgage loans and services only mortgage loans that they or an affiliate originated or own. The servicing rules took effect on January 10, 2014.
Additional Constraints on Trinity and Bank.
Monetary Policy
.
The monetary policy of the FRB has a significant effect on the operating results of financial or bank holding companies and their subsidiaries. Among the tools available to the FRB to affect the money supply are open market transactions in U.S. government securities, changes in the discount rate on member bank borrowings and changes in reserve requirements against member bank deposits. These means are used in varying combinations to influence overall growth and distribution of bank loans, investments and deposits, and their use may affect interest rates charged on loans or paid on deposits.
The Volcker Rule.
In addition to other implications of the Dodd-Frank Act discussed above, the act amends the BHCA to require the federal regulatory agencies to adopt rules that prohibit banks and their affiliates from engaging in proprietary trading and investing in and sponsoring certain unregistered investment companies (defined as hedge funds and private equity funds). This statutory provision is commonly called the “Volcker Rule.” On December 10, 2013, the federal regulatory agencies issued final rules to implement the prohibitions required by the Volcker Rule. Thereafter, in reaction to industry concern over the adverse impact to community banks of the treatment of certain collateralized debt instruments in the final rule, the federal regulatory agencies approved an interim final rule to permit banking entities to retain interests in collateralized debt obligations backed primarily by trust preferred securities (“TruPS CDOs”) from the investment prohibitions contained in the final rule. Under the interim final rule, the agencies permit the retention of an interest in or sponsorship of covered funds by banking entities under $15 billion in assets if the following qualifications are met:
| · |
The TruPS CDO was established, and the interest was issued, before May 19, 2010;
|
| · |
The banking entity reasonably believes that the offering proceeds received by the TruPS CDO were invested primarily in qualifying TruPS collateral; and
|
| · |
The banking entity’s interest in the TruPS CDO was acquired on or before December 10, 2013.
|
The Volcker Rule became effective in July 2015. While the Volcker Rule has produced significant implications for many large financial institutions, it has not had a material effect on the operations of Trinity or the Bank. Trinity may incur costs if it is required to adopt additional policies and systems to ensure compliance with the Volcker Rule, but any such costs are not expected to be material.
Our business, financial condition and results of operations are subject to various risks, including those discussed below. The risks discussed below are those that we believe are the most significant risks, although additional risks not presently known to us or that we currently deem less significant may also adversely affect our business, financial condition and results of operations, perhaps materially. The risks discussed below also include forward-looking statements, and our actual results may differ substantially from those discussed in these forward-looking statements. In addition to the other information in this Form 10-K and our other filings with the SEC, stockholders or prospective investors should carefully consider the following risk factors:
Risks Related to Our Internal Review, Financial Statements, Internal Controls and Related Investigations
We have identified various material weaknesses in our internal control over financial reporting which have materially adversely affected our ability to timely and accurately report our results of operations and financial condition. These material weaknesses have not been fully remediated as of the filing date of this Form 10-K and we cannot ensure that other material weaknesses will not be identified in the future.
Discussed under Part II, Item 9A “Controls and Procedures,” we concluded that, as of and for the year ended December 31, 2015, we had material weaknesses in our internal control over financial reporting and that, as a result, our disclosure controls and procedures and our internal control over financial reporting were not effective at such dates. A material weakness is a deficiency, or combination of deficiencies, in internal control over financial reporting that creates a reasonable possibility that a material misstatement of our annual or interim consolidated financial statements will not be prevented or detected on a timely basis. See Part II, Item 9A “Controls and Procedures” for a detailed discussion of the material weaknesses identified and related remedial activities. Management anticipates that these remedial actions, and further actions that are being developed, will strengthen the Company’s internal control over financial reporting and will, over time, address the material weaknesses that were identified. Because some of these remedial actions will take place on a quarterly or annual basis, their successful implementation will continue to be evaluated before management is able to conclude that these material weaknesses have been remediated. The Company cannot provide any assurance that these remediation efforts will be successful or that the Company’s internal control over financial reporting will be effective as a result of these efforts. Moreover, we cannot assure you that additional material weaknesses in our internal control over financial reporting will not arise or be identified in the future.
We continue our remediation activities and must also continue to improve our operational, information technology, financial systems, infrastructure, procedures, and controls, as well as continue to expand, train, retain, and manage our employee base. Any difficulties we encounter during implementation could result in additional material weaknesses or in material misstatements in our financial statements. These misstatements could result in a future restatement of our financial statements, could cause us to fail to meet our reporting obligations, or could cause investors to lose confidence in our reported financial information, all of which could have a material adverse effect on our business, financial condition and results of operations.
Certain regulatory authorities have requested information and documentation relating to the restatement of our financial statements. These government inquiries or any future inquiries to which we may become subject could result in penalties and/or other remedies that could have a material adverse effect on our financial condition and results of operation.
The SEC opened an investigation in January 2013 relating to the restatement of our financial statements, resulting in the announcement of a settlement with Trinity on September 28, 2015. The SEC also announced settlements with four former members of our senior management and filed suit against one former member of our senior management. While Trinity has settled all claims alleged by the SEC relating to the restatement, Trinity is required to cooperate in any proceedings, including the suit filed against the former members of management, and any other investigation relating to the restatement. The cooperation provisions and the lawsuit may result in a continuation of elevated legal expenses. Additionally, the Special Inspector General for the Troubled Asset Relief Program opened a criminal investigation and requested information and documentation relating to the restatement of our financial statements. The Company has been advised it is not the target of the investigation.
The Company has incurred and will continue to incur significant expenses related to such investigations and inquiries. The Company is cooperating fully with the investigations. The Company cannot predict the outcome of any unresolved proceedings or whether we will face additional government inquiries, investigations, or other actions related to these or other matters. An adverse ruling in any regulatory proceeding or other action could impose upon us fines, penalties, or other remedies, which could have a material adverse effect on results of operations and financial condition. Even if we are successful in defending against regulatory proceedings or other actions, such an action or proceeding may continue to be time consuming, expensive, and distracting from the conduct of our business and could have a material adverse effect on our business, financial condition, and results of operations. Pursuant to our obligation to indemnify our directors, executive officers and certain employees, we are currently covering certain expenses related to these matters and we may become subject to additional costly indemnification obligations to current or former officers, directors, or employees, which may or may not be covered by insurance. Moreover, the regulatory authorities may disagree with the manner in which we have accounted for and reported the financial impact of the adjustments to previously filed financial statements.
We expect to continue to incur significant expenses related to our internal control over financial reporting and the preparation of our financial statements.
We devoted substantial internal and external resources to the completion of the restatement and will continue to devote substantial internal and external resources to become current in filing our financial statements. As a result of these efforts, we have incurred and expect that we will continue to incur significant fees and expenses for additional auditor services, financial and other consulting services, and legal services. We expect that these fees and expenses will remain significantly higher than historical fees and expenses in this category for several quarters. These expenses, as well as the substantial time devoted by our management towards addressing these material weaknesses, could have a material adverse effect on our business, financial condition and results of operations.
Following the filing of this Form 10-K, we will remain delayed in our SEC reporting obligations, we cannot predict when we will complete our remaining SEC filings for periods subsequent to those included in this Form 10-K, and we are likely to continue to face challenges until we complete these filings.
We continue to face challenges with regard to completing our remaining SEC filings for periods subsequent to those included in this Form 10-K. We remain delayed with our SEC reporting obligations as of the filing date of this report and have not yet completed our Quarterly Report on Form 10-Q for each of the quarters ended March 31, 2016, June 30, 2016, and September 30, 2016. Until we complete these filings and subsequent filings as they come due, we expect to face many of the risks and challenges we have experienced during our extended filing delay period, including:
| · |
continued concern on the part of customers, partners, investors, and employees about our financial condition and
extended
filing delay status, including potential loss of business opportunities;
|
| · |
additional significant time and expense required to complete our remaining filings beyond the very significant time and expense we have already incurred in connection with our internal review, restatement and audits to date;
|
| · |
continued attention of our senior management team and our Board of Directors as we work to complete our remaining
filings
;
|
| · |
limitations on our ability to raise capital in the public markets; and
|
| · |
general
reputational
harm as a result of the foregoing.
|
The lack of current financial and operating information about the Company, along with the restatement of our consolidated financial statements and related events, have had, and likely will continue to have, a material adverse effect on our business.
The delay in producing current consolidated financial statements and related problems have had, and in the future may continue to have, an adverse effect on our business and reputation. In addition, the negative publicity to which we have been subject as a result of our restatement of prior period financial statements and related problems has further contributed to declines in the price of our common stock, an increase in the regulatory scrutiny to which we are subject, and affect our customer relationships. Companies that restate their financial statements sometimes face litigation claims following such a restatement. On September 29, 2015, Trinity announced a settlement with the SEC stemming from the restatement of its financial statements for the years ended December 31, 2006 through 2011 and for the quarters ended March 31, 2012 and June 30, 2012, without admitting or denying any of the findings made by the SEC and paid a civil money penalty of $1.5 million to the SEC. It is possible that the Company may face additional monetary judgments, penalties or other sanctions which could have a material adverse effect on our business, financial condition and results of operations.
As a result of the delay in completing our financial statements, we are currently unable to register securities with the SEC. This may adversely affect our ability to raise capital and the cost of raising future capital.
As a result of the delay in completing our financial statements, we have been, and remain, unable to register securities for sale by us or for resale by other security holders, which adversely affects our ability to raise capital. Additionally, following the filing of this Form 10-K we will remain ineligible to use Form S-3 to register securities until we have timely filed all periodic reports under the Exchange Act for at least 12 calendar months. In addition, in the event our market cap remains below $75 million, we would need to use Form S-1 to register securities with the SEC for capital raising transactions or issue such securities in private placements, in either case, increasing the costs of raising capital during that period.
A failure to comply with the terms of the Written Agreement or the Consent Order to which Trinity and the Bank, respectively, are currently subject within the required timeframes could subject us to further regulatory enforcement actions, which could have a material adverse effect upon our business, financial condition and results of operations.
As previously discussed, on September 26, 2013, Trinity entered into the Written Agreement with the FRB, and on December 17, 2013, the Bank entered into the Consent Order with the OCC. If Trinity or the Bank is not successful in complying with the terms of their respective regulatory orders within the required timeframes, we could become subject to additional enforcement actions, sanctions or restrictions on our business activities.
Risks Related to Our Business
If there were to be a return
of recessionary conditions our level of non-performing loans could increase and/or reduce demand for our products and services, which could lead to lower revenue, higher loan losses and lower earnings.
A return of recessionary conditions and/or continued negative developments in the domestic and international credit markets may significantly affect the markets in which we do business, the value of our loans and investments and our ongoing operations, costs and profitability. Declines in real estate values and sales volumes and increased unemployment or underemployment levels may result in higher than expected loan delinquencies, increases in our levels of non-performing and classified assets and a decline in demand for our products and services. These negative events may cause us to incur losses and may adversely affect our capital, liquidity and financial condition.
Our profitability is dependent upon the health of the markets in which we operate, and our geographic concentration may magnify the adverse effects and consequences of any regional or local economic downturn
. We operate our banking offices in Los Alamos, White Rock, Santa Fe and Albuquerque, New Mexico. The United States is recovering from historically difficult economic conditions. The effects of these conditions have not been as bad in our markets as other parts of the country; however, our markets have still experienced significant difficulties due to the downturn in the national economy. If the overall economic climate in the United States, generally, and our market areas, specifically, does not improve, this could result in a decrease in demand for our products and services, an increase in loan delinquencies and defaults and increased levels of problem assets and foreclosures. Moreover, because of our geographic concentration, we are less able than other regional or national financial institutions to diversify our credit risks across multiple markets. Any regional or local economic downturn that affects New Mexico, whether caused by recession, inflation, unemployment, or other factors, may affect us and our profitability more significantly and more adversely than our competitors that are less geographically concentrated and could have a material adverse effect on our results of operations and financial condition.
As the Laboratory is the largest employer in Northern New Mexico, its health is central to the economic health of both Northern and Central New Mexico. The main indicator of the Laboratory’s health is its funding. The Laboratory’s funding is primarily based and dependent upon the federal government’s budgeting process. As such, funding is not certain and can be delayed and influenced, both negatively and positively, by international, national, state and local events and circumstances beyond the Laboratory’s control. Additionally, the Laboratory’s funding can be influenced by both positive and negative events and circumstances influenced by the Laboratory. The Laboratory received from the Department of Energy (the Laboratory’s largest single historical source of funding) funding of $2.2 billion for its fiscal year 2016. The fiscal year 2017 budget request is for $2.1 billion, a 4.4% decrease over the 2016 funding. Any material fluctuation or delay in the Laboratory’s funding may affect our customers’ business and financial interests, adversely affect economic conditions in our market area, affect the ability of our customers to repay their loans to us and generally affect our financial condition and results of operations.
Our risk management processes may not fully identify and mitigate exposure to the various risks that we face, including interest rate, credit, liquidity and market risk.
We continue to refine our risk management techniques, strategies and assessment methods on an ongoing basis. However, risk management techniques and strategies, both ours and those available to the market generally, may not be fully effective in mitigating our risk exposure in all economic market environments or against all types of risk. For example, we might fail to identify or anticipate particular risks, or the systems that we use, and that are used within our business segments generally, may not be capable of identifying certain risks. Certain of our strategies for managing risk are based upon our use of observed historical market behavior. We apply statistical and other tools to these observations to quantify our risk exposure. Any failures in our risk management techniques and strategies to accurately identify and quantify our risk exposure could limit our ability to manage risks. In addition, any risk management failures could cause our losses to be significantly greater than the historical measures indicate. Further, our quantified modeling does not take all risks into account. As a result, we also take a qualitative approach in reducing our risk. Our qualitative approach to managing those risks could also prove insufficient, exposing us to material unanticipated losses.
We are subject to interest rate risk, and a change in interest rates could have a negative effect on our net income, capital levels, and overall results.
Our earnings and cash flows are largely dependent upon our net interest income. Interest rates are highly sensitive to many factors that are beyond our control, including general economic conditions, our competition and policies of various governmental and regulatory agencies, particularly the FRB. Changes in monetary policy, including changes in interest rates, could influence the amount of interest we earn on loans and securities and the amount of interest we incur on deposits and borrowings. Such changes could also affect our ability to originate loans and obtain deposits as well as the average duration of our securities portfolio. If the interest rates paid on deposits and other borrowings increase at a faster rate than the interest rates received on loans and other investments, our net interest income, and therefore earnings, could be adversely affected. Earnings could also be adversely affected if the interest rates received on loans and other investments fall more quickly than the interest rates paid on deposits and other borrowings.
In addition, we hold securities that may be sold in response to changes in market interest rates, changes in securities’ prepayment risk, increases in loan demand, general liquidity needs and other similar factors are classified as available for sale and are carried at estimated fair value, which may fluctuate with changes in market interest rates. The effects of an increase in market interest rates may result in a decrease in the value of our available for sale investment portfolio.
Market interest rates are affected by many factors outside of our control, including inflation, recession, unemployment, money supply, international disorder and instability in domestic and foreign financial markets. We may not be able to accurately predict the likelihood, nature and magnitude of such changes or how and to what extent such changes may affect our business. We also may not be able to adequately prepare for, or compensate for, the consequences of such changes. Any failure to predict and prepare for changes in interest rates, or adjust for the consequences of these changes, may adversely affect our earnings and capital levels and overall results of operations and financial condition.
We measure interest rate risk under various rate scenarios and using specific criteria and assumptions. A summary of this process, along with the results of our net interest income simulations is presented at Part II, Item 7A “Quantitative and Qualitative Disclosures About Market Risk” of this Form 10-K. Although we believe our current level of interest rate sensitivity is reasonable and effectively managed, significant fluctuations in interest rates may have an adverse effect on our business, financial condition and results of operations.
We must effectively manage our credit risk, including risks specific to real estate value due to the large concentration of real estate loans in our loan portfolio.
There are risks inherent in making any loan, including risks of nonpayment, risks resulting from uncertainties as to the future value of collateral and risks resulting from changes in economic and industry conditions. The Loan Department of the Bank has been focused on improving processes and controls to minimize our credit risk through prudent loan underwriting procedures, monitoring of the concentration of our loans within specific industries, monitoring of our collateral values and market conditions, stress testing and periodic independent reviews of outstanding loans performed by a third-party as well as external auditors. However, we cannot assure such approval and monitoring procedures will eliminate these credit risks. If the overall economic climate in the United States, generally, and our market areas, specifically, do not continue to improve, our borrowers may experience difficulties in repaying their loans, and the level of non-performing loans, charge-offs and delinquencies could rise and require increases in the provision for loan losses, which would cause our net income and return on equity to decrease.
Further, the Bank’s loan portfolio is invested in commercial real estate, residential real estate, construction, general commercial and consumer lending. The Bank has no significant direct exposure to the oil and gas industry. The Bank may experience indirect impact from the oil and gas industry as a result of its impact on the national economy. The maximum amount we can loan to any one customer and their related entities (our “legal lending limit”) is smaller than the limits of our national and regional competitors with larger lending limits. While there is little demand for loans over our legal lending limit, we can, and have, engaged in participation loans with other financial institutions to respond to customer requirements. However, there are some loans and relationships that we cannot effectively compete for due to our size.
Real estate lending (including commercial, construction and residential) is a large portion of our loan portfolio. These categories constitute approximately $720 million (85.5%) of our total loan portfolio as of December 31, 2015. The fair value of real estate can fluctuate significantly in a short period of time as a result of market conditions in the geographic area in which the real estate is located. Although a significant portion of such loans is secured by real estate, adverse developments affecting real estate values in one or more of our markets could increase the credit risk associated with our loan portfolio. Additionally, commercial real estate lending typically involves larger loan principal amounts and the repayment of the loans generally is dependent, in large part, on sufficient income from the properties securing the loans to cover operating expenses and debt service. Economic events or governmental regulations outside of the control of the borrower or lender could negatively impact the future cash flow and fair values of the affected properties.
The Bank’s residential mortgage loan operations include origination, sale and servicing. The Bank’s residential mortgage loan portfolio does not include subprime mortgages and contains a limited number of non-traditional residential mortgages. The Bank employs underwriting standards that it believes are in line with industry norms in making residential mortgage loans. The Bank purchased mortgage-backed securities in the past several years based upon the returns and quality of these assets. Neither Trinity nor the Bank engaged in the packaging and selling of loan pools, such as collateralized debt obligations, structured investment vehicles, or other instruments which contain subprime mortgage loans and have seen significant losses in value. As such, Trinity does not foresee any charge-offs, write-downs or other losses outside the ordinary course of business with respect to our residential mortgage operations. The majority of the residential mortgage loans originated by the Bank are sold to third-party investors, primarily to
Fannie Mae
. The Bank continues to service the majority of loans that are sold to third-party investors, to provide a continuing source of income through mortgage servicing right (“MSR”) fees, although moving forward the Bank will not service as many of the loans that it sells to third parties.
If loans collateralized by real estate become troubled during a time when market conditions are declining or have declined, we may not be able to realize the amount of security anticipated at the time of originating the loan, which could cause us to increase our provision for loan losses and adversely affect our operating results and financial condition. To mitigate such risk, we employ the use of independent third parties to conduct appraisals on our real estate collateral and adhere to limits set on the percentages for the loan amount to the appraised value of the collateral. We continually monitor the real estate markets and economic conditions in the areas in which our loans are concentrated.
Our ability to continue extensive residential real estate lending in our market area is heavily dependent on building and retaining relationships with non-affiliate mortgage lenders.
As of December 31, 2015, the Bank serviced a total of approximately $865.6 million in loans that were sold to
Fannie Mae
, in addition to the approximately $258.6 million in residential real estate loans maintained on the balance sheet. For many years, the Bank sold the majority of the residential real estate loans it generated to
Fannie Mae
on a servicing retained basis. However, beginning in late 2015, the Bank began moving toward a strategy to sell most newly originated mortgages with servicing released. In 2016, the Bank made a further strategy change to generate applications for non-affiliated mortgage companies on a fee basis. These changes in strategy were primarily based upon new compliance requirements and capital treatment related to residential mortgage loans. If we are unable to identify new partners or fund the loans on our balance sheet, it could have the effect of limiting the Company’s fees associated with originating such loans.
Our construction and development loans are based upon estimates of costs and value associated with the completed project. These estimates may be inaccurate and we may be exposed to more losses on these projects than on other loans.
As of December 31, 2015, construction loans, including land acquisition and development, totaled $89.3 million, or 10.6%, of our total loan portfolio. Construction, land acquisition and development lending involve additional risks because funds are advanced based upon the value of the project, which is of uncertain value prior to its completion. Because of the uncertainties inherent in estimating construction costs, as well as the fair value of the completed project and the effects of governmental regulation of real property and the general effects of the national and local economies, it is relatively difficult to evaluate accurately the total funds required to complete a project and the related loan-to-value ratio. As a result, construction loans often involve the disbursement of substantial funds with repayment dependent, in part, on the success of the ultimate project and the ability of the borrower to sell or lease the property, rather than the ability of the borrower or guarantor to repay principal and interest. If our appraisal of the value of the completed project proves to be overstated, we may have inadequate security for the repayment of the loan upon completion of construction of the project. If we are forced to foreclose on a project prior to or at completion due to a default, there can be no assurance that we will be able to recover all of the unpaid balance of, and accrued interest on, the loan as well as related foreclosure, sale and holding costs. In addition, we may be required to fund additional amounts to complete the project and may have to hold the property for an unspecified period of time.
Our allowance for loan losses may prove to be insufficient to absorb losses in our loan portfolio.
Every loan carries a certain risk that it will not be repaid in accordance with its terms or that any underlying collateral will not be sufficient to assure repayment. This risk is affected by, among other
factors
:
| · |
cash flow of the borrower and/or the project being financed;
|
| · |
the changes and uncertainties as to the future value of the collateral, in the case of a collateralized loan;
|
| · |
the credit history of a particular borrower;
|
| · |
changes in economic and industry conditions; and
|
| · |
the duration of the loan.
|
We maintain an allowance for loan losses, which is a reserve established through a provision for loan losses charged to expense, that we believe is appropriate to provide for probable incurred losses in our loan portfolio. The amount of this allowance is determined by our management through a periodic review and consideration of several factors, including, but not limited to:
| · |
our general reserve, based on our historical default and loss experience;
|
| · |
our specific reserve, based on our evaluation of impaired loans and their underlying collateral; and
|
| · |
current macroeconomic factors and model imprecision factors.
|
The determination of the appropriate level of the allowance for loan losses inherently involves a high degree of subjectivity and requires us to make significant estimates of current credit risks and future trends, all of which may undergo material changes. A deterioration or lack of improvement in economic conditions affecting borrowers, new information regarding existing loans, identification of additional problem loans and other factors, both within and outside of our control, may require an increase in the allowance for loan losses. In addition, bank regulatory agencies periodically review our allowance for loan losses and may require an increase in the provision for possible loan losses or the recognition of further loan charge-offs, based on judgments different than those of management. In addition, if charge-offs in future periods exceed the allowance for loan losses, we will need additional provisions to increase the allowance for loan losses. Any increases in the allowance for loan losses will result in a decrease in net income and, possibly, capital, and may have a material negative effect on our financial condition and results of operations.
Our ability to attract and retain management and key personnel may affect future growth and earnings, and legislation imposing compensation restrictions could adversely affect our ability to do so.
Much of our future success will be strongly influenced by our ability to attract and retain management experienced in banking and financial services and familiarity with the communities in our market areas. Our ability to retain executive officers, the functional area managers, branch managers and loan officers of our bank subsidiary will continue to be important to the successful implementation of our strategy. It is also critical, as we address the Written Agreement and the Consent Order, to be able to attract and retain qualified management and loan officers with the appropriate level of experience and knowledge about our market areas to implement our community-based operating strategy.
As a result of the Bank having entered into the Consent Order, we are subject to certain limitations regarding employee compensation, as well as the hiring of executive officers. These limitations may adversely affect our ability to recruit and retain key employees in addition to our senior executive officers, especially if we are competing for talent against institutions that are not subject to the same restrictions. Moreover, there have been many staffing changes recently at the Company, including the departure of several loan officers and senior management. Over the past two years, the Company hired experienced and proven management to serve as Chief Executive Officer, Chief Financial Officer, Chief Credit Officer, Chief Risk Officer, Chief Lending Officer, Chief Wealth Strategies & Fiduciary Officer, and Chief Information Officer. The unexpected loss of services of key management personnel, or the inability to recruit and retain qualified personnel in the future, could have an adverse effect on our business, results of operations and financial condition.
We may need to raise additional capital in the future, which may not be available when it is needed.
We are required by federal and state regulatory authorities to maintain adequate levels of capital to support our operations. We manage our growth rate and risk profile to ensure that our existing capital resources will satisfy our capital requirements for the foreseeable future. However, regulatory requirements, growth in assets outpacing growth in capital or our growth strategy may present conditions that would create a need for additional capital from the capital markets. Additionally, the restatement of our financial statements for 2010 and 2011, and our inability to have timely filed our 2012, 2013, 2014 and 2015 financial statements, as well as the regulatory orders on Trinity and the Bank, among other
factors
, may make it difficult to raise capital in the near future, or limit the manner in which we can raise it. Our ability to raise additional capital depends on conditions in the capital markets, general economic conditions and a number of other factors, including investor perceptions regarding the banking industry, market conditions and governmental activities, and on our financial condition and performance. There may not always be capital available or available on favorable terms. These conditions may alter our strategic direction and require us to manage our growth to remain within capital limits relying solely on our earnings for capital formation, possibly limiting our growth.
Stock Purchase Agreement.
On September 8, 2016, the Company entered into a stock purchase agreement with Castle Creek Capital Partners VI, L.P. (“Castle Creek”), Patriot Financial Partners II, L.P., Patriot Financial Partners Parallel II, L.P. (together with Patriot Financial Partners II, L.P., “Patriot”) and Strategic Value Bank Partners LLC, through its fund, Strategic Value Investors LP (“SVBP”, and collectively, the “Investors”), pursuant to which the Company expects to raise gross proceeds of approximately $52 million in a private placement transaction and to issue shares of the Company’s common stock at a purchase price of $4.75 per common share and shares of newly-created nonvoting noncumulative convertible perpetual Series C Preferred Stock at a purchase price of $475.00 per share of Series C Preferred Stock. Proceeds from the private placement transaction will be used to repurchase all of the outstanding Series A Preferred Stock and Series B Preferred Stock, to pay the deferred interest on our trust preferred securities, and for general corporate purposes. Closing of the private placement transaction is subject to the receipt of the necessary regulatory approvals or nonobjections for the use of proceeds described above. We currently anticipate that the private placement transaction will close in [October] 2016. There are no assurances that we will receive the necessary regulatory approvals or nonobjections or otherwise be able to close the private placement transaction.
In connection with the private placement, the Company entered into a registration rights agreement (the “Registration Rights Agreement”) with each of Castle Creek and Patriot. Pursuant to the terms of the Registration Rights Agreement, the Company has agreed to file a resale registration statement for the purpose of registering the resale of the shares of the Common Stock and Series C preferred stock issued in the private placement and the underlying shares of Common Stock or non-voting Common Stock into which the shares of Series C preferred stock are convertible, as appropriate. The Company is obligated to file the registration statement no later than the third anniversary after the closing of the private placement.
Pursuant to the terms of the stock purchase agreement, prior to closing, Castle Creek and Patriot will enter into side letter agreements with us. Under the terms of a side letter agreements, each investor will be entitled to have one representative appointed to our Board of Directors for so long as such investor, together with its respective affiliates, owns, in the aggregate, 5% or more of all of the outstanding shares of common stock (including shares of Common Stock issuable upon conversion of the Series C preferred stock or non-voting Common Stock).
The size of our loan portfolio has declined in recent periods, and, if we are unable to return to loan growth, our profitability may be adversely affected.
From December 31, 2014 to December 31, 2015, our gross loans declined 7.8% and have continued to decline in 2016. During this period, we were managing our balance sheet composition to manage our capital levels and position the Bank to meet and exceed its targeted capital levels. Among other factors, our current strategic plan calls for reductions in the amount of our non-performing assets and a return to growth in our loan portfolio to improve our net interest margin and profitability. Our ability to increase profitability in accordance with this plan will depend on a variety of factors, including our ability to originate attractive new lending relationships. While we believe we have the management resources and lending staff in place to successfully achieve our strategic plan, if we are unable to increase the size of our loan portfolio, our strategic plan may not be successful and our profitability may be adversely affected.
Our growth must be effectively managed and our growth strategy involves risks that may impact our net income.
While addressing the Written Agreement and the Consent Order, we are also resuming a general growth strategy, which may include our expansion into additional communities or attempt to strengthen our position in our current markets to take advantage of expanding market share by opening new offices. To the extent that we undertake additional office openings, we are likely to experience the effects of higher operating expenses relative to operating income from the new operations for a period of time, which may have an adverse effect on our levels of reported net income, return on average equity and return on average assets.
We must compete with other banks and financial institutions in all lines of business.
The banking and financial services business in our market is highly competitive. Our competitors include large regional banks, local community banks, savings institutions, securities and brokerage companies, mortgage companies, insurance companies, finance companies, money market mutual funds, credit unions and other non-bank financial service providers. Many of these competitors are not subject to the same regulatory restrictions, which may therefore enable them to provide customers with an alternative to traditional banking services.
Increased competition in our markets may result in a decrease in the amounts of our loans and deposits, reduced spreads between loan rates and deposit rates or loan terms that are more favorable to the borrower. Any of these results could have a material adverse effect on our ability to grow and remain profitable. If increased competition causes us to significantly discount the interest rates we offer on loans or increase the amount we pay on deposits, our net interest income could be adversely impacted. If increased competition causes us to modify our underwriting standards, we could be exposed to higher losses from lending activities. Additionally, many of our competitors are much larger in total assets and capitalization, have greater access to capital markets, have larger lending limits and may be able to offer a broader range of financial services than we can offer.
Additionally, our ability to compete successfully depends on developing and maintaining long-term customer relationships, offering community banking services with features and pricing in line with customer interests and expectations, consistently achieving outstanding levels of customer service and adapting to many and frequent changes in banking as well as local or regional economies. Failure to excel in these areas could significantly weaken our competitive position, which could adversely affect our growth and profitability. These weaknesses could have a significant negative impact on our business, financial condition and results of operations.
Our mortgage origination business is subject to fluctuations based upon seasonal and other factors and, as a result, our results of operations for any given quarter may not be indicative of the results that may be achieved for the full fiscal year.
Our mortgage origination business is subject to several variables that can impact loan origination volume, an increase in the general level of interest rates may, among other things, adversely affect the demand for mortgage loans and our ability to originate mortgage loans. In particular, if mortgage interest rates increase, the demand for residential mortgage loans and the refinancing of residential mortgage loans will likely decrease, which will have an adverse effect on our mortgage origination activities. Conversely, a decrease in the general level of interest rates, among other things, may lead to increased competition for mortgage loan origination business. As a result of these variables, our results of operations for any single quarter are not necessarily indicative of the results that may be achieved for a full fiscal year.
We could experience an unexpected inability to obtain needed liquidity.
Liquidity measures the ability to meet current and future cash flow needs as they become due. The liquidity of a financial institution reflects its ability to meet loan requests, to accommodate possible outflows in deposits, and to take advantage of interest rate market opportunities and is essential to a financial institution's business. The ability of a financial institution to meet its current financial obligations is a function of its balance sheet structure, its ability to liquidate assets and its access to alternative sources of funds. We seek to ensure that our funding needs are met by maintaining an appropriate level of liquidity through asset and liability management.
In the event the Bank is unable to deliver sufficient and acceptable collateral to the FHLB, it may affect our ability to borrow sufficient amounts in the event it is necessary for our liquidity. If we become unable to obtain funds when needed, it could have a material adverse effect on our business, financial condition and results of operations.
Loss of customer deposits due to increased competition could increase our funding costs.
We rely on bank deposits to be a low cost and stable source of funding. We compete with banks and other financial services companies for deposits. If our competitors raise the rates they pay on deposits, our funding costs may increase, either because we raise our rates to avoid losing deposits or because we lose deposits and must rely on more expensive sources of funding. Higher funding costs could reduce our net interest margin and net interest income and could have a material adverse effect on our financial condition and results of operations.
We rely on the accuracy and completeness of information about customers and counterparties.
We rely on information furnished by or on behalf of customers and counterparties in deciding whether to extend credit or enter into other transactions. This information could include financial statements, credit reports and other financial information. We also rely on representations of those customers, counterparties or other third parties, such as independent auditors, as to the accuracy and completeness of that information. Reliance on inaccurate or misleading financial statements, credit reports or other financial information could have a material adverse impact on our business, financial condition and results of operations.
The soundness of other financial institutions could adversely affect our business.
Our ability to engage in routine funding transactions could be adversely affected by the actions and commercial soundness of other financial institutions. Financial services institutions are interrelated as a result of trading, clearing, counterparty or other relationships. We have exposure to many different counterparties and we routinely execute transactions with counterparties in the financial services industry, including brokers and dealers, commercial banks, credit unions, investment banks, mutual and hedge funds, and other institutional clients. As a result, defaults by, or even negative speculation about, one or more financial services institutions, or the financial services industry in general, have led to market-wide liquidity problems and could lead to losses or defaults by us or by other institutions. Many of these transactions expose us to credit risk in the event of default of our counterparty or client. In addition, our credit risk may be exacerbated when the collateral held by us cannot be realized or is liquidated at prices not sufficient to recover the full amount of the receivable due us. Any such losses could be material and could materially and adversely affect our business, financial condition, results of operations or cash flows.
Negative publicity regarding us, or financial institutions in general, could damage our reputation and adversely impact our business and results of operations.
Our ability to attract and retain customers and conduct our business could be adversely affected to the extent our
reputation is damaged. Reputational risk, or the risk to our business, earnings and capital from negative public
opinion regarding our company, or financial institutions in general, is inherent in our business. Adverse perceptions
concerning our reputation could lead to difficulties in generating and maintaining accounts as well as in financing
them. In particular, negative perceptions concerning our reputation could lead to decreases in the level of deposits
that consumer
and commercial customers and potential customers choose to maintain with us. Negative public opinion could
result from actual or alleged conduct in any number of activities or circumstances, including lending or foreclosure
practices; sales practices; corporate governance and potential conflicts of interest; ethical failures or fraud,
including alleged deceptive or unfair lending or pricing practices; regulatory compliance; protection of customer
information; cyberattacks,
whether actual, threatened, or perceived; negative news about us or the financial
institutions industry generally; general company performance; or from actions taken by government regulators and
community organizations in response to such activities or circumstances. Furthermore, our failure to address, or the
perception that we have failed to address, these issues appropriately could impact our ability to keep and attract
customers and/or employees and could expose us to litigation and/or regulatory action, which could have an
adverse effect on our business and results of operations.
Technology is continually changing and we must effectively implement new innovations in providing services to our customers.
The financial services industry is undergoing rapid technological changes with frequent innovations in technology-driven products and services. In addition to better serving customers, the effective use of technology increases our efficiency and enables us to reduce costs. Our future success will depend, in part, upon our ability to address the needs of our customers using innovative methods, processes and technology to provide products and services that will satisfy customer demands for convenience as well as to create additional efficiencies in our operations as we continue to grow and expand our market areas.
In order to ensure that we are responsive to customer needs as well as compliant with the numerous changes required by the rapid pace of regulatory initiatives, we underwent a conversion of our core information systems in July, 2016. Our ability to successfully transition and implement the new system may affect our ability to meet the needs of our customers and capitalize on the opportunities for efficiencies presented through increased automation.
System failure or breaches of our network security or cybersecurity-related incidents could subject us to increased operating costs, damage to our reputation, litigation and other liabilities.
Information technology systems are critical to our business and we have developed some of our own computer software systems internally. We currently maintain and run our own core computer system for data processing and banking operations. The computer systems and network infrastructure we use could be vulnerable to unforeseen problems that may be unique to our organization. Our operations are dependent upon our ability to protect our computer equipment against damage from physical theft, fire, power loss, telecommunications failure or a similar catastrophic event, as well as from security breaches, cybersecurity-related incidents, denial of service attacks, viruses, worms and other disruptive problems caused by hackers. Any damage or failure that causes an interruption in our operations could have a material adverse effect on our financial condition and results of operations. Computer break-ins, phishing and other disruptions could also jeopardize the security of information stored in, and transmitted through, our computer systems and network infrastructure, which may result in significant liability to us and may cause existing and potential customers to refrain from doing business with us, as well as damage to our reputation in general.
As a financial institution, we are susceptible to fraudulent activity, information security breaches and cyber security-related incidents that may be committed against us or our clients, which may result in financial losses or increased costs to us or our clients, disclosure or misuse of our information or out clients’ information, misappropriation of assets, privacy breaches against our clients, litigation, or damage to our reputation. These risks may increase in the future as we continue to increase our mobile-payment and other internet-based product offerings and expand our internal usage of web-based products and applications.
Such fraudulent activity may take many forms, including check fraud, electronic fraud, wire fraud, phishing, social engineering and other dishonest acts. Information security breaches and cybersecurity-related incidents may include fraudulent or unauthorized access to systems used by us or our clients, denial or degradation of service attacks, and malware or other cyberattacks. In recent periods, there continues to be a rise in electronic fraudulent activity, security breaches and cyberattacks within the financial services industry, especially in the commercial banking sector due to cybercriminals targeting commercial bank accounts. Consistent with industry trends, we have also experienced an increase in attempted electronic fraudulent activity, security breaches and cybersecurity-related incidents in recent periods. Moreover, in the past year, several large corporations, including retail companies, have suffered major data breaches, where in some cases, exposing sensitive financial and other personal information of their clients and subjecting them to potential fraudulent activity. Some of our clients may have been affected by these breaches, which increase their risks of identity theft, credit card fraud and other fraudulent activity that could involve their accounts with the Bank.
Information pertaining to us and our clients is maintained, and transactions are executed, on our networks and systems, those of our clients and certain of our third party partners, such as reporting systems. The secure maintenance and transmission of confidential information, as well as execution of transactions over these systems, are essential to protect us and our clients against fraud and security breaches and to maintain our clients’ confidence. Increases in criminal activity levels and sophistication, advances in computer capabilities, new discoveries, vulnerabilities in third-party technologies (including browsers and operating systems) or other developments could result in a compromise or breach of the technology processes and controls that we use to prevent fraudulent transactions and to protect data about us, our clients and underlying transactions, as well as the technology used by our clients to access our systems. Although we have developed, and continue to invest in, systems and processes that are designed to detect and prevent security breaches and cyber-attacks and periodically test our security, the inability to anticipate, or failure to adequately mitigate, breaches of security could result in: losses to us or our clients; our loss of business and/or clients; damage to our reputation; the incurrence of additional expenses; disruption to our business, and/or our ability to grow our online services or other businesses; additional regulatory scrutiny or penalties; or exposure to civil litigation or possible financial liability, any of which could have a material adverse effect on our business, financial condition and results of operations.
The Federal Financial Institutions Examination Council (“FFIEC”) issued guidance for “Strong Authentication/Two Factor Authentication” in the Internet banking environment. All financial institutions were required to make changes to their online banking systems to meet the FFIEC requirements. In response to this guidance, Trinity incorporated multiple layers of security to protect our customers’ financial data. We further employ external information technology auditors to conduct extensive auditing and testing for any weaknesses in our systems, controls, firewalls and encryption to reduce the likelihood of any security failures or breaches. Although we, with the help of third-party service providers and auditors, intend to continue implementing security technology and establish operational procedures to prevent such damage, there can be no assurance that these security measures will be successful. In addition, advances in computer capabilities, new discoveries in the field of cryptography or other developments could result in a compromise or breach of the algorithms we, and our third-party service providers, use to encrypt and protect customer transaction data. A failure of such security measures could have a material adverse effect on our financial condition and results of operations.
The financial services industry is continually undergoing rapid technological change with frequent introductions of new technology-driven products and services. Many of our competitors have substantially greater resources to invest in technological improvements. We may not be able to effectively or timely implement new technology-driven products and services or be successful in marketing these products and services to our customers and clients. Failure to successfully keep pace with technological change affecting the financial services industry could have a material adverse impact on our business, financial condition, results of operations or cash flows.
We are subject to certain operational risks, including, but not limited to, customer or employee fraud and data processing system failures and errors.
Employee errors and employee and customer misconduct could subject us to financial losses or regulatory sanctions and seriously harm our reputation. Employee errors could include data processing system failures and errors. Misconduct by our employees could include hiding unauthorized activities from us, improper or unauthorized activities on behalf of our customers or improper use of confidential information. It is not always possible to prevent employee errors and misconduct, and the precautions we take to prevent and detect this activity may not be effective in all cases. Employee errors could also subject us to financial claims for negligence. We have reported that we found material weaknesses in our internal control over financial reporting and, while we are enhancing our system of internal controls and we maintain insurance coverage, should our internal controls fail to prevent or detect an occurrence, or if any resulting loss is not insured or exceeds applicable insurance limits, it could have a material adverse effect on our business, financial condition and results of operations.
We may be subject to environmental liabilities in connection with the foreclosure on real estate assets securing the loan portfolio of our banking segment.
Hazardous or toxic substances or other environmental hazards may be located on the real estate that secures our loans. If we acquire such properties as a result of foreclosure, or otherwise, we could become subject to various environmental liabilities. For example, we could be held liable for the cost of cleaning up or otherwise addressing contamination at or from these properties. We could also be held liable to a governmental entity or third party for property damage, personal injury or other claims relating to any environmental contamination at or from these properties. In addition, we could be held liable for costs relating to environmental contamination at or from our current or former properties. We may not detect all environmental hazards associated with these properties. If we ever became subject to significant environmental liabilities, our business, financial condition, liquidity and results of operations could be harmed.
Our ability to pay dividends is limited.
On May 7, 2013, the Company, after consulting with our regulators, determined to defer its regularly scheduled interest payments on its junior subordinated debentures and its quarterly cash dividend payments payable on its preferred stock. Under the terms of both the junior subordinated debentures and the preferred stock, we will not be able to pay dividends on our common shares until the deferred interest payments and all accrued dividends have been paid in full. As of December 31, 2015 the Company had a total of $6.9 million of accrued and unpaid interest due on the junior subordinated debentures and $8.7 million of accrued and unpaid dividends due under Preferred Stock. While we are not in default under these instruments, if we fail to pay interest associated with junior subordinated debentures for 20 consecutive quarters, then the holders of the corresponding trust preferred securities have the ability to take certain actions, including the acceleration of the amounts owed, against Trinity. In addition, pursuant to the terms of the Written Agreement, the Company is prohibited from declaring and paying any dividends without the prior written approval of the FRB. However, the Company has accrued but not declared dividends on its preferred stock so as to not overstate its capital and capital ratios.
Moreover, dividends from the Bank have traditionally served as a major source of the funds with which Trinity pays dividends and interest payments due. However, pursuant to the Consent Order with the OCC, the Bank may not declare and pay any dividends to Trinity unless it complies with certain provisions of the Consent Order and without first obtaining the prior written determination of no supervisory objection from the OCC.
Our indebtedness may affect our ability to operate our business, and may have a material adverse effect on our financial condition and results of operations. We may incur additional indebtedness, including secured indebtedness.
At December 31, 2015, on a consolidated basis, we had total deposits of $1.25 billion and other indebtedness of $39.4 million, including $37.1 million in aggregate principal amount of junior subordinated debentures. Our significant amount of indebtedness could have important consequences, such as:
| · |
limiting our ability to obtain additional financing to fund our working capital needs, acquisitions, capital expenditures or other debt service requirements or for other purposes;
|
| · |
limiting our ability to use operating cash flow in other areas of our business because we must dedicate a substantial portion of these funds to service debt;
|
| · |
limiting our ability to compete with other companies who are not as highly leveraged, as we may be less capable of responding to adverse economic and industry conditions;
|
| · |
restricting us from making strategic acquisitions, developing properties or exploiting business opportunities;
|
| · |
restricting the way in which we conduct our business because of financial and operating covenants in the agreements governing our and certain of our subsidiaries’ existing and future indebtedness, including, in the case of certain indebtedness of subsidiaries, certain covenants that restrict the ability of subsidiaries to pay dividends or make other distributions to us;
|
| · |
exposing us to potential events of default (if not cured or waived) under financial and operating covenants contained in our or our subsidiaries’ debt instruments that could have a material adverse effect on our business, financial condition and operating results;
|
| · |
increasing our vulnerability to a downturn in general economic conditions or a decrease in pricing of our products;
|
| · |
and limiting our ability to react to changing market conditions in our industry and in our customers’ industries.
|
In addition to our debt service obligations, our operations require substantial investments on a continuing basis. Our ability to make scheduled debt payments, to refinance our obligations with respect to our indebtedness and to fund capital and noncapital expenditures necessary to maintain the condition of our operating assets and properties, as well as to provide capacity for the growth of our business, depends on our financial and operating performance, which, in turn, is subject to prevailing economic conditions and financial, business, competitive, legal and other factors. If new debt is added to our current debt levels, the risks described above could increase.
As previously mentioned, the Company is currently deferring the interest payments on the junior subordinated debt. As of September 30, 2016 the Company had a total of $9.1 million of accrued and unpaid interest due on the junior subordinated debt.
We may not be able to generate sufficient cash to service all of our indebtedness and may be forced to take other actions to satisfy our obligations under our indebtedness that may not be successful.
Our ability to satisfy our debt obligations will depend upon, among other things: our future financial and operating performance, which will be affected by prevailing economic conditions and financial, business, regulatory and other factors, many of which are beyond our control.
We cannot assure you that our business will generate sufficient cash flow from operations, or that we will be able to obtain financing in an amount sufficient to fund our liquidity needs.
If our cash flows and capital resources are insufficient to service our indebtedness, we may be forced to reduce or delay capital expenditures, sell assets, seek additional capital or restructure or refinance our indebtedness. These alternative measures may not be successful and may not permit us to meet our scheduled debt service obligations. Our ability to restructure or refinance our debt will depend on the condition of the capital markets and our financial condition at such time. Any refinancing of our debt could be at higher interest rates and may require us to comply with more onerous covenants, which could further restrict our business operations. In addition, the terms of existing or future debt agreements may restrict us from adopting some of these alternatives. In the absence of such operating results and resources, we could face substantial liquidity problems and might be required to dispose of material assets or operations, sell equity and/or negotiate with our lenders and other creditors to restructure the applicable debt in order to meet our debt service and other obligations. We may not be able to consummate those dispositions for fair market value or at all.
Legislative and regulatory actions taken now or in the future may increase our costs and impact our business, governance structure, financial condition or results of operations.
Trinity and the Bank are subject to extensive regulation by multiple regulatory bodies. These regulations may affect the manner and terms of delivery of our services. If we do not comply with governmental regulations, we may be subject to fines, penalties, lawsuits or material restrictions on our businesses in the jurisdiction where the noncompliance occurred, which may adversely affect our business operations. Changes in these regulations can significantly affect the services that we provide as well as our costs of compliance with such regulations. In addition, adverse publicity and damage to our reputation arising from the failure or perceived failure to comply with legal, regulatory or contractual requirements could affect our ability to attract and retain customers.
The recent economic crises, particularly in the financial markets, resulted in government regulatory agencies and political bodies placing increased focus and scrutiny on the financial services industry. The U.S. government intervened on an unprecedented scale by temporarily enhancing the liquidity support available to financial institutions, establishing a commercial paper funding facility, temporarily guaranteeing money market funds and certain types of debt issuances and increasing insurance on bank deposits.
These programs have subjected financial institutions to additional restrictions, oversight and costs. In addition, new proposals for legislation continue to be introduced in the U.S. Congress that could further substantially increase regulation of the financial services industry, impose restrictions on the operations and general ability of firms within the industry to conduct business consistent with historical practices, including in the areas of compensation, interest rates, financial product offerings and disclosures, and have an effect on bankruptcy proceedings with respect to consumer residential real estate mortgages, among other
factors
. Federal and state regulatory agencies also frequently adopt changes to their regulations or change the manner in which existing regulations are applied.
In recent years, regulatory oversight and enforcement have increased substantially, imposing additional costs and increasing the potential risks associated with our operations. If these regulatory trends continue, they could adversely affect our business and, in turn, our consolidated results of operations.
Monetary policies and regulations of the FRB could adversely affect our business, financial condition and results of operations.
In addition to being affected by general economic conditions, our earnings and growth are affected by the policies of the FRB. An important function of the FRB is to regulate the money supply and credit conditions. Among the instruments used by the FRB to implement these objectives are open market operations in U.S. government securities, adjustments of the discount rate and changes in reserve requirements against bank deposits. These instruments are used in varying combinations to influence overall economic growth and the distribution of credit, bank loans, investments and deposits. Their use also affects interest rates charged on loans or paid on deposits.
The monetary policies and regulations of the FRB have had a significant effect on the operating results of commercial banks in the past and are expected to continue to do so in the future. The effects of such policies upon our business, financial condition and results of operations cannot be predicted.
Legislative and regulatory reforms applicable to the financial services industry may have a significant impact on our business, financial condition and results of operations.
On July 21, 2010, the Dodd-Frank Act was signed into law, which significantly changed the regulation of financial institutions and the financial services industry. The Dodd-Frank Act, together with the regulations to be developed thereunder, included provisions affecting large and small financial institutions alike, including several provisions that will affect how community banks, thrifts and small bank and thrift holding companies will be regulated in the future.
The Dodd-Frank Act, among other
factors
: (i) imposed new capital requirements on bank holding companies; (ii) changed the base for FDIC insurance assessments to a bank’s average consolidated total assets minus average tangible equity, rather than upon its deposit base, and permanently raised the current standard deposit insurance limit to $250 thousand; and (iii) expanded the FDIC’s authority to raise insurance premiums. The legislation also called for the FDIC to raise the ratio of reserves to deposits from 1.15% to 1.35% for deposit insurance purposes by September 30, 2020 and to “offset the effect” of increased assessments on insured depository institutions with assets of less than $10 billion The Dodd-Frank Act also authorized the FRB to limit interchange fees payable on debit card transactions, established the CFPB as an independent entity within the FRB, which has broad rulemaking, supervisory and enforcement authority over consumer financial products and services, including deposit products, residential mortgages, home-equity loans and credit cards, and contained provisions on mortgage-related matters, such as steering incentives, determinations as to a borrower’s ability to repay and prepayment penalties. The Dodd-Frank Act also included provisions that affect corporate governance and executive compensation at all publicly-traded companies and allowed financial institutions to pay interest on business checking accounts.
These provisions, or any other aspects of current or proposed regulatory or legislative changes to laws applicable to the financial industry, if enacted or adopted, may impact the profitability of our business activities or change certain of our business practices, including the ability to offer new products, obtain financing, attract deposits, make loans, and achieve satisfactory interest spreads, and could expose us to additional costs, including increased compliance costs. These changes also may require us to invest significant management attention and resources to make any necessary changes to operations in order to comply, and could therefore also materially and adversely affect our business, financial condition and results of operations. Although the majority of the Dodd-Frank Act’s rulemaking requirements have been met with finalized rules, approximately one-third of the rulemaking requirements are either still in the proposal stage or have not yet been proposed. Accordingly, it is difficult to anticipate the continued impact this expansive legislation will have on the Company, its customers and the financial industry generally.
Implementation of the Basel III capital rules adopted by the federal bank regulatory agencies require increased capital levels that we may not be able to satisfy and could impede our growth and profitability.
The Basel III Capital Rules became effective January 1, 2015. The new rules increase minimum capital ratios, add a new minimum common equity ratio, introduce a new capital conservation buffer, and change the risk-weightings of certain assets. These changes will be phased in through 2019. As the rules are phased in they could have a material and adverse effect on our liquidity, capital resources and financial condition.
The Basel III Rules also expand the definition of capital as in effect currently by establishing criteria that instruments must meet to be considered Additional Tier 1 Capital (Tier 1 Capital in addition to Common Equity) and Tier 2 Capital. A number of instruments that used to qualify as Tier 1 Capital no longer qualify, or their qualifications have changed. The Basel III Rules also permit smaller banking organizations to retain, through a one-time election, the existing treatment for accumulated other comprehensive income, which currently does not affect regulatory capital. Trinity made the election to retain the existing treatment of accumulated other comprehensive income. The Basel III Rules have maintained the general structure of the current prompt corrective action framework, while incorporating the increased requirements. The prompt corrective action guidelines were also revised to add the Common Equity Tier 1 Capital ratio. In order to be a “well-capitalized” depository institution under the new regime, a bank and holding company must maintain a Common Equity Tier 1 Capital ratio of 6.5% or more; a Tier 1 Capital ratio of 8% or more; a Total Capital ratio of 10% or more; and a leverage ratio of 5% or more.
Such changes, including changes regarding interpretations and implementation, could affect us in substantial and unpredictable ways and could have a material adverse effect on us, including on our business, financial condition or results of operations. Further, such changes could subject us to additional costs, limit the types of financial services and products we may offer, and/or increase the ability of non-banks to offer competing financial services and products, among other
factors
.
The CFPB has issued “ability-to-repay” and “qualified mortgage” rules that may have a negative impact on our loan origination process and foreclosure proceedings, which could adversely affect our business, operating results, and financial condition.
On January 10, 2013, the CFPB issued a final rule to implement the “qualified mortgage” provisions of the Dodd-Frank Act requiring mortgage lenders to consider consumers’ ability to repay home loans before extending them credit. The CFPB’s “qualified mortgage” rule took effect on January 10, 2014. The final rule describes certain minimum requirements for lenders making ability-to-repay determinations, but does not dictate that they follow particular underwriting models. Lenders will be presumed to have complied with the ability-to-repay rule if they issue “qualified mortgages,” which are generally defined as mortgage loans prohibiting or limiting certain risky features. Loans that do not meet the ability-to-repay standard can be challenged in court by borrowers who default and the absence of ability-to-repay status can be used against a lender in foreclosure proceedings. Any loans that we make outside of the “qualified mortgage” criteria could expose us to an increased risk of liability and reduce or delay our ability to foreclose on the underlying property. The CFPB’s “qualified mortgage” rule could limit our ability or desire to make certain types of loans or loans to certain borrowers, or could make it more expensive or time consuming to make these loans. Any decreases in loan origination volume or increases in compliance and foreclosure costs caused by the rule could negatively affect our business, operating results and financial condition.
Risks Related to Our Common Stock
There is a limited trading market for our common shares and, as with all companies, stockholders may not be able to resell shares at or above the price stockholders paid for them.
Our common stock is not listed on any automated quotation system or securities exchange and no firm makes a market in our stock. The trading in our common shares has less liquidity than companies quoted on the national securities exchanges or markets. A public trading market having the desired characteristics of depth, liquidity and orderliness depends on the presence in the market of willing buyers and sellers of our common shares at any given time. This presence depends on the individual decisions of investors and general economic and market conditions over which we have no control. Although we intend to explore the benefits to liquidity and improved pricing through greater volumes offered by a listing on an exchange, we cannot assure you that we will be accepted for listing on an exchange or, even if we are accepted, that the volume of trading in our common shares will increase.
We may issue shares of preferred stock or additional shares of common stock to raise capital, complete an acquisition or effect a combination or under an employee incentive plan after consummation of an acquisition or combination, which would dilute the interests of our stockholders and likely present other risks.
The issuance of additional shares of preferred stock or common stock:
| · |
may significantly dilute the equity interest of our stockholders;
|
| · |
may subordinate the rights of holders of common stock if preferred stock is issued with rights senior to those afforded our common stock;
|
| · |
could cause a change in control if a substantial number of shares of common stock are issued, which may affect, among other things, our ability to use our net operating loss carry forwards; and
|
| · |
may adversely affect prevailing market prices for our common stock.
|
Our authorized capital stock includes 20,000,000 shares of common stock, 6,856,800 shares of which are issued and outstanding, and 1,000,000 shares of preferred stock, 37,316 shares of which are issued. Subject to limitations imposed by law or our articles of incorporation, our board of directors is empowered to issue authorized shares of common stock and preferred stock and determine the designations, powers, preferences, limitations, restrictions, special or relative rights or qualifications, voting rights, dividend rates, conversion rights, redemption price, and liquidation preferences of any series of preferred stock. Preferred stock could be issued with voting and conversion rights that could adversely affect the voting power of the shares of our common stock.
Our charter and bylaws contain provisions that could discourage acquisition bids or merger proposals.
Authority to Issue Additional Shares
. Under our charter, our board of directors may issue up to an aggregate of 1,000,000 shares of preferred stock without stockholder action.
Subject to limitations imposed by law or our articles of incorporation,
the preferred stock may be issued, in one or more series, with the preferences and other terms designated by our board of directors that may delay or prevent a change in control of us, even if the change is in the best interests of stockholders. At December 31, 2015,
37,316
shares of preferred stock were outstanding.
Banking Laws
. Any change in control of our company is subject to prior regulatory approval under the Bank Holding Company Act or the Change in Bank Control Act, which may delay, discourage or prevent an attempted acquisition or change in control of us.
Restrictions on Calling Special Meeting and Board Nominations
. Our bylaws include a provision prohibiting the holders of less than 25% of the voting shares from calling a special meeting of stockholders. Stockholders must provide advance notice to nominate individuals for election to the board of directors or to propose matters that can be acted upon at a stockholders’ meeting.
Cumulative Voting and Other Board Matters.
Our charter expressly denies cumulative voting in the election of directors. Further our board of directors is divided into three classes, and only one class is up for election each year. Our charter provides that our directors may only be removed for cause and then only by an affirmative vote of at least a majority of the outstanding shares entitled generally in the election of directors. These provisions may discourage or deter a potential acquirer from conducting a solicitation of proxies to elect the acquirer’s own slate of directors or otherwise attempting to obtain control of us.
None
As of
September 30, 2016
, the Company conducts operations through seven locations as shown below. Trinity is headquartered in the main Bank office in Los Alamos, New Mexico. Four banking offices are owned by the Bank and are not subject to any mortgages or material encumbrances. The Bank’s Albuquerque offices are in leased office spaces and the Cerrillos Road office is subject to a ground lease as further discussed in Part II, Item 8 of the Form 10-K, Note 11.
In March 2016, the Bank formed Triscensions ABQ, LLCs, a wholly owned subsidiary of the Bank, for the purpose of acquiring, holding, and managing a commercial office building at 7445 Pan American Freeway, NE in Albuquerque, NM. The Bank intends to utilize approximately one quarter of the building for future banking offices. The transaction is further discussed in Part II, Item 8, Note 22.
The Cerrillos Road ground lease contains a purchase option exercised in 2015, the cost of which is largely offset by a loan held on the property. The Company notified the owners of its intent to exercise its option to purchase the property and expects to complete the purchase or extend the leases in 2016.
In addition to our offices, the Bank operates 22 automatic teller machines (“ATMs”) throughout northern New Mexico. The ATMs are housed either on Bank properties or on leased property.
|
Properties
|
Address
|
Entity
|
||
|
Company Headquarters
|
1200 Trinity Drive
Los Alamos, New Mexico 87544
|
Trinity
|
||
|
Los Alamos Office
|
1200 Trinity Drive
Los Alamos, New Mexico 87544
|
Bank
|
||
|
White Rock Office
|
77 Rover
White Rock, New Mexico 87544
|
Bank
|
||
|
Santa Fe Office I (Galisteo)
|
2009 Galisteo Street
Santa Fe, New Mexico 87505
|
Bank
|
||
|
Santa Fe Office II (Downtown)
|
301 Griffin Street
Santa Fe, New Mexico 87501
|
Bank
|
||
|
Santa Fe Office III (Cerrillos Road)
|
3674 Cerrillos Road
Santa Fe, New Mexico 87507
|
Bank
|
||
|
Albuquerque Office II (AJ II)
|
6700 Jefferson NE Suite D-1
Albuquerque, New Mexico 87109
|
Bank
|
||
|
Albuquerque Office I (AJ I)
|
6700 Jefferson NE Suite A-2
Albuquerque, New Mexico 87109
|
Bank
|
The Company and its subsidiaries are subject, in the normal course of business, to various pending and threatened legal proceedings in which claims for monetary damages are asserted. On an ongoing basis management, after consultation with legal counsel, assesses the Company’s liabilities and contingencies in connection with such legal proceedings. For those matters where it is probable that the Company will incur losses and the amounts of the losses can be reasonably estimated, the Company records an expense and corresponding liability in its consolidated financial statements. To the extent the pending or threatened litigation could result in exposure in excess of that liability, the amount of such excess is not currently estimable.
In addition to legal proceedings occurring in the normal course of business, certain governmental investigations and legal proceedings as set forth below are ongoing.
SEC Investigation:
On September 28, 2015, the SEC announced an administrative settlement with the Company, resolving the previously reported investigation of the Company’s historical accounting and reporting with respect to its restatement of financial information for the years ended December 31, 2006 through December 31, 2011 and the quarters ended March 31, 2012 and June 30, 2012. The Company and the SEC settled the investigation, pursuant to which the Company, without admitting or denying any factual allegations, consented to the SEC’s issuance of an administrative order finding that the Company did not properly account for the Bank’s loan portfolio during 2006 through 2011 and the first two quarters of 2012, did not properly account for its OREO in 2011, and did not have effective internal accounting controls over loan and OREO accounting. In addition, the SEC found that certain former members of the Bank’s management caused the Bank to engage in false and misleading accounting and overrode internal accounting controls. As a result, the SEC found that the Company violated certain provisions of the securities laws, including Section 10(b) of the Exchange Act and Rule 10b-5 thereunder; Section 17(a) of the Securities Act of 1933; and Section 13(a) of the Exchange Act and Rules 13a-1, 13a-13 and 12b-20 thereunder; Section 13(b)(2)(A) of the Exchange Act; and Sections 13(b)(2)(B) of the Exchange Act. The settlement orders the Company to cease and desist from committing or causing any such violations in the future and to pay a civil money penalty in the amount of $1.5 million. The Company agreed to cooperate in proceedings brought by the SEC as well as any future investigations into matters described in the settlement. The Company cooperated fully with the SEC investigation.
SIGTARP/DOJ Investigation:
The Special Inspector General of the Troubled Asset Relief Program (“SIGTARP”) and the Department of Justice (“DOJ”) initiated a criminal investigation relating to the financial reporting and securities filings referenced above and actions relating to the 2012 examination of the Bank by the OCC. The Company is cooperating with all requests from SIGTARP and the DOJ. SIGTARP and DOJ have advised the Company that it is not the target of the investigation.
As of May 1, 2016, no suit or charges have been filed against the Company or its current directors, executive officers or employees by any parties relating to the restatement.
Insurance Coverage and Indemnification Litigation:
| · |
Trinity Capital Corporation and Los Alamos National Bank v. Atlantic Specialty Insurance Company, Federal Insurance Company, William C. Enloe and Jill Cook, (First Judicial District Court, State of New Mexico, Case No. D-132-CV-201500083);
|
| · |
William C. Enloe v. Atlantic Specialty Insurance Company, Federal Insurance Company, Trinity Capital Corporation and Los Alamos National Bank, (First Judicial District Court, State of New Mexico, Case No. D-132-CV-201500082)
; and
|
| · |
Mark Pierce v. Atlantic Specialty Insurance Company, Trinity Capitol Corporation d/b/a Los Alamos National Bank, and Federal Insurance Company, (First Judicial District Court, State of New Mexico, Case No. D-101-CV-201502381).
|
In connection with the restatements and investigations, on September 1, 2015, the Company and William Enloe (“Enloe”), Trinity and the Bank’s former Chief Executive Officer and Chairman of the Board, filed separate suits in New Mexico State Court. Jill Cook, the Company’s former Chief Credit Officer, was also named in the suit brought by Trinity. On October 28, 2015, the Court entered an order consolidating the Enloe and Trinity suits. Mark Pierce, the Bank’s former Senior Lending Officer, filed suit in New Mexico State Court on November 2, 2015. On April 28, 2016, the Court entered an order consolidating the Pierce suit with the Enloe and Trinity suits. In each of the three suits listed above, the plaintiffs seek coverage and reimbursement from the insurance carriers for the defense costs incurred by individuals covered under those policies, as defined therein, in addition to causes of action against the insurance companies for back faith breach of insurance contracts and against Atlantic Specialty Insurance for violations of New Mexico insurance statutes. The suits, with the exception of Enloe’s suit, also seek a determination on the obligations of the Company and/or the Bank to indemnify the former officers. The suits filed by Enloe and Pierce and the counterclaims of Cook allege, in the alternative, negligence against the Company and the Bank for failing to timely put all carriers on notice of claims. The Company and the Bank will vigorously defend its actions and seek indemnification and coverage from its insurance carriers as required under the insurance policies. Due to the complex nature, the outcome and timing of ultimate resolution is inherently difficult to predict.
Title Insurance Coverage Litigation:
First American Title v. Los Alamos National Bank (Second Judicial District Court, State of New Mexico, Case No. D-202-CV-201207023
). This suit relates to title coverage claims regarding a commercial property that served as collateral for a commercial loan made by the Bank. The title company asserted a claim against the Bank for recovery of losses suffered as a result of a settlement entered into by both the title company and the Bank to satisfy the claims of certain contractors who filed liens on the property. On April 29, 2016, the District Court issued its Findings of Fact and Conclusions of Law finding against the Bank and finding the plaintiff is entitled to a judgment in the amount of $150,000 and its costs of bringing suit. The suit was settled in June 2016 for significantly less than the judgment amount.
Not applicable.
PART II
| Item 5. |
Market Information
Trinity’s common stock is not listed on any automated quotation system or securities exchange. No firm makes a market in our stock. As of September 30, 2016, there were 6,526,302 shares of common stock outstanding and approximately 1,660 stockholders of record. At December 31, 2015, the most recently reported sale price of Trinity’s stock was $4.00 per share. As of September 30, 2016, the most recently reported sale price of Trinity’s stock was $4.00 per share.
The tables below show the reported high and low sales prices of the common stock during the periods indicated. The prices below are only the trades where the price was disclosed to the Company. Sales where the value of the shares traded was not given to us are not included.
|
Quarter ended
|
High sales price
|
Low sales price
|
||||||
|
December 31, 2015
|
$
|
4.00
|
$
|
4.00
|
||||
|
September 30, 2015
|
4.00
|
4.00
|
||||||
|
June 30, 2015
|
4.50
|
4.00
|
||||||
|
March 31, 2015
|
4.50
|
3.00
|
||||||
|
December 31, 2014
|
$
|
3.40
|
$
|
2.50
|
||||
|
September 30, 2014
|
4.25
|
3.50
|
||||||
|
June 30, 2014
|
4.50
|
4.25
|
||||||
|
March 31, 2014
|
5.00
|
4.25
|
||||||
A table presenting the shares issued and available to be issued under stock-based benefit plans and arrangements can be found under Part III, Item 12,“Security Ownership of Certain Beneficial Owners and Management and Related Stockholder Matters” of this Form 10-K.
Dividend Policy
Trinity did not pay dividends on its common stock during 2015 or 2014. The Company is subject to certain restrictions that currently materially limit its ability to pay dividends on its common stock. Under New Mexico law, a corporation may not, subject to any restrictions in its articles of incorporation, make any distributions to its shareholders if, after giving effect to such distribution either (1) the corporation would be unable to pay its debts as they become due in the usual course of its business, or (2) the corporation’s total assets would be less than the sum of its total liabilities and the maximum amount that then would be payable, in any liquidation, in respect of all outstanding shares having preferential rights in liquidation. In addition, pursuant to the terms of the Written Agreement, the Company is prohibited from declaring and paying any dividends without the prior written approval of the FRB.
On May 7, 2013, the Company, determined to defer its regularly scheduled interest payments on its junior subordinated debentures and its quarterly cash dividend payments payable on its Preferred Stock. Under the terms of both the junior subordinated debentures and the Preferred Stock, we will not be able to pay dividends on our common shares until the deferred interest payments and all accrued dividends on our preferred stock have been paid in full. While we are not in default under these instruments, if we fail to pay interest associated with junior subordinated debentures for 20 consecutive quarters, then the holders of the corresponding trust preferred securities have the ability to take certain actions, including the acceleration of the amounts owed, against Trinity. In addition, pursuant to the terms of the Written Agreement, the Company is prohibited from declaring and paying any dividends without the prior written approval of the FRB.
As of December 31, 2015, the Company had a total of $6.9 million of accrued and unpaid interest due on the junior subordinated debentures and $8.7 million of accrued and unpaid dividends due under the Preferred Stock. See Item 1, “Supervision and Regulation” of this Form 10-K for a more detailed description of these limitations. The Company continues to defer the interest due on the junior subordinated debentures and the dividends on the Preferred Stock. As of September 30, 2016, the Company had a total of $9.1 million of accrued and unpaid interest due on the junior subordinated debentures.
As of September 30, 2016, the Company continues to defer the payment of dividends on the Preferred Stock. As of that date, the amount of dividends accrued and unpaid for Series A and Series B totaled $11.2 million and $677 thousand, respectively or $314.91 dollars per share for Series A and $380.85 per share for Series B.
Dividends from the Bank have traditionally served as a major source of funds with which Trinity pays dividends and interest due. However, pursuant to the Consent Order with the OCC, the Bank may not declare or pay any dividends to Trinity unless it first obtains a prior written determination of no supervisory objection from the OCC. In addition, Trinity cannot accept the payment of a dividend from the Bank without prior written approval of the FRB.
Issuer Purchases of Equity Securities
During 2015 and 2014, the Company made no repurchases of any class of equity securities.
Stockholder Return Performance Graph
The following graph and related information shall not be deemed to be filed, but rather furnished to the SEC by inclusion herein.
The following graph shows a comparison of cumulative total returns for Trinity, the NASDAQ Stock Market, an index of all bank stocks followed by SNL, an index of bank stock for banks with $1 billion to $5 billion in total assets followed by SNL, and an index of bank stocks for banks in asset size over $500 million that are quoted on the Pink Sheets followed by SNL. The cumulative total stockholder return computations assume the investment of $100.00 on December 31, 2011 and the reinvestment of all dividends. Figures for Trinity’s common stock represent inter-dealer quotations, without retail markups, markdowns or commissions and do not necessarily represent actual transactions. The graph was prepared using data provided by SNL Financial LLC, Charlottesville, Virginia.
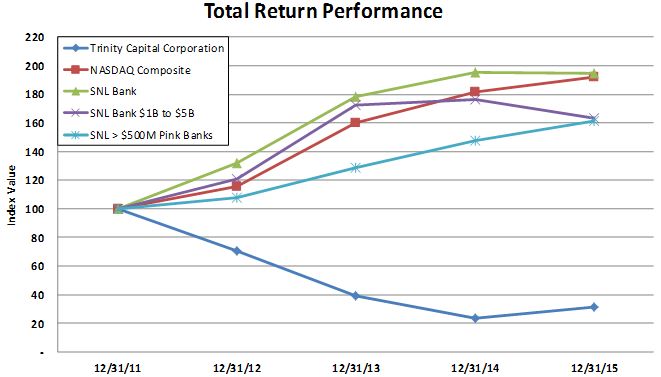
|
Index
|
12/31/11
|
12/31/12
|
12/31/13
|
12/31/14
|
12/31/15
|
|||||||||||||||
|
Trinity Capital Corporation
|
$
|
100.00
|
$
|
70.59
|
$
|
39.22
|
$
|
23.53
|
$
|
31.37
|
||||||||||
|
NASDAQ Composite
|
100.00
|
115.91
|
160.32
|
181.80
|
192.21
|
|||||||||||||||
|
SNL Bank
|
100.00
|
132.25
|
178.24
|
195.55
|
194.97
|
|||||||||||||||
|
SNL Bank $1B to $5B
|
100.00
|
120.62
|
172.25
|
176.73
|
163.66
|
|||||||||||||||
|
SNL > $500M Pink Banks
|
100.00
|
107.55
|
128.49
|
147.99
|
161.33
|
|||||||||||||||
The following tables set forth certain consolidated financial and other data of Trinity at the dates and for the periods indicated.
|
Year ended December 31,
|
||||||||||||||||||||
|
2015
|
2014
|
2013
|
2012
|
2011
|
||||||||||||||||
|
(Dollars in thousands, except per share and share data)
|
||||||||||||||||||||
|
Statement of Operations data:
|
||||||||||||||||||||
|
Interest income
|
$
|
47,604
|
$
|
52,150
|
$
|
60,695
|
$
|
67,274
|
$
|
66,044
|
||||||||||
|
Interest expense
|
5,876
|
7,356
|
8,821
|
10,393
|
12,506
|
|||||||||||||||
|
Net interest income
|
41,728
|
44,794
|
51,874
|
56,881
|
53,538
|
|||||||||||||||
|
Provision for loan losses
|
500
|
2,000
|
-
|
27,206
|
30,561
|
|||||||||||||||
|
Net interest income after provision for loan losses
|
41,228
|
42,794
|
51,874
|
29,675
|
22,977
|
|||||||||||||||
|
Noninterest income
|
11,574
|
13,186
|
15,465
|
19,125
|
15,831
|
|||||||||||||||
|
Noninterest expenses
|
50,888
|
60,802
|
54,476
|
51,558
|
52,577
|
|||||||||||||||
|
Income (loss) before provision (benefit) for income taxes
|
1,914
|
(4,822
|
)
|
12,863
|
(2,758
|
)
|
(13,769
|
)
|
||||||||||||
|
Provision (benefit) for income taxes
|
-
|
1,170
|
-
|
(250
|
)
|
9,639
|
||||||||||||||
|
Net income (loss)
|
1,914
|
(5,992
|
)
|
12,863
|
(2,508
|
)
|
(23,408
|
)
|
||||||||||||
|
Dividends on preferred shares
|
3,803
|
3,230
|
2,144
|
2,115
|
2,142
|
|||||||||||||||
|
Net (loss) income available to common shareholders
|
$
|
(1,889
|
)
|
$
|
(9,222
|
)
|
$
|
10,719
|
$
|
(4,623
|
)
|
$
|
(25,550
|
)
|
||||||
|
Common Share data:
|
||||||||||||||||||||
|
(Loss) Earnings per common share
|
$
|
(0.29
|
)
|
$
|
(1.43
|
)
|
$
|
1.66
|
$
|
(0.72
|
)
|
$
|
(3.96
|
)
|
||||||
|
Diluted (loss) earnings per common share
|
(0.29
|
)
|
(1.43
|
)
|
1.66
|
(0.72
|
)
|
(3.96
|
)
|
|||||||||||
|
Book value per common share (1)
|
6.51
|
7.20
|
8.63
|
7.09
|
7.89
|
|||||||||||||||
|
Shares outstanding at end of period
|
6,491,802
|
6,453,049
|
6,449,726
|
6,449,726
|
6,449,726
|
|||||||||||||||
|
Weighted average common shares outstanding
|
6,483,637
|
6,452,557
|
6,449,726
|
6,449,726
|
6,449,726
|
|||||||||||||||
|
Diluted weighted average common shares outstanding
|
6,483,637
|
6,452,557
|
6,449,726
|
6,449,726
|
6,449,726
|
|||||||||||||||
|
Dividend pay out ratio (2)
|
N/A
|
N/A
|
N/A
|
-0.2083
|
-0.0631
|
|||||||||||||||
|
Cash dividend declared per common share (3)
|
$
|
-
|
$
|
-
|
$
|
-
|
$
|
0.15
|
$
|
0.25
|
||||||||||
| (1) |
Computed by dividing total stockholders’ equity less preferred stock, including net stock owned by the Employee Stock Ownership Plan (“ESOP”), by shares outstanding at end of period.
|
| (2) |
Computed by dividing dividends declared per common share by earnings (loss) per common share.
|
| (3) |
Computed by dividing dividends on consolidated statements of changes in stockholders’ equity by weighted average common shares outstanding.
|
|
|
As of or For the Year Ended December 31,
|
|||||||||||||||||||
|
|
2015
|
2014
|
2013
|
2012
|
2011
|
|||||||||||||||
|
|
(Dollars in thousands)
|
|||||||||||||||||||
|
Balance Sheet Data:
|
||||||||||||||||||||
|
Investment securities
|
$
|
325,026
|
$
|
227,797
|
$
|
143,148
|
$
|
133,391
|
$
|
145,490
|
||||||||||
|
Loans, gross
|
839,788
|
910,547
|
1,057,088
|
1,193,824
|
1,184,319
|
|||||||||||||||
|
Allowance for loan loses
|
17,392
|
24,783
|
28,358
|
35,633
|
34,873
|
|||||||||||||||
|
Total assets
|
1,398,985
|
1,446,206
|
1,550,020
|
1,544,912
|
1,484,179
|
|||||||||||||||
|
Deposits
|
1,253,958
|
1,282,592
|
1,383,065
|
1,393,139
|
1,327,127
|
|||||||||||||||
|
Borrowings, including capital lease obligation
|
4,511
|
24,511
|
24,511
|
24,511
|
24,511
|
|||||||||||||||
|
Junior subordinated debt
|
37,116
|
37,116
|
37,116
|
37,116
|
37,116
|
|||||||||||||||
|
Stock owned by ESOP participants, net of unearned ESOP shares
|
2,690
|
2,019
|
3,366
|
6,059
|
8,245
|
|||||||||||||||
|
Stockholders' equity
|
76,300
|
81,003
|
88,710
|
75,858
|
78,679
|
|||||||||||||||
|
|
||||||||||||||||||||
|
Performance ratios:
|
||||||||||||||||||||
|
Return on average assets (1)
|
0.13
|
%
|
(0.40
|
)%
|
0.83
|
%
|
(0.17
|
)%
|
(1.53
|
)%
|
||||||||||
|
Return on average equity (2)
|
2.31
|
%
|
(6.84
|
)%
|
14.70
|
%
|
(3.00
|
)%
|
(26.93
|
)%
|
||||||||||
|
Return on average common equity (3)
|
(4.09
|
)%
|
(16.78
|
)%
|
20.95
|
%
|
(9.74
|
)%
|
(36.91
|
)%
|
||||||||||
|
Net interest margin (4)
|
3.02
|
%
|
3.15
|
%
|
3.56
|
%
|
3.90
|
%
|
3.75
|
%
|
||||||||||
|
Loans to deposits
|
66.97
|
%
|
70.99
|
%
|
76.43
|
%
|
85.69
|
%
|
89.24
|
%
|
||||||||||
|
Efficiency ratio (5)
|
95.47
|
%
|
104.87
|
%
|
80.90
|
%
|
67.83
|
%
|
75.79
|
%
|
||||||||||
| (1) |
Calculated by dividing net income (loss) by average assets.
|
| (2) |
Calculated by dividing net income (loss) by average stockholders’ equity, including stock owned by ESOP participants, net of unearned ESOP shares.
|
| (3) |
Calculated by dividing net income (loss) available to common shareholders by average common stockholders’ equity, including stock owned by ESOP participants, net of unearned ESOP shares.
|
| (4) |
Calculated by dividing net interest income (adjusting for federal and state exemption of interest income and certain other permanent income tax differences) by average earning assets.
|
| (5) |
Calculated by dividing operating expense by the sum of net interest income and noninterest income.
|
|
Year Ended December 31,
|
||||||||||||||||||||
|
2015
|
2014
|
2013
|
2012
|
2011
|
||||||||||||||||
|
Asset Quality Ratios:
|
||||||||||||||||||||
|
Non-performing loans to total loans
|
3.60
|
%
|
5.29
|
%
|
4.92
|
%
|
3.81
|
%
|
5.91
|
%
|
||||||||||
|
Non-performing assets to total assets
|
2.76
|
%
|
4.32
|
%
|
4.29
|
%
|
3.56
|
%
|
5.63
|
%
|
||||||||||
|
Allowance for loan losses to total loans
|
2.07
|
%
|
2.72
|
%
|
2.68
|
%
|
2.98
|
%
|
2.94
|
%
|
||||||||||
|
Allowance for loan losses to non- performing loans
|
57.35
|
%
|
51.40
|
%
|
54.41
|
%
|
78.09
|
%
|
49.75
|
%
|
||||||||||
|
Net loan charge-offs to average loans
|
0.91
|
%
|
0.57
|
%
|
0.64
|
%
|
2.18
|
%
|
2.18
|
%
|
||||||||||
|
Capital Ratios: (1)
|
||||||||||||||||||||
|
Tier 1 capital (to risk-weighted assets)
|
11.13
|
%
|
12.10
|
%
|
11.93
|
%
|
9.47
|
%
|
9.93
|
%
|
||||||||||
|
Total capital (to risk-weighted assets)
|
14.10
|
%
|
14.27
|
%
|
13.72
|
%
|
11.50
|
%
|
11.81
|
%
|
||||||||||
|
Common Equity Tier 1 (to risk weighted assets)
|
4.85
|
%
|
NA
|
NA
|
NA
|
NA
|
||||||||||||||
|
Tier 1 leverage (to average assets)
|
7.11
|
%
|
7.54
|
%
|
8.02
|
%
|
6.98
|
%
|
7.78
|
%
|
||||||||||
|
Average equity, including junior subordinated debt, to average assets
|
8.32
|
%
|
8.50
|
%
|
8.09
|
%
|
7.98
|
%
|
8.09
|
%
|
||||||||||
|
Other:
|
||||||||||||||||||||
|
Banking facilities
|
7
|
7
|
7
|
7
|
7
|
|||||||||||||||
|
Full-time equivalent employees
|
307
|
350
|
358
|
347
|
331
|
|||||||||||||||
| (1) |
Ratios presented are for Trinity on a consolidated basis. See Item 7, “Management’s Discussion and Analysis of Financial Condition and Results of Operations—Capital Resources” and Note 19 to the consolidated financial statements included in Part II, Item 8.
|
The following discussion should be read in conjunction with the other sections of this Form 10-K, including our consolidated financial statements and related notes included in this Form 10-K. This discussion contains forward-looking statements that are based on management’s current expectations, estimates and projections about our business and operations. Our actual results may differ materially from those currently anticipated and expressed in such forward-looking statements, including as a result of the factors we describe under Part I, Item 1A “Risk Factors” and elsewhere in this Form 10-K. See “Special Note Regarding Forward-Looking Statements” appearing at the beginning of this Form 10-K and “Risk Factors” set forth in Part I, Item 1A of this Form 10-K.
Overview
The Company’s net loss available to common shareholders was reduced by $7.3 million from a net loss of $9.2 million for the year ended December 31, 2014 to net loss of $1.9 million for the year ended December 31, 2015. This loss was primarily attributable to the decrease in interest income on loans and the decrease in income on the venture capital investments. Offsetting these factors was a reduction in professional and legal fees in connection with the audits for the restatements of financial statements, a decrease in losses on sale of OREO properties, a decrease in loan loss provisions, and a decrease in interest expenses. As discussed in Part I, Item 3 of this Annual Report on Form 10-K, the Company reached a settlement with the SEC on September 28, 2015, resolving the previously reported investigation which began in January 2013. Under the terms of the agreement with the SEC, the Company will continue to provide assistance in any proceeding or investigation relating to the settlement. Additionally, the Company is cooperating with requests for information received from SIGTARP and DOJ. The related investigations resulted in the significant increase in legal, professional and accounting fees from prior periods and the imposition of a civil monetary penalty in the amount of $1.5 million. The penalty imposed is reflected in the quarterly period ended March 31, 2014.
The Company continues to experience challenges in its loan portfolio, with high levels of non-performing loans and foreclosed properties. In response to these challenges and to proactively position the Company to meet these challenges, we continue to reduce our concentration in the construction real estate portfolio and have taken other steps in compliance with the regulatory enforcement actions taken against the Company and the Bank.
Regulatory Actions Against the Company and the Bank.
As discussed in Part I, Item 1 of this Form 10-K, the FRB entered into the Written Agreement with Trinity. The Written Agreement requires Trinity to serve as a source of strength to the Bank and restricts Trinity’s ability to issue dividends and other capital distributions and to repurchase or redeem any Trinity stock without the prior written approval of the FRB. The Written Agreement further requires that Trinity implement a capital plan, subject to approval by the FRB, and submit cash flow projections to the FRB. Finally, the Written Agreement requires Trinity to comply with all applicable laws and regulations and to provide quarterly progress reports to the FRB. Additionally, the Bank entered into a Consent Order with the OCC. The Consent Order focuses on improving the Bank’s credit administration, credit underwriting, internal controls, compliance and management supervision. Additionally, the Consent Order requires that the Bank maintain certain capital ratios and receive approval of the OCC prior to declaring dividends. The Consent Order requires the Bank to maintain the following minimum capital ratios: (i) a leverage ratio of Tier 1 Capital to average total assets of at least 8%; and (ii) a ratio of Total Capital to total risk-weighted assets of at least 11%. The Company continues to take action to ensure the satisfaction of the requirements under the Consent Order and the Written Agreement.
Critical Accounting Policies
Allowance for Loan and Lease Losses:
The allowance for loan and lease losses is that amount which, in management’s judgment, is considered appropriate to provide for probable incurred losses in the loan portfolio. In analyzing the adequacy of the allowance for loan losses, management uses a comprehensive loan grading system to determine risk potential in the portfolio, and considers the results of periodic internal and external loan reviews. Specific reserves for impaired loans and historical loss experience factors, combined with other considerations, such as delinquency, nonaccrual, trends on criticized and classified loans, economic conditions, concentrations of credit risk, and experience and abilities of lending personnel, are also considered in analyzing the adequacy of the allowance. Management uses a systematic methodology, which is applied quarterly, to determine the amount of allowance for loan losses and the resultant provisions for loan losses it considers adequate to provide for probable incurred loan losses. In the event that different assumptions or conditions were to prevail, and depending upon the severity of such changes, the possibility of materially different financial condition or results of operations is a reasonable likelihood.
The allowance consists of specific and general components. The specific component relates to loans that are individually classified as impaired when, based on current information and events, it is probable that the Company will be unable to collect all amounts due according to the contractual terms of the loan agreement. The general component covers non‑impaired loans and is based on historical loss experience adjusted for current factors.
The general component is based upon (a) h
istoric performance
; and (
b
)
an estimate of the impact of environmental or qualitative factors
based on l
evels of credit concentrations; lending policies and procedures; the nature and volume of the portfolio; the experience, ability and depth of lending management and staff; the volume and severity of past dues, criticized, classified and nonaccrual loans; the quality of the loan review system; the change in economic conditions; loan collateral value for dependent loans; and other external factors, examples of which are changes in regulations, laws or legal precedent and competition.
While management uses the best information available to make its evaluation, future adjustments to the allowance may be necessary if there are significant changes in economic conditions. In addition, as an integral part of their examination process, regulatory agencies periodically review our allowance for loan losses and may require us to make additions to the allowance based on their evaluation of information available at the time of their examinations.
Investment securities:
Securities classified as available for sale are debt securities the Bank intends to hold for an indefinite period of time, but not necessarily to maturity. Any decision to sell a security classified as available for sale would be based on various factors, including significant movements in interest rates, changes in the maturity mix of the Bank's assets and liabilities, liquidity needs, regulatory capital considerations and other similar factors. Securities available for sale are reported at fair value with unrealized gains or losses reported as other comprehensive income, net of the related deferred tax effect. Securities classified as held to maturity are those securities that the Bank has the ability and positive intent to hold until maturity. These securities are reported at amortized cost. Sales of investment securities held to maturity within three months of maturity are treated as maturities. Realized gains or losses, determined on the basis of the cost of specific securities sold, are included in earnings.
Purchase premiums and discounts are generally recognized in interest income using the interest method over the term of the securities. For mortgage-backed securities, estimates of prepayments are considered in the constant yield calculations.
Securities available for sale are reported at fair value, with unrealized gains and losses reported as a separate component of accumulated other comprehensive income, net of deferred income taxes. Declines in fair value of individual securities, below their amortized cost, are evaluated by management to determine whether the decline is temporary or “other-than-temporary.” Declines in the fair value of available for sale securities below their cost that are deemed “other-than-temporary” are reflected in earnings as impairment losses. In determining whether other-than-temporary impairment (“OTTI”) exists, management considers whether: (1) we have the intent to sell the security, (2) it is more likely than not that we will be required to sell the security before recovery of the amortized cost basis, and (3) we do not expect to recover the entire amortized cost basis of the security. When we determine that OTTI has occurred, the amount of the OTTI recognized in earnings depends on whether we intend to sell the security or whether it is more likely than not we will be required to sell the security before recovery of its amortized cost basis. If we intend to sell, or it is more likely than not we will be required to sell, the security before recovery of its amortized cost basis, the OTTI recognized in earnings is equal to the entire difference between the investment’s amortized cost basis and its fair value at the balance sheet date. If we do not intend to sell the security, and it is not more likely than not that we will be required to sell before recovery of its amortized cost basis, the OTTI is separated into the amount representing the credit loss and the amount related to all other factors. The amount of the total OTTI related to the credit loss is determined based on the present value of cash flows expected to be collected, using the original yield as the discount rate, and is recognized in earnings. The amount of the total OTTI related to other factors is recognized in accumulated other comprehensive income, net of applicable taxes. The previous amortized cost basis less the OTTI recognized in earnings becomes the new amortized cost basis of the investment. The assessment of whether an OTTI exists involves a high degree of subjectivity and judgment and is based on the information available to management at the time.
Deferred Tax Asset
s:
A valuation allowance is required for deferred tax assets (“DTA”) if, based on available evidence, it is more likely than not that all or some portion of the asset may not be realized due to the inability to generate sufficient taxable income in the period and/or of the character necessary to utilize the benefit of the DTA. In making this assessment, all sources of taxable income available to realize the DTA are considered, including taxable income in prior carryback years, future reversals of existing temporary differences, tax planning strategies, and future taxable income exclusive of reversing temporary differences and carry-forwards. The predictability that future taxable income, exclusive of reversing temporary differences, will occur is the most subjective of these four sources. The presence of cumulative losses in recent years is considered significant negative evidence, making it difficult for a company to rely on future taxable income, exclusive of reversing temporary differences and carry-forwards, as a reliable source of taxable income to realize a DTA. Judgment is a critical element in making this assessment. Changes in the valuation allowance that result from favorable changes in those circumstances that cause a change in judgment about the realization of deferred tax assets in future years are recorded through income tax expense.
In assessing the need for a valuation allowance, the Company considered all available evidence about the realization of DTAs, both positive and negative, that could be objectively verified. The Company’s positive evidence was insufficient to overcome the negative evidence. Therefore, the Company continues to maintain a full valuation allowance on its net deferred tax assets as of December 31, 2015.
Reversal of the DTA valuation allowance is subject to considerable judgment. However, the Company expects to reverse the DTA valuation allowance once it has demonstrated a sustainable return to profitability and experienced consecutive profitable quarters coupled with a forecast of sufficient continuing profitability. Depending upon the level of forecasted taxable income, the degree of probability related to realizing the forecasted taxable income, and the estimated risk related to credit quality, a reversal of the valuation allowance could occur. In that event, there will remain limitations on the ability to include the DTA for regulatory capital purposes. Pursuant to regulatory requirements, DTAs that arise from net operating loss and tax credit carryforwards are shown as a deduction from common equity tier 1 capital and additional tier 1 capital based on transition provisions starting in 2015 with these DTAs being fully deducted from common equity tier 1 capital in 2018. DTAs that arise from temporary differences that could not be realized through net operating loss carrybacks which exceed either a 10% or 15% threshold of common equity tier 1 capital are reported as deductions from common equity tier 1 capital. Finally, DTAs that arise from temporary differences that can be realized through net operating loss carrybacks are not subject to deduction.
Other Real Estate Owned (“OREO”):
OREO, consisting of properties obtained through a foreclosure proceeding or through an in-substance foreclosure in satisfaction of loans, is reported at the lower of cost or fair value, determined on the basis of current appraisals, comparable sales, and other estimates of fair value obtained principally from independent sources, adjusted for estimated selling costs. Management also considers other factors or recent developments, such as changes in absorption rates or market conditions from the time of valuation and anticipated sales values considering management’s plans for disposition, which could result in adjustments to the collateral value estimates indicated in the appraisals. Significant judgments and complex estimates are required in estimating the fair value of other real estate, and the period of time within which such estimates can be considered current is significantly shortened during periods of market volatility. In response to market conditions and other economic factors, management may utilize liquidation sales as part of its distressed asset disposition strategy. As a result of the significant judgments required in estimating fair value and the variables involved in different methods of disposition, the net proceeds realized from sales transactions could differ significantly from appraisals, comparable sales, and other estimates used to determine the fair value of other real estate. Management reviews the value of other real estate each quarter and adjusts the values as appropriate.
Mortgage Servicing Rights (“MSRs”):
The expected and actual rates of mortgage loan prepayments are the most significant factors driving the value of MSRs. Increases in mortgage loan prepayments reduce estimated future net servicing cash flows because the life of the underlying loan is reduced. In determining the fair value of the MSRs, mortgage interest rates, which are used to determine prepayment rates and discount rates, are held constant over the estimated life of the portfolio. Fair values of the MSRs are calculated on a monthly basis. The values are based upon current market conditions and assumptions for comparable mortgage servicing contracts, which incorporate the expected life of the loans, estimated costs to service the loans, servicing fees to be received and other factors. The valuation model calculates the present value of estimated future net servicing income. MSRs are carried at the lower of the initial capitalized amount, net of accumulated amortization, or fair value.
The primary risk characteristics of the underlying loans used to stratify the servicing assets for the purposes of measuring impairment are interest rate and original term.
A valuation allowance is used to recognize impairments of our MSRs. An MSR is considered impaired when the fair value of the MSR is below the amortized book value of the MSR. The MSRs are accounted by risk tranche, with the interest rate and term of the underlying loan being the primary strata used in distinguishing the tranches. Each tranche is evaluated separately for impairment.
MSRs are analyzed for impairment on a monthly basis. The underlying loans on all serviced loans are reviewed and, based upon the value of MSRs that are traded on the open market, a current fair value is assigned for each risk tranche in our portfolio and then compared to the current amortized book value for each tranche. The change in fair value (up to the amortized value of the MSR) is recorded as an adjustment to the MSR valuation allowance, with the offset recorded to earnings.
Fees earned for MSRs are recorded as mortgage loan servicing fees on the consolidated statement of operations. The fees are based on a contractual percentage of the outstanding principal; or a fixed amount per loan and are recorded as income when earned. The amortization of MSRs as well as change in any valuation allowances are netted against loans servicing fee income.
Results of Operations
The profitability of the Company’s operations depends primarily on its net interest income, which is the difference between total interest earned on interest-earning assets and total interest paid on interest-bearing liabilities. The Company’s net income is also affected by its provision for loan losses as well as noninterest income and noninterest expenses.
Net interest income is affected by changes in the volume and mix of interest-earning assets, the level of interest rates earned on those assets, the volume and mix of interest-bearing liabilities, and the level of interest rates paid on those interest-bearing liabilities. Provision for loan losses is dependent on changes in the loan portfolio and management’s assessment of the collectability of the loan portfolio, as well as economic and market conditions. Noninterest income and noninterest expenses are impacted by growth of operations and growth in the number of accounts. Noninterest expenses are impacted by additional employees, branch facilities and promotional marketing expenses. A number of accounts affect noninterest income, including service fees as well as noninterest expenses such as computer services, supplies, postage, telecommunications and other miscellaneous expenses.
Net Income (Loss).
Net loss available to common shareholders for the year ended December 31, 2015 was $1.9 million, or a diluted loss per common share of $0.29, compared to net loss available to common shareholders of $9.2 million for the year ended December 31, 2014, or diluted loss per common share of $1.43, a decrease of $7.3 million in net losses and a decrease in diluted loss per common share of $1.14. This decrease in net loss available to common shareholders was primarily due to decreases of $3.6 million in professional, legal and accounting fees, a decrease of $2.4 million in losses on sales of OREO properties, a decrease in the loan loss provision of $1.5 million, a decrease of $1 million in interest expense on deposits, $800 thousand decreases in both salaries and employee benefits and occupancy expenses, and an increase of $1.6 million in investment securities interest income. These fluctuations were partially offset by a decrease in interest income on loans including loan fees of $6.4 million. Reductions in the net loan portfolio of $63.4 million resulted in an adverse effect on the interest income earned on loans. The reduction in the size of the loan portfolio was driven by management’s focus on reducing nonperforming assets and positioning the Bank to meet and exceed its targeted capital levels. The decrease in the provision for loan losses was due to decreases in the loan portfolio and in the amount of non-performing loans. The decrease in legal, professional and accounting fees was due to decreased costs associated with the restatement of the consolidated financial statements and the related requests for information pertaining to the restatements for regulatory agencies, including the SEC, as well as compliance with enforcement actions issued by bank regulators. A reduction in interest-bearing deposits of $37 million resulted in a decline for net interest expense on deposits.
Net loss available to common shareholders for the year ended December 31, 2014 was $9.2 million, or diluted loss per common share of $1.43, compared to a net income available to common shareholders of $10.7 million for the year ended December 31, 2013, or a diluted earnings per common share of $1.66, a decrease of $19.9 million in net income and a decrease in diluted earnings per common share of $3.09. This decrease in net income available to common shareholders was primarily due to decreases in interest income on loans of $9.2 million and decrease in net gain on sale of loans of $2.8 million as well as increases in legal, professional and accounting fees of $3.7 million, a $2 million provision for loan loss expense, amortization and valuation of MSRs of $1.5 million and the payment of a civil monetary penalty of $1.5 million to the SEC. These fluctuations were partially offset by decreases in collection expenses of $3.2 million and interest expense on deposits of $1.6 million. Reductions in the net loan portfolio of $143 million resulted in an adverse effect on the interest income earned on loans. The reduction in the size of the loan portfolio was driven by management’s focus on reducing nonperforming assets and positioning the Bank to meet and exceed its targeted capital levels. Net gain on sale of loans decreased mainly due to a lower volume of loans sold in 2014 compared to 2013. The increase in the provision for loan losses was due to loan impairment adjustments identified in subsequent event reviews and to provide an adequate reserve for problem loans. The increase in legal, professional and accounting fees was due to increased costs associated with the restatement of the consolidated financial statements and the related requests for information pertaining to the restatements for regulatory agencies, including the SEC, as well as compliance with enforcement actions issued by bank regulators. Collection expenses decreased primarily due to a lower volume of appraisals and title work as a result of the restatement work which occurred in 2013 and sale or refinance of OREO properties under third-party management. A reduction in interest-bearing deposits of $95.9 million resulted in a decline for net interest expense on deposits. The increase in the amortization and valuation of MSRs was due to an increase in the valuation allowance.
Net Interest Income.
The following table presents, for the periods indicated the total dollar amount of interest income from average interest-earning assets and the resultant yields, as well as the interest expense on average interest-bearing liabilities, and the resultant costs, expressed both in dollars and rates:
|
Year Ended December 31,
|
||||||||||||||||||||||||||||||||||||
|
2015
|
2014
|
2013
|
||||||||||||||||||||||||||||||||||
|
Average
Balance
|
Interest
|
Yield
/Rate
|
Average
Balance
|
Interest
|
Yield
/Rate
|
Average
Balance
|
Interest
|
Yield
/Rate
|
||||||||||||||||||||||||||||
|
(Dollars in thousands)
|
||||||||||||||||||||||||||||||||||||
|
Interest-earning Assets:
|
||||||||||||||||||||||||||||||||||||
|
Loans(1)
|
$
|
862,465
|
$
|
42,364
|
4.91
|
%
|
$
|
975,317
|
$
|
48,766
|
5.00
|
%
|
$
|
1,142,734
|
$
|
58,002
|
5.08
|
%
|
||||||||||||||||||
|
Taxable investment securities
|
269,653
|
3,956
|
1.47
|
%
|
178,102
|
2,081
|
1.17
|
%
|
136,909
|
1,456
|
1.06
|
%
|
||||||||||||||||||||||||
|
Investment securities exempt from federal income taxes
|
6,739
|
175
|
12,223
|
452
|
3.70
|
%
|
12,585
|
582
|
4.62
|
%
|
||||||||||||||||||||||||||
|
Securities purchased under resell agreements
|
20,129
|
155
|
0.77
|
%
|
19,689
|
134
|
0.68
|
%
|
17,937
|
126
|
0.70
|
%
|
||||||||||||||||||||||||
|
Other interest-bearing deposits
|
217,590
|
739
|
0.34
|
%
|
234,755
|
580
|
0.25
|
%
|
155,371
|
392
|
0.25
|
%
|
||||||||||||||||||||||||
|
Non-marketable equity securities
|
4,281
|
215
|
5.02
|
%
|
1,116
|
137
|
12.28
|
%
|
3,750
|
137
|
3.65
|
%
|
||||||||||||||||||||||||
|
Total interest-earning assets
|
1,380,857
|
47,604
|
3.45
|
%
|
1,421,202
|
52,150
|
3.67
|
%
|
1,469,286
|
60,695
|
4.13
|
%
|
||||||||||||||||||||||||
|
Non-interest-earning assets
|
61,065
|
63,602
|
71,676
|
|||||||||||||||||||||||||||||||||
|
Total assets
|
$
|
1,441,922
|
$
|
1,484,804
|
$
|
1,540,962
|
||||||||||||||||||||||||||||||
|
Interest-bearing Liabilities:
|
||||||||||||||||||||||||||||||||||||
|
Deposits:
|
||||||||||||||||||||||||||||||||||||
|
NOW deposits
|
$
|
157,587
|
$
|
106
|
0.07
|
%
|
$
|
152,615
|
$
|
173
|
0.11
|
%
|
$
|
180,336
|
$
|
219
|
0.12
|
%
|
||||||||||||||||||
|
Money market deposits
|
292,660
|
202
|
0.07
|
%
|
290,951
|
271
|
0.09
|
%
|
245,280
|
285
|
0.12
|
%
|
||||||||||||||||||||||||
|
Savings deposits
|
374,671
|
318
|
0.08
|
%
|
354,311
|
299
|
0.08
|
%
|
346,353
|
284
|
0.08
|
%
|
||||||||||||||||||||||||
|
Time deposits over $100,000
|
170,770
|
1,457
|
0.85
|
%
|
211,582
|
2,074
|
0.98
|
%
|
257,295
|
3,106
|
1.21
|
%
|
||||||||||||||||||||||||
|
Time deposits under $100,000
|
140,579
|
856
|
0.61
|
%
|
162,423
|
1,116
|
0.69
|
%
|
185,664
|
1,638
|
0.88
|
%
|
||||||||||||||||||||||||
|
Short-term borrowings
|
4,441
|
139
|
3.13
|
%
|
15,430
|
471
|
3.05
|
%
|
-
|
-
|
0.00
|
%
|
||||||||||||||||||||||||
|
Long-term borrowings
|
2,300
|
146
|
6.35
|
%
|
6,870
|
285
|
4.15
|
%
|
22,300
|
756
|
3.39
|
%
|
||||||||||||||||||||||||
|
Long-term capital lease obligation
|
2,211
|
-
|
0.00
|
%
|
2,211
|
239
|
10.81
|
%
|
2,211
|
268
|
12.12
|
%
|
||||||||||||||||||||||||
|
Junior subordinated debt
|
37,116
|
2,652
|
7.15
|
%
|
37,116
|
2,428
|
6.54
|
%
|
37,116
|
2,265
|
6.10
|
%
|
||||||||||||||||||||||||
|
Total interest-bearing liabilities
|
1,182,335
|
5,876
|
0.50
|
%
|
1,233,509
|
7,356
|
0.60
|
%
|
1,276,555
|
8,821
|
0.69
|
%
|
||||||||||||||||||||||||
|
Demand deposits, noninterest- bearing
|
151,283
|
152,599
|
148,818
|
|||||||||||||||||||||||||||||||||
|
Other noninterest-bearing liabilities
|
25,430
|
10,650
|
28,110
|
|||||||||||||||||||||||||||||||||
|
Stockholders' equity, including stock owned by ESOP
|
82,874
|
88,046
|
87,479
|
|||||||||||||||||||||||||||||||||
|
Total liabilities and stockholders equity
|
$
|
1,441,922
|
$
|
1,484,804
|
$
|
1,540,962
|
||||||||||||||||||||||||||||||
|
Net interest income/interest rate spread (2)
|
$
|
41,728
|
2.95
|
%
|
$
|
44,794
|
3.07
|
%
|
$
|
51,874
|
3.44
|
%
|
||||||||||||||||||||||||
|
Net interest margin (3)
|
3.02
|
%
|
3.15
|
%
|
3.53
|
%
|
||||||||||||||||||||||||||||||
| (1) |
Average loans include nonaccrual loans of $31.5 million, $50.7 million and $50.8 million for the years ended December 31, 2015, 2014 and 2013, respectively. Interest income includes loan origination fees of $1.3 million, $1.3 million and $1.9 million for the years ended December 31, 2015, 2014 and 2013, respectively.
|
| (2) |
Interest rate spread represents the difference between the average yield on interest-earning assets and the average cost of interest-bearing liabilities.
|
| (3) |
Net interest margin represents net interest income as a percentage of average interest-earning assets.
|
In 2015, net interest income decreased $3.1 million to $41.7 million from $44.8 million in 2014 due to lower interest income of $4.6 million offset by a decrease in interest expense of $1.5 million from 2014. Net interest income decreased primarily due to a lower average volume of loans of $112.9 million partially offset by an increase in average taxable investment securities of $91.6 million. The lower volume of loans and earning assets in general resulted in the average yield on earning assets to decline 22 basis points to 3.45% from 3.67% in 2014. The decrease in interest expense was primarily due to a decrease in the average volume of time deposits of $62.7 million partially offset by an increase in average savings deposits of $20.4 million. The reduction in volume and shift in deposit mix caused the cost of interest-bearing liabilities to decline 10 basis points to 0.50% from 0.60% in 2014. The decrease in the cost of funds on interest-bearing liabilities is a result of an effort by management to decrease the cost of funds and increase the overall interest margin, causing existing deposits to reprice at lower interest rates, and causing new deposits to be priced at lower interest rates. Net interest margin decreased 13 basis points to 3.02% in 2015 from 3.15% in 2014.
In 2014, net interest income decreased $7.1 million to $44.8 million from $51.9 million in 2013 due to lower interest income of $8.5 million offset by a decrease in interest expense of $1.5 million from 2013. Net interest income decreased primarily due to a lower average volume of loans of $167.4 million partially offset by an increase in average taxable investment securities of $41.2 million. The lower volume of loans and earning assets in general resulted in the average yield on earning assets to decline 46 basis points to 3.67% from 4.13% in 2013. The decrease in interest expense was primarily due to a decrease in the average volume of time deposits of $69.0 million partially offset by an increase in average money market deposits of $45.7 million. The reduction in volume and shift in deposit mix caused the cost of interest-bearing liabilities to decline 9 basis points to 0.60% from 0.69% in 2013. The decrease in the cost of funds on interest-bearing liabilities is a result of an effort by management to decrease the cost of funds and increase the overall interest margin, causing existing deposits to reprice at lower interest rates, and causing new deposits to be priced at lower interest rates. Net interest margin decreased 38 basis points to 3.15% in 2014 from 3.53% in 2013.
Volume, Mix and Rate Analysis of Net Interest Income.
The following table presents the extent to which changes in volume and interest rates of interest-earning assets and interest-bearing liabilities have affected interest income and interest expense during the periods indicated. Information is provided on changes in each category due to (i) changes attributable to changes in volume (change in volume times the prior period interest rate) and (ii) changes attributable to changes in interest rate (changes in rate times the prior period volume). Changes attributable to the combined impact of volume and rate have been allocated proportionally to the changes due to volume and the changes due to rate.
|
Year ended December 31,
|
Year Ended December 31,
|
|||||||||||||||||||||||
|
2015 Compared to 2014
|
2014 Compared to 2013
|
|||||||||||||||||||||||
|
Change Due to
Volume
|
Change Due
to Rate
|
Total Change
|
Change Due
to Volume
|
Change Due
to Rate
|
Total Change
|
|||||||||||||||||||
|
(In thousands)
|
||||||||||||||||||||||||
|
Interest-earning Assets:
|
||||||||||||||||||||||||
|
Loans, includes fees
|
$
|
(5,643
|
)
|
$
|
(759
|
)
|
$
|
(6,402
|
)
|
$
|
(8,498
|
)
|
$
|
(738
|
)
|
$
|
(9,236
|
)
|
||||||
|
Taxable investment securities
|
1,070
|
805
|
1,875
|
438
|
187
|
625
|
||||||||||||||||||
|
Investment securities exempt from federal income taxes
|
(203
|
)
|
(249
|
)
|
(452
|
)
|
(17
|
)
|
(113
|
)
|
(130
|
)
|
||||||||||||
|
Securities purchased under resell agreements
|
3
|
18
|
21
|
12
|
(4
|
)
|
8
|
|||||||||||||||||
|
Other interest bearing deposits
|
(42
|
)
|
201
|
159
|
200
|
(12
|
)
|
188
|
||||||||||||||||
|
Non-marketable equity securities
|
389
|
(311
|
)
|
78
|
(97
|
)
|
97
|
-
|
||||||||||||||||
|
Total (decrease) increase in interest income
|
$
|
(4,426
|
)
|
$
|
(295
|
)
|
$
|
(4,721
|
)
|
$
|
(7,962
|
)
|
$
|
(583
|
)
|
$
|
(8,545
|
)
|
||||||
|
Interest-bearing Liabilities:
|
||||||||||||||||||||||||
|
NOW deposits
|
$
|
6
|
$
|
(73
|
)
|
$
|
(67
|
)
|
$
|
(34
|
)
|
$
|
(12
|
)
|
$
|
(46
|
)
|
|||||||
|
Money market deposits
|
2
|
(71
|
)
|
(69
|
)
|
53
|
(67
|
)
|
(14
|
)
|
||||||||||||||
|
Savings deposits
|
17
|
2
|
19
|
7
|
8
|
15
|
||||||||||||||||||
|
Time deposits over $100,000
|
(400
|
)
|
(217
|
)
|
(617
|
)
|
(552
|
)
|
(480
|
)
|
(1,032
|
)
|
||||||||||||
|
Time deposits under $100,000
|
(150
|
)
|
(110
|
)
|
(260
|
)
|
(205
|
)
|
(317
|
)
|
(522
|
)
|
||||||||||||
|
Short-term borrowings
|
(335
|
)
|
3
|
(332
|
)
|
471
|
-
|
471
|
||||||||||||||||
|
Long-term borrowings
|
(191
|
)
|
52
|
(139
|
)
|
(471
|
)
|
-
|
(471
|
)
|
||||||||||||||
|
Capital long-term lease obligation
|
-
|
(239
|
)
|
(239
|
)
|
-
|
(29
|
)
|
(29
|
)
|
||||||||||||||
|
Junior subordinated debt
|
-
|
224
|
224
|
-
|
163
|
163
|
||||||||||||||||||
|
Total increase (decrease) in interest expense
|
$
|
(1,051
|
)
|
$
|
(429
|
)
|
$
|
(1,480
|
)
|
$
|
(731
|
)
|
$
|
(734
|
)
|
$
|
(1,465
|
)
|
||||||
|
Increase (decrease) in net interest income
|
$
|
(3,375
|
)
|
$
|
134
|
$
|
(3,241
|
)
|
$
|
(7,231
|
)
|
$
|
151
|
$
|
(7,080
|
)
|
||||||||
Provision for Loan Losses.
Our allowance for loan losses is established through charges to income in the form of the provision in order to bring our allowance for loan losses to a level deemed appropriate by management. The allowance for loan losses at December 31, 2015 and December 31, 2014 was $17.4 million and $28.4 million, respectively, representing 2.1% and 2.7% of total loans as of such dates. We recorded a $500 thousand provision for loan losses for the year ended December 31, 2015 compared with $2.0 million for the year ended December 31, 2014. The decrease in the provision was primarily due to a decrease in impaired loan balances. See the Balance Sheet section below for further information on provision for loan losses.
The provision for loan losses for the year ended December 31, 2014 was $2.0 million compared with no provision for the year ended December 31, 2013. The increase in the provision was largely the result of impairment adjustments identified during subsequent event reviews to maintain an adequate reserve for the current portfolio.
Noninterest Income.
Changes in
noninterest
income between 2015 and 2014 and between 2014 and 2013 were as follows:
|
Year Ended
December 31, |
Year Ended
December 31, |
|||||||||||||||||||||||
|
2015
|
2014
|
Net
difference
|
2014
|
2013
|
Net
difference
|
|||||||||||||||||||
|
(In thousands)
|
||||||||||||||||||||||||
|
Noninterest income:
|
||||||||||||||||||||||||
|
Mortgage loan servicing fees
|
$
|
2,298
|
$
|
2,428
|
$
|
(130
|
)
|
$
|
2,428
|
$
|
2,563
|
$
|
(135
|
)
|
||||||||||
|
Trust and investment services fees
|
2,604
|
2,564
|
40
|
2,564
|
2,359
|
205
|
||||||||||||||||||
|
Service charges on deposits
|
1,262
|
1,528
|
(266
|
)
|
1,528
|
1,516
|
12
|
|||||||||||||||||
|
Net gain on sale of loans
|
2,629
|
2,373
|
256
|
2,373
|
5,175
|
(2,802
|
)
|
|||||||||||||||||
|
Net gain (loss) on sale of securities
|
4
|
1
|
3
|
1
|
(80
|
)
|
81
|
|||||||||||||||||
|
Other fees
|
3,979
|
3,975
|
4
|
3,975
|
3,650
|
325
|
||||||||||||||||||
|
Other noninterest (loss) income
|
(1,202
|
)
|
317
|
(1,519
|
)
|
317
|
282
|
35
|
||||||||||||||||
|
Total noninterest income
|
$
|
11,574
|
$
|
13,186
|
$
|
(1,612
|
)
|
$
|
13,186
|
$
|
15,465
|
$
|
(2,279
|
)
|
||||||||||
Noninterest income decreased $1.6 million to $11.6 million in 2015 from $13.2 million in 2014, primarily attributable to decrease in income on the venture capital investments of $1.4 million due to impairment and recorded losses reported to us, a decrease in service charges on deposits of $266 thousand, and a decrease of mortgage servicing income of $130 thousand.
Noninterest income decreased $2.3 million to $13.2 million in 2014 from $15.5 million in 2013, primarily attributable to net gain on sale of loans decreasing $2.8 million due to a lower volume of loans sold in 2014 compared to 2013. The reduction in the volume of loans sold was reflective of the decline in residential mortgage activity in the Bank’s market.
Noninterest Expenses.
Changes in
noninterest
expenses between 2015 and 2014 and between 2014 and 2013, were as follows:
|
Year Ended
December 31, |
Year Ended
December 31, |
|||||||||||||||||||||||
|
2015
|
2014
|
Net
difference
|
2014
|
2013
|
Net
difference
|
|||||||||||||||||||
|
(In thousands)
|
||||||||||||||||||||||||
|
Noninterest expenses:
|
||||||||||||||||||||||||
|
Salaries and employee benefits
|
$
|
24,482
|
$
|
25,269
|
$
|
(787
|
)
|
$
|
25,269
|
$
|
24,415
|
$
|
854
|
|||||||||||
|
Occupancy
|
3,452
|
4,204
|
(752
|
)
|
4,204
|
4,105
|
99
|
|||||||||||||||||
|
Losses and write-downs on OREO, net
|
(427
|
)
|
2,012
|
(2,439
|
)
|
2,012
|
980
|
1,032
|
||||||||||||||||
|
Other noninterest expenses:
|
||||||||||||||||||||||||
|
Data processing
|
2,979
|
3,155
|
(176
|
)
|
3,155
|
3,202
|
(47
|
)
|
||||||||||||||||
|
Marketing
|
1,335
|
1,119
|
216
|
1,119
|
1,181
|
(62
|
)
|
|||||||||||||||||
|
Amortization and valuation of MSRs
|
1,393
|
1,673
|
(280
|
)
|
1,673
|
219
|
1,454
|
|||||||||||||||||
|
Supplies
|
486
|
444
|
42
|
444
|
652
|
(208
|
)
|
|||||||||||||||||
|
Postage
|
648
|
748
|
(100
|
)
|
748
|
795
|
(47
|
)
|
||||||||||||||||
|
Bankcard and ATM network fees
|
1,872
|
2,169
|
(297
|
)
|
2,169
|
1,458
|
711
|
|||||||||||||||||
|
Legal, professional and accounting
fees |
7,304
|
10,868
|
(3,564
|
)
|
10,868
|
7,169
|
3,699
|
|||||||||||||||||
|
FDIC insurance premiums
|
3,087
|
3,211
|
(124
|
)
|
3,211
|
2,944
|
267
|
|||||||||||||||||
|
Collection expenses
|
834
|
1,217
|
(383
|
)
|
1,217
|
4,369
|
(3,152
|
)
|
||||||||||||||||
|
Other
|
3,443
|
4,713
|
(1,270
|
)
|
4,713
|
2,987
|
1,726
|
|||||||||||||||||
|
Total other noninterest expenses
|
23,381
|
29,317
|
(5,936
|
)
|
29,317
|
24,976
|
4,341
|
|||||||||||||||||
|
Total noninterest expenses
|
$
|
50,888
|
$
|
60,802
|
$
|
(9,914
|
)
|
$
|
60,802
|
$
|
54,476
|
$
|
6,326
|
|||||||||||
Noninterest expenses decreased $9.9 million to $50.9 million in 2015 from $60.8 million in 2014. This decrease was primarily attributable to a decrease of $3.6 million in legal, professional and accounting fees due to reduced fees associated with the restatement of our consolidated financial statements and the related requests from regulatory agencies, including with respect to the SEC investigation, for information regarding the restatements, as well as compliance with enforcement actions issued by bank regulators; decrease on losses on sale of OREO properties of $2.4 million, a decrease of $787 thousand in salaries and employee benefits, a decrease of $752 thousand in occupancy expenses, a decrease of $757 thousand included in the other category due to the payment of the civil money penalty to the SEC in 2014, a decrease of $372 thousand in OREO property management expenses, a decrease of $297 thousand in bankcard and network expenses, and a decrease of $280 thousand in MSR amortization and valuation.
Noninterest expenses increased $6.3 million to $60.8 million in 2014 from $54.5 million in 2013. Legal, professional and accounting fees increased $3.7 million due to fees associated with the restatement of our consolidated financial statements and the related requests from regulatory agencies, including with respect to the SEC investigation, for information regarding the restatements, as well as compliance with enforcement actions issued by bank regulators. Amortization and valuation of MSRs increased $1.5 million due to a higher valuation allowance. These increases were offset by decrease in collection expenses of $3.2 million primarily due to a lower volume of appraisals and title work as a result of the restatement work which occurred during 2013. Write-downs of the carrying values of OREO increased $1.9 million to $2.7 million but were offset by an increase of $822 thousand in net gains on the sale of OREO.
Impact of Inflation and Changing Prices.
The primary impact of inflation on our operations is increased operating costs.
Unlike industrial companies, nearly all of our assets and liabilities are monetary in nature. As a result, interest rates have a greater impact on our performance than do the effects of general levels of inflation. Over short periods of time, interest rates do not necessarily move in the same direction or to the same extent as the price of goods and services.
Income Taxes.
Provision (benefit) for income taxes decreased $1.2 million from 2014 to 2015
.
There was no income tax provision or benefit in 2015 due to a full valuation allowance on the deferred tax assets. For further discussion of income taxes, see Note 14 “Income Taxes” in Item 8 “Financial Statements and Supplementary Data”.
Financial Condition
Balance Sheet-General.
Total assets as of December 31, 2015 were $1.4 billion, decreasing $46 million from $1.45 billion as of December 31, 2014. During 2015, net loans decreased by $63.4 million and cash and cash equivalents decreased by $58.5 million, but were offset by an increase of $100 million in investment securities available for sale. During the same period total liabilities decreased to $1.32 billion, a decrease of $43.2 million. Stockholders’ equity (excluding stock owned by the ESOP) decreased $4.7 million to $76.3 million as of December 31, 2015 compared to $81.0 million as of December 31, 2014 primarily due to a decrease in retained earnings of $2.9 million.
Investment Securities.
We primarily utilize our investment portfolio to provide a source of earnings, to manage liquidity, to provide collateral to pledge against public deposits, and to manage interest rate risk. In managing the portfolio, the Company seeks to obtain the objectives of safety of principal, liquidity, diversification and maximized return on funds. For an additional discussion with respect to these matters, see “Sources of Funds” included below under this Item 7 and “Asset Liability Management” included under Item 7A of this Form 10-K.
The following table sets forth the amortized cost and fair value of our securities portfolio:
|
December 31,
|
||||||||||||||||||||||||
|
2015
|
2014
|
2013
|
||||||||||||||||||||||
|
Amortized
Cost
|
Fair Value
|
Amortized
Cost
|
Fair Value
|
Amortized
Cost
|
Fair Value
|
|||||||||||||||||||
|
(In thousands)
|
||||||||||||||||||||||||
|
Securities Available for Sale:
|
||||||||||||||||||||||||
|
U.S. Government sponsored
agencies |
$
|
69,798
|
$
|
69,584
|
$
|
42,438
|
$
|
42,282
|
$
|
73,391
|
$
|
73,102
|
||||||||||||
|
States and political subdivisions
|
3,429
|
3,576
|
4,964
|
5,087
|
501
|
505
|
||||||||||||||||||
|
Residential mortgage-backed security
|
123,055
|
121,597
|
102,482
|
101,775
|
5,540
|
5,465
|
||||||||||||||||||
|
Residential collateralized mortgage obligation
|
40,305
|
39,921
|
41,119
|
41,051
|
44,705
|
44,232
|
||||||||||||||||||
|
Commercial mortgage backed security
|
41,341
|
41,119
|
24,993
|
24,882
|
-
|
-
|
||||||||||||||||||
|
SBA pool
|
757
|
750
|
949
|
945
|
-
|
-
|
||||||||||||||||||
|
Asset-backed security
|
40,136
|
39,493
|
-
|
-
|
-
|
-
|
||||||||||||||||||
|
Totals
|
$
|
318,821
|
$
|
316,040
|
$
|
216,945
|
$
|
216,022
|
$
|
124,137
|
$
|
123,304
|
||||||||||||
|
Securities Held to Maturity:
|
||||||||||||||||||||||||
|
SBA pools
|
$
|
8,986
|
$
|
8,988
|
$
|
9,269
|
$
|
9,378
|
$
|
9,756
|
$
|
9,778
|
||||||||||||
|
State and political subdivisions
|
-
|
-
|
2,506
|
2,569
|
10,088
|
9,854
|
||||||||||||||||||
|
Totals
|
$
|
8,986
|
$
|
8,988
|
$
|
11,775
|
$
|
11,947
|
$
|
19,844
|
$
|
19,632
|
||||||||||||
U.S. government sponsored agency securities generally consist of fixed rate securities with maturities from four months to eight years. States and political subdivision investment securities consist of a local issue rated “Aa1” by Moody’s Investment Services with maturities of eight months to eleven years.
The Company had a total of $40.3 million in CMOs as of December 31, 2015. The CMOs were private label issued or issued by U.S. government sponsored agencies. At the time of purchase, the ratings of these securities ranged from AAA to Aaa. As of December 31, 2015, the ratings of these securities ranged from AAA to BBB+, all of which are considered “Investment Grade” (rating of “BBB” or higher). At the time of purchase and on a monthly basis, the Company reviews these securities for impairment on an other than temporary basis. The Company utilizes several external sources to evaluate prepayments, delinquencies, loss severity, and other factors in determining if there is impairment. As of December 31, 2015, none of these securities were deemed to have OTTI. The Company continues to closely monitor the performance and ratings of these securities.
As of December 31, 2015 and 2014, securities of no single issuer exceeded 10% of stockholders’ equity, except for U.S. government sponsored agency securities.
The following table sets forth certain information regarding contractual maturities and the weighted average yields of our securities portfolio as of December 31, 2015:
|
Due in One Year or Less
|
Due after One Year
through Five Years
|
Due after Five Years
through Ten Years
|
Due after Ten Years or no
stated Maturity
|
|||||||||||||||||||||||||||||
|
Balance
|
Weighted
Average
Yield
|
Balance
|
Weighted
Average
Yield
|
Balance
|
Weighted
Average
Yield
|
Balance
|
Weighted
Average
Yield
|
|||||||||||||||||||||||||
|
As of December 31, 2015
|
(Dollars in thousands)
|
|||||||||||||||||||||||||||||||
|
Securities Available for Sale:
|
||||||||||||||||||||||||||||||||
|
U.S. Government sponsored agencies
|
$
|
10,559
|
0.59
|
%
|
$
|
19,785
|
1.30
|
%
|
$
|
39,240
|
2.25
|
%
|
$
|
-
|
0.00
|
%
|
||||||||||||||||
|
States and political subdivision (1)
|
202
|
0.56
|
%
|
1,092
|
1.48
|
%
|
1,962
|
2.31
|
%
|
320
|
2.70
|
%
|
||||||||||||||||||||
|
Mortgage backed
|
-
|
0.00
|
%
|
849
|
1.34
|
%
|
25,336
|
2.27
|
%
|
176,452
|
1.60
|
%
|
||||||||||||||||||||
|
SBA pools
|
-
|
0.00
|
%
|
-
|
0.00
|
%
|
-
|
0.00
|
%
|
750
|
1.04
|
%
|
||||||||||||||||||||
|
Asset backed ssecurities
|
-
|
0.00
|
%
|
-
|
0.00
|
%
|
-
|
0.00
|
%
|
39,493
|
2.01
|
%
|
||||||||||||||||||||
|
Totals
|
$
|
10,761
|
0.53
|
%
|
$
|
21,726
|
0.80
|
%
|
$
|
66,538
|
2.13
|
%
|
$
|
217,015
|
1.65
|
%
|
||||||||||||||||
|
Securities Held to Maturity:
|
||||||||||||||||||||||||||||||||
|
SBA pools
|
$
|
-
|
0.00
|
%
|
$
|
-
|
0.00
|
%
|
$
|
-
|
0.00
|
%
|
$
|
8,988
|
3.48
|
%
|
||||||||||||||||
|
Totals
|
$
|
-
|
0.00
|
%
|
$
|
-
|
0.00
|
%
|
$
|
-
|
0.00
|
%
|
$
|
8,988
|
3.48
|
%
|
||||||||||||||||
|
(1)
|
Yield is reflected adjusting for federal and state exemption of interest income and certain other permanent income tax differences.
|
Loan Portfolio.
As a result of the economic downturn, loan demand has slowed and with management’s focus on completing the restatement, levels of total loans decreased steadily from 2012 to 2015. While loan demand remains weak in our markets, management is working to increase its portfolio of performing loans. The total amounts in the residential real estate and construction real estate loan portfolios have steadily decreased primarily due to the Bank’s strategy to diversify its portfolio.
The following table sets forth the composition of the loan portfolio:
|
2015
|
2014
|
2013
|
||||||||||||||||||||||
|
Amount
|
Percent
|
Amount
|
Percent
|
Amount
|
Percent
|
|||||||||||||||||||
|
(Dollars in thousands)
|
||||||||||||||||||||||||
|
Commercial
|
$
|
92,995
|
11.05
|
%
|
$
|
108,309
|
11.87
|
%
|
$
|
145,445
|
13.73
|
%
|
||||||||||||
|
Commercial real estate
|
371,599
|
44.17
|
366,199
|
40.15
|
406,048
|
38.34
|
||||||||||||||||||
|
Residential real estate
|
258,606
|
30.74
|
305,744
|
33.52
|
341,050
|
32.20
|
||||||||||||||||||
|
Construction real estate
|
89,341
|
10.62
|
100,178
|
10.98
|
125,877
|
11.89
|
||||||||||||||||||
|
Installment and other
|
28,730
|
3.42
|
31,768
|
3.48
|
40,637
|
3.84
|
||||||||||||||||||
|
Total loans
|
841,271
|
100.00
|
912,198
|
100.00
|
1,059,057
|
100.00
|
||||||||||||||||||
|
Unearned income
|
(1,483
|
)
|
(1,651
|
)
|
(1,969
|
)
|
||||||||||||||||||
|
Gross loans
|
839,788
|
910,547
|
1,057,088
|
|||||||||||||||||||||
|
Allowance for loan losses
|
(17,392
|
)
|
(24,783
|
)
|
(28,358
|
)
|
||||||||||||||||||
|
Net loans
|
$
|
822,396
|
$
|
885,764
|
$
|
1,028,730
|
||||||||||||||||||
Net loans decreased $63.4 million from $885.8 million as of December 31, 2014 to $822.4 million as of December 31, 2015. The largest decreases were in gross residential real estate loans of $47.1 million, gross commercial loans of $15.3 million, and gross construction loans of $10.8 million. Partially offset by increases in gross commercial real estate loans of $5.4 million.
Loan Maturities.
The following table sets forth the maturity or repricing information for loans outstanding as of December 31, 2015:
|
Due in One Year or Less
|
Due after one Year through
Five Years
|
Due after Five Years
|
Total
|
|||||||||||||||||||||||||||||
|
Fixed Rate
|
Variable
Rate
|
Fixed Rate
|
Variable
Rate
|
Fixed Rate
|
Variable
Rate
|
Fixed Rate
|
Variable
Rate
|
|||||||||||||||||||||||||
|
(Dollars in thousands)
|
||||||||||||||||||||||||||||||||
|
Commercial
|
$
|
18,128
|
$
|
53,695
|
$
|
8,640
|
$
|
2,016
|
$
|
10,516
|
$
|
-
|
$
|
37,284
|
$
|
55,711
|
||||||||||||||||
|
Commercial real estate
|
1,863
|
148,953
|
48,591
|
64,118
|
86,727
|
21,347
|
137,181
|
234,418
|
||||||||||||||||||||||||
|
Residential real estate
|
24,464
|
106,799
|
5,334
|
17,410
|
102,307
|
2,292
|
132,105
|
126,501
|
||||||||||||||||||||||||
|
Construction real estate
|
24,131
|
48,139
|
4,720
|
265
|
5,122
|
6,964
|
33,973
|
55,368
|
||||||||||||||||||||||||
|
Installment and other
|
11,311
|
5,848
|
6,716
|
40
|
4,815
|
-
|
22,842
|
5,888
|
||||||||||||||||||||||||
|
Total loans
|
$
|
79,897
|
$
|
363,434
|
$
|
74,001
|
$
|
83,849
|
$
|
209,487
|
$
|
30,603
|
$
|
363,385
|
$
|
477,886
|
||||||||||||||||
Asset Quality.
Over the past several years,
the Bank experienced significant deterioration in asset quality due to the historic economic downturn. Non-performing assets peaked in 2010 at approximately $100.0 million.
The following table sets forth the amounts of non-performing loans and non-performing assets as of the dates indicated:
|
December 31,
|
||||||||||||||||||||
|
2015
|
2014
|
2013
|
2012
|
2011
|
||||||||||||||||
|
(Dollars in thousands)
|
||||||||||||||||||||
|
Non-accruing loans
|
$
|
30,325
|
$
|
47,856
|
$
|
52,086
|
$
|
45,631
|
$
|
70,099
|
||||||||||
|
Loans 90 days or more past due, still accruing interest
|
-
|
361
|
32
|
-
|
-
|
|||||||||||||||
|
Total non-performing loans
|
30,325
|
48,217
|
52,118
|
45,631
|
70,099
|
|||||||||||||||
|
OREO
|
8,346
|
13,980
|
14,002
|
9,211
|
13,193
|
|||||||||||||||
|
Other repossessed assets
|
-
|
338
|
343
|
115
|
262
|
|||||||||||||||
|
Total non-performing assets
|
$
|
38,671
|
$
|
62,535
|
$
|
66,463
|
$
|
54,957
|
$
|
83,554
|
||||||||||
|
TDRs, still accruing interest
|
$
|
53,592
|
$
|
60,973
|
$
|
80,873
|
$
|
80,609
|
$
|
54,570
|
||||||||||
|
Total non-performing loans to total loans
|
3.60
|
%
|
5.29
|
%
|
4.92
|
%
|
3.81
|
%
|
5.91
|
%
|
||||||||||
|
Allowance for loan losses to non- performing loans
|
57.35
|
%
|
51.40
|
%
|
54.41
|
%
|
78.09
|
%
|
49.75
|
%
|
||||||||||
|
Total non-performing assets to total assets
|
2.76
|
%
|
4.32
|
%
|
4.29
|
%
|
3.56
|
%
|
5.63
|
%
|
||||||||||
The following table presents data related to non-performing loans by dollar amount and category as of December 31, 2015 and 2014:
|
Commercial
|
Commercial real estate
|
Residential real estate
|
||||||||||||||||||||||
|
Dollar Range
|
Number of
Borrowers
|
Amount
|
Number of
Borrowers
|
Amount
|
Number of
Borrowers
|
Amount
|
||||||||||||||||||
|
(Dollars in thousands)
|
||||||||||||||||||||||||
|
December 31, 2015
|
||||||||||||||||||||||||
|
$5.0 million or more
|
-
|
$
|
-
|
-
|
$
|
-
|
-
|
$
|
-
|
|||||||||||||||
|
$3.0 million to $4.9 million
|
-
|
-
|
-
|
-
|
-
|
-
|
||||||||||||||||||
|
$1.5 million to $2.9 million
|
-
|
-
|
3
|
5,719
|
-
|
-
|
||||||||||||||||||
|
Under $1.5 million
|
17
|
2,268
|
16
|
5,019
|
51
|
7,821
|
||||||||||||||||||
|
Total
|
17
|
$
|
2,268
|
19
|
$
|
10,738
|
51
|
$
|
7,821
|
|||||||||||||||
|
Percentage of individual loan category
|
2.44
|
%
|
2.89
|
%
|
3.02
|
%
|
||||||||||||||||||
|
December 31, 2014
|
||||||||||||||||||||||||
|
$5.0 million or more
|
-
|
$
|
-
|
-
|
$
|
-
|
-
|
$
|
-
|
|||||||||||||||
|
$3.0 million to $4.9 million
|
-
|
-
|
3
|
10,506
|
-
|
-
|
||||||||||||||||||
|
$1.5 million to $2.9 million
|
-
|
-
|
2
|
3,809
|
-
|
-
|
||||||||||||||||||
|
Under $1.5 million
|
32
|
3,697
|
19
|
7,581
|
65
|
11,407
|
||||||||||||||||||
|
Total
|
32
|
$
|
3,697
|
24
|
$
|
21,896
|
65
|
$
|
11,407
|
|||||||||||||||
|
Percentage of individual loan category
|
3.41
|
%
|
5.98
|
%
|
3.73
|
%
|
||||||||||||||||||
Continued:
|
Construction real estate
|
Installment & other loans
|
Total
|
||||||||||||||||||||||
|
Dollar Range
|
Number of
Borrowers
|
Amount
|
Number of
Borrowers
|
Amount
|
Number of
Borrowers
|
Amount
|
||||||||||||||||||
|
(Dollars in thousands)
|
||||||||||||||||||||||||
|
December 31, 2015
|
||||||||||||||||||||||||
|
$5.0 million or more
|
-
|
$
|
-
|
-
|
$
|
-
|
-
|
$
|
-
|
|||||||||||||||
|
$3.0 million to $4.9 million
|
-
|
-
|
-
|
-
|
-
|
-
|
||||||||||||||||||
|
$1.5 million to $2.9 million
|
2
|
4,851
|
-
|
-
|
5
|
10,570
|
||||||||||||||||||
|
Under $1.5 million
|
19
|
4,500
|
4
|
146
|
107
|
19,754
|
||||||||||||||||||
|
Total
|
21
|
$
|
9,351
|
4
|
$
|
146
|
112
|
$
|
30,324
|
|||||||||||||||
|
Percentage of individual loan category
|
10.47
|
%
|
0.51
|
%
|
3.60
|
%
|
||||||||||||||||||
|
December 31, 2014
|
||||||||||||||||||||||||
|
$5.0 million or more
|
-
|
$
|
-
|
-
|
$
|
-
|
-
|
$
|
-
|
|||||||||||||||
|
$3.0 million to $4.9 million
|
-
|
-
|
-
|
-
|
3
|
10,506
|
||||||||||||||||||
|
$1.5 million to $2.9 million
|
3
|
5,340
|
-
|
-
|
5
|
9,149
|
||||||||||||||||||
|
Under $1.5 million
|
32
|
5,225
|
6
|
252
|
154
|
28,162
|
||||||||||||||||||
|
Total
|
35
|
$
|
10,565
|
6
|
$
|
252
|
162
|
$
|
47,817
|
|||||||||||||||
|
Percentage of individual loan category
|
10.55
|
%
|
0.79
|
%
|
5.24
|
%
|
||||||||||||||||||
Non-performing loans include (i) loans accounted for on a nonaccrual basis and (ii) accruing loans contractually past due 90 days or more as to interest and principal. Management reviews the loan portfolio for problem loans on a regular basis with additional resources dedicated to resolving the non-performing loans. Additional internal controls were implemented to ensure the timely identification of signs of weaknesses in credits, facilitating efforts to rehabilitate or exit the relationship in a timely manner. External loan reviews, which have been conducted on a regular basis, were also revised to provide a broad scope and reviewers now have access to all elements of a relationship. In 2015 and 2014, a significant portion of the loan portfolio was also examined by independent third party consultants.
There were significant changes to the Bank’s credit policy in 2014. Among these were:
| · |
Bank’s engagement of an independent third party to perform an annual review of no less than 40% of the commercial loan portfolio. The review will include but not be limited to both new credits over $1 million in size closed in the previous twelve months and large relationships to insure proper closing and monitoring of these credits.
|
During the ordinary course of business, management may become aware of borrowers who may not be able to meet the contractual requirements of loan agreements. Such loans are placed under close supervision with consideration given to placing the loan on nonaccrual status, increasing the allowance for loan losses, and (if appropriate) partial or full charge-off. After a loan is placed on nonaccrual status, any interest previously accrued, but not yet collected, is reversed against current income. When payments are received on nonaccrual loans, such payments will be applied to principal and any interest portion included in the payments are not included in income, but rather are applied to the principal balance of the loan. Loans will not be placed back on accrual status unless all unpaid interest and principal payments are made. If interest on nonaccrual loans had been accrued, such income would have amounted to $1.8 million and $3.0 million for the years ended December 31, 2015 and 2014, respectively. Our policy is to place loans 90 days past due on nonaccrual status.
We consider a loan to be impaired when, based on current information and events, we determine that it is probable that we will not be able to collect all amounts due according to the original terms of the note, including interest payments. When management identifies a loan as impaired, impairment is measured based on the present value of expected future cash flows, discounted at the loan’s effective interest rates, except when the sole remaining source of repayment for the loan is the liquidation of the collateral. In these cases management uses the current fair value of the collateral, less selling costs when foreclosure is probable, rather than discounted cash flows. If management determines that the value of the impaired loan is less than the recorded investment in the loan, an impairment is recognized through a charge-off to the allowance.
Non-performing assets also consist of other repossessed assets and OREO. OREO represents properties acquired through foreclosure or other proceedings and are initially recorded at the fair value. OREO is evaluated regularly to ensure that the recorded amount is supported by its current fair value. Valuation allowances to reduce the carrying amount to fair value are recorded as necessary. Revenues and expenses from the operations of OREO and changes in the valuation are included in noninterest expenses on the consolidated statements of operations.
As of December 31, 2015, total non-performing assets decreased $23.8 million to $38.7 million from $62.5 million as of December 31, 2014 primarily due to a decrease in non-accruing loans of $17.5 million. The decreases in non-accruing loans were primarily in the categories of commercial real estate loans of $11.6 million, residential real estate loans of $3.2 million, commercial loans of $1.4 million, construction loans of $1.2 million, and installment and other loans of $106 thousand. The overall reduction in non-performing assets is a result of a combination of transfers to OREO and charge-offs.
The following table presents a summary of OREO activity for the years ended December 31, 2015 and 2014:
|
2015
|
2014
|
|||||||
|
(In thousands)
|
||||||||
|
Balance at beginning of period
|
$
|
13,980
|
$
|
14,002
|
||||
|
Transfers in at fair value
|
3,958
|
11,523
|
||||||
|
Write-down of value
|
(506
|
)
|
(2,730
|
)
|
||||
|
Gain (loss) on disposal
|
749
|
651
|
||||||
|
Cash received upon disposition
|
(7,989
|
)
|
(8,849
|
)
|
||||
|
Sales financed by loans
|
(1,846
|
)
|
(617
|
)
|
||||
|
Balance at end of period
|
$
|
8,346
|
$
|
13,980
|
||||
As of December 31, 2015 and 2014, total OREO consisted of:
|
2015
|
2014
|
|||||||
|
(In thousands)
|
||||||||
|
Commercial real estate
|
$
|
781
|
$
|
2,985
|
||||
|
Residential real estate
|
3,024
|
5,284
|
||||||
|
Construction real estate
|
4,541
|
5,711
|
||||||
|
Total
|
$
|
8,346
|
$
|
13,980
|
||||
As of December 31, 2015, there were a total of 34 properties in OREO. Of these, three (3) were commercial real estate properties, fifteen (15) were residential real estate properties and sixteen (16) were construction real estate properties.
The following table presents an analysis of the allowance for loan losses for the periods presented:
|
Year Ended December 31,
|
||||||||||||||||||||
|
2015
|
2014
|
2013
|
2012
|
2011
|
||||||||||||||||
|
(Dollars in thousands)
|
||||||||||||||||||||
|
Balance at beginning of year
|
$
|
24,783
|
$
|
28,358
|
$
|
35,633
|
$
|
34,873
|
$
|
30,316
|
||||||||||
|
Provision for loan losses
|
500
|
2,000
|
-
|
27,206
|
30,561
|
|||||||||||||||
|
Charge-offs:
|
||||||||||||||||||||
|
Commercial
|
1,919
|
2,261
|
2,028
|
8,964
|
5,531
|
|||||||||||||||
|
Commercial real estate
|
4,731
|
2,772
|
3,296
|
10,190
|
7,103
|
|||||||||||||||
|
Residential real estate
|
2,297
|
2,463
|
2,447
|
4,081
|
6,378
|
|||||||||||||||
|
Construction real estate
|
1,570
|
285
|
471
|
6,919
|
7,617
|
|||||||||||||||
|
Installment and other
|
642
|
631
|
929
|
1,263
|
1,680
|
|||||||||||||||
|
Total charge-offs
|
11,159
|
8,412
|
9,171
|
31,417
|
28,309
|
|||||||||||||||
|
Recoveries:
|
||||||||||||||||||||
|
Commercial
|
1,476
|
818
|
762
|
3,776
|
727
|
|||||||||||||||
|
Commercial real estate
|
508
|
746
|
290
|
270
|
234
|
|||||||||||||||
|
Residential real estate
|
520
|
669
|
436
|
147
|
977
|
|||||||||||||||
|
Construction real estate
|
471
|
454
|
295
|
472
|
186
|
|||||||||||||||
|
Installment and other
|
293
|
150
|
113
|
306
|
181
|
|||||||||||||||
|
Total recoveries
|
3,268
|
2,837
|
1,896
|
4,971
|
2,305
|
|||||||||||||||
|
Net charge-offs
|
7,891
|
5,575
|
7,275
|
26,446
|
26,004
|
|||||||||||||||
|
Balance at end of year
|
$
|
17,392
|
$
|
24,783
|
$
|
28,358
|
$
|
35,633
|
$
|
34,873
|
||||||||||
Net charge-offs for 2015 totaled $7.9 million, an increase of $2.3 million from 2014 primarily due to increases in net charge-offs for commercial real estate loans of $2.2 million and increases in net charge-offs of construction real estate loans of $1.3 million, partially offset by decreases in net charge-offs for commercial loans of $1.0 million.
The following table sets forth the allocation of the allowance for loan losses for the years presented and the percentage of loans in each classification to total loans:
|
At December 31,
|
||||||||||||||||
|
2015
|
2014
|
|||||||||||||||
|
Amount
|
Percent
|
Amount
|
Percent
|
|||||||||||||
|
(Dollars in thousands)
|
||||||||||||||||
|
Commercial
|
$
|
2,442
|
14.04
|
%
|
$
|
4,031
|
16.27
|
%
|
||||||||
|
Commercial real estate
|
6,751
|
38.82
|
8,339
|
33.65
|
||||||||||||
|
Residential real estate
|
6,082
|
34.97
|
7,939
|
32.03
|
||||||||||||
|
Construction real estate
|
1,143
|
6.57
|
3,323
|
13.41
|
||||||||||||
|
Installment and other
|
940
|
5.40
|
788
|
3.18
|
||||||||||||
|
Unallocated
|
34
|
0.19
|
363
|
1.46
|
||||||||||||
|
Total
|
$
|
17,393
|
100.00
|
%
|
$
|
24,783
|
100.00
|
%
|
||||||||
The allowance for loan losses decreased $7.4 million from $24.8 million as of December 31, 2014 to $17.4 million as of December 31, 2015. This reduction was largely due to net charge-offs in all loan categories. Non-recurring charge-offs in the amount of $4.1 million were required in 2015 due to a bulk sale of loans. A $500 thousand and $2.0 million provision for loan loss was required during 2015 and 2014, respectively, due to impairment adjustments identified during subsequent event reviews to maintain an adequate reserve for the current portfolio. Specific reserves in the amount of $8.0 million were recorded as of December 31, 2014 to cover charge-offs recorded during 2015. As of December 31, 2015 there are $4.2 million in specific reserves recorded to cover future charge-offs. For further information, see the discussion in “Critical Accounting Policies—Allowance for Loan Losses” above in this Item 7.
A loan is considered impaired when, based on current information and events, it is probable that the Bank will be unable to collect all amounts due according to the original contractual terms of the loan agreement, including both principal and interest.
The allocation of the allowance for impaired credits is equal to the recorded investment in the loan using one of three methods to measure impairment: the fair value of the collateral less disposition costs, the present value of expected future cash flows method, or the observable market price of the loan. An impairment reserve that exceeds collateral value is charged to the allowance for loan losses in the period it is identified.
Total loans which were deemed to have been impaired, including both performing and non-performing loans, as of December 31, 2015 were $80.3 million. Impaired loans that are deemed collateral dependent have been charged down to the value of the collateral (based upon the most recent valuations), less estimated disposition costs. Impaired loans with specifically identified allocations of allowance for loan losses had a total of $4.2 million allocated in the allowance for loan losses as of December 31, 2015.
TDRs are defined as those loans whose terms have been modified, due to deterioration in the financial condition of the borrower in which the Company grants concessions to the borrower in the restructuring that it would not otherwise consider. Total loans which were considered TDRs as of December 31, 2015 were $64.5 million. Of these, $53.9 million were still performing in accordance with modified terms as of December 31, 2015.
Although the Company believes the allowance for loan losses is sufficient to cover probable incurred losses inherent in the loan portfolio, there can be no assurance that the allowance will prove sufficient to cover actual loan losses.
Potential Problem Loans.
We utilize an internal asset classification system as a means of reporting problem and potential problem assets. At the scheduled meetings of the Board of Directors of the Bank, a watch list is presented, listing significant loan relationships as “Special Mention,” “Substandard,” “Doubtful” and “Loss.” Substandard assets include those characterized by the distinct possibility that we will sustain some loss if the deficiencies are not corrected. Assets classified as Doubtful have all the weaknesses inherent in those classified as Substandard with the added characteristic that the weaknesses present make collection or liquidation in full highly questionable and improbable, on the basis of currently existing facts, conditions and values. Assets classified as “Loss” are those considered uncollectible and viewed as valueless assets and have been charged-off. Assets that do not currently expose us to sufficient risk to warrant classification in one of the aforementioned categories, but possess weaknesses that deserve management’s close attention are deemed to be Special Mention.
See Item 1 “Explanatory Note” and Item 9A “Controls and Procedures” in this Form 10-K for a discussion of the restatement of previously issued financial statements as the result of correcting misstatements related to the Company’s allowance for loan losses, carrying value of OREO and loan credit quality disclosures.
Our determination as to the classification of our assets and the amount of our valuation allowances is subject to review by the OCC, which can order the establishment of additional general or specific loss allowances. There can be no assurance that regulators, in reviewing our loan portfolio, will not request us to materially adjust our allowance for loan losses. The OCC, in conjunction with the other federal banking agencies, has adopted an interagency policy statement on the allowance for loan losses. The policy statement provides guidance for financial institutions on both the responsibilities of management for the assessment and establishment of adequate allowances and guidance for banking agency examiners to use in determining the adequacy of general valuation guidelines. Generally, the policy statement recommends that: (i) institutions establish effective systems and controls to identify, monitor and address asset quality problems; (ii) management has analyzed all significant factors that affect the collectability of the portfolio in a reasonable manner; and (iii) management established acceptable allowance evaluation processes that meet the objectives set forth in the policy statement. Management believes it has established an adequate allowance for probable loan losses. We analyze our process regularly, with modifications made if needed, and report those results four times per year at meetings of our Audit Committee.
Although management believes that adequate specific and general allowance for loan losses have been established, actual losses are dependent upon future events and, as such, further additions to the level of specific and general allowance for loan losses may become necessary.
We define potential problem loans as performing loans rated Substandard that do not meet the definition of a non-performing loan.
The following table shows the amounts of performing but adversely classified assets and special mention loans as of the periods indicated:
|
At December 31,
|
||||||||||||||||||||
|
2015
|
2014
|
2013
|
2012
|
2011
|
||||||||||||||||
|
(In thousands)
|
||||||||||||||||||||
|
Performing loans classified as:
|
||||||||||||||||||||
|
Substandard
|
$
|
59,860
|
$
|
73,643
|
$
|
88,291
|
$
|
87,109
|
$
|
72,254
|
||||||||||
|
Total performing adversely classified loans
|
$
|
59,860
|
$
|
73,643
|
$
|
88,291
|
$
|
87,109
|
$
|
72,254
|
||||||||||
|
Special mention loans
|
$
|
30,932
|
$
|
52,313
|
$
|
35,260
|
$
|
11,848
|
$
|
10,084
|
||||||||||
The table above does not include nonaccrual loans that are less than 30 days past due. Total performing adversely classified assets as of December 31, 2015 were $59.9 million, a decrease of $13.7 million from $73.6 million as of December 31, 2014. The declines were primarily in the commercial real estate, commercial loans, and construction real estate loan categories. In addition, special mention loans decreased $21.4 million. These declines were primarily in commercial loans, construction real estate loans, and commercial real estate loans. For further discussion of loans, see Note 4 “Loans and Allowance for Loan Losses” in Item 8, “Financial Statements and Supplementary Data.”
Sources of Funds
General.
Deposits, short-term and long-term borrowings, loan and investment security repayments and prepayments, proceeds from the sale of securities, and cash flows generated from operations are the primary sources of our funds for lending, investing and other general purposes. Loan repayments are a relatively predictable source of funds except during periods of significant interest rate declines, while deposit flows tend to fluctuate with prevailing interests rates, money market conditions, general economic conditions and competition.
Deposits.
We offer a variety of deposit accounts with a range of interest rates and terms. Our core deposits consist of checking accounts, NOW accounts, MMDA, savings accounts and non-public certificates of deposit. These deposits, along with public fund deposits and short-term and long-term borrowings are used to support our asset base. Our deposits are obtained predominantly from our market areas. We rely primarily on competitive rates along with customer service and long-standing relationships with customers to attract and retain deposits; however, market interest rates and rates offered by competing financial institutions significantly affect our ability to attract and retain deposits.
The following table sets forth the maturities of time deposits $250 thousand and over:
|
December 31, 2015
|
||||
|
(In Thousands)
|
||||
|
Maturing within three months
|
$
|
6,605
|
||
|
After three but within six months
|
5,676
|
|||
|
After six but within twelve months
|
10,269
|
|||
|
After twelve but within three years
|
9,621
|
|||
|
After three years
|
6,977
|
|||
|
Total time deposits $250,000 and over
|
$
|
39,148
|
||
Borrowings.
We have access to a variety of borrowing sources and use short-term and long-term borrowings to support our asset base. Short-term borrowings were advances from the FHLB with remaining maturities under one year. Long-term borrowings are advances from the FHLB with remaining maturities over one year.
The following table sets forth certain information regarding our borrowings for the years ended December 31, 2015, 2014 and 2013:
|
At December 31,
|
||||||||||||
|
2015
|
2014
|
2013
|
||||||||||
|
(Dollars in thousands)
|
||||||||||||
|
Short-term borrowings:
|
||||||||||||
|
Average balance outstanding
|
$
|
4,441
|
$
|
15,430
|
$
|
-
|
||||||
|
Maximum outstanding at any month-end during the period
|
20,000
|
20,000
|
-
|
|||||||||
|
Balance outstanding at end of period
|
-
|
20,000
|
-
|
|||||||||
|
Weighted average interest rate during the period
|
3.13
|
%
|
3.05
|
%
|
0.00
|
%
|
||||||
|
Weighted average interest rate at end of the period
|
0.00
|
%
|
3.05
|
%
|
0.00
|
%
|
||||||
|
Long-term borrowings:
|
||||||||||||
|
Average balance outstanding
|
$
|
2,300
|
$
|
6,870
|
$
|
22,300
|
||||||
|
Maximum outstanding at any month-end during the period
|
2,300
|
22,300
|
22,300
|
|||||||||
|
Balance outstanding at end of period
|
2,300
|
2,300
|
22,300
|
|||||||||
|
Weighted average interest rate during the period
|
6.34
|
%
|
4.15
|
%
|
3.39
|
%
|
||||||
|
Weighted average interest rate at end of the period
|
6.34
|
%
|
6.34
|
%
|
3.39
|
%
|
||||||
|
Junior subordinated debt owed to unconsolidated trusts:
|
||||||||||||
|
Average balance outstanding
|
$
|
37,116
|
$
|
37,116
|
$
|
37,116
|
||||||
|
Maximum outstanding at any month-end during the period
|
37,116
|
37,116
|
37,116
|
|||||||||
|
Balance outstanding at end of period
|
37,116
|
37,116
|
37,116
|
|||||||||
|
Weighted average interest rate during the period
|
7.15
|
%
|
6.54
|
%
|
6.10
|
%
|
||||||
|
Weighted average interest rate at end of the period (1)
|
6.09
|
%
|
5.95
|
%
|
5.95
|
%
|
||||||
|
(1)
|
Excludes interest impact of compounding interest on deferred payments.
|
Liquidity
Bank Liquidity.
Liquidity management is monitored by the Asset/Liability Management Committee and Board of Directors of the Bank, who review historical funding requirements, current liquidity position, sources and stability of funding, marketability of assets, options for attracting additional funds, and anticipated future funding needs, including the level of unfunded commitments.
Our primary sources of funds are retail and commercial deposits, borrowings, public funds and funds generated from operations. Funds from operations include principal and interest payments received on loans and securities. While maturities and scheduled amortization of loans and securities provide an indication of the timing of the receipt of funds, changes in interest rates, economic conditions and competition strongly influence mortgage prepayment rates and deposit flows, reducing the predictability of the timing on sources of funds.
We adhere to a liquidity policy, which was updated and approved by the Board of Directors in December 2015, which requires that we maintain the following liquidity ratios:
| · |
The Liquidity Coverage Ratio is defined as the Anticipated Sources of Liquidity divided by the Anticipated Liquidity Needs 1.15 Times
|
| · |
Cumulative Liquidity Gap (% of cumulative net cash outflow over a six month period under a worst case scenario) 100%
|
| · |
Fed Funds Purchased are limited to 60% of the total Available Lines, leaving 40% available for emergency needs and potential funding needs.
|
| · |
FHLB Advances are limited to 75% of the Total Collateral Advance Capacity leaving 25% available for emergency liquidity needs and potential funding needs.
|
| · |
Total Borrowings are limited to no more than 25% of Total Funding (which is defined as equal to Total Assets).
|
| · |
Wholesale (CDs) Funds is limited to no more than 25% of the Bank’s Total Funding (total assets).
|
| · |
Brokered funds are not to exceed 20% of total funding without the prior approval of the Board of Directors.
|
| · |
The total aggregate balance of Wholesale Funds, Brokered Funds and Borrowings as defined above is limited to no more than 35% of Total Funding (total assets).
|
As of December 31, 2015 we were in compliance with the foregoing policy. As of December 31, 2014 we were in compliance with the then effective liquidity policy as outlined in the December 31, 2014 Form 10-K filed on May 9, 2016.
As of December 31, 2015, we had outstanding loan origination commitments and unused commercial and retail lines of credit of $114.1 million and standby letters of credit of $7.6 million. We anticipate we will have sufficient funds available to meet current origination and other lending commitments. Certificates of deposit scheduled to mature within one year totaled $227.6 million as of December 31, 2015. As of December 31, 2015, total certificates of deposits declined $56.5 million or 16.5% from the prior year end.
In the event that additional short-term liquidity is needed, we have established relationships with several large regional banks to provide short-term borrowings in the form of federal funds purchases. We have the ability to borrow $20 million for a short period (15 to 60 days) from these banks on a collective basis. Management believes that we will be able to continue to borrow federal funds from our correspondent banks in the future. Additionally, we are a member of the FHLB and, as of December 31, 2015, we had the ability to borrow from the FHLB up to $112.6 million in additional funds. We also may borrow through the FRB’s discount window up to a total of $5.9 million on a short-term basis. As a contingency plan for significant funding needs, the Asset/Liability Management Committee may also consider the sale of investment securities, selling securities under agreement to repurchase, sale of certain loans and/or the temporary curtailment of lending activities.
Company Liquidity.
Trinity’s main sources of liquidity at the holding company level are dividends from the Bank.
The Bank is subject to various regulatory capital requirements administered by federal and state banking agencies, as well as the restrictions imposed by the Consent Order, which affect its ability to pay dividends to Trinity. See Part I, Item 1 “Business—Supervision and Regulation—Trinity—Dividends Payments” and Part I, Item 1 “Business—Supervision and Regulation—The Bank—Dividend Payments” of this Form 10-K. Failure to meet minimum capital requirements can initiate certain mandatory and discretionary actions by regulators that, if undertaken, could have a material adverse effect on our business, financial condition, and results of operations. The Consent Order also requires that the Bank maintain (i) a leverage ratio of Tier 1 capital to total assets of at least 8%; and (ii) a ratio of total capital to total risk-weighted assets of at least 11%. As of December 31, 2015, the Bank was in compliance with these requirements.
The Bank has an internal Capital Plan which identifies potential sources for additional capital should it be deemed necessary. For more information, see “Capital Resources” below and Note 19 “Regulatory Matters” in Part II, Item 8, “Financial Statements and Supplementary Data.
Stock Purchase Agreement.
On September 8, 2016, the Company entered into a stock purchase agreement with Castle Creek Capital Partners VI, L.P. (“Castle Creek”), Patriot Financial Partners II, L.P., Patriot Financial Partners Parallel II, L.P. (together with Patriot Financial Partners II, L.P., “Patriot”) and Strategic Value Bank Partners LLC, through its fund, Strategic Value Investors LP (“SVBP”, and collectively, the “Investors”), pursuant to which the Company expects to raise gross proceeds of approximately $52 million in a private placement transaction and to issue shares of the Company’s common stock at a purchase price of $4.75 per common share and shares of newly-created nonvoting noncumulative convertible perpetual Series C Preferred Stock at a purchase price of $475.00 per share of Series C Preferred Stock. Proceeds from the private placement transaction will be used to repurchase all of the outstanding Series A Preferred Stock and Series B Preferred Stock, to pay the deferred interest on our trust preferred securities, and for general corporate purposes. Closing of the private placement transaction is subject to the receipt of the necessary regulatory approvals or nonobjections for the use of proceeds described above. We currently anticipate that the private placement transaction will close in [October] 2016. There are no assurances that we will receive the necessary regulatory approvals or nonobjections or otherwise be able to close the private placement transaction.
In connection with the private placement, the Company entered into a registration rights agreement (the “Registration Rights Agreement”) with each of Castle Creek and Patriot. Pursuant to the terms of the Registration Rights Agreement, the Company has agreed to file a resale registration statement for the purpose of registering the resale of the shares of the Common Stock and Series C preferred stock issued in the private placement and the underlying shares of Common Stock or non-voting Common Stock into which the shares of Series C preferred stock are convertible, as appropriate. The Company is obligated to file the registration statement no later than the third anniversary after the closing of the private placement.
Pursuant to the terms of the stock purchase agreement, prior to closing, Castle Creek and Patriot will enter into side letter agreements with us. Under the terms of a side letter agreements, each investor will be entitled to have one representative appointed to our Board of Directors for so long as such investor, together with its respective affiliates, owns, in the aggregate, 5% or more of all of the outstanding shares of common stock (including shares of Common Stock issuable upon conversion of the Series C preferred stock or non-voting Common Stock).
Contractual Obligations, Commitments, and Off-Balance-Sheet Arrangements
We have various financial obligations, including contractual obligations and commitments, which may require future cash payments.
Contractual Obligations.
The following table presents significant fixed and determinable contractual obligations to third parties by payment date as of December 31, 2015. For further discussion of the nature of each obligation, see Note 16 “Commitments and Off-Balance-Sheet Activities” in Item 8, “Financial Statements and Supplementary Data” for more information on each line item.
|
|
Payments Due by Period
|
|||||||||||||||||||
|
Total
|
One year or
less
|
1-3 years
|
4-5 years
|
After 5 years
|
||||||||||||||||
|
(in thousands)
|
||||||||||||||||||||
|
Deposits without a stated maturity (1)
|
$
|
967,335
|
$
|
967,335
|
$
|
-
|
$
|
-
|
$
|
-
|
||||||||||
|
Time deposits (1)
|
286,623
|
227,583
|
42,227
|
10,912
|
5,901
|
|||||||||||||||
|
Short-term borrowings (1)
|
-
|
-
|
-
|
-
|
-
|
|||||||||||||||
|
Long-term borrowings (1)
|
2,300
|
-
|
-
|
-
|
2,300
|
|||||||||||||||
|
Operating leases
|
255
|
129
|
126
|
-
|
-
|
|||||||||||||||
|
Capital lease obligation
|
2,211
|
2,211
|
-
|
-
|
-
|
|||||||||||||||
|
Junior subordinated debt (1)
|
37,116
|
-
|
-
|
-
|
37,116
|
|||||||||||||||
|
Total contractual long-term cash obligations
|
$
|
1,295,840
|
$
|
1,197,258
|
$
|
42,353
|
$
|
10,912
|
$
|
45,317
|
||||||||||
|
(1)
|
Excludes interest.
|
Deposits without a stated maturity and time deposits do not necessarily represent future cash requirements. While these deposits contractually can be withdrawn by the customer on the dates indicated in the above table, historical experience has shown these deposits to have low volatility. Operating leases represent rental payments for office and storage property, as well as space for ATM installation in various locations. The capital leases were acquired in 2006 for the land on which our third office in Santa Fe was constructed. The leases contain a purchase option exercised in 2015, the cost of which is largely offset by a loan held on the property. The Company notified the owners of its intent to exercise its option to purchase the property and expects to complete the purchase or extend the leases in 2016.
As of December 31, 2015 the Company had a total of $6.9 million of accrued and unpaid interest due on the junior subordinated debt.
Data Processing Agreement.
In September 2015, the Bank entered into a data processing agreement with FIS, a global leader in banking and payments technology. This agreement will allow the Bank to increase efficiency and functionality, and expand its services to better meet the needs of its customers. The Bank implemented the FIS core system on July 18, 2016. The contract has an initial term of five (5) years. The terms of the agreement call for monthly payments based, in large part, on the amount of volume processed. Currently, the Company anticipates that the required payments under the new agreement will total approximately $14.8 million over the initial term of the agreement.
Commitments.
The following table details the amounts and expected maturities of significant commitments as of December 31, 2015. Further discussion of these commitments is included in Note 15 “Commitments and Off-Balance-Sheet Activities” in Part II, Item 8, “Financial Statements and Supplementary Data.”
|
Payments Due by Period
|
||||||||||||||||||||
|
Total
|
One year or
less
|
1-3 years
|
4-5 years
|
After 5
years
|
||||||||||||||||
|
(in thousands)
|
||||||||||||||||||||
|
Commitments to extend credit:
|
||||||||||||||||||||
|
Commercial
|
$
|
25,649
|
$
|
19,524
|
$
|
1,115
|
$
|
5,010
|
$
|
-
|
||||||||||
|
Commercial real estate
|
266
|
266
|
-
|
-
|
-
|
|||||||||||||||
|
Residential real estate
|
180
|
180
|
-
|
-
|
-
|
|||||||||||||||
|
Construction real estate
|
15,099
|
11,339
|
404
|
-
|
3,356
|
|||||||||||||||
|
Revolving home equity and credit card lines
|
56,647
|
34,476
|
6,955
|
4,971
|
10,245
|
|||||||||||||||
|
Other
|
11,125
|
11,125
|
-
|
-
|
-
|
|||||||||||||||
|
Standby letters of credit
|
7,608
|
4,260
|
3,348
|
-
|
-
|
|||||||||||||||
|
Total commitments to extend credit
|
116,574
|
81,170
|
11,822
|
9,981
|
13,601
|
|||||||||||||||
|
Commitments to sell mortgage loans
|
8,146
|
8,146
|
-
|
-
|
-
|
|||||||||||||||
|
Commitments to make loans
|
5,104
|
5,104
|
-
|
-
|
-
|
|||||||||||||||
|
ESOP liquidity put
|
2,690
|
538
|
1,076
|
1,076
|
-
|
|||||||||||||||
|
Total commitments
|
$
|
132,514
|
$
|
94,958
|
$
|
12,898
|
$
|
11,057
|
$
|
13,601
|
||||||||||
Commitments to extend credit, including loan commitments and standby letters of credit, do not necessarily represent future cash requirements, as these commitments may expire without being drawn upon. Commitments to sell mortgage loans are offset by commitments from customers to enter into a mortgage loan. The Bank’s contract with customers specifically requires the customer to pay any fees incurred in the event that we cannot deliver a mortgage to the buyer according to the contract with the buyer of the mortgage. The ESOP liquidity put is described in Note 12 “Retirement Plans” in Part II, Item 8, “Financial Statements and Supplementary Data.”
Capital Resources
Banks and bank holding companies are subject to regulatory capital requirements administered by federal banking agencies. Capital adequacy guidelines and, additionally for bank, prompt corrective action regulations, involve quantitative measures of assets, liabilities, and certain off-balance-sheet items calculated under regulatory accounting practices. Capital amounts and classifications are also subject to qualitative judgements by regulators. Failure to meet capital requirements can initiate regulatory action. The final rules implementing Basel Committee on Banking Supervision’s capital guidelines for U.S. banks (Basel III rules) became effective for the Company on January 1, 2015 with full compliance with all of the requirements being phased in over a multi-year schedule, and fully phased in by January 1, 2019. Under the prompt corrective action regulations, to be adequately capitalized a bank must maintain minimum ratios of total capital to risk-weighted assets of 8%, Tier 1 capital to risk-weighted assets of 6%, common equity Tier 1 capital to risk-weighted assets of 4.5%, and Tier 1 capital to total assets of 4%. A “well–capitalized” institution must maintain minimum ratios of total capital to risk-weighted assets of at least 10%, Tier 1 capital to risk-weighted assets of at least 8%, common equity Tier 1 capital to risk-weighted assets of at least 6.5%, and Tier 1 capital to total assets of at least 5% and must not be subject to any written order, agreement or directive requiring it to meet or maintain a specific capital level.
A certain amount of Trinity’s Tier 1 Capital is in the form of trust preferred securities. See Note 10, ”Junior Subordinated Debt” in Item 8, “Financial Statements and Supplementary Data” for details on the effect these have on risk based capital. See “Risk Factors” in Part I, Item 1A of this Form 10-K for further information regarding changes in the regulatory environment affecting capital.
As previously discussed, on December 17, 2013, the Bank entered into the Consent Order with the OCC, which replaced the Formal Agreement.
The focus of the Consent Order is on improving the Bank’s credit administration, credit underwriting, internal controls, compliance and management supervision. Additionally, the Consent Order requires that the Bank maintain certain capital ratios and receive approval of the OCC prior to declaring dividends. The Consent Order requires the Bank to maintain the following minimum capital ratios: (i) a leverage ratio of Tier 1 Capital to total assets of at least 8%; and (ii) a ratio of Total Capital to total risk-weighted assets of at least 11%. While the Bank’s capital ratios as of December 31, 2015 fall into the category of “well-capitalized,” the Bank cannot be considered “well-capitalized” due to the requirement to meet and maintain a specific capital level in the Consent Order pursuant to the prompt corrective action rules. As of December 31, 2015, the Bank was in compliance with these requirements. The required and actual amounts and ratios for Trinity and the Bank as of December 31, 2015 are presented below:
|
|
Actual
|
For Capital Adequacy
Purposes
|
To be well capitalized
under prompt
corrective action
provisions
|
Minimum Levels
Under Order
Provisions
|
||||||||||||||||||||||||||||
|
|
Amount
|
Ratio
|
Amount
|
Ratio
|
Amount
|
Ratio
|
Amount
|
Ratio
|
||||||||||||||||||||||||
|
|
(Dollars in thousands)
|
|||||||||||||||||||||||||||||||
|
December 31, 2015
|
||||||||||||||||||||||||||||||||
|
Total capital (to risk-weighted assets):
|
||||||||||||||||||||||||||||||||
|
Consolidated
|
$
|
128,272
|
14.10
|
%
|
$
|
72,774
|
8.00
|
%
|
N/A
|
N/A
|
N/A
|
N/A
|
||||||||||||||||||||
|
Bank only
|
141,486
|
15.62
|
%
|
72,452
|
8.00
|
%
|
$
|
90,565
|
10.00
|
%
|
$
|
99,621
|
11.00
|
%
|
||||||||||||||||||
|
Tier 1 capital (to risk weighted assets):
|
||||||||||||||||||||||||||||||||
|
Consolidated
|
101,263
|
11.13
|
%
|
54,580
|
6.00
|
%
|
N/A
|
N/A
|
N/A
|
N/A
|
||||||||||||||||||||||
|
Bank only
|
130,084
|
14.36
|
%
|
54,339
|
6.00
|
%
|
72,452
|
8.00
|
%
|
N/A
|
N/A
|
|||||||||||||||||||||
|
Common Equity Tier 1 Capital (to risk weighted assets):
|
||||||||||||||||||||||||||||||||
|
Consolidated
|
44,080
|
4.85
|
%
|
40,935
|
4.50
|
%
|
N/A
|
N/A
|
N/A
|
N/A
|
||||||||||||||||||||||
|
Bank only
|
130,084
|
14.36
|
%
|
40,754
|
4.50
|
%
|
58,867
|
6.50
|
%
|
N/A
|
N/A
|
|||||||||||||||||||||
|
Tier 1 leverage (to average assets):
|
||||||||||||||||||||||||||||||||
|
Consolidated
|
101,263
|
7.11
|
%
|
56,943
|
4.00
|
%
|
N/A
|
N/A
|
N/A
|
N/A
|
||||||||||||||||||||||
|
Bank only
|
130,084
|
9.18
|
%
|
56,685
|
4.00
|
%
|
70,856
|
5.00
|
%
|
113,370
|
8.00
|
%
|
||||||||||||||||||||
N/A—not applicable
Statement of Cash Flows
Net cash provided by operating activities was $22.1 million, $5.1 million and $31.9 million for the years ended December 31, 2015, 2014 and 2013, respectively. Net cash provided by operating activities increased $17.0 million from 2014 to 2015 primarily due to increases in net income of $7.9 million and a net increase in the volume of originations and sales of loans held for sale in the amount of $5.3 million. Net cash provided by operating activities decreased $26.9 million from 2013 to 2014 primarily due to decreases in net income of $18.9 million and a net decrease of the volume of originations and sales loans held for sale of $14.8 million.
Net cash provided by (used in) investing activities was $(32.2) million, $51.5 million and $108.8 million for the years ended December 31, 2015, 2014 and 2013, respectively. Net cash provided by investing activities decreased $83.7 million from 2014 to 2015 primarily due to an increase of $37.2 million used to purchase loans, a $31.1 million decrease in loan pay downs, and an increase of $22.6 million used to purchase investment securities available for sale. An increase in the proceeds from the sale of investment securities of $11.0 million offset a portion of the decrease in cash provided by investing activities. Net cash provided by investing activities decreased $57.3 million from 2013 to 2014 primarily due to an increase of $78.5 million used to purchase investment securities available for sale. An increase in the funding of loans, net of repayments, of $6.1 million and an increase in proceeds from the sale of OREO of $7.3 million offset a portion of the decrease in cash provided by investing activities.
Net cash (used in) provided by financing activities was ($48.4) million, ($100.4) million and ($10.6) million for the years ended December 31, 2015, 2014 and 2013, respectively. The decrease in cash used in financing activities of $51.9 million from 2014 to 2015 was primarily due to a decrease in cash outflows from deposits of $71.8 million and a repayment of borrowings for $20 million. The net decrease in total deposits was due to a decision by management to decrease the amount of public deposits in order to decrease excess liquidity and increase capital ratios. From 2013 to 2014, net cash provided by financing activities decreased $89.8 million primarily due to a decrease in cash from deposits of $90.3 million. This net decrease in total deposits was due to a decision by management to decrease the amount of public deposits in order to decrease excess liquidity and increase capital ratios.
Asset Liability Management
Our net interest income is subject to “interest rate risk” to the extent that it can vary based on changes in the general level of interest rates. It is our policy to maintain an acceptable level of interest rate risk over a range of possible changes in interest rates while remaining responsive to market demand for loan and deposit products. The strategy we employ to manage our interest rate risk involves measuring our risk using an asset/liability simulation model and adjusting the maturity of securities in our investment portfolio to manage that risk.
Interest rate risk is also measured by analyzing the extent to which the repricing of assets and liabilities are mismatched to create an interest sensitivity “gap.” An asset or liability is considered to be interest rate sensitive within a specific time period if it will mature or reprice within that time period. The interest rate sensitivity gap is defined as the difference between the amount of interest-earning assets maturing or repricing within a specific time period and the amount of interest-bearing liabilities maturing or repricing within that same time period. A gap is considered positive when the amount of interest rate sensitive assets exceeds the amount of interest rate sensitive liabilities. A gap is considered negative when the amount of interest rate sensitive liabilities exceeds the amount of interest rate sensitive assets. During a period of rising interest rates, therefore, a negative gap would tend to adversely affect net interest income. Conversely, during a period of falling interest rates, a negative gap position would tend to result in an increase in net interest income.
The following table sets forth the amounts of interest-earning assets and interest-bearing liabilities outstanding as of December 31, 2015, which we anticipate, based upon certain assumptions, to reprice or mature in each of the future time periods shown. Except as stated below, the amount of assets and liabilities shown which reprice or mature during a particular period was determined based on the earlier of the term to repricing or the term to repayment of the asset or liability. The table is intended to provide an approximation of the projected repricing of assets and liabilities as of December 31, 2015, on the basis of contractual maturities and scheduled rate adjustments within a three-month period and subsequent selected time intervals. The loan amounts in the table reflect principal balances expected to be reinvested and/or repriced as a result of contractual amortization and rate adjustments on adjustable-rate loans. The contractual maturities and amortization of loans and investment securities reflect prepayment assumptions.
|
Time to Maturity or Repricing
|
||||||||||||||||||||
|
As of December 31, 2015
|
0-90 Days
|
91-365 Days
|
1-5 Years
|
Over 5 Years
|
Total
|
|||||||||||||||
|
(Dollars in thousands)
|
||||||||||||||||||||
|
Interest-earning Assets:
|
||||||||||||||||||||
|
Loans
|
$
|
204,227
|
$
|
239,105
|
$
|
157,850
|
$
|
238,606
|
$
|
839,788
|
||||||||||
|
Loans held for sale
|
3,041
|
-
|
-
|
-
|
3,041
|
|||||||||||||||
|
Investment securities
|
83,718
|
48,171
|
79,135
|
114,002
|
325,026
|
|||||||||||||||
|
Securities purchased under agreements to resell
|
24,320
|
-
|
-
|
-
|
24,320
|
|||||||||||||||
|
Interest-bearing deposits with banks
|
151,049
|
-
|
-
|
-
|
151,049
|
|||||||||||||||
|
Total interest-earning assets
|
$
|
466,355
|
$
|
287,276
|
$
|
236,985
|
$
|
352,608
|
$
|
1,343,224
|
||||||||||
|
Interest-bearing Liabilities:
|
||||||||||||||||||||
|
NOW deposits
|
$
|
211,557
|
$
|
-
|
$
|
-
|
$
|
-
|
$
|
211,557
|
||||||||||
|
Money market deposits
|
222,851
|
-
|
-
|
-
|
222,851
|
|||||||||||||||
|
Savings deposits
|
380,039
|
-
|
-
|
-
|
380,039
|
|||||||||||||||
|
Time deposits over $100,000
|
40,806
|
79,147
|
29,514
|
5,901
|
155,368
|
|||||||||||||||
|
Time deposits under $100,000
|
34,336
|
73,294
|
23,625
|
-
|
131,255
|
|||||||||||||||
|
Borrowings
|
-
|
-
|
-
|
2,300
|
2,300
|
|||||||||||||||
|
Capital lease obligations
|
2,211
|
-
|
-
|
-
|
2,211
|
|||||||||||||||
|
Borrowings made by ESOP to outside parties
|
-
|
-
|
-
|
-
|
-
|
|||||||||||||||
|
Junior subordinated debt owed to unconsolidated trusts
|
16,496
|
-
|
-
|
20,620
|
37,116
|
|||||||||||||||
|
Total interest-bearing liabilities
|
$
|
908,295
|
$
|
152,441
|
$
|
53,139
|
$
|
28,821
|
$
|
1,142,697
|
||||||||||
|
Rate sensitive assets (RSA)
|
$
|
466,355
|
$
|
753,631
|
$
|
990,616
|
$
|
1,343,224
|
1,343,224
|
|||||||||||
|
Rate sensitive liabilities (RSL)
|
908,296
|
1,060,737
|
1,113,876
|
1,142,697
|
1,142,697
|
|||||||||||||||
|
Cumulative GAP (GAP=RSA-RSL)
|
(441,941
|
)
|
(307,106
|
)
|
(123,260
|
)
|
200,527
|
200,527
|
||||||||||||
|
RSA/Total assets
|
33.34
|
%
|
53.87
|
%
|
70.81
|
%
|
96.01
|
%
|
96.01
|
%
|
||||||||||
|
RSL/Total assets
|
64.93
|
%
|
75.82
|
%
|
79.62
|
%
|
81.68
|
%
|
81.68
|
%
|
||||||||||
|
GAP/Total assets
|
(31.59
|
)%
|
(21.95
|
)%
|
(8.81
|
)%
|
14.33
|
%
|
14.33
|
%
|
||||||||||
|
GAP/RSA
|
(94.77
|
)%
|
(40.75
|
)%
|
(12.44
|
)%
|
14.93
|
%
|
14.93
|
%
|
||||||||||
Certain shortcomings are inherent in the method of analysis presented in the foregoing table. For example, although certain assets and liabilities may have similar maturities or periods to repricing, they may react in different degrees to changes in market interest rates. Also, the interest rates on certain types of assets and liabilities may fluctuate in advance of changes in market interest rates, while interest rates on other types of assets may lag behind changes in market rates. Additionally, in the event of a change in interest rates, prepayment and early withdrawal levels would likely deviate significantly from those assumed in calculating the table. Therefore, we do not rely solely on a gap analysis to manage our interest rate risk, but rather we use what we believe to be the more reliable simulation model relating to changes in net interest income.
Based on simulation modeling as of December 31, 2015 and 2014, our net interest income would likely change over a two-year time period due to changes in interest rates as follows:
Change in Net Interest Income Over Two Year Horizon
|
2015
|
2014
|
|||||||||||||||||
|
Changes in
Levels of
Interest
Rates
|
Dollar
Change
|
Percent
Change
|
Dollar
Change
|
Percent
Change
|
||||||||||||||
|
(Dollars in thousands)
|
||||||||||||||||||
|
+2.00
|
%
|
$
|
3,421
|
3.86
|
%
|
$
|
(6,240
|
)
|
(14.21
|
)%
|
||||||||
|
+1.00
|
%
|
2,589
|
2.92
|
%
|
(4,435
|
)
|
(10.10
|
)%
|
||||||||||
|
(1.00
|
)%
|
(3,522
|
)
|
(3.98
|
)%
|
(88
|
)
|
(0.20
|
)%
|
|||||||||
|
(2.00
|
)%
|
NA
|
NA
|
(123
|
)
|
(0.28
|
)%
|
|||||||||||
Our simulation modeling assumed that changes in interest rates are immediate.
Changes in net interest income between the periods above reflect changes in the composition of interest-earning assets and interest-bearing liabilities, related interest rates, repricing frequencies, and the fixed or variable characteristics of the interest-earning assets and interest-bearing liabilities. Projections of income given by the model are not actual predictions, but rather show our relative interest rate risk. Actual interest income may vary from model projections.
TRINITY CAPITAL CORPORATION AND SUBSIDIARIES
INDEX TO CONSOLIDATED FINANCIAL STATEMENTS
|
REPORT OF INDEPENDENT REGISTERED PUBLIC ACCOUNTING FIRM
|
68
|
|
AUDITED FINANCIAL STATEMENTS
|
|
|
Consolidated Balance Sheets
as of December 31, 2015 and 2014
|
69
|
|
Consolidated Statements of Operations
for the Years Ended December 31, 2015, 2014 and 2013
|
70
|
|
Consolidated Statements of Comprehensive Income (Loss)
for the Years Ended December 31, 2015, 2014 and 2013
|
71
|
|
Consolidated Statements of Changes in Stockholders’ Equity
for the Years Ended December 31, 2015, 2014 and 2013
|
72
|
|
Consolidated Statements of Cash Flows
for the Years Ended December 31, 2015, 2014 and 2013
|
73
|
|
Notes to Consolidated Financial Statements
|
75
|

|
Crowe Horwath LLP
Independent Member Crowe Horwath International
|
REPORT OF INDEPENDENT REGISTERED PUBLIC ACCOUNTING FIRM
To the Board of Directors and Stockholders of
Trinity Capital Corporation
Los Alamos, New Mexico
We have audited the accompanying consolidated balance sheets of Trinity Capital Corporation & Subsidiaries (“the Company”) as of December 31, 2015 and 2014, and the related consolidated statements of operations, comprehensive income (loss), changes in stockholders' equity, and cash flows for each of the three years in the period ended December 31, 2015. These consolidated financial statements are the responsibility of the Company's management. Our responsibility is to express an opinion on these consolidated financial statements based on our audits.
We conducted our audits in accordance with the standards of the Public Company Accounting Oversight Board (United States). Those standards require that we plan and perform the audit to obtain reasonable assurance about whether the consolidated financial statements are free of material misstatement.
The Company is not required to have, nor were we engaged to perform, an audit of its internal control over financial reporting. Our audit included consideration of internal control over financial reporting as a basis for designing audit procedures that are appropriate in the circumstances, but not for the purpose of expressing an opinion on the effectiveness of the Company's internal control over financial reporting. Accordingly, we express no such opinion.
An audit includes examining, on a test basis, evidence supporting the amounts and disclosures in the consolidated financial statements. An audit also includes assessing the accounting principles used and significant estimates made by management, as well as evaluating the overall consolidated financial statement presentation. We believe that our audits provide a reasonable basis for our opinion.
In our opinion, the consolidated financial statements referred to above present fairly, in all material respects, the consolidated financial position of the Company as of December 31, 2015 and December 31, 2014, and the results of its operations and its cash flows for each of the three years in the period ended December 31, 2015, in conformity with U.S. generally accepted accounting principles.
/s/
Crowe Horwath LLP
Sacramento, California
October 31, 2016
TRINITY CAPITAL CORPORATION & SUBSIDIARIES
CONSOLIDATED BALANCE SHEETS
December 31, 2015 and 2014
(In thousands, except share data)
|
2015
|
2014
|
|||||||
|
ASSETS
|
||||||||
|
Cash and due from banks
|
$
|
13,506
|
$
|
17,202
|
||||
|
Interest-bearing deposits with banks
|
151,049
|
207,965
|
||||||
|
Securities purchased under resell agreements
|
24,320
|
22,231
|
||||||
|
Cash and cash equivalents
|
188,875
|
247,398
|
||||||
|
Investment securities available for sale, at fair value
|
316,040
|
216,022
|
||||||
|
Investment securities held to maturity, at amortized cost (fair value of $8,988 and $11,947 as of December 31, 2015 and 2014, respectively)
|
8,986
|
11,775
|
||||||
|
Non-marketable equity securities
|
3,854
|
6,984
|
||||||
|
Loans held for sale
|
3,041
|
5,632
|
||||||
|
Loans (net of allowance for loan losses of $17,392 and $24,783 as of December 31, 2015 and 2014, respectively)
|
822,396
|
885,764
|
||||||
|
Mortgage servicing rights ("MSRs"), net
|
6,882
|
7,453
|
||||||
|
Premises and equipment, net
|
23,373
|
24,734
|
||||||
|
Other real estate owned ("OREO"), net
|
8,346
|
13,980
|
||||||
|
Other assets
|
17,192
|
26,464
|
||||||
|
Total assets
|
$
|
1,398,985
|
$
|
1,446,206
|
||||
|
LIABILITIES AND STOCKHOLDERS' EQUITY
|
||||||||
|
Liabilities
|
||||||||
|
Deposits:
|
||||||||
|
Noninterest-bearing
|
$
|
152,888
|
$
|
144,503
|
||||
|
Interest-bearing
|
1,101,070
|
1,138,089
|
||||||
|
Total deposits
|
1,253,958
|
1,282,592
|
||||||
|
Long-term borrowings
|
2,300
|
22,300
|
||||||
|
Junior subordinated debt
|
37,116
|
37,116
|
||||||
|
Other liabilities
|
26,621
|
21,176
|
||||||
|
Total liabilities
|
1,319,995
|
1,363,184
|
||||||
|
Stock owned by Employee Stock Ownership Plan ("ESOP") participants; 672,623 shares and 672,958 shares as of December 31, 2015 and 2014, respectively, at fair value
|
2,690
|
2,019
|
||||||
|
Commitments and contingencies (Notes 11, 15 and 17)
|
||||||||
|
Stockholders' equity
|
||||||||
|
Preferred stock, no par, authorized 1,000,000 shares
|
||||||||
|
Series A, 9% cumulative perpetual, 35,539 shares issued and outstanding, $1,000 liquidation value per share, at amortized cost
|
34,858
|
34,648
|
||||||
|
Series B, 9% cumulative perpetual, 1,777 shares issued and outstanding, $1,000 liquidation value per share, at amortized cost
|
1,882
|
1,915
|
||||||
|
Common stock, no par, 20,000,000 shares authorized; 6,856,800 shares issued; 6,491,802 shares and 6,453,049 shares oustanding as of December 31, 2015 and 2014, respectively
|
6,836
|
6,836
|
||||||
|
Additional paid-in capital
|
1,153
|
1,963
|
||||||
|
Retained earnings
|
44,232
|
47,084
|
||||||
|
Accumulated other comprehensive (loss)
|
(2,781
|
)
|
(555
|
)
|
||||
|
Total stockholders' equity before treasury stock
|
86,180
|
91,891
|
||||||
|
Treasury stock, at cost; 364,998 shares and 403,751 shares as of December 31, 2015 and 2014, respectively
|
(9,880
|
)
|
(10,888
|
)
|
||||
|
Total stockholders' equity
|
76,300
|
81,003
|
||||||
|
Total liabilities and stockholders' equity
|
$
|
1,398,985
|
$
|
1,446,206
|
||||
The accompanying notes are an integral part of these consolidated financial statements.
TRINITY CAPITAL CORPORATION & SUBSIDIARIES
CONSOLIDATED STATEMENTS OF OPERATIONS
Years Ended December 31, 2015, 2014 and 2013
(In thousands, except per share data)
|
2015
|
2014
|
2013
|
||||||||||
|
Interest income:
|
||||||||||||
|
Loans, including fees
|
$
|
42,364
|
$
|
48,766
|
$
|
58,002
|
||||||
|
Interest and dividends on investment securities:
|
||||||||||||
|
Taxable
|
3,956
|
2,081
|
1,456
|
|||||||||
|
Nontaxable
|
175
|
452
|
582
|
|||||||||
|
Other interest income
|
1,109
|
851
|
655
|
|||||||||
|
Total interest income
|
47,604
|
52,150
|
60,695
|
|||||||||
|
Interest expense:
|
||||||||||||
|
Deposits
|
2,939
|
3,933
|
5,532
|
|||||||||
|
Borrowings
|
285
|
995
|
1,024
|
|||||||||
|
Junior subordinated debt
|
2,652
|
2,428
|
2,265
|
|||||||||
|
Total interest expense
|
5,876
|
7,356
|
8,821
|
|||||||||
|
Net interest income
|
41,728
|
44,794
|
51,874
|
|||||||||
|
Provision for loan losses
|
500
|
2,000
|
-
|
|||||||||
|
Net interest income after provision for loan losses
|
41,228
|
42,794
|
51,874
|
|||||||||
|
Noninterest income:
|
||||||||||||
|
Mortgage loan servicing fees
|
2,298
|
2,428
|
2,563
|
|||||||||
|
Trust and investment services fees
|
2,604
|
2,564
|
2,359
|
|||||||||
|
Service charges on deposits
|
1,262
|
1,528
|
1,516
|
|||||||||
|
Net gain on sale of loans
|
2,629
|
2,373
|
5,175
|
|||||||||
|
Net gain (loss) on sale of securities
|
4
|
1
|
(80
|
)
|
||||||||
|
Other fees
|
3,979
|
3,975
|
3,650
|
|||||||||
|
Other noninterest (loss) income
|
(1,202
|
)
|
317
|
282
|
||||||||
|
Total noninterest income
|
11,574
|
13,186
|
15,465
|
|||||||||
|
Noninterest expenses:
|
||||||||||||
|
Salaries and employee benefits
|
24,482
|
25,269
|
24,415
|
|||||||||
|
Occupancy
|
3,452
|
4,204
|
4,105
|
|||||||||
|
(Gains) losses and write-downs on OREO, net
|
(427
|
)
|
2,012
|
980
|
||||||||
|
Other noninterest expense
|
23,381
|
29,317
|
24,976
|
|||||||||
|
Total noninterest expenses
|
50,888
|
60,802
|
54,476
|
|||||||||
|
Income (loss) before provision for income taxes
|
1,914
|
(4,822
|
)
|
12,863
|
||||||||
|
Provision for income taxes
|
-
|
1,170
|
-
|
|||||||||
|
Net income (loss)
|
1,914
|
(5,992
|
)
|
12,863
|
||||||||
|
Dividends and discount accretion on preferred shares
|
3,803
|
3,230
|
2,144
|
|||||||||
|
Net income (loss) available to common shareholders
|
$
|
(1,889
|
)
|
$
|
(9,222
|
)
|
$
|
10,719
|
||||
|
Basic earnings (loss) per common share
|
$
|
(0.29
|
)
|
$
|
(1.43
|
)
|
$
|
1.66
|
||||
|
Diluted earnings (loss)per common share
|
$
|
(0.29
|
)
|
$
|
(1.43
|
)
|
$
|
1.66
|
||||
The accompanying notes are an integral part of these consolidated financial statements.
TRINITY CAPITAL CORPORATION & SUBSIDIARIES
CONSOLIDATED STATEMENTS OF COMPREHENSIVE INCOME (LOSS)
Years Ended December 31, 2015, 2014 and 2013
(In thousands)
|
2015
|
2014
|
2013
|
||||||||||
|
Net income (loss)
|
$
|
1,914
|
$
|
(5,992
|
)
|
$
|
12,863
|
|||||
|
Other comprehensive loss:
|
||||||||||||
|
Unrealized gains (losses) on securities available for sale
|
(2,222
|
)
|
(89
|
)
|
(1,308
|
)
|
||||||
|
Securities losses (gains) reclassified into earnings
|
(4
|
)
|
(1
|
)
|
80
|
|||||||
|
Related income tax benefit
|
-
|
36
|
490
|
|||||||||
|
Other comprehensive loss
|
(2,226
|
)
|
(54
|
)
|
(738
|
)
|
||||||
|
Total comprehensive income (loss)
|
$
|
(312
|
)
|
$
|
(6,046
|
)
|
$
|
12,125
|
||||
The accompanying notes are an integral part of these consolidated financial statements.
TRINITY CAPITAL CORPORATION & SUBSIDIARIES
CONSOLIDATED STATEMENTS OF CHANGES IN STOCKHOLDERS’ EQUITY
Years Ended December 31, 2015, 2014 and 2013
(In thousands)
|
Common stock
|
||||||||||||||||||||||||||||
|
Issued
|
Held in
treasury, at
cost
|
Preferred
stock
|
Additional
paid-in
capital
|
Retained
earnings
|
Accumulated
other compre-
hensive income
(loss)
|
Total
stockholders'
equity
|
||||||||||||||||||||||
|
Balance, December 31, 2012
|
$
|
6,836
|
$
|
(10,974
|
)
|
$
|
36,208
|
$
|
2,005
|
$
|
41,546
|
$
|
237
|
$
|
75,858
|
|||||||||||||
|
Net income
|
12,863
|
12,863
|
||||||||||||||||||||||||||
|
Other comprehensive income
|
(738
|
)
|
(738
|
)
|
||||||||||||||||||||||||
|
Dividends declared on preferred shares
|
(1,966
|
)
|
(1,966
|
)
|
||||||||||||||||||||||||
|
Amortization of preferred stock issuance costs
|
178
|
(178
|
)
|
-
|
||||||||||||||||||||||||
|
Decrease in stock owned by ESOP participants, 191 shares
|
2
|
2
|
||||||||||||||||||||||||||
|
Net change in the fair value of stock owned by ESOP participants
|
2,691
|
2,691
|
||||||||||||||||||||||||||
|
Balance, December 31, 2013
|
$
|
6,836
|
$
|
(10,974
|
)
|
$
|
36,386
|
$
|
2,005
|
$
|
54,958
|
$
|
(501
|
)
|
$
|
88,710
|
||||||||||||
|
Net loss
|
(5,992
|
)
|
(5,992
|
)
|
||||||||||||||||||||||||
|
Other comprehensive income
|
(54
|
)
|
(54
|
)
|
||||||||||||||||||||||||
|
Dividends declared on preferred shares
|
(3,052
|
)
|
(3,052
|
)
|
||||||||||||||||||||||||
|
Amortization of preferred stock issuance costs
|
177
|
(177
|
)
|
-
|
||||||||||||||||||||||||
|
Treasury shares issued for stock option plan
|
86
|
14
|
100
|
|||||||||||||||||||||||||
|
Dissolution of subsidiary
|
(56
|
)
|
(56
|
)
|
||||||||||||||||||||||||
|
Decrease in stock owned by ESOP participants, 108 shares
|
-
|
-
|
||||||||||||||||||||||||||
|
Net change in the fair value of stock owned by ESOP participants
|
1,347
|
1,347
|
||||||||||||||||||||||||||
|
Balance, December 31, 2014
|
$
|
6,836
|
$
|
(10,888
|
)
|
$
|
36,563
|
$
|
1,963
|
$
|
47,084
|
$
|
(555
|
)
|
$
|
81,003
|
||||||||||||
|
Net Income
|
1,914
|
1,914
|
||||||||||||||||||||||||||
|
Other comprehensive income
|
(2,226
|
)
|
(2,226
|
)
|
||||||||||||||||||||||||
|
Dividends declared on preferred shares
|
(3,917
|
)
|
(3,917
|
)
|
||||||||||||||||||||||||
|
Amortization of preferred stock issuance costs
|
177
|
(177
|
)
|
-
|
||||||||||||||||||||||||
|
Treasury shares issued for stock option plan
|
1,008
|
(810
|
)
|
198
|
||||||||||||||||||||||||
|
Increase in stock owned by ESOP participants, 57 shares
|
-
|
-
|
||||||||||||||||||||||||||
|
Net change in the fair value of stock owned by ESOP participants
|
(672
|
)
|
(672
|
)
|
||||||||||||||||||||||||
|
Balance, December 31, 2015
|
$
|
6,836
|
$
|
(9,880
|
)
|
$
|
36,740
|
$
|
1,153
|
$
|
44,232
|
$
|
(2,781
|
)
|
$
|
76,300
|
||||||||||||
The accompanying notes are an integral part of these consolidated financial statements.
TRINITY CAPITAL CORPORATION & SUBSIDIARIES
CONSOLIDATED STATEMENTS OF CASH FLOWS
Years Ended December 31, 2015, 2014 and 2013
(In thousands)
|
2015
|
2014
|
2013
|
||||||||||
|
Cash Flows From Operating Activities
|
||||||||||||
|
Net income (loss)
|
$
|
1,914
|
$
|
(5,992
|
)
|
$
|
12,863
|
|||||
|
Adjustments to reconcile net income (loss) to net cash provided by operating activities:
|
||||||||||||
|
Depreciation and amortization
|
1,653
|
2,409
|
2,658
|
|||||||||
|
Provision for loan losses
|
500
|
2,000
|
-
|
|||||||||
|
Net (gain) loss on sale of investment securities
|
(4
|
)
|
1
|
80
|
||||||||
|
Net (gain) on sale of loans
|
(2,629
|
)
|
(2,373
|
)
|
(5,175
|
)
|
||||||
|
(Gains) losses and write-downs on OREO, net
|
(243
|
)
|
2,079
|
980
|
||||||||
|
Loss on disposal of premises and equipment
|
27
|
(3
|
)
|
2
|
||||||||
|
Decrease in deferred income tax assets
|
-
|
36
|
489
|
|||||||||
|
Federal Home Loan Bank (FHLB) stock dividends received
|
(4
|
)
|
-
|
(6
|
)
|
|||||||
|
Net amortization of MSRs
|
1,515
|
1,676
|
1,540
|
|||||||||
|
Change in mortgage servicing rights valuation allowance
|
(122
|
)
|
(4
|
)
|
(1,321
|
)
|
||||||
|
Changes in operating assets and liabilities:
|
||||||||||||
|
Other Assets
|
13,560
|
3,493
|
2,375
|
|||||||||
|
Other Liabilities
|
1,527
|
2,661
|
3,555
|
|||||||||
|
Net cash provided by operating activities before origination and gross sales of loans held for sale
|
17,694
|
5,983
|
18,040
|
|||||||||
|
Gross sales of loans held for sale
|
81,561
|
78,679
|
175,368
|
|||||||||
|
Origination of loans held for sale
|
(77,163
|
)
|
(79,612
|
)
|
(161,455
|
)
|
||||||
|
Net cash provided by operating activities
|
$
|
22,092
|
$
|
5,050
|
$
|
31,953
|
||||||
Continued next page
TRINITY CAPITAL CORPORATION & SUBSIDIARIES
CONSOLIDATED STATEMENTS OF CASH FLOWS CONTINUED
Years Ended December 31, 2015, 2014 and 2013
(In thousands)
|
2015
|
2014
|
2013
|
||||||||||
|
Cash Flows From Investing Activities
|
||||||||||||
|
Proceeds from maturities and paydowns of investment securities, available for sale
|
$
|
64,316
|
$
|
62,562
|
$
|
61,643
|
||||||
|
Proceeds from sale of investment securities, available for sale
|
10,951
|
-
|
4,142
|
|||||||||
|
Purchase of investment securities, available for sale
|
(179,718
|
)
|
(157,101
|
)
|
(78,631
|
)
|
||||||
|
Proceeds from maturities and paydowns of investment securities, held to maturity
|
191
|
7,893
|
475
|
|||||||||
|
Proceeds from maturities and paydowns of investment securities, other
|
374
|
-
|
83
|
|||||||||
|
Proceeds from sale of investment securities, other
|
888
|
-
|
-
|
|||||||||
|
Purchase of investment securities, other
|
(36
|
)
|
(160
|
)
|
(718
|
)
|
||||||
|
Proceeds from sale of other real estate owned
|
7,989
|
8,849
|
1,538
|
|||||||||
|
Sale of impaired loans
|
11,860
|
-
|
-
|
|||||||||
|
Loans paid down (funded), net
|
88,263
|
130,448
|
124,327
|
|||||||||
|
Purchases of loans
|
(37,190
|
)
|
(431
|
)
|
(2,505
|
)
|
||||||
|
Purchases of premises and equipment
|
(350
|
)
|
(538
|
)
|
(1,511
|
)
|
||||||
|
Proceeds from sale of premises and equipment
|
31
|
-
|
-
|
|||||||||
|
Net cash (used in) provided by investing activities
|
(32,178
|
)
|
51,522
|
108,843
|
||||||||
|
Cash Flows From Financing Activities
|
||||||||||||
|
Net increase (decrease) in demand deposits, NOW accounts and savings accounts
|
27,904
|
(34,708
|
)
|
55,602
|
||||||||
|
Net (decrease) in time deposits
|
(56,539
|
)
|
(65,764
|
)
|
(65,676
|
)
|
||||||
|
Repayment of borrowings
|
(20,000
|
)
|
-
|
-
|
||||||||
|
Issuance of common stock for stock option plan
|
198
|
100
|
-
|
|||||||||
|
Preferred shares dividend payments
|
-
|
-
|
(484
|
)
|
||||||||
|
Net cash (used in) financing activities
|
(48,437
|
)
|
(100,372
|
)
|
(10,558
|
)
|
||||||
|
Net (decrease) increase in cash and cash equivalents
|
(58,523
|
)
|
(43,800
|
)
|
130,238
|
|||||||
|
Cash and cash equivalents:
|
||||||||||||
|
Beginning of period
|
247,398
|
291,198
|
160,960
|
|||||||||
|
End of period
|
$
|
188,875
|
$
|
247,398
|
$
|
291,198
|
||||||
|
Supplemental Disclosures of Cash Flow Information
|
||||||||||||
|
Cash payments for:
|
||||||||||||
|
Interest
|
$
|
3,416
|
$
|
5,306
|
$
|
9,840
|
||||||
|
Non-cash investing and financing activities:
|
||||||||||||
|
Transfers from loans to other real estate owned
|
3,958
|
11,523
|
11,160
|
|||||||||
|
Transfers from loans to repossessed assets
|
16
|
42
|
330
|
|||||||||
|
Sales of other real estate owned financed by loans
|
1,846
|
617
|
3,851
|
|||||||||
|
Transfer from loans to loans held for sale
|
11,860
|
-
|
-
|
|||||||||
|
Transfer from held to maturity securities to loans
|
2,457
|
|||||||||||
|
Dividends declared, not yet paid
|
3,917
|
3,052
|
1,725
|
|||||||||
|
Change in unrealized gain on investment securities, net of taxes
|
(2,222
|
)
|
(54
|
)
|
(738
|
)
|
||||||
The accompanying notes are an integral part of these consolidated financial statements.
TRINITY CAPITAL CORPORATION & SUBSIDIARIES
NOTES TO CONSOLIDATED FINANCIAL STATEMENTS
DECEMBER 31, 2015, 2014 AND 2013
Note 1. Significant Accounting Policies
Consolidation:
The accompanying consolidated financial statements include the consolidated balances and results of operations of Trinity Capital Corporation (“Trinity”) and its wholly owned subsidiaries: Los Alamos National Bank (the “Bank”), TCC Advisors Corporation (“TCC Advisors”), LANB Investment Advisors, LLC (“LANB Investment Advisors”), and TCC Funds, collectively referred to as the “Company.” Trinity Capital Trust I (“Trust I”), Trinity Capital Trust III (“Trust III”), Trinity Capital Trust IV (“Trust IV”) and Trinity Capital Trust V (“Trust V”), collectively referred to as the “Trusts,” are trust subsidiaries of Trinity.
Trinity owns all of the outstanding common securities of the Trusts. The Trusts are considered variable interest entities (“VIEs”) under ASC Topic 810,
"Consolidation."
Because Trinity is not the primary beneficiary of the Trusts, the financial statements of the Trusts are not included in the consolidated financial statements of the Company.
Title Guaranty & Insurance Company (“Title Guaranty”) was acquired in 2000 and its assets were subsequently sold in August 2012. As of December 31, 2013, all operations of Title Guaranty had ended. Substantially all of the assets of TCC Advisors was sold in January 2015. Trinity is in the process of dissolving this entity.
Basis of presentation:
The consolidated financial statements include the accounts of the Company and its subsidiaries. Significant intercompany items and transactions have been eliminated in consolidation. The accounting and reporting policies of the Company conform to accounting principles generally accepted in the United States of America (“GAAP”) and general practices within the financial services industry. In preparing the financial statements, management is required to make estimates and assumptions that affect the reported amounts of assets and liabilities as of the date of the balance sheet and revenues and expenses for the year then ended. Actual results could differ from those estimates.
Nature of operations:
The Company provides a variety of financial services to individuals, businesses and government organizations through its offices in Los Alamos, Santa Fe and Albuquerque, New Mexico. Its primary deposit products are term certificate, Negotiable Order of Withdrawal (“NOW”) and savings accounts and its primary lending products are commercial, residential and construction real estate loans. The Company also offers trust and wealth management services.
Deposits with banks and securities purchased under resell agreements:
For purposes of reporting cash flows, cash and cash equivalents include cash on hand, amounts due from banks (including cash items in process of clearing), interest-bearing deposits with banks with original maturities of 90 days or less.
Investment securities:
Securities classified as available for sale are debt securities the Bank intends to hold for an indefinite period of time, but not necessarily to maturity. Any decision to sell a security classified as available for sale would be based on various factors, including significant movements in interest rates, changes in the maturity mix of the Bank's assets and liabilities, liquidity needs, regulatory capital considerations and other similar factors. Securities available for sale are reported at fair value with unrealized gains or losses reported as other comprehensive income, net of the related deferred tax effect.
Securities classified as held to maturity are those securities that the Company has the ability and positive intent to hold until maturity. These securities are reported at amortized cost. Sales of investment securities held to maturity within three months of maturity are treated as maturities. Realized gains or losses are included in earnings on the trade date and are determined on the basis of the cost of specific securities sold.
Purchase premiums and discounts are generally recognized in interest income using the interest method over the term of the securities. For mortgage-backed securities, estimates of prepayments are considered in the constant yield calculations.
An investment security is impaired if the fair value of the security is less than its amortized cost basis. Once the security is impaired, a determination must be made to determine if it is other than temporarily impaired (“OTTI”).
In determining OTTI losses, management considers many factors, including: current market conditions, fair value in relationship to cost; extent and nature of the change in fair value; issuer rating changes and trends; whether it intends to sell the security before recovery of the amortized cost basis of the investment, which may be maturity; and other factors. For debt securities, if management intends to sell the security or it is likely that the Bank will be required to sell the security before recovering its cost basis, the entire impairment loss would be recognized in earnings as an OTTI. If management does not intend to sell the security and it is not likely that the Bank will be required to sell the security, but management does not expect to recover the entire amortized cost basis of the security, only the portion of the impairment loss representing credit losses would be recognized in earnings. The credit loss on a security is measured as the difference between the amortized cost basis and the present value of the cash flows expected to be collected. Projected cash flows are discounted by the original or current effective interest rate depending on the nature of the security being measured for potential OTTI. The remaining impairment related to the difference between the present value of the cash flows expected to be collected and fair value is recognized as a charge to other comprehensive income.
Non-marketable equity securities:
The Bank, as a member of the FHLB, is required to maintain an investment in common stock of the FHLB based upon borrowings made from the FHLB and based upon various classes of loans in the Bank’s portfolio. FHLB and Federal Reserve Bank (“FRB”) stock do not have readily determinable fair values as ownership is restricted and they lack a market. As a result, these stocks are carried at cost and evaluated periodically by management for impairment.
Also included are the Bank’s investments in certain venture capital funds totaling $1.0 million and $3.3 million as of December 31, 2015 and December 31, 2014, respectively. The Bank’s $50 thousand interest in Cottonwood Technology Group, LLC was written off in the year ending December 31, 2015. The Bank is the only member of FNM Investment Fund IV, LLC (“FNM Investment Fund IV”). As of December 31, 2015, the new market tax credit of FNM Investment Fund IV of $305 thousand was fully amortized to zero and the current outstanding commercial loan amount was $5.2 million. The commercial loan is included in “loans, net” on the consolidated balance sheets. The Bank holds an interest in Southwest Medical Technologies, LLC. During the year ending December 31, 2015 the Bank received a $200 thousand cash distribution and wrote down the remaining $201 thousand investment in Southwest Medical Technologies, LLC to zero. The Bank holds an interest in New Mexico Mezzanine Partners, LP. During the year ending December 31, 2015 the Bank received a $120 thousand cash distribution and wrote down the investment by $300 thousand to $138 thousand. The Bank holds an interest in Puente Partners, LLC. During the year ending December 31, 2015 the Bank received a distribution in the form of stock in an Albuquerque based pharmaceutical company initially valued at less than $6 thousand. The pharmaceutical company was subsequently dissolved and the Bank wrote the Puente partners, LLC investment down by $280 thousand to zero. The Bank holds an interest in VSpring II, LP. During the year ending December 31, 2015 the Bank recorded partnership operating losses of $70 thousand which reduced the carrying value of VSpring II, LP to $92 thousand. The Bank holds an interest in CCP/Respira, LP. During the year ending December 31, 2015 the Bank brought the carrying value of CCP/Respira, LP to zero. During the year ended December 31, 2015 the Bank sold its interest in PCM/FibeRio, LP and recorded a $182 thousand loss as a result of the sale.
These non-marketable investments are carried at net equity value and evaluated periodically by management for impairment. Investments with fair values that are less than amortized cost are considered impaired. Impairment may result from either a decline in the financial condition of the issuing entity or, in the case of fixed rate investments, from rising interest rates. At each financial statement date, management assesses each investment to determine if impaired investments are temporarily impaired or if the impairment is other than temporary based upon the evidence available. Evidence evaluated includes (if applicable), but is not limited to, industry analyst reports, credit market conditions, and interest rate trends. If negative evidence outweighs positive evidence that the carrying amount is recoverable within a reasonable period of time, the impairment is recognized with a charge to earnings.
Loans held for sale:
Mortgage loans originated and intended for sale in the secondary market are carried at the lower of aggregate cost or fair value, as determined by outstanding commitments from investors. Net unrealized losses, if any, are recorded as a valuation allowance and charged to earnings.
Mortgage loans held for sale are generally sold with servicing rights retained; however, management intends to sell newly originated mortgage loans with servicing rights released going forward. The carrying value of mortgage loans sold is reduced by the amount allocated to the servicing right. Gains and losses on sales of mortgage loans are based on the difference between the selling price and the carrying value of the related loan sold.
Loans:
Loans that management has the intent and ability to hold for the foreseeable future or until maturity or pay-off are stated at the amount of unpaid principal reduced by deferred fees and costs and the allowance for loan losses.
Loan origination and commitment fees and certain direct loan origination costs are deferred and the net amount amortized as an adjustment of the related loan’s yield. The Company amortizes these amounts over the estimated life of the loan. Commitment fees based upon a percentage of a customer’s unused line of credit and fees related to standby letters of credit are recognized over the commitment period. Net deferred fees on real estate loans sold in the secondary market reduce the cost basis of such loans.
Interest on loans is accrued and reported as income using the interest method on daily principal balances outstanding. Past due status is based on the contractual terms of the loan. The Company generally discontinues accruing interest on loans when the loan becomes 90 days or more past due or when management believes that the borrower’s financial condition is such that collection of interest is doubtful. Cash collections on nonaccrual loans are credited to the loan balance, and no interest income is recognized on those loans until the principal balance has been determined to be collectible. Such interest will be reported as income on a cash basis, only upon collection of such interest.
Loans, other than those included in large groups of smaller-balance homogeneous loans, are considered impaired when it is probable the Company will be unable to collect all contractual principal and interest payments due in accordance with the terms of the loan agreement. Impaired loans are measured based on the present value of expected future cash flows discounted at the loan’s effective interest rate or, as a practical expedient, at the loan’s observable market price or the fair value of the collateral (less estimated disposition costs) if the loan is collateral dependent. The amount of impairment (if any) and any subsequent changes are included in the allowance for loan losses.
A loan is classified as a troubled debt restructure (“TDR”) when a borrower is experiencing financial difficulties that lead to a restructuring of the loan, and the Company grants concessions to the borrower in the restructuring that it would not otherwise consider. These concessions may include rate reductions, principal forgiveness, extension of maturity date and other actions intended to minimize potential losses.
In determining whether a debtor is experiencing financial difficulties, the Company considers if the debtor is in payment default or would be in payment default in the foreseeable future without the modification, the debtor declared or is in the process of declaring bankruptcy, there is substantial doubt that the debtor will continue as a going concern, the debtor has securities that have been or are in the process of being delisted, the debtor’s entity-specific projected cash flows will not be sufficient to service any of its debt, or the debtor cannot obtain funds from sources other than the existing creditors at a market rate for debt with similar risk characteristics.
In determining whether the Company has granted a concession, the Company assesses, if it does not expect to collect all amounts due, whether the current value of the collateral will satisfy the amounts owed, whether additional collateral or guarantees from the debtor will serve as adequate compensation for other terms of the restructuring, and whether the debtor otherwise has access to funds at a market rate for debt with similar risk characteristics.
A loan that is modified at a market rate of interest will not be classified as TDR in the calendar year subsequent to the restructuring if it is in compliance with the modified terms. Payment performance prior and subsequent to the restructuring is taken into account in assessing whether it is likely that the borrower can meet the new terms. A period of sustained repayment for at least six months generally is required for return to accrual status.
Periodically, the Company will restructure a note into two separate notes (A/B structure), charging off the entire B portion of the note. The A note is structured with appropriate loan-to-value and cash flow coverage ratios that provide for a high likelihood of repayment. The A note is classified as a non-performing note until the borrower has displayed a historical payment performance for a reasonable time prior to and subsequent to the restructuring. A period of sustained repayment for at least six months generally is required to return the note to accrual status provided that management has determined that the performance is reasonably expected to continue. The A note will be classified as a restructured note (either performing or non-performing) through the calendar year of the restructuring that the historical payment performance has been established.
Allowance for loan losses:
The Company has established an internal policy to estimate the allowance for loan losses. This policy is periodically reviewed by management and the Board of Directors.
The allowance for loan losses is established through a provision for loan losses charged to expense. Loans are charged-off against the allowance for loan losses when management believes that collectability of the principal is unlikely. The allowance for loan losses is an amount that management believes will be adequate to absorb probable incurred losses on existing loans, based on an evaluation of the collectability of loans in the portfolio and prior loss experience. This is based, in part, on an evaluation of the loss history of each type of loan over the past 12 quarters and this loss history is applied to the current outstanding loans of each respective type. This loss history analysis is updated quarterly to ensure it encompasses the most recent 12 quarter loss history. The allowance for loan losses is based on management’s evaluation of the loan portfolio giving consideration to the nature and volume of the loan portfolio, the value of underlying collateral, overall portfolio quality, review of specific problem loans, and prevailing economic conditions that may affect the borrower’s ability to pay. While management uses the best information available to make its evaluation, future adjustments to the allowance for loan losses may be necessary if there are significant changes in economic conditions.
In analyzing the adequacy of the allowance for loan losses, management uses a comprehensive loan grading system to determine risk potential in the portfolio, and considers the results of periodic internal and external loan reviews. Specific reserves for impaired loans and historical loss experience factors, combined with other considerations, such as delinquency, nonaccrual status, trends on criticized and classified loans, economic conditions, concentrations of credit risk, and experience and abilities of lending personnel, are also considered in analyzing the adequacy of the allowance
for loan losses
. Management uses a systematic methodology, which is applied quarterly, to determine the amount of allowance for loan losses and the resultant provisions for loan losses it considers adequate to provide for probable incurred loan losses. In the event that different assumptions or conditions were to prevail, and depending upon the severity of such changes, the possibility of materially different financial condition or results of operations is a reasonable likelihood.
The allowance for loan losses consists of specific and general components. The specific component relates to loans that are individually classified as impaired when, based on current information and events, it is probable that the Company will be unable to collect all amounts due according to the contractual terms of the loan agreement. The general component covers non‑impaired loans and is based on historical loss experience adjusted for current factors.
The general component is based upon (a) h
istoric performance
; and (
b
)
an estimate of the impact of environmental or qualitative factors
based on l
evels of credit concentrations; lending policies and procedures; the nature and volume of the portfolio; the experience, ability and depth of lending management and staff; the volume and severity of past due, criticized, classified and nonaccrual loans; the quality of the loan review system; the change in economic conditions; loan collateral value for dependent loans; and other external factors, examples of which are changes in regulations, laws or legal precedent and competition.
Concentrations of credit risk:
The majority of the loans, commitments to extend credit, and standby letters of credit have been granted to customers in Los Alamos, Santa Fe and surrounding communities. A substantial portion of the Company’s loan
portfolio includes loans that are made to businesses and individuals associated with, or employed by, the Los Alamos National Laboratory (the “Laboratory”). The ability
of such borrowers to honor their contracts is predominately dependent upon the continued operation and funding of the Laboratory. Investments in securities issued by state and political subdivisions involve governmental entities within the state of New Mexico. The distribution of commitments to extend credit approximates the distribution of loans outstanding. Standby letters of credit are granted primarily to commercial borrowers.
The Company recognizes a liability in relation to unfunded commitments that is intended to represent the estimated future losses on the commitments. In calculating the amount of this liability, management considers the amount of the Company’s off-balance-sheet commitments, estimated utilization factors and loan specific risk factors. The Company’s liability for unfunded commitments is calculated quarterly and the liability is included in “other liabilities” in the consolidated balance sheets.
Premises and equipment:
Premises and equipment is carried at cost less accumulated depreciation and amortization. Depreciation and amortization is computed by the straight-line method over the estimated useful lives. Leasehold improvements are amortized over the term of the related lease or the estimated useful lives of the improvements, whichever is shorter. For owned and capitalized assets, estimated useful lives range from three to 39 years. Maintenance and repairs are charged to expense as incurred, while major improvements are capitalized and amortized to operating expense over their identified useful life. Generally, the useful life on software is three years; on computer and office equipment, five years; on furniture, 10 years; and on building and building improvements, 10 to 39 years.
Other Real Estate Owned (“OREO”):
OREO includes real estate assets that have been received in full or partial satisfaction of debt. OREO is initially recorded at fair value establishing a new cost basis and subsequently carried at lower of cost basis or fair value. Any valuation adjustments required at the date of transfer are charged to the allowance for loan losses. Subsequently, unrealized losses and realized gains and losses on sale are included in “(Gains) losses and write-downs on OREO, net” in the consolidated statements of operations. Operating results from OREO are recorded in “other noninterest expenses” in the consolidated statements of operations.
Mortgage Servicing Rights (“MSRs”):
The Bank recognizes, as separate assets, rights to service mortgage loans for others, whether the rights are acquired through purchase or after origination and sale of mortgage loans. The Bank initially measures MSRs at fair value. Fair value is based on market prices for comparable mortgage servicing contracts, when available, or alternatively is based on the present value of estimated future net servicing income. All classes of servicing assets are subsequently measured using the amortization method, which requires servicing rights to be amortized into noninterest income in proportion to, and over the period of, the estimated future net servicing income of the underlying loans.
The carrying amount of MSRs, and the amortization thereon, is periodically evaluated in relation to their estimated fair values. The Bank stratifies the underlying mortgage loan portfolio by certain risk characteristics, such as loan type, interest rate and maturity, for purposes of measuring impairment. The Bank estimates the fair value of each stratum by calculating the discounted present value of future net servicing income based on management’s best estimate of remaining loan lives.
Impairment is recognized through a valuation allowance for an individual grouping, to the extent that fair value is less than the carrying amount. If the Company later determines that all or a portion of the impairment no longer exists for a particular group, a reduction of the valuation allowance may be recorded as an increase to income. The fair values of servicing rights are subject to significant fluctuations as a result of changes in estimated and actual payment speeds and default rates and losses. The Bank has determined that the primary risk characteristic of MSRs is the contractual interest rate and term of the underlying mortgage loans.
Fees earned for servicing rights are recorded as mortgage loan servicing fees in the consolidated statements of operations. The fees are based on a contractual percentage of the outstanding principal; or a fixed amount per loan and are recorded as income when earned. The amortization of MSRs as well as change in any valuation allowances are recorded in “other noninterest expenses” in the consolidated statements of operations.
Federal Home Loan Bank (FHLB) Stock:
The Bank is a member of the FHLB system. Members are required to own a certain amount of stock based on the level of borrowings and other factors, and may invest in additional amounts. FHLB stock is carried at cost, classified as a restricted security, and periodically evaluated for impairment based on ultimate recovery of par value. Both cash and stock dividends are reported as income.
Federal Reserve Bank (FRB) Stock:
The Bank is a member of its regional Federal Reserve Bank. FRB stock is carried at cost, classified as a restricted security, and periodically evaluated for impairment based on ultimate recovery of par value. Both cash and stock dividends are reported as income.
Other intangible assets:
The Company may obtain intangible assets other than MSRs from time to time. In certain cases, these assets have no definite life and are not amortized. Other intangible assets may have an expected useful life and are amortized over this life. All intangible assets are tested periodically for impairment and, if deemed impaired, the assets are written down to the current value, with the impairment amount being charged to current earnings.
Prepaid expenses:
The Company may pay certain expenses before the actual costs are incurred. In this case, these expenses are recognized as an asset. These assets are amortized as expense over the period of time in which the costs are incurred. The original term of these prepaid expenses generally range from three months to five years.
Earnings (loss) per common share:
Basic earnings (loss) per common share represent income available to common shareholders divided by the weighted average number of common shares outstanding during the period. Diluted earnings (loss) per common share are determined assuming that all in-the-money stock options were exercised at the beginning of the yearly period. Shares related to unvested stock options are not treated as outstanding for the purposes of computing basic earnings (loss) per common share; however all allocated shares held by the ESOP are included in the average shares outstanding.
Average number of shares used in calculation of basic and diluted earnings (loss) per common share are as follows for the years ended December 31, 2015, 2014 and 2013:
|
Year ended December 31,
|
||||||||||||
|
2015
|
2014
|
2013
|
||||||||||
|
(In thousands, except share and per share data)
|
||||||||||||
|
Net income (loss)
|
$
|
1,914
|
$
|
(5,992
|
)
|
$
|
12,863
|
|||||
|
Dividends and discount accretion on preferred shares
|
3,803
|
3,230
|
2,144
|
|||||||||
|
Net income (loss) available to common shareholders
|
$
|
(1,889
|
)
|
$
|
(9,222
|
)
|
$
|
10,719
|
||||
|
Weighted average common shares issued
|
6,856,800
|
6,856,800
|
6,856,800
|
|||||||||
|
LESS: Weighted average treasury stock shares
|
(373,163
|
)
|
(404,243
|
)
|
(407,074
|
)
|
||||||
|
Weighted average common shares outstanding, net
|
6,483,637
|
6,452,557
|
6,449,726
|
|||||||||
|
Basic (loss) earnings per common share
|
$
|
(0.29
|
)
|
$
|
(1.43
|
)
|
$
|
1.66
|
||||
|
Dilutive effect of stock-based compensation
|
-
|
-
|
-
|
|||||||||
|
Weighted average common shares outstanding including dilutive shares
|
6,483,637
|
6,452,557
|
6,449,726
|
|||||||||
|
Diluted (loss) earnings per common share
|
$
|
(0.29
|
)
|
$
|
(1.43
|
)
|
$
|
1.66
|
||||
Certain stock options and restricted stock units were not included in the above calculation, as they would have an anti-dilutive effect as the exercise price is greater than current market prices. The total number of shares excluded was approximately 12,000 shares, 26,000 shares and 42,000 shares for years ended December 31, 2015, 2014 and 2013, respectively.
Comprehensive income (loss):
Comprehensive income (loss) includes net income (loss) and other comprehensive income (loss). Other comprehensive income (loss) includes net unrealized gains and losses on investment securities available for sale, net of tax, which is also recognized as a separate component of equity.
Transfers of financial assets:
Transfers of financial assets are accounted for as sales only when the control over the financial assets has been surrendered. Control over transferred assets is deemed surrendered when (1) the assets have been isolated from the Company, (2) the transferee obtains the right (free of conditions that constrain it from taking advantage of the right) to pledge or exchange the transferred assets, and (3) the Company does not maintain effective control over the transferred assets through an agreement to repurchase them before their maturity.
Impairment of long-lived assets:
Management periodically reviews the carrying value of its long-lived assets to determine if impairment has occurred or whether changes in circumstances have occurred that would require a revision to the remaining useful life. In making such determination, management evaluates the performance, on an undiscounted basis, of the underlying operations or assets which give rise to such amount.
Income taxes:
Income tax expense is the total of the current year income tax due or refundable and the change in deferred tax assets and liabilities. Deferred tax assets and liabilities are the expected future tax amounts for the temporary differences between carrying amounts and tax bases of assets and liabilities, computed using enacted tax rates. A valuation allowance, if needed, reduces deferred tax assets to the amount expected to be realized.
A tax position is recognized as a benefit only if it is “more likely than not” that the tax position would be sustained in a tax examination, with a tax examination being presumed to occur. The amount recognized is the largest amount of tax benefit that is greater than 50% likely of being realized on examination. For tax positions not meeting the “more likely than not” test, no tax benefit is recorded.
The Company recognizes interest and/or penalties related to income tax matters in income tax expense.
Stock-based compensation:
Compensation cost is recognized for stock options and restricted stock awards issued to employees, based on the fair value of these awards at the date of grant. A Black-Scholes model is utilized to estimate the fair value of stock options, while the market price of the Company’s common stock at the date of grant is used for restricted stock awards.
Compensation cost is recognized over the required service period, generally defined as the vesting period. For awards with graded vesting, compensation cost is recognized on a straight-line basis over the requisite service period for the entire award.
Preferred stock:
Preferred stock callable at the option of the Company is initially recorded at the amount of proceeds received. Any discount from the liquidation value is accreted to the preferred stock and charged to retained earnings. The accretion is recorded using the level-yield method. Preferred dividends paid (declared and/or accrued) and any accretion is deducted from net income for computing net income available to common shareholders and earnings per share computations.
Fair value of financial instruments:
Fair value of financial instruments is estimated using relevant market information and other assumptions, as more fully disclosed in Note 20. Fair value estimates involve uncertainties and matters of significant judgment regarding interest rates, credit risk, prepayments, and other factors, especially in the absence of broad markets for particular items. Changes in assumptions or in market conditions could significantly affect these estimates.
Newly Issued But Not Yet Effective Accounting Standards:
In May 2014, the FASB issued
ASU No. 2014‑09
,
Revenue from Contracts with Customers (Topic 606)
. This update requires an entity to recognize revenue as performance obligations are met, in order to reflect the transfer of promised goods or services to customers in an amount that reflects the consideration the entity is entitled to receive for those goods or services. The following steps are applied in the updated guidance: (1) identify the contract(s) with a customer; (2) identify the performance obligations in the contract; (3) determine the transaction price; (4) allocate the transaction price to the performance obligations in the contract; and (5) recognize revenue when, or as, the entity satisfies a performance obligation. The FASB issued
ASU No. 2015-14
,
Revenue from Contracts with Customers (Topic 606) – Deferral of the Effective Date
. This update deferred the effective date by one year. The amended effective date is annual reporting periods beginning after December 15, 2017 including interim reporting periods within that reporting period. The Company is currently in the process of evaluating the impact of the adoption of this update, but does not expect a material impact on the Company’s financial statements.
In January 2016, the FASB issued
ASU No. 2016-01
,
Recognition and Measurement of Financial Assets and Financial Liabilities (Topic 825).
The amendments in this update require that public entities measure equity investments with readily determinable fair values, at fair value, with changes in their fair value recorded through net income. This ASU also clarifies that an entity should evaluate the need for a valuation allowance on a deferred tax asset related to available for sale securities in combination with the entity’s other deferred tax assets. The amendments within the update are effective for fiscal years and all interim periods beginning after December 15, 2017. The Company is currently in the process of evaluating the impact of the adoption of this update, but does not expect a material impact on the Company’s financial statements.
In February 2016, the FASB issued
ASU 2016-02
,
Leases
(Topic 842). ASU 2016-02 is effective for fiscal years beginning after December 15, 2018, including interim periods within those periods using a modified retrospective approach and early adoption is permitted. The Company is currently in the process of evaluating the impact of adoption of ASU 2016-02 on its financial statements and disclosures, if any.
In March 2016, the FASB issued ASU 2016-07,
Investments Equity Method and Joint Ventures
(Topic 323): Simplifying the Transition to the Equity Method of Accounting. ASU 2016-07 is effective for fiscal years beginning December 15, 2016, and interim periods within those fiscal years and early adoption is permitted. The Company is currently in the process of evaluating the impact of adoption of ASU 2016-07 on its financial statements and disclosures, if any.
In March 2016, the FASB issued
ASU 2016-09
,
Compensation- Stock Compensation
(Topic 718): Improvements to Employee Share-Based Payment Accounting. This ASU is effective for annual periods and interim periods within those annual periods beginning after December 15, 2016 and early adoption is permitted for financial statements that have not been previously issued. The Company is currently evaluating the effects of ASU 2016-09 on its financial statements and disclosures.
In April 2016, the FASB issued
ASU 2016-10
,
Revenue from Contracts with Customers
(Topic 606): Identifying Performance Obligations and Licensing. This ASU is effective for the annual periods beginning after December 15, 2017. The company is currently in the process of evaluating the effects of ASU 2016-10 on its financial statements and disclosures.
In May 2016, the FASB issued
ASU 2016-12
,
Revenue from Contracts with Customers
(Topic 606): Narrow-Scope Improvements and Practical Expedients. This ASU is effective for the annual periods beginning after December 15, 2017. The company is currently in the process of evaluating the effects of ASU 2016-12 on its financial statements and disclosures.
In June 2016, the FASB issued
ASU 2016-13
,
Financial Instruments – Credit Losses
(Topic 326): Measurement of Credit Losses on Financial Instruments. This ASU is effective for fiscal years beginning after December 15, 2019, including interim periods within those fiscal years. The company is currently in the process of evaluating the effects of ASU 2016-13 on its financial statements and disclosures.
Note 2. Restrictions on Cash and Due From Banks
The Bank is required to maintain reserve balances in cash or on deposit with the FRB, based on a percentage of deposits. As of December 31, 2015 and 2014, the reserve requirement on deposit at the FRB was $4.3 million and $4.2 million, respectively.
The Company maintains some of its cash in bank deposit accounts at financial institutions other than its subsidiaries that, at times, may exceed federally insured limits. The Company has not experienced any losses in such accounts. The Company believes it is not exposed to any significant credit risk on cash and cash equivalents.
Note 3. Investment Securities
Amortized cost and fair values of investment securities are summarized as follows:
|
Securities Available for Sale:
|
Amortized
Cost
|
Gross
Unrealized
Gains
|
Gross
Unrealized
Losses
|
Fair Value
|
||||||||||||
|
(In thousands)
|
||||||||||||||||
|
December 31, 2015
|
||||||||||||||||
|
U.S. Government sponsored agency
|
$
|
69,798
|
$
|
98
|
$
|
(312
|
)
|
$
|
69,584
|
|||||||
|
State and political subdivision
|
3,429
|
147
|
-
|
3,576
|
||||||||||||
|
Residential mortgage-backed security
|
123,055
|
43
|
(1,501
|
)
|
121,597
|
|||||||||||
|
Residential collateralized mortgage obligation
|
40,305
|
139
|
(523
|
)
|
39,921
|
|||||||||||
|
Commercial mortgage backed security
|
41,341
|
15
|
(237
|
)
|
41,119
|
|||||||||||
|
SBA pools
|
757
|
-
|
(7
|
)
|
750
|
|||||||||||
|
Asset-backed security
|
40,136
|
-
|
(643
|
)
|
39,493
|
|||||||||||
|
Totals
|
$
|
318,821
|
$
|
442
|
$
|
(3,223
|
)
|
$
|
316,040
|
|||||||
|
December 31, 2014
|
||||||||||||||||
|
U.S. Government sponsored agencies
|
$
|
42,438
|
$
|
8
|
$
|
(164
|
)
|
$
|
42,282
|
|||||||
|
State and political subdivisions
|
4,964
|
123
|
-
|
5,087
|
||||||||||||
|
Residential mortgage-backed security
|
102,482
|
92
|
(799
|
)
|
101,775
|
|||||||||||
|
Residential collateralized mortgage obligation
|
41,119
|
273
|
(341
|
)
|
41,051
|
|||||||||||
|
Commercial mortgage backed security
|
24,993
|
-
|
(111
|
)
|
24,882
|
|||||||||||
|
SBA pools
|
949
|
-
|
(4
|
)
|
945
|
|||||||||||
|
Totals
|
$
|
216,945
|
$
|
496
|
$
|
(1,419
|
)
|
$
|
216,022
|
|||||||
|
Securities Held to Maturity
|
Amortized
Cost
|
Gross
Unrealized
Gains
|
Gross
Unrealized
Losses
|
Fair Value
|
||||||||||||
|
(In thousands)
|
||||||||||||||||
|
December 31, 2015
|
||||||||||||||||
|
SBA pools
|
$
|
8,986
|
$
|
2
|
$
|
-
|
$
|
8,988
|
||||||||
|
Totals
|
$
|
8,986
|
$
|
2
|
$
|
-
|
$
|
8,988
|
||||||||
|
December 31, 2014
|
||||||||||||||||
|
SBA pools
|
$
|
9,269
|
$
|
109
|
$
|
-
|
$
|
9,378
|
||||||||
|
State and political subdivisions
|
2,506
|
63
|
-
|
2,569
|
||||||||||||
|
Totals
|
$
|
11,775
|
$
|
172
|
$
|
-
|
$
|
11,947
|
||||||||
Realized net gains (losses) on sale and call of securities available for sale are summarized as follows:
|
Year ended December 31,
|
||||||||||||
|
2015
|
2014
|
2013
|
||||||||||
|
(In thousands)
|
||||||||||||
|
Proceeds
|
$
|
17,184
|
$
|
24,500
|
$
|
4,142
|
||||||
|
Gross realized gains
|
4
|
1
|
59
|
|||||||||
|
Gross realized losses
|
-
|
-
|
(139
|
)
|
||||||||
A summary of unrealized loss information for investment securities, categorized by security type, as of December 31, 2015 and 2014 was as follows:
|
Less than 12 Months
|
12 Months or Longer
|
Total
|
||||||||||||||||||||||
|
Fair Value
|
Unrealized
Losses
|
Fair Value
|
Unrealized
Losses
|
Fair Value
|
Unrealized
Losses
|
|||||||||||||||||||
|
Securities Available for Sale:
|
(In thousands)
|
|||||||||||||||||||||||
|
December 31, 2015
|
||||||||||||||||||||||||
|
U.S. Government sponsored agencies
|
$
|
54,804
|
$
|
(312
|
)
|
$
|
-
|
$
|
-
|
$
|
54,804
|
$
|
(312
|
)
|
||||||||||
|
Residential mortgage-backed security
|
54,760
|
(602
|
)
|
48,752
|
(899
|
)
|
103,512
|
(1,501
|
)
|
|||||||||||||||
|
Residential collateralized mortgage obligation
|
17,237
|
(185
|
)
|
16,252
|
(338
|
)
|
33,489
|
(523
|
)
|
|||||||||||||||
|
Commercial mortgage backed security
|
26,883
|
(237
|
)
|
-
|
-
|
26,883
|
(237
|
)
|
||||||||||||||||
|
SBA pools
|
-
|
-
|
742
|
(7
|
)
|
742
|
(7
|
)
|
||||||||||||||||
|
Asset-backed security
|
39,493
|
(643
|
)
|
-
|
-
|
39,493
|
(643
|
)
|
||||||||||||||||
|
Totals
|
$
|
193,177
|
$
|
(1,979
|
)
|
$
|
65,746
|
$
|
(1,244
|
)
|
$
|
258,923
|
$
|
(3,223
|
)
|
|||||||||
|
December 31, 2014
|
||||||||||||||||||||||||
|
U.S. Government sponsored agency
|
$
|
34,278
|
$
|
(142
|
)
|
$
|
5,477
|
$
|
(22
|
)
|
$
|
39,755
|
$
|
(164
|
)
|
|||||||||
|
Residential mortgage-backed security
|
78,997
|
(777
|
)
|
2,361
|
(22
|
)
|
81,358
|
(799
|
)
|
|||||||||||||||
|
Residential collateralized mortgage obligation
|
7,890
|
(89
|
)
|
13,878
|
(252
|
)
|
21,768
|
(341
|
)
|
|||||||||||||||
|
Commercial mortgage backed security
|
14,794
|
(111
|
)
|
-
|
-
|
14,794
|
(111
|
)
|
||||||||||||||||
|
SBA pools
|
-
|
-
|
945
|
(4
|
)
|
945
|
(4
|
)
|
||||||||||||||||
|
Totals
|
$
|
135,959
|
$
|
(1,119
|
)
|
$
|
22,661
|
$
|
(300
|
)
|
$
|
158,620
|
$
|
(1,419
|
)
|
|||||||||
As of December 31, 2015 and 2014 there were no held to maturity investment securities in an unrealized loss position.
As of December 31, 2015, the Company’s security portfolio consisted of 92 securities, 60 of which were in an unrealized loss position. As of
December 31, 2015, $258.9 million in investment securities had unrealized losses with aggregate depreciation of 1.23% of the Company’s amortized cost basis. Of these securities, $65.7 million had a continuous unrealized loss position for twelve months or longer with an aggregate depreciation of 1.86%. The unrealized losses in all security categories relate principally to the general change in interest rates and illiquidity, and not credit quality, that has occurred since the securities purchase dates, and such unrecognized losses or gains will continue to vary with general interest rate level fluctuations in the future. The Company utilizes several external sources to evaluate prepayments, delinquencies, loss severity, and other factors in determining if there is impairment on an individual security. As management does not intend to sell the securities, and it is likely that it will not be required to sell the securities before their anticipated recovery, no declines are deemed to be other than temporary.
The amortized cost and fair value of investment securities, as of December 31, 2015, by contractual maturity are shown below. Maturities may differ from contractual maturities because borrowers may have the right to call or prepay obligations with or without penalties.
|
Available for Sale
|
Held to Maturity
|
|||||||||||||||
|
Amortized
Cost
|
Fair Value
|
Amortized
Cost
|
Fair Value
|
|||||||||||||
|
December 31, 2015
|
(In thousands)
|
|||||||||||||||
|
One year or less
|
$
|
10,777
|
$
|
10,761
|
$
|
-
|
$
|
-
|
||||||||
|
One to five years
|
20,938
|
20,877
|
-
|
-
|
||||||||||||
|
Five to ten years
|
41,215
|
41,202
|
-
|
-
|
||||||||||||
|
Over ten years
|
41,190
|
40,563
|
8,986
|
8,988
|
||||||||||||
|
Subtotal
|
114,120
|
113,403
|
8,986
|
8,988
|
||||||||||||
|
Residential mortgage-backed security
|
123,055
|
121,597
|
-
|
-
|
||||||||||||
|
Residential collateralized mortgage obligation
|
40,305
|
39,921
|
-
|
-
|
||||||||||||
|
Commercial mortgage backed security
|
41,341
|
41,119
|
||||||||||||||
|
Total
|
$
|
318,821
|
$
|
316,040
|
$
|
8,986
|
$
|
8,988
|
||||||||
Securities with carrying amounts of $91.7 million and $78.5 million as of December 31, 2015 and 2014, respectively, were pledged as collateral on public deposits and for other purposes as required or permitted by law.
Note 4. Loans and Allowance for Loan Losses
As of December 31, 2015 and 2014, loans consisted of:
|
December 31,
|
||||||||
|
2015
|
2014
|
|||||||
|
(In thousands)
|
||||||||
|
Commercial
|
$
|
92,995
|
$
|
108,309
|
||||
|
Commercial real estate
|
371,599
|
366,199
|
||||||
|
Residential real estate
|
258,606
|
305,744
|
||||||
|
Construction real estate
|
89,341
|
100,178
|
||||||
|
Installment and other
|
28,730
|
31,768
|
||||||
|
Total loans
|
841,271
|
912,198
|
||||||
|
Unearned income
|
(1,483
|
)
|
(1,651
|
)
|
||||
|
Gross loans
|
839,788
|
910,547
|
||||||
|
Allowance for loan losses
|
(17,392
|
)
|
(24,783
|
)
|
||||
|
Net loans
|
$
|
822,396
|
$
|
885,764
|
||||
Loan Origination/Risk Management.
The Company has certain lending policies and procedures in place that are designed to maximize loan income within an acceptable level of risk. Management and the Board of Directors review and approve these policies and procedures. A reporting system supplements the review process by providing management with reports related to loan production, loan quality, concentrations of credit, loan delinquencies and non-performing and potential problem loans. Management has identified the following categories in its loan portfolios:
Commercial loans:
These loans are underwritten after evaluating and understanding the borrower’s ability to operate profitably and prudently expand its business. Underwriting standards are designed to promote relationship banking rather than transactional banking. Management examines current and projected cash flows to determine the ability of the borrower to repay their obligations as agreed. Commercial loans are primarily made based on the identified cash flows of the borrower and secondarily on the underlying collateral provided by the borrower. The cash flows of borrowers, however, may not be as expected and the collateral securing these loans may fluctuate in value. Most commercial and industrial loans are secured by the assets being financed or other business assets such as accounts receivable or inventory and may incorporate a personal guarantee; however, some short-term loans may be made on an unsecured basis. In the case of loans secured by accounts receivable, the availability of funds for the repayment of these loans may be substantially dependent on the ability of the borrower to collect amounts due from its customers.
Commercial real estate loans:
These loans are subject to underwriting standards and processes similar to commercial loans, in addition to those of other real estate loans. These loans are viewed primarily as cash flow loans and secondarily as loans secured by real estate. Commercial real estate lending typically involves higher original amounts than other types of loans and the repayment of these loans is generally dependent on the successful operation of the property securing the loan or the business conducted on the property securing the loan. Commercial real estate loans may be more adversely affected by conditions in the real estate markets or in the general economy. The properties securing the Company’s commercial real estate portfolio are geographically concentrated in the markets in which the Company operates. Management monitors and evaluates commercial real estate loans based on collateral, location and risk grade criteria. The Company also utilizes third-party sources to provide insight and guidance about economic conditions and trends affecting market areas it serves. In addition, management tracks the level of owner-occupied commercial real estate loans versus non-owner occupied loans. As of December 31, 2015 and 2014, 28.4% and 33.1%, respectively, of the outstanding principal balances of the Company’s commercial real estate loans were secured by owner-occupied properties.
With respect to loans to developers and builders that are secured by non-owner occupied properties that the Company may originate from time to time, the Company generally requires the borrower to have had an existing relationship with the Company and have a proven record of success.
Construction real estate loans:
These loans are underwritten utilizing feasibility studies, independent appraisal reviews, sensitivity analysis of absorption and lease rates and financial analysis of the developers and property owners. Construction real estate loans are generally based upon estimates of costs and values associated with the completed project and often involve the disbursement of substantial funds with repayment substantially dependent on the success of the ultimate project. Sources of repayment for these types of loans may be pre-committed permanent loans from approved long-term lenders, sales of developed property or an interim loan commitment from the Company until permanent financing is obtained. These loans are monitored by on-site inspections and are considered to have higher risks than other real estate loans due to their ultimate repayment being sensitive to interest rate changes, governmental regulation of real property, general economic conditions and the availability of long-term financing.
Residential real estate loans:
Underwriting standards for residential real estate and home equity loans are heavily influenced by statutory requirements, which include, but are not limited to, maximum loan-to-value levels, debt-to-income levels, collection remedies, the number of such loans a borrower can have at one time and documentation requirements.
Installment loans:
The Company originates consumer loans utilizing a credit scoring analysis to supplement the underwriting process. To monitor and manage consumer loan risk, policies and procedures are developed and modified, as needed. This activity, coupled with relatively small loan amounts that are spread across many individual borrowers, minimizes risk. Additionally, trend and outlook reports are reviewed by management on a regular basis.
The loan review process complements and reinforces the risk identification and assessment decisions made by lenders and credit personnel, as well as the Company’s policies and procedures, which include periodic internal reviews and reports to identify and address risk factors developing within the loan portfolio. The Company engages external independent loan reviews that assess and validate the credit risk program on a periodic basis. Results of these reviews are presented to management and the Board of Directors.
The following table presents the contractual aging of the recorded investment in current and past due loans by class of loans as of December 31, 2015 and 2014, including nonaccrual loans:
|
Current
|
30-59 Days
Past Due
|
60-89 Days
Past Due
|
Loans past
due 90 days
or more
|
Total Past
Due
|
Total
|
|||||||||||||||||||
|
(In thousands)
|
||||||||||||||||||||||||
|
December 31, 2015
|
||||||||||||||||||||||||
|
Commercial
|
$
|
90,839
|
$
|
167
|
$
|
131
|
$
|
1,858
|
$
|
2,156
|
$
|
92,995
|
||||||||||||
|
Commercial real estate
|
363,495
|
1,526
|
704
|
5,874
|
8,104
|
371,599
|
||||||||||||||||||
|
Residential real estate
|
252,568
|
1,215
|
606
|
4,217
|
6,038
|
258,606
|
||||||||||||||||||
|
Construction real estate
|
80,629
|
291
|
85
|
8,336
|
8,712
|
89,341
|
||||||||||||||||||
|
Installment and other
|
28,534
|
110
|
12
|
74
|
196
|
28,730
|
||||||||||||||||||
|
Total loans
|
$
|
816,065
|
$
|
3,309
|
$
|
1,538
|
$
|
20,359
|
$
|
25,206
|
$
|
841,271
|
||||||||||||
|
Nonaccrual loan classification
|
$
|
6,202
|
$
|
2,702
|
$
|
1,418
|
$
|
20,003
|
$
|
24,123
|
$
|
30,325
|
||||||||||||
|
December 31, 2014
|
||||||||||||||||||||||||
|
Commercial
|
$
|
106,847
|
$
|
380
|
$
|
352
|
$
|
730
|
$
|
1,462
|
$
|
108,309
|
||||||||||||
|
Commercial real estate
|
356,062
|
389
|
-
|
9,748
|
10,137
|
366,199
|
||||||||||||||||||
|
Residential real estate
|
299,250
|
737
|
235
|
5,522
|
6,494
|
305,744
|
||||||||||||||||||
|
Construction real estate
|
87,989
|
5,882
|
-
|
6,307
|
12,189
|
100,178
|
||||||||||||||||||
|
Installment and other
|
31,628
|
132
|
4
|
4
|
140
|
31,768
|
||||||||||||||||||
|
Total loans
|
$
|
881,776
|
$
|
7,520
|
$
|
591
|
$
|
22,311
|
$
|
30,422
|
$
|
912,198
|
||||||||||||
|
Nonaccrual loan classification
|
$
|
24,124
|
$
|
1,195
|
$
|
587
|
$
|
21,950
|
$
|
23,732
|
$
|
47,856
|
||||||||||||
The following table presents the recorded investment in nonaccrual loans and loans past due ninety days or more and still accruing by class of loans as of December 31, 2015 and 2014:
|
December 31,
|
||||||||||||||||
|
2015
|
2014
|
|||||||||||||||
|
Nonaccrual
|
Loans past
due 90 days
or more and
still accruing
interest
|
Nonaccrual
|
Loans past
due 90 days
or more and
still accruing
interest
|
|||||||||||||
|
(In thousands)
|
||||||||||||||||
|
Commercial
|
$
|
2,268
|
$
|
-
|
$
|
3,697
|
$
|
-
|
||||||||
|
Commercial real estate
|
10,737
|
-
|
22,296
|
-
|
||||||||||||
|
Residential real estate
|
7,821
|
-
|
11,046
|
361
|
||||||||||||
|
Construction real estate
|
9,353
|
-
|
10,565
|
-
|
||||||||||||
|
Installment and other
|
146
|
-
|
252
|
-
|
||||||||||||
|
Total
|
$
|
30,325
|
$
|
-
|
$
|
47,856
|
$
|
361
|
||||||||
The Company utilizes an internal asset classification system as a means of reporting problem and potential problem loans. Under the Company’s risk rating system, problem and potential problem loans are classified as “Special Mention,” “Substandard,” and “Doubtful.” Substandard loans include those characterized by the likelihood that the Company will sustain some loss if the deficiencies are not corrected. Loans classified as Doubtful have all the weaknesses inherent in those classified as Substandard with the added characteristic that the weaknesses present make collection or liquidation in full, on the basis of currently existing facts, conditions and values, highly questionable and improbable. Loans that do not currently expose the Company to sufficient risk to warrant classification in one of the aforementioned categories, but possess weaknesses that deserve management’s close attention are deemed to be Special Mention. Any time a situation warrants, the risk rating may be reviewed.
Loans not meeting the criteria above that are analyzed individually are considered to be pass-rated loans. The following table presents the risk category by class of loans based on the most recent analysis performed and the contractual aging as of December 31, 2015 and 2014:
|
Pass
|
Special
Mention
|
Substandard
|
Doubtful
|
Total
|
||||||||||||||||
|
(In thousands)
|
||||||||||||||||||||
|
December 31, 2015
|
||||||||||||||||||||
|
Commercial
|
$
|
69,221
|
$
|
3,129
|
$
|
20,645
|
$
|
-
|
$
|
92,995
|
||||||||||
|
Commercial real estate
|
307,700
|
19,512
|
44,387
|
-
|
371,599
|
|||||||||||||||
|
Residential real estate
|
245,897
|
1,622
|
11,087
|
-
|
258,606
|
|||||||||||||||
|
Construction real estate
|
71,864
|
6,667
|
10,810
|
-
|
89,341
|
|||||||||||||||
|
Installment and other
|
28,378
|
2
|
350
|
-
|
28,730
|
|||||||||||||||
|
Total
|
$
|
723,060
|
$
|
30,932
|
$
|
87,279
|
$
|
-
|
$
|
841,271
|
||||||||||
|
December 31, 2014
|
||||||||||||||||||||
|
Commercial
|
$
|
66,050
|
$
|
14,889
|
$
|
27,128
|
$
|
242
|
$
|
108,309
|
||||||||||
|
Commercial real estate
|
282,279
|
22,222
|
61,698
|
-
|
366,199
|
|||||||||||||||
|
Residential real estate
|
287,616
|
2,403
|
15,725
|
-
|
305,744
|
|||||||||||||||
|
Construction real estate
|
71,678
|
12,683
|
15,817
|
-
|
100,178
|
|||||||||||||||
|
Installment and other
|
30,762
|
116
|
890
|
-
|
31,768
|
|||||||||||||||
|
Total
|
$
|
738,385
|
$
|
52,313
|
$
|
121,258
|
$
|
242
|
$
|
912,198
|
||||||||||
The following table shows all loans, including nonaccrual loans, by classification and aging, as of December 31, 2015 and 2014:
|
Pass
|
Special
Mention
|
Substandard
|
Doubtful
|
Total
|
||||||||||||||||
|
(In thousands)
|
||||||||||||||||||||
|
December 31, 2015
|
||||||||||||||||||||
|
Current
|
$
|
719,752
|
$
|
30,674
|
$
|
65,639
|
$
|
-
|
$
|
816,065
|
||||||||||
|
Past due 30-59 days
|
349
|
258
|
2,702
|
-
|
3,309
|
|||||||||||||||
|
Past due 60-89 days
|
109
|
-
|
1,429
|
-
|
1,538
|
|||||||||||||||
|
Past due 90 days or more
|
2,850
|
-
|
17,509
|
-
|
20,359
|
|||||||||||||||
|
Total
|
$
|
723,060
|
$
|
30,932
|
$
|
87,279
|
$
|
-
|
$
|
841,271
|
||||||||||
|
December 31, 2014
|
||||||||||||||||||||
|
Current
|
$
|
731,941
|
$
|
52,313
|
$
|
97,425
|
$
|
97
|
$
|
881,776
|
||||||||||
|
Past due 30-59 days
|
6,079
|
-
|
1,441
|
-
|
7,520
|
|||||||||||||||
|
Past due 60-89 days
|
4
|
-
|
587
|
-
|
591
|
|||||||||||||||
|
Past due 90 days or more
|
361
|
-
|
21,805
|
145
|
22,311
|
|||||||||||||||
|
Total
|
$
|
738,385
|
$
|
52,313
|
$
|
121,258
|
$
|
242
|
$
|
912,198
|
||||||||||
As of December 31, 2015, nonaccrual loans totaling $27.5 million were classified as Substandard. As of December 31, 2014, nonaccrual loans totaling $47.6 million were classified as Substandard and $242 thousand were classified as Doubtful.
The following table presents loans individually evaluated for impairment by class of loans as of December 31, 2015 and 2014, showing the unpaid principal balance, the recorded investment of the loan (reflecting any loans with partial charge-offs), and the amount of allowance for loan losses specifically allocated for these impaired loans (if any):
|
December 31,
|
||||||||||||||||||||||||
|
2015
|
2014
|
|||||||||||||||||||||||
|
Unpaid
Principal
Balance
|
Recorded
Investment
|
Allowance for
Loan Losses
Allocated
|
Unpaid
Principal
Balance
|
Recorded
Investment
|
Allowance
for Loan
Losses
Allocated
|
|||||||||||||||||||
|
(In thousands)
|
||||||||||||||||||||||||
|
With no related allowance recorded:
|
||||||||||||||||||||||||
|
Commercial
|
$
|
13,611
|
$
|
10,137
|
$
|
-
|
$
|
16,401
|
$
|
11,936
|
$
|
-
|
||||||||||||
|
Commercial real estate
|
15,872
|
14,198
|
-
|
25,737
|
22,554
|
-
|
||||||||||||||||||
|
Residential real estate
|
9,473
|
7,450
|
-
|
10,132
|
8,707
|
-
|
||||||||||||||||||
|
Construction real estate
|
9,816
|
8,137
|
-
|
12,219
|
9,685
|
-
|
||||||||||||||||||
|
Installment and other
|
433
|
416
|
-
|
791
|
752
|
-
|
||||||||||||||||||
|
With an allowance recorded:
|
||||||||||||||||||||||||
|
Commercial
|
14,958
|
14,956
|
399
|
15,924
|
15,918
|
877
|
||||||||||||||||||
|
Commercial real estate
|
11,050
|
11,050
|
1,295
|
18,298
|
17,081
|
2,111
|
||||||||||||||||||
|
Residential real estate
|
10,759
|
10,755
|
2,132
|
14,571
|
14,500
|
3,450
|
||||||||||||||||||
|
Construction real estate
|
3,688
|
3,688
|
252
|
6,953
|
6,953
|
1,416
|
||||||||||||||||||
|
Installment and other
|
636
|
636
|
138
|
743
|
743
|
107
|
||||||||||||||||||
|
Total
|
$
|
90,296
|
$
|
81,423
|
$
|
4,216
|
$
|
121,769
|
$
|
108,829
|
$
|
7,961
|
||||||||||||
The following table presents loans individually evaluated for impairment by class of loans for the years ended December 31, 2015, 2014 and 2013, showing the average recorded investment and the interest income recognized:
|
2015
|
2014
|
2013
|
||||||||||||||||||||||
|
Average
Recorded
Investment
|
Interest
Income
Recognized
|
Average
Recorded
Investment
|
Interest
Income
Recognized
|
Average
Recorded
Investment
|
Interest
Income
Recognized
|
|||||||||||||||||||
|
(In thousands)
|
||||||||||||||||||||||||
|
With no related allowance recorded:
|
||||||||||||||||||||||||
|
Commercial
|
$
|
11,037
|
$
|
553
|
$
|
12,571
|
$
|
533
|
$
|
12,978
|
$
|
548
|
||||||||||||
|
Commercial real estate
|
18,376
|
592
|
29,459
|
369
|
32,835
|
626
|
||||||||||||||||||
|
Residential real estate
|
8,079
|
79
|
10,585
|
248
|
13,305
|
99
|
||||||||||||||||||
|
Construction real estate
|
8,911
|
196
|
10,685
|
162
|
14,610
|
126
|
||||||||||||||||||
|
Installment and other
|
584
|
65
|
947
|
81
|
1,150
|
32
|
||||||||||||||||||
|
With an allowance recorded:
|
||||||||||||||||||||||||
|
Commercial
|
15,437
|
804
|
15,921
|
832
|
18,293
|
854
|
||||||||||||||||||
|
Commercial real estate
|
14,066
|
468
|
19,791
|
591
|
24,031
|
881
|
||||||||||||||||||
|
Residential real estate
|
12,628
|
349
|
13,821
|
379
|
11,918
|
430
|
||||||||||||||||||
|
Construction real estate
|
5,321
|
157
|
6,296
|
210
|
5,692
|
261
|
||||||||||||||||||
|
Installment and other
|
690
|
20
|
835
|
27
|
953
|
35
|
||||||||||||||||||
|
Total
|
$
|
95,129
|
$
|
3,283
|
$
|
120,911
|
$
|
3,432
|
$
|
135,765
|
$
|
3,892
|
||||||||||||
If nonaccrual loans outstanding had been current in accordance with their original terms, approximately $1.7 million, $3.0 million and $2.6 million would have been recorded as loan interest income during the years ended December 31, 2015, 2014 and 2013, respectively. Interest income recognized in the above table was primarily recognized on a cash basis.
Recorded investment balances in the above tables exclude accrued interest income and unearned income as such amounts were immaterial.
Allowance for Loan Losses:
For the years ended December 31, 2015, 2014 and 2013, activity in the allowance for loan losses was as follows:
|
Commercial
|
Commercial
real estate
|
Residential
real estate
|
Construction
real estate
|
Installment
and other
|
Unallocated
|
Total
|
||||||||||||||||||||||
|
(In thousands)
|
||||||||||||||||||||||||||||
|
Year Ended December 31, 2015
|
||||||||||||||||||||||||||||
|
Beginning balance
|
$
|
4,031
|
$
|
8,339
|
$
|
7,939
|
$
|
3,323
|
$
|
788
|
$
|
363
|
$
|
24,783
|
||||||||||||||
|
Provision (benefit) for loan losses
|
(1,146
|
)
|
2,635
|
(80
|
)
|
(1,081
|
)
|
501
|
(329
|
)
|
500
|
|||||||||||||||||
|
Charge-offs
|
(1,919
|
)
|
(4,731
|
)
|
(2,297
|
)
|
(1,570
|
)
|
(642
|
)
|
-
|
(11,159
|
)
|
|||||||||||||||
|
Recoveries
|
1,476
|
508
|
520
|
471
|
293
|
-
|
3,268
|
|||||||||||||||||||||
|
Net charge-offs
|
(443
|
)
|
(4,223
|
)
|
(1,777
|
)
|
(1,099
|
)
|
(349
|
)
|
-
|
(7,891
|
)
|
|||||||||||||||
|
Ending balance
|
$
|
2,442
|
$
|
6,751
|
$
|
6,082
|
$
|
1,143
|
$
|
940
|
$
|
34
|
$
|
17,392
|
||||||||||||||
|
Year Ended December 31, 2014
|
||||||||||||||||||||||||||||
|
Beginning balance
|
$
|
3,958
|
$
|
10,699
|
$
|
8,162
|
$
|
4,658
|
$
|
1,199
|
$
|
(318
|
)
|
$
|
28,358
|
|||||||||||||
|
Provision (benefit) for loan losses
|
1,516
|
(334
|
)
|
1,571
|
(1,504
|
)
|
70
|
681
|
2,000
|
|||||||||||||||||||
|
Charge-offs
|
(2,261
|
)
|
(2,772
|
)
|
(2,463
|
)
|
(285
|
)
|
(631
|
)
|
-
|
(8,412
|
)
|
|||||||||||||||
|
Recoveries
|
818
|
746
|
669
|
454
|
150
|
-
|
2,837
|
|||||||||||||||||||||
|
Net charge-offs
|
(1,443
|
)
|
(2,026
|
)
|
(1,794
|
)
|
169
|
(481
|
)
|
-
|
(5,575
|
)
|
||||||||||||||||
|
Ending balance
|
$
|
4,031
|
$
|
8,339
|
$
|
7,939
|
$
|
3,323
|
$
|
788
|
$
|
363
|
$
|
24,783
|
||||||||||||||
|
Year Ended December 31, 2013
|
||||||||||||||||||||||||||||
|
Beginning balance
|
$
|
7,085
|
$
|
12,587
|
$
|
9,037
|
$
|
5,575
|
$
|
1,643
|
$
|
(294
|
)
|
$
|
35,633
|
|||||||||||||
|
Provision (benefit) for loan losses
|
(1,861
|
)
|
1,118
|
1,136
|
(741
|
)
|
372
|
(24
|
)
|
-
|
||||||||||||||||||
|
Charge-offs
|
(2,028
|
)
|
(3,296
|
)
|
(2,447
|
)
|
(471
|
)
|
(929
|
)
|
-
|
(9,171
|
)
|
|||||||||||||||
|
Recoveries
|
762
|
290
|
436
|
295
|
113
|
-
|
1,896
|
|||||||||||||||||||||
|
Net charge-offs
|
(1,266
|
)
|
(3,006
|
)
|
(2,011
|
)
|
(176
|
)
|
(816
|
)
|
-
|
(7,275
|
)
|
|||||||||||||||
|
Ending balance
|
$
|
3,958
|
$
|
10,699
|
$
|
8,162
|
$
|
4,658
|
$
|
1,199
|
$
|
(318
|
)
|
$
|
28,358
|
|||||||||||||
Allocation of the allowance for loan losses (as well as the total loans in each allocation method), disaggregated on the basis of the Company’s impairment methodology, is as follows:
|
Commercial
|
Commercial
real estate
|
Residential
real estate
|
Construction
real estate
|
Installment
and other
|
Unallocated
|
Total
|
||||||||||||||||||||||
|
December 31, 2015
|
(In thousands)
|
|||||||||||||||||||||||||||
|
Allowance for loan losses allocated to:
|
||||||||||||||||||||||||||||
|
Loans individually evaluated for impairment
|
$
|
399
|
$
|
1,295
|
$
|
2,132
|
$
|
252
|
$
|
138
|
$
|
-
|
$
|
4,216
|
||||||||||||||
|
Loans collectively evaluated for impairment
|
2,043
|
5,456
|
3,950
|
891
|
802
|
34
|
13,176
|
|||||||||||||||||||||
|
Ending balance
|
$
|
2,442
|
$
|
6,751
|
$
|
6,082
|
$
|
1,143
|
$
|
940
|
$
|
34
|
$
|
17,392
|
||||||||||||||
|
Loans:
|
||||||||||||||||||||||||||||
|
Individually evaluated for impairment
|
$
|
25,093
|
$
|
25,248
|
$
|
18,205
|
$
|
11,825
|
$
|
1,052
|
$
|
-
|
$
|
81,423
|
||||||||||||||
|
Collectively evaluated for impairment
|
67,902
|
346,351
|
240,401
|
77,516
|
27,678
|
-
|
759,848
|
|||||||||||||||||||||
|
Total ending loans balance
|
$
|
92,995
|
$
|
371,599
|
$
|
258,606
|
$
|
89,341
|
$
|
28,730
|
$
|
-
|
$
|
841,271
|
||||||||||||||
|
December 31, 2014
|
||||||||||||||||||||||||||||
|
Allowance for loan losses allocated to:
|
||||||||||||||||||||||||||||
|
Loans individually evaluated for impairment
|
$
|
877
|
$
|
2,111
|
$
|
3,450
|
$
|
1,416
|
$
|
107
|
$
|
-
|
$
|
7,961
|
||||||||||||||
|
Loans collectively evaluated for impairment
|
3,154
|
6,228
|
4,489
|
1,907
|
681
|
363
|
16,822
|
|||||||||||||||||||||
|
Ending balance
|
$
|
4,031
|
$
|
8,339
|
$
|
7,939
|
$
|
3,323
|
$
|
788
|
$
|
363
|
$
|
24,783
|
||||||||||||||
|
Loans:
|
||||||||||||||||||||||||||||
|
Individually evaluated for impairment
|
$
|
27,854
|
$
|
39,635
|
$
|
23,207
|
$
|
16,638
|
$
|
1,495
|
$
|
-
|
$
|
108,829
|
||||||||||||||
|
Collectively evaluated for impairment
|
80,455
|
326,564
|
282,537
|
83,540
|
30,273
|
-
|
803,369
|
|||||||||||||||||||||
|
Total ending loans balance
|
$
|
108,309
|
$
|
366,199
|
$
|
305,744
|
$
|
100,178
|
$
|
31,768
|
$
|
-
|
$
|
912,198
|
||||||||||||||
In order to determine whether a borrower is experiencing financial difficulty, an evaluation is performed of the probability that the borrower will be in payment default on any of its debt in the foreseeable future without the modification. The evaluation is performed under the Company’s internal underwriting policy.
TDRs are defined as those loans where: (1) the borrower is experiencing financial difficulties and (2) the restructuring includes a concession by the Bank to the borrower that the Bank would not otherwise consider.
The following loans were restructured during the years ended December 31, 2015, 2014, and 2013:
|
Number of
Contracts
|
Pre-
Modification
Outstanding
Recorded
Investment
|
Post-
Modification
Outstanding
Recorded
Investment
|
Specific
reserves
allocated
|
|||||||||||||
|
(Dollars in thousands)
|
||||||||||||||||
|
December 31, 2015
|
||||||||||||||||
|
Residential real estate
|
1
|
$
|
82
|
$
|
82
|
$
|
-
|
|||||||||
|
Construction real estate
|
2
|
831
|
831
|
11
|
||||||||||||
|
Installment and other
|
4
|
82
|
82
|
3
|
||||||||||||
|
Total
|
7
|
$
|
995
|
$
|
995
|
$
|
14
|
|||||||||
|
December 31, 2014
|
||||||||||||||||
|
Commercial
|
3
|
$
|
221
|
$
|
90
|
$
|
1
|
|||||||||
|
Commercial real estate
|
2
|
1,408
|
1,408
|
56
|
||||||||||||
|
Residential real estate
|
6
|
498
|
493
|
21
|
||||||||||||
|
Construction real estate
|
2
|
410
|
410
|
1
|
||||||||||||
|
Installment and other
|
4
|
76
|
49
|
9
|
||||||||||||
|
Total
|
17
|
$
|
2,613
|
$
|
2,450
|
$
|
88
|
|||||||||
|
December 31, 2013
|
||||||||||||||||
|
Commercial
|
12
|
$
|
1,654
|
$
|
1,587
|
$
|
11
|
|||||||||
|
Commercial real estate
|
10
|
15,531
|
15,006
|
265
|
||||||||||||
|
Residential real estate
|
17
|
3,062
|
2,879
|
373
|
||||||||||||
|
Construction real estate
|
3
|
524
|
514
|
10
|
||||||||||||
|
Installment and other
|
12
|
216
|
216
|
10
|
||||||||||||
|
Total
|
54
|
$
|
20,987
|
$
|
20,202
|
$
|
669
|
|||||||||
The following table presents loans by class modified as TDRs for which there was a payment default within twelve months following the modification during the years ended December 31, 2015, 2014, and 2013:
|
Number of
Contracts
|
Recorded
Investment
|
Specific
reserves
allocated
|
||||||||||
|
(Dollars in thousands)
|
||||||||||||
|
TDRs that subsequently defaulted:
|
2015
|
|||||||||||
|
Construction real estate
|
2
|
$
|
831
|
$
|
11
|
|||||||
|
Total
|
2
|
$
|
831
|
$
|
11
|
|||||||
|
TDRs that subsequently defaulted:
|
2014
|
|||||||||||
|
Residential real estate
|
1
|
$
|
168
|
$
|
-
|
|||||||
|
Total
|
1
|
$
|
168
|
$
|
-
|
|||||||
|
TDRs that subsequently defaulted:
|
2013
|
|||||||||||
|
Commercial
|
4
|
$
|
236
|
$
|
4
|
|||||||
|
Commercial real estate
|
7
|
10,319
|
-
|
|||||||||
|
Residential real estate
|
7
|
1,421
|
28
|
|||||||||
|
Construction real estate
|
1
|
227
|
-
|
|||||||||
|
Installment and other
|
1
|
22
|
4
|
|||||||||
|
Total
|
20
|
$
|
12,225
|
$
|
36
|
|||||||
The following table presents total TDRs, both in accrual and nonaccrual status, as of December 31, 2015, 2014, and 2013:
|
December 31,
|
||||||||||||||||||||||||
|
2015
|
2014
|
2013
|
||||||||||||||||||||||
|
Number of
Contracts
|
Amount
|
Number of
Contracts
|
Amount
|
Number of
Contracts
|
Amount
|
|||||||||||||||||||
|
(Dollars in thousands)
|
||||||||||||||||||||||||
|
Accrual
|
165
|
$
|
53,862
|
188
|
$
|
60,973
|
214
|
$
|
80,873
|
|||||||||||||||
|
Nonaccrual
|
32
|
10,641
|
61
|
27,394
|
78
|
30,957
|
||||||||||||||||||
|
Total TDRs
|
197
|
$
|
64,503
|
249
|
$
|
88,367
|
292
|
$
|
111,830
|
|||||||||||||||
As of December 31, 2015, the Bank had a total of $194 thousand in commitments to lend additional funds on six commercial loans classified as TDRs.
Impairment analyses are prepared on TDRs in conjunction with the normal allowance for loan loss process. TDRs required a specific reserve of $14 thousand, $88 thousand, and $669 thousand which was included in the allowance for loan losses at the years ended December 31, 2015, 2014, and 2013, respectively. TDRs resulted in charge-offs of $2.8 million, $2.75 million, and $626 thousand during the years ended December 31, 2015, 2014, and 2013, respectively. The TDRs that subsequently defaulted required a provision of $11 thousand, $0, and $36 thousand to the allowance for loan losses for the years ended December 31, 2015, 2014, and 2013 respectively.
Loan principal balances to executive officers and directors of the Company were $1.9 million and $1.3 million as of December 31, 2015 and 2014, respectively. Total credit available, including companies in which these individuals have management control or beneficial ownership, was $2.3 million and $2.2 million as of December 31, 2015 and 2014, respectively. An analysis of the activity related to these loans as of December 31, 2015 and 2014 is as follows:
|
December 31,
|
||||||||
|
2015
|
2014
|
|||||||
|
(In thousands)
|
||||||||
|
Balance, beginning
|
$
|
1,322
|
$
|
271
|
||||
|
Additions
|
438
|
470
|
||||||
|
Changes in Board composition
|
800
|
643
|
||||||
|
Principal payments and other reductions
|
(627
|
)
|
(62
|
)
|
||||
|
Balance, ending
|
$
|
1,933
|
$
|
1,322
|
||||
Note 5. Loan Servicing and Mortgage Servicing Rights
Mortgage loans serviced for others are not included in the accompanying consolidated balance sheets. The unpaid balance of these loans as of December 31, 2015 and 2014 is summarized as follows:
|
December 31,
|
||||||||
|
2015
|
2014
|
|||||||
|
(In thousands)
|
||||||||
|
Mortgage loan portfolios serviced for:
|
||||||||
|
Federal National Mortgage Association ("Fannie Mae")
|
$
|
865,568
|
$
|
918,658
|
||||
|
Other investors
|
16
|
66
|
||||||
|
Totals
|
$
|
865,584
|
$
|
918,724
|
||||
During the years ended December 31, 2015, 2014 and 2013, substantially all of the loans serviced for others had a contractual servicing fee of 0.25% on the unpaid principal balance. These fees are recorded as “mortgage loan servicing fees” under “noninterest income” on the consolidated statements of operations.
Late fees on the loans serviced for others totaled $182 thousand, $191 thousand and $225 thousand during the years ended December 31, 2015, 2014 and 2013, respectively. These fees are included in “noninterest income” on the consolidated statements of operations.
Custodial balances on deposit at the Bank in connection with the foregoing loan servicing were approximately $6.1 million and $5.4 million as of December 31, 2015 and 2014, respectively. There were no custodial balances on deposit with other financial institutions as of December 31, 2015 and 2014.
An analysis of changes in the MSR asset for the years ended December 31, 2015, 2014 and 2013 follows:
|
Year Ended December 31,
|
||||||||||||
|
2015
|
2014
|
2013
|
||||||||||
|
(In thousands)
|
||||||||||||
|
Balance at beginning of period
|
$
|
9,470
|
$
|
10,336
|
$
|
10,313
|
||||||
|
Servicing rights originated and capitalized
|
822
|
810
|
1,563
|
|||||||||
|
Amortization
|
(1,515
|
)
|
(1,676
|
)
|
(1,540
|
)
|
||||||
|
Balance at end of period
|
$
|
8,777
|
$
|
9,470
|
$
|
10,336
|
||||||
Below is an analysis of changes in the MSR asset valuation allowance for the years ended December 31, 2015, 2014 and 2013:
|
Year Ended December 31,
|
||||||||||||
|
2015
|
2014
|
2013
|
||||||||||
|
(In thousands)
|
||||||||||||
|
Balance at beginning of period
|
$
|
(2,017
|
)
|
$
|
(2,021
|
)
|
$
|
(3,342
|
)
|
|||
|
Aggregate reduction credited to operations
|
2,644
|
1,373
|
2,890
|
|||||||||
|
Aggregate additions charged to operations
|
(2,522
|
)
|
(1,369
|
)
|
(1,569
|
)
|
||||||
|
Balance at end of period
|
$
|
(1,895
|
)
|
$
|
(2,017
|
)
|
$
|
(2,021
|
)
|
|||
The fair values of the MSRs were $6.9 million, $7.5 million and $8.3 million for the years ended December 31, 2015, 2014 and 2013, respectively.
A valuation allowance is used to recognize impairments of MSRs. An MSR is considered impaired when the fair value of the MSR is below the amortized book value of the MSR. MSRs are accounted for by risk tranche, with the interest rate and term of the underlying loan being the primary strata used in distinguishing the tranches. Each tranche is evaluated separately for impairment.
The following assumptions were used to calculate the fair value of the MSRs as of December 31, 2015, 2014 and 2013:
|
December 31,
|
||||||||||||
|
2015
|
2014
|
2013
|
||||||||||
|
Weighted Average Public Securities Association (PSA) speed
|
213.25
|
%
|
201.67
|
%
|
166.67
|
%
|
||||||
|
Weighted Average Discount rate
|
10.50
|
10.50
|
10.75
|
|||||||||
|
Weighted Average Earnings rate
|
1.73
|
1.77
|
1.79
|
|||||||||
Note 6. Other Real Estate Owned
OREO consists of property acquired due to foreclosure on real estate loans. As of December 31, 2015 and 2014, total OREO consisted of:
|
|
2015
|
2014
|
||||||
|
|
(In thousands)
|
|||||||
|
Commercial real estate
|
$
|
781
|
$
|
2,985
|
||||
|
Residential real estate
|
3,024
|
5,284
|
||||||
|
Construction real estate
|
4,541
|
5,711
|
||||||
|
Total
|
$
|
8,346
|
$
|
13,980
|
||||
The following table presents a summary of OREO activity for the years ended December 31, 2015 and 2014:
|
2015
|
2014
|
|||||||
|
(In thousands)
|
||||||||
|
Balance at beginning of period
|
$
|
13,980
|
$
|
14,002
|
||||
|
Transfers in at fair value
|
3,958
|
11,523
|
||||||
|
Write-down of value
|
(506
|
)
|
(2,730
|
)
|
||||
|
Gain (loss) on disposal
|
749
|
651
|
||||||
|
Cash received upon disposition
|
(7,989
|
)
|
(8,849
|
)
|
||||
|
Sales financed by loans
|
(1,846
|
)
|
(617
|
)
|
||||
|
Balance at end of period
|
$
|
8,346
|
$
|
13,980
|
||||
Note 7. Premises and Equipment
As of December 31, 2015 and 2014, premises and equipment consisted of:
|
December 31,
|
||||||||
|
2015
|
2014
|
|||||||
|
(In thousands)
|
||||||||
|
Land and land improvements
|
$
|
3,820
|
$
|
3,820
|
||||
|
Buildings
|
23,166
|
23,146
|
||||||
|
Furniture and equipment
|
31,846
|
32,145
|
||||||
|
Total
|
58,832
|
59,111
|
||||||
|
Accumulated depreciation
|
(35,459
|
)
|
(34,377
|
)
|
||||
|
Total less depreciation
|
$
|
23,373
|
$
|
24,734
|
||||
Depreciation on premises and equipment was $1.7 million, $2.4 million and $2.7 million for the years ended December 31, 2015, 2014 and 2013, respectively.
Note 8. Deposits
As of December 31, 2015 and 2014, deposits consisted of:
|
December 31,
|
||||||||
|
2015
|
2014
|
|||||||
|
(In thousands)
|
||||||||
|
Demand deposits, noninterest bearing
|
$
|
75,867
|
$
|
76,706
|
||||
|
NOW and money market accounts
|
511,423
|
430,708
|
||||||
|
Savings deposits
|
380,045
|
432,017
|
||||||
|
Time certificates, $250,000 or more
|
39,148
|
53,693
|
||||||
|
Other time certificates
|
247,475
|
289,468
|
||||||
|
Total
|
$
|
1,253,958
|
$
|
1,282,592
|
||||
As of December 31, 2015, the scheduled maturities of time certificates were as follows:
|
(In thousands)
|
||||
|
2016
|
$
|
227,583
|
||
|
2017
|
29,119
|
|||
|
2018
|
13,108
|
|||
|
2019
|
6,910
|
|||
|
2020
|
4,002
|
|||
|
Thereafter
|
5,901
|
|||
|
Total
|
$
|
286,623
|
||
Deposits from executive officers, directors and their affiliates as of December 31, 2015 and 2014 were $1.1 million and $874 thousand, respectively.
Note 9. Borrowings
Notes payable to the FHLB as of December 31, 2015 and 2014 were secured by a blanket assignment of mortgage loans or other collateral acceptable to FHLB, and generally had a fixed rate of interest, interest payable monthly and principal due at end of term, unless otherwise noted. As of December 31, 2015, no loans were pledged under the blanket assignment. However, investment securities are held in safekeeping at the FHLB with $2.3 million pledged as collateral for outstanding advances and letters of credit. An additional $112.6 million in advances is available based on the current value of the remaining unpledged investment securities.
The following table details borrowings as of December 31, 2015 and 2014.
|
Maturity Date
|
Rate
|
Type
|
Principal due
|
2015
|
2014
|
||||||||||
|
|
|
(In thousands)
|
|||||||||||||
|
March 23, 2015
|
3.050
|
%
|
Fixed
|
At maturity
|
$
|
-
|
$
|
20,000
|
|||||||
|
April 27, 2021
|
6.343
|
%
|
Fixed
|
At maturity
|
2,300
|
2,300
|
|||||||||
|
|
Total
|
$
|
2,300
|
$
|
22,300
|
||||||||||
Note 10. Junior Subordinated Debt
The following table presents details on the junior subordinated debt as of December 31, 2015:
|
Trust I
|
Trust III
|
Trust IV
|
Trust V
|
|||||||||||||
|
(Dollars in thousands)
|
||||||||||||||||
|
Date of Issue
|
March 23, 2000
|
May 11, 2004
|
June 29, 2005
|
September 21, 2006
|
||||||||||||
|
Amount of trust preferred securities issued
|
$
|
10,000
|
$
|
6,000
|
$
|
10,000
|
$
|
10,000
|
||||||||
|
Rate on trust preferred securities
|
10.875
|
%
|
3.3351% (variable)
|
6.88
|
%
|
2.162% (variable)
|
||||||||||
|
Maturity
|
March 8, 2030
|
September 8, 2034
|
November 23, 2035
|
December 15, 2036
|
||||||||||||
|
Date of first redemption
|
March 8, 2010
|
September 8, 2009
|
August 23, 2010
|
September 15, 2011
|
||||||||||||
|
Common equity securities issued
|
$
|
310
|
$
|
186
|
$
|
310
|
$
|
310
|
||||||||
|
Junior subordinated deferrable interest debentures owed
|
$
|
10,310
|
$
|
6,186
|
$
|
10,310
|
$
|
10,310
|
||||||||
|
Rate on junior subordinated deferrable interest debentures
|
10.875
|
%
|
3.3351% (variable)
|
6.88
|
%
|
2.162% (variable)
|
||||||||||
On the dates of issue indicated above, the Trusts, being Delaware statutory business trusts, issued trust preferred securities (the “trust preferred securities”) in the amount and at the rate indicated above. These securities represent preferred beneficial interests in the assets of the Trusts. The trust preferred securities will mature on the dates indicated, and are redeemable in whole or in part at the option of Trinity, with the approval of the FRB. The Trusts also issued common equity securities to Trinity in the amounts indicated above. The Trusts used the proceeds of the offering of the trust preferred securities to purchase junior subordinated deferrable interest debentures (the “debentures”) issued by Trinity, which have terms substantially similar to the trust preferred securities.
Trinity has the right to defer payments of interest on the debentures at any time or from time to time for a period of up to ten consecutive semi-annual periods (or twenty consecutive quarterly periods in the case of Trusts with quarterly interest payments) with respect to each interest payment deferred. During a period of deferral, unpaid accrued interest is compounded.
Under the terms of the debentures, under certain circumstances of default or if Trinity has elected to defer interest on the debentures, Trinity may not, with certain exceptions, declare or pay any dividends or distributions on its common stock or purchase or acquire any of its common stock.
In the second quarter of 2013, Trinity began to defer the interest payments on $37.1 million of junior subordinated debentures that are held by the Trusts that it controls. Interest accrued and unpaid to securities holders total $6.9 million and $4.3 million as of December 31, 2015 and 2014, respectively. As of September 30, 2016, the Company continued to defer the interest payments on the junior subordinated debentures, with interest accrued but unpaid totaling $9.1 million.
As of December 31, 2015 and 2014, the Company’s trust preferred securities, subject to certain limitations, qualified as Tier 1 Capital for regulatory capital purposes.
Payments of distributions on the trust preferred securities and payments on redemption of the trust preferred securities are guaranteed by Trinity. Trinity also entered into an agreement as to expenses and liabilities with the Trusts pursuant to which it agreed, on a subordinated basis, to pay any costs, expenses or liabilities of the Trusts other than those arising under the trust preferred securities. The obligations of Trinity under the junior subordinated debentures, the related indenture, the trust agreement establishing the Trusts, the guarantee and the agreement as to expenses and liabilities, in the aggregate, constitute a full and unconditional guarantee by Trinity of the Trusts’ obligations under the trust preferred securities.
Note 11. Description of Leasing Arrangements
The Company is leasing land in Santa Fe on which it built a bank office as well as the vacant land adjacent to the office. The construction of the office was completed in 2009. The original terms of the leases expired in May 2014 and are currently month-to-month. The leases contain both options to extend for additional five year terms and an option to purchase the land at a set price. Trinity was required to notify the landlord of its intent to exercise the options to purchase between December 1, 2014 and December 1, 2015 for the land on which the bank built its office and between May 1, 2014 and December 1, 2015 for the adjacent land. Trinity formally notified the landlord of its exercise of the options to purchase under the leases on April 24, 2015 and expects to complete the exercise or extend the lease in 2016. This lease is classified as a capital lease. The Company also holds two notes and mortgages on the land, and the interest payments received on the notes are approximately equal to the rental payments on the leases; and the principal due at maturity or upon transfer of the land, will largely offset the option purchase prices.
Operating lease payments for the years ended December 31, 2015, 2014 and 2013 totaled $272 thousand, $356 thousand and $507 thousand, respectively.
The lease payments under capital lease for 2015 totaled $161 thousand. These amounts were offset by the interest payments due on the notes.
Commitments for minimum future rentals under operating leases were as follows as of December 31, 2015:
|
Lease Payments under Operating Leases;
|
||||
|
|
||||
|
Year
|
(In thousands)
|
|||
|
2016
|
$
|
129
|
||
|
2017
|
114
|
|||
|
2018
|
5
|
|||
|
2019
|
7
|
|||
|
Thereafter
|
-
|
|||
|
Total
|
$
|
255
|
||
Note 12. Retirement Plans
The Company has an ESOP for the benefit of all employees who are at least 18 years of age and have completed 1,000 hours of service during the Plan year. The employee’s interest in the ESOP vests over a period of six years. The ESOP was established in January 1989 and is a defined contribution plan subject to the requirements of the Employee Retirement Income Security Act of 1974.
The ESOP is funded by discretionary contributions by the Company as determined by its Board of Directors. No expenses were recorded in 2015, 2014, or 2013.
All shares held by the ESOP, acquired prior to the issuance of ASC 718-40,
"Compensation—Stock Compensation-Employee Stock Ownership Plans”
are included in the computation of average common shares and common share equivalents. This accounting treatment is grandfathered for shares purchased prior to December 31, 1992. As permitted by ASC 718-40, compensation expense for shares released is equal to the original acquisition cost of the shares if acquired prior to December 31, 1992. As shares acquired after ASC 718-40 were released from collateral, the Company reported compensation expense equal to the current fair value of the shares, and the shares became outstanding for the earnings per share computations.
Shares of the Company held by the ESOP are as follows:
|
|
December 31,
|
|||||||
|
|
2015
|
2014
|
||||||
|
Shares acquired before December 31, 1992
|
215,369
|
215,503
|
||||||
|
Shares acquired after December 31, 1992
|
457,254
|
457,455
|
||||||
|
Total shares
|
672,623
|
672,958
|
||||||
There was no compensation expense recognized for ESOP shares acquired prior to December 31, 1992 during the years ended December 31, 2015, 2014 and 2013.
Under federal income tax regulations, the employer securities that are held by the Plan and its participants and that are not readily tradable on an established market or that are subject to trading limitations include a put option (liquidity put). The liquidity put is a right to demand that the Company buy shares of its stock held by the participant for which there is no readily available market. The put price is representative of the fair value of the stock. The Company may pay the purchase price over a five-year period. The purpose of the liquidity put is to ensure that the participant has the ability to ultimately obtain cash. The fair value of the allocated shares subject to repurchase was $2.7 million and $2.0 million as of December 31, 2015 and 2014, respectively.
The Company’s employees may also participate in a tax-deferred savings plan (401(k)) to which the Company does not contribute.
Note 13. Stock Incentives
The Trinity Capital Corporation 1998 Stock Option Plan (“1998 Plan”) and Trinity Capital Corporation 2005 Stock Incentive Plan (“2005 Plan”) were created for the benefit of key management and select employees. Under the 1998 Plan, 400,000 shares (as adjusted for the stock split on December 19, 2002) from shares held in treasury or authorized but unissued common stock were reserved for granting options. No further awards may be granted under the 1998 Plan. Under the 2005 Plan, 500,000 shares from shares held in treasury or authorized but unissued common stock were reserved for granting stock-based incentive awards. No further awards may be granted under the 2005 Plan.
Both of these plans were approved by the Company’s stockholders. The Compensation Committee determines the terms and conditions of the awards. At the Shareholder Meeting held on January 22, 2015, the Company’s stockholders approved
the Trinity Capital Corporation 2015 Long-Term Incentive Plan (“2015 Plan”). Under the 2015 Plan, 500,000 shares from shares held in treasury or authorized but unissued common stock are reserved for granting stock-based incentive awards. There were no awards issued under this plan in 2015.
Because share-based compensation awards vesting in the current periods were granted on a variety of dates, the assumptions are presented as weighted averages in those assumptions.
A summary of stock option and restricted stock unit (“RSU”) activity under the 1998 Plan and the 2005 Plan as of December 31, 2015 and 2014 is presented below:
|
|
Shares
|
Weighted-
Average
Exercise Price
|
Weighted-Average
Remaining
Contractual Term,
in years
|
Agregate
Intrinsic
Value
(in thousands) |
||||||||||||
|
Stock Options
|
||||||||||||||||
|
Outstanding as of January 1, 2015
|
14,000
|
30.50
|
0.70
|
-
|
||||||||||||
|
Forfeited or expired
|
(14,000
|
)
|
30.50
|
-
|
-
|
|||||||||||
|
Outstanding as of December 31, 2015
|
-
|
$
|
-
|
-
|
$
|
-
|
||||||||||
|
Vested as of December 31, 2015
|
-
|
$
|
-
|
-
|
$
|
-
|
||||||||||
|
|
Shares
|
Weighted-
Average Grant
Price
|
Weighted-Average
Remaining
Contractual Term,
in years
|
Agregate
Intrinsic
Value
(in thousands) |
||||||||||||
|
RSUs
|
||||||||||||||||
|
Outstanding as of January 1, 2015
|
11,765
|
4.25
|
1.50
|
50
|
||||||||||||
|
Granted
|
-
|
-
|
-
|
-
|
||||||||||||
|
Exercised
|
-
|
-
|
-
|
-
|
||||||||||||
|
Forfeited or expired
|
-
|
-
|
-
|
-
|
||||||||||||
|
Outstanding as of December 31, 2015
|
11,765
|
$
|
4.25
|
0.50
|
$
|
50
|
||||||||||
|
Vested as of December 31, 2015
|
-
|
$
|
-
|
-
|
$
|
-
|
||||||||||
There were no stock options exercised in 2015, 2014 or 2013.
As of December 31, 2015, there was $50 thousand in unrecognized compensation cost related to unvested share-based compensation awards granted under the 2005 Plan and the 1998 Plan. The cost will be recognized over the 2 year vesting period.
Note 14. Income Taxes
The current and deferred components of the provision (benefit) for income taxes for the years ended December 31, 2015, 2014 and 2013 are as follows:
|
|
Year Ended December 31,
|
|||||||||||
|
|
2015
|
2014
|
2013
|
|||||||||
|
|
(In thousands)
|
|||||||||||
|
Current provision (benefit) for income taxes
|
||||||||||||
|
Federal
|
$
|
-
|
$
|
-
|
$
|
-
|
||||||
|
State
|
-
|
-
|
-
|
|||||||||
|
Deferred provision (benefit) for income taxes
|
||||||||||||
|
Federal
|
(188
|
)
|
(1,621
|
)
|
3,996
|
|||||||
|
State
|
242
|
(206
|
)
|
324
|
||||||||
|
Change in valuation allowance
|
(54
|
)
|
2,997
|
(4,320
|
)
|
|||||||
|
Total provision (benefit) for income taxes
|
$
|
-
|
$
|
1,170
|
$
|
-
|
||||||
A deferred tax asset or liability is recognized to reflect the net tax effects of temporary differences between the carrying amounts of existing assets and liabilities for financial reporting purposes and the amounts used for income tax reporting purposes. Temporary differences that gave rise to the deferred tax assets and liabilities as of December 31, 2015 and 2014 are as follows:
|
|
2015
|
2014
|
||||||||||||||
|
|
Asset
|
Liability
|
Asset
|
Liability
|
||||||||||||
|
|
(In thousands)
|
|||||||||||||||
|
Investment securities
|
$
|
-
|
$
|
-
|
$
|
-
|
$
|
-
|
||||||||
|
Unrealized loss on securities available for sale
|
1,109
|
-
|
368
|
-
|
||||||||||||
|
Stock dividends on FHLB stock
|
-
|
3
|
-
|
4
|
||||||||||||
|
Venture capital investments
|
835
|
-
|
460
|
-
|
||||||||||||
|
Allowance for loan losses
|
7,106
|
-
|
10,916
|
-
|
||||||||||||
|
Premises and equipment
|
-
|
1,273
|
-
|
1,429
|
||||||||||||
|
MSRs
|
-
|
2,722
|
-
|
2,972
|
||||||||||||
|
Other intangible assets
|
377
|
-
|
418
|
-
|
||||||||||||
|
OREO
|
1,349
|
-
|
1,144
|
-
|
||||||||||||
|
Prepaid expenses
|
-
|
636
|
-
|
656
|
||||||||||||
|
Accrued compensation
|
566
|
-
|
728
|
-
|
||||||||||||
|
Capital losses
|
372
|
-
|
-
|
-
|
||||||||||||
|
Net operating loss carryforwards
|
4,687
|
-
|
3,002
|
-
|
||||||||||||
|
Business tax credits
|
2,827
|
-
|
1,970
|
-
|
||||||||||||
|
Stock options and SARs expensed
|
237
|
-
|
160
|
-
|
||||||||||||
|
Contributions and Other
|
206
|
-
|
41
|
-
|
||||||||||||
|
AMT credit
|
173
|
-
|
377
|
-
|
||||||||||||
|
Total deferred taxes
|
19,844
|
4,634
|
19,584
|
5,061
|
||||||||||||
|
Allowance for deferred taxes
|
(19,844
|
)
|
(4,634
|
)
|
(19,584
|
)
|
(5,061
|
)
|
||||||||
|
Net deferred taxes
|
$
|
0
|
$
|
(0
|
)
|
$
|
-
|
$
|
-
|
|||||||
A valuation allowance is established when it is more likely than not that all or a portion of a net deferred tax asset will not be realized. The Company recorded a loss before income taxes for the years ended December 31, 2011 and 2010. Based on these losses, the Company determined that it was no longer more likely than not that its deferred tax assets of $14.6 million at December 31, 2011 would be utilized. Accordingly, a full valuation allowance was recorded as of December 31, 2011. As of December 31, 2015, 2014, and 2013, management did not believe that it was more likely than not that the full amount of the deferred tax assets would be utilized in future periods.
For the year ended December 31, 2015, the Company had federal net operating loss carryforwards of $11.0 million and state net operating loss carryforwards of $18.8 million which will expire at various dates from 2031 to 2035. Realization of deferred tax assets associated with the net operating loss carryforwards is dependent upon generating sufficient taxable income prior to their expiration.
The Company had no income tax expense in 2015.
The Company is subject to U.S. federal and New Mexico state income taxes and is subject to examination by the taxing authorities for the years after 2010. In September 2014, the Company filed amended federal income tax returns for tax years 2006-2012 to claim additional bad debt deductions. The additional deductions resulted in net operating losses (NOLs) in 2011 and 2012; the NOLs have been utilized in full through carryback and carryforward.
The amended returns were reviewed by the Internal Revenue Service (“IRS”), resulting in a $1.17 million reduction in the Company’s current federal income tax receivable. The reduction to the current income tax receivable was the result of a loan loss deduction which was deferred to a future period and for alternative minimum tax (ATM) liability that becomes a credit carryforward. This resulted in a corresponding increase to the Company’s deferred tax asset. As a result, the increase in the deferred tax asset ensuing from the IRS adjustment required an equal increase in the valuation allowance. As noted above, the Company determined that it was no longer more likely than not that its deferred tax asset would be utilized.
The Company had business tax credits totaling $2.4 million as of December 31, 2015 and $2.3 million as of December 31, 2014, which will begin to expire in 2031.
Items causing differences between the Federal statutory tax rate and the effective tax rate are summarized as follows:
|
|
Year Ended December 31,
|
|||||||||||||||||||||||
|
|
2015
|
2014
|
2013
|
|||||||||||||||||||||
|
|
Amount
|
Rate
|
Amount
|
Rate
|
Amount
|
Rate
|
||||||||||||||||||
|
|
(Dollars in thousands)
|
|||||||||||||||||||||||
|
Federal statuatory tax rate
|
$
|
651
|
34.00
|
%
|
$
|
(1,688
|
)
|
(35.00
|
)%
|
4,502
|
35.00
|
%
|
||||||||||||
|
Net tax exempt interest income
|
(64
|
)
|
(3.34
|
)%
|
(158
|
)
|
(3.28
|
)%
|
(197
|
)
|
(1.53
|
)%
|
||||||||||||
|
Interest disallowance
|
1
|
0.05
|
%
|
3
|
0.06
|
%
|
2
|
0.02
|
%
|
|||||||||||||||
|
Nondeductible expenses
|
13
|
0.68
|
%
|
32
|
0.66
|
%
|
37
|
0.29
|
%
|
|||||||||||||||
|
Nondeductible book amortization
|
107
|
5.59
|
%
|
156
|
3.24
|
%
|
217
|
1.69
|
%
|
|||||||||||||||
|
Other, net
|
-
|
0.00
|
%
|
(90
|
)
|
(1.87
|
)%
|
(241
|
)
|
(1.87
|
)%
|
|||||||||||||
|
Tax credits
|
(424
|
)
|
(22.15
|
)%
|
(424
|
)
|
(8.79
|
)%
|
-
|
0.00
|
%
|
|||||||||||||
|
Provision to return adjustments
|
(445
|
)
|
(23.25
|
)%
|
-
|
(8.79
|
)%
|
-
|
0.00
|
%
|
||||||||||||||
|
Fed rate differential
|
20
|
1.04
|
%
|
-
|
(8.79
|
)%
|
-
|
0.00
|
%
|
|||||||||||||||
|
Change in state tax rate
|
114
|
5.96
|
%
|
-
|
(8.79
|
)%
|
-
|
0.00
|
%
|
|||||||||||||||
|
Fines & penalties
|
-
|
0.00
|
%
|
525
|
10.89
|
%
|
-
|
0.00
|
%
|
|||||||||||||||
|
State income tax, net of federal benefit
|
81
|
4.23
|
%
|
(183
|
)
|
(3.80
|
)%
|
-
|
0.00
|
%
|
||||||||||||||
|
Tax provision (benefit) before change in valuation allowance
|
54
|
2.82
|
%
|
(1,827
|
)
|
(64.26
|
)%
|
4,320
|
33.60
|
%
|
||||||||||||||
|
Change in valuation allowance
|
(54
|
)
|
(2.82
|
)%
|
2,997
|
62.15
|
%
|
(4,320
|
)
|
(33.60
|
)%
|
|||||||||||||
|
Provision (benefit) for income taxes
|
$
|
-
|
0.00
|
%
|
$
|
1,170
|
(2.11
|
)%
|
$
|
-
|
0.00
|
%
|
||||||||||||
The calculation for the income tax provision or benefit generally does not consider the tax effects of changes in other comprehensive income (“OCI”), which is a component of stockholders’ equity on the balance sheet. However, an exception is provided in certain circumstances, such as when there is a full valuation allowance on net deferred tax assets, a loss before provision (benefit) for income taxes and income in other components of the financial statements. In such a case, pre-tax income from other categories, such as changes in OCI, must be considered in determining a tax benefit to be allocated to the loss before provision (benefit) for income taxes.
During 2014, the Company recognized a penalty in the amount of $1.5 million imposed by the SEC as a result of the restatement of the Company’s financial statements. The impact of this non-deductible penalty was an increase in income tax in the amount of $525 thousand for the year ended December 31, 2014.
The Company has no liabilities associated with uncertain tax positions as of December 31, 2015 and 2014 and does not anticipate providing an income tax reserve in the next twelve months. During the years ended December 31, 2015 and 2014, the Company did not record an accrual for interest and penalties associated with uncertain tax positions.
Note 15. Commitments and Off-Balance-Sheet Activities
Credit-related financial instruments:
The Company is a party to credit-related commitments with off-balance-sheet risk in the normal course of business to meet the financing needs of its customers. These credit-related commitments include commitments to extend credit, standby letters of credit and commercial letters of credit. Such credit-related commitments involve, to varying degrees, elements of credit and interest rate risk in excess of the amount recognized in the consolidated balance sheets.
The Company’s exposure to credit loss is represented by the contractual amount of these credit-related commitments. The Company follows the same credit policies in making credit-related commitments as it does for on-balance-sheet instruments.
As of
December 31, 2015 and 2014, the following credit-related commitments were outstanding:
|
|
Contract Amount
|
|||||||
|
|
2015
|
2014
|
||||||
|
|
(In thousands)
|
|||||||
|
Unfunded commitments under lines of credit
|
$
|
108,966
|
$
|
141,674
|
||||
|
Commercial and standby letters of credit
|
7,608
|
10,411
|
||||||
|
Commitments to make loans
|
5,105
|
5,489
|
||||||
Commitments to extend credit are agreements to lend to a customer as long as there is no violation of any condition established in the contract. Commitments generally have fixed expiration dates or other termination clauses and may require payment of a fee. The commitments for equity lines of credit may expire without being drawn upon. Therefore, the total commitment amounts do not necessarily represent future cash requirements. The amount of collateral obtained, if deemed necessary by the Bank, is based on management’s credit evaluation of the customer. Unfunded commitments under commercial lines of credit, revolving credit lines and overdraft protection agreements are commitments for possible future extensions of credit to existing customers. Overdraft protection agreements are uncollateralized, but most other unfunded commitments have collateral. These unfunded lines of credit usually do not contain a specified maturity date and may not necessarily be drawn upon to the total extent to which the Bank is committed.
Outstanding Letters of Credit:
In addition to short and long-term borrowings from the FHLB, the FHLB has issued letters of credit to various public entities with deposits at the Bank. These letters of credit are issued to collateralize the deposits of these entities at the Bank as required or allowed under law. These letters of credit expired during 2015. The total value of these letters of credit was $22.0 million as of December 31, 2014. These letters were secured under the blanket assignment of mortgage loans or other collateral acceptable to the FHLB that also secures the Company’s short and long-term borrowings from FHLB.
The amount of collateral with the FHLB at December 31, 2015 was $114.9 million.
Commercial and standby letters of credit are conditional credit-related commitments issued by the Bank to guarantee the performance of a customer to a third party. Those letters of credit are primarily issued to support public and private borrowing arrangements. Essentially all letters of credit issued have expiration dates within one year. The credit risk involved in issuing letters of credit is the same as that involved in extending loans to customers. The Bank generally holds collateral supporting those credit-related commitments, if deemed necessary. In the event the customer does not perform in accordance with the terms of the agreement with the third party, the Bank would be required to fund the credit-related commitment. The maximum potential amount of future payments the Bank could be required to make is represented by the contractual amount shown in the summary above. If the credit-related commitment is funded, the Bank would be entitled to seek recovery from the customer. A
s of both
December 31, 2015 and 2014, $575 thousand has been recorded as liabilities for the Company’s potential losses under these credit-related commitments. The fair value of these credit-related commitments is approximately equal to the fees collected when granting these letters of credit. These fees collected were $20 thousand and $28 thousand as of December 31, 2015 and 2014, respectively, and are included in “other liabilities” on the consolidated balance sheets.
Note 16. Preferred Equity Issues
On March 27, 2009, the Company issued two series of preferred stock to the U.S. Department of the Treasury (“Treasury”) under the Capital Purchase Program (“CPP”). Below is a table disclosing the information on the two series:
|
|
Number of shares
issued
|
Dividend rate
|
Liquidation value per share
|
Original
cost, in thousands
|
||||||||||||
|
Series A cumulative perpetual preferred shares
|
35,539
|
5% for first 5 years; thereafter 9%
|
$
|
1,000.00
|
$
|
33,437
|
||||||||||
|
Series B cumulative perpetual preferred shares
|
1,777
|
9%
|
1,000.00
|
2,102
|
||||||||||||
The difference between the liquidation value of the preferred stock and the original cost is accreted (for the Series B Preferred Stock) or amortized (for the Series A Preferred Stock) over 10 years and is reflected, on a net basis, as an increase to the carrying value of preferred stock and decrease to retained earnings. For each of the years ended December 31, 2015 and 2014, a net amount of $178 thousand was recorded for amortization.
Dividends and discount accretion on preferred stock reduce the amount of net income available to common shareholders. For each of the years ended December 31, 2015 and 2014 the total of these amounts was $3.8 million and $3.2 million, respectively.
On August 10, 2012, the Treasury sold its ownership of the Series A Preferred Stock and the Series B Preferred Stock to third parties.
On May 7, 2013, the Company elected to exercise the option to defer the payment of dividends on the preferred stock, as provided by the agreements under which the stock was issued.
The amounts of dividends accrued and unpaid as of December 31, 2015 and 2014 were $8.7 million and $4.8 million, respectively, and are included in “other liabilities” on the consolidated balance sheets.
Note 17. Litigation
The Company and its subsidiaries are subject, in the normal course of business, to various pending and threatened legal proceedings in which claims for monetary damages are asserted. On an ongoing basis management, after consultation with legal counsel, assesses the Company’s liabilities and contingencies in connection with such legal proceedings. For those matters where it is probable that the Company will incur losses and the amounts of the losses can be reasonably estimated, the Company records an expense and corresponding liability in its consolidated financial statements. To the extent the pending or threatened litigation could result in exposure in excess of that liability, the amount of such excess is not currently estimable.
The Company can give no assurance, however, its business, financial condition and results of operations will not be materially adversely affected, or that it will not be required to materially change its business practices, based on: (i) future enactment of new banking or other laws or regulations; (ii) the interpretation or application of existing laws or regulations, including the laws and regulations as they may relate to the Company’s business, banking services or the financial services industry in general; (iii) pending or future federal or state governmental investigations of the business; (iv) institution of government enforcement actions against the Company; or (v) adverse developments in other pending or future legal proceedings against the Company or affecting the banking or financial services industry generally.
In addition to legal proceedings occurring in the normal course of business, the Company is the subject of certain governmental investigations and legal proceedings as set forth below.
SEC Investigation:
On September 28, 2015, the Securities and Exchange Commission (“SEC”) announced an administrative settlement with the Company, resolving the previously reported investigation of the Company’s historical accounting and reporting with respect to its restatement of financial information for the years ended December 31, 2006 through December 31, 2011 and the quarters ended March 31, 2012 and June 30, 2012. The Company and the SEC settled the investigation, pursuant to which the Company, without admitting or denying any factual allegations, consented to the SEC’s issuance of an administrative order finding that the Company did not properly account for the Bank’s loan portfolio during 2010, 2011 and the first two quarters of 2012, did not properly account for its OREO in 2011, and did not have effective internal accounting controls over loan and OREO accounting. In addition, the SEC found that certain former members of the Bank’s management caused the Bank to engage in false and misleading accounting and overrode internal accounting controls. As a result, the SEC found that the Company violated certain provisions of the securities laws, including Section 10(b) of the Exchange Act of 1934 (“Exchange Act”) and Rule 10b-5 thereunder; Section 17(a) of the Securities Act of 1933; and Section 13(a) of the Exchange Act and Rules 13a-1, 13a-13 and 12b-20 thereunder; Section 13(b)(2)(A) of the Exchange Act; and Sections 13(b)(2)(B) of the Exchange Act. The settlement orders the Company to cease and desist from committing or causing any such violations in the future and to pay a civil money penalty in the amount of $1.5 million. The civil money penalty was expensed in 2014 and subsequently paid in September 2015, upon entering into the administrative settlement agreement. The Company agreed to cooperate in proceedings brought by the SEC as well as any future investigations into matters described in the settlement. The Company cooperated fully with the SEC investigation.
SIGTARP/DOJ Investigation:
The Special Inspector General of the Troubled Asset Relief Program (“SIGTARP”) and the Department of Justice (“DOJ”) initiated a criminal investigation relating to the financial reporting and securities filings referenced in above and actions relating to the 2012 examination of the Bank by the OCC. The Company is cooperating with all requests from SIGTARP and the DOJ. SIGTARP and the DOJ have advised the Company that it is not a target of the investigation.
As of May 1, 2016, no suit or charges have been filed against the Company or its current directors, executive officers or employees by any parties relating to the restatement.
While there is a reasonable probability that some loss will be experienced, through litigation or assessments, other than as disclosed above, the potential loss cannot be quantified. The Company has not accrued a reserve for any potential losses resulting from unresolved regulatory investigations.
Insurance Coverage and Indemnification Litigation:
| · |
Trinity Capital Corporation and Los Alamos National Bank v. Atlantic Specialty Insurance Company, Federal Insurance Company, William C. Enloe and Jill Cook, (First Judicial District Court, State of New Mexico, Case No. D-132-CV-201500083);
|
| · |
William C. Enloe v. Atlantic Specialty Insurance Company, Federal Insurance Company, Trinity Capital Corporation and Los Alamos National Bank, (First Judicial District Court, State of New Mexico, Case No. D-132-CV-201500082)
; and
|
| · |
Mark Pierce v. Atlantic Specialty Insurance Company, Trinity Capitol Corporation d/b/a Los Alamos National Bank, and Federal Insurance Company, (First Judicial District Court, State of New Mexico, Case No. D-101-CV-201502381).
|
In connection with the restatements and investigations, on September 1, 2015, the Company and William Enloe (“Enloe”), Trinity and the Bank’s former Chief Executive Officer and Chairman of the Board, filed separate suits in New Mexico State Court. Jill Cook, the Company’s former Chief Credit Officer, was also named in the suit brought by Trinity. On October 28, 2015, the Court entered an order consolidating the Enloe and Trinity suits. Mark Pierce, the Bank’s former Senior Lending Officer, filed suit in New Mexico State Court on November 2, 2015. On April 26, 2016, Pierce filed a motion to consolidate his suit with the Enloe and Trinity suit. In each of the three suits listed above, the plaintiffs seek coverage and reimbursement from the insurance carriers for the defense costs incurred by individuals covered under those policies, as defined therein, in addition to causes of action against the insurance companies for bad faith, breach of insurance contracts and against Atlantic Specialty Insurance for violations of New Mexico insurance statutes. The suits, with the exception of Enloe’s suit, also seek a determination on the obligations of the Company and/or the Bank to indemnify the former officers. The suits filed by Enloe and Pierce each allege, in the alternative, negligence against the Company and the Bank for failing to timely put all carriers on notice of his claims. The Company and the Bank will vigorously defend its actions and seek indemnification and coverage from its insurance carriers as required under the insurance policies. Due to the complex nature, the outcome and timing of ultimate resolution is inherently difficult to predict.
Title Insurance Coverage Litigation:
First American Title v. Los Alamos National Bank (Second Judicial District Court, State of New Mexico, Case No. D-202-CV-201207023
). This suit relates to title coverage claims regarding a commercial property that served as collateral for a commercial loan made by the Bank. The title company asserted a claim against the Bank for recovery of losses suffered as a result of a settlement entered into by both the title company and the Bank to satisfy the claims of certain contractors who filed liens on the property. On April 29, 2016, the District Court issued its Findings of Fact and Conclusions of Law finding against the Bank and finding the plaintiff is entitled to a judgment in the amount of $150,000 and its costs of bringing suit. The suit was settled in June 2016 for significantly less than the judgment amount.
Note 18. Derivative Financial Instruments
In the normal course of business, the Bank uses a variety of financial instruments to service the financial needs of customers and to reduce its exposure to fluctuations in interest rates. Derivative instruments that the Bank uses as part of its interest rate risk management strategy include mandatory forward delivery commitments and rate lock commitments.
As a result of using derivative instruments, the Bank has potential exposure to credit loss in the event of non-performance by the counterparties. The Bank manages this credit risk by spreading the credit risk among counterparties that the Company believes are well established and financially strong and by placing contractual limits on the amount of unsecured credit risk from any single counterparty. The Bank’s exposure to credit risk in the event of default by a counterparty is the current cost of replacing the contracts net of any available margins retained by the Bank. However, if the borrower defaults on the commitment the Bank requires the borrower to cover these costs.
The Company’s derivative instruments outstanding as of December 31, 2015 included commitments to fund loans held for sale. The interest rate lock commitment was valued at fair value at inception. The rate locks will continue to be adjusted for changes in value resulting from changes in market interest rates.
The Company originates single-family residential loans for sale pursuant to programs offered by Fannie Mae. At the time the interest rate is locked in by the borrower, the Bank concurrently enters into a forward loan sale agreement with respect to the sale of such loan at a set price in an effort to manage the interest rate risk inherent in the locked loan commitment. Any change in the fair value of the loan commitment after the borrower locks in the interest rate is substantially offset by the corresponding change in the fair value of the forward loan sale agreement related to such loan. This change is recorded to “other noninterest expenses” in the consolidated statements of operations. The period from the time the borrower locks in the interest rate to the time the Bank funds the loan and sells it to Fannie Mae is generally 60 days. The fair value of each instrument will rise or fall in response to changes in market interest rates subsequent to the dates the interest rate locks and forward loan sale agreements are entered into. In the event that interest rates rise after the Bank enters into an interest rate lock, the fair value of the loan commitment will decline. However, the fair value of the forward loan sale agreement related to such loan commitment generally increases by substantially the same amount, effectively eliminating the Company’s interest rate and price risk.
As of December 31, 2015, the Company had notional amounts of $5.1 million in contracts with customers and $8.1 million in contracts with Fannie Mae for interest rate lock commitments outstanding related to loans being originated for sale. As of December 31, 2014, the Company had notional amounts of $5.5 million in contracts with customers and $11.2 million in contracts with Fannie Mae for interest rate lock commitments outstanding related to loans being originated for sale. The fair value of interest rate lock commitments was $225 thousand as of December 31, 2015 and $139 thousand as of December 31, 2014.
The Company had outstanding loan commitments, excluding undisbursed portion of loans in process and equity lines of credit, of approximately $116.6 million as of December 31, 2015 and $136.1 million as of 2014, respectively. Of these commitments outstanding, the breakdown between fixed rate and adjustable rate loans is as follows:
|
|
December 31,
|
|||||||
|
|
2015
|
2014
|
||||||
|
|
(In thousands)
|
|||||||
|
Fixed rate (ranging from 2.1% to 13.9%)
|
$
|
11,913
|
$
|
9,913
|
||||
|
Adjustable rate
|
104,661
|
126,215
|
||||||
|
Total
|
$
|
116,574
|
$
|
136,128
|
||||
Note 19. Regulatory Matters
The payment of dividends by any financial institution is affected by the requirement to maintain adequate capital pursuant to applicable capital adequacy guidelines and regulations, and a financial institution generally is prohibited from paying any dividends if, following payment thereof, the institution would be undercapitalized.
The Company is subject to restrictions on the payment of dividends and cannot pay dividends that exceed its net income or which may weaken its financial health. The Company’s primary source of cash is dividends from the Bank. Generally, the Bank is subject to certain restrictions on dividends that it may declare without prior regulatory approval. The Bank cannot pay dividends in any calendar year that, in the aggregate, exceed the Bank’s year-to-date net income plus its retained income for the two preceding years. Additionally, the Bank cannot pay dividends that are in excess of the amount that would result in the Bank falling below the minimum required for capital adequacy purposes.
Trinity was placed under a Written Agreement by the FRB on September 26, 2013. The Written Agreement requires Trinity to serve as a source of strength to the Bank and restricts Trinity’s ability, without written approval of the FRB, to make payments on the Company’s junior subordinated debentures, incur or increase any debt, issue dividends and other capital distributions or to repurchase or redeem any Trinity stock. Additionally, the Bank was similarly prohibited from paying dividends to Trinity under the Formal Agreement issued by the OCC on November 30, 2012 and under the Consent Order, which replaced the Formal Agreement, issued on December 17, 2013. The Consent Order requires that the Bank maintain certain capital ratios and receive approval from the OCC prior to declaring dividends. The Written Agreement was filed with the Company’s Current Report on Form 8-K filed on October 1, 2013; the Formal Agreement was filed with the Company’s Current Report on Form 8-K filed on December 6, 2012; and the Consent Order was filed with the Company’s Current Report on Form 8-K filed on December 23, 2013. The Company and the Bank are taking actions to address the provisions of the enforcement actions.
Banks and bank holding companies are subject to regulatory capital requirements administered by federal banking agencies. Capital adequacy guidelines and, additionally for bank, prompt corrective action regulations, involve quantitative measures of assets, liabilities, and certain off-balance-sheet items calculated under regulatory accounting practices. Capital amounts and classifications are also subject to qualitative judgements by regulators. Failure to meet capital requirements can initiate regulatory action. The final rules implementing Basel Committee on Banking Supervision’s capital guidelines for U.S. banks (Basel III rules) became effective for the Company on January 1, 2015 with full compliance with all of the requirements being phased in over a multi-year schedule, and fully phased in by January 1, 2019. Capital amounts and ratios for December 31, 2014 are calculated using Basel I rules. The Company and the Bank met all capital adequacy requirements to which they were subject as of December 31, 2015.
The statutory requirements and actual amounts and ratios for the Company and the Bank are presented below:
|
|
Actual
|
For Capital Adequacy
Purposes
|
To be well capitalized
under prompt
corrective action
provisions
|
Minimum Levels
Under Order
Provisions
|
||||||||||||||||||||||||||||
|
|
Amount
|
Ratio
|
Amount
|
Ratio
|
Amount
|
Ratio
|
Amount
|
Ratio
|
||||||||||||||||||||||||
|
|
(Dollars in thousands)
|
|||||||||||||||||||||||||||||||
|
December 31, 2015
|
||||||||||||||||||||||||||||||||
|
Total capital (to risk-weighted assets):
|
||||||||||||||||||||||||||||||||
|
Consolidated
|
$
|
128,272
|
14.10
|
%
|
$
|
72,774
|
8.00
|
%
|
N/A
|
N/A
|
N/A
|
N/A
|
||||||||||||||||||||
|
Bank only
|
141,486
|
15.62
|
%
|
72,452
|
8.00
|
%
|
$
|
90,565
|
10.00
|
%
|
$
|
99,621
|
11.00
|
%
|
||||||||||||||||||
|
Tier 1 capital (to risk weighted assets):
|
||||||||||||||||||||||||||||||||
|
Consolidated
|
101,263
|
11.13
|
%
|
54,580
|
6.00
|
%
|
N/A
|
N/A
|
N/A
|
N/A
|
||||||||||||||||||||||
|
Bank only
|
130,084
|
14.36
|
%
|
54,339
|
6.00
|
%
|
72,452
|
8.00
|
%
|
N/A
|
N/A
|
|||||||||||||||||||||
|
Common Equity Tier 1 Capital (to risk weighted assets):
|
||||||||||||||||||||||||||||||||
|
Consolidated
|
44,080
|
4.85
|
%
|
40,935
|
4.50
|
%
|
N/A
|
N/A
|
N/A
|
N/A
|
||||||||||||||||||||||
|
Bank only
|
130,084
|
14.36
|
%
|
40,754
|
4.50
|
%
|
58,867
|
6.50
|
%
|
N/A
|
N/A
|
|||||||||||||||||||||
|
Tier 1 leverage (to average assets):
|
||||||||||||||||||||||||||||||||
|
Consolidated
|
101,263
|
7.11
|
%
|
56,943
|
4.00
|
%
|
N/A
|
N/A
|
N/A
|
N/A
|
||||||||||||||||||||||
|
Bank only
|
130,084
|
9.18
|
%
|
56,685
|
4.00
|
%
|
70,856
|
5.00
|
%
|
113,370
|
8.00
|
%
|
||||||||||||||||||||
|
|
||||||||||||||||||||||||||||||||
|
December 31, 2014
|
||||||||||||||||||||||||||||||||
|
Total capital (to risk-weighted assets):
|
||||||||||||||||||||||||||||||||
|
Consolidated
|
$
|
130,452
|
14.27
|
%
|
$
|
73,108
|
8.00
|
%
|
N/A
|
N/A
|
N/A
|
N/A
|
||||||||||||||||||||
|
Bank only
|
135,872
|
14.98
|
%
|
72,562
|
8.00
|
%
|
$
|
90,703
|
10.00
|
%
|
$
|
99,773
|
11.00
|
%
|
||||||||||||||||||
|
Tier 1 capital (to risk weighted assets):
|
||||||||||||||||||||||||||||||||
|
Consolidated
|
110,532
|
12.10
|
%
|
36,554
|
4.00
|
%
|
N/A
|
N/A
|
N/A
|
N/A
|
||||||||||||||||||||||
|
Bank only
|
124,361
|
13.71
|
%
|
36,281
|
4.00
|
%
|
54,422
|
6.00
|
%
|
N/A
|
N/A
|
|||||||||||||||||||||
|
Tier 1 capital (to average assets):
|
||||||||||||||||||||||||||||||||
|
Consolidated
|
110,532
|
7.54
|
%
|
58,650
|
4.00
|
%
|
N/A
|
N/A
|
N/A
|
N/A
|
||||||||||||||||||||||
|
Bank only
|
124,361
|
8.51
|
%
|
58,420
|
4.00
|
%
|
73,025
|
5.00
|
%
|
116,840
|
8.00
|
%
|
||||||||||||||||||||
N/A—not applicable
While the Bank’s capital ratios fall into the category of “well-capitalized,” the Bank cannot be considered “well-capitalized” due to the requirement to meet and maintain a specific capital level in the Consent Order pursuant to the prompt corrective action rules. The Bank is required to maintain (i) a leverage ratio of Tier 1 Capital to total assets of at least 8%; and (ii) a ratio of Total Capital to total risk-weighted assets of at least 11%. As of December 31, 2015 and 2014 the Bank was in compliance with these requirements.
Note 20. Fair Value Measurements
ASC Topic 820 defines fair value as the price that would be received to sell an asset or paid to transfer a liability in an orderly transaction between market participants. A fair value measurement assumes that the transaction to sell the asset or transfer the liability occurs in the principal market for the asset or liability or, in the absence of a principal market, the most advantageous market for the asset or liability. The price in the principal (or most advantageous) market used to measure the fair value of the asset or liability shall not be adjusted for transaction costs. An orderly transaction is a transaction that assumes exposure to the market for a period prior to the measurement date to allow for marketing activities that are usual and customary for transactions involving such assets and liabilities; it is not a forced transaction. Market participants are buyers and sellers in the principal market that are (i) independent, (ii) knowledgeable, (iii) able to transact and (iv) willing to transact.
The Company uses valuation techniques that are consistent with the sales comparison approach, the income approach and/or the cost approach. The market approach uses prices and other relevant information generated by market transactions involving identical or comparable assets and liabilities. The income approach uses valuation techniques to convert expected future amounts, such as cash flows or earnings, to a single present value amount on a discounted basis. The cost approach is based on the amount that currently would be required to replace the service capacity of an asset (replacement cost). Valuation techniques should be consistently applied. Inputs to valuation techniques refer to the assumptions that market participants would use in pricing the asset or liability. Inputs may be observable, meaning those that reflect the assumptions market participants would use in pricing the asset or liability developed based on market data obtained from independent sources, or unobservable, meaning those that reflect the reporting entity's own assumptions about the assumptions market participants would use in pricing the asset or liability developed based on the best information available in the circumstances. In that regard, ASC Topic 820 establishes a fair value hierarchy for valuation inputs that gives the highest priority to quoted prices in active markets for identical assets or liabilities and the lowest priority to unobservable inputs. The fair value hierarchy is as follows:
Level 1: Quoted prices (unadjusted) for identical assets or liabilities in active markets that the entity has the ability to access as of the measurement date.
Level 2: Significant other observable inputs other than Level 1 prices such as quoted prices for similar assets or liabilities; quoted prices in markets that are not active; or other inputs that are observable or can be corroborated by observable market data.
Level 3: Significant unobservable inputs that reflect a reporting entity’s own assumptions about the assumptions that market participants would use in pricing an asset or liability.
While management believes the Company’s valuation methodologies are appropriate and consistent with other market participants, the use of different methodologies or assumptions to determine the fair value of certain financial instruments could result in a different estimate of fair value at the reporting date.
Transfers between levels of the fair value hierarchy are recognized on the actual date of the event or circumstances that caused the transfer, which generally coincides with the Company’s monthly and/or quarterly valuation process.
Financial Instruments Recorded at Fair Value on a Recurring Basis
Securities Available for Sale.
The fair values of securities available for sale are determined by quoted prices in active markets, when available. If quoted market prices are not available, the fair value is determined by a matrix pricing, which is a mathematical technique widely used in the industry to value debt securities without relying exclusively on quoted prices for the specific securities but rather by relying on the securities’ relationship to other benchmark quoted securities.
Derivatives.
Derivative assets and liabilities represent interest rate contracts between the Company and loan customers, and between the Company and outside parties to whom it has made a commitment to sell residential mortgage loans at a set interest rate. These are valued based upon the differential between the interest rates upon the inception of the contract and the current market interest rates for similar products. Changes in fair value are recorded in current earnings.
The following table summarizes the Company's financial assets and off-balance-sheet instruments measured at fair value on a recurring basis as of December 31, 2015 and 2014, segregated by the level of the valuation inputs within the fair value hierarchy utilized to measure fair value:
|
December 31, 2015
|
Total
|
Level 1
|
Level 2
|
Level 3
|
||||||||||||
|
(In thousands)
|
||||||||||||||||
|
Financial Assets:
|
||||||||||||||||
|
Investment securities available for sale:
|
||||||||||||||||
|
U.S. Government sponsored agencies
|
$
|
69,584
|
$
|
-
|
$
|
69,584
|
$
|
-
|
||||||||
|
State and political subdivisions
|
3,576
|
-
|
3,576
|
-
|
||||||||||||
|
Residential mortgage-backed security
|
121,597
|
-
|
121,597
|
-
|
||||||||||||
|
Residential collateralized mortgage obligation
|
39,921
|
-
|
39,921
|
-
|
||||||||||||
|
Commercial mortgage backed security
|
41,119
|
-
|
41,119
|
-
|
||||||||||||
|
SBA pool
|
750
|
-
|
750
|
-
|
||||||||||||
|
Asset-backed security
|
39,493
|
-
|
39,493
|
-
|
||||||||||||
|
Interest rate lock commitments, mandatory forward delivery commitments and pair offs
|
225
|
-
|
225
|
-
|
||||||||||||
|
Total
|
$
|
316,265
|
$
|
-
|
$
|
316,265
|
$
|
-
|
||||||||
|
December 31, 2014
|
||||||||||||||||
|
Financial Assets:
|
||||||||||||||||
|
Investment securities available for sale:
|
||||||||||||||||
|
U.S. Government sponsored agencies
|
$
|
42,282
|
$
|
-
|
$
|
42,282
|
$
|
-
|
||||||||
|
Stats and political subdivisions
|
5,087
|
-
|
5,087
|
-
|
||||||||||||
|
Residential mortgage-backed security
|
101,775
|
-
|
101,775
|
-
|
||||||||||||
|
Residential collateralized mortgage obligation
|
41,051
|
-
|
41,051
|
-
|
||||||||||||
|
Commercial mortgage backed security
|
24,882
|
-
|
24,882
|
-
|
||||||||||||
|
SBA pool
|
945
|
-
|
945
|
-
|
||||||||||||
|
Interest rate lock commitments, mandatory forward delivery commitments and pair offs
|
186
|
-
|
186
|
-
|
||||||||||||
|
Total
|
$
|
216,208
|
$
|
-
|
$
|
216,208
|
$
|
-
|
||||||||
There were no financial liabilities that were measured at fair value as of December 31, 2015 and 2014. There were no financial assets or financial liabilities measured at fair value on a recurring basis for which the Company used significant unobservable inputs (Level 3) during the periods presented in these financial statements. There were no transfers between the levels used on any asset classes during the year.
Assets and Liabilities Recorded at Fair Value on a Nonrecurring Basis
The Company may be required, from time to time, to measure certain financial assets and financial liabilities at fair value on a nonrecurring basis in accordance with GAAP.
Impaired Loans.
Loans for which it is probable that payment of interest and principal will not be made in accordance with the contractual terms of the loan agreement are considered impaired. Once a loan is identified as impaired, management measures the amount of that impairment in accordance with ASC Topic 310. The fair value of impaired loans is estimated using one of several methods, including collateral value, liquidation value and discounted cash flows. Those impaired loans not requiring an allowance represent loans for which the fair value of the expected repayments or collateral exceed the recorded investments in such loans.
In accordance with ASC Topic 820, impaired loans where an allowance is established based on the fair value of collateral require classification in the fair value hierarchy. Collateral values are estimated using Level 3 inputs based on customized discounting criteria. For collateral dependent impaired loans, the Company obtains a current independent appraisal of loan collateral. Other valuation techniques are used as well, including internal valuations, comparable property analysis and contractual sales information.
OREO.
OREO is adjusted to fair value at the time the loans are transferred to OREO. Subsequently, OREO is carried at the lower of the carrying value or fair value. Fair value is determined based upon independent market prices, appraised values of the collateral or management’s estimation of the value of the collateral. The fair value of OREO was computed based on third part appraisals, which are level 3 valuation inputs.
As of December 31, 2015, impaired loans with a carrying value of $40.7 million had a valuation allowance of $4.2 million. As of December 31, 2014, impaired loans with a carrying value of $47.2 million had a valuation allowance of $8.0 million.
In the table below, OREO had write-downs during the years ended
December 31, 2015 and 2014
of $361 thousand and $2.7 million, respectively.
The valuation adjustments on OREO have been recorded through earnings.
Assets measured at fair value on a nonrecurring basis as of December 31, 2015 and 2014 are included in the table below:
|
|
Total
|
Level 1
|
Level 2
|
Level 3
|
||||||||||||
|
|
(In thousands)
|
|||||||||||||||
|
December 31, 2015
|
||||||||||||||||
|
Financial Assets
|
||||||||||||||||
|
Impaired loans
|
$
|
36,870
|
$
|
-
|
$
|
-
|
$
|
36,870
|
||||||||
|
MSRs
|
6,905
|
-
|
-
|
6,905
|
||||||||||||
|
Non-Financial Assets
|
||||||||||||||||
|
OREO
|
2,231
|
-
|
-
|
2,231
|
||||||||||||
|
|
||||||||||||||||
|
December 31, 2014
|
||||||||||||||||
|
Financial Assets
|
||||||||||||||||
|
Impaired loans
|
$
|
47,234
|
$
|
-
|
$
|
-
|
$
|
47,234
|
||||||||
|
MSRs
|
7,438
|
-
|
-
|
7,438
|
||||||||||||
|
Non-Financial Assets
|
||||||||||||||||
|
OREO
|
6,111
|
-
|
-
|
6,111
|
||||||||||||
See Note 5 for assumptions used to determine the fair value of MSRs. Assumptions used to determine
impaired loans and OREO are presented below by classification, measured at fair value and on a nonrecurring basis as of December 31, 2015 and 2014:
|
Fair value
|
Valuation
Technique(s)
|
Unobservable Input(s)
|
Adjustment Range,
Weighted Average
|
|||||||
|
December 31, 2015
|
(In thousands)
|
|||||||||
|
Impaired loans
|
|
|
|
|||||||
|
Commercial
|
$
|
14,557
|
Sales comparison
|
Adjustments for differences of comparable sales
|
(0.00)% to (13.92)%,
(5.70)% |
|||||
|
Commercial real estate
|
9,755
|
Sales comparison
|
Adjustments for differences of comparable sales
|
(4.25) to (7.62),
(5.65) |
||||||
|
Residential real estate
|
8,624
|
Sales comparison
|
Adjustments for differences of comparable sales
|
(0.00) to (8.70),
(5.29) |
||||||
|
Construction real estate
|
3,436
|
Sales comparison
|
Adjustments for differences of comparable sales
|
(4.00) to (7.50),
(6.14) |
||||||
|
Installment and other
|
498
|
Sales comparison
|
Adjustments for differences of comparable sales
|
(4.13) to (9.50),
(6.52) |
||||||
|
Total impaired loans
|
$
|
36,870
|
|
|
|
|||||
|
OREO
|
|
|
|
|||||||
|
Commercial real estate
|
$
|
217
|
Sales comparison
|
Adjustments for differences of comparable sales
|
(14.55)% to (14.55)%,
(14.55)% |
|||||
|
Residential real estate
|
1,493
|
Sales comparison
|
Adjustments for differences of comparable sales
|
(8.47) to (91.19),
(21.76) |
||||||
|
Construction real estate
|
521
|
Sales comparison
|
Adjustments for differences of comparable sales
|
(10.70) to (67.45),
(57.32) |
||||||
|
Total OREO
|
$
|
2,231
|
|
|
|
|||||
|
|
|
|
||||||||
|
December 31, 2014
|
|
|
|
|||||||
|
Impaired loans
|
|
|
|
|||||||
|
Commercial
|
$
|
15,041
|
Sales comparison
|
Adjustments for differences of comparable sales
|
(5.70)% to (13.92)%,
(5.78)% |
|||||
|
Commercial real estate
|
14,970
|
Sales comparison
|
Adjustments for differences of comparable sales
|
(5.50) to (7.62),
(6.04) |
||||||
|
Residential real estate
|
11,050
|
Sales comparison
|
Adjustments for differences of comparable sales
|
(3.13) to (8.70),
(5.62) |
||||||
|
Construction real estate
|
5,537
|
Sales comparison
|
Adjustments for differences of comparable sales
|
(5.00) to (7.25),
(6.07) |
||||||
|
Installment and other
|
636
|
Sales comparison
|
Adjustments for differences of comparable sales
|
(4.13) to (10.00),
(6.82) |
||||||
|
Total impaired loans
|
$
|
47,234
|
|
|
|
|||||
|
OREO
|
|
|
|
|||||||
|
Commercial real estate
|
$
|
2,179
|
Sales comparison
|
Adjustments for differences of comparable sales
|
(5.45) to (42.92),
(35.96) |
|||||
|
Residential real estate
|
1,966
|
Sales comparison
|
Adjustments for differences of comparable sales
|
(2.98) to (82.38)
(23.43) |
||||||
|
Construction real estate
|
1,966
|
Sales comparison
|
Adjustments for differences of comparable sales
|
(22.41) to (100.00)
(65.25) |
||||||
|
Total OREO
|
$
|
6,111
|
|
|
|
|||||
Fair Value Assumptions
ASC Topic 825 requires disclosure of the fair value of financial assets and financial liabilities, including those financial assets and financial liabilities that are not measured and reported at fair value on a recurring basis or non-recurring basis. The following methods and assumptions were used by the Company in estimating the fair values of its other financial instruments:
Cash and due from banks and interest-bearing deposits with banks:
The carrying amounts reported in the balance sheet approximate fair value and are classified as Level 1.
Securities purchased under resell agreements:
The carrying amounts reported in the balance sheet approximate fair value and are classified as Level 1.
Investment Securities:
The fair values for investment securities are determined by quoted market prices, if available (Level 1). For securities where quoted prices are not available, fair values are calculated based on market prices of similar securities (Level 2), using matrix pricing. Matrix pricing is a mathematical technique commonly used to price debt securities that are not actively traded, values debt securities without relying exclusively on quoted prices for the specific securities but rather by relying on the securities’ relationship to other benchmark quoted securities (Level 2 inputs). For securities where quoted prices or market prices of similar securities are not available, fair values are calculated using discounted cash flows or other market indicators (Level 3). See below for additional discussion of Level 3 valuation methodologies and significant inputs.
Non-marketable equity securities:
It is not practical to determine the fair value of FHLB stock due to restrictions placed on its transferability.
Loans held for sale:
The fair values disclosed are based upon the values of loans with similar characteristics purchased in secondary mortgage markets and are classified as Level 3.
Loans:
For those variable-rate loans that reprice frequently with no significant change in credit risk, fair values are based on carrying values. The fair values for fixed rate and all other loans are estimated using discounted cash flow analyses, using interest rates currently being offered for loans with similar terms to borrowers with similar credit quality. The fair value of loans is classified as Level 3 within the fair value hierarchy.
Noninterest-bearing deposits:
The fair values disclosed are equal to their balance sheet carrying amounts, which represent the amount payable on demand, and are classified as Level 1.
Interest-bearing deposits:
The fair values disclosed for deposits with no defined maturities are equal to their carrying amounts, which represent the amounts payable on demand, and are classified as Level 2. The carrying amounts for variable rate, fixed term money market accounts and certificates of deposit approximate their fair values at the reporting date. Fair values for fixed rate certificates of deposit are estimated using a discounted cash flow calculation that applies interest rates currently being offered on similar certificates to a schedule of aggregated expected monthly maturities on time deposits.
Long-term borrowings
: The fair values of the Company's long-term borrowings (other than deposits) are estimated using discounted cash flow analyses, based on the Company's current incremental borrowing rates for similar types of borrowing arrangements, and are classified as Level 2.
Junior subordinated debt
: The fair values of the Company’s junior subordinated debt are estimated based on the quoted market prices, when available, of the related trust preferred security instruments, or are estimated based on the quoted market prices of comparable trust preferred securities, and are classified as Level 3.
Off-balance-sheet instruments
: Fair values for the Company's off-balance-sheet lending commitments in the form of letters of credit are based on fees currently charged to enter into similar agreements, taking into account the remaining terms of the agreements. It is the opinion of management that the fair value of these commitments would approximate their carrying value, if drawn upon, and are classified as Level 2.
Accrued interest:
The carrying amounts of accrued interest approximate fair value resulting in a Level 2 or Level 3 classification.
The carrying amount and estimated fair values of other financial instruments as of December 31, 2015 and 2014 are as follows:
|
|
Carrying amount
|
Level 1
|
Level 2
|
Level 3
|
Total
|
|||||||||||||||
|
|
(In thousands)
|
|||||||||||||||||||
|
December 31, 2015
|
||||||||||||||||||||
|
Financial assets:
|
||||||||||||||||||||
|
Cash and due from banks
|
$
|
13,506
|
$
|
13,506
|
$
|
-
|
$
|
-
|
$
|
13,506
|
||||||||||
|
Interest-bearing deposits with banks
|
151,049
|
151,049
|
-
|
-
|
151,049
|
|||||||||||||||
|
Securities purchased under resell agreements
|
24,320
|
24,320
|
-
|
-
|
24,320
|
|||||||||||||||
|
Investments:
|
||||||||||||||||||||
|
Available for sale
|
316,040
|
-
|
316,040
|
-
|
316,040
|
|||||||||||||||
|
Held to maturity
|
8,986
|
-
|
8,988
|
-
|
8,988
|
|||||||||||||||
|
Non-marketable equity securities
|
3,854
|
N/A
|
N/A
|
N/A
|
N/A
|
|||||||||||||||
|
Loans held for sale
|
3,041
|
-
|
-
|
3,041
|
3,041
|
|||||||||||||||
|
Loans, net
|
822,396
|
-
|
-
|
830,555
|
830,555
|
|||||||||||||||
|
Accrued interest receivable on securities
|
1,028
|
-
|
1,028
|
-
|
1,028
|
|||||||||||||||
|
Accrued interest receivable on loans
|
3,795
|
-
|
-
|
3,795
|
3,795
|
|||||||||||||||
|
Accrued interest receivable other
|
208
|
-
|
-
|
208
|
208
|
|||||||||||||||
|
Interest rate lock commitments, mandatory forward delivery commitments and pair offs
|
225
|
-
|
225
|
-
|
225
|
|||||||||||||||
|
|
||||||||||||||||||||
|
Off-balance-sheet instruments:
|
||||||||||||||||||||
|
Loan commitments and standby letters of credit
|
$
|
20
|
$
|
-
|
$
|
20
|
$
|
-
|
$
|
20
|
||||||||||
|
|
||||||||||||||||||||
|
Financial liabilities:
|
||||||||||||||||||||
|
Non-interest bearing deposits
|
$
|
152,888
|
$
|
152,888
|
$
|
-
|
$
|
-
|
$
|
152,888
|
||||||||||
|
Interest bearing deposits
|
1,101,070
|
-
|
1,099,937
|
-
|
1,099,937
|
|||||||||||||||
|
Long-term borrowings
|
2,300
|
-
|
2,642
|
-
|
2,642
|
|||||||||||||||
|
Junior subordinated debt
|
37,116
|
-
|
-
|
20,461
|
20,461
|
|||||||||||||||
|
Accrued interest payable
|
7,370
|
-
|
7,370
|
-
|
7,370
|
|||||||||||||||
|
|
||||||||||||||||||||
|
December 31, 2014
|
||||||||||||||||||||
|
Financial assets:
|
||||||||||||||||||||
|
Cash and due from banks
|
$
|
17,202
|
$
|
17,202
|
$
|
-
|
$
|
-
|
$
|
17,202
|
||||||||||
|
Interest-bearing deposits with banks
|
207,965
|
207,965
|
-
|
-
|
207,965
|
|||||||||||||||
|
Securities purchased under resell agreements
|
22,231
|
22,231
|
-
|
-
|
22,231
|
|||||||||||||||
|
Investments:
|
||||||||||||||||||||
|
Available for sale
|
216,022
|
-
|
216,022
|
-
|
216,022
|
|||||||||||||||
|
Held to maturity
|
11,775
|
-
|
11,947
|
-
|
11,947
|
|||||||||||||||
|
Non-marketable equity securities
|
6,984
|
N/A
|
N/A
|
N/A
|
N/A
|
|||||||||||||||
|
Loans held for sale
|
5,632
|
-
|
-
|
5,831
|
5,831
|
|||||||||||||||
|
Loans, net
|
885,764
|
-
|
-
|
889,031
|
889,031
|
|||||||||||||||
|
Accrued interest receivable
|
5,100
|
-
|
5,100
|
-
|
5,100
|
|||||||||||||||
|
Interest rate lock commitments, mandatory forward delivery commitments and pair offs
|
186
|
-
|
186
|
-
|
186
|
|||||||||||||||
|
|
||||||||||||||||||||
|
Off-balance-sheet instruments:
|
||||||||||||||||||||
|
Loan commitments and standby letters of credit
|
$
|
28
|
$
|
-
|
$
|
28
|
$
|
-
|
$
|
28
|
||||||||||
|
|
||||||||||||||||||||
|
Financial liabilities:
|
||||||||||||||||||||
|
Non-interest bearing deposits
|
$
|
144,503
|
$
|
144,503
|
$
|
-
|
$
|
-
|
$
|
144,503
|
||||||||||
|
Interest bearing deposits
|
1,138,089
|
-
|
1,142,657
|
-
|
1,142,657
|
|||||||||||||||
|
Long-term borrowings
|
22,300
|
-
|
23,001
|
-
|
23,001
|
|||||||||||||||
|
Junior subordinated debt
|
37,116
|
-
|
-
|
20,758
|
20,758
|
|||||||||||||||
|
Accrued interest payable
|
4,911
|
-
|
4,911
|
-
|
4,911
|
|||||||||||||||
Note 21. Other Noninterest Expense
Other noninterest expense items are presented in the following table for the years ended December 31, 2015, 2014 and 2013. Components exceeding 1% of the aggregate of total net interest income and total noninterest income are presented separately.
|
|
Year Ended December 31,
|
|||||||||||
|
|
2015
|
2014
|
2013
|
|||||||||
|
|
(In thousands)
|
|||||||||||
|
Other noninterest expenses
|
||||||||||||
|
Data processing
|
$
|
2,979
|
$
|
3,155
|
$
|
3,202
|
||||||
|
Marketing
|
1,335
|
1,119
|
1,181
|
|||||||||
|
Amortization and valuation of MSRs
|
1,393
|
1,672
|
219
|
|||||||||
|
Supplies
|
486
|
444
|
652
|
|||||||||
|
Postage
|
648
|
748
|
795
|
|||||||||
|
Bankcard and ATM network fees
|
1,872
|
2,169
|
1,458
|
|||||||||
|
Legal, professional and accounting fees
|
7,304
|
10,868
|
7,169
|
|||||||||
|
FDIC insurance premiums
|
3,087
|
3,211
|
2,944
|
|||||||||
|
Collection expenses
|
834
|
1,217
|
4,369
|
|||||||||
|
Other
|
3,443
|
4,714
|
2,987
|
|||||||||
|
Total noninterest expenses
|
$
|
23,381
|
$
|
29,317
|
$
|
24,976
|
||||||
Note 22. Subsequent Events
Purchase of Commercial Property.
In March 2016, the Bank formed Triscensions ABQ, LLC, a wholly owned subsidiary of the bank, for the purpose of acquiring, holding, and managing a commercial office building at 7445 Pan American Freeway, NE in Albuquerque, NM. The Bank intends to utilize approximately one quarter of the building for future banking offices with the remainder of the building leased to long term tenants. The Bank injected $5 million in initial capital into the new subsidiary, Triscensions ABQ, LLC. These funds were used to purchase the property and for funding future operations and possible renovations.
Stock Purchase Agreement.
On September 8, 2016, the Company entered into a stock purchase agreement with Castle Creek Capital Partners VI, L.P. (“Castle Creek”), Patriot Financial Partners II, L.P., Patriot Financial Partners Parallel II, L.P. (together with Patriot Financial Partners II, L.P., “Patriot”) and Strategic Value Bank Partners LLC, through its fund, Strategic Value Investors LP (“SVBP”, and collectively, the “Investors”), pursuant to which the Company expects to raise gross proceeds of approximately $52 million in a private placement transaction and to issue shares of the Company’s common stock at a purchase price of $4.75 per common share and shares of newly-created nonvoting noncumulative convertible perpetual Series C Preferred Stock at a purchase price of $475.00 per share of Series C Preferred Stock. Proceeds from the private placement transaction will be used to repurchase all of the outstanding Series A Preferred Stock and Series B Preferred Stock, to pay the deferred interest on our trust preferred securities, and for general corporate purposes. Closing of the private placement transaction is subject to the receipt of the necessary regulatory approvals or nonobjections for the use of proceeds described above. We currently anticipate that the private placement transaction will close in [October] 2016. There are no assurances that we will receive the necessary regulatory approvals or nonobjections or otherwise be able to close the private placement transaction.
In connection with the private placement, the Company entered into a registration rights agreement (the “Registration Rights Agreement”) with each of Castle Creek and Patriot. Pursuant to the terms of the Registration Rights Agreement, the Company has agreed to file a resale registration statement for the purpose of registering the resale of the shares of the Common Stock and Series C preferred stock issued in the private placement and the underlying shares of Common Stock or non-voting Common Stock into which the shares of Series C preferred stock are convertible, as appropriate. The Company is obligated to file the registration statement no later than the third anniversary after the closing of the private placement.
Pursuant to the terms of the stock purchase agreement, prior to closing, Castle Creek and Patriot will enter into side letter agreements with us. Under the terms of a side letter agreements, each investor will be entitled to have one representative appointed to our Board of Directors for so long as such investor, together with its respective affiliates, owns, in the aggregate, 5% or more of all of the outstanding shares of common stock (including shares of Common Stock issuable upon conversion of the Series C preferred stock or non-voting Common Stock).
Note 23. Condensed Parent Company Financial Information
The condensed financial statements of Trinity Capital Corporation (parent company only) are presented below:
Balance Sheets
|
|
December 31,
|
|||||||
|
|
2015
|
2014
|
||||||
|
|
(In thousands)
|
|||||||
|
Assets
|
||||||||
|
Cash
|
$
|
707
|
$
|
1,382
|
||||
|
Investments in subsidiaries
|
128,627
|
125,770
|
||||||
|
Other assets
|
7,944
|
16,993
|
||||||
|
Total assets
|
$
|
137,278
|
$
|
144,145
|
||||
|
|
||||||||
|
Liabilities and Stockholders' Equity
|
||||||||
|
Dividends payable
|
$
|
8,693
|
$
|
4,776
|
||||
|
Junior subordinated debt owed to unconsolidated trusts
|
37,116
|
37,116
|
||||||
|
Other liabilities
|
12,479
|
19,231
|
||||||
|
Stock owned by Employee Stock Ownership Plan (ESOP) participants
|
2,690
|
2,019
|
||||||
|
Stockholders' equity
|
76,300
|
81,003
|
||||||
|
Total liabilities and stockholders' equity
|
$
|
137,278
|
$
|
144,145
|
||||
Statements of Operations
|
|
December 31,
|
|||||||||||
|
|
2015
|
2014
|
2013
|
|||||||||
|
|
(In thousands)
|
|||||||||||
|
Dividends from subsidiaries
|
$
|
-
|
$
|
-
|
$
|
25
|
||||||
|
Interest and other income
|
161
|
475
|
463
|
|||||||||
|
Interest and other expense
|
(3,152
|
)
|
(3,320
|
)
|
(2,312
|
)
|
||||||
|
Income before income tax benefit and equity in undistributed net income of subsidiaries
|
(2,991
|
)
|
(2,845
|
)
|
(1,824
|
)
|
||||||
|
Income tax benefit
|
-
|
-
|
1,137
|
|||||||||
|
Loss before equity in undistributed net income of subsidiaries
|
(2,991
|
)
|
(2,845
|
)
|
(687
|
)
|
||||||
|
Equity in undistributed net income (loss) of subsidiaries
|
4,905
|
(3,147
|
)
|
13,550
|
||||||||
|
Net income (loss)
|
$
|
1,914
|
$
|
(5,992
|
)
|
$
|
12,863
|
|||||
|
Dividends and discount accretion on preferred shares
|
3,803
|
3,230
|
2,144
|
|||||||||
|
Net (loss) income available to common shareholders
|
$
|
(1,889
|
)
|
$
|
(9,222
|
)
|
$
|
10,719
|
||||
Statements of Cash Flows
|
December 31,
|
||||||||||||
|
2015
|
2014
|
2013
|
||||||||||
|
(In thousands)
|
||||||||||||
|
Cash Flows From Operating Activities
|
||||||||||||
|
Net income (loss)
|
$
|
1,914
|
$
|
(5,992
|
)
|
$
|
12,863
|
|||||
|
Adjustments to reconcile net income (loss) to net cash used in operating activities
|
||||||||||||
|
Amortization of junior subordinated debt owed to unconsolidated trusts issuance costs
|
14
|
14
|
14
|
|||||||||
|
Equity in undistributed net income (loss) of subsidiaries
|
(4,905
|
)
|
3,147
|
(13,550
|
)
|
|||||||
|
Decrease in taxes receivable from subsidiaries
|
9,051
|
1,139
|
1,137
|
|||||||||
|
Gain on sale of subsidiary
|
-
|
(56
|
)
|
-
|
||||||||
|
Decrease (increase) in other assets
|
9,036
|
828
|
(296
|
)
|
||||||||
|
Decrease in other liabilities
|
(18,442
|
)
|
(1,632
|
)
|
(1,994
|
)
|
||||||
|
Increase in TPS accrued dividend payable
|
2,559
|
2,340
|
-
|
|||||||||
|
Sale of subsidiary
|
-
|
(111
|
)
|
-
|
||||||||
|
Tax benefit recognized for exercise of stock options
|
-
|
-
|
1,376
|
|||||||||
|
Net cash used in operating activities
|
$
|
(773
|
)
|
$
|
(323
|
)
|
$
|
(450
|
)
|
|||
|
Cash Flows From Investing Activities
|
||||||||||||
|
Investments in and advances to subsidiaries
|
(100
|
)
|
290
|
42
|
||||||||
|
Net cash (used in) provided by investing activities
|
$
|
(100
|
)
|
$
|
290
|
$
|
42
|
|||||
|
Cash Flows from Financing Activities
|
||||||||||||
|
Issuance of treasury stock
|
198
|
100
|
-
|
|||||||||
|
Preferred shares dividend payments
|
-
|
-
|
(484
|
)
|
||||||||
|
Net cash provided by (used in) financing activities
|
$
|
198
|
$
|
100
|
$
|
(484
|
)
|
|||||
|
Net increase (decrease) in cash
|
(675
|
)
|
67
|
(892
|
)
|
|||||||
|
Cash:
|
||||||||||||
|
Beginning of year
|
1,382
|
1,315
|
2,207
|
|||||||||
|
End of year
|
$
|
707
|
$
|
1,382
|
$
|
1,315
|
||||||
None.
As discussed in the Company’s Annual Report on Form 10-K for the period ended December 31, 2014, filed on May 9, 2016, subsequent to the issuance of the Company’s consolidated financial statements on Form 10-Q as of and for the quarterly period ended June 30, 2012, the Company’s management determined that the Bank, the Company’s wholly owned bank subsidiary (the “Bank”), had not properly recognized certain losses and risks inherit in its loan portfolio on a timely basis as disclosed in the Company’s Current Report on Form 8-K Current Reports filed on November 13, 2012, April 26, 2013 and October 27, 2014 with the Securities and Exchange Commission (“SEC”). This failure was caused by the override of controls by certain former members of management and material weaknesses in internal control over financial reporting.
Management anticipates that its remedial actions, and further actions that are being developed, will strengthen the Company’s internal control over financial reporting and will, over time, address the material weaknesses that were identified. Certain of the remedial measures, primarily those associated with information technology systems, infrastructure and controls, may require ongoing effort and investment. Management has made technological improvements with the implementation of the new core systems in mid-July 2016. These new enhanced core systems will allow management to redesign processes and enhance controls. Because some of these remedial actions take place on a quarterly basis, their successful implementation must be further evaluated before management is able to conclude that a material weakness has been remediated. The Company cannot provide any assurance that these remediation efforts will be successful or that the Company’s internal control over financial reporting will be effective as a result of these efforts. Our management, with the oversight of the Audit Committee, will continue to identify and take steps to remedy known material weaknesses as expeditiously as possible and enhance the overall design and capability of our control environment.
To address the material weaknesses described below, the Company performed extensive procedures to ensure the reliability of its financial reporting. These procedures included independent review of loan grading, TDR recognition, accrual status, collateral valuations, impairment and required loan loss reserves. Additional procedures were conducted relating to accounts payable, journal entries and reconciliations, and access controls. The additional procedures were conducted at a detailed level and included the dedication of a significant amount of internal resources and external consultants. As a result, management believes that the consolidated financial statements and other financial information included in this Form 10-K fairly present, in all material respects, the Company’s financial condition, results of operations, and cash flows for the periods presented in accordance with GAAP.
Controls and Procedures
The Company maintains controls and procedures that are designed to ensure that information required to be disclosed in the Company’s Exchange Act reports is recorded, processed, summarized and reported within the time periods specified in the United States SEC’s rules and forms, and that such information is accumulated and communicated to the Company’s management to allow timely decisions regarding required disclosure based on the definition of “disclosure controls and procedures” in Securities Exchange Act Rules 13a-15 (e) and 15d-15(e).
The Company does not expect that its disclosure controls and procedures and internal control over financial reporting will prevent all errors or fraud. A control procedure, no matter how well conceived and operated, can provide only reasonable, not absolute, assurance that the objectives of the control procedure are met and management necessarily is required to apply its judgment in evaluating the cost-benefit relationship of possible controls and procedures. Because of the inherent limitations in all control procedures, no evaluation of controls can provide absolute assurance that all control issues and instances of fraud, if any, within the Company have been detected. These inherent limitations include the realities that judgments in decision-making can be faulty, and that breakdowns in controls or procedures can occur because of simple error or mistake. Additionally, controls can be circumvented by the individual acts of some persons, by collusion of two or more people, or by management override of the control. The design of any control procedure is based in part upon certain assumptions about the likelihood of future events, and there can be no assurance that any design will succeed in achieving its stated goals under all potential future conditions; over time, controls become inadequate because of changes in conditions, or the degree of compliance with the policies or procedures may deteriorate. Because of the inherent limitations in a cost-effective control procedure, misstatements due to error or fraud may occur and not be detected.
In connection with the preparation and filing of this Form 10-K, the Company, under the supervision and with the participation of the Company’s management, including the Company’s Chief Executive Officer and Chief Financial Officer, evaluated the effectiveness of the design and operation of the Company’s disclosure controls and procedures. In making its assessment of the effectiveness of the Company’s internal control over financial reporting, management used the 1992 framework issued by the Committee of Sponsoring Organizations of the Treadway Commission (“COSO”) in
Internal Control-Integrated Framework
. Based on this evaluation, the Company’s Chief Executive Officer and Chief Financial Officer concluded that the Company’s disclosure controls and procedures were not effective as of December 31, 2015, as a result of the material weaknesses in internal control over financial reporting as discussed below.
Management’s Report on Internal Control Over Financial Reporting
Management of the Company is responsible for establishing and maintaining adequate internal controls designed to provide reasonable assurance regarding the reliability of financial reporting and the preparation of financial statements for external purposes in accordance with GAAP. Internal control over financial reporting is defined in Rule 13a-15(f) under the Securities Exchange Act of 1934 as a process designed by, or under the supervision of, the Company’s principal executive and principal financial officers and effected by the Company’s Board of Directors, management and other personnel, to provide reasonable assurance regarding the reliability of financial reporting and the preparation of financial statements for external purposes in accordance with GAAP. Internal control over financial reporting includes those policies and procedures that: (1) pertain to the maintenance of records that, in reasonable detail, accurately and fairly reflect the transactions and dispositions of the assets of the Company; (2) provide reasonable assurance that transactions are recorded as necessary to permit preparation of financial statements in accordance with GAAP, and that receipts and expenditures of the Company are being made only in accordance with authorizations of Management and Directors of the Company; and (3) provide reasonable assurance regarding prevention or timely detection of unauthorized acquisition, use or disposition of the Company’s assets that could have a material effect on the financial statements. Management’s assessment of the effectiveness of internal control over financial reporting is based on the criteria established in the 1992
Internal Control
—
Integrated Framework
issued by the COSO.
All internal control systems, no matter how well designed, have inherent limitations. Internal control over financial reporting is a process that involves human diligence and compliance and is subject to lapses in judgment and breakdowns resulting from human failures. Internal control over financial reporting also can be circumvented by collusion or improper management override. Because of such limitations, there is a risk that material misstatements will not be prevented or detected on a timely basis by internal control over financial reporting. Further, because of changes in conditions, the effectiveness of internal control may vary over time. A material weakness is a deficiency (within the meaning of the Public Company Accounting Oversight Board (United States) Auditing Standard No. 5), or a combination of deficiencies in internal control over financial reporting, such that there is a reasonable possibility that a material misstatement of the Company’s annual or interim financial statements will not be prevented or detected on a timely basis.
In connection with the preparation and filing of this Form 10-K, the Company’s Management evaluated the effectiveness of the Company’s internal control over financial reporting as of December 31, 2015. Based on this evaluation, Management has concluded that there were control deficiencies in the Company’s internal control over financial reporting, which individually or in combination were considered material weaknesses as of December 31, 2015. Management has identified the following material weaknesses in the Company’s internal control over financial reporting as of December 31, 2015. Many of these weaknesses continue to be present.
| (1) |
Internal Control Environment.
Weaknesses in the control environment resulted in an environment in which management was able to override controls in the past, including:
|
| · |
Sufficient importance and attention was not given to developing, re-assessing and updating policies and procedures for financially significant areas.
|
| · |
Training historically focused on the performance of procedures without sufficient attention to the reason or importance of the procedures and controls.
|
| (2) |
Information Systems and Reports.
Weaknesses in the control environment over implementation, change management and monitoring of in-house systems were present, including:
|
| · |
For the third party application used to calculate trust fee income, management relied on the application without performing a review of the SOC/SSAE 16 report as well as the associated Complementary User Entity Controls.
|
| · |
A review of user access to financially significant applications had been initiated but not completed in its entirety in calendar year 2015. In addition, security events were not being tracked through available application logs for several of these applications.
|
| · |
The core system for loans and deposits did not provide the tools or reports necessary for management to implement an effective set of controls over account-level file maintenance changes.
|
| (3) |
Internal Audit and Risk Management.
The Company’s Internal Audit function did not provide adequate oversight and the Company’s Risk Management function lacked formality and structure as follows:
|
| · |
Progress occurred in 2015 after the reorganization of the Internal Audit function, but for the majority of the year the Company’s Internal Audit function did not provide adequate oversight due to an improper risk assessment process, inaccurate or outdated process and control documentation, untimely testing procedures, and insufficient monitoring over training of Internal Audit personnel. Risk assessment and audit procedures designed did not sufficiently address risks in financial reporting, although improvement occurred after this function was outsourced to a third party during the year.
|
| · |
Process and control documentation did not accurately reflect the actual processes and controls in place. In various cases, process and control flow charts include controls that were no longer applicable and do not reflect newly implemented controls.
|
| · |
Testing of Internal Controls over Financial Reporting was not completed in a timely manner.
|
| · |
The Company did not have a formal risk management function for the majority of 2015.
|
| (4) |
Financial Reporting.
The Company lacked sufficient staffing over the financial reporting function, resulting in reporting issues, errors and untimely financial reporting, as follows:
|
| · |
For the majority of the year the Company lacked sufficient qualified individuals within the financial reporting function. Prior to the arrival of these individuals, undue reliance was placed on results from regulatory and external examinations to identify financial reporting issues and errors.
|
| · |
Management reviews of control procedures designed to validate and detect errors at period end were informal in various cases and in most cases lacked the precision necessary to identify material errors.
|
| · |
Segregation of duties were not in place in several financially significant areas.
|
| · |
Period-end financial reporting procedures were informal and inconsistent for the majority of the year. Similarly, for the majority of the year management did not utilize checklists to:
|
| i. |
Track completion of month-end key reconciliations
|
|
ii.
|
Complete and review calculations affecting significant accounting estimates
|
|
iii.
|
Track compliance with GAAP and SEC reporting requirements.
|
|
iv.
|
Document the review of regulatory reporting requirements including call reports.
|
| · |
Subsequent event identification procedures were incomplete, resulting in untimely identifications and adjustments.
|
| · |
Controls over certain reconciliations were either not in place or not properly designed, resulting in one case where unidentified reconciling items and classification errors were not detected..
|
| · |
A control is not in place to validate the completeness of related party loan and deposit disclosures within both regulatory and financial reporting.
|
| (5) |
Allowance for Loan Losses.
Processes and controls designed to monitor loan quality and determine the allowance for loan loss reserve were inadequate as follows:
|
| · |
Reserve calculations and reports utilized to estimate required reserves were subject to informal control procedures, leading to weaknesses in the quality of documentation utilized by management to support loan impairments, specific reserve requirements, and qualitative adjustments.
|
| · |
Reports utilized by the Loan Risk Rating Committee were not subject to formal reviews to ensure that decisions are being made based on accurate and complete information.
|
| · |
Review of the allowance for loan loss calculation was informal and insufficiently precise, and the quality of documentation surrounding management’s analysis was low.
|
These material weaknesses impacted the Company’s ability to complete its financial statements in a timely manner.
Independent Registered Public Accounting Firm Attestation on Management’s Assessment of Internal Controls
As of result of a provision of the Dodd-Frank Act, which, among other things, permanently exempted non-accelerated filers, such as us, from complying with the requirements of Section 404(b) of the Sarbanes-Oxley Act of 2002, which requires an issuer to include an attestation report from an issuer’s independent registered public accounting firm on the issuer’s internal control over financial reporting, this Form 10-K does not include an attestation report of our registered public accounting firm regarding our internal control over financial reporting.
Changes in Internal Control over Financial Reporting
The Company determined the following preliminary steps were necessary to address the aforementioned material weaknesses, including:
| · |
The Company has replaced several members of senior management. Various officers of the Company, including several loan officers, left the Company, and the Company hired a new Chief Executive Officer, Chief Financial Officer, Chief Lending Officer, Chief Information Officer, Chief Wealth Strategies & Fiduciary Officer, Director of Internal Audit and Chief Credit Officer. Additional staff was added in the Compliance and Accounting & Finance Departments. In addition, the Company created the position of Chief Risk Officer and hired a qualified candidate who started with the Bank in 2016.
|
| · |
The Board of Directors appointed two new independent directors in 2015 and one new independent director in 2013 who serves as the Board Audit Committee Chair. The Board Audit Committee Chair possesses significant experience auditing large, sophisticated companies and has been designated by the Board as a qualified financial expert. John S. Gulas, Chief Executive Officer was appointed to the Board in 2014 and is the sole management director on the Board.
|
| · |
The Board of Directors is strengthening the Company’s control environment by ensuring that management has adopted a philosophy, operating style and general tone that promotes and reinforces the importance of internal controls and compliance. This is being accomplished through formal as well as informal communications from the Board and management, development and issuance of formal control procedures, and providing formal training to individuals responsible for the operation of controls.
|
| · |
The process and controls for the review of loans were reevaluated and restructured. Controls over loan review and grading ensure that all loans requiring review under the loan policy are reviewed, accurate loan grades are assigned, and grade changes, TDR status, loan impairments and charge-offs are recognized in a timely manner. Loans under common relationships will be evaluated by considering global, historic cash flows.
|
| · |
The Company has implemented a review and approval process over the periodic loan reviews that are completed by loan officers. These reviews will consider the information utilized, assumptions made, and conclusions reached by the loan officer.
|
| · |
The Company has restructured its loan review function. This function is now outsourced and conducted by external independent loan review personnel. This is intended to ensure independence from the Loan Department and that disagreements can be resolved by individuals who can render an unbiased opinion.
|
| · |
In 2015, the Audit Committee restructured the Internal Audit function to ensure independence and sufficient expertise through the hiring of a highly qualified Director of Internal Audit who has extensive banking experience in the internal audit area and the engagement of new highly qualified independent third party to provide internal audit services. The Director of Internal Audit reports directly to the Audit Committee of the Board as does the Chief Risk Officer, who has primary responsibility for the compliance area. The Internal Audit function is designed to be free from interference in determining the scope of internal auditing, performing work, and communicating results. Individuals who may be impacted by the Internal Audit, Risk Management or Compliance Department findings will not be put in a position to oversee the functions.
|
| · |
The Internal Audit function updated its risk assessments. The scope of testing performed by the department incorporates an assessment of the risks that could result in a misstatement of the Company’s financial statements. Qualified independent external resources have been engaged to perform audits and support to the Internal Audit staff.
|
| · |
The Company undergoing a conversion of its systems and tools used for compiling and issuing its financials to provide improved controls. The Company imposed controls relating to the segregation of duties and access rights to various systems and is continuing to refine those controls to ensure effectiveness. In addition, the Company is undergoing a conversion of its core systems from its internally developed system to a third-party service provider which is expected to improve controls.
|
The remediation plans identified above were in different stages of progress as of the date of this Form 10-K. Management anticipates that these remedial actions, and further actions that are being developed, when fully implemented will strengthen the Company’s internal control over financial reporting and will, over time, address the material weaknesses that were identified. Certain of the remedial measures, primarily those associated with information technology systems, infrastructure and controls, may require ongoing effort and investment. Because some of these remedial actions take place on a quarterly basis, their successful implementation must be further evaluated before management is able to conclude that a material weakness has been remediated. The Company cannot provide any assurance that these remediation efforts will be successful or that the Company’s internal control over financial reporting will be effective as a result of these efforts. Our management, with the oversight of the Audit Committee, will continue to identify and take steps to remedy known material weaknesses as expeditiously as possible and enhance the overall design and capability of our control environment.
None.
PART III
Board of Directors
Trinity’s Board of Directors (“the Board”) is divided into three classes with one class elected each year to serve for a three-year term. On June 22, 2015, the Boards of Trinity and the Bank appointed Gregory Antonsen as a director. The Company disclosed his appointment on a Form 8-K filed on June 24, 2015. On September 18, 2015, the Boards of Trinity and the Bank appointed Leslie Nathanson Juris as a director. The Company disclosed her appointment on a Form 8-K filed on September 21, 2015.
At the Shareholder Meeting held on January 22, 2015, two Class I directors, all incumbent nominees, were re-elected to serve until the Annual Meeting of Stockholders in 2016 or until their respective successors are elected or appointed and two Class II directors, both incumbent nominees, were re-elected to serve until the Annual Meeting of Stockholders in 2017 or until their respective successors are elected or appointed.
The following descriptions provide the background and qualifications for each director, including the year each became a director of Trinity and his or her positions with the Company. The age indicated for each individual is as of May 1, 2016. There are no family relationships among directors or executive officers of the Company.
GREGORY (“GREGG”) A. ANTONSEN
Director Since June 2015
Class I Director
Mr. Antonsen, age 62, has served as a member of the Boards of Directors of Trinity and the Bank since June 2015. Mr. Antonsen serves on the Nominating and Corporate Governance, Enterprise Risk Management and Compensation Committees. Mr. Antonsen is the Senior Vice President and Qualifying Broker at Sotheby’s International Realty Santa Fe. Mr. Antonsen has been at Sotheby’s International Realty since 2011. Prior to joining Sotheby’s International Realty, Mr. Antonsen served for eight years as Senior Vice President for Business Development with Christie’s International Real Estate, headquartered in Santa Fe, where he oversaw management of regional offices and business growth throughout North America. Mr. Antonsen was the founder of Antonsen, Garrett & Associates, Ltd., a boutique real estate firm in Hawaii and also conducted a solo law practice for ten years. Mr. Antonsen earned his Bachelors of Art degree from Gustavus Adolphus College in St. Peter, Minnesota and a Juris Doctorate from William Mitchell College of Law in St. Paul, Minnesota.
Mr. Antonsen brings more than 30 years of experience with real estate, marketing and management.
JAMES E. GOODWIN, JR.
Director Since 2013
Class III Director
Mr. Goodwin, age 68, has served as a member of the Boards of Directors of Trinity and the Bank since 2013. He is the Chair of the Audit Committee and serves as the audit committee financial expert, as defined under the SEC rules and regulations. Mr. Goodwin is also a member of the Board’s Executive, Compensation, Loan and Enterprise Risk Management Committees. He was a Partner in the firm of PricewaterhouseCoopers LLP (“PwC”) and served as a member of the firm’s U.S. Board of Partners and Principals. Mr. Goodwin currently serves on PwC’s Retired Partners Committee. Mr. Goodwin is a graduate of Virginia Polytechnic Institute and State University with a B.S. in Accounting and served on the Advisory Board for its College of Business-Department of Accounting and Information Technology. He was a Certified Public Accountant in various states from 1973 until his retirement in 2009.
Mr. Goodwin is a member of the Board of Directors of The National Dance Institute of New Mexico. He also serves as a member of the Audit Committee of the New Mexico State Investment Council. Mr. Goodwin served on the Board and as Treasurer of the Museum of New Mexico Foundation for a number of years and is currently a member of its Advisory Board. He was a member of the Boards of the School of Advance Research and the Cancer Foundation of New Mexico, both located in Santa Fe. Mr. Goodwin served as President of the Alzheimer’s Association/Greater Houston Chapter and as the Treasurer of the Big Brothers/Big Sisters of Greater Memphis. He also served on the Boards of these organizations as well as the National Conference of Christians and Jews, Memphis Chapter, and the Japan/American Society of Houston.
Mr. Goodwin brings extensive accounting, auditing, financial reporting and risk management experience to the Board. He served at PwC for over 39 years in a wide range of U.S. and Global leadership, audit and risk management positions and served as the lead engagement partner on a number of PwC’s largest clients. During his career at PwC, Mr. Goodwin worked closely with senior management, boards of directors and audit committees of large multinational companies and his experience provides him with a unique perspective of the complex issues facing businesses.
JOHN S. GULAS
Director since 2014
Class II Director
Mr. Gulas, age 57, has
served as a member of
the Boards of Directors of Trinity and the Bank since May 2014. Mr. Gulas also serves as the Chief Executive Officer and President of Trinity and the Bank. Mr. Gulas is a member of the Executive, Loan, Enterprise Risk Management, and Trust and Investment Committees. Prior to joining Trinity and the Bank, Mr. Gulas served as President and Chief Executive Officer for Farmers National Bank headquartered in Canfield, Ohio from 2010 to 2014, and served as Chief Operating Officer for Farmers National Bank from 2008 to 2010. Mr. Gulas served as President and Chief Executive Officer for Sky Trust, Co, N.A., a subsidiary of Sky Financial from 2005 to 2007. In his 26-year banking career, Mr. Gulas has also held executive positions at UMB, Wachovia Corporation, and KeyCorp. Mr. Gulas is a graduate of Youngstown State University and the University of Toledo College of Law.
Mr. Gulas has also been very active in business development and charitable organizations. These activities included serving as a Director of the Regional Chamber Foundation in Youngstown/Warren, Ohio, the Better Business Bureau, the Mahoning Valley Economic Development Corporation, the Ohio Bankers League, the Youngstown Business Incubator, the Ohio Foundation of Independent Colleges, the Achievement Centers for Children, the Museum of Labor and Industry, the Great Trail Girl Scout Council, the Kansas City Arts Council Advisory Board, the Dayton Ballet and the Atlanta Ballet.
Mr. Gulas currently serves as a director for the Santa Fe Chamber of Commerce, the Los Alamos Commerce and Development Corporation, the New Mexico Bankers Association, and the Los Alamos National Laboratory Foundation.
Mr. Gulas brings extensive banking, management and strategic planning experience to the Board and the management of Trinity and the Bank. Mr. Gulas has a track record of improved performance, increasing stockholder value and growth in a community bank environment. Mr. Gulas was recognized by the American Bankers Association for leading Farmers National Bank to national acclaim as one of the top community banks in the country, and under Mr. Gulas’ management in 2013 and 2014, Farmers National Bank was named by Bank Director magazine as one of the best banks with $1-5 billion in assets.
JEFFREY F. HOWELL
Director Since 2002
Class III Director
Ms. Howell, age 63, has served as a member of the Boards of Directors of Trinity and the Bank since 2002 and was Chair of the Board of Trinity from 2004 to 2008. She was the Chair of the Audit Committee from 2003 to 2014. Ms. Howell is the Chair of the Board’s Enterprise Risk Management Committee and a member of the Board’s Audit and Trust and Investment Committees. She was President and Chief Executive Officer of Howell Fuel and Lumber Company, Inc., headquartered in Wallkill, New York. She was the founder and managing Director of Howell Meyers Associates from 1997 to 2001, was employed in various capacities at Harvard University from 1985 to 1991, including as Associate Director for Administration at Harvard College Observatory and Assistant Dean for Financial Operations in the Faculty of Arts and Sciences. She was an accountant in the Emerging Business Systems Group at Coopers & Lybrand from 1982 to 1984 after receiving her Masters of Business Administration from Yale University.
Ms. Howell is active in charitable and community organizations. She is a member of the Board of Directors of the Los Alamos National Laboratory Foundation of which she is a past President, President of The Delle Foundation, member of the League of Women Voters of Los Alamos, a member of the J. R. Oppenheimer Memorial Committee and a past Dog Handler and Search and Rescue volunteer for the Mountain Canine Corps K-9 Unit of the Pajarito Ski Patrol. Ms. Howell is also Chair of the Lady Bird Johnson Wildflower Center Advisory Council of the University of Texas at Austin.
LESLIE NATHANSON JURIS
Director Since September 2015
Class II Director
Ms. Nathanson Juris, age 70, has served as a member of the Boards of Directors of Trinity and the Bank since September 2015. Ms. Nathanson Juris serves as a member of the Board’s Enterprise Risk Management and Nominating and Corporate Governance Committees. Ms. Nathanson Juris is the Founder and has been Managing Director of Nathanson/Juris Consulting, which advises corporate executives on issues of strategy, leadership, and organizational and personal performance. She continues to serve as an active consultant with her firm. Ms. Nathanson Juris has extensive experience in serving on corporate boards, including serving as Board Member for Ameristar Casinos, Inc. from 2003 to 2013; as Advisory Board Member to Chas. Levy Company, LLC from 1999 to 2011; Advisory Board Member to Successories from 2000 to 2003; and as a Board Member to Quill from 1995 to 1998. Ms. Nathanson Juris also has extensive experience serving on non-profit boards, including National Dance Institute, New Mexico (NDInm) from 2003 to present; Emeritus Director to Creativity for Peace from 2005 to present; and as Advisory Board Member for BeCause Foundation from 2007 to present.
Ms. Nathanson Juris earned her Ph.D. in Organizational Behavior and Labor Relations from the Kellogg School of Management in 1979 and a Master’s Degree from Northwestern University in 1975. She served as an Adjunct Professor at Kellogg School of Management from 1999 to 2010, teaching executives from many industries, including Banking, courses in leadership, strategy and change management. Ms. Nathanson Juris earned her Bachelor’s Degree from Tufts University.
Ms. Nathanson Juris brings this extensive experience and knowledge of leadership, business strategy and change management to the Boards of Trinity and the Bank.
JERRY KINDSFATHER
Director Since 1984
Class II Director
Jerry Kindsfather, age 66, has served as the Chair of the Board of Directors of Trinity since June 2012 and previously served as Chairman from 2000 to 2004. Mr. Kindsfather has served as the Chair of the Board of Directors of the Bank since February 2013. Mr. Kindsfather has served as a member of the Boards of Directors of Trinity and the Bank since 1984 and as a member of the Board of Directors of Title Guaranty since May 2000. He is the Chair of the Executive and Loan Committees and a member of the Compensation and Enterprise Risk Management Committees. Mr. Kindsfather retired in November 2003 after serving as President of AKC, Inc. since 1970 and as co-owner of Ed's Foods, a retail grocery store located in Los Alamos, New Mexico. Mr. Kindsfather is a partner in J&G Investments and is a managing member of KKSE, LLC.
Mr. Kindsfather has business management experience and experience as a small business owner. Mr. Kindsfather has extensive accounting and financial expertise. Mr. Kindsfather has significant experience serving as a director for Trinity for 32 years.
ARTHUR B. MONTOYA, JR.
Director Since 2001
Class III Director
Dr. Montoya, age 52, has served as a member of the Boards of Directors of Trinity and the Bank since 2001. Dr. Montoya has served as Secretary for the Bank since 2012 and as Secretary for Trinity since 2015. He is Chair of the Board's Nominating and Corporate Governance Committee and is a member of the Board's Audit and Trust and Investment Committees. Dr. Montoya runs a successful dental practice in Los Alamos, New Mexico.
Dr. Montoya has been on the Pajarito Homeowners' Association Board of Directors and is a past Chairman, taught religious education at Immaculate Heart of Mary Catholic Church, is a past Chairman and a member of the Board of Directors of the Los Alamos Chamber of Commerce, a past member of the Board of Directors for the Los Alamos Historical Society, a past Chairman and member of the Board of Directors for the Los Alamos Medical Center, is active in the Northern New Mexico Interdisciplinary Study Club, has coached little league girls basketball at the Los Alamos Middle School, assisted with the Los Alamos Fusion Volleyball Club, and is involved with Special Olympics Los Alamos.
Dr. Montoya provides insight from his experience as a small business owner as well as from the dental and general medical community. Dr. Montoya has served the community through his participation in various boards and organizations.
CHARLES A. SLOCOMB
Director Since 1999
Class I Director
Mr. Slocomb, age 69, has been a member of the Boards of Directors of Trinity and the Bank since 1999. Mr. Slocomb has served as Vice-Chairman of the Board of Trinity and the Bank since 2014. Mr. Slocomb is a member of the Board's Enterprise Risk Management, Loan, Executive, Nominating and Corporate Governance and Audit Committees. He retired from the Los Alamos National Laboratory in August 2004 and is currently employed by COMPA in Los Alamos mostly doing consulting work for the NNSA in the area of high performance computing. He held various management positions at the Laboratory, including Project Director, Division Director and Group Leader. He also serves as a member of the Road Committee of Laguna Vista Land Owners Association and as a volunteer firefighter for the Laguna Vista Volunteer Fire Department.
Mr. Slocomb’s qualifications include his expertise in technology and computing, including data security. Mr. Slocomb lived in Los Alamos for 30 years before moving to Santa Fe in 2004. He has extensive knowledge about our communities and the Laboratory, which constitutes a major employer and business in the Company’s markets.
ROBERT P. WORCESTER
Director Since 1995
Class II Director
Mr. Worcester, age 69, has been a member of the Boards of Directors of Trinity and the Bank since 1995 and served as the Chairman of the Board of Directors from 2008 to 2012. Mr. Worcester served as the Vice Chairman of the Board from 2004 to 2008. Mr. Worcester is the Chair of the Compensation and Trust and Investment Committees. He is also a member of the Audit and Loan Committees. Mr. Worcester retired in October 2014 after practicing law for 40 years. Mr. Worcester most recently practiced at the firm of Sommer Udall Sutin Law. He was previously the President and a 50% stockholder of Worcester & McKay, LLC which merged with Sommer Udall Sutin Law in 2013. Mr. Worcester has been recognized by "The Best Lawyers in America" for the last 21 years and was recently recognized by "Outstanding Lawyers in America" and in "Super Lawyers of the Southwest." He is also a Fellow of the American College of Trust and Estate Council since 1988 and past President of the Santa Fe Estate Planning Council. He is the past President of the Georgia O'Keefe Foundation, a past member and Secretary of the Board of Directors of the Veritas Foundation, and a past member and Secretary of the Board of Directors of the Don and Susan Meredith Foundation. In addition, Mr. Worcester serves as a member of the Board of Directors and President of the Peters Family Art Foundation, as a member of the Board of Directors and as President of the John Bourne Foundation, and as a member of the Board of Directors and Secretary of the Allan Houser Foundation.
Mr. Worcester’s qualifications include his knowledge and expertise as a trust and estate attorney. Mr. Worcester has knowledge of a broad range legal and business issues. Mr. Worcester also serves the communities through professional, educational and community service organizations.
Executive Officers
John S. Gulas
. See “Board of Directors” above.
Daniel W. Thompson.
Mr. Thompson, age 64, has served as Chief Financial Officer of Trinity and the Bank since October 27, 2015. Mr. Thompson was previously employed as Executive Vice-President and Chief Financial Officer at United Central Bank in Garland, Texas from August 2012 to August 2014 when United Central was acquired by Hamni Bank where Mr. Thompson served as Executive Vice-President and Regional Chief Financial Officer from September 2014 to March 2015. Mr. Thompson also served as Executive Vice-President and Chief Financial Officer for Providence Bank in Columbia, Missouri from October 2010 to May 2012 and Premier Bank in Jefferson City, Missouri where he served as Senior Vice-President and Corporate Treasurer from June of 2007 to October of 2010. Mr. Thompson is a Certified Public Accountant and is an active member of the American Institute of Certified Public Accountants. Mr. Thompson holds a Bachelor of Business Administration degree from the University of Oklahoma.
Anne H. Kain.
Ms. Kain, age 43, serves as Vice President Accounting and Finance for the Bank, having previously served as Interim Chief Financial Officer of Trinity and the Bank from September 12, 2014 to October 27, 2015. Ms. Kain was previously employed at the Bank as V
ice-President and Cashier of the Bank from 2011 to September 2014, Cashier from 2004 to 2011, Assistant Cashier from 2002 to 2004, and Senior Accountant from 2000 to 2001. Ms. Kain earned her Masters of Business Administration and Bachelor of Business Administration degree in Finance from the University of New Mexico Anderson School of Business. Ms. Kain has been active in the community, serving on the Board of Directors for Quality New Mexico since 2011 and Espanola Valley Humane Society since 2011. As of August 2016 Anne Kain is no longer employed at the Bank.
Thomas M. Lilly.
Mr. Lilly, age 57, has served as Chief Credit Officer of Los Alamos National Bank since July 2013. Mr. Lilly was previously employed as Chief Credit Officer at The National Bank in Bettendorf, Iowa from August 2009 to July 2013. Mr. Lilly as served as the Chief Credit Officer of West Valley National Bank in Goodyear, Arizona from January 2008 to January 2009. Mr. Lilly has over 30 years’ experience as a commercial lender and Chief Credit Officer.
Yin Y Ho.
Mr. Ho, age 64, has served as Chief Information Officer since September 29, 2014. Mr. Ho was previously employed as Executive Vice President and Chief Information Officer at OmniAmerican Bank in Fort Worth, Texas since October 2008 until the bank was acquired by Southside Bank of Tyler, Texas. Mr. Ho has performed key leadership roles as Chief Information Officer, Chief Information Security Officer, Technology Risk Management, and Enterprise Architect for IBM, Dell, Grant Thornton, Blockbuster, and Financial Institutions. He is a frequent speaker for Banking and Finance Industry group in governance, risk, and cybersecurity areas, and was a adjunct professor at University of Texas in Arlington and University of North Texas. Mr. Ho is the author of a network technology book and has served as publisher/editor-in-chief of information technology magazines. Mr. Ho holds a BS from University of Wisconsin, an MS in Computer Science from North Dakota State University, and holds CIPP, CISA, CISM, CGEIT, and CISSP certification.
Other Relationships
There are no arrangements or understandings between any of the directors or executive officers and any other person pursuant to which any of Trinity’s directors or executive officers have been selected for their respective positions. No director or executive officer is related to any other director or executive officer. No director is a director of another “public corporation” (i.e. subject to the reporting requirements of the Exchange Act) or of any investment company.
Section 16(a) Beneficial Ownership Reporting Compliance
Section 16(a) of the Exchange Act requires that the directors, executive officers and persons who own more than 10% of Trinity’s common stock file reports of ownership and changes in ownership with the SEC. These persons are also required to furnish the Company with copies of all Section 16(a) forms they file. Based solely on Trinity’s review of the copies of such forms furnished to it and, if appropriate, representations made by any reporting person concerning whether a Form 5 was required to be filed for 2015, all reports required to be filed under Section 16(a) during 2015 were timely filed.
Code of Conduct
All directors and employees of Trinity and all of its subsidiaries’, including Trinity’s principal executive officer, principal financial officer and principal accounting officer or persons performing similar functions, are required to abide by Trinity’s Code of Conduct (the “Code of Conduct”). Trinity does not maintain a separate code of ethics applicable solely to its directors, principal executive officer, principal financial officer and/or its principal accounting officer or the persons performing similar functions. The Code of Conduct requires that the directors, executive officers, and employees of Trinity and its subsidiaries, avoid conflicts of interest, comply with all laws and other legal requirements, conduct business in an honest and ethical manner, and otherwise act with integrity and in Trinity’s best interests. Under the terms of the Code of Conduct, directors, executive officers and employees are required to report any conduct that they believe in good faith to be an actual or apparent violation of the Code of Conduct.
Trinity’s Code of Conduct is available on its website
(www.lanb.com)
at
https://www.lanb.com/docs/default-source/TCC/code-of-conduct-(2016-03-18).pdf?sfvrsn=6
. Trinity intends to satisfy the disclosure requirements under Item 5.05 of Form 8-K regarding any amendment to or waiver of the Code of Conduct by posting such information on its website. No waivers to Trinity’s Code of Conduct were granted or made in 2015.
Corporate Governance
Director Independence; Board Leadership Structure.
It is Trinity’s policy that the Board of Directors consists of a majority of independent directors. The Board has determined that each of Goodwin, Kindsfather, Montoya, Jr., Slocomb, Worcester and Antonsen and Mmes. Howell and Nathanson Juris is “independent,” as defined by NASDAQ. In making these determinations, the Board was aware of and considered the loan and deposit relationships with directors and their related interests with which the Bank enters into in the ordinary course of business, and any other arrangements which would fall within the provisions described under Certain Relationships and Related Transactions, and Director Independence in Item 13 below.
While not prohibited by its Bylaws, Trinity’s leadership structure since inception has been organized such that the positions of Chairman of the Board and the Chief Executive Officer are filled by two different persons. Currently, Jerry Kindsfather serves as Chairman and John S. Gulas serves as Chief Executive Officer.
Nominating and Corporate Governance Committee.
The members of the Nominating and Corporate Governance Committee consist of Dr. Montoya (Chair), Antonsen and Slocomb and Ms. Nathanson Juris. The Board has determined that each member of the Committee is “independent,” as defined by the SEC and NASDAQ. The purpose of the Committee is to evaluate and recommend to the Board nominees for consideration by Trinity’s stockholders to serve as directors and to review and analyze the corporate governance policies and practices of Trinity. The Committee has adopted a written charter, which can be found on the Bank’s website at
https://www.lanb.com/home/tcc-investor-relations/tcc-ncgc-charter
setting forth the Committee’s duties and functions.
Nominating Process.
There have been no changes to the procedures by which our shareholders may recommend nominees to the Board since such procedures were disclosed in our Annual Report on Form 10-K for the year ended December 31, 2014 filed with the SEC on May 9, 2016.
Audit Committee.
Mr. Goodwin (Chair), Dr. Montoya, Slocomb, and Worcester and Ms. Howell currently serve on the Audit Committee. The Board has determined that Mr. Goodwin is an “audit committee financial expert” as defined under the SEC rules and regulations. Each member of the Audit Committee is “independent” as that term is defined in the rules of NASDAQ and met the criteria for independence set forth in Rule 10A-3 of the Exchange Act. The Board has determined that each Audit Committee member is financially literate
.
The Audit Committee of the Company also serves as the Audit Committee for the Bank.
The responsibilities of the Audit Committee include the following:
|
●
|
Selecting and retaining Trinity’s independent registered public accounting firm, approval of the services they will perform and review of the results, both with management and in executive session with the independent registered public accounting firm;
|
|
●
|
Reviewing the performance of the independent registered public accounting firm;
|
|
●
|
Reviewing with management and the independent registered public accounting firm the systems of internal controls, including the adequacy and effectiveness of the systems of internal control over financial reporting and any significant changes in internal control over financial reporting, accounting practices and disclosure controls and procedures;
|
|
●
|
Reviewing annual and quarterly financial statements and other Trinity filings;
|
|
●
|
Reviewing internal audit reports and associated controls;
|
|
●
|
Instituting procedures for the receipt, retention and treatment of complaints received by Trinity regarding accounting, internal accounting controls or auditing matters; and
|
|
●
|
Assisting the Board in the oversight of:
|
|
o
|
the integrity of Trinity’s consolidated financial statements and the effectiveness of Trinity’s internal control over financial reporting; and
|
|
o
|
the independent registered public accounting firm’s and Internal Auditor’s qualifications and independence.
|
The Audit Committee will also carry out any other responsibilities delegated to the Audit Committee by the full Board. The Committee has adopted a written charter which can be found at the Bank’s website at
https://www.lanb.com/home/tcc-investor-relations/tcc-audit-committee
setting forth the Audit Committee’s duties and functions.
Compensation Committee.
Worcester (Chair), Antonsen, Goodwin, and Kindsfather serve on the Compensation Committee. The Board of Directors has determined that each member of the Compensation Committee is “independent” as that term is defined by the SEC and NASDAQ. These committee members are “outside” directors under Section 162(m) of the Internal Revenue Code of 1986 and all are non-employee directors pursuant to Section 16 of the Exchange Act. The Compensation Committee has a written charter which may be found on the Bank’s website at
https://www.lanb.com/home/tcc-investor-relations/tcc-compensation-committee
. The Compensation Committee of the Company also serves as the Compensation Committee of the Bank.
The Compensation Committee is responsible for making recommendations to the Board regarding (and, in some cases, setting) compensation and incentive compensation awards and plans, and other forms of compensation for senior management as well as the contributions toward short- and long-term incentive compensation for all employees. The Compensation Committee is also responsible for reviewing and making recommendations to the full Board for all matters pertaining to compensation paid to directors for Board, committee and committee Chair services. The Compensation Committee, in accordance with its obligations under applicable rules and regulations of the federal banking regulators, periodically reviews and assesses the Company’s compensation plans to ensure that the risk-taking behavior incentivized by such plans is kept to an appropriate level. The Compensation Committee will, as necessary, amend or discontinue any plan or revise any company policy or procedure to meet its obligations under applicable rules and regulations of the federal banking regulators. The Compensation Committee also approves the Compensation Committee Report.
Executive Compensation
Summary Compensation Table.
During 2015, the Company’s named executive officers (“NEOs”) were as follows: John S. Gulas, Daniel W. Thompson, Thomas M. Lilly, Yin Y Ho, and Anne H. Kain. The following table contains the summary of compensation awarded to, paid to or earned by the NEOs in 2015. The NEOs are compensated by the Bank.
|
Name and
Principal Position
|
Year
|
Salary
($)
|
Bonus
($)
|
Stock
Awards (1)
($)
|
All Other
Compensation
($)
|
Total
($)
|
||||||||||||||||
|
John S. Gulas,
Chief Executive
|
2015
|
407,692
|
-
|
-
|
39,492
|
$
|
447,184
|
|||||||||||||||
|
Officer of Trinity and the Bank (2)
|
2014
|
223,077
|
-
|
50,000
|
91,643
|
$
|
364,720
|
|||||||||||||||
|
Daniel W. Thompson,
Chief
Financial Officer of Trinity and the Bank (3)
|
2015
|
125,192
|
-
|
-
|
17,804
|
$
|
142,996
|
|||||||||||||||
|
Anne H. Kain,
Interim Chief
|
2015
|
132,500
|
74,885
|
-
|
-
|
$
|
207,388
|
|||||||||||||||
|
Financial Officer of Trinity and the Bank (4)
|
2014
|
129,948
|
10,000
|
-
|
-
|
$
|
139,948
|
|||||||||||||||
|
Thomas M. Lilly,
Chief Credit Officer of the Bank
|
2015
|
233,914
|
-
|
-
|
-
|
$
|
233,914
|
|||||||||||||||
|
Yin Y Ho,
Chief Information Officer of the Bank (5)
|
2015
|
199,712
|
-
|
-
|
2,003
|
$
|
201,716
|
|||||||||||||||
| (1) |
Amounts reported in this column reflect the aggregate grant date fair value of restricted stock units (“RSUs”), computed in accordance with ASC Topic 718. The assumptions used in calculating these amounts are set forth in Note 13 to this Form 10-K.
|
| (2) |
Mr. Gulas was hired as Chief Executive Officer and President of Trinity and the Bank on May 29, 2014. Other Compensation paid to Mr. Gulas in 2015 consists of an annual vehicle allowance ($9,000), moving expenses ($26,792), and temporary housing ($3,700). Other Compensation paid in 2014 consists of an annual vehicle allowance ($4,500), moving expenses ($41,717), one-half of the realtor fee on his prior residence ($11,994) and temporary housing expenses ($33,432).
|
| (3) |
Mr. Thompson was hired on July 7, 2015 and was appointed Chief Financial Officer on October 27, 2015. Other Compensation paid in 2015 consists of cell phone allowance ($554) half of the realtor fee on his prior residence ($17,250).
|
| (4) |
Ms. Kain served as Interim Chief Financial Officer of Trinity and the Bank from September 4, 2014 to October 27, 2015 and October 19, 2015, respectively. Ms. Kain’s bonus consisted of a discretionary performance bonus.
|
| (5) |
Mr. Ho was hired on September 29, 2014 as the Chief Information Officer. Other compensation consists of moving expenses ($2,003).
|
Mr. Gulas did not receive an increase in salary for 2015, nor did Ms. Kain. Mr. Gulas and certain other senior officers of the Bank are eligible for incentive-based compensation to be earned in 2015 pursuant to the 2015 Long-Term Incentive Plan and the Incentive Compensation Program. Awards pursuant to these plans are both discretionary and based upon performance metrics. The performance metrics are aimed at encouraging growth and increasing profitability and ensuring appropriate risk management. In addition, the equity awards will vest over a three-year period and require profitability in subsequent years as a prerequisite to vesting, among other requirements. Awards made under these plans are subject to recoupment by the Company in the event of a material error or the necessity for a restatement of the data upon which the award was based.
Grants of Plan-Based Awards.
There were no grants to any NEO in 2015.
Outstanding Equity Awards as of 2015 Year-End.
The following table provides information as of December 31, 2015 regarding outstanding equity awards held by the NEOs.
|
Name
|
Number of
Securities
Underlying
Unexercised
Options
(#)
Exercisable
|
Number of
Securities
Underlying
Unexercised
Options
(#)
Unexercisable
|
Option
Exercise
Price
($)
|
Option
Expiration
Date
|
Number of
Shares or
Units of
Stock That
Have Not
Vested (1)
(#)
|
Fair
Value of
Shares or
Units of
Stock
That
Have Not
Vested (2)
($)
|
||||||||||||||||||
|
John S. Gulas
|
-
|
-
|
-
|
-
|
11,765
|
47,060
|
||||||||||||||||||
|
(1)
|
All awards reflected in this column will vest 100% on the second anniversary of grant, June 3, 2016.
|
| (2) |
The fair value is based upon the last reported sale price of the Company common stock on December 31, 2015 of $4.00 per share.
|
The Company awarded Mr. Gulas 6,000 shares of unrestricted common stock on February 24, 2015, the fair value of which was $24,000 based upon the last reported sale price of the Company common stock on February 24, 2015 of $4.00 per share. This award was based upon Mr. Gulas’ performance in 2014. No other executive officer was awarded equity in 2015.
Employment Agreements.
During 2015, the Company had in place employment agreements with Mr. Gulas, Mr. Thompson, and Ms. Kain. The Company entered into these agreements to provide certainty in the relationships between the Company and these key employees in relation to their positions, as well as to establish non-compete and non-solicitation agreements and change in control provisions. The key provisions of these agreements are summarized immediately below and in the
“Potential Payments upon Termination or Change in Control”
section below. These summaries are qualified in their entirety by reference to the full employment agreements, copies of which are filed as exhibits to this Form 10-K. Ms. Kain’s term of employment under the agreement expired on October 27, 2015.
The Company’s employment agreements contain non-competition, non-solicitation, non-disparagement and confidentiality provisions, equitable enforcement provisions, and dispute resolution provisions. Mr. Gulas’ employment agreement also requires him to provide 90 days’ notice of intent to terminate employment voluntarily. Ms. Kain’s employment agreement provides for the forfeiture and claw-back of the salary differential amounts described therein in the event that she terminates her employment prior to sixty (60) days following the appointment of a permanent Chief Financial Officer. These provisions were consideration to induce the Company to enter into the agreements and, thus, any benefit conferred by the employment agreements is conditioned on the honoring of these terms by the executive. Each of the Company’s employment agreements referenced above precondition the receipt of any severance pay or other benefits upon a general release of claims against the Company and the Bank.
The employment agreements also include a provision that requires the adjustment or recovery of awards or payments upon restatement or other adjustment of relevant company financial statements or performance metrics. Thus, to the extent that such adjustment or recovery is required under applicable securities or other law, the Company’s employment agreements provide that the executive will make restitution.
New CFO Employment Agreement.
On October 19, 2015, the Bank entered into a two-year employment agreement with Daniel W. Thompson, Chief Financial Officer of the Bank. On October 27, 2015, the Company and the Bank entered into a two-year employment agreement with Mr. Thompson, Chief Financial Officer of the Company and the Bank. The agreement will extend automatically each year for additional one-year periods beginning on the first anniversary of its effective date, unless either party chooses not to extend the term. Mr. Thompson’s initial annual base salary under the agreement will be $262,500, and he will participate in the benefit plans currently available to Bank employees and be entitled to certain additional benefits including temporary housing expenses, reimbursement of certain moving expenses and realtor fees up to a total of $45,000. Mr. Thompson is eligible to participate in the Company’s incentive plans, including the 2015 Long-Term Incentive Plan at a level of thirty percent (30%) of Base Salary, subject to the terms and conditions of the Plan and as approved by the Board.
Under his employment agreement, Mr. Thompson is entitled to a severance payment equal to 12 months of base salary in the event of an involuntary termination in connection with a change in control or a voluntary termination within 30 days following a change in control. All severance payments due to Mr. Thompson under his agreement are contingent upon his execution of a general release of claims against Trinity and the Bank. All payments due to Mr. Thompson under the agreement will be limited in order to avoid application of an excise tax under Internal Revenue Code Section 280G. Mr. Thompson’s employment agreement also contains non-competition, non-solicitation, non-disparagement and confidentiality provisions, and equitable enforcement provisions.
Potential Payments upon Termination or Change in Control.
As of December 31, 2015, the Bank is deemed to be in “troubled condition” by virtue of the regulatory enforcement actions, and as a result, we are required to comply with certain restrictions on severance payments under the applicable rules and may be prohibited from making some or all of the payments reflected in the table below in connection with an employment termination. However, the table below sets forth the estimated amount of incremental compensation payable to each of the NEOs upon different employment termination and change in control scenarios as though the troubled condition rules did not apply. The amounts shown assume the hypothetical payment event was effective as of December 31, 2015, and that the price of the Company’s common stock was the closing price of $4.00 on December 31, 2015 (the last trading day of the year).
|
Potential Payment Event
|
John S. Gulas
|
Daniel W. Thompson
|
|||||||
|
Voluntary Termination (including Retirement)
|
None
|
None
|
|||||||
|
Termination without Cause (no Change in Control)
|
None
|
None
|
|||||||
|
Termination for Cause (no Change in Control)
|
None
|
None
|
|||||||
|
Involuntary Termination following Change in Control
|
$
|
447,060
|
(1) |
$
|
262,500
|
(2) | |||
|
Termination Due to Death or Disability
|
$
|
47,060
|
(3) |
$
|
0
|
||||
|
Change in Control (no Termination)
|
$
|
47,060
|
(3) |
$
|
0
|
||||
| (1) |
Under his employment agreement, Mr. Gulas is entitled to a lump sum payment equal to 12 months of his annual base salary in the event of a termination of his employment (a) by the Company without cause within 12 months following a change in control of the Company, (b) by him for good reason (as defined in his agreement) within 12 months following a change in control of the Company, or (c) by him for any reason within 30 days following a change in control of the Company.
|
| (2) |
Under his employment agreement, Mr. Thompson is entitled to a lump sum payment equal to 12 months of his annual base salary in the event of a termination of his employment (a) by the Company without cause within 12 months following a change in control of the Company, (b) by him for good reason (as defined in his agreement) within 12 months following a change in control of the Company, or (c) by him for any reason within 30 days following a change in control of the Company.
|
| (3) |
The outstanding RSUs awarded to Mr. Gulas under the 2015 Plan would vest 100% upon Mr. Gulas’ termination without cause on or following a change in control of the Company.
|
All change in control payments due to Mr. Gulas and Mr. Thompson are limited in order to avoid application of an excise tax under Internal Revenue Code Section 280G.
Tax and Accounting Considerations.
In consultation with advisors, the tax and accounting treatment of each of the Company’s compensation programs is evaluated at the time of adoption and, as necessary, with changes in tax or other applicable rules or conditions making such a review prudent to ensure we understand the financial impact of each program on the Company and the value of the benefit provided to the Company’s officers and employees.
Code Section 162(m) generally limits the Bank’s Federal income tax deduction for certain executive compensation in excess of $1 million paid to the Chief Executive Officer and the three highest compensated officers (other than the Chief Financial Officer) serving at the end of the year. The $1 million deduction limit does not apply, however, to “performance-based compensation,” as that term is defined in Code Section 162(m). The Compensation Committee recognizes the possibility that if the amounts of the base salary of a covered officer, and other compensation that is not “performance-based compensation,” exceeds $1 million, it may not be fully deductible for Federal income tax purposes. The Compensation Committee will make a determination at any such time whether to authorize the payment of such amounts without regard to deductibility or whether the terms of payment should be modified as to preserve any deduction otherwise available. In 2015, the limitation on deductibility of compensation to the Company’s officers did not affect the Company’s compensation practices nor did the Company pay any officers an amount in excess of the applicable deductibility limit.
Stock Ownership Requirements.
The Company has not adopted stock ownership requirements for the NEOs or directors apart from the requirements of the bank regulators under 12 U.S.C. Section 72, which require directors to own a minimum of $1,000 in the Company’s stock. Each of the Company’s directors satisfies this requirement. See “
Security Ownership of Certain Beneficial Owners and Management and Related Stockholder Matters
” in this Form 10-K, Part III, Item 12. As a practical matter, the NEOs and directors hold significant interests in the Company’s stock, which they have accumulated primarily through individual purchases and, for NEOs, through the exercise of stock incentive awards, as reflected in the Security Ownership table in this Form 10-K, Part III, Item 12.
Compensation Claw-backs.
Upon completion of the restatement of financial data contained in the Annual Report on Form 10-K for the year ended December 31, 2013 filed with the SEC on December 12, 2014, the Company initiated a compensation claw-back in accordance with CPP rules and all other applicable laws. The claw-backs included all persons subject to claw-back requirements who received incentive compensation based upon the Company’s performance during 2013, 2012, 2011 and 2010. The total of the claw-backs is approximately $97 thousand of which over $78 thousand was recovered as of March 31, 2016.
Director Compensation
The Company provides compensation to non-employee directors based on the service they provide to the Company. The Company’s employee director, John S. Gulas, was not provided compensation for his service as director during 2015. The Company’s employee director was compensated for his positions within the Company during 2015 as described above.
The following table sets forth compensation provided to each of the non-employee directors of the Company and includes compensation for their services as directors of the Bank in 2015.
|
Name
|
Fees Earned or
Paid in Cash
($)
|
Stock
Awards
($)
|
All Other Compensation
(1) ($)
|
Total
($)
|
||||
|
James E. Goodwin, Jr.
|
42,000
|
10,000
|
3,803
|
55,803
|
||||
|
Jeffrey F. Howell
|
36,000
|
10,000
|
3,364
|
49,364
|
||||
|
Jerry Kindsfather
|
19,165
|
10,000
|
2,133
|
31,298
|
||||
|
Arthur B. Montoya, Jr.
|
36,000
|
10,000
|
3,364
|
49,364
|
||||
|
Charles A. Slocomb
|
36,000
|
10,000
|
3,364
|
49,364
|
||||
|
Robert P. Worcester
|
36,000
|
10,000
|
3,364
|
49,364
|
||||
|
Gregory Antonsen
|
31,000
|
-
|
2,267
|
33,267
|
||||
|
Leslie Nathanson Juris
|
22,000
|
-
|
1,609
|
23,609
|
| (1) |
All Other Compensation consists of tax gross-ups. The Company does not provide for the payment of any tax gross-ups to its NEOs.
|
The Board modified the fees paid to non-employee members, effective January 1, 2016, as presented in the table below. Each non-employee member of the Board receives the compensation as presented in the following table.
|
Board or Committee
|
2015 Fee
Schedule
(1) ($)
|
2016 Fee
Schedule
($) (3)
|
||
|
Trinity Board of Directors Monthly Retainer
|
500
|
500
|
||
|
Bank Board of Directors Monthly Retainer
|
2,500
|
2,500
|
||
|
Trinity Board of Directors Annual Stock Grant (2)
|
10,000
|
12,000
|
||
|
Trinity Chair of the Board of Directors Monthly Retainer
|
833
|
833
|
||
|
Trinity and Bank Audit Committee Chairman Monthly Retainer
|
500
|
500
|
||
|
Trinity and Bank Executive Committee Members
|
-
|
500
|
||
|
Trinity Chair of the Board of Directors Annual Stock Grant
|
-
|
8,000
|
||
|
Trinity and Bank Audit Committee, Compensation, Risk Management, and Nominating Committees Chairman Annual Stock Grant
|
-
|
4,000
|
|
(1)
|
The 2015 Fee Schedule was approved on February 24, 2015 with an effective date of January 1, 2015.
|
|
(2)
|
On February 24, 2015, all then-current directors were awarded 2,500 shares of unrestricted common stock valued at $10,000, based upon the last reported sale price of the Company’s common stock of $4.00 per share on the date of grant, for service completed in 2014. On that same date, the 2015 Fee Schedule was modified to include an annual grant of unrestricted stock valued at $10,000, based upon the last reported sale price of the Company’s common stock on the date of grant. Accordingly, on that date, all then-current directors were awarded an additional 2,500 shares of unrestricted common stock valued at $10,000, based upon the last reported sale price of the Company’s common stock of $4.00 per share on the date of grant for service in 2015. A grant valued at $10,000 in unrestricted stock, based upon the last reported sale price of the Company’s common stock on the date of grant, is granted to each new director upon appointment.
|
|
(3)
|
On December 15, 2015, the Fee Schedule was modified to increase the annual stock grant to directors and to provide an additional grant of unrestricted stock for the chairs of Trinity committees and the members of the Executive Committee. The revised fee schedule was effective on January 1, 2016.
|
Under the Trinity Capital Corporation Directors Deferred Compensation Plan, approved effective March 24, 2015, directors may choose to defer some or all of their annual cash retainers. Deferred compensation will be invested in an interest-bearing account. In 2015 one board member elected to defer a portion of board fees earned.
Role of Compensation Consultants and Advisors
Under the Compensation Committee charter, the Compensation Committee is authorized to engage consultants or advisors in connection with its review and analysis of director compensation. The Compensation Committee engaged McLagan, an independent executive financial institution compensation consultant, to provide advice and recommendations on all compensation matters under its oversight responsibilities in 2015. The Committee in its sole discretion selects the consultant, and determines its compensation and scope of responsibilities.
In 2015, McLagan assisted the Committee by providing advice and recommendations regarding the compensation philosophy and strategies; executive and director compensation levels and practices, including review and recommendations on chief executive officer and other executive compensation and evaluation of chief executive officer pay and peer levels; designation of the Company’s compensation peer groups; guidance on the design of the compensation plans including the 2015 Long-Term Incentive Plan; and periodic reports regarding market and industry compensation trends. The Committee and the Company did not engage McLagan for any additional services outside of executive and director compensation consulting during 2015. In addition, the Committee does not believe that there were any potential conflicts of interest that arise from any work performed by McLagan during 2015.
Item 12.
Security Ownership of Certain Beneficial Owners and Management and Related Stockholder Matters
The following table sets forth certain information regarding beneficial ownership of Trinity’s common stock by:
|
·
|
Any person who is known to Trinity to own beneficially more than 5% of Trinity’s common stock;
|
|
·
|
Each of Trinity’s directors;
|
|
·
|
The NEOs of Trinity; and
|
|
·
|
All current executive officers and Directors as a group.
|
All shares of common stock are owned with sole voting and investment power by each person listed, unless otherwise indicated by footnote. Beneficial ownership as of the dates noted has been determined for this purpose in accordance with Rule 13d-3 under the Exchange Act, under which a person is deemed to be the beneficial owner of securities if he or she has shares voting power or investment power with respect to such securities or has the right to acquire beneficial ownership of securities within 60 days of October 1, 2016. The shares of common stock subject to options currently exercisable or exercisable within 60 days of October 1, 2016, are deemed outstanding for calculating the percentage of outstanding shares of the person holding those options, but are not deemed outstanding for calculating the percentage of any other person. The address of each beneficial owner is c/o Trinity, 1200 Trinity Drive, Los Alamos, New Mexico 87544, unless otherwise indicated by footnote. As of July 1, 2016, there were 6,526,302 shares of common stock outstanding, each share entitled to one vote.
|
Name of Individual or Individuals in Group
|
Reporting Type
|
As of September 30, 2016
|
||||
|
Beneficial
Ownership
|
Percent of
Class
|
|||||
|
Gregory G. Antonsen
|
Director
|
5,500
|
*
|
|||
|
James E. Goodwin, Jr. (1)
|
Director
|
10,667
|
*
|
|||
|
John S. Gulas (2)
|
Director and Chief Executive Officer
|
15,518
|
*
|
|||
|
Yin Y Ho (3)
|
Chief Information Officer
|
-
|
*
|
|||
|
Jeffrey F. Howell
|
Director
|
16,028
|
*
|
|||
|
Leslie Nathanson Juris
|
Director
|
5,500
|
*
|
|||
|
Jerry Kindsfather (4)
|
Director
|
236,360
|
3.6%
|
|||
|
Thomas M. Lilly (5)
|
Chief Credit Officer
|
-
|
*
|
|||
|
Arthur B. Montoya, Jr. (6)
|
Director
|
25,333
|
*
|
|||
|
Charles A. Slocomb (7)
|
Director
|
15,336
|
*
|
|||
|
Daniel W. Thompson (8)
|
Chief Financial Officer
|
-
|
*
|
|||
|
Robert P. Worcester (9)
|
Director
|
18,674
|
*
|
|||
|
Total of Current Directors and Executive Officers (10)
|
348,916
|
5.3%
|
||||
|
(1)
|
The James E. Goodwin, Jr. 2010 Trust holds 10,000 shares which was gifted to the trust by Mr. Goodwin. Mr. Goodwin does not have any voting or investment power over such shares. Mr. Worcester is one of the Trustees of the trust and has voting and investment power over such shares.
|
|
(2)
|
Mr. Gulas was appointed as Chief Executive Officer, President and Director of Trinity on May 29, 2014 and did not hold a position at Trinity or the Bank prior to that date. Mr. Gulas holds 11,765 RSUs, awarded on June 3, 2014 which will vest on June 3, 2016 and are included in his total as this date was prior to September 1, 2016. Mr. Gulas also holds 19,880 RSUs awarded on February 23, 2016 which are not included in the total as these RSUs are not yet vested.
|
|
(3)
|
Mr. Ho holds 8,989 RSUs awarded on February 23, 2016. These RSUs are not yet vested.
|
|
(4)
|
Mr. Kindsfather holds 100,268 shares in the Kindsfather Family Revocable Trust. Mr. Kindsfather’s beneficial ownership also includes 129,592 shares, one-half of the 259,184 shares held by J&G Investments, in which Mr. Kindsfather is a 50% partner with shared voting and investment power.
|
|
(5)
|
Mr. Lilly holds 8,962 RSUs awarded on February 23, 2016. These RSUs are not yet vested.
|
|
(6)
|
Dr. Montoya shares voting and investment power in 25,033 shares with his spouse. The remaining 300 shares are held by the Arthur B. Montoya, Jr., DDS Profit Sharing Plan over which Dr. Montoya shares voting and investment power.
|
|
(7)
|
Mr. Slocomb shares voting and investment power in such shares with his spouse.
|
|
(8)
|
Mr. Thompson holds 8,453 RSUs awarded on February 23, 2016. These RSUs are not yet vested. Mr. Thompson was appointed Chief Financial Officer of Trinity and the Bank on October 27, 2015.
|
|
(9)
|
Mr. Worcester shares voting and investment power over 14,674 shares with his spouse. Mr. Worcester serves as Trustee to the James E. Goodwin, Jr. 2010 Trust and has investment powers over the 10,000 shares held therein. These shares are included under James E. Goodwin Jr.’s total in the above table.
|
|
(10)
|
The total percentage of ownership for all Directors and Executive Officers includes all options exercisable within 60 days of May 1, 2016.
|
Persons known to Trinity to own more than 5% of the outstanding shares
|
Name of Individual or Individuals in Group
|
Reporting Type
|
As of September 30, 2016
|
||||
|
Beneficial Ownership
|
Percent of Class
|
|||||
|
Trinity Capital Corporation ESOP (1)
|
5% Shareholder
|
672,654
|
10.3%
|
|||
|
The Delle Foundation (2)
|
5% Shareholder
|
567,097
|
8.7%
|
|||
|
Kindsfather Family Trust, Jerry and Faye Kindsfather, J&G Partners, Gary and Linda Kindsfather (3)
|
5% Shareholder, Director
|
373,952
|
5.7%
|
|||
|
(1)
|
Of the 672,654 shares held by Trinity’s ESOP as of September 31, 2016 all were allocated or will be allocated to the individual participants’ accounts.
|
|
(2)
|
The Delle Foundation is a non-profit corporation. George A. Cowan, the grantor of the foundation, served as a Director Emeritus to Trinity and the Bank until his death in April 2012. The address of The Delle Foundation is 1200 Trinity Drive, Los Alamos, NM 87544. Ms. Howell serves as Chairman of the Board of The Delle Foundation.
|
|
(3)
|
Jerry Kindsfather, the Kindsfather Family Revocable Trust u/a dated June 16, 2008, J&G Investments, the Gary E. and Linda D. Kindsfather Trust u/a dated July 5, 2007 and Gary and Linda Kindsfather collectively hold 5.73% of the outstanding shares of Trinity. Mr. Kindsfather holds 6,500 shares and 100,268 shares in the Kindsfather Family Revocable Trust. J&G Investments holds 259,184 shares. The Gary E. and Linda D. Kindsfather Trust holds 8,000 shares. Jerry Kindsfather serves as Chairman of the Board of Directors of both Trinity and the Bank.
|
Securities Authorized for Issuance Under Equity Compensation Plans.
Trinity’s current stock-based benefit plans and arrangements consist of the 1998 Stock Option Plan which was approved by stockholders at the 1998 Annual Meeting, the Trinity Capital Corporation 2005 Stock Incentive Plan (the “2005 Plan”), which was approved by stockholders at the 2005 Annual Shareholders’ Meeting and the Trinity Capital Corporation 2015 Long-Term Incentive Plan (the “2015 Plan”), which was approved by stockholders at the 2014 Annual Shareholders’ Meeting held on January 22, 2015. The following table provides information regarding the Plans as of December 31, 2015:
|
Plan category
|
Number of securities
to be issued upon
exercise of
outstanding options,
warrants and rights
(1) (a)
|
Weighted-average
exercise price of
outstanding
options, warrants
and rights (b)
|
Number of securities remaining
available for future issuance
under equity compensation
plans (excluding securities
reflected in column (a)) (c)
|
|||||||||
|
Equity compensation plans approved by stockholders
|
11,765
|
$
|
4.25
|
500,000
|
||||||||
|
Equity compensation plans not approved by stockholders
|
—
|
—
|
—
|
|||||||||
|
Total
|
11,765
|
$
|
4.25
|
500,000
|
(2)
|
|||||||
|
(1)
|
As of December 31, 2015, there were 11,765 outstanding RSUs under the Company’s equity compensation plans. The exercise price in column (b) is for the outstanding RSUs.
|
|
(2)
|
No additional shares may be awarded under the 2005 Plan. The 2015 Plan authorized the issuance of 500,000 shares, of which 449,769 remain available for issuance as of September 30, 2016.
|
Certain Relationships and Related Transactions.
Trinity’s written Related Party Transaction Policy provides that all relationships between Trinity and any director, executive officer or an entity related to a director or executive officer, will be reviewed, approved or ratified by the Audit Committee, excluding loan transactions falling within the ordinary course of business with the Bank. All transactions will be reviewed, regardless of type, when the transaction is anticipated to or actually meets or exceeds $120,000 in compensation to the director, executive officer or an entity related to a director or executive officer. The review will include the details of the relationship, including the nature of the relationship, the anticipated amount of compensation to be paid under the transaction, and, if possible, a comparison of market rates for similar products or services. The Audit Committee will consider the proposed relationship and either approve or deny the engagement. Additionally, the relationships with directors and their related entities will be reviewed each year as part of the determination of independence of each director and nominee. In the event that a relationship is entered into without prior approval of the Audit Committee, it will be provided with detailed information regarding the relationship for ratification. If the Audit Committee does not ratify the relationship, Trinity will terminate the relationship. Once a relationship has been created, Trinity will cause a request for proposals to be issued to the director, executive officer or entity related to a director or executive officer not less than every five years. This request will serve to ensure that Trinity is obtaining products and services on terms at least as favorable as if they were from an unrelated third party.
The types of transactions, relationships and arrangements that are considered in determining independence but are not disclosed as a related party transaction include, but are not limited to, borrowing relationships and business relationships. Trinity is a bank holding company that controls the Bank, a national bank. The Bank commonly enters into customary loan, deposit and associated relationships with its directors and executive officers, all of which are made in the ordinary course of business, on substantially the same terms, including interest rates and collateral, as those prevailing at the time for comparable transactions with other persons and did not involve more than the normal risk of collectability or present other unfavorable features. All loans by the Bank to Trinity’s directors and executive officers are subject to the regulations of the OCC. National banks are generally prohibited from making loans to their directors and executive officers at favorable rates or on terms not comparable to those available to the general public or other employees. The Bank does not offer any preferential loans to Trinity’s directors or executive officers.
The Board selected Crowe as the independent registered public accounting firm of Trinity and the Bank for the years ended December 31, 2015 and 2014.
Audit and Other Fees Paid.
Aggregate fees for professional services rendered for Trinity and the Bank by Crowe for the years ended December 31, 2015 and 2014, including the restated periods, are described below.
|
Services Provided
|
2015
(thousands)
|
2014
|
||||||
|
Audit Fees
, including audits of our consolidated financial statements
|
$
|
1,007
|
$
|
1,379
|
||||
|
Audit Related Fees,
including assurance related services the majority of which relate to the audits of Trinity’s ESOP and 401(k) plan and evaluation of compliance with the Sarbanes-Oxley Act of 2002
|
-
|
39
|
||||||
|
Tax Fees,
including preparation of our federal and state income tax returns and non-routine tax consultations
|
-
|
-
|
||||||
|
All Other Fees
|
191
|
189
|
||||||
|
TOTAL
|
$
|
1,198
|
$
|
1,605
|
||||
Fees Paid.
For the year ended December 31, 2015, the Company paid a total of $958 thousand to Crowe Horwath for audit work related to the 2014 financial statements.
Policy on Audit Committee Pre-Approval of Audit and Permissible Non-Audit Services of Independent Registered Public Accounting Firm.
The Audit Committee is responsible for appointing and reviewing the work of the independent registered public accounting firm and setting the independent registered public accounting firm’s compensation. In accordance with its charter, the Audit Committee reviews and pre-approves all audit services and permitted non-audit services provided by the independent registered public accounting firm to Trinity or the Bank and ensures that the independent public accounting firm is not engaged to perform the specific non-audit services prohibited by law, rule or regulation. During the years ended December 31, 2015, 2014 and 2013, all services were approved in advance by the Audit Committee in compliance with these processes. The Committee concluded that the provision of such services by Crowe and Moss Adams was compatible with the maintenance of each firm’s independence in the conduct of its auditing functions.
PART IV
Financial Statements.
All financial statements of Trinity are set forth under Item 8 of this Form 10-K.
Financial Statement Schedules.
Financial statement schedules are omitted, as they are not required,
not significant,
not applicable, or the required information is shown in the consolidated financial statements or the accompanying notes thereto.
Exhibits.
The following exhibits are filed as part of this Form 10-K:
|
3.1 (1)
|
Articles of Incorporation of Trinity Capital Corporation
|
|
3.2 (22)
|
Amended and Restated By-Laws of Trinity Capital Corporation
|
|
3.3 (9)
|
Amendment to the Articles of Incorporation establishing the Series A Preferred Stock and the Series B Preferred Stock, effective on March 25, 2009
|
|
3.4(22)
|
Amendment to the Articles of Incorporation, effective on April 26, 2004
|
|
4.1 (1)
|
Indenture dated as of March 23, 2000 among Trinity Capital Corporation, Trinity Capital Trust I and The Bank of New York
|
|
4.3 (6)
|
Indenture dated as of May 11, 2004 between Trinity Capital Corporation, Trinity Capital Trust III and Wells Fargo Bank, National Association
|
|
4.4 (4)
|
Indenture dated as of June 29, 2005 between Trinity Capital Corporation, Trinity Capital Trust IV and Wilmington Trust Company
|
|
4.5 (5)
|
Indenture dated as of September 21, 2006 between Trinity Capital Corporation, Trinity Capital Trust V and Wilmington Trust Company
|
|
10.1 (1)
|
Los Alamos National Bank Employee Stock Ownership Plan
|
|
10.2 (1)
|
Trinity Capital Corporation 1998 Stock Option Plan
|
|
10.4 (2)
|
Form of stock option grant agreement
|
|
10.5 (3)
|
Trinity Capital Corporation 2005 Stock Incentive Plan
|
|
10.6 (3)
|
Trinity Capital Corporation 2005 Deferred Income Plan
|
|
10.7 (13)
|
Amended and Restated Trinity Capital Corporation 2005 Stock Incentive Plan
|
|
10.8 (12)
|
Form of stock appreciation right grant agreement
|
|
10.9 (7)
|
Employment Agreement dated January 16, 2007 between Trinity Capital Corporation, Los Alamos National Bank and Steve W. Wells
|
|
10.10 (8)
|
Amendment to Employment Agreement dated January 16, 2007 between Trinity Capital Corporation, Los Alamos National Bank and Steve W. Wells dated March 13, 2008
|
|
10.11 (19)
|
Amendment to Employment Agreement dated January 16, 2007 between Trinity Capital Corporation, Los Alamos National Bank and Steve W. Wells dated December 31, 2012
|
|
10.12 (11)
|
Amendment to Trinity Capital Corporation 1998 Stock Option Plan
|
|
10.13 (11)
|
Amendment to Trinity Capital Corporation 2005 Deferred Compensation Plan
|
|
10.14 (10)
|
Trinity Capital Corporation Employee Stock Ownership Plan and Trust (As Amended and Restated Effective January 1, 2009) adopted on April 23, 2009
|
|
10.15 (13)
|
Form of Non-TARP Restricted Stock Unit grant agreement
|
|
10.16 (13)
|
Form of TARP Restricted Stock Unit grant agreement
|
|
10.17 (14)
|
Agreement by and between Los Alamos National Bank and The Comptroller of the Currency, dated November 30, 2012
|
|
10.18 (15)
|
Agreement by and between Trinity Capital Corporation and the Federal Reserve Bank of Kansas City, dated September 26, 2013
|
|
10.19 (16)
|
Consent Order by and between Los Alamos National Bank and The Comptroller of the Currency, dated December 17, 2013
|
|
10.20 (17)
|
Employment Agreement dated June 3, 2014 between Trinity Capital Corporation, Los Alamos National Bank and John S. Gulas
|
|
10.21 (18)
|
Consulting Agreement dated September 16, 2014, between Los Alamos National Bank and Daniel R. Bartholomew
|
|
Trinity Capital Corporation 2015 Long-Term Incentive Plan
|
|
|
Trinity Capital Corporation Employee Stock Ownership Plan and Trust (As Amended and Restated Effective January 1, 2015)
|
|
|
10.2 (20)
|
Employment Agreement dated February 20, 2015, between Trinity Capital Corporation, Los Alamos National Bank and Anne H. Kain
|
|
10.25 (21)
|
Employment Agreement dated October 27, 2015, between Trinity Capital Corporation, Los Alamos National Bank and Daniel W. Thompson
|
|
Subsidiaries
|
|
|
Consent of Independent Registered Public Accounting Firm – Crowe Horwath LLP
|
|
|
Certification of Chief Executive Officer Pursuant to Rule 13a-14(a)/15d-14(a)
|
|
|
Certification on Chief Financial Officer Pursuant to Rule 13a-14(a)/15d-14(a)
|
|
|
Certification of Chief Executive Officer Pursuant to 18 U.S.C. Section 1350, as adopted Pursuant to Section 906 of the Sarbanes-Oxley Act of 2002
|
|
|
Certification of Chief Financial Officer Pursuant to 18 U.S.C. Section 1350, as adopted Pursuant to Section 906 of the Sarbanes-Oxley Act of 2002
|
|
|
101
|
Interactive data files pursuant to Rule 405 of Regulation S-T: (i) Consolidated Balance Sheets as of December 31, 2014 and 2013; (ii) Consolidated Statements of Income for the years ended December 31, 2014, 2013, and 2012; (iii) Consolidated Statements of Changes in Stockholders’ Equity for the years ended December 31, 2014, 2013, and 2012; (iv) Consolidated Statements of Cash Flows for the years ended December 31, 2014, 2013, and 2012; and (v) Notes to Consolidated Financial Statements, tagged as blocks of text.
|
|
(1)
|
Incorporated by reference to the Company’s Form 10 filed on April 30, 2003, as amended.
|
|
|
(2)
|
Incorporated by reference to the Company’s Form 8-K filed August 22, 2005
|
|
|
(3)
|
Incorporated by reference to the Company’s Form S-8 filed on July 28, 2005
|
|
|
(4)
|
Incorporated by reference to the Company’s Form 10-Q filed on August 9, 2005
|
|
|
(5)
|
Incorporated by reference to the Company’s Form 10-Q filed on November 9, 2006
|
|
|
(6)
|
Incorporated by reference to the Company’s Form 10-K for the fiscal year ended December 31, 2004
|
|
(7)
|
Incorporated by reference to the Company’s Form 10-K for the fiscal year ended December 31, 2006
|
|
|
(8)
|
Incorporated by reference to the Company’s Form 10-K for the fiscal year ended December 31, 2007
|
|
|
(9)
|
Incorporated by reference to the Company’s Form 8-K filed on March 27, 2009
|
|
|
(10)
|
Incorporated by reference to the Company’s Form 10-Q filed on May 11, 2009
|
|
|
(11)
|
Incorporated by reference to the Company’s Form 10-K for the fiscal year ended December 31, 2008
|
|
|
(12)
|
Incorporated by reference to the Company’s Form 8-K filed on January 3, 2006
|
|
|
(13)
|
Incorporated by reference to the Company’s Form 10-K filed on March 15, 2013
|
|
|
(14)
|
Incorporated by reference to the Company’s Form 8-K filed on December 6, 2013
|
|
|
(15)
|
Incorporated by reference to the Company’s Form 8-K filed on October 1, 2014
|
|
|
(16)
|
Incorporated by reference to the Company’s Form 8-K filed on December 23, 2014
|
|
|
(17)
|
Incorporated by reference to the Company’s Form 8-K filed on June 9, 2014
|
|
|
(18)
|
Incorporated by reference to the Company’s Form 8-K filed on September 16, 2014
|
|
|
(19)
|
Incorporated by reference to the Company’s Form 10-K for the fiscal year ended December 31, 2013
|
|
|
(20)
|
Incorporated by reference to the Company’s Form 8-K filed on February 25, 2015
|
|
|
(21)
|
Incorporated by reference to the Company’s Form 8-K filed on October 28, 2015
|
|
|
(22)
|
Incorporated by reference to the Company’s Form 8-K filed on February 29, 2016
|
Pursuant to the requirements of Section 13 or 15(d) of the Securities Exchange Act of 1934, the registrant has duly caused this registration statement to be signed on its behalf by the undersigned, thereunto duly authorized.
|
Date: October 31, 2016
|
TRINITY CAPITAL CORPORATION
|
||
|
By:
|
/s/ John S. Gulas
|
||
|
John S. Gulas
|
|||
|
Chief Executive Officer and President
|
|||
Pursuant to the requirements of the Securities Exchange Act of 1934, this report has been signed below by the following persons on behalf of the Registrant and in the capacities and on the dates indicated.
|
Name
|
Title
|
Date
|
||
| /s/ John S. Gulas |
Chief Executive Officer, President
|
October 31, 2016
|
||
|
John S. Gulas
|
and Director
|
|||
| /s/ Daniel W. Thompson |
Chief Financial Officer
|
October 31, 2016
|
||
|
Daniel W. Thompson
|
and Principal Accounting Officer
|
|||
| /s/ Jerry Kindsfather |
Chairman of the Board
|
October 31, 2016
|
||
|
Jerry Kindsfather
|
and Director
|
|||
| /s/ Gregg Antonsen |
Director
|
October 31, 2016
|
||
|
Gregg Antonsen
|
||||
| /s/ James E. Goodwin, Jr. |
Director
|
October 31, 2016
|
||
|
James E. Goodwin, Jr.
|
||||
| /s/ Jeffrey F. Howell |
Director
|
October 31, 2016
|
||
|
Jeffrey F. Howell
|
||||
| /s/ Leslie Nathanson Juris |
Director
|
October 31, 2016
|
||
|
Leslie Nathanson Juris
|
||||
| /s/ Arthur B. Montoya, Jr. |
Director
|
October 31, 2016
|
||
|
Arthur B. Montoya, Jr.
|
||||
| /s/ Charles A. Slocomb |
Director
|
October 31, 2016
|
||
|
Charles A. Slocomb
|
||||
| /s/ Robert P. Worcester |
Director
|
October 31, 2016
|
||
|
Robert P. Worcester
|
146
TABLE OF CONTENTS
Part IItem 1. BusinessItem 1A. Risk FactorsItem 1B. Unresolved Staff CommentsItem 2. PropertiesItem 3. Legal ProceedingsItem 4. Mine Safety DisclosuresPart IIItem 5. Market For Registrant S Common Equity, Related Stockholder Matters and Issuer Purchases Of Equity SecuritiesItem 6. Selected Consolidated Financial DataItem 7. Management S Discussion and Analysis Of Financial Condition and Results Of OperationItem 7A. Quantitative and Qualitative Disclosures About Market RiskItem 8. Financial Statements and Supplementary DataNote 1. Significant Accounting PoliciesNote 2. Restrictions on Cash and Due From BanksNote 3. Investment SecuritiesNote 4. Loans and Allowance For Loan LossesNote 5. Loan Servicing and Mortgage Servicing RightsNote 6. Other Real Estate OwnedNote 7. Premises and EquipmentNote 8. DepositsNote 9. BorrowingsNote 10. Junior Subordinated DebtNote 11. Description Of Leasing ArrangementsNote 12. Retirement PlansNote 13. Stock IncentivesNote 14. Income TaxesNote 15. Commitments and Off-balance-sheet ActivitiesNote 16. Preferred Equity IssuesNote 17. LitigationNote 18. Derivative Financial InstrumentsNote 19. Regulatory MattersNote 20. Fair Value MeasurementsNote 21. Other Noninterest ExpenseNote 22. Subsequent EventsNote 23. Condensed Parent Company Financial InformationItem 9. Changes in and Disagreements with Accountants on Accounting and Financial DisclosureItem 9A. Controls and ProceduresItem 9B. Other InformationPart IIIItem 10. Directors, Executive Officers and Corporate GovernanceItem 11. Executive CompensationItem 12. Security Ownership Of Certain Beneficial Owners and Management and Related Stockholder MattersItem 13. Certain Relationships and Related Transactions, and Director IndependenceItem 14. Principal Accountant Fees and ServicesPart IVItem 15. Exhibits and Financial Statement Schedules