TRINITY INDUSTRIES INC
10-Ks and 10-Qs
|
|
|
|
|
|
|
|
|
|
|
|
|
|
|
|
|
|
|
|
|
|
|
|
|
|
|
|
|
|
|
|
|
|
|
|
|
|
|
|
|
|
|
|
|
|
|
|
|
|
|
|
|
UNITED STATES SECURITIES AND EXCHANGE COMMISSION
Washington, D.C. 20549
Form 10-K
|
(Mark One)
|
|
|
þ
|
ANNUAL REPORT PURSUANT TO SECTION 13
OR 15(d) OF THE SECURITIES EXCHANGE ACT
OF 1934
|
For the fiscal year ended
December 31, 2014
|
OR
|
|
|
¨
|
TRANSITION REPORT PURSUANT TO
SECTION 13 OR 15(d) OF THE
SECURITIES EXCHANGE ACT OF 1934
|
Commission File Number 1-6903

Trinity Industries, Inc.
(Exact name of registrant as specified in its charter)
|
Delaware
|
75-0225040
|
|
(State or Other Jurisdiction of Incorporation or Organization)
|
(I.R.S. Employer Identification No.)
|
|
2525 N. Stemmons Freeway, Dallas, Texas
|
75207-2401
|
|
(Address of principal executive offices)
|
(Zip Code)
|
Registrant's telephone number, including area code:
(214) 631-4420
Securities Registered Pursuant to Section 12(b) of the Act
|
Title of each class
|
Name of each exchange
on which registered
|
|
Common Stock ($1.00 par value)
|
New York Stock Exchange, Inc.
|
Securities registered Pursuant to Section 12(g) of the Act:
None
Indicate by check mark if the Registrant is a well-known seasoned issuer, as defined
in Rule 405 of the Securities Act. Yes
þ
No
¨
Indicate by check mark if the Registrant is not required to file reports pursuant to
Section 13 or Section 15(d) of the Act. Yes
¨
No
þ
Indicate by check mark whether the Registrant (1) has filed all reports required
to be filed by Section 13 or 15(d) of the Securities Exchange Act of 1934 during
the preceding 12 months (or for such shorter period that the Registrant was
required to file such reports), and (2) has been subject to such filing
requirements for the past 90 days. Yes
þ
No
¨
Indicate by check mark whether the registrant has submitted electronically and posted
on its corporate Web site, if any, every Interactive Data File required to be
submitted and posted pursuant to Rule 405 of Regulation S-T
(§ 232.405 of this chapter) during the preceding 12 months (or for such
shorter period that the registrant was required to submit and post such
files). Yes
þ
No
¨
Indicate by check mark if disclosure of delinquent filers pursuant to Item 405 of
Regulation S-K (§ 229.405 of this chapter) is not contained herein, and will not be contained, to the
best of Registrant's knowledge, in definitive proxy or information statements
incorporated by reference in Part III of this Form 10-K or any
amendment to this Form 10-K.
þ
Indicate by check mark whether the registrant is a large accelerated filer, an
accelerated filer, a non-accelerated filer, or a smaller reporting company. See the
definitions of “large accelerated filer,” “accelerated filer” and “smaller reporting
company” in Rule 12b-2 of the Exchange Act.
Large accelerated filer
þ
Accelerated filer
¨
Non-accelerated filer
¨
Smaller reporting company
¨
(Do not check if a smaller reporting company)
Indicate by check mark whether the Registrant is a shell
company (as defined in Rule 12b-2 of the Exchange Act). Yes
¨
No
þ
The aggregate market value of voting and non-voting common equity held by
non-affiliates computed by reference to the price at which the common equity was last
sold as of the last business day of the Registrant's most recently completed second
fiscal quarter (June 30, 2014) was
$6,706.8 million
.
At January 31, 2015 the number of shares of common stock outstanding was
155,668,747
.
The information required by Part III of this report, to the extent not set forth
herein, is incorporated by reference from the Registrant's definitive
2015
Proxy
Statement.
TRINITY INDUSTRIES, INC.
FORM 10-K
TABLE OF CONTENTS
|
Caption
|
Page
|
All share and per share information, including dividends, has been retroactively adjusted to reflect the 2-for-1 stock split. except
for the statement of stockholders' equity which reflects the stock split by reclassifying from "Capital in Excess of Par Value" to "Common Stock" an amount equal to the par value of the additional shares issued to effect the stock split.
2
Item 1.
Business.
General Development of Business.
Trinity Industries, Inc. and its consolidated subsidiaries, (“Trinity”, “Company”, “we”, or “our”) headquartered in Dallas, Texas, is a diversified industrial company that owns a variety of market-leading businesses providing products and services to the energy, transportation, chemical, and construction sectors. Trinity was incorporated in 1933.
Trinity became a Delaware corporation in 1987. Our principal executive offices are located at 2525 N. Stemmons Freeway, Dallas, Texas 75207-2401, our telephone number is 214-631-4420, and our Internet website address is
www.trin.net
.
Financial Information About Industry Segments.
Financial information about our industry segments for the years ended
December 31, 2014
,
2013
, and
2012
is presented in Part II, Item 7 “Management's Discussion and Analysis of Financial Condition and Results of Operations.”
Narrative Description of Business.
As a diversified industrial company, we manufacture and sell a variety of products and services principally including:
|
•
|
railcars and railcar parts;
|
|
•
|
the leasing, management, and maintenance of railcars;
|
|
•
|
inland barges;
|
|
•
|
highway products;
|
|
•
|
aggregates;
|
|
•
|
storage and distribution containers;
|
|
•
|
structural wind towers;
|
|
•
|
electric utility structures; and
|
|
•
|
parts and steel components.
|
We serve our customers through the following five business groups:
Rail Group.
Through wholly-owned subsidiaries with manufacturing facilities in the U.S. and Mexico, our Rail Group is a leading manufacturer of freight and tank railcars in North America used for transporting a wide variety of liquids, gases, and dry cargo (“Trinity Rail Group” or “Rail Group”).
Trinity Rail Group offers a complete array of railcar solutions to our customers. We are capable of manufacturing a full line of railcars, including:
Autorack Cars
- Autoracks and flatcars transport finished automobiles and light trucks.
Box Cars
- Box cars carry a wide variety of bulk cargo such as auto parts, paper, and food products.
Covered Hopper Cars
- Covered hopper cars transport commodities such as industrial sand and cement, grain products, dry fertilizer, and plastics. Pressure differential covered hopper cars carry products such as flour and starch.
Gondola Cars
- Rotary gondola cars are primarily used for coal service. Other gondola cars carry bulk commodities such as scrap metal, aggregate, ores, and finished steel.
Intermodal Cars
- Intermodal cars transport shipping containers in single or double stacked configurations as well as truck trailers.
Open Hopper Cars
- Open hopper cars are used to transport coal, aggregates, and other similar products.
Tank Cars
- Non-pressurized tank cars transport a wide variety of liquid commodities including chemicals, food products, and petroleum products. Pressurized tank cars are used to transport liquefied gases.
Our Rail Group is capable of manufacturing a diversified railcar product line, allowing us to capitalize on changing industry trends and developing opportunities in the construction, agricultural, energy, chemical and automotive markets, among others. We also manufacture and sell a variety of railcar parts and components used in manufacturing and repairing railcars including couplers, axles, and other equipment. We have plants in Mexico and the U.S. that manufacture parts and components, primarily for the North American market. We provide railcar maintenance services at multiple facilities in the U.S.
3
Our customers include railroads, leasing companies, and industrial shippers of products, such as utilities, petrochemical companies, grain shippers, agricultural product companies, and major construction and industrial companies. We compete in the North American market primarily against five major railcar manufacturers.
For the
year ended
December 31, 2014
we shipped
30,255
railcars, or 44% of total North American railcar shipments. As of
December 31, 2014
, our Rail Group backlog consisted of
61,035
railcars valued at
$7.2 billion
. This amount included approximately $
2.0 billion
in orders from our Railcar Leasing and Management Services Group (“Leasing Group”). The total amount of orders in our backlog from the Leasing Group was supported by lease commitments with external customers. The final amount dedicated to the Leasing Group may vary by the time of delivery.
We hold patents of varying duration for use in our manufacture of railcars and components. We believe patents offer a marketing advantage in certain circumstances. No material revenues are received from the licensing of these patents.
Railcar Leasing and Management Services Group.
Our Railcar Leasing and Management Services Group is a leading provider in North America of comprehensive rail industry services. Through wholly-owned subsidiaries, primarily Trinity Industries Leasing Company ("TILC"), and partially-owned subsidiaries, TRIP Rail Holdings LLC (“TRIP Holdings”) and RIV 2013 Rail Holdings LLC ("RIV 2013"), we offer operating leases for tank and freight railcars. TILC also offers management, maintenance, and administrative services to railcar investors. By providing leasing and management, maintenance, and administrative services, in addition to management services for investor-owned funds, our Leasing Group is an important strategic resource that further links our Rail Group with our customers. Trinity's Rail Group and TILC coordinate sales and marketing activities under the registered trade name
TrinityRail
®
, thereby providing a single point of contact for railroads and shippers seeking rail equipment and services.
The railcars in our lease fleet are leased to industrial shippers and railroads. These companies operate in the chemical, agricultural, and energy industries, among others. Substantially all of the railcars in our lease fleet were manufactured by our Rail Group. The terms of our railcar leases generally vary from one to twenty years and provide for fixed monthly rentals. A small percentage of our fleet is leased on a per diem basis. As of
December 31, 2014
, the lease fleet of our subsidiaries included
75,930
owned or leased railcars that were
99.5%
utilized. Of this total,
63,520
railcars were owned by TILC or its affiliates and
12,410
railcars were financed in sale-leaseback transactions.
We also manage railcar fleets on behalf of third parties. Our railcar fleet management services complement our leasing business by generating stable fee income, strengthening customer relationships, and enhancing the view of Trinity as a leading provider of railcar products and services.
Our railcar leasing businesses compete against a number of well-established entities that are also in the business of leasing railcars.
Construction Products Group.
Through wholly-owned subsidiaries, our Construction Products Group manufactures highway products as well as other primarily-steel products for infrastructure-related projects; mines and produces aggregates; and provides galvanizing services. Many of these lines of business are seasonal and revenues are impacted by weather conditions and fluctuations in government spending levels.
Our Highway Products business is a leading U.S. manufacturer of guardrail, crash cushions, and other protective barriers. The Federal Highway Administration, which determines product eligibility for cost reimbursement using federal funds, has approved many of our products as eligible for Federal-aid reimbursement based on satisfactory performance testing pursuant to criteria established under either the National Cooperative Highway Research Program Report 350 or the Manual for Assessing Safety Hardware, as applicable. Our crash cushion, protective barrier, and guardrail products include multiple proprietary products manufactured under license from certain public and private research organizations and inventors as well as Company-held patents. We sell highway products in Canada, Mexico, and throughout the U.S., and we export highway products, including proprietary products to more than 60 countries. The Company does not perform any installation services with respect to its highway products, except in Mexico. We compete against several national and regional highway products manufacturers.
We are a leading producer and distributor of lightweight and natural aggregates, including expanded shale and clay; crushed stone; sand and gravel; asphalt rock; and various other products in the western and southwestern U.S. Our aggregates customers are concrete producers; commercial, residential, and highway contractors; manufacturers of masonry products; and state and local municipalities. We compete with lightweight aggregates producers nationwide and natural aggregates producers located in the regions where we operate.
We provide hot-dip galvanizing services to manufacturers of fabricated steel materials from our service facilities in Texas, Louisiana, and Mississippi. We also manufacture a line of trench shields and shoring products for the construction industry and a line of construction equipment for the mining industry.
4
Energy Equipment Group.
Through wholly-owned subsidiaries, our Energy Equipment Group manufactures structural wind towers; utility steel structures for electricity transmission and distribution; ambient and cryogenic storage and distribution containers; and tank heads for pressure and non-pressure vessels.
We are a leading manufacturer in North America of structural wind towers used in the wind energy market. These towers are manufactured in the U.S. and Mexico to customer specifications and installed by our customers. Our customers are generally wind turbine producers. Our structural wind towers backlog as of
December 31, 2014
was approximately
$473.5 million
.
With the acquisition of the assets of Meyer Steel Structures ("Meyer"), the utility steel structures division of Thomas & Betts Corporation, a member of the ABB Group, in August 2014, we became one of the leading manufacturers of steel structures for electricity transmission and distribution, which are used principally by municipalities and other local and state governmental entities, as well as by public and private utilities. These structures are manufactured in the U.S. and Mexico to customer specifications and installed by our customers.
We manufacture storage and distribution containers that support the oil, gas, and chemical industries and are used by industrial plants, utilities, residences, and small businesses in suburban and rural areas. Additionally, we manufacture fertilizer storage and distribution containers for bulk storage, farm storage, and the application and distribution of anhydrous ammonia. We also manufacture cryogenic tanks for the distribution of industrial gases and liquefied natural gas. Our storage and distribution container products range from nine-gallon containers for motor fuel use to 1.8 million-gallon bulk storage spheres. We sell our storage and distribution containers to dealers and large industrial users. In the U.S., we generally deliver storage and distribution containers to our customers who install and fill the containers. Our competitors include large and small manufacturers of storage and distribution containers.
We manufacture tank heads, which are pressed metal components used in the manufacturing of many of our finished products, both pressure rated and non-pressure rated, depending on their intended use. We use a significant portion of the tank heads we manufacture in the production of our railcars and storage and distribution containers. We also sell our tank heads to a broad range of other manufacturers. There is strong competition in the tank heads business.
We are a leading manufacturer in North America of storage and distribution containers and tank heads for pressure and non-pressure vessels. We manufacture these products in the U.S. and Mexico. We market a portion of our products in Mexico under the brand name of TATSA
®
.
In February 2014, we acquired the assets of Platinum Energy Services Corporation ("Platinum"), based in Alberta, Canada, which manufactures and sells oil and gas process and storage equipment, including various types of containers, separators, and treaters used at the well-site and in midstream locations.
There are a number of well-established entities that actively compete with us in the business of manufacturing energy equipment .
Inland Barge Group.
Through wholly-owned subsidiaries, our Inland Barge Group is a leading U.S. manufacturer of inland barges and fiberglass barge covers. We manufacture a variety of dry cargo barges, such as deck barges, and open or covered hopper barges that transport various commodities, such as grain, coal, and aggregates. We also manufacture tank barges used to transport liquids such as crude oil, chemicals and a variety of petroleum products. Our fiberglass reinforced lift covers are used primarily for grain barges. Our four barge manufacturing facilities are located along the U.S. inland river systems, allowing for rapid delivery to our customers. Our Inland Barge Group backlog as of
December 31, 2014
was approximately $
437.9 million
.
Our primary Inland Barge customers are commercial marine transportation companies. Many companies have the capability to enter into, and from time to time do enter into, the inland barge manufacturing business. We strive to compete through operational efficiency, timely delivery, and quality products. We have a number of competitors for our products in this industry.
All Other.
All Other includes our captive insurance and transportation companies; legal, environmental, and maintenance costs associated with non-operating facilities; and other peripheral businesses.
Foreign Operations.
Trinity's foreign operations are primarily located in Mexico. Continuing operations included sales to foreign customers, primarily in Mexico, which represented 5.8%, 11.7%, and 10.0% of our consolidated revenues for the years ended
December 31, 2014
,
2013
, and
2012
, respectively. As of
December 31, 2014
and
2013
, we had 3.9% and 3.7%, respectively, of our long-lived assets not held for sale located outside the U.S. We manufacture railcars, storage and distribution containers, tank heads, structural wind towers, utility structures, parts and steel components, and other products at our Mexico facilities for local consumption as well as for export to the U.S. and other countries.
5
Backlog.
As of
December 31, 2014
and
2013
, our backlog of firm and noncancellable orders was as follows:
|
December 31,
2014 |
December 31,
2013 |
|||||||
|
(in millions)
|
||||||||
|
Rail Group
|
||||||||
|
External Customers
|
$
|
5,204.3
|
|
$
|
4,189.6
|
|
||
|
Leasing Group
|
2,010.5
|
|
827.0
|
|
||||
|
$
|
7,214.8
|
|
$
|
5,016.6
|
|
|||
|
Inland Barge Group
|
$
|
437.9
|
|
$
|
429.6
|
|
||
|
Wind towers
|
$
|
473.5
|
|
$
|
553.9
|
|
||
For the
twelve months ended
December 31, 2014
, our rail manufacturing businesses received orders for
51,395
railcars, including a multi-year railcar order received in November 2014 from GATX Corporation to deliver 8,950 railcars over a four-year period beginning in 2016. The increase in backlog as of
December 31, 2014
reflects the value of orders taken during the year. The orders in our backlog from the Leasing Group are fully supported by lease commitments with external customers. The final amount dedicated to the Leasing Group may vary by the time of delivery as directed by our customers. Approximately 55% of our railcar backlog is expected to be delivered in the twelve months ending December 31, 2015 with the remainder to be delivered from 2016 through 2020. All of our Inland Barge backlog is expected to be delivered in the twelve months ending December 31, 2015. Deliveries for multi-year barge agreements are included in the backlog when specific production quantities for future years have been determined. Approximately 57% of our structural wind towers backlog is expected to be delivered in the twelve months ending December 31, 2015 with the remainder to be delivered in 2016. The Company does not report backlog from its utility structures business because certain contracts contain partial order cancellation provisions.
Marketing.
We sell or lease substantially all of our products and services through our own sales personnel operating from offices in multiple locations in the U.S. as well as Canada, Mexico, the United Kingdom, Singapore, Sweden, and Peru. We also use independent sales representatives on a limited basis.
Raw Materials and Suppliers.
Railcar Specialty Components and Steel.
Products manufactured at our railcar manufacturing facilities require a significant supply of raw materials such as steel, as well as numerous specialty components such as brakes, wheels, axles, side frames, bolsters, and bearings. Although the number of alternative suppliers of specialty components has declined in recent years, at least two suppliers continue to produce most components.
The principal material used in our manufacturing segments is steel. During 2014, the supply of steel was sufficient to support our manufacturing requirements. Market steel prices were relatively stable during the year with 2014 prices averaging slightly higher than 2013. Steel prices may be volatile in the future in part as a result of market conditions. We often use contract-specific purchasing practices, existing supplier commitments, contractual price escalation provisions, and other arrangements with our customers, to mitigate the effect of steel price volatility on our operating profits for the year. In general, we believe there is enough capacity in the supply industry to meet current production levels and that our existing contracts and other relationships we have in place will meet our current production forecasts.
Aggregates.
Natural and lightweight aggregates can be found throughout the U.S., and many producers exist nationwide. Shipments of natural aggregates from an individual quarry are generally limited in geographic scope because the cost of transporting processed aggregates to customers is high in relation to the value of the product itself. Lightweight aggregates have a much wider, multi-state distribution area due to their higher value relative to their distribution costs. We currently operate 14 mining facilities strategically located in Texas, Louisiana, Colorado, and California.
6
Employees.
The following table presents the approximate headcount breakdown of employees by business group:
|
Business Group
|
December 31,
2014 |
|
|
Rail Group
|
10,980
|
|
|
Construction Products Group
|
1,670
|
|
|
Inland Barge Group
|
2,130
|
|
|
Energy Equipment Group
|
6,340
|
|
|
Railcar Leasing and Management Services Group
|
200
|
|
|
All Other
|
420
|
|
|
Corporate
|
330
|
|
|
22,070
|
|
|
As of
December 31, 2014
, approximately 12,520 employees were employed in the U.S. and 9,430 employees were employed in Mexico.
Acquisitions and Divestitures.
See Note 2 of the Notes to Consolidated Financial Statements.
Environmental Matters.
We are subject to comprehensive federal, state, local, and foreign environmental laws and regulations relating to the release or discharge of materials into the environment; the management, use, processing, handling, storage, transport, and disposal of hazardous and non-hazardous waste and materials; and other activities relating to the protection of human health and the environment.
Environmental operating permits are, or may be, required for our operations under these laws and regulations. These operating permits are subject to modification, renewal, and revocation. We regularly monitor and review our operations, procedures, and policies for compliance with our operating permits and related laws and regulations. We believe that our operations and facilities, whether owned, managed, or leased, are in substantial compliance with applicable environmental laws and regulations and that any non-compliance is not likely to have a material adverse effect on our operations or financial condition.
Governmental Regulation.
Railcar Industry.
The primary regulatory and industry authorities involved in the regulation of the railcar industry are the U.S. Environmental Protection Agency ("USEPA"); the Research and Special Programs Administration, the Federal Railroad Administration ("FRA"), and the Pipeline and Hazardous Materials Safety Administration ("PHMSA"), all divisions of the U.S. Department of Transportation ("USDOT"); and the Association of American Railroads ("AAR"). These organizations establish rules and regulations for the railcar industry, rail infrastructure, and rail interchange, including product specifications and standards for the design and manufacture of railcars and railcar parts; mechanical, maintenance, and related standards for railcars; safety of railroad equipment, tracks, and operations; and packaging and transportation of hazardous or toxic materials. We believe that our product designs and operations are in compliance with these specifications, standards and regulations.
Recent derailments in North America of trains transporting crude oil have caused various regulatory agencies and industry organizations, including but not limited to the USDOT; FRA; PHMSA; Transport Canada ("TC"); AAR and the AAR Tank Car Committee; American Petroleum Institute; and Railway Supply Institute, as well as community governments, to focus attention on transportation by rail of flammable materials. In August 2014, PHMSA published a Notice of Proposed Rulemaking seeking interested party comments on potential regulatory initiatives pertaining to the transportation of flammable materials by rail. A similar rulemaking process and request for comments was initiated in Canada in July 2014 under the direction of TC - Transport Dangerous Goods. Comment periods for PHMSA and TC have closed and agency review of comments is in process at both PHMSA and TC. Regulatory certainty from PHMSA and TC is expected in 2015. While the regulatory process itself and the scope of any potential regulatory change is uncertain, the Company is assessing its position under a variety of potentially diverse, final rule scenarios. Any final rule may or may not materially impact the rail industry as a whole; railroad operations; older and newer tank railcars that meet or exceed currently mandated PHMSA and TC standards; future tank railcar specifications; market decisions relative to capital investment in rail products; and the capability of the nation’s railcar manufacturing, repair and maintenance infrastructure to implement mandated modification configurations or new construction.
Inland Barge Industry.
The primary regulatory and industry authorities involved in the regulation of the inland barge industry are the U.S. Coast Guard; the U.S. National Transportation Safety Board; the U.S. Customs Service; the Maritime Administration of the U.S. Department of Transportation; and private industry organizations such as the American Bureau of Shipping. These organizations establish safety criteria, investigate vessel accidents, and recommend improved safety standards. We believe that our product specifications and operations are in compliance with applicable laws and regulations.
7
Highway Products.
The primary regulatory and industry authorities involved in the regulation of highway products manufacturers are the USDOT, the Federal Highway Administration ("FHWA"), and various state highway departments. These organizations, with participation from the American Association of State Highway and Transportation Officials, establish certain standards, specifications, and product testing criteria related to the manufacture of our highway products. If our products were found to be not in compliance with these standards, specifications, or product testing criteria, we could be required to re-qualify our products for installation on state and national highways, recall products already in use or installed, or replace products in use or installed with other products manufactured by us or manufactured by our competitors.We believe that our highway products are in compliance with all applicable standards and specifications.
Occupational Safety and Health Administration and Similar Regulations.
Our operations are subject to regulation of health and safety matters by the U.S. Occupational Safety and Health Administration and the U.S. Mine Safety and Health Administration. We believe that we employ appropriate precautions to protect our employees and others from workplace injuries and harmful exposure to materials handled and managed at our facilities. However, claims that may be asserted against us for work-related illnesses or injury and the further adoption of occupational and mine safety and health regulations in the U.S. or in foreign jurisdictions in which we operate could increase our operating costs. While we do not anticipate having to make material expenditures in order to remain in substantial compliance with health and safety laws and regulations, we are unable to predict the ultimate cost of compliance.
See Item 1A for further discussion of risk factors with regard to environmental, governmental, and other matters.
Executive Officers and Other Corporate Officers of the Company.
The following table sets forth the names and ages of all of our executive officers and other corporate officers, their positions and offices presently held by them, and the year each person first became an officer. All officer terms expire in May 2015.
|
Name
|
Age
|
Office
|
Officer
Since
|
|||
|
Timothy R. Wallace*
|
61
|
Chairman, Chief Executive Officer, and President
|
1985
|
|||
|
James E. Perry*
|
43
|
Senior Vice President and Chief Financial Officer
|
2005
|
|||
|
Melendy E. Lovett*
|
56
|
Senior Vice President and Chief Administrative Officer
|
2014
|
|||
|
William A. McWhirter II*
|
50
|
Senior Vice President and Group President
|
2005
|
|||
|
D. Stephen Menzies*
|
59
|
Senior Vice President and Group President
|
2001
|
|||
|
S. Theis Rice*
|
64
|
Senior Vice President and Chief Legal Officer
|
2002
|
|||
|
Kathryn A. Collins
|
51
|
Vice President, Human Resources
|
2014
|
|||
|
Tammy D. Gilbert
|
54
|
Vice President, Information Technology
|
2012
|
|||
|
Virginia C. Gray, Ph.D.
|
55
|
Vice President, Organizational Development
|
2007
|
|||
|
Mary E. Henderson*
|
56
|
Vice President and Chief Accounting Officer
|
2009
|
|||
|
John M. Lee
|
54
|
Vice President, Business Development
|
1994
|
|||
|
Steven L. McDowell
|
53
|
Vice President and Chief Audit Executive
|
2013
|
|||
|
Gail M. Peck
|
47
|
Vice President, Finance and Treasurer
|
2010
|
|||
|
Heather Perttula Randall
|
41
|
Vice President, Legal Affairs and Government Relations
|
2011
|
|||
|
Jared S. Richardson
|
42
|
Vice President, Associate General Counsel and Secretary
|
2010
|
|||
|
Stephen W. Smith
|
65
|
Vice President and Chief Technical Officer
|
2012
|
|||
*
Executive officer subject to reporting requirements under Section 16 of the Securities Exchange Act of 1934.
Ms. Collins joined Trinity in 2014 as Vice President, Human Resources. Prior to joining Trinity, she worked for RealPage, Inc. from 2012 to 2014, most recently serving as Vice President, Talent Management and HR Systems. She served as Divisional Vice President, Organization Effectiveness and Vice President, Associate Recruitment at J.C. Penney Company, Inc. where she held management and executive positions from 2009 to 2012.
Ms. Gilbert joined Trinity in 2012 as Vice President, Information Technology. Prior to joining Trinity, she worked for Hewlett-Packard from 2006 to 2012, most recently serving as the America's Vice President, Transition, Transformation, and Project/Program Management. She has also held executive positions with Electronic Data Systems, Sabre Holdings, American Airlines, and Harris Methodist Hospital.
Ms. Henderson joined the Company in 2003 as Director of Financial Reporting. She was named Assistant Controller in 2005 and Controller in 2009. In 2010, Ms. Henderson was elected Vice President and Chief Accounting Officer.
Ms. Lovett joined the Company in 2014 as Senior Vice President and Chief Administrative Officer. She was a member of the Company's Board of Directors since 2012 but resigned from her Board position at Trinity in connection with her appointment as an officer of the Company. Prior to joining Trinity, she worked for Texas Instruments ("TI") from 1993 to 2014 serving as Senior
8
Vice President and President of TI's Education Technology business from 2004. She previously served as Vice President in TI's human resources organization from 1998. Prior to joining TI, she was a senior manager with the consulting firm of Coopers & Lybrand.
Mr. McWhirter joined the Company in 1985 and held various accounting positions until 1992, when he became a business group officer. In 1999, he was elected to a corporate position as Vice President for Mergers and Acquisitions. In 2001, he was named Executive Vice President of a business group. In March 2005, he became Vice President and Chief Financial Officer and in 2006, Senior Vice President and Chief Financial Officer. In 2010, Mr. McWhirter was named Senior Vice President and Group President of the Construction Products and Inland Barge Groups. In 2012, Mr. McWhirter was named Senior Vice President and Group President of the Construction Products, Energy Equipment, and Inland Barge Groups.
Mr. McDowell joined the Company in 2013 as Vice President and Chief Audit Executive. Prior to joining Trinity, he worked for Dean Foods from 2007 to 2013, where he held a variety of management positions and most recently served as Vice President, Internal Audit and Risk Management. Prior to his tenure at Dean Foods, he served as Vice President - Internal Audit at Centex Corporation.
Ms. Peck joined Trinity in 2010 as Treasurer and was appointed Vice President and Treasurer in 2011 and Vice President, Finance and Treasurer in 2014. Prior to joining Trinity, she worked for Centex Corporation from 2001 to 2009, serving as Vice President and Treasurer beginning in 2004.
Mr. Perry joined Trinity in 2004 and was appointed Treasurer in April 2005. Mr. Perry was named a Vice President of Trinity in 2006 and appointed its Vice President, Finance in 2007. In 2010, Mr. Perry was appointed Chief Financial Officer and in 2011 was elected Senior Vice President and Chief Financial Officer.
Ms. Randall joined the Company in 2005 as Chief Counsel of
TrinityRail.
In 2006, she became Deputy General Counsel in charge of litigation for Trinity. In 2011, Ms. Randall was elected Vice President, Legal Affairs and Government Relations.
Mr. Rice joined the Company in 1991 and held various legal and business positions until 2005, when he was elected Vice President and Chief Legal Officer. He was named Senior Vice President, Human Resources and Chief Legal Officer in 2011 and was named Senior Vice President and Chief Legal Officer in 2013.
Mr. Richardson joined the Company in 2010 as Associate General Counsel and Secretary. In 2012, Mr. Richardson was elected Vice President, Associate General Counsel, and Secretary. From 2004 to 2009, he handled legal, corporate governance, and secretary matters for Energy Future Holdings Corp. (formerly TXU Corp.).
Mr. Smith joined the Company in 1976 and held various engineering positions, advancing to Senior Vice President Engineering for
TrinityRail.
In 2008, Mr. Smith was promoted to a corporate position and serving as an engineering and technical advisor to Trinity's Group Presidents and corporate officers. In 2012, Mr. Smith was elected Vice President and was named Chief Technical Officer in 2013.
Messrs. Wallace, Menzies, and Lee and Dr. Gray have been in full time employment of Trinity or its subsidiaries for more than five years and have performed essentially the same respective duties during such time.
Item 1A.
Risk Factors.
There are risks and uncertainties that could cause our actual results to be materially different from those mentioned in forward-looking statements that we make from time to time in filings with the Securities and Exchange Commission (“SEC”), news releases, reports, proxy statements, registration statements, and other written communications, as well as oral forward-looking statements made from time to time by representatives of our Company. All known material risks and uncertainties are described below. The cautionary statements below discuss important factors that could cause our business, financial condition, operating results, and cash flows to be materially adversely affected. Accordingly, readers are cautioned not to place undue reliance on the forward-looking statements contained herein. We undertake no obligations to update or revise publicly any forward-looking statements, whether as a result of new information, future events, or otherwise.
Many of the industries in which we operate are cyclical, and, accordingly, our business is subject to changes in the economy.
We operate in cyclical industries. Downturns in overall economic conditions usually have a significant adverse effect on cyclical industries due to decreased demand for new and replacement products. Decreased demand could result in lower sales volumes, lower prices, and/or a loss of profits. The railcar, barge, and wind energy industries have previously experienced sharp cyclical downturns and at such times operated with a minimal backlog. The business cycles of our different operations may not typically coincide but an economic downturn could impact disparate cycles contemporaneously. In such cases, the effect of an economic downturn may have a magnified negative effect on our business.
Volatility in the global markets may adversely affect our business and operating results.
Instability in the global economy, negative conditions in the global credit markets, volatility in the industries that our products serve, fluctuations in commodity
9
prices that our customers produce and transport, changes in legislative policy, adverse changes in the availability of raw materials and supplies, or adverse changes in the financial condition of our customers could lead to customers' requests for deferred deliveries of our backlog orders. Additionally such events could result in our customers' attempts to cancel orders in whole or in part or unilaterally terminate firm contracts resulting in un-remedied contract breaches or purchase order breaches, and increased commercial litigation costs. Such occurrences could adversely affect our cash flows and results of operations.
If volatile conditions in the global credit markets prevent our customers' access to credit, product order volumes may decrease or customers may default on payments owed to us. Likewise, if our suppliers face challenges obtaining credit, selling their products to customers that require purchasing credit, or otherwise operating their businesses, the supply of materials we purchase from them to manufacture our products may be interrupted. Any of these conditions or events could result in reductions in our revenues, increased price competition, or increased operating costs, which could adversely affect our business, results of operations, and financial condition.
Litigation claims could increase our costs and weaken our financial condition.
We are currently, and may from time to time be, involved in various claims or legal proceedings arising out of our operations. Adverse judgments and outcomes in some or all of these matters could result in significant losses and costs that could weaken our financial condition. Although we maintain reserves for our reasonably estimable liability, our reserves may be inadequate to cover our portion of claims or judgments after taking into consideration rights in indemnity and recourse to third parties. Any such claims or judgments could have a material adverse effect on our business, operations, or overall financial condition.
Increases in the price and demand for steel could lower our
margins and profitability.
The principal material used in our manufacturing segments is steel. Market steel prices may exhibit short periods of volatility. Steel prices may experience further volatility as a result of scrap surcharges assessed by steel mills and other market factors. We often use contract-specific purchasing practices, existing supplier commitments, contractual price escalation provisions, and other arrangements with our customers to mitigate the effect of this volatility on our operating profits for the year. To the extent that we do not have such arrangements in place, an increase in steel prices could materially lower our profitability. In addition, meeting production demands is dependent on our ability to obtain a sufficient amount of steel. An unanticipated interruption in our supply chain could have an adverse impact on both our margins and production schedules.
We have potential exposure to environmental liabilities, which may increase costs and
lower profitability.
We are subject to comprehensive federal, state, local, and foreign environmental laws and regulations relating to: (i) the release or discharge of materials into the environment at our facilities or with respect to our products while in operation; (ii) the management, use, processing, handling, storage, transport, and disposal of hazardous and non-hazardous waste and materials; and (iii) other activities relating to the protection of human health and the environment. Such laws and regulations not only expose us to liability for our own acts, but also may expose us to liability for the acts of others or for our actions which were in compliance with all applicable laws at the time these actions were taken. In addition, such laws may require significant expenditures to achieve compliance, and are frequently modified or revised to impose new obligations. Civil and criminal fines and penalties may be imposed for non-compliance with these environmental laws and regulations. Our operations involving hazardous materials also raise potential risks of liability under common law.
Environmental operating permits are, or may be, required for our operations under these laws and regulations. These operating permits are subject to modification, renewal, and revocation. Although we regularly monitor and review our operations, procedures, and policies for compliance with our operating permits and related laws and regulations, the risk of environmental liability is inherent in the operation of our businesses, as it is with other companies operating under environmental permits.
However, future events, such as changes in, or modified interpretations of, existing environmental laws and regulations or enforcement policies, or further investigation or evaluation of the potential health hazards associated with the manufacture of our products and related business activities and properties, may give rise to additional compliance and other costs that could have a material adverse effect on our financial condition and operations.
In addition to environmental laws, the transportation of commodities by railcar, barge, or storage container raises potential risks in the event of an accident that results in the release of an environmentally sensitive substance. Generally, liability under existing laws for a derailment or other accident depends upon causation analysis and the acts, errors, or omissions, if any, of a party involved in the transportation activity, including, but not limited to, the railroad, the shipper, the buyer and seller of the substances being transported, or the manufacturer of the railcar, barge, or storage container, or its components. Additionally, the severity of injury or property damage arising from an incident may influence the causation responsibility analysis, exposing the Company to potentially greater liability. Under certain circumstances, strict liability concepts may apply and if we are found liable in any such incident, it could have a material adverse effect on our financial condition, business, and operations.
10
We operate in highly competitive industries. We may not be able to sustain our market
leadership positions, which may impact our financial results.
We face aggressive competition in all geographic markets and each industry sector in which we operate. In addition to price, we face competition in product performance and technological innovation, quality, reliability of delivery, customer service, and other factors. This competition is often intense, the effects of which could reduce our revenues and operating profits, limit our ability to grow, increase pricing pressure on our products, and otherwise affect our financial results.
The limited number of customers in certain of our businesses, the variable purchase patterns of our customers in all our segments, and the timing of completion, delivery, and customer acceptance of orders may cause our revenues and income from operations to vary substantially each quarter, which would result in significant fluctuations in our quarterly results.
Some of the markets we serve are dominated by a limited number of customers. Customers in each of our business segments do not purchase a similar volume of products each year nor make purchases consistently from year-to-year. As a result, the order levels for our products have varied significantly from quarterly period to quarterly period in the past and may continue to vary significantly in the future. Therefore, our results of operations in any particular quarterly period may be significantly affected. As a result of these quarterly fluctuations, we believe that comparisons of our sales and operating results between quarterly periods may not be meaningful and should not be relied upon as indicators of future performance.
Our access to capital may be limited or unavailable due to deterioration of conditions in the global capital markets, weakening of macroeconomic conditions, and negative changes in credit ratings.
In general, the Company, and more specifically its leasing subsidiaries' operations, rely in large part upon banks and capital markets to fund its operations and contractual commitments and refinance existing debt. These markets can experience high levels of volatility and access to capital can be constrained for an extended period of time. In addition to conditions in the capital markets, a number of other factors could cause the Company to incur increased borrowing costs and to have greater difficulty accessing public and private markets for both secured and unsecured debt. These factors include the Company's financial performance and its credit ratings and rating outlook as determined primarily by rating agencies such as Standard & Poor's Financial Services LLC, Moody's Investors Service, Inc., and Fitch Ratings, Inc. If the Company is unable to secure financing on acceptable terms, the Company's other sources of funds, including available cash, bank facilities, and cash flow from operations may not be adequate to fund its operations and contractual commitments and refinance existing debt.
We may be unable to maintain railcar assets on lease at satisfactory rates.
The profitability of our railcar leasing business depends on our ability to lease railcars at satisfactory rates, to re-lease railcars upon the expiration and non-renewal of existing leases, and to sell railcars in the secondary market as part of our ordinary course of business. Our ability to lease, re-lease or sell leased or unleased railcars profitably is dependent upon several factors, including, among others:
|
•
|
the cost of and demand for leases or ownership of newer or specific-use railcar types;
|
|
•
|
the availability in the market generally of competing used or new railcars;
|
|
•
|
the degree of obsolescence of leased or unleased railcars, including railcars subject to regulatory obsolescence;
|
|
•
|
the prevailing market and economic conditions, including the availability of credit, interest rates, and inflation rates;
|
|
•
|
the market demand or governmental mandate for refurbishment; and
|
|
•
|
the volume and nature of railcar traffic and loadings
|
A downturn in the industries in which our lessees operate and decreased demand for railcars could also increase our exposure to re-marketing risk because lessees may demand shorter lease terms or newer railcars, requiring us to re-market leased railcars more frequently. Furthermore, the resale market for previously leased railcars has a limited number of potential buyers. Our inability to re-lease or sell leased or unleased railcars on favorable terms could result in lower lease rates, lower lease utilization percentages, and reduced revenues.
Fluctuations in the price and supply of specialty and other component parts used in the production of our
products could have a material adverse
effect on our ability to cost-effectively manufacture and sell our products. In some instances, we rely on a limited number of suppliers for certain components needed in our production.
A significant portion of our business depends on the adequate supply of numerous specialty and other parts and components at competitive prices such as brakes, wheels, side frames, bolsters, and bearings for the railcar business, as well as flanges for the wind towers business. Our manufacturing operations partially depend on our ability to obtain timely deliveries of materials, parts, and components in acceptable quantities and quality from our suppliers. Certain parts and components of our products are currently available from a limited number of suppliers and, as a result, we may have limited control over pricing, availability, and delivery schedules. If we are unable to purchase a sufficient quantity of parts and components on a timely basis, we could face disruptions in our production and incur delays while we attempt
11
to engage alternative suppliers. Fewer suppliers could result from unimproved or worsening economic or commercial conditions which could increase our rejections for poor quality and require us to source unknown and distant supply alternatives. Any such disruption or conditions could harm our business and adversely impact our results of operations.
Reductions in the availability of energy supplies or an increase in energy costs may
increase our operating costs.
We use various gases, including natural gas, at our manufacturing facilities and use diesel fuel in vehicles to transport our products to customers and to operate our plant equipment. An outbreak or escalation of hostilities between the U.S. and any foreign power and, in particular, prolonged conflicts could result in a real or perceived shortage of petroleum and/or natural gas, which could result in an increase in the cost of natural gas or energy in general. Hurricanes or other natural disasters could result in a real or perceived shortage of petroleum and/or natural gas potentially resulting in an increase in natural gas prices or general energy costs. Speculative trading in energy futures in the world markets could also result in an increase in natural gas and general energy cost. Future limitations on the availability (including limitations imposed by increased regulation or restrictions on rail, road, and pipeline transportation of energy supplies) or consumption of petroleum products and/or an increase in energy costs, particularly natural gas for plant operations and diesel fuel for vehicles and plant equipment, could have an adverse effect upon our ability to conduct our business cost effectively.
Our manufacturer's warranties expose us to product replacement and repair claims.
Depending on the product, we warrant against manufacturing defects due to our workmanship and certain materials (including surface coatings, primers, sealants, and interior linings), parts, and components pursuant to express limited contractual warranties. Accordingly, we may be subject to significant warranty claims in the future such as multiple claims based on one defect repeated throughout our production process or claims for which the cost of repairing or replacing the defective part, component or material is highly disproportionate to the original price. These types of warranty claims could result in costly product recalls, significant repair or replacement costs, and damage to our reputation.
Increasing insurance claims and expenses could lower profitability and increase
business risk.
The nature of our business subjects us to product liability, property damage, and personal injury claims, especially in connection with products we manufacture that our customers install along US highways or that our customers use to transport hazardous, flammable, toxic, or explosive materials. Over the last several years, insurance carriers have raised premiums for many companies operating in our industries. Increased premiums may further increase our insurance expense as coverage expires or otherwise cause us to raise our self-insured retention. If the number or severity of claims within our self-insured retention increases, we could suffer costs in excess of the reserves we maintain for the reasonably estimable liability in such claims or such number. Also the severity of such claims could expose us to uninsured damages if we were unable or elected not to insure against certain hazards because of high premiums or other reasons. While our liability insurance coverage is at or above levels based on commercial norms in our industries, an unusually large liability claim or a string of claims coupled with an unusually large damage award could exceed our liability insurance coverage. In addition, the availability of, and our ability to collect on, insurance coverage is often subject to factors beyond our control. If any of our third-party insurers fail, cancel our coverage, or otherwise are unable to provide us with adequate insurance coverage, then our overall risk exposure and our operational expenses would increase and the management of our business operations would be disrupted. Moreover, any accident or incident involving our industries in general or us or our products specifically, even if we are fully insured, contractually indemnified, or not held to be liable, could negatively affect our reputation among customers and the public, thereby making it more difficult for us to compete effectively, and could significantly affect the cost and availability of insurance in the future.
Many of our products are sold to leasing companies, contractors, distributors, and installers who may misuse, abuse, improperly install or improperly or inadequately maintain or repair such products thereby potentially exposing the Company to claims that could increase our costs and weaken our financial condition.
The products we manufacture are designed to work optimally when properly operated, installed, repaired, and maintained. When this does not occur, the Company may be subjected to claims or litigation associated with injuries or property damage.
Risks related to our operations outside of the U.S., particularly Mexico, could decrease our
profitability.
Our operations outside of the U.S. are subject to the risks associated with cross-border business transactions and activities. Political, legal, trade, economic change or instability, unrestrained criminal activities, or social unrest could limit or curtail our respective foreign business activities and operations, including the ability to hire and retain employees. Violence in Mexico associated with drug trafficking has not abated. We have not, to date, been materially affected by any of these risks, but we cannot predict the likelihood of future effects from such risks or any resulting adverse impact on our business, results of operations, or financial condition. Many items manufactured by us in Mexico are sold primarily in the U.S. and the transportation and import of such products may be disrupted. Some foreign countries where we operate have regulatory authorities that regulate railroad safety, railcar and railcar component part design, performance, and manufacture of equipment used on their railroad systems. If we fail to obtain and maintain certifications of our railcars and railcar parts and components within the various foreign countries where we operate, we may be unable to market and sell our railcars, parts, and components in those countries. In addition, unexpected changes in laws, rules, and regulatory requirements; tariffs and other trade barriers, including regulatory initiatives for buying goods produced in America;
12
more stringent or restrictive laws, rules, and regulations relating to labor or the environment; adverse tax consequences; and price exchange controls could limit operations affecting production throughput and making the manufacture and distribution of our products less timely or more difficult. Furthermore, any material change in the quotas, regulations, or duties on imports imposed by the U.S. government and agencies, or on exports by the government of Mexico or its agencies, could affect our ability to export products that we manufacture in Mexico. Because we have operations outside the
U.S., we could be adversely affected by final judgments of non-compliance with the U.S. Foreign Corrupt Practices Act or import/export rules and regulations and similar anti-corruption or import/export laws of other countries.
Equipment failures or extensive damage to our facilities, including as might occur as a result of natural disasters, could lead to production, delivery, or service curtailments or shutdowns, loss of revenue or higher expenses.
We operate a substantial amount of equipment at our production facilities, several of which are situated in tornado and hurricane zones and on navigable waterways in the U.S. An interruption in production capabilities or maintenance and repair capabilities at our facilities, as a result of equipment failure or acts of nature, including non-navigation orders resulting from low-water conditions issued from time to time by the U.S. Army Corps of Engineers on one or more U.S. rivers which serve our facilities, could reduce or prevent our production, delivery, service, or repair of our products and increase our costs and expenses. A halt of production at any of our manufacturing facilities could severely affect delivery times to our customers. While we maintain business recovery plans that are intended to allow us to recover from natural disasters that could disrupt our business, we cannot provide assurances that our plans would fully protect us from the effects of all such disasters. In addition, insurance may not adequately compensate us for any losses incurred as a result of natural or other disasters, which may adversely affect our financial condition. Any significant delay in deliveries not otherwise contractually mitigated by favorable force majeure provisions could result in cancellation of all or a portion of our orders, cause us to lose future sales, and negatively affect our reputation and our results of operations.
Because we do not have employment contracts with our key management employees, we may
not be able to retain their services in the future.
Our success depends on the continued services of our key management employees, none of whom currently have an employment agreement with us. Although we have historically been largely successful in retaining the services of our key management, we may not be able to do so in the future. The loss of the services of one or more key members of our management team could result in increased costs associated with attracting and retaining a replacement and could disrupt our operations and result in a loss of revenues.
Repercussions from terrorist activities or armed conflict could harm our
business.
Terrorist activities, anti-terrorist efforts, and other armed conflict involving the U.S. or its interests abroad may adversely affect the U.S. and global economies, potentially preventing us from meeting our financial and other obligations. In particular, the negative impacts of these events may affect the industries in which we operate. This could result in delays in or cancellations of the purchase of our products or shortages in raw materials, parts, or components. Any of these occurrences could have a material adverse impact on our operating results, revenues, and costs.
Violations of or changes in the regulatory requirements applicable to the industries
in which we operate may increase our operating costs.
Our railcar manufacturing and leasing businesses are regulated by multiple governmental regulatory agencies such as the USEPA; the USDOT and the administrative agencies it oversees, including the FRA, PHMSA, and the Research and Special Programs Administration; and industry authorities such as the AAR. All such agencies and authorities promulgate rules, regulations, specifications, and operating standards affecting railcar design, configuration, and mechanics; maintenance, and rail-related safety standards for railroad equipment, tracks, and operations, including the packaging and transportation of hazardous or toxic materials. Future regulatory changes in the rail industry, including rules, regulations, and specifications mandating modified railcar designs, configurations, materials, and equipment could affect compliance costs and may have a material adverse effect on our financial condition and operations.
Recent derailments in North America of trains transporting crude oil have caused various U.S. and Canadian regulatory agencies and industry organizations, as well as community governments, to focus attention on transportation by rail of flammable materials. In July and August of 2014, PHMSA and TC, published notices of proposed rulemakings seeking interested party comments on potential regulatory initiatives pertaining to the transportation of flammable materials by rail. Regulatory certainty from PHMSA and TC is expected in 2015. While the regulatory process itself and the scope of any potential regulatory change is uncertain, any final rule or rules may or may not materially impact the rail industry as a whole; railroad operations; older and newer tank railcars that meet or exceed currently mandated PHMSA and TC standards; future tank railcar specifications; market decisions relative to capital investment in rail products; and the capability of the nation’s railcar manufacturing, repair and maintenance infrastructure to implement mandated modification configurations or new construction. The Company cannot assure that costs incurred to comply with standards and regulations emerging from PHMSA’s and TC's rulemaking processes will not be material to the Company’s financial position or results of operations.
Our Inland Barge operations are subject to regulation by the U.S. Coast Guard; the U.S. National Transportation Safety Board; the U.S. Customs Service; the Maritime Administration of the U.S. Department of Transportation; and private industry organizations
13
such as the American Bureau of Shipping. These organizations establish safety criteria, investigate vessel accidents and recommend improved safety standards.
Our Construction Products Group is subject to regulation by the USDOT; the FHWA; and state highway departments and administrative agencies. These organizations establish certain standards, specifications, and product testing criteria related to the manufacture of our highway products. If our products were found to be not in compliance with these standards, specifications, or product testing criteria, or if additional testing criteria not previously contemplated by the applicable rules or regulations are required, we could be required to re-qualify our products for installation on state and national highways, recall products already in use or installed, or replace products in use or installed with other products manufactured by us or manufactured by our competitors.
Our operations are also subject to regulation of health and safety matters by the U.S. Occupational Safety and Health Administration and the U.S. Mine Safety and Health Administration. Although we believe we employ appropriate precautions to protect our employees and others from workplace injuries and harmful exposure to materials handled and managed at our facilities, claims that may be asserted against us for work-related illnesses or injury, and the further adoption of occupational and mine safety and health regulations in the U.S. or in foreign jurisdictions in which we operate could increase our operating costs. We are unable to predict the ultimate cost of compliance with these health and safety laws and regulations.
Some of our customers place orders for our products in reliance on their ability to utilize tax benefits or tax credits such as accelerated depreciation or the production tax credit for renewable energy, or to recover the cost of products acquired to comply with federal requirements or standards.
There is no assurance that the U.S. government will reauthorize, modify, or otherwise not allow the expiration of such tax benefits, tax credits, or reimbursement policies, and in cases where such subsidies and policies are materially modified to reduce the available benefit, credit, or reimbursement or are otherwise allowed to expire, the demand for our products could decrease, thereby creating the potential for a material adverse effect on our financial condition or results of operations.
We may be required to reduce the value of our long-lived assets and/or
goodwill, which would weaken our financial results.
We periodically evaluate for potential impairment the carrying values of our long-lived assets to be held and used. The carrying value of a long-lived asset to be held and used is considered impaired when the carrying value is not recoverable through undiscounted future cash flows and the fair value of the asset is less than the carrying value. Fair value is determined primarily using the anticipated cash flows discounted at a rate commensurate with the risks involved or market quotes as available. Impairment losses on long-lived assets held for sale are determined in a similar manner, except that fair values are reduced commensurate with the estimated cost to dispose of the assets. In addition, goodwill is required to be tested for impairment annually, or on an interim basis whenever events or circumstances change, indicating that the carrying amount of the goodwill might be impaired. Impairment losses related to reductions in the value of our long-lived assets or our goodwill could weaken our financial condition and results of operations.
We may incur increased costs due to fluctuations in interest rates and foreign
currency exchange rates.
We are exposed to risks associated with fluctuations in interest rates and changes in foreign currency exchange rates. Under varying circumstances, we may seek to minimize these risks through the use of interest rate hedges and similar financial instruments and other activities, although these measures, if and when implemented, may not be effective. Any material and untimely changes in interest rates or exchange rates could result in significant losses to us.
Railcars as a significant mode of transporting freight could decline, become more
efficient over time, experience a shift in types of modal transportation, and/or
certain railcar types could become obsolete.
As the freight transportation markets we serve continue to evolve and become more efficient, the use of railcars may decline in favor of other more economic transportation modalities or the number of railcars needed to transport current or an increasing volume of goods may decline. Features and functionality specific to certain railcar types could result in those railcars becoming obsolete as customer requirements for freight delivery change or as regulatory mandates are promulgated that affect railcar design, configuration, and manufacture.
Business, regulatory, and legal developments regarding climate change may affect the
demand for our products or the ability of our critical suppliers to meet our
needs.
We have followed the current debate over climate change in general, and the related science, policy discussion, and prospective legislation. Additionally, the potential challenges and opportunities for the Company that climate change policy and legislation may pose have been reviewed. However, any such challenges or opportunities are heavily dependent on the nature and degree of climate change legislation and the extent to which it applies to our industries. At this time, the Company cannot predict the ultimate impact of climate change and climate change legislation on the Company's operations or opportunities. Potential opportunities could include greater demand for wind towers and certain types of railcars, while potential challenges could include decreased demand for certain types of railcars and higher energy costs. Further, when or if these impacts may occur cannot be assessed until scientific analysis and legislative policy are more developed and specific legislative proposals begin to take shape.
14
Changes in accounting standards or inaccurate estimates or assumptions in the application of accounting policies could adversely affect our financial results
.
Our accounting policies and methods are fundamental to how we record and report our financial condition and results of operations. Some of these policies require use of estimates and assumptions that may affect the reported value of our assets or liabilities and financial results and are critical because they require management to make difficult, subjective, and complex judgments about matters that are inherently uncertain. Accounting standard setters and those who interpret the accounting standards (such as the Financial Accounting Standards Board, the SEC, and our independent registered public accounting firm) may amend or even reverse their previous interpretations or positions on how these standards should be applied. These changes can be difficult to predict and can materially impact how we record and report our financial condition and results of operations. In some cases, we could be required to apply a new or revised standard retroactively, resulting in the restatement of prior period financial statements. For a further discussion of some of our critical accounting policies and standards and recent accounting changes, see Critical Accounting Policies and Estimates in Management's Discussion and Analysis of Financial Condition and Results of Operations and Note 1 Summary of Significant Accounting Policies of the Notes to Consolidated Financial Statements.
Shortages of skilled labor could adversely impact our operations.
We depend on skilled labor in the manufacture, maintenance, and repair of our products. Some of our facilities are located in areas where demand for skilled laborers may exceed supply. Shortages of some types of skilled laborers, such as welders, could restrict our ability to maintain or increase production rates and could increase our labor costs.
Some of our employees belong to labor unions, and strikes or work stoppages could adversely affect our operations.
We are a party to collective bargaining agreements with various labor unions at some of our operations in the U.S. and all of our operations in Mexico. Disputes with regard to the terms of these agreements or our potential inability to negotiate acceptable contracts with these unions in the future could result in, among other things, strikes, work stoppages or other slowdowns by the affected workers. We cannot be assured that our relations with our workforce will remain positive or that union organizers will not be successful in future attempts to organize at some of our facilities. If our workers were to engage in a strike, work stoppage or other slowdown, or other employees were to become unionized, or the terms and conditions in future labor agreements were renegotiated, we could experience a significant disruption of our operations and higher ongoing labor costs. In addition, we could face higher labor costs in the future as a result of severance or other charges associated with lay-offs, shutdowns or reductions in the size and scope of our operations or difficulties of restarting our operations that have been temporarily shuttered.
From time to time we may take tax positions that the Internal Revenue Service or other taxing jurisdictions may contest.
We have in the past and may in the future take tax positions that the Internal Revenue Service (“IRS”) or other taxing jurisdictions may challenge. We are required to disclose to the IRS as part of our tax returns particular tax positions in which we have a reasonable basis for the position but not a "more likely than not" chance of prevailing. If the IRS successfully contests a tax position that we take, we may be required to pay additional taxes or fines which may not have been previously accrued that may adversely affect our results of operations and financial position.
Our inability to produce and disseminate relevant and/or reliable data and information pertaining to our business in an efficient, cost-effective, secure, and well-controlled fashion may have significant negative impacts on confidentiality requirements and obligations and proprietary needs and expectations and, therefore, our future operations, profitability, and competitive position.
Management relies on information technology infrastructure and architecture, including hardware, network, software, people, and processes to provide useful and confidential information to conduct our business in the ordinary course, including correspondence and commercial data and information interchange with customers, suppliers, legal counsel, governmental agencies, and financial institution consultants, and to support assessments and conclusions about future plans and initiatives pertaining to market demands, operating performance, and competitive positioning. In addition, any material failure, interruption of service, compromised data security, or cybersecurity threat could adversely affect our relations with suppliers and customers, place us in violation of confidentiality and data protection laws, rules, and regulations, and result in negative impacts to our market share, operations, and profitability. Security breaches in our information technology could result in theft, destruction, loss, misappropriation, or release of confidential data or intellectual property which could adversely impact our future results.
Discord, conflict, and lack of compromise within and amongst the executive and legislative branches of the U.S. government relative to federal government budgeting, taxation policies, government expenditures, and U.S. borrowing/debt ceiling limits could adversely affect our business and operating results.
The legislative and executive branches of the U.S. government have encountered one or more impasses or deadlocks relative to federal government budgeting, tax revenue requirements, deficit spending, and management of short and long term U.S. government borrowing, debt ratings, and debt ceiling adjustments. Continuing impasse or deadlock could negatively impact U.S. domestic and global financial markets thereby reducing demand by our customers for our products and services and potentially result in reductions in our revenues, increased price competition, or increased operating costs, any of which could adversely affect our business results of operations and financial condition.
15
The Company could potentially fail to successfully integrate new businesses or products into its current business.
The Company routinely engages in the search for growth opportunities, including assessment of merger and acquisition prospects in new markets and/or products. Any merger or acquisition in which the Company becomes involved and ultimately concludes is subject to integration into the Company's businesses and culture. If such integration is unsuccessful to any material degree, such lack of success could result in unexpected claims or otherwise have a material adverse effect on our business, operations, or overall financial condition.
Additional Information.
Our Internet website address is
www.trin.net
. Information on the website is available free of charge. We make available on our website our annual report on Form 10-K, quarterly reports on Form 10-Q, current reports on Form 8-K, and any amendments thereto, as soon as reasonably practicable after such material is filed with, or furnished to, the SEC. The contents of our website are not intended to be incorporated by reference into this report or in any other report or document we file and any reference to our website is intended to be an inactive textual reference only.
Item 1B.
Unresolved Staff Comments.
None.
Item 2.
Properties.
We principally operate in various locations throughout the U.S. and in Mexico and Canada. Our facilities are considered to be in good condition, well maintained, and adequate for our purposes.
|
Approximate Square Feet
|
Approximate Square Feet Located In
|
|||||||||||||
|
Owned
|
Leased
|
US
|
Mexico
|
Canada
|
||||||||||
|
Rail Group
|
6,586,100
|
|
129,500
|
|
4,638,800
|
|
2,076,800
|
|
—
|
|
||||
|
Construction Products Group
|
1,859,500
|
|
101,900
|
|
1,930,300
|
|
31,100
|
|
—
|
|
||||
|
Inland Barge Group
|
996,700
|
|
81,000
|
|
1,077,700
|
|
—
|
|
—
|
|
||||
|
Energy Equipment Group
|
2,805,800
|
|
554,600
|
|
2,589,100
|
|
687,900
|
|
83,400
|
|
||||
|
Corporate Offices
|
231,200
|
|
3,100
|
|
211,000
|
|
23,300
|
|
—
|
|
||||
|
12,479,300
|
|
870,100
|
|
10,446,900
|
|
2,819,100
|
|
83,400
|
|
|||||
Our estimated weighted average production capacity utilization for the twelve month period ended December 31,
2014
is reflected by the following percentages:
|
Production Capacity Utilized
|
||
|
Rail Group
|
90
|
%
|
|
Construction Products Group
|
65
|
%
|
|
Inland Barge Group
|
85
|
%
|
|
Energy Equipment Group
|
85
|
%
|
Item 3.
Legal Proceedings.
See Note 18 of the Notes to Consolidated Financial Statements.
Item 4.
Mine Safety Disclosures
The information concerning mine safety violations or other regulatory matters required by Section 1503(a) of the Dodd-Frank Wall Street Reform and Consumer Protection Act and Item 104 of Regulation S-K is included in Exhibit 95 to this Form 10-K.
16
Item 5.
Market for Registrant's Common Equity, Related Stockholder Matters
and Issuer Purchases of Equity Securities.
Our common stock is traded on the New York Stock Exchange under the ticker symbol “TRN”. The following table shows the closing price range of our common stock by quarter for the years ended
December 31, 2014
and
2013
(1)
.
|
Prices
|
|||||||
|
Year Ended December 31, 2014
|
High
|
Low
|
|||||
|
Quarter ended March 31, 2014
|
$
|
37.32
|
|
$
|
27.08
|
|
|
|
Quarter ended June 30, 2014
|
43.74
|
|
33.82
|
|
|||
|
Quarter ended September 30, 2014
|
50.30
|
|
41.56
|
|
|||
|
Quarter ended December 31, 2014
|
43.12
|
|
26.57
|
|
|||
|
Year Ended December 31, 2013
|
High
|
Low
|
|||||
|
Quarter ended March 31, 2013
|
$
|
22.70
|
|
$
|
18.10
|
|
|
|
Quarter ended June 30, 2013
|
22.31
|
|
17.65
|
|
|||
|
Quarter ended September 30, 2013
|
23.09
|
|
17.88
|
|
|||
|
Quarter ended December 31, 2013
|
28.33
|
|
21.79
|
|
|||
(1)
Stock prices have been adjusted to reflect a 2-for-1 stock split issued in the form of a 100% stock dividend in June 2014.
Our transfer agent and registrar as of
December 31, 2014
was American Stock Transfer & Trust Company.
Holders
At
December 31, 2014
, we had 1,885 record holders of common stock. The par value of the common stock is $1.00 per share.
Dividends
Trinity has paid 203 consecutive quarterly dividends. Quarterly dividends declared by Trinity for the years ended
December 31, 2014
and
2013
are as follows
(2)
:
|
Year Ended December 31,
|
|||||||
|
2014
|
2013
|
||||||
|
Quarter ended March 31,
|
$
|
0.075
|
|
$
|
0.055
|
|
|
|
Quarter ended June 30,
|
0.100
|
|
0.065
|
|
|||
|
Quarter ended September 30,
|
0.100
|
|
0.075
|
|
|||
|
Quarter ended December 31,
|
0.100
|
|
0.075
|
|
|||
|
Total
|
$
|
0.375
|
|
$
|
0.270
|
|
|
(2)
Per share amounts have been adjusted to reflect a 2-for-1 stock split issued in the form of a 100% stock dividend in June 2014.
Recent Sales of Unregistered Securities
None.
17
Performance Graph
The following Performance Graph and related information shall not be deemed
“soliciting material” or to be “filed” with the SEC, nor shall such information be
incorporated by reference into any future filing under the Securities Act of 1933 or
Securities Exchange Act of 1934, each as amended, except to the extent that the
Company specifically incorporates it by reference into such filing.
The following graph compares the Company's cumulative total stockholder return (assuming reinvestment of dividends) during the five-year period ended December 31, 2014 with an overall stock market index (New York Stock Exchange Composite Index) and the Company's peer group index (Dow Jones US Commercial Vehicles & Trucks Index). The data in the graph assumes $100 was invested on December 31, 2009.
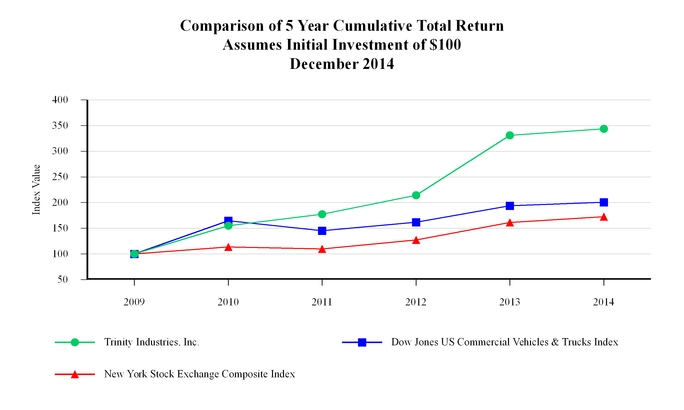
|
2009
|
|
2010
|
|
2011
|
|
2012
|
|
2013
|
|
2014
|
|
||||||
|
Trinity Industries, Inc.
|
100
|
|
155
|
|
177
|
|
214
|
|
331
|
|
343
|
|
|||||
|
Dow Jones US Commercial Vehicles & Trucks Index
|
100
|
|
165
|
|
145
|
|
162
|
|
194
|
|
201
|
|
|||||
|
New York Stock Exchange Composite Index
|
100
|
|
114
|
|
110
|
|
128
|
|
161
|
|
172
|
|
|||||
18
Issuer Purchases of Equity Securities
N
EED
This table provides information with respect to purchases by the Company of shares of its common stock during the quarter ended
December 31, 2014
:
|
Period
|
Number of Shares Purchased
(1)
|
Average Price Paid per Share
(1)
|
Total Number of Shares (or Units) Purchased as Part of Publicly Announced Plans or Programs
(2)
|
Maximum Number (or Approximate Dollar Value) of Shares (or Units) that May Yet Be Purchased Under the Plans or Programs
(2)
|
||||||||||
|
October 1, 2014 through October 31, 2014
|
2,358
|
|
$
|
36.98
|
|
—
|
|
$
|
218,529,671
|
|
||||
|
November 1, 2014 through November 30, 2014
|
441
|
|
$
|
35.01
|
|
—
|
|
$
|
218,529,671
|
|
||||
|
December 1, 2014 through December 31, 2014
|
299
|
|
$
|
28.85
|
|
—
|
|
$
|
218,529,671
|
|
||||
|
Total
|
3,098
|
|
$
|
35.91
|
|
—
|
|
$
|
218,529,671
|
|
||||
(1)
These columns include the following transactions during the three months ended December 31, 2014: (i) the surrender to the Company of 618 shares of common stock to satisfy tax withholding obligations in connection with the vesting of restricted stock issued to employees and (ii) the purchase of 2,480 shares of common stock by the Trustee for assets held in a non-qualified employee profit-sharing plan trust.
(2)
In March 2014, the Company's Board of Directors authorized a new $250 million share repurchase program that expires on December 31, 2015 and replaced the Company's previously authorized $200 million share repurchase program. Under the new program, no shares were repurchased during the three months ended December 31, 2014. The approximate dollar value of shares that were eligible to be repurchased under such share repurchase program is shown as of the end of such month or quarter.
19
Item 6.
Selected Financial Data.
The following financial information for the five years ended
December 31, 2014
has been derived from our audited consolidated financial statements. This information should be read in conjunction with Management's Discussion and Analysis of Financial Condition and Results of Operations and the consolidated financial statements and notes thereto included elsewhere herein.
|
Year Ended December 31,
|
|||||||||||||||||||
|
2014
|
2013
|
2012
|
2011
|
2010
|
|||||||||||||||
|
(in millions, except percent and per share data)
|
|||||||||||||||||||
|
Statement of Operations Data:
|
|||||||||||||||||||
|
Revenues
|
$
|
6,170.0
|
|
$
|
4,365.3
|
|
$
|
3,811.9
|
|
$
|
2,938.3
|
|
$
|
1,930.7
|
|
||||
|
Operating profit
|
1,251.0
|
|
772.9
|
|
574.8
|
|
426.8
|
|
294.2
|
|
|||||||||
|
Income from continuing operations
|
709.3
|
|
386.1
|
|
251.9
|
|
146.8
|
|
69.4
|
|
|||||||||
|
Gain on sale of discontinued operations, net of provision for income taxes of $-, $5.4, $-, $-, and $-
|
—
|
|
7.1
|
|
—
|
|
—
|
|
—
|
|
|||||||||
|
Income (loss) from discontinued operations, net of provision (benefit) for income taxes of $-, $(0.8), $1.1, $(0.4), and $3.6
|
—
|
|
(0.8
|
)
|
1.8
|
|
(1.1
|
)
|
6.0
|
|
|||||||||
|
Net income
|
$
|
709.3
|
|
$
|
392.4
|
|
$
|
253.7
|
|
$
|
145.7
|
|
$
|
75.4
|
|
||||
|
Net income attributable to Trinity Industries, Inc.
|
$
|
678.2
|
|
$
|
375.5
|
|
$
|
255.2
|
|
$
|
142.2
|
|
$
|
67.4
|
|
||||
|
Net income attributable to Trinity Industries, Inc. per common share:
|
|||||||||||||||||||
|
Basic:
|
|||||||||||||||||||
|
Continuing operations
|
$
|
4.35
|
|
$
|
2.34
|
|
$
|
1.59
|
|
$
|
0.89
|
|
$
|
0.39
|
|
||||
|
Discontinued operations
|
—
|
|
0.04
|
|
0.01
|
|
(0.01
|
)
|
0.04
|
|
|||||||||
|
$
|
4.35
|
|
$
|
2.38
|
|
$
|
1.60
|
|
$
|
0.88
|
|
$
|
0.43
|
|
|||||
|
Diluted:
|
|||||||||||||||||||
|
Continuing operations
|
$
|
4.19
|
|
$
|
2.34
|
|
$
|
1.58
|
|
$
|
0.89
|
|
$
|
0.39
|
|
||||
|
Discontinued operations
|
—
|
|
0.04
|
|
0.01
|
|
(0.01
|
)
|
0.04
|
|
|||||||||
|
$
|
4.19
|
|
$
|
2.38
|
|
$
|
1.59
|
|
$
|
0.88
|
|
$
|
0.43
|
|
|||||
|
Weighted average number of shares outstanding:
|
|||||||||||||||||||
|
Basic
|
151.0
|
|
152.8
|
|
154.7
|
|
154.9
|
|
153.7
|
|
|||||||||
|
Diluted
|
156.7
|
|
152.9
|
|
155.1
|
|
155.4
|
|
154.0
|
|
|||||||||
|
Dividends declared per common share
|
$
|
0.375
|
|
$
|
0.270
|
|
$
|
0.210
|
|
$
|
0.175
|
|
$
|
0.160
|
|
||||
|
Balance Sheet Data:
|
|||||||||||||||||||
|
Total assets
|
$
|
8,733.8
|
|
$
|
7,313.4
|
|
$
|
6,669.9
|
|
$
|
6,121.0
|
|
$
|
5,760.0
|
|
||||
|
Debt - recourse
|
$
|
829.3
|
|
$
|
419.0
|
|
$
|
458.1
|
|
$
|
455.0
|
|
$
|
449.4
|
|
||||
|
Debt - non-recourse
|
$
|
2,723.7
|
|
$
|
2,570.8
|
|
$
|
2,596.9
|
|
$
|
2,517.2
|
|
$
|
2,457.4
|
|
||||
|
Stockholders' equity
|
$
|
3,397.4
|
|
$
|
2,749.1
|
|
$
|
2,137.6
|
|
$
|
1,948.3
|
|
$
|
1,845.7
|
|
||||
|
Ratio of total debt to total capital
|
51.1
|
%
|
52.1
|
%
|
58.8
|
%
|
60.4
|
%
|
61.2
|
%
|
|||||||||
|
Book value per share
|
$
|
21.83
|
|
$
|
17.75
|
|
$
|
13.52
|
|
$
|
12.15
|
|
$
|
11.57
|
|
||||
Per share and share amounts have been adjusted to reflect a 2-for-1 stock split issued in the form of a 100% stock dividend in June 2014.
20
Item 7.
Management’s Discussion and Analysis of Financial Condition and Results of Operations
Management’s Discussion and Analysis of Financial Condition and Results of Operations (“MD&A”) is intended to provide a reader of our financial statements with a narrative from the perspective of our management on our financial condition, results of operations, liquidity, and certain other factors that may affect our future results. Our MD&A is presented in the following sections:
•
Company Overview
•
Executive Summary
•
Results of Operations
•
Liquidity and Capital Resources
•
Contractual Obligations and Commercial Commitments
•
Critical Accounting Policies and Estimates
•
Recent Accounting Pronouncements
•
Forward-Looking Statements
Our MD&A should be read in conjunction with our Consolidated Financial Statements and related Notes in Item 8, Financial Statements and Supplementary Data, of this Annual Report on Form 10-K.
Company Overview
Trinity Industries, Inc., headquartered in Dallas, Texas, is a diversified industrial company that owns market-leading businesses providing products and services to the energy, transportation, chemical, and construction sectors. We operate in five distinct business groups which we report on a segment basis: the Rail Group, Construction Products Group, Inland Barge Group, Energy Equipment Group, and Railcar Leasing and Management Services Group. We also report the All Other segment which includes the Company's captive insurance and transportation companies; legal, environmental, and maintenance costs associated with non-operating facilities; and other peripheral businesses.
Our Rail and Inland Barge Groups and our structural wind towers, utility structures, and storage and distribution containers businesses operate in cyclical industries. Results in our Construction Products and Energy Equipment Groups are subject to seasonal fluctuations with the first quarter historically being the weakest quarter. Railcar sales from the lease fleet are the primary driver of fluctuations in results in the Railcar Leasing and Management Services Group.
Demand conditions and corresponding order levels for new railcars continue to be favorable across a wide variety of industries. While demand conditions and corresponding order levels for barges serving the oil and gas markets have slowed recently, favorable conditions exist long term for barges in the chemical and petrochemical markets. In other markets, such as agricultural products, demand has recently been strong for hopper barges. Budgetary constraints at the Federal and state levels, and pending litigation in our Highway Products business have negatively impacted the results of our Construction Products Group.
We continually assess our manufacturing capacity and take steps to align our production capacity with demand for our products. Due to improvements in demand for certain products, we have continued to increase production staff at certain facilities. We expect that facilities on non-operating status will be available for future operations should demand increase further.
Executive Summary
The Company’s revenues for
2014
were $
6.2 billion
, representing an increase of $
1.8 billion
or
41%
over last year. Operating profit increased to $
1.3 billion
compared to $
0.8 billion
last year for an increase of
61.9%
. Operating margin improved to
20.3%
in
2014
from
17.7%
in
2013
. The increase in revenues for
2014
, when compared to the prior year, resulted primarily from higher shipment volumes and higher pricing due to increased overall demand and a more favorable product mix in our Rail Group. Additionally, our Leasing Group experienced significantly higher revenues from external railcar sales along with higher leasing and management revenues related to higher utilization and rental rates. Revenues in our Energy Equipment Group increased primarily due to higher volumes and acquisitions. Revenues in our Construction Products Group were higher in our Aggregates business due to acquisitions and higher volumes. Increased deliveries and a more favorable product mix led to higher revenues for our Inland Barge Group. Overall operating profit and margin grew for the
year ended
December 31, 2014
, when compared with the prior year, primarily due to higher shipment levels and the effects of a more favorable product mix in our Rail Group, higher railcar sales from our Leasing Group, and increased volumes in our Construction Products, Inland Barge, and Energy Equipment Groups. Selling, engineering, and administrative expenses increased for the
year ended
December 31, 2014
, primarily due to increased staffing and higher performance-related compensation costs in addition to increased legal expenses. The Company's headcount, including both production and non-production personnel, has increased approximately 20% since the end of
2013
primarily due to production expansion and acquisitions. Net income from continuing operations for the
year ended
December 31, 2014
was
$709.3 million
and increased
$323.2 million
or
83.7%
over the prior year. Net income attributable to Trinity Industries, Inc. common stockholders for the
year ended
December 31, 2014
was
$678.2 million
and increased
$302.7 million
or
80.6%
over the prior year.
21
As of
December 31, 2014
and
2013
our backlog of firm and noncancellable orders was as follows:
|
December 31,
2014 |
December 31,
2013 |
||||||
|
|
(in millions)
|
||||||
|
Rail Group
|
|||||||
|
External Customers
|
$
|
5,204.3
|
|
$
|
4,189.6
|
|
|
|
Leasing Group
|
2,010.5
|
|
827.0
|
|
|||
|
$
|
7,214.8
|
|
$
|
5,016.6
|
|
||
|
Inland Barge Group
|
$
|
437.9
|
|
$
|
429.6
|
|
|
|
Wind towers
|
$
|
473.5
|
|
$
|
553.9
|
|
|
For the
twelve months ended
December 31, 2014
, our rail manufacturing businesses received orders for
51,395
railcars, including a multi-year railcar order received in November 2014 from GATX Corporation to deliver 8,950 railcars over a four-year period beginning in 2016. The increase in backlog as of
December 31, 2014
reflects the value of orders taken during the year. The orders in our backlog from the Leasing Group are fully supported by lease commitments with external customers. The final amount dedicated to the Leasing Group may vary by the time of delivery as directed by our customers. Approximately 55% of our railcar backlog is expected to be delivered in the twelve months ending December 31, 2015 with the remainder to be delivered from 2016 through 2020. All of our Inland Barge backlog is expected to be delivered in the twelve months ending December 31, 2015. Deliveries for multi-year barge agreements are included in the backlog when specific production quantities for future years have been determined. Approximately 57% of our structural wind towers backlog is expected to be delivered in the twelve months ending December 31, 2015 with the remainder to be delivered in 2016. The Company does not report backlog from its utility structures business because certain contracts contain partial order cancellation provisions.
Capital expenditures for
2014
were
$464.6 million
with
$245.3 million
utilized for net lease fleet additions, net of deferred profit of
$133.1 million
. Manufacturing and corporate capital expenditures for
2015
are projected to be between
$250.0 million
and
$300.0 million
. For
2015
, we expect the annual net cash investment in new railcars in our lease fleet to be between
$55.0 million
and
$70.0 million
after considering the expected proceeds received from leased railcar sales during the year.
During the
year ended
December 31, 2014
, the Company received proceeds of
$882.7 million
from the sale of leased railcars to Element Financial Corporation ("Element") under the strategic alliance with Element announced in December 2013, including
$200.4 million
recorded as revenue by the Rail Group. From the total proceeds received from Element, the Leasing Group recorded
$446.6 million
in revenue from the sale of railcars owned one year or less at the time of sale. The remainder of the proceeds of
$235.7 million
is attributable to the sale of railcars owned more than one year at the time of sale and is, consequently, excluded from revenue. Since the inception of our alliance, the Company has received proceeds of
$987.7 million
from the sale of leased railcars to Element.
In
March 2014
, the Company’s Board of Directors authorized a new
$250 million
share repurchase program that expires on
December 31, 2015
and replaced the Company's previously authorized
$200 million
share repurchase program. Under the new program,
747,246
shares were repurchased during the year ended
December 31, 2014
, at a cost of
$31.5 million
.
In
May 2014
, the Company's partially-owned leasing subsidiary, TRIP Rail Holdings LLC ("TRIP Holdings"), acquired $388 million in railcar equipment from Trinity Industries Leasing Company ("TILC"). In connection with this portfolio purchase, TRIP Master Funding issued
$335.7 million
in aggregate principal amount of Series 2014-1 Secured Railcar Equipment Notes pursuant to the Master Indenture between TRIP Master Funding and Wilmington Trust Company, as indenture trustee, with a final maturity date of
April 2044
. The TRIP Master Funding Series 2014-1 Secured Railcar Equipment Notes consist of
two
classes with the Class A-1 notes bearing interest at
2.86%
and the Class A-2 notes bearing interest at
4.09%
. The TRIP Master Funding Secured Railcar Equipment Notes are non-recourse to Trinity, TILC, TRIP Holdings, and the other equity investors in TRIP Holdings and are secured by TRIP Master Funding's portfolio of railcars and operating leases thereon, its cash reserves, and all other assets owned by TRIP Master Funding. As of
December 31, 2014
, there were
$108.7 million
and
$220.7 million
of Class A-1 and Class A-2 notes outstanding, respectively. The remainder of the purchase price was provided by TILC and the third-party investors of TRIP Holdings who contributed $21.6 million and $49.6 million, respectively, net of expenses.
In
May 2014
, the Company's Board of Directors authorized a
2-for-1
stock split. The stock split was issued in the form of a
100%
stock dividend. The additional shares were distributed on
June 19, 2014
, to shareholders of record at the close of business on
June 5, 2014
. All share and per share information, including dividends, has been retroactively adjusted to reflect the
2-for-1
stock split, except for the statement of stockholders' equity which will reflect the stock split by reclassifying from "Capital in Excess of Par Value" to "Common Stock" in the amount of
$78.0 million
which equals the par value of the additional shares issued to effect the stock split.
22
Additionally, the Company increased its quarterly dividend in May 2014 by 33%. On a stock-split adjusted basis, the Company increased its quarterly dividend to $0.10 per share compared to the previous, split-adjusted level of $0.075 per share.
In August 2014, Trinity completed its acquisition of the assets of Meyer, the utility steel structures division of Thomas & Betts Corporation, a member of the ABB Group, for approximately
$595.6 million
in cash. Meyer is one of North America's leading providers of tubular steel structures for electricity transmission and distribution. During the
year ended
December 31, 2014
, we completed the acquisitions of the assets of WesMor Cryogenic Companies and Alloy Custom Products, Inc., expanding the Company's engineering and manufacturing capabilities to provide cryogenic storage and distribution products. We also completed the acquisition of the assets of Platinum Energy Services Corporation in Alberta, Canada, a manufacturer and seller of oil and gas process and storage equipment as well as the acquisition of a galvanizing services business located in Texas.
In September 2014, the Company issued
$400.0 million
aggregate principal amount of
4.55%
senior notes ("Senior Notes") due
October 2024
. Interest on the Senior Notes is payable semiannually commencing April 1, 2015. The Senior Notes rank senior to existing and future subordinated debt including the Company's Convertible Subordinated Notes and rank equal to existing and future senior indebtedness, including the Company's revolving credit facility. The Senior Notes are subordinated to all the Company's existing and future secured debt to the extent of the value of the collateral securing such indebtedness. The Senior Notes could restrict our ability to incur additional debt; make certain distributions, investments, and other restricted payments; create certain liens; and consolidate, merge, or transfer all or substantially all of our assets. The Company’s Senior Notes are fully and unconditionally and jointly and severally guaranteed by certain of Trinity’s 100%-owned subsidiaries. See Note 19 of the Notes to the Consolidated Financial Statements for Financial Statements for Guarantors of the Senior Notes. Proceeds from the note issuance are intended to be used for general corporate purposes.
23
Results of Operations
Years Ended
December 31, 2014
,
2013
, and
2012
Overall Summary for Continuing Operations
Revenues
|
|
Year Ended December 31, 2014
|
|
|||||||||||||
|
|
Revenues
|
Percent Change 2014 versus 2013
|
|||||||||||||
|
|
External
|
Intersegment
|
Total
|
||||||||||||
|
|
($ in millions)
|
|
|||||||||||||
|
Rail Group
|
$
|
3,077.6
|
|
$
|
739.2
|
|
$
|
3,816.8
|
|
33.1
|
|
%
|
|||
|
Construction Products Group
|
546.1
|
|
5.6
|
|
551.7
|
|
5.1
|
|
|||||||
|
Inland Barge Group
|
638.5
|
|
—
|
|
638.5
|
|
10.7
|
|
|||||||
|
Energy Equipment Group
|
796.0
|
|
196.3
|
|
992.3
|
|
49.1
|
|
|||||||
|
Railcar Leasing and Management Services Group
|
1,106.4
|
|
11.9
|
|
1,118.3
|
|
73.3
|
|
|||||||
|
All Other
|
5.4
|
|
105.0
|
|
110.4
|
|
27.5
|
|
|||||||
|
Segment Totals before Eliminations
|
6,170.0
|
|
1,058.0
|
|
7,228.0
|
|
34.7
|
|
|||||||
|
Eliminations – Lease subsidiary
|
—
|
|
(710.1
|
)
|
(710.1
|
)
|
|
|
|||||||
|
Eliminations – Other
|
—
|
|
(347.9
|
)
|
(347.9
|
)
|
|||||||||
|
Consolidated Total
|
$
|
6,170.0
|
|
$
|
—
|
|
$
|
6,170.0
|
|
41.3
|
|
%
|
|||
|
|
Year Ended December 31, 2013
|
|
|||||||||||||
|
|
Revenues
|
Percent Change 2013 versus 2012
|
|||||||||||||
|
External
|
Intersegment
|
Total
|
|||||||||||||
|
($ in millions)
|
|||||||||||||||
|
Rail Group
|
$
|
2,093.5
|
|
$
|
774.0
|
|
$
|
2,867.5
|
|
42.4
|
|
%
|
|||
|
Construction Products Group
|
508.6
|
|
16.4
|
|
525.0
|
|
8.5
|
|
|||||||
|
Inland Barge Group
|
576.6
|
|
0.1
|
|
576.7
|
|
(14.6
|
)
|
|||||||
|
Energy Equipment Group
|
536.5
|
|
128.9
|
|
665.4
|
|
19.1
|
|
|||||||
|
Railcar Leasing and Management Services Group
|
645.4
|
|
—
|
|
645.4
|
|
(0.3
|
)
|
|||||||
|
All Other
|
4.7
|
|
81.9
|
|
86.6
|
|
6.4
|
|
|||||||
|
Segment Totals before Eliminations
|
4,365.3
|
|
1,001.3
|
|
5,366.6
|
|
20.4
|
|
|||||||
|
Eliminations – Lease subsidiary
|
—
|
|
(756.5
|
)
|
(756.5
|
)
|
|||||||||
|
Eliminations – Other
|
—
|
|
(244.8
|
)
|
(244.8
|
)
|
|||||||||
|
Consolidated Total
|
$
|
4,365.3
|
|
$
|
—
|
|
$
|
4,365.3
|
|
14.5
|
|
%
|
|||
|
Year Ended December 31, 2012
|
|||||||||||||||
|
Revenues
|
|||||||||||||||
|
External
|
Intersegment
|
Total
|
|||||||||||||
|
($ in millions)
|
|||||||||||||||
|
Rail Group
|
$
|
1,512.1
|
|
$
|
500.9
|
|
$
|
2,013.0
|
|
||||||
|
Construction Products Group
|
461.2
|
|
22.5
|
|
483.7
|
|
|||||||||
|
Inland Barge Group
|
675.2
|
|
—
|
|
675.2
|
|
|||||||||
|
Energy Equipment Group
|
506.0
|
|
52.6
|
|
558.6
|
|
|||||||||
|
Railcar Leasing and Management Services Group
|
644.4
|
|
2.7
|
|
647.1
|
|
|||||||||
|
All Other
|
13.0
|
|
68.4
|
|
81.4
|
|
|||||||||
|
Segment Totals before Eliminations
|
3,811.9
|
|
647.1
|
|
4,459.0
|
|
|||||||||
|
Eliminations – Lease subsidiary
|
—
|
|
(485.9
|
)
|
(485.9
|
)
|
|||||||||
|
Eliminations – Other
|
—
|
|
(161.2
|
)
|
(161.2
|
)
|
|||||||||
|
Consolidated Total
|
$
|
3,811.9
|
|
$
|
—
|
|
$
|
3,811.9
|
|
||||||
Our revenues for the
year ended
December 31, 2014
, increased by
41.3%
from the previous year. The increase was primarily due to higher shipment volumes and pricing due to increased overall demand and a more favorable product mix in our Rail Group combined with the effects of higher volumes in our Construction Products, Inland Barge, and Energy Equipment Groups. In addition to higher volumes, revenues from our Inland Barge Group increased as a result of favorable product mix changes while an increase in revenues from our Energy Equipment Group was primarily due to acquisitions completed in 2014. Our Leasing Group experienced higher leasing and management revenues due to increased rental rates and higher utilization as well as higher external railcar sales.
24
Our revenues for the
year ended
December 31, 2013
, increased by
14.5%
from the previous year. The overall increase was primarily due to higher shipment volumes and a favorable change in product mix in our Rail Group, acquisition-related higher shipment volumes in the Aggregates and Other product lines of our Construction Products Group, and higher revenues in our Energy Equipment Group resulting primarily from increased demand for storage and distribution container vessels and other product lines. Lower revenues in our Inland Barge Group were due to lower volumes and a less favorable product mix while revenues in our Railcar Leasing and Management Services Group were substantially unchanged as higher revenue from leasing and management were offset by lower revenues from railcar sales.
Operating Costs
Operating costs are comprised of cost of revenues; selling, engineering, and administrative costs; and gains or losses on property disposals.
|
|
Year Ended December 31,
|
||||||||||
|
|
2014
|
2013
|
2012
|
||||||||
|
|
(in millions)
|
||||||||||
|
Rail Group
|
$
|
3,092.7
|
|
$
|
2,377.8
|
|
$
|
1,814.0
|
|
||
|
Construction Products Group
|
486.3
|
|
472.4
|
|
438.9
|
|
|||||
|
Inland Barge Group
|
524.1
|
|
480.7
|
|
550.5
|
|
|||||
|
Energy Equipment Group
|
884.2
|
|
604.0
|
|
540.4
|
|
|||||
|
Railcar Leasing and Management Services Group
|
602.0
|
|
348.6
|
|
346.2
|
|
|||||
|
All Other
|
136.0
|
|
100.3
|
|
91.6
|
|
|||||
|
Segment Totals before Eliminations and Corporate Expenses
|
5,725.3
|
|
4,383.8
|
|
3,781.6
|
|
|||||
|
Corporate
|
119.0
|
|
73.4
|
|
51.5
|
|
|||||
|
Eliminations – Lease subsidiary
|
(577.0
|
)
|
(621.1
|
)
|
(435.1
|
)
|
|||||
|
Eliminations – Other
|
(348.3
|
)
|
(243.7
|
)
|
(160.9
|
)
|
|||||
|
Consolidated Total
|
$
|
4,919.0
|
|
$
|
3,592.4
|
|
$
|
3,237.1
|
|
||
Operating costs for the
year ended
December 31, 2014
, increased by 36.9% over the previous year primarily due to higher shipment levels in our manufacturing segments and higher railcar sales in our Leasing Group. Selling, engineering, and administrative expenses increased overall primarily due to higher performance-related compensation costs and increased staffing in addition to increased legal expenses. For
2013
, the 11.0% increase in operating costs over the previous year was primarily due to higher shipment levels in our Rail, Construction Products, and Energy Equipment Groups. Operating costs from our Inland Barge Group decreased due to lower shipment volumes and a change in the mix of barge types. As a percentage of revenue, our selling, engineering, and administrative expenses were
6.5%
for
2014
as compared to
6.7%
for
2013
and
5.9%
for
2012
.
Operating Profit (Loss)
|
|
Year Ended December 31,
|
||||||||||
|
|
2014
|
2013
|
2012
|
||||||||
|
|
(in millions)
|
||||||||||
|
Rail Group
|
$
|
724.1
|
|
$
|
489.7
|
|
$
|
199.0
|
|
||
|
Construction Products Group
|
65.4
|
|
52.6
|
|
44.8
|
|
|||||
|
Inland Barge Group
|
114.4
|
|
96.0
|
|
124.7
|
|
|||||
|
Energy Equipment Group
|
108.1
|
|
61.4
|
|
18.2
|
|
|||||
|
Railcar Leasing and Management Services Group
|
516.3
|
|
296.8
|
|
300.9
|
|
|||||
|
All Other
|
(25.6
|
)
|
(13.7
|
)
|
(10.2
|
)
|
|||||
|
Segment Totals before Eliminations and Corporate Expenses
|
1,502.7
|
|
982.8
|
|
677.4
|
|
|||||
|
Corporate
|
(119.0
|
)
|
(73.4
|
)
|
(51.5
|
)
|
|||||
|
Eliminations – Lease subsidiary
|
(133.1
|
)
|
(135.4
|
)
|
(50.8
|
)
|
|||||
|
Eliminations – Other
|
0.4
|
|
(1.1
|
)
|
(0.3
|
)
|
|||||
|
Consolidated Total
|
$
|
1,251.0
|
|
$
|
772.9
|
|
$
|
574.8
|
|
||
Our operating profit for the
year ended
December 31, 2014
increased by
61.9%
primarily as a result of higher shipments in our manufacturing segments as well as higher railcar sales in our Leasing Group. Our operating profit for the
year ended
December 31, 2013
increased by
34.5%
primarily as a result of higher shipment levels in our Rail Group in addition to improved efficiencies in our Energy Equipment Group.
For a further discussion of revenues, costs, and the operating results of individual segments, see
Segment Discussion
below.
25
Other Income and Expense
.
Other income and expense is summarized in the following table:
|
|
Year Ended December 31,
|
||||||||||
|
|
2014
|
2013
|
2012
|
||||||||
|
|
(in millions)
|
||||||||||
|
Interest income
|
$
|
(1.9
|
)
|
$
|
(2.1
|
)
|
$
|
(1.5
|
)
|
||
|
Interest expense
|
193.4
|
|
187.3
|
|
194.7
|
|
|||||
|
Other, net
|
(4.6
|
)
|
(2.8
|
)
|
(4.3
|
)
|
|||||
|
Consolidated Total
|
$
|
186.9
|
|
$
|
182.4
|
|
$
|
188.9
|
|
||
Interest expense in
2014
increased
$6.1 million
over the prior year primarily due to the issuance of the Company's Senior Notes in September 2014. Interest expense in
2013
decreased
$7.4 million
over the prior year primarily due to the TRIP Holdings debt refinancing completed in May 2013. The increase in Other, net income for the
year ended
December 31, 2014
was primarily due to higher foreign currency translation gains. The decrease in Other, net income for the
year ended
December 31, 2013
was due to higher foreign currency translation gains in
2012
exceeding the gains recognized in
2013
from the change in fair value of certain equity repurchase agreements.
Income Taxes.
The provision for income taxes results in effective tax rates that differ from the statutory rates. The following is a reconciliation between the statutory U.S. Federal income tax rate and the Company’s effective income tax rate on income from continuing operations:
|
Year Ended December 31,
|
||||||||
|
|
2014
|
2013
|
2012
|
|||||
|
Statutory rate
|
35.0
|
%
|
35.0
|
%
|
35.0
|
%
|
||
|
State taxes
|
1.4
|
|
2.1
|
|
2.0
|
|
||
|
Domestic production activities deduction
|
(2.0
|
)
|
(1.4
|
)
|
—
|
|
||
|
Noncontrolling interest in partially-owned subsidiaries
|
(1.1
|
)
|
(0.9
|
)
|
—
|
|
||
|
Tax assessments and settlements
|
—
|
|
—
|
|
(0.6
|
)
|
||
|
Changes in valuation allowances and reserves
|
0.1
|
|
(0.8
|
)
|
(1.4
|
)
|
||
|
Other, net
|
(0.1
|
)
|
0.6
|
|
(0.3
|
)
|
||
|
Effective rate
|
33.3
|
%
|
34.6
|
%
|
34.7
|
%
|
||
Our effective tax rate reflects a current tax benefit available for U.S. manufacturing activity in addition to income attributable to the noncontrolling interests in TRIP Holdings and RIV 2013. In 2013, TRIP Holdings and RIV 2013 elected to be treated as partnerships for income tax purposes and, consequently, no income tax expense has been provided with respect to income earned after this election attributable to the noncontrolling interests. See Note 5 of the Notes to the Consolidated Financial Statements for a further explanation of activities with respect to TRIP Holdings and RIV 2013. See Note 13 of the Notes to the Consolidated Financial Statements for a further discussion of income taxes.
Income from continuing operations before income taxes for the
years ended
December 31, 2014
,
2013
, and
2012
was
$1,051.4 million
,
$571.2 million
, and
$376.3 million
, respectively, for U.S. operations, and
$12.6 million
,
$19.3 million
, and
$9.6 million
, respectively, for foreign operations. The Company provides deferred income taxes on the un-repatriated earnings of its foreign operations where it results in a deferred tax liability.
At
December 31, 2014
, the Company had
$33.5 million
of Federal consolidated net operating loss carryforwards and
$3.6 million
of tax-effected state loss carryforwards remaining. The Federal net operating loss carryforwards were acquired as part of an acquisition of a company in 2010 and are subject to limitations on the amount that can be utilized in any one tax year. The Federal net operating loss carryforwards are due to expire in
2028
and
2029
. We have established a valuation allowance for Federal, state, and foreign tax operating losses and credits which we have estimated may not be realizable.
The IRS field work for our
2006-2008
audit cycle has concluded and all issues, except for transfer pricing, have been agreed upon and tentatively settled. The transfer pricing issue has been appealed and we are working with both the U.S. and Mexican taxing authorities to coordinate taxation in a formal mutual agreement process (“MAP”). During 2013, we received the revenue agent report for the
2009-2011
audit cycle. All issues have been concluded and agreed to except for transfer pricing issues. The transfer pricing issues have been appealed and we have requested they be addressed in the same MAP as the
2006-2008
cycle. At this time, we cannot determine when the
2006-2008
or the
2009-2011
cycle will close and all issues formally settled.
26
Income tax payments, net of refunds, compared to our current provision are different based on 1) when estimated tax payments are due as compared to when the income was earned, 2) changes in our uncertain tax positions that are reflected in current expense, and 3) excess tax benefits from stock-based compensation that are reflected in stockholders' equity. At
December 31, 2014
, the Company's consolidated income tax position was a net receivable of $48.3 million from Federal, state, and foreign jurisdictions whereas at
December 31, 2013
, the Company's tax position was a net payable of $28.9 million for a net change of $77.2 million. Income taxes paid, net of refunds, during the
years ended
December 31, 2014
,
2013
, and
2012
totaled
$399.0 million
,
$110.9 million
, and
$18.4 million
, respectively.
Segment Discussion
Rail Group
|
|
Year Ended December 31,
|
Percent Change
|
|||||||||||||||
|
|
2014
|
2013
|
2012
|
2014 versus 2013
|
2013 versus 2012
|
||||||||||||
|
|
($ in millions)
|
||||||||||||||||
|
Revenues:
|
|||||||||||||||||
|
Rail
|
$
|
3,674.8
|
|
$
|
2,736.7
|
|
$
|
1,850.5
|
|
34.3
|
%
|
47.9
|
%
|
||||
|
Components
|
142.0
|
|
130.8
|
|
162.5
|
|
8.6
|
|
(19.5
|
)
|
|||||||
|
Total revenues
|
3,816.8
|
|
2,867.5
|
|
2,013.0
|
|
33.1
|
|
42.4
|
|
|||||||
|
Operating costs:
|
|||||||||||||||||
|
Cost of revenues
|
3,027.2
|
|
2,330.8
|
|
1,773.9
|
|
29.9
|
|
31.4
|
|
|||||||
|
Selling, engineering, and administrative costs
|
65.5
|
|
47.0
|
|
40.1
|
|
39.4
|
|
17.2
|
|
|||||||
|
Operating profit
|
$
|
724.1
|
|
$
|
489.7
|
|
$
|
199.0
|
|
47.9
|
|
146.1
|
|
||||
|
Operating profit margin
|
19.0
|
%
|
17.1
|
%
|
9.9
|
%
|
|||||||||||
As of
December 31, 2014
,
2013
, and
2012
our Rail Group backlog of railcars was as follows:
|
|
Year Ended December 31,
|
||||||||||
|
|
2014
|
2013
|
2012
|
||||||||
|
|
(in millions)
|
||||||||||
|
External Customers
|
$
|
5,204.3
|
|
$
|
4,189.6
|
|
$
|
2,867.5
|
|
||
|
Leasing Group
|
2,010.5
|
|
827.0
|
|
834.7
|
|
|||||
|
Total
|
$
|
7,214.8
|
|
$
|
5,016.6
|
|
$
|
3,702.2
|
|
||
The changes in the number of railcars in the Rail Group backlog are as follows:
|
|
Year Ended December 31,
|
|||||||
|
|
2014
|
2013
|
2012
|
|||||
|
Beginning balance
|
39,895
|
|
31,990
|
|
29,000
|
|
||
|
Orders received
|
51,395
|
|
32,240
|
|
22,350
|
|
||
|
Shipments
|
(30,255
|
)
|
(24,335
|
)
|
(19,360
|
)
|
||
|
Ending balance
|
61,035
|
|
39,895
|
|
31,990
|
|
||
Revenues increased for the
year ended
December 31, 2014
by
33.1
% when compared with the prior year with approximately three-fourths of the increase resulting from higher unit deliveries and the remainder of the increase due to improved pricing and product mix changes. Cost of revenues increased for the
year ended
December 31, 2014
by
29.9
% when compared with the prior year primarily due to an increase in unit deliveries.
Revenues increased for the
year ended
December 31, 2013
by
42.4
% when compared to
2012
with slightly more than half of the increase resulting from an increase in unit deliveries and the remainder due to improved pricing and product mix changes. Cost of revenues increased for the
year ended
December 31, 2013
by
31.4
% when compared with the prior year with approximately 80% of the increase resulting from an increase in unit deliveries and the remainder arising from product mix changes.
Unit increases and higher prices increased total backlog dollars by 43.8% when comparing
December 31, 2014
to the prior year. The average selling price in the backlog at
December 31, 2014
was 6.0% lower as compared to the previous year due to product mix changes. Backlog increased when comparing
2013
versus
2012
due to unit and price increases, as well as product mix change. The backlog dedicated to the Leasing Group is fully supported by lease commitments with external customers. The final amount dedicated to the Leasing Group may vary by the time of delivery as directed by our customers.
27
For the
year ended
December 31, 2014
, railcar shipments included sales to the Leasing Group of $
710.1 million
compared to $
756.5 million
in the comparable period in
2013
, with a deferred profit of $
133.1 million
compared to $
135.4 million
for the same period in
2013
. Results for the
year ended
December 31, 2012
, included $
485.9 million
in sales to the Leasing Group with a deferred profit of $
50.8 million
.
Sales to the Leasing Group and related profits are included in the operating results of the Rail Group but are eliminated in consolidation.
The Leasing Group purchases a portion of our railcar production, financing a portion of the purchase price through a non-recourse warehouse loan facility or cash, and periodically refinances those borrowings through equipment financing transactions. In
2014
, the Leasing Group purchased 22.5% of our railcar production compared to 27.2% in
2013
. On a segment basis, sales to the Leasing Group and related profits are included in the operating results of our Rail Group but are eliminated in consolidation.
Construction Products Group
|
|
Year Ended December 31,
|
Percent Change
|
|||||||||||||||
|
|
2014
|
2013
|
2012
|
2014 versus 2013
|
2013 versus 2012
|
||||||||||||
|
|
($ in millions)
|
||||||||||||||||
|
Revenues:
|
|||||||||||||||||
|
Highway products
|
$
|
317.6
|
|
$
|
335.9
|
|
$
|
376.1
|
|
(5.4
|
)%
|
(10.7
|
)%
|
||||
|
Aggregates
|
152.1
|
|
112.7
|
|
65.1
|
|
35.0
|
|
73.1
|
|
|||||||
|
Other
|
82.0
|
|
76.4
|
|
42.5
|
|
7.3
|
|
79.8
|
|
|||||||
|
Total revenues
|
551.7
|
|
525.0
|
|
483.7
|
|
5.1
|
|
8.5
|
|
|||||||
|
Operating costs:
|
|||||||||||||||||
|
Cost of revenues
|
430.9
|
|
409.6
|
|
387.0
|
|
5.2
|
|
5.8
|
|
|||||||
|
Selling, engineering, and administrative costs
|
67.8
|
|
63.3
|
|
52.0
|
|
7.1
|
|
21.7
|
|
|||||||
|
Property disposition gains
|
(12.4
|
)
|
(0.5
|
)
|
(0.1
|
)
|
|||||||||||
|
Operating profit
|
$
|
65.4
|
|
$
|
52.6
|
|
$
|
44.8
|
|
24.3
|
|
17.4
|
|
||||
|
Operating profit margin
|
11.9
|
%
|
10.0
|
%
|
9.3
|
%
|
|||||||||||
Revenues increased for the
year ended
December 31, 2014
by
5.1%
compared to the same period in
2013
. During the
year ended
December 31, 2014
, slightly more than half of the
35.0%
increase in revenues in our Aggregates business was due to the timing of acquisitions and the remainder was due to increased sales volume. The
5.4%
decrease in Highway Products revenue resulted from lower sales volumes. Cost of revenues increased by
5.2%
for the
year ended
December 31, 2014
when compared to the prior year due to higher volumes in our Aggregates business partially offset by a $2.6 million gain from the settlement of certain liabilities related to Aggregates acquisitions in
2013
. Selling, engineering, and administrative costs increased by
7.1%
for the
year ended
December 31, 2014
compared to the same period in
2013
primarily due to higher compensation expenses. The property disposition gains for the
year ended
December 31, 2014
primarily related to the sale of certain land held by our Aggregates business.
Revenues increased for the
year ended
December 31, 2013
by
8.5%
compared to the same period in
2012
. Increases in revenue in our Aggregates and Other businesses were due to acquisitions while the
10.7%
decrease in our Highway Products business was due to lower sales volumes. Similarly, cost of revenues increased by
5.8%
for the
year ended
December 31, 2013
, due to acquisition-related increases of approximately 15.6% offset by lower costs from lower Highway Products volumes of 9.8%. Selling, engineering, and administrative costs increased by
21.7%
in
2013
primarily due to acquisitions.
28
Inland Barge Group
|
|
Year Ended December 31,
|
Percent Change
|
|||||||||||||||
|
|
2014
|
2013
|
2012
|
2014 versus 2013
|
2013 versus 2012
|
||||||||||||
|
|
($ in millions)
|
||||||||||||||||
|
Revenues
|
$
|
638.5
|
|
$
|
576.7
|
|
$
|
675.2
|
|
10.7
|
%
|
(14.6
|
)%
|
||||
|
Operating costs:
|
|||||||||||||||||
|
Cost of revenues
|
506.6
|
|
461.5
|
|
538.9
|
|
9.8
|
|
(14.4
|
)
|
|||||||
|
Selling, engineering, and administrative costs
|
17.5
|
|
19.2
|
|
15.4
|
|
(8.9
|
)
|
24.7
|
|
|||||||
|
Property disposition gains
|
—
|
|
—
|
|
(3.8
|
)
|
|||||||||||
|
Operating profit
|
$
|
114.4
|
|
$
|
96.0
|
|
$
|
124.7
|
|
19.2
|
|
(23.0
|
)
|
||||
|
Operating profit margin
|
17.9
|
%
|
16.6
|
%
|
18.5
|
%
|
|||||||||||
Revenues increased for the
year ended
December 31, 2014
by
10.7%
compared to the same period in
2013
with two-thirds of the increase resulting from higher delivery volumes and the remainder due to product mix changes. Cost of revenues increased at a lower rate than the increase in revenues for the
year ended
December 31, 2014
when compared to the same period in the prior year due to product mix changes. Selling, engineering, and administrative costs decreased for the
year ended
December 31, 2014
compared to the same period in
2013
due to a legal reserve regarding a matter originating over ten years ago involving a foreign subsidiary recorded during the three months ended March 31, 2013 as well as decreased employee-related and consulting costs.
Revenues decreased for the
year ended
December 31, 2013
by
14.6%
compared to the same period in the prior year with two-thirds of the decrease resulting from lower delivery volumes and the remainder arising from a change in the mix of barge types. Cost of revenues decreased primarily due to product mix changes. Selling, engineering, and administrative costs increased by
24.7
% for the
year ended
December 31, 2013
primarily as a result of increased employee-related and consulting costs as well as a legal reserve recorded during the three month period ended March 31, 2013 regarding a matter originating over ten years ago involving a foreign subsidiary. Operating costs for the
year ended
December 31, 2012
included a $3.4 million net gain from sales of barges previously included in property, plant, and equipment that were under lease to third-party customers.
As of
December 31, 2014
, the backlog for the Inland Barge Group was $
437.9 million
compared to $
429.6 million
as of
December 31, 2013
. Deliveries for multi-year barge agreements are included in the backlog when specific production quantities for future years have been determined.
Energy Equipment Group
|
|
Year Ended December 31,
|
Percent Change
|
|||||||||||||||
|
|
2014
|
2013
|
2012
|
2014 versus 2013
|
2013 versus 2012
|
||||||||||||
|
|
($ in millions)
|
||||||||||||||||
|
Revenues:
|
|||||||||||||||||
|
Wind towers and utility structures
|
$
|
454.6
|
|
$
|
280.1
|
|
$
|
294.0
|
|
62.3
|
%
|
(4.7
|
)%
|
||||
|
Other
|
537.7
|
|
385.3
|
|
264.6
|
|
39.6
|
|
45.6
|
|
|||||||
|
Total revenues
|
992.3
|
|
665.4
|
|
558.6
|
|
49.1
|
|
19.1
|
|
|||||||
|
Operating costs:
|
|||||||||||||||||
|
Cost of revenues
|
810.5
|
|
559.0
|
|
510.3
|
|
45.0
|
|
9.5
|
|
|||||||
|
Selling, engineering, and administrative costs
|
74.8
|
|
45.0
|
|
30.8
|
|
66.2
|
|
46.1
|
|
|||||||
|
Property disposition gains
|
(1.1
|
)
|
—
|
|
(0.7
|
)
|
|||||||||||
|
Operating profit
|
$
|
108.1
|
|
$
|
61.4
|
|
$
|
18.2
|
|
76.1
|
|
237.4
|
|
||||
|
Operating profit margin
|
10.9
|
%
|
9.2
|
%
|
3.3
|
%
|
|||||||||||
In August 2014, Trinity completed its acquisition of the assets of Meyer for approximately
$595.6 million
in cash. Meyer is one of North America's leading providers of tubular steel structures for electricity transmission and distribution. Along with three other acquisitions completed earlier in the year, the operations of Meyer are included with the Company's Energy Equipment Group. We have combined revenues from our wind towers and utility structures product lines due to the similarity of the related products and markets. Previously reported amounts have been restated to reflect this change.
29
Revenues for the
year ended
December 31, 2014
increased by
49.1%
compared to the same period in
2013
with revenue from acquisitions completed during
2014
totaling $186.1 million and the remainder of the increase due to higher volumes. Revenues from the wind towers and utility structures product lines increased by
62.3%
while other revenues increased by
39.6%
for the
year ended
December 31, 2014
. Other revenues includes results primarily from our storage and distribution containers and tank heads product lines. Cost of revenues increased by
45.0%
for the
year ended
December 31, 2014
compared to
2013
. A little less than two-thirds of the increase was due to acquisitions while the remainder of the increase was due to higher volumes. Selling, engineering, and administrative costs increased by
66.2%
for the
year ended
December 31, 2014
compared to
2013
primarily due to acquisitions.
Revenues for the
year ended
December 31, 2013
increased by
19.1
% compared to the same period in
2012
. Other revenues increased by
45.6
%, with two-thirds of the increase due to volume increases and the remainder due to an acquisition. Revenue from wind towers and utility structures decreased by
4.7%
due primarily to a change in the type of wind towers produced. Cost of revenues for the
year ended
December 31, 2013
increased
9.5
% consisting of a 19.9% increase due to higher volumes in our storage and distribution containers, tank heads, and utility structures businesses partially offset by a 10.4% decrease due to product mix changes in our structural wind towers business. Selling, engineering, and administrative costs increased in
2013
by
46.1
% primarily related to an acquisition and additional compensation costs.
As of
December 31, 2014
, the backlog for wind towers was
$473.5 million
compared to
$553.9 million
as of
December 31, 2013
. The Company does not report backlog from its utility structures business because certain contracts contain partial order cancellation provisions.
30
Railcar Leasing and Management Services Group
|
|
Year Ended December 31,
|
Percent Change
|
|||||||||||||||
|
|
2014
|
2013
|
2012
|
2014 versus 2013
|
2013 versus 2012
|
||||||||||||
|
|
($ in millions)
|
||||||||||||||||
|
Revenues:
|
|||||||||||||||||
|
Leasing and management
|
$
|
632.0
|
|
$
|
586.9
|
|
$
|
528.5
|
|
7.7
|
%
|
11.1
|
%
|
||||
|
Sale of railcars owned one year or less at the time of sale
|
486.3
|
|
58.5
|
|
118.6
|
|
|||||||||||
|
Total revenues
|
$
|
1,118.3
|
|
$
|
645.4
|
|
$
|
647.1
|
|
73.3
|
|
(0.3
|
)
|
||||
|
Operating profit:
|
|||||||||||||||||
|
Leasing and management
|
$
|
287.9
|
|
$
|
267.3
|
|
$
|
242.6
|
|
7.7
|
|
10.2
|
|
||||
|
Railcar sales:
|
|||||||||||||||||
|
Railcars owned one year or less at the time of sale
|
136.1
|
|
9.1
|
|
24.8
|
|
|||||||||||
|
Railcars owned more than one year at the time of sale
|
92.3
|
|
20.4
|
|
33.5
|
|
|||||||||||
|
Total operating profit
|
$
|
516.3
|
|
$
|
296.8
|
|
$
|
300.9
|
|
74.0
|
|
(1.4
|
)
|
||||
|
Operating profit margin:
|
|||||||||||||||||
|
Leasing and management
|
45.6
|
%
|
45.5
|
%
|
45.9
|
%
|
|||||||||||
|
Railcar sales
|
*
|
*
|
*
|
||||||||||||||
|
Total operating profit margin
|
46.2
|
|
46.0
|
|
46.5
|
|
|||||||||||
|
Selected expense information
(1)
:
|
|||||||||||||||||
|
Depreciation
|
$
|
130.0
|
|
$
|
129.0
|
|
$
|
120.5
|
|
0.8
|
|
7.1
|
|
||||
|
Maintenance
|
$
|
78.9
|
|
$
|
71.5
|
|
$
|
59.4
|
|
10.3
|
|
20.4
|
|
||||
|
Rent
|
$
|
52.9
|
|
$
|
53.3
|
|
$
|
50.9
|
|
(0.8
|
)
|
4.7
|
|
||||
|
Interest:
|
|||||||||||||||||
|
External
|
$
|
153.3
|
|
$
|
153.5
|
|
$
|
161.2
|
|
||||||||
|
Intercompany
|
—
|
|
3.8
|
|
13.1
|
|
|||||||||||
|
Total interest expense
|
$
|
153.3
|
|
$
|
157.3
|
|
$
|
174.3
|
|
(2.5
|
)
|
(9.8
|
)
|
||||
* Not meaningful
(1)
Depreciation, maintenance, and rent expense are components of operating profit. Amortization of deferred profit on railcars sold from the Rail Group to the Leasing Group is included in the operating profits of the Leasing Group resulting in the recognition of depreciation expense based on the Company's original manufacturing cost of the railcars. Interest expense is not a component of operating profit and includes the effect of hedges. Intercompany interest expense is eliminated in consolidation and arises from Trinity’s previous ownership of a portion of TRIP Holdings’ Senior Secured Notes, which notes were retired in full in May 2013. See Note 11 Debt of the Notes to the Consolidated Financial Statements.
Total revenues increased by
73.3
% for the
year ended
December 31, 2014
compared to
2013
due to increased railcar sales. Forty-five percent of the increase in leasing and management revenues was due to higher average rental rates on renewals and 25% was due to net fleet additions with the remainder resulting from higher utilization and other fees. Sales of railcars owned one year or less at the time of sale included
$446.6 million
in railcar sales to Element for the
year ended
December 31, 2014
. Additionally, proceeds from the sale of railcars owned more than one year included
$235.7 million
in railcar sales to Element for the
year ended
December 31, 2014
. These transactions were completed as part of the Company's strategic alliance with Element announced in December 2013.
Total revenues for the
year ended
December 31, 2013
were substantially unchanged compared to the prior year, reflecting a decrease in railcar sales from the lease fleet primarily due to lower volumes, offset by an
11.1%
increase in leasing and management revenues. Of the increase in leasing and management revenues, 70% was due to lease fleet additions while the remainder was due primarily to higher rental rates in our lease fleet.
Operating profit increased by
74.0
% for the
year ended
December 31, 2014
compared to
2013
due to higher profit from railcar sales. Leasing and management profits increased primarily due to higher average rental rates in our lease fleet, partially offset by increased maintenance costs resulting from higher regulatory compliance activity for the
year ended
December 31, 2014
when compared to
2013
. Selling, engineering, and administrative costs increased to $49.6 million for the
year ended
December 31, 2014
from $37.6 million for the
year ended
December 31, 2013
primarily due to increased staffing and higher performance-related compensation costs.
31
Operating profit for the
year ended
December 31, 2013
was substantially unchanged compared to the prior year with lower profit from railcar sales offset by higher profit from operations. Increased profit from operations resulting from higher rental rates and additions to the lease fleet more than offset higher operating costs for the
year ended
December 31, 2013
when compared to the prior year. Depreciation, maintenance, and rent expense increased due to lease fleet additions and additional maintenance costs resulting primarily from increased mileage and regulatory requirements. Interest expense decreased as a result of lower borrowings.
The Leasing Group generally uses its non-recourse $475 million warehouse facility or cash to provide initial financing for a portion of the purchase price of the railcars. After initial financing, the Leasing Group generally obtains long-term financing for the railcars in the lease fleet through non-recourse asset-backed securities, long-term non-recourse operating leases pursuant to sales/leaseback transactions; long-term recourse debt such as equipment trust certificates; or third-party equity. See
Other
Financing Activities
.
Information regarding the Leasing Group’s lease fleet follows:
|
|
December 31, 2014
|
December 31, 2013
|
December 31, 2012
|
|||||
|
Number of railcars
|
75,930
|
|
75,685
|
|
71,455
|
|
||
|
Average age in years
|
7.8
|
|
7.2
|
|
6.7
|
|
||
|
Average remaining lease term in years
|
3.4
|
|
3.3
|
|
3.3
|
|
||
|
Fleet utilization
|
99.5
|
%
|
99.5
|
%
|
98.6
|
%
|
||
All Other
|
|
Year Ended December 31,
|
Percent Change
|
|||||||||||||||
|
|
2014
|
2013
|
2012
|
2014 versus 2013
|
2013 versus 2012
|
||||||||||||
|
|
($ in millions)
|
||||||||||||||||
|
Revenues
|
$
|
110.4
|
|
$
|
86.6
|
|
$
|
81.4
|
|
27.5
|
%
|
6.4
|
%
|
||||
|
Operating costs:
|
|||||||||||||||||
|
Cost of revenues
|
125.2
|
|
94.6
|
|
86.8
|
|
32.3
|
|
9.0
|
|
|||||||
|
Selling, engineering, and administrative costs
|
9.4
|
|
6.0
|
|
5.2
|
|
56.7
|
|
15.4
|
|
|||||||
|
Property disposition losses/(gains)
|
1.4
|
|
(0.3
|
)
|
(0.4
|
)
|
|||||||||||
|
Operating loss
|
$
|
(25.6
|
)
|
$
|
(13.7
|
)
|
$
|
(10.2
|
)
|
|
|
|
|
||||
Revenues increased by
27.5%
for the
year ended
December 31, 2014
compared to
2013
due to increased revenues from our transportation company resulting from higher internal shipments. The increase in operating loss for the
year ended
December 31, 2014
was due to higher costs of facility maintenance activities, higher costs related to commodity hedges, and higher reserves.
The increase in revenues for the
year ended
December 31, 2013
compared to the prior year of
6.4%
was primarily due to higher internal billings related to facility maintenance activities. The increase in operating loss for the
year ended
December 31, 2013
was primarily due to certain reserves related to non-operating facilities.
Corporate
|
|
Year Ended December 31,
|
Percent Change
|
|||||||||||||||
|
|
2014
|
2013
|
2012
|
2014 versus 2013
|
2013 versus 2012
|
||||||||||||
|
|
($ in millions)
|
||||||||||||||||
|
Operating costs
|
$
|
119.0
|
|
$
|
73.4
|
|
$
|
51.5
|
|
62.1
|
%
|
42.5
|
%
|
||||
The increase in operating costs for the
year ended
December 31, 2014
compared to
2013
is primarily due to higher performance-related compensation costs and increased staffing, increased legal expenses and approximately
$8.7 million
in one-time costs related to the acquisition of Meyer for the
year ended
December 31, 2014
.
The increase in operating costs for the
year ended
December 31, 2013
compared to the prior year is primarily due to higher compensation, resulting from the Company's higher financial performance, and consulting costs.
32
Liquidity and Capital Resources
Cash Flows
The following table summarizes our cash flows from operating, investing, and financing activities for each of the last three years:
|
|
Year Ended December 31,
|
||||||||||
|
|
2014
|
2013
|
2012
|
||||||||
|
|
(in millions)
|
||||||||||
|
Total cash provided by (required by):
|
|||||||||||
|
Operating activities
|
$
|
819.2
|
|
$
|
662.2
|
|
$
|
527.4
|
|
||
|
Investing activities
|
(814.7
|
)
|
(818.0
|
)
|
(311.4
|
)
|
|||||
|
Financing activities
|
454.9
|
|
11.3
|
|
5.9
|
|
|||||
|
Net increase (decrease) in cash and cash equivalents
|
$
|
459.4
|
|
$
|
(144.5
|
)
|
$
|
221.9
|
|
||
2014 compared with 2013
Operating Activities
. Net cash
provided
by operating activities for the
year ended
December 31, 2014
was
$819.2 million
compared to net cash
provided
by operating activities of
$662.2 million
for the
year ended
December 31, 2013
. Cash flow
provided
by operating activities increased primarily due to higher operating profits in
2014
.
Receivables at
December 31, 2014
increased by $
56.4 million
or
15.1%
from
December 31, 2013
, primarily due to an increase in income taxes receivable. Raw materials inventory at
December 31, 2014
increased by $
108.4 million
or
22.7%
since
December 31, 2013
primarily attributable to higher levels in our Rail Group required to meet production demands. Finished goods inventory at
December 31, 2014
increased by $
48.5 million
or
35.6%
since
December 31, 2013
primarily due to higher levels in our Rail and Energy Equipment Groups pending delivery. Accounts payable increased by
$60.7 million
to support higher inventory levels, while accrued liabilities increased by $
82.1 million
from
December 31, 2013
due to higher customer advances which totaled $
193.8 million
at
December 31, 2014
. We continually review reserves related to bad debt as well as the adequacy of lower of cost or market valuations related to accounts receivable and inventory.
Investing Activities.
Net cash
required
by investing activities for the
year ended
December 31, 2014
was
$814.7 million
compared to
$818.0 million
for the
year ended
December 31, 2013
. Capital expenditures for the
year ended
December 31, 2014
were $
464.6 million
, of which $
245.3 million
were for additions to the lease fleet. This compares to $
731.0 million
of capital expenditures for the same period last year, of which $
581.1 million
were for additions to the lease fleet. Full-year manufacturing and corporate capital expenditures for
2015
are projected to range between $
250.0 million
and $
300.0 million
. For
2015
, we expect the annual net cash investment in new railcars in our lease fleet to be between
$55.0 million
and
$70.0 million
after considering the expected proceeds received from leased railcar sales during the year. Proceeds from the sale of property, plant, and equipment and other assets totaled $
288.8 million
for the
year ended
December 31, 2014
, including railcar sales from the lease fleet owned more than one year at the time of sale totaling $
265.8 million
. This compares to $
135.3 million
for the same period in
2013
, including railcar sales from the lease fleet owned more than one year at the time of sale totaling $
131.6 million
. Net cash required related to acquisitions amounted to
$714.4 million
and
$73.2 million
for the
years ended
December 31, 2014
and
2013
, respectively. Short-term marketable securities for the
year ended
December 31, 2014
decreased
$74.7 million
.
Financing Activities.
Net cash
provided
by financing activities during the
year ended
December 31, 2014
was
$454.9 million
compared to
$11.3 million
of net cash
provided
by financing activities for the same period in
2013
. During the
year ended
December 31, 2014
, we retired $
186.6 million
in debt as scheduled. We borrowed $
727.3 million
, net of debt issuance costs, during the
year ended
December 31, 2014
, from the issuance of $400 million in Senior Notes and, the issuance by TRIP Master Funding, of $335.7 million in Secured Equipment Notes. Also, during the
year ended
December 31, 2014
, we received
$49.6 million
in equity contributions from noncontrolling interests in one of the Company's partially-owned leasing subsidiaries. During the
year ended
December 31, 2013
, we retired $
262.1 million
in debt principally consisting of the repayment of the Leasing Group term loan and the TRIP Holdings senior secured notes. During the
year ended
December 31, 2013
, we borrowed $
175.0 million
, net of debt issuance costs, primarily from the issuance by TRL 2012 of its 2013-1 Secured Railcar Equipment Notes. During the
year ended
December 31, 2013
, we received proceeds of
$296.7 million
related to the sale of equity interests in certain partially-owned leasing subsidiaries and we received
$50.0 million
in equity contributions from noncontrolling interests in one of the Company's partially-owned leasing subsidiaries. During 2013, TRIP Holdings repurchased the equity interests of certain equity investors for
$84.0 million
. Additionally, we repurchased shares of the Company’s stock under a share repurchase program as described further below. We intend to use our cash and committed credit facilities to fund the operations, expansions, and growth initiatives of the Company.
33
2013 compared with 2012
Operating Activities.
Net cash
provided
by operating activities for the
year ended
December 31, 2013
was
$662.2 million
compared to
$527.4 million
of net cash
provided
by operating activities for the same period in
2012
. Cash flow
provided
by operating activities increased primarily due to higher operating profits in
2013
.
Receivables at
December 31, 2013
decreased slightly by $
17.2 million
or
4.4%
from
December 31, 2012
, primarily due to lower receivables from the Energy Equipment Group. At
December 31, 2013
, one customer's net receivable balance in our Energy Equipment Group, all within terms, accounted for 16% of the consolidated net receivables balance outstanding. Raw materials inventory at
December 31, 2013
increased by $
37.3 million
or
8.5%
since
December 31, 2012
primarily attributable to higher levels in our Rail Group required to meet production demands. Finished goods inventory at
December 31, 2013
increased by $
14.8 million
or
12.2%
since
December 31, 2012
primarily due to higher levels in our Rail Group pending delivery. Accounts payable increased by
$29.0 million
to support higher inventory levels, while accrued liabilities increased by $
72.4 million
or
12.4%
from
December 31, 2012
due to higher income taxes payable and certain other payroll-related accruals. Customer advances totaled
$141.7 million
at
December 31, 2013
.
Investing Activities.
Net cash required by investing activities for the
year ended
December 31, 2013
was
$818.0 million
compared to
$311.4 million
for the
year ended
December 31, 2012
. Capital expenditures for the
year ended
December 31, 2013
were $
731.0 million
, of which $
581.1 million
were for additions to the lease fleet. This compares to $
469.2 million
of capital expenditures for the same period in
2012
, of which $
352.6 million
were for additions to the lease fleet. Proceeds from the sale of property, plant, and equipment and other assets totaled $
135.3 million
for the
year ended
December 31, 2013
, including railcar sales from the lease fleet owned more than one year at the time of sale totaling $
131.6 million
. This compares to $
201.4 million
for the
year ended
December 31, 2012
, including railcar sales from the lease fleet owned more than one year at the time of sale totaling $
126.3 million
. Net cash required related to acquisitions amounted to $
73.2 million
and $
46.2 million
for the
years ended
December 31, 2013
and
2012
, respectively. Short-term marketable securities for the
year ended
December 31, 2013
increased
$149.7 million
.
Financing Activities.
Net cash provided by financing activities during the
year ended
December 31, 2013
was
$11.3 million
compared to
$5.9 million
of net cash provided by financing activities for the
year ended
December 31, 2012
. During the
year ended
December 31, 2013
, we retired $
262.1 million
in debt principally consisting of the repayment of the Leasing Group term loan and the TRIP Holdings senior secured notes. During the
year ended
December 31, 2012
, we retired $378.4 million in debt principally consisting of repayments of the TILC warehouse loan facility. We borrowed $
175.0 million
, net of debt issuance costs, during the
year ended
December 31, 2013
, primarily from the issuance by TRL 2012 of its 2013-1 Secured Railcar Equipment Notes. During the
year ended
December 31, 2012
, we borrowed $443.8 million, net of $5.2 million of deferred loan costs, primarily from the issuance by TRL 2012 of $333.8 million in Secured Railcar Equipment Notes, and from advances under our TILC warehouse loan facility. During the
year ended
December 31, 2013
, we received proceeds of $296.7 million related to the sale of equity interests in certain partially-owned leasing subsidiaries and we received $50.0 million in equity contributions from noncontrolling interests in one of the Company's partially-owned leasing subsidiaries. During 2013, TRIP Holdings repurchased the equity interests of certain equity investors for $84.0 million. Additionally, we repurchased shares of the Company's stock under a share repurchase program as described further below.
Other Investing and Financing Activities
In August 2014, Trinity completed its acquisition of the assets of Meyer for approximately
$595.6 million
in cash. Meyer is one of North America's leading providers of tubular steel structures for electricity transmission and distribution. The operations of Meyer are included within the Company's Energy Equipment Group.
During the
year ended
December 31, 2014
, we completed the acquisitions of the assets of WesMor Cryogenic Companies and Alloy Custom Products, Inc., expanding the Company's engineering and manufacturing capabilities to provide cryogenic storage and distribution products. We also completed the acquisition of the assets of Platinum in Alberta, Canada, a manufacturer and seller of oil and gas process and storage equipment as well as the acquisition of a galvanizing services business located in Texas.
During the
year ended
December 31, 2014
, the Company received proceeds of
$882.7 million
from the sale of leased railcars to Element under the strategic alliance with Element announced in December 2013, including
$200.4 million
recorded as revenue by the Rail Group. From the total proceeds received from Element, the Leasing Group recorded
$446.6 million
in revenue from the sale of railcars owned one year or less at the time of sale. The remainder of the proceeds of
$235.7 million
is attributable to the sale of railcars owned more than one year at the time of sale and is, consequently, excluded from revenue. Since the inception of our alliance, the Company has received proceeds of
$987.7 million
from the sale of leased railcars to Element.
34
At
December 31, 2014
and for the two year period then ended, there were no borrowings under our
$425.0 million
revolving credit facility that matures on
October 20, 2016
. Interest on the revolving credit facility is calculated at
Libor
plus
1.50%
or
prime
plus
0.50%
. After subtracting
$88.6 million
for letters of credit outstanding,
$336.4 million
was available under the revolving credit facility as of
December 31, 2014
.
The
$475.0 million
TILC warehouse loan facility, established to finance railcars owned by TILC, had
$120.6 million
outstanding with
$354.4 million
unused, of which
$334.6 million
was available as of
December 31, 2014
based on the amount of warehouse-eligible, unpledged equipment. The warehouse loan is a non-recourse obligation secured by a portfolio of railcars and operating leases, certain cash reserves, and other assets acquired and owned by the warehouse loan facility trust. The principal and interest of this indebtedness are paid from the cash flows of the underlying leases. Advances under the facility bear interest at a defined index rate plus a margin, for an all-in interest rate of
1.94%
at
December 31, 2014
. The warehouse loan facility has been renewed and extended through
June 2015
. Amounts outstanding at maturity, absent renewal, will be payable in
three
installments in
December 2015
,
June 2016
, and
December 2016
.
In
May 2014
, TRIP Master Funding issued
$335.7 million
in aggregate principal amount of Series 2014-1 Secured Railcar Equipment Notes pursuant to the Master Indenture between TRIP Master Funding and Wilmington Trust Company, as indenture trustee, with a final maturity date of
April 2044
. The TRIP Master Funding Series 2014-1 Secured Railcar Equipment Notes consist of
two
classes with the Class A-1 notes bearing interest at
2.86%
and the Class A-2 notes bearing interest at
4.09%
. The TRIP Master Funding Secured Railcar Equipment Notes are non-recourse to Trinity, TILC, TRIP Holdings, and the other equity investors in TRIP Holdings and are secured by TRIP Master Funding's portfolio of railcars and operating leases thereon, its cash reserves, and all other assets owned by TRIP Master Funding. As of
December 31, 2014
, there were
$108.7 million
and
$220.7 million
of Class A-1 and Class A-2 notes outstanding, respectively.
In September 2014, the Company issued
$400.0 million
aggregate principal amount of
4.55%
senior notes due
October 2024
. Interest on the Senior Notes is payable semiannually commencing April 1, 2015. The Senior Notes rank senior to existing and future subordinated debt including the Company's Convertible Subordinated Notes and rank equal to existing and future senior indebtedness, including the Company's revolving credit facility. The Senior Notes are subordinated to all the Company's existing and future secured debt to the extent of the value of the collateral securing such indebtedness. The Senior Notes contain covenants that limit our ability and/or certain subsidiaries' ability to create or permit to exist certain liens; enter into sale and leaseback transactions; and consolidate, merge, or transfer all or substantially all of our assets. The Company’s Senior Notes are fully and unconditionally and jointly and severally guaranteed by each of Trinity’s domestic subsidiaries that is a guarantor under the Company's revolving credit facility.
In
March 2014
, the Company’s Board of Directors authorized a new
$250 million
share repurchase program that expires on
December 31, 2015
and replaced the Company's previously authorized
$200 million
share repurchase program. Under the new program,
747,246
shares were repurchased during the
year ended
December 31, 2014
, at a cost of
$31.5 million
. During the year ended
December 31, 2013
, the Company repurchased
2,473,189
shares under the prior program at a cost of
$108.2 million
.
In May 2014, the Company's Board of Directors authorized a
2-for-1
stock split. The stock split was issued in the form of a
100%
stock dividend. The additional shares were distributed on
June 19, 2014
, to shareholders of record at the close of business on
June 5, 2014
. All share and per share information, including dividends, has been retroactively adjusted to reflect the
2-for-1
stock split, except for the statement of stockholders' equity which reflects the stock split by reclassifying from "Capital in Excess of Par Value" to "Common Stock" in the amount of
$78.0 million
which equals the par value of the additional shares issued to effect the stock split.
Demand conditions and corresponding order levels for new railcars continue to be favorable across a wide variety of industries. While demand conditions and corresponding order levels for barges serving the oil and gas markets have slowed recently, favorable conditions exist long term for barges in the chemical and petrochemical markets. In other markets, such as agricultural products, demand has recently been strong for hopper barges. Budgetary constraints at the Federal and state levels, and pending litigation in our Highway Products business have negatively impacted the results of our Construction Products Group.
We continually assess our manufacturing capacity and take steps to align our production capacity with demand for our products. Due to improvements in demand for certain products, we have continued to increase production staff at certain facilities. We expect that facilities on non-operating status will be available for future operations should demand increase further.
35
Equity Investment
See Note 5 of the Notes to the Consolidated Financial Statements for information about the investment in partially-owned subsidiaries.
Future Operating Requirements
We expect to finance future operating requirements with cash, cash equivalents and short-term marketable securities; cash flows from operations, and, depending on market conditions, short-term and long-term debt; and equity. Debt instruments that the Company has utilized include its revolving credit facility, the TILC warehouse facility, senior notes, convertible subordinated notes, asset-backed securities, and sale-leaseback transactions. The Company has also issued equity at various times. As of
December 31, 2014
, the Company had unrestricted cash, cash equivalents and short-term marketable securities balances of $
962.9 million
,
$336.4 million
available under its revolving credit facility, and
$334.6 million
available under its TILC warehouse facility. The Company believes it has access to adequate capital resources to fund operating requirements and is an active participant in the capital markets.
Off Balance Sheet Arrangements
See Note 6 of the Notes to the Consolidated Financial Statements for information about off balance sheet arrangements.
36
Derivative Instruments
We use derivative instruments to mitigate the impact of changes in interest rates, both in anticipation of future debt issuances and to offset interest rate variability of certain floating rate debt issuances outstanding. We also use derivative instruments to mitigate the impact of changes in natural gas and diesel fuel prices and changes in foreign currency exchange rates. For derivative instruments designated as hedges, the Company formally documents the relationship between the derivative instrument and the hedged item, as well as the risk management objective and strategy for the use of the derivative instrument. This documentation includes linking the derivatives that are designated as fair value or cash flow hedges to specific assets or liabilities on the balance sheet, commitments, or forecasted transactions. At the time a derivative instrument is entered into, and at least quarterly thereafter, the Company assesses whether the derivative instrument is effective in offsetting the changes in fair value or cash flows of the hedged item. Any change in fair value resulting in ineffectiveness, as defined by accounting standards issued by the Financial Accounting Standards Board ("FASB"), is recognized in current period earnings. For derivative instruments that are designated and qualify as cash flow hedges, the effective portion of the gain or loss on the derivative instrument is recorded in accumulated other comprehensive loss ("AOCL") as a separate component of stockholders' equity and reclassified into earnings in the period during which the hedged transaction affects earnings. Trinity monitors its derivative positions and the credit ratings of its counterparties and does not anticipate losses due to counterparties' non-performance. See Note 3 of the Notes to Consolidated Financial Statements for discussion of how the Company valued its commodity hedges and interest rate swaps at
December 31, 2014
. See Note 11 of the Notes to Consolidated Financial Statements for a description of the Company's debt instruments.
Interest rate hedges
|
|
|
|
Included in accompanying balance sheet
at December 31, 2014 |
|||||||||||||||
|
|
Notional
Amount
|
Interest
Rate
(1)
|
Liability
|
AOCL –
loss/
(income)
|
Noncontrolling
Interest
|
|||||||||||||
|
|
(in millions, except %)
|
|||||||||||||||||
|
Expired hedges:
|
||||||||||||||||||
|
2006 secured railcar equipment notes
|
$
|
200.0
|
|
4.87
|
%
|
$
|
—
|
|
$
|
(1.3
|
)
|
$
|
—
|
|
||||
|
Promissory notes
|
$
|
370.0
|
|
5.34
|
%
|
$
|
—
|
|
$
|
1.2
|
|
$
|
—
|
|
||||
|
TRIP Holdings warehouse loan
|
$
|
788.5
|
|
3.60
|
%
|
$
|
—
|
|
$
|
10.0
|
|
$
|
13.6
|
|
||||
|
Open hedges:
|
||||||||||||||||||
|
TRIP Master Funding secured railcar equipment notes
|
$
|
56.3
|
|
2.62
|
%
|
$
|
2.0
|
|
$
|
0.8
|
|
$
|
1.1
|
|
||||
|
Promissory notes
|
$
|
387.6
|
|
4.13
|
%
|
$
|
6.4
|
|
$
|
5.3
|
|
$
|
—
|
|
||||
|
(1)
|
Weighted average fixed interest rate
|
|
|
Effect on interest expense-increase/(decrease)
|
||||||||||||||
|
|
Year Ended December 31,
|
Expected effect during next twelve months
(1)
|
|||||||||||||
|
|
2014
|
2013
|
2012
|
||||||||||||
|
|
(in millions)
|
||||||||||||||
|
Expired hedges:
|
|||||||||||||||
|
2006 secured railcar equipment notes
|
$
|
(0.3
|
)
|
$
|
(0.3
|
)
|
$
|
(0.3
|
)
|
$
|
(0.3
|
)
|
|||
|
Promissory notes
|
$
|
2.9
|
|
$
|
3.1
|
|
$
|
3.3
|
|
$
|
1.2
|
|
|||
|
TRIP Holdings warehouse loan
|
$
|
5.1
|
|
$
|
6.1
|
|
$
|
6.0
|
|
$
|
4.9
|
|
|||
|
Open hedges:
|
|||||||||||||||
|
TRIP Master Funding secured railcar equipment notes
|
$
|
1.5
|
|
$
|
1.8
|
|
$
|
2.0
|
|
$
|
1.2
|
|
|||
|
Promissory notes
|
$
|
15.4
|
|
$
|
15.8
|
|
$
|
18.4
|
|
$
|
6.4
|
|
|||
|
(1)
|
Based on fair value of open hedges as of
December 31, 2014
|
During
2005
and
2006
, we entered into interest rate swap derivatives in anticipation of issuing our 2006 Secured Railcar Equipment Notes. These derivative instruments, with a notional amount of
$200.0 million
, were settled in
2006
and fixed the interest rate on a portion of the related debt issuance. These derivative instrument transactions are being accounted for as cash flow hedges with changes in the fair value of the instruments of
$4.5 million
in income recorded in AOCL through the date the related debt issuance closed in
2006
. The balance is being amortized over the term of the related debt. The effect on interest expense is due to amortization of the AOCL balance.
37
During
2006
and
2007
, we entered into interest rate swap derivatives in anticipation of issuing our Promissory Notes. These derivative instruments, with a notional amount of
$370.0 million
, were settled in
2008
and fixed the interest rate on a portion of the related debt issuance. These derivative instrument transactions are being accounted for as cash flow hedges with changes in the fair value of the instruments of
$24.5 million
recorded as a loss in AOCL through the date the related debt issuance closed in
2008
. The balance is being amortized over the term of the related debt. The effect on interest expense is due to amortization of the AOCL balance.
In
2008
, we entered into an interest rate swap derivative instrument, expiring in
2015
, to fix the variable Libor component of the Promissory Notes. This derivative instrument transaction is being accounted for as a cash flow hedge. The effect on interest expense results primarily from monthly interest settlements.
Between
2007
and
2009
, TRIP Holdings, as required by the TRIP Warehouse Loan, entered into interest rate swap derivatives, all of which qualified as cash flow hedges, to reduce the effect of changes in variable interest rates in the TRIP Warehouse Loan. In
July 2011
, these interest rate hedges were terminated in connection with the refinancing of the TRIP Warehouse Loan. Balances included in AOCL at the date the hedges were terminated are being amortized over the expected life of the new debt with
$4.9 million
of additional interest expense expected to be recognized during the
twelve
months following
December 31, 2014
. Also in
July 2011
, TRIP Holdings’ wholly-owned subsidiary, TRIP Master Funding, entered into an interest rate swap derivative instrument, expiring in
2021
, with a notional amount of
$94.1 million
to reduce the effect of changes in variable interest rates associated with the
Class A-1b
notes of the TRIP Master Funding secured railcar equipment notes. The effect on interest expense results primarily from monthly interest settlements.
See Note 11 of the Notes to Consolidated Financial Statements regarding the related debt instruments.
Other Derivatives
|
|
Effect on operating income - increase/(decrease)
|
||||||||||
|
|
Year Ended December 31,
|
||||||||||
|
|
2014
|
2013
|
2012
|
||||||||
|
|
(in millions)
|
||||||||||
|
Fuel hedges
(1)
|
$
|
(2.3
|
)
|
$
|
—
|
|
$
|
0.4
|
|
||
|
Foreign exchange hedges
(2)
|
$
|
—
|
|
$
|
—
|
|
$
|
(0.4
|
)
|
||
|
(1)
|
Included in cost of revenues in the accompanying consolidated statement of operations
|
|
(2)
|
Included in other, net in the accompanying consolidated statement of operations
|
Natural gas and diesel fuel
We maintain a program to mitigate the impact of fluctuations in the price of natural gas and diesel fuel purchases. The intent of the program is to protect our operating profit from adverse price changes by entering into derivative instruments. For those instruments that do not qualify for hedge accounting treatment, any changes in their valuation are recorded directly to the consolidated statement of operations. The amount recorded in the consolidated balance sheet as of
December 31, 2014
for these instruments was a liability of $2.1 million.
Foreign exchange hedge
We enter into foreign exchange hedges to mitigate the impact on operating profit of unfavorable fluctuations in foreign currency exchange rates. These instruments are short term with quarterly maturities and
no
remaining balance in AOCL as of
December 31, 2014
.
Stock-Based Compensation
We have a stock-based compensation plan covering our employees and our Board of Directors. See Note 16 of the Notes to the Consolidated Financial Statements.
38
Employee Retirement Plans
As disclosed in Note 14 of the Notes to the Consolidated Financial Statements, the projected benefit obligations of the employee retirement plans exceeded the plans' assets by
$39.4 million
as of
December 31, 2014
while the assets of the employee retirement plans exceeded the plans' projected benefit obligations by
$7.1 million
as of
December 31, 2013
. The change was primarily due to an 89 basis point decrease in the obligation discount rate assumption, a lower return on assets, and lower mortality assumptions. We continue to sponsor an employee savings plan under the existing 401(k) plan that covers substantially all employees and includes both a company matching contribution and an annual retirement contribution of up to 3% each of eligible compensation based on our performance, as well as a Supplemental Profit Sharing Plan. Both the annual retirement contribution and the company matching contribution are discretionary, requiring board approval, and made annually with the investment of the funds directed by the participants. Finally, with the acquisition of Meyer, the Company contributes to a multiemployer defined benefit pension plan under the terms of a collective-bargaining agreement that covers certain union-represented employees at one of Meyer's facilities.
Employer contributions for the year ending
December 31, 2015
are expected to be
$19.7 million
for the defined benefit plans compared to
$15.0 million
contributed during
2014
. Employer contributions to the 401(k) plans and the Supplemental Profit Sharing Plan for the year ending
December 31, 2015
are expected to be
$16.1 million
compared to
$14.0 million
contributed during
2014
. Employer contributions for the year ending
December 31, 2015
are expected to be
$2.7 million
for the multiemployer plan compared to
$0.6 million
contributed during
2014
.
Contractual Obligation and Commercial Commitments
As of
December 31, 2014
, we had the following contractual obligations and commercial commitments:
|
Payments Due by Period
|
|||||||||||||||||||
|
Contractual Obligations and Commercial Commitments
|
Total
|
1 Year
or Less
|
2-3
Years
|
4-5
Years
|
After
5 Years
|
||||||||||||||
|
(in millions)
|
|||||||||||||||||||
|
Debt and capital lease obligations:
|
|||||||||||||||||||
|
Debt:
|
|||||||||||||||||||
|
Parent and wholly-owned subsidiaries, excluding unamortized debt discount
|
$
|
2,058.0
|
|
$
|
110.8
|
|
$
|
505
|
|
$
|
88.6
|
|
$
|
1,353.6
|
|
||||
|
Partially-owned subsidiaries
|
1,515.9
|
|
69.1
|
|
114.2
|
|
137.2
|
|
1,195.4
|
|
|||||||||
|
Capital lease obligations
|
39.1
|
|
3.2
|
|
7.2
|
|
28.7
|
|
—
|
|
|||||||||
|
Interest
|
1,005.6
|
|
170.7
|
|
286.0
|
|
226.5
|
|
322.4
|
|
|||||||||
|
4,618.6
|
|
353.8
|
|
912.4
|
|
481.0
|
|
2,871.4
|
|
||||||||||
|
Operating leases:
|
|||||||||||||||||||
|
Leasing Group
|
511.3
|
|
56.0
|
|
106.7
|
|
110.2
|
|
238.4
|
|
|||||||||
|
Other
|
19.4
|
|
7.0
|
|
8.5
|
|
3.1
|
|
0.8
|
|
|||||||||
|
Obligations for purchase of goods and services
1
|
1,365.8
|
|
1,267.7
|
|
98.1
|
|
—
|
|
—
|
|
|||||||||
|
Letters of credit
|
92.0
|
|
91.8
|
|
0.2
|
|
—
|
|
—
|
|
|||||||||
|
Other
|
8.8
|
|
5.4
|
|
2.8
|
|
0.6
|
|
—
|
|
|||||||||
|
Total
|
$
|
6,615.9
|
|
$
|
1,781.7
|
|
$
|
1,128.7
|
|
$
|
594.9
|
|
$
|
3,110.6
|
|
||||
1
Includes
$1.2 billion
in purchase obligations for raw materials and components principally by the Rail, Inland Barge, and Energy Equipment Groups.
As of
December 31, 2014
and
2013
, we had
$73.9 million
and
$65.8 million
, respectively, of tax liabilities, including interest and penalties, related to uncertain tax positions. Because of the high degree of uncertainty regarding the timing of future cash outflows associated with these liabilities, we are unable to estimate the years in which settlement will occur with the respective taxing authorities. See Note 13 of the Notes to the Consolidated Financial Statements.
39
Critical Accounting Policies and Estimates
Management's Discussion and Analysis of Financial Condition and Results of Operations discusses our consolidated financial statements, which have been prepared in accordance with accounting principles generally accepted in the U.S. The preparation of these consolidated financial statements requires management to make estimates and assumptions that affect the reported amounts of assets and liabilities, the disclosure of contingent assets and liabilities at the date of the financial statements, and the reported amounts of revenues and expenses during the reporting period. On an on-going basis, management evaluates its estimates and judgments, including those related to bad debts, inventories, property, plant, and equipment, goodwill, income taxes, warranty obligations, insurance, restructuring costs, contingencies, and litigation. Management bases its estimates and judgments on historical experience and on various other factors that are believed to be reasonable under the circumstances, the results of which form the basis for making judgments about the carrying values of assets and liabilities that are not readily apparent from other sources. Actual results may differ from these estimates under different assumptions or conditions.
We believe the following critical accounting policies, among others, affect our more significant judgments and estimates used in the preparation of our consolidated financial statements.
Inventory
We state all our inventories at the lower of cost or market. Our policy related to excess and obsolete inventory requires an analysis of inventory at the business unit level on a quarterly basis and the recording of any required adjustments. In assessing the ultimate realization of inventories, we are required to make judgments as to future demand requirements and compare that with the current or committed inventory levels. It is possible that changes in required inventory reserves may occur in the future due to then current market conditions.
Long-lived Assets
We periodically evaluate the carrying value of long-lived assets to be held and used for potential impairment. The carrying value of long-lived assets to be held and used is considered impaired only when the carrying value is not recoverable through undiscounted future cash flows and the fair value of the assets is less than their carrying value. Fair value is determined primarily using the anticipated cash flows discounted at a rate commensurate with the risks involved or market quotes as available. Impairment losses on long-lived assets held for sale are determined in a similar manner, except that fair values are reduced by the estimated cost to dispose of the assets.
Goodwill
Goodwill is required to be tested for impairment annually, or on an interim basis, whenever events or circumstances change, indicating that the carrying amount of the goodwill might be impaired. The goodwill impairment test is a two-step process with step one requiring the comparison of the reporting unit's estimated fair value with the carrying amount of its net assets. Step two of the impairment test is necessary to determine the amount of goodwill impairment to be recorded when the reporting unit's recorded net assets exceed its fair value. Impairment is assessed at the “reporting unit” level by applying a fair value-based test for each unit with recorded goodwill. The estimates and judgments that most significantly affect the fair value calculations are assumptions related to revenue and operating profit growth, discount rates and exit multiples. During the three months ended
December 31, 2014
, the Company considered certain state actions with regard to its highway products litigation as an indicator of possible goodwill impairment. See Note 18 Commitments and Contingencies and in the accompanying consolidated financial statements for a fuller explanation of this matter. Based on the Company's annual goodwill impairment test, performed at the reporting unit level as of
December 31, 2014
, the Company concluded that 1) no impairment charges were determined to be necessary and 2) none of the reporting units evaluated could reasonably be expected to fail the first step of the goodwill impairment test. See Note 1 of the Notes to the Consolidated Financial Statements for further explanation.
Given the uncertainties of the economy and its potential impact on our businesses, there can be no assurance that our estimates and assumptions regarding the fair value of our reporting units, made for the purposes of the long-lived asset and goodwill impairment tests, will prove to be accurate predictions of the future. If our assumptions regarding forecasted cash flows are not achieved, it is possible that impairments of remaining goodwill and long-lived assets may be required.
Warranties
The Company provides warranties against materials and manufacturing defects generally ranging from one to five years depending on the product. The warranty costs are estimated using a two-step approach. First, an engineering estimate is made for the cost of all claims that have been filed by a customer. Second, based on historical claims experience, a cost is accrued for all products still within a warranty period for which no claims have been filed. The Company provides for the estimated cost of product
40
warranties at the time revenue is recognized related to products covered by warranties and assesses the adequacy of the resulting reserves on a quarterly basis.
Insurance
We are effectively self-insured for workers' compensation claims. A third-party administrator processes all such claims. We accrue our workers' compensation liability based upon independent actuarial studies. To the extent actuarial assumptions change and claims experience rates differ from historical rates, our liability may change.
Contingencies and Litigation
The Company is involved in claims and lawsuits incidental to our business. Based on information currently available with respect to such claims and lawsuits, including information on claims and lawsuits as to which the Company is aware but for which the Company has not been served with legal process, it is management's opinion that the ultimate outcome of all such claims and litigation, including settlements, in the aggregate will not have a material adverse effect on the Company's overall financial condition for purposes of financial reporting. However, resolution of certain claims or lawsuits by settlement or otherwise, could impact the operating results of the reporting period in which such resolution occurs.
Environmental
We are involved in various proceedings related to environmental matters. We have provided reserves to cover probable and estimable liabilities with respect to such proceedings, taking into account currently available information and our contractual rights of indemnification. However, estimates of future response costs are necessarily imprecise. Accordingly, there can be no assurance that we will not become involved in future litigation or other proceedings or, if we were found to be responsible or liable in any litigation or proceeding, that such costs would not be material to us.
Income Taxes
The Company accounts for income taxes under the asset and liability method prescribed by ASC 740. See Note 13 in the Notes to the Consolidated Financial Statements. Deferred tax assets and liabilities are recognized for the future tax consequences attributable to temporary differences between the financial statement carrying amount of existing assets and liabilities and their respective tax bases and other tax attributes using currently enacted tax rates. The effect of a change in tax rates on deferred tax assets and liabilities is recognized in the provision for income taxes in the period that includes the enactment date. Management is required to estimate the timing of the recognition of deferred tax assets and liabilities, make assumptions about the future deductibility of deferred tax assets and assess deferred tax liabilities based on enacted law and tax rates for the appropriate tax jurisdictions to determine the amount of such deferred tax assets and liabilities. Changes in the calculated deferred tax assets and liabilities may occur in certain circumstances, including statutory income tax rate changes, statutory tax law changes, or changes in the structure or tax status of the Company. The Company assesses whether a valuation allowance should be established against its deferred tax assets based on consideration of all available evidence, both positive and negative, using a more likely than not standard. This assessment considers, among other matters, the nature, frequency and severity of recent losses; a forecast of future profitability; the duration of statutory carryback and carryforward periods; the Company's experience with tax attributes expiring unused; and tax planning alternatives.
At
December 31, 2014
, the Company had
$33.5 million
of Federal consolidated net operating loss carryforwards. The majority of these net operating loss carryforwards were acquired as part of an acquisition of a company in 2010 and are subject to limitations on the amount that can be utilized in any one tax year. In addition, the Company had tax-effected
$3.6 million
of state loss carryforwards. The Federal net operating loss carryforwards are due to expire in
2028
and
2029
. We have established a valuation allowance for Federal, state, and foreign tax operating losses and credits which may not be realizable. We believe that it is more likely than not that we will be able to generate sufficient future taxable income to utilize the remaining deferred tax assets.
At times, we may claim tax benefits that may be challenged by a tax authority. We recognize tax benefits only for tax positions that are more likely than not to be sustained upon examination by tax authorities. The amount recognized is measured as the largest amount of benefit that is greater than 50 percent likely to be realized upon settlement. A liability for “unrecognized tax benefits” is recorded for any tax benefits claimed in our tax returns that do not meet these recognition and measurement standards.
41
Pensions
The Company sponsors defined benefit plans which provide retirement income and death benefits for certain eligible employees. The Company's pension costs and liabilities are primarily determined using actuarial assumptions regarding the long-term rate of return on plan assets and the discount rate used to determine the present value of future benefit obligations. The compensation increase rate assumption pertains solely to the pension plan of the Company's Inland Barge segment which was closed to new participants in 2014. The accrued benefits of the Company's remaining pension plans were frozen in 2009.
Pension assumptions are reviewed annually by outside actuaries and the Company's management. These actuarial assumptions are summarized in the following table:
|
Year Ended December 31,
|
||||||||
|
2014
|
2013
|
2012
|
||||||
|
Assumptions used to determine benefit obligations at the annual measurement date were:
|
||||||||
|
Obligation discount rate
|
4.33
|
%
|
5.22
|
%
|
4.25
|
%
|
||
|
Compensation increase rate
|
4.00
|
%
|
4.00
|
%
|
4.00
|
%
|
||
|
Assumptions used to determine net periodic benefit costs were:
|
||||||||
|
Obligation discount rate
|
5.22
|
%
|
4.25
|
%
|
5.40
|
%
|
||
|
Long-term rate of return on plan assets
|
7.75
|
%
|
7.75
|
%
|
7.75
|
%
|
||
|
Compensation increase rate
|
4.00
|
%
|
4.00
|
%
|
3.00
|
%
|
||
The obligation discount rate assumption is determined by deriving a single discount rate from a theoretical settlement portfolio of high quality corporate bonds sufficient to provide for the plans' projected benefit payments. The expected long-term rate of return on plan assets is an assumption reflecting the anticipated weighted average rate of earnings on the portfolio over the long-term. To arrive at this rate, we developed estimates based upon the anticipated performance of the plans' assets. The effect of a change in either of these assumptions on the net retirement cost for the
year ended
December 31, 2014
and on the projected benefit obligations at
December 31, 2014
is summarized as follows:
|
Effect on Net Retirement Cost for the Year Ended December 31, 2014
|
Effect on Projected Benefit Obligations at December 31, 2014
|
||||||
|
Assumptions:
|
Increase/(decrease)
(in millions)
|
||||||
|
Obligation discount rate:
|
|||||||
|
Increase of 50 basis points
|
$
|
(0.2
|
)
|
$
|
(30.7
|
)
|
|
|
Decrease of 50 basis points
|
$
|
0.8
|
|
$
|
34.2
|
|
|
|
Long-term rate of return on plan assets:
|
|||||||
|
Increase of 50 basis points
|
$
|
(2.0
|
)
|
$
|
—
|
|
|
|
Decrease of 50 basis points
|
$
|
2.0
|
|
$
|
—
|
|
|
Recent Accounting Pronouncements
See Note 1 of the Notes to the Consolidated Financial Statements for information about recent accounting pronouncements.
42
Forward-Looking Statements
This annual report on Form 10-K (or statements otherwise made by the Company or on the Company’s behalf from time to time in other reports, filings with the Securities and Exchange Commission (“SEC”), news releases, conferences, World Wide Web postings or otherwise) contains forward-looking statements within the meaning of the Private Securities Litigation Reform Act of 1995. Any statements contained herein that are not historical facts are forward-looking statements and involve risks and uncertainties. These forward-looking statements include expectations, beliefs, plans, objectives, future financial performances, estimates, projections, goals, and forecasts. Trinity uses the words “anticipates,” “believes,” “estimates,” “expects,” “intends,” “forecasts,” “may,” “will,” “should,” and similar expressions to identify these forward-looking statements. Potential factors, which could cause our actual results of operations to differ materially from those in the forward-looking statements include, among others:
|
•
|
market conditions and demand for our business products and services;
|
|
•
|
the cyclical nature of industries in which we compete;
|
|
•
|
variations in weather in areas where our construction products are sold, used, or installed;
|
|
•
|
naturally-occurring events and disasters causing disruption to our manufacturing, product deliveries, and production capacity, thereby giving rise to an increase in expenses, loss of revenue, and property losses;
|
|
•
|
the timing of introduction of new products;
|
|
•
|
the timing and delivery of customer orders or a breach of customer contracts;
|
|
•
|
the credit worthiness of customers and their access to capital;
|
|
•
|
product price changes;
|
|
•
|
changes in mix of products sold;
|
|
•
|
the extent of utilization of manufacturing capacity;
|
|
•
|
availability and costs of steel, component parts, supplies, and other raw materials;
|
|
•
|
competition and other competitive factors;
|
|
•
|
changing technologies;
|
|
•
|
surcharges and other fees added to fixed pricing agreements for steel, component parts, supplies and other raw materials;
|
|
•
|
interest rates and capital costs;
|
|
•
|
counter-party risks for financial instruments;
|
|
•
|
long-term funding of our operations;
|
|
•
|
taxes;
|
|
•
|
the stability of the governments and political and business conditions in certain foreign countries, particularly Mexico;
|
|
•
|
changes in import and export quotas and regulations;
|
|
•
|
business conditions in emerging economies;
|
|
•
|
costs and results of litigation, including trial and appellate costs and supersedes bonding costs;
|
|
•
|
changes in accounting standards or inaccurate estimates or assumptions in the application of accounting policies; and
|
|
•
|
legal, regulatory, and environmental issues, including compliance of our products with mandated specifications, standards, or testing criteria and obligations to remove and replace our products following installation or to recall our products and install different products manufactured by us or our competitors.
|
Any forward-looking statement speaks only as of the date on which such statement is made. Trinity undertakes no obligation to update any forward-looking statement to reflect events or circumstances after the date on which such statement is made.
43
Item 7A.
Quantitative and Qualitative Disclosures About Market Risk.
Our earnings could be affected by changes in interest rates due to the impact those changes have on our variable rate debt obligations, which represented 15.5% of our total debt as of
December 31, 2014
. If interest rates average one percentage point more in fiscal year
2015
than they did during
2014
, our interest expense would increase by $1.4 million, after considering the effects of interest rate hedges. In comparison, at
December 31, 2013
, we estimated that if interest rates averaged one percentage point more in fiscal year
2014
than they did during
2013
, our interest expense would increase by $1.7 million. The impact of an increase in interest rates was determined based on the impact of the hypothetical change in interest rates and scheduled principal payments on our variable-rate debt obligations as of
December 31, 2014
and
2013
. A one percentage point increase in the interest rate yield would decrease the fair value of the fixed rate debt by approximately $243.7 million. A one percentage point decrease in the interest rate yield would increase the fair value of the fixed rate debt by approximately $275.7 million.
Trinity uses derivative instruments to mitigate the impact of increases in natural gas and diesel fuel prices. Existing hedge transactions as of
December 31, 2014
are based on the New York Mercantile Exchange for natural gas and heating oil. Hedge transactions are settled with the counterparty in cash. The effect of these transactions on the consolidated balance sheets was a liability of $2.1 million at
December 31, 2014
and was insignificant at
December 31, 2013
. The effect on the consolidated statement of operations for the
year ended
December 31, 2014
was operating expense of $2.3 million, and for the
year ended
December 31, 2013
was immaterial. Based on hedge positions at
December 31, 2014
we estimate that a hypothetical 10% increase in the price of these commodities would reduce the liability and the related operating expense by $0.5 million. Similarly, a hypothetical 10% decrease in the price of these commodities would increase the liability and the related operating expense by $0.5 million.
In addition, we are subject to market risk related to our net investments in our foreign subsidiaries. The net investment in foreign subsidiaries as of
December 31, 2014
was $299.9 million. The impact of such market risk exposures as a result of foreign exchange rate fluctuations has not been material to us. See Note 12 of the Notes to the Consolidated Financial Statements.
44
Item 8.
Financial Statements
Trinity Industries, Inc.
Index to Financial Statements
|
Page
|
|
45
Report of Independent Registered Public Accounting Firm
The Board of Directors and Stockholders
Trinity Industries, Inc.
We have audited the accompanying consolidated balance sheets of Trinity Industries, Inc. and Subsidiaries as of December 31, 2014 and 2013, and the related consolidated statements of operations, comprehensive income, cash flows and stockholders' equity for each of the three years in the period ended December 31, 2014. These financial statements are the responsibility of the Company's management. Our responsibility is to express an opinion on these financial statements based on our audits.
We conducted our audits in accordance with the standards of the Public Company Accounting Oversight Board (United States). Those standards require that we plan and perform the audit to obtain reasonable assurance about whether the financial statements are free of material misstatement. An audit includes examining, on a test basis, evidence supporting the amounts and disclosures in the financial statements. An audit also includes assessing the accounting principles used and significant estimates made by management, as well as evaluating the overall financial statement presentation. We believe that our audits provide a reasonable basis for our opinion.
In our opinion, the financial statements referred to above present fairly, in all material respects, the consolidated financial position of Trinity Industries, Inc. and Subsidiaries at December 31, 2014 and 2013, and the consolidated results of their operations and their cash flows for each of the three years in the period ended December 31, 2014, in conformity with U.S. generally accepted accounting principles.
We also have audited, in accordance with the standards of the Public Company Accounting Oversight Board (United States), Trinity Industries, Inc. and Subsidiaries' internal control over financial reporting as of December 31, 2014, based on criteria established in Internal Control - Integrated Framework issued by the Committee of Sponsoring Organizations of the Treadway Commission (2013 framework) and our report dated February 19, 2015 expressed an unqualified opinion thereon.
|
/s/ ERNST & YOUNG LLP
|
Dallas, Texas
February 19, 2015
46
Trinity Industries, Inc. and Subsidiaries
|
|
Year Ended December 31,
|
||||||||||
|
|
2014
|
2013
|
2012
|
||||||||
|
|
(in millions, except per share amounts)
|
||||||||||
|
Revenues:
|
|||||||||||
|
Manufacturing
|
$
|
5,063.6
|
|
$
|
3,719.9
|
|
$
|
3,167.5
|
|
||
|
Leasing
|
1,106.4
|
|
645.4
|
|
644.4
|
|
|||||
|
6,170.0
|
|
4,365.3
|
|
3,811.9
|
|
||||||
|
Operating costs:
|
|||||||||||
|
Cost of revenues:
|
|||||||||||
|
Manufacturing
|
3,975.1
|
|
2,990.9
|
|
2,701.2
|
|
|||||
|
Leasing
|
644.7
|
|
331.4
|
|
350.3
|
|
|||||
|
4,619.8
|
|
3,322.3
|
|
3,051.5
|
|
||||||
|
Selling, engineering, and administrative expenses:
|
|||||||||||
|
Manufacturing
|
235.0
|
|
180.4
|
|
143.4
|
|
|||||
|
Leasing
|
49.6
|
|
37.6
|
|
29.4
|
|
|||||
|
Other
|
119.0
|
|
73.3
|
|
51.3
|
|
|||||
|
403.6
|
|
291.3
|
|
224.1
|
|
||||||
|
Gains on disposition of property, plant, and equipment:
|
|||||||||||
|
Net gains on railcar lease fleet sales owned more than one year at the time of sale
|
92.3
|
|
20.4
|
|
33.5
|
|
|||||
|
Other
|
12.1
|
|
0.8
|
|
5.0
|
|
|||||
|
104.4
|
|
21.2
|
|
38.5
|
|
||||||
|
Total operating profit
|
1,251.0
|
|
772.9
|
|
574.8
|
|
|||||
|
Other (income) expense:
|
|||||||||||
|
Interest income
|
(1.9
|
)
|
(2.1
|
)
|
(1.5
|
)
|
|||||
|
Interest expense
|
193.4
|
|
187.3
|
|
194.7
|
|
|||||
|
Other, net
|
(4.6
|
)
|
(2.8
|
)
|
(4.3
|
)
|
|||||
|
186.9
|
|
182.4
|
|
188.9
|
|
||||||
|
Income from continuing operations before income taxes
|
1,064.1
|
|
590.5
|
|
385.9
|
|
|||||
|
Provision (benefit) for income taxes:
|
|||||||||||
|
Current
|
360.6
|
|
158.6
|
|
7.7
|
|
|||||
|
Deferred
|
(5.8
|
)
|
45.8
|
|
126.3
|
|
|||||
|
354.8
|
|
204.4
|
|
134.0
|
|
||||||
|
Net income from continuing operations
|
709.3
|
|
386.1
|
|
251.9
|
|
|||||
|
Discontinued operations:
|
|||||||||||
|
Gain on sale of discontinued operations, net of provision for income taxes of $-, $5.4, and $-
|
—
|
|
7.1
|
|
—
|
|
|||||
|
Income (loss) from discontinued operations, net of provision (benefit) for income taxes of $-, $(0.8), and $1.1
|
—
|
|
(0.8
|
)
|
1.8
|
|
|||||
|
Net income
|
709.3
|
|
392.4
|
|
253.7
|
|
|||||
|
Net income (loss) attributable to noncontrolling interest
|
31.1
|
|
16.9
|
|
(1.5
|
)
|
|||||
|
Net income attributable to Trinity Industries, Inc.
|
$
|
678.2
|
|
$
|
375.5
|
|
$
|
255.2
|
|
||
|
Net income attributable to Trinity Industries, Inc. per common share:
|
|||||||||||
|
Basic:
|
|||||||||||
|
Continuing operations
|
$
|
4.35
|
|
$
|
2.34
|
|
$
|
1.59
|
|
||
|
Discontinued operations
|
—
|
|
0.04
|
|
0.01
|
|
|||||
|
$
|
4.35
|
|
$
|
2.38
|
|
$
|
1.60
|
|
|||
|
Diluted:
|
|||||||||||
|
Continuing operations
|
$
|
4.19
|
|
$
|
2.34
|
|
$
|
1.58
|
|
||
|
Discontinued operations
|
—
|
|
0.04
|
|
0.01
|
|
|||||
|
$
|
4.19
|
|
$
|
2.38
|
|
$
|
1.59
|
|
|||
|
Weighted average number of shares outstanding:
|
|||||||||||
|
Basic
|
151.0
|
|
152.8
|
|
154.7
|
|
|||||
|
Diluted
|
156.7
|
|
152.9
|
|
155.1
|
|
|||||
|
Dividends declared per common share
|
$
|
0.375
|
|
$
|
0.270
|
|
$
|
0.210
|
|
||
See accompanying notes to consolidated financial statements.
47
Trinity Industries, Inc. and Subsidiaries
Consolidated Statements of Comprehensive Income
|
|
Year Ended December 31,
|
|||||||||||
|
|
2014
|
2013
|
2012
|
|||||||||
|
|
(in millions)
|
|||||||||||
|
Net income
|
$
|
709.3
|
|
$
|
392.4
|
|
$
|
253.7
|
|
|||
|
Other comprehensive income (loss):
|
||||||||||||
|
Derivative financial instruments:
|
||||||||||||
|
Unrealized gains/(losses) arising during the period, net of tax expense/ (benefit) of $(0.6), $0.8, and $4.2
|
(1.2
|
)
|
0.8
|
|
7.2
|
|
||||||
|
Reclassification adjustments for losses included in net income, net of tax benefit of $8.4, $8.7, and $3.2
|
16.0
|
|
18.1
|
|
5.8
|
|
||||||
|
Currency translation adjustment
|
(2.0
|
)
|
—
|
|
0.6
|
|
||||||
|
Defined benefit plans:
|
||||||||||||
|
Unrealized gains/(losses) arising during the period, net of tax expense/ (benefit) of $(26.7), $31.0, and $(17.8)
|
(45.1
|
)
|
52.7
|
|
(30.3
|
)
|
||||||
|
Amortization of net actuarial losses, net of tax benefit of $0.8, $1.9, and $1.1
|
1.3
|
|
3.1
|
|
2.2
|
|
||||||
|
(31.0
|
)
|
74.7
|
|
(14.5
|
)
|
|||||||
|
Comprehensive income
|
678.3
|
|
467.1
|
|
239.2
|
|
||||||
|
Less: comprehensive income attributable to noncontrolling interest
|
34.1
|
|
21.1
|
|
0.1
|
|
||||||
|
Comprehensive income attributable to Trinity Industries, Inc.
|
$
|
644.2
|
|
$
|
446.0
|
|
$
|
239.1
|
|
|||
See accompanying notes to consolidated financial statements.
48
Trinity Industries, Inc. and Subsidiaries
|
December 31,
2014 |
December 31,
2013 |
|||||||
|
(in millions)
|
||||||||
|
ASSETS
|
||||||||
|
Cash and cash equivalents
|
$
|
887.9
|
|
$
|
428.5
|
|
||
|
Short-term marketable securities
|
75.0
|
|
149.7
|
|
||||
|
Receivables, net of allowance for doubtful accounts of $4.5 and $3.1
|
405.3
|
|
365.0
|
|
||||
|
Income tax receivable
|
58.6
|
|
7.7
|
|
||||
|
Inventories:
|
||||||||
|
Raw materials and supplies
|
585.4
|
|
477.0
|
|
||||
|
Work in process
|
298.2
|
|
201.4
|
|
||||
|
Finished goods
|
184.8
|
|
136.3
|
|
||||
|
1,068.4
|
|
814.7
|
|
|||||
|
Restricted cash, including partially-owned subsidiaries of $91.9 and $77.1
|
234.7
|
|
260.7
|
|
||||
|
Property, plant, and equipment, at cost, including partially-owned subsidiaries of $2,261.2 and $1,887.2
|
6,586.0
|
|
6,275.8
|
|
||||
|
Less accumulated depreciation, including partially-owned subsidiaries of $261.3 and $202.1
|
(1,683.1
|
)
|
(1,505.2
|
)
|
||||
|
4,902.9
|
|
4,770.6
|
|
|||||
|
Goodwill
|
773.2
|
|
278.2
|
|
||||
|
Other assets
|
327.8
|
|
238.3
|
|
||||
|
$
|
8,733.8
|
|
$
|
7,313.4
|
|
|||
|
LIABILITIES AND STOCKHOLDERS' EQUITY
|
||||||||
|
Accounts payable
|
$
|
295.4
|
|
$
|
216.3
|
|
||
|
Accrued liabilities
|
709.6
|
|
567.4
|
|
||||
|
Debt:
|
||||||||
|
Recourse, net of unamortized discount of $60.0 and $74.1
|
829.3
|
|
419.0
|
|
||||
|
Non-recourse:
|
||||||||
|
Wholly-owned subsidiaries
|
1,207.8
|
|
1,314.7
|
|
||||
|
Partially-owned subsidiaries
|
1,515.9
|
|
1,256.1
|
|
||||
|
3,553.0
|
|
2,989.8
|
|
|||||
|
Deferred income
|
36.4
|
|
40.8
|
|
||||
|
Deferred income taxes
|
632.6
|
|
650.7
|
|
||||
|
Other liabilities
|
109.4
|
|
99.3
|
|
||||
|
5,336.4
|
|
4,564.3
|
|
|||||
|
Stockholders’ equity:
|
||||||||
|
Preferred stock – 1.5 shares authorized and unissued
|
—
|
|
—
|
|
||||
|
Common stock – 200.0 shares authorized; shares issued and outstanding at December 31, 2014 – 155.7; at December 31, 2013 – 81.7
|
155.7
|
|
81.7
|
|
||||
|
Capital in excess of par value
|
463.2
|
|
686.6
|
|
||||
|
Retained earnings
|
2,489.9
|
|
1,870.0
|
|
||||
|
Accumulated other comprehensive loss
|
(111.9
|
)
|
(78.2
|
)
|
||||
|
Treasury stock – shares at December 31, 2014 – 0.1; at December 31, 2013 – 4.3
|
(1.0
|
)
|
(158.0
|
)
|
||||
|
2,995.9
|
|
2,402.1
|
|
|||||
|
Noncontrolling interest
|
401.5
|
|
347.0
|
|
||||
|
3,397.4
|
|
2,749.1
|
|
|||||
|
$
|
8,733.8
|
|
$
|
7,313.4
|
|
|||
See accompanying notes to consolidated financial statements.
49
Trinity Industries, Inc. and Subsidiaries
|
|
Year Ended December 31,
|
|||||||||||
|
|
2014
|
2013
|
2012
|
|||||||||
|
|
(in millions)
|
|||||||||||
|
Operating activities:
|
||||||||||||
|
Net income
|
$
|
709.3
|
|
$
|
392.4
|
|
$
|
253.7
|
|
|||
|
Adjustments to reconcile net income to net cash provided by operating activities:
|
||||||||||||
|
Income from discontinued operations
|
—
|
|
(6.3
|
)
|
(1.8
|
)
|
||||||
|
Depreciation and amortization
|
244.6
|
|
211.5
|
|
193.7
|
|
||||||
|
Stock-based compensation expense
|
53.3
|
|
44.5
|
|
27.7
|
|
||||||
|
Excess tax benefits from stock-based compensation
|
(24.4
|
)
|
(8.5
|
)
|
(0.6
|
)
|
||||||
|
Provision (benefit) for deferred income taxes
|
(5.8
|
)
|
45.8
|
|
126.3
|
|
||||||
|
Net gains on railcar lease fleet sales owned more than one year at the time of sale
|
(92.3
|
)
|
(20.4
|
)
|
(33.5
|
)
|
||||||
|
Gain on disposition of property, plant, equipment, and other assets
|
(12.1
|
)
|
(0.8
|
)
|
(5.0
|
)
|
||||||
|
Non-cash interest expense
|
30.7
|
|
30.8
|
|
31.2
|
|
||||||
|
Other
|
(4.5
|
)
|
(6.4
|
)
|
(3.2
|
)
|
||||||
|
Changes in assets and liabilities:
|
||||||||||||
|
(Increase) decrease in receivables
|
(56.4
|
)
|
17.2
|
|
2.7
|
|
||||||
|
(Increase) decrease in inventories
|
(186.3
|
)
|
(95.6
|
)
|
(128.0
|
)
|
||||||
|
(Increase) decrease in restricted cash
|
25.0
|
|
(25.0
|
)
|
—
|
|
||||||
|
(Increase) decrease in other assets
|
(8.3
|
)
|
(29.1
|
)
|
(41.5
|
)
|
||||||
|
Increase (decrease) in accounts payable
|
60.7
|
|
29.0
|
|
(16.7
|
)
|
||||||
|
Increase (decrease) in accrued liabilities
|
82.1
|
|
72.4
|
|
125.5
|
|
||||||
|
Increase (decrease) in other liabilities
|
2.6
|
|
8.2
|
|
(3.9
|
)
|
||||||
|
Net cash provided by operating activities - continuing operations
|
818.2
|
|
659.7
|
|
526.6
|
|
||||||
|
Net cash provided by operating activities - discontinued operations
|
1.0
|
|
2.5
|
|
0.8
|
|
||||||
|
Net cash provided by operating activities
|
819.2
|
|
662.2
|
|
527.4
|
|
||||||
|
Investing activities:
|
||||||||||||
|
(Increase) decrease in short-term marketable securities
|
74.7
|
|
(149.7
|
)
|
—
|
|
||||||
|
Proceeds from railcar lease fleet sales owned more than one year at the time of sale
|
265.8
|
|
131.6
|
|
126.3
|
|
||||||
|
Proceeds from railcar lease fleet sales – sale and leaseback
|
—
|
|
—
|
|
58.3
|
|
||||||
|
Proceeds from disposition of property, plant, equipment, and other assets
|
23.0
|
|
3.7
|
|
16.8
|
|
||||||
|
Capital expenditures – leasing, net of sold lease fleet railcars owned one year or less with a net cost of $350.2, $49.4 and $93.8
|
(245.3
|
)
|
(581.1
|
)
|
(352.6
|
)
|
||||||
|
Capital expenditures – manufacturing and other
|
(219.3
|
)
|
(149.9
|
)
|
(116.6
|
)
|
||||||
|
Acquisitions, net of cash acquired
|
(714.4
|
)
|
(73.2
|
)
|
(46.2
|
)
|
||||||
|
Other
|
0.8
|
|
—
|
|
1.7
|
|
||||||
|
Net cash required by investing activities - continuing operations
|
(814.7
|
)
|
(818.6
|
)
|
(312.3
|
)
|
||||||
|
Net cash provided by investing activities - discontinued operations
|
—
|
|
0.6
|
|
0.9
|
|
||||||
|
Net cash required by investing activities
|
(814.7
|
)
|
(818.0
|
)
|
(311.4
|
)
|
||||||
|
Financing activities:
|
||||||||||||
|
Proceeds from issuance of common stock, net
|
0.6
|
|
2.5
|
|
4.1
|
|
||||||
|
Excess tax benefits from stock-based compensation
|
24.4
|
|
8.5
|
|
0.6
|
|
||||||
|
Payments to retire debt
|
(186.6
|
)
|
(262.1
|
)
|
(378.4
|
)
|
||||||
|
Proceeds from issuance of debt
|
727.3
|
|
175.0
|
|
443.8
|
|
||||||
|
(Increase) decrease in restricted cash
|
1.0
|
|
(12.5
|
)
|
17.1
|
|
||||||
|
Shares repurchased
|
(36.5
|
)
|
(103.2
|
)
|
(45.2
|
)
|
||||||
|
Dividends paid to common shareholders
|
(54.4
|
)
|
(39.3
|
)
|
(31.7
|
)
|
||||||
|
Purchase of shares to satisfy employee tax on vested stock
|
(38.3
|
)
|
(9.6
|
)
|
(4.8
|
)
|
||||||
|
Proceeds from sale of interests in partially-owned leasing subsidiaries
|
—
|
|
296.7
|
|
—
|
|
||||||
|
Repurchase of noncontrolling interests in partially-owned leasing subsidiary
|
—
|
|
(84.0
|
)
|
—
|
|
||||||
|
Contributions from noncontrolling interest
|
49.6
|
|
50.0
|
|
—
|
|
||||||
|
Distributions to noncontrolling interest
|
(28.2
|
)
|
(10.0
|
)
|
—
|
|
||||||
|
Other
|
(2.5
|
)
|
0.8
|
|
(0.5
|
)
|
||||||
|
Net cash provided by financing activities - continuing operations
|
456.4
|
|
12.8
|
|
5.0
|
|
||||||
|
Net cash provided (required) by financing activities - discontinued operations
|
(1.5
|
)
|
(1.5
|
)
|
0.9
|
|
||||||
|
Net cash provided by financing activities
|
454.9
|
|
11.3
|
|
5.9
|
|
||||||
|
Net increase (decrease) in cash and cash equivalents
|
459.4
|
|
(144.5
|
)
|
221.9
|
|
||||||
|
Cash and cash equivalents at beginning of period
|
428.5
|
|
573.0
|
|
351.1
|
|
||||||
|
Cash and cash equivalents at end of period
|
$
|
887.9
|
|
$
|
428.5
|
|
$
|
573.0
|
|
|||
Interest paid for the
years ended
December 31, 2014
,
2013
, and
2012
was
$158.3 million
,
$163.6 million
, and
$174.8 million
, respectively. Income tax payments, net of refunds, made for the
years ended
December 31, 2014
,
2013
, and
2012
were
$399.0 million
,
$110.9 million
, and
$18.4 million
, respectively.
See accompanying notes to consolidated financial statements.
50
Trinity Industries, Inc. and Subsidiaries
Consolidated Statements of Stockholders’ Equity
|
|
Common
Stock
|
|
|
|
Treasury
Stock
|
|
|
|
||||||||||||||||||||||||||||||
|
|
Shares
|
$1 Par Value
|
Capital in
Excess of
Par Value
|
Retained
Earnings
|
Accumulated
Other
Comprehensive
Loss
|
Shares
|
Amount
|
Trinity
Stockholders’
Equity
|
Noncontrolling
Interest
|
Total
Stockholders’
Equity
|
||||||||||||||||||||||||||||
|
|
(in millions, except par value)
|
|||||||||||||||||||||||||||||||||||||
|
Balances at
December 31, 2011 |
81.7
|
|
$
|
81.7
|
|
$
|
626.5
|
|
$
|
1,314.7
|
|
$
|
(134.0
|
)
|
(1.5
|
)
|
$
|
(25.1
|
)
|
$
|
1,863.8
|
|
$
|
84.5
|
|
$
|
1,948.3
|
|
||||||||||
|
Net income (loss)
|
—
|
|
—
|
|
—
|
|
255.2
|
|
—
|
|
—
|
|
—
|
|
255.2
|
|
(1.5
|
)
|
253.7
|
|
||||||||||||||||||
|
Other comprehensive income (loss)
|
—
|
|
—
|
|
—
|
|
—
|
|
(16.1
|
)
|
—
|
|
—
|
|
(16.1
|
)
|
1.6
|
|
(14.5
|
)
|
||||||||||||||||||
|
Cash dividends on common stock
|
—
|
|
—
|
|
—
|
|
(33.2
|
)
|
—
|
|
—
|
|
—
|
|
(33.2
|
)
|
—
|
|
(33.2
|
)
|
||||||||||||||||||
|
Restricted shares, net
|
—
|
|
—
|
|
26.4
|
|
—
|
|
—
|
|
0.4
|
|
(1.7
|
)
|
24.7
|
|
—
|
|
24.7
|
|
||||||||||||||||||
|
Stock options exercised
|
—
|
|
—
|
|
(0.7
|
)
|
—
|
|
—
|
|
0.3
|
|
4.8
|
|
4.1
|
|
—
|
|
4.1
|
|
||||||||||||||||||
|
Excess tax benefits from stock-based compensation
|
—
|
|
—
|
|
0.2
|
|
—
|
|
—
|
|
—
|
|
—
|
|
0.2
|
|
—
|
|
0.2
|
|
||||||||||||||||||
|
Stock-based compensation expense
|
—
|
|
—
|
|
0.2
|
|
—
|
|
—
|
|
—
|
|
—
|
|
0.2
|
|
—
|
|
0.2
|
|
||||||||||||||||||
|
Shares repurchased
|
—
|
|
—
|
|
—
|
|
—
|
|
—
|
|
(1.8
|
)
|
(45.2
|
)
|
(45.2
|
)
|
—
|
|
(45.2
|
)
|
||||||||||||||||||
|
Other
|
—
|
|
—
|
|
—
|
|
—
|
|
—
|
|
—
|
|
(0.7
|
)
|
(0.7
|
)
|
—
|
|
(0.7
|
)
|
||||||||||||||||||
|
Balances at
December 31, 2012 |
81.7
|
|
$
|
81.7
|
|
$
|
652.6
|
|
$
|
1,536.7
|
|
$
|
(150.1
|
)
|
(2.6
|
)
|
$
|
(67.9
|
)
|
$
|
2,053.0
|
|
$
|
84.6
|
|
$
|
2,137.6
|
|
||||||||||
|
Net income
|
—
|
|
—
|
|
—
|
|
375.5
|
|
—
|
|
—
|
|
—
|
|
375.5
|
|
16.9
|
|
392.4
|
|
||||||||||||||||||
|
Other comprehensive income
|
—
|
|
—
|
|
—
|
|
—
|
|
70.5
|
|
—
|
|
—
|
|
70.5
|
|
4.2
|
|
74.7
|
|
||||||||||||||||||
|
Cash dividends on common stock
|
—
|
|
—
|
|
—
|
|
(42.2
|
)
|
—
|
|
—
|
|
—
|
|
(42.2
|
)
|
—
|
|
(42.2
|
)
|
||||||||||||||||||
|
Restricted shares, net
|
—
|
|
—
|
|
23.3
|
|
—
|
|
—
|
|
0.7
|
|
13.8
|
|
37.1
|
|
—
|
|
37.1
|
|
||||||||||||||||||
|
Shares repurchased
|
—
|
|
—
|
|
—
|
|
—
|
|
—
|
|
(2.5
|
)
|
(108.2
|
)
|
(108.2
|
)
|
—
|
|
(108.2
|
)
|
||||||||||||||||||
|
Stock options exercised
|
—
|
|
—
|
|
(2.0
|
)
|
—
|
|
—
|
|
0.1
|
|
4.3
|
|
2.3
|
|
—
|
|
2.3
|
|
||||||||||||||||||
|
Excess tax benefits from stock-based compensation
|
—
|
|
—
|
|
8.7
|
|
—
|
|
—
|
|
—
|
|
—
|
|
8.7
|
|
—
|
|
8.7
|
|
||||||||||||||||||
|
Repurchase of interests in partially-owned leasing subsidiary
|
—
|
|
—
|
|
11.8
|
|
—
|
|
(11.8
|
)
|
—
|
|
—
|
|
—
|
|
(84.2
|
)
|
(84.2
|
)
|
||||||||||||||||||
|
Sale of interests in partially-owned leasing subsidiaries
|
—
|
|
—
|
|
(7.3
|
)
|
—
|
|
13.2
|
|
—
|
|
—
|
|
5.9
|
|
285.4
|
|
291.3
|
|
||||||||||||||||||
|
Contributions from noncontrolling interest
|
—
|
|
—
|
|
—
|
|
—
|
|
—
|
|
—
|
|
—
|
|
—
|
|
50.0
|
|
50.0
|
|
||||||||||||||||||
|
Distributions to noncontrolling interest
|
—
|
|
—
|
|
—
|
|
—
|
|
—
|
|
—
|
|
—
|
|
—
|
|
(9.9
|
)
|
(9.9
|
)
|
||||||||||||||||||
|
Other
|
—
|
|
—
|
|
(0.5
|
)
|
—
|
|
—
|
|
—
|
|
—
|
|
(0.5
|
)
|
—
|
|
(0.5
|
)
|
||||||||||||||||||
|
Balances at
December 31, 2013 |
81.7
|
|
$
|
81.7
|
|
$
|
686.6
|
|
$
|
1,870.0
|
|
$
|
(78.2
|
)
|
(4.3
|
)
|
$
|
(158.0
|
)
|
$
|
2,402.1
|
|
$
|
347.0
|
|
$
|
2,749.1
|
|
||||||||||
|
Net income
|
—
|
|
—
|
|
—
|
|
678.2
|
|
—
|
|
—
|
|
—
|
|
678.2
|
|
31.1
|
|
709.3
|
|
||||||||||||||||||
|
Other comprehensive income (loss)
|
—
|
|
—
|
|
—
|
|
—
|
|
(34.0
|
)
|
—
|
|
—
|
|
(34.0
|
)
|
3.0
|
|
(31.0
|
)
|
||||||||||||||||||
|
Cash dividends on common stock
|
—
|
|
—
|
|
—
|
|
(58.3
|
)
|
—
|
|
—
|
|
—
|
|
(58.3
|
)
|
—
|
|
(58.3
|
)
|
||||||||||||||||||
|
Restricted shares, net
|
0.1
|
|
0.1
|
|
29.8
|
|
—
|
|
—
|
|
0.6
|
|
(15.0
|
)
|
14.9
|
|
—
|
|
14.9
|
|
||||||||||||||||||
|
Shares repurchased
|
—
|
|
—
|
|
—
|
|
—
|
|
—
|
|
(0.6
|
)
|
(31.5
|
)
|
(31.5
|
)
|
—
|
|
(31.5
|
)
|
||||||||||||||||||
|
Stock options exercised
|
0.1
|
|
0.1
|
|
(0.1
|
)
|
—
|
|
—
|
|
0.1
|
|
0.6
|
|
0.6
|
|
—
|
|
0.6
|
|
||||||||||||||||||
|
Excess tax benefits from stock-based compensation
|
—
|
|
—
|
|
24.2
|
|
—
|
|
—
|
|
—
|
|
—
|
|
24.2
|
|
—
|
|
24.2
|
|
||||||||||||||||||
|
Contributions from noncontrolling interest
|
—
|
|
—
|
|
—
|
|
—
|
|
—
|
|
—
|
|
—
|
|
—
|
|
49.6
|
|
49.6
|
|
||||||||||||||||||
|
Distributions to noncontrolling interest
|
—
|
|
—
|
|
—
|
|
—
|
|
—
|
|
—
|
|
—
|
|
—
|
|
(28.2
|
)
|
(28.2
|
)
|
||||||||||||||||||
|
Retirement of treasury stock
|
(4.2
|
)
|
(4.2
|
)
|
(198.9
|
)
|
—
|
|
—
|
|
4.2
|
|
203.1
|
|
—
|
|
—
|
|
—
|
|
||||||||||||||||||
|
Stock split
|
78.0
|
|
78.0
|
|
(78.0
|
)
|
—
|
|
—
|
|
—
|
|
—
|
|
—
|
|
—
|
|
—
|
|
||||||||||||||||||
|
Other
|
—
|
|
—
|
|
(0.4
|
)
|
—
|
|
0.3
|
|
(0.1
|
)
|
(0.2
|
)
|
(0.3
|
)
|
(1.0
|
)
|
(1.3
|
)
|
||||||||||||||||||
|
Balances at
December 31, 2014 |
155.7
|
|
$
|
155.7
|
|
$
|
463.2
|
|
$
|
2,489.9
|
|
$
|
(111.9
|
)
|
(0.1
|
)
|
$
|
(1.0
|
)
|
$
|
2,995.9
|
|
$
|
401.5
|
|
$
|
3,397.4
|
|
||||||||||
See accompanying notes to consolidated financial statements.
51
Trinity Industries, Inc. and Subsidiaries
Notes to Consolidated Financial Statements
Principles of Consolidation
The financial statements of Trinity Industries, Inc. and its consolidated subsidiaries (“Trinity”, “Company”, “we” or “our”) include the accounts of its wholly-owned subsidiaries and its partially-owned subsidiaries, TRIP Rail Holdings LLC ("TRIP Holdings") and RIV 2013 Rail Holdings LLC ("RIV 2013"), in which the Company has a controlling interest. All significant intercompany accounts and transactions have been eliminated.
Stockholders' Equity
On
May 5, 2014
, the Company's Board of Directors authorized a
2
-for-1 stock split on its common shares. The stock split was issued in the form of a
100%
stock dividend. The additional shares were distributed on
June 19, 2014
, to shareholders of record at the close of business on
June 5, 2014
. All share and per share information, including dividends, has been retroactively adjusted to reflect the
2-for-1
stock split, except for the statement of stockholders' equity which will reflect the stock split by reclassifying
$78.0 million
from "Capital in Excess of Par Value" to "Common Stock" representing the par value of the additional shares issued to effect the stock split.
In
March 2014
, the Company’s Board of Directors authorized a new
$250 million
share repurchase program that expires on
December 31, 2015
and replaced the Company's previously authorized
$200 million
share repurchase program. Under the new program,
747,246
shares were repurchased during the year ended
December 31, 2014
, at a cost of
$31.5 million
. During the year ended
December 31, 2013
, the Company repurchased
2,473,189
shares under the prior program at a cost of
$108.2 million
.
Revenue Recognition
Revenues for contracts providing for a large number of units and few deliveries are recorded as the individual units are produced, inspected, and accepted by the customer as the risk of loss passes to the customer upon delivery acceptance on these contracts. This occurs primarily in the Rail and Inland Barge Groups. Revenue from rentals and operating leases, including contracts which contain non-level fixed rental payments, is recognized monthly on a straight-line basis. Revenue is recognized from the sales of railcars from the lease fleet on a gross basis in leasing revenues and cost of revenues if the railcar has been owned for one year or less at the time of sale. Sales of railcars from the lease fleet that have been owned for more than one year are recognized as a net gain or loss from the disposal of a long-term asset. Fees for shipping and handling are recorded as revenue. For all other products, we recognize revenue when products are shipped or services are provided.
Income Taxes
The liability method is used to account for income taxes. Deferred income taxes represent the tax effects of temporary differences between the carrying amounts of assets and liabilities for financial reporting purposes and the amounts used for income tax purposes. Valuation allowances reduce deferred tax assets to an amount that will more likely than not be realized.
The Company regularly evaluates the likelihood of realization of tax benefits derived from positions it has taken in various federal and state filings after consideration of all relevant facts, circumstances, and available information. For those tax positions that are deemed more likely than not to be sustained, the Company recognizes the benefit it believes is cumulatively greater than
50%
likely to be realized. To the extent the Company were to prevail in matters for which accruals have been established or be required to pay amounts in excess of recorded reserves, the effective tax rate in a given financial statement period could be materially impacted.
Financial Instruments
The Company considers all highly liquid debt instruments to be either cash and cash equivalents if purchased with a maturity of
three months
or less, or short-term marketable securities if purchased with a maturity of more than
three months
and less than
one year
. The Company intends to hold its short-term marketable securities until they are redeemed at their maturity date and believes that under the "more likely than not" criteria, the Company will not be required to sell the securities before recovery of their amortized cost bases, which may be maturity.
Financial instruments that potentially subject the Company to a concentration of credit risk are primarily cash investments including restricted cash, short-term marketable securities, and receivables. The Company places its cash investments and short-term marketable securities in bank deposits and investment grade, short-term debt instruments and limits the amount of credit exposure to any one commercial issuer. Concentrations of credit risk with respect to receivables are limited due to control procedures
52
that monitor the credit worthiness of customers, the large number of customers in the Company's customer base, and their dispersion across different industries and geographic areas. As receivables are generally unsecured, the Company maintains an allowance for doubtful accounts based upon the expected collectibility of all receivables. Receivable balances determined to be uncollectible are charged against the allowance. The carrying values of cash, short-term marketable securities, receivables and accounts payable are considered to be representative of their respective fair values.
Inventories
Inventories are valued at the lower of cost or market, with cost determined principally on the first in first out method. Market is replacement cost or net realizable value. Work in process and finished goods include material, labor, and overhead.
Property, Plant, and Equipment
Property, plant, and equipment are stated at cost and depreciated over their estimated useful lives using the straight-line method. The estimated useful lives are: buildings and improvements -
3
to
30 years
; leasehold improvements - the lesser of the term of the lease or
7 years
; machinery and equipment -
2
to
10 years
; information systems hardware and software -
2
to
5 years
; and railcars in our lease fleet - generally
35 years
. The costs of ordinary maintenance and repair are charged to operating costs while renewals and major replacements are capitalized.
Long-lived Assets
The Company periodically evaluates the carrying value of long-lived assets to be held and used for potential impairment. The carrying value of long-lived assets to be held and used is considered impaired only when their carrying value is not recoverable through undiscounted future cash flows and the fair value of the assets is less than their carrying value. Fair value is determined primarily using the anticipated cash flows discounted at a rate commensurate with the risks involved or market quotes as available. Impairment losses on long-lived assets held for sale are determined in a similar manner, except that fair values are reduced by the estimated cost to dispose of the assets. Impairment losses were not material for the years ended
December 31, 2014
,
2013
, and
2012
.
Goodwill and Intangible Assets
Goodwill is required to be tested for impairment annually, or on an interim basis whenever events or circumstances change, indicating that the carrying amount of the goodwill might be impaired. The goodwill impairment test is a two-step process with step one requiring the comparison of the reporting unit's estimated fair value with the carrying amount of its net assets. If necessary, step two of the impairment test determines the amount of goodwill impairment to be recorded when the reporting unit's recorded net assets exceed its fair value. Impairment is assessed at the “reporting unit” level by applying a fair value-based test for each unit with recorded goodwill. The estimates and judgments that most significantly affect the fair value calculations are assumptions, consisting of level three inputs, related to revenue and operating profit growth, discount rates and exit multiples. During the three months ended
December 31, 2014
, the Company considered certain state actions with regard to its highway products litigation as an indicator of possible goodwill impairment. See Note 18 Commitments and Contingencies for a fuller explanation of this matter. As of
December 31, 2014
and
2013
, the Company's annual impairment test of goodwill was completed at the reporting unit level and
no
impairment charges were determined to be necessary.
Intangible assets with defined useful lives, which as of
December 31, 2014
had net book values of
$58.8 million
, are amortized over their estimated useful lives, and were also evaluated for potential impairment as of
December 31, 2014
.
Restricted Cash
Restricted cash consists of cash and cash equivalents that are held either as collateral for the Company's non-recourse debt and lease obligations or security for the performance of certain product sales agreements and as such are restricted in use.
Insurance
The Company is effectively self-insured for workers' compensation claims. A third party administrator is used to process claims. We accrue our workers' compensation liability based upon independent actuarial studies.
Warranties
Depending on the product, the Company provides warranties against materials and manufacturing defects generally ranging from
one
to
five
years. The warranty costs are estimated using a two-step approach. First, an engineering estimate is made for the cost of all claims that have been asserted by customers. Second, based on historical claims experience, a cost is accrued for all products still within a warranty period for which no claims have been filed. The Company provides for the estimated cost of product
53
warranties at the time revenue is recognized related to products covered by warranties, and assesses the adequacy of the resulting reserves on a quarterly basis.
Foreign Currency Translation
Operations outside the United States prepare financial statements in currencies other than the United States dollar. The income statement amounts are translated at average exchange rates for the year, while the assets and liabilities are translated at year-end exchange rates. Translation adjustments are accumulated as a separate component of stockholders' equity and other comprehensive income. The functional currency of our Mexico operations is considered to be the United States dollar. The functional currency of our Canadian operations is considered to be the Canadian dollar.
Other Comprehensive Income (Loss)
Other comprehensive net income (loss) consists of foreign currency translation adjustments, the effective unrealized gains and losses on the Company's derivative financial instruments, and the net actuarial gains and losses of the Company's defined benefit plans, the sum of which, along with net income (loss), constitutes comprehensive net income (loss). See Note 15 Accumulated Other Comprehensive Loss (“AOCL”). All components are shown net of tax.
Recent Accounting Pronouncements
In May 2014, the Financial Accounting Standards Board ("FASB") issued Accounting Standards Update No. 2014-09, "Revenue from Contracts with Customers," ("ASU 2014-09") providing common revenue recognition guidance for U.S. GAAP. Under ASU 2014-09, an entity recognizes revenue when it transfers promised goods or services to customers in an amount that reflects what it expects in exchange for the goods or services. It also requires additional detailed disclosures to enable users of financial statements to understand the nature, amount, timing, and uncertainty of revenue and cash flows arising from contracts with customers. ASU 2014-09 will become effective for public companies during interim and annual reporting periods beginning after December 15, 2016. Early application is not permitted. We are currently evaluating the impact this standard will have on our consolidated financial statements.
Management's Estimates
The preparation of financial statements in conformity with generally accepted accounting principles requires management to make estimates and assumptions that affect the reported amounts of assets and liabilities and disclosure of contingent assets and liabilities at the date of the financial statements and the reported amounts of revenues and expenses during the reporting period. Actual results could differ from those estimates.
Reclassifications
Certain prior year balances have been reclassified in the consolidated financial statements to conform to the
2014
presentation.
54
The Company's acquisition and divestiture activities are summarized below:
|
Year Ended December 31,
|
|||||||||||
|
2014
|
2013
|
2012
|
|||||||||
|
(in millions)
|
|||||||||||
|
Acquisitions:
|
|||||||||||
|
Purchase price
|
$
|
720.9
|
|
$
|
125.2
|
|
$
|
48.8
|
|
||
|
Net cash paid
|
$
|
714.4
|
|
$
|
73.2
|
|
$
|
46.2
|
|
||
|
Goodwill recorded
|
$
|
495.0
|
|
$
|
37.0
|
|
$
|
20.9
|
|
||
|
Divestitures:
|
|||||||||||
|
Proceeds
|
$
|
—
|
|
$
|
35.6
|
|
$
|
2.1
|
|
||
|
Gain recognized
|
$
|
—
|
|
$
|
12.5
|
|
$
|
1.5
|
|
||
|
Goodwill charged off
|
$
|
—
|
|
$
|
4.8
|
|
$
|
0.1
|
|
||
Acquisition of Meyer Steel Structures
On August 18, 2014, Trinity completed its acquisition of the assets of Meyer Steel Structures ("Meyer"), the utility steel structures division of Thomas & Betts Corporation, a member of the ABB Group, for approximately
$595.6 million
in cash. Meyer is one of North America's leading providers of tubular steel structures for electricity transmission and distribution and is included in the Company's Energy Equipment Group. For the
year ended
December 31, 2014
, the Company incurred
$8.7 million
in acquisition-related transaction costs which have been expensed in our Corporate segment and
$1.5 million
in non-recurring additional state income tax expense included in our consolidated provision for income taxes. Due to the size and complexity of Meyer, the purchase price was allocated on a preliminary basis to the assets acquired and liabilities assumed based on their acquisition date fair value using level three inputs. We expect to complete our purchase price allocation as soon as reasonably possible not to exceed one year from the acquisition date. Adjustments to the preliminary purchase price allocation could be material to the purchase price allocation. The following table represents our preliminary purchase price allocation as of
December 31, 2014
:
|
December 31,
2014 |
|||
|
(in millions)
|
|||
|
Accounts receivable
|
$
|
29.4
|
|
|
Inventories
|
36.1
|
|
|
|
Property, plant, and equipment
|
70.5
|
|
|
|
Goodwill
|
409.1
|
|
|
|
Other assets
|
76.0
|
|
|
|
Accounts payable
|
(15.4
|
)
|
|
|
Accrued liabilities
|
(10.1
|
)
|
|
|
Total net assets acquired
|
$
|
595.6
|
|
Level three inputs are those that reflect our estimates about the assumptions market participants would use in determining the fair value of the asset or liability based on the best information available in the circumstances. Valuation techniques for assets and liabilities measured using level three inputs may include methodologies such as the market approach, the income approach or the cost approach and may use unobservable inputs such as projections, estimates, and management’s interpretation of current market data. These unobservable inputs are utilized only to the extent that observable inputs are not available or cost effective to obtain. Goodwill, all tax-deductible, was primarily related to the value of Meyer's market position and its existing workforce. Based on our preliminary valuation, other assets include intangibles arising from the Meyer acquisition as follows:
|
Preliminary estimated fair value
|
Weighted average useful life
|
||||
|
(in millions)
|
|||||
|
Customer relationships
|
$
|
35.3
|
|
10.5 years
|
|
|
Trademarks/trade names
|
34.1
|
|
Indefinite
|
||
|
Technology
|
5.6
|
|
5.0 years
|
||
|
$
|
75.0
|
|
|||
55
In addition to Meyer, during the
year ended
December 31, 2014
, we completed the acquisition of
three
businesses in our Energy Equipment Group located in the U.S. and Canada and
one
business in our Construction Products Group located in the U.S. These acquisitions were recorded based on preliminary valuations of the related assets and liabilities at their acquisition date fair value using level three inputs. Such assets and liabilities were not significant in relation to assets and liabilities at the consolidated or segment level. The valuations of the three Energy Equipment Group acquisitions were finalized as of
September 30, 2014
.
The operating results of our 2014 acquisitions, as summarized in the following table, are included in the Consolidated Statements of Operations from their date of acquisition, exclude transaction-related acquisition costs that are included in the Corporate segment, and include additional amortization expense resulting from the preliminary purchase price allocation:
|
Year Ended
December 31, 2014 |
|||
|
(in millions)
|
|||
|
Revenues
|
$
|
187.4
|
|
|
Operating profit
|
$
|
2.4
|
|
The following table represents the pro-forma consolidated operating results of the Company as if our 2014 acquisitions had been acquired on January 1, 2013. The pro-forma information should not be considered indicative of the results that would have occurred if the acquisitions had been completed on January 1, 2013, nor is such pro-forma information necessarily indicative of future results.
|
Year Ended December 31, 2014
|
Year Ended December 31, 2013
|
||||||
|
(in millions)
|
|||||||
|
Revenues
|
$
|
6,369.8
|
|
$
|
4,830.8
|
|
|
|
Operating profit
|
$
|
1,274.4
|
|
$
|
834.1
|
|
|
The aggregate purchase price related to our acquisition activity for the years ended December 31, 2014, 2013, and 2012 by segment follows:
|
Year ended December 31,
|
|||||||||||
|
2014
|
2013
|
2012
|
|||||||||
|
(in millions)
|
|||||||||||
|
Rail Group
|
$
|
—
|
|
$
|
23.1
|
|
$
|
—
|
|
||
|
Construction Products Group
|
6.1
|
|
74.2
|
|
48.8
|
|
|||||
|
Energy Equipment Group
|
714.8
|
|
27.9
|
|
—
|
|
|||||
|
$
|
720.9
|
|
$
|
125.2
|
|
$
|
48.8
|
|
|||
Discontinued operation - Ready-Mix Concrete Operations
During the
year ended
December 31, 2013
, the Company sold its remaining ready-mix concrete operations in exchange for certain aggregates operations in Texas, Colorado, and California. The fair value of the proceeds received in exchange for the divested operations was based on the Company’s estimate of fair value of the operations disposed using a discounted cash flow analysis. A gain of
$12.5 million
was recognized based on the fair value of the proceeds less the assets’ carrying amounts and certain transaction costs. The divestiture of our ready-mix concrete operations has been accounted for and reported as a discontinued operation.
Condensed results of operations for the ready-mix concrete operations for the years ended December 31, 2014, 2013, and 2012 are as follows:
|
Year Ended December 31,
|
|||||||||||
|
2014
|
2013
|
2012
|
|||||||||
|
(in millions)
|
|||||||||||
|
Revenues
|
$
|
—
|
|
$
|
31.6
|
|
$
|
121.4
|
|
||
|
Income (loss) from discontinued operations before income taxes
|
$
|
—
|
|
$
|
(1.6
|
)
|
$
|
2.9
|
|
||
|
Provision (benefit) for income taxes
|
—
|
|
(0.8
|
)
|
1.1
|
|
|||||
|
Net income (loss) from discontinued operations
|
$
|
—
|
|
$
|
(0.8
|
)
|
$
|
1.8
|
|
||
56
Assets and liabilities measured at fair value on a recurring basis are summarized below:
(1)
Included in accrued liabilities on the consolidated balance sheet.
|
|
Fair Value Measurement as of December 31, 2014
|
||||||||||||||
|
|
Level 1
|
Level 2
|
Level 3
|
Total
|
|||||||||||
|
(in millions)
|
|||||||||||||||
|
Assets:
|
|||||||||||||||
|
Cash equivalents
|
$
|
415.2
|
|
$
|
—
|
|
$
|
—
|
|
$
|
415.2
|
|
|||
|
Restricted cash
|
234.7
|
|
—
|
|
—
|
|
234.7
|
|
|||||||
|
Total assets
|
$
|
649.9
|
|
$
|
—
|
|
$
|
—
|
|
$
|
649.9
|
|
|||
|
Liabilities:
|
|||||||||||||||
|
Interest rate hedges:
(1)
|
|||||||||||||||
|
Wholly-owned subsidiaries
|
$
|
—
|
|
$
|
6.4
|
|
$
|
—
|
|
$
|
6.4
|
|
|||
|
Partially-owned subsidiaries
|
—
|
|
2.0
|
|
—
|
|
2.0
|
|
|||||||
|
Fuel derivative instruments
(1)
|
—
|
|
2.1
|
|
—
|
|
2.1
|
|
|||||||
|
Total liabilities
|
$
|
—
|
|
$
|
10.5
|
|
$
|
—
|
|
$
|
10.5
|
|
|||
|
|
Fair Value Measurement as of December 31, 2013
|
||||||||||||||
|
|
Level 1
|
Level 2
|
Level 3
|
Total
|
|||||||||||
|
(in millions)
|
|||||||||||||||
|
Assets:
|
|||||||||||||||
|
Cash equivalents
|
$
|
230.6
|
|
$
|
—
|
|
$
|
—
|
|
$
|
230.6
|
|
|||
|
Restricted cash
|
260.7
|
|
—
|
|
—
|
|
260.7
|
|
|||||||
|
Total assets
|
$
|
491.3
|
|
$
|
—
|
|
$
|
—
|
|
$
|
491.3
|
|
|||
|
Liabilities:
|
|||||||||||||||
|
Interest rate hedges:
(1)
|
|||||||||||||||
|
Wholly-owned subsidiaries
|
$
|
—
|
|
$
|
21.7
|
|
$
|
—
|
|
$
|
21.7
|
|
|||
|
Partially-owned subsidiaries
|
—
|
|
2.1
|
|
—
|
|
2.1
|
|
|||||||
|
Total liabilities
|
$
|
—
|
|
$
|
23.8
|
|
$
|
—
|
|
$
|
23.8
|
|
|||
Fair value is defined as the exchange price that would be received for an asset or paid to transfer a liability (an exit price) in the principal or most advantageous market for that asset or liability in an orderly transaction between market participants on the measurement date. An entity is required to establish a fair value hierarchy that maximizes the use of observable inputs and minimizes the use of unobservable inputs when measuring fair value. The
three
levels of inputs that may be used to measure fair values are listed below:
Level 1
– This level is defined as quoted prices in active markets for identical assets or liabilities. The Company’s cash equivalents and restricted cash are instruments of the U.S. Treasury or highly-rated money market mutual funds.
Level 2
– This level is defined as observable inputs other than
Level 1
prices such as quoted prices for similar assets or liabilities; quoted prices in markets that are not active; or other inputs that are observable or can be corroborated by observable market data for substantially the full term of the assets or liabilities. The Company’s fuel derivative instruments, which are commodity swaps, are valued using energy and commodity market data. Interest rate hedges are valued at exit prices obtained from each counterparty. See Note 7 Derivative Instruments and Note 11 Debt.
Level 3
– This level is defined as unobservable inputs that are supported by little or no market activity and that are significant to the fair value of the assets or liabilities.
57
The carrying amounts and estimated fair values of our long-term debt are as follows:
|
|
December 31, 2014
|
December 31, 2013
|
||||||||||||||
|
|
Carrying
Value
|
Estimated
Fair Value
|
Carrying
Value
|
Estimated
Fair Value
|
||||||||||||
|
|
(in millions)
|
|||||||||||||||
|
Recourse:
|
||||||||||||||||
|
Senior notes
|
$
|
399.6
|
|
$
|
387.0
|
|
$
|
—
|
|
$
|
—
|
|
||||
|
Convertible subordinated notes
|
449.5
|
593.9
|
|
450.0
|
|
593.4
|
||||||||||
|
Less: unamortized discount
|
(59.6
|
)
|
(74.1
|
)
|
||||||||||||
|
389.9
|
|
375.9
|
|
|||||||||||||
|
Capital lease obligations
|
39.1
|
|
39.1
|
|
42.2
|
|
42.2
|
|
||||||||
|
Other
|
0.7
|
|
0.7
|
|
0.9
|
|
0.9
|
|
||||||||
|
829.3
|
|
1,020.7
|
|
419.0
|
|
636.5
|
|
|||||||||
|
Non-recourse:
|
||||||||||||||||
|
2006 secured railcar equipment notes
|
223.0
|
|
245.6
|
|
240.7
|
|
259.2
|
|
||||||||
|
Promissory notes
|
363.9
|
|
362.7
|
|
396.1
|
|
389.6
|
|
||||||||
|
2009 secured railcar equipment notes
|
188.8
|
|
227.7
|
|
199.0
|
|
229.5
|
|
||||||||
|
2010 secured railcar equipment notes
|
311.5
|
|
344.0
|
|
326.9
|
|
342.7
|
|
||||||||
|
TILC warehouse facility
|
120.6
|
|
120.6
|
|
152.0
|
|
152.0
|
|
||||||||
|
TRL 2012 secured railcar equipment notes
(RIV 2013)
|
472.2
|
|
470.3
|
|
499.3
|
|
483.4
|
|
||||||||
|
TRIP Master Funding secured railcar equipment notes
|
1,043.7
|
|
1,121.4
|
|
756.8
|
|
819.8
|
|
||||||||
|
2,723.7
|
|
2,892.3
|
|
2,570.8
|
|
2,676.2
|
|
|||||||||
|
Total
|
$
|
3,553.0
|
|
$
|
3,913.0
|
|
$
|
2,989.8
|
|
$
|
3,312.7
|
|
||||
The estimated fair value of our senior notes and convertible subordinated notes were based on a quoted market price in a market with little activity as of
December 31, 2014
and
2013
, respectively (
Level 2
input). The estimated fair values of our
2006
,
2009
,
2010
, and
2012
secured railcar equipment notes, promissory notes, and TRIP Rail Master Funding LLC (“TRIP Master Funding”) secured railcar equipment notes are based on our estimate of their fair value as of
December 31, 2014
and
2013
, respectively. These values were determined by discounting their future cash flows at the current market interest rate (
Level 3
inputs). The carrying value of our Trinity Industries Leasing Company (“TILC”) warehouse facility approximates fair value because the interest rate adjusts to the market interest rate (
Level 3
input). The fair values of all other financial instruments are estimated to approximate carrying value. See Note 11 Debt for a description of the Company's long-term debt.
58
The Company reports operating results in
five
principal business segments: (1) the Rail Group, which manufactures and sells railcars and related parts and components; (2) the Construction Products Group, which manufactures and sells highway products and other primarily-steel products and services for infrastructure-related projects, and produces and sells aggregates; (3) the Inland Barge Group, which manufactures and sells barges and related products for inland waterway services; (4) the Energy Equipment Group, which manufactures and sells products for energy-related businesses, including structural wind towers, storage and distribution containers, tank heads for pressure and non-pressure vessels, and utility structures for electricity transmission and distribution; and (5) the Railcar Leasing and Management Services Group (“Leasing Group”), which owns and operates a fleet of railcars as well as provides third-party fleet leasing, management, maintenance, and administrative services. The segment All Other includes our captive insurance and transportation companies; legal, environmental, and maintenance costs associated with non-operating facilities; and other peripheral businesses. Gains and losses from the sale of property, plant, and equipment that are related to manufacturing and dedicated to the specific manufacturing operations of a particular segment are included in operating profit of that respective segment. Gains and losses from the sale of property, plant, and equipment that can be utilized by multiple segments are included in operating profit of the All Other segment.
Sales and related net profits from the Rail Group to the Leasing Group are recorded in the Rail Group and eliminated in consolidation. Sales between these groups are recorded at prices comparable to those charged to external customers, taking into consideration quantity, features, and production demand. Intersegment sales and net profit ("deferred profit") are eliminated in consolidation and reflected in the "Eliminations – Lease subsidiary" line in the table below. Amortization of deferred profit on railcars sold to the Leasing Group is included in the operating profit of the Leasing Group, resulting in the recognition of depreciation expense based on the Company's original manufacturing cost of the railcars. Sales of railcars from the lease fleet are included in the Leasing Group, with related gains and losses computed based on the net book value of the original manufacturing cost of the railcars.
59
The financial information from continuing operations for these segments is shown in the tables below. We operate principally in North America.
Year Ended
December 31, 2014
|
|
Revenues
|
Operating Profit (Loss)
|
Assets
|
Depreciation & Amortization
|
Capital Expenditures
|
||||||||||||||||||||||
|
|
External
|
Intersegment
|
Total
|
||||||||||||||||||||||||
|
|
(in millions)
|
||||||||||||||||||||||||||
|
Rail Group
|
$
|
3,077.6
|
|
$
|
739.2
|
|
$
|
3,816.8
|
|
$
|
724.1
|
|
$
|
1,322.4
|
|
$
|
32.7
|
|
$
|
98.3
|
|
||||||
|
Construction Products Group
|
546.1
|
|
5.6
|
|
551.7
|
|
65.4
|
|
459.3
|
|
22.7
|
|
37.1
|
|
|||||||||||||
|
Inland Barge Group
|
638.5
|
|
—
|
|
638.5
|
|
114.4
|
|
177.1
|
|
9.3
|
|
9.7
|
|
|||||||||||||
|
Energy Equipment Group
|
796.0
|
|
196.3
|
|
992.3
|
|
108.1
|
|
1,160.0
|
|
33.0
|
|
56.0
|
|
|||||||||||||
|
Railcar Leasing and Management Services Group
|
1,106.4
|
|
11.9
|
|
1,118.3
|
|
516.3
|
|
4,972.1
|
|
130.0
|
|
245.3
|
|
|||||||||||||
|
All Other
|
5.4
|
|
105.0
|
|
110.4
|
|
(25.6
|
)
|
56.3
|
|
9.6
|
|
9.3
|
|
|||||||||||||
|
Segment Totals before Eliminations and Corporate
|
6,170.0
|
|
1,058.0
|
|
7,228.0
|
|
1,502.7
|
|
8,147.2
|
|
237.3
|
|
455.7
|
|
|||||||||||||
|
Corporate
|
—
|
|
—
|
|
—
|
|
(119.0
|
)
|
1,147.1
|
|
7.4
|
|
8.9
|
|
|||||||||||||
|
Eliminations – Lease subsidiary
|
—
|
|
(710.1
|
)
|
(710.1
|
)
|
(133.1
|
)
|
(557.2
|
)
|
—
|
|
—
|
|
|||||||||||||
|
Eliminations – Other
|
—
|
|
(347.9
|
)
|
(347.9
|
)
|
0.4
|
|
(3.3
|
)
|
(0.1
|
)
|
—
|
|
|||||||||||||
|
Consolidated Total
|
$
|
6,170.0
|
|
$
|
—
|
|
$
|
6,170.0
|
|
$
|
1,251.0
|
|
$
|
8,733.8
|
|
$
|
244.6
|
|
$
|
464.6
|
|
||||||
Year Ended
December 31, 2013
|
|
Revenues
|
Operating Profit (Loss)
|
Assets
|
Depreciation & Amortization
|
Capital Expenditures
|
||||||||||||||||||||||
|
|
External
|
Intersegment
|
Total
|
||||||||||||||||||||||||
|
|
(in millions)
|
||||||||||||||||||||||||||
|
Rail Group
|
$
|
2,093.5
|
|
$
|
774.0
|
|
$
|
2,867.5
|
|
$
|
489.7
|
|
$
|
1,063.9
|
|
$
|
27.2
|
|
$
|
42.4
|
|
||||||
|
Construction Products Group
|
508.6
|
|
16.4
|
|
525.0
|
|
52.6
|
|
459.9
|
|
20.9
|
|
17.1
|
|
|||||||||||||
|
Inland Barge Group
|
576.6
|
|
0.1
|
|
576.7
|
|
96.0
|
|
170.3
|
|
8.1
|
|
18.4
|
|
|||||||||||||
|
Energy Equipment Group
|
536.5
|
|
128.9
|
|
665.4
|
|
61.4
|
|
364.3
|
|
18.2
|
|
41.5
|
|
|||||||||||||
|
Railcar Leasing and Management Services Group
|
645.4
|
|
—
|
|
645.4
|
|
296.8
|
|
5,026.9
|
|
129.0
|
|
581.1
|
|
|||||||||||||
|
All Other
|
4.7
|
|
81.9
|
|
86.6
|
|
(13.7
|
)
|
49.8
|
|
3.7
|
|
4.4
|
|
|||||||||||||
|
Segment Totals before Eliminations and Corporate
|
4,365.3
|
|
1,001.3
|
|
5,366.6
|
|
982.8
|
|
7,135.1
|
|
207.1
|
|
704.9
|
|
|||||||||||||
|
Corporate
|
—
|
|
—
|
|
—
|
|
(73.4
|
)
|
731.0
|
|
4.5
|
|
26.1
|
|
|||||||||||||
|
Eliminations – Lease subsidiary
|
—
|
|
(756.5
|
)
|
(756.5
|
)
|
(135.4
|
)
|
(549.7
|
)
|
—
|
|
—
|
|
|||||||||||||
|
Eliminations – Other
|
—
|
|
(244.8
|
)
|
(244.8
|
)
|
(1.1
|
)
|
(3.0
|
)
|
(0.1
|
)
|
—
|
|
|||||||||||||
|
Consolidated Total
|
$
|
4,365.3
|
|
$
|
—
|
|
$
|
4,365.3
|
|
$
|
772.9
|
|
$
|
7,313.4
|
|
$
|
211.5
|
|
$
|
731.0
|
|
||||||
Year Ended
December 31, 2012
|
|
Revenues
|
Operating Profit (Loss)
|
Assets
|
Depreciation & Amortization
|
Capital Expenditures
|
||||||||||||||||||||||
|
|
External
|
Intersegment
|
Total
|
||||||||||||||||||||||||
|
|
(in millions)
|
||||||||||||||||||||||||||
|
Rail Group
|
$
|
1,512.1
|
|
$
|
500.9
|
|
$
|
2,013.0
|
|
$
|
199.0
|
|
$
|
916.2
|
|
$
|
21.8
|
|
$
|
47.8
|
|
||||||
|
Construction Products Group
|
461.2
|
|
22.5
|
|
483.7
|
|
44.8
|
|
415.2
|
|
16.6
|
|
15.7
|
|
|||||||||||||
|
Inland Barge Group
|
675.2
|
|
—
|
|
675.2
|
|
124.7
|
|
154.4
|
|
7.6
|
|
15.0
|
|
|||||||||||||
|
Energy Equipment Group
|
506.0
|
|
52.6
|
|
558.6
|
|
18.2
|
|
400.1
|
|
19.0
|
|
25.2
|
|
|||||||||||||
|
Railcar Leasing and Management Services Group
|
644.4
|
|
2.7
|
|
647.1
|
|
300.9
|
|
4,538.8
|
|
120.5
|
|
352.6
|
|
|||||||||||||
|
All Other
|
13.0
|
|
68.4
|
|
81.4
|
|
(10.2
|
)
|
30.9
|
|
4.4
|
|
6.6
|
|
|||||||||||||
|
Segment Totals before Eliminations and Corporate
|
3,811.9
|
|
647.1
|
|
4,459.0
|
|
677.4
|
|
6,455.6
|
|
189.9
|
|
462.9
|
|
|||||||||||||
|
Corporate
|
—
|
|
—
|
|
—
|
|
(51.5
|
)
|
744.9
|
|
3.9
|
|
6.3
|
|
|||||||||||||
|
Eliminations – Lease subsidiary
|
—
|
|
(485.9
|
)
|
(485.9
|
)
|
(50.8
|
)
|
(446.2
|
)
|
—
|
|
—
|
|
|||||||||||||
|
Eliminations – Other
|
—
|
|
(161.2
|
)
|
(161.2
|
)
|
(0.3
|
)
|
(112.3
|
)
|
(0.1
|
)
|
—
|
|
|||||||||||||
|
Consolidated Total
|
$
|
3,811.9
|
|
$
|
—
|
|
$
|
3,811.9
|
|
$
|
574.8
|
|
$
|
6,642.0
|
|
$
|
193.7
|
|
$
|
469.2
|
|
||||||
60
Corporate assets are composed of cash and cash equivalents, short-term marketable securities, notes receivable, certain property, plant, and equipment, and other assets. Capital expenditures do not include business acquisitions.
Externally reported revenues and operating profit for our Mexico operations for the years ended
December 31, 2014
,
2013
, and
2012
are presented below. Our Canadian operations were not significant in relation to the consolidated financial statements.
|
External Revenues
|
Operating Profit
|
||||||||||||||||||||||
|
Year Ended December 31,
|
Year Ended December 31,
|
||||||||||||||||||||||
|
2014
|
2013
|
2012
|
2014
|
2013
|
2012
|
||||||||||||||||||
|
(in millions)
|
|||||||||||||||||||||||
|
Mexico
|
$
|
130.4
|
|
$
|
133.5
|
|
$
|
96.4
|
|
$
|
16.8
|
|
$
|
4.0
|
|
$
|
0.2
|
|
|||||
Total assets and long-lived assets for our Mexico operations as of
December 31, 2014
and
2013
are presented below:
|
Total Assets
|
Long-Lived Assets
|
||||||||||||||
|
December 31,
|
|||||||||||||||
|
2014
|
2013
|
2014
|
2013
|
||||||||||||
|
(in millions)
|
|||||||||||||||
|
Mexico
|
$
|
339.0
|
|
$
|
306.9
|
|
$
|
189.4
|
|
$
|
177.7
|
|
|||
61
The Company, through its wholly-owned subsidiary, TILC, formed
two
subsidiaries, TRIP Holdings and RIV 2013, for the purpose of providing railcar leasing in North America. Each of TRIP Holdings and RIV 2013 are direct, partially-owned subsidiaries of TILC and are each governed by a
seven
-member board of representatives,
two
of whom are designated by TILC. TILC is the agent of each of TRIP Holdings and RIV 2013 and as such, has been delegated the authority, power, and discretion to take certain actions on behalf of the respective companies. Each of TRIP Holdings and RIV 2013 in turn has wholly-owned subsidiaries which are the owners of railcars. These wholly-owned subsidiaries are TRIP Master Funding (wholly-owned by TRIP Holdings) and Trinity Rail Leasing 2012 LLC ("TRL 2012", wholly-owned by RIV 2013). TILC is the contractual servicer for TRIP Master Funding and TRL 2012, with the authority to manage and service each entity's owned railcars. The Company's controlling interest in each of TRIP Holdings and RIV 2013 results from its combined role as both equity member and agent/servicer. The noncontrolling interest included in the accompanying consolidated balance sheets represents the non-Trinity equity interest in these partially-owned subsidiaries. The railcars owned by TRIP Master Funding were originally acquired from the Company's Rail and Leasing Groups by TRIP Rail Leasing LLC ("TRIP Leasing"), a wholly-owned subsidiary of TRIP Holdings. TRIP Master Funding acquired the railcars from TRIP Leasing in July 2011. TRIP Leasing currently owns
no
railcars and is not expected to acquire any railcars.
TRIP Holdings and RIV 2013, through TRIP Leasing and TRL 2012, respectively, acquired railcars from the Company's Rail and Leasing Groups funded by capital contributions from TILC and third-party equity investors, and from secured borrowings. Railcars purchased from the Company by TRIP Master Funding and TRL 2012 are required to be purchased at fair value as determined by TILC and approved by the boards of representatives of TRIP Holdings and RIV 2013, respectively. The assets of each of TRIP Master Funding and TRL 2012 may only be used to satisfy the particular subsidiary's liabilities, and the creditors of each of TRIP Master Funding and TRL 2012 have recourse only to the particular subsidiary's assets. Each of TILC and the third-party equity investors receive distributions from TRIP Holdings and RIV 2013, when allowed, in proportion to its respective equity interests, and has an interest in the net assets of the partially-owned subsidiaries upon a liquidation event in the same proportion. TILC is paid fees for the services it provides to TRIP Master Funding and TRL 2012 and has the potential to earn certain incentive fees. With respect to TRIP Holdings as of
December 31, 2014
, TILC has a commitment that expires in
May 2016
to provide additional equity funding of up to
$5.7 million
for the purchase of railcars and satisfaction of certain other liabilities of TRIP Holdings. The third-party equity investors in TRIP Holdings have a similar commitment that expires in
May 2016
to provide up to
$12.9 million
of additional equity funding. TILC and the third-party equity investors may have additional commitments to provide equity funding to TRIP Holdings that expire in
May 2019
contingent upon certain returns on investment in TRIP Holdings and other conditions being met. Trinity has
no
obligation to guarantee performance under any of the partially-owned subsidiaries' (or their respective subsidiaries') debt agreements, guarantee any railcar residual values, shield any parties from losses, or guarantee minimum yields.
In May 2014, TILC and the third-party investors of TRIP Holdings contributed
$21.6 million
and
$49.6 million
, respectively, net of expenses, to TRIP Holdings. These contributions, combined with additional secured borrowings, were used to purchase additional railcar equipment from TILC. At
December 31, 2014
, the Company's carrying value of its investment in TRIP Holdings and RIV 2013 totaled
$229.1 million
representing the Company's weighted average
39%
ownership interest. The Company's investments in its partially-owned leasing subsidiaries are eliminated in consolidation.
See Note 11 Debt regarding the debt of TRIP Holdings and RIV 2013 and their respective subsidiaries.
62
The Railcar Leasing and Management Services Group owns and operates a fleet of railcars as well as provides third-party fleet management, maintenance, and leasing services. Selected consolidating financial information for the Leasing Group is as follows:
|
|
December 31, 2014
|
||||||||||||||
|
|
Leasing Group
|
|
|
||||||||||||
|
|
Wholly-
Owned
Subsidiaries
|
Partially-
Owned
Subsidiaries
|
Manufacturing/
Corporate
|
Total
|
|||||||||||
|
|
(in millions)
|
||||||||||||||
|
Cash, cash equivalents, and short-term marketable securities
|
$
|
11.9
|
|
$
|
—
|
|
$
|
951.0
|
|
$
|
962.9
|
|
|||
|
Property, plant, and equipment, net
|
$
|
2,599.2
|
|
$
|
1,999.9
|
|
$
|
861.0
|
|
$
|
5,460.1
|
|
|||
|
Net deferred profit on railcars sold to the Leasing Group
|
(557.2
|
)
|
|||||||||||||
|
Consolidated property, plant, and equipment, net
|
$
|
4,902.9
|
|
||||||||||||
|
Restricted cash
|
$
|
142.8
|
|
$
|
91.9
|
|
$
|
—
|
|
$
|
234.7
|
|
|||
|
Debt:
|
|||||||||||||||
|
Recourse
|
$
|
39.1
|
|
$
|
—
|
|
$
|
850.2
|
|
$
|
889.3
|
|
|||
|
Less: unamortized discount
|
—
|
|
—
|
|
(60.0
|
)
|
(60.0
|
)
|
|||||||
|
39.1
|
|
—
|
|
790.2
|
|
829.3
|
|
||||||||
|
Non-recourse
|
1,207.8
|
|
1,515.9
|
|
—
|
|
2,723.7
|
|
|||||||
|
Total debt
|
$
|
1,246.9
|
|
$
|
1,515.9
|
|
$
|
790.2
|
|
$
|
3,553.0
|
|
|||
|
Net deferred tax liabilities
|
$
|
658.2
|
|
$
|
0.9
|
|
$
|
(44.1
|
)
|
$
|
615.0
|
|
|||
|
|
December 31, 2013
|
||||||||||||||
|
|
Leasing Group
|
|
|
||||||||||||
|
|
Wholly-
Owned
Subsidiaries
|
Partially-
Owned
Subsidiaries
|
Manufacturing/
Corporate
|
Total
|
|||||||||||
|
|
(in millions)
|
||||||||||||||
|
Cash, cash equivalents, and short-term marketable securities
|
$
|
3.5
|
|
$
|
—
|
|
$
|
574.7
|
|
$
|
578.2
|
|
|||
|
Property, plant, and equipment, net
|
$
|
2,964.6
|
|
$
|
1,685.1
|
|
$
|
670.6
|
|
$
|
5,320.3
|
|
|||
|
Net deferred profit on railcars sold to the Leasing Group
|
(549.7
|
)
|
|||||||||||||
|
Consolidated property, plant, and equipment, net
|
$
|
4,770.6
|
|
||||||||||||
|
Restricted cash
|
$
|
183.6
|
|
$
|
77.1
|
|
$
|
—
|
|
$
|
260.7
|
|
|||
|
Debt:
|
|||||||||||||||
|
Recourse
|
$
|
42.2
|
|
$
|
—
|
|
$
|
450.9
|
|
$
|
493.1
|
|
|||
|
Less: unamortized discount
|
—
|
|
—
|
|
(74.1
|
)
|
(74.1
|
)
|
|||||||
|
42.2
|
|
—
|
|
376.8
|
|
419.0
|
|
||||||||
|
Non-recourse
|
1,314.7
|
|
1,256.1
|
|
—
|
|
2,570.8
|
|
|||||||
|
Total debt
|
$
|
1,356.9
|
|
$
|
1,256.1
|
|
$
|
376.8
|
|
$
|
2,989.8
|
|
|||
|
Net deferred tax liabilities
|
$
|
671.9
|
|
$
|
—
|
|
$
|
(32.5
|
)
|
$
|
639.4
|
|
|||
Net deferred profit on railcars sold to the Leasing Group consists of intersegment profit that is eliminated in consolidation and is, therefore, not allocated to an operating segment. See Note 5 Partially-Owned Leasing Subsidiaries and Note 11 Debt for a further discussion regarding the Company’s investment in its partially-owned leasing subsidiaries and the related indebtedness.
63
|
|
Year Ended December 31,
|
Percent Change
|
|||||||||||||||
|
|
2014
|
2013
|
2012
|
2014 versus 2013
|
2013 versus 2012
|
||||||||||||
|
($ in millions)
|
|||||||||||||||||
|
Revenues:
|
|||||||||||||||||
|
Leasing and management
|
$
|
632.0
|
|
$
|
586.9
|
|
$
|
528.5
|
|
7.7
|
%
|
11.1
|
%
|
||||
|
Sale of railcars owned one year or less at the time of sale
|
486.3
|
|
58.5
|
|
118.6
|
|
|||||||||||
|
Total revenues
|
$
|
1,118.3
|
|
$
|
645.4
|
|
$
|
647.1
|
|
73.3
|
|
(0.3
|
)
|
||||
|
Operating profit:
|
|||||||||||||||||
|
Leasing and management
|
$
|
287.9
|
|
$
|
267.3
|
|
$
|
242.6
|
|
7.7
|
|
10.2
|
|
||||
|
Railcar sales:
|
|||||||||||||||||
|
Railcars owned one year or less at the time of sale
|
136.1
|
|
9.1
|
|
24.8
|
|
|||||||||||
|
Railcars owned more than one year at the time of sale
|
92.3
|
|
20.4
|
|
33.5
|
|
|||||||||||
|
Total operating profit
|
$
|
516.3
|
|
$
|
296.8
|
|
$
|
300.9
|
|
74.0
|
|
(1.4
|
)
|
||||
|
Operating profit margin:
|
|||||||||||||||||
|
Leasing and management
|
45.6
|
%
|
45.5
|
%
|
45.9
|
%
|
|||||||||||
|
Railcar sales
|
*
|
*
|
*
|
|
|||||||||||||
|
Total operating profit margin
|
46.2
|
|
46.0
|
|
46.5
|
|
|||||||||||
|
Selected expense information
(1)
:
|
|||||||||||||||||
|
Depreciation
|
$
|
130.0
|
|
$
|
129.0
|
|
$
|
120.5
|
|
0.8
|
|
7.1
|
|
||||
|
Maintenance
|
$
|
78.9
|
|
$
|
71.5
|
|
$
|
59.4
|
|
10.3
|
|
20.4
|
|
||||
|
Rent
|
$
|
52.9
|
|
$
|
53.3
|
|
$
|
50.9
|
|
(0.8
|
)
|
4.7
|
|
||||
|
Interest:
|
|||||||||||||||||
|
External
|
$
|
153.3
|
|
$
|
153.5
|
|
$
|
161.2
|
|
||||||||
|
Intercompany
|
—
|
|
3.8
|
|
13.1
|
|
|||||||||||
|
Total interest expense
|
$
|
153.3
|
|
$
|
157.3
|
|
$
|
174.3
|
|
(2.5
|
)
|
(9.8
|
)
|
||||
* Not meaningful
(1)
Depreciation, maintenance, and rent expense are components of operating profit. Amortization of deferred profit on railcars sold from the Rail Group to the Leasing Group is included in the operating profit of the Leasing Group resulting in the recognition of depreciation expense based on the Company's original manufacturing cost of the railcars. Interest expense is not a component of operating profit and includes the effect of hedges. Intercompany interest expense is eliminated in consolidation and arises from Trinity’s previous ownership of a portion of TRIP Holdings’ Senior Secured Notes, which notes were retired in full in May 2013. See Note 11 Debt.
During the
year ended
December 31, 2014
, the Company received proceeds of
$882.7 million
from the sale of leased railcars to Element Financial Corporation ("Element") under the strategic alliance with Element announced in December 2013, including
$200.4 million
recorded as revenue by the Rail Group. From the total proceeds received from Element, the Leasing Group recorded
$446.6 million
in revenue from the sale of railcars owned one year or less at the time of sale. The remainder of the proceeds of
$235.7 million
is attributable to the sale of railcars owned more than one year at the time of sale and is, consequently, excluded from revenue. Since the inception of our alliance, the Company has received proceeds of
$987.7 million
from the sale of leased railcars to Element.
64
Equipment consists primarily of railcars leased by third parties. The Leasing Group purchases equipment manufactured predominantly by the Rail Group and enters into lease contracts with third parties with terms generally ranging between
one
and
twenty
years. The Leasing Group primarily enters into operating leases. Future contractual minimum rental revenues on leases are as follows:
|
2015
|
2016
|
2017
|
2018
|
2019
|
Thereafter
|
Total
|
|||||||||||||||||||||
|
|
(in millions)
|
||||||||||||||||||||||||||
|
Future contractual minimum rental revenues
|
$
|
462.9
|
|
$
|
388.8
|
|
$
|
319.9
|
|
$
|
248.1
|
|
$
|
168.5
|
|
$
|
227.2
|
|
$
|
1,815.4
|
|
||||||
Partially-owned subsidiaries.
Debt owed by TRIP Holdings and RIV 2013 and their respective subsidiaries is non-recourse to Trinity and TILC. Creditors of each of TRIP Holdings and RIV 2013 and their respective subsidiaries have recourse only to the particular subsidiary's assets. TRIP Master Funding equipment with a net book value of
$1,398.1 million
is pledged as collateral for the TRIP Master Funding debt. TRL 2012 equipment with a net book value of
$601.7 million
is pledged solely as collateral for the TRL 2012 secured railcar equipment notes. See Note 5 Partially-Owned Leasing Subsidiaries for a description of TRIP Holdings and RIV 2013.
Off Balance Sheet Arrangements.
In prior years, the Leasing Group completed a series of financing transactions whereby railcars were sold to one or more separate independent owner trusts (“Trusts”). Each of the Trusts financed the purchase of the railcars with a combination of debt and equity. In each transaction, the equity participant in the Trust is considered to be the primary beneficiary of the Trust and therefore, the debt related to the Trust is not included as part of the consolidated financial statements. The Leasing Group, through wholly-owned, qualified subsidiaries, leased railcars from the Trusts under operating leases with terms of
22
years, and subleased the railcars to independent third-party customers under shorter term operating rental agreements. Under the terms of the operating lease agreements between the subsidiaries and the Trusts, the Leasing Group has the option to purchase at a predetermined fixed price, certain of the railcars from the Trusts in
2016
and other railcars in
2019
. The Leasing Group also has options to purchase the railcars at the end of the respective lease agreements in
2023
,
2026
, and
2027
at the then fair market value of the railcars as determined by a third party, independent appraisal. At the expiration of the operating lease agreements, the Company has no further obligations with respect to the leased railcars.
These Leasing Group subsidiaries had total assets as of
December 31, 2014
of
$195.5 million
, including cash of
$71.1 million
and railcars of
$83.7 million
. The subsidiaries' cash, railcars, and an interest in each sublease are pledged to collateralize the lease obligations to the Trusts and are included in the consolidated financial statements of the Company. Trinity does not guarantee the performance of the subsidiaries’ lease obligations. Certain ratios and cash deposits must be maintained by the Leasing Group’s subsidiaries in order for excess cash flow, as defined in the agreements, from the lease to third parties to be available to Trinity. Future operating lease obligations of the Leasing Group’s subsidiaries as well as future contractual minimum rental revenues related to these leases due to the Leasing Group are as follows:
|
2015
|
2016
|
2017
|
2018
|
2019
|
Thereafter
|
Total
|
||||||||||||||||||||||
|
|
(in millions)
|
|||||||||||||||||||||||||||
|
Future operating lease obligations of Trusts’ railcars
|
$
|
43.0
|
|
$
|
40.0
|
|
$
|
41.8
|
|
$
|
45.2
|
|
$
|
43.5
|
|
$
|
209.7
|
|
$
|
423.2
|
|
|||||||
|
Future contractual minimum rental revenues of Trusts’ railcars
|
$
|
73.0
|
|
$
|
60.6
|
|
$
|
46.2
|
|
$
|
35.4
|
|
$
|
23.1
|
|
$
|
35.6
|
|
$
|
273.9
|
|
|||||||
In each transaction, the Leasing Group has entered into a servicing and re-marketing agreement with the Trusts that requires the Leasing Group to endeavor, consistent with customary commercial practice as would be used by a prudent person, to maintain railcars under lease for the benefit of the Trusts. The Leasing Group also receives management fees under the terms of the agreements. In each transaction, an independent trustee for the Trusts has authority for appointment of the railcar fleet manager.
65
Operating Lease Obligations.
Future amounts due as well as future contractual minimum rental revenues related to operating leases other than leases discussed above are as follows:
|
2015
|
2016
|
2017
|
2018
|
2019
|
Thereafter
|
Total
|
||||||||||||||||||||||
|
|
(in millions)
|
|||||||||||||||||||||||||||
|
Future operating lease obligations
|
$
|
13.0
|
|
$
|
12.8
|
|
$
|
12.1
|
|
$
|
12.0
|
|
$
|
9.5
|
|
$
|
28.7
|
|
$
|
88.1
|
|
|||||||
|
Future contractual minimum rental revenues
|
$
|
18.7
|
|
$
|
17.4
|
|
$
|
10.6
|
|
$
|
6.2
|
|
$
|
3.4
|
|
$
|
5.8
|
|
$
|
62.1
|
|
|||||||
Operating lease obligations totaling
$17.6 million
are guaranteed by Trinity Industries, Inc. and certain subsidiaries.
66
We use derivative instruments to mitigate the impact of changes in interest rates, both in anticipation of future debt issuances and to offset interest rate variability of certain floating rate debt issuances outstanding. We also use derivative instruments to mitigate the impact of changes in natural gas and diesel fuel prices and changes in foreign currency exchange rates. For derivative instruments designated as hedges, the Company formally documents the relationship between the derivative instrument and the hedged item, as well as the risk management objective and strategy for the use of the derivative instrument. This documentation includes linking the derivatives that are designated as fair value or cash flow hedges to specific assets or liabilities on the balance sheet, commitments, or forecasted transactions. At the time a derivative instrument is entered into, and at least quarterly thereafter, the Company assesses whether the derivative instrument is effective in offsetting the changes in fair value or cash flows of the hedged item. Any change in fair value resulting in ineffectiveness, as defined by accounting standards issued by the FASB, is recognized in current period earnings. For derivative instruments that are designated and qualify as cash flow hedges, the effective portion of the gain or loss on the derivative instrument is recorded in AOCL as a separate component of stockholders' equity and reclassified into earnings in the period during which the hedged transaction affects earnings. Trinity monitors its derivative positions and the credit ratings of its counterparties and does not anticipate losses due to counterparties' non-performance. See Note 3 Fair Value Accounting for discussion of how the Company valued its commodity hedges and interest rate swaps at
December 31, 2014
. See Note 11 Debt for a description of the Company's debt instruments.
Interest rate hedges
|
|
|
|
Included in accompanying balance sheet
at December 31, 2014 |
|||||||||||||||
|
|
Notional
Amount
|
Interest
Rate
(1)
|
Liability
|
AOCL –
loss/
(income)
|
Noncontrolling
Interest
|
|||||||||||||
|
|
(in millions, except %)
|
|||||||||||||||||
|
Expired hedges:
|
||||||||||||||||||
|
2006 secured railcar equipment notes
|
$
|
200.0
|
|
4.87
|
%
|
$
|
—
|
|
$
|
(1.3
|
)
|
$
|
—
|
|
||||
|
Promissory notes
|
$
|
370.0
|
|
5.34
|
%
|
$
|
—
|
|
$
|
1.2
|
|
$
|
—
|
|
||||
|
TRIP Holdings warehouse loan
|
$
|
788.5
|
|
3.60
|
%
|
$
|
—
|
|
$
|
10.0
|
|
$
|
13.6
|
|
||||
|
Open hedges:
|
||||||||||||||||||
|
TRIP Master Funding secured railcar equipment notes
|
$
|
56.3
|
|
2.62
|
%
|
$
|
2.0
|
|
$
|
0.8
|
|
$
|
1.1
|
|
||||
|
Promissory notes
|
$
|
387.6
|
|
4.13
|
%
|
$
|
6.4
|
|
$
|
5.3
|
|
$
|
—
|
|
||||
|
(1)
|
Weighted average fixed interest rate
|
|
|
Effect on interest expense-increase/(decrease)
|
||||||||||||||
|
|
Year Ended December 31,
|
Expected effect during next twelve months
(1)
|
|||||||||||||
|
|
2014
|
2013
|
2012
|
||||||||||||
|
|
(in millions)
|
||||||||||||||
|
Expired hedges:
|
|||||||||||||||
|
2006 secured railcar equipment notes
|
$
|
(0.3
|
)
|
$
|
(0.3
|
)
|
$
|
(0.3
|
)
|
$
|
(0.3
|
)
|
|||
|
Promissory notes
|
$
|
2.9
|
|
$
|
3.1
|
|
$
|
3.3
|
|
$
|
1.2
|
|
|||
|
TRIP Holdings warehouse loan
|
$
|
5.1
|
|
$
|
6.1
|
|
$
|
6.0
|
|
$
|
4.9
|
|
|||
|
Open hedges:
|
|||||||||||||||
|
TRIP Master Funding secured railcar equipment notes
|
$
|
1.5
|
|
$
|
1.8
|
|
$
|
2.0
|
|
$
|
1.2
|
|
|||
|
Promissory notes
|
$
|
15.4
|
|
$
|
15.8
|
|
$
|
18.4
|
|
$
|
6.4
|
|
|||
(1)
Based on the fair value of open hedges as of
December 31, 2014
During
2005
and
2006
, we entered into interest rate swap derivatives in anticipation of issuing our 2006 Secured Railcar Equipment Notes. These derivative instruments, with a notional amount of
$200.0 million
, were settled in
2006
and fixed the interest rate on a portion of the related debt issuance. These derivative instrument transactions are being accounted for as cash flow hedges with changes in the fair value of the instruments of
$4.5 million
in income recorded in AOCL through the date the related debt issuance closed in
2006
. The balance is being amortized over the term of the related debt. The effect on interest expense is due to amortization of the AOCL balance.
67
During
2006
and
2007
, we entered into interest rate swap derivatives in anticipation of issuing our Promissory Notes. These derivative instruments, with a notional amount of
$370.0 million
, were settled in
2008
and fixed the interest rate on a portion of the related debt issuance. These derivative instrument transactions are being accounted for as cash flow hedges with changes in the fair value of the instruments of
$24.5 million
recorded as a loss in AOCL through the date the related debt issuance closed in
2008
. The balance is being amortized over the term of the related debt. The effect on interest expense is due to amortization of the AOCL balance.
In
2008
, we entered into an interest rate swap derivative instrument, expiring in
2015
, to fix the variable Libor component of the Promissory Notes. This derivative instrument transaction is being accounted for as a cash flow hedge. The effect on interest expense results primarily from monthly interest settlements.
Between
2007
and
2009
, TRIP Holdings, as required by the TRIP Warehouse Loan, entered into interest rate swap derivatives, all of which qualified as cash flow hedges, to reduce the effect of changes in variable interest rates in the TRIP Warehouse Loan. In
July 2011
, these interest rate hedges were terminated in connection with the refinancing of the TRIP Warehouse Loan. Balances included in AOCL at the date the hedges were terminated are being amortized over the expected life of the new debt with
$4.9 million
of additional interest expense expected to be recognized during the
twelve
months following
December 31, 2014
. Also in
July 2011
, TRIP Holdings’ wholly-owned subsidiary, TRIP Master Funding, entered into an interest rate swap derivative instrument, expiring in
2021
, with a notional amount of
$94.1 million
to reduce the effect of changes in variable interest rates associated with the
Class A-1b
notes of the TRIP Master Funding secured railcar equipment notes. The effect on interest expense is primarily a result of monthly interest settlements.
See Note 11 Debt regarding the related debt instruments.
Other Derivatives
|
|
Effect on operating income - increase/(decrease)
|
||||||||||
|
|
Year Ended December 31,
|
||||||||||
|
|
2014
|
2013
|
2012
|
||||||||
|
|
(in millions)
|
||||||||||
|
Fuel hedges
(1)
|
$
|
(2.3
|
)
|
$
|
—
|
|
$
|
0.4
|
|
||
|
Foreign exchange hedges
(2)
|
$
|
—
|
|
$
|
—
|
|
$
|
(0.4
|
)
|
||
|
(1)
|
Included in cost of revenues in the accompanying consolidated statement of operations
|
|
(2)
|
Included in other, net in the accompanying consolidated statement of operations
|
Natural gas and diesel fuel
We maintain a program to mitigate the impact of fluctuations in the price of natural gas and diesel fuel. The intent of the program is to protect our operating profit from adverse price changes by entering into derivative instruments. For those instruments that do not qualify for hedge accounting treatment, any changes in their valuation are recorded directly to the consolidated statement of operations. The amount recorded in the consolidated balance sheet as of
December 31, 2014
for these instruments was a liability of
$2.1 million
.
Foreign exchange hedge
We enter into foreign exchange hedges to mitigate the impact on operating profit of unfavorable fluctuations in foreign currency exchange rates. The amounts recorded in the consolidated financial statements as of December 31, 2014 for these instruments were not significant. These instruments are short term with quarterly maturities and
no
remaining balance in AOCL as of
December 31, 2014
.
68
The following table summarizes the components of property, plant, and equipment as of
December 31,
2014
and
2013
.
|
December 31,
2014 |
December 31,
2013 |
||||||
|
|
(in millions)
|
||||||
|
Manufacturing/Corporate:
|
|||||||
|
Land
|
$
|
81.4
|
|
$
|
44.2
|
|
|
|
Buildings and improvements
|
548.2
|
|
463.2
|
|
|||
|
Machinery and other
|
975.7
|
|
832.5
|
|
|||
|
Construction in progress
|
76.4
|
|
79.0
|
|
|||
|
1,681.7
|
|
1,418.9
|
|
||||
|
Less accumulated depreciation
|
(820.7
|
)
|
(748.3
|
)
|
|||
|
861.0
|
|
670.6
|
|
||||
|
Leasing:
|
|||||||
|
Wholly-owned subsidiaries:
|
|||||||
|
Machinery and other
|
10.7
|
|
10.3
|
|
|||
|
Equipment on lease
|
3,189.6
|
|
3,509.1
|
|
|||
|
3,200.3
|
|
3,519.4
|
|
||||
|
Less accumulated depreciation
|
(601.1
|
)
|
(554.8
|
)
|
|||
|
2,599.2
|
|
2,964.6
|
|
||||
|
Partially-owned subsidiaries:
|
|||||||
|
Equipment on lease
|
2,261.2
|
|
1,887.2
|
|
|||
|
Less accumulated depreciation
|
(261.3
|
)
|
(202.1
|
)
|
|||
|
1,999.9
|
|
1,685.1
|
|
||||
|
Net deferred profit on railcars sold to the Leasing Group
|
(557.2
|
)
|
(549.7
|
)
|
|||
|
$
|
4,902.9
|
|
$
|
4,770.6
|
|
||
We lease certain equipment and facilities under operating leases. Future minimum rent expense on non-Leasing Group leases in each year is (in millions):
2015
-
$7.0
;
2016
-
$5.0
;
2017
-
$3.5
;
2018
-
$2.1
;
2019
-
$1.0
; and
$0.8
thereafter. See Note 6 Railcar Leasing and Management Services Group for information related to the lease agreements, future operating lease obligations, and future minimum rent expense associated with the Leasing Group.
We did not capitalize any interest expense as part of the construction of facilities and equipment during
2014
or
2013
.
We estimate the fair market value of properties no longer in use based on the location and condition of the properties, the fair market value of similar properties in the area, and the Company's experience selling similar properties in the past. As of
December 31, 2014
, the Company had non-operating plants with a net book value of
$18.4 million
. Our estimated fair value of these assets exceeds their book value.
69
Goodwill by segment is as follows:
|
December 31,
2014 |
December 31,
2013 |
||||||
|
|
(in millions)
|
||||||
|
Rail Group
|
$
|
134.6
|
|
$
|
134.6
|
|
|
|
Construction Products Group
|
128.3
|
|
126.9
|
|
|||
|
Energy Equipment Group
|
508.5
|
|
14.9
|
|
|||
|
Railcar Leasing and Management Services Group
|
1.8
|
|
1.8
|
|
|||
|
$
|
773.2
|
|
$
|
278.2
|
|
||
As of
December 31, 2014 and 2013
, the Company's annual impairment test of goodwill was completed at the reporting unit level and
no
additional impairment charges were determined to be necessary. As of
December 31, 2014
and
2013
, Rail Group goodwill is net of a 2009 impairment charge of
$325.0 million
.
The increase in the Construction Products Group and Energy Equipment Group goodwill as of
December 31, 2014
is due to acquisition activities during the
twelve months ended
December 31, 2014
, including the acquisition of Meyer. See Note 2 Acquisitions and Divestitures.
The changes in the accruals for warranties for the years ended
December 31, 2014, 2013, and 2012
are as follows:
|
|
December 31, 2014
|
December 31, 2013
|
December 31, 2012
|
||||||||
|
|
(in millions)
|
||||||||||
|
Beginning balance
|
$
|
14.7
|
|
$
|
12.5
|
|
$
|
13.5
|
|
||
|
Warranty costs incurred
|
(6.1
|
)
|
(5.9
|
)
|
(5.9
|
)
|
|||||
|
Warranty originations and revisions
|
12.6
|
|
11.9
|
|
7.7
|
|
|||||
|
Warranty expirations
|
(3.4
|
)
|
(3.8
|
)
|
(2.8
|
)
|
|||||
|
Ending balance
|
$
|
17.8
|
|
$
|
14.7
|
|
$
|
12.5
|
|
||
70
The following table summarizes the components of debt as of
December 31, 2014
and
2013
:
|
December 31,
2014 |
December 31,
2013 |
||||||
|
|
(in millions)
|
||||||
|
Corporate – Recourse:
|
|||||||
|
Revolving credit facility
|
$
|
—
|
|
$
|
—
|
|
|
|
Senior notes, net of unamortized discount of $0.4 and $-
|
399.6
|
|
—
|
|
|||
|
Convertible subordinated notes, net of unamortized discount of $59.6 and $74.1
|
389.9
|
|
375.9
|
|
|||
|
Other
|
0.7
|
|
0.9
|
|
|||
|
790.2
|
|
376.8
|
|
||||
|
Leasing – Recourse:
|
|||||||
|
Capital lease obligations
|
39.1
|
|
42.2
|
|
|||
|
Total recourse debt
|
829.3
|
|
419.0
|
|
|||
|
Leasing – Non-recourse:
|
|||||||
|
Wholly-owned subsidiaries:
|
|||||||
|
2006 secured railcar equipment notes
|
223.0
|
|
240.7
|
|
|||
|
Promissory notes
|
363.9
|
|
396.1
|
|
|||
|
2009 secured railcar equipment notes
|
188.8
|
|
199.0
|
|
|||
|
2010 secured railcar equipment notes
|
311.5
|
|
326.9
|
|
|||
|
TILC warehouse facility
|
120.6
|
|
152.0
|
|
|||
|
1,207.8
|
|
1,314.7
|
|
||||
|
Partially-owned subsidiaries:
|
|||||||
|
TRL 2012 secured railcar equipment notes (RIV 2013)
|
472.2
|
|
499.3
|
|
|||
|
TRIP Master Funding secured railcar equipment notes
|
1,043.7
|
|
756.8
|
|
|||
|
1,515.9
|
|
1,256.1
|
|
||||
|
Total non–recourse debt
|
2,723.7
|
|
2,570.8
|
|
|||
|
Total debt
|
$
|
3,553.0
|
|
$
|
2,989.8
|
|
|
Corporate
We have a
$425.0 million
unsecured revolving credit facility that matures on
October 20, 2016
. As of
December 31, 2014
, we had letters of credit issued under our revolving credit facility in an aggregate principal amount of
$88.6 million
, leaving
$336.4 million
available for borrowing. Other than these letters of credit, there were
no
borrowings under our revolving credit facility as of
December 31, 2014
, or for the
twelve
month period then ended. Of the outstanding letters of credit as of
December 31, 2014
, a total of
$88.5 million
is expected to expire in
2015
and the remainder in
2016
. The majority of our letters of credit obligations support the Company’s various insurance programs and generally renew each year. Trinity’s revolving credit facility requires the maintenance of ratios related to minimum interest coverage for the leasing and manufacturing operations and maximum leverage. As of
December 31, 2014
, we were in compliance with all such financial covenants. Borrowings under the credit facility bear interest at
Libor
plus
1.50%
or
prime
plus
0.50%
and are guaranteed by certain 100%-owned subsidiaries of the Company.
The Company's
$450.0 million
of Convertible Subordinated Notes due
2036
(“Convertible Subordinated Notes”) bear an interest rate of
3 7/8%
per annum on the principal amount payable semi-annually in arrears on
June 1
and
December 1
of each year. In addition, commencing with the
six
-month period beginning
June 1, 2018
and for each
six
-month period thereafter, we will pay contingent interest to the holders of the Convertible Subordinated Notes under certain circumstances. The Convertible Subordinated Notes mature on
June 1, 2036
, unless redeemed, repurchased, or converted earlier. We may not redeem the Convertible Subordinated Notes before
June 1, 2018
. On or after that date, we may redeem all or part of the Convertible Subordinated Notes for cash
at 100% of the principal amount of the notes to be redeemed, plus accrued and unpaid interest (including any contingent interest) up to, but excluding, the redemption date
. Holders of the Convertible Subordinated Notes may require us to purchase all or a portion of their notes on
June 1, 2018
or upon a fundamental change. In each case, the Convertible Subordinated Notes would be purchased for cash at a price equal to
100%
of the principal amount of the notes to be purchased plus any accrued and unpaid interest (including any contingent interest) up to, but excluding, the purchase date.
71
The Convertible Subordinated Notes are recorded net of unamortized discount to reflect their underlying economics by capturing the value of the conversion option as borrowing costs. As of
December 31, 2014
and
2013
, capital in excess of par value included
$92.5 million
and
$92.8 million
, respectively, related to the estimated value of the Convertible Subordinated Notes’ conversion options, in accordance with ASC 470-20. Debt discount recorded in the consolidated balance sheet is being amortized through
June 1, 2018
to yield an effective annual interest rate of
8.42%
based upon the estimated market interest rate for comparable non-convertible debt as of the issuance date of the Convertible Subordinated Notes. Total interest expense recognized on the Convertible Subordinated Notes for the years ended
December 31, 2014
,
2013
, and
2012
, is as follows:
|
|
Year Ended December 31,
|
||||||||||
|
|
2014
|
2013
|
2012
|
||||||||
|
|
(in millions)
|
||||||||||
|
Coupon rate interest
|
$
|
17.4
|
|
$
|
17.4
|
|
$
|
17.4
|
|
||
|
Amortized debt discount
|
14.5
|
|
13.4
|
|
12.3
|
|
|||||
|
$
|
31.9
|
|
$
|
30.8
|
|
$
|
29.7
|
|
|||
Holders of the Convertible Subordinated Notes may convert their notes under the following circumstances: 1) if the daily closing price of our common stock is greater than or equal to
130%
of the conversion price during
20
of the last
30
trading days of the preceding calendar quarter; 2) upon notice of redemption; or 3) upon the occurrence of specified corporate transactions pursuant to the terms of the applicable indenture. Upon conversion, the Company is required to pay cash up to the aggregate principal amount of the Convertible Subordinated Notes to be converted. Any conversion obligation in excess of the aggregate principal amount of the Convertible Subordinated Notes to be converted may be settled in cash, shares of the Company’s common stock, or a combination of cash and shares of the Company’s common stock, at the Company’s election. The conversion price, which is subject to adjustment upon the occurrence of certain events, was
$25.22
per share as of
December 31, 2014
. The Convertible Subordinated Notes were not subject to conversion as of January 1, 2015. See Note 17 Earnings Per Common Share for an explanation of the effects of the Convertible Subordinated Notes on earnings per share. The Company has not entered into any derivatives transactions associated with these notes.
In September 2014, the Company issued
$400.0 million
aggregate principal amount of
4.55%
senior notes ("Senior Notes") due
October 2024
. Interest on the Senior Notes is payable semiannually commencing April 1, 2015. The Senior Notes rank senior to existing and future subordinated debt including the Company's Convertible Subordinated Notes and rank equal to existing and future senior indebtedness, including the Company's revolving credit facility. The Senior Notes are subordinated to all the Company's existing and future secured debt to the extent of the value of the collateral securing such indebtedness. The Senior Notes contain covenants that limit our ability and/or certain subsidiaries' ability to create or permit to exist certain liens; enter into sale and leaseback transactions; and consolidate, merge, or transfer all or substantially all of our assets. The Company’s Senior Notes are fully and unconditionally and jointly and severally guaranteed by each of Trinity’s domestic subsidiaries that is a guarantor under the Company's revolving credit facility. See Note 19 Financial Statements for Guarantors of the Senior Notes.
Wholly-owned leasing subsidiaries
In
May 2006
, Trinity Rail Leasing V, L.P., a limited partnership (“TRL V”) and a limited purpose, indirect wholly-owned subsidiary of the Company owned through TILC issued
$355.0 million
in aggregate principal amount of Secured Railcar Equipment Notes, Series
2006
-1A (the “
2006
Secured Railcar Equipment Notes”), of which
$223.0 million
was outstanding as of
December 31, 2014
. The
2006
Secured Railcar Equipment Notes were issued pursuant to a Master Indenture, dated
May 24, 2006
, between TRL V and Wilmington Trust Company, as indenture trustee. The
2006
Secured Railcar Equipment Notes bear interest at a fixed rate of
5.90%
per annum, are payable monthly, and have a final maturity of
May 14, 2036
. The
2006
Secured Railcar Equipment Notes are obligations of TRL V and are non-recourse to Trinity. The obligations are secured by a portfolio of railcars and operating leases thereon, certain cash reserves, and other assets acquired and owned by TRL V.
In
May 2008
, Trinity Rail Leasing VI LLC, a Delaware limited liability company (“TRL VI”) and a limited purpose, indirect wholly-owned subsidiary of the Company owned through TILC issued
$572.2 million
of
30
-year promissory notes (the “Promissory Notes”) to financial institutions, of which
$363.9 million
was outstanding as of
December 31, 2014
. The Promissory Notes are secured by a portfolio of railcars and operating leases thereon, certain cash reserves, and other assets acquired and owned by TRL VI. The Promissory Notes are obligations of TRL VI and are non-recourse to Trinity. The Promissory Notes bear interest at a floating rate of
one
-month
Libor
plus a margin of
1.50%
. The
Libor
portion of the interest rate on the Promissory Notes is fixed at
4.13%
for the first
seven
years from the date of issuance of the Promissory Notes through interest rate swaps. The interest rate margin on the Promissory Notes will increase by
0.50%
on each of the
seventh
and
eighth
anniversary dates of the issuance of the Promissory Notes, and by an additional
2.00%
on the
tenth
anniversary date of the issuance of the Promissory Notes. The Promissory Notes may be prepaid at any time.
72
In
November 2009
, Trinity Rail Leasing VII LLC, a Delaware limited liability company (“TRL VII”) and a limited purpose, indirect wholly-owned subsidiary of the Company owned through TILC, issued
$238.3 million
in aggregate principal amount of Secured Railcar Equipment Notes, Series
2009
-1 (“the
2009
Secured Railcar Equipment Notes”), of which
$188.8 million
was outstanding as of
December 31, 2014
. The
2009
Secured Railcar Equipment Notes were issued pursuant to a Master Indenture, dated
November 5, 2009
between TRL VII and Wilmington Trust Company, as indenture trustee. The
2009
Secured Railcar Equipment Notes bear interest at a fixed rate of
6.66%
per annum, are payable monthly, and have a final maturity date of
November 16, 2039
. The
2009
Secured Railcar Equipment Notes are obligations of TRL VII and are non-recourse to Trinity. The obligations are secured by a portfolio of railcars and operating leases thereon, certain cash reserves, and other assets acquired and owned by TRL VII.
In
October 2010
, Trinity Rail Leasing
2010
LLC, a Delaware limited liability company ("TRL
2010
") and a limited purpose, indirect wholly-owned subsidiary of the Company owned through TILC, issued
$369.2 million
in aggregate principal amount of Secured Railcar Equipment Notes, Series
2010
-1 (“
2010
Secured Railcar Equipment Notes"), of which
$311.5 million
was outstanding as of
December 31, 2014
. The
2010
Secured Railcar Equipment Notes were issued pursuant to an Indenture, dated as of
October 25, 2010
between TRL
2010
and Wilmington Trust Company, as indenture trustee. The
2010
Secured Railcar Equipment Notes bear interest at a fixed rate of
5.19%
, are payable monthly, and have a stated final maturity date of
October 16, 2040
. The
2010
Secured Railcar Equipment Notes are obligations of TRL
2010
and are non-recourse to Trinity. The obligations are secured by a portfolio of railcars and operating leases thereon, certain cash reserves, and other assets acquired and owned by TRL
2010
.
The
$475.0 million
TILC warehouse loan facility, established to finance railcars owned by TILC, had
$120.6 million
outstanding with
$354.4 million
unused, of which
$334.6 million
was available as of
December 31, 2014
based on the amount of warehouse-eligible, unpledged equipment. The warehouse loan is a non-recourse obligation secured by a portfolio of railcars and operating leases, certain cash reserves, and other assets acquired and owned by the warehouse loan facility trust. The principal and interest of this indebtedness are paid from the cash flows of the underlying leases. Advances under the facility bear interest at a defined index rate plus a margin, for an all-in interest rate of
1.94%
at
December 31, 2014
. The warehouse loan facility has been renewed and extended through
June 2015
. Amounts outstanding at maturity, absent renewal, will be payable in
three
installments in
December 2015
,
June 2016
, and
December 2016
.
In
2009
, the Company entered into capital lease obligations totaling
$56.6 million
, of which
$39.1 million
was outstanding as of
December 31, 2014
. The capital lease obligations are guaranteed by the Company and certain subsidiaries and secured by railcar equipment and related leases.
Partially-owned leasing subsidiaries
In
July 2011
, TRIP Holdings issued
$175.0 million
in Senior Secured Notes (the “TRIP Holdings Senior Secured Notes”) and TRIP Master Funding, a Delaware limited liability company and limited purpose, wholly-owned subsidiary of TRIP Holdings, issued
$857.0 million
in Secured Railcar Equipment Notes (the “TRIP Master Funding Secured Railcar Equipment Notes”). The proceeds from the TRIP Holdings Senior Secured Notes and the TRIP Master Funding Secured Railcar Equipment Notes were primarily used by TRIP Master Funding to purchase all of the railcar equipment owned by TRIP Leasing. The TRIP Holdings Senior Secured Notes were repaid in full in
May 2013
. See Note 5 Partially-Owned Leasing Subsidiaries for further explanation.
The TRIP Master Funding Secured Railcar Equipment Notes consist of
three
classes with the Class A-1a notes bearing interest at
4.37%
, the Class A-1b notes bearing interest at
Libor
plus
2.50%
, and the Class A-2 notes bearing interest at
6.02%
, all payable monthly, with a final maturity date in
July 2041
. As of
December 31, 2014
, there were
$130.8 million
,
$73.9 million
, and
$509.6 million
of Class A-1a, Class A-1b, and of Class A-2 notes outstanding, respectively. In
May 2014
, TRIP Master Funding issued
$335.7 million
in aggregate principal amount of Series 2014-1 Secured Railcar Equipment Notes consisting of
two
classes with the Class A-1 notes bearing interest at
2.86%
and the Class A-2 notes bearing interest at
4.09%
, with a final maturity date of
April 2044
. As of
December 31, 2014
, there were
$108.7 million
and
$220.7 million
of Class A-1 and Class A-2 notes outstanding, respectively. The TRIP Master Funding Secured Railcar Equipment Notes and the TRIP Master Funding Series 2014-1 Secured Railcar Equipment Notes are issued pursuant to a Master Indenture dated
July 6, 2011
between TRIP Master Funding and Wilmington Trust Company, as indenture trustee; are non-recourse to Trinity, TILC, TRIP Holdings, and the other equity investors in TRIP Holdings; and are secured by TRIP Master Funding's portfolio of railcars and operating leases thereon, its cash reserves, and all other assets owned by TRIP Master Funding.
In
December 2012
, Trinity Rail Leasing
2012
LLC, a Delaware limited liability company ("TRL
2012
") and a limited purpose, indirect wholly-owned subsidiary of the Company owned through TILC, issued
$145.4 million
in aggregate principal amount of Series
2012
-1 Class A-1 Secured Railcar Equipment Notes (the "
2012
Class A-1 Notes") and
$188.4 million
in aggregate principal amount of Series
2012
-1 Class A-2 Secured Railcar Equipment Notes (the "
2012
Class A-2 Notes") and collectively with the 2012 Class A-1 Notes, the "2012 Secured Railcar Equipment Notes", of which
$111.5 million
and
$188.4 million
, respectively, were outstanding as of
December 31, 2014
. The
2012
Class A-1 Notes bear interest at a fixed rate of
2.27%
, are payable monthly, and
73
have a stated final maturity date of
January 15, 2043
. The 2012 Class A-2 Notes bear interest at a fixed rate of
3.53%
, are payable monthly, and have a stated final maturity date of
January 15, 2043
. In May 2013, TRL 2012 became a subsidiary of one of the Company's partially-owned subsidiaries, RIV 2013. See Note 5 Partially-Owned Leasing Subsidiaries for further explanation. In
August 2013
, TRL
2012
issued
$183.4 million
in aggregate principal amount of Series
2013
-1 Secured Railcar Equipment Notes of which
$172.3 million
was outstanding as of
December 31, 2014
. The
2013
-1 Secured Railcar Equipment Notes bear interest at a fixed rate of
3.9%
, are payable monthly, and have a stated final maturity date of
July 15, 2043
.
The
2012
Secured Railcar Equipment Notes and the 2013-1 Secured Railcar Equipment Notes were issued pursuant to a Master Indenture dated
December 19, 2012
between TRL
2012
and Wilmington Trust Company, as indenture trustee; are non-recourse to Trinity, TILC, RIV 2013, and the other equity investors in RIV 2013; and are secured by TRL 2012's portfolio of railcars and operating leases thereon, its cash reserves, and all other assets owned by TRL
2012
.
TRIP Master Funding and TRL 2012 are wholly-owned subsidiaries of TRIP Holdings and RIV 2013, respectively, which, in turn, are partially-owned subsidiaries of the Company, through its wholly-owned subsidiary, TILC. The Company's combined weighted average ownership interest in TRIP Holdings and RIV 2013 is
39%
. See Note 5 Partially-Owned Leasing Subsidiaries for further explanation.
The remaining principal payments under existing debt agreements as of
December 31, 2014
are as follows:
|
2015
|
2016
|
2017
|
2018
|
2019
|
Thereafter
|
||||||||||||||||||
|
|
(in millions)
|
||||||||||||||||||||||
|
Recourse:
|
|||||||||||||||||||||||
|
Corporate
|
$
|
0.2
|
|
$
|
0.2
|
|
$
|
0.3
|
|
$
|
—
|
|
$
|
—
|
|
$
|
849.5
|
|
|||||
|
Leasing – capital lease obligations (Note 6)
|
3.2
|
|
3.5
|
|
3.7
|
|
28.7
|
|
—
|
|
—
|
|
|||||||||||
|
Non-recourse – leasing (Note 6):
|
|||||||||||||||||||||||
|
2006 secured railcar equipment notes
|
18.5
|
|
21.8
|
|
24.0
|
|
25.3
|
|
28.0
|
|
105.4
|
|
|||||||||||
|
Promissory notes
|
25.5
|
|
338.4
|
|
—
|
|
—
|
|
—
|
|
—
|
|
|||||||||||
|
2009 secured railcar equipment notes
|
9.6
|
|
6.5
|
|
6.3
|
|
6.5
|
|
11.2
|
|
148.7
|
|
|||||||||||
|
2010 secured railcar equipment notes
|
15.3
|
|
14.9
|
|
13.7
|
|
10.0
|
|
7.6
|
|
250.0
|
|
|||||||||||
|
TILC warehouse facility
|
4.0
|
|
3.6
|
|
—
|
|
—
|
|
—
|
|
—
|
|
|||||||||||
|
TRL 2012 secured railcar equipment notes (RIV 2013)
|
23.2
|
|
22.3
|
|
22.9
|
|
23.1
|
|
22.2
|
|
358.5
|
|
|||||||||||
|
TRIP Master Funding secured railcar equipment notes
|
45.9
|
|
39.8
|
|
29.2
|
|
41.8
|
|
50.1
|
|
836.9
|
|
|||||||||||
|
Facility termination payments - TILC warehouse facility
|
37.7
|
|
75.3
|
—
|
|
—
|
|
—
|
|
—
|
|
||||||||||||
|
Total principal payments
|
$
|
183.1
|
|
$
|
526.3
|
|
$
|
100.1
|
|
$
|
135.4
|
|
$
|
119.1
|
|
$
|
2,549.0
|
|
|||||
Other, net (income) expense consists of the following items:
|
|
Year Ended December 31,
|
||||||||||
|
|
2014
|
2013
|
2012
|
||||||||
|
|
(in millions)
|
||||||||||
|
Foreign currency exchange transactions
|
$
|
(1.2
|
)
|
$
|
0.3
|
|
$
|
(2.3
|
)
|
||
|
Gain on equity investments
|
(0.8
|
)
|
(0.3
|
)
|
(0.4
|
)
|
|||||
|
Other
|
(2.6
|
)
|
(2.8
|
)
|
(1.6
|
)
|
|||||
|
Other, net
|
$
|
(4.6
|
)
|
$
|
(2.8
|
)
|
$
|
(4.3
|
)
|
||
Other for the years ended
December 31, 2013
and
2012
includes
$1.7 million
and
$0.3 million
in income, respectively, related to the change in fair value of certain equity repurchase agreements with an investor in TRIP Holdings. These agreements were terminated in March 2013.
74
The components of the provision for income taxes from continuing operations are as follows:
|
Year Ended December 31,
|
|||||||||||
|
2014
|
2013
|
2012
|
|||||||||
|
(in millions)
|
|||||||||||
|
Current:
|
|||||||||||
|
Federal
|
$
|
322.7
|
|
$
|
141.8
|
|
$
|
(5.7
|
)
|
||
|
State
|
19.4
|
|
13.7
|
|
7.0
|
|
|||||
|
Foreign
|
18.5
|
|
3.1
|
|
6.4
|
|
|||||
|
Total current
|
360.6
|
|
158.6
|
|
7.7
|
|
|||||
|
Deferred:
|
|||||||||||
|
Federal
|
(4.0
|
)
|
44.3
|
|
126.6
|
|
|||||
|
State
|
1.2
|
|
2.3
|
|
3.2
|
|
|||||
|
Foreign
|
(3.0
|
)
|
(0.8
|
)
|
(3.5
|
)
|
|||||
|
Total deferred
|
(5.8
|
)
|
45.8
|
|
126.3
|
|
|||||
|
Provision
|
$
|
354.8
|
|
$
|
204.4
|
|
$
|
134.0
|
|
||
The provision for income taxes results in effective tax rates that differ from the statutory rates. The following is a reconciliation between the statutory U.S. Federal income tax rate and the Company’s effective income tax rate on income from continuing operations:
|
Year Ended December 31,
|
||||||||
|
|
2014
|
2013
|
2012
|
|||||
|
Statutory rate
|
35.0
|
%
|
35.0
|
%
|
35.0
|
%
|
||
|
State taxes
|
1.4
|
|
2.1
|
|
2.0
|
|
||
|
Domestic production activities deduction
|
(2.0
|
)
|
(1.4
|
)
|
—
|
|
||
|
Noncontrolling interest in partially-owned subsidiaries
|
(1.1
|
)
|
(0.9
|
)
|
—
|
|
||
|
Tax assessments and settlements
|
—
|
|
—
|
|
(0.6
|
)
|
||
|
Changes in valuation allowances and reserves
|
0.1
|
|
(0.8
|
)
|
(1.4
|
)
|
||
|
Other, net
|
(0.1
|
)
|
0.6
|
|
(0.3
|
)
|
||
|
Effective rate
|
33.3
|
%
|
34.6
|
%
|
34.7
|
%
|
||
Income from continuing operations before income taxes for the
years ended
December 31, 2014
,
2013
, and
2012
was
$1,051.4 million
,
$571.2 million
, and
$376.3 million
, respectively, for U.S. operations, and
$12.6 million
,
$19.3 million
, and
$9.6 million
, respectively, for foreign operations, principally Mexico. The Company provides deferred income taxes on the un-repatriated earnings of its foreign operations where it results in a deferred tax liability. Our effective tax rate reflects the current tax benefit available for U.S. manufacturing activity.
In May 2013, TRIP Holdings and RIV 2013 elected to be treated as partnerships for income tax purposes and consequently no income tax expense has been provided with respect to income earned after this election attributable to the noncontrolling interests. See Note 5 Partially-Owned Leasing Subsidiaries for a further explanation of activities with respect to TRIP Holdings and RIV 2013.
During 2013, and after the filing of its 2012 Federal income tax return, the Company determined that it would utilize previously reserved foreign tax credits on its 2013 Federal income tax return which were due to expire in 2014-2016. Accordingly, the related
$6.4 million
valuation allowance was reversed and recorded as an income tax benefit during 2013. During the
year ended
December 31, 2013
, the Company completed a review of its state tax filing positions based upon the current operational footprint. As a result of this review, we recorded a charge of
$5.1 million
in order to adjust our overall net deferred tax liability based upon our current state tax filing responsibilities.
Deferred income taxes represent the tax effects of temporary differences between the carrying amounts of assets and liabilities for financial reporting purposes and the amounts used for income tax purposes. The components of deferred tax liabilities and assets are as follows:
75
|
December 31,
|
|||||||
|
2014
|
2013
|
||||||
|
(in millions)
|
|||||||
|
Deferred tax liabilities:
|
|||||||
|
Depreciation, depletion, and amortization
|
$
|
627.1
|
|
$
|
668.9
|
|
|
|
Accrued liabilities and other
|
97.6
|
|
48.3
|
|
|||
|
Convertible debt
|
114.8
|
|
105.4
|
|
|||
|
Total deferred tax liabilities
|
839.5
|
|
822.6
|
|
|||
|
Deferred tax assets:
|
|||||||
|
Workers compensation, pensions, and other benefits
|
68.6
|
|
61.3
|
|
|||
|
Warranties and reserves
|
12.3
|
|
13.8
|
|
|||
|
Equity items
|
53.3
|
|
33.4
|
|
|||
|
Tax loss carryforwards and credits
|
25.1
|
|
27.5
|
|
|||
|
Inventory
|
29.2
|
|
18.8
|
|
|||
|
Total deferred tax assets
|
188.5
|
|
154.8
|
|
|||
|
Net deferred tax liabilities before valuation allowances
|
651.0
|
|
667.8
|
|
|||
|
Valuation allowances
|
9.6
|
|
10.2
|
|
|||
|
Net deferred tax liabilities before reserve for uncertain tax positions
|
660.6
|
|
678.0
|
|
|||
|
Deferred tax assets included in reserve for uncertain tax positions
|
(45.6
|
)
|
(38.6
|
)
|
|||
|
Adjusted net deferred tax liabilities
|
$
|
615.0
|
|
$
|
639.4
|
|
|
At
December 31, 2014
, the Company had
$33.5 million
of Federal consolidated net operating loss carryforwards and
$3.6 million
of tax-effected state loss carryforwards remaining. The Federal net operating loss carryforwards were acquired as part of an acquisition of a company in 2010 and are subject to limitations on the amount that can be utilized in any one tax year. The Federal net operating loss carryforwards are due to expire in
2028
and
2029
. We have established a valuation allowance for Federal, state, and foreign tax operating losses and credits which we have estimated may not be realizable.
Taxing authority examinations
The IRS field work for our
2006-2008
audit cycle has concluded and all issues, except for transfer pricing, have been agreed upon and tentatively settled. The transfer pricing issue has been appealed and we are working with both the U.S. and Mexican taxing authorities to coordinate taxation in a formal mutual agreement process (“MAP”). During 2013, we received the revenue agent report for the
2009-2011
audit cycle. All issues have been concluded and agreed to except for transfer pricing issues. The transfer pricing issues have been appealed and we have requested they be addressed in the same MAP as the
2006-2008
cycle. At this time, we cannot determine when the
2006-2008
or the
2009-2011
cycle will close and all issues formally settled.
We have various subsidiaries in Mexico that file separate tax returns and are subject to examination by taxing authorities at different times. The
2007
tax year of one of our Mexican subsidiaries is still under review for transfer pricing purposes only, and its statute of limitations remains open through the later of the resolution of the MAP or
August 2017
. During the third of quarter of 2014, we received notification that one of our Mexican entities is now under audit for its 2011 tax year. The remaining entities are generally open for their
2009
tax years and forward.
Our
two
Swiss subsidiaries,
one
of which is a holding company and the other of which is dormant, have been audited by the taxing authorities through
2008 and 2009
, respectively. The statute of limitations in Switzerland is generally
five
years from the end of the tax year, but can be extended up to
15
years in certain cases if the audit has commenced during the original
five
year period. We also currently have sales offices in Europe, Canada, and South America that are subject to various statutes of limitations with regard to their tax status. Generally, states’ statutes of limitations in the U.S. are open from
2003
forward due to the use of tax loss carryforwards in certain jurisdictions.
During the year ended December 31, 2012, we settled our audit with the Internal Revenue Service ("IRS") for the
2004-2005
tax years. As a result of closing this audit, we recognized a
$3.5 million
tax benefit, primarily related to favorable claims filed and approved by the IRS in the final audit settlement. Additionally, we recognized a tax benefit of
$4.4 million
due to the release of net tax reserves primarily as a result of certain state tax issues where the statute of limitations had lapsed.
76
Unrecognized tax benefits
The change in unrecognized tax benefits for the years ended
December 31, 2014
,
2013
, and
2012
was as follows:
|
Year Ended December 31,
|
|||||||||||
|
|
2014
|
2013
|
2012
|
||||||||
|
|
(in millions)
|
||||||||||
|
Beginning balance
|
$
|
55.0
|
|
$
|
48.7
|
|
$
|
52.5
|
|
||
|
Additions for tax positions related to the current year
|
5.0
|
|
4.8
|
|
4.1
|
|
|||||
|
Additions for tax positions of prior years
|
2.5
|
|
2.8
|
|
—
|
|
|||||
|
Reductions for tax positions of prior years
|
(0.1
|
)
|
—
|
|
(1.1
|
)
|
|||||
|
Settlements
|
—
|
|
(0.3
|
)
|
(3.4
|
)
|
|||||
|
Expiration of statute of limitations
|
(0.1
|
)
|
(1.0
|
)
|
(3.4
|
)
|
|||||
|
Ending balance
|
$
|
62.3
|
|
$
|
55.0
|
|
$
|
48.7
|
|
||
Additions for tax positions related to the current year for
2014
were amounts provided for tax positions that will be taken for Federal and state income tax purposes when we file the tax return. Additions for tax positions related to the current year for
2013
and
2012
were amounts provided for tax positions taken for Federal, state, and Mexican income tax purposes.
Additions for tax positions of prior years in the amount of
$2.5 million
and recorded in the current year related to federal, state, and foreign tax positions. Additions for tax positions of prior years in the amount of
$2.8 million
and recorded in 2013 were for Federal, state, and Mexican tax positions taken on the prior year tax returns which the taxing authorities have previously identified.
The reduction in tax positions of prior years of
$1.1 million
for the
twelve months ended
December 31, 2012
, was primarily related to new guidance issued in
March 2012
by the IRS regarding the capitalization of fixed assets as well as state taxes. Settlements during the
twelve months ended
December 31, 2013
relate to settled positions with the IRS for one of our subsidiaries as well as settled positions with Mexican taxing authorities in the settlement of the 2003 exam. Settlements during
2012
primarily related to the settlement of our
2004-2005
IRS audit as well as the related impact on state tax returns.
The total amount of unrecognized tax benefits including interest and penalties at
December 31, 2014
and
2013
, that would affect the Company’s overall effective tax rate if recognized was
$15.0 million
and
$13.8 million
, respectively. There is a reasonable possibility that unrecognized Federal and state tax benefits will
decrease
by
$0.1 million
by
December 31, 2015
due to settlements and lapses in statutes of limitations for assessing tax. During 2013, we entered into an agreement with the IRS to extend the statute of limitations to assess tax on our
2006-2011
tax years. At this time, we are unable to determine when those years will be effectively settled.
Trinity accounts for interest expense and penalties related to income tax issues as income tax expense. Accordingly, interest expense and penalties associated with an uncertain tax position are included in the income tax provision. The total amount of accrued interest and penalties as of
December 31, 2014
and
2013
was
$11.6 million
and
$10.8 million
, respectively. Income tax expense for the
years ended
December 31, 2014
,
2013
, and
2012
included an
increase
of
$0.8 million
, an
increase
of
$0.5 million
, and a
decrease
of
$3.0 million
, respectively, with regard to interest expense and penalties related to uncertain tax positions.
77
The Company sponsors defined benefit plans and defined contribution profit sharing plans that provide retirement income and death benefits for eligible employees. The annual measurement date of the benefit obligations, fair value of plan assets, and funded status is December 31.
Actuarial assumptions
|
Year Ended December 31,
|
|||||
|
2014
|
2013
|
2012
|
|||
|
Assumptions used to determine benefit obligations at the annual measurement date were:
|
|||||
|
Obligation discount rate
|
4.33%
|
5.22%
|
4.25%
|
||
|
Compensation increase rate
|
4.00%
|
4.00%
|
4.00%
|
||
|
Assumptions used to determine net periodic benefit costs were:
|
|||||
|
Obligation discount rate
|
5.22%
|
4.25%
|
5.40%
|
||
|
Long-term rate of return on plan assets
|
7.75%
|
7.75%
|
7.75%
|
||
|
Compensation increase rate
|
4.00%
|
4.00%
|
3.00%
|
||
The obligation discount rate assumption is determined by deriving a single discount rate from a theoretical settlement portfolio of high quality corporate bonds sufficient to provide for the plans' projected benefit payments. The expected long-term rate of return on the plans' assets is an assumption reflecting the anticipated weighted average rate of earnings on the portfolio over the long-term. To arrive at this rate, estimates were developed based upon the anticipated performance of the plans' assets. The compensation increase rate pertains solely to the pension plan of the Company's Inland Barge segment, which was closed to new participants in 2014. The accrued benefits of the Company's remaining pension plans were frozen in 2009.
Components of net retirement cost
|
Year Ended December 31,
|
|||||||||||
|
2014
|
2013
|
2012
|
|||||||||
|
(in millions)
|
|||||||||||
|
Expense Components
|
|||||||||||
|
Service cost
|
$
|
0.5
|
|
$
|
1.1
|
|
$
|
0.9
|
|
||
|
Interest
|
20.2
|
|
18.5
|
|
19.4
|
|
|||||
|
Expected return on plan assets
|
(31.0
|
)
|
(26.6
|
)
|
(22.9
|
)
|
|||||
|
Amortization of actuarial loss
|
2.1
|
|
4.9
|
|
3.2
|
|
|||||
|
Prior service cost
|
—
|
|
0.1
|
|
0.1
|
|
|||||
|
Defined benefit expense
|
(8.2
|
)
|
(2.0
|
)
|
0.7
|
|
|||||
|
Profit sharing
|
17.4
|
|
12.3
|
|
11.9
|
|
|||||
|
Multiemployer plan
|
0.8
|
|
—
|
|
—
|
|
|||||
|
Net expense
|
$
|
10.0
|
|
$
|
10.3
|
|
$
|
12.6
|
|
||
The expected return on plan assets is based on the plan assets' fair value. Amortization of actuarial loss is determined using the corridor method. Under the corridor method, unamortized actuarial gains or losses in excess of 10% of the greater of the projected benefit obligation or the fair value of plan assets as of the beginning of the plan year, are amortized, for frozen plans, over the average expected remaining lifetime of frozen and inactive participants. Substantially all of the Company's defined benefit plans were frozen as of
December 31, 2014
.
78
Obligations and funded status
|
Year Ended December 31,
|
|||||||
|
2014
|
2013
|
||||||
|
(in millions)
|
|||||||
|
Accumulated Benefit Obligations
|
$
|
473.8
|
|
$
|
392.1
|
|
|
|
Projected Benefit Obligations:
|
|||||||
|
Beginning of year
|
$
|
392.1
|
|
$
|
442.5
|
|
|
|
Service cost
|
0.5
|
|
1.1
|
|
|||
|
Interest
|
20.2
|
|
18.5
|
|
|||
|
Benefits paid
|
(16.4
|
)
|
(15.8
|
)
|
|||
|
Actuarial (gain)/loss
|
77.6
|
|
(54.2
|
)
|
|||
|
Curtailment
|
(0.1
|
)
|
—
|
|
|||
|
End of year
|
$
|
473.9
|
|
$
|
392.1
|
|
|
|
Plans' Assets:
|
|||||||
|
Beginning of year
|
$
|
399.2
|
|
$
|
340.1
|
|
|
|
Actual return on assets
|
36.7
|
|
56.0
|
|
|||
|
Employer contributions
|
15.0
|
|
18.9
|
|
|||
|
Benefits paid
|
(16.4
|
)
|
(15.8
|
)
|
|||
|
End of year
|
$
|
434.5
|
|
$
|
399.2
|
|
|
|
Consolidated Balance Sheet Components:
|
|||||||
|
Other assets
|
$
|
1.2
|
|
$
|
17.8
|
|
|
|
Accrued liabilities
|
(40.4
|
)
|
(10.7
|
)
|
|||
|
Net funded status
|
$
|
(39.4
|
)
|
$
|
7.1
|
|
|
|
Percent of projected benefit obligations funded
|
91.7
|
%
|
101.8
|
%
|
|||
No
ne of the plans' assets are expected to be returned to us during the year ending
December 31, 2015
.
Amounts recognized in other comprehensive income (loss)
|
Year Ended December 31,
|
|||||||||||
|
2014
|
2013
|
2012
|
|||||||||
|
(in millions)
|
|||||||||||
|
Actuarial gain (loss)
|
$
|
(71.9
|
)
|
$
|
83.7
|
|
$
|
(48.1
|
)
|
||
|
Amortization of actuarial loss
|
2.1
|
|
4.9
|
|
3.2
|
|
|||||
|
Amortization of prior service cost
|
—
|
|
0.1
|
|
0.1
|
|
|||||
|
Curtailment
|
0.1
|
|
—
|
|
—
|
|
|||||
|
Total before income taxes
|
(69.7
|
)
|
88.7
|
|
(44.8
|
)
|
|||||
|
Income tax expense (benefit)
|
(25.9
|
)
|
32.9
|
|
(16.7
|
)
|
|||||
|
Net amount recognized in other comprehensive income (loss)
|
$
|
(43.8
|
)
|
$
|
55.8
|
|
$
|
(28.1
|
)
|
||
Included in AOCL at
December 31, 2014
were the following amounts that have not been recognized in net periodic pension cost: prior service cost of
$0.1 million
(
$0.1 million
net of related income taxes) and unrecognized actuarial losses of
$138.1 million
(
$86.9 million
net of related income taxes).
Actuarial loss included in AOCL and expected to be recognized in net periodic pension cost for the year ended
December 31, 2015
is
$5.2 million
(
$3.3 million
net of related income taxes).
79
Plan assets
The Company's pension plan investment strategies have been developed as part of a comprehensive asset/liability management process that considers the relationship between both the assets and liabilities of the plans for the purpose of providing the capital assets necessary to meet the financial obligations made to participants of the Company's pension plans. These strategies consider not only the expected risk and returns on the plans' assets, but also the actuarial projections of liabilities, projected contributions, and funded status. During 2014, the Company revised its investment policy statement allocating its pension plan assets into two portfolios as follows:
•
Liability hedging portfolio - The objective of the liability hedging portfolio is to match the characteristics of the pension plans' liabilities. This portfolio consists primarily of investment grade long duration bonds.
•
Growth portfolio - The objective of the growth portfolio is to focus upon total return with an acceptable level of risk. This portfolio is heavily weighted toward U.S. equities with a lesser exposure to international equities, domestic real estate investment trusts, U.S. high yield and emerging market sovereign debt.
The target allocation between these two portfolios varies on a sliding scale based on the pension plans' percentage of projected benefit obligations funded ("Funding Percentage"), beginning with a 50%/50% target allocation at a Funding Percentage of less than 100% and increasing to a 100% liability hedging portfolio target allocation at a Funding Percentage exceeding 110%. The range of target asset allocations has been determined after giving consideration to the expected returns of each asset category within the two portfolios, the expected performance of each asset category, the volatility of asset returns over time, and the complementary nature of the asset mix within the portfolio. The principal pension investment strategies include asset allocation and active asset management within approved guidelines. These assets are managed by an investment advisor.
The target and actual allocations of the plans' assets at December 31,
2014
are as follows:
|
Target
Allocation
|
December 31,
2014 |
|||
|
Cash and cash equivalents
|
1
|
%
|
||
|
Liability hedging portfolio
|
50%
|
47
|
%
|
|
|
Growth portfolio
|
50%
|
52
|
%
|
|
|
Total
|
100
|
%
|
||
The estimated fair value of the plans' assets at December 31,
2014
and
2013
, indicating input levels used to determine fair value are as follows:
|
Fair Value Measurement as of December 31, 2014
|
|||||||||||||||
|
(in millions)
|
|||||||||||||||
|
Level 1
|
Level 2
|
Level 3
|
Total
|
||||||||||||
|
Temporary cash investments
|
$
|
4.8
|
|
$
|
—
|
|
$
|
—
|
|
$
|
4.8
|
|
|||
|
Debt common trust funds
|
—
|
|
275.0
|
|
—
|
|
275.0
|
|
|||||||
|
Equity common trust funds
|
—
|
|
154.7
|
|
—
|
|
154.7
|
|
|||||||
|
$
|
4.8
|
|
$
|
429.7
|
|
$
|
—
|
|
$
|
434.5
|
|
||||
|
Fair Value Measurement as of December 31, 2013
|
|||||||||||||||
|
(in millions)
|
|||||||||||||||
|
Level 1
|
Level 2
|
Level 3
|
Total
|
||||||||||||
|
Temporary cash investments
|
$
|
7.0
|
|
$
|
—
|
|
$
|
—
|
|
$
|
7.0
|
|
|||
|
Debt common trust funds
|
—
|
|
101.3
|
|
—
|
|
101.3
|
|
|||||||
|
Equity common trust funds
|
—
|
|
290.9
|
|
—
|
|
290.9
|
|
|||||||
|
$
|
7.0
|
|
$
|
392.2
|
|
$
|
—
|
|
$
|
399.2
|
|
||||
The pension plans' assets are valued at fair value. The following is a description of the valuation methodologies used in determining fair value, including the general classification of such instruments pursuant to the valuation hierarchy as described further in Note 3 Fair Value Accounting:
Temporary cash investments - These investments consist of U.S. dollars held in master trust accounts with the trustee. These temporary cash investments are classified as Level 1 instruments.
80
Common trust funds - Common trust funds are comprised of shares or units in commingled funds that are not publicly traded. The underlying assets in these funds are publicly traded on exchanges and price quotes for the assets held by these funds are readily available. Holdings of common trust funds are classified as Level 2 investments.
Multiemployer plan
As a result of the acquisition of Meyer, the Company contributes to a multiemployer defined benefit pension plan under the terms of a collective-bargaining agreement that covers certain union-represented employees at one of Meyer's facilities. The risks of participating in a multiemployer plan are different from a single-employer plan in the following aspects:
•
Assets contributed to a multiemployer plan by one employer may be used to provide benefits to employees of other participating employers.
•
If a participating employer stops contributing to a multiemployer plan, the unfunded obligations of the plan may be borne by the remaining participating employers.
•
If the Company chooses to stop participating in the multiemployer plan, the Company may be required to pay the plan an amount based on the underfunded status of the plan, referred to as a withdrawal liability.
Our participation in the multiemployer plan for the year ended December 31, 2014 is outlined in the table below. The Pension Protection Act ("PPA") zone status at December 31, 2014 and 2013 is as of the plan years ended December 31, 2013 and 2012, respectively, and is obtained from the multiemployer plan's regulatory filings available in the public domain and certified by the plan's actuary. Among other factors, plans in the yellow zone are less than 80% funded while plans in the red zone are less than 65% funded. Federal law requires that plans classified in the yellow or red zones adopt a funding improvement plan in order to improve the financial health of the plan. The plan utilized an amortization extension and the funding relief provided under the Internal Revenue Code and under the Preservation of Access to Care for Medicare Beneficiaries and Pension Relief Act in determining the zone status. The Company's contributions to the multiemployer plan were less than 5% of total contributions to the plan. The last column in the table lists the expiration date of the collective bargaining agreement to which the plan is subject.
|
PPA Zone Status
|
Contributions for Year Ended December 31,
|
|||||||||||||||||||||||
|
Pension Fund
|
Employer Identification Number
|
2014
|
2013
|
Financial improvement plan status
|
2014
|
2013
|
2012
|
Surcharge imposed
|
Expiration date of collective bargaining agreement
|
|||||||||||||||
|
(in millions)
|
||||||||||||||||||||||||
|
Boilermaker-Blacksmith National Pension Trust
|
48-6168020
|
Yellow
|
Yellow
|
Implemented
|
$
|
0.6
|
|
$
|
—
|
|
$
|
—
|
|
No
|
July 3, 2016
|
|||||||||
Cash flows
Employer contributions for the year ending
December 31, 2015
are expected to be
$19.7 million
for the defined benefit plans compared to
$15.0 million
contributed during
2014
. Employer contributions to the 401(k) plans and the Supplemental Profit Sharing Plan for the year ending
December 31, 2015
are expected to be
$16.1 million
compared to
$14.0 million
contributed during
2014
. Employer contributions for the year ending
December 31, 2015
are expected to be
$2.7 million
for the multiemployer plan compared to
$0.6 million
contributed during
2014
.
Benefit payments for the Company's defined benefit plans expected to be paid during the next ten years are as follows:
|
Year Ending December 31,
|
|||
|
(in millions)
|
|||
|
2015
|
$
|
18.5
|
|
|
2016
|
19.8
|
|
|
|
2017
|
20.9
|
|
|
|
2018
|
22.0
|
|
|
|
2019
|
24.0
|
|
|
|
2020-2024
|
133.7
|
|
|
Participants in the pension plans are eligible to receive future retirement benefits through a company-funded annual retirement contribution provided through the Profit Sharing Plan for Employees of Trinity Industries, Inc. and Certain Affiliates. The contribution ranges from
one
to
three
percent of eligible compensation based on service. Both the annual retirement contribution and the company matching contribution are discretionary, requiring board approval, and are made annually with the investment of the funds directed by the participants.
81
Changes in accumulated other comprehensive loss for the
twelve
months ended
December 31, 2014
,
2013
, and
2012
are as follows:
|
Currency translation adjustments
|
Unrealized loss on derivative financial instruments
|
Net actuarial gains/(losses) of defined benefit plans
|
Accumulated
Other
Comprehensive
Loss
|
||||||||||||
|
|
(in millions)
|
||||||||||||||
|
Balances at December 31, 2011
|
$
|
(17.1
|
)
|
$
|
(46.2
|
)
|
$
|
(70.7
|
)
|
$
|
(134.0
|
)
|
|||
|
Other comprehensive income (loss), net of tax, before reclassifications
|
—
|
|
7.2
|
|
(30.3
|
)
|
(23.1
|
)
|
|||||||
|
Amounts reclassified from accumulated other comprehensive loss, net of tax benefit of $0.4, $3.2, $1.1, and $4.7
|
0.6
|
|
5.8
|
|
2.2
|
|
8.6
|
|
|||||||
|
Less: noncontrolling interest
|
—
|
|
(1.6
|
)
|
—
|
|
(1.6
|
)
|
|||||||
|
Other comprehensive income (loss)
|
0.6
|
|
11.4
|
|
(28.1
|
)
|
(16.1
|
)
|
|||||||
|
Balances at December 31, 2012
|
(16.5
|
)
|
(34.8
|
)
|
(98.8
|
)
|
(150.1
|
)
|
|||||||
|
Other comprehensive income, net of tax, before reclassifications
|
—
|
|
0.8
|
|
52.7
|
|
53.5
|
|
|||||||
|
Amounts reclassified from accumulated other comprehensive loss, net of tax benefit of $-, $8.7, $1.9, and $10.6
|
—
|
|
18.1
|
|
3.1
|
|
21.2
|
|
|||||||
|
Less: noncontrolling interest
|
—
|
|
(4.2
|
)
|
—
|
|
(4.2
|
)
|
|||||||
|
Other comprehensive income
|
—
|
|
14.7
|
|
55.8
|
|
70.5
|
|
|||||||
|
Sale of interests in partially-owned leasing subsidiaries
|
—
|
|
13.2
|
|
—
|
|
13.2
|
|
|||||||
|
Repurchase of interests in partially-owned leasing subsidiary
|
—
|
|
(11.8
|
)
|
—
|
|
(11.8
|
)
|
|||||||
|
Balances at December 31, 2013
|
(16.5
|
)
|
(18.7
|
)
|
(43.0
|
)
|
(78.2
|
)
|
|||||||
|
Other comprehensive loss, net of tax, before reclassifications
|
(2.0
|
)
|
(1.2
|
)
|
(45.1
|
)
|
(48.3
|
)
|
|||||||
|
Amounts reclassified from accumulated other comprehensive loss, net of tax benefit of $-, $8.4, $0.8, and $9.2
|
—
|
|
16.0
|
|
1.3
|
|
17.3
|
|
|||||||
|
Less: noncontrolling interest
|
—
|
|
(3.0
|
)
|
—
|
|
(3.0
|
)
|
|||||||
|
Other comprehensive income (loss)
|
(2.0
|
)
|
11.8
|
|
(43.8
|
)
|
(34.0
|
)
|
|||||||
|
Transfer of interests in partially-owned leasing subsidiaries
|
—
|
|
0.3
|
|
—
|
|
0.3
|
|
|||||||
|
Balances at December 31, 2014
|
$
|
(18.5
|
)
|
$
|
(6.6
|
)
|
$
|
(86.8
|
)
|
$
|
(111.9
|
)
|
|||
See Note 7 Derivative Instruments for information on the reclassification of amounts in accumulated other comprehensive loss into earnings. Reclassifications of unrealized before-tax losses on derivative financial instruments are included in interest expense in the consolidated statements of operations. Approximately
$1.7 million
,
$4.0 million
, and
$2.7 million
of the before-tax reclassification of net actuarial gains/(losses) of defined benefit plans are included in cost of revenues with the remainder included in selling, engineering, and administrative expenses in the consolidated statements of operations for the
years ended
December 31, 2014
,
2013
, and
2012
, respectively.
The Company's 2004 Second Amended and Restated Stock Option and Incentive Plan (the "Plan”) provides for awarding
15,200,000
(adjusted for stock splits) shares of common stock plus (i) shares covered by forfeited, expired, and canceled options granted under prior plans; and (ii) shares tendered as full or partial payment for the purchase price of an award or to satisfy tax withholding obligations. At
December 31, 2014
, a total of
2,607,425
shares were available for issuance. The Plan provides for the granting of nonqualified and incentive stock options having maximum
ten
-year terms to purchase common stock at its market value on the award date; stock appreciation rights based on common stock fair market values with settlement in common stock or cash; restricted stock awards; restricted stock units; and performance awards with settlement in common stock or cash on achievement of specific business objectives. Options become exercisable in various percentages over periods ranging up to
five
years.
82
The cost of employee services received in exchange for awards of equity instruments are referred to as share-based payments and are based on the grant date fair-value of those awards. Stock-based compensation includes compensation expense, recognized over the applicable vesting periods, for both new share-based awards and share-based awards granted prior to, but not yet vested, as of January 1, 2006. The Company uses the Black-Scholes-Merton option pricing model to determine the fair value of stock options granted to employees. Stock-based compensation totaled
$53.3 million
,
$44.5 million
, and
$28.3 million
for the years ended
December 31, 2014
,
2013
, and
2012
, respectively.
The income tax benefit related to stock-based compensation expense was
$40.1 million
,
$15.6 million
, and
$6.4 million
for the years ended
December 31, 2014
,
2013
, and
2012
, respectively. The Company has presented excess tax benefits related to stock-based compensation awards as a financing activity in the consolidated statements of cash flows.
Stock options
Expense related to stock options issued to eligible employees under the Plan is recognized over their vesting period on a straight- line basis. Stock options generally vest over
five
years and have contractual terms of
ten
years. All options outstanding at
December 31, 2014
and
December 31, 2013
were exercisable.
|
Number of Shares
|
Weighted Average Exercise Price
|
Weighted Average Remaining Contractual Terms (Years)
|
Aggregate Intrinsic Value
|
|||||||
|
(in millions)
|
||||||||||
|
Options outstanding at December 31, 2013
|
162,404
|
|
$
|
8.90
|
|
3.3
|
$3.0
|
|||
|
Granted
|
—
|
|
—
|
|
||||||
|
Exercised
|
(67,111
|
)
|
$
|
8.95
|
|
|||||
|
Cancelled
|
—
|
|
—
|
|
||||||
|
Options outstanding at December 31, 2014
|
95,293
|
|
$
|
8.86
|
|
3.1
|
$1.8
|
|||
At
December 31, 2014
, there was
no
unrecognized compensation expense related to stock options. The intrinsic value of options exercised totaled
$1.8 million
,
$4.4 million
, and
$6.6 million
during the years ended
December 31, 2014
,
2013
, and
2012
, respectively.
Restricted stock
Restricted share awards consist of restricted stock, restricted stock units, and performance units. Restricted stock and restricted stock units generally vest for periods ranging from
one
to
fifteen
years from the date of grant. Certain restricted stock and restricted stock units vest in their entirety upon the employee's retirement from the Company, the employee's reaching the age of
65
, or when the employee's age plus years of vested service equal
80
. Restricted stock units issued to non-employee directors under the Plan vest on the grant date or on the first business day immediately preceding the next Annual Meeting of Stockholders and are released upon completion of the directors' service to the Company. Expense related to restricted stock and restricted stock units issued to eligible employees under the Plan is recognized ratably over the vesting period or to the date on which retirement eligibility is achieved, if shorter. Performance units are granted to employees based upon a target level, however, depending upon the achievement of certain specified goals during the performance period, performance units may be adjusted to a level ranging between
0%
and
200%
of the target level. The performance units vest upon certification by the Human Resources Committee of the Board of Directors of the achievement of the specified performance goals. Expense related to performance units is recognized ratably from their award date to the end of the performance period, generally
three
years.
|
Number of Restricted Share Awards
|
Weighted Average Grant-Date
Fair Value per Award
|
|||||
|
Restricted share awards outstanding at December 31, 2013
|
7,810,104
|
|
$
|
16.50
|
|
|
|
Granted
|
2,364,839
|
|
32.35
|
|
||
|
Vested
|
(2,625,396
|
)
|
16.09
|
|
||
|
Forfeited
|
(136,578
|
)
|
22.05
|
|
||
|
Restricted share awards outstanding at December 31, 2014
|
7,412,969
|
|
$
|
21.60
|
|
|
At
December 31, 2014
, unrecognized compensation expense related to restricted share awards totaled
$104.8 million
which will be recognized over a weighted average period of
4.0
years. The total vesting-date fair value of shares vested and released during the years ended December 31,
2014
,
2013
, and
2012
was
$105.2 million
,
$29.9 million
, and
$16.9 million
, respectively.
83
The weighted average grant-date fair value of restricted share awards granted during the years ended December 31,
2014
,
2013
, and
2012
was
$32.35
,
$20.76
, and
$14.72
per share, respectively.
Basic net income attributable to Trinity Industries, Inc. per common share is computed by dividing net income attributable to Trinity remaining after allocation to unvested restricted shares by the weighted average number of basic common shares outstanding for the period. Except when the effect would be antidilutive, the calculation of diluted net income attributable to Trinity per common share includes 1) the net impact of unvested restricted shares and shares that could be issued under outstanding stock options and 2) the incremental shares calculated by dividing the value of the conversion obligation in excess of the Convertible Subordinated Notes' aggregate principal amount by the average price of the Company's common stock during the period. The effect of the Convertible Subordinated Notes was antidilutive for the years ended
December 31, 2013
and
2012
. See Note 11 Debt for further explanation of the Company's Convertible Subordinated Notes. Total weighted average restricted shares and antidilutive stock options were
7.4 million
shares,
7.0 million
shares, and
6.1 million
shares, for the years ended
December 31, 2014
,
2013
, and
2012
, respectively.
The computation of basic and diluted net income attributable to Trinity Industries, Inc. follows.
|
|
Year Ended
December 31, 2014 |
|||||||||
|
|
(in millions, except per share amounts)
|
|||||||||
|
|
Income
(Loss)
|
Average
Shares
|
EPS
|
|||||||
|
Net income from continuing operations
|
$
|
709.3
|
|
|||||||
|
Less: net income from continuing operations attributable to noncontrolling interest
|
31.1
|
|
||||||||
|
Net income from continuing operations attributable to Trinity Industries, Inc.
|
678.2
|
|
||||||||
|
Unvested restricted share participation
|
(22.1
|
)
|
||||||||
|
Net income from continuing operations attributable to Trinity Industries, Inc. – basic
|
656.1
|
|
151.0
|
|
$
|
4.35
|
|
|||
|
Effect of dilutive securities:
|
||||||||||
|
Stock options
|
—
|
|
0.1
|
|
||||||
|
Convertible subordinated notes
|
0.7
|
|
5.6
|
|
||||||
|
Net income from continuing operations attributable to Trinity Industries, Inc. – diluted
|
$
|
656.8
|
|
156.7
|
|
$
|
4.19
|
|
||
|
Net income from discontinued operations, net of taxes
|
$
|
—
|
|
|||||||
|
Unvested restricted share participation
|
—
|
|
||||||||
|
Net income from discontinued operations, net of taxes – basic
|
—
|
|
151.0
|
|
$
|
—
|
|
|||
|
Effect of dilutive securities:
|
||||||||||
|
Stock options
|
—
|
|
0.1
|
|
||||||
|
Convertible subordinated notes
|
—
|
|
5.6
|
|
||||||
|
Net income from discontinued operations, net of taxes – diluted
|
$
|
—
|
|
156.7
|
|
$
|
—
|
|
||
84
|
|
Year Ended
December 31, 2013 |
|||||||||
|
|
(in millions, except per share amounts)
|
|||||||||
|
|
Income
(Loss)
|
Average
Shares
|
EPS
|
|||||||
|
Net income from continuing operations
|
$
|
386.1
|
|
|||||||
|
Less: net income from continuing operations attributable to noncontrolling interest
|
16.9
|
|
||||||||
|
Net income from continuing operations attributable to Trinity Industries, Inc.
|
369.2
|
|
||||||||
|
Unvested restricted share participation
|
(12.0
|
)
|
||||||||
|
Net income from continuing operations attributable to Trinity Industries, Inc. – basic
|
357.2
|
|
152.8
|
|
$
|
2.34
|
|
|||
|
Effect of dilutive securities:
|
||||||||||
|
Stock options
|
—
|
|
0.1
|
|
||||||
|
Convertible subordinated notes
|
—
|
|
—
|
|
||||||
|
Net income from continuing operations attributable to Trinity Industries, Inc. – diluted
|
$
|
357.2
|
|
152.9
|
|
$
|
2.34
|
|
||
|
Net income from discontinued operations, net of taxes
|
$
|
6.3
|
|
|||||||
|
Unvested restricted share participation
|
(0.2
|
)
|
||||||||
|
Net income from discontinued operations, net of taxes – basic
|
6.1
|
|
152.8
|
|
$
|
0.04
|
|
|||
|
Effect of dilutive securities:
|
||||||||||
|
Stock options
|
—
|
|
0.1
|
|
||||||
|
Convertible subordinated notes
|
—
|
|
—
|
|
||||||
|
Net income from discontinued operations, net of taxes – diluted
|
$
|
6.1
|
|
152.9
|
|
$
|
0.04
|
|
||
|
|
Year Ended
December 31, 2012 |
|||||||||
|
|
(in millions, except per share amounts)
|
|||||||||
|
|
Income
(Loss)
|
Average
Shares
|
EPS
|
|||||||
|
Net income from continuing operations
|
$
|
251.9
|
|
|||||||
|
Less: net loss from continuing operations attributable to noncontrolling interest
|
(1.5
|
)
|
||||||||
|
Net income from continuing operations attributable to Trinity Industries, Inc.
|
253.4
|
|
||||||||
|
Unvested restricted share participation
|
(7.7
|
)
|
||||||||
|
Net income from continuing operations attributable to Trinity Industries, Inc. – basic
|
245.7
|
|
154.7
|
|
$
|
1.59
|
|
|||
|
Effect of dilutive securities:
|
||||||||||
|
Stock options
|
—
|
|
0.4
|
|
||||||
|
Convertible subordinated notes
|
—
|
|
—
|
|
||||||
|
Net income from continuing operations attributable to Trinity Industries, Inc. – diluted
|
$
|
245.7
|
|
155.1
|
|
$
|
1.58
|
|
||
|
Net income from discontinued operations, net of taxes
|
$
|
1.8
|
|
|||||||
|
Unvested restricted share participation
|
(0.1
|
)
|
||||||||
|
Net income from discontinued operations, net of taxes – basic
|
1.7
|
|
154.7
|
|
$
|
0.01
|
|
|||
|
Effect of dilutive securities:
|
||||||||||
|
Stock options
|
—
|
|
0.4
|
|
||||||
|
Convertible subordinated notes
|
—
|
|
—
|
|
||||||
|
Net income from discontinued operations, net of taxes – diluted
|
$
|
1.7
|
|
155.1
|
|
$
|
0.01
|
|
||
85
Highway products litigation
We previously reported that on January 28, 2013, the United States filed a “Notice of Election to Decline Intervention” in a False Claims Act (“Act”) complaint filed under seal on March 6, 2012 in the United States District Court for the Eastern District of Texas, Marshall Division (“District Court”) styled
Joshua Harman, on behalf of the United States of America, Plaintiff/Relator v. Trinity Industries, Inc., Defendant,
Case 2:12-cv-00089-JRG. Mr. Harman alleged the Company knowingly presented or caused to be presented a false or fraudulent claim, record or statement to purchasers of the Company's ET-Plus® System, a highway guardrail end-terminal (“ET Plus”), in order for such purchasers to obtain Federal-aid reimbursement for payments made on such purchases. On October 20, 2014 a trial of this case concluded with a jury verdict stating that the Company and its subsidiary, Trinity Highway Products, LLC, “knowingly made, used or caused to be made or used, a false record or statement material to a false or fraudulent claim," awarding
$175 million
in damages based on such finding. The jury's damages award, to the extent it survives the Company's challenge in post-trial motions or on appeal, is automatically trebled under the Act to
$525 million
. Additionally, the District Court is required to impose civil penalties for each violation of the Act (which penalties are not automatically trebled). The District Court has the discretion to establish the civil penalty amount between
$5,500
and
$11,000
per violation. In this regard, the Relator contended during trial that certain invoices submitted to purchasers of the ET Plus certified that the product was accepted by the Federal Highway Administration ("FHWA") and was therefore eligible for Federal-aid reimbursement. Based on Relator’s damages model in this respect, the range of possible civil penalties is
$5,500
(if the District Court determines there has been a single violation) to
$184 million
(if the District Court determines that each invoice for the product was a violation).
The District Court has not yet entered a final judgment or determined a civil penalty amount. While the Company believes the District Court does not have the evidence required under the law to quantify civil penalties, the total range of loss in this case, based on the jury’s verdict and Mr. Harman's damage model for civil penalties, is
$525 million
to
$709 million
, exclusive of attorney's fees, costs, and interest.
The Company maintains that Mr. Harman’s allegations are without merit. Accordingly, the Company intends to challenge the damages award on the ground of insufficient evidence and to vigorously defend its positions in post-trial motions and on appeal to the United States Court of Appeals for the Fifth Circuit (“Fifth Circuit”). Such post-trial motions and appellate review will result in certain legal expenses, including potential costs associated with posting a supersedeas bond upon the District Court’s entry of a final judgment. The face amount of such bond could equal the amount of the final judgment entered plus
twenty
(20) percent. The Company has confidence that such bond will be issued if, when, and to the extent required.
Texas A&M Transportation Institute (“TTI”), a member of The Texas A&M University System, designed the technology employed in the ET Plus. The Texas A&M University System is the owner of patents issued by the U.S. Patent Office that cover the ET Plus. Trinity Highway Products manufactures and markets the ET Plus pursuant to an exclusive license granted by The Texas A&M University System of their intellectual property. Trinity Highway Products contracted with TTI to conduct crash testing of the ET Plus to demonstrate compliance with the required standards set out in National Cooperative Highway Research Program Report 350 (“Report 350”). In addition, TTI prepared and provided to Trinity Highway Products the test reports on the performance of the ET Plus for review by the FHWA in their consideration for accepting the product for use on the national highway system and determining the product’s eligibility for Federal-aid reimbursement. It is our belief that since its introduction in 2000, including all subsequent improvement modifications recommended by TTI, the ET Plus has been in compliance with Report 350 and has been, and is currently, accepted by the FHWA for Federal-aid reimbursement eligibility. In a Memorandum dated June 17, 2014, the FHWA confirmed to its Division Administrators, Directors of Field Services, Federal Lands Division Engineers, that "The Trinity ET Plus with 4-inch guide channels became eligible for Federal-aid reimbursement under FHWA letter CC-94 on September 2, 2005. In addition, the device is eligible for reimbursement under FHWA letters CC-94A and CC-120.” In its memorandum, the FHWA further confirmed the reimbursement eligibility of the device at guardrail heights from 27 3/4 inches to 31 inches, stating that an “unbroken chain of eligibility for Federal-aid reimbursement has existed since September 2, 2005 and the ET Plus continues to be eligible today."
A trial in this matter commenced in July 2014, but ended in a mistrial declared by the District Court on its own volition. Preceding the second trial in this matter, the Company filed a Petition for Writ of Mandamus with the Fifth Circuit based, in part, on the District Court’s failure to apply Fifth Circuit case law precedent as well as other precedential case law. In its per curiam order denying the Company’s Petition for Writ of Mandamus, the Fifth Circuit expressed concern regarding the District Court’s failure to issue a reasoned ruling rejecting the Company’s prior motions for judgment as a matter of law. The Fifth Circuit also stated that the FHWA authoritative memorandum dated June 17, 2014, on its face, appears to compel the conclusion that the FHWA, after due consideration of all the facts, found the ET Plus sufficiently compliant with federal safety standards and therefore fully eligible, in the past, present and future, for Federal-aid reimbursement claims. Additionally, the Fifth Circuit noted that a strong argument could be made that the Company’s actions were neither material nor were any false claims based on false certifications presented
86
to the government. Based on the Fifth Circuit’s remarks, the Company re-urged its motions with the District Court for judgment as a matter of law, which the District Court denied during trial. We believe this reinforces our prospects for a successful outcome.
Revenues from sales of the ET Plus in the United States, included in the Construction Products Group, totaled approximately
$35.1 million
and
$46.0 million
for the
years ended
December 31, 2014
and
2013
, respectively.
Pending entry of a final judgment and completion of the Company’s post-trial and appellate activities in this matter, we currently do not believe that a loss is probable, therefore
no
accrual has been included in the accompanying consolidated financial statements.
At December 31, 2014, the Company had unrestricted cash, cash equivalents, and short-term marketable securities of
$962.9 million
. When combined with capacity under committed credit facilities, the Company had approximately
$1.6 billion
of available liquidity at the end of the fourth quarter.
On October 21, 2014, in light of the jury’s finding, the FHWA requested that the Company perform
eight
(8) additional crash tests of the ET Plus to support the FHWA’s ongoing evaluation of ET Plus performance. The eight tests were comprised of four tests at a guardrail height of 27 3/4" and four tests at a guardrail height of 31". On October 24, 2014, the Company issued a press release stating that it will stop shipments of the ET Plus until additional crash testing of the ET Plus was completed. The requested tests were conducted in December 2014 and January 2015, in accordance with Report 350 at Southwest Research Institute, an FHWA-approved and independent research facility. Report 350 sets forth the performance evaluation criteria applicable to the ET Plus and many other roadside safety features used on U.S. highways. The ET Plus extruder heads tested in all eight tests were randomly selected by the FHWA from inventory at the California Department of Transportation. These extruder heads were representative of what is in use on U.S. and Canadian highways.
On January 27, 2015, Trinity Highway Products completed the eighth, and final, test. On February 6, 2015, the FHWA released the crash test results of the first
four
tests conducted at the 27 3/4" installation height of the ET Plus. This release reports that the ET Plus passed Report 350 crash test criteria at the 27 3/4" guardrail height. The vast majority of guardrails installed on the roadways in the U.S. and Canada are at the 27 3/4" height. These test results validate Trinity Highway Products' long standing position that when installed, maintained and impacted within the Report 350 standards, the 27 3/4" height ET Plus performs to Report 350 criteria. When all eight test results are reviewed and released by the FHWA, the Company will perform a thorough analysis before resuming any shipments of the ET Plus to its customers.
As of the date on which the eighth test was concluded, Trinity is aware of
42
states that had removed the ET Plus from their respective qualified products list. The state of Virginia, in addition to evaluating a potential recall of all ET Plus products installed on Virginia roadways, has joined Mr. Harman's Virginia state action alleging the same false claims as were alleged in the false claims act case pending in the Eastern District of Texas. Other states could take similar or different actions regarding recall, and could be considering similar state false claims litigation against the Company. While the financial impacts of such actions are currently unknown, they could be material.
The Company is aware of
two
class action lawsuits involving claims pertaining to the ET Plus. The Company has received service of process in a lawsuit filed November 6, 2014, titled
Hamilton County, Illinois and Macon County, Illinois, Individually and on behalf of all Other Counties in the State of Illinois vs. Trinity Industries, Inc. and Trinity Highway Products, LLC.
In this case it is alleged that the Company and Trinity Highway Products made a series of un-tested modifications to the ET Plus and falsely certified that the modified ET Plus was acceptable for use on the nation’s highways based on federal testing standards and approval for Federal-aid reimbursement. The Plaintiffs further allege breach of express and implied warranties, violation of the Uniform Deceptive Trade Practices Act and unjust enrichment, for which Plaintiffs seek actual damages related to purchases of the ET Plus, compensatory damages for establishing a common fund for class members, punitive damages, and injunctive relief. The case is filed in the United States District Court for the Southern District of Illinois and is being brought by Plaintiffs for and on behalf of themselves and the other
101
counties of the State of Illinois. The Company is also aware of, but has not received service of process in a lawsuit filed February 11, 2015 titled
The Corporation of the City of Stratford and Trinity Industries, Inc., Trinity Highway Products, LLC, and Trinity Industries Canada, Inc.
pending in Ontario Superior Court of Justice. The class in this matter has been identified as persons in Canada who purchased and/or used an ET Plus guardrail end terminal. The Statement of Claim in this litigation generally alleges that Trinity Industries, Inc., Trinity Highway Products, and Trinity Industries Canada, failed to warn of dangers associated with undisclosed modifications to the ET Plus guardrail end terminals, breached its implied warranty, breached its duty of care, and was negligent. Plaintiff is seeking
$400 million
in compensatory damages and
$100 million
in punitive damages. In the alternative to damages, Plaintiff further pleads an entitlement to "waive the tort" and claim an accounting or other such restitution remedy for disgorgement of the revenues generated by Trinity Industries, Inc., Trinity Highway Products, and Trinity Industries Canada as a result of the sale of the modified ET Plus guardrail end terminals in Canada, due to the product not being fit for its intended purpose and/or the failure to disclose the modifications and/or risks associated with the modifications to the ET Plus guardrail end terminals. The Company believes each of these lawsuits are without merit and intends to vigorously defend these allegations. While the financial impacts of these two actions are currently unknown, they could be material.
87
The Company is currently defending a number of product liability lawsuits in several different states that are alleged to involve the ET Plus. These cases are diverse in light of the randomness of collisions in general and the fact that each accident involving roadside devices such as an ET Plus, or any other fixed object along the highway has its own unique facts and circumstances. Report 350 recognizes that performance of even the most carefully researched roadside device is subject to physical laws and the crash worthiness of vehicles. The Company expects the jury verdict, coupled with the media attention the verdict has generated, will prompt the plaintiff’s bar to seek out vehicle accident victims involved in collisions with an ET Plus as potential clients, which may result in additional product liability lawsuits being filed against the Company. The Company carries general liability insurance to mitigate the impact of adverse verdict exposures in these product liability cases.
The Company has received information that several law firms are investigating whether certain officers and directors of the Company breached their fiduciary duties relating to modifications made to the ET Plus and/or violated federal securities laws. We believe these investigations will be concluded without substantive results. However, the Company may incur legal expenses and related costs in responding to these investigations.
Train derailment
As previously reported, the Company was named as a respondent in litigation filed July 15, 2013 in Superior Court, Province of Quebec, District of Saint-Francois, styled
Yannick Gagne and Guy Ouellet vs. Rail World, Inc., et al
related to the July 2013 crude oil unit train derailment in Lac-Mégantic, Quebec. A partially-owned subsidiary of the Company owned and leased to a third party
13
of the railcars involved in the incident, which lessee is also named as a defendant in the Province of Quebec litigation. As of June 18, 2014, the petitioners in the Quebec litigation have voluntarily desisted with their claims against the Company resulting in the dismissal of the Company without prejudice; however the partially-owned subsidiary remains as a respondent in the litigation. The litigation filed in Quebec is seeking “class” status which, if certified, could lead to multiple individuals and business entities becoming class members.
The Company was also named as a defendant in multiple cases filed by the estates of decedents in the Circuit Court of Cook County, Illinois seeking damages for alleged wrongful death and property damage arising from the July 2013 crude oil unit train derailment in Lac-Mégantic, Quebec. The Company’s tank car manufacturing subsidiary manufactured
35
of the
72
tank railcars involved in the derailment. However the Illinois cases have since been ordered transferred to the United States District Court for the District of Maine. This transfer prompted plaintiffs to seek dismissal of these actions. Nonetheless, the Maine court has not indicated those dismissals were effectuated and the cases were transferred to federal court in Maine and have been assigned new case numbers. Certain of the plaintiffs in these transferred cases have appealed to the U.S. Court of Appeals for the First Circuit seeking to overturn the decision to transfer. This appeal has resulted in a stay of all proceedings in the transferred cases pending resolution of the appeal. The Company could be named in similar litigation involving other affected plaintiffs, but the ultimate number of claims and the jurisdiction in which such claims are filed, may vary. The Company has recorded an accrual of
$11.4 million
at
December 31, 2014
related to this matter of which expected third-party recoveries of
$10.2 million
are recorded in other assets at
December 31, 2014
. We do not believe at this time that an additional loss is probable nor can a range of additional losses be determined.
Other matters
The Company is involved in claims and lawsuits incidental to our business arising from various matters including product warranty, personal injury, environmental issues, workplace laws, and various governmental regulations. The Company evaluates its exposure to such claims and suits periodically and establishes accruals for these contingencies when a range of loss can be reasonably estimated. The range of reasonably possible losses for such matters, taking into consideration our rights in indemnity and recourse to third parties is
$3.9 million
to
$29.3 million
. This range excludes any amount related to the highway products litigation matters described above. At
December 31, 2014
, total accruals of
$27.5 million
, including environmental and workplace matters described below, are included in accrued liabilities in the accompanying consolidated balance sheet. The Company believes any additional liability would not be material to its financial position or results of operations.
Trinity is subject to remedial orders and Federal, state, local, and foreign laws and regulations relating to the environment and the workplace. The Company has reserved
$6.1 million
to cover our probable and estimable liabilities with respect to the investigations, assessments, and remedial responses to such matters, taking into account currently available information and our contractual rights to indemnification and recourse to third parties. However, estimates of liability arising from future proceedings, assessments, or remediation are inherently imprecise. Accordingly, there can be no assurance that we will not become involved in future litigation or other proceedings involving the environment and the workplace or, if we are found to be responsible or liable in any such litigation or proceeding, that such costs would not be material to the Company. We believe that we are currently in substantial compliance with environmental and workplace laws and regulations.
88
Other commitments
Non-cancelable purchase obligations amounted to
$1.4 billion
as of
December 31, 2014
, of which
$1.2 billion
is for the purchase of raw materials and components, principally by the Rail, Inland Barge, and Energy Equipment Groups.
The Company’s Senior Notes are fully and unconditionally and jointly and severally guaranteed by certain of Trinity’s 100%-owned subsidiaries: Trinity Construction Materials Inc., Trinity Highway Products, LLC, Trinity Industries Leasing Company, Trinity Marine Products, Inc., Trinity North American Freight Car, Inc., Trinity Parts & Components, LLC, Trinity Rail Group, LLC, Trinity Structural Towers, Inc., and Trinity Tank Car, Inc. (“Combined Guarantor Subsidiaries”). See Note 11 Debt. The Senior Notes indenture agreement includes customary provisions for the release of the guarantees by the Combined Guarantor Subsidiaries upon the occurrence of certain allowed events including the release of one or more of the Combined Guarantor Subsidiaries as guarantor under the Company's revolving credit facility. The Senior Notes are not guaranteed by any remaining 100%-owned subsidiaries of the Company or partially-owned subsidiaries (“Combined Non-Guarantor Subsidiaries”).
As of
December 31, 2014
, assets held by the Combined Non-Guarantor Subsidiaries included $
194.4 million
of restricted cash that was not available for distribution to Trinity Industries, Inc. (“Parent”), $
3,936.8 million
of equipment securing certain non-recourse debt, $
87.5 million
of equipment securing certain lease obligations held by the Combined Non-Guarantor Subsidiaries, and $
395.5 million
of assets located in foreign locations. As of
December 31, 2013
, assets held by the Combined Non-Guarantor Subsidiaries included $
208.3 million
of restricted cash that was not available for distribution to the Parent, $
3,733.9 million
of equipment securing certain non-recourse debt, $
90.2 million
of equipment securing certain lease obligations held by the Combined Non-Guarantor Subsidiaries, and $
306.9 million
of assets located in foreign locations.
|
Statement of Operations and Comprehensive Income
|
|||||||||||||||||||
|
Year Ended December 31, 2014
|
|||||||||||||||||||
|
Parent
|
Combined
Guarantor Subsidiaries |
Combined
Non-Guarantor Subsidiaries |
Eliminations
|
Consolidated
|
|||||||||||||||
|
(in millions)
|
|||||||||||||||||||
|
Revenues
|
$
|
—
|
|
$
|
4,725.4
|
|
$
|
2,294.2
|
|
$
|
(849.6
|
)
|
$
|
6,170.0
|
|
||||
|
Cost of revenues
|
—
|
|
3,705.3
|
|
1,770.2
|
|
(855.7
|
)
|
4,619.8
|
|
|||||||||
|
Selling, engineering, and administrative expenses
|
115.6
|
|
151.5
|
|
136.5
|
|
—
|
|
403.6
|
|
|||||||||
|
Gains/(losses) on disposition of property, plant, and equipment
|
(1.4
|
)
|
41.4
|
|
64.4
|
|
—
|
|
104.4
|
|
|||||||||
|
117.0
|
|
3,815.4
|
|
1,842.3
|
|
(855.7
|
)
|
4,919.0
|
|
||||||||||
|
Operating profit (loss)
|
(117.0
|
)
|
910.0
|
|
451.9
|
|
6.1
|
|
1,251.0
|
|
|||||||||
|
Other (income) expense
|
(60.3
|
)
|
86.3
|
|
160.9
|
|
—
|
|
186.9
|
|
|||||||||
|
Equity in earnings of subsidiaries, net of taxes
|
740.2
|
|
228.9
|
|
—
|
|
(969.1
|
)
|
—
|
|
|||||||||
|
Income (loss) from continuing operations before income taxes
|
683.5
|
|
1,052.6
|
|
291.0
|
|
(963.0
|
)
|
1,064.1
|
|
|||||||||
|
Provision (benefit) for income taxes
|
5.3
|
|
325.4
|
|
26.1
|
|
(2.0
|
)
|
354.8
|
|
|||||||||
|
Income (loss) from continuing operations
|
678.2
|
|
727.2
|
|
264.9
|
|
(961.0
|
)
|
709.3
|
|
|||||||||
|
Income (loss) from discontinued operations, net of provision (benefit) for income taxes
|
—
|
|
(0.1
|
)
|
0.1
|
|
—
|
|
—
|
|
|||||||||
|
Net income (loss)
|
678.2
|
|
727.1
|
|
265.0
|
|
(961.0
|
)
|
709.3
|
|
|||||||||
|
Net income (loss) attributable to noncontrolling interest
|
—
|
|
—
|
|
—
|
|
31.1
|
|
31.1
|
|
|||||||||
|
Net income (loss) attributable to controlling interest
|
$
|
678.2
|
|
$
|
727.1
|
|
$
|
265.0
|
|
$
|
(992.1
|
)
|
$
|
678.2
|
|
||||
|
Net income (loss)
|
$
|
678.2
|
|
$
|
727.1
|
|
$
|
265.0
|
|
$
|
(961.0
|
)
|
$
|
709.3
|
|
||||
|
Other comprehensive income (loss)
|
(32.2
|
)
|
(10.0
|
)
|
11.2
|
|
—
|
|
(31.0
|
)
|
|||||||||
|
Comprehensive income
|
$
|
646.0
|
|
$
|
717.1
|
|
$
|
276.2
|
|
$
|
(961.0
|
)
|
$
|
678.3
|
|
||||
89
|
Statement of Operations and Comprehensive Income
|
|||||||||||||||||||
|
Year Ended December 31, 2013
|
|||||||||||||||||||
|
Parent
|
Combined
Guarantor Subsidiaries |
Combined
Non-Guarantor Subsidiaries |
Eliminations
|
Consolidated
|
|||||||||||||||
|
(in millions)
|
|||||||||||||||||||
|
Revenues
|
$
|
—
|
|
$
|
3,257.8
|
|
$
|
1,758.2
|
|
$
|
(650.7
|
)
|
$
|
4,365.3
|
|
||||
|
Cost of revenues
|
—
|
|
2,636.3
|
|
1,341.9
|
|
(655.9
|
)
|
3,322.3
|
|
|||||||||
|
Selling, engineering, and administrative expenses
|
72.8
|
|
128.9
|
|
90.3
|
|
(0.7
|
)
|
291.3
|
|
|||||||||
|
Gains on disposition of property, plant, and equipment
|
0.3
|
|
10.9
|
|
10.0
|
|
—
|
|
21.2
|
|
|||||||||
|
72.5
|
|
2,754.3
|
|
1,422.2
|
|
(656.6
|
)
|
3,592.4
|
|
||||||||||
|
Operating profit (loss)
|
(72.5
|
)
|
503.5
|
|
336.0
|
|
5.9
|
|
772.9
|
|
|||||||||
|
Other (income) expense
|
(71.5
|
)
|
61.2
|
|
192.7
|
|
—
|
|
182.4
|
|
|||||||||
|
Equity in earnings of subsidiaries, net of taxes
|
378.3
|
|
97.1
|
|
—
|
|
(475.4
|
)
|
—
|
|
|||||||||
|
Income (loss) from continuing operations before income taxes
|
377.3
|
|
539.4
|
|
143.3
|
|
(469.5
|
)
|
590.5
|
|
|||||||||
|
Provision (benefit) for income taxes
|
1.8
|
|
167.0
|
|
33.5
|
|
2.1
|
|
204.4
|
|
|||||||||
|
Income (loss) from continuing operations
|
375.5
|
|
372.4
|
|
109.8
|
|
(471.6
|
)
|
386.1
|
|
|||||||||
|
Income (loss) from discontinued operations, net of provision (benefit) for income taxes
|
—
|
|
6.3
|
|
—
|
|
—
|
|
6.3
|
|
|||||||||
|
Net income (loss)
|
375.5
|
|
378.7
|
|
109.8
|
|
(471.6
|
)
|
392.4
|
|
|||||||||
|
Net income (loss) attributable to noncontrolling interest
|
—
|
|
—
|
|
—
|
|
16.9
|
|
16.9
|
|
|||||||||
|
Net income (loss) attributable to controlling interest
|
$
|
375.5
|
|
$
|
378.7
|
|
$
|
109.8
|
|
$
|
(488.5
|
)
|
$
|
375.5
|
|
||||
|
Net income (loss)
|
$
|
375.5
|
|
$
|
378.7
|
|
$
|
109.8
|
|
$
|
(471.6
|
)
|
$
|
392.4
|
|
||||
|
Other comprehensive income (loss)
|
47.7
|
|
9.9
|
|
17.1
|
|
—
|
|
74.7
|
|
|||||||||
|
Comprehensive income
|
$
|
423.2
|
|
$
|
388.6
|
|
$
|
126.9
|
|
$
|
(471.6
|
)
|
$
|
467.1
|
|
||||
|
Statement of Operations and Comprehensive Income
|
|||||||||||||||||||
|
Year Ended December 31, 2012
|
|||||||||||||||||||
|
Parent
|
Combined
Guarantor Subsidiaries |
Combined
Non-Guarantor Subsidiaries |
Eliminations
|
Consolidated
|
|||||||||||||||
|
(in millions)
|
|||||||||||||||||||
|
Revenues
|
$
|
—
|
|
$
|
2,791.5
|
|
$
|
1,429.0
|
|
$
|
(408.6
|
)
|
$
|
3,811.9
|
|
||||
|
Cost of revenues
|
—
|
|
2,385.3
|
|
1,087.9
|
|
(421.7
|
)
|
3,051.5
|
|
|||||||||
|
Selling, engineering, and administrative expenses
|
50.4
|
|
111.4
|
|
62.3
|
|
—
|
|
224.1
|
|
|||||||||
|
Gains on disposition of property, plant, and equipment
|
0.4
|
|
9.4
|
|
28.7
|
|
—
|
|
38.5
|
|
|||||||||
|
50.0
|
|
2,487.3
|
|
1,121.5
|
|
(421.7
|
)
|
3,237.1
|
|
||||||||||
|
Operating profit (loss)
|
(50.0
|
)
|
304.2
|
|
307.5
|
|
13.1
|
|
574.8
|
|
|||||||||
|
Other (income) expense
|
(56.5
|
)
|
49.0
|
|
196.4
|
|
—
|
|
188.9
|
|
|||||||||
|
Equity in earnings of subsidiaries, net of taxes
|
246.6
|
|
88.2
|
|
—
|
|
(334.8
|
)
|
—
|
|
|||||||||
|
Income (loss) from continuing operations before income taxes
|
253.1
|
|
343.4
|
|
111.1
|
|
(321.7
|
)
|
385.9
|
|
|||||||||
|
Provision (benefit) for income taxes
|
(2.1
|
)
|
117.1
|
|
14.3
|
|
4.7
|
|
134.0
|
|
|||||||||
|
Income (loss) from continuing operations
|
255.2
|
|
226.3
|
|
96.8
|
|
(326.4
|
)
|
251.9
|
|
|||||||||
|
Income (loss) from discontinued operations, net of provision (benefit) for income taxes
|
—
|
|
1.4
|
|
0.4
|
|
—
|
|
1.8
|
|
|||||||||
|
Net income (loss)
|
255.2
|
|
227.7
|
|
97.2
|
|
(326.4
|
)
|
253.7
|
|
|||||||||
|
Net income (loss) attributable to noncontrolling interest
|
—
|
|
—
|
|
—
|
|
(1.5
|
)
|
(1.5
|
)
|
|||||||||
|
Net income (loss) attributable to controlling interest
|
$
|
255.2
|
|
$
|
227.7
|
|
$
|
97.2
|
|
$
|
(324.9
|
)
|
$
|
255.2
|
|
||||
|
Net income (loss)
|
$
|
255.2
|
|
$
|
227.7
|
|
$
|
97.2
|
|
$
|
(326.4
|
)
|
$
|
253.7
|
|
||||
|
Other comprehensive income (loss)
|
(20.1
|
)
|
(6.1
|
)
|
11.7
|
|
—
|
|
(14.5
|
)
|
|||||||||
|
Comprehensive income
|
$
|
235.1
|
|
$
|
221.6
|
|
$
|
108.9
|
|
$
|
(326.4
|
)
|
$
|
239.2
|
|
||||
90
|
Balance Sheet
|
|||||||||||||||||||
|
December 31, 2014
|
|||||||||||||||||||
|
Parent
|
Combined
Guarantor Subsidiaries |
Combined
Non-Guarantor Subsidiaries |
Eliminations
|
Consolidated
|
|||||||||||||||
|
(in millions)
|
|||||||||||||||||||
|
Assets:
|
|||||||||||||||||||
|
Cash and cash equivalents
|
$
|
827.7
|
|
$
|
11.1
|
|
$
|
89.4
|
|
$
|
(40.3
|
)
|
$
|
887.9
|
|
||||
|
Short-term marketable securities
|
75.0
|
|
—
|
|
—
|
|
—
|
|
75.0
|
|
|||||||||
|
Receivables, net of allowance
|
—
|
|
190.0
|
|
215.7
|
|
(0.4
|
)
|
405.3
|
|
|||||||||
|
Income tax receivable
|
58.6
|
|
—
|
|
—
|
|
—
|
|
58.6
|
|
|||||||||
|
Inventory
|
—
|
|
836.6
|
|
249.8
|
|
(18.0
|
)
|
1,068.4
|
|
|||||||||
|
Property, plant, and equipment, net
|
29.3
|
|
774.8
|
|
4,663.1
|
|
(564.3
|
)
|
4,902.9
|
|
|||||||||
|
Investments in and advances to subsidiaries
|
4,426.6
|
|
4,028.0
|
|
3.4
|
|
(8,458.0
|
)
|
—
|
|
|||||||||
|
Restricted cash
|
—
|
|
—
|
|
194.4
|
|
40.3
|
|
234.7
|
|
|||||||||
|
Goodwill and other assets
|
180.6
|
|
131.6
|
|
819.0
|
|
(30.2
|
)
|
1,101.0
|
|
|||||||||
|
$
|
5,597.8
|
|
$
|
5,972.1
|
|
$
|
6,234.8
|
|
$
|
(9,070.9
|
)
|
$
|
8,733.8
|
|
|||||
|
Liabilities:
|
|||||||||||||||||||
|
Accounts payable
|
$
|
15.0
|
|
$
|
154.8
|
|
$
|
126.2
|
|
$
|
(0.6
|
)
|
$
|
295.4
|
|
||||
|
Accrued liabilities
|
235.8
|
|
286.9
|
|
186.9
|
|
—
|
|
709.6
|
|
|||||||||
|
Debt
|
789.5
|
|
39.1
|
|
2,724.4
|
|
—
|
|
3,553.0
|
|
|||||||||
|
Deferred income
|
—
|
|
34.5
|
|
1.9
|
|
—
|
|
36.4
|
|
|||||||||
|
Deferred income taxes
|
—
|
|
637.5
|
|
8.7
|
|
(13.6
|
)
|
632.6
|
|
|||||||||
|
Advances from subsidiaries
|
1,067.5
|
|
—
|
|
597.7
|
|
(1,665.2
|
)
|
—
|
|
|||||||||
|
Other liabilities
|
92.6
|
|
13.7
|
|
3.1
|
|
—
|
|
109.4
|
|
|||||||||
|
Total stockholders' equity
|
3,397.4
|
|
4,805.6
|
|
2,585.9
|
|
(7,391.5
|
)
|
3,397.4
|
|
|||||||||
|
$
|
5,597.8
|
|
$
|
5,972.1
|
|
$
|
6,234.8
|
|
$
|
(9,070.9
|
)
|
$
|
8,733.8
|
|
|||||
|
Balance Sheet
|
|||||||||||||||||||
|
December 31, 2013
|
|||||||||||||||||||
|
Parent
|
Combined
Guarantor Subsidiaries |
Combined
Non-Guarantor Subsidiaries |
Eliminations
|
Consolidated
|
|||||||||||||||
|
(in millions)
|
|||||||||||||||||||
|
Assets:
|
|||||||||||||||||||
|
Cash and cash equivalents
|
$
|
409.8
|
|
$
|
2.1
|
|
$
|
44.0
|
|
$
|
(27.4
|
)
|
$
|
428.5
|
|
||||
|
Short-term marketable securities
|
149.7
|
|
—
|
|
—
|
|
—
|
|
149.7
|
|
|||||||||
|
Receivables, net of allowance
|
—
|
|
223.4
|
|
142.2
|
|
(0.6
|
)
|
365.0
|
|
|||||||||
|
Income tax receivable
|
7.7
|
|
—
|
|
—
|
|
—
|
|
7.7
|
|
|||||||||
|
Inventory
|
—
|
|
642.1
|
|
180.7
|
|
(8.1
|
)
|
814.7
|
|
|||||||||
|
Property, plant, and equipment, net
|
44.5
|
|
947.2
|
|
4,264.7
|
|
(485.8
|
)
|
4,770.6
|
|
|||||||||
|
Investments in and advances to subsidiaries
|
3,431.7
|
|
2,806.5
|
|
79.8
|
|
(6,318.0
|
)
|
—
|
|
|||||||||
|
Restricted cash
|
—
|
|
25.0
|
|
208.3
|
|
27.4
|
|
260.7
|
|
|||||||||
|
Goodwill and other assets
|
133.1
|
|
144.3
|
|
247.8
|
|
(8.7
|
)
|
516.5
|
|
|||||||||
|
$
|
4,176.5
|
|
$
|
4,790.6
|
|
$
|
5,167.5
|
|
$
|
(6,821.2
|
)
|
$
|
7,313.4
|
|
|||||
|
Liabilities:
|
|||||||||||||||||||
|
Accounts payable
|
$
|
11.6
|
|
$
|
115.6
|
|
$
|
89.7
|
|
$
|
(0.6
|
)
|
$
|
216.3
|
|
||||
|
Accrued liabilities
|
213.0
|
|
202.7
|
|
151.7
|
|
—
|
|
567.4
|
|
|||||||||
|
Debt
|
375.9
|
|
42.2
|
|
2,571.7
|
|
—
|
|
2,989.8
|
|
|||||||||
|
Deferred income
|
—
|
|
38.7
|
|
2.1
|
|
—
|
|
40.8
|
|
|||||||||
|
Deferred income taxes
|
—
|
|
655.9
|
|
3.5
|
|
(8.7
|
)
|
650.7
|
|
|||||||||
|
Advances from subsidiaries
|
744.5
|
|
—
|
|
19.2
|
|
(763.7
|
)
|
—
|
|
|||||||||
|
Other liabilities
|
82.4
|
|
13.9
|
|
3.0
|
|
—
|
|
99.3
|
|
|||||||||
|
Total stockholders' equity
|
2,749.1
|
|
3,721.6
|
|
2,326.6
|
|
(6,048.2
|
)
|
2,749.1
|
|
|||||||||
|
$
|
4,176.5
|
|
$
|
4,790.6
|
|
$
|
5,167.5
|
|
$
|
(6,821.2
|
)
|
$
|
7,313.4
|
|
|||||
91
|
Statement of Cash Flows
|
|||||||||||||||||||
|
Year Ended December 31, 2014
|
|||||||||||||||||||
|
Parent
|
Combined
Guarantor Subsidiaries |
Combined
Non-Guarantor Subsidiaries |
Eliminations
|
Consolidated
|
|||||||||||||||
|
(in millions)
|
|||||||||||||||||||
|
Operating activities:
|
|||||||||||||||||||
|
Net income
|
$
|
678.2
|
|
$
|
727.1
|
|
$
|
265.0
|
|
$
|
(961.0
|
)
|
$
|
709.3
|
|
||||
|
Adjustments to reconcile net income to net cash:
|
|||||||||||||||||||
|
(Income) loss from discontinued operations
|
—
|
|
0.1
|
|
(0.1
|
)
|
—
|
|
—
|
|
|||||||||
|
Depreciation and amortization
|
6.1
|
|
24.9
|
|
213.6
|
|
—
|
|
244.6
|
|
|||||||||
|
Stock-based compensation expense
|
53.3
|
|
18.9
|
|
13.4
|
|
(32.3
|
)
|
53.3
|
|
|||||||||
|
Excess tax benefits from stock-based compensation
|
(24.4
|
)
|
—
|
|
—
|
|
—
|
|
(24.4
|
)
|
|||||||||
|
Provision for deferred income taxes
|
(4.0
|
)
|
(8.9
|
)
|
7.1
|
|
—
|
|
(5.8
|
)
|
|||||||||
|
Net gains on railcar lease fleet sales owned more than one year
|
—
|
|
(41.4
|
)
|
(50.9
|
)
|
—
|
|
(92.3
|
)
|
|||||||||
|
Gains on disposition of property, plant, and equipment
|
1.4
|
|
—
|
|
(13.5
|
)
|
—
|
|
(12.1
|
)
|
|||||||||
|
Non-cash interest expense
|
15.7
|
|
(1.9
|
)
|
16.9
|
|
—
|
|
30.7
|
|
|||||||||
|
Changes in assets and liabilities:
|
|||||||||||||||||||
|
(Increase) decrease in receivables
|
(50.9
|
)
|
33.4
|
|
(38.7
|
)
|
(0.2
|
)
|
(56.4
|
)
|
|||||||||
|
(Increase) decrease in inventories
|
—
|
|
(194.5
|
)
|
(1.7
|
)
|
9.9
|
|
(186.3
|
)
|
|||||||||
|
(Increase) decrease in restricted cash
|
—
|
|
25.0
|
|
—
|
|
—
|
|
25.0
|
|
|||||||||
|
(Increase) decrease in other assets
|
(38.8
|
)
|
13.2
|
|
(4.2
|
)
|
21.5
|
|
(8.3
|
)
|
|||||||||
|
Increase (decrease) in accounts payable
|
3.4
|
|
39.2
|
|
18.1
|
|
—
|
|
60.7
|
|
|||||||||
|
Increase (decrease) in accrued liabilities
|
2.1
|
|
72.8
|
|
12.1
|
|
(4.9
|
)
|
82.1
|
|
|||||||||
|
Increase (decrease) in other liabilities
|
9.2
|
|
(0.2
|
)
|
(6.4
|
)
|
—
|
|
2.6
|
|
|||||||||
|
Equity in earnings of subsidiaries, net of taxes
|
(740.2
|
)
|
(228.9
|
)
|
—
|
|
969.1
|
|
—
|
|
|||||||||
|
Other
|
(0.4
|
)
|
(3.5
|
)
|
(0.6
|
)
|
—
|
|
(4.5
|
)
|
|||||||||
|
Net cash provided (required) by operating activities - continuing
|
(89.3
|
)
|
475.3
|
|
430.1
|
|
2.1
|
|
818.2
|
|
|||||||||
|
Net cash provided by operating activities - discontinued
|
—
|
|
1.0
|
|
—
|
|
—
|
|
1.0
|
|
|||||||||
|
Net cash provided (required) by operating activities
|
(89.3
|
)
|
476.3
|
|
430.1
|
|
2.1
|
|
819.2
|
|
|||||||||
|
Investing activities:
|
|||||||||||||||||||
|
(Increase) decrease in short-term marketable securities
|
74.7
|
|
—
|
|
—
|
|
—
|
|
74.7
|
|
|||||||||
|
Proceeds from railcar lease fleet sales
|
—
|
|
549.2
|
|
140.3
|
|
(423.7
|
)
|
265.8
|
|
|||||||||
|
Proceeds from disposition of PPE and other assets
|
0.4
|
|
—
|
|
22.6
|
|
—
|
|
23.0
|
|
|||||||||
|
Capital expenditures – leasing
|
—
|
|
(222.8
|
)
|
(446.2
|
)
|
423.7
|
|
(245.3
|
)
|
|||||||||
|
Capital expenditures – manufacturing and other
|
(9.2
|
)
|
(64.0
|
)
|
(146.1
|
)
|
—
|
|
(219.3
|
)
|
|||||||||
|
Acquisitions, net of cash acquired
|
—
|
|
—
|
|
(714.4
|
)
|
—
|
|
(714.4
|
)
|
|||||||||
|
(Increase) decrease in investment in partially-owned subsidiaries
|
—
|
|
(4.5
|
)
|
—
|
|
4.5
|
|
—
|
|
|||||||||
|
Other
|
0.9
|
|
(0.8
|
)
|
0.7
|
|
—
|
|
0.8
|
|
|||||||||
|
Net cash provided (required) by investing activities - continuing
|
66.8
|
|
257.1
|
|
(1,143.1
|
)
|
4.5
|
|
(814.7
|
)
|
|||||||||
|
Net cash provided (required) by investing activities - discontinued
|
—
|
|
—
|
|
—
|
|
—
|
|
—
|
|
|||||||||
|
Net cash provided (required) by investing activities
|
66.8
|
|
257.1
|
|
(1,143.1
|
)
|
4.5
|
|
(814.7
|
)
|
|||||||||
|
Financing activities:
|
|||||||||||||||||||
|
Proceeds from issuance of common stock, net
|
0.6
|
|
—
|
|
—
|
|
—
|
|
0.6
|
|
|||||||||
|
Excess tax benefits from stock-based compensation
|
24.4
|
|
—
|
|
—
|
|
—
|
|
24.4
|
|
|||||||||
|
Payments to retire debt
|
(0.5
|
)
|
(3.1
|
)
|
(183.0
|
)
|
—
|
|
(186.6
|
)
|
|||||||||
|
Proceeds from issuance of debt
|
395.7
|
|
—
|
|
331.6
|
|
—
|
|
727.3
|
|
|||||||||
|
(Increase) decrease in restricted cash
|
—
|
|
—
|
|
13.9
|
|
(12.9
|
)
|
1.0
|
|
|||||||||
|
Shares repurchased
|
(36.5
|
)
|
—
|
|
—
|
|
—
|
|
(36.5
|
)
|
|||||||||
|
Dividends paid to common shareholders
|
(54.4
|
)
|
—
|
|
—
|
|
—
|
|
(54.4
|
)
|
|||||||||
|
Purchase of shares to satisfy employee tax on vested stock
|
(38.3
|
)
|
—
|
|
—
|
|
—
|
|
(38.3
|
)
|
|||||||||
|
Contributions from noncontrolling interest
|
—
|
|
—
|
|
49.6
|
|
—
|
|
49.6
|
|
|||||||||
|
Distributions to noncontrolling interest
|
—
|
|
—
|
|
(28.2
|
)
|
—
|
|
(28.2
|
)
|
|||||||||
|
Contributions from controlling interest in partially-owned subs
|
—
|
|
—
|
|
4.5
|
|
(4.5
|
)
|
—
|
|
|||||||||
|
Change in intercompany financing between entities
|
149.4
|
|
(719.1
|
)
|
571.8
|
|
(2.1
|
)
|
—
|
|
|||||||||
|
Other
|
—
|
|
(0.7
|
)
|
(1.8
|
)
|
—
|
|
(2.5
|
)
|
|||||||||
|
Net cash provided (required) by financing activities - continuing
|
440.4
|
|
(722.9
|
)
|
758.4
|
|
(19.5
|
)
|
456.4
|
|
|||||||||
|
Net cash required by financing activities - discontinued
|
—
|
|
(1.5
|
)
|
—
|
|
—
|
|
(1.5
|
)
|
|||||||||
|
Net cash provided (required) by financing activities
|
440.4
|
|
(724.4
|
)
|
758.4
|
|
(19.5
|
)
|
454.9
|
|
|||||||||
|
Net increase (decrease) in cash and cash equivalents
|
417.9
|
|
9.0
|
|
45.4
|
|
(12.9
|
)
|
459.4
|
|
|||||||||
|
Cash and cash equivalents at beginning of period
|
409.8
|
|
2.1
|
|
44.0
|
|
(27.4
|
)
|
428.5
|
|
|||||||||
|
Cash and cash equivalents at end of period
|
$
|
827.7
|
|
$
|
11.1
|
|
$
|
89.4
|
|
$
|
(40.3
|
)
|
$
|
887.9
|
|
||||
92
|
Statement of Cash Flows
|
|||||||||||||||||||
|
Year Ended December 31, 2013
|
|||||||||||||||||||
|
Parent
|
Combined
Guarantor Subsidiaries |
Combined
Non-Guarantor Subsidiaries |
Eliminations
|
Consolidated
|
|||||||||||||||
|
(in millions)
|
|||||||||||||||||||
|
Operating activities:
|
|||||||||||||||||||
|
Net income
|
$
|
375.5
|
|
$
|
378.7
|
|
$
|
109.8
|
|
$
|
(471.6
|
)
|
$
|
392.4
|
|
||||
|
Adjustments to reconcile net income to net cash:
|
|||||||||||||||||||
|
(Income) loss from discontinued operations
|
—
|
|
(6.3
|
)
|
—
|
|
—
|
|
(6.3
|
)
|
|||||||||
|
Depreciation and amortization
|
4.5
|
|
31.5
|
|
175.5
|
|
—
|
|
211.5
|
|
|||||||||
|
Stock-based compensation expense
|
44.5
|
|
15.9
|
|
7.5
|
|
(23.4
|
)
|
44.5
|
|
|||||||||
|
Excess tax benefits from stock-based compensation
|
(8.5
|
)
|
—
|
|
—
|
|
—
|
|
(8.5
|
)
|
|||||||||
|
Provision for deferred income taxes
|
43.3
|
|
(5.3
|
)
|
7.8
|
|
—
|
|
45.8
|
|
|||||||||
|
Net gains on railcar lease fleet sales owned more than one year
|
—
|
|
(10.9
|
)
|
(9.5
|
)
|
—
|
|
(20.4
|
)
|
|||||||||
|
Gain on disposition of property, plant, and equipment
|
(0.3
|
)
|
—
|
|
(0.5
|
)
|
—
|
|
(0.8
|
)
|
|||||||||
|
Non-cash interest expense
|
14.4
|
|
(0.9
|
)
|
17.3
|
|
—
|
|
30.8
|
|
|||||||||
|
Changes in assets and liabilities:
|
|||||||||||||||||||
|
(Increase) decrease in receivables
|
1.0
|
|
27.6
|
|
(12.0
|
)
|
0.6
|
|
17.2
|
|
|||||||||
|
(Increase) decrease in inventories
|
—
|
|
(103.7
|
)
|
6.4
|
|
1.7
|
|
(95.6
|
)
|
|||||||||
|
(Increase) decrease in restricted cash
|
—
|
|
(25.0
|
)
|
—
|
|
—
|
|
(25.0
|
)
|
|||||||||
|
(Increase) decrease in other assets
|
146.8
|
|
9.3
|
|
(3.0
|
)
|
(182.2
|
)
|
(29.1
|
)
|
|||||||||
|
Increase (decrease) in accounts payable
|
0.1
|
|
15.0
|
|
14.4
|
|
(0.5
|
)
|
29.0
|
|
|||||||||
|
Increase (decrease) in accrued liabilities
|
61.8
|
|
20.5
|
|
(9.9
|
)
|
—
|
|
72.4
|
|
|||||||||
|
Increase (decrease) in other liabilities
|
(45.4
|
)
|
4.7
|
|
(22.7
|
)
|
71.6
|
|
8.2
|
|
|||||||||
|
Equity in earnings of subsidiaries, net of taxes
|
(378.3
|
)
|
(97.1
|
)
|
—
|
|
475.4
|
|
—
|
|
|||||||||
|
Other
|
(1.8
|
)
|
(4.4
|
)
|
(0.2
|
)
|
—
|
|
(6.4
|
)
|
|||||||||
|
Net cash provided (required) by operating activities - continuing
|
257.6
|
|
249.6
|
|
280.9
|
|
(128.4
|
)
|
659.7
|
|
|||||||||
|
Net cash provided (required) by operating activities - discontinued
|
—
|
|
2.5
|
|
—
|
|
—
|
|
2.5
|
|
|||||||||
|
Net cash provided (required) by operating activities
|
257.6
|
|
252.1
|
|
280.9
|
|
(128.4
|
)
|
662.2
|
|
|||||||||
|
Investing activities:
|
|||||||||||||||||||
|
(Increase) decrease in short-term marketable securities
|
(149.7
|
)
|
—
|
|
—
|
|
—
|
|
(149.7
|
)
|
|||||||||
|
Proceeds from railcar lease fleet sales
|
—
|
|
322.4
|
|
57.1
|
|
(247.9
|
)
|
131.6
|
|
|||||||||
|
Proceeds from disposition of PPE and other assets
|
—
|
|
0.3
|
|
3.4
|
|
—
|
|
3.7
|
|
|||||||||
|
Capital expenditures – leasing
|
—
|
|
(545.6
|
)
|
(283.4
|
)
|
247.9
|
|
(581.1
|
)
|
|||||||||
|
Capital expenditures – manufacturing and other
|
(23.7
|
)
|
(34.1
|
)
|
(92.1
|
)
|
—
|
|
(149.9
|
)
|
|||||||||
|
Acquisitions, net of cash acquired
|
—
|
|
35.6
|
|
(108.8
|
)
|
—
|
|
(73.2
|
)
|
|||||||||
|
(Increase) decrease in investment in partially-owned subsidiaries
|
—
|
|
47.3
|
|
—
|
|
(47.3
|
)
|
—
|
|
|||||||||
|
Other
|
108.8
|
|
—
|
|
—
|
|
(108.8
|
)
|
—
|
|
|||||||||
|
Net cash provided (required) by investing activities - continuing
|
(64.6
|
)
|
(174.1
|
)
|
(423.8
|
)
|
(156.1
|
)
|
(818.6
|
)
|
|||||||||
|
Net cash provided by investing activities - discontinued
|
—
|
|
0.6
|
|
—
|
|
—
|
|
0.6
|
|
|||||||||
|
Net cash provided (required) by investing activities
|
(64.6
|
)
|
(173.5
|
)
|
(423.8
|
)
|
(156.1
|
)
|
(818.0
|
)
|
|||||||||
|
Financing activities:
|
|||||||||||||||||||
|
Proceeds from issuance of common stock, net
|
2.5
|
|
—
|
|
—
|
|
—
|
|
2.5
|
|
|||||||||
|
Excess tax benefits from stock-based compensation
|
8.5
|
|
—
|
|
—
|
|
—
|
|
8.5
|
|
|||||||||
|
Payments to retire debt
|
—
|
|
(52.2
|
)
|
(318.7
|
)
|
108.8
|
|
(262.1
|
)
|
|||||||||
|
Proceeds from issuance of debt
|
—
|
|
—
|
|
175.0
|
|
—
|
|
175.0
|
|
|||||||||
|
(Increase) decrease in restricted cash
|
—
|
|
—
|
|
2.5
|
|
(15.0
|
)
|
(12.5
|
)
|
|||||||||
|
Shares repurchased
|
(103.2
|
)
|
—
|
|
—
|
|
—
|
|
(103.2
|
)
|
|||||||||
|
Dividends paid to common shareholders
|
(39.3
|
)
|
—
|
|
—
|
|
—
|
|
(39.3
|
)
|
|||||||||
|
Purchase of shares to satisfy employee tax on vested stock
|
(9.6
|
)
|
—
|
|
—
|
|
—
|
|
(9.6
|
)
|
|||||||||
|
Proceeds from sale of interests in partially-owned leasing subs
|
—
|
|
—
|
|
296.7
|
|
—
|
|
296.7
|
|
|||||||||
|
Repurchase of noncontrolling interest in partially-owned leasing subs
|
—
|
|
(84.0
|
)
|
—
|
|
—
|
|
(84.0
|
)
|
|||||||||
|
Contributions from noncontrolling interest
|
—
|
|
—
|
|
50.0
|
|
—
|
|
50.0
|
|
|||||||||
|
Distributions to noncontrolling interest
|
—
|
|
—
|
|
(10.0
|
)
|
—
|
|
(10.0
|
)
|
|||||||||
|
Distributions to controlling interest in partially-owned subsidiaries
|
—
|
|
—
|
|
(47.3
|
)
|
47.3
|
|
—
|
|
|||||||||
|
Change in intercompany financing between entities
|
(148.3
|
)
|
56.7
|
|
(36.8
|
)
|
128.4
|
|
—
|
|
|||||||||
|
Other
|
—
|
|
—
|
|
0.8
|
|
—
|
|
0.8
|
|
|||||||||
|
Net cash provided (required) by financing activities - continuing
|
(289.4
|
)
|
(79.5
|
)
|
112.2
|
|
269.5
|
|
12.8
|
|
|||||||||
|
Net cash required by financing activities - discontinued
|
—
|
|
(1.5
|
)
|
—
|
|
—
|
|
(1.5
|
)
|
|||||||||
|
Net cash provided (required) by financing activities
|
(289.4
|
)
|
(81.0
|
)
|
112.2
|
|
269.5
|
|
11.3
|
|
|||||||||
|
Net increase (decrease) in cash and cash equivalents
|
(96.4
|
)
|
(2.4
|
)
|
(30.7
|
)
|
(15.0
|
)
|
(144.5
|
)
|
|||||||||
|
Cash and cash equivalents at beginning of period
|
506.2
|
|
4.5
|
|
74.7
|
|
(12.4
|
)
|
573.0
|
|
|||||||||
|
Cash and cash equivalents at end of period
|
$
|
409.8
|
|
$
|
2.1
|
|
$
|
44.0
|
|
$
|
(27.4
|
)
|
$
|
428.5
|
|
||||
93
|
Statement of Cash Flows
|
|||||||||||||||||||
|
Year Ended December 31, 2012
|
|||||||||||||||||||
|
Parent
|
Combined
Guarantor Subsidiaries |
Combined
Non-Guarantor Subsidiaries |
Eliminations
|
Consolidated
|
|||||||||||||||
|
(in millions)
|
|||||||||||||||||||
|
Operating activities:
|
|||||||||||||||||||
|
Net income
|
$
|
255.2
|
|
$
|
227.7
|
|
$
|
97.2
|
|
$
|
(326.4
|
)
|
$
|
253.7
|
|
||||
|
Adjustments to reconcile net income to net cash:
|
|||||||||||||||||||
|
(Income) loss from discontinued operations
|
—
|
|
(1.4
|
)
|
(0.4
|
)
|
—
|
|
(1.8
|
)
|
|||||||||
|
Depreciation and amortization
|
3.9
|
|
30.4
|
|
159.4
|
|
—
|
|
193.7
|
|
|||||||||
|
Stock-based compensation expense
|
27.7
|
|
10.2
|
|
4.1
|
|
(14.3
|
)
|
27.7
|
|
|||||||||
|
Excess tax benefits from stock-based compensation
|
(0.6
|
)
|
—
|
|
—
|
|
—
|
|
(0.6
|
)
|
|||||||||
|
Provision for deferred income taxes
|
4.9
|
|
125.5
|
|
(4.1
|
)
|
—
|
|
126.3
|
|
|||||||||
|
Net gains on railcar lease fleet sales owned more than one year
|
—
|
|
(9.0
|
)
|
(24.5
|
)
|
—
|
|
(33.5
|
)
|
|||||||||
|
Gain on disposition of PPE and other assets
|
(0.4
|
)
|
(0.4
|
)
|
(4.2
|
)
|
—
|
|
(5.0
|
)
|
|||||||||
|
Non-cash interest expense
|
13.3
|
|
0.3
|
|
17.6
|
|
—
|
|
31.2
|
|
|||||||||
|
Changes in assets and liabilities:
|
|||||||||||||||||||
|
(Increase) decrease in receivables
|
(7.8
|
)
|
10.1
|
|
0.4
|
|
—
|
|
2.7
|
|
|||||||||
|
(Increase) decrease in inventories
|
—
|
|
(106.3
|
)
|
(24.9
|
)
|
3.2
|
|
(128.0
|
)
|
|||||||||
|
(Increase) decrease in restricted cash
|
—
|
|
—
|
|
—
|
|
—
|
|
—
|
|
|||||||||
|
(Increase) decrease in other assets
|
(30.2
|
)
|
(2.7
|
)
|
(3.3
|
)
|
(5.3
|
)
|
(41.5
|
)
|
|||||||||
|
Increase (decrease) in accounts payable
|
3.5
|
|
(26.0
|
)
|
5.8
|
|
—
|
|
(16.7
|
)
|
|||||||||
|
Increase (decrease) in accrued liabilities
|
5.9
|
|
109.5
|
|
6.2
|
|
3.9
|
|
125.5
|
|
|||||||||
|
Increase (decrease) in other liabilities
|
(12.8
|
)
|
(33.7
|
)
|
(1.4
|
)
|
44.0
|
|
(3.9
|
)
|
|||||||||
|
Equity in earnings of subsidiaries, net of taxes
|
(246.6
|
)
|
(88.2
|
)
|
—
|
|
334.8
|
|
—
|
|
|||||||||
|
Other adjustments
|
0.9
|
|
(3.2
|
)
|
(0.9
|
)
|
—
|
|
(3.2
|
)
|
|||||||||
|
Net cash provided by operating activities - continuing operations
|
16.9
|
|
242.8
|
|
227.0
|
|
39.9
|
|
526.6
|
|
|||||||||
|
Net cash provided by operating activities - discontinued operations
|
—
|
|
0.8
|
|
—
|
|
—
|
|
0.8
|
|
|||||||||
|
Net cash provided by operating activities
|
16.9
|
|
243.6
|
|
227.0
|
|
39.9
|
|
527.4
|
|
|||||||||
|
Investing activities:
|
|||||||||||||||||||
|
Proceeds from railcar lease fleet sales owned more than one year
|
—
|
|
527.6
|
|
88.7
|
|
(490.0
|
)
|
126.3
|
|
|||||||||
|
Proceeds from lease fleet sales – sale and leaseback
|
—
|
|
58.3
|
|
—
|
|
—
|
|
58.3
|
|
|||||||||
|
Proceeds from disposition of PPE and other assets
|
—
|
|
13.6
|
|
3.2
|
|
—
|
|
16.8
|
|
|||||||||
|
Capital expenditures – leasing subsidiary
|
—
|
|
(380.9
|
)
|
(461.7
|
)
|
490.0
|
|
(352.6
|
)
|
|||||||||
|
Capital expenditures – manufacturing and other
|
(6.6
|
)
|
(38.8
|
)
|
(71.2
|
)
|
—
|
|
(116.6
|
)
|
|||||||||
|
Acquisitions, net of cash acquired
|
—
|
|
2.1
|
|
(48.3
|
)
|
—
|
|
(46.2
|
)
|
|||||||||
|
Other
|
—
|
|
—
|
|
1.7
|
|
—
|
|
1.7
|
|
|||||||||
|
Net cash required by investing activities - continuing
|
(6.6
|
)
|
181.9
|
|
(487.6
|
)
|
—
|
|
(312.3
|
)
|
|||||||||
|
Net cash provided (required) by investing activities - discontinued
|
—
|
|
0.9
|
|
—
|
|
—
|
|
0.9
|
|
|||||||||
|
Net cash required by investing activities
|
(6.6
|
)
|
182.8
|
|
(487.6
|
)
|
—
|
|
(311.4
|
)
|
|||||||||
|
Financing activities:
|
|||||||||||||||||||
|
Proceeds from issuance of common stock, net
|
4.1
|
|
—
|
|
—
|
|
—
|
|
4.1
|
|
|||||||||
|
Excess tax benefits from stock-based compensation
|
0.6
|
|
—
|
|
—
|
|
—
|
|
0.6
|
|
|||||||||
|
Payments to retire debt
|
—
|
|
(8.9
|
)
|
(369.5
|
)
|
—
|
|
(378.4
|
)
|
|||||||||
|
Proceeds from issuance of debt
|
—
|
|
—
|
|
443.8
|
|
—
|
|
443.8
|
|
|||||||||
|
(Increase) decrease in restricted cash
|
—
|
|
—
|
|
(6.0
|
)
|
23.1
|
|
17.1
|
|
|||||||||
|
Shares repurchased
|
(45.2
|
)
|
—
|
|
—
|
|
—
|
|
(45.2
|
)
|
|||||||||
|
Dividends paid to common shareholders
|
(31.7
|
)
|
—
|
|
—
|
|
—
|
|
(31.7
|
)
|
|||||||||
|
Purchase of shares to satisfy employee tax on vested stock
|
(4.8
|
)
|
—
|
|
—
|
|
—
|
|
(4.8
|
)
|
|||||||||
|
Change in intercompany financing between entities
|
236.5
|
|
(415.4
|
)
|
218.8
|
|
(39.9
|
)
|
—
|
|
|||||||||
|
Other
|
—
|
|
—
|
|
(0.5
|
)
|
—
|
|
(0.5
|
)
|
|||||||||
|
Net cash provided by financing activities - continuing
|
159.5
|
|
(424.3
|
)
|
286.6
|
|
(16.8
|
)
|
5.0
|
|
|||||||||
|
Net cash required by financing activities - discontinued
|
—
|
|
0.9
|
|
—
|
|
—
|
|
0.9
|
|
|||||||||
|
Net cash provided by financing activities
|
159.5
|
|
(423.4
|
)
|
286.6
|
|
(16.8
|
)
|
5.9
|
|
|||||||||
|
Net increase (decrease) in cash and cash equivalents
|
169.8
|
|
3.0
|
|
26.0
|
|
23.1
|
|
221.9
|
|
|||||||||
|
Cash and cash equivalents at beginning of period
|
336.4
|
|
1.5
|
|
48.7
|
|
(35.5
|
)
|
351.1
|
|
|||||||||
|
Cash and cash equivalents at end of period
|
$
|
506.2
|
|
$
|
4.5
|
|
$
|
74.7
|
|
$
|
(12.4
|
)
|
$
|
573.0
|
|
||||
94
|
Three Months Ended
|
|||||||||||||||
|
March 31,
2014 |
June 30,
2014 |
September 30,
2014 |
December 31,
2014 |
||||||||||||
|
(in millions except per share data)
|
|||||||||||||||
|
Revenues:
|
|||||||||||||||
|
Manufacturing
|
$
|
1,018.3
|
|
$
|
1,259.9
|
|
$
|
1,359.8
|
|
$
|
1,425.6
|
|
|||
|
Leasing
|
442.2
|
|
225.4
|
|
203.0
|
|
235.8
|
|
|||||||
|
1,460.5
|
|
1,485.3
|
|
1,562.8
|
|
1,661.4
|
|
||||||||
|
Operating costs:
|
|||||||||||||||
|
Costs of revenues:
|
|||||||||||||||
|
Manufacturing
|
794.7
|
|
970.2
|
|
1,062.6
|
|
1,147.6
|
|
|||||||
|
Leasing
|
279.3
|
|
128.1
|
|
109.6
|
|
127.7
|
|
|||||||
|
1,074.0
|
|
1,098.3
|
|
1,172.2
|
|
1,275.3
|
|
||||||||
|
Selling, engineering, and administrative expenses
|
83.6
|
|
96.4
|
|
113.0
|
|
110.6
|
|
|||||||
|
Gain on disposition of property, plant, and equipment
|
88.4
|
|
11.4
|
|
3.6
|
|
1.0
|
|
|||||||
|
Operating profit
|
391.3
|
|
302.0
|
|
281.2
|
|
276.5
|
|
|||||||
|
Net income from continuing operations
|
233.3
|
|
173.3
|
|
156.3
|
|
146.4
|
|
|||||||
|
Discontinued operations, net of tax
|
(0.3
|
)
|
(0.2
|
)
|
0.6
|
|
(0.1
|
)
|
|||||||
|
Net income
|
233.0
|
|
173.1
|
|
156.9
|
|
146.3
|
|
|||||||
|
Net income attributable to Trinity Industries, Inc.
|
226.4
|
|
164.2
|
|
149.4
|
|
138.2
|
|
|||||||
|
Net income attributable to Trinity Industries, Inc. per common share:
|
|||||||||||||||
|
Basic:
|
|||||||||||||||
|
Continuing operations
|
$
|
1.46
|
|
$
|
1.05
|
|
$
|
0.95
|
|
$
|
0.89
|
|
|||
|
Discontinued operations
|
—
|
|
—
|
|
—
|
|
—
|
|
|||||||
|
$
|
1.46
|
|
$
|
1.05
|
|
$
|
0.95
|
|
$
|
0.89
|
|
||||
|
Diluted:
|
|||||||||||||||
|
Continuing operations
|
$
|
1.42
|
|
$
|
1.01
|
|
$
|
0.90
|
|
$
|
0.86
|
|
|||
|
Discontinued operations
|
—
|
|
—
|
|
—
|
|
—
|
|
|||||||
|
$
|
1.42
|
|
$
|
1.01
|
|
$
|
0.90
|
|
$
|
0.86
|
|
||||
|
Three Months Ended
|
|||||||||||||||
|
March 31,
2013 |
June 30,
2013 |
September 30,
2013 |
December 31,
2013 |
||||||||||||
|
(in millions except per share data)
|
|||||||||||||||
|
Revenues:
|
|||||||||||||||
|
Manufacturing
|
$
|
798.5
|
|
$
|
896.5
|
|
$
|
959.7
|
|
$
|
1,065.2
|
|
|||
|
Leasing
|
134.4
|
|
169.6
|
|
150.6
|
|
190.8
|
|
|||||||
|
932.9
|
|
1,066.1
|
|
1,110.3
|
|
1,256.0
|
|
||||||||
|
Operating costs:
|
|||||||||||||||
|
Costs of revenues:
|
|||||||||||||||
|
Manufacturing
|
641.2
|
|
726.0
|
|
767.0
|
|
856.7
|
|
|||||||
|
Leasing
|
69.9
|
|
86.2
|
|
69.3
|
|
106.0
|
|
|||||||
|
711.1
|
|
812.2
|
|
836.3
|
|
962.7
|
|
||||||||
|
Selling, engineering, and administrative expenses
|
69.0
|
|
71.5
|
|
70.6
|
|
80.2
|
|
|||||||
|
Gain on disposition of property, plant, and equipment
|
6.7
|
|
1.0
|
|
2.2
|
|
11.3
|
|
|||||||
|
Operating profit
|
159.5
|
|
183.4
|
|
205.6
|
|
224.4
|
|
|||||||
|
Net income from continuing operations
|
72.2
|
|
89.2
|
|
105.8
|
|
118.9
|
|
|||||||
|
Discontinued operations, net of tax
|
6.6
|
|
(1.0
|
)
|
0.3
|
|
0.4
|
|
|||||||
|
Net income
|
78.8
|
|
88.2
|
|
106.1
|
|
119.3
|
|
|||||||
|
Net income attributable to Trinity Industries, Inc.
|
79.1
|
|
84.0
|
|
99.6
|
|
112.8
|
|
|||||||
|
Net income (loss) attributable to Trinity Industries, Inc. per common share:
|
|||||||||||||||
|
Basic:
|
|||||||||||||||
|
Continuing operations
|
$
|
0.46
|
|
$
|
0.53
|
|
$
|
0.63
|
|
$
|
0.72
|
|
|||
|
Discontinued operations
|
0.04
|
|
(0.01
|
)
|
—
|
|
—
|
|
|||||||
|
$
|
0.50
|
|
$
|
0.52
|
|
$
|
0.63
|
|
$
|
0.72
|
|
||||
|
Diluted:
|
|||||||||||||||
|
Continuing operations
|
$
|
0.46
|
|
$
|
0.53
|
|
$
|
0.63
|
|
$
|
0.72
|
|
|||
|
Discontinued operations
|
0.04
|
|
(0.01
|
)
|
—
|
|
—
|
|
|||||||
|
$
|
0.50
|
|
$
|
0.52
|
|
$
|
0.63
|
|
$
|
0.72
|
|
||||
95
Item 9.
Changes in and Disagreements with Accountants on Accounting and
Financial Disclosure.
None.
Item 9A.
Controls and Procedures.
Disclosure Controls and Procedures.
The Company maintains disclosure controls and procedures designed to ensure that it is able to collect and record the information it is required to disclose in the reports it files with the SEC, and to process, summarize, and disclose this information within the time periods specified in the rules of the SEC. The Company's Chief Executive and Chief Financial Officers are responsible for establishing and maintaining these procedures and, as required by the rules of the SEC, evaluating their effectiveness. Based on their evaluation of the Company's disclosure controls and procedures which took place as of the end of the period covered by this report, the Chief Executive and Chief Financial Officers believe that these procedures are effective to 1) ensure that the Company is able to collect, process, and disclose the information it is required to disclose in the reports it files with the SEC within the required time periods and 2) accumulate and communicate this information to the Company's management, including its Chief Executive and Chief Financial Officers, to allow timely decisions regarding this disclosure.
The Company acquired the assets of Meyer on August 18, 2014 and has not yet included Meyer in its assessment of the effectiveness of its internal control over financial reporting. Accordingly, pursuant to the Securities and Exchange Commission's general guidance that an assessment of a recently acquired business may be omitted from the scope of an assessment in the year of acquisition, the scope of its assessment of the effectiveness of its disclosure controls and procedures does not include any disclosure controls and procedures of Meyer that are also part of Meyer's internal control over financial reporting. For the year ended December 31, 2014, Meyer represented less than 2% of the Company's consolidated total revenues and as of December 31, 2014 represented less than 8% of its consolidated total assets.
Management's Report on Internal Control over Financial Reporting.
Management of the Company is responsible for establishing and maintaining effective internal control over financial reporting as defined in Rules 13a-15(f) under the Securities Exchange Act of 1934. The Company's internal control over financial reporting is designed to provide reasonable assurance regarding the reliability of financial reporting and the preparation of financial statements for external purposes in accordance with accounting principles generally accepted in the United States.
Because of its inherent limitations, internal control over financial reporting may not prevent or detect misstatements. Therefore, even those systems determined to be effective can provide only reasonable assurance, as opposed to absolute assurance, of achieving their internal control objectives.
During the three months ended December 31, 2014, except as described above regarding the Meyer acquisition, there have been no changes in the Company’s internal controls over financial reporting that have materially affected or are reasonably likely to materially affect the Company’s internal controls over financial reporting. Management is currently evaluating the impact of the Meyer acquisition on the Company's internal control over financial reporting.
Management assessed the effectiveness of the Company's internal control over financial reporting as of
December 31, 2014
. In making this assessment, management used the criteria set forth by the Committee of Sponsoring Organizations of the Treadway Commission (the 2013 Framework) (COSO) in
Internal Control - Integrated Framework.
Based on our assessment, except as described above regarding the Meyer acquisition, we believe that, as of
December 31, 2014
, the Company's internal control over financial reporting was effective based on those criteria.
The effectiveness of internal control over financial reporting as of
December 31, 2014
, has been audited by Ernst & Young LLP, the independent registered public accounting firm who also audited the Company's consolidated financial statements. Ernst & Young LLP's attestation report on effectiveness of the Company's internal control over financial reporting follows:
96
Report of Independent Registered Public Accounting Firm
The Board of Directors and Stockholders
Trinity Industries, Inc.
We have audited Trinity Industries, Inc. and Subsidiaries' internal control over financial reporting as of December 31, 2014, based on criteria established in Internal Control - Integrated Framework issued by the Committee of Sponsoring Organizations of the Treadway Commission (2013 framework) (the COSO criteria). Trinity Industries, Inc. and Subsidiaries' management is responsible for maintaining effective internal control over financial reporting, and for its assessment of the effectiveness of internal control over financial reporting included in the accompanying Management's Report on Internal Control over Financial Reporting. Our responsibility is to express an opinion on the company's internal control over financial reporting based on our audit.
We conducted our audit in accordance with the standards of the Public Company Accounting Oversight Board (United States). Those standards require that we plan and perform the audit to obtain reasonable assurance about whether effective internal control over financial reporting was maintained in all material respects. Our audit included obtaining an understanding of internal control over financial reporting, assessing the risk that a material weakness exists, testing and evaluating the design and operating effectiveness of internal control based on the assessed risk, and performing such other procedures as we considered necessary in the circumstances. We believe that our audit provides a reasonable basis for our opinion.
A company's internal control over financial reporting is a process designed to provide reasonable assurance regarding the reliability of financial reporting and the preparation of financial statements for external purposes in accordance with generally accepted accounting principles. A company's internal control over financial reporting includes those policies and procedures that (1) pertain to the maintenance of records that, in reasonable detail, accurately and fairly reflect the transactions and dispositions of the assets of the company; (2) provide reasonable assurance that transactions are recorded as necessary to permit preparation of financial statements in accordance with generally accepted accounting principles, and that receipts and expenditures of the company are being made only in accordance with authorizations of management and directors of the company; and (3) provide reasonable assurance regarding prevention or timely detection of unauthorized acquisition, use or disposition of the company's assets that could have a material effect on the financial statements.
Because of its inherent limitations, internal control over financial reporting may not prevent or detect misstatements. Also, projections of any evaluation of effectiveness to future periods are subject to the risk that controls may become inadequate because of changes in conditions, or that the degree of compliance with the policies or procedures may deteriorate.
As indicated in the accompanying Management’s Report on Internal Control over Financial Reporting, management’s assessment of and conclusion on the effectiveness of internal control over financial reporting did not include the internal controls of Meyer Steel Structures, which is included in the 2014 consolidated financial statements of Trinity Industries, Inc. and Subsidiaries and constituted less than 8% of consolidated total assets, as of December 31, 2014 and less than 2% of consolidated total revenues, for the year then ended. Our audit of internal control over financial reporting of Trinity Industries Inc. and Subsidiaries also did not include an evaluation of the internal control over financial reporting of Meyer Steel Structures.
In our opinion, Trinity Industries, Inc. and Subsidiaries maintained, in all material respects, effective internal control over financial reporting as of December 31, 2014, based on the COSO criteria.
We also have audited, in accordance with the standards of the Public Company Accounting Oversight Board (United States), the consolidated balance sheets of Trinity Industries, Inc. and Subsidiaries as of December 31, 2014 and 2013, and the related consolidated statements of operations, comprehensive income, cash flows, and stockholders' equity for each of the three years in the period ended December 31, 2014 of Trinity Industries, Inc. and Subsidiaries and our report dated February 19, 2015 expressed an unqualified opinion thereon.
|
/s/ ERNST & YOUNG LLP
|
Dallas, Texas
February 19, 2015
97
Item 9B.
Other Information.
None.
Item 10.
Directors, Executive Officers and Corporate Governance.
Information regarding the directors of the Company is incorporated by reference to the information set forth under the caption “Proposal 1 - Election of Directors” in the Company's Proxy Statement for the
2015
Annual Meeting of Stockholders (the “
2015
Proxy Statement”). Information relating to the executive officers of the Company is set forth in Part I of this report under the caption “Executive Officers and Other Corporate Officers of the Company.” Information relating to the Board of Directors' determinations concerning whether at least one of the members of the Audit Committee is an “audit committee financial expert” as that term is defined under Item 407 (d)(5) of Regulation S-K is incorporated by reference to the information set forth under the caption “Corporate Governance - Board Committees - Audit Committee” in the Company's
2015
Proxy Statement. Information regarding the Company's Audit Committee is incorporated by reference to the information set forth under the caption “Corporate Governance - Board Committees - Audit Committee” in the Company's
2015
Proxy Statement. Information regarding compliance with Section 16(a) of the Securities and Exchange Act of 1934 is incorporated by reference to the information set forth under the caption “Additional Information - Section 16(a) Beneficial Ownership Reporting Compliance” in the Company's
2015
Proxy Statement.
The Company has adopted a Code of Business Conduct and Ethics that applies to all of its directors, officers, and employees. The Code of Business Conduct and Ethics is on the Company's website at
www.trin.net
under the caption “Investor Relations/ Governance.” The Company intends to post any amendments or waivers for its Code of Business Conduct and Ethics to the Company's website at
www.trin.net
to the extent applicable to an executive officer or director of the Company.
Item 11.
Executive Compensation.
Information regarding compensation of executive officers and directors is incorporated by reference to the information set forth under the caption “Executive Compensation” in the Company's
2015
Proxy Statement. Information concerning compensation committee interlocks and insider participation is incorporated by reference to the information set forth under the caption “Corporate Governance - Compensation Committee Interlocks and Insider Participation” in the Company's
2015
Proxy Statement. Information about the compensation committee report is incorporated by reference to the information set forth under the caption “Executive Compensation - Human Resources Committee Report” in the Company's
2015
Proxy Statement.
98
Item 12.
Security Ownership of Certain Beneficial Owners and Management and
Related Stockholder Matters.
Information concerning security ownership of certain beneficial owners and management is incorporated herein by reference from the Company's
2015
Proxy Statement, under the caption “Security Ownership - Security Ownership of Certain Beneficial Owners and Management.”
The following table sets forth information about Trinity common stock that may be issued under all of Trinity's existing equity compensation plans as of
December 31, 2014
.
|
Equity Compensation Plan Information
|
|||||||||
|
(a)
|
(b)
|
(c)
|
|||||||
|
Number of Securities to be Issued Upon Exercise of Outstanding Options, Warrants and Rights
|
Weighted-Average Exercise Price of Outstanding Options, Warrants and Rights
|
Number of Securities Remaining Available for Future Issuance under Equity Compensation Plans (Excluding Securities Reflected in Column (a))
|
|||||||
|
Plan Category:
|
|||||||||
|
Equity compensation plans approved by security holders:
|
|||||||||
|
Stock Options
|
95,293
|
|
$
|
8.86
|
|
||||
|
Restricted stock units and performance units
|
2,523,025
|
|
1
|
$
|
—
|
|
|||
|
2,618,318
|
|
2,607,425
|
|
||||||
|
Equity compensation plans not approved by security holders
|
—
|
|
2
|
—
|
|
||||
|
Total
|
2,618,318
|
|
2,607,425
|
|
|||||
____________
1
Includes 811,003 shares of common stock issuable upon the vesting and conversion of restricted stock units and 1,712,022 shares of common stock issuable upon the vesting and conversion of performance units. The restricted stock units and performance units do not have an exercise price. The performance units are granted to employees based upon a target level, however, depending upon the achievement of certain specified goals during the performance period, performance units may be adjusted to a level ranging between 0% and
200%
of the target level.
2
Excludes information regarding the Trinity Deferred Plan for Director Fees. This plan permits the deferral of the payment of the annual retainer fee and board and committee meeting fees. At the election of the participant, the deferred fees may be converted into phantom stock units with a fair market value equal to the value of the fees deferred, and such phantom stock units are credited to the director's account (along with the amount of any dividends or stock distributions). At the time a participant ceases to be a director, cash will be distributed to the participant. At
December 31, 2014
, there were 224,818 phantom stock units credited to the accounts of participants. Also excludes information regarding the Trinity Industries Supplemental Profit Sharing Plan (“Supplemental Plan”) for certain of its highly compensated employees. Information about the Supplemental Plan is incorporated herein by reference from the Company's
2015
Proxy Statement, under the caption “Executive Compensation - Compensation Discussion and Analysis - Components of Compensation - Post-employment Benefits.” At
December 31, 2014
, there were 86,466 stock units credited to the accounts of participants under the Supplemental Plan.
Item 13.
Certain Relationships and Related Transactions, and Director
Independence.
Information regarding certain relationships and related person transactions is incorporated by reference to the information set forth under the captions “Corporate Governance-Compensation Committee Interlocks and Insider Participation” and “Transactions with Related Persons” in the Company's
2015
Proxy Statement. Information regarding the independence of directors is incorporated by reference to the information set forth under the captions “Corporate Governance-Independence of Directors” in the Company's
2015
Proxy Statement.
Item 14.
Principal Accountant Fees and Services.
Information regarding principal accountant fees and services is incorporated by reference to the information set forth under the captions “Fees of Independent Registered Public Accounting Firm for Fiscal Years
2014
and
2013
” in the Company's
2015
Proxy Statement.
99
Item 15.
Exhibits and Financial Statement Schedules.
(a) (1)
Financial Statements.
See Item 8.
(2)
Financial Statement Schedule.
All schedules are omitted because they are not required, not significant, not applicable or the information is shown in the financial statements or the notes to consolidated financial statements.
(3)
Exhibits.
See Index to Exhibits for a listing of Exhibits which are filed herewith or incorporated herein by reference to the location indicated.
100
EXHIBIT 23
CONSENT OF INDEPENDENT REGISTERED PUBLIC ACCOUNTING FIRM
We consent to the incorporation by reference in the following Registration Statements:
|
1)
|
Post-Effective Amendment No. 3 to the Registration Statement (Form S-8, No. 2-64813),
|
|
2)
|
Post-Effective Amendment No. 1 to the Registration Statement (Form S-8, No. 33-10937),
|
|
3)
|
Registration Statement (Form S-8, No. 33-35514),
|
|
4)
|
Registration Statement (Form S-8, No. 33-73026),
|
|
5)
|
Registration Statement (Form S-8, No. 333-77735),
|
|
6)
|
Registration Statement (Form S-8, No. 333-91067),
|
|
7)
|
Registration Statement (Form S-8, No. 333-85588),
|
|
8)
|
Registration Statement (Form S-8, No. 333-85590),
|
|
9)
|
Registration Statement (Form S-8, No. 333-114854),
|
|
10)
|
Registration Statement (Form S-8, No. 333-115376),
|
|
11)
|
Registration Statement (Form S-3, No. 333-134596),
|
|
12)
|
Registration Statement (Form S-8, No. 333-159552),
|
|
13)
|
Registration Statement (Form S-8, No. 333-169452),
|
|
14)
|
Registration Statement (Form S-8, No. 333-183941), and
|
|
15)
|
Registration Statement (Form S-3, No. 333-198744);
|
of our reports dated
February 19, 2015
with respect to the consolidated financial statements of Trinity Industries, Inc. and Subsidiaries and the effectiveness of internal control over financial reporting of Trinity Industries, Inc. and Subsidiaries included in this Annual Report (Form 10-K) of Trinity Industries, Inc. and Subsidiaries for the year ended
December 31, 2014
.
|
/s/ ERNST & YOUNG LLP
|
Dallas, Texas
February 19, 2015
101
SIGNATURES
Pursuant to the requirements of Section 13 or 15(d) of the Securities Exchange Act of 1934, the registrant has duly caused this report to be signed on its behalf by the undersigned, thereunto duly authorized.
|
TRINITY INDUSTRIES, INC.
|
By
|
/s/ James E. Perry
|
|
Registrant
|
|
|
|
|
James E. Perry
|
|
|
|
Senior Vice President and
|
|
|
|
Chief Financial Officer
|
|
|
|
February 19, 2015
|
|
Pursuant to the requirements of the Securities Exchange Act of 1934, this report has been signed below by the following persons on behalf of the registrant and in the capacities and on the dates indicated.
Directors:
|
/s/ John L. Adams
|
/s/ Douglas L. Rock
|
|
John L. Adams
|
Douglas L. Rock
|
|
Director
|
Director
|
|
Dated: February 19, 2015
|
Dated: February 19, 2015
|
|
/s/ Rhys J. Best
|
/s/ Dunia A. Shive
|
|
Rhys J. Best
|
Dunia A. Shive
|
|
Director
|
Director
|
|
Dated: February 19, 2015
|
Dated: February 19, 2015
|
|
/s/ David W. Biegler
|
|
|
David W. Biegler
|
Principal Executive Officer:
|
|
Director
|
|
|
Dated: February 19, 2015
|
/s/ Timothy R. Wallace
|
|
Timothy R. Wallace
|
|
|
/s/ Antonio Carrillo
|
Chairman, Chief Executive Officer, President, and Director
|
|
Antonio Carrillo
|
Dated: February 19, 2015
|
|
Director
|
|
|
Dated: February 19, 2015
|
|
|
Principal Financial Officer:
|
|
|
/s/ Leldon E. Echols
|
|
|
Leldon E. Echols
|
/s/ James E. Perry
|
|
Director
|
James E. Perry
|
|
Dated: February 19, 2015
|
Senior Vice President and Chief Financial Officer
|
|
Dated: February 19, 2015
|
|
|
/s/ Ronald J. Gafford
|
|
|
Ronald J. Gafford
|
|
|
Director
|
Principal Accounting Officer:
|
|
Dated: February 19, 2015
|
|
|
/s/ Mary E. Henderson
|
|
|
/s/ Adrián Lajous
|
Mary E. Henderson
|
|
Adrián Lajous
|
Vice President and Chief Accounting Officer
|
|
Director
|
Dated: February 19, 2015
|
|
Dated: February 19, 2015
|
|
|
/s/ Charles W. Matthews
|
|
|
Charles W. Matthews
|
|
|
Director
|
|
|
Dated: February 19, 2015
|
|
102
|
INDEX TO EXHIBITS
Trinity Industries, Inc.
Index to Exhibits
(Item 15(b))
|
||
|
NO.
|
DESCRIPTION
|
|
|
(2.1)
|
Purchase Agreement, dated as of June 26, 2014, by and among McKinley 2014 Acquisition LLC, Thomas & Betts Corporation and Thomas & Betts International, LLC (incorporated by reference to Exhibit 2.1 to our Form 8-K filed June 30, 2014).
|
|
|
(3.1)
|
Certificate of Incorporation of Trinity Industries, Inc., as amended May 23, 2007 (incorporated by reference to Exhibit 3.1 to our Annual Report on Form 10-K for the annual period ended December 31, 2012).
|
|
|
(3.2)
|
Amended and Restated By-Laws of Trinity Industries, Inc., as amended September 10, 2014 (incorporated by reference to Exhibit 99.2 to our Form 8-K filed September 12, 2014).
|
|
|
(4.1)
|
Indenture, dated June 7, 2006, between Trinity Industries, Inc. and Wells Fargo Bank, National Association, as trustee (including the Form of 3 7/8% Convertible Subordinated Note due 2036 as an exhibit thereto) (incorporated by reference to Exhibit 4.01 to our Annual Report on Form 10-K for the annual period ended December 31, 2011).
|
|
|
(4.1.1)
|
Officers' Certificate of Trinity Industries, Inc. pursuant to the Indenture dated June 7, 2006, relating to the Company's 3 7/8% Convertible Subordinated Notes due 2036 (incorporated by reference to Exhibit 4.01.1 to our Annual Report on Form 10-K for the annual period ended December 31, 2011).
|
|
|
(4.2)
|
Specimen Common Stock Certificate of Trinity Industries, Inc. (incorporated by reference to Exhibit 4.1 of Registration Statement No. 333-159552 filed May 28, 2009).
|
|
|
(4.3)
|
Pass Through Trust Agreement dated as of February 15, 2002 among Trinity Industries Leasing Company, Trinity Industries, Inc. and Wilmington Trust Company, as Trustee (incorporated by reference to Exhibit 4.3 to our Annual Report on Form 10-K for the annual period ended December 31, 2013).
|
|
|
(4.3.1)
|
Trust Indenture and Security Agreement dated as of February 15, 2002 among Trinity Industries Leasing Company, Trinity Industries, Inc. and The Bank of New York, as Trustee (incorporated by reference to Exhibit 4.3.1 to our Annual Report on Form 10-K for the annual period ended December 31, 2013).
|
|
|
(4.3.2)
|
Trust Indenture and Security Agreement dated as of February 15, 2002 among Trinity Industries Leasing Company, Trinity Industries, Inc. and The Bank of New York, as Trustee (incorporated by reference to Exhibit 4.3.2 to our Annual Report on Form 10-K for the annual period ended December 31, 2013).
|
|
|
(4.3.3)
|
Trust Indenture and Security Agreement dated as of February 15, 2002 among Trinity Industries Leasing Company, Trinity Industries, Inc. and The Bank of New York, as Trustee (incorporated by reference to Exhibit 4.3.3 to our Annual Report on Form 10-K for the annual period ended December 31, 2013).
|
|
|
(4.4)
|
Indenture dated September 25, 2014, by and among Trinity Industries, Inc., certain of its subsidiaries, as guarantors, and Wells Fargo Bank, National Association, as trustee (incorporated by reference to Exhibit 4.1 to our Form 8-K filed September 25, 2014).
|
|
|
(4.4.1)
|
First Supplemental Indenture dated September 25, 2014, by and among Trinity Industries, Inc., certain of its subsidiaries, as guarantors, and Wells Fargo Bank, National Association, as trustee (incorporated by reference to Exhibit 4.2 to our Form 8-K filed September 25, 2014).
|
|
|
(4.4.2)
|
Form of 4.550% Senior Note due 2024 (included in Exhibit 4.4.1 and incorporated by reference to Exhibit 4.3 to our Form 8-K filed September 25, 2014).
|
|
|
(10.1)
|
Form of Change in Control Agreement entered into between Trinity Industries, Inc. and the Chief Executive Officer, and each of the Senior Vice Presidents (incorporated by reference to Exhibit 10.1 to our Annual Report on Form 10-K for the annual period ended December 31, 2013).*
|
|
|
(10.2)
|
Trinity Industries, Inc. Directors' Retirement Plan, as amended September 10, 1998 (incorporated by reference to Exhibit 10.2 of Registration Statement No. 333-117526 filed July 21, 2004).*
|
|
|
(10.2.1)
|
Amendment No. 2 to the Trinity Industries, Inc. Directors' Retirement Plan (incorporated by reference to Exhibit 10.2.1 to our Annual Report on Form 10-K for the annual period ended December 31, 2010).*
|
|
|
(10.2.2)
|
Amendment No. 3 to the Trinity Industries, Inc. Directors' Retirement Plan (incorporated by reference to Exhibit 10.2.2 to our Annual Report on Form 10-K for the annual period ended December 31, 2011).*
|
|
|
(10.3)
|
1993 Stock Option and Incentive Plan (incorporated by reference to Exhibit 4.1 of Registration Statement No. 33-73026 filed December 15, 1993).*
|
|
|
(10.3.1)
|
Amendment No. 1 to the 1993 Stock Option and Incentive Plan (incorporated by reference to Exhibit 10.3.1 to our Annual Report on Form 10-K for the annual period ended December 31, 2011).*
|
|
|
(10.3.2)
|
Amendment No. 2 to the 1993 Stock Option and Incentive Plan (incorporated by reference to Exhibit 10.3.2 to our Annual Report on Form 10-K for the annual period ended December 31, 2011).*
|
|
|
(10.3.3)
|
Amendment No. 3 to the 1993 Stock Option and Incentive Plan (incorporated by reference to Exhibit 10.3.3 to our Annual Report on Form 10-K for the annual period ended December 31, 2011).*
|
|
|
(10.3.4)
|
Amendment No. 4 to the 1993 Stock Option and Incentive Plan (incorporated by reference to Exhibit 10.3.4 to our Annual Report on Form 10-K for the annual period ended December 31, 2011).*
|
|
103
|
INDEX TO EXHIBITS
Trinity Industries, Inc.
Index to Exhibits
(Item 15(b))
|
||
|
NO.
|
DESCRIPTION
|
|
|
(10.3.5)
|
Amendment No. 5 to the 1993 Stock Option and Incentive Plan (incorporated by reference to Exhibit 10.3.5 to our Annual Report on Form 10-K for the annual period ended December 31, 2011).*
|
|
|
(10.4)
|
Supplemental Profit Sharing Plan for Employees of Trinity Industries, Inc. and Certain Affiliates as restated effective January 1, 2005 (incorporated by reference to Exhibit 10.4 to our Annual Report on Form 10-K for the annual period ended December 31, 2013).*
|
|
|
(10.5)
|
Trust Agreement for Trinity Industries, Inc. Deferred Compensation Trust dated December 15, 2011 (incorporated by reference to Exhibit 10.5 to our Annual Report on Form 10-K for the annual period ended December 31, 2011).*
|
|
|
(10.6)
|
Trust Agreement for Trinity Industries, Inc. Supplemental Profit Sharing and Directors Fee Trust dated December 15, 2011 (incorporated by reference to Exhibit 10.6 to our Annual Report on Form 10-K for the annual period ended December 31, 2011).*
|
|
|
(10.7)
|
Supplemental Retirement Plan as Amended and Restated effective January 1, 2009 (incorporated by reference to Exhibit 10.7 to our Annual Report on Form 10-K for the annual period ended December 31, 2013).*
|
|
|
(10.7.1)
|
Amendment No. 1 to the Supplemental Retirement Plan as Amended and Restated effective January 1, 2009 (incorporated by reference to Exhibit 10.7.1 to our Annual Report on Form 10-K for the annual period ended December 31, 2013).*
|
|
|
(10.8)
|
Trinity Industries, Inc. Deferred Plan for Director Fees, as amended (incorporated by reference to Exhibit 10.9 of Registration Statement No. 333-117526 filed July 21, 2004).*
|
|
|
(10.8.1)
|
Amendment to Trinity Industries, Inc. Deferred Plan for Director Fees dated December 7, 2005 (incorporated by reference to Exhibit 10.8.1 to our Annual Report on Form 10-K for the annual period ended December 31, 2011).*
|
|
|
(10.8.2)
|
Trinity Industries, Inc. 2005 Deferred Plan for Director Fees (incorporated by reference to Exhibit 10.8.2 to our Annual Report on Form 10-K for the annual period ended December 31, 2011).*
|
|
|
(10.9)
|
Trinity Industries, Inc. 1998 Stock Option and Incentive Plan (incorporated by reference to Exhibit 4.2 of Registration Statement No. 333-77735 filed May 4, 1999).*
|
|
|
(10.9.1)
|
Amendment No. 1 to the Trinity Industries, Inc. 1998 Stock Option Plan and Incentive Plan (incorporated by reference to Exhibit 10.9.1 to our Annual Report on Form 10-K for the annual period ended December 31, 2009).*
|
|
|
(10.9.2)
|
Amendment No. 2 to the Trinity Industries, Inc. 1998 Stock Option and Incentive Plan (incorporated by reference to Exhibit 10.9.2 to our Annual Report on Form 10-K for the annual period ended December 31, 2009).*
|
|
|
(10.9.3)
|
Amendment No. 3 to the Trinity Industries, Inc. 1998 Stock Option and Incentive Plan (incorporated by reference to Exhibit 10.9.3 to our Annual Report on Form 10-K for the annual period ended December 31, 2011).*
|
|
|
(10.9.4)
|
Amendment No. 4 to the Trinity Industries, Inc. 1998 Stock Option and Incentive Plan (incorporated by reference to Exhibit 10.9.4 to our Annual Report on Form 10-K for the annual period ended December 31, 2011).*
|
|
|
(10.10)
|
Second Amended and Restated Trinity Industries, Inc. 2004 Stock Option and Incentive Plan (incorporated by reference to Exhibit 10.1 to our Form 8-K filed May 8, 2013).*
|
|
|
(10.10.1)
|
Form of Notice of Grant of Stock Options and Non-Qualified Option Agreement with Non-Qualified Stock Option Terms and Conditions as of December 9, 2008 (incorporated by reference to Exhibit 10.10.1 to our Annual Report on Form 10-K for the annual period ended December 31, 2013).*
|
|
|
(10.10.2)
|
Form of Notice of Grant of Stock Options and Incentive Stock Option Agreement with Incentive Stock Option Terms and Conditions as of December 9, 2008 (incorporated by reference to Exhibit 10.10.2 to our Annual Report on Form 10-K for the annual period ended December 31, 2013).*
|
|
|
(10.10.3)
|
Form of Restricted Stock Grant Agreement for grants issued prior to 2008 (incorporated by reference to Exhibit 10.10.3 to our Annual Report on Form 10-K for the annual period ended December 31, 2013).*
|
|
|
(10.10.3.1)
|
Form of Restricted Stock Grant Agreement for grants issued commencing 2008 (incorporated by reference to Exhibit 10.10.3.1 to our Annual Report on Form 10-K for the annual period ended December 31, 2013).*
|
|
|
(10.10.4)
|
Form of Non-Qualified Stock Option Agreement for Non-Employee Directors (incorporated by reference to Exhibit 10.10.4 to our Annual Report on Form 10-K for the annual period ended December 31, 2010).*
|
|
|
(10.10.5)
|
Form of Restricted Stock Unit Agreement for Non-Employee Directors for grants issued prior to 2008 (incorporated by reference to Exhibit 10.10.5 to our Annual Report on Form 10-K for the annual period ended December 31, 2013).*
|
|
|
(10.10.5.1)
|
Form of Restricted Stock Unit Agreement for Non-Employee Directors for grants issued commencing 2008 (incorporated by reference to Exhibit 10.10.5.1 to our Annual Report on Form 10-K for the annual period ended December 31, 2013).*
|
|
104
|
INDEX TO EXHIBITS
Trinity Industries, Inc.
Index to Exhibits
(Item 15(b))
|
||
|
NO.
|
DESCRIPTION
|
|
|
(10.10.6)
|
Form of Performance Restricted Stock Unit Grant Agreement for grants issued commencing 2011 (incorporated by reference to Exhibit 10.1 to our Quarterly Report on Form 10-Q for the quarterly period ended June 30, 2011).*
|
|
|
(10.11)
|
Trinity Industries, Inc. Supplemental Retirement Plan Trust (incorporated by reference to Exhibit 10.1 to our Quarterly Report on Form 10-Q/A for the quarterly period ended March 31, 2012).*
|
|
|
(10.12)
|
Form of 2008 Deferred Compensation Plan and Agreement as amended and restated entered into between Trinity Industries, Inc. and certain officers of Trinity Industries, Inc. or its subsidiaries (incorporated by reference to Exhibit 10.12 to our Annual Report on Form 10-K for the annual period ended December 31, 2013).*
|
|
|
(10.13)
|
Trinity Industries, Inc. Annual Incentive Plan (incorporated by reference to Exhibit 10.2 to our Form 8-K filed May 8, 2013).*
|
|
|
(10.14)
|
Equipment Lease Agreement (TRL 1 2001-1A) dated as of May 17, 2001 between TRLI-1A Railcar Statutory Trust, lesser, and Trinity Rail Leasing I L.P., lessee (incorporated by reference to Exhibit 10.14 to our Annual Report on Form 10-K for the annual period ended December 31, 2013).
|
|
|
(10.14.1)
|
Participation Agreement (TRL 1 2001-1A) dated as of May 17, 2001 among Trinity Rail Leasing I L.P., lessee, et. al. (incorporated by reference to Exhibit 10.14.1 to our Annual Report on Form 10-K for the annual period ended December 31, 2013).
|
|
|
(10.14.2)
|
Equipment Lease Agreement (TRL 1 2001-1B) dated as of July 12, 2001 between TRL 1 2001-1B Railcar Statutory Trust, lessor, and Trinity Rail Leasing I L.P., lessee (incorporated by reference to Exhibit 10.14.2 to our Annual Report on Form 10-K for the annual period ended December 31, 2013).
|
|
|
(10.14.3)
|
Participation Agreement (TRL 1 2001-1B) dated as of May 17, 2001 among Trinity Rail Leasing I L.P., lessee, et. al. (incorporated by reference to Exhibit 10.14.3 to our Annual Report on Form 10-K for the annual period ended December 31, 2013).
|
|
|
(10.14.4)
|
Equipment Lease Agreement (TRL 1 2001-1C) dated as of December 28, 2001 between TRL 1 2001-1C Railcar Statutory Trust, lessor, and Trinity Rail Leasing 1 L.P., lessee (incorporated by reference to Exhibit 10.14.4 to our Annual Report on Form 10-K for the annual period ended December 31, 2013).
|
|
|
(10.14.5)
|
Participation Agreement (TRL 1 2001-1C) dated as of December 28, 2001 among Trinity Rail Leasing 1 L.P., lessee, et. al. (incorporated by reference to Exhibit 10.14.5 to our Annual Report on Form 10-K for the annual period ended December 31, 2013).
|
|
|
(10.15)
|
Equipment Lease Agreement (TRL III 2003-1A) dated as of November 12, 2003 between TRL III-1A Railcar Statutory Trust, lessor, and Trinity Rail Leasing III L.P., lessee (incorporated by reference to Exhibit 10.15 to our Annual Report on Form 10-K for the annual period ended December 31, 2013).
|
|
|
(10.15.1)
|
Participation Agreement (TRL III 2003-1A) dated as of November 12, 2003 between TRL III-1A among Trinity Rail Leasing III L.P., lessee, et. al. (incorporated by reference to Exhibit 10.15.1 to our Annual Report on Form 10-K for the annual period ended December 31, 2013).
|
|
|
(10.15.2)
|
Equipment Lease Agreement (TRL III 2003-1B) dated as of November 12, 2003 between TRL III-1B Railcar Statutory Trust, lessor, and Trinity Rail Leasing III L.P., lessee, (incorporated by reference to Exhibit 10.15.2 to our Annual Report on Form 10-K for the annual period ended December 31, 2013).
|
|
|
(10.15.3)
|
Participation Agreement (TRL III 2003-1B) dated as of November 12, 2003 between TRL III-1B among Trinity Rail Leasing III L.P., lessee, et. al. (incorporated by reference to Exhibit 10.15.3 to our Annual Report on Form 10-K for the annual period ended December 31, 2013).
|
|
|
(10.15.4)
|
Equipment Lease Agreement (TRL III 2003-1C) dated as of November 12, 2003 between TRL III-1C Railcar Statutory Trust, lessor, and Trinity Rail Leasing III L.P., lessee (incorporated by reference to Exhibit 10.15.4 to our Annual Report on Form 10-K for the annual period ended December 31, 2013).
|
|
|
(10.15.5)
|
Participation Agreement (TRL III 2003-1C) dated as of November 12, 2003 between TRL III-1C among Trinity Rail Leasing III L.P., lessee, et. al. (incorporated by reference to Exhibit 10.15.5 to our Annual Report on Form 10-K for the annual period ended December 31, 2013).
|
|
|
(10.16)
|
Equipment Lease Agreement (TRL IV 2004-1A) between TRL IV 2004-1A Statutory Trust, lessor, and Trinity Rail Leasing IV L.P., lessee (incorporated by reference to Exhibit 10.16 to our Annual Report on Form 10-K for the annual period ended December 31, 2013).
|
|
|
(10.16.1)
|
Participation Agreement (TRL IV 2004-1A) among Trinity Rail Leasing IV, L.P., lessee, et. al (incorporated by reference to Exhibit 10.16.1 to our Annual Report on Form 10-K for the annual period ended December 31, 2013).
|
|
|
(10.17)
|
Third Amended and Restated Credit Agreement dated as of October 20, 2011 among Trinity Industries, Inc, as Borrower, JP Morgan Chase Bank, N.A., individually and as Administrative Agent, and certain other Lenders party thereto from time to time (incorporated by reference to Exhibit 10.17 to our Annual Report on Form 10-K for the annual period ended December 31, 2011).
|
|
105
|
INDEX TO EXHIBITS
Trinity Industries, Inc.
Index to Exhibits
(Item 15(b))
|
||
|
NO.
|
DESCRIPTION
|
|
|
(10.18)
|
Third Amended and Restated Warehouse Loan Agreement dated as of June 17, 2013 among Trinity Industries Leasing Company, Trinity Rail Leasing Warehouse Trust, the banks and other lending institutions from time to time party hereto, Credit Suisse AG, New York Branch, as Agent, and Wilmington Trust Company, as Collateral Agent and Depositary (incorporated by reference to Exhibit 10.1 to our Form 8-K filed on June 21, 2013).
|
|
|
(10.19)
|
Term Loan Agreement dated as of May 9, 2008 among Trinity Rail Leasing VI LLC, the Committed Lenders and the Conduit Lenders From Time to Time Party Hereto, DVB Bank AG, as Agent, and Wilmington Trust Company; as Collateral and Depositary (incorporated by reference to Exhibit 10.19 to our Annual Report on Form 10-K for the annual period ended December 31, 2013).
|
|
|
(10.19.1)
|
Purchase and Sale Agreement (TILC) dated as of May 9, 2008 among Trinity Industries Leasing Company, as Seller and Trinity Rail Leasing VI LLC, as Buyer (incorporated by reference to Exhibit 10.19.1 to our Annual Report on Form 10-K for the annual period ended December 31, 2013).
|
|
|
(10.19.2)
|
Purchase and Sale Agreement (TRLT-II) dated as of May 9, 2008 among Trinity Rail Leasing Trust II, as Seller, Trinity Rail Leasing VI LLC, as Buyer and Trinity Industries Leasing Company (incorporated by reference to Exhibit 10.19.2 to our Annual Report on Form 10-K for the annual period ended December 31, 2013).
|
|
|
(10.20)
|
Master Indenture dated November 5, 2009, between Trinity Rail Leasing VII LLC and Wilmington Trust Company, as indenture trustee (filed herewith).
|
|
|
(10.20.1)
|
Purchase and Contribution Agreement, dated November 5, 2009, among Trinity Industries Leasing Company, Trinity Rail Leasing Warehouse Trust, and Trinity Rail Leasing VII L.L.C. (filed herewith).
|
|
|
(10.21)
|
Perquisite Plan beginning January 1, 2004 in which the Company's Executive Officers participate (filed herewith).*
|
|
|
(10.22)
|
Purchase and Contribution Agreement, dated May 18, 2006, among Trinity Industries Leasing Company, Trinity Leasing Trust II, and Trinity Rail Leasing V L.P. (incorporated by reference to Exhibit 10.22 to our Annual Report on Form 10-K for the annual period ended December 31, 2011).
|
|
|
(10.22.1)
|
Master Indenture dated May 24, 2006, between Trinity Rail Leasing V L.P. and Wilmington Trust Company, as indenture trustee (incorporated by reference to Exhibit 10.22.1 to our Annual Report on Form 10-K for the annual period ended December 31, 2011).
|
|
|
(10.23)
|
Board Compensation Summary Sheet (filed herewith).*
|
|
|
(10.25)
|
Indenture dated as of October 25, 2010, between Trinity Rail Leasing 2010 LLC and Wilmington Trust Company, as indenture trustee (incorporated by reference to Exhibit 10.2 to our Quarterly Report on Form 10-Q for the quarterly period ended September 30, 2010).
|
|
|
(10.25.1)
|
Purchase and Contribution Agreement, dated as of October 25, 2010, among Trinity Rail Leasing Warehouse Trust, Trinity Industries Leasing Company, and Trinity Rail Leasing 2010 LLC (incorporated by reference to Exhibit 10.3 to our Quarterly Report on Form 10-Q for the quarterly period ended September 30, 2010).
|
|
|
(10.26)
|
Purchase and Contribution Agreement dated July 6, 2011, among TRIP Rail Leasing, LLC, Trinity Industries Leasing Company, TRIP Rail Master Funding LLC (incorporated by reference to Exhibit 10.3 to our Quarterly Report on Form 10-Q for the quarterly period ended June 30, 2011).
|
|
|
(10.26.1)
|
Master Indenture dated July 6, 2011, among TRIP Rail Master Funding LLC and Wilmington Trust Company, as indenture trustee (incorporated by reference to Exhibit 10.4 to our Quarterly Report on Form 10-Q for the quarterly period ended June 30, 2011).
|
|
|
(10.27)
|
Form of Indemnification Agreement between Trinity Industries, Inc. and certain directors and executive officers (incorporated by reference to Exhibit 10.28 to our Annual Report on Form 10-K for the annual period ended December 31, 2011).
|
|
|
(10.28)
|
Master Indenture dated December 19, 2012, between Trinity Rail Leasing 2012 LLC and Wilmington Trust Company, as Indenture Trustee (incorporated by reference to Exhibit 10.28.1 to our Annual Report on Form 10-K for the annual period ended December 31, 2012).
|
|
|
(10.28.1)
|
Purchase and Contribution Agreement, dated December 19, 2012, among Trinity Rail Leasing Warehouse Trust, Trinity Industries Leasing Company, and Trinity Rail Leasing 2012 LLC (incorporated by reference to Exhibit 10.28.2 to our Annual Report on Form 10-K for the annual period ended December 31, 2012).
|
|
|
(12)
|
Computation of Ratio of Earnings to Fixed Charges (filed herewith).
|
|
|
(21)
|
Listing of subsidiaries of Trinity Industries, Inc. (filed herewith).
|
|
|
(23)
|
Consent of Ernst & Young LLP (contained on page 101 of this document and filed herewith).
|
|
|
(31.1)
|
Rule 13a-15(e) and 15d-15(e) Certification of the Chief Executive Officer (filed herewith).
|
|
|
(31.2)
|
Rule 13a-15(e) and 15d-15(e) Certification of the Chief Financial Officer (filed herewith).
|
|
106
|
INDEX TO EXHIBITS
Trinity Industries, Inc.
Index to Exhibits
(Item 15(b))
|
||
|
NO.
|
DESCRIPTION
|
|
|
(32.1)
|
Certification pursuant to 18U.S.C. Section 1350, as adopted pursuant to Section 906 of the Sarbanes-Oxley Act of 2002 (filed herewith).
|
|
|
(32.2)
|
Certification pursuant to 18U.S.C. Section 1350, as adopted pursuant to Section 906 of the Sarbanes-Oxley Act of 2002 (filed herewith).
|
|
|
(95)
|
Mine Safety Disclosure Exhibit (filed herewith).
|
|
|
101.INS
|
XBRL Instance Document (filed electronically herewith)
|
|
|
101.SCH
|
XBRL Taxonomy Extension Schema Document (filed electronically herewith)
|
|
|
101.CAL
|
XBRL Taxonomy Extension Calculation Linkbase Document (filed electronically herewith)
|
|
|
101.LAB
|
XBRL Taxonomy Extension Label Linkbase Document (filed electronically herewith)
|
|
|
101.PRE
|
XBRL Taxonomy Extension Presentation Linkbase Document (filed electronically herewith)
|
|
|
101.DEF
|
XBRL Taxonomy Extension Definition Linkbase Document (filed electronically herewith)
|
|
_________________
* Management contracts and compensatory plan arrangements.
107
TABLE OF CONTENTS
Part IItem 1. BusinessItem 1A. Risk FactorsItem 1B. Unresolved Staff CommentsItem 2. PropertiesItem 3. Legal ProceedingsItem 4. Mine Safety DisclosuresPart IIItem 5. Market For Registrant's Common Equity, Related Stockholder Matters and Issuer Purchases Of Equity SecuritiesItem 6. Selected Financial DataItem 7. Management S Discussion and Analysis Of Financial Condition and Results Of OperationsItem 7A. Quantitative and Qualitative Disclosures About Market RiskItem 8. Financial StatementsNote 1. Summary Of Significant Accounting PoliciesNote 2. Acquisitions and DivestituresNote 3. Fair Value AccountingNote 4. Segment InformationNote 5. Partially-owned Leasing SubsidiariesNote 6. Railcar Leasing and Management Services GroupNote 7. Derivative InstrumentsNote 8. Property, Plant, and EquipmentNote 9. GoodwillNote 10. WarrantiesNote 11. DebtNote 12. Other, NetNote 13. Income TaxesNote 14. Employee Retirement PlansNote 15. Accumulated Other Comprehensive LossNote 16. Stock-based CompensationNote 17. Earnings Per Common ShareNote 18. Commitments and ContingenciesNote 19. Financial Statements For Guarantors Of The Senior NotesNote 20. Selected Quarterly Financial Data (unaudited)Item 9. Changes in and Disagreements with Accountants on Accounting and Financial DisclosureItem 9A. Controls and ProceduresItem 9B. Other InformationPart IIIItem 10. Directors, Executive Officers and Corporate GovernanceItem 11. Executive CompensationItem 12. Security Ownership Of Certain Beneficial Owners and Management and Related Stockholder MattersItem 13. Certain Relationships and Related Transactions, and Director IndependenceItem 14. Principal Accountant Fees and ServicesPart IVItem 15. Exhibits and Financial Statement Schedules