TRIMAS CORP
10-Ks and 10-Qs
|
|
|
|
|
|
|
|
|
|
|
|
|
|
|
|
|
|
|
|
|
|
|
|
|
|
|
|
|
|
|
|
|
|
|
|
|
|
|
|
|
|
|
|
|
|
|
|
|
|
|
|
|
UNITED STATES
SECURITIES AND EXCHANGE COMMISSION
Washington D.C. 20549
__________________________________________________________________________________________________
Form 10-K
|
(Mark One)
|
|
|
|
x
|
|
ANNUAL REPORT PURSUANT TO SECTION 13 OR 15(d) OF THE SECURITIES EXCHANGE ACT OF 1934
|
|
For the fiscal year ended December 31, 2018
|
||
|
OR
|
||
|
o
|
|
TRANSITION REPORT PURSUANT TO SECTION 13 or 15(d) OF THE SECURITIES EXCHANGE ACT OF 1934
|
|
For the transition period from to
|
||
Commission file number 001-10716
__________________________________________________________________________________________________
TRIMAS CORPORATION
(Exact Name of Registrant as Specified in Its Charter)
|
Delaware
(State or Other Jurisdiction of Incorporation or
Organization)
|
|
38-2687639
(IRS Employer Identification No.)
|
38505 Woodward Avenue, Suite 200
Bloomfield Hills, Michigan 48304
(Address of Principal Executive Offices, Including Zip Code)
(248) 631-5450
(Registrant's telephone number, including area code)
Securities registered pursuant to Section 12(b) of the Act:
|
Title of Each Class:
|
|
Name of Each Exchange on Which Registered:
|
|
Common stock, $0.01 par value
|
|
NASDAQ Stock Market LLC
|
Securities registered pursuant to Section 12(g) of the Act: None
Indicate by check mark if the registrant is a well-known seasoned issuer, as defined in Rule 405 of the Securities Act. Yes
x
No
o
Indicate by check mark if the registrant is not required to file reports pursuant to Section 13 and Section 15(d) of the Act. Yes
o
No
x
Indicate by check mark whether the Registrant (1) has filed all reports required to be filed by Section 13 or 15(d) of the Securities Exchange Act of 1934 during the preceding 12 months (or for such shorter period that the Registrant was required to file such reports), and (2) has been subject to such filing requirements for the past 90 days. Yes
x
No
o
Indicate by check mark whether the registrant has submitted electronically, every Interactive Data File required to be submitted pursuant to Rule 405 of Regulation S-T (§ 232.405 of this chapter) during the preceding 12 months (or for such shorter period that the registrant was required to submit such files). Yes
x
No
o
Indicate by check mark if disclosure of delinquent filers pursuant to Item 405 of Regulation S-K is not contained herein, and will not be contained, to the best of Registrant's knowledge, in definitive proxy or information statements incorporated by reference in Part III of this Form 10-K or any amendment to this Form 10-K.
o
Indicate by check mark whether the Registrant is a large accelerated filer, an accelerated filer, a non-accelerated filer, a smaller reporting company, or an emerging growth company. See definition of "accelerated filer," "large accelerated filer," "smaller reporting company," and "emerging growth company" in Rule 12b-2 of the Exchange Act.
|
Large accelerated filer
x
|
Accelerated filer
o
|
Non-accelerated filer
o
|
Smaller reporting company
o
|
|||
|
Emerging growth company
o
|
||||||
If an emerging growth company, indicate by check mark if the registrant has elected not to use the extended transition period for complying with any new or revised financial accounting standards provided pursuant to Section 13(a) of the Exchange Act.
o
Indicate by check mark whether the registrant is a shell company (as defined in Rule 12b-2 of the Act). Yes
o
No
x
The aggregate market value of the voting common equity held by non-affiliates of the Registrant as of
June 29, 2018
was approximately
$1.3 billion
, based upon the closing sales price of the Registrant's common stock,
$0.01
par value, reported for such date on the NASDAQ Global Select Market. For purposes of this calculation only, directors, executive officers and the principal controlling shareholder or entities controlled by such controlling shareholder are deemed to be affiliates of the Registrant.
As of
February 22, 2019
, the number of outstanding shares of the Registrant's common stock, $0.01 par value, was
45,530,615
shares.
Portions of the Registrant's Proxy Statement for the
2019
Annual Meeting of Stockholders are incorporated herein by reference in Part III of this Annual Report on Form 10-K to the extent stated herein.
TRIMAS CORPORATION INDEX
|
|
|
Page No.
|
|
|
||
|
|
||
|
|
||
|
|
||
2
Forward-Looking Statements
This report may contain forward-looking statements within the meaning of Section 27A of the Securities Act of 1933 and Section 21E of the Securities Exchange Act of 1934 about our financial condition, results of operations and business. These forward-looking statements can be identified by the use of forward-looking words, such as “may,” “could,” “should,” “estimate,” “project,” “forecast,” “intend,” “expect,” “anticipate,” “believe,” “target,” “plan” or other comparable words, or by discussions of strategy that may involve risks and uncertainties.
These forward-looking statements are subject to numerous assumptions, risks and uncertainties which could materially affect our business, financial condition or future results including, but not limited to: general economic and currency conditions; material and energy costs; risks and uncertainties associated with intangible assets, including goodwill or other intangible asset impairment charges; competitive factors; future trends; our ability to realize our business strategies; our ability to identify attractive acquisition candidates, successfully integrate acquired operations or realize the intended benefits of such acquisitions; information technology and other cyber-related risks; the performance of our subcontractors and suppliers; supply constraints; market demand; intellectual property factors; litigation; government and regulatory actions, including, without limitation, the impact of tariffs, quotas and surcharges; our leverage; liabilities imposed by our debt instruments; labor disputes; changes to fiscal and tax policies; contingent liabilities relating to acquisition activities; the disruption of operations from catastrophic or extraordinary events, including natural disasters; the potential impact of Brexit; tax considerations relating to the Cequent spin-off; our future prospects; and other risks that are discussed in Part I, Item 1A, "
Risk Factors
." The risks described in this report are not the only risks facing our Company. Additional risks and uncertainties not currently known to us or that we currently deemed to be immaterial also may materially adversely affect our business, financial position and results of operations or cash flows.
The cautionary statements set forth above should be considered in connection with any subsequent written or oral forward-looking statements that we or persons acting on our behalf may issue. We caution readers not to place undue reliance on the statements, which speak only as of the date of this report. We do not undertake any obligation to review or confirm analysts' expectations or estimates or to release publicly any revisions to any forward-looking statement to reflect events or circumstances after the date of this report or to reflect the occurrence of unanticipated events, except as required by law.
We disclose important factors that could cause our actual results to differ materially from our expectations implied by our forward-looking statements under Part II, Item 7, "
Management's Discussion and Analysis of Financial Condition and Results of Operations
," and elsewhere in this report. These cautionary statements qualify all forward-looking statements attributed to us or persons acting on our behalf. When we indicate that an event, condition or circumstance could or would have an adverse effect on us, we mean to include effects upon our business, financial and other conditions, results of operations, prospects and ability to service our debt.
Trademarks and Service Marks
We own or have rights to trademarks, service marks or trade names that we use in connection with the operation of our business. Solely for convenience, some of the copyrights, trademarks, service marks and trade names referred to in this Annual Report on Form 10-K are listed without the
©
,
®
and ™ symbols, but we will assert, to the fullest extent under applicable law, our rights to our copyrights, trademarks, service marks, trade names and domain names. The trademarks, service marks and trade names of other companies appearing in this Annual Report on Form 10-K are, to our knowledge, the property of their respective owners.
3
PART I
Item 1. Business
Overview
We are a diversified global manufacturer and provider of products for customers in the consumer products, aerospace, industrial, petrochemical, refinery, and oil and gas end markets. Our wide range of innovative product solutions are engineered and designed to solve application-specific challenges that our customers face. We believe our businesses share important and distinguishing characteristics, including: well-recognized and leading brand names in the focused markets we serve; innovative product technologies and features; customer approved processes and qualified products; established distribution networks; relatively low ongoing capital investment requirements; strong cash flow conversion and long-term growth opportunities. We manufacture and supply products globally to a wide range of companies, with approximately 80% of our
2018
revenue generated from sales into North America. In addition, we generated more than 50% of our
2018
revenue from sales to less cyclical consumer product and aerospace markets.
During
2018
, our net sales were
$877.1 million
, operating profit was
$122.1 million
, and net cash provided by operating activities was
$129.3 million
.
Our Competitive Strengths
TriMas operates businesses in three reportable segments: Packaging, Aerospace and Specialty Products. Our brands include Rieke
®
(reported in Packaging); TriMas Aerospace™, Monogram Aerospace Fasteners™, Allfast Fastening Systems
®
, Mac Fasteners™ and Martinic Engineering™ (reported in Aerospace); and Lamons,
®
Norris Cylinder,™ and Arrow
®
Engine Company (reported in Specialty Products). We believe TriMas is uniquely positioned because of a number of competitive strengths, including:
|
•
|
Well-Recognized and Established Brands.
We believe each of our go-to-market brands are well-recognized and firmly established in the focused markets we serve. We believe our brands represent high standards and a commitment to quality that our customers rely on when they make their sourcing decisions. In most applications, the products we sell under our brand names meet rigorous industry standards or customer qualifications, providing an advantage over a broad base of competitors. Moreover, we enhance our brand offerings with ongoing investments in new products to help us capture additional customer share and identify new customer or market opportunities.
|
|
•
|
Innovative and Proprietary Manufacturing and Product Technologies.
We believe each of our businesses is well-positioned through years of refined manufacturing know-how, innovative product development and application engineering and solutions design. We believe our manufacturing competencies and installed capital base would be difficult and costly to replicate, providing us an advantage over prospective competitors. We continue to place a priority on investing in innovation to protect and enhance our product designs, brand names and manufacturing methods. TriMas continues to place a priority on driving growth through both product and process innovation within each of its businesses.
|
|
•
|
Customer-Focused Solutions Drive Deep and Long-Term Relationships.
We work collaboratively with our customers to design new product applications that help satisfy rapidly changing preferences in today’s consumer product marketplace. As a recognized leader in many of our markets, customers partner with us during both the product development and production life cycle. These ongoing relationships, often developed over decades, coupled with our expertise in innovation and application engineering, position us to win new and replacement business with our customers when they launch new products or programs. Customers look to TriMas’ businesses for these product innovations because of our long-standing, trusted relationships, which have provided the enabling technologies for their existing products, and our commitment to collaborate on designs for their future products.
|
|
•
|
Well-Established, Extensive Distribution Channels.
Each of our businesses provides products through established distribution channels that cater to the specific needs of our customers’ purchasing preferences. We developed many of these channels over decades, and believe they are a competitive differentiator for us across the markets we serve. In many cases, we provide products directly to our end markets through our locations, while in other cases, we supply to distribution companies that provide our customers with flexible purchasing solutions.
|
4
|
•
|
TriMas Business Model.
We implemented the TriMas Business Model ("TBM") in late 2016 to improve the management and performance of our businesses. The TBM provides a platform to set near- and long-term performance objectives and goals, including safety, financial, and talent development, measure these against defined objectives, and utilize a reliable communication and escalation process that provides for flexibility and adjustments if market expectations change. We believe the TBM connects our operations, and allows us to benefit from sharing best practices across each of our businesses. We believe that the TBM, through a culture of Kaizen and continuous improvement, helps drive long-term improvement in our performance. For example, since August 2016, we have rationalized 13 manufacturing, warehousing and office locations, streamlined fixed expenses and selling, general and administrative expenses in certain of our businesses, increased our focus on optimizing inventory levels and improved certain of our manufacturing processes. We believe actions driven by the TBM have provided an economic benefit to us and have augmented our cash conversion characteristics and performance overall. Specifically, we reduced our debt from
$374.7 million
at
December 31, 2016
to
$293.6 million
at
December 31, 2018
, and we ended 2018 with
$108.2 million
of cash and cash equivalents on the balance sheet. We will continue to rely on the TBM to drive continuous improvement and to unlock TriMas’ value potential.
|
Our Strategy
Guided by our experienced management team and our commitment to operational excellence, we are focused on the following components that form our core strategy:
|
•
|
Leverage The TriMas Business Model to Drive Performance.
A key tenet of the TBM is our commitment to operational excellence and continuous improvement. We adopted the use of Kaizen methodology within our operations, which is predicated on engaging our employees, to improve all aspects of our businesses. We believe our operating performance will continue to benefit from the use of Kaizen as a means to drive our decision-making processes. In addition to continuous improvement, the TBM is also focused on environmental, health and safety, annual goal setting and measurement, flawless launches, and talent development.
|
|
•
|
Enhance Long-term Growth through Innovation.
Each of our businesses sells products under well-recognized brand names in the focused markets they serve. We intend to leverage our brands, expand our product offerings to current and new customers, and introduce innovative products to meet our customers' needs and help solve their challenges. We believe this disciplined approach will allow us to defend and expand our product offerings and grow our business over the longer term. In addition to product innovation, we also value process innovation and believe we can solidify our customer relationships as innovative new processes and manufacturing "know-how" allow us to improve our quality, speed to market and overall competitiveness, increasing customer satisfaction, as well as our performance.
|
|
•
|
Operate in a Culture Committed to Cash Conversion.
We use the TBM to drive management’s decision-making processes to achieve our annual growth and profitability targets, as well as drive our businesses towards achieving market-leading returns and cash flow conversion. We believe our commitment to having well-defined strategies in place, setting and executing against annual goals and long-range targets, operating in a data-driven environment, and awarding our team on annual cash flow achievement will allow us to invest in and grow our businesses.
|
|
•
|
Utilize a Disciplined Approach to Capital Allocation.
We believe we have the ability to generate substantial free cash flow for reinvestment in our businesses consistent with our capital allocation priorities. We will continue to execute our disciplined approach to capital allocation and other investments. We will invest in organic growth in our most compelling market segments with the highest return potential, and manage indebtedness consistent with our long-term net leverage target. We will also consider strategic bolt-on acquisitions, as well as other capital allocation actions consistent with our long-term, financial goals, such as repurchasing shares of our outstanding common stock.
|
Our Reportable Segments
We report the results of our operations in three segments, which had net sales and operating profit for the year ended
December 31, 2018
as follows: Packaging (net sales:
$368.2 million
; operating profit:
$84.6 million
), Aerospace (net sales:
$185.9 million
; operating profit:
$27.3 million
) and Specialty Products (net sales:
$323.0 million
; operating profit:
$34.3 million
). For information pertaining to the net sales and operating profit attributed to our reportable segments, refer to Note
18
, "
Segment Information
," included in Item 8, "
Financial Statements and Supplementary Data
," within this Form 10-K.
5
Effective with the first quarter of 2019, we will report the machined components operations, located in Stanton, California and Tolleson, Arizona, in the Specialty Products segment. Prior to this change, it has been reported in the Aerospace segment. This modification allows us to better leverage our machining competencies and resources across the businesses within the Specialty Products segment, as well as provides us with the opportunity to expand sales of these products to customers outside of the aerospace market. In addition, this change enables our TriMas Aerospace team to better focus on driving growth and innovation in our aerospace fastener and related product lines.
In addition, effective with the first quarter of 2018, we realigned our reportable segment structure from four segments to three. While there were no changes to the Packaging and Aerospace segments, we combined the former Energy and Engineered Components segments into a single segment, titled Specialty Products. This change was made in connection with our business realignment efforts, to provide a more streamlined operating structure and to better leverage resources across the Norris Cylinder, Lamons and Arrow Engine businesses.
Each of our reportable segments is described in more detail on the following pages.
Packaging (
42%
of
2018
net sales)
Our Packaging segment is comprised primarily of the Rieke business, who we believe is a leading designer and manufacturer of specialty, highly-engineered closure and dispensing systems for a range of end markets, including steel and plastic industrial and consumer packaging markets. Rieke manufactures high-performance, value-added products that are designed to enhance its customers’ ability to store, transport, process and dispense various products for the health, beauty and home care, food and beverage, and industrial markets. These enhancements help to enable our customers to distinguish their products and related applications from that of their competition.
Rieke designs and manufacturers specialty dispensing systems that include products such as foamers, lotion pumps, fine mist sprayers, airless dispensers and other packaging solutions for the cosmetic, personal care, pharmaceutical and household product markets. Rieke also provides specialty dispensers that serve the food and beverage and industrial markets.
The specialty closure portion of Rieke's business includes products made from steel or polymeric materials for a variety of end markets. Rieke's specialty closure products include steel drum enclosures, plastic drum closures, plastic pail dispensers and plugs, and plastic enclosures for sub-20 liter-sized containers, commonly sold into the industrial end markets. Rieke's closure products also include specialty plastic closures for bottles and jars for the food and beverage markets.
Rieke has the capability of manufacturing the majority of its products in North America, Europe or Asia, which allows Rieke to evaluate manufacturing location decisions based on customer needs, timing, cost and capacity.
Competitive Strengths
We believe Rieke benefits from the following competitive strengths:
|
•
|
Strong Product Innovation
. We believe that Rieke’s product development capability is a competitive advantage. Through its Global Innovation Centers located in the United States, United Kingdom and India, Rieke is focused on driving innovation across a broad range of dispensing and closure solutions for its customers. Rieke’s product development programs have provided innovative and proprietary product solutions, such as the Visegrip
®
steel flange and plug closure, and the all-plastic, environmentally safe, self-venting FlexSpout
®
flexible pouring spout. Rieke, partnering with Amazon, also developed a range of products designed to meet the requirements of the high-growth e-commerce retail channel, including a proprietary dispenser locking mechanism to protect the integrity of packages and prevent liquids from leaking during shipment. As a result of this innovation, Rieke was honored as a Diamond Finalist for Packaging Innovation by Dow Chemical in 2018 for the development of a new lotion dispensing pump for e-commerce solutions. Other developments include a measured-dose dispenser that provides exact doses of highly-concentrated liquids for the health and beauty market. Rieke’s emphasis on highly-engineered solutions and product development has yielded numerous issued and enforceable patents, with many other patent applications pending.
|
6
|
•
|
Customized Solutions that Enhance Customer Loyalty and Relationships
. A significant portion of Rieke’s products are customized designs that are developed and engineered to address specific customer technical, marketing and sustainability needs, helping to distinguish our customers’ products from that of their competitors. For example, the customization of specialty plastic caps and closures including branding, unique colors, collar sizes, lining and venting results in substantial customer loyalty. The substantial investment in flexible manufacturing cells allows Rieke to offer both short lead-times for high volume products and extensive customization for low order volumes, which provides significant advantages to our consumer packaged goods customer base. In addition, Rieke provides customized dispensing solutions including unique pump designs, precision metering, unique colors and special collar sizes to fit the customer’s bottles. Rieke has also been successful in promoting the sale of complementary products in an effort to achieve preferred supplier status with several customers.
|
|
•
|
Leading Market Positions and Global Presence.
Rieke maintains a global network of manufacturing and distribution sites, to serve our increasingly global customer base. Rieke’s global customers often desire supply chain capability and a flexible manufacturing footprint close to their end markets which result in shorter supply chains, reduced carbon footprint and better sustainability. To serve our customers in Asia, we have design and manufacturing capacity and offer highly engineered dispensing solutions through locations in China, India and Vietnam, and increased our Asian market sales coverage. Additionally, Rieke opened a facility in San Miguel de Allende, Mexico during 2017, to replace an older facility in Mexico City, and provide additional manufacturing capacity to support growth. This flexible manufacturing footprint provides Rieke with multiple alternatives for production to best meet customer requirements and mitigate the impacts of potential trade disruption. The majority of Rieke’s manufacturing facilities around the world have advanced injection molding machines required to manufacture precision engineered dispensing and closure components, as well as automated, high-speed assembly equipment for multi-component products.
|
We believe Rieke has significant opportunities to grow, including the following strategies:
|
•
|
Innovate New Products and New Applications.
Rieke has focused product development capabilities on consumer applications requiring special packaging forms, stylized containers and dispensing systems requiring a high degree of functionality and engineering, as well as evolving its industrial applications to include child resistant closures and other applications. Rieke has a consistent pipeline of new products ready for launch. For example, 52 patents were filed and 25 patents were issued in
2018
. Being a leader in e-commerce packaging allows Rieke to collaborate with Amazon, resulting in innovative solutions, including the E-Commerce Trigger Sprayer, that meets consumers' demands and meets ISTA 6 standards as required by Amazon.
|
|
•
|
Increase Global Presence.
Rieke successfully globalizes its products by customizing products to meet regional market requirements. Our global network of manufacturing and distribution sites ensures customers have a global product standard manufactured locally resulting in reduced order lead-times and product support where our customers require. We believe Rieke is able to offer a wider variety of products to our global customers with enhanced service support and has entered into supply agreements with many of these customers based on our broad product offering. Over the past few years, Rieke has increased its global manufacturing and sales presence, with advanced manufacturing capabilities in China, India, Vietnam and Mexico. We have also increased our sales coverage in Europe and Asia, and in January 2019, closed on the acquisition of Plastic Srl, a manufacturer of polymeric caps and closures for home care product applications, located in Forlì, Italy, which provides us with additional manufacturing capacity and sales presence in Europe. By maintaining a presence in international locations, Rieke focuses on developing new markets and new applications for its products, capitalizing on its global design and manufacturing capabilities.
|
|
•
|
Leverage The TriMas Business Model to Drive Performance.
Rieke is committed to operational excellence and continuous improvement and has utilized the Kaizen methodology within its operations. For example, Rieke is continuously evaluating its floor plans and flow to maximize the efficiency and cost of the manufacturing and assembly processes. Rieke also works diligently to effectively use it materials and to eliminate as much scrap as possible in the manufacturing process. In addition to continuous improvement, Rieke is focused on quality and safety of its products and processes.
|
Marketing, Customers and Distribution
Rieke accesses its markets through direct sales to end-use customers, as well as through leading distributors, where it has enjoyed favorable, long-standing relationships. Rieke employs an internal sales force in North America, Europe and Asia. Rieke focuses its business and sales organization into the health, beauty and home care, food and beverage, and industrial end markets by region, to better provide the breadth of its product portfolio and solutions to its customers, and has recently established a Global Strategic Account sales team. Rieke also uses third-party agents and distributors in key geographic markets, including Europe, South America and Asia. Rieke’s agents and distributors primarily sell to container manufacturers and to users or fillers of containers.
7
Rieke’s end customers include, but are not limited to, agricultural chemical, consumer packaged goods, cosmetic, food, industrial chemical, paint, personal care, petroleum, pharmaceutical and sanitary supply chemical companies, warehouse clubs, retailers and fast food retailers. Rieke may provide its products directly to the end customer, but the end customers may also specify that our products be provided to fillers or packagers. We also supply major container manufacturers around the world. Rieke maintains a customer service center that provides technical support, as well as other technical assistance to customers.
Rieke has manufacturing and distribution facilities in the United States, Mexico, the United Kingdom, Germany, Italy (as a result of the January 2019 acquisition of Plastic Srl), China, India and Vietnam.
Competition
Rieke has a broad range of products in both closures and dispensing systems, and therefore has various competitors in each of our product offerings. We do not believe that there is a single competitor that matches our entire product offering. Depending on the product and customers served, Rieke’s competitors include Albea, Aptar, Bericap, Berry Global, Greif, Phoenix Closures, Silgan, Technocraft and TKPC.
Aerospace (
21%
of
2018
net sales)
Our Aerospace segment is comprised of TriMas Aerospace, which includes the Monogram Aerospace Fasteners, Allfast Fastening Systems, Mac Fasteners and Martinic Engineering brands. We believe TriMas Aerospace is a leading designer and manufacturer of a diverse range of products, including highly-engineered fasteners, collars, blind bolts, rivets and precision-machined components, for use in focused markets within the aerospace industry. In general, these products are customer-specific and are manufactured utilizing customer-qualified and proprietary processes. The products also satisfy rigorous customer approvals or meet unique aerospace industry standards, and as such, we believe there are a limited set of competitors.
We provide products to commercial, maintenance, repair and operations ("MRO"), and military aerospace applications and platforms with sales to original equipment manufacturers ("OEMs"), supply chain distributors, MRO/aftermarket providers and tier one suppliers. Our customer-specified and/or qualified products are used in production of significant long-term aircraft programs, including several Boeing and Airbus commercial jetliner programs. Based on Boeing and Airbus' future aircraft delivery projections, it is estimated that commercial production will remain at stable levels through the next several years.
We believe our brands are well established and recognized in their markets. The TriMas Aerospace product offering is as follows:
|
•
|
Monogram Aerospace Fasteners (“Monogram”).
The product offering includes permanent threaded blind bolts, including high-strength, rotary-actuated blind bolts that allow sections of aircraft to be joined together when access is limited to only one side of the airframe, providing cost efficiencies over conventional two piece fastening devices. Monogram also provides collars and temporary fasteners used in aircraft construction and assembly.
|
|
•
|
Allfast Fastening Systems (“Allfast”).
The product offering includes solid and blind rivets, blind bolts, temporary fasteners and installation tools for the aerospace industry.
|
|
•
|
Mac Fasteners.
The product offering consists of high-volume, standard aerospace screws and bolts, including NAS, MS, AN and AS standards.
|
|
•
|
Martinic Engineering.
The product offering includes highly-engineered, precision machined, complex machine-to-print parts for aerospace applications, including auxiliary power units, as well as electrical, hydraulic and pneumatic systems. Effective in the first quarter of 2019, Martinic Engineering will be reported within the Specialty Products segment.
|
Competitive Strengths
We believe TriMas Aerospace benefits from the following competitive strengths:
|
•
|
Broad Product Portfolio of Established Brands
. We believe that TriMas Aerospace is a leading designer and manufacturer of fasteners and other complex, precision-machined components for the aerospace industry. The combination of the Monogram, Allfast and Mac Fasteners brands enables TriMas Aerospace to offer a wide range of fastener products which address a broad scope of customer requirements, providing scale to customers who continue to rationalize their supply base. In several of the product categories, including rotary-actuated blind bolts and blind and solid rivets, TriMas Aerospace has a meaningful market share with well-known and established brands.
|
8
|
•
|
Product Innovation.
We believe that TriMas Aerospace’s engineering, research and development capability and new product focus are competitive advantages. For many years, TriMas Aerospace’s product development programs have provided innovative and proprietary product solutions. We believe our customer-focused approach to provide cost-effective technical solutions will drive the development of new products and create new opportunities for growth. Our innovation team adds value by working directly with our customers to address assembly and manufacturing process challenges to increase productivity, quality, speed and efficiency, while reducing overall installed cost.
|
|
•
|
Leading Manufacturing Capabilities and Processes.
We believe that TriMas Aerospace is a leading manufacturer of precision engineered components for the aerospace industry. Given industry regulatory requirements, as well as customer requirements, it is required that these products need to be manufactured within tight tolerances and specifications, often out of hard-to-work-with materials including titanium, inconel and specialty steels. Many of TriMas Aerospace’s products, facilities and manufacturing processes are required to be qualified and/or certified. Key certifications in TriMas Aerospace include: AS9100:2009 Revision D; ISO9001:2008; TSO; and NADCAP for non-destructive testing, heat treatment, wet processes and materials testing. While proprietary products and patents are important, having proprietary manufacturing processes and capabilities makes TriMas Aerospace’s products difficult to replicate. We believe TriMas Aerospace’s manufacturing processes, capabilities and quality focus create a competitive strength for the business.
|
Strategies
We believe TriMas Aerospace has significant opportunities to grow and improve, based on the following strategies:
|
•
|
Develop, Qualify and Commercialize Innovative Fastener Products
. TriMas Aerospace has a history of successfully developing and introducing new products and there are currently several new product initiatives underway. We focus on expanding our current products into new applications on the aircraft, as well as securing qualified products onto new programs. TriMas Aerospace products contain patent protection, with additional patents pending, and are manufactured using proprietary manufacturing processes and “know-how.” TriMas Aerospace has developed new fastener products that offer a flush break upon installation and is developing and testing other fastener designs which offer improved clamping characteristics on composite structures. An example of such would include the newer Composi-Lite™ fastener, affording significant installed weight savings in concert with fuel efficient aircraft designs. TriMas Aerospace has also recently designed the next generation temporary fastener with an 800% increase in clamping force called Fastack® SC (Super Clamp). TriMas Aerospace has also expanded its fastener offerings to include other fastening product applications on current aircraft, including the expansion of its suite of collar families used in traditional two-sided assembly. The close working relationship between our sales and engineering teams and our customers’ engineering teams is key to developing future products desired and required by our customers.
|
|
•
|
Leverage the TriMas Business Model
. TriMas Aerospace is focused on continuously improving its processes and manufacturing operations by using the tools of Kaizen and automation, as applicable. The aerospace industry has strict requirements for quality and delivery, making process innovation and continuous improvement vital to TriMas Aerospace's success. In addition, the combined product sets of the Monogram, Allfast and Mac Fasteners brands uniquely position us to benefit from platform-wide supply opportunities. In addition, our aerospace platform should benefit from leveraging combined purchasing activities and other back-office functions, joint commercial and product development efforts, and sharing of best practices among previously separate businesses. TriMas Aerospace customers benefit from a combined product portfolio of proprietary products and product development efforts. As a result of these strong customer relationships and operational excellence in 2018, TriMas Aerospace has been recognized by our customers, including receipt of the Boeing Performance Excellence Award for the seventh year in a row and the 2018 Best Performer Award from Airbus.
|
Marketing, Customers and Distribution
TriMas Aerospace serves both OEM and aftermarket customers on a wide variety of platforms. Given the focused nature of many of our products, TriMas Aerospace relies upon a global sales force that is knowledgeable of both OEM customers and the established network of independent distributors. Although the markets for fasteners and complex machine components are highly competitive, we provide products and services primarily for specialized markets, and compete principally on technology, quality and service. TriMas Aerospace works directly with aircraft manufacturers to develop and test new products and improve existing products. TriMas Aerospace’s primary customers include OEMs, supply chain distributors, tier one suppliers and the United States government.
9
TriMas Aerospace's manufacturing facilities are located in the United States, and it exports products to Europe, South America and Asia.
Competition
Depending on the product and customers served, our primary competitors include Ateliers de la Haute Garonne, Arconic, Inc., Cherry Aerospace (Precision Castparts Corp.) and LISI Aerospace. We believe that we are a leader in the blind bolt market with significant market share in all blind fastener product categories in which we compete.
Specialty Products (
37%
of
2018
net sales)
Our Specialty Products segment is comprised of Norris Cylinder, Lamons and Arrow Engine Company. We believe these businesses are well established and recognized in their respective markets, and in general, their products are highly-engineered, customer-specific items that are sold into focused markets.
|
•
|
Norris Cylinder
. We believe Norris Cylinder is a leading designer, manufacturer and distributor of highly-engineered steel cylinders for use in industrial, construction, health care and defense end markets. We believe that Norris Cylinder is a leading provider of a complete line of large, intermediate and small size, high and low-pressure steel cylinders for the transportation, storage and dispensing of compressed gases. Norris Cylinder’s large high-pressure seamless gas cylinders are used principally for shipping, storing and dispensing oxygen, nitrogen, argon, helium and other compressed gases. In addition, Norris Cylinder offers a complete line of steel cylinders used to contain and dispense acetylene gas for the welding and cutting industries. Norris Cylinder's products meet the rigorous standards required by the Department of Transportation ("DOT") or International Standards Organization ("ISO"), which certifies a cylinder's adequacy to perform in specific applications. Norris Cylinder markets cylinders primarily to domestic and international industrial gas producers and distributors, welding equipment distributors and equipment manufacturers. Given this customer base, Norris Cylinder tends to grow in times of increased industrial and infrastructure investment.
|
|
•
|
Lamons.
We believe Lamons is a leading designer, manufacturer and distributor of industrial sealing, fastener and specialty products for the petrochemical, petroleum refining, oil field, water/waste water treatment and other industrial markets. These products are used in recurring MRO activities, as well as in the construction of new facilities or capacity expansions for industrial OEMs. Our sealing and fastener solutions typically represent a low-cost element of an overall project spend, but many times are needed with quick-turn capabilities to minimize our customers' facility down-time, as well as operate in harsh conditions with severe consequences of failure. As a result, we believe customers often choose to work with Lamons, given its long-standing, reputable brand name known for quality products and expedited customer service.
|
|
•
|
Arrow Engine
. We believe that Arrow Engine is a leading provider of natural gas powered wellhead engines, compressors and replacement parts, all engineered for use in oil and natural gas production and other industrial and commercial markets. As Arrow's engines can operate from the natural gas produced at the wellhead, we believe Arrow is uniquely positioned to provide its products for remote pump jack installations. Arrow Engine distributes its products through a worldwide distribution network with a particularly strong presence in the United States and Canada. Arrow Engine manufactures its own engine line and also offers a wide variety of spare parts for various industrial engines not manufactured by Arrow Engine, including selected engines manufactured and sold under the Caterpillar
®
, Waukesha
®
and Ajax
®
brands. Arrow Engine has expanded its product line to include compressors and compressor packaging, as well as certain gas production equipment.
|
Competitive Strengths
We believe Norris Cylinder, Lamons and Arrow Engine benefit from the following competitive strengths:
|
•
|
Leading Market Positions and Strong Brand Names
. Norris Cylinder, with more than 70 years of experience, is one of the worlds' largest manufacturers of high- and low-pressure steel cylinders, and the only manufacturer in the United States. We believe that Norris has a reputation for high-quality cylinders used in a variety of applications, including industrial gas, welding and cutting, government, medical, laboratories, food and beverage technology, breathing air, fire protection and aviation. We also believe Lamons is one of the largest gasket and bolt suppliers to the U.S. energy market. We believe that Lamons is known as a quality brand and offers premium service to the industry. We also believe that our facilities have the latest proprietary technology and equipment to be able to produce urgent requirement gaskets and bolts locally to meet our customers’ demands. We believe that Arrow Engine has also built a reputation for quality equipment, parts and accessories used in oil and natural gas production, and has a leading market position in the niche it serves.
|
10
|
•
|
Comprehensive Product Offering
. Norris Cylinder offers a complete line of large, intermediate and small size, high and low-pressure steel cylinders to its customers across a variety of end markets. Lamons offers a full suite of custom and standard metallic and nonmetallic gasket and bolt products to the petroleum refining, petrochemical, oil field and industrial markets. Over the years, Lamons expanded its product offering to include custom-manufactured, specialty bolts of various sizes, other CNC-machined components and isolation gasket kits. Arrow Engine also provides a comprehensive product offering, including engines, compressors, chemical pumps, generator sets, electronics and replacement parts to a variety of oilfield and industrial markets.
|
|
•
|
Established and Extensive Distribution Channels
. Lamons utilizes an established hub-and-spoke distribution system whereby our primary manufacturing facility supplies products to our own branches and a highly knowledgeable network of worldwide distributors and licensees, which are located in close proximity to our primary customers. Enabled by its branch network and close proximity to its customers, Lamons' ability to provide quick turn-around and customized solutions for its customers provides a competitive advantage. Norris Cylinder has long-standing customer relationships and distributes directly to major gas companies, as well as distributing to domestic buying groups, OEMs, medium and small independent gas companies, and independent gas and welding distributors.
|
Strategies
Over the past several years, we realigned these businesses to better align with demand levels, especially in our energy-facing businesses. We are now focused on continuous improvement opportunities that will positively impact these businesses. We believe there are additional opportunities to improve margins, while maintaining market leadership, including:
|
•
|
Leverage The TriMas Business Model to Drive Performance.
Over the past couple of years, we reduced our cost structure through ongoing manufacturing, overhead and administrative productivity initiatives, and global sourcing of certain components. At Lamons and Arrow Engine, we performed a comprehensive review of our physical footprint and have closed or consolidated locations to reduce and realign our fixed cost structure to current market demand levels. We have also reconfigured our facilities to increase efficiency and reduce our operating cost structure, allowing for incremental capacity. Norris Cylinder has deployed previously acquired assets to mitigate risk, improve efficiency and support its future expected growth, increasing its manufacturing flexibility for both large and small high pressure cylinders. We have also variablized Arrow Engine's cost structure to respond quickly to end market changes and enhance flexibility, driving low cost sourcing efforts, and focusing on additional productivity and Lean initiatives. We are also working to mitigate material cost increases and indirect impacts of tariffs through commercial negotiations, sourcing actions, leveraging existing footprint and cost savings initiatives. We believe that there are also additional opportunities to improve our operational efficiency through continued implementation of Lean-based manufacturing initiatives. Through the methods of Kanban and improved production planning, inventory management and order fulfillment processes, we believe Lamons can improve its margins, while reducing product lead-times and increasing customer fill-rates.
|
|
•
|
Expand Offering and Markets.
Norris Cylinder has been pursuing new end markets such as cylinders for use as hydrogen fuel cells in storage (cell towers), transport (fork trucks), breathing air applications and in fire suppression. Norris Cylinder has also created new designs for seamless acetylene applications in marine and international markets. Over the past few years, we have also launched several new highly-engineered and specialty products and have broadened our specialty bolt offering at Lamons. Examples of new products include: WRI-LP gaskets, a hydrofluoric acid gasket solution; inhibitor gaskets designed to prevent corrosion in offshore platform flanges; IsoTek
TM
Gaskets, an engineered sealing solution for flanged pipe connections; hose products; and intelligent bolts, which provide more reliable load indication. Arrow Engine continues to expand its product portfolio to serve new customers and new applications for oil and natural gas production in all areas of the industry, including shale drilling. Arrow Engine has also launched an offering of customizable compressors and gas production equipment, which are used by existing end customers in the oil and natural gas extraction markets, as well as developed a natural gas compressor used for compressed natural gas filling stations. Although tempered by lower drilling levels over the past few years, Arrow Engine has also been focused on expanding its international sales, particularly in Mexico.
|
11
Marketing, Customers and Distribution
The primary customers of our Specialty Products businesses operate in the oil and gas, industrial and commercial end markets. Given the focused nature of many of our products, we rely upon a combination of a direct sales force and an established network of distributors with familiarity of the end-users. Lamons, for example, relies upon a combination of a direct sales force and an established network of independent distributors and licensees. The close proximity of the sales and distribution network to the customer makes it possible for Lamons to respond to customer-specific engineered applications and provide a high degree of customer service. Norris Cylinder also sells directly to customers and through distributors. Our primary customers include industrial gas producers and distributors, welding equipment distributors, equipment manufacturers, petrochemical companies and refineries.
Norris Cylinder's and Arrow Engine's manufacturing facilities are located are in the United States. Lamons' primary manufacturing facility and the majority of sales and service locations are located in the United States, with additional locations in Belgium, Canada, Singapore, Spain and Thailand.
Competition
Norris Cylinder competes against Worthington, Beijing Tianhai Industry Co., Faber and Vitkovice Cylinders, but is the only remaining steel cylinder manufacturer in the United States. In May 2012, the U.S. International Trade Commission made a unanimous final determination that Norris Cylinder had been materially injured by imports of DOT high-pressure steel cylinders that were being subsidized by the Government of China, as well as being dumped in the U.S. market by producers in China. As a result, trade duties were imposed on the subject imports for a five-year period to create a fairer competitive environment in the United States. The duty was extended and increased for an additional five-year period in 2017, and will be subject to renewal in 2022. We believe Lamons offers a broader gasket and bolt product portfolio than its competitors, as most tend to focus on either gaskets or bolts, but not both. Also, there is a wide range of end markets that consume gasket and bolt products, and Lamons primarily serves midstream and downstream petrochemical and refinery applications. As such, Lamons competes with a wide variety of companies depending on geography and product content, including ERIKS, Flexitallic Group, Garlock (EnPro), GHX, Klinger and Lone Star, but rarely is directly competing with another company across all products. Arrow Engine tends to compete against natural gas powered, lower horsepower, multi-cylinder engines from manufacturers such as Caterpillar, Chevy, Cummins and Ford industrial engines and electric motors.
12
TriMas' Acquisition Strategy
TriMas' capital allocation priorities include reinvesting in production capability and capacity of our businesses, executing treasury actions, such as share buybacks, and accelerating product and geographic expansion through mergers and acquisitions, all while maintaining a disciplined approach to net leverage. We believe that TriMas has opportunities to grow through strategic acquisitions that enhance the strengths of our core businesses. We typically seek "bolt-on" acquisitions, in which we acquire another industry participant or adjacent product lines that expand our existing product offerings, gain access to new customers, end markets and distribution channels, expand our geographic footprint and/or capitalize on scale and cost efficiencies. Our primary focus is on bolt-on acquisition candidates in the Packaging and Aerospace segments, as we believe these segments offer the highest growth and performance profile. While we would also consider opportunistic bolt-on acquisitions in our other, or even a new segment, such transactions are of secondary focus.
Materials and Supply Arrangements
Our largest raw material purchases are for steel, polyethylene and other resins, aluminum, titanium and copper. Raw materials and other supplies used in our operations are normally available from a variety of competing suppliers. In addition to raw materials, we purchase a variety of components and finished products from low-cost sources in China, India, Mexico, South Korea, Thailand and Vietnam.
Steel is purchased primarily from steel mills and service centers with pricing contracts principally in the three-to-six month time frame. Changing global dynamics for steel production and supply will continue to present a challenge to our business. Polyethylene is generally a commodity resin with multiple suppliers capable of providing product globally.
Historically, we have experienced volatility in costs of our raw material purchases and have worked with our suppliers to manage costs and disruptions in supply. We also utilize pricing programs to pass increased steel, resin and other raw material costs to customers. Although we may experience delays in our ability to implement price increases, we have been generally able to recover such increased costs.
Employees and Labor Relations
As of
December 31, 2018
, we employed approximately 4,000 people, of which approximately 44% were located outside the United States and
16%
were unionized. We currently have collective bargaining agreements covering
four
facilities worldwide,
two
of which are in the United States. The two facilities outside the United States with collective bargaining agreements are associated with state-controlled unions.
We believe employee relations are good and are not aware of any present active union organizing activities at any of our facilities. We cannot predict the impact of any further unionization of our workplace. Our labor agreement with the United Automobile, Aerospace and Agricultural Implement Workers of America at our TriMas Aerospace facility in Commerce, California expired in August 2018, at which time we revised the collective bargaining agreement, which now extends to 2021.
Seasonality and Backlog
Our business does not experience significant seasonal fluctuation, other than our fourth quarter, which has tended to be the lowest net sales quarter of the year given holiday shutdowns by certain of our customers and other customers deferring capital spending to the new year. We do not consider sales order backlog to be a material factor in our businesses. Our TriMas Aerospace customers often provide a forward view of build rates and need for products, but firm orders do not extend for more than a few months, and are not guaranteed and subject to change.
Environmental Matters
We are subject to increasingly stringent environmental laws and regulations, including those relating to air emissions, wastewater discharges and chemical and hazardous waste management and disposal. Some of these environmental laws hold owners or operators of land or businesses liable for their own and for previous owners' or operators' releases of hazardous or toxic substances or wastes. Other environmental laws and regulations require the obtainment and compliance with environmental permits. To date, costs of complying with environmental, health and safety requirements have not been material. However, the nature of our operations and our long history of industrial activities at certain of our current or former facilities, as well as those acquired, could potentially result in material environmental liabilities.
Current laws and regulations have not had a material impact on our business, capital expenditures or financial position. However, we must comply with existing and pending climate change legislation, regulation and international treaties or accords. Future events, including those relating to climate change or greenhouse gas regulation could require us to incur expenses related to the modification or curtailment of operations, installation of pollution control equipment or investigation and cleanup of contaminated sites.
13
Intangible Assets
Our identified intangible assets, consisting of customer relationships, trademarks and trade names and technology, are recorded at approximately
$174.5 million
at
December 31, 2018
, net of accumulated amortization. The valuation of each of the identified intangibles was performed using broadly accepted valuation methodologies and techniques.
Customer Relationships.
We have developed and maintained stable, long-term selling relationships with customer groups for specific branded products and/or focused market product offerings within each of our businesses. Useful lives assigned to customer relationship intangibles range from five to 25 years and have been estimated using historic customer retention and turnover data. Other factors considered in evaluating estimated useful lives include the diverse nature of focused markets and products of which we have significant share, how customers in these markets make purchases and these customers' position in the supply chain. We also monitor and evaluate the impact of other evolving risks including the threat of lower cost competitors and evolving technology.
Trademarks and Trade Names.
Each of our businesses designs and manufactures products for focused markets under various trade names and trademarks (see discussion above by reportable segment). Our trademark/trade name intangibles are well-established and considered long-lived assets that require maintenance through advertising and promotion expenditures. Because it is our practice and intent to maintain and to continue to support, develop and market these trademarks/trade names for the foreseeable future, we consider our rights in these trademarks/trade names to have an indefinite life, except as otherwise dictated by applicable law.
Technology.
We hold a number of United States and foreign patents, patent applications, and proprietary product and process-oriented technologies within all three of our reportable segments. We have, and will continue to dedicate, technical resources toward the further development of our products and processes in order to maintain our competitive position in the industrial, commercial and consumer end markets that we serve. Estimated useful lives for our technology intangibles range from one to 30 years and are determined in part by any legal, regulatory or contractual provisions that limit useful life. For example, patent rights have a maximum limit of 20 years in the United States. Other factors considered include the expected use of the technology by the operating groups, the expected useful life of the product and/or product programs to which the technology relates, and the rate of technology adoption by the industry.
International Operations
Approximately
13.9%
of our net sales for the year ended
December 31, 2018
were derived from sales by our businesses located outside of the United States, and we may expand our international operations through organic growth actions and acquisitions. In addition, approximately
15.8%
of our long-lived assets as of
December 31, 2018
were located outside of the United States. We operate manufacturing facilities in Belgium, Canada, China, Germany, India, Italy (as a result of the January 2019 acquisition of Plastic Srl), Mexico, Singapore, Spain, Thailand, the United Kingdom and Vietnam. In addition to the net sales derived from sales by our businesses located outside of the United States, we also generated approximately
$72.7 million
of export sales from the United States. For information pertaining to the net sales and long-lived assets attributed to our international operations, refer to Note
18
, "
Segment Information
," included in Item 8, "
Financial Statements and Supplementary Data
," within this Form 10-K.
Website Access to Company Reports
We use our corporate website, www.trimascorp.com, as a channel for routine distribution of important information, including news releases, company presentation, links to our businesses' websites and financial information. We post filings as soon as reasonably practicable after they are electronically filed with, or furnished to, the Securities and Exchange Commission ("SEC"), including our annual, quarterly, and current reports on Forms 10-K, 10-Q, and 8-K, our proxy statements and any amendments to those reports or statements. All such postings and filings are available under our Investors section of the website free of charge. The SEC also maintains a website, www.sec.gov, that contains reports, proxy and information statements and other information regarding issuers that file electronically with the SEC. The content on any website referred to in this Annual Report on Form 10-K is not incorporated by reference into this Annual Report on Form 10-K unless expressly noted.
14
Item 1A. Risk Factors
You should carefully consider each of the risks described below, together with information included elsewhere in this Annual Report on Form 10-K and other documents we file with the SEC. The risks and uncertainties described below are those that we have identified as material, but are not the only risks and uncertainties facing us. Additional risks and uncertainties not currently known to us or that we currently believe are immaterial may also impact our business operations, financial results and liquidity.
Risks Relating to our Business
Our businesses depend upon general economic conditions and we serve some customers in highly cyclical industries; as such, we may be subject to the loss of sales and margins due to an economic downturn or recession.
Our financial performance depends, in large part, on conditions in the markets that we serve in both the U.S. and global economies. Some of the end markets that we serve are highly cyclical, such as the end markets for oil and gas products and industrial goods, and to a lesser extent, aerospace and consumer products. When combined with ongoing customer consolidation activity and periodic inventory initiatives, an uncertain macro-economic and political climate could lead to reduced demand from our customers, variations in timing of sales to our customers, increased price competition for our products, increased risk of excess and obsolete inventories, uncollectible receivables, and higher overhead costs as a percentage of revenue, all of which could impact our operating margins. If our customers are adversely affected by these factors, we may experience lower product volume orders, which could have an unfavorable impact on our revenue and operating profit. Our inability to forecast precisely the level of our customers’ orders can cause inefficiencies within our installed manufacturing capacity and result in sub-optimal business and financial results.
We are dependent on our manufacturing facilities for the production of our highly engineered products, which subjects us to risks associated with disruptions and changing technology and manufacturing techniques that could place us at a competitive disadvantage.
If our manufacturing facilities become unavailable either temporarily or permanently due to labor disruptions or circumstances beyond our control, such as geopolitical developments or logistical complications arising from acts of war, cyber-attacks, weather, global climate change, earthquakes or other natural disasters, we may be unable to shift production to other facilities or to make up for lost production. For example, our Aerospace manufacturing facilities are predominately located in southern California, an area known for earthquakes, and are thus vulnerable to damage. Any new facility would need to comply with the necessary regulatory requirements, satisfy our specialized manufacturing requirements and require specialized equipment. Even though we carry business interruption insurance policies, any business interruption losses could exceed the coverage available or be excluded from our insurance policies. Any disruption of our ability to operate our business could result in a material decrease in our revenues or significant additional costs to replace, repair or insure our assets, which could have a material adverse impact on our financial condition and results of operations.
In addition, we believe that our customers rigorously evaluate their suppliers on the basis of price competitiveness, product quality, reliability and timeliness of delivery, technical expertise and development capability, new product innovation, product design capability, manufacturing expertise, operational flexibility, customer service and overall management. Our success depends on our ability to continue to meet our customers’ changing expectations with respect to these criteria. We may be unable to install, maintain and certify equipment needed to produce products or upgrade or transition our manufacturing facilities without impacting production rates or requiring other operational efficiency measures at our facilities. We anticipate that we will remain committed to product research and development, advanced manufacturing techniques and service to remain competitive, which entails significant costs; however, we may be unable to address technological advances, implement new and more cost-effective manufacturing techniques, or introduce new or improved products, whether in existing or new markets, so as to maintain our businesses’ competitive positions or to grow our businesses as desired.
Many of the markets we serve are highly competitive, which could limit sales volumes and reduce our operating margins.
Many of our products are sold in competitive markets. We believe that the principal points of competition in our markets are price, product quality, delivery performance, design and engineering capabilities, product development, conformity to customer specifications, customer service and effectiveness of distribution. Maintaining and improving our competitive position will require continued investment by us in manufacturing, engineering, quality standards, marketing, customer service and support of our distribution networks. We may have insufficient resources in the future to continue to make such investments and, even if we make such investments, we may not be able to maintain or improve our competitive position. We also face the risk of lower-cost foreign manufacturers located in China, Southeast Asia, India and other regions competing in the markets for our products and we may be driven as a consequence of this competition to increase our investment overseas. Making overseas investments can be highly complicated and we may not always realize the advantages we anticipate from any such investments. Competitive pressure may limit the volume of products that we sell and reduce our operating margins.
15
We may be unable to successfully implement our business strategies.
We have a long history of acquisitions and divestitures, and we continuously evaluate strategic opportunities and other investment activities. From time to time, we may engage in one or more strategic transactions. If we do so, it may or may not meet the intended strategic objective. These strategic transactions may require integration expense and actions that may negatively affect our results of operations and that could not have been fully anticipated beforehand. In addition, attractive strategic transaction opportunities may not be identified or pursued in the future, financing for strategic transactions may be unavailable on satisfactory terms and we may be unable to accomplish our strategic objectives in effecting a particular strategic transaction. We may encounter various risks in pursuing such strategic transactions, including the possible inability to integrate an acquired business into our operations, the disruption of our ongoing business, diversion of management’s attention, increased expenses, increased debt obligations to finance such strategic transactions, unanticipated problems or liabilities, the failure of such transactions to be completed, or the failure to realize the financial and strategic benefits contemplated at the time of a transaction, some or all of which could materially and adversely affect our business strategy and financial condition and results of operations.
Trends in oil and natural gas prices may affect the demand for, and profitability of, our energy-related products and services, which could have a material adverse effect on our business, consolidated results of operations, and consolidated financial condition.
The oil and gas industry historically has experienced periodic downturns. Demand for our energy-related products, such as pump jack engines and compressors, gaskets, fasteners, hoses and compression products is sensitive to the level of production activity of, and the corresponding capital spending by, oil and natural gas companies. The level of production activity is directly affected by trends in oil (and related derivatives) and natural gas prices, which have been at lower levels over the past three years, and may continue to remain at depressed levels and be subject to future volatility.
Prices for oil and natural gas are subject to large fluctuations in response to changes in the supply of and demand for oil and natural gas, market uncertainty, geopolitical developments, alternative production methods and a variety of other factors that are beyond our control. Even the perception of longer-term lower oil and natural gas prices can reduce or defer major capital expenditures by our customers in the oil and gas industry. Given the long-term nature of many large-scale development projects, a significant or extended downturn in the oil and gas industry could result in the reduction in demand for our energy-related products, and could have a material adverse effect on our business, consolidated results of operations and consolidated financial condition.
Compliance with and changes in tax laws, including tax reform legislation in the United States, could materially and adversely impact our financial condition, results of operations and cash flows.
We are subject to extensive tax liabilities, including federal, state and foreign income taxes and transactional taxes such as excise, sales and use, payroll, franchise, withholding and property taxes. Many tax liabilities are subject to periodic audits by taxing authorities, and such audits could subject us to additional tax as well as interest and penalties. New tax laws and regulations and changes in existing tax laws and regulations could result in increased expenditures by us for tax liabilities in the future and could materially and adversely impact our financial condition, results of operations and cash flows.
The 2017 Tax Cuts and Jobs Act included substantial changes to U.S. tax law, including a reduction in the corporate tax rate, a limitation on deductibility of interest expense, a limitation on the use of net operating losses to offset future taxable income, the allowance of immediate expensing of capital expenditures and deemed repatriation of foreign earnings. The Company recorded charges of approximately $12.3 million, net, between 2017 and 2018 as a result of adopting the 2017 Tax Cuts and Jobs Act. Any future clarification of the tax law or required change in these charges could adversely affect the Company's business and financial condition.
Increases in our raw material or energy costs or the loss of critical suppliers could adversely affect our profitability and other financial results.
We are sensitive to price movements in our raw materials supply base. Our largest material purchases are for steel, polyethylene and other resins, aluminum, titanium and copper. Prices for these products fluctuate with market conditions, and have generally increased over time. We may be unable to offset the impact with price increases on a timely basis due to outstanding commitments to our customers, competitive considerations or our customers’ resistance to accepting such price increases and our financial performance could be adversely impacted. A failure by our suppliers to continue to supply us with certain raw materials or component parts on commercially reasonable terms, or at all, could have a material adverse effect on us. To the extent there are energy supply disruptions or material fluctuations in energy costs, our margins could be materially adversely impacted.
16
Our business may be exposed to risks associated with an increasingly concentrated customer base.
While no individual customer accounted for 10% or more of our consolidated net sales for 2018, 2017 or 2016, our customer base has become, and may further become, increasingly concentrated as a result of customer consolidations and/or through our sales growth to new and existing customers. In 2018, our Packaging and Aerospace reportable segments each had either one or two customers that comprised more than 10% of its segment revenue. As a result of these factors, certain customers may expose our business and results of operations to greater volatility. The mix and type of customers, and sales to any single customer, may vary significantly from quarter to quarter and from year to year, and have a significant impact on our financial condition, results of operations and cash flows. If customers do not place orders, or they substantially reduce, delay or cancel orders, we may not be able to replace the business, which may have a significant adverse impact on our results of operations and financial condition. Major customers may also seek pricing, payment, intellectual property-related, or other commercial terms that are less favorable to us, which may have a negative impact on our business. The concentration of our customer base also increases our risks related to the financial condition of our customers, and the deterioration in financial condition of customers or the failure of customers to perform their obligations could have a material adverse effect on our results of operations and cash flows.
A major failure of our information systems could harm our business; increased IT security threats and more sophisticated and targeted computer crime could pose a risk to our systems, networks, and products.
We depend on integrated information systems to conduct our business. While we maintain some of our critical information systems, we are also dependent on third parties to provide important services relating to, among other things, operational technology at our facilities, human resources, electronic communications and certain finance functions. We may experience operating problems with our information systems as a result of system failures, viruses, computer hackers or other causes. Any significant disruption or slowdown of our systems could cause customers to cancel orders or cause standard business processes to become inefficient or ineffective.
We have experienced cyber-attacks in the past and, while none of these cyber-attacks resulted in a material disruption to our business, we may experience additional cyber-attacks in the future. Increased global IT security threats and more sophisticated and targeted computer crime pose a risk to the security of our systems and networks and the confidentiality, availability and integrity of our data and communications. While we attempt to mitigate these risks by employing a number of measures, including employee training, comprehensive monitoring of our networks and systems, and maintenance of backup and protective systems, our networks and systems remain potentially vulnerable to advanced persistent threats. Furthermore, we may have little or no oversight with respect to security measures employed by third-party service providers, which may ultimately prove to be ineffective at countering threats. Depending on their nature and scope, such threats could potentially lead to the compromising of confidential information and communications, improper use of our systems and networks, manipulation and destruction of data, defective products, production downtimes and operational disruptions, which in turn could adversely affect our reputation, competitiveness and results of operations.
Significant developments from the recent and potential changes in U.S. trade policies could have a material adverse effect on us and our financial condition and results of operations.
Existing free trade laws and regulations, such as the North American Free Trade Agreement and/or other trade agreements, provide certain beneficial duties and tariffs on qualifying imports and exports, subject to compliance with the applicable classification and other requirements. The U.S. government has indicated its intent to alter its approach to international trade policy and in some cases to renegotiate, or potentially terminate, certain existing bilateral or multi-lateral trade agreements and treaties with foreign countries. For example, throughout 2018, the U.S. government implemented additional tariffs on certain goods imported from China. These tariffs, and other governmental actions relating to international trade agreements or policies, the adoption and expansion of trade restrictions, or the occurrence of a trade war may adversely impact demand for our products, costs, customers, suppliers and/or the U.S. economy or certain sectors thereof and, as a result, adversely impact our business. These tariffs and actions may, directly or indirectly, lead to higher costs and cause us to increase prices to our customers which may reduce demand, or, if we are unable to increase prices, result in lowering our margin on products sold. For example, in 2018, we experienced higher input costs as a direct result of recently imposed tariffs on certain raw materials and components imported from China. In addition, our U.S. suppliers raised prices for certain components in response to an overall increase in demand for domestic sources as a result of recently imposed tariffs. It remains unclear what the U.S. or foreign governments will or will not do with respect to tariffs, international trade agreements and policies on a short-term or long-term basis. Additional changes in laws or policies governing the terms of foreign trade, and in particular increased trade restrictions, tariffs or taxes on imports from countries where we manufacture or purchase products could have a material adverse effect on our business and financial results.
17
Our ability to deliver products that satisfy customer requirements is dependent on the performance of our subcontractors and suppliers, as well as on the availability of raw materials and other components.
We rely on other companies, including subcontractors and suppliers, to provide and produce raw materials, integrated components and sub-assemblies and production commodities included in, or used in the production of, our products. If one or more of our suppliers or subcontractors experiences delivery delays or other performance problems, we may be unable to meet commitments to our customers or incur additional costs and penalties. In some instances, we depend upon a single source of supply. Any service disruption from one of these suppliers, either due to circumstances beyond the supplier’s control, such as geopolitical developments or logistical complications due to weather, global climate change, earthquakes or other natural disasters, or as a result of performance problems or financial difficulties, could have a material adverse effect on our ability to meet commitments to our customers or increase our operating costs.
We have significant goodwill and intangible assets, and future impairment of our goodwill and intangible assets could have a material negative impact on our financial results.
At
December 31, 2018
, our goodwill and intangible assets were approximately
$491.2 million
and represented approximately
44.6%
of our total assets. Based on the results of our annual goodwill and indefinite-lived intangible asset impairment tests, we recorded pre-tax goodwill and indefinite-lived intangible asset impairment charges in 2016 of approximately
$98.9 million
within our Aerospace reporting unit. If we experience declines in sales and operating profit or do not meet our current and forecasted operating budget, we may be subject to additional goodwill and/or other intangible asset impairments in the future. While the fair value of our remaining goodwill exceeds its carrying value, significantly worse financial performance of our businesses, significantly different assumptions regarding future performance of our businesses or significant declines in our stock price could result in future impairment losses. Because of the significance of our goodwill and intangible assets, and based on the magnitude of historical impairment charges, any future impairment of these assets could have a material adverse effect on our financial results.
We have debt principal and interest payment requirements that may restrict our future operations and impair our ability to meet our obligations.
As of
December 31, 2018
, we have approximately
$293.6 million
of outstanding debt. We are subject to variable interest rates on our revolving credit facility. We may experience increases in our interest expense as a result of general increases in interest rate levels. We have no amounts outstanding under our revolving credit facility as of
December 31, 2018
.
Our degree of leverage and level of interest expense may have important consequences, including:
|
•
|
should our leverage increase, it may place us at a competitive disadvantage as compared with our less leveraged competitors and make us more vulnerable in the event of a downturn in general economic conditions or in any of our businesses;
|
|
•
|
our flexibility in planning for, or reacting to, changes in our businesses and the industries in which we operate may be limited;
|
|
•
|
a substantial portion of our cash flow from operations will be dedicated to the payment of annual interest and future principal obligations on our indebtedness, thereby reducing the funds available to us for operations, capital expenditures, acquisitions, future business opportunities or obligations to pay rent in respect of our operating leases; and
|
|
•
|
our operations are restricted by our debt instruments, which contain certain financial and operating covenants, and those restrictions may limit, among other things, our ability to borrow money in the future for working capital, capital expenditures, acquisitions, rent expense or other purposes.
|
Our ability to service our debt and other obligations will depend on our future operating performance, which will be affected by prevailing economic conditions and financial, business and other factors, many of which are beyond our control. Our business may not generate sufficient cash flow, and future financings may not be available to provide sufficient net proceeds, to meet these obligations or to successfully execute our business strategies. See "
Management's Discussion and Analysis of Financial Condition and Results of Operations—Liquidity and Capital Resources.
"
18
Restrictions in our debt instruments limit our ability to take certain actions and breaches thereof could impair our liquidity.
Our revolving credit facility and the indenture governing our senior notes contain covenants that restrict our ability to:
|
•
|
pay dividends or redeem or repurchase capital stock;
|
|
•
|
incur additional indebtedness and grant liens;
|
|
•
|
make acquisitions and joint venture investments; and
|
|
•
|
sell assets.
|
Our debt instruments also require us to comply with financial covenants relating to, among other things, interest coverage and leverage. We may not be able to satisfy these covenants in the future or be able to pursue our strategies within the constraints of these covenants. Substantially all of the assets of our domestic subsidiaries are pledged as collateral. Borrowings under the foreign currency sub limit are secured by a pledge of the assets of the foreign subsidiary borrowers that are party to our revolving credit facility. A breach of a covenant contained in our debt instruments could result in an event of default under one or more of our debt instruments and our lease financing arrangements. Such breaches would permit the lenders to declare all amounts borrowed thereunder to be due and payable, and the commitments of such lenders to make further extensions of credit could be terminated. Each of these circumstances could materially and adversely impair our liquidity.
We may face liability associated with the use of products for which patent ownership or other intellectual property rights are claimed.
We may be subject to claims or inquiries regarding alleged unauthorized use of a third party’s intellectual property. An adverse outcome in any intellectual property litigation could subject us to significant liabilities to third parties, require us to license technology or other intellectual property rights from others, require us to comply with injunctions to cease marketing or using certain products or brands, or require us to redesign, re-engineer, or re-brand certain products or packaging, any of which could affect our business, financial condition and operating results. If we are required to seek licenses under patents or other intellectual property rights of others, we may not be able to acquire these licenses on acceptable terms, if at all. In addition, the cost of responding to an intellectual property infringement claim, in terms of legal fees and expenses and the diversion of management resources, whether or not the claim is valid, could have a material adverse effect on our business, results of operations and financial condition.
We may be unable to adequately protect our intellectual property.
While we believe that our patents, trademarks, know how and other intellectual property have significant value, it is uncertain that this intellectual property or any intellectual property acquired or developed by us in the future, will provide a meaningful competitive advantage. Our patents or pending applications may be challenged, invalidated or circumvented by competitors or rights granted thereunder may not provide meaningful proprietary protection. Moreover, competitors may infringe on our patents or successfully avoid them through design innovation. Policing unauthorized use of our intellectual property is difficult and expensive, and we may not be able to, or have the resources to, prevent misappropriation of our proprietary rights, particularly in countries where the laws may not protect such rights as fully as in the U.S. The cost of protecting our intellectual property may be significant and have a material adverse effect on our financial condition and future results of operations
We may incur material losses and costs as a result of product liability, recall and warranty claims brought against us.
We are subject to a variety of litigation incidental to our businesses, including claims for damages arising out of use of our products, claims relating to intellectual property matters and claims involving employment matters and commercial disputes. We currently carry insurance and maintain reserves for potential product liability claims. However, our insurance coverage may be inadequate if such claims do arise and any liability not covered by insurance could have a material adverse effect on our business. Although we have been able to obtain insurance in amounts we believe to be appropriate to cover such liability to date, our insurance premiums may increase in the future as a consequence of conditions in the insurance business generally or our situation in particular. Any such increase could result in lower operating profit or cause the need to reduce our insurance coverage. In addition, a future claim may be brought against us that could have a material adverse effect on us. Any product liability claim may also include the imposition of punitive damages, the award of which, pursuant to certain state laws, may not be covered by insurance. Our product liability insurance policies have limits that, if exceeded, may result in material costs that could have an adverse effect on our future profitability. In addition, warranty claims are generally not covered by our product liability insurance. Further, any product liability or warranty issues may adversely affect our reputation as a manufacturer of high-quality, safe products, divert management’s attention, and could have a material adverse effect on our business.
19
In addition, the Lamons business within our Specialty Products reportable segment is a party to lawsuits related to asbestos contained in gaskets formerly manufactured by it or its predecessors. Some of this litigation includes claims for punitive and consequential as well as compensatory damages. We are not able to predict the outcome of these matters given that, among other things, claims may be initially made in jurisdictions without specifying the amount sought or by simply stating the minimum or maximum permissible monetary relief, and may be amended to alter the amount sought. Of the
4,820
claims pending at
December 31, 2018
,
49
set forth specific amounts of damages (other than those stating the statutory minimum or maximum). See Note
13
, "
Commitments and Contingencies
," included in Item 8, "
Financial Statements and Supplementary Data
," within this Form 10-K for additional information.
Total settlement costs (exclusive of defense costs) for all such cases, some of which were filed over 25 years ago, have been approximately
$8.9 million
. All relief sought in the asbestos cases is monetary in nature. To date, approximately
40%
of our costs related to settlement and defense of asbestos litigation have been covered by our primary insurance. Effective February 14, 2006, we entered into a coverage-in-place agreement with our first level excess carriers regarding the coverage to be provided to us for asbestos-related claims when the primary insurance is exhausted. The coverage-in-place agreement makes asbestos defense costs and indemnity insurance coverage available to us that might otherwise be disputed by the carriers and provides a methodology for the administration of such expenses. The Company's primary insurance exhausted in November 2018, and the Company will be solely responsible for defense costs and indemnity payments prior to the commencement of coverage under this agreement, the duration of which would be subject to the scope of damage awards and settlements paid. During this period, we may incur significant litigation costs in defending these matters. We also may be required to incur additional defense costs and pay damage awards or settlements or become subject to equitable remedies in the future that could adversely affect our businesses.
Our business may be materially and adversely affected by compliance obligations and liabilities under environmental laws and regulations.
We are subject to increasingly stringent environmental laws and regulations, including those relating to air emissions, wastewater discharges and chemical and hazardous waste management and disposal. Some of these environmental laws hold owners or operators of land or businesses liable for their own and for previous owners’ or operators’ releases of hazardous or toxic substances or wastes. Other environmental laws and regulations require the obtainment and compliance with environmental permits. To date, costs of complying with environmental, health and safety requirements have not been material. However, the nature of our operations and our long history of industrial activities at certain of our current or former facilities, as well as those acquired, could potentially result in material environmental liabilities.
While we must comply with existing and pending climate change legislation, regulation and international treaties or accords, current laws and regulations have not had a material impact on our business, capital expenditures or financial position. Future events, including those relating to climate change or greenhouse gas regulation, could require us to incur expenses related to the modification or curtailment of operations, installation of pollution control equipment or investigation and cleanup of contaminated sites.
Our borrowing costs may be impacted by our credit ratings developed by various rating agencies.
Two major ratings agencies, Standard & Poor’s and Moody’s, evaluate our credit profile on an ongoing basis and have each assigned ratings for our long-term debt. If our credit ratings were to decline, our ability to access certain financial markets may become limited, the perception of us in the view of our customers, suppliers and security holders may worsen and as a result, we may be adversely affected.
We have significant operating lease obligations and our failure to meet those obligations could adversely affect our financial condition.
We lease many of our manufacturing and distribution branch facilities, and certain capital equipment. Our rental expense in
2018
under these operating leases was approximately
$12.3 million
. A failure to pay our rental obligations would constitute a default allowing the applicable landlord to pursue any remedy available to it under applicable law, which would include taking possession of our property and, in the case of real property, evicting us. These leases are categorized as operating leases and are not considered indebtedness for purposes of our debt instruments.
20
We may be subject to further unionization and work stoppages at our facilities or our customers may be subject to work stoppages, which could seriously impact the profitability of our business.
As of
December 31, 2018
, approximately
16%
of our work force was unionized under several different unions and bargaining agreements. We have collective bargaining agreements covering
four
facilities worldwide,
two
of which are in the United States. We are not aware of any present active union organizing drives at any of our other facilities. We cannot predict the impact of any further unionization of our workplace. Our labor agreement with the United Automobile, Aerospace and Agricultural Implement Workers of America at our TriMas Aerospace facility in Commerce, California expired during 2018, at which time we revised the collective bargaining agreement which now extends until 2021.
Many of our direct or indirect customers have unionized work forces. Strikes, work stoppages or slowdowns experienced by these customers or their suppliers could result in slowdowns or closures of assembly plants where our products are included. In addition, organizations responsible for shipping our customers' products may be impacted by occasional strikes or other activity. Any interruption in delivery of our customers' products may reduce demand for our products and have a material adverse effect on us.
Healthcare costs for active employees may exceed projections and may negatively affect our financial results.
We maintain a range of healthcare benefits for our active employees pursuant to labor contracts and otherwise. Healthcare benefits for active employees are provided through comprehensive hospital, surgical and major medical benefit provisions or through health maintenance organizations, all of which are subject to various cost-sharing features. Some of these benefits are provided for in fixed amounts negotiated in labor contracts with the respective unions. If our costs under our benefit programs for active employees exceed our projections, our business and financial results could be materially adversely affected. Additionally, foreign competitors and many domestic competitors provide fewer benefits to their employees, and this difference in cost could adversely impact our competitive position.
A growing portion of our sales may be derived from international sources, which exposes us to certain risks which may adversely affect our financial results and impact our ability to service debt.
We have operations outside of the United States. Approximately
13.9%
of our net sales for the year ended
December 31, 2018
were derived from sales by our subsidiaries located outside of the U.S. In addition, we may expand our international operations through internal growth or acquisitions. International operations, particularly sales to emerging markets and manufacturing in non-U.S. countries, are subject to risks that are not present within U.S. markets, which include, but are not limited to, the following:
|
•
|
volatility of currency exchange between the U.S. dollar and currencies in international markets;
|
|
•
|
changes in local government regulations and policies including, but not limited to, foreign currency exchange controls or monetary policy, governmental embargoes, repatriation of earnings, expropriation of property, duty or tariff restrictions, investment limitations and tax policies;
|
|
•
|
political and economic instability and disruptions, including labor unrest, civil strife, acts of war, guerrilla activities, insurrection and terrorism;
|
|
•
|
legislation that regulates the use of chemicals;
|
|
•
|
disadvantages of competing against companies from countries that are not subject to U.S. laws and regulations, including the Foreign Corrupt Practices Act ("FCPA");
|
|
•
|
compliance with international trade laws and regulations, including export control and economic sanctions, such as anti-dumping duties;
|
|
•
|
difficulties in staffing and managing multi-national operations;
|
|
•
|
limitations on our ability to enforce legal rights and remedies;
|
|
•
|
tax inefficiencies in repatriating cash flow from non-U.S. subsidiaries that could affect our financial results and reduce our ability to service debt;
|
|
•
|
reduced protection of intellectual property rights; and
|
|
•
|
other risks arising out of foreign sovereignty over the areas where our operations are conducted.
|
21
In addition, we could be adversely affected by violations of the FCPA and similar worldwide anti-bribery laws as well as export controls and economic sanction laws. The FCPA and similar anti-bribery laws in other jurisdictions generally prohibit companies and their intermediaries from making improper payments to non-U.S. officials for the purpose of obtaining or retaining business.
Our acquisition and disposition agreements by which we have acquired or sold companies, include indemnification provisions that may not fully protect us and may result in unexpected liabilities.
Certain of the agreements related to the acquisition and disposition of businesses require indemnification against certain liabilities related to the operations of the company for the previous owner. We cannot be assured that any of these indemnification provisions will fully protect us, and as a result we may incur unexpected liabilities that adversely affect our profitability and financial position.
We depend on the services of key individuals and relationships, the loss of which could materially harm us.
Our success will depend, in part, on the efforts of our key leadership, including key technical, commercial and manufacturing personnel. Our future success will also depend on, among other factors, our ability to retain or attract other qualified personnel. The loss of the services of any of our key employees or the failure to retain or attract employees could have a material adverse effect on us.
Economic conditions and regulatory changes leading up to and following the United Kingdom's anticipated exit from the European Union could have a material adverse effect on our business and results of operations.
The United Kingdom's anticipated exit from the European Union and the resulting significant change to the United Kingdom's relationship with the European Union and with countries outside the European Union (and the laws, regulations and trade deals impacting business conducted between them) could disrupt the overall economic growth or stability of the United Kingdom and the European Union and negatively impact our operations. The United Kingdom is currently negotiating the terms of the anticipated exit, with the United Kingdom due to exit the European Union on March 29, 2019. There is significant uncertainty about the terms and timing under which the United Kingdom will leave the European Union. These developments, or the perception that any of them could occur, have had and may continue to have a material adverse effect on global economic conditions and the stability of global financial markets, and may significantly reduce global market liquidity and restrict the ability of key market participants to operate in certain financial markets. Any of these factors could depress economic activity and restrict our access to capital, which could have a material adverse effect on our business, financial condition and results of operations and reduce the price of our equity shares. We operate manufacturing facilities internationally, including in the United Kingdom. Accordingly, the United Kingdom's withdrawal from the European Union may have an adverse impact on our international operations, particularly in the United Kingdom.
Our reputation, ability to do business, and results of operations may be impaired by legal compliance risks.
While we strive to maintain high standards, our internal controls and compliance systems may not always protect us from acts committed by our employees, agents, or business partners that would violate U.S. and/or non-U.S. laws or adequately protect our confidential information, including the laws governing payments to government officials, bribery, fraud, anti-kickback and false claims rules, competition, export and import compliance, money laundering, and data privacy laws, as well as the improper use of proprietary information or social media. Any such allegations, violations of law or improper actions could subject us to civil or criminal investigations in the U.S. and in other jurisdictions, could lead to substantial civil or criminal, monetary and non-monetary penalties, and related shareholder lawsuits, could lead to increased costs of compliance, could damage our reputation and could have a material effect on our financial statements.
If the Cequent spin-off does not qualify as a tax-free transaction, the Company and its shareholders could be subject to substantial tax liabilities.
The separation of our former Cequent businesses from TriMas in 2015 was conditioned on our receipt of an opinion from our tax advisors, in form and substance satisfactory to us, that the distribution of shares of our Cequent businesses in the spin-off qualifies as tax-free to the Cequent businesses, the Company and our shareholders for U.S. federal income tax purposes under Sections 355 and 368(a)(1)(D) and related provisions of the U.S. Internal Revenue Code of 1986, as amended (the “Code”), the Company and other members of our consolidated tax reporting group. The opinion relied on, among other things, various assumptions and representations as to factual matters made by the Company and the Cequent businesses which, if inaccurate or incomplete in any material respect, could jeopardize the conclusions reached by our advisor in its opinion. The opinion is not binding on the Internal Revenue Service (“IRS”), or the courts, and there is no assurance that the IRS or the courts will not challenge the qualification of the spin-off as a transaction under Sections 355 and 368(a) of the Code or that any such challenge would not prevail.
22
If the spin-off were determined not to qualify under Section 355 of the Code, each U.S. holder of our common shares who received shares of the Cequent businesses in connection with the spin-off would generally be treated as having received a taxable distribution of property in an amount equal to the fair market value of the shares of the Cequent businesses that were received. That distribution would be taxable to each such shareholder as a dividend to the extent of our current and accumulated earnings and profits. For each such shareholder, any amount that exceeded our earnings and profits would be treated first as a non-taxable return of capital to the extent of such shareholder’s tax basis in his or her common shares of the Company with any remaining amount being taxed as a capital gain. We would be subject to tax as if we had sold common shares in a taxable sale for their fair market value and we would recognize taxable gain in an amount equal to the excess of the fair market value of such common shares over our tax basis in such common shares, which could have a material adverse impact on our financial condition, results of operations and cash flows.
23
Item 1B. Unresolved Staff Comments
Not applicable.
Item 2. Properties
Properties
Our principal manufacturing facilities range in size from approximately 10,000 square feet to approximately 255,000 square feet. Except as set forth in the table below, all of our manufacturing facilities are owned. The leases for our manufacturing facilities have terms that expire from 2019 through 2029 and are generally renewable, at our option, for various terms, provided that we are not in default under the lease agreements. Substantially all of our owned U.S. real properties are subject to liens in connection with our credit facility. Our executive offices are located in Bloomfield Hills, Michigan under a lease through February 2028. Our buildings have been generally well maintained, are in good operating condition and are adequate for current production requirements.
The following list sets forth the location of our principal owned and leased manufacturing and other facilities used in continuing operations and identifies the principal reportable segment utilizing such facilities as of
December 31, 2018
:
|
Packaging
|
Aerospace
|
Specialty Products
|
|||||
|
United States:
|
|||||||
|
Alabama
|
Huntsville
|
||||||
|
Arkansas
|
Atkins
(1)
|
||||||
|
Arizona
|
Tempe
(1)
Tolleson |
||||||
|
California
|
Irwindale
(1)
Rohnert Park (1) |
City of Industry
Commerce (1)
Stanton
(1)
|
|||||
|
Indiana
|
Auburn
Hamilton (1) |
||||||
|
Kansas
|
Ottawa
|
||||||
|
Ohio
|
New Albany
(1)
|
||||||
|
Oklahoma
|
Tulsa
|
||||||
|
Texas
|
Houston
(1)
Longview |
||||||
|
International:
|
|||||||
|
Belgium
|
Geel, Antwerp
(1)
|
||||||
|
Canada
|
Sarnia, Ontario
(1)
|
||||||
|
China
|
Haining City
(1)
Hangzhou
(1)
|
||||||
|
Germany
|
Neunkirchen
|
||||||
|
India
|
Baddi
New Delhi
(1)
|
||||||
|
Mexico
|
San Miguel de Allende
(1)
|
||||||
|
Singapore
|
Singapore
(1)
|
||||||
|
Thailand
|
Muang Rayong
(1)
|
||||||
|
United Kingdom
|
Leicester
|
||||||
|
Vietnam
|
Thu Dau Mot
(1)
|
||||||
__________________________
|
(1)
|
Represents a leased facility. All such leases are operating leases.
|
24
Item 3. Legal Proceedings
See Note
13
, "
Commitments and Contingencies
" included in Item 8, "
Financial Statements and Supplementary Data
," within this Form 10-K.
Item 4. Mine Safety Disclosures
Not applicable.
Supplementary Item. Executive Officers of the Company
As of
December 31, 2018
, the following were executive officers of the Company:
Thomas A. Amato.
Mr. Amato, age 55, was appointed the Company's president and chief executive officer in July 2016. Previously, he served as chief executive officer and president of Metaldyne, LLC, an international engineered products manufacturing company, from 2009 through 2015, and co-president and chief integration officer of Metaldyne Performance Group, a global manufacturing company formed in mid-2014 and taken public in the same year, from August 2014 through December 2015. Prior to 2009, he served as chairman, chief executive officer, and president of Metaldyne Corporation, a global components manufacturer, and co-chief executive officer of Asahi Tec, a Japanese casting and forging company. Prior to this, Mr. Amato worked at MascoTech in positions of increasing responsibility, and successfully completed several acquisitions and divestitures. During this time, one of his roles was vice president of corporate development for TriMas. From 1987 to 1994, Mr. Amato worked at Imperial Chemical Industries, a large multinational chemical company, as an applications development engineer and, eventually, a group leader.
Robert J. Zalupski
. Mr. Zalupski, age 59, was appointed the Company’s chief financial officer in January 2015. Previously, he served as vice president, finance and treasurer of the Company since 2003 and assumed responsibility for corporate development in March 2010. He joined the Company as director of finance and treasury in 2002, prior to which he worked in the Detroit office of Arthur Andersen. From 1996 through 2001, Mr. Zalupski was a partner in the audit and business advisory services practice of Arthur Andersen providing audit, business consulting, and risk management services to both public and privately held companies in the manufacturing, defense, and automotive industries. Prior to 1996, Mr. Zalupski held various positions of increasing responsibility within the audit practice of Arthur Andersen serving public and privately held clients in a variety of industries.
Joshua A. Sherbin
. Mr. Sherbin, age 55, was appointed the Company’s general counsel and corporate secretary in 2005, vice president and chief compliance officer in May 2008, and senior vice president in March 2016. Prior to joining the Company, he was employed as the North American corporate counsel and corporate secretary for Valeo, a diversified Tier 1 international automotive supplier headquartered in Europe. Prior to joining Valeo in 1997, Mr. Sherbin was senior counsel, assistant corporate secretary for Kelly Services, Inc., an employment staffing company, from 1995 to 1997. From 1988 until 1995, he was an associate with the law firm Butzel Long in its general business practice.
25
PART II
Item 5. Market for Registrant's Common Equity, Related Stockholder Matters and Issuer Purchases of Equity Securities
Our common stock, par value
$0.01
per share, is listed for trading on the NASDAQ Global Select Market under the symbol "TRS." As of
February 22, 2019
, there were
222
holders of record of our common stock.
Our credit agreement and the indenture governing our senior notes restrict the payment of dividends on common stock, as such we did not pay dividends in
2018
or
2017
. Our current policy is to retain earnings to repay debt and finance our operations and acquisitions. See the discussion under Item 7, "
Management's Discussion and Analysis of Financial Condition and Results of Operations—Liquidity and Capital Resources"
and Note
10
to the Company's financial statements captioned "
Long-term Debt,"
included in Item 8, "
Financial Statements and Supplementary Data
," within this Form 10-K.
Performance Graphs
The following graph compares the cumulative total stockholder return from December 31, 2013 through
December 31, 2018
for TriMas common stock, the Russell 2000 Index and the S&P SmallCap 600 Capped Industrials Index. We have assumed that dividends have been reinvested (and taking into account the value of Horizon Global shares distributed in the spin-off) and returns have been weighted-averaged based on market capitalization. The graph assumes that $100 was invested on December 31, 2013 in each of TriMas common stock, the stocks comprising the Russell 2000 Index and the stocks comprising the S&P SmallCap 600 Capped Industrials Index.
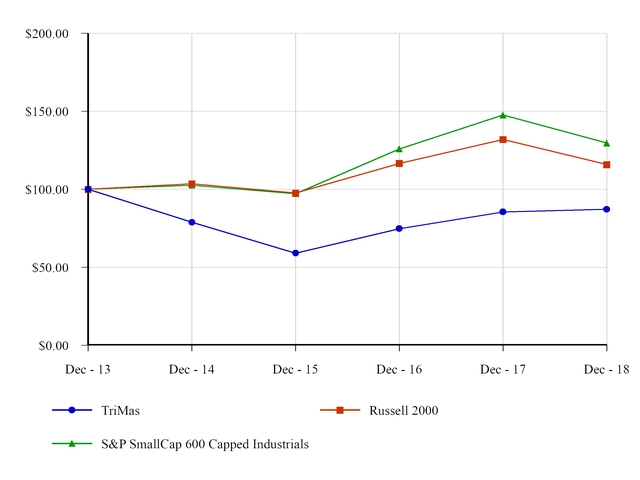
26
The following graph also compares TriMas common stock, the Russell 2000 Index and the S&P SmallCap 600 Capped Industrials Index, but displays the cumulative total stockholder return over a three year period from December 31, 2015 through
December 31, 2018
. Management believes this comparison of more recent relative returns is helpful information, as it highlights TriMas' improved results following the implementation of the TriMas Business Model in 2016. The TriMas Business Model is the common framework under which we operate our multi-industry set of business. We have assumed that dividends have been reinvested and returns have been weighted-averaged based on market capitalization. The graph assumes that $100 was invested on December 31, 2015 in each of TriMas common stock, the stocks comprising the Russell 2000 Index and the stocks comprising the S&P SmallCap 600 Capped Industrials Index.

27
Issuer Purchases of Equity Securities
The following table provides information about purchases made by the Company, or on behalf of the Company by an affiliated purchaser, of shares of the Company's common stock during the three months ended
December 31, 2018
.
|
Period
|
Total Number of Shares Purchased
|
Average Price Paid per Share
|
Total Number of Shares Purchased as Part of Publicly Announced Plans or Programs
(1)
|
Approximate Dollar Value of Shares that May Yet Be Purchased Under the Program
(1)
|
||||||||||
|
October 1, 2018 to October 31, 2018
|
112,036
|
|
$
|
27.76
|
|
112,036
|
|
$
|
43,298,871
|
|
||||
|
November 1, 2018 to November 30, 2018
|
—
|
|
$
|
—
|
|
—
|
|
$
|
43,298,871
|
|
||||
|
December 1, 2018 to December 31, 2018
|
206,458
|
|
$
|
26.39
|
|
206,458
|
|
$
|
37,851,045
|
|
||||
|
Total
|
318,494
|
|
$
|
26.87
|
|
318,494
|
|
$
|
37,851,045
|
|
||||
__________________________
|
(1)
|
Pursuant to a publicly announced share repurchase program from November 2015, during the three months ended
December 31, 2018
, the Company repurchased
318,494
shares of its common stock at a cost of approximately
$8.6 million
. The share repurchase program, pursuant to which the Company is authorized to purchase up to
$50 million
in aggregate of its common stock, is effective and has no expiration date. On February 28, 2019, the Company announced that its Board of Directors increased the Company’s common stock share repurchase authorization to
$75 million
in the aggregate. The increased authorization includes the value of shares already purchased under the previous authorization.
|
28
Item 6. Selected Financial Data
The financial data for each of the five years presented has been derived from our financial statements and notes to those financial statements, which have been audited by Deloitte & Touche LLP. The following data should be read in conjunction with Item 7, "
Management's Discussion and Analysis of Financial Condition and Results of Operations,
" and our audited financial statements included in Item 8, "
Financial Statements and Supplementary Data
," within this Form 10-K. The following tables set forth our selected historical financial data from continuing operations for the five years ended
December 31, 2018
(dollars and shares in thousands, except per share data).
|
|
Year ended December 31,
|
|||||||||||||||||||
|
|
2018
|
2017
|
2016
|
2015
|
2014
|
|||||||||||||||
|
Statement of Operations Data:
|
|
|
|
|
|
|||||||||||||||
|
Net sales
|
$
|
877,140
|
|
$
|
817,740
|
|
$
|
794,020
|
|
$
|
863,980
|
|
$
|
887,300
|
|
|||||
|
Gross profit
|
244,120
|
|
219,390
|
|
210,800
|
|
236,430
|
|
237,250
|
|
||||||||||
|
Operating profit (loss)
(a)
|
122,070
|
|
89,170
|
|
(41,930
|
)
|
(3,170
|
)
|
87,460
|
|
||||||||||
|
Income (loss) from continuing operations
(a)
|
83,300
|
|
30,960
|
|
(39,800
|
)
|
(28,660
|
)
|
46,890
|
|
||||||||||
|
Per Share Data:
|
|
|
|
|
|
|||||||||||||||
|
Basic:
|
|
|
|
|
|
|||||||||||||||
|
Continuing operations
(a)
|
$
|
1.82
|
|
$
|
0.68
|
|
$
|
(0.88
|
)
|
$
|
(0.64
|
)
|
$
|
1.03
|
|
|||||
|
Weighted average shares
|
45,825
|
|
45,683
|
|
45,407
|
|
45,124
|
|
44,882
|
|
||||||||||
|
Diluted:
|
|
|
|
|
|
|||||||||||||||
|
Continuing operations
(a)
|
$
|
1.80
|
|
$
|
0.67
|
|
$
|
(0.88
|
)
|
$
|
(0.64
|
)
|
$
|
1.02
|
|
|||||
|
Weighted average shares
|
46,170
|
|
45,990
|
|
45,407
|
|
45,124
|
|
45,269
|
|
||||||||||
|
|
Year ended December 31,
|
|||||||||||||||||||
|
|
2018
|
2017
|
2016
|
2015
|
2014
|
|||||||||||||||
|
Balance Sheet Data:
|
|
|
|
|
|
|||||||||||||||
|
Total assets
(b)
|
$
|
1,100,520
|
|
$
|
1,033,200
|
|
$
|
1,051,650
|
|
$
|
1,170,300
|
|
$
|
1,625,430
|
|
|||||
|
Total debt
(b)
|
293,560
|
|
303,080
|
|
374,650
|
|
419,630
|
|
630,810
|
|
||||||||||
|
Goodwill and other intangibles
(a)
|
491,180
|
|
513,610
|
|
529,000
|
|
652,790
|
|
757,500
|
|
||||||||||
__________________________
|
(a)
|
During 2016 and 2015, we recorded goodwill and indefinite-lived intangible asset impairment charges totaling approximately
$98.9 million
and
$75.7 million
, respectively. See Note
6
, "
Goodwill and Other Intangibles Assets,
" included in Item 8, "
Financial Statements and Supplementary Data
," within this Form 10-K for further information.
|
|
(b)
|
During 2015, we completed the spin-off of our Cequent businesses, thereby reducing the amount of our total assets and total debt as compared to prior periods. Total assets at December 31, 2014 include approximately $333.3 million of assets related to our Cequent businesses.
|
29
Item 7. Management's Discussion and Analysis of Financial Condition and Results of Operations
The statements in the discussion and analysis regarding industry outlook, our expectations regarding the performance of our business and the other non-historical statements in the discussion and analysis are forward-looking statements. These forward-looking statements are subject to numerous risks and uncertainties, including, but not limited to, the risks and uncertainties described in Item 1A "Risk Factors." Our actual results may differ materially from those contained in or implied by any forward-looking statements. You should read the following discussion together with Item 8, "Financial Statements and Supplementary Data."
Introduction
We are a diversified global manufacturer and provider of products for customers in the consumer products, aerospace, industrial, petrochemical, refinery, and oil and gas end markets. Our wide range of innovative product solutions are engineered and designed to solve application-specific challenges that our customers face. We believe our businesses share important and distinguishing characteristics, including: well-recognized and leading brand names in the focused markets we serve; innovative product technologies and features; customer approved processes and qualified products; established distribution networks; relatively low ongoing capital investment requirements; strong cash flow conversion and long-term growth opportunities. While the majority of our revenue is in the United States, we manufacture and supply products globally to a wide range of companies. We are principally engaged in three reportable segments: Packaging, Aerospace and Specialty Products.
Key Factors and Risks Affecting Our Reported Results
Our businesses and results of operations depend upon general economic conditions. We serve customers in cyclical industries that are highly competitive and are themselves significantly impacted by changes in economic conditions.
There were six significant factors impacting our reported results in 2018 compared with 2017.
The first factor was an increase in sales levels across most of our end markets. Our 2018 net sales increased by 7.3% compared with 2017, with increases in each of our three reportable segments. The sales increase was driven primarily by growth in our health, beauty and home care end market within our Packaging reportable segment, and higher sales levels of steel cylinder and oil and gas-related products within our Specialty Products reportable segment. We believe general industrial activity levels have been higher in 2018 versus 2017, particularly in the United States, and we were well positioned to take advantage of the incremental volume opportunities.
The second factor was continued positive momentum as we further leveraged the TriMas Business Model ("TBM"), which provides for a common platform to operate and manage our multi-industry set of businesses. Using the TBM, we drive and leverage operating improvements through Kaizen and continuous improvement activities, as well as continuously evaluate, realign and streamline fixed and selling, general and administrative expenses. Operating under the TBM contributed to increased operating profit on higher sales levels, as we leveraged our fixed costs at a greater rate than in 2017.
The third factor affecting our year-over-year results was the enactment of the Tax Cuts and Jobs Act (the "Tax Reform Act") on December 22, 2017. We adopted the new legislation in the fourth quarter of 2017, and recorded one-time provisional charges of approximately $12.7 million related to taxing previously deferred foreign income and revaluing our net deferred tax assets. In 2018, we finalized these provisional charges, resulting in a tax benefit of approximately $0.4 million. The impact of these one-time charges resulting from adopting the Tax Reform Act, as well as the impact from the reduction in the U.S. Federal corporate tax rate from 35% to 21%, are the primary reasons for the decrease in our overall effective tax rate from 53.2% in 2017 to 21.4% in 2018.
The fourth factor impacting our 2018 results was an increase of approximately $7 million in material costs over 2017 levels, primarily related to oil and metal-based commodities. These increases primarily impacted our Packaging and Specialty Products reportable segments. Historically, we have been able to work with our suppliers to manage costs. Tactics we employ in mitigating commodity cost increases include commercial pricing adjustments, both contractual and negotiated, resourcing to alternate suppliers to secure better pricing or avoid import and transportation costs, and insourcing to better leverage our global manufacturing footprint. Certain of these measures take time, and in some cases some investment, to implement. We worked diligently on these efforts in 2018, and we believe we recovered or mitigated the majority of the cost increases. Historically, we have been generally able to mitigate the impact of increased commodity costs over time.
30
The fifth factor impacting our reported results was an adjustment in 2018 to terminate a legacy liability of approximately $8.2 million, which resulted in a reduction to corporate office selling, general and administrative expenses. Prior to 2002, we were wholly-owned by Metaldyne Corporation ("Metaldyne"). In connection with the reorganization between TriMas and Metaldyne in June 2002, we assumed certain liabilities and obligations of Metaldyne, mainly comprised of contractual obligations to former TriMas employees, tax-related matters, benefit plan liabilities and reimbursements to Metaldyne of normal course payments to be made on TriMas' behalf. Metaldyne and its U.S. subsidiaries filed voluntary petitions in the United States Bankruptcy Court under Chapter 11 of the U.S. Bankruptcy Code in 2009. In January 2018, the U.S. Bankruptcy Court entered a final decree to close all remaining cases and finalize the Metaldyne bankruptcy distribution trust, effectively terminating any potential obligation by TriMas to Metaldyne.
The sixth factor impacting our reported results was the refinancing of our long-term debt in September 2017, whereby we issued $300 million principal of 4.875% senior unsecured notes due October 2025 ("Senior Notes") at par value in a private placement offering. Proceeds from the Senior Notes offering were used to repay all outstanding obligations of our former senior secured term loan A facility due 2020 ("Term Loan A Facility"), repay a portion of outstanding obligations under our accounts receivable facility and pay fees and expenses related to the refinancing. In connection with the Senior Notes offering, we also amended our existing credit agreement ("Credit Agreement") to increase the level of permitted foreign currency borrowings, resize our revolving loan commitments and extend the maturity to September 2022. We believe the refinancing enhanced our capital structure, and also extended maturity dates and locked-in fixed rate debt at favorable long-term rates. We paid fees and expenses of approximately $10.8 million in connection with refinancing-related activities, of which approximately $6.0 million was capitalized as deferred financing fees and $4.8 million was expensed, which was primarily related to the termination of interest rate swap agreements. In addition, we recorded non-cash charges of approximately $2.0 million related to the write-off of previously capitalized deferred financing fees.
Additional Key Risks that May Affect Our Reported Results
Critical factors affecting our ability to succeed include: our ability to create organic growth through product development, cross-selling and extending product-line offerings, and our ability to quickly and cost-effectively introduce new products; our ability to acquire and integrate companies or products that supplement existing product lines, add new distribution channels or customers, expand our geographic coverage or enable better absorption of overhead costs; our ability to manage our cost structure more efficiently via supply base management, internal sourcing and/or purchasing of materials, selective outsourcing and/or purchasing of support functions, working capital management, and greater leverage of our administrative functions.
Our overall business does not experience significant seasonal fluctuation, other than our fourth quarter, which has tended to be the lowest net sales quarter of the year due to holiday shutdowns at certain customers or other customers deferring capital spending to the following year. Given the short-cycle nature of most of our businesses, we do not consider sales order backlog to be a material factor. A growing amount of our sales is derived from international sources, which exposes us to certain risks, including currency risks.
We are sensitive to price movements in our raw materials supply base. Our largest material purchases are for resins (such as polypropylene and polyethylene), steel, aluminum and other oil and metal-based purchased components. Although we are generally able to mitigate the impact of higher commodity costs, we may experience additional material costs and disruptions in supply in the future and may not be able to pass along higher costs to our customers in the form of price increases.
Certain of our businesses in our Specialty Products reportable segment are sensitive to the demand for natural gas and crude oil in North America. For example, our Arrow Engine business is most directly impacted by these factors, as its engine, pump jack and compressor products are impacted by oil and gas rig counts and well completion activities. In addition, a portion of our Lamons business serves upstream customers at oil well sites that are impacted by fluctuating oil prices. The majority of this business provides parts for oil refineries and petrochemical plants, which may or may not decide to incur capital expenditures for their preventive maintenance or capacity expansion activities, both of which require use of our gaskets and bolts, in times of fluctuating oil prices. Separately, oil-based commodity costs are a significant driver of raw materials and purchased components used within our Packaging reportable segment. Although we have escalator/de-escalator clauses in commercial contracts with certain of our customers, or can modify prices based on market conditions to recover higher costs, we cannot be assured of full cost recovery in the open market.
Each year, as a core tenet of the TBM, our businesses target cost savings from Kaizen and continuous improvement initiatives in an effort to lower input costs or increase throughput and yield rates with a goal of at least covering inflationary and market cost increases. In addition, we continuously review our costs to ensure alignment with current market demand.
31
As our businesses continue to generate cash, we continue to evaluate strategies to redeploy our cash, which includes returning capital to our shareholders. In November 2015, we announced our Board of Directors had authorized us to purchase up to $50 million in the aggregate of our common stock. In 2018, we purchased 442,632 shares of our outstanding common stock for approximately $12.1 million. The 2018 share purchases represent the first stock buyback activity under this authorization.
On February 28, 2019, we announced our Board of Directors increased this authorization to $75 million, which includes the value of shares already purchased under the previous authorization. We will continue to evaluate opportunities to return capital to shareholders through the purchase of our common stock, depending on market conditions and other factors.
32
Segment Information and Supplemental Analysis
The following table summarizes financial information for our three reportable segments (dollars in thousands):
|
|
Year ended December 31,
|
||||||||||||||||||||
|
2018
|
As a Percentage of Net Sales
|
2017
|
As a Percentage of Net Sales
|
2016
|
As a Percentage of Net Sales
|
||||||||||||||||
|
Net Sales
|
|
|
|
|
|
|
|||||||||||||||
|
Packaging
|
$
|
368,200
|
|
42.0
|
%
|
$
|
344,570
|
|
42.1
|
%
|
$
|
341,340
|
|
43.0
|
%
|
||||||
|
Aerospace
|
185,920
|
|
21.2
|
%
|
184,310
|
|
22.6
|
%
|
174,920
|
|
22.0
|
%
|
|||||||||
|
Specialty Products
|
323,020
|
|
36.8
|
%
|
288,860
|
|
35.3
|
%
|
277,760
|
|
35.0
|
%
|
|||||||||
|
Total
|
$
|
877,140
|
|
100.0
|
%
|
$
|
817,740
|
|
100.0
|
%
|
$
|
794,020
|
|
100.0
|
%
|
||||||
|
Gross Profit
|
|
|
|
||||||||||||||||||
|
Packaging
|
$
|
119,620
|
|
32.5
|
%
|
$
|
116,620
|
|
33.8
|
%
|
$
|
121,030
|
|
35.5
|
%
|
||||||
|
Aerospace
|
49,630
|
|
26.7
|
%
|
48,910
|
|
26.5
|
%
|
35,660
|
|
20.4
|
%
|
|||||||||
|
Specialty Products
|
74,870
|
|
23.2
|
%
|
53,860
|
|
18.6
|
%
|
54,110
|
|
19.5
|
%
|
|||||||||
|
Total
|
$
|
244,120
|
|
27.8
|
%
|
$
|
219,390
|
|
26.8
|
%
|
$
|
210,800
|
|
26.5
|
%
|
||||||
|
Selling, General and Administrative
|
|||||||||||||||||||||
|
Packaging
|
$
|
35,030
|
|
9.5
|
%
|
$
|
38,310
|
|
11.1
|
%
|
$
|
42,030
|
|
12.3
|
%
|
||||||
|
Aerospace
|
22,340
|
|
12.0
|
%
|
22,370
|
|
12.1
|
%
|
27,170
|
|
15.5
|
%
|
|||||||||
|
Specialty Products
|
40,360
|
|
12.5
|
%
|
36,910
|
|
12.8
|
%
|
49,850
|
|
17.9
|
%
|
|||||||||
|
Corporate expenses
|
24,070
|
|
N/A
|
|
31,550
|
|
N/A
|
|
32,910
|
|
N/A
|
|
|||||||||
|
Total
|
$
|
121,800
|
|
13.9
|
%
|
$
|
129,140
|
|
15.8
|
%
|
$
|
151,960
|
|
19.1
|
%
|
||||||
|
Operating Profit (Loss)
|
|||||||||||||||||||||
|
Packaging
|
$
|
84,590
|
|
23.0
|
%
|
$
|
80,610
|
|
23.4
|
%
|
$
|
78,630
|
|
23.0
|
%
|
||||||
|
Aerospace
|
27,290
|
|
14.7
|
%
|
26,410
|
|
14.3
|
%
|
(90,540
|
)
|
(51.8
|
)%
|
|||||||||
|
Specialty Products
|
34,260
|
|
10.6
|
%
|
12,280
|
|
4.3
|
%
|
2,900
|
|
1.0
|
%
|
|||||||||
|
Corporate
|
(24,070
|
)
|
N/A
|
|
(30,130
|
)
|
N/A
|
|
(32,920
|
)
|
N/A
|
|
|||||||||
|
Total
|
$
|
122,070
|
|
13.9
|
%
|
$
|
89,170
|
|
10.9
|
%
|
$
|
(41,930
|
)
|
(5.3
|
)%
|
||||||
|
Capital Expenditures
|
|||||||||||||||||||||
|
Packaging
|
$
|
13,590
|
|
3.7
|
%
|
$
|
17,140
|
|
5.0
|
%
|
$
|
19,880
|
|
5.8
|
%
|
||||||
|
Aerospace
|
1,190
|
|
0.6
|
%
|
3,370
|
|
1.8
|
%
|
3,950
|
|
2.3
|
%
|
|||||||||
|
Specialty Products
|
5,380
|
|
1.7
|
%
|
6,830
|
|
2.4
|
%
|
7,470
|
|
2.7
|
%
|
|||||||||
|
Corporate
(a)
|
4,890
|
|
N/A
|
|
9,460
|
|
N/A
|
|
30
|
|
N/A
|
|
|||||||||
|
Total
|
$
|
25,050
|
|
2.9
|
%
|
$
|
36,800
|
|
4.5
|
%
|
$
|
31,330
|
|
3.9
|
%
|
||||||
|
Depreciation
|
|||||||||||||||||||||
|
Packaging
|
$
|
12,510
|
|
3.4
|
%
|
$
|
12,240
|
|
3.6
|
%
|
$
|
12,390
|
|
3.6
|
%
|
||||||
|
Aerospace
|
6,570
|
|
3.5
|
%
|
5,900
|
|
3.2
|
%
|
5,460
|
|
3.1
|
%
|
|||||||||
|
Specialty Products
|
5,220
|
|
1.6
|
%
|
8,630
|
|
3.0
|
%
|
6,260
|
|
2.3
|
%
|
|||||||||
|
Corporate
|
280
|
|
N/A
|
|
180
|
|
N/A
|
|
280
|
|
N/A
|
|
|||||||||
|
Total
|
$
|
24,580
|
|
2.8
|
%
|
$
|
26,950
|
|
3.3
|
%
|
$
|
24,390
|
|
3.1
|
%
|
||||||
|
Amortization
|
|||||||||||||||||||||
|
Packaging
|
$
|
9,110
|
|
2.5
|
%
|
$
|
9,390
|
|
2.7
|
%
|
$
|
9,730
|
|
2.9
|
%
|
||||||
|
Aerospace
|
8,620
|
|
4.6
|
%
|
8,630
|
|
4.7
|
%
|
8,630
|
|
4.9
|
%
|
|||||||||
|
Specialty Products
|
1,710
|
|
0.5
|
%
|
1,900
|
|
0.7
|
%
|
2,110
|
|
0.8
|
%
|
|||||||||
|
Corporate
|
—
|
|
N/A
|
|
—
|
|
N/A
|
|
—
|
|
N/A
|
|
|||||||||
|
Total
|
$
|
19,440
|
|
2.2
|
%
|
$
|
19,920
|
|
2.4
|
%
|
$
|
20,470
|
|
2.6
|
%
|
||||||
________________________________________
(a)
Corporate capital expenditures for the years ended December 31, 2018 and 2017, respectively, are primarily related to purchases of machinery and equipment formerly held under operating leases. These purchased assets were subsequently transferred from Corporate to the reportable segment utilizing the assets.
33
Results of Operations
Year Ended
December 31, 2018
Compared with Year Ended
December 31, 2017
The principal factors impacting us during the year ended
December 31, 2018
, compared with the year ended
December 31, 2017
were:
|
•
|
increased sales levels across our end markets, primarily driven by higher demand for our industrial and oil and gas-related products within our Specialty Products reportable segment and from growth in our health, beauty and home care end market within our Packaging reportable segment;
|
|
•
|
benefits of leveraging the TBM, as we continue to drive operating improvements, as well as evaluate, realign and streamline fixed costs and selling, general and administrative expenses;
|
|
•
|
the impact of the Tax Reform Act, contributing to a lower overall effective tax rate;
|
|
•
|
higher commodity costs, primarily related to oil and steel-based raw materials, primarily impacting our Packaging reportable segment;
|
|
•
|
the termination of the liability to Metaldyne, resulting in an approximate $8.2 million reduction in selling, general and administrative expenses; and
|
|
•
|
the impact of fees and expenses related to our issuance of Senior Notes and other refinancing activities in 2017.
|
Overall, net sales
increased
approximately
$59.4 million
, or approximately
7.3%
, to
$877.1 million
in
2018
, as compared to
$817.7 million
in
2017
, as sales increased in all three reportable segments. Sales of oil and gas-related products increased approximately $17.3 million and sales of our industrial cylinder products increased approximately $16.2 million, both within our Specialty Products reportable segment. Sales of our health, beauty and home care products increased approximately $15.6 million within our Packaging reportable segment. In addition, net sales increased by approximately $2.3 million due to net favorable currency exchange, as our reported results in U.S. dollars were favorably impacted as a result of the weakening U.S. dollar relative to foreign currencies.
Gross profit margin (gross profit as a percentage of sales) approximated
27.8%
and
26.8%
in
2018
and
2017
, respectively. Gross profit increased primarily as a result of higher sales levels and lower facility exit costs, primarily within our Specialty Products and Packaging reportable segments. These increases were partially offset by the impact of higher commodity-related costs, a less favorable product sales mix and pricing pressures, most notably in our health, beauty and home care end market within our Packaging reportable segment.
Operating profit margin (operating profit as a percentage of sales) approximated
13.9%
and
10.9%
in
2018
and
2017
, respectively. Operating profit increased $32.9 million, to
$122.1 million
in
2018
, as compared to
$89.2 million
in
2017
. Operating profit increased primarily due to overall higher sales levels and lower costs to exit, move and consolidate facilities in 2018 as compared to 2017. Operating profit also increased by approximately $8.2 million due to a reduction of our recorded liability to Metaldyne following the U.S. Bankruptcy Court's final decree to close all remaining cases and terminate the Metaldyne bankruptcy distribution trust.
Interest expense decreased approximately $0.5 million, to
$13.9 million
in
2018
, as compared to
$14.4 million
in
2017
, as lower weighted average borrowings more than offset an increase in our interest rates.
In 2017, we incurred debt financing and related expenses of approximately
$6.6 million
related to costs associated with the issuance of our Senior Notes, repayment of all outstanding obligations of our former Term Loan A Facility, termination of the interest rate swaps and the amendment of our Credit Agreement.
Other expense, net increased approximately
$0.3 million
to
$2.2 million
in
2018
, from
$1.9 million
in
2017
, primarily due to an increase in losses on transactions denominated in foreign currencies.
34
Income tax expense decreased approximately $12.6 million, to $22.7 million in 2018, as compared to $35.3 million in 2017. The effective income tax rate for
2018
was
21.4%
, compared to
53.2%
for
2017
. During
2018
, we reported domestic and foreign pre-tax income of approximately
$75.8 million
and
$30.2 million
, respectively, and recognized tax benefits of approximately $1.7 million resulting from research and manufacturing tax incentives. We also recognized approximately $0.4 million of income tax benefit in connection with finalizing the 2017 provisional tax charges recorded associated with adopting the Tax Reform Act. In finalizing these charges, we recorded an approximate $1.1 million income tax benefit related to revaluing our net deferred tax assets at the lower U.S. corporate tax rate, which was partially offset by an approximate $0.7 million income tax expense related to the deemed repatriation of undistributed non-U.S. subsidiary earnings. We also incurred tax charges of approximately
$0.7 million
directly attributable to increases in valuation allowances on certain deferred tax assets including foreign tax operating loss carryforwards. In
2017
, we reported domestic and foreign pre-tax income of approximately
$50.8 million
and
$15.5 million
, respectively, and recognized tax benefits of approximately $2.0 million due to a change in an uncertain tax position for which the statute of limitations expired and research and manufacturing tax incentives. We recognized approximately $12.7 million of income tax expense as a result of the Tax Reform Act, including $3.7 million of provisional expense related to revaluing our net deferred tax assets at the lower U.S. corporate tax rate, and a $9.0 million of provisional tax expense related to the deemed repatriation of approximately $110.0 million of undistributed non-U.S. subsidiary earnings. We also incurred tax charges of approximately
$0.5 million
directly attributable to increases in valuation allowances on certain deferred tax assets including foreign tax operating loss carryforwards.
Net income increased approximately $52.3 million to
$83.3 million
in
2018
, from
$31.0 million
in
2017
. The increase was primarily the result of an approximately $32.9 million increase in operating profit, a decrease in income tax expense of approximately $12.6 million, a decrease in debt financing and related expenses of approximately $6.6 million and a decrease in interest expense of approximately $0.5 million, partially offset by an increase in other expense, net of approximately $0.3 million.
See below for a discussion of operating results by reportable segment.
Packaging.
Net sales
increased
approximately
$23.6 million
, or
6.9%
, to
$368.2 million
in
2018
, as compared to
$344.6 million
in
2017
. Sales of our health, beauty and home care products increased approximately $15.6 million, driven by higher sales in Asia and North America as well as the ramp up of new products. Sales of our industrial closures increased approximately $5.7 million and sales of our food and beverage products increased approximately $0.6 million, both due to increased demand in North America. Additionally, net sales increased by approximately $1.7 million due to favorable currency exchange, as our reported results in U.S. dollars were favorably impacted as a result of the weakening of the U.S. dollar relative to foreign currencies.
Packaging's gross profit
increased
approximately
$3.0 million
to
$119.6 million
, or
32.5%
of sales, in
2018
, as compared to
$116.6 million
, or
33.8%
of sales, in
2017
, primarily as a result higher sales levels, as well as approximately $2.7 million of costs incurred in 2017 to consolidate manufacturing facilities in India and to finalize the move to a new facility in Mexico that did not recur. In addition, gross profit increased due to approximately $0.8 million of favorable currency exchange, as our reported results in U.S. dollars were favorably impacted as a result of the weakening of the U.S. dollar relative to foreign currencies. These increases were partially offset by approximately $3.5 million higher steel and resin-based material costs, as well as a less favorable product sales mix and pricing pressures, most notably in our health, beauty and home care end market.
Packaging's selling, general and administrative expenses
decreased
approximately
$3.3 million
to
$35.0 million
, or
9.5%
of sales, in
2018
, as compared to
$38.3 million
, or
11.1%
of sales, in
2017
, primarily due to approximately $2.7 million lower third-party professional fees in 2018, as well as a charge of approximately $1.0 million in 2017 to reserve for an outstanding accounts receivable deemed uncollectable from a European customer who filed for insolvency. These decreases were partially offset by higher employee-related costs in 2018 supporting our sales growth initiatives.
Packaging's operating profit
increased
approximately
$4.0 million
to
$84.6 million
, or
23.0%
of sales, in
2018
, as compared to
$80.6 million
, or
23.4%
of sales, in
2017
. Operating profit increased primarily due to higher sales levels, lower consolidation and move costs than in 2017, lower selling, general, and administrative expenses and approximately $0.6 million due to favorable currency exchange, all of which were partially offset by higher material costs, a gain of approximately $2.5 million related to the the sale of the former Mexico facility in 2017 that did not recur, a less favorable product sales mix and pricing pressures.
Aerospace.
Net sales
increased
approximately
$1.6 million
, or
0.9%
, to
$185.9 million
in
2018
, as compared to
$184.3 million
in
2017
. Sales of our fastener products increased by approximately $2.3 million, as we achieved higher sales levels consistent with new aircraft build rates. Sales of our machined components products decreased by approximately $0.7 million, as new product sales and the benefit of improved commercial terms with our largest customer for machined components were more than offset by our decision to exit certain less profitable components.
35
Gross profit within Aerospace
increased
approximately
$0.7 million
to
$49.6 million
, or
26.7%
of sales, in
2018
, from
$48.9 million
, or
26.5%
of sales, in
2017
, primarily as a result of higher sales levels. Gross profit margin increased slightly, as a more favorable product sales mix and increased profitability for machined components more than offset the impact of lower profit generated by our standard fastener product facility in Ottawa, Kansas.
Selling, general and administrative expenses remained relatively flat at
$22.3 million
, or
12.0%
of sales, in
2018
, as compared to
$22.4 million
, or
12.1%
of sales, in
2017
.
Operating profit within Aerospace
increased
approximately
$0.9 million
to
$27.3 million
, or
14.7%
of sales, in
2018
, as compared to
$26.4 million
, or
14.3%
of sales, in
2017
, primarily due to higher sales levels, as well as a more favorable product sales mix and increased profitability for machined components, which was partially offset by the impact of lower profit generated by our standard fastener product facility in Ottawa, Kansas.
Specialty Products.
Net sales
increased
approximately $34.1 million, or
11.8%
, to
$323.0 million
in
2018
, as compared to
$288.9 million
in
2017
. Sales of our oil and gas related products increased by approximately $17.3 million, due to higher levels of petrochemical and refinery production site turnaround activity as well as increased sales of engines and compressors to wellhead sites due to higher levels of extraction activity in the United States and Canada. Sales of our steel cylinders for the compressed gas market increased by approximately $16.2 million, as we have captured increased general industrial and defense demand for steel cylinders. In addition, net sales increased by approximately $0.6 million due to favorable currency exchange, as our reported results in U.S. dollars were positively impacted as a result of the weaker U.S. dollar relative to foreign currencies.
Gross profit within Specialty Products
increased
approximately
$21.0 million
to
$74.9 million
, or
23.2%
of sales, in
2018
, as compared to
$53.9 million
, or
18.6%
of sales, in
2017
. Gross profit and margin increased primarily as a result of higher sales levels, as we continue to leverage our lower fixed cost footprint. In addition, gross profit dollars and margin increased as a result of approximately $6.7 million lower costs related to the exit of our former Reynosa, Mexico and Bangalore, India facilities in 2018 compared with 2017. These increases were partially offset by approximately $3 million higher input costs, primarily related to steel.
Selling, general and administrative expenses within Specialty Products
increased
approximately
$3.5 million
to
$40.4 million
, or
12.5%
of sales, in
2018
, as compared to
$36.9 million
, or
12.8%
of net sales, in
2017
. Selling, general and administrative expenses increased primarily due to higher sales levels and approximately $0.7 million of severance and restructuring costs associated with the exit of our Bangalore, India facility in 2018. However, we were able to leverage our lower cost structure, reducing expenses as a percentage of sales.
Operating profit within Specialty Products increased approximately
$22.0 million
to
$34.3 million
, or
10.6%
of sales, in
2018
, as compared to
$12.3 million
, or
4.3%
of sales, in
2017
, primarily as a result of higher sales levels while leveraging a lower cost structure as a result of our facility exits. In addition, we exited our Wolverhampton, United Kingdom facility in 2017 and recorded a pre-tax charge of approximately $3.5 million within net loss on disposition of assets. These decreases were partially offset by higher selling, general and administrative expenses in 2018 to support the higher sales levels and higher steel costs.
Corporate Expenses.
Corporate expenses included in operating profit consist of the following (dollars in millions):
|
|
Year ended December 31,
|
|||||||
|
|
2018
|
2017
|
||||||
|
Corporate operating expenses
|
$
|
22.3
|
|
$
|
20.9
|
|
||
|
Non-cash stock compensation
|
7.2
|
|
6.8
|
|
||||
|
Legacy (income) expenses, net
|
(5.4
|
)
|
2.4
|
|
||||
|
Corporate expenses
|
$
|
24.1
|
|
$
|
30.1
|
|
||
Corporate expenses included in operating profit
decreased
approximately $6.0 million to
$24.1 million
in
2018
, from
$30.1 million
in
2017
, primarily due to the termination of the liability to Metaldyne in 2018, resulting in an approximate $8.2 million non-cash reduction in legacy (income) expenses, net. Corporate operating expenses increased approximately $1.4 million, primarily due to an increase in professional fees related to corporate development activities and an increase in expense related to our short-term incentive compensation plans. Non-cash stock compensation increased approximately $0.4 million, primarily due to the amount of equity grants in 2018 compared with 2017 as well as the estimated attainment of certain performance-based equity awards.
36
Year Ended
December 31, 2017
Compared with Year Ended
December 31, 2016
The principal factors impacting us during the year ended
December 31, 2017
compared with the year ended
December 31, 2016
were:
|
•
|
the impact of improved throughput and productivity in our Aerospace reportable segment, enabling this segment to achieve higher sales and profit levels in 2017;
|
|
•
|
the continued benefits of the realigned footprint within our Specialty Products reportable segment, with lower ongoing operating costs following several facility consolidations and closures;
|
|
•
|
the impact of Hurricane Harvey, primarily within our Specialty Products reportable segment;
|
|
•
|
the impact of fees and expenses related to our issuance of Senior Notes and other refinancing activities in 2017;
|
|
•
|
the impact of the Tax Reform Act, primarily impacting our 2017 income tax expense; and
|
|
•
|
approximately $98.9 million goodwill and intangible asset impairment charges in 2016 in our Aerospace reportable segment.
|
Overall, net sales
increased
approximately
$23.7 million
, or approximately
3.0%
, to
$817.7 million
in
2017
, as compared to
$794.0 million
in
2016
, as sales increased in all three reportable segments. Sales within our Aerospace reportable segment increased approximately $9.4 million, primarily as a result of improved manufacturing throughput to meet customer demand levels. Sales in our Specialty Products reportable segment increased approximately $10.8 million, excluding the impact of currency exchange, due to increased U.S. industrial and oilfield activity and higher sales in North America resulting from improved delivery performance, partially offset by lower sales in Europe as a result of the closure of our Wolverhampton, United Kingdom facility. Sales within our Packaging reportable segment increased by approximately $5.0 million, excluding the impact of currency exchange, primarily due to increased demand for our industrial closures and food and beverage products in North America. These increases were partially offset by approximately $1.4 million of net unfavorable currency exchange, primarily in our Packaging reportable segment, as our reported results in U.S. dollars were negatively impacted as a result of the stronger U.S. dollar relative to foreign currencies.
Gross profit margin (gross profit as a percentage of sales) approximated
26.8%
and
26.5%
in
2017
and
2016
, respectively. Gross profit margin increased primarily due to improved manufacturing efficiency levels and reduced manufacturing spend, primarily within our Aerospace reportable segment, and as a result of the footprint realignment actions within our Specialty Products reportable segment. This increase was partially offset by costs associated with the closure and consolidation of manufacturing facilities in India and Mexico within our Packaging reportable segment, and the Mexico facility within our Specialty Products reportable segment. In addition, gross profit was impacted by approximately $0.8 million of unfavorable currency exchange, as our reported results in U.S. dollars were negatively impacted as a result of the stronger U.S. dollar relative to foreign currencies.
Operating profit (loss) margin (operating profit (loss) as a percentage of sales) approximated
10.9%
and
(5.3)%
in
2017
and
2016
, respectively. Operating profit increased approximately $131.1 million, to
$89.2 million
in
2017
, as compared to an operating loss of
$41.9 million
in
2016
, Operating profit and margin increased primarily due to approximately $98.9 million in goodwill and intangible asset impairment charges in our Aerospace reportable segment in 2016 that did not repeat in 2017. Operating profit and margin also increased as a result of higher sales levels across all reportable segments and productivity initiatives to improve scheduling and throughput, particularly in our Aerospace reportable segment, and the impact of our footprint realignment activities within our Specialty Products reportable segment. These factors were partially offset by the costs incurred in 2017 associated with footprint consolidation and relocation projects within our Packaging and Specialty Products reportable segments.
Interest expense increased approximately $0.7 million, to
$14.4 million
in
2017
, as compared to
$13.7 million
in
2016
. The increase in interest expense was primarily due to an increase in our interest rates, which more than offset lower average borrowings. Our weighted average borrowings decreased to approximately
$381.8 million
in
2017
, from approximately $454.1 million in
2016
. The effective weighted average interest rate on our outstanding variable rate borrowings, including our Credit Agreement and accounts receivable facilities, increased to approximately 2.8% for 2017, from approximately and 2.2% for 2016. In addition, in September 2017, we repaid our former Term Loan A facility with proceeds from the Senior Notes, which bear interest at 4.875%.
We incurred debt financing and related expenses of approximately
$6.6 million
in 2017 related to costs associated with the issuance of our Senior Notes, repayment of all outstanding obligations of the Term Loan A Facility, termination of the interest rate swaps and the amendment of our existing credit agreement.
Other expense, net decreased approximately
$0.7 million
to
$1.9 million
in
2017
, from
$2.6 million
in
2016
. The decrease was primarily due to one-time settlement and curtailment charges of approximately $1.3 million for defined benefit pension plans in 2016 that did not recur, partially offset by an increase in losses on transactions denominated in foreign currencies.
37
Income tax expense increased approximately $53.7 million, to $35.3 million of tax expense in 2017, as compared to $18.4 million of tax benefit in 2016. The effective income tax rate for
2017
was
53.2%
, compared to
31.7%
for
2016
. During
2017
, we reported domestic and foreign pre-tax income of approximately
$50.8 million
and
$15.5 million
, respectively, and recognized tax benefits of approximately $2.0 million due to a change in an uncertain tax position for which the statute of limitations expired and research and manufacturing tax incentives. We also recognized approximately $12.7 million of income tax expense as a result of the Tax Reform Act, including $3.7 million of provisional expense related to revaluing our net deferred tax assets at the lower U.S. corporate tax rate, and $9.0 million of provisional tax expense related to the deemed repatriation of approximately $110.0 million of undistributed non-U.S. subsidiary earnings. We also incurred tax charges of approximately
$0.5 million
directly attributable to increases in valuation allowances on certain deferred tax assets including foreign tax operating loss carryforwards. In
2016
, we reported domestic pre-tax losses of approximately
$69.9 million
and foreign pre-tax income of approximately
$11.6 million
, and recognized tax benefits of approximately $2.2 million due to a change in an uncertain tax position for which the statute of limitations expired and research and manufacturing tax incentives. In addition, we were unable to record tax benefit of approximately
$5.1 million
related to pre-tax goodwill impairment charges in the U.S. We also incurred tax charges of approximately
$2.1 million
directly attributable to increases in valuation allowances on certain deferred tax assets including foreign tax operating loss carryforwards.
Net income (loss) increased approximately $70.8 million, to income of
$31.0 million
in
2017
, from a loss of
$39.8 million
in
2016
. The increase was primarily the result of an approximately $131.1 million increase in operating profit and decreases in other expenses, net of approximately $0.7 million, partially offset by an increase in income tax expense of approximately $53.7 million, an increase in debt financing and related expenses of approximately $6.6 million in connection with the refinancing of our our long-term debt and an increase in interest expense of approximately $0.7 million.
See below for a discussion of operating results by reportable segment.
Packaging.
Net sales
increased
approximately
$3.3 million
, or
0.9%
, to
$344.6 million
in
2017
, as compared to
$341.3 million
in
2016
. Sales of our industrial closures increased approximately $2.7 million due to higher demand in North America and Europe. Sales of our food and beverage products increased approximately $2.3 million due to increased demand in North America. Additionally, sales of our health, beauty and home care products were flat year-over-year, as higher demand in Asia and Europe was offset by lower demand in North America. The sales increase was partially offset by approximately $1.7 million of unfavorable currency exchange, as our reported results in U.S. dollars were negatively impacted as a result of the stronger U.S. dollar relative to foreign currencies.
Packaging's gross profit
decreased
approximately
$4.4 million
to
$116.6 million
, or
33.8%
of sales, in
2017
, as compared to
$121.0 million
, or
35.5%
of sales, in
2016
. While sales increased, gross profit dollars and margin decreased, primarily as a result of costs associated with facility moves. During 2017, we ramped up production in our new manufacturing facility in Mexico, incurring approximately $1.9 million higher costs than in the former, and now closed Mexican facility in 2016, as costs related to the capacity expansion plus inefficiencies and start-up costs more than offset initial move costs incurred in 2016. In addition, we incurred approximately $1.1 million of costs in 2017 to consolidate manufacturing facilities in India. Gross profit also declined due to an unfavorable product sales mix in North America and by approximately $0.9 million due to unfavorable currency exchange, as our reported results in U.S. dollars were negatively impacted as a result of the stronger U.S. dollar relative to foreign currencies.
Packaging's selling, general and administrative expenses
decreased
approximately
$3.7 million
to
$38.3 million
, or
11.1%
of sales, in
2017
, as compared to
$42.0 million
, or
12.3%
of sales, in
2016
. The decrease was primarily due to higher costs incurred in 2016 in connection with re-organizing our go-to-market strategy based on global product categories, as well as generally lower go-forward spending levels resulting from this reorganization. Additionally, we recognized approximately $1.0 million of severance and other costs related to the move of our Mexican facilities during 2016, and recorded an approximate $1.0 million charge in 2017 to reserve an outstanding accounts receivable amount for a European customer who filed for bankruptcy.
Packaging's operating profit
increased
approximately
$2.0 million
to
$80.6 million
, or
23.4%
of sales, in
2017
, as compared to
$78.6 million
, or
23.0%
of sales, in
2016
. Operating profit increased primarily due to lower ongoing selling, general and administrative expenses associated with our re-organization efforts as well as an approximate $2.5 million gain on the sale of the former Mexico facility. These impacts were partially offset by the charge recorded in 2017 to reserve an outstanding accounts receivable amount, costs associated with our India facility consolidation and new facility in Mexico and approximately $0.6 million of unfavorable currency exchange.
Aerospace.
Net sales
increased
approximately
$9.4 million
, or
5.4%
, to
$184.3 million
in
2017
, as compared to
$174.9 million
in
2016
. We continued to improve production scheduling and manufacturing efficiencies, which enabled us to increase daily production rates and ship higher levels of net sales in 2017 as compared to 2016. Sales to our distribution customers increased approximately $7.0 million, as order patterns from our customers continued to stabilize and increase in 2017 as compared to the lower and more volatile levels throughout 2016. Sales to our OE customers increased approximately $2.4 million.
38
Gross profit within Aerospace increased approximately
$13.2 million
to
$48.9 million
, or
26.5%
of sales, in
2017
, from
$35.7 million
, or
20.4%
of sales, in
2016
, primarily as a result of higher sales levels. Further, in 2016, we incurred additional costs and experienced lower fixed cost absorption associated with production scheduling and manufacturing inefficiencies, primarily in our Commerce, California facility. We have improved the efficiency levels during 2017 and reduced manufacturing spend levels despite higher demand level in this facility.
Selling, general and administrative expenses
decreased
approximately
$4.8 million
to
$22.4 million
, or
12.1%
of sales, in
2017
, as compared to
$27.2 million
, or
15.5%
of sales, in
2016
, primarily due to approximately $2.0 million of lower estimated uncollectable accounts receivable expenses as a result of collection of previously reserved customer balances and approximately $2.8 million of reduced professional fees and certain administrative support costs.
Operating profit (loss) within Aerospace
increased
approximately
$116.9 million
to an operating profit of
$26.4 million
, or
14.3%
of sales, in
2017
, as compared to an operating loss of
$90.5 million
, or
51.8%
of sales, in
2016
. Operating profit and related margin increased primarily due to approximately $98.9 million in goodwill and intangible asset impairment charges in 2016 that did not repeat in 2017. Operating profit also increased as a result of higher sales levels, improved production scheduling and manufacturing efficiencies and lower selling, general and administrative expenses.
Specialty Products.
Net sales for
2017
increased
approximately
$11.1 million
, or
4.0%
, to
$288.9 million
, as compared to
$277.8 million
in
2016
. Sales of our oil and gas related products increased by approximately $11.3 million due to increased customer demand following improvements in our on-time delivery, increasing our share of turnaround activity and increases in drilling activity in the United States and Canada and the continued stabilization of oil prices. Sales of our industrial cylinders increased by approximately $4.1 million, primarily due to increased U.S. industrial activity and enhanced responsiveness to support shorter customer order lead-times. These increases were partially offset by a decrease in net sales of oil and gas related products of approximately $4.3 million in Europe, primarily due to exiting our facility in the United Kingdom.
Gross profit within Specialty Products
decreased
approximately $0.2 million to
$53.9 million
, or
18.6%
of sales, in
2017
, as compared to
$54.1 million
, or
19.5%
of sales, in
2016
. While gross profit increased as a result of higher sales levels and improved leverage resulting from our lower fixed cost structure, these impacts were essentially offset by $1.6 million higher facility closure costs in 2017 than in 2016, primarily related to costs incurred in 2017 to close our Mexico facility and costs incurred in 2016 to close our United Kingdom facility, and higher costs, inefficiencies and a less favorable oil and gas product sales mix as a result of Hurricane Harvey in 2017.
Selling, general and administrative expenses within Specialty Products
decreased
approximately $13.0 million to
$36.9 million
, or
12.8%
of sales, in
2017
, as compared to
$49.9 million
, or
17.9%
of sales, in
2016
. Selling, general and administrative expenses decreased by approximately $7.2 million as a result of elimination of costs related to closed facilities and by approximately $1.0 million as a result of an increase in reserves for past due accounts receivable in 2016 that did not repeat in 2017. The remaining $4.8 million decrease was primarily due to lowering our ongoing operating costs associated with the Company's current operating footprint following completion of significant realignment activities.
Operating profit within Specialty Products
increased
approximately
$9.4 million
to
$12.3 million
, or
4.3%
of sales, in
2017
, as compared to
$2.9 million
, or
1.0%
of sales, in
2016
, primarily as a result of lower selling, general and administrative expenses related to prior footprint realignment activities, partially offset by a pre-tax charge of approximately $3.5 million recorded within net loss on disposition of assets related to our 2017 exit of our Wolverhampton, United Kingdom facility.
Corporate Expenses.
Corporate expenses included in operating profit consist of the following (dollars in millions):
|
|
Year ended December 31,
|
|||||||
|
|
2017
|
2016
|
||||||
|
Corporate operating expenses
|
$
|
20.9
|
|
$
|
23.9
|
|
||
|
Non-cash stock compensation
|
6.8
|
|
6.9
|
|
||||
|
Legacy expenses
|
2.4
|
|
2.1
|
|
||||
|
Corporate expenses
|
$
|
30.1
|
|
$
|
32.9
|
|
||
Corporate expenses included in operating profit
decreased
approximately $2.8 million to
$30.1 million
in
2017
, from
$32.9 million
in
2016
, primarily due to separation costs incurred in 2016 associated with the change in our President and CEO as well as elimination of several corporate positions during 2017, partially offset by an increase in expense related to our short-term incentive compensation plans.
39
Liquidity and Capital Resources
Cash Flows
Cash flows provided by operating activities of continuing operations in
2018
were approximately
$129.3 million
, as compared to
$120.1 million
in
2017
. Significant changes in cash flows provided by operating activities of continuing operations and the reasons for such changes are as follows:
|
•
|
In
2018
, the Company generated
$146.0 million
in cash flows, based on the reported net income of
$83.3 million
and after considering the effects of non-cash items related to losses on dispositions of businesses and other assets, depreciation, amortization, changes in deferred income taxes, debt financing and related expenses, stock-based compensation and other operating activities. In
2017
, the Company generated
$111.2 million
in cash flows based on the reported net income of
$31.0 million
and after considering the effects of similar non-cash items.
|
|
•
|
Increases in accounts receivable resulted in a use of cash of approximately
$11.4 million
in
2018
, primarily due to the increase in sales levels and the timing of sales and collection of cash. Decreases in accounts receivable resulted in a source of cash of approximately
$1.2 million
in
2017
. Days sales outstanding of receivables remained flat year-over-year.
|
|
•
|
We increased our investment in inventory by approximately
$18.7 million
in 2018 to support the increased sales levels, nearly $8.0 million of which occurred in the fourth quarter as we received foreign-sourced goods ahead of the expected increase in tariff rates. We reduced our investment in inventory by approximately
$4.4 million
in
2017
, primarily due to our facility consolidation efforts. Our days sales in inventory increased by five days in
2018
as compared to
2017
, primarily as a result of the fourth quarter 2018 increase.
|
|
•
|
Decreases in prepaid expenses and other assets resulted in a source of cash of approximately
$9.1 million
in
2018
, primarily as a result of the timing of payments made for income taxes and certain operating expenses. Increases in prepaid expenses and other assets resulted in a use of cash of approximately
$0.3 million
in
2017
.
|
|
•
|
Increases in accounts payable and accrued liabilities resulted in a source of cash of approximately
$4.3 million
and
$3.6 million
in
2018
and
2017
, respectively, primarily a result of higher purchases of inventory and other supplies to support higher sales demand. Our days accounts payable on hand increased by 10 days year-over-year, primarily due to the mix of payment terms in December 2018, which increased given longer payment terms to certain foreign vendors.
|
Net cash used for investing activities in
2018
was approximately
$24.8 million
, as compared to
$32.4 million
in
2017
. During
2018
, we incurred approximately
$25.1 million
in capital expenditures as we have continued our investment in growth, capacity and productivity-related capital projects. Cash received from the disposition of assets was approximately
$0.3 million
in
2018
. During
2017
, we invested approximately
$36.8 million
in capital expenditures and received cash from the disposition of assets of approximately
$4.5 million
.
Net cash used for financing activities in
2018
was approximately
$24.0 million
, as compared to
$80.8 million
in
2017
. During
2018
, we made net repayments of approximately
$9.4 million
on our revolving credit and accounts receivable facilities. We also purchased approximately
$12.1 million
of outstanding common stock and used a net cash amount of approximately
$2.4 million
related to our stock compensation arrangements. During 2017, we issued $300.0 million principal amount of Senior Notes, repaid approximately $257.9 million on our former Term Loan A facility and made net repayments of approximately $116.0 million on our revolving credit and accounts receivable facilities. In connection with refinancing our long-term debt in 2017, we paid approximately $6.1 million of debt financing fees. We also used a net cash amount of approximately $0.8 million related to our stock compensation arrangements and other financing activities.
40
Our Debt and Other Commitments
The
$300.0 million
aggregate principal amount of Senior Notes accrues interest at a rate of
4.875%
per annum, payable semi-annually in arrears on April 15 and October 15, commencing on April 15, 2018, and mature on October 15, 2025. The payment of principal and interest is jointly and severally guaranteed, on a senior unsecured basis by certain named subsidiaries of the Company (each a "Guarantor" and collectively the "Guarantors"). The Senior Notes are
pari passu
in right of payment with all existing and future senior indebtedness and subordinated to all existing and future secured indebtedness to the extent of the value of the assets securing such indebtedness. For the twelve months ended
December 31, 2018
, our consolidated subsidiaries that do not guarantee the Senior Notes represented approximately
13%
of the total of guarantor and non-guarantor net sales, treating each as a consolidated group and excluding intercompany transactions between guarantor and non-guarantor subsidiaries. In addition, our non-guarantor subsidiaries represented approximately
29%
and
8%
of the total guarantor and non-guarantor assets and liabilities, respectively, as of
December 31, 2018
, treating the guarantor and non-guarantor subsidiaries each as a consolidated group and excluding intercompany transactions between such groups.
Prior to October 15, 2020, we may redeem up to
35%
of the principal amount of the Senior Notes at a redemption price of
104.875%
of the principal amount, plus accrued and unpaid interest, if any, to the redemption date, with the net cash proceeds of one or more equity offerings provided that each such redemption occurs within 90 days of the date of closing of each such equity offering. In addition, we may redeem all or part of the Senior Notes at a redemption price equal to
100%
of the principal amount thereof, plus accrued and unpaid interest, if any, to the redemption date, plus a "make whole" premium.
We are party to a Credit Agreement, consisting of a
$300.0 million
senior secured revolving credit facility, which permits borrowings denominated in specific foreign currencies, subject to a
$125.0 million
sub limit. The Credit Agreement matures on September 20, 2022 and is subject to interest at London Interbank Offered Rate ("LIBOR") plus
1.50%
. The interest rate spread is based upon the leverage ratio, as defined, as of the most recent determination date. The Credit Agreement allows issuance of letters of credit, not to exceed
$40.0 million
in aggregate, against revolving credit facility commitments.
The Credit Agreement also provides for incremental revolving credit commitments in an amount not to exceed the greater of
$200 million
and an amount such that, after giving effect to such incremental commitments and the incurrence of any other indebtedness substantially simultaneously with the making of such commitments, the senior secured net leverage ratio, as defined in the Credit Agreement, is no greater than
3.00
to 1.00. The terms and conditions of any incremental revolving credit facility commitments must be no more favorable than the existing credit facility.
Amounts drawn under our revolving credit facility fluctuate daily based upon our working capital and other ordinary course needs. Availability under our revolving credit facility depends upon, among other things, compliance with our Credit Agreement's financial covenants. Our Credit Agreement contains various negative and affirmative covenants and other requirements affecting us and our subsidiaries, including the ability to, subject to certain exceptions and limitations, incur debt, liens, mergers, investments, loans, advances, guarantee obligations, acquisitions, assets dispositions, sale-leaseback transactions, hedging agreements, dividends and other restricted payments, transactions with affiliates, restrictive agreements and amendments to charters, bylaws, and other material documents. The terms of our Credit Agreement require us and our subsidiaries to meet certain restrictive financial covenants and ratios computed quarterly, including a maximum total net leverage ratio (total consolidated indebtedness plus outstanding amounts under the accounts receivable securitization facility, less the aggregate amount of certain unrestricted cash and unrestricted permitted investments, as defined, over consolidated EBITDA, as defined), a maximum senior secured net leverage ratio (total consolidated senior secured indebtedness, less the aggregate amount of certain unrestricted cash and unrestricted permitted investments, as defined, over consolidated EBITDA, as defined) and a minimum interest expense coverage ratio (consolidated EBITDA, as defined, over the sum of consolidated cash interest expense, as defined, and preferred dividends, as defined). Our permitted total net leverage ratio under the Credit Agreement is
4.00
to 1.00 as of
December 31, 2018
. If we were to complete an acquisition which qualifies for a Covenant Holiday Period, as defined in our Credit Agreement, then our permitted total net leverage ratio cannot exceed
4.50
to 1.00 during that period. Our actual total net leverage ratio was
1.27
to 1.00 at
December 31, 2018
. Our permitted senior secured net leverage ratio under the Credit Agreement is
3.50
to 1.00 as of
December 31, 2018
. If we were to complete an acquisition which qualifies for a Covenant Holiday Period, as defined in our Credit Agreement, then our permitted senior secured net leverage ratio cannot exceed
4.00
to 1.00 during that period. Our actual senior secured net leverage ratio was not meaningful at
December 31, 2018
. Our permitted interest expense coverage ratio under the Credit Agreement is
3.00
to 1.00 and, our actual interest expense coverage ratio was
13.63
to 1.00 as of
December 31, 2018
. At
December 31, 2018
, we were in compliance with our financial and other covenants contained in the Credit Agreement.
41
The following is a reconciliation of net income, as reported, which is a GAAP measure of our operating results, to Consolidated Bank EBITDA, as defined in our Credit Agreement, for the year ended
December 31, 2018
. We present Consolidated Bank EBITDA to show our performance under our financial covenants. Dollars are in thousands in the below tables.
|
|
Year ended
December 31, 2018 |
|||
|
Net income
|
$
|
83,300
|
|
|
|
Bank stipulated adjustments:
|
||||
|
Interest expense, net (as defined)
|
13,910
|
|
||
|
Income tax expense
|
20,950
|
|
||
|
Depreciation and amortization
|
44,020
|
|
||
|
Non-cash compensation expense
(1)
|
7,170
|
|
||
|
Other non-cash expenses or losses
|
3,420
|
|
||
|
Non-recurring expenses or costs
(2)
|
1,830
|
|
||
|
Extraordinary, non-recurring or unusual gains or losses
|
(3,800
|
)
|
||
|
Business and asset dispositions
|
380
|
|
||
|
Casualty or business interruption expenses covered and reimbursed by insurance
|
460
|
|
||
|
Consolidated Bank EBITDA, as defined
|
$
|
171,640
|
|
|
|
|
December 31, 2018
|
||||
|
Total Indebtedness, as defined
(3)
|
$
|
217,990
|
|
||
|
Consolidated Bank EBITDA, as defined
|
171,640
|
|
|||
|
Actual total net leverage ratio
|
1.27
|
|
x
|
||
|
Covenant requirement
|
4.00
|
|
x
|
||
|
|
December 31, 2018
|
||||
|
Total senior secured indebtedness
(4)
|
$
|
(85,950
|
)
|
||
|
Consolidated Bank EBITDA, as defined
|
171,640
|
|
|||
|
Senior secured net leverage ratio
|
n/m
|
|
x
|
||
|
Covenant requirement
|
3.50
|
|
x
|
||
|
|
December 31, 2018
|
|||
|
Interest expense, as defined
|
$
|
13,910
|
|
|
|
Bank stipulated adjustments:
|
||||
|
Interest income
|
(210
|
)
|
||
|
Non-cash amounts attributable to amortization of financing costs
|
(1,110
|
)
|
||
|
Total Consolidated Cash Interest Expense, as defined
|
$
|
12,590
|
|
|
|
|
December 31, 2018
|
|
|||
|
Consolidated Bank EBITDA, as defined
|
$
|
171,640
|
|
||
|
Total Consolidated Cash Interest Expense, as defined
|
12,590
|
|
|||
|
Actual interest expense coverage ratio
|
13.63
|
|
x
|
||
|
Covenant requirement
|
3.00
|
|
x
|
||
________________________________________
|
(1)
|
Non-cash compensation expenses resulting from the grant of equity awards.
|
|
(2)
|
Non-recurring costs and expenses relating to severance, relocation, restructuring and curtailment expenses.
|
|
(3)
|
Includes approximately $4.0 million of acquisition related deferred purchase price as of
December 31, 2018
.
|
42
|
(4)
|
Senior secured indebtedness is negative at
December 31, 2018
due to the deduction of certain unrestricted cash and unrestricted permitted investments as allowed under the Credit Agreement.
|
During 2018, we terminated our
$75.0 million
accounts receivable facility, under which we had the ability to sell eligible accounts receivable to a third-party multi-seller receivables funding company. At
December 31, 2017
, we had
no
amounts outstanding under the facility and approximately
$57.8 million
available but not utilized.
At
December 31, 2018
, we had
no
amounts outstanding under our revolving credit facility and had
$284.9 million
potentially available after giving effect to approximately
$15.1 million
of letters of credit issued and outstanding. At
December 31, 2017
, we had
$10.8 million
outstanding under our revolving credit facility and had
$274.3 million
potentially available after giving effect to approximately
$14.9 million
of letters of credit issued and outstanding. The letters of credit are used for a variety of purposes, including support of certain operating lease agreements, vendor payment terms and other subsidiary operating activities, and to meet various states' requirements to self-insure workers' compensation claims, including incurred but not reported claims. Including availability under our accounts receivable facility and after consideration of leverage restrictions contained in the Credit Agreement, as of
December 31, 2018
and
December 31, 2017
, we had
$284.9 million
and
$332.1 million
, respectively, of borrowing capacity available for general corporate purposes.
We rely upon our cash flow from operations and available liquidity under our revolving credit facility to fund our debt service obligations and other contractual commitments, working capital and capital expenditure requirements, as well as for discretionary spending such as any repurchases of our common stock. At the end of each quarter, we use cash on hand from our domestic and certain foreign subsidiaries to pay down amounts outstanding under our revolving credit facility, as applicable.
Our weighted average borrowings approximated
$315.2 million
and
$381.8 million
during
2018
and
2017
, respectively. The overall decrease is primarily due to repayments of revolving borrowings using cash flow generated by operating activities.
Cash management related to our revolving credit and accounts receivable facilities is centralized. We monitor our cash position and available liquidity on a daily basis and forecast our cash needs on a weekly basis within the current quarter and on a monthly basis outside the current quarter over the remainder of the year. Our business and related cash forecasts are updated monthly. The majority of our cash on hand as of
December 31, 2018
is recorded as a Corporate asset and is located within United States. We have aggregate available funding under our revolving credit and accounts receivable facilities of
$284.9 million
at
December 31, 2018
after consideration of the aforementioned leverage restrictions. Based on forecasted cash sources and requirements inherent in our business plans, we believe that our liquidity and capital resources, including anticipated cash flows from operations, will be sufficient to meet our debt service, capital expenditure and other short-term and long-term obligation needs for the foreseeable future.
We are subject to variable interest rates on our revolving credit facility. At
December 31, 2018
, 1-Month LIBOR approximated
2.50%
. At
December 31, 2018
, we had no amounts outstanding on our revolving credit facility and, therefore, no variable rate-based borrowings outstanding.
In addition to our long-term debt, we have other cash commitments related to leases. We account for these lease transactions primarily as operating leases, and incurred expense from continuing operations related thereto of approximately
$12.3 million
in
2018
. We continue to be party to non-cancelable leases for certain facilities we have exited as part of restructuring activities, and have entered into sublease agreements to minimize our net lease payments. We expect leasing will continue to be an available financing option to fund future capital expenditure requirements.
We continuously evaluate strategies to redeploy our cash, including returning capital to our shareholders. In November 2015, we announced our Board of Directors had authorized us to purchase up to
$50 million
in the aggregate of our common stock. During
2018
, we purchased
442,632
shares of our outstanding common stock for an aggregate purchase price of approximately
$12.1 million
. We will continue to evaluate opportunities to return capital to shareholders through the purchase of our common stock, depending on market conditions and other factors.
Market Risk
We conduct business in various locations throughout the world and are subject to market risk due to changes in the value of foreign currencies. The functional currencies of our foreign subsidiaries are primarily the local currency in the country of domicile. We manage these operating activities at the local level and revenues and costs are generally denominated in local currencies; however, results of operations and assets and liabilities reported in U.S. dollars will fluctuate with changes in exchange rates between such local currencies and the U.S. dollar.
43
We have historically used derivative financial instruments to manage currency risks, albeit in immaterial notional contracts, as we explored the predictability of our procurement activities denominated in currencies other than the functional currency of our subsidiaries and the impact of currency rate volatility on our earnings. We use cross-currency swap agreements to mitigate currency risks associated with the net investment in certain of our foreign subsidiaries. See Note
11
, "
Derivative Instruments
," included in Item 8, "
Financial Statements and Supplementary Data
," within this Form 10-K for additional information.
We are also subject to interest risk as it relates to our long-term debt. We have historically used interest rate swap agreements to fix the variable portion of our debt to manage this risk. See Note
11
, "
Derivative Instruments
," included in Item 8, "
Financial Statements and Supplementary Data
," within this Form 10-K for additional information.
Common Stock
TriMas is listed in the NASDAQ Global Select Market
SM
. Our stock trades under the symbol "TRS."
Contractual Obligations and Off-Balance Sheet Arrangements
Under various agreements, we are obligated to make future cash payments in fixed amounts. These include payments under our long-term debt agreements, rent payments required under operating lease agreements, certain benefit obligations and interest obligations on our long-term debt.
The following table summarizes our significant contractual cash obligations as of
December 31, 2018
(dollars in thousands).
|
Payments Due by Periods
|
||||||||||||||||||||
|
Total
|
Less than
One Year
|
1 - 3 Years
|
3 - 5 Years
|
More than
5 Years
|
||||||||||||||||
|
Contractual cash obligations:
|
||||||||||||||||||||
|
Long-term debt
|
$
|
300,000
|
|
$
|
—
|
|
$
|
—
|
|
$
|
—
|
|
$
|
300,000
|
|
|||||
|
Operating lease obligations
|
65,950
|
|
12,730
|
|
23,610
|
|
13,780
|
|
15,830
|
|
||||||||||
|
Benefit obligations
|
13,150
|
|
1,030
|
|
2,260
|
|
2,520
|
|
7,340
|
|
||||||||||
|
Interest obligations
(a)
|
102,380
|
|
14,630
|
|
29,250
|
|
29,250
|
|
29,250
|
|
||||||||||
|
Other
|
3,950
|
|
3,950
|
|
—
|
|
—
|
|
—
|
|
||||||||||
|
Total contractual obligations
|
$
|
485,430
|
|
$
|
32,340
|
|
$
|
55,120
|
|
$
|
45,550
|
|
$
|
352,420
|
|
|||||
__________________________
|
(a)
|
Our Senior Notes bear interest at 4.875%. Interest on our senior secured revolving credit facility is based on LIBOR plus 150.0 basis points at
December 31, 2018
. These rates were used to estimate our future interest obligations with respect to the long-term debt. These rates exclude the impact of our cross-currency swap agreements. See Note
11
, "
Derivative Instruments
," included in Item 8, "
Financial Statements and Supplementary Data
," within this Form 10-K for additional information.
|
As of
December 31, 2018
, we had a
$300.0 million
revolving credit facility, with no outstanding balance.
As of
December 31, 2018
, we are contingently liable for standby letters of credit totaling
$15.1 million
issued on our behalf by financial institutions under the Credit Agreement. These letters of credit are used for a variety of purposes, including to support certain operating lease agreements, vendor payment terms and other subsidiary operating activities, and to meet various states' requirements to self-insure workers' compensation claims, including incurred but not reported claims.
The liability related to unrecognized tax benefits has been excluded from the contractual obligations table because a reasonable estimate of the timing and amount of cash flows from future tax settlements cannot be determined. For additional information, refer to Note
19
, "
Income Taxes
," included in Item 8, "
Financial Statements and Supplementary Data
," within this Form 10-K.
Credit Rating
We and certain of our outstanding debt obligations are rated by Standard & Poor's and Moody's. On June 7, 2018, Moody's upgraded our Senior Notes rating to Ba3 from B1, as presented in Note
10
,
"Long-term Debt"
included in
Item 8
,
"Financial Statements and Supplementary Data"
within this Form 10-K. Moody's also upgraded our Corporate Family Rating to Ba2 from Ba3 and maintained its outlook as stable. On May 11, 2018, Standard & Poor's upgraded our senior unsecured debt rating to BB- from B+, upgraded our corporate credit rating to BB from BB- and maintained its outlook as stable. If our credit ratings were to decline, our ability to access certain financial markets may become limited, our cost of borrowings may increase, the perception of us in the view of our customers, suppliers and security holders may worsen and as a result, we may be adversely affected.
44
Outlook
2018 was a strong operational and financial year for TriMas, marking our second full year of successfully operating under the TriMas Business Model, which provides a standardized set of processes that we follow to drive results across our multi-industry set of businesses. We experienced year-over-year increases in sales, and leveraged those increases into higher operating profit and related margin, with further improvement in net income as a result of a lower tax rate following the enactment of the Tax Reform Act. We also generated significant cash flow in 2018, strengthening our balance sheet for future capital deployment while affording us the opportunity to buy back more than $12 million of our common stock.
We expect to continue our positive momentum in 2019, as we believe we are well positioned to capitalize on growth opportunities, as well as have instilled a culture of Kaizen and continuous improvement to generate additional efficiencies, cost savings and leverage opportunities. We are not counting on end market improvement, particularly given economic uncertainty around direct and indirect impacts of tariffs on foreign-sourced materials. We will continue our efforts to mitigate the impact of external factors, while focusing on those areas we can control.
We will continue to prioritize growth programs, particularly in our Packaging and Aerospace reportable segments, where we have many initiatives underway that we expect will benefit us in 2019. We will also continue to ensure our cost structures remain aligned with customer demand in the end markets we serve, most notably in our Specialty Products reportable segment. We will continue to leverage the tenets of the TriMas Business Model to achieve our growth plans, execute continuous improvement initiatives to offset inflationary pressures, and seek lower-cost sources for input costs, all while continuously assessing our manufacturing footprint, productivity and fixed-cost structure.
Impact of New Accounting Standards
See Note
2
, "
New Accounting Pronouncements
," included in Item 8, "
Financial Statements and Supplementary Data
," within this Form 10-K.
Critical Accounting Policies
The following discussion of accounting policies is intended to supplement the accounting policies presented in Note
3
, "
Summary of Significant Accounting Policies
" included in Item 8, "
Financial Statements and Supplementary Data
," within this Form 10-K. Certain of our accounting policies require the application of significant judgment by management in selecting the appropriate assumptions for calculating financial estimates. By their nature, these judgments are subject to an inherent degree of uncertainty. These judgments are based on our historical experience, our evaluation of business and macroeconomic trends, and information from other outside sources, as appropriate.
Receivables.
Receivables are presented net of allowances for doubtful accounts of approximately
$3.4 million
and
$4.1 million
at
December 31, 2018
and
2017
, respectively. We monitor our exposure for credit losses and maintain adequate allowances for doubtful accounts. We determine these allowances based on our historical write-off experience and/or specific customer circumstances and provide such allowances when amounts are reasonably estimable and it is probable a loss has been incurred. We do not have concentrations of accounts receivable with a single customer or group of customers and do not believe that significant credit risk exists due to our diverse customer base. See Item 1A,
"Risk Factors,"
for additional information regarding risks associated with a concentrated customer base. Prior to March 2018, when we terminated this facility, trade accounts receivable of substantially all domestic business operations may have been sold, on an ongoing basis, to a wholly-owned, special purpose entity, but remained included in our consolidated balance sheet.
Depreciation and Amortization.
Depreciation is computed principally using the straight-line method over the estimated useful lives of the assets. Annual depreciation rates are as follows: building and land/building improvements
three
to
40
years, and machinery and equipment,
three
to
15
years. Capitalized debt issuance costs are amortized over the underlying terms of the related debt securities. Customer relationship intangibles are amortized over periods ranging from
five
to
25
years, while technology and other intangibles are amortized over periods ranging from
one
to
30
years.
Impairment of Long-Lived Assets and Definite-Lived Intangible Assets.
We review, on at least a quarterly basis, the financial performance of each business unit for indicators of impairment. In reviewing for impairment indicators, we also consider events or changes in circumstances such as business prospects, customer retention, market trends, potential product obsolescence, competitive activities and other economic factors. An impairment loss is recognized when the carrying value of an asset group exceeds the future net undiscounted cash flows expected to be generated by that asset group. The impairment loss recognized is the amount by which the carrying value of the asset group exceeds its fair value.
45
Goodwill and Indefinite-Lived Intangibles.
We assess goodwill and indefinite-lived intangible assets for impairment at the reporting unit level on an annual basis as of October 1, by reviewing relevant qualitative and quantitative factors. More frequent evaluations may be required if we experience changes in our business climate or as a result of other triggering events that take place. If carrying value exceeds fair value, a possible impairment exists and further evaluation is performed.
We determine our reporting units at the individual operating segment level, or one level below, when there is discrete financial information available that is regularly reviewed by segment management for evaluating operating results. For purposes of our
2018
goodwill impairment test, we had
five
reporting units,
three
of which had goodwill, within our
three
reportable segments.
We first perform a qualitative assessment for our annual goodwill impairment test and for our indefinite-lived intangible asset impairment test, which involves significant use of management's judgment and assumptions to determine whether it is more likely than not that the fair value of a reporting unit or indefinite-lived intangible asset is less than its carrying amount. In conducting the qualitative assessment, we consider macroeconomic conditions, industry and market considerations, overall financial performance, entity and reporting unit specific events, capital markets pricing, recent fair value estimates and carrying amounts, as well as legal, regulatory, and contractual factors. These factors are all considered in reaching a conclusion about whether it is more likely than not that the fair values of the intangible assets are less than the carrying values. If we conclude that further testing is required, we would perform a quantitative valuation to estimate the fair value of our intangible assets.
For purposes of the 2018 annual impairment tests, based on the qualitative assessments, we determined there were no indications that the fair value of a reporting unit or indefinite-lived intangible asset was less than its carrying amount; therefore, we determined that quantitative assessments were not required.
Future declines in sales and/or operating profit, declines in our stock price, or other changes in our business or the markets for our products could result in further impairments of our goodwill and indefinite-lived intangible assets.
Pension Benefits.
We engage independent actuaries to compute the amounts of liabilities and expenses under defined benefit pension plans, subject to the assumptions that we determine are appropriate based on historical trends, current market rates and future projections as of the measurement date. Annually, we review the actual experience compared to the most significant assumptions used and makes adjustments to the assumptions, if warranted. Discount rates are based upon an expected benefit payments duration analysis and the equivalent average yield rate for high-quality fixed-income investments. Pension benefits are funded through deposits with trustees and the expected long-term rate of return on plan assets is based upon actual historical returns modified for known changes in the market and any expected change in investment policy. Certain accounting guidance, including the guidance applicable to pensions, does not require immediate recognition of the effects of a deviation between actual and assumed experience or the revision of an estimate. This approach allows the favorable and unfavorable effects that fall within an acceptable range to be netted.
Income Taxes.
We compute income taxes using the asset and liability method, whereby deferred income taxes using current enacted tax rates are provided for the temporary differences between the financial reporting basis and the tax basis of assets and liabilities and for operating loss and tax credit carryforwards. We determine valuation allowances based on an assessment of positive and negative evidence on a jurisdiction-by-jurisdiction basis and record a valuation allowance to reduce deferred tax assets to the amount more likely than not to be realized. Recognized income tax positions are measured at the largest amount that is greater than 50% likely of being realized. Changes in recognition or measurement are reflected in the period in which the change in judgment occurs. We record interest and penalties related to unrecognized tax benefits in income tax expense.
On December 22, 2017, the Tax Reform Act was signed into law. Among the provisions, the Tax Reform Act reduces the Federal statutory corporate income tax rate from 35% to 21% effective January 1, 2018, implements a territorial tax system and imposes a one-time tax on the deemed repatriation of undistributed earnings of non-U.S. subsidiaries, introduces additional limitations on the deductibility of interest, allows for the immediate expensing of capital expenditures through 2023 and modifies or repeals many business deductions and credits.
While the Tax Reform Act provides for a territorial tax system, beginning in 2018, it includes two new U.S. tax base erosion provisions, the global intangible low-taxed income (“GILTI”) provisions and the base-erosion and anti-abuse tax (“BEAT”) provisions. The GILTI provisions impose a tax on foreign income in excess of a deemed return on tangible assets of foreign corporations. Authoritative guidance has been published that allows companies to make an accounting policy election to either account for deferred taxes related to GILTI inclusions or treat any taxes on GILTI inclusions as period costs. We have elected to account for GILTI tax in the period in which it is incurred, and therefore have not provided any deferred tax impacts on GILTI in our consolidated financial statements for the years ended December 31, 2018 and 2017.
46
The BEAT provisions in the Tax Reform Act eliminate the deduction of certain base-erosion payments made to related foreign corporations, and impose a minimum tax if greater than regular tax. We do not expect the BEAT provisions to have a significant impact to our consolidated financial statements, and have not included any tax impacts of BEAT in our consolidated financial statements for the years ended December 31, 2018 and 2017.
Other Loss Reserves.
We have other loss exposures related to environmental claims, asbestos claims and litigation. Establishing loss reserves for these matters requires the use of estimates and judgment in regard to risk exposure and ultimate liability. We are generally self-insured for losses and liabilities related principally to workers' compensation, health and welfare claims and comprehensive general, product and vehicle liability. Generally, we are responsible for up to
$0.8 million
per occurrence under our retention program for workers' compensation, between
$0.3 million
and
$1.5 million
per occurrence under our retention programs for comprehensive general, product and vehicle liability, and have a
$0.3 million
per occurrence stop-loss limit with respect to our self-insured group medical plan. We accrue loss reserves up to our retention amounts based upon our estimates of the ultimate liability for claims incurred, including an estimate of related litigation defense costs, and an estimate of claims incurred but not reported using actuarial assumptions about future events. We accrue for such items when such amounts are reasonably estimable and probable. We utilize known facts and historical trends, as well as actuarial valuations in determining estimated required reserves. Changes in assumptions for factors such as medical costs and actual experience could cause these estimates to change significantly.
47
Item 7A. Quantitative and Qualitative Disclosures About Market Risk
In the normal course of business, we are exposed to market risk associated with fluctuations in commodity prices, insurable risks due to property damage, employee and liability claims, and other uncertainties in the financial and credit markets, which may impact demand for our products.
We conduct business in various locations throughout the world and are subject to market risk due to changes in the value of foreign currencies. The functional currencies of our foreign subsidiaries are primarily the local currency in the country of domicile. We manage these operating activities at the local level and revenues and costs are generally denominated in local currencies; however, results of operations and assets and liabilities reported in U.S. dollars will fluctuate with changes in exchange rates between such local currencies and the U.S. dollar. We may use derivative financial instruments to manage currency risks associated with our procurement activities denominated in currencies other than the functional currency of our subsidiaries and the impact of currency rate volatility on our earnings.
We are also subject to interest risk as it relates to long-term debt, for which we have historically and may prospectively employ derivative instruments such as interest rate swaps to mitigate the risk of variable interest rates. See Item 7 "
Management's Discussion and Analysis of Financial Condition and Results of Operations
" for details about our primary market risks, and the objectives and strategies used to manage these risks. Also see Note
10
, "
Long-term Debt,
" and Note
11
, "
Derivative Instruments
," included in Item 8, "
Financial Statements and Supplementary Data
," within this Form 10-K for additional information.
48
Item 8
. Financial Statements and Supplementary Data
REPORT OF INDEPENDENT REGISTERED PUBLIC ACCOUNTING FIRM
To the shareholders and the Board of Directors of TriMas Corporation
Opinion on the Financial Statements
We have audited the accompanying consolidated balance sheets of TriMas Corporation and subsidiaries (the "Company") as of December 31, 2018 and 2017, the related consolidated statements of operations, comprehensive income, cash flows, and shareholders’ equity, for each of the three years in the period ended December 31, 2018, and the related notes and the schedule listed in the Index at Item 15 (collectively referred to as the "financial statements"). In our opinion, the financial statements present fairly, in all material respects, the financial position of the Company as of December 31, 2018 and 2017, and the results of its operations and its cash flows for each of the three years in the period ended December 31, 2018, in conformity with accounting principles generally accepted in the United States of America.
We have also audited, in accordance with the standards of the Public Company Accounting Oversight Board (United States) (PCAOB), the Company's internal control over financial reporting as of December 31, 2018, based on criteria established in
Internal Control - Integrated Framework (2013)
issued by the Committee of Sponsoring Organizations of the Treadway Commission and our report dated February 28, 2019, expressed an unqualified opinion on the Company's internal control over financial reporting.
Basis for Opinion
These financial statements are the responsibility of the Company's management. Our responsibility is to express an opinion on the Company's financial statements based on our audits. We are a public accounting firm registered with the PCAOB and are required to be independent with respect to the Company in accordance with the U.S. federal securities laws and the applicable rules and regulations of the Securities and Exchange Commission and the PCAOB.
We conducted our audits in accordance with the standards of the PCAOB. Those standards require that we plan and perform the audit to obtain reasonable assurance about whether the financial statements are free of material misstatement, whether due to error or fraud. Our audits included performing procedures to assess the risks of material misstatement of the financial statements, whether due to error or fraud, and performing procedures that respond to those risks. Such procedures included examining, on a test basis, evidence regarding the amounts and disclosures in the financial statements. Our audits also included evaluating the accounting principles used and significant estimates made by management, as well as evaluating the overall presentation of the financial statements. We believe that our audits provide a reasonable basis for our opinion.
/s/ Deloitte & Touche LLP
Detroit, Michigan
February 28, 2019
We have served as the Company's auditor since 2013.
49
TriMas Corporation
Consolidated Balance Sheet
(Dollars in thousands)
|
|
December 31,
|
|||||||
|
|
2018
|
2017
|
||||||
|
Assets
|
||||||||
|
Current assets:
|
|
|
||||||
|
Cash and cash equivalents
|
$
|
108,150
|
|
$
|
27,580
|
|
||
|
Receivables, net
|
123,110
|
|
112,220
|
|
||||
|
Inventories
|
173,120
|
|
155,350
|
|
||||
|
Prepaid expenses and other current assets
|
7,430
|
|
16,120
|
|
||||
|
Total current assets
|
411,810
|
|
311,270
|
|
||||
|
Property and equipment, net
|
187,800
|
|
190,250
|
|
||||
|
Goodwill
|
316,650
|
|
319,390
|
|
||||
|
Other intangibles, net
|
174,530
|
|
194,220
|
|
||||
|
Deferred income taxes
|
1,080
|
|
9,100
|
|
||||
|
Other assets
|
8,650
|
|
8,970
|
|
||||
|
Total assets
|
$
|
1,100,520
|
|
$
|
1,033,200
|
|
||
|
Liabilities and Shareholders' Equity
|
||||||||
|
Current liabilities:
|
|
|
||||||
|
Accounts payable
|
$
|
93,430
|
|
$
|
72,410
|
|
||
|
Accrued liabilities
|
48,300
|
|
49,470
|
|
||||
|
Total current liabilities
|
141,730
|
|
121,880
|
|
||||
|
Long-term debt, net
|
293,560
|
|
303,080
|
|
||||
|
Deferred income taxes
|
5,560
|
|
5,650
|
|
||||
|
Other long-term liabilities
|
39,220
|
|
58,570
|
|
||||
|
Total liabilities
|
480,070
|
|
489,180
|
|
||||
|
Preferred stock $0.01 par: Authorized 100,000,000 shares;
Issued and outstanding: None |
—
|
|
—
|
|
||||
|
Common stock, $0.01 par: Authorized 400,000,000 shares;
Issued and outstanding: 45,527,993 shares at December 31, 2018 and 45,724,453 shares at December 31, 2017 |
460
|
|
460
|
|
||||
|
Paid-in capital
|
816,500
|
|
823,850
|
|
||||
|
Accumulated deficit
|
(179,660
|
)
|
(262,960
|
)
|
||||
|
Accumulated other comprehensive loss
|
(16,850
|
)
|
(17,330
|
)
|
||||
|
Total shareholders' equity
|
620,450
|
|
544,020
|
|
||||
|
Total liabilities and shareholders' equity
|
$
|
1,100,520
|
|
$
|
1,033,200
|
|
||
The accompanying notes are an integral part of these financial statements.
50
TriMas Corporation
Consolidated Statement of Operations
(Dollars in thousands, except per share amounts)
|
|
Year ended December 31,
|
|||||||||||
|
|
2018
|
2017
|
2016
|
|||||||||
|
Net sales
|
$
|
877,140
|
|
$
|
817,740
|
|
$
|
794,020
|
|
|||
|
Cost of sales
|
(633,020
|
)
|
(598,350
|
)
|
(583,220
|
)
|
||||||
|
Gross profit
|
244,120
|
|
219,390
|
|
210,800
|
|
||||||
|
Selling, general and administrative expenses
|
(121,800
|
)
|
(129,140
|
)
|
(151,960
|
)
|
||||||
|
Net loss on dispositions of assets
|
(250
|
)
|
(1,080
|
)
|
(1,870
|
)
|
||||||
|
Impairment of goodwill and indefinite-lived intangible assets
|
—
|
|
—
|
|
(98,900
|
)
|
||||||
|
Operating profit (loss)
|
122,070
|
|
89,170
|
|
(41,930
|
)
|
||||||
|
Other expense, net:
|
||||||||||||
|
Interest expense
|
(13,910
|
)
|
(14,400
|
)
|
(13,720
|
)
|
||||||
|
Debt financing and related expenses
|
—
|
|
(6,640
|
)
|
—
|
|
||||||
|
Other expense, net
|
(2,180
|
)
|
(1,920
|
)
|
(2,580
|
)
|
||||||
|
Other expense, net
|
(16,090
|
)
|
(22,960
|
)
|
(16,300
|
)
|
||||||
|
Income (loss) before income taxes
|
105,980
|
|
66,210
|
|
(58,230
|
)
|
||||||
|
Income tax benefit (expense)
|
(22,680
|
)
|
(35,250
|
)
|
18,430
|
|
||||||
|
Net income (loss)
|
83,300
|
|
30,960
|
|
(39,800
|
)
|
||||||
|
Basic earnings (loss) per share:
|
||||||||||||
|
Net income (loss) per share
|
$
|
1.82
|
|
$
|
0.68
|
|
$
|
(0.88
|
)
|
|||
|
Weighted average common shares - basic
|
45,824,555
|
|
45,682,627
|
|
45,407,316
|
|
||||||
|
Diluted earnings (loss) per share:
|
||||||||||||
|
Net income (loss) per share
|
$
|
1.80
|
|
$
|
0.67
|
|
$
|
(0.88
|
)
|
|||
|
Weighted average common shares - diluted
|
46,170,464
|
|
45,990,252
|
|
45,407,316
|
|
||||||
The accompanying notes are an integral part of these financial statements.
51
TriMas Corporation
Consolidated Statement of Comprehensive Income
(Dollars in thousands)
|
Year ended December 31,
|
||||||||||||
|
2018
|
2017
|
2016
|
||||||||||
|
Net income (loss)
|
$
|
83,300
|
|
$
|
30,960
|
|
$
|
(39,800
|
)
|
|||
|
Other comprehensive income (loss):
|
||||||||||||
|
Defined benefit plans (Note 14)
|
3,250
|
|
1,670
|
|
250
|
|
||||||
|
Foreign currency translation
|
(6,880
|
)
|
6,050
|
|
(12,620
|
)
|
||||||
|
Derivative instruments (Note 11)
|
4,110
|
|
(650
|
)
|
(730
|
)
|
||||||
|
Total other comprehensive income (loss)
|
480
|
|
7,070
|
|
(13,100
|
)
|
||||||
|
Total comprehensive income (loss)
|
$
|
83,780
|
|
$
|
38,030
|
|
$
|
(52,900
|
)
|
|||
The accompanying notes are an integral part of these financial statements.
52
TriMas Corporation
Consolidated Statement of Cash Flows
(Dollars in thousands)
|
|
Year ended December 31,
|
||||||||||
|
|
2018
|
2017
|
2016
|
||||||||
|
Cash Flows from Operating Activities:
|
|
|
|
||||||||
|
Net income (loss)
|
$
|
83,300
|
|
$
|
30,960
|
|
$
|
(39,800
|
)
|
||
|
Adjustments to reconcile net income (loss) to net cash provided by operating activities:
|
|||||||||||
|
Impairment of goodwill and indefinite-lived intangible assets
|
—
|
|
—
|
|
98,900
|
|
|||||
|
Loss on dispositions of assets
|
250
|
|
1,080
|
|
1,870
|
|
|||||
|
Depreciation
|
24,580
|
|
26,950
|
|
24,390
|
|
|||||
|
Amortization of intangible assets
|
19,440
|
|
19,920
|
|
20,470
|
|
|||||
|
Amortization of debt issue costs
|
1,290
|
|
1,320
|
|
1,370
|
|
|||||
|
Deferred income taxes
|
7,200
|
|
15,260
|
|
(32,160
|
)
|
|||||
|
Non-cash compensation expense
|
7,170
|
|
6,780
|
|
6,940
|
|
|||||
|
Debt financing and related expenses
|
—
|
|
6,640
|
|
—
|
|
|||||
|
(Increase) decrease in receivables
|
(11,420
|
)
|
1,220
|
|
7,990
|
|
|||||
|
(Increase) decrease in inventories
|
(18,690
|
)
|
4,350
|
|
5,180
|
|
|||||
|
(Increase) decrease in prepaid expenses and other assets
|
9,060
|
|
(310
|
)
|
2,550
|
|
|||||
|
Increase (decrease) in accounts payable and accrued liabilities
|
4,340
|
|
3,640
|
|
(18,120
|
)
|
|||||
|
Other operating activities
|
2,800
|
|
2,250
|
|
890
|
|
|||||
|
Net cash provided by operating activities
|
129,320
|
|
120,060
|
|
80,470
|
|
|||||
|
Cash Flows from Investing Activities:
|
|||||||||||
|
Capital expenditures
|
(25,050
|
)
|
(36,800
|
)
|
(31,330
|
)
|
|||||
|
Net proceeds from dispositions of property and equipment
|
250
|
|
4,450
|
|
220
|
|
|||||
|
Net cash used for investing activities
|
(24,800
|
)
|
(32,350
|
)
|
(31,110
|
)
|
|||||
|
Cash Flows from Financing Activities:
|
|
|
|
||||||||
|
Proceeds from borrowings on revolving credit and accounts receivable facilities
|
59,060
|
|
401,300
|
|
402,420
|
|
|||||
|
Repayments of borrowings on revolving credit and accounts receivable facilities
|
(68,490
|
)
|
(517,310
|
)
|
(433,350
|
)
|
|||||
|
Payments to purchase common stock
|
(12,140
|
)
|
—
|
|
—
|
|
|||||
|
Shares surrendered upon exercise and vesting of equity awards to cover taxes
|
(2,380
|
)
|
(510
|
)
|
(1,590
|
)
|
|||||
|
Proceeds from issuance of senior notes
|
—
|
|
300,000
|
|
—
|
|
|||||
|
Repayments of borrowings on term loan facilities
|
—
|
|
(257,940
|
)
|
(13,850
|
)
|
|||||
|
Debt financing fees
|
—
|
|
(6,070
|
)
|
—
|
|
|||||
|
Payments for deferred purchase price
|
—
|
|
—
|
|
(2,530
|
)
|
|||||
|
Other financing activities
|
—
|
|
(310
|
)
|
800
|
|
|||||
|
Net cash used for financing activities
|
(23,950
|
)
|
(80,840
|
)
|
(48,100
|
)
|
|||||
|
Cash and Cash Equivalents:
|
|||||||||||
|
Increase for the year
|
80,570
|
|
6,870
|
|
1,260
|
|
|||||
|
At beginning of year
|
27,580
|
|
20,710
|
|
19,450
|
|
|||||
|
At end of year
|
$
|
108,150
|
|
$
|
27,580
|
|
$
|
20,710
|
|
||
|
Supplemental disclosure of cash flow information:
|
|||||||||||
|
Cash paid for interest
|
$
|
13,800
|
|
$
|
9,430
|
|
$
|
11,800
|
|
||
|
Cash paid for income taxes
|
$
|
7,380
|
|
$
|
16,230
|
|
$
|
17,210
|
|
||
The accompanying notes are an integral part of these financial statements.
53
TriMas Corporation
Consolidated Statement of Shareholders' Equity
Years Ended
December 31, 2018
,
2017
and
2016
(Dollars in thousands)
|
|
Common
Stock
|
Paid-In
Capital
|
Accumulated
Deficit
|
Accumulated
Other
Comprehensive
Income (Loss)
|
Total
|
|||||||||||||||
|
Balances at December 31, 2015
|
$
|
450
|
|
$
|
812,160
|
|
$
|
(254,120
|
)
|
$
|
(11,300
|
)
|
$
|
547,190
|
|
|||||
|
Net loss
|
—
|
|
—
|
|
(39,800
|
)
|
—
|
|
(39,800
|
)
|
||||||||||
|
Other comprehensive loss
|
—
|
|
—
|
|
—
|
|
(13,100
|
)
|
(13,100
|
)
|
||||||||||
|
Shares surrendered upon exercise and vesting of equity awards to cover taxes
|
—
|
|
(1,590
|
)
|
—
|
|
—
|
|
(1,590
|
)
|
||||||||||
|
Stock option exercises and restricted stock vestings
|
10
|
|
150
|
|
—
|
|
—
|
|
160
|
|
||||||||||
|
Tax effect from stock based compensation
|
—
|
|
(80
|
)
|
—
|
|
—
|
|
(80
|
)
|
||||||||||
|
Non-cash compensation expense
|
—
|
|
6,940
|
|
—
|
|
—
|
|
6,940
|
|
||||||||||
|
Balances at December 31, 2016
|
$
|
460
|
|
$
|
817,580
|
|
$
|
(293,920
|
)
|
$
|
(24,400
|
)
|
$
|
499,720
|
|
|||||
|
Net income
|
—
|
|
—
|
|
30,960
|
|
—
|
|
30,960
|
|
||||||||||
|
Other comprehensive income
|
—
|
|
—
|
|
—
|
|
7,070
|
|
7,070
|
|
||||||||||
|
Shares surrendered upon exercise and vesting of equity awards to cover taxes
|
—
|
|
(510
|
)
|
—
|
|
—
|
|
(510
|
)
|
||||||||||
|
Non-cash compensation expense
|
—
|
|
6,780
|
|
—
|
|
—
|
|
6,780
|
|
||||||||||
|
Balances at December 31, 2017
|
$
|
460
|
|
$
|
823,850
|
|
$
|
(262,960
|
)
|
$
|
(17,330
|
)
|
$
|
544,020
|
|
|||||
|
Net income
|
—
|
|
—
|
|
83,300
|
|
—
|
|
83,300
|
|
||||||||||
|
Other comprehensive income
|
—
|
|
—
|
|
—
|
|
480
|
|
480
|
|
||||||||||
|
Purchase of common stock
|
—
|
|
(12,140
|
)
|
—
|
|
—
|
|
(12,140
|
)
|
||||||||||
|
Shares surrendered upon exercise and vesting of equity awards to cover taxes
|
—
|
|
(2,380
|
)
|
—
|
|
—
|
|
(2,380
|
)
|
||||||||||
|
Non-cash compensation expense
|
—
|
|
7,170
|
|
—
|
|
—
|
|
7,170
|
|
||||||||||
|
Balances at December 31, 2018
|
$
|
460
|
|
$
|
816,500
|
|
$
|
(179,660
|
)
|
$
|
(16,850
|
)
|
$
|
620,450
|
|
|||||
The accompanying notes are an integral part of these financial statements.
54
TRIMAS CORPORATION
NOTES TO CONSOLIDATED FINANCIAL STATEMENTS
1. Basis of Presentation
TriMas Corporation ("TriMas" or the "Company"), and its consolidated subsidiaries, is a diversified industrial manufacturer of products for customers in the consumer products, aerospace, industrial, petrochemical, refinery and oil and gas end markets.
In the first quarter of 2018, TriMas realigned its reporting structure from four segments to three. While there were no changes to the Packaging and Aerospace reportable segments, the Company combined its previous Energy and Engineered Components reportable segments into a new reportable segment titled Specialty Products. This change was made in connection with recent realignment efforts, providing a more streamlined operating structure and to better leverage resources across the divisions in this segment. See Note
18
, "
Segment Information
," for further information on each of the Company's reportable segments.
2
. New Accounting Pronouncements
Recently Issued Accounting Pronouncements
In August 2018, the Financial Accounting Standards Board ("FASB") issued Accounting Standards Update ("ASU") 2018-14, "Compensation - Retirement Benefits - Defined Benefit Plans - General (Subtopic 715-20)" ("ASU 2018-14"), which modifies the disclosure requirements for employers who sponsor defined benefit pension or other postretirement plans. ASU 2018-14 is effective for fiscal years ending after December 15, 2020, with early adoption permitted. ASU 2018-14 is to be applied retrospectively to all periods presented. The Company is in the process of assessing the impact of adoption on its consolidated financial statements.
In February 2018, the FASB issued ASU 2018-02, "Income Statement - Reporting Comprehensive Income (Topic 220)" ("ASU 2018-02"), which provides for the option to reclassify stranded tax effects resulting from the Tax Cuts and Jobs Act ("Tax Reform Act") classified within accumulated other comprehensive income to retained earnings. ASU 2018-02 is effective for fiscal years, and interim periods within those years, beginning after December 15, 2018, with early adoption permitted. ASU 2018-02 is to be applied retrospectively to each period in which the effect of the change in the U.S. federal corporate income tax rate related to the Tax Reform Act is recorded. The Company is in the process of assessing the impact of adoption on its consolidated financial statements.
In January 2017, the FASB issued ASU 2017-04, "Intangibles - Goodwill and Other (Topic 350): Simplifying the Test for Goodwill Impairment" ("ASU 2017-04"), which simplifies the test for goodwill impairment by eliminating the requirement to perform a hypothetical purchase price allocation to measure the amount of goodwill impairment. ASU 2017-04 is effective for fiscal years, and interim periods within those years, beginning after December 15, 2019, with early adoption permitted. The Company is in the process of assessing the impact of adoption on its consolidated financial statements.
In February 2016, the FASB issued ASU 2016-02, "Leases (Topic 842)" ("ASU 2016-02"), which requires that lessees, at the lease commencement date, recognize a lease liability representing the lessee's obligation to make lease payments arising from a lease as well as a right-of-use asset, which represents the lessee's right to use, or control the use of a specified asset, for the lease term. The new guidance also aligns lessor accounting to the lessee accounting model and to Topic 606, "Revenue from Contracts with Customers." Since the issuance of the original standard, the FASB has issued several subsequent updates. ASU 2016-02 is effective for fiscal years, and interim periods within those years, beginning after December 15, 2018, and is to be applied using a modified retrospective approach with early adoption permitted. The Company plans to adopt the standard effective January 1, 2019. While the Company continues to assess the impact of adoption of this standard, the Company anticipates the most significant impact will be to its consolidated balance sheet, adding approximately
$40 million
of right-of-use assets and lease liabilities.
55
3
. Summary of Significant Accounting Policies
Principles of Consolidation.
The accompanying consolidated financial statements include the accounts and transactions of TriMas and its subsidiaries. Intercompany transactions have been eliminated.
Use of Estimates.
The preparation of financial statements in conformity with accounting principles generally accepted in the United States of America requires management of the Company to make estimates and assumptions that affect the reported amounts of assets and liabilities and the disclosure of contingent assets and liabilities at the date of the financial statements. Such estimates and assumptions also affect the reported amounts of revenues and expenses during the reporting periods. Significant items subject to such estimates and assumptions include the carrying amount of property and equipment, goodwill and other intangibles, valuation allowances for receivables, inventories and deferred income tax assets, valuation of derivatives, estimated future unrecoverable lease costs, reserves for asbestos and ordinary course litigation, assets and obligations related to employee benefits and estimated unrecognized tax benefits. Actual results may differ from such estimates and assumptions.
Cash and Cash Equivalents.
The Company considers cash on hand and on deposit and investments in all highly liquid debt instruments with initial maturities of three months or less to be cash and cash equivalents.
Receivables.
Receivables are presented net of allowances for doubtful accounts of approximately
$3.4 million
and
$4.1 million
at
December 31, 2018
and
2017
, respectively. The Company monitors its exposure for credit losses and maintains allowances for doubtful accounts based upon the Company's best estimate of probable losses inherent in the accounts receivable balances. The Company does not believe that significant credit risk exists due to its diverse customer base.
Sales of Receivables.
The Company may, from time to time, sell certain of its receivables to third parties. Sales of receivables are recognized at the point in which the receivables sold are transferred beyond the reach of the Company and its creditors, the purchaser has the right to pledge or exchange the receivables and the Company has surrendered control over the transferred receivables.
Inventories.
Inventories are stated at the lower of cost or net realizable value, with cost determined using the first-in, first-out method. Direct materials, direct labor and allocations of variable and fixed manufacturing-related overhead are included in inventory cost.
Property and Equipment.
Property and equipment additions, including significant improvements, are recorded at cost. Upon retirement or disposal of property and equipment, the cost and accumulated depreciation are removed from the accounts, and any gain or loss is included in the accompanying statement of operations. Repair and maintenance costs are charged to expense as incurred.
Depreciation and Amortization.
Depreciation is computed principally using the straight-line method over the estimated useful lives of the assets. Annual depreciation rates are as follows: building and land/building improvements
three
to
40
years, and machinery and equipment,
three
to
15
years. Capitalized debt issuance costs are amortized over the underlying terms of the related debt securities. Customer relationship intangibles are amortized over periods ranging from
five
to
25
years, while technology and other intangibles are amortized over periods ranging from
one
to
30
years.
Impairment of Long-Lived Assets and Definite-Lived Intangible Assets.
The Company reviews, on at least a quarterly basis, the financial performance of its businesses for indicators of impairment. In reviewing for impairment indicators, the Company also considers events or changes in circumstances such as business prospects, customer retention, market trends, potential product obsolescence, competitive activities and other economic factors. An impairment loss is recognized when the carrying value of an asset group exceeds the future net undiscounted cash flows expected to be generated by that asset group. The impairment loss recognized is the amount by which the carrying value of the asset group exceeds its fair value.
Goodwill.
The Company assesses goodwill for impairment on an annual basis (October 1 test date) by reviewing relevant qualitative and quantitative factors. More frequent evaluations may be required if the Company experiences changes in its business climate or as a result of other triggering events that take place. If carrying value exceeds fair value, a possible impairment exists and further evaluation is performed.
The Company determines its reporting units at the individual operating segment level, or one level below, when there is discrete financial information available that is regularly reviewed by segment management for evaluating operating results. For purposes of the Company's
2018
goodwill impairment test, the Company had
five
reporting units,
three
of which had goodwill, within its
three
reportable segments. See Note
6
, "
Goodwill and Other Intangible Assets
," for further details regarding the Company's goodwill impairment testing.
56
The Company begins its goodwill reviews by conducting a qualitative assessment ("Step Zero"), considering relevant events and circumstances that affect the fair value or carrying amount of a reporting unit. Such events and circumstances can include macroeconomic conditions, industry and market considerations, overall financial performance, entity and reporting unit specific events, and capital markets pricing. The Company considers the extent to which each of the adverse events and circumstances identified affect the comparison of a reporting unit's fair value with its carrying amount. The Company places more weight on the events and circumstances that most affect a reporting unit's fair value or the carrying amount of its net assets. The Company considers positive and mitigating events and circumstances that may affect its determination of whether it is more likely than not that the fair value of a reporting unit is less than its carrying amount. The Company also considers recent valuations of its reporting units, including the difference between the most recent fair value estimate and the carrying amount. These factors are all considered by management in reaching its conclusion about whether a quantitative goodwill impairment test is necessary to estimate the fair value of its reporting units.
If the Company concludes that conducting a quantitative assessment is required, it performs the first step of a two-step goodwill impairment test. For the first step ("Step I"), the Company estimates the fair value of the reporting unit being evaluated utilizing a combination of three valuation techniques: discounted cash flow (income approach), market comparable method (market approach) and market capitalization (direct market data method). The income approach is based on management's operating plan and internal five-year forecast and utilizes forward-looking assumptions and projections, but considers factors unique to each reporting unit and related long-range plans that may not be comparable to other companies and that are not yet public. The market approach considers potentially comparable companies and transactions within the industries where the Company's reporting units participate, and applies their trading multiples to the Company's reporting units. This approach utilizes data from actual marketplace transactions, but reliance on its results is limited by difficulty in identifying companies that are specifically comparable to the Company's reporting units, considering the diversity of the Company's businesses, the relative sizes and levels of complexity. The Company also uses the direct market data method by comparing its book value and the estimates of fair value of the reporting units to the Company's market capitalization. Management uses this comparison as additional evidence of the fair value of the Company, as its market capitalization may be suppressed by other factors such as the control premium associated with a controlling shareholder, the Company's degree of leverage and the float of the Company's common stock. Management evaluates and weights the results based on a combination of the income and market approaches, and, in situations where the income approach results differ significantly from the market and direct data approaches, management re-evaluates and adjusts, if necessary, its assumptions.
Based on the Step I test, if it is determined that the carrying value of the reporting unit is higher than its fair value, there is an indication that an impairment may exist and the second step ("Step II") is performed to measure the amount of impairment loss, if any. In Step II, the Company determines the implied fair value of the reporting unit goodwill in the same manner as if the reporting unit was being acquired in a business combination and compares the implied fair value of the reporting unit goodwill to the carrying value of the goodwill. If the implied fair value of the goodwill is less than the carrying value, goodwill is impaired and is written down to the implied fair value amount.
Indefinite-Lived Intangibles.
The Company assesses indefinite-lived intangible assets (primarily trademark/trade names) for impairment on an annual basis (October 1 test date) by reviewing relevant qualitative and quantitative factors. More frequent evaluations may be required if the Company experiences changes in its business climate or as a result of other triggering events that take place. If carrying value exceeds fair value, a possible impairment exists and further evaluation is performed.
In conducting a qualitative assessment, the Company considers relevant events and circumstances to determine whether it is more likely than not that the fair values of the indefinite-lived intangible assets are less than the carrying values. In addition to the events and circumstances that the Company considers above in its qualitative analysis for potential goodwill impairment, the Company also considers legal, regulatory and contractual factors that could affect the fair value or carrying amount of the Company's indefinite-lived intangible assets. The Company also considers recent valuations of its indefinite-lived intangible assets, including the difference between the most recent fair value estimates and the carrying amounts. These factors are all considered by management in reaching its conclusion about whether it is more likely than not that the fair values of the indefinite-lived intangible assets are less than the carrying values. If management concludes that further testing is required, the Company performs a quantitative valuation to estimate the fair value of its indefinite-lived intangible assets. In conducting the quantitative impairment analysis, the Company determines the fair value of its indefinite-lived intangible assets using the relief-from-royalty method. The relief-from-royalty method involves the estimation of appropriate market royalty rates for the indefinite-lived intangible assets and the application of these royalty rates to forecasted net sales attributable to the intangible assets. The resulting cash flows are then discounted to present value, using a rate appropriately reflecting the risks inherent in the cash flows, which is compared to the carrying value of the assets. If the carrying value exceeds fair value, an impairment is recorded. See Note
6
, "
Goodwill and Other Intangible Assets
," for further details regarding the Company's indefinite-lived intangible asset impairment testing.
57
High Deductible Insurance.
The Company generally has a high deductible insurance plan for losses and liabilities related to workers' compensation, health and welfare claims and comprehensive general, product and vehicle liability. The Company is generally responsible for up to
$0.8 million
per occurrence under its retention program for workers' compensation, between
$0.3 million
and
$1.5 million
per occurrence under its retention programs for comprehensive general, product and vehicle liability, and has a
$0.3 million
per occurrence stop-loss limit with respect to its group medical plan. Total insurance limits under these retention programs vary by year for comprehensive general, product and vehicle liability and extend to the applicable statutory limits for workers' compensation. Reserves for claims losses, including an estimate of related litigation defense costs, are recorded based upon the Company's estimates of the aggregate liability for claims incurred using actuarial assumptions about future events. Changes in assumptions for factors such as medical costs and actual experience could cause these estimates to change.
Pension Plans.
The Company engages independent actuaries to compute the amounts of liabilities and expenses under defined benefit pension plans, subject to the assumptions that the Company determines are appropriate based on historical trends, current market rates and future projections. Assumptions used in the actuarial calculations could have a significant impact on plan obligations, and a lesser impact on current period expense. Annually, the Company reviews the actual experience compared to the more significant assumptions used and makes adjustments to the assumptions, if warranted. Discount rates are based on an expected benefit payments duration analysis and the equivalent average yield rate for high-quality fixed-income investments. Pension benefits are funded through deposits with trustees and the expected long-term rate of return on fund assets is based on actual historical returns and a review of other public company pension asset return data, modified for known changes in the market and any expected change in investment policy.
Revenue Recognition.
Revenue is recognized when control of promised goods are transferred to customers, which generally occurs when products are shipped from the Company’s facilities to its customers. The amount of revenue recorded reflects the consideration the Company expects to be entitled to in exchange for transferring those goods. Net sales are comprised of gross revenues, based on observed stand-alone selling prices, less estimates of expected returns, trade discounts and customer allowances, which include incentives such as volume and other discounts in connection with various supply programs. Such deductions are estimated and recorded during the period the related revenue is recognized. The Company may adjust these estimates when the expected amount of consideration changes based on sales volumes or other contractual terms. Sales and other consumption taxes the Company collects from customers and remits to government agencies are excluded from revenue. The Company accounts for freight and shipping costs that occur after control of the related goods transfer to the customer as a fulfillment cost within cost of sales. The nature and timing of the Company's revenue transactions are similar, as substantially all revenue is based on point-in-time transactions with customers under industry-standard payment terms. The Company may require shortened payment terms, including cash-in-advance, on an individual customer basis depending on its assessment of the customer's credit risk.
Cost of Sales.
Cost of sales includes material, labor and overhead costs incurred in the manufacture of products sold in the period. Material costs include raw material, purchased components, outside processing and freight costs. Overhead costs consist of variable and fixed manufacturing costs, wages and fringe benefits, and purchasing, receiving and inspection costs.
Selling, General and Administrative Expenses.
Selling, general and administrative expenses include the following: costs related to the advertising, sale, marketing and distribution of the Company's products, amortization of customer intangible assets, costs of finance, human resources, legal functions, executive management costs and other administrative expenses.
Income Taxes.
The Company computes income taxes using the asset and liability method, whereby deferred income taxes using current enacted tax rates are provided for the temporary differences between the financial reporting basis and the tax basis of assets and liabilities and for operating loss and tax credit carryforwards. The Company determines valuation allowances based on an assessment of positive and negative evidence on a jurisdiction-by-jurisdiction basis and records a valuation allowance to reduce deferred tax assets to the amount more likely than not to be realized. The Company recognizes the effect of income tax positions only if those positions are more likely than not of being sustained. Recognized income tax positions are measured at the largest amount that is greater than 50% likely of being realized. Changes in recognition or measurement are reflected in the period in which the change in judgment occurs. The Company records interest and penalties related to unrecognized tax benefits in income tax expense.
On December 22, 2017, the Tax Reform Act was signed into law. Among the provisions, the Tax Reform Act reduces the Federal statutory corporate income tax rate from
35%
to
21%
effective January 1, 2018, implements a territorial tax system and imposes a one-time tax on the deemed repatriation of undistributed earnings of non-U.S. subsidiaries, introduces additional limitations on the deductibility of interest, allows for the immediate expensing of capital expenditures through 2023 and modifies or repeals many business deductions and credits.
58
While the Tax Reform Act provides for a territorial tax system, beginning in 2018, it includes two new U.S. tax base erosion provisions, the global intangible low-taxed income (“GILTI”) provisions and the base-erosion and anti-abuse tax (“BEAT”) provisions. The GILTI provisions impose a tax on foreign income in excess of a deemed return on tangible assets of foreign corporations. The FASB provided guidance that allows companies to make an accounting policy election to either account for deferred taxes related to GILTI inclusions or treat any taxes on GILTI inclusions as period costs. The Company has elected to account for GILTI tax in the period in which it is incurred, and therefore has not provided any deferred tax impacts on GILTI in its consolidated financial statements for the years ended December 31, 2018 and 2017.
The BEAT provisions in the Tax Reform Act eliminate the deduction of certain base-erosion payments made to related foreign corporations, and impose a minimum tax if greater than regular tax. The Company does not expect the BEAT provisions to have a significant impact to its consolidated financial statements, and has not included any tax impacts of BEAT in its consolidated financial statements for the year ended December 31, 2018 and 2017.
See Note
19
, "
Income Taxes
," for further information regarding the impact of the Tax Reform Act to the Company.
Foreign Currency Translation.
The financial statements of subsidiaries located outside of the United States are measured using the currency of the primary economic environment in which they operate as the functional currency. When translating into U.S. dollars, income and expense items are translated at average monthly exchange rates and assets and liabilities are translated at exchange rates in effect at the balance sheet date. Adjustments resulting from translating the functional currency into U.S. dollars are deferred as a component of accumulated other comprehensive income (loss) ("AOCI") in the consolidated statement of shareholders' equity. Net foreign currency transaction gains (losses) were an approximate gain of
$1.3 million
for the year ended
December 31, 2018
, a loss of
$0.8 million
for the year ended
December 31, 2017
and a gain of
$0.8 million
for the year ended
December 31, 2016
, and are included in other expense, net in the accompanying consolidated statement of operations.
Derivative Financial Instruments.
The Company records derivative financial instruments at fair value on the balance sheet as either assets or liabilities, and changes in their fair values are immediately recognized in earnings if the derivatives do not qualify as effective hedges. If a derivative is designated as a fair value hedge, then changes in the fair value of the derivative are offset against the changes in the fair value of the underlying hedged item. If a derivative is designated as a cash flow hedge, then the effective portion of the changes in the fair value of the derivative is recognized as a component of other comprehensive income until the underlying hedged item is recognized in earnings or the forecasted transaction is no longer probable of occurring. If a derivative is designated as a net investment hedge, then the effective portion of the changes in the fair value of the derivative is recognized in other comprehensive income and will be subsequently reclassified to earnings when the hedged net investment is either sold or substantially liquidated. The Company formally documents hedging relationships for all derivative transactions and the underlying hedged items, as well as its risk management objectives and strategies for undertaking the hedge transactions. See Note
11
, "
Derivative Instruments
," for further information on the Company's financial instruments.
Fair Value of Financial Instruments.
In accounting for and disclosing the fair value of financial instruments, the Company uses the following hierarchy:
|
•
|
Level 1 inputs are quoted prices (unadjusted) in active markets for identical assets or liabilities that the Company has the ability to access at the measurement date;
|
|
•
|
Level 2 inputs are inputs other than quoted prices included within Level 1 that are observable for the asset or liability, either directly or indirectly; and
|
|
•
|
Level 3 inputs are unobservable inputs for the asset or liability.
|
Valuation of the Company's interest rate swaps and cross-currency swaps are based on the income approach, which uses observable inputs such as interest rate yield curves and forward currency exchange rates, as applicable.
The carrying value of financial instruments reported in the balance sheet for current assets and current liabilities approximates fair value due to the short maturity of these instruments.
59
Business Combinations.
The Company records assets acquired and liabilities assumed from acquisitions at fair value. The fair value of working capital accounts generally approximates book value. The valuation of inventory, property, plant and equipment, and intangible assets requires significant assumptions. Inventory is recorded at fair value based on the estimated selling price less costs to sell, including completion, disposal and holding period costs with a reasonable profit margin. Property and equipment is recorded at fair value using a combination of both the cost and market approaches for both the real and personal property acquired. Under the cost approach, consideration is given to the amount required to construct or purchase a new asset of equal value at current prices, with adjustments in value for physical deterioration, as well as functional and economic obsolescence. Under the market approach, recent transactions for similar types of assets are used as the basis for estimating fair value. For trademark/trade names and technology and other intangible assets, the estimated fair value is based on projected discounted future net cash flows using the relief-from-royalty method. For customer relationship intangible assets, the estimated fair value is based on projected discounted future cash flows using the excess earnings method. The relief-from-royalty and excess earnings method are both income approaches that utilize key assumptions such as forecasts of revenue and expenses over an extended period of time, royalty rate percentages, tax rates, and estimated costs of debt and equity capital to discount the projected cash flows.
Stock-based Compensation.
The Company recognizes compensation expense related to equity awards based on their fair values as of the grant date. For awards with only a service condition, expense is recognized ratably over the vesting period. Performance based equity awards may have targets tied to performance and/or market-based conditions. Market-based conditions are taken into consideration in determining the grant date fair value, and the related compensation expense is recognized regardless of whether the market condition is satisfied, provided the requisite service has been provided. For performance condition components, the Company periodically updates the probability that the performance conditions will be achieved and adjusts expense accordingly, reflecting the change from prior estimate, if any, in current period non-cash stock compensation expense. The disclosed number of awards granted considers only the targeted number of units until such time that the performance condition has been satisfied. If the performance conditions are not achieved, no award is earned.
Other Comprehensive Income (Loss).
The Company refers to other comprehensive income (loss) as revenues, expenses, gains and losses that under accounting principles generally accepted in the United States of America are included in comprehensive income (loss) but are excluded from net earnings as these amounts are recorded directly as an adjustment to stockholders' equity. Other comprehensive income (loss) is comprised of foreign currency translation adjustments, amortization of prior service costs and unrecognized gains and losses in actuarial assumptions for pension and postretirement plans and changes in unrealized gains and losses on derivatives.
Reclassifications.
Certain prior year amounts have been reclassified to conform with the current year presentation.
4. Revenue
The following table presents the Company’s disaggregated net sales by primary end market served (dollars in thousands):
|
Year ended December 31,
|
||||||||||||
|
Customer End Markets
|
2018
|
2017
|
2016
|
|||||||||
|
Consumer
|
$
|
276,740
|
|
$
|
259,470
|
|
$
|
259,390
|
|
|||
|
Aerospace
|
185,920
|
|
184,310
|
|
174,920
|
|
||||||
|
Industrial
|
212,160
|
|
189,550
|
|
182,280
|
|
||||||
|
Oil and gas
|
202,320
|
|
184,410
|
|
177,430
|
|
||||||
|
Total net sales
|
$
|
877,140
|
|
$
|
817,740
|
|
$
|
794,020
|
|
|||
The Company’s Packaging reportable segment earns revenues from the consumer and industrial end markets. The Aerospace reportable segment earns revenues from the aerospace end market. The Specialty Products reportable segment earns revenues from the industrial and oil and gas end markets.
5
. Facility Closures and Consolidations
During 2018, 2017 and 2016, the Company closed and consolidated several facilities. The following includes details of the most significant actions.
60
2018 Facility Closures and Consolidations
During 2018, the Company exited its Bangalore, India facility within the Specialty Products reportable segment. In connection with this action, the Company recorded pre-tax charges of approximately
$0.7 million
within selling, general and administrative expenses and approximately
$0.6 million
within cost of sales related to severance benefits for employees involuntarily terminated, facility closure costs and costs related to the disposal of certain assets
2017 Facility Closures and Consolidations
During 2017, the Company announced plans within the Specialty Products reportable segment to cease production at its Reynosa, Mexico facility, and consolidate production into its Houston, Texas facility. In 2017, upon the cease use date of the facility, the Company recorded a pre-tax charge of approximately
$2.3 million
within cost of sales for estimated future unrecoverable lease obligations, net of estimated sublease recoveries, for the lease that expires in 2025. In addition, the Company incurred approximately
$1.2 million
of pre-tax, non-cash charges within cost of sales related to accelerated depreciation expense as a result of shortening the expected lives on certain machinery, equipment and leasehold improvement assets that the Company no longer used following the facility closure. During 2018, following entry into a sublease agreement for the facility, the Company re-evaluated its estimate of unrecoverable future obligations, and reduced its estimate by approximately
$1.1 million
.
Additionally, during 2017, the Company exited its Wolverhampton, United Kingdom facility within the Specialty Products reportable segment. In connection with this action, the Company recorded pre-tax charges of approximately
$3.5 million
within net loss on disposition of assets in the accompanying statement of operations, of which approximately
$3.2 million
were non-cash charges related to the disposal of certain assets.
2016 Facility Closures and Consolidations
During 2016, the Company closed and consolidated certain facilities and initiated actions toward consolidating additional facilities within each of its reportable segments. The most significant activity related to the move of production activities in Mexico within the Packaging reportable segment from Mexico City to San Miguel de Allende, for which the Company recorded pre-tax charges of approximately
$2.5 million
, of which approximately
$0.7 million
related to severance benefits for employees involuntarily terminated, approximately
$0.8 million
related to accelerated depreciation of machinery and equipment and the write-down of certain inventory to its estimated salvage value, with the remainder of the charges related to costs to move and start-up operations in the new facility. During 2017, the Company sold the Mexico City facility for cash proceeds of approximately
$2.8 million
and recognized a gain on sale of approximately
$2.5 million
which is included in net loss on dispositions of assets in the accompanying consolidated statement of operations.
6
. Goodwill and Other Intangible Assets
Goodwill
The Company performed a Step Zero qualitative assessment as part of its 2018, 2017 and 2016 annual impairment tests for all reporting units, which included a review of the Company’s market capitalization. For purposes of the 2018 annual impairment test, based on the Step Zero assessment, the Company determined there were no indications that the fair value of a reporting unit was less than its carrying amount. Therefore, the Company determined that the Step I and Step II tests were not required. For purposes of the 2017 and 2016 annual impairment tests, for all reporting units with goodwill other than the Aerospace reporting unit, based on the Step Zero assessment, the Company determined that there were no indications that the fair value of a reporting unit was less than its carrying amount. Therefore, the Company determined that the Step I and Step II tests were not required for these reporting units.
For purposes of the 2017 annual impairment test for the Company's Aerospace reporting unit, management elected to perform a Step I quantitative assessment in consideration of the partial goodwill impairment charge recorded during 2016. In preparing the Step I analysis, the Company utilized both income and market-based approaches, placing a
50%
weighting on each. Significant management assumptions used under the income approach were a weighted average cost of capital ("WACC") of
9.5%
and an estimated residual growth rate of
3%
. In determining the WACC, management considered the level of risk inherent in the cash flow projections based on reducing previously utilized sales growth and margin expansion assumptions, as well as historical attainment of its projections and current market conditions. The use of these unobservable inputs resulted in the fair value estimate being classified as a Level 3 measurement within the fair value hierarchy. Upon completion of the Step I test, the Company determined that the fair value of the Aerospace reporting unit exceeded its carrying value by more than
15%
.
61
For purposes of the 2016 annual impairment test for the Company's Aerospace reporting unit, management had been monitoring current and expected operating results since the first quarter of 2016, when sales and margins were significantly lower than expected, to assess whether the reductions were other than temporary. Management established and executed against recovery plans, improving sales and margin levels during the second and third quarters of 2016. However, when considering these recent financial results, plus recognizing that fourth quarter 2016 results would be lower than previously expected, and updating the Company's assessment of future expectations for growth and profit levels, the Company determined that there were indicators that the fair value of the Aerospace reporting unit was less than its carrying value. Therefore, the Company performed a Step I quantitative assessment for its Aerospace reporting unit utilizing both income and market-based approaches, placing a
50%
weighting on each. Significant management assumptions used under the income approach were a WACC of
10.3%
and an estimated residual growth rate of
3%
. In determining the WACC, management considered the level of risk inherent in the cash flow projections and current market conditions. The use of these unobservable inputs resulted in the fair value estimate being classified as a Level 3 measurement within the fair value hierarchy.
Upon completion of the 2016 Step I test, the Company determined that the carrying value of the Aerospace reporting unit exceeded its fair value. The Company then performed a Step II test to determine whether goodwill had been impaired and, if applicable, to calculate the amount of the impairment charge. Based on the results of the Step II goodwill impairment test, the Company recorded a goodwill impairment charge of approximately
$60.2 million
in its Aerospace reporting unit.
Changes in the carrying amount of goodwill for the years ended
December 31, 2018
and
2017
are as follows (dollars in thousands):
|
|
|
|
Specialty
|
|
|||||||||||
|
|
Packaging
|
Aerospace
|
Products
|
Total
|
|||||||||||
|
Balance, December 31, 2016
|
$
|
162,090
|
|
$
|
146,430
|
|
$
|
6,560
|
|
$
|
315,080
|
|
|||
|
Foreign currency translation and other
|
4,310
|
|
—
|
|
—
|
|
4,310
|
|
|||||||
|
Balance, December 31, 2017
|
$
|
166,400
|
|
$
|
146,430
|
|
$
|
6,560
|
|
$
|
319,390
|
|
|||
|
Foreign currency translation and other
|
(2,740
|
)
|
—
|
|
—
|
|
(2,740
|
)
|
|||||||
|
Balance, December 31, 2018
|
$
|
163,660
|
|
$
|
146,430
|
|
$
|
6,560
|
|
$
|
316,650
|
|
|||
Other Intangible Assets
For the purposes of the Company's 2018 indefinite-lived intangible asset impairment tests, the Company performed a qualitative assessment to determine whether it was more likely than not that the fair values of the indefinite-lived intangible assets are less than the carrying values. Based on the qualitative assessment performed, the Company does not believe that it is more likely than not that the fair values of each of its indefinite-lived intangible assets are less than the carrying values; therefore, a fair value calculation of the indefinite-lived intangible assets is not required for the 2018 annual indefinite-lived intangible asset impairment tests.
In 2017, the Company performed a qualitative assessment as part of its annual impairment test to determine whether it was more likely than not that the fair values of the indefinite-lived intangible assets were less than the carrying values. Based on the assessment, the Company determined that there were no indications that the fair values of any of its indefinite-lived intangible assets were less than the carrying values. However, in consideration of the impairment charge recorded during 2016, the Company performed a quantitative assessment for its indefinite-lived intangible assets recorded on its balance sheet as of October 1, 2017 within the Aerospace reportable segment to supplement its qualitative assessment. Using the relief-from-royalty method with a discount rate of
9.5%
and an estimated residual growth rate of
3%
, the Company determined each of its Aerospace-related trade names had a fair value that exceeded carrying values by more than
9%
. The use of unobservable inputs resulted in the fair value estimates being classified as a Level 3 measurement within the fair value hierarchy.
62
In 2016, the Company performed a qualitative assessment as part of its annual impairment test to determine whether it was more likely than not that the fair values of the indefinite-lived intangible assets were less than the carrying values. Based on the assessment, the Company determined that there were no indications that the fair values of any of its indefinite-lived intangible assets, except for the Aerospace indefinite-lived intangible assets, were less than the carrying values. As such, the Company performed a quantitative assessment for all of its indefinite-lived intangible assets included within the Aerospace reportable segment, using a relief-from-royalty method. Significant management assumptions used under the relief-from-royalty method were a discount rate of
10.3%
and an estimated residual growth rate of
3%
. The use of these unobservable inputs resulted in the fair value estimates being classified as a Level 3 measurement within the fair value hierarchy. Upon completion of the quantitative impairment test, the Company determined that certain of the Company's Aerospace-related trade names had carrying values that exceeded their fair values, and therefore recorded impairment charges of approximately
$38.7 million
.
The Company amortizes its other intangible assets over periods ranging from
one
to
30
years. The gross carrying amounts and accumulated amortization of the Company's other intangibles as of
December 31, 2018
and
2017
are summarized below (dollars in thousands):
|
|
As of December 31, 2018
|
As of December 31, 2017
|
||||||||||||||
|
Intangible Category by Useful Life
|
Gross Carrying
Amount
|
Accumulated
Amortization
|
Gross Carrying
Amount
|
Accumulated
Amortization
|
||||||||||||
|
Finite-lived intangible assets:
|
|
|
|
|
||||||||||||
|
Customer relationships, 5 - 12 years
|
$
|
73,450
|
|
$
|
(48,410
|
)
|
$
|
73,910
|
|
$
|
(41,000
|
)
|
||||
|
Customer relationships, 15 - 25 years
|
132,230
|
|
(58,790
|
)
|
132,230
|
|
(51,880
|
)
|
||||||||
|
Total customer relationships
|
205,680
|
|
(107,200
|
)
|
206,140
|
|
(92,880
|
)
|
||||||||
|
Technology and other, 1 - 15 years
|
57,020
|
|
(31,600
|
)
|
57,340
|
|
(29,120
|
)
|
||||||||
|
Technology and other, 17 - 30 years
|
43,300
|
|
(35,600
|
)
|
43,300
|
|
(33,490
|
)
|
||||||||
|
Total technology and other
|
100,320
|
|
(67,200
|
)
|
100,640
|
|
(62,610
|
)
|
||||||||
|
Indefinite-lived intangible assets:
|
|
|
|
|
||||||||||||
|
Trademark/Trade names
|
42,930
|
|
—
|
|
42,930
|
|
—
|
|
||||||||
|
Total other intangible assets
|
$
|
348,930
|
|
$
|
(174,400
|
)
|
$
|
349,710
|
|
$
|
(155,490
|
)
|
||||
Amortization expense related to intangible assets as included in the accompanying consolidated statement of operations is summarized as follows (dollars in thousands):
|
Year ended December 31,
|
||||||||||||
|
2018
|
2017
|
2016
|
||||||||||
|
Technology and other, included in cost of sales
|
$
|
4,900
|
|
$
|
5,340
|
|
$
|
5,680
|
|
|||
|
Customer relationships, included in selling, general and administrative expenses
|
14,540
|
|
14,580
|
|
14,790
|
|
||||||
|
Total amortization expense
|
$
|
19,440
|
|
$
|
19,920
|
|
$
|
20,470
|
|
|||
Estimated amortization expense for the next five fiscal years beginning after
December 31, 2018
is as follows (dollars in thousands):
|
Year ended December 31,
|
Estimated Amortization Expense
|
|||
|
2019
|
$
|
19,080
|
|
|
|
2020
|
$
|
18,140
|
|
|
|
2021
|
$
|
15,360
|
|
|
|
2022
|
$
|
11,810
|
|
|
|
2023
|
$
|
9,910
|
|
|
63
7. Inventories
Inventories consist of the following components (dollars in thousands):
|
|
December 31,
2018 |
December 31,
2017 |
||||||
|
Finished goods
|
$
|
91,780
|
|
$
|
86,310
|
|
||
|
Work in process
|
29,080
|
|
24,580
|
|
||||
|
Raw materials
|
52,260
|
|
44,460
|
|
||||
|
Total inventories
|
$
|
173,120
|
|
$
|
155,350
|
|
||
8
. Property and Equipment, Net
Property and equipment consists of the following components (dollars in thousands):
|
|
December 31,
2018 |
December 31,
2017 |
||||||
|
Land and land improvements
|
$
|
15,580
|
|
$
|
15,500
|
|
||
|
Building and building improvements
|
74,110
|
|
73,550
|
|
||||
|
Machinery and equipment
|
318,860
|
|
303,880
|
|
||||
|
408,550
|
|
392,930
|
|
|||||
|
Less: Accumulated depreciation
|
220,750
|
|
202,680
|
|
||||
|
Property and equipment, net
|
$
|
187,800
|
|
$
|
190,250
|
|
||
Depreciation expense as included in the accompanying consolidated statement of operations is as follows (dollars in thousands):
|
Year ended December 31,
|
||||||||||||
|
2018
|
2017
|
2016
|
||||||||||
|
Depreciation expense, included in cost of sales
|
$
|
22,940
|
|
$
|
24,950
|
|
$
|
21,620
|
|
|||
|
Depreciation expense, included in selling, general and administrative expense
|
1,640
|
|
2,000
|
|
2,770
|
|
||||||
|
Total depreciation expense
|
$
|
24,580
|
|
$
|
26,950
|
|
$
|
24,390
|
|
|||
9. Accrued Liabilities
Accrued liabilities consist of the following components (dollars in thousands):
|
|
December 31,
2018 |
December 31,
2017 |
||||||
|
High deductible insurance
|
$
|
6,090
|
|
$
|
6,250
|
|
||
|
Accrued payroll
|
20,830
|
|
19,060
|
|
||||
|
Other
|
21,380
|
|
24,160
|
|
||||
|
Total accrued liabilities
|
$
|
48,300
|
|
$
|
49,470
|
|
||
64
10
. Long-term Debt
The Company's long-term debt consists of the following (dollars in thousands):
|
|
December 31,
2018 |
December 31,
2017 |
||||||
|
4.875% Senior Notes due October 2025
|
$
|
300,000
|
|
$
|
300,000
|
|
||
|
Credit Agreement
|
—
|
|
10,810
|
|
||||
|
Debt issuance costs
|
(6,440
|
)
|
(7,730
|
)
|
||||
|
Long-term debt, net
|
$
|
293,560
|
|
$
|
303,080
|
|
||
Senior Notes
In September 2017, the Company issued
$300.0 million
aggregate principal amount of
4.875%
senior notes due
October 15, 2025
("Senior Notes") at par value in a private placement under Rule 144A of the Securities Act of 1933, as amended. The Company used the proceeds from the offering to fully repay the
$250.9 million
principal, plus
$0.4 million
related interest, outstanding on its former senior secured term loan A facility due 2020 ("Term Loan A Facility"), repay approximately
$41.7 million
of outstanding obligations under the Company's accounts receivable facility, pay fees and expenses of
$5.0 million
related to the Senior Notes offering, pay fees and expenses of
$1.1 million
related to amending its existing credit agreement, with the remaining amount retained as cash on its consolidated balance sheet. Of the
$5.0 million
of fees and expenses related to the Senior Notes, approximately
$4.9 million
was capitalized as debt issuance costs and approximately
$0.1 million
was recorded as debt financing and related expenses in the accompanying consolidated statement of operations.
The Senior Notes accrue interest at a rate of
4.875%
per annum, payable semi-annually in arrears on April 15 and October 15, commencing on
April 15, 2018
. The payment of principal and interest is jointly and severally guaranteed, on a senior unsecured basis, by certain subsidiaries of the Company (each a "Guarantor" and collectively the "Guarantors"). The Senior Notes are
pari passu
in right of payment with all existing and future senior indebtedness and subordinated to all existing and future secured indebtedness to the extent of the value of the assets securing such indebtedness.
Prior to October 15, 2020, the Company may redeem up to
35%
of the principal amount of the Senior Notes at a redemption price of
104.875%
of the principal amount, plus accrued and unpaid interest, if any, to the redemption date, with the net cash proceeds of one or more equity offerings provided that each such redemption occurs within 90 days of the date of closing of each such equity offering. In addition, the Company may redeem all or part of the Senior Notes at a redemption price equal to
100%
of the principal amount thereof, plus accrued and unpaid interest, if any, to the redemption date, plus a "make whole" premium. On or after October 15, 2020, the Company may redeem all or part of the Senior Notes at the redemption prices (expressed as percentages of principal amount) set forth below, plus accrued and unpaid interest, if any, to the redemption date, if redeemed during the twelve-month period beginning on October 15 of the years indicated below:
|
Year
|
Percentage
|
||
|
2020
|
102.438
|
%
|
|
|
2021
|
101.219
|
%
|
|
|
2022 and thereafter
|
100.000
|
%
|
|
Credit Agreement
The Company is party to a credit agreement ("Credit Agreement") consisting of a
$300.0 million
senior secured revolving credit facility, which permits borrowings denominated in specific foreign currencies, subject to a
$125.0 million
sub limit, matures on
September 20, 2022
and is subject to interest at London Interbank Offered Rate ("LIBOR") plus
1.50%
. The interest rate spread is based upon the leverage ratio, as defined, as of the most recent determination date.
The Credit Agreement also provides incremental revolving credit facility commitments in an amount not to exceed the greater of
$200.0 million
and an amount such that, after giving effect to such incremental commitments and the incurrence of any other indebtedness substantially simultaneously with the making of such commitments, the senior secured net leverage ratio, as defined, is no greater than
3.00
to 1.00. The terms and conditions of any incremental revolving credit facility commitments must be no more favorable than the existing credit facility.
65
The Company amended its existing credit agreement in 2017 in connection with the Senior Notes offering and extended the maturity date, increased the permitted borrowings denominated in specific foreign currencies, removed the Term Loan A Facility and resized the revolving credit facility. The Company incurred fees and expenses of approximately
$1.1 million
related to the amendment, all of which was capitalized as debt issuance costs. The Company also recorded approximately
$2.0 million
non-cash expense related to the write-off of previously capitalized deferred financing fees within debt financing and related expenses in the accompanying consolidated statement of operations.
The Company's revolving credit facility allows for the issuance of letters of credit, not to exceed
$40.0 million
in aggregate. At
December 31, 2018
, the Company had
no
amounts outstanding under its revolving credit facility and had
$284.9 million
potentially available after giving effect to approximately
$15.1 million
of letters of credit issued and outstanding. At
December 31, 2017
, the Company had
$10.8 million
outstanding under its revolving credit facility and had
$274.3 million
potentially available after giving effect to approximately
$14.9 million
of letters of credit issued and outstanding. However, including availability under its accounts receivable facility and after consideration of leverage restrictions contained in the Credit Agreement, at
December 31, 2018
and
2017
, the Company had
$284.9 million
and
$332.1 million
, respectively, of borrowing capacity available for general corporate purposes.
The debt under the Credit Agreement is an obligation of the Company and certain of its domestic subsidiaries and is secured by substantially all of the assets of such parties. Borrowings under the
$125.0 million
(equivalent) foreign currency sub limit of the
$300.0 million
senior secured revolving credit facility are secured by a cross-guarantee amongst, and a pledge of the assets of, the foreign subsidiary borrowers that are a party to the agreement. The Credit Agreement also contains various negative and affirmative covenants and other requirements affecting the Company and its subsidiaries, including the ability to, subject to certain exceptions and limitations, incur debt, liens, mergers, investments, loans, advances, guarantee obligations, acquisitions, assets dispositions, sale-leaseback transactions, hedging agreements, dividends and other restricted payments, transactions with affiliates, restrictive agreements and amendments to charters, bylaws, and other material documents. The terms of the Credit Agreement also require the Company and its restricted subsidiaries to meet certain restrictive financial covenants and ratios computed quarterly, including a maximum total net leverage ratio (total consolidated indebtedness plus outstanding amounts under the accounts receivable securitization facility, less the aggregate amount of certain unrestricted cash and unrestricted permitted investments, as defined, over consolidated EBITDA, as defined), a maximum senior secured net leverage ratio (total consolidated senior secured indebtedness, less the aggregate amount of certain unrestricted cash and unrestricted permitted investments, as defined, over consolidated EBITDA, as defined) and a minimum interest expense coverage ratio (consolidated EBITDA, as defined, over the sum of consolidated cash interest expense, as defined, and preferred dividends, as defined). At
December 31, 2018
, the Company was in compliance with the financial covenants contained in the Credit Agreement.
Receivables Facility
In March 2018, the Company terminated its accounts receivable facility previously utilized through TSPC, Inc. ("TSPC"), a wholly-owned subsidiary. The facility was used to sell trade accounts receivable of substantially all of the Company's domestic business operations. Under this facility, TSPC, from time to time, could sell an undivided fractional ownership interest in the pool of receivables up to
$75.0 million
to a third-party multi-seller receivables funding company. The cost of funds under this facility consisted of a 1-month LIBOR-based rate plus a usage fee of
1.00%
and a fee on the unused portion of the facility of
0.35%
.
At
December 31, 2017
, the Company had
no
amounts outstanding under the facility and
$57.8 million
available but not utilized. Aggregate costs incurred under the facility were
$0.1 million
,
$1.0 million
and
$0.9 million
for the years ended
December 31, 2018
,
2017
and
2016
, respectively, and are included in interest expense in the accompanying consolidated statement of operations.
66
Long-term Debt Maturities
Future maturities of the face value of long-term debt at
December 31, 2018
are as follows (dollars in thousands):
|
Year Ending December 31:
|
Future Maturities
|
|||
|
2019
|
$
|
—
|
|
|
|
2020
|
—
|
|
||
|
2021
|
—
|
|
||
|
2022
|
—
|
|
||
|
2023
|
—
|
|
||
|
Thereafter
|
300,000
|
|
||
|
Total
|
$
|
300,000
|
|
|
Fair Value of Debt
The valuations of the Senior Notes and revolving credit facility were determined based on Level 2 inputs under the fair value hierarchy, as defined. The carrying amounts and fair values were as follows (dollars in thousands):
|
December 31, 2018
|
December 31, 2017
|
|||||||||||||||
|
Carrying Amount
|
Fair Value
|
Carrying Amount
|
Fair Value
|
|||||||||||||
|
Senior Notes
|
$
|
300,000
|
|
$
|
282,750
|
|
$
|
300,000
|
|
$
|
300,750
|
|
||||
|
Revolving credit facility
|
—
|
|
—
|
|
10,810
|
|
10,490
|
|
||||||||
Debt Issuance Costs
The Company's unamortized debt issuance costs approximated
$6.4 million
and
$7.7 million
at
December 31, 2018
and
2017
, respectively, and are included as a direct reduction from the related debt liability in the accompanying consolidated balance sheet. These amounts consisted primarily of legal, accounting and other transaction advisory fees as well as facility fees paid to the lenders. Amortization expense for these items was approximately
$1.3 million
,
$1.3 million
and
$1.4 million
in
2018
,
2017
and
2016
, respectively, and is included in interest expense in the accompanying consolidated statement of operations.
11
. Derivative Instruments
In October 2018, the Company entered into cross-currency swap agreements to hedge its net investment in Euro-denominated assets against future volatility in the exchange rate between the U.S. dollar and the Euro. By doing so, the Company synthetically converted a portion of its U.S. dollar-based long-term debt into Euro-denominated long-term debt. The agreements have a
five
year tenor at notional amounts declining from
$125.0 million
to
$75.0 million
over the contract period. Under the terms of the swap agreements, the Company is to receive net interest payments at a fixed rate of approximately
2.9%
of the notional amount. At inception, the cross-currency swaps were designated as net investment hedges.
In October 2018, immediately prior entering into the new cross-currency swap agreements, the Company terminated its existing cross-currency swap agreements, de-designating the swaps as net investment hedges and receiving approximately
$1.1 million
of cash. The cross-currency swap agreements were entered into in October 2017 and hedged the Company's net investment in Euro-denominated assets against future volatility in the exchange rate between the U.S. dollar and the Euro. The agreements had a
five
year tenor at notional amounts declining from
$150.0 million
to
$75.0 million
over the contract period. Under the terms of the swap agreements, the Company was to receive net interest payments at a fixed rate of approximately
2.1%
of the notional amount.
The Company has historically utilized interest rate swap agreements to fix the LIBOR-based variable portion of the interest rate on its long-term debt. Prior to its debt refinancing in September 2017, the Company had interest rate swap agreements in place that hedged a declining notional value of debt ranging from approximately
$238.4 million
to approximately
$192.7 million
, amortizing consistent with future scheduled debt principal payments. The interest rate swap agreements required the Company to receive a variable interest rate and pay a fixed interest rate in a range of
0.74%
to
2.68%
with various expiration terms extending to
June 30, 2020
. At inception, the interest rate swaps were designated as cash flow hedges.
67
In September 2017, immediately following the debt refinancing, the Company determined the likelihood of the hedged transactions occurring was not probable and de-designated the interest rate swaps as cash flow hedges and terminated the interest rate swaps for a cash payment of approximately
$4.7 million
. There were no interest rate swaps outstanding as of December 31, 2017. The cash flows associated with the cash flow hedges are reported in net cash provided by operating activities in the accompanying consolidated statement of cash flows. Up to the date of the termination, the Company utilized hedge accounting, which allows for the effective portion of the interest rate swaps to be recorded in AOCI in the accompanying consolidated balance sheet. At the date the Company de-designated the swaps as effective hedges, there was approximately
$2.9 million
(net of tax of
$1.8 million
) of unrealized losses remaining in AOCI, which were reclassified into debt financing and related expenses in the accompanying consolidated statement of operations during 2017.
As of
December 31, 2018
and
2017
, the fair value carrying amount of the Company's derivatives designated as hedging instruments are recorded as follows (dollars in thousands):
|
Asset / (Liability) Derivatives
|
||||||||||
|
Derivatives designated as hedging instruments
|
Balance Sheet Caption
|
December 31, 2018
|
December 31, 2017
|
|||||||
|
Net Investment Hedges
|
||||||||||
|
Cross-currency swaps
|
Other assets
|
$
|
130
|
|
$
|
—
|
|
|||
|
Cross-currency swaps
|
Other long-term liabilities
|
—
|
|
(4,110
|
)
|
|||||
The following table summarizes the income (loss) recognized in AOCI on derivative contracts designated as hedging instruments as of
December 31, 2018
and
2017
, and the amounts reclassified from AOCI into earnings for the years ended
December 31, 2018
,
2017
and
2016
(dollars in thousands):
|
Amount of Income (Loss) Recognized
in AOCI on Derivative (Effective Portion, net of tax) |
Location of Loss Reclassified from AOCI into Earnings
(Effective Portion) |
Amount of Loss Reclassified from
AOCI into Earnings |
||||||||||||||||||||
|
As of December 31,
|
Year ended December 31,
|
|||||||||||||||||||||
|
2018
|
2017
|
2018
|
2017
|
2016
|
||||||||||||||||||
|
Net Investment Hedges
|
||||||||||||||||||||||
|
Cross-currency swaps
|
$
|
940
|
|
$
|
(3,170
|
)
|
Other expense, net
|
$
|
—
|
|
$
|
—
|
|
$
|
—
|
|
||||||
|
Cash Flow Hedges
|
||||||||||||||||||||||
|
Interest rate swaps
|
$
|
—
|
|
$
|
—
|
|
Interest expense
|
$
|
—
|
|
$
|
(320
|
)
|
$
|
(670
|
)
|
||||||
|
Debt financing and related expenses
|
$
|
—
|
|
$
|
(4,680
|
)
|
$
|
—
|
|
|||||||||||||
Over the next
12
months, the Company does not expect to reclassify any pre-tax deferred losses from AOCI into earnings.
The fair value of the Company's derivative instruments are estimated using an income approach based on valuation techniques to convert future amounts to a single, discounted amount. Estimates of the fair value of the Company's cross-currency swaps use observable inputs such as interest rate yield curves and forward currency exchange rates. Fair value measurements and the fair value hierarchy level for the Company's assets and liabilities measured at fair value on a recurring basis as of
December 31, 2018
and
2017
are as follows (dollars in thousands):
|
Description
|
Frequency
|
Asset / (Liability)
|
Quoted Prices in Active Markets for Identical Assets
(Level 1) |
Significant Other Observable Inputs
(Level 2) |
Significant Unobservable Inputs
(Level 3) |
||||||||||||||
|
December 31, 2018
|
Cross-currency swaps
|
Recurring
|
$
|
130
|
|
$
|
—
|
|
$
|
130
|
|
$
|
—
|
|
|||||
|
December 31, 2017
|
Cross-currency swaps
|
Recurring
|
$
|
(4,110
|
)
|
$
|
—
|
|
$
|
(4,110
|
)
|
$
|
—
|
|
|||||
68
12. Leases
The Company leases certain equipment and facilities under non-cancelable operating leases. Rental expense for the Company totaled approximately
$12.3 million
in
2018
,
$16.7 million
in
2017
and
$17.4 million
in
2016
.
Minimum payments for operating leases having initial or remaining non-cancelable lease terms in excess of one year at
December 31, 2018
are summarized below (dollars in thousands):
|
Year ended December 31,
|
Minimum Payments
|
|||
|
2019
|
$
|
12,730
|
|
|
|
2020
|
12,530
|
|
||
|
2021
|
11,080
|
|
||
|
2022
|
7,510
|
|
||
|
2023
|
6,270
|
|
||
|
Thereafter
|
15,830
|
|
||
|
Total
|
$
|
65,950
|
|
|
13
. Commitments and Contingencies
Environmental
The Company is subject to increasingly stringent environmental laws and regulations, including those relating to air emissions, wastewater discharges and chemical and hazardous waste management and disposal. Some of these environmental laws hold owners or operators of land or businesses liable for their own and for previous owners' or operators' releases of hazardous or toxic substances or wastes. Other environmental laws and regulations require the obtainment and compliance with environmental permits. To date, costs of complying with environmental, health and safety requirements have not been material. However, the nature of the Company's operations and the long history of industrial activities at certain of the Company's current or former facilities, as well as those acquired, could potentially result in material environmental liabilities.
While the Company must comply with existing and pending climate change legislation, regulation and international treaties or accords, current laws and regulations have not had a material impact on the Company's business, capital expenditures or financial position. Future events, including those relating to climate change or greenhouse gas regulation, could require the Company to incur expenses related to the modification or curtailment of operations, installation of pollution control equipment or investigation and cleanup of contaminated sites.
Asbestos
As of
December 31, 2018
, the Company was a party to
379
pending cases involving an aggregate of
4,820
claimants primarily alleging personal injury from exposure to asbestos containing materials formerly used in gaskets (both encapsulated and otherwise) manufactured or distributed by certain of its subsidiaries for use primarily in the petrochemical refining and exploration industries. The following chart summarizes the number of claimants, number of claims filed, number of claims dismissed, number of claims settled, the average settlement amount per claim and the total defense costs, excluding amounts reimbursed under the Company's primary insurance, at the applicable date and for the applicable periods:
|
|
Claims
pending at
beginning of
period
|
Claims filed
during
period
|
Claims
dismissed
during
period
|
Claims
settled
during
period
|
Claims
pending at end of period |
Average
settlement
amount per
claim during
period
|
Total defense
costs during
period
|
||||||||||||||||
|
Fiscal year ended December 31, 2018
|
5,256
|
|
171
|
|
564
|
|
43
|
|
4,820
|
|
$
|
7,191
|
|
$
|
2,260,000
|
|
|||||||
|
Fiscal year ended December 31, 2017
|
5,339
|
|
173
|
|
231
|
|
25
|
|
5,256
|
|
$
|
8,930
|
|
$
|
2,280,000
|
|
|||||||
|
Fiscal year ended December 31, 2016
|
6,242
|
|
140
|
|
1,009
|
|
34
|
|
5,339
|
|
$
|
15,624
|
|
$
|
2,920,000
|
|
|||||||
69
In addition, the Company acquired various companies to distribute its products that had distributed gaskets of other manufacturers prior to acquisition. The Company believes that many of the pending cases relate to locations at which none of its gaskets were distributed or used.
The Company may be subjected to significant additional asbestos-related claims in the future, the cost of settling cases in which product identification can be made may increase, and the Company may be subjected to further claims in respect of the former activities of its acquired gasket distributors. The Company is unable to make a meaningful statement concerning the monetary claims made in the asbestos cases given that, among other things, claims may be initially made in some jurisdictions without specifying the amount sought or by simply stating the requisite or maximum permissible monetary relief, and may be amended to alter the amount sought. The large majority of claims do not specify the amount sought. Of the
4,820
claims pending at
December 31, 2018
,
49
set forth specific amounts of damages (other than those stating the statutory minimum or maximum). At
December 31, 2018
, of the
49
claims that set forth specific amounts, there were no claims seeking specific amounts for punitive damages. Below is a breakdown of the amount sought for those claims seeking specific amounts:
|
Compensatory
|
|||||
|
Range of damages sought (in millions)
|
$0.0 to $0.6
|
$0.6 to $5.0
|
$5.0+
|
||
|
Number of claims
|
—
|
12
|
37
|
||
In addition, relatively few of the claims have reached the discovery stage and even fewer claims have gone past the discovery stage.
Total settlement costs (exclusive of defense costs) for all such cases, some of which were filed over 25 years ago, have been approximately
$8.9 million
. All relief sought in the asbestos cases is monetary in nature. To date, approximately
40%
of the Company's costs related to settlement and defense of asbestos litigation have been covered by its primary insurance. Effective February 14, 2006, the Company entered into a coverage-in-place agreement with its first level excess carriers regarding the coverage to be provided to the Company for asbestos-related claims when the primary insurance is exhausted. The coverage-in-place agreement makes asbestos defense costs and indemnity insurance coverage available to the Company that might otherwise be disputed by the carriers and provides a methodology for the administration of such expenses. The Company's primary insurance exhausted in November 2018, and the Company will be solely responsible for defense costs and indemnity payments prior to the commencement of coverage under this agreement, the duration of which would be subject to the scope of damage awards and settlements paid.
Based on the settlements made to date and the number of claims dismissed or withdrawn for lack of product identification, the Company believes that the relief sought (when specified) does not bear a reasonable relationship to its potential liability. Based upon the Company's experience to date, including the trend in annual defense and settlement costs incurred to date, and other available information (including the availability of excess insurance), the Company does not believe that these cases will have a material adverse effect on its financial position and results of operations or cash flows.
Metaldyne Corporation
Prior to 2002, the Company was wholly-owned by Metaldyne Corporation ("Metaldyne"). In connection with the reorganization between TriMas and Metaldyne in 2002, TriMas assumed certain liabilities and obligations of Metaldyne, mainly comprised of contractual obligations to former TriMas employees, tax related matters, benefit plan liabilities and reimbursements to Metaldyne of normal course payments to be made on TriMas' behalf.
In 2007, Metaldyne merged into a subsidiary of Asahi Tec Corporation (“Asahi”) whereby Metaldyne became a wholly-owned subsidiary of Asahi, and in 2009, Metaldyne and its U.S. subsidiaries filed voluntary petitions in the United States Bankruptcy Court under Chapter 11 of the U.S. Bankruptcy Code.
In January 2018, the U.S. Bankruptcy Court entered a final decree to close all remaining cases and finalize the Metaldyne bankruptcy distribution trust, effectively terminating any potential obligation by TriMas to Metaldyne. In consideration of the final decree, the Company removed the obligation from its balance sheet during the first quarter of 2018, resulting in an approximate
$8.2 million
non-cash reduction in selling, general and administrative expenses in the accompanying consolidated statement of operations.
70
Claims and Litigation
The Company is subject to other claims and litigation in the ordinary course of business, but does not believe that any such claim or litigation will have a material adverse effect on its financial position and results of operations or cash flows.
14
. Employee Benefit Plans
Pension and Profit-Sharing Benefits
The Company provides a defined contribution profit sharing plan for the benefit of substantially all the Company's domestic salaried and non-union hourly employees. The plan contains both contributory and noncontributory profit sharing arrangements, as defined. Aggregate charges included in the accompanying consolidated statement of operations under this plan were approximately
$4.2 million
,
$3.8 million
and
$3.7 million
in
2018
,
2017
and
2016
, respectively. Certain of the Company's non-U.S. and union hourly employees participate in defined benefit pension plans.
Plan Assets, Expenses and Obligations
Net periodic pension benefit expense recorded in the Company's consolidated statement of operations for defined benefit pension plans include the following components (dollars in thousands):
|
|
Pension Benefit
|
|||||||||||
|
|
2018
|
2017
|
2016
|
|||||||||
|
Service cost
|
$
|
1,120
|
|
$
|
1,150
|
|
$
|
950
|
|
|||
|
Interest cost
|
1,100
|
|
1,290
|
|
1,510
|
|
||||||
|
Expected return on plan assets
|
(1,520
|
)
|
(1,480
|
)
|
(1,610
|
)
|
||||||
|
Settlements and curtailments
|
2,620
|
|
—
|
|
1,330
|
|
||||||
|
Amortization of net loss
|
860
|
|
1,010
|
|
930
|
|
||||||
|
Net periodic benefit expense
|
$
|
4,180
|
|
$
|
1,970
|
|
$
|
3,110
|
|
|||
The service cost component of net periodic benefit cost is recorded in cost of goods sold and selling, general and administrative expenses, while non-service cost components are recorded in other expense, net in the accompanying consolidated statement of operations.
During 2018, the Company recognized one-time settlement and curtailment charges of approximately
$2.6 million
, of which approximately
$2.5 million
was due to the purchase of an annuity contract to transfer certain U.S. retiree defined benefit obligations to an insurance company. The annuity contract was funded by plan assets.
During 2016, the Company recognized one-time settlement and curtailment charges of approximately
$1.3 million
primarily due to lump sum payments in the United States and the United Kingdom.
The estimated net actuarial loss and prior service cost for defined benefit pension plans that is expected to be amortized from AOCI into net periodic benefit expense in
2019
is approximately
$0.6 million
.
Actuarial valuations of the Company's defined benefit pension plans were prepared as of
December 31, 2018
,
2017
and
2016
. Weighted average assumptions used in accounting for the U.S. defined benefit pension plans are as follows:
|
|
Pension Benefit
|
||||||||
|
|
2018
|
2017
|
2016
|
||||||
|
Discount rate for obligations
|
4.50
|
%
|
3.76
|
%
|
4.35
|
%
|
|||
|
Discount rate for benefit costs
|
4.37
|
%
|
4.35
|
%
|
4.62
|
%
|
|||
|
Rate of increase in compensation levels
|
N/A
|
|
N/A
|
|
N/A
|
|
|||
|
Expected long-term rate of return on plan assets
|
7.13
|
%
|
7.13
|
%
|
7.13
|
%
|
|||
71
The Company utilizes a high-quality (Aa or greater) corporate bond yield curve as the basis for its domestic discount rate for its pension benefit plans. Management believes this yield curve removes the impact of including additional required corporate bond yields (potentially considered in the above-median curve) resulting from the uncertain economic climate that does not necessarily reflect the general trend in high-quality interest rates.
Weighted average assumptions used in accounting for the non-U.S. defined benefit pension plans are as follows:
|
|
Pension Benefit
|
||||||||
|
|
2018
|
2017
|
2016
|
||||||
|
Discount rate for obligations
|
3.00
|
%
|
2.60
|
%
|
2.80
|
%
|
|||
|
Discount rate for benefit costs
|
2.60
|
%
|
2.80
|
%
|
3.80
|
%
|
|||
|
Rate of increase in compensation levels
|
3.30
|
%
|
3.30
|
%
|
3.90
|
%
|
|||
|
Expected long-term rate of return on plan assets
|
4.60
|
%
|
4.60
|
%
|
4.90
|
%
|
|||
The following provides a reconciliation of the changes in the Company's defined benefit pension plans' projected benefit obligations and fair value of assets for each of the years ended
December 31, 2018
and
2017
and the funded status as of
December 31, 2018
and
2017
(dollars in thousands):
|
Pension Benefit
|
||||||||
|
2018
|
2017
|
|||||||
|
Changes in Projected Benefit Obligations
|
|
|||||||
|
Benefit obligations at January 1
|
$
|
(39,030
|
)
|
$
|
(37,640
|
)
|
||
|
Service cost
|
(1,120
|
)
|
(1,150
|
)
|
||||
|
Interest cost
|
(1,100
|
)
|
(1,290
|
)
|
||||
|
Participant contributions
|
(60
|
)
|
(60
|
)
|
||||
|
Actuarial gain
|
3,020
|
|
990
|
|
||||
|
Benefit payments
|
1,200
|
|
1,320
|
|
||||
|
Annuity purchase
|
5,480
|
|
—
|
|
||||
|
Settlements and curtailments
|
210
|
|
710
|
|
||||
|
Change in foreign currency
|
1,100
|
|
(1,910
|
)
|
||||
|
Projected benefit obligations at December 31
|
$
|
(30,300
|
)
|
$
|
(39,030
|
)
|
||
|
Changes in Plan Assets
|
||||||||
|
Fair value of plan assets at January 1
|
$
|
31,760
|
|
$
|
26,260
|
|
||
|
Actual return on plan assets
|
(1,520
|
)
|
2,510
|
|
||||
|
Employer contributions
|
2,440
|
|
3,170
|
|
||||
|
Participant contributions
|
60
|
|
60
|
|
||||
|
Benefit payments
|
(1,200
|
)
|
(1,320
|
)
|
||||
|
Annuity purchase
|
(5,480
|
)
|
—
|
|
||||
|
Settlements
|
(210
|
)
|
(710
|
)
|
||||
|
Change in foreign currency
|
(1,200
|
)
|
1,790
|
|
||||
|
Fair value of plan assets at December 31
|
$
|
24,650
|
|
$
|
31,760
|
|
||
|
Funded status at December 31
|
$
|
(5,650
|
)
|
$
|
(7,270
|
)
|
||
72
|
Pension Benefit
|
||||||||
|
2018
|
2017
|
|||||||
|
Amounts Recognized in Balance Sheet
|
||||||||
|
Prepaid benefit cost
|
$
|
1,350
|
|
$
|
1,190
|
|
||
|
Current liabilities
|
(340
|
)
|
(340
|
)
|
||||
|
Noncurrent liabilities
|
(6,660
|
)
|
(8,120
|
)
|
||||
|
Net liability recognized at December 31
|
$
|
(5,650
|
)
|
$
|
(7,270
|
)
|
||
|
Pension Benefit
|
||||||||
|
2018
|
2017
|
|||||||
|
Amounts Recognized in Accumulated Other Comprehensive Loss
|
||||||||
|
Unrecognized prior service cost
|
$
|
190
|
|
$
|
50
|
|
||
|
Unrecognized net loss
|
11,610
|
|
15,600
|
|
||||
|
Total accumulated other comprehensive loss recognized at December 31
|
$
|
11,800
|
|
$
|
15,650
|
|
||
|
|
Accumulated Benefit Obligations
|
Projected Benefit Obligations
|
||||||||||||||
|
|
2018
|
2017
|
2018
|
2017
|
||||||||||||
|
Benefit Obligations at December 31,
|
||||||||||||||||
|
Total benefit obligations
|
$
|
(28,410
|
)
|
$
|
(36,720
|
)
|
$
|
(30,300
|
)
|
$
|
(39,030
|
)
|
||||
|
Plans with benefit obligations exceeding plan assets
|
|
|
|
|
||||||||||||
|
Benefit obligations
|
$
|
(12,050
|
)
|
$
|
(18,420
|
)
|
$
|
(12,080
|
)
|
$
|
(18,440
|
)
|
||||
|
Plan assets
|
5,090
|
|
9,980
|
|
5,090
|
|
9,980
|
|
||||||||
The assumptions regarding discount rates and expected return on plan assets can have a significant impact on amounts reported for benefit plans. A 25 basis point change in benefit obligation discount rates or 50 basis point change in expected return on plan assets would have the following effect (dollars in thousands):
|
|
Pension Benefit
|
|||||||
|
|
December 31, 2018
Benefit Obligation |
2018 Expense
|
||||||
|
Discount rate
|
|
|
||||||
|
25 basis point increase
|
$
|
(1,120
|
)
|
$
|
(90
|
)
|
||
|
25 basis point decrease
|
$
|
1,210
|
|
$
|
100
|
|
||
|
Expected return on assets
|
||||||||
|
50 basis point increase
|
N/A
|
|
$
|
(130
|
)
|
|||
|
50 basis point decrease
|
N/A
|
|
$
|
130
|
|
|||
The Company expects to make contributions of approximately
$1.9 million
to fund its pension plans during
2019
.
73
Plan Assets
The Company's overall investment goal is to provide for capital growth with a moderate level of volatility by investing assets in targeted allocation ranges. Specific long term investment goals include total investment return, diversity to reduce volatility and risk, and to achieve an asset allocation profile that reflects the general nature and sensitivity of the plans' liabilities. Investment goals are established after a comprehensive review of current and projected financial statement requirements, plan assets and liability structure, market returns and risks as well as special requirements of the plans. The Company reviews investment goals and actual results annually to determine whether stated objectives are still relevant and the continued feasibility of achieving the objectives.
The actual weighted average asset allocation of the Company's domestic and foreign pension plans' assets at
December 31, 2018
and
2017
and target allocations by class, were as follows:
|
|
Domestic Pension
|
Foreign Pension
|
||||||||||||||||
|
|
Actual
|
Actual
|
||||||||||||||||
|
|
Target
|
2018
|
2017
|
Target
|
2018
|
2017
|
||||||||||||
|
Equity securities
|
60
|
%
|
58
|
%
|
63
|
%
|
33
|
%
|
29
|
%
|
30
|
%
|
||||||
|
Fixed income
|
36
|
%
|
39
|
%
|
36
|
%
|
45
|
%
|
47
|
%
|
46
|
%
|
||||||
|
Diversified growth
(a)
|
—
|
%
|
—
|
%
|
—
|
%
|
22
|
%
|
24
|
%
|
24
|
%
|
||||||
|
Cash and other
|
4
|
%
|
3
|
%
|
1
|
%
|
—
|
|
—
|
%
|
—
|
%
|
||||||
|
Total
|
100
|
%
|
100
|
%
|
100
|
%
|
100
|
%
|
100
|
%
|
100
|
%
|
||||||
________________________________________
(a)
Diversified growth funds invest in a broad range of asset classes including equities, investment grade and high yield bonds, commodities, property, private equity, infrastructure and currencies.
Actual allocations to each asset vary from target allocations due to periodic investment strategy changes, market value fluctuations and the timing of benefit payments and contributions. The expected long-term rate of return for both the domestic and foreign plans' total assets is based on the expected return of each of the above categories, weighted based on the target allocation for each class. Actual allocation is reviewed regularly and investments are rebalanced to their targeted allocation range when deemed appropriate.
In managing the plan assets, the Company reviews and manages risk associated with the funded status risk, interest rate risk, market risk, liquidity risk and operational risk. Investment policies reflect the unique circumstances of the respective plans and include requirements designed to mitigate these risks by including quality and diversification standards.
74
The following table summarizes the level under the fair value hierarchy (see Note 3, "
Summary of Significant Accounting Policies
") that the Company's pension plan assets are measured, on a recurring basis as of
December 31, 2018
(dollars in thousands):
|
|
Total
|
Level 1
|
Level 2
|
Level 3
|
||||||||||||
|
Plan assets subject to leveling
|
|
|
|
|
||||||||||||
|
Investment funds
|
||||||||||||||||
|
Equity securities
|
$
|
2,960
|
|
$
|
2,960
|
|
$
|
—
|
|
$
|
—
|
|
||||
|
Fixed income
|
1,970
|
|
1,970
|
|
—
|
|
—
|
|
||||||||
|
Cash and cash equivalents
|
90
|
|
90
|
|
—
|
|
—
|
|
||||||||
|
Plan assets measured at net asset value
(a)
|
||||||||||||||||
|
Investment funds
|
||||||||||||||||
|
Equity securities
|
5,590
|
|
||||||||||||||
|
Fixed income
|
9,400
|
|
||||||||||||||
|
Diversified growth
|
4,390
|
|
||||||||||||||
|
Cash and cash equivalents
|
250
|
|
||||||||||||||
|
Total
|
$
|
24,650
|
|
$
|
5,020
|
|
$
|
—
|
|
$
|
—
|
|
||||
________________________________________
(a)
Certain investments that are measured at fair value using the net asset value per share as a practical expedient have not been classified in the fair value hierarchy. The fair value amounts presented in this table are intended to permit reconciliation of the fair value hierarchy to the amount presented in the fair value of plan assets.
The following benefit payments, which reflect expected future service, as appropriate, are expected to be paid (dollars in thousands):
|
|
Pension
Benefit
|
|||
|
December 31, 2019
|
$
|
990
|
|
|
|
December 31, 2020
|
1,110
|
|
||
|
December 31, 2021
|
1,090
|
|
||
|
December 31, 2022
|
1,190
|
|
||
|
December 31, 2023
|
1,290
|
|
||
|
Years 2024-2028
|
7,260
|
|
||
75
15. Equity Awards
The Company maintains the following long-term equity incentive plans (collectively, the "Plans"):
|
Plan Names
|
Shares Approved for Issuance
|
||
|
TriMas Corporation 2017 Equity and Incentive Compensation Plan
|
2,000,000
|
|
|
|
TriMas Corporation Director Retainer Share Election Program
|
100,000
|
|
|
The Company previously maintained the 2006 Long Term Equity Incentive Plan, which expired in 2016, and the 2011 Omnibus Incentive Compensation Plan, which was replaced by the TriMas Corporation 2017 Equity and Incentive Compensation Plan in 2017, such that, while existing grants remain outstanding until exercised, vested or canceled, no new shares may be issued under these plans.
Stock Options
The Company granted
150,000
stock options in 2016. The Company estimated the grant-date fair value of the options using the Black-Scholes option pricing model using the following weighted average assumptions: risk-free rate of
1.1%
, expected volatility of
32.3%
, and an expected term of
six
years. The Company did not grant any stock options during
2018
and
2017
.
Information related to stock options at
December 31, 2018
is as follows:
|
|
Number of
Stock Options
|
Weighted Average
Option Price
|
Average
Remaining
Contractual Life (Years)
|
Aggregate
Intrinsic Value
|
|||||||||
|
Outstanding at January 1, 2018
|
206,854
|
|
$
|
13.19
|
|
||||||||
|
Granted
|
—
|
|
—
|
|
|||||||||
|
Exercised
|
—
|
|
—
|
|
|||||||||
|
Cancelled
|
—
|
|
—
|
|
|||||||||
|
Expired
|
—
|
|
—
|
|
|||||||||
|
Outstanding at December 31, 2018
|
206,854
|
|
$
|
13.19
|
|
5.5
|
$
|
2,915,651
|
|
||||
As of
December 31, 2018
,
156,854
stock options outstanding were exercisable under the Plans. There was approximately
$0.1 million
of unrecognized compensation cost related to stock options that is expected to be recorded over a weighted average period of
0.6
years. Stock options of
50,000
vested during each of 2018 and 2017, respectively, while
no
options vested during 2016.
The Company recognized approximately
$0.3 million
,
$0.5 million
and
$0.3 million
of stock-based compensation expense related to stock options during
2018
,
2017
and
2016
, respectively. The stock-based compensation expense is included in selling, general and administrative expenses in the accompanying consolidated statement of operations.
Restricted Stock Units
The Company awarded
2,800
restricted stock units ("RSUs") to certain employees during
2016
. These shares are subject only to a service condition and vest on the first anniversary date of the award so long as the employee remains with the Company.
During
2018
,
2017
and
2016
, the Company issued
141,203
,
189,062
, and
235,251
RSUs, respectively, to certain employees which are subject only to a service condition and vest ratably over
three years
so long as the employee remains with the Company.
The Company awarded
42,740
RSUs to certain employees
during
2016
. These shares are subject only to a service condition and vest on the first anniversary date of the award. The awards were made to participants in the Company's Short-Term Incentive Compensation Plan ("STI"), where all STI participants whose target STI annual award exceeds
$20 thousand
receive
80%
of the value earned in cash and
20%
in the form of a restricted stock award upon finalization of the award amount in the first quarter each year following the previous plan year.
76
During
2018
,
2017
and
2016
, the Company granted
25,830
,
30,429
and
41,174
RSUs, respectively, to its non-employee independent directors, which vest
one year
from date of grant so long as the director and/or Company does not terminate their service prior to the vesting date.
During
2018
, the Company awarded
104,532
performance-based RSUs to certain Company key employees which vest
three years
from the grant date as long as the employee remains with the Company. These awards are earned
50%
based upon the Company's achievement of earnings per share compound annual growth rate ("EPS CAGR") metrics over a period beginning January 1, 2018 and ending December 31, 2020. The remaining
50%
of the awards are earned based on the Company's total shareholder return ("TSR") relative to the TSR of the common stock of a pre-defined industry peer-group, measured over the performance period. TSR is calculated as the Company's average closing stock price for the 20-trading days at the end of the performance period plus Company dividends, divided by the Company's average closing stock price for the 20-trading days prior to the start of the performance period. The Company estimated the grant-date fair value and term of the awards subject to a market condition using a Monte Carlo simulation model, using the following weighted average assumptions: risk-free interest rate of
2.61%
and annualized volatility of
30.2%
. Depending on the performance achieved for these two metrics, the amount of shared earned, if any, can vary from
0%
of the target award to a maximum of
200%
of the target award for the EPS CAGR metric and
0%
of the target award to a maximum of
200%
of the target award for the TSR metric.
During
2017
, the Company awarded
111,761
performance-based RSUs to certain Company key employees which vest
three years
from the grant date so long as the employee remains with the Company. These awards are earned
50%
based upon the Company's achievement of earnings per share compound annual growth rate ("EPS CAGR") metrics over a period beginning January 1, 2017 and ending December 31, 2019. The remaining
50%
of the awards are earned based on the Company's total shareholder return ("TSR") relative to the TSR of the common stock of a pre-defined industry peer-group, measured over the performance period. TSR is calculated as the Company's average closing stock price for the 20-trading days at the end of the performance period plus Company dividends, divided by the Company's average closing stock price for the 20-trading days prior to the start of the performance period. The Company estimated the grant-date fair value and term of the awards subject to a market condition using a Monte Carlo simulation model, using the following weighted average assumptions: risk-free interest rate of
1.52%
and annualized volatility of
35.6%
. Depending on the performance achieved for these two metrics, the amount of shared earned, if any, can vary from
40%
of the target award to a maximum of
200%
of the target award for the EPS CAGR metric and
0%
of the target award to a maximum of
200%
of the target award for the TSR metric.
During
2016
, the Company awarded
198,956
performance-based RSUs to certain Company key employees which vest
three years
from the grant date so long as the employee remains with the Company. The performance criteria for these awards is based on the Company's TSR relative to the TSR of the common stock of a pre-defined industry peer-group, measured over a period beginning January 1, 2016 and ending December 31, 2018. Depending on the performance achieved, the amount of shares earned can vary from
0%
of the target award to a maximum of
200%
of the target award. The Company estimated the grant-date fair value and term of the awards subject to a market condition using a Monte Carlo simulation model, using the following weighted average assumptions: risk-free interest rate of
0.96%
and annualized volatility of
35.8%
.
During
2015
, the Company awarded performance-based RSUs to certain Company key employees which were earned based upon the Company's TSR relative to the TSR of the common stock of a pre-defined industry peer-group and measured over a period beginning September 10, 2015 and ending on December 31, 2017. Depending on the performance achieved, the amount of shares earned could vary from
0%
of the target award to a maximum of
200%
of the target award. The Company attained
126.9%
of the target on a weighted average basis, resulting in an increase of
31,021
shares during 2018.
The Company allows for its non-employee independent directors to make an annual election to defer all or a portion of their director fees and to receive the deferred amount in cash or equity. Certain of the Company's directors have elected to defer all or a portion of their director fees and to receive the amount in Company common stock at a future date. The Company issued
7,263
,
12,912
and
16,588
shares in
2018
,
2017
and
2016
, respectively, related to director fee deferrals.
77
Information related to restricted shares at
December 31, 2018
is as follows:
|
|
Number of
Unvested
Restricted
Shares
|
Weighted
Average
Grant Date
Fair Value
|
Average
Remaining
Contractual
Life (Years)
|
Aggregate
Intrinsic Value
|
|||||||||
|
Outstanding at January 1, 2018
|
726,936
|
|
$
|
22.60
|
|
||||||||
|
Granted
|
309,849
|
|
30.29
|
|
|||||||||
|
Vested
|
(338,141
|
)
|
21.60
|
|
|||||||||
|
Cancelled
|
(35,516
|
)
|
23.24
|
|
|||||||||
|
Outstanding at December 31, 2018
|
663,128
|
|
$
|
26.67
|
|
1.0
|
$
|
18,096,763
|
|
||||
As of December 31, 2018
, there was approximately
$7.5 million
of unrecognized compensation cost related to unvested restricted shares that is expected to be recorded over a weighted average period of
2.0
years.
The Company recognized stock-based compensation expense related to restricted shares of approximately
$6.9 million
,
$6.2 million
and
$6.7 million
in
2018
,
2017
, and
2016
, respectively. The stock-based compensation expense is included in selling, general and administrative expenses in the accompanying statement of operations.
16. Earnings per Share
Net income is divided by the weighted average number of common shares outstanding during the year to calculate basic earnings per share. Diluted earnings per share is calculated to give effect to stock options and RSUs. For the year ended
December 31, 2016
,
no
restricted shares or stock options were included in the computation of net income (loss) per share because to do so would be anti-dilutive. The following table summarizes the dilutive effect of restricted shares and options to purchase common stock:
|
Year ended December 31,
|
|||||||||
|
2018
|
2017
|
2016
|
|||||||
|
Weighted average common shares—basic
|
45,824,555
|
|
45,682,627
|
|
45,407,316
|
|
|||
|
Dilutive effect of restricted share awards
|
242,204
|
|
241,974
|
|
—
|
|
|||
|
Dilutive effect of stock options
|
103,705
|
|
65,651
|
|
—
|
|
|||
|
Weighted average common shares—diluted
|
46,170,464
|
|
45,990,252
|
|
45,407,316
|
|
|||
In November 2015, the Company announced its Board of Directors had authorized the Company to purchase up to
$50 million
in the aggregate of its common stock. During
2018
, the Company purchased
442,632
shares of its outstanding common stock for approximately
$12.1 million
. The Company did not purchase any shares of its outstanding common stock during
2017
or
2016
.
78
17
. Other Comprehensive Income
Changes in AOCI by component for the
year ended December 31, 2018
are summarized as follows, net of tax (dollars in thousands):
|
Defined Benefit Plans
|
Derivative Instruments
|
Foreign Currency Translation
|
Total
|
|||||||||||||
|
Balance, December 31, 2017
|
$
|
(10,450
|
)
|
$
|
(3,170
|
)
|
$
|
(3,710
|
)
|
$
|
(17,330
|
)
|
||||
|
Net unrealized gains (losses) arising during the period
(a)
|
—
|
|
4,110
|
|
(6,880
|
)
|
(2,770
|
)
|
||||||||
|
Less: Net realized losses reclassified to net income
(b)
|
(3,250
|
)
|
—
|
|
—
|
|
(3,250
|
)
|
||||||||
|
Net current-period other comprehensive income (loss)
|
3,250
|
|
4,110
|
|
(6,880
|
)
|
480
|
|
||||||||
|
Balance, December 31, 2018
|
$
|
(7,200
|
)
|
$
|
940
|
|
$
|
(10,590
|
)
|
$
|
(16,850
|
)
|
||||
__________________________
(a)
Derivative instruments, net of income tax of
$1.2 million
. See Note
11
, "
Derivative Instruments
," for further details.
(b)
Defined benefit plans, net of income tax of
$0.9 million
. See Note
14
, "
Employee Benefit Plans
," for additional details.
Changes in AOCI by component for the
year ended December 31, 2017
are summarized as follows, net of tax (dollars in thousands):
|
Defined Benefit Plans
|
Derivative Instruments
|
Foreign Currency Translation
|
Total
|
|||||||||||||
|
Balance, December 31, 2016
|
$
|
(12,120
|
)
|
$
|
(2,520
|
)
|
$
|
(9,760
|
)
|
$
|
(24,400
|
)
|
||||
|
Net unrealized gains (losses) arising during the period
(a)
|
1,000
|
|
(3,750
|
)
|
6,050
|
|
3,300
|
|
||||||||
|
Less: Net realized losses reclassified to net income
(b)
|
(670
|
)
|
(3,100
|
)
|
—
|
|
(3,770
|
)
|
||||||||
|
Net current-period other comprehensive income (loss)
|
1,670
|
|
(650
|
)
|
6,050
|
|
7,070
|
|
||||||||
|
Balance, December 31, 2017
|
$
|
(10,450
|
)
|
$
|
(3,170
|
)
|
$
|
(3,710
|
)
|
$
|
(17,330
|
)
|
||||
__________________________
(a)
Defined benefit plans, net of income tax of
$0.3 million
. See Note
14
, "
Employee Benefit Plans
," for additional details. Derivative instruments, net of income tax expense of
$1.3 million
. See Note
11
, "
Derivative Instruments
," for further details.
(b)
Defined benefit plans, net of income tax of
$0.3 million
. See Note
14
,
"Employee Benefit Plans,"
for additional details. Derivative instruments, net of income tax expense of
$1.9 million
. See Note
11
,
"Derivative Instruments,"
for further details.
18
. Segment Information
In the first quarter of 2018, TriMas realigned its reporting structure into three reportable segments: Packaging, Aerospace and Specialty Products. Each of these segments has discrete financial information that is regularly evaluated by TriMas’ president and chief executive officer (chief operating decision maker) in determining resource, personnel and capital allocation, as well as assessing strategy and performance. The Company utilizes its proprietary TriMas Business Model as a standardized set of processes to manage and drive results and strategy across its multi-industry businesses.
Within the Company's reportable segments, there are no individual products or product families for which reported net sales accounted for more than 10% of the Company's consolidated net sales. See below for more information regarding the types of products and services provided within each reportable segment:
Packaging –
The Packaging segment, which consists primarily of the Rieke
®
brand, develops and manufactures specialty dispensing and closure products for the health, beauty and home care, food and beverage, and industrial markets.
Aerospace –
The Aerospace segment, which includes the Monogram Aerospace Fasteners
™
, Allfast Fastening Systems
®
, Mac Fasteners
™
and Martinic Engineering
™
brands, develops, qualifies and manufactures highly-engineered, precision fasteners and machined products to serve the aerospace market.
79
Specialty Products –
The Specialty Products segment, which includes the Norris Cylinder
™
, Lamons
®
and Arrow
®
Engine brands, designs, manufactures and distributes highly-engineered steel cylinders, sealing and fastener products, and wellhead engines and compression systems for use within the industrial, petrochemical, and oil and gas exploration and refining markets.
Segment activity is as follows (dollars in thousands):
|
|
Year ended December 31,
|
|||||||||||
|
|
2018
|
2017
|
2016
|
|||||||||
|
Net Sales
|
|
|
|
|||||||||
|
Packaging
|
$
|
368,200
|
|
$
|
344,570
|
|
$
|
341,340
|
|
|||
|
Aerospace
|
185,920
|
|
184,310
|
|
174,920
|
|
||||||
|
Specialty Products
|
323,020
|
|
288,860
|
|
277,760
|
|
||||||
|
Total
|
$
|
877,140
|
|
$
|
817,740
|
|
$
|
794,020
|
|
|||
|
Operating Profit (Loss)
|
|
|
|
|||||||||
|
Packaging
|
$
|
84,590
|
|
$
|
80,610
|
|
$
|
78,630
|
|
|||
|
Aerospace
|
27,290
|
|
26,410
|
|
(90,540
|
)
|
||||||
|
Specialty Products
|
34,260
|
|
12,280
|
|
2,900
|
|
||||||
|
Corporate
|
(24,070
|
)
|
(30,130
|
)
|
(32,920
|
)
|
||||||
|
Total
|
$
|
122,070
|
|
$
|
89,170
|
|
$
|
(41,930
|
)
|
|||
|
Capital Expenditures
|
|
|
|
|||||||||
|
Packaging
|
$
|
13,590
|
|
$
|
17,140
|
|
$
|
19,880
|
|
|||
|
Aerospace
|
1,190
|
|
3,370
|
|
3,950
|
|
||||||
|
Specialty Products
|
5,380
|
|
6,830
|
|
7,470
|
|
||||||
|
Corporate
(a)
|
4,890
|
|
9,460
|
|
30
|
|
||||||
|
Total
|
$
|
25,050
|
|
$
|
36,800
|
|
$
|
31,330
|
|
|||
|
Depreciation and Amortization
|
|
|
|
|||||||||
|
Packaging
|
$
|
21,620
|
|
$
|
21,630
|
|
$
|
22,120
|
|
|||
|
Aerospace
|
15,190
|
|
14,530
|
|
14,090
|
|
||||||
|
Specialty Products
|
6,930
|
|
10,530
|
|
8,370
|
|
||||||
|
Corporate
|
280
|
|
180
|
|
280
|
|
||||||
|
Total
|
$
|
44,020
|
|
$
|
46,870
|
|
$
|
44,860
|
|
|||
|
Total Assets
|
||||||||||||
|
Packaging
|
$
|
435,140
|
|
$
|
431,680
|
|
$
|
423,460
|
|
|||
|
Aerospace
|
392,140
|
|
401,060
|
|
409,040
|
|
||||||
|
Specialty Products
|
181,700
|
|
172,840
|
|
179,160
|
|
||||||
|
Corporate
|
91,540
|
|
27,620
|
|
39,990
|
|
||||||
|
Total
|
$
|
1,100,520
|
|
$
|
1,033,200
|
|
$
|
1,051,650
|
|
|||
________________________________________
(a)
Corporate capital expenditures for the years ended December 31, 2018 and 2017, respectively, are primarily related to purchases of machinery and equipment formerly held under operating leases. These purchased assets were subsequently transferred from Corporate to the reportable segment utilizing the assets.
80
The following table presents the Company's net sales for each of the years ended December 31 and long-lived assets at each year ended December 31, attributed to each subsidiary's continent of domicile (dollars in thousands).
|
|
As of December 31,
|
|||||||||||||||||||||||
|
|
2018
|
2017
|
2016
|
|||||||||||||||||||||
|
|
Net
Sales
|
Long-lived Assets
|
Net
Sales
|
Long-lived Assets
|
Net
Sales
|
Long-lived Assets
|
||||||||||||||||||
|
Non-U.S.
|
|
|
|
|
|
|
||||||||||||||||||
|
Europe
|
$
|
62,420
|
|
$
|
54,340
|
|
$
|
62,360
|
|
$
|
54,790
|
|
$
|
65,490
|
|
$
|
45,050
|
|
||||||
|
Asia Pacific
|
45,040
|
|
45,160
|
|
36,630
|
|
51,120
|
|
32,230
|
|
51,060
|
|
||||||||||||
|
Other Americas
|
14,670
|
|
7,830
|
|
15,260
|
|
7,930
|
|
13,620
|
|
7,800
|
|
||||||||||||
|
Total non-U.S.
|
122,130
|
|
107,330
|
|
114,250
|
|
113,840
|
|
111,340
|
|
103,910
|
|
||||||||||||
|
Total U.S.
|
755,010
|
|
571,650
|
|
703,490
|
|
590,020
|
|
682,680
|
|
604,250
|
|
||||||||||||
|
Total
|
$
|
877,140
|
|
$
|
678,980
|
|
$
|
817,740
|
|
$
|
703,860
|
|
$
|
794,020
|
|
$
|
708,160
|
|
||||||
The Company's export sales from the U.S. approximated
$72.7 million
,
$79.8 million
and
$76.2 million
in
2018
,
2017
and
2016
, respectively.
19
. Income Taxes
The Company's income (loss) before income taxes and income tax expense (benefit), each by tax jurisdiction, consists of the following (dollars in thousands):
|
|
Year ended December 31,
|
|||||||||||
|
|
2018
|
2017
|
2016
|
|||||||||
|
Income (loss) before income taxes:
|
|
|
|
|||||||||
|
Domestic
|
$
|
75,830
|
|
$
|
50,760
|
|
$
|
(69,850
|
)
|
|||
|
Foreign
|
30,150
|
|
15,450
|
|
11,620
|
|
||||||
|
Total income (loss) before income taxes
|
$
|
105,980
|
|
$
|
66,210
|
|
$
|
(58,230
|
)
|
|||
|
Current income tax expense:
|
||||||||||||
|
Federal
|
$
|
6,770
|
|
$
|
12,800
|
|
$
|
7,560
|
|
|||
|
State and local
|
2,440
|
|
1,770
|
|
1,920
|
|
||||||
|
Foreign
|
7,070
|
|
5,420
|
|
4,250
|
|
||||||
|
Total current income tax expense
|
16,280
|
|
19,990
|
|
13,730
|
|
||||||
|
Deferred income tax expense (benefit):
|
||||||||||||
|
Federal
|
4,540
|
|
15,180
|
|
(28,180
|
)
|
||||||
|
State and local
|
1,310
|
|
1,280
|
|
(2,550
|
)
|
||||||
|
Foreign
|
550
|
|
(1,200
|
)
|
(1,430
|
)
|
||||||
|
Total deferred income tax expense (benefit)
|
6,400
|
|
15,260
|
|
(32,160
|
)
|
||||||
|
Income tax expense (benefit)
|
$
|
22,680
|
|
$
|
35,250
|
|
$
|
(18,430
|
)
|
|||
81
The components of deferred taxes are as follows (dollars in thousands):
|
|
December 31, 2018
|
December 31, 2017
|
||||||
|
Deferred tax assets:
|
|
|
||||||
|
Accounts receivable
|
$
|
310
|
|
$
|
1,000
|
|
||
|
Inventories
|
1,900
|
|
5,230
|
|
||||
|
Accrued liabilities and other long-term liabilities
|
7,220
|
|
20,350
|
|
||||
|
Tax loss and credit carryforwards
|
6,990
|
|
7,290
|
|
||||
|
Gross deferred tax asset
|
16,420
|
|
33,870
|
|
||||
|
Valuation allowances
|
(5,520
|
)
|
(6,400
|
)
|
||||
|
Net deferred tax asset
|
10,900
|
|
27,470
|
|
||||
|
Deferred tax liabilities:
|
||||||||
|
Property and equipment
|
(8,770
|
)
|
(16,380
|
)
|
||||
|
Goodwill and other intangible assets
|
(4,940
|
)
|
(5,350
|
)
|
||||
|
Investment in foreign affiliates, including withholding tax
|
(1,050
|
)
|
(740
|
)
|
||||
|
Other, principally deferred income
|
(620
|
)
|
(1,550
|
)
|
||||
|
Gross deferred tax liability
|
(15,380
|
)
|
(24,020
|
)
|
||||
|
Net deferred tax asset (liability)
|
$
|
(4,480
|
)
|
$
|
3,450
|
|
||
The following is a reconciliation of income tax expense (benefit) computed at the U.S. federal statutory rate to income tax expense (benefit) allocated to income (loss) before income taxes (dollars in thousands):
|
Year ended December 31,
|
||||||||||||
|
|
2018
|
2017
|
2016
|
|||||||||
|
U.S. federal statutory rate
|
21
|
%
|
35
|
%
|
35
|
%
|
||||||
|
Tax at U.S. federal statutory rate
|
$
|
22,250
|
|
$
|
23,170
|
|
$
|
(20,380
|
)
|
|||
|
State and local taxes, net of federal tax benefit
|
3,030
|
|
2,250
|
|
(550
|
)
|
||||||
|
Differences in statutory foreign tax rates
|
380
|
|
(2,580
|
)
|
(1,930
|
)
|
||||||
|
Change in recognized tax benefits
|
(270
|
)
|
(480
|
)
|
(1,410
|
)
|
||||||
|
Goodwill and other intangible assets impairment
|
—
|
|
—
|
|
5,050
|
|
||||||
|
Nontaxable income
|
(940
|
)
|
(1,050
|
)
|
(310
|
)
|
||||||
|
Research and manufacturing incentives
|
(1,740
|
)
|
(1,510
|
)
|
(830
|
)
|
||||||
|
Net change in valuation allowance
|
650
|
|
520
|
|
2,140
|
|
||||||
|
Tax Reform Act
|
(400
|
)
|
12,660
|
|
—
|
|
||||||
|
Other, net
|
(280
|
)
|
2,270
|
|
(210
|
)
|
||||||
|
Income tax expense (benefit)
|
$
|
22,680
|
|
$
|
35,250
|
|
$
|
(18,430
|
)
|
|||
The Company has recorded deferred tax assets on
$31.1 million
of various state operating loss carryforwards and
$18.3 million
of various foreign operating loss carryforwards. The majority of the state tax loss carryforwards expire between
2024
and
2028
and the majority of the foreign losses have indefinite carryforward periods.
The Company has not made a provision for U.S. or additional foreign withholding taxes related to investments in foreign subsidiaries that are indefinitely reinvested since any excess of the amount for financial reporting over the tax basis in these investments is not significant as of
December 31, 2018
.
82
Tax Reform
In December 2017, the Tax Reform Act was signed into law, and, among the provisions, reduced the Federal statutory corporate income tax rate from
35%
to
21%
effective January 1, 2018, and implemented a territorial tax system, imposing a one-time tax on the deemed repatriation of undistributed earnings of non-U.S. subsidiaries ("Transition Tax"). The Transition Tax is payable over eight years beginning in 2019.
Coincident with the signing of the Tax Reform Act, the Securities and Exchange Commission issued Staff Accounting Bulletin No. 118 (“SAB 118”) to address situations when a registrant does not have the necessary information available, prepared, or analyzed (including computations) in reasonable detail to complete the accounting for certain income tax effects of the Tax Reform Act. SAB 118 provided up to a one-measurement period for companies to finalize the accounting for the impacts of this new legislation.
In 2017, the Company recognized an approximate
$9.0 million
provisional tax expense related to the Transition Tax, and an approximate
$3.7 million
provisional tax expense in connection with the revaluation of its ending net deferred tax assets resulting from the reduction in the Federal income tax rate, for a total of
$12.7 million
provisional tax expense related to the adoption of the Tax Reform Act.
In 2018, the Company finalized the measurement of these provisional expenses. The Company recognized an approximate
$1.1 million
income tax benefit in connection with finalizing the revaluation of its net deferred tax assets following the filing of the Company's 2017 corporate income tax return, and recognized an approximate
$0.7 million
income tax expense related to finalizing the Transition Tax, resulting in a
$0.4 million
net reduction in 2018 to the
$12.7 million
provisional tax expense recorded in 2017.
On January 15, 2019, the Internal Revenue Service finalized regulations that govern the Transition Tax. The Company is in the process of analyzing these regulations, but does not expect the regulations to have a significant impact on its consolidated financial statements.
Unrecognized tax benefits
The Company had approximately
$3.0 million
and
$3.4 million
of unrecognized tax benefits ("UTBs") as of
December 31, 2018
and
2017
, respectively. If the UTBs were recognized, the impact to the Company's effective tax rate would be to reduce reported income tax expense for the years ended
December 31, 2018
and
2017
by approximately
$2.5 million
and
$2.8 million
, respectively.
83
A reconciliation of the change in the UTBs and related accrued interest and penalties for the years ended
December 31, 2018
and
2017
is as follows (dollars in thousands):
|
|
Unrecognized
Tax Benefits
|
|||
|
Balance at December 31, 2016
|
$
|
3,570
|
|
|
|
Tax positions related to current year:
|
|
|||
|
Additions
|
250
|
|
||
|
Tax positions related to prior years:
|
|
|||
|
Additions
|
860
|
|
||
|
Reductions
|
(100
|
)
|
||
|
Settlements
|
—
|
|
||
|
Lapses in the statutes of limitations
|
(1,210
|
)
|
||
|
Balance at December 31, 2017
|
$
|
3,370
|
|
|
|
Tax positions related to current year:
|
|
|||
|
Additions
|
60
|
|
||
|
Tax positions related to prior years:
|
|
|
||
|
Additions
|
390
|
|
||
|
Reductions
|
—
|
|
||
|
Settlements
|
—
|
|
||
|
Lapses in the statutes of limitations
|
(800
|
)
|
||
|
Balance at December 31, 2018
|
$
|
3,020
|
|
|
In addition to the UTBs summarized above, the Company has recorded approximately
$1.8 million
and
$1.7 million
in potential interest and penalties associated with uncertain tax positions as of
December 31, 2018
and
2017
, respectively.
The Company is subject to U.S. federal, state and local, and certain non-U.S. income tax examinations for tax years
2011
through
2018
. In addition, there are currently several state and foreign income tax examinations in process. The Company does not believe that the results of these examinations will have a significant impact on the Company's tax position or its effective tax rate.
Management monitors changes in tax statutes and regulations and the issuance of judicial decisions to determine the potential impact to UTBs and is not aware of, nor does it anticipate, any material subsequent events that could have a significant impact on the Company's financial position during the next twelve months.
84
20. Summary Quarterly Financial Data
The Company's unaudited quarterly financial data is as follows (dollars in thousands, except for per share data):
|
|
As of December 31, 2018
|
|||||||||||||||
|
|
First Quarter
|
Second Quarter
|
Third Quarter
|
Fourth Quarter
|
||||||||||||
|
Net sales
|
$
|
217,100
|
|
$
|
224,910
|
|
$
|
223,780
|
|
$
|
211,350
|
|
||||
|
Gross profit
|
60,380
|
|
64,780
|
|
61,720
|
|
57,240
|
|
||||||||
|
Net income
|
24,320
|
|
19,600
|
|
22,670
|
|
16,710
|
|
||||||||
|
Earnings per share—basic:
|
||||||||||||||||
|
Net income per share
|
$
|
0.53
|
|
$
|
0.43
|
|
$
|
0.49
|
|
$
|
0.37
|
|
||||
|
Weighted average shares—basic
|
45,779,966
|
|
45,920,307
|
|
45,850,288
|
|
45,747,659
|
|
||||||||
|
Earnings per share—diluted:
|
||||||||||||||||
|
Net income per share
|
$
|
0.53
|
|
$
|
0.42
|
|
$
|
0.49
|
|
$
|
0.36
|
|
||||
|
Weighted average shares—diluted
|
46,229,337
|
|
46,200,757
|
|
46,166,558
|
|
46,085,202
|
|
||||||||
|
|
As of December 31, 2017
|
|||||||||||||||
|
|
First Quarter
|
Second Quarter
|
Third Quarter
|
Fourth Quarter
|
||||||||||||
|
Net sales
|
$
|
199,830
|
|
$
|
213,370
|
|
$
|
209,330
|
|
$
|
195,210
|
|
||||
|
Gross profit
|
51,820
|
|
59,470
|
|
58,890
|
|
49,210
|
|
||||||||
|
Net income (loss)
|
6,990
|
|
14,850
|
|
13,130
|
|
(4,010
|
)
|
||||||||
|
Earnings (loss) per share—basic:
|
||||||||||||||||
|
Net income (loss) per share
|
$
|
0.15
|
|
$
|
0.32
|
|
$
|
0.29
|
|
$
|
(0.09
|
)
|
||||
|
Weighted average shares—basic
|
45,570,495
|
|
45,717,697
|
|
45,721,155
|
|
45,721,160
|
|
||||||||
|
Earnings (loss) per share—diluted:
|
||||||||||||||||
|
Net income (loss) per share
|
$
|
0.15
|
|
$
|
0.32
|
|
$
|
0.29
|
|
$
|
(0.09
|
)
|
||||
|
Weighted average shares—diluted
|
45,908,958
|
|
45,922,416
|
|
46,029,361
|
|
45,721,160
|
|
||||||||
21. Subsequent Events
On
January 11, 2019
, the Company acquired Plastic Srl, a manufacturer of single-bodied and assembled polymeric caps and closures for use in home care product applications. Plastic Srl, located in Forli, Italy, serves the home care market in Italy and other European countries and generates approximately
$12 million
in annual revenue. Plastic Srl will be included in the Company's Packaging reportable segment.
On
February 28, 2019
, the Company announced that its Board of Directors increased the Company’s common stock share repurchase authorization to
$75 million
in the aggregate of the Company's common stock. The previous authorization, approved in November 2015, authorized up to
$50 million
in share repurchases. The increased authorization includes the value of shares already purchased under the previous authorization.
85
Item 9. Changes in and Disagreements with Accountants on Accounting and Financial Disclosure
Not applicable.
Item 9A. Controls and Procedures
Evaluation of disclosure controls and procedures
As of
December 31, 2018
, an evaluation was carried out by management, with the participation of our Chief Executive Officer and Chief Financial Officer, of the effectiveness of our disclosure controls and procedures (as such term is defined in Rule 13a-15(e) and Rule 15d-15(e) of the Securities Exchange Act of 1934 (the "Exchange Act")), pursuant to Rule 13a-15 of the Exchange Act. Our disclosure controls and procedures are designed only to provide reasonable assurance that they will meet their objectives. Based upon that evaluation, the Chief Executive Officer and Chief Financial Officer concluded that as of
December 31, 2018
, the Company's disclosure controls and procedures were effective to provide reasonable assurance that they would meet their objectives.
Management's Annual Report on Internal Control Over Financial Reporting
Management is responsible for the preparation and fair presentation of the consolidated financial statements included in this annual report. The consolidated financial statements have been prepared in conformity with United States generally accepted accounting principles and reflect management's judgments and estimates concerning events and transactions that are accounted for or disclosed.
Management is also responsible for establishing and maintaining effective internal control over financial reporting. The Company's internal control over financial reporting includes those policies and procedures that pertain to the Company's ability to record, process, summarize, and report reliable financial data. Management recognizes that there are inherent limitations in the effectiveness of any internal control and effective internal control over financial reporting can provide only reasonable assurance with respect to financial statement preparation. Additionally, because of changes in conditions, the effectiveness of internal control over financial reporting may vary over time.
In order to ensure that the Company's internal control over financial reporting is effective, management regularly assesses such controls and did so most recently for its financial reporting as of
December 31, 2018
. Management's assessment was based on criteria for effective internal control over financial reporting described in Internal Control—Integrated Framework (2013) issued by the Committee of Sponsoring Organizations of the Treadway Commission. Based on this assessment, management asserts that the Company has maintained effective internal control over financial reporting as of
December 31, 2018
.
86
Deloitte & Touche LLP, an independent registered public accounting firm, who audited the Company's consolidated financial statements, has also audited the effectiveness of the Company's internal control over financial reporting as of
December 31, 2018
, as stated in their report below.
REPORT OF INDEPENDENT REGISTERED PUBLIC ACCOUNTING FIRM
To the shareholders and the Board of Directors of TriMas Corporation
Opinion on Internal Control over Financial Reporting
We have audited the internal control over financial reporting of TriMas Corporation and subsidiaries (the “Company”) as of December 31, 2018, based on criteria established in
Internal Control - Integrated Framework (2013)
issued by the Committee of Sponsoring Organizations of the Treadway Commission (COSO). In our opinion, the Company maintained, in all material respects, effective internal control over financial reporting as of December 31, 2018, based on criteria established in
Internal Control - Integrated Framework (2013)
issued by COSO.
We have also audited, in accordance with the standards of the Public Company Accounting Oversight Board (United States) (PCAOB), the consolidated financial statements and financial statement schedule as of and for the year ended December 31, 2018 of the Company and our report dated February 28, 2019, expressed an unqualified opinion on those financial statements and financial statement schedule.
Basis for Opinion
The Company’s management is responsible for maintaining effective internal control over financial reporting and for its assessment of the effectiveness of internal control over financial reporting, included in the accompanying Management’s Annual Report on Internal Control Over Financial Reporting. Our responsibility is to express an opinion on the Company’s internal control over financial reporting based on our audit. We are a public accounting firm registered with the PCAOB and are required to be independent with respect to the Company in accordance with the U.S. federal securities laws and the applicable rules and regulations of the Securities and Exchange Commission and the PCAOB.
We conducted our audit in accordance with the standards of the PCAOB. Those standards require that we plan and perform the audit to obtain reasonable assurance about whether effective internal control over financial reporting was maintained in all material respects. Our audit included obtaining an understanding of internal control over financial reporting, assessing the risk that a material weakness exists, testing and evaluating the design and operating effectiveness of internal control based on the assessed risk, and performing such other procedures as we considered necessary in the circumstances. We believe that our audit provides a reasonable basis for our opinion.
Definition and Limitations of Internal Control over Financial Reporting
A company’s internal control over financial reporting is a process designed to provide reasonable assurance regarding the reliability of financial reporting and the preparation of financial statements for external purposes in accordance with generally accepted accounting principles. A company’s internal control over financial reporting includes those policies and procedures that (1) pertain to the maintenance of records that, in reasonable detail, accurately and fairly reflect the transactions and dispositions of the assets of the company; (2) provide reasonable assurance that transactions are recorded as necessary to permit preparation of financial statements in accordance with generally accepted accounting principles, and that receipts and expenditures of the company are being made only in accordance with authorizations of management and directors of the company; and (3) provide reasonable assurance regarding prevention or timely detection of unauthorized acquisition, use, or disposition of the company’s assets that could have a material effect on the financial statements.
Because of its inherent limitations, internal control over financial reporting may not prevent or detect misstatements. Also, projections of any evaluation of effectiveness to future periods are subject to the risk that controls may become inadequate because of changes in conditions, or that the degree of compliance with the policies or procedures may deteriorate.
/s/ Deloitte & Touche LLP
Detroit, Michigan
February 28, 2019
87
Changes in disclosure controls and procedures
There have been no changes in the Company's internal control over financial reporting during the quarter ended
December 31, 2018
that have materially affected, or are reasonably likely to materially affect, the Company's internal control over financial reporting.
Item 9B. Other Information
Not applicable.
88
PART III
Item 10. Directors, Executive Officers and Corporate Governance
Information regarding our executive officers is included in Part I of this Form 10-K under the heading “
Executive Officers of the Company.
”
The Company's Code of Ethics and Business Conduct is applicable to its directors, officers and employees. The Code of Ethics and Business Conduct is available on the "Investors" portion of the Company's website under the "Corporate Governance" link. The Company's website address is www.trimascorp.com.
The information required by this item is incorporated by reference from our definitive proxy statement for the 2019 Annual Meeting of Shareholders.
Item 11. Executive Compensation
The information required by this item is incorporated by reference from our definitive proxy statement for the 2019 Annual Meeting of Shareholders.
Item 12. Security Ownership of Certain Beneficial Owners and Management and Related Stockholder Matters
The information required by this item is incorporated by reference from our definitive proxy statement for the 2019 Annual Meeting of Shareholders.
Item 13. Certain Relationships and Related Transactions, and Director Independence
The information required by this item is incorporated by reference from our definitive proxy statement for the 2019 Annual Meeting of Shareholders.
Item 14. Principal Accountant Fees and Services
The information required by this item is incorporated by reference from our definitive proxy statement for the 2019 Annual Meeting of Shareholders.
89
PART IV
Item 15. Exhibits and Financial Statement Schedules
(a) Listing of Documents
(1) Financial Statements
The Company's Financial Statements included in Item 8 hereof, as required at
December 31, 2018
and
December 31, 2017
, and for the periods ended
December 31, 2018
,
December 31, 2017
and
December 31, 2016
, consist of the following:
Balance Sheet
Statement of Operations
Statement of Comprehensive Income
Statement of Cash Flows
Statement of Shareholders' Equity
Notes to Financial Statements
(2) Financial Statement Schedules
Financial Statement Schedule of the Company appended hereto, as required for the periods ended
December 31, 2018
,
December 31, 2017
and
December 31, 2016
, consists of the following:
Valuation and Qualifying Accounts
All other schedules are omitted because they are not applicable, not required, or the information is otherwise included in the financial statements or the notes thereto.
(3) Exhibits
|
2.1(p)
|
|
|
3.1(d)
|
|
|
3.2(i)
|
|
|
4.1(u)
|
|
|
10.1(a)
|
|
|
10.2(c)
|
|
|
10.3(e)
|
|
|
10.4(b)
|
|
|
10.5(m)
|
|
|
10.6(o)
|
|
|
10.7(p)
|
|
|
10.8(s)
|
|
90
|
10.9(s)
|
|
|
10.10(u)
|
|
|
10.11(h)
|
|
|
10.12(f)
|
|
|
10.13(g)
|
|
|
10.14(j)
|
|
|
10.15(k)
|
|
|
10.16(t)
|
|
|
10.17(l)
|
|
|
10.18(q)
|
|
|
10.19(q)
|
|
|
10.20(q)
|
|
|
10.21(q)
|
|
|
10.22(q)
|
|
|
10.23(q)
|
|
|
10.24(r)
|
|
|
10.25(s)
|
|
|
10.26(s)
|
|
|
10.27(v)
|
|
|
10.28(v)
|
|
|
10.29(v)
|
|
|
10.30(n)
|
|
|
10.31(p)
|
|
|
10.32(p)
|
|
|
10.33(r)
|
|
|
21.1
|
|
|
23.1
|
|
|
31.1
|
|
|
31.2
|
|
|
32.1
|
|
91
|
32.2
|
|
|
101.INS
|
XBRL Instance Document.
|
|
101.SCH
|
XBRL Taxonomy Extension Schema Document.
|
|
101.CAL
|
XBRL Taxonomy Extension Calculation Linkbase Document.
|
|
101.DEF
|
XBRL Taxonomy Extension Definition Linkbase Document.
|
|
101.LAB
|
XBRL Taxonomy Extension Label Linkbase Document.
|
|
101.PRE
|
XBRL Taxonomy Extension Presentation Linkbase Document.
|
*Management contracts and compensatory plans or arrangements required to be filed as an exhibit pursuant to Item 15(b) of Form 10-K.
** Certain exhibits and schedules have been omitted and the Company agrees to furnish supplementally to the Securities and Exchange Commission a copy of any omitted exhibits and schedules upon request.
|
(a)
|
|
Incorporated by reference to the Exhibits filed with our Registration Statement on Form S-4 filed on October 4, 2002 (File No. 333-100351).
|
|
(b)
|
|
Incorporated by reference to the Exhibits filed with our Registration Statement on Form S-4 filed June 9, 2003 (File No. 333-105950).
|
|
(c)
|
Incorporated by reference to the Exhibits filed with Amendment No. 1 to our Registration Statement on Form S-1 filed on September 19, 2006 (File No. 333-136263).
|
|
|
(d)
|
Incorporated by reference to the Exhibits filed with our Quarterly Report on Form 10-Q filed on August 3, 2007 (File No. 001-10716).
|
|
|
(e)
|
Incorporated by reference to the Exhibits filed with our Quarterly Report on Form 10-Q filed on August 7, 2008 (File No. 001-10716).
|
|
|
(f)
|
Incorporated by reference to the Exhibits filed with our Report on Form 8-K filed on March 6, 2009 (File No. 001-10716).
|
|
|
(g)
|
Incorporated by reference to the Exhibits filed with our Report on Form 8-K filed on December 10, 2009 (File No. 001-10716).
|
|
|
(h)
|
Incorporated by reference to the Exhibits filed with our Report on Form 8-K filed on March 26, 2010 (File No. 001-10716).
|
|
|
(i)
|
Incorporated by reference to the Exhibits filed with our Report on Form 8-K filed on December 18, 2015 (File No. 001-10716).
|
|
|
(j)
|
Incorporated by reference to the Exhibits filed with our Report on Form 8-K filed on April 4, 2011 (File No. 001-10716).
|
|
|
(k)
|
Incorporated by reference to Appendix A filed with our Definitive Proxy Statement on Schedule 14A filed on April 5, 2013 (File No. 001-10716).
|
|
|
(l)
|
Incorporated by reference to the Exhibits filed with our Report on Form 8-K filed on August 23, 2013 (File No. 001-10716).
|
|
|
(m)
|
Incorporated by reference to the Exhibits filed with our Report on Form 8-K filed on October 21, 2013 (File No. 001-10716).
|
|
|
(n)
|
Incorporated by reference to the Exhibits filed with our Report on Form 8-K filed on November 13, 2013 (File No. 001-10716).
|
|
|
(o)
|
Incorporated by reference to the Exhibits filed with our Current Report on Form 8-K filed on October 20, 2014 (File No. 001-10716).
|
|
|
(p)
|
Incorporated by reference to the Exhibits filed with our Current Report on Form 8-K filed on July 6, 2015 (File No. 001-10716).
|
|
|
(q)
|
Incorporated by reference to the Exhibits filed with our Quarterly Report on Form 10-Q filed on April 28, 2016 (File No. 001-10716).
|
|
|
(r)
|
Incorporated by reference to the Exhibits filed with our Quarterly Report on Form 10-Q filed on October 27, 2016 (File No. 001-10716).
|
|
|
(s)
|
Incorporated by reference to the Exhibits filed with our Quarterly Report on Form 10-Q filed on April 27, 2017 (File No. 001-10716).
|
|
|
(t)
|
Incorporated by reference to the Exhibits filed with our Quarterly Report on Form 10-Q filed on July 27, 2017 (File No. 001-10716).
|
|
92
|
(u)
|
Incorporated by reference to the Exhibits filed with our Current Report on Form 8-K filed on September 20, 2017 (File No. 001-10716).
|
|
|
(v)
|
Incorporated by reference to the Exhibits filed with our Quarterly Report on Form 10-Q filed on August 7, 2018 (File No. 001-10716).
|
|
Item 16. Form 10-K Summary
None.
93
SIGNATURES
Pursuant to the requirements of Section 13 or 15(d) of the Securities Exchange Act of 1934, the Registrant has duly caused this report to be signed on its behalf by the undersigned, thereunto duly authorized.
|
|
|
TRIMAS CORPORATION
(Registrant)
|
|||
|
BY:
|
/s/ THOMAS A. AMATO
|
||||
|
DATE:
|
February 28, 2019
|
|
|
Name: Thomas A. Amato
Title:
President and Chief Executive Officer
|
|
Pursuant to the requirements of the Securities Exchange Act of 1934, this Report has been signed below by the following persons on behalf of the Registrant and in the capacities and on the dates indicated.
|
Name
|
|
Title
|
|
Date
|
|
|
|
|
|
|
|
/s/ THOMAS A. AMATO
|
President and Chief Executive Officer
|
February 28, 2019
|
||
|
Thomas A. Amato
|
|
(Principal Executive Officer) and Director
|
|
|
|
/s/ ROBERT J. ZALUPSKI
|
Chief Financial Officer
|
February 28, 2019
|
||
|
Robert J. Zalupski
|
|
(Principal Financial Officer)
|
|
|
|
/s/ PAUL A. SWART
|
Vice President Business Planning, Controller and Chief Accounting Officer
|
February 28, 2019
|
||
|
Paul A. Swart
|
|
(Principal Accounting Officer)
|
|
|
|
/s/ SAMUEL VALENTI III
|
Chairman of the Board of Directors
|
February 28, 2019
|
||
|
Samuel Valenti III
|
|
|
||
|
/s/ RICHARD M. GABRYS
|
Director
|
|
February 28, 2019
|
|
|
Richard M. Gabrys
|
|
|||
|
/s/ NANCY S. GOUGARTY
|
Director
|
February 28, 2019
|
||
|
Nancy S. Gougarty
|
||||
|
/s/ JEFFREY M. GREENE
|
Director
|
February 28, 2019
|
||
|
Jeffrey M. Greene
|
||||
|
/s/ EUGENE A. MILLER
|
Director
|
|
February 28, 2019
|
|
|
Eugene A. Miller
|
|
|||
|
/s/ HERBERT K. PARKER
|
Director
|
February 28, 2019
|
||
|
Herbert K. Parker
|
||||
|
/s/ NICK L. STANAGE
|
Director
|
February 28, 2019
|
||
|
Nick L. Stanage
|
||||
|
/s/ DANIEL P. TREDWELL
|
Director
|
|
February 28, 2019
|
|
|
Daniel P. Tredwell
|
|
|||
94
SCHEDULE II
PURSUANT TO ITEM 15(a)(2)
OF FORM 10-K VALUATION AND QUALIFYING ACCOUNTS FOR THE YEARS ENDED
December 31, 2018
,
2017
AND
2016
|
|
|
ADDITIONS
|
|
|
||||||||||||||||
|
DESCRIPTION
|
BALANCE
AT
BEGINNING
OF PERIOD
|
CHARGED
TO
COSTS AND
EXPENSES
|
CHARGED
(CREDITED)
TO OTHER
ACCOUNTS
|
DEDUCTIONS
(A)
|
BALANCE
AT END
OF PERIOD
|
|||||||||||||||
|
Allowance for doubtful accounts deducted from accounts receivable in the balance sheet
|
|
|
|
|
|
|||||||||||||||
|
Year ended December 31, 2018
|
$
|
4,130,000
|
|
$
|
1,640,000
|
|
$
|
170,000
|
|
$
|
2,550,000
|
|
$
|
3,390,000
|
|
|||||
|
Year ended December 31, 2017
|
$
|
4,580,000
|
|
$
|
2,730,000
|
|
$
|
(140,000
|
)
|
$
|
3,040,000
|
|
$
|
4,130,000
|
|
|||||
|
Year ended December 31, 2016
|
$
|
3,710,000
|
|
$
|
2,770,000
|
|
$
|
(90,000
|
)
|
$
|
1,810,000
|
|
$
|
4,580,000
|
|
|||||
________________________________________
|
(A)
|
Deductions, representing uncollectible accounts written-off, less recoveries of amounts reserved in prior years.
|
95
TABLE OF CONTENTS
Part IItem 1. BusinessItem 1A. Risk FactorsItem 1B. Unresolved Staff CommentsItem 2. PropertiesItem 3. Legal ProceedingsItem 4. Mine Safety DisclosuresPart IIItem 5. Market For Registrant's Common Equity, Related Stockholder Matters and Issuer Purchases Of Equity SecuritiesItem 6. Selected Financial DataItem 7. Management's Discussion and Analysis Of Financial Condition and Results Of OperationsItem 7A. Quantitative and Qualitative Disclosures About Market RiskItem 8. Financial Statements and Supplementary DataItem 9. Changes in and Disagreements with Accountants on Accounting and Financial DisclosureItem 9A. Controls and ProceduresItem 9B. Other InformationPart IIIItem 10. Directors, Executive Officers and Corporate GovernanceItem 11. Executive CompensationItem 12. Security Ownership Of Certain Beneficial Owners and Management and Related Stockholder MattersItem 13. Certain Relationships and Related Transactions, and Director IndependenceItem 14. Principal Accountant Fees and ServicesPart IVItem 15. Exhibits and Financial Statement SchedulesItem 16. Form 10-k Summary