UNITED STATES
SECURITIES AND EXCHANGE COMMISSION
WASHINGTON, D.C. 20549
FORM 10-K
|
ý
|
ANNUAL REPORT PURSUANT TO SECTION 13 OR 15(d) OF THE SECURITIES EXCHANGE ACT OF 1934
|
For The
Fiscal Year
Ended
December 31, 2018
Or
|
o
|
TRANSITION REPORT PURSUANT TO SECTION 13 OR 15(d) OF THE SECURITIES EXCHANGE ACT OF 1934
|
Commission file number - 001-37827
Triton International Limited
(Exact name of registrant as specified in the charter)
|
Bermuda
(State or other jurisdiction of incorporation or organization)
|
|
98-1276572
(I.R.S. Employer Identification Number)
|
|
Canon's Court, 22 Victoria Street, Hamilton HM12, Bermuda
(Address of principal executive office)
|
||
|
(441) 294-8033
(Registrant's telephone number including area code)
|
||
Securities registered pursuant to Section 12(b) of the Act:
|
Title of Each Class
|
Name of Exchange On Which Registered
|
|
|
Common shares, $0.01 par value per share
|
The New York Stock Exchange
|
|
Securities registered pursuant to Section 12(g) of the Act:
None
Indicate by check mark if the registrant is a well-known seasoned issuer, as defined in Rule 405 of the Securities Act. Yes
ý
No
o
Indicate by check mark if the registrant is not required to file reports pursuant to Section 13 or Section 15(d) of the Act. Yes
o
No
ý
Indicate by check mark whether the registrant (1) has filed all reports required to be filed by Section 13 or 15(d) of the Securities Exchange Act of 1934 during the preceding 12 months (or for such shorter period that the registrant was required to file such reports), and (2) has been subject to such filing requirement for the past 90 days. Yes
ý
No
o
Indicate by check mark whether the registrant has submitted electronically every Interactive Data File required to be submitted pursuant to Rule 405 of Regulation S-T during the preceding 12 months (or for such shorter period that the registrant was required to submit such files). Yes
ý
No
o
Indicate by check mark if disclosure of delinquent filers pursuant to Item 405 of Regulation S-K is not contained herein, and will not be contained, to the best of registrant's knowledge, in definitive proxy or information statements incorporated by reference in Part III of this Form 10-K or any amendment to this Form 10-K.
o
Indicate by check mark whether the registrant is a large accelerated filer, an accelerated filer, a non-accelerated filer, smaller reporting company, or an emerging growth company. See definitions of "large accelerated filer," "accelerated filer," "smaller reporting company," and "emerging growth company" in Rule 12b-2 of the Exchange Act.
|
Large Accelerated Filer
ý
|
|
|
Accelerated Filer
o
|
|
||
|
Non-accelerated filer
o
|
Smaller reporting company
o
|
|||||
|
Emerging growth company
o
|
||||||
If an emerging growth company, indicate by check mark if the registrant has elected not to use the extended transition period for complying with any new or revised financial accounting standards provided pursuant to Section 13(a) of the Exchange Act.
o
Indicate by check mark whether the registrant is a shell company (as defined in rule 12b-2 of the Exchange Act). Yes
o
No
ý
The aggregate market value of voting common shares held by non-affiliates as of
June 29, 2018
was approximately
$1,586.0 million
.
As of
February 8, 2019
, there were
78,743,418
common shares, $0.01 par value, of the Registrant outstanding.
|
DOCUMENTS INCORPORATED BY REFERENCE
|
|
|
Part of Form 10-K
|
Document Incorporated by Reference
|
|
Part III, Items 10, 11, 12, 13, and 14
|
Portion of the Registrant's proxy statement to be filed in connection with the Annual Meeting of Shareholders of the Registrant to be held on April 25, 2019.
|
Table of Contents
|
|
|
Page No.
|
|
Item 9B
.
|
||
|
PART III
|
||
2
CAUTIONARY NOTE REGARDING FORWARD-LOOKING STATEMENTS
This
annual
report on Form
10-K
contains forward-looking statements within the meaning of Section 27A of the Securities Act of 1933, as amended, or the Securities Act, and Section 21E of the Securities Exchange Act of 1934, as amended, or the Exchange Act, that involve substantial risks and uncertainties. In addition, we, or our executive officers on our behalf, may from time to time make forward-looking statements in reports and other documents we file with the Securities and Exchange Commission, or SEC, or in connection with oral statements made to the press, potential investors or others. All statements other than statements of historical facts, including statements regarding our strategy, future operations, future financial position, future revenues, future costs, prospects, plans and objectives of management are forward-looking statements. The words "expect," "estimate," "anticipate," "predict," "believe," "think," "plan," "will," "should," "intend," "seek," "potential" and similar expressions and variations are intended to identify forward-looking statements, although not all forward-looking statements contain these identifying words.
All forward-looking statements address matters that involve risks and uncertainties, many of which are beyond Triton's control. Accordingly, there are or will be important factors that could cause actual results to differ materially from those indicated in such statements and, therefore, you should not place undue reliance on any such statements. These factors include, without limitation, economic, business, competitive, market and regulatory conditions and the following:
|
•
|
decreases in the demand for leased containers;
|
|
•
|
decreases in market leasing rates for containers;
|
|
•
|
difficulties in re-leasing containers after their initial fixed-term leases;
|
|
•
|
customers' decisions to buy rather than lease containers;
|
|
•
|
dependence on a limited number of customers for a substantial portion of our revenues;
|
|
•
|
customer defaults;
|
|
•
|
decreases in the selling prices of used containers;
|
|
•
|
extensive competition in the container leasing industry;
|
|
•
|
difficulties stemming from the international nature of Triton's businesses;
|
|
•
|
decreases in demand for international trade;
|
|
•
|
disruption to Triton's operations resulting from political and economic policies of the United States and other countries, particularly China, including but not limited to the impact of trade wars and tariffs;
|
|
•
|
disruption to Triton's operations from failure of or attacks on Triton's information technology systems;
|
|
•
|
disruption to Triton's operations as a result of natural disasters;
|
|
•
|
compliance with laws and regulations related to economic and trade sanctions, security, anti-terrorism, environmental protection and corruption;
|
|
•
|
ability to obtain sufficient capital to support growth;
|
|
•
|
restrictions imposed by the terms of Triton's debt agreements;
|
|
•
|
changes in the tax laws in Bermuda, the United States and other countries; and
|
|
•
|
other risks and uncertainties, including those listed under the caption "Risk Factors."
|
The foregoing list of important factors should not be construed as exhaustive and should be read in conjunction with the other cautionary statements that are included herein and elsewhere, including the risk factors included in this annual report on Form 10-K. Any forward-looking statements made in this annual report on Form 10-K are qualified in their entirety by these cautionary statements, and there can be no assurance that the actual results or developments anticipated by us will be realized or, even if substantially realized, that they will have the expected consequences to, or effects on, Triton or its respective businesses or operations. Except to the extent required by applicable law, we undertake no obligation to update publicly or revise any forward-looking statement, whether as a result of new information, future developments or otherwise.
3
MERGER OF TRITON CONTAINER INTERNATIONAL LIMITED AND TAL INTERNATIONAL GROUP, INC. TO FORM TRITON INTERNATIONAL LIMITED
On November 9, 2015, Triton Container International Limited, an exempted company incorporated with limited liability under the laws of Bermuda ("TCIL"), and TAL International Group, Inc., a Delaware corporation ("TAL"), announced that they entered into a definitive Transaction Agreement (the "Transaction Agreement") to combine in an all-stock merger (the "Merger"). On July 12, 2016, TCIL and TAL combined under a newly-formed company, Triton International Limited ("Triton", "we", "our" or the "Company"), which is domiciled in Bermuda and is listed on the New York Stock Exchange under the stock symbol "TRTN".
Post-Merger Organization Structure Relevant to this Form 10-K
On July 12, 2016, the transactions contemplated by the Transaction Agreement were approved by the stockholders of TAL and became effective. Former TCIL shareholders owned approximately 55% of the outstanding equity of the Company and former TAL stockholders owned approximately 45% of the outstanding equity of the Company on that date. The Company, through its subsidiaries, leases intermodal transportation equipment, primarily maritime containers, and provides maritime container management services through a worldwide network of subsidiary offices, third-party depots and other facilities. Triton operates in both international and U.S. markets. The majority of Triton's business is derived from leasing its containers to shipping line customers through a variety of long-term and short-term contractual lease arrangements. Triton also sells its own containers and containers purchased from third parties for resale. Triton's registered office is located at Canon's Court, 22 Victoria Street, Hamilton HM12, Bermuda.
Since completion of the Merger, Brian M. Sondey, who was the Chairman, President and Chief Executive Officer of TAL, has served as the Chairman and Chief Executive Officer of Triton, and John Burns, who was the Chief Financial Officer of TAL, has served as the Chief Financial Officer of Triton. Simon R. Vernon, who was the President and Chief Executive Officer of TCIL, served as President of Triton until his retirement on February 28, 2018 and continues to serve as a member of the Board of Directors.
WEBSITE ACCESS TO COMPANY'S REPORTS AND CODE OF ETHICS
Our Internet website address is http://www.trtn.com. Our annual reports on Form 10-K, quarterly reports on Form 10-Q, current reports on Form 8-K, and amendments to those reports filed or furnished pursuant to Section 13(a) or 15(d) of the Exchange Act are available free of charge through our website as soon as reasonably practicable after they are electronically filed with, or furnished to, the SEC.
We have adopted a code of ethics that applies to all of our employees, officers, and directors, including our principal executive officer and principal financial officer. The text of our code of ethics is posted within the Corporate Governance portion of the Investors section of our website.
Also, copies of our annual report and Code of Ethics will be made available, free of charge, upon written request to:
Triton International Limited
Canon's Court
22 Victoria Street
Hamilton HM12, Bermuda
Attn: Marc Pearlin, Sr. Vice President, General Counsel and Secretary
Telephone: (441) 294-8033
SERVICE MARKS MATTERS
The following items referred to in this annual report are registered or unregistered service marks in the United States and/or foreign jurisdictions pursuant to applicable intellectual property laws and are the property of Triton and its subsidiaries: Triton®, TAL®, and
 ®.
®.
®.
4
PART I
ITEM 1. BUSINESS
Our Company
Triton International Limited (“Triton”, “we”, "our” or the “Company”) is the world's largest lessor of intermodal containers. Intermodal containers are large, standardized steel boxes used to transport freight by ship, rail or truck. Because of the handling efficiencies they provide, intermodal containers are the primary means by which many goods and materials are shipped internationally. We also lease chassis, which are used for the transportation of containers.
Triton was formed on July 12, 2016 through an all-stock merger between Triton Container International Limited and TAL International Group, Inc.
Our consolidated operations include the acquisition, leasing, re-leasing and subsequent sale of multiple types of intermodal containers and chassis. As of
December 31, 2018
, our total fleet consisted of
3.7 million
containers and chassis, representing
6.2 million
twenty-foot equivalent units ("TEU") or
7.6 million
cost equivalent units ("CEU"). We have an extensive global presence, offering leasing services through
23
offices located in
16
countries, and we provide access to our containers through a network of approximately
400
third-party container depot facilities located in approximately
45
countries as of
December 31, 2018
. Our primary customers include the world's largest container shipping lines. We employed
243
people as of
December 31, 2018
. Our field operations include a global sales force, a global container operations group, an equipment resale group, and a logistics services group. Our registered office is located in Bermuda.
The most important driver of profitability in our business is the extent to which leasing revenues, which are driven primarily by our owned equipment fleet size, utilization and average rental rates, exceed our ownership and operating costs. Our profitability is also driven by the gains or losses we realize on the sale of used containers because, in the ordinary course of our business, we sell certain containers when they are returned to us.
Industry Overview
Intermodal containers provide a secure and cost-effective method of transporting raw materials, component parts and finished goods because they can be used in multiple modes of transport. By making it possible to move cargo from a point of origin to a final destination without repeated unpacking and repacking, containers reduce freight and labor costs. In addition, automated handling of containers permits faster loading and unloading of vessels, more efficient utilization of transportation equipment and reduced transit time. The protection provided by sealed containers also reduces cargo damage and the loss and theft of goods during shipment.
Over the last thirty years, containerized trade has grown at a rate greater than that of general worldwide economic growth. According to Clarkson Research Studies, worldwide containerized cargo volume increased at a compound annual growth rate ("CAGR") of
8.1%
from
1987
to
2018
. We believe that this high historical growth was due to several factors, including the shift in global manufacturing capacity to lower labor cost areas such as China and India, the continued integration of developing high growth economies into global trade patterns and the continued conversion of cargo from bulk shipping into containers. However, worldwide containerized cargo volume growth has been lower over the last few years, averaging
4.1%
CAGR from
2013
to
2018
, due to weak global economic growth and a significant reduction in the difference between global trade growth and global economic growth.
Container leasing firms maintain inventories of new and used containers in a wide range of worldwide locations and supply these containers primarily to shipping line customers under a variety of short and long-term lease structures. Based on container fleet information reported by Drewry Maritime Research, we estimate that container lessors owned approximately
21.9
million twenty-foot equivalent units ("TEU"), or approximately
53%
of the total worldwide container fleet of
41.7
million TEU, as of the end of
2018
.
Leasing containers helps shipping lines improve their container fleet efficiency and provides shipping lines with an alternative source of equipment financing. Given the uncertainty and variability of export volumes, and the fact that shipping lines have difficulty in accurately forecasting their container requirements on a day-by-day, port-by-port basis, the availability of containers for lease on short notice reduces shipping lines' need to purchase and maintain larger container inventory buffers. In addition, the
5
drop-off flexibility provided by operating leases also allows the shipping lines to adjust their container fleet sizes and the mix of container types in their fleets both seasonally and over time and helps to balance their trade flows.
Spot leasing rates are typically a function of, among other things, new equipment prices (which are heavily influenced by steel prices), interest rates and the equipment supply and demand balance at a particular time and location. Average leasing rates on an entire portfolio of leases respond more gradually to changes in new equipment prices or changes in the balance of container supply and demand because lease agreements are generally only re-priced upon the expiration of the lease. In addition, the value that lessors receive upon resale of equipment is closely related to the cost of new equipment.
Our Equipment
Intermodal containers are designed to meet a number of criteria outlined by the International Standards Organization (ISO). The standard criteria include the size of the container and the gross weight rating of the container. This standardization ensures that containers can be used by the widest possible number of transporters and it facilitates container and vessel sharing by the shipping lines. The standardization of the container is also an important element of the container leasing business since we can operate one fleet of containers that can be used by all of our major customers.
Our fleet primarily consists of five types of equipment:
|
•
|
Dry Containers.
A dry container is a steel constructed box with a set of doors on one end. Dry containers come in lengths of 20, 40 or 45 feet. They are 8 feet wide, and either 8½
or 9½ feet tall. Dry containers are the least expensive and most widely used type of intermodal container and are used to carry general cargo such as manufactured component parts, consumer staples, electronics and apparel.
|
|
•
|
Refrigerated Containers.
Refrigerated containers include an integrated cooling machine and an insulated container. Refrigerated containers come in lengths of 20 or 40 feet. They are 8 feet wide, and are either 8½
or 9½ feet tall. These containers are typically used to carry perishable cargo such as fresh and frozen produce.
|
|
•
|
Special Containers.
Most of our special containers are open top and flat rack containers. Open top containers come in similar sizes as dry containers, but do not have a fixed roof. Flat rack containers come in varying sizes and are steel platforms with folding ends and no fixed sides. Open top and flat rack containers are generally used to move heavy or bulky cargos, such as marble slabs, steel coils or factory components, that cannot be easily loaded on a fork lift through the doors of a standard container.
|
|
•
|
Tank Containers.
Tank containers are stainless steel cylindrical tanks enclosed in rectangular steel frames with the same outside dimensions as 20 foot dry containers. These containers carry bulk liquids such as chemicals.
|
|
•
|
Chassis.
An intermodal chassis is a rectangular, wheeled steel frame, generally 23½, 40 or 45 feet in length, built specifically for the purpose of transporting intermodal containers over the road. Longer sized chassis, designed to solely accommodate rail containers, can be up to 53 feet in length. When mounted on a chassis, the container may be trucked either to its destination or to a railroad terminal for loading onto a rail car. Our chassis are primarily used in the United States.
|
Our Leases
Most of our revenues are derived from leasing our equipment to our core shipping line customers. The majority of our leases are structured as operating leases, though we also provide customers with finance leases. Regardless of the lease type, we seek to exceed our targeted return on our investments over the life cycle of the equipment by managing utilization, lease rates, and the used equipment sale process.
Our lease products provide numerous operational and financial benefits to our shipping line customers. These benefits include:
|
•
|
Operating Flexibility.
The timing, location and daily volume of cargo movements for a shipping line are often unpredictable. Leasing containers and chassis helps our customers manage this uncertainty and minimizes the requirement for large inventory buffers by allowing them to pick-up leased equipment on short notice.
|
|
•
|
Fleet Size and Mix Flexibility.
The drop-off flexibility included in container and chassis operating leases allows our customers to more quickly adjust the size of their fleets and the mix of container types in their fleets as their trade volumes and patterns change due to seasonality, market changes or changes in company strategies.
|
|
•
|
Alternative Source of Financing.
Container and chassis leases provide an additional source of equipment financing to help our customers manage the high level of investment required to maintain pace with the growth of the asset intensive container shipping industry.
|
Operating Leases.
Operating leases are structured to allow customers flexibility to pick-up equipment on short notice and to drop-off equipment prior to the end of its useful life. Because of this flexibility, most of our containers and chassis will go through several pick-up and drop-off cycles. Our operating lease contracts specify a per diem rate for equipment on-hire, where
6
and when such equipment can be returned, how the customer will be charged for damage and the charge for lost or destroyed equipment, among other things.
We categorize our operating leases as either long-term leases or service leases. Some leases have contractual terms that have features reflective of both long-term and service leases. We classify such leases as either long-term or service leases, depending upon which features we believe are predominant. Long-term leases typically have initial contractual terms ranging from three to eight years. Our long-term leases require our customers to maintain specific units on-hire for the duration of the lease term, and they provide us with predictable recurring cash flow. As of
December 31, 2018
,
66.6%
of our on-hire containers and chassis were under long-term operating leases.
We also have expired long-term leases whose fixed terms have ended but for which the related units remain on-hire and for which we continue to receive rental payments pursuant to the terms of the initial contract. As of
December 31, 2018
,
14.6%
of our on-hire containers and chassis were on long-term leases whose fixed terms have expired but for which the related units remain on-hire and for which we continue to receive rental payments.
Some of our long-term leases give our customers Early Termination Options ("ETOs"). If exercised, ETOs allow customers to return equipment prior to the expiration of the long-term lease. However, if an ETO is exercised, the customer is required to pay a penalty per diem rate that is applied retroactively to the beginning of the lease. As a result of this retroactive penalty, ETOs have historically been exercised infrequently.
Service leases allow our customers to pick-up and drop-off equipment during the term of the lease, subject to contractual limitations. Service leases provide the customer with a higher level of flexibility than long-term leases and, as a result, typically carry a higher per diem rate. The terms of our service leases can range from 12 months to five years, though because equipment can be returned during the term of a service lease and since service leases are generally renewed or modified and extended upon expiration, lease term does not dictate expected on-hire time for our equipment on service leases. As of
December 31, 2018
,
11.3%
of our on-hire containers and chassis were under service leases and this equipment has been on-hire for an average of
35 months
.
Finance Leases.
Finance leases provide our customers with an alternative method to finance their equipment acquisitions. Finance leases are generally structured for specific quantities of equipment, generally require the customer to keep the equipment on-hire for its remaining useful life, and typically provide the customer with a purchase option at the end of the lease term. As of
December 31, 2018
, approximately
7.5%
of our on-hire containers and chassis were under finance leases.
The following table provides a summary of our equipment lease portfolio by lease type, based on cost equivalent units (CEU), as of
December 31, 2018
:
|
Lease Portfolio
|
December 31, 2018
|
||
|
Long-term leases
|
66.6
|
%
|
|
|
Finance leases
|
7.5
|
|
|
|
Service leases
|
11.3
|
|
|
|
Expired long-term leases (units on-hire)
|
14.6
|
|
|
|
Total
|
100.0
|
%
|
|
As of
December 31, 2018
, our long-term and finance leases had an average remaining duration of
47 months
, assuming no leases are renewed. However, we believe that many of our customers will renew operating leases for equipment that is less than sale age at the expiration of the lease. In addition, our equipment on operating leases typically remains on-hire at the contractual per diem rate for an additional six to twelve months beyond the end of the contractual lease term due to the logistical requirements of our customers having to return the containers and chassis to specific drop-off locations.
Lease Documentation.
In general, our lease agreements consist of two basic elements, a master lease agreement and a lease addendum. Lease addenda typically contain the business terms (including daily rate, term duration and drop-off schedule, among other things) for specific leasing transactions, while master lease agreements typically outline the general rights and obligations of the lessor and lessee under all of the lease addenda covered by the master lease agreement (lease addenda will specify the master lease agreement that governs the addenda). For most customers, we have a small number of master lease agreements (often one) and a large number of lease addenda.
Our master lease agreements generally require the lessees to pay rentals, depot charges, taxes and other charges when due, to maintain the equipment in good condition, to return the equipment in accordance with the return condition set forth in the master
7
lease agreement, to use the equipment in compliance with all federal, state, local and foreign laws, and to pay us the specified value of the equipment if the equipment is lost or destroyed. The default clause gives us certain legal remedies in the event that the lessee is in breach of the lease.
The master lease agreements usually contain an exclusion of warranties clause and require lessees to defend and indemnify us in most instances from third-party claims arising out of the lessee's use, operation, possession or lease of the equipment. Lessees are generally required to maintain all risks physical damage insurance, comprehensive general liability insurance and to indemnify us against loss. We also maintain our own off-hire physical damage insurance to cover our equipment when it is not on-hire to lessees and third-party liability insurance for both on-hire and off-hire equipment. Nevertheless, such insurance or indemnities may not fully protect us against damages arising from the use of our containers.
Logistics Management, Re-leasing, Depot Management and Equipment Disposals
We believe that managing the period after our equipment's lease is the most important aspect of our business. Successful management of this period requires disciplined logistics management, extensive re-lease capability, careful cost control and effective sales of used equipment.
Logistics Management.
Since the late 1990's, the shipping industry has been characterized by large regional trade imbalances, with loaded containers generally flowing from export oriented economies in Asia to North America and Western Europe. Because of these trade imbalances, shipping lines have an incentive to return leased containers in North America and Europe to reduce the cost of empty container backhaul. Triton attempts to mitigate the risk of these unbalanced trade flows by maintaining a large portion of our fleet on long-term and finance leases and by contractually restricting the ability of our customers to return containers outside of Asian demand locations.
In addition, we attempt to minimize the costs of any container imbalances by finding local users in surplus locations and by moving empty containers as inexpensively as possible. While we believe we manage our logistics risks and costs effectively, logistical risk remains an important element of our business due to competitive pressures, changing trade patterns and other market factors and uncertainties.
Re-leasing.
Since our operating leases allow customers to return containers and chassis prior to the end of their useful lives, we typically are required to place containers and chassis on several leases during their useful lives. Initial lease transactions for new containers and chassis can usually be generated with a limited sales and customer service infrastructure because initial leases for new containers and chassis typically cover large volumes of units and are fairly standardized transactions. Used equipment, on the other hand, is typically leased out in small transactions that are structured to accommodate pick-ups and returns in a variety of locations. As a result, leasing companies benefit from having an extensive global marketing and operations infrastructure, a large number of customers, and a high level of operating contact with these customers.
Depot Management.
As of
December 31, 2018
, we managed our equipment fleet through approximately
400
third-party owned and operated depot facilities located in
45
countries. Depot facilities are generally responsible for repairing our containers and chassis when they are returned by lessees and for storing the equipment while it is off-hire. We have a global operations group that is responsible for managing our depot contracts and they also regularly visit the depot facilities to conduct inventory and repair audits. We also supplement our internal operations group with the use of independent inspection agents.
We are in constant communication with our depot partners through the use of electronic data interchange ("EDI"). Our depots gather and prepare all information related to the activity of our equipment at their facilities and transmit the information via EDI and the Internet to us. The information we receive from the depots updates our fully integrated container fleet management, tracking, and billing system.
Most of the depot agency agreements follow a standard form and generally provide that the depot will be liable for loss or damage of equipment and, in the event of loss or damage, will pay us the previously agreed loss value of the applicable equipment. The agreements require the depots to maintain insurance against equipment loss or damage and we carry insurance to cover the risk that the depots' insurance proves insufficient.
Our container repair standards and processes are generally managed in accordance with standards and procedures specified by the Institute of International Container Lessors (IICL). The IICL establishes and documents the acceptable interchange condition for containers and the repair procedures required to return damaged containers to the acceptable interchange condition. At the time that containers are returned by lessees, the depot arranges an inspection of the containers to assess the repairs required to return the containers to acceptable IICL condition. This inspection process also splits the damage into two components, customer damage and normal wear and tear. Items typically designated as customer damage include dents in the container and debris left in the
8
container, while items such as rust are typically designated as normal wear and tear.
Our leases are generally structured so that the lessee is responsible for the customer damage portion of the repair costs, and customers are billed for damages at the time the equipment is returned. We sometimes offer our customers a repair service program whereby we, for an additional payment by the lessee (in the form of a higher per-diem rate or a flat fee at off-hire), assume financial responsibility for all or a portion of the cost of repairs upon return of the equipment.
Equipment Disposals.
Our in-house equipment sales group has a worldwide team of specialists that manage the sale process for our used containers and chassis from our lease fleet. We generally sell to portable storage companies, freight forwarders (who often use the containers for one-way trips) and other purchasers of used containers. We believe we are one of the world's largest sellers of used containers.
The sale prices we receive for our used containers are influenced by many factors, including the level of demand for used containers compared to the number of used containers available for disposal in a particular location, the cost of new containers, and the level of damage on the containers. While our total revenue is primarily made up of leasing revenues, gains or losses on the sale of used containers can have a significant positive or negative impact on our profitability.
Equipment Trading.
We also buy and sell new and used containers and chassis acquired from third parties. We typically purchase our equipment trading fleet from our shipping line customers or other sellers of used or new equipment. Trading margins are dependent on the volume of units purchased and resold, selling prices, costs paid for equipment sold and selling and administrative costs.
Customers
Our customers are mainly international shipping lines, though we also lease containers to freight forwarding companies and manufacturers. We believe that we have strong, long-standing relationships with our largest customers, most of whom we have done business with for more than 30 years. We currently have equipment on-hire to more than 300 customers, although our
twenty
largest customers account for
85%
of our lease billings. The shipping industry has been consolidating for a number of years, and further consolidation could increase the portion of our revenues that come from our largest customers. Our
five
largest customers accounted for
54%
of our lease billings, and our two largest customers,
CMA CGM S.A.
and
Mediterranean Shipping Company S.A.
, accounted for
20%
and
14%
, respectively, of our lease billings in
2018
. A default by one of our major customers could have a material adverse impact on our business, financial condition and future prospects.
Marketing and Customer Service
Our global marketing force and our customer service representatives are responsible for developing and maintaining relationships with senior operations staff at our shipping line customers, negotiating lease contracts and maintaining day-to-day coordination with junior level staff at our customers. This close customer communication is critical to our ability to provide customers with a high level of service, helps us to negotiate lease contracts that satisfy both our financial return requirements and our customers' operating needs, ensures that we are aware of our customers' potential equipment shortages, and provides customers knowledge of our available equipment inventories.
Credit Controls
We monitor our customers' performance and our lease exposures on an ongoing basis. Our credit management processes are aided by the long payment experience we have with most of our customers and our broad network of relationships in the shipping industry that provides current information about our customers' market reputations. Credit criteria may include, but are not limited to, customer payment history, customer financial position and performance (e.g., net worth, leverage and profitability), trade routes, country of domicile and the type of, and location of, equipment that is to be supplied.
We experienced a major lessee default in 2016 when Hanjin Shipping Co. ("Hanjin"), one of our largest customers, filed for bankruptcy court protection
and defaulted on our lease agreements. Hanjin had approximately
87,000
of our containers on lease with a net book value of
$243.3
million. We recorded a loss of $
29.7
million during the third quarter ended September 30, 2016, comprised of bad debt expense and a charge for costs not expected to be recovered due to deductibles in our credit insurance policies. As of
December 31, 2018
, we recovered approximately
95%
of our containers previously leased to Hanjin.
While we recovered
95%
of the containers previously on-hire to Hanjin, we incurred substantial costs in the recovery effort including a write-off of outstanding receivables; payments to terminals, depots, Hanjin shipping agents and others in possession
9
of our containers to obtain the release of our containers; repair and handling costs; and positioning costs to move containers recovered from locations with weak leasing demand to higher demand locations.
We historically maintained credit insurance to help mitigate the cost and risk of lessee defaults and this insurance coverage reduced our costs resulting from the default of Hanjin, by approximately $
67.0
million. However, our credit insurance policies typically had annual terms, and in the aftermath of the Hanjin bankruptcy, the availability of credit insurance protection has become much more limited and the cost of the more limited protection has increased substantially. We currently assess the cost and level of this type of credit insurance protection offered to us as uneconomic, and have allowed this credit insurance coverage to lapse. We have obtained a more limited credit insurance policy covering only accounts receivables for some of our customers. This policy does not cover recovery costs, has exclusions and payment and other limitations, and therefore may not protect us from losses arising from customer defaults. Therefore we may be forced to incur all of the losses resulting from future lessee defaults, significantly increasing the likelihood that a lessee default would have a material adverse impact on our profitability and financial condition.
Competition
We compete with at least
six
other major intermodal equipment leasing companies in addition to many smaller lessors, manufacturers of intermodal equipment, and companies offering finance leases as distinct from operating leases. It is common for our customers to utilize several leasing companies to meet their equipment needs.
Our competitors compete with us in many ways, including lease pricing, lease flexibility, supply reliability and customer service. In times of weak demand or excess supply, leasing companies often respond by lowering leasing rates and increasing the logistical flexibility offered in their lease agreements. In addition, new entrants into the leasing business are often aggressive on pricing and lease flexibility. Furthermore, customers also have the option to purchase intermodal equipment and utilize owned equipment instead of leasing, relying on their own fleets to satisfy their intermodal equipment needs and even leasing their excess container stock to other shipping companies.
While we are forced to compete aggressively on price, we attempt to emphasize our supply reliability and high level of customer service to our customers. We invest heavily to ensure adequate equipment availability in high demand locations, dedicate large portions of our organization to building customer relationships and maintaining close day-to-day coordination with customers' operating staffs, and have developed powerful and user-friendly systems that allow our customers to transact with us through the Internet.
Suppliers
We have long-standing relationships with all of our major suppliers. We purchase most of our containers and chassis in China. There are
five
large manufacturers of dry containers and
four
large manufacturers of refrigerated containers, though for both dry containers and refrigerated containers, the largest manufacturer accounts for more than
40%
of global production volume. Our procurement and engineering staff reviews the designs for our containers and periodically audits the production facilities of our suppliers. In addition, we use our Asian procurement and engineering group and third-party inspectors to visit factories when our containers are being produced to provide an extra layer of quality control. Nevertheless, defects in our containers sometimes occur. We work with the manufacturers to correct these defects, and our manufacturers have generally honored their warranty obligations in such cases.
Systems and Information Technology
The efficient operation of our business is highly dependent on our information technology system to track transactions, bill customers and provide the information needed to report our financial results. Our system allows customers to place pick-up and drop-off orders on the Internet, view current inventories and check contractual terms in effect with respect to any given container lease agreement. Our system also maintains a database, which accounts for the containers in our fleet and our leasing agreements, processes leasing and sale transactions, and bills our customers for their use of and damage to our containers. The Company also uses the information provided by these systems in our day-to-day business to make business decisions and improve our operations and customer service.
Segments
We operate our business in one industry, intermodal transportation equipment, and have two business segments, which also represent our reporting segments:
10
|
•
|
Equipment leasing—Our equipment leasing operations include the acquisition, leasing, re-leasing and ultimate sale of multiple types of intermodal transportation equipment, primarily intermodal containers.
|
|
•
|
Equipment trading—We purchase containers from shipping line customers, and other sellers of containers, and resell these containers to container retailers and users of containers for storage or one-way shipment.
|
Environmental
We face a number of environmental concerns, including potential liability due to accidental discharge from our containers, potential equipment obsolescence or retrofitting expenses due to changes in environmental regulations, and increased risk of container performance problems due to container design changes driven by environmental factors. While we maintain environmental liability insurance coverage, and the terms of our leases and other arrangements for use of our containers place the responsibility for environmental liability on the end user, we still may be subject to environmental liability in connection with our current or historical operations. In certain countries like the United States, the owner of a leased container may be liable for the costs of environmental damage from the discharge of the contents of the container even though the owner is not at fault. Our lessees are required to indemnify us from environmental claims and our standard master tank container lease agreement insurance clause requires our tank container lessees to provide pollution liability insurance.
We also face risks from changing environmental regulations, particularly with our refrigerated container product line. Many countries, including the United States, restrict, prohibit or otherwise regulate the use of chemical refrigerants due to their ozone depleting and global warming effects. . Our refrigerated containers currently use 404A or R134A refrigerant. While 404A and R134A do not contain hydrochlorofluorocarbons ("CFCs"), which have been restricted since 1995, the European Union ("EU") has instituted regulations beginning in 2011 to phase out the use of R134A in automobile air conditioning systems due to concern that the release of R134A into the atmosphere may contribute to global warming. While the EU regulations do not currently restrict the use of 404A or R134A in refrigerated containers or trailers, it has been proposed that, beginning in 2020 and 2025, respectively, 404A and R134A usage in refrigerated containers may be banned, although the final decision has not yet been made. Further, certain manufacturers of refrigerated containers, including the largest manufacturer of cooling machines for refrigerated containers, have begun testing units that utilize alternative refrigerants, such as R513a and H1234YF, as well as natural refrigerants such as propane and carbon dioxide, that may have less global warming potential than 404A and R134A. If future regulations prohibit the use or servicing of containers using 404A or R134A refrigerants, we could be forced to incur large retrofitting expenses. In addition, refrigerated containers that are not retrofitted may become difficult to lease, command lower rental rates and disposal prices, or may have to be scrapped.
Historically, the foam insulation in the walls of intermodal refrigerated containers required the use of a blowing agent that contains CFCs, specifically HCFC-141b. The manufacturers producing our refrigerated containers have eliminated the use of this blowing agent in the manufacturing process, but a large number of our refrigerated containers manufactured prior to 2014 contain these CFCs. The EU prohibits the import and the placing on the market in the EU of intermodal containers with insulation made with HCFC-141b (“EU regulation”). However, we believe international conventions governing free movement of intermodal containers allow the use of such intermodal refrigerated containers in the EU if they have been admitted into EU countries on temporary customs admission. Each country in the EU has its own individual and different regulations, and we have procedures in place that we believe comply with the relevant EU and country regulations. However, if such intermodal refrigerated containers exceed their temporary customs admission period and/or their custom admissions status changes (e.g., should such container be off-hired) and such intermodal refrigerated containers are deemed placed on the market in the EU, or if our procedures are deemed not to comply with EU or a country’s regulation, we could be subject to fines and penalties. Also, if future international conventions or regulations prohibit the use or servicing of containers with foam insulation that utilized this blowing agent during the manufacturing process, we could be forced to incur large retrofitting expenses and those containers that are not retrofitted may become more difficult to lease and command lower rental rates and disposal prices.
An additional environmental concern affecting our operations relates to the construction materials used in our dry containers. The floors of dry containers are plywood usually made from tropical hardwoods. Due to concerns regarding de-forestation of tropical rain forests and climate change, many countries which have been the source of these hardwoods have implemented severe restrictions on the cutting and export of these woods. Accordingly, container manufacturers have switched a significant portion of production to more readily available alternatives such as birch, bamboo, and other farm-grown wood species. Container users are also evaluating alternative designs that would limit the amount of plywood required and are also considering possible synthetic materials to replace the plywood. These new woods or other alternatives have not proven their durability over the typical 13-15 year life of a dry container, and if they cannot perform as well as the hardwoods have historically, the future repair and operating costs for these containers could be significantly higher and the useful life of the containers may be decreased.
The paint systems used for dry containers have recently been modified for environmental reasons. Container manufacturers have replaced solvent-based paint systems with water-based paint systems for dry container production. Water-based paint systems
11
require more time and care for proper application, and there is an increased risk that the paint will not adhere properly to the steel for the expected useful life of the containers. Poor paint coverage leads to premature rusting, increased maintenance cost over the life of the container and could result in a shorter useful life. If water-based paint applications cannot perform as well as the solvent-based applications have historically, the future repair and operating costs for these containers could be significantly higher and the useful life of the containers may be decreased.
Currency
The U.S. dollar is the operating currency for the large majority of our leases and obligations, and most of our revenues and expenses are denominated in U.S. dollars. However, we pay our subsidiaries' non-U.S. staff in local currencies, and our direct operating expenses and disposal transactions for our older containers are often structured in foreign currencies. We record realized and unrealized foreign currency exchange gains and losses primarily due to fluctuations in exchange rates related to our Euro and Pound Sterling transactions and related assets and liabilities.
Employees
As of
December 31, 2018
, we employed
243
people in
23
offices, in
16
countries. We believe that our relations with our employees are good and we are not a party to any collective bargaining agreements.
12
ITEM 1A. RISK FACTORS
Our business, financial condition and results of operations are subject to various risks and uncertainties noted throughout this report including those discussed below, which may affect the value of our securities. In addition to the risks discussed below, which we believe to be the most significant risks facing the Company, there may be additional risks not presently known to us or that we currently deem less significant that also may adversely affect our business, financial condition and results of operations, possibly materially. Some statements in our risk factors constitute forward-looking statements. Please refer to the section entitled “Cautionary Note Concerning Forward-Looking Statements” in this report.
Container leasing demand can be negatively affected by numerous market factors as well as external political and economic events that are beyond our control. Decreasing leasing demand could have a material adverse effect on our business, financial condition, results of operations and cash flows.
Demand for containers depends largely on the rate of world trade and economic growth. Demand for leased containers is also driven by our customers’ “lease vs. buy” decisions. Cyclical recessions, tariffs and other trade actions, and political instability can negatively affect lessors’ operating results because during economic downturns or periods of reduced trade, shipping lines tend to lease fewer containers, or lease containers only at reduced rates, and tend to rely more on their own fleets to satisfy a greater percentage of their requirements. As a result, during periods of weak global economic activity, container lessors typically experience decreased leasing demand, decreased equipment utilization, lower average rental rates, decreased leasing revenue, decreased used container resale prices and significantly decreased profitability. These effects can be severe.
For example, our profitability decreased significantly from the third quarter of 2008 to the third quarter of 2009 due to the effects of the global financial crisis. In 2015 and for the first half of 2016, our operating performance and profitability were negatively impacted due to slower global trade growth resulting in reduced demand for leased containers, higher operating costs and decreasing utilization, lease rental revenue and used container sales prices.
Other general factors affecting demand for leased containers and our container utilization include:
|
•
|
the available supply and prices of new and used containers;
|
|
•
|
changes in economic conditions, the operating efficiency of customers and competitive pressures in the shipping industry;
|
|
•
|
the availability and terms of equipment financing for customers;
|
|
•
|
fluctuations in interest rates and foreign currency values;
|
|
•
|
import/export tariffs and restrictions, and customs procedures;
|
|
•
|
foreign exchange controls; and
|
|
•
|
other governmental regulations and political or economic factors that are inherently unpredictable and may be beyond our control.
|
Any of the aforementioned factors may have a material adverse effect on our business, financial condition, results of operations and cash flows.
Increased tariffs or other trade actions could adversely affect our business, financial conditions and results of operations.
The international nature of the container industry exposes us to risks relating to the imposition of import and export duties and quotas and domestic and foreign customs and tariffs. These risks have increased recently due to trade actions taken by the United States and China that have led to increased tariffs on goods traded between these two countries, and the United States has threatened to further increase tariffs if certain demands are not met. Given the importance of the United States and China in the global economy, these increased tariffs could significantly reduce the volume of goods traded internationally and reduce the rate of global economic growth, leading to decreased demand for leased containers, lower new container prices and decreased market leasing rates. These impacts could have a materially adverse effect on our business, financial condition and results of operations.
Our customers may decide to lease fewer containers. Should shipping lines decide to buy a larger percentage of the containers they operate, our utilization rate and level of investment would decrease, resulting in decreased leasing revenues, increased storage costs, increased repositioning costs and lower growth.
We, like other suppliers of leased containers, are dependent upon decisions by shipping lines to lease rather than buy their container equipment. Should shipping lines decide to buy a larger percentage of the containers they operate, our utilization rate would decrease, resulting in decreased leasing revenues, increased storage costs and increased positioning costs. A decrease in the
13
portion of leased containers operated by shipping lines would also reduce our investment opportunities and significantly constrain our growth. Most of the factors affecting the lease vs. buy decisions of our customers are outside of our control.
Until recently, many widely-used accounting standards such as Generally Accepted Accounting Principles ("GAAP") and International Financial Reporting Standards ("IFRS") generally did not require operating leases to be presented on the balance sheet, which resulted in a lower level of reported financial leverage for leased containers relative to containers purchased with debt. This difference in accounting treatment may have been a factor in shipping lines' decisions to lease rather than buy. For reporting periods beginning in 2019, new guidance for operating leases require the recognition of a right-of-use (“ROU”) asset and corresponding lease liability on the lessee’s balance sheet. Additionally, the International Accounting Standards Board has issued similar changes to lease accounting under IFRS 16 Leases. Adoption of the standard under GAAP and/or IFRS may impact our existing or potential customer’s willingness to enter into leases, the duration of our leases, or the economic decision to purchase or lease containers.
Market lease rates may decrease due to a decrease in new container prices, weak leasing demand, increased competition or other factors, resulting in reduced revenues, lower margins, and reduced profitability and cash flows.
Market leasing rates are typically a function of, among other things, new equipment prices (which are heavily influenced by steel prices in China), interest rates, the type and length of the lease, and the equipment supply and demand balance at a particular time and location. A decrease in leasing rates can have a materially adverse effect on our leasing revenues, profitability and cash flow.
A decrease in market leasing rates negatively impacts the leasing rates on both new container investments and the existing containers in our fleet. Most of our existing containers are on operating leases, which means that the lease term is shorter than the expected life of the container, so the lease rate we receive for the container is subject to change at the expiration of the current lease. As a result, during periods of low market lease rates, the average lease rate received for our containers is negatively impacted by both the addition of new containers at low lease rates as well as, and more significantly by, the turnover of existing containers from leases with higher lease rates to leases with lower lease rates.
Market leasing rates decreased during the fourth quarter of 2018 due to a decrease in new container prices and aggressive competition among leasing companies, and as of December 31, 2018, market leasing rates were below the average leasing rates in our lease portfolio. In addition, the portion of our containers on expired leases increased in 2018, increasing the number of containers that could be subject to negative lease re-pricing. If market lease rates remain below our portfolio lease rates for an extended period of time, as they did in 2015 and 2016, such lower average lease rates could materially impact our leasing revenue and profitability.
Market conditions for container lessors have been extremely volatile.
Market conditions and the operating and financial performance of container leasing companies have been extremely volatile. Market conditions such as steel and new container prices, global containerized trade growth, market lease rates and used container sale prices were strong from 2010 through 2014, driving a high level of profitability for container leasing companies. Market conditions subsequently deteriorated rapidly in 2015 and 2016, leading to a significant erosion in our operating and financial performance. Market conditions rebounded at the end of 2016 and remained favorable through 2017 and 2018, leading to a recovery in our operating and financial performance. However, there is no assurance this will continue. A reversal in market conditions back to the difficult conditions faced in 2015 and 2016, would lead to decreased profitability, reduced cash flows and a deterioration in our financial position.
We face significant credit risk. Lessee defaults adversely affect our business, financial condition, results of operations and cash flow by decreasing revenues and increasing storage, positioning, collection, recovery and lost equipment expenses. The risk of lessee defaults is currently elevated due to sustained excess vessel capacity and the resulting poor financial performance for most of our shipping line customers.
Our containers and chassis are leased to numerous customers. Lease rentals and other charges, as well as indemnification for damage to or loss of equipment, are payable under the leases and other arrangements by the lessees. Inherent in the nature of the leases and other arrangements for use of the equipment is the risk that once the lease is consummated, we may not receive, or may experience delay in receipt of, all of the amounts to be paid in respect of the equipment. A delay or diminution in amounts received under the leases and other arrangements could adversely affect our business and financial prospects and our ability to make payments on debt. In addition, not all of our customers provide detailed financial information regarding their operations. As a result, customer
14
credit risk is in part assessed on the basis of their reputation in the market, and there can be no assurance that they can or will fulfill their obligations under the contracts we enter into with them. Our customers could incur financial difficulties, or otherwise have difficulty making payments to us when due, for any number of factors that may be beyond our control and which we may be unable to anticipate.
The cash flow from our equipment, principally lease rentals, management fees and proceeds from the sale of owned equipment, is affected significantly by our ability to collect payments under leases and other arrangements for the use of the equipment and our ability to replace cash flows from terminating leases by re-leasing or selling equipment on favorable terms. All of these factors are subject to external economic conditions and performance by lessees and service providers that are beyond our control.
In addition, when lessees or sub-lessees of our containers and chassis default, we may fail to recover all of our equipment, and the containers and chassis we do recover may be returned in damaged condition or to locations where we will not be able to efficiently re-lease or sell them. As a result, we may have to repair and reposition these containers and chassis to other places where we can re-lease or sell them and we may lose lease revenues and incur additional operating expenses in repossessing, repositioning and storing the equipment.
We also often incur extra costs when repossessing containers from a defaulting lessee. These costs typically arise when our lessee has also defaulted on payments owed to container terminals or depot facilities where the repossessed containers are located. In such cases, the terminal or depot facility will sometimes seek to have us repay a portion of the unpaid bills as a condition before releasing the containers back to us.
The likelihood of lessee defaults remains elevated. The container shipping industry has been suffering for several years from excess vessel capacity and low freight rates. Most of our customers generated financial losses in 2018 and many are burdened by high levels of debt. Ongoing deliveries of fuel efficient mega vessels will likely continue to pressure freight rates and our customers’ profitability. In addition, the implementation of the IMO 2020 global sulfur cap regulations is likely to increase the financial pressures on shipping lines. These regulations will require our customers to either purchase more expensive, low sulfur fuel or invest large amounts to install sulfur scrubbers for their existing ships. These extra expenses and investments could create significant additional financial burdens for our customers.
We experienced a major lessee default in 2016 when Hanjin Shipping Co. ("Hanjin") filed for court protection and immediately began a liquidation process. At that time, we had approximately
87,000
containers on lease to Hanjin with a net book value of $
243.3
million. We recorded a loss of $
29.7
million during the third quarter ended September 30, 2016, comprised of bad debt expense and a charge for costs not expected to be recovered due to deductibles in credit insurance policies. The impact of the Hanjin bankruptcy was significantly lessened by credit insurance policies in place during 2016 which covered the value of containers that are unrecoverable, cost incurred to recover containers and a portion of lost lease revenue. We have not been able to renew the credit insurance at levels considered to be economical and may not be able to obtain such insurance in the future.
Our balance sheet includes an allowance for doubtful accounts as well as an equipment reserve related to the expected costs of recovering and remarketing containers currently in the possession of customers that have either defaulted or that we believe currently present a significant risk of loss. However, we do not maintain a general equipment reserve for equipment on-hire under operating leases to performing customers. As a result, any major customer default could have a significant impact on our profitability upon such default. Such a default could also have a material adverse effect on our business condition and financial prospects.
Our customer base highly is concentrated. A default from any of our largest customers, and especially our largest customer, would have a material adverse effect on our business, financial condition and future prospects. In addition, a significant reduction in leasing business from any of our large customers could have a material adverse impact on demand for our containers and our financial performance.
Our
five
largest customers represented approximately
54%
of our lease billings in
2018
, with our single largest customer,
CMA CGM S.A.
, representing approximately
20%
of lease billings in 2018, and our second largest customer
Mediterranean Shipping Company S.A.
, representing approximately
14%
of lease billings in 2018. Furthermore, the shipping industry has been consolidating for a number of years, and further consolidation is expected and could increase the portion of our revenues that come from our largest customers.
Given the high concentration of our customer base, a default by any of our largest customers would result in a major reduction in our leasing revenue, large repossession expenses, potentially large lost equipment charges and a material adverse impact on our performance and financial condition. In addition, the loss or significant reduction in orders from any of our major customers could
15
materially reduce the demand for our containers and result in lower leasing revenue, higher operating expenses and diminished growth prospects.
The implementation of new environmental regulations is expected to significantly increase the operating cost of our shipping line customers, further pressuring their financial performance and increasing our credit risk.
As of January 1, 2020, the International Maritime Organization regulation referred to as IMO 2020 will require all vessels to burn fuel with a sulfur content of no more than 0.5% unless fitted with an exhaust gas emissions cleaner (scrubber) capable of reducing sulfur emissions to 0.5% or less. Low sulfur fuel is considerably more expensive than high sulfur fuel and the alternative installation of scrubbers requires significant capital outlays. Whatever option a shipping line elects, the regulation will increase costs for our customers with no assurance that these added costs can be passed on via higher freight rates. If the shipping lines are unable to pass on these additional costs, our customers' financial performance will be further pressured which may negatively impact their ability to make payments to us when due and have an adverse effect on our business and financial condition.
Credit insurance may not be available in the future to help defer the costs of future credit defaults.
We have historically maintained credit insurance to help mitigate the cost and risk of lessee defaults. Those insurance policies typically covered the value of containers that were unrecoverable, cost incurred to recover containers and a portion of lost lease revenue. This insurance coverage reduced our loss resulting from the default of Hanjin, by approximately $
67.0
million.
However, in the aftermath of the Hanjin bankruptcy, the level of protection offered under this type of credit insurance has become much more limited and the cost of the more limited protection has increased substantially. We assessed the cost and level of credit insurance protection offered to the Company, determined that it is not economical and have allowed this credit insurance coverage to lapse. Accordingly, we may be forced to incur all of the losses resulting from future lessee defaults, significantly increasing the likelihood that a lessee default would have a material adverse impact on our profitability and financial condition.
Used container sales prices have been volatile. During periods of low used container sale prices, such as we experienced for much of 2015 and 2016, used container sale prices can fall below our accounting residual values, leading to losses on the disposal of our equipment.
Although our revenues primarily depend upon equipment leasing, our profitability is also affected by the gains or losses we realize on the sale of used containers because, in the ordinary course of our business, we sell certain containers when they are returned by customers upon lease expiration. The volatility of the selling prices and gains or losses from the disposal of such equipment can be significant. Used container selling prices, which can vary substantially, depend upon, among other factors, the cost of new containers, the global supply and demand balance for containers, the location of the containers, the supply and demand balance for used containers at a particular location, the physical condition of the container, refurbishment needs, materials and labor costs and obsolescence of certain equipment or technology. Most of these factors are outside of our control.
Containers are typically sold if it is in our best interest to do so after taking into consideration local and global leasing and sale market conditions and the age, location and physical condition of the container. As these considerations vary, gains or losses on sale of equipment will also fluctuate and may be significant if we sell large quantities of containers.
Used container selling prices and the gains or losses that we have recognized from selling used containers have varied widely. Selling prices for used containers and disposal gains were exceptionally high from 2010 to 2012 due to a tight global supply and demand balance for containers. Used container prices gradually declined from 2012 through 2014, then dropped steeply in 2015 and 2016 to levels below our estimated residual values, resulting in significant losses on sale of leasing equipment in 2016. Used container sale prices have rebounded since 2016, but there is no assurance this rebound in sale prices will be sustained. If disposal prices were to fall back below our residual values for an extended period, it would have a significantly negative impact on our financial performance and cash flow.
Equipment trading results have been highly volatile and are subject to many factors outside of our control.
The profitability of our equipment trading activities has varied widely, and our equipment trading results in 2018 were unusually strong. In 2018, we benefited from several block purchase transactions and our per-unit selling margins were supported by high sale values for older containers. Our ability to sustain a high level of equipment trading profitability will require securing large volumes of additional trading equipment and continuing to achieve high selling margins.
16
Several factors could limit our trading volumes. Shipping lines that have sold containers to us could develop other means for disposing their equipment or develop their own sales networks. In addition, we may limit our purchases if we have concerns that used container selling prices might decrease.
Our equipment trading results would also be negatively impacted by a reduction in our selling margins by increased competition for purchasing trading containers or by decreased sales prices. If sales prices rapidly deteriorate and we hold a large inventory of equipment that was purchased when prices for equipment were higher, then our gross margins could become negative
We face extensive competition in the container leasing industry.
We may be unable to compete favorably in the highly competitive container leasing and sales business. We compete with
six
other major leasing companies, many smaller container lessors, manufacturers of container equipment, companies offering finance leases as distinct from operating leases, promoters of container ownership and leasing as a tax shelter investment, shipping lines which sometimes lease their excess container stocks, and suppliers of alternative types of equipment for freight transport. Some of these competitors may have greater financial resources and access to capital than us. Additionally, some of these competitors may, at times, accumulate a high volume of underutilized inventories of containers, which could lead to significant downward pressure on lease rates and margins.
Competition among container leasing companies involves many factors, including, among others, lease rates, lease terms (including lease duration, and drop-off and repair provisions), customer service, and the location, availability, quality and individual characteristics of equipment. The highly competitive nature of our industry may reduce our lease rates and margins and undermine our ability to maintain our current level of container utilization or achieve our growth plans. In general, competition from other leasing companies becomes more intense following a period of strong performance, such as we experienced in 2017 and 2018. As a result, we expect increased competitive pressure.
We may incur future asset impairment charges.
An asset impairment charge may result from the occurrence of an adverse change in market conditions, unexpected adverse events or management decisions that impact our estimates of expected cash flows generated from our long-lived assets. We review our long-lived assets, including our container and chassis equipment, goodwill and other intangible assets for impairment, when events or changes in circumstances indicate that the carrying value of an asset may not be recoverable. We may be required to recognize asset impairment charges in the future as a result of reductions in demand for specific container and chassis types, a weak economic environment, challenging market conditions, events related to particular customers or asset types, or as a result of asset or portfolio sale decisions by management.
The likelihood that we could incur asset impairment charges increases during periods of low new container prices, low market lease rates and low used container selling prices. These conditions existed in the industry for much of 2015 and 2016. There is no assurance these conditions will not return.
In addition, while used container selling prices are currently above our estimated residual values, they are extremely volatile and if disposal prices fall back below our residual values for an extended period, we would likely need to revise our estimates for residual values. Decreasing estimates for residual values would result in an immediate impairment charge on containers older than the estimated useful life in our depreciation calculations, and would result in increased depreciation expense for all of our other containers in subsequent periods. Asset impairment charges could significantly impact our profitability and could potentially cause us to breach the financial covenants contained in some or all of our debt agreements. The impact of asset impairment charges and a potential covenant default could be severe.
Financing may become more difficult to arrange and more expensive. If we are unable to finance capital expenditures efficiently, our business and growth plans will be adversely affected.
We expect to make capital investments to, among other things, maintain and expand the size of our container fleet. If we are unable to raise sufficient debt financing, we may be unable to achieve our targeted level of investment and growth. In addition, if our financing costs increase, we may be unable to pass along the higher cost of financing to our customers through higher per diem lease rates, which would reduce the profit margin and investment returns on new container investments.
During the difficult market environment in 2015 and 2016, many lenders to the container leasing industry became more cautious, decreasing our sources of available debt financing and increasing our borrowing costs. Financing availability and costs
17
have since improved, but there is no assurance this will continue. In addition, we are the largest container leasing exposure for many of our lenders, and the amount of incremental loans available from our existing lenders may become constrained due to single-name credit limitations.
In addition, our financing capacity could decrease, our financing costs and interest rates could increase, or our future access to the financial markets could be limited, as a result of other risks and contingencies, many of which are beyond our control, including: (i) the acceptance by credit markets of the structures and structural risks associated with our bank financing, private placement financing and asset-backed financing arrangements; (ii) the credit ratings provided by credit rating agencies for our corporate rating and those of our special purpose funding entities; (iii) third parties requiring changes in the terms and structure of our financing arrangements, including increased credit enhancements (such as lower advance rates) or required cash collateral and/or other liquid reserves; or (iv) changes in laws or regulations that negatively impact the terms on which the banks or other creditors may finance us. If we are unsuccessful in obtaining sufficient additional financing on acceptable terms, on a timely basis, or at all, such changes could have a material adverse effect on our liquidity, interest costs, financial condition, cash flows and results of operations.
We have a substantial amount of debt outstanding on a consolidated basis and have significant debt service requirements. This increases the risk that adverse changes in our operating performance, our industry or the financial markets could severely diminish our financial performance and future business and growth prospects, and increases the chance that we might face insolvency due to a default on our debt obligations.
As of December 31,
2018
, we had outstanding indebtedness of approximately
$7,529.4 million
under our debt facilities. Total interest and debt expense for the year ended December 31,
2018
was
$322.7 million
.
Our substantial amount of debt could have important consequences for investors, including:
|
•
|
making it more difficult for us to satisfy our obligations with respect to our debt facilities. Any failure to comply with such obligations, including a failure to make timely interest or principal payments, or a breach of financial or other restrictive covenants, could result in an event of default under the agreements governing such indebtedness, which could lead to, among other things, an acceleration of our indebtedness or foreclosure on the assets securing our indebtedness and which could have a material adverse effect on our business, financial condition, future prospects and solvency;
|
|
•
|
requiring us to dedicate a substantial portion of our cash flow from operations to make payments on our debt, thereby reducing funds available for operations, capital expenditures, future business opportunities and other purposes;
|
|
•
|
limiting our flexibility in planning for, or reacting to, changes in our business and the industry in which we operate;
|
|
•
|
limiting our ability to borrow additional funds, or to sell assets to raise funds, if needed, for working capital, capital expenditures, acquisitions or other purposes;
|
|
•
|
making it difficult for us to pay dividends on our common shares;
|
|
•
|
increasing our vulnerability to general adverse economic and industry conditions, including changes in interest rates; and
|
|
•
|
placing us at a competitive disadvantage compared to our competitors having less debt.
|
Additionally, we may not be able to refinance any of our indebtedness on commercially reasonable terms or at all. If we cannot refinance our indebtedness, we may have to take actions such as selling assets, seeking equity capital or reducing or delaying future capital expenditures or other business investments, which could have a material adverse impact on our growth rate, profitability and cash flow. Such actions, if necessary, may not be effected on commercially reasonable terms or at all. Our indebtedness may restrict our ability to sell assets and use the proceeds from such sales in certain ways.
Possible replacement of the LIBOR benchmark interest rate may have an impact on our business.
On July 27, 2017, the U.K. Financial Conduct Authority (the “FCA”), which regulates LIBOR, announced that it will no longer persuade or compel banks to submit rates for the calculation of LIBOR rates after 2021. As a result, LIBOR may be discontinued after 2021. The FCA and the submitting LIBOR banks have indicated they will support the LIBOR indices through 2021 to allow for an orderly transition to an alternative reference rate. Financial services regulators and industry groups are evaluating the phase-out of LIBOR and the development of alternate reference rate indices or reference rates.
As of December 31, 2018, we had
$2,997.4
million of total debt outstanding on facilities with interest rates based on floating rate indices, LIBOR. In addition, we had
$1,565.6
million notional value of interest rate swaps in place that are indexed to LIBOR. Potential changes to the underlying floating rate indices and reference rates may have an adverse impact on our assets or liabilities indexed to LIBOR and could have a material adverse effect on our operating results and financial condition.
18
Despite our substantial leverage, we and our subsidiaries may be able to incur additional indebtedness. This could further exacerbate the risks described above.
We may incur substantial additional indebtedness in the future. To the extent that new indebtedness is added to current debt levels, the risks described above would increase.
We will require a significant amount of cash to service and repay our outstanding indebtedness. This may limit our ability to fund future capital expenditures, pursue future business opportunities, make acquisitions or return cash to our shareholders.
Our high level of indebtedness requires us to make large interest and principal payments. These debt service payments will represent a significant portion of our cash flow, and if our operating cash flow decreases in the future, or if it becomes more difficult for us to arrange financing to refinance existing debt facilities, our ability to finance capital expenditures, pursue future business opportunities or return cash to our shareholders could be severely limited.
Our credit facilities impose significant operating and financial restrictions, which may prevent us from pursuing certain business opportunities and taking certain actions.
Our asset-backed securities, institutional notes and other credit facilities impose, and the terms of any future indebtedness may impose, significant operating, financial and other restrictions on the Company and our subsidiaries. These restrictions may limit or prohibit, among other things, our ability to:
|
•
|
incur additional indebtedness;
|
|
•
|
pay dividends on or redeem or repurchase our shares;
|
|
•
|
issue additional share capital;
|
|
•
|
make loans and investments;
|
|
•
|
create liens;
|
|
•
|
sell certain assets or merge with or into other companies;
|
|
•
|
enter into certain transactions with our shareholders and affiliates;
|
|
•
|
cause our subsidiaries to make dividends, distributions and other payments to us; and
|
|
•
|
otherwise conduct necessary corporate activities.
|
These restrictions could adversely affect our ability to finance our future operations or capital needs and pursue available business opportunities. A breach of any of these restrictions could result in a default in respect of the related indebtedness. If a default occurs, the relevant lenders could elect to declare the indebtedness, together with accrued interest and fees, to be immediately due and payable and proceed against any collateral securing that indebtedness, which under certain circumstances could constitute substantially all of our container assets.
We have a complex debt structure with numerous credit facilities containing various non-financial covenants which are not standardized between facilities. This increases the risk of a technical default that could lead to the acceleration of our repayment obligations in certain instances.
We have a significant number credit facilities containing numerous non-financial covenants, such as, but not limited to, reporting and notification requirements, which are not standardized between facilities requiring extensive monitoring and compliance. Failure to comply with any of these non-financial covenants could result in an event of default, which could trigger cross-defaults of multiple facilities. Should we fail to comply with any of these non-financial covenants we may be unable to obtain waivers and lenders could accelerate our debt repayment obligations and proceed against any collateral securing that indebtedness.
Environmental regulations may result in equipment obsolescence or require substantial investments to retrofit existing equipment. Additionally, environmental concerns are leading to significant design changes for new containers that have not been extensively tested, which increases the likelihood that we could face technical problems.
Many countries, including the United States, restrict, prohibit or otherwise regulate the use of chemical refrigerants due to their ozone depleting and global warming effects. Our refrigerated containers currently use 404A or R134A refrigerant. While 404A and R134A do not contain hydrochlorofluorocarbons (CFCs), which have been restricted since 1995, the EU has instituted regulations beginning in 2011 to phase out the use of R134A in automobile air conditioning systems due to concern that the release of R134A into the atmosphere may contribute to global warming. While the EU regulations do not currently restrict the use of 404A or R134A in refrigerated containers or trailers, it has been proposed that, beginning in 2020 and 2025, respectively, 404A and R134A usage in refrigerated containers may be banned, although the final decision has not yet been made. Further, certain
19
manufacturers of refrigerated containers, including the largest manufacturer of cooling machines for refrigerated containers, have begun testing units that utilize alternative refrigerants, such as R513a and H1234YF, as well as natural refrigerants such as propane and carbon dioxide, that may have less global warming potential than 404A and R134A. If future regulations prohibit the use or servicing of containers using 404A or R134A refrigerants, we could be forced to incur large retrofitting expenses. In addition, refrigerated containers that are not retrofitted may become difficult to lease, command lower rental rates and disposal prices, or may have to be scrapped.
Historically, the foam insulation in the walls of intermodal refrigerated containers required the use of a blowing agent that contains CFCs, specifically HCFC-141b. The manufacturers producing our refrigerated containers have eliminated the use of this blowing agent in the manufacturing process, but a large number of our refrigerated containers manufactured prior to 2014 contain these CFCs. The EU prohibits the import and the placing on the market in the EU of intermodal containers with insulation made with HCFC-141b (“EU regulation”). However, we believe international conventions governing free movement of intermodal containers allow the use of such intermodal refrigerated containers in the EU if they have been admitted into EU countries on temporary customs admission. Each country in the EU has its own individual and different regulations, and we have procedures in place that we believe comply with the relevant EU and country regulations. However, if such intermodal refrigerated containers exceed their temporary customs admission period and/or their custom admissions status changes (e.g., should such container be off-hired) and such intermodal refrigerated containers are deemed placed on the market in the EU, or if our procedures are deemed not to comply with EU or a country’s regulation, we could be subject to fines and penalties. Also, if future international conventions or regulations prohibit the use or servicing of containers with foam insulation that utilized this blowing agent during the manufacturing process, we could be forced to incur large retrofitting expenses and those containers that are not retrofitted may become more difficult to lease and command lower rental rates and disposal prices.
An additional environmental concern affecting our operations relates to the construction materials used in our dry containers. The floors of dry containers are plywood, usually made from tropical hardwoods. Due to concerns regarding the de-forestation of tropical rain forests and climate change, many countries which have been the source of these hardwoods have implemented severe restrictions on the cutting and export of these woods. Accordingly, container manufacturers have switched a significant portion of production to more readily available alternatives such as birch, bamboo, and other farm-grown wood species. Container users are also evaluating alternative designs that would limit the amount of plywood required and are also considering possible synthetic materials to replace the plywood. These new woods or other alternatives have not proven their durability over the typical 13 to 15 year life of a dry container, and if they cannot perform as well as the hardwoods have historically performed, the future repair and operating costs for these containers could be significantly higher and the useful life of the containers may be decreased.
For environmental reasons, container manufacturers have replaced solvent-based paint systems with water-based paint systems for dry container production. Water-based paint systems require more time and care for proper application, and there is an increased risk that the paint will not adhere properly to the steel for the expected useful life of the containers. Poor paint coverage leads to premature rusting, increased maintenance cost over the life of the container and could result in a shorter useful life. If water-based paint applications cannot perform as well as the solvent-based applications have historically performed, the future repair and operating costs for these containers could be significantly higher and the useful life of the containers may be decreased.
China has implemented regulations restricting the import of solid wastes, and these regulations are limiting the importation into China of old refrigerated containers destined for materials recycling. These regulations may limit the disposal demand for non-working refrigerated containers and could result in a decrease in refrigerated container disposal prices which could have a significant negative impact on our financial performance and cash flows.
Litigation to enforce our leases and recover our containers has inherent uncertainties. These uncertainties are increased for our containers located in jurisdictions that have less developed legal systems.
While almost all of our lease agreements are governed by New York or California law and provide for the non-exclusive jurisdiction of the courts located in the State of New York or the courts located in San Francisco, California or arbitration in San Francisco, California, the ability to enforce the lessees’ obligations under the leases and other arrangements for use of the containers often is subject to applicable laws in the jurisdiction in which enforcement is sought. It is not possible to predict, with any degree of certainty, the jurisdictions in which enforcement proceedings may be commenced. Our containers are manufactured primarily in China, and a substantial portion of our containers are leased out of Asia, primarily China, and are used by our customers in a wide range of global trades. Litigation and enforcement proceedings have inherent uncertainties in any jurisdiction and are expensive. These uncertainties are enhanced in countries that have less developed legal systems where the interpretation of laws and regulations is not consistent, may be influenced by factors other than legal merits and may be cumbersome, time-consuming and more expensive. For example, repossessing containers from defaulting lessees may be difficult and more expensive in
20
jurisdictions whose laws do not confer the same security interests and rights to creditors and lessors as those in the United States and where the legal systems are not as well developed. Additionally, even if we are successful in obtaining judgments against defaulting customers, these customers may have limited owned assets and/or heavily encumbered assets and the collection and enforcement of a monetary judgment against them may be unsuccessful. As a result, the remedies available and the relative success and expedience of collection and enforcement proceedings with respect to the containers in various jurisdictions cannot be predicted.
The success of our recovery efforts for defaulted leases has been hampered by undeveloped creditor protections and legal systems in a number of countries. In these situations, we experienced an increase in average recovery costs per unit and a decrease in the percentage of containers recovered in default situations primarily due to excessive charges applied to our containers by the depot or terminal facilities that had been storing the containers for the defaulted lessee. In these cases, the payments demanded by the depot or terminal operators often significantly exceeded the amount of storage costs that the Company would have reasonably expected to pay for the release of the containers. However, legal remedies were limited in many of the jurisdictions where the containers were being stored, and we were sometimes forced to accept the excessive storage charges to gain control of our containers. If the number and size of defaults increases in the future, and if a large percentage of the defaulted containers are being stored in countries with less developed legal systems, losses resulting from recovery payments and unrecovered containers could be large and our profitability significantly reduced.
Manufacturers of equipment may be unwilling or unable to honor manufacturer warranties covering defects in our equipment.
We obtain warranties from the manufacturers of equipment that we purchase. When defects in the containers occur we work with the manufacturers to identify and rectify the problems. However, there is no assurance that manufacturers will be willing or able to honor warranty obligations. In addition, manufactures warranties often do not cover the full expected life of our containers. If the manufacturer is unwilling or unable to honor warranties covering failures occurring within the warranty period or if defects are discovered in containers that are no longer covered by manufacturers’ warranties, we could be required to expend significant amounts of money to repair the containers, the useful lives of the containers could be shortened and the value of the containers reduced.
A shortage of mature tropical hardwood has forced manufacturers to use younger and alternative species of wood to make container floors. Manufacturers have switched a significant portion of production to more readily available alternatives such as birch, bamboo, bamboo-wood combined panels, and other farm-grown wood species. Container users are also evaluating alternative designs that would limit the amount of plywood required and are also considering possible synthetic materials to replace the plywood. These new woods or other alternatives have not proven their durability over the typical 13 to 15 year life of a dry container. It is likely that the number and magnitude of warranty claims related to premature floor failures will increase.
Another example relates to the Chinese Central Government imposing Volatile Organic Compound ("VOC") and Air Quality standards in South China in July 2016 and in all of China in April 2017. As a result of this standard, manufacturers changed from solvent-based paint systems to water-based paint systems. Water-based paint systems have not proven their durability over the typical 13 to 15 year life of a dry container in a marine environment. It is possible that the number and magnitude of warranty claims related to premature paint failures will increase.
If container manufacturers do not honor warranties covering these failures, or if the failures occur after the warranty period expires, we could be required to expend significant amounts of money to repair or sell containers earlier than expected. This could have a material adverse effect on our operating results and financial condition.
Changes in market price or availability of containers in China could adversely affect our ability to maintain our supply of containers.
The vast majority of intermodal containers are currently manufactured in China, and we currently purchase substantially all of our dry containers, special containers and refrigerated containers from manufacturers based there. In addition, the container manufacturing industry in China is highly concentrated. In the event that it were to become more expensive for us to procure containers in China because of further consolidation among container suppliers, a dispute with one of our manufacturers, increased tariffs imposed by the United States or other governments or for any other reason, we would have to seek alternative sources of supply. We may not be able to make alternative arrangements quickly enough to meet our equipment needs, and the alternative arrangements may increase our costs, reduce our profitability and make us less competitive in the market.
We may incur significant costs associated with relocation of leased equipment.
21
When lessees return equipment to locations where supply exceeds demand, containers are routinely repositioned to higher demand areas. Positioning expenses vary depending on geographic location, distance, freight rates and other factors. Positioning expenses can be significant if a large portion of our containers are returned to locations with weak demand.
We currently seek to limit the number of containers that can be returned to areas where demand for such containers is not expected to be strong. However, future market conditions may not enable us to continue such practices. In addition, we may not be successful in accurately anticipating which port locations will be characterized by weak or strong demand in the future, and current contracts will not provide much protection against positioning costs if ports that are expected to be strong demand ports turn out to be surplus container ports when the equipment is returned to such ports upon lease expiration. In particular, we could incur significant positioning costs in the future if trade flows change from net exports to net imports in locations such as the main ports in China that are currently considered to be high demand locations and where our leases typically allow large numbers of containers to be returned.
Sustained China and Asian economic, social or political instability could reduce demand for leasing.
Many of the shipping lines to which we lease containers are entities domiciled in Asian countries. In addition, many of our customers are substantially dependent upon shipments of goods exported from China and other Asian countries. From time to time, there have been economic disruptions, financial turmoil and political instability in this region. If these events were to occur again in the future, they could adversely affect our customers and lead to reduced demand for our containers or otherwise have an adverse effect on market conditions and our performance.
It may become more expensive for us to store our off-hire containers.
We are dependent on third-party depot operators to repair and store our equipment in port areas throughout the world. In many of these locations the land occupied by these depots is increasingly being considered as prime real estate. Accordingly, some depots are seeking to increase the rates we pay to store our containers, and some local communities are increasing restrictions on depot operations which increase their costs of operation and in some cases force depots to relocate to sites further from the port areas. Additionally, depots in prime locations may become filled to capacity based on market conditions and may refuse additional containers due to space constraints. As a result of these factors, the cost of maintaining and storing our off-hire containers could increase significantly.
We rely on our information technology systems to conduct our business. If there are disruptions and these systems fail to adequately perform their functions, or if we experience an interruption in our operation, our business and financial results could be adversely affected.
The efficient operation of our business is highly dependent on our information technology systems including our equipment tracking and billing systems and our customer interface systems. These systems allow customers to place pick-up and drop-off orders, view current inventory and check contractual terms in effect with respect to any given container lease agreement. These systems also process and track transactions, such as container pick-ups, drop-offs and repairs, and bill customers for the use of and damage to our equipment. If our information technology systems are damaged or an interruption is caused by a computer systems failure, viruses, fire, natural disasters or power loss, the disruption to our normal business operations and impact on our costs, competitiveness and financial results could be significant.
Security breaches and other disruptions could compromise our information technology systems and expose us to liability, which could cause our business and reputation to suffer.
In the ordinary course of our business, we will collect and store sensitive data on our systems and networks, including our proprietary business information and that of our customers and suppliers, and personally identifiable information of our customers and employees. The secure storage, processing, maintenance and transmission of this information is critical to our operations. Despite the security measures we employ, our information technology systems and networks may be vulnerable to attacks by hackers or breached due to employee error, malfeasance or other disruptions. Any such breach could compromise such systems and networks and the information stored therein could be accessed, publicly disclosed and/or lost or stolen. Any such access, disclosure or other loss of information could result in legal claims or proceedings, liability under laws that protect the privacy of personal information, disruption to our operations, damage to our reputation and/or loss of competitive position.
A number of key personnel are critical to the success of our business.
22
We have senior executives and other management level employees with extensive industry experience. We rely on this knowledge and experience in our strategic planning and in our day-to-day business operations. Our success depends in large part upon our ability to retain our senior management, the loss of one or more of whom could have a material adverse effect on our business. Our success also depends on our ability to retain our experienced sales force and technical personnel as well as to recruit new skilled sales, marketing and technical personnel. Competition for experienced managers in our industry can be intense. If we fail to retain and recruit the necessary personnel, our business and our ability to retain customers and provide acceptable levels of customer service could suffer.
The international nature of the container industry exposes us to numerous risks.
We are subject to risks inherent in conducting business across national boundaries, any one of which could adversely impact our business. These risks include:
|
•
|
regional or local economic downturns;
|
|
•
|
changes in governmental policy or regulation;
|
|
•
|
domestic and foreign customs and tariffs, import and export duties and quotas;
|
|
•
|
restrictions on the transfer of funds into or out of countries in which we operate;
|
|
•
|
compliance with U.S. Treasury and EU sanctions regulations restricting doing business with certain nations or specially designated nationals;
|
|
•
|
international incidents;
|
|
•
|
military conflicts;
|
|
•
|
government instability;
|
|
•
|
nationalization of foreign assets;
|
|
•
|
government protectionism;
|
|
•
|
compliance with export controls, including those of the U.S. Department of Commerce;
|
|
•
|
compliance with import procedures and controls, including those of the U.S. Department of Homeland Security;
|
|
•
|
potentially negative consequences from changes in tax laws;
|
|
•
|
requirements relating to withholding taxes on remittances and other payments by subsidiaries and customers;
|
|
•
|
labor or other disruptions at key ports;
|
|
•
|
difficulty in staffing and managing widespread operations;
|
|
•
|
difficulty in registering intellectual property or inadequate intellectual property protection in foreign jurisdictions; and
|
|
•
|
restrictions on our ability to own or operate subsidiaries, make investments or acquire new businesses in these jurisdictions.
|
Any one or more of these factors could impair our current or future international operations and, as a result, harm our overall business.
The lack of an international title registry for containers increases the risk of ownership disputes.
There is no internationally recognized system for recording or filing to evidence our title to containers nor is there an internationally recognized system for filing security interests in containers. Although this has not occurred to date, the lack of a title recordation system with respect to containers could result in disputes with lessees, end-users, or third parties who may improperly claim ownership of the containers.
Certain liens may arise on our containers.
Depot operators, container terminals, repairmen and transporters may come into possession of our containers from time to time and have sums due to them from the lessees or sublessees of the containers. In the event of nonpayment of those charges by the lessees or sublessees, we may be delayed in, or entirely barred from, taking possession of our containers, or we may be required to make payments or incur expenses to discharge such liens on the containers.
For example, in the aftermath of the Hanjin bankruptcy, we were forced to make substantial payments to container terminals, container depots and other parties who took possession of our containers previously on-hire to Hanjin and demanded to be reimbursed for payments owed to them by Hanjin as a condition for the release of our containers.
Changes in financial accounting standards or practices may cause adverse, unexpected financial reporting fluctuations and affect our reported operating results.
23
GAAP is subject to interpretation by the Financial Accounting Standards Board (the “FASB”), the SEC and various bodies formed to promulgate and interpret appropriate accounting principles. A change in accounting standards or practices can have a significant effect on our reported results and may even affect our reporting of transactions completed before the change is effective. New accounting pronouncements and varying interpretations of accounting pronouncements have occurred and may occur in the future. Changes to existing rules or the questioning of current practices may have a material adverse effect on our reported financial results or the way in which we conduct our business.
Because of our significant international operations, we could be materially adversely affected by violations of the U.S. Foreign Corrupt Practices Act, the U.K. Bribery Act and similar anti-corruption and anti-bribery laws and regulations.
We operate on a global basis, with the vast majority of our revenue generated from leasing our containers to lessees for use in international trade. We are also dependent on third-party depot operators to repair and store our containers in port locations throughout the world. Our business operations are subject to anti-corruption and anti-bribery laws and regulations, including restrictions imposed by the U.S. Foreign Corrupt Practices Act (the “FCPA”), the United Kingdom Bribery Act of 2010 (the “U.K. Bribery Act”), and the Bermuda Bribery Act 2016 (“Bermuda Bribery Act”). The FCPA, the U.K. Bribery Act, the Bermuda Bribery Act and similar anti-corruption and anti-bribery laws in other jurisdictions generally prohibit companies and their intermediaries and agents from making improper payments to government officials or any other persons for the purpose of obtaining or retaining business. Any determination of a violation or an investigation into violations of the FCPA, the U.K. Bribery Act, the Bermuda Bribery Act or similar anti-corruption and anti-bribery laws could have a material and adverse effect on our business, results of operations and financial condition.
A failure to comply with United States Treasury and other economic sanction laws and regulations and export control laws and regulations could have a material adverse effect on our business, results of operations or financial condition. We may be unable to ensure that our agents and/or customers comply with applicable sanctions and export control laws.
We face several risks inherent in conducting our business internationally, including compliance with applicable economic sanctions laws and regulations, such as laws and regulations administered by the U.S. Department of Treasury’s Office of Foreign Assets Control (“OFAC”), the U.S. Department of State and the U.S. Department of Commerce. We must also comply with all applicable export control laws and regulations of the United States (including but not limited to the U.S. Export Administration Regulations) and other countries. Any determination of a violation or an investigation into violations of export controls or economic sanctions laws and regulations could result in significant criminal or civil fines, penalties or other sanctions and repercussions, including reputational harm that could materially affect our business, results of operations or financial condition.
We may incur increased costs associated with the implementation of security regulations, which could have a material adverse effect on our business, financial condition, results of operations and cash flows.
We may be subject to regulations promulgated in various countries, including the United States, seeking to protect the integrity of international commerce and prevent the use of containers for international terrorism or other illicit activities. For example, the Container Safety Initiative, the Customs-Trade Partnership Against Terrorism and Operation Safe Commerce are among the programs administered by the U.S. Department of Homeland Security that are designed to enhance security for cargo moving throughout the international transportation system by identifying existing vulnerabilities in the supply chain and developing improved methods for ensuring the security of containerized cargo entering and leaving the United States. Moreover, the International Convention for Safe Containers, 1972 (CSC), as amended, adopted by the International Maritime Organization, applies to containers and seeks to maintain a high level of safety of human life in the transport and handling of containers by providing uniform international safety regulations. As these regulations develop and change, we may incur increased compliance costs due to the acquisition of new, regulation compliant containers and/or the adaptation of existing containers to meet any new requirements imposed by such regulations. Additionally, certain companies are currently developing or may in the future develop products designed to enhance the security of containers transported in international commerce. We may adopt such products and may incur increased costs, which could have a material adverse effect on our business, financial condition, results of operations and cash flows.
Terrorist attacks could negatively impact our operations and profitability and may expose us to liability and reputational damage.
Terrorist attacks may negatively affect our operations and profitability. Such attacks have contributed to economic instability in the United States, Europe and elsewhere, and further acts of terrorism, violence or war could similarly affect world trade and the industries in which we and our customers operate. In addition, terrorist attacks or hostilities may directly impact ports our containers enter and exit, depots, our physical facilities or those of our suppliers or customers and could impact our sales and our
24
supply chain. A severe disruption to the worldwide ports system and flow of goods could result in a reduction in the level of international trade and lower demand for our containers. The consequences of any terrorist attacks or hostilities are unpredictable, and we may not be able to foresee events that could have an adverse effect on our operations.
It is also possible that one of our containers could be involved in a terrorist attack. Although our lease agreements typically require our customers to indemnify us against all damages and liabilities arising out of the use of our containers and we carry insurance to potentially offset any costs in the event that our customer indemnifications prove to be insufficient, the insurance does not cover certain types of terrorist attacks and we may not be fully protected from liability or the reputational damage that could arise from a terrorist attack which utilizes one of our containers.
Environmental liability may adversely affect our business and financial situation.
We are subject to federal, state, local and foreign laws and regulations relating to the protection of the environment, including those governing the discharge of pollutants to air and water, the management and disposal of hazardous substances and wastes and the cleanup of contaminated sites. We could incur substantial costs, including cleanup costs, fines and third-party claims for property damage and personal injury, as a result of violations of or liabilities under environmental laws and regulations in connection with our current or historical operations. Under some environmental laws in the United States and certain other countries, the owner of a leased container may be liable for environmental damage, cleanup or other costs in the event of a spill or discharge of material from a container without regard to the owner’s fault. We have not yet experienced any such claims, although we cannot assure you that we will not be subject to such claims in the future. Liability insurance policies, including ours, usually exclude claims for environmental damage. Some of our lessees may have separate insurance coverage for environmental damage, but we cannot assure you that any such policies would cover or otherwise offset any liability we may have as the owner of a leased container.
Changes in U.S. tax rules as part of the 2017 U.S. tax legislation could negatively impact our income tax provisions or future cash tax payments.
Our subsidiaries record U.S. tax provisions in their financial statements. Certain of our U.S. subsidiaries currently do not pay meaningful U.S. income taxes primarily due to the benefit they currently receive from accelerated tax depreciation of their container investments. However, the changes in U.S. tax law passed on December 22, 2017 limiting the deductibility of interest expense above certain levels could increase our taxable income and lead to higher cash tax payments in the future.
A reduction in our level of continuing investment in our U.S. subsidiaries or future U.S. tax rule changes may negatively impact our income tax provisions or future cash tax payments.
Our U.S. subsidiaries record tax provisions in their financial statements. Certain of these subsidiaries currently do not pay any meaningful U.S. income taxes primarily due to the benefit they currently receive, and we expect they will continue to receive, from accelerated tax depreciation of their container investments. A change in the rules governing the tax depreciation for these U.S. subsidiaries’ containers, in particular, a change that increases the period over which they must depreciate their containers for tax purposes, could reduce or eliminate this tax benefit and significantly increase these U.S. subsidiaries’ cash tax payments.
In addition, even under current tax rules, these U.S. subsidiaries will need to make ongoing investments in new containers in order to continue to benefit from the tax deferral generated by accelerated tax depreciation. If these U.S. subsidiaries are unable to do so, the favorable tax treatment from accelerated tax depreciation would diminish, and they could face significantly increased cash tax payments.
In addition, our net deferred tax liability balance includes a deferred tax asset for U.S. federal and various states resulting from net operating loss carryforwards. A reduction to our future earnings, which will lower taxable income, may require the Company to record a charge against earnings in the form of a valuation allowance, if it is determined that it is more-likely-than-not that some or all of the loss carryforwards will not be realized.
Our U.S. investors could suffer adverse tax consequences if we are characterized as a passive foreign investment company for U.S. federal income tax purposes.
Based upon the nature of our business activities, we may be classified as a passive foreign investment company (“PFIC”) for U.S. federal income tax purposes. Such characterization could result in adverse U.S. tax consequences for direct or indirect U.S. investors in our common shares. For example, if we are a PFIC, our U.S. investors could become subject to increased tax liabilities
25
under U.S. tax laws and regulations and could become subject to burdensome reporting requirements. The determination of whether or not we are a PFIC is made on an annual basis and depends on the composition of our income and assets from time to time. Specifically, for any taxable year, we will be classified as a PFIC for U.S. tax purposes if either:
|
•
|
75% or more of the our gross income in a taxable year is passive income; or
|
|
•
|
the average percentage of our assets (which includes cash) by value in a taxable year which produce or are held for the production of passive income is at least 50%.
|
In applying these tests, we are treated as owning or generating directly our pro rata share of the assets and income of any corporation in which we own at least 25% by value. If you are a U.S. holder and we are a PFIC for any taxable year during which you own our common shares, you could be subject to adverse U.S. tax consequences. In such a case, under the PFIC rules, unless a U.S. holder is permitted to and does elect otherwise under the Code, such U.S. holder would be subject to special tax rules with respect to excess distributions and any gain from the disposition of our common shares. In particular, the excess distribution or gain will be treated as if it had been recognized ratably over the holder’s holding period for our common shares, and amounts allocated to prior years starting with our first taxable year during which we were a PFIC will be subject to U.S. federal income tax at the highest prevailing tax rates on ordinary income for that year plus an interest charge.
Based on the composition of our income, valuation of our assets and our election to treat certain of our subsidiaries as disregarded entities for U.S. federal income tax purposes, we do not expect that we should be treated as a PFIC for the current taxable year or for the foreseeable future. However, because the PFIC determination in our case is made by taking into account all of the relevant facts and circumstances regarding our business without the benefit of clearly defined bright line rules, it is possible that we may be a PFIC for any taxable year or that the U.S. Internal Revenue Service (the “IRS”) may challenge our determination concerning our PFIC status.
We may become subject to unanticipated tax liabilities that may have a material adverse effect on our results of operations.
We are a Bermuda company, and we believe that the income derived from our operations will not be subject to tax in Bermuda, which currently has no corporate income tax. We further believe that a significant portion of the income derived from our operations will not be subject to tax in many other countries in which our customers or containers are located. However, this belief is based on the anticipated nature and conduct of our business, which may change. It is also based on our understanding of the tax laws of the countries in which our customers use containers. The tax positions we take in various jurisdictions are subject to review and possible challenge by taxing authorities and to possible changes in law that may have retroactive effect.
Bermuda recently enacted the Economic Substance Act 2018 requiring affected Bermuda registered companies to maintain a substantial economic presence in Bermuda. While detailed guidelines have yet to be issued, this legislation could require us to incur substantial additional cost, and/or incur significant penalties and possibly require us to re-domicile our company to a jurisdiction with higher tax rates. Our results of operations could be materially and adversely affected if we become subject to these or other unanticipated tax liabilities.
The calculation of our income tax expense requires judgment and the use of estimates.
We periodically assess our tax positions based on current tax developments, including enacted statutory, judicial and regulatory guidance. In analyzing our overall tax position, consideration is given to the amount and timing of recognizing income tax liabilities and benefits. In applying the tax and accounting guidance to the facts and circumstances, income tax balances are adjusted as we consider appropriate through the income tax provision. We account for income tax positions on uncertainties by recognizing the effect of income tax positions only if those positions are more-likely-than-not of being sustained, and maintain reserves for income tax positions we believe are not more-likely-than-not of being sustained. Recognized income tax positions are measured at the largest amount that is greater than 50% likely of being realized. However, due to the significant judgment required in estimating those reserves, actual amounts paid, if any, could differ significantly from those estimates.
Fluctuations in foreign exchange rates could reduce our profitability.
While the majority of our revenues and costs are billed in U.S. dollars, our operations and used container sales in locations outside of the U.S. have exposure to foreign currency. Most of our non-U.S. dollar transactions are individually small amounts and in various denominations and thus are not suitable for cost-effective hedging. Fluctuations in the value of foreign currencies relative to the U.S. dollar can negatively impact our cash flow and profitability.
26
In addition, trade growth and the direction of trade flows can be influenced by large changes in relative currency values, potentially leading to decreased demand for our containers or increased container positioning costs.
Most of our equipment fleet is manufactured in China. Although the purchase price is typically in U.S. dollars, our manufacturers pay labor and other costs in the local currency, the Chinese yuan. To the extent that our manufacturers’ costs change due to changes in the valuation of the Chinese yuan, the dollar price we pay for equipment could be affected.
Our operations could be affected by natural or man-made events in the locations in which our customers or suppliers operate.
We have operations in locations subject to severe weather conditions, natural disasters, the outbreak of contagious disease, or man-made incidents such as chemical explosions, any of which could disrupt our operations. In addition, our suppliers and customers also have operations in such locations. For example, in 2011, the northern region of Japan experienced a severe earthquake followed by a series of tsunamis resulting in material damage to the Japanese economy. In 2015, a chemical explosion and fire in the port of Tianjin, China damaged or destroyed a small number of our containers and disrupted operations in the port. Similarly, outbreaks of pandemic or contagious diseases, such as H1N1 (swine) flu and the Ebola virus, could significantly reduce the demand for international shipping or could prevent our containers from being discharged in the affected areas or in other locations after having visited the affected areas. Any future natural or man-made disasters or health concerns in the world where we have business operations could lead to disruption of the regional and global economies, which could result in a decrease in demand for leased containers.
Increases in the cost of or the lack of availability of contingent liability, physical damage and directors' and officers’ liability insurance could increase our risk exposure and reduce our profitability.
Our lessees and depots are required to maintain all risks physical damage insurance, comprehensive general liability insurance and to indemnify us against loss. We also maintain our own contingent liability insurance and off-hire physical damage insurance. Nevertheless, lessees’ and depots’ insurance or indemnities and our future insurance may not fully protect us. The cost of such insurance may increase or become prohibitively expensive and such insurance may not continue to be available.
We also maintain directors' and officers' liability insurance. We may be required to incur substantial costs to maintain existing or increased levels of coverage or such coverage may not continue to be available, which would make it more difficult and expensive to attract and retain our directors and officers.
Labor activism and unrest, or failure to maintain satisfactory labor relations, could adversely affect our business, financial condition and results of operations.
Labor activism and unrest could materially adversely affect our operations and thereby materially adversely affect our financial condition and prospects. We may experience labor unrest, activism, disputes or actions in the future, some of which may be significant and could materially adversely affect our business, financial condition and results of operations.
The price of our common shares has been highly volatile and may decline regardless of our operating performance.
The trading price of our common shares has been and is likely to remain highly volatile. Factors affecting the trading price of our common shares may include:
|
•
|
broad market and industry factors including global and political instability, trade actions, and interest rate and currency changes;
|
|
•
|
variations in our financial results;
|
|
•
|
changes in financial estimates or investment recommendations by securities analysts following our business;
|
|
•
|
the public's response to our press releases, other public announcements and filings with the SEC;
|
|
•
|
changes in accounting standards, policies, guidance or interpretations or principles;
|
|
•
|
future sales of common shares by our directors, officers and significant shareholders;
|
|
•
|
announcements of technological innovations or enhanced or new products by us or our competitors;
|
|
•
|
the failure to achieve operating results consistent with securities analysts’ projections;
|
|
•
|
the operating and stock price performance of other companies that investors may deem comparable to us;
|
|
•
|
changes in our dividend policy and share repurchase programs;
|
|
•
|
fluctuations in the worldwide equity markets;
|
|
•
|
recruitment or departure of key personnel;
|
|
•
|
failure to timely address changing customer preferences; and
|
27
|
•
|
other events or factors, including those resulting from, the perceived or actual threat of impending natural disasters, coups, missile launches, terrorism or war, as well as the actual occurrence of such events or responses to such events.
|
In addition, if the market for intermodal equipment leasing company stocks or the stock market in general experiences a loss of investor confidence, the trading price of our common shares could decline for reasons unrelated to our business or financial results. The trading price of our common shares might also decline in reaction to events that affect other companies in our industry even if these events do not directly affect us.
If securities analysts do not publish research or reports about our business or if they downgrade our shares, the price of our common shares could decline.
The trading market for our common shares relies in part on the research and reports that industry or financial analysts publish about us, our business or our industry. We have no influence or control over these analysts. Furthermore, if one or more analysts covering our Company downgrades our shares, the price of our shares could decline. If one or more of these analysts ceases coverage of us, we could lose visibility in the market, which in turn could cause our share price to decline.
Our failure to comply with required public company corporate governance and financial reporting practices and regulations could materially and adversely impact our financial condition, operating results and the price of our common shares. Further, our internal controls over financial reporting may not detect all errors or omissions in the financial statements.
We are subject to the regulatory compliance and reporting requirements applicable to us as a public company, including those issued by the Securities and Exchange Commission (the "SEC") and the New York Stock Exchange (the "NYSE"). Failure to meet these requirements may lead to adverse regulatory consequences, and could lead to defaults under our loan agreements or a negative reaction in the financial markets due to a loss of confidence in the reliability of our financial statements. If we fail to maintain effective controls and procedures, we may be unable to provide the required financial information in a timely and reliable manner or otherwise comply with the standards applicable to us as a public company. Any failure to timely provide the required financial information could materially and adversely impact our financial condition and the market value of our common shares. Furthermore, testing and maintaining internal controls can divert our management’s attention from other matters that are important to our business.
The Sarbanes-Oxley Act of 2002, as amended (the “Sarbanes-Oxley Act”), requires that we maintain effective internal controls for financial reporting and disclosure controls and procedures. If we do not maintain compliance with the requirements of Section 404 of the Sarbanes-Oxley Act, or if we or our independent registered public accounting firm identifies deficiencies in our internal controls over financial reporting that are deemed to be material weaknesses, we could suffer a loss of investor confidence in the reliability of our financial statements, which could cause the market price of our shares to decline. We can also be subject to sanctions or investigations by the NYSE, the SEC or other regulatory authorities for failure to comply with public company corporate governance and financial reporting practices and regulations.
Section 404 of the Sarbanes-Oxley Act requires an annual management assessment of the effectiveness of internal controls over financial reporting and a report by our independent registered public accounting firm on the effectiveness on such internal controls. If we fail to maintain the adequacy of internal controls over financial accounting, we may not be able to conclude on an ongoing basis that we have effective internal controls over financial reporting in accordance with the Sarbanes-Oxley Act and related regulations. No system of internal controls can provide absolute assurance that the financial statements are accurate and free of material errors. As a result, the risk exists that our internal controls may not detect all errors or omissions in the financial statements.
Changes in laws and regulations could adversely affect our business.
All aspects of our business, including leasing, pricing, sales, litigation and intellectual property rights are subject to extensive legislation and regulation. Changes in applicable federal and state laws and agency regulations, as well as the laws and regulations of foreign jurisdictions, could have a material adverse effect on our business.
Concentration of ownership among our significant shareholders may prevent new investors from influencing significant corporate decisions and may result in conflicts of interest.
As of December 31,
2018
, certain affiliates of Vestar Capital Partners, Inc. ("Vestar") beneficially owned approximately
13.5%
of our outstanding common shares, an affiliate of Bharti Global Limited ("Bharti") beneficially owned approximately
10.4%
of our outstanding common shares and certain affiliates of Warburg Pincus LLC ("Warburg Pincus") beneficially owned approximately
28
9.0%
of our outstanding common shares. As of such date, Vestar, Bharti and Warburg Pincus (collectively, the "Sponsor Shareholders"), in the aggregate, beneficially owned approximately
33.0%
of our outstanding common shares. Under the shareholder agreements with the Sponsor Shareholders (the "Sponsor Shareholder Agreements"), Warburg Pincus and Bharti (collectively, the "Warburg Shareholder Group") have the ongoing right to designate two nominees for election to serve on our Board, and Vestar has the ongoing right to designate one nominee for election to serve on our Board, in each case subject to the approval by our Nominating and Corporate Governance Committee of any individuals so designated. The rights of the Warburg Shareholder Group and Vestar to designate nominees for election to serve on our Board are subject to reduction as their respective ownership of our common shares declines. The Sponsor Shareholders Agreements provide certain restrictions on the Sponsor Shareholders, which are further described in the Registration Statement on Form S-4 that we filed with the SEC on December 24, 2015, as amended (the "Form S-4"), under “Related Agreements - The Sponsor Shareholders Agreements.” However, the concentration of influence in the Sponsor Shareholders may delay, deter or prevent acts that would be favored by our other shareholders, who may have interests different from those of the Sponsor Shareholders. For example, the Sponsor Shareholders could delay or prevent an acquisition, merger or amalgamation deemed beneficial to other shareholders, or cause, or seek to cause, us to take courses of action that, in their judgment, could enhance their investment in us, but which might involve risks to our other shareholders or adversely affect us or our other shareholders. Our Sponsor Shareholders may be able to cause or prevent a change in control or a change in the composition of our Board and could preclude any unsolicited acquisition of us. This may have the effect of delaying, preventing or deterring a change in control. In addition, this significant concentration of share ownership may materially adversely affect the trading price of our common shares because investors often perceive disadvantages in owning common shares in companies with significant concentrations of ownership.
Further, our by-laws provide that we, on behalf of our subsidiaries, renounce any interest or expectancy we or our subsidiaries may have in (or in being offered an opportunity to participate in) business opportunities that are from time to time presented to any of Warburg Pincus, Vestar, and Bharti and their respective affiliated funds, or any of their respective officers, directors, agents, shareholders, members, partners, affiliates and subsidiaries (other than us and our subsidiaries), even if the opportunity is one that we or our subsidiaries might reasonably be deemed to have pursued or had the ability or desire to pursue if granted the opportunity to do so. Our bye-laws provide that no such person will be liable to us or any of our subsidiaries (for breach of any duty or otherwise), as a director or officer or otherwise, by reason of the fact that such person pursues or acquires such business opportunity, directs such business opportunity to another person or fails to present such business opportunity, or information regarding such business opportunity, to us or our subsidiaries; provided, that the foregoing will not apply to any such person who is a director or officer, if such business opportunity is expressly offered to such director or officer in writing solely in his or her capacity as a director or officer. This may cause the strategic interests of the Sponsor Shareholders to differ from, and conflict with, our interests and our other shareholders' interests in material respects.
Future sales of our common shares, or the perception in the public markets that such sales may occur, may depress our share price.
Sales of substantial amounts of our common shares in the public market or the perception that such sales could occur, could adversely affect the price of our common shares and could impair our ability to raise capital through the sale of additional shares and result in long-lived asset impairment.
In addition, to the extent that Warburg Pincus, Vestar, Bharti or other significant shareholders sell, or indicate an intent to sell, substantial amounts of our common shares in the public market, the trading price of our common shares could decline significantly. These factors could also make it more difficult for us to raise additional funds through future offerings of our common shares or other securities.
Issuing additional common shares or other equity securities or securities convertible into equity for financing or in connection with our incentive plans, acquisitions or otherwise may dilute the economic and voting rights of our existing shareholders or reduce the market price of our common shares or both. Upon liquidation, holders of our debt securities, if issued, and lenders with respect to other borrowings would receive a distribution of our available assets prior to the holders of our common shares. Debt securities convertible into equity could be subject to adjustments in the conversion ratio pursuant to which certain events may increase the number of equity securities issuable upon conversion. Our decision to issue securities in any future offering will depend on market conditions and other factors beyond our control, which may materially adversely affect the amount, timing or nature of future offerings. Thus, holders of our common shares bear the risk that our future offerings may reduce the market price of our common shares.
In the future, we may also issue securities in connection with investments or acquisitions. The amount of our common shares issued in connection with an investment or acquisition could constitute a material portion of our then-outstanding common shares.
29
Any issuance of additional securities in connection with investments or acquisitions may result in dilution to you.
We are incorporated in Bermuda and a significant portion of our assets will be located outside the United States. As a result, it may not be possible for shareholders to enforce civil liability provisions of the federal or state securities laws of the United States against the Company.
We are incorporated under the laws of Bermuda and a significant portion of our assets are located outside the United States. It may not be possible to enforce court judgments obtained in the United States against us in Bermuda or in countries, other than the United States, where we will have assets, based on the civil liability provisions of the federal or state securities laws of the United States. In addition, there is some doubt as to whether the courts of Bermuda and other countries would recognize or enforce judgments of United States courts obtained against us or our officers or directors based on the civil liability provisions of the federal or state securities laws of the United States or would hear actions against us or those persons based on those laws. We have been advised by our legal advisors in Bermuda that the United States and Bermuda do not currently have a treaty providing for the reciprocal recognition and enforcement of judgments in civil and commercial matters. Therefore, a final judgment for the payment of money rendered by any federal or state court in the United States based on civil liability, whether or not based solely on United States federal or state securities laws, would not automatically be enforceable in Bermuda. Similarly, those judgments may not be enforceable in countries, other than the United States, where we have assets.
Bermuda law differs from the laws in effect in the United States and may afford less protection to shareholders.
Our shareholders might have more difficulty protecting their interests than would shareholders of a corporation incorporated in a jurisdiction of the United States. As a Bermuda company, we are governed by the Bermuda Companies Act. The Bermuda Companies Act differs in some material respects from laws generally applicable to United States corporations and shareholders, including the provisions relating to interested directors, mergers, amalgamations and acquisitions, takeovers, shareholder lawsuits and indemnification of directors. See "Description of Our Common Shares" in the Form S-4.
Certain provisions of the Sponsor Shareholders Agreements, our memorandum of association and amended and restated bye-laws and Bermuda law could hinder, delay or prevent a change in control that you might consider favorable, which could also adversely affect the price of our common shares.
Certain provisions under the Sponsor Shareholders Agreements, our memorandum of association and amended and restated bye-laws and Bermuda law could discourage, delay or prevent a transaction involving a change in control, even if doing so would benefit our shareholders. These provisions may include customary anti-takeover provisions and certain rights of our Sponsor Shareholders with respect to the designation of directors for nomination and election to our Board, including the ability to appoint members to each board committee.
Anti-takeover provisions could substantially impede the ability of our public shareholders to benefit from a change in control or change of our management and Board of Directors and, as a result, may materially adversely affect the market price of our common shares and your ability to realize any potential change of control premium. These provisions could also discourage proxy contests and make it more difficult for you and other shareholders to elect directors of your choosing and to cause us to take other corporate actions you desire.
We may not be able to protect our intellectual property rights, which could materially affect our business.
Our ability to obtain, protect and enforce our intellectual property rights is subject to general litigation risks, as well as the uncertainty as to the registrability, validity and enforceability of our intellectual property rights in each applicable country.
We rely on our trademarks to distinguish our services from the services of competitors, and have registered or applied to register a number of these trademarks. However, our trademark applications may not be approved. Third parties may also oppose our trademark applications or otherwise challenge our ownership or use of trademarks. In the event that our trademarks are successfully challenged, we could be forced to rebrand our products, which could result in loss of brand recognition and could require us to devote resources to advertising and marketing of these new brands. Additionally, from time to time, third parties adopt or use names similar to ours, thereby impeding our ability to build brand identity and possibly leading to consumer confusion or to dilution of our trademarks. We may not have sufficient resources or desire to defend or enforce our intellectual property rights, and even if we seek to enforce them, there is no guarantee that we will be able to prevent such third-party uses. Furthermore, such enforcement efforts may be expensive, time consuming and could divert management’s attention from managing our business.
30
We may be subject to claims by others that we are infringing on their intellectual property rights, which could harm our business and negatively impact our results of operations.
Third parties may assert claims that we infringe their intellectual property rights and these claims, with or without merit, could be time-consuming to litigate, cause the Company to incur substantial costs and divert management resources and attention in defending the claim. In some jurisdictions, plaintiffs can also seek injunctive relief that may prevent the marketing and selling of our services that infringe on the plaintiff’s intellectual property rights. To resolve these claims, we may enter into licensing agreements with restrictive terms or significant fees, stop selling or redesign affected services, or pay damages to satisfy contractual obligations to others. If we do not resolve these claims in advance of a trial, there is no guarantee that we will be successful in court. These outcomes may have a material adverse impact on our operating results and financial condition.
31
ITEM 1B. UNRESOLVED STAFF COMMENTS
None.
ITEM 2. PROPERTIES
Office Locations.
As of
December 31, 2018
, our employees are located in
23
offices in
16
countries including our registered office in Bermuda.
ITEM 3. LEGAL PROCEEDINGS
From time to time we are a party to litigation matters arising in connection with the normal course of our business. While we cannot predict the outcome of these matters, in the opinion of our management, any liability arising from these matters will not have a material adverse effect on our business. Nevertheless, unexpected adverse future events, such as an unforeseen development in our existing proceedings, a significant increase in the number of new cases or changes in our current insurance arrangements could result in liabilities that have a material adverse impact on our business.
ITEM 4. MINE SAFETY DISCLOSURES
Not applicable.
32
PART II
ITEM 5. MARKET FOR REGISTRANT'S COMMON EQUITY, RELATED SHAREHOLDER MATTERS, AND ISSUER PURCHASES OF EQUITY SECURITIES
Our common shares have been listed on the New York Stock Exchange (the “NYSE”) under the symbol "TRTN" since
July 13, 2016
. Prior to that time, there was no public market for our common shares.
On
February 7, 2019
, there were
60
holders of record of our common shares and
39,087
beneficial holders, based on information obtained from our transfer agent.
The following table provides certain information with respect to our purchases of the Company’s common shares during the
fourth
quarter for the year ended
December 31, 2018
.
|
Issuer Purchases of Common Shares
(1)
|
||||||||||
|
Period
|
Total number of shares purchased
|
Average price paid per share
|
Total number of shares purchased as part of publicly announced plan
|
Approximate dollar value of shares that may yet be purchased under the plan (in thousands)
|
||||||
|
October 1, 2018 through October 31, 2018
|
942,823
|
|
$
|
30.76
|
|
942,823
|
|
$
|
169,866
|
|
|
November 1, 2018 through November 30, 2018
|
270,642
|
|
$
|
34.00
|
|
270,642
|
|
$
|
160,658
|
|
|
December 1, 2018 through December 31, 2018
|
605,983
|
|
$
|
30.96
|
|
605,983
|
|
$
|
141,886
|
|
|
Total
|
1,819,448
|
|
|
|
1,819,448
|
|
$
|
141,886
|
|
|
|
(1)
|
On August 1, 2018, the Company's Board of Directors authorized the repurchase of up to
$200.0 million
of its common shares. The share repurchase authorization will terminate upon completing repurchases of
$200.0 million
of common shares unless earlier terminated by the Board.
|
33
Performance Graph
The graph below compares our cumulative shareholder returns with the S&P 500 Stock Index and the Russell 2000 Stock Index for the period from July 13, 2016 (the first day our common shares were traded) through
December 31, 2018
. The graph assumes that the value of the investment in our common shares, the S&P 500 Stock Index and the Russell 2000 Stock Index was $100 on July 13, 2016 and that all dividends were reinvested.
Comparison of Cumulative Total Return
July 13, 2016 through
December 31, 2018
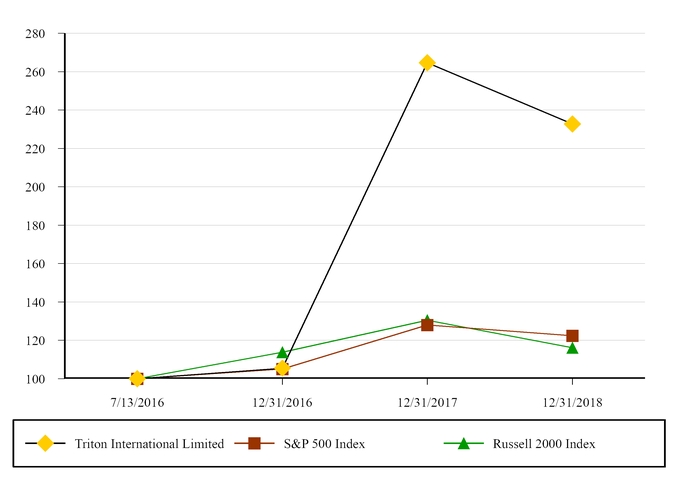
|
Base Period as of
|
INDEXED RETURNS FOR THE YEARS ENDED
|
||||||
|
Company / Index
|
July 13, 2016
|
December 31, 2016
|
December 31, 2017
|
December 31, 2018
|
|||
|
Triton International Limited
|
$100.00
|
$105.49
|
$264.66
|
$232.76
|
|||
|
S&P 500 Index
|
$100.00
|
$105.06
|
$127.99
|
$122.38
|
|||
|
Russell 2000 Index
|
$100.00
|
$113.77
|
$130.43
|
$116.07
|
|||
34
ITEM 6. SELECTED FINANCIAL DATA
The following table summarizes certain selected historical financial, operating and other data of Triton. The selected historical consolidated statements of operations data, balance sheet data and other financial data for each of the
five years
ended December 31,
2018
were derived from the Company's audited Consolidated Financial Statements and related notes. The data below should be read in conjunction with, and is qualified by reference to, our Management's Discussion and Analysis and our Consolidated Financial Statements and notes thereto contained elsewhere in this report. The historical results are not necessarily indicative of the results to be expected in any future period. The following financial data for Triton included herein for the periods prior to the date of the Merger on
July 12, 2016
are for TCIL operations alone as TCIL was treated as the acquirer in the Merger for accounting purposes.
35
|
Year Ended December 31,
(In thousands, except per share data)
|
|||||||||||||||||||
|
Statements of Operations Data:
|
2018
|
2017
|
2016
|
2015
|
2014
|
||||||||||||||
|
Leasing revenues:
|
|||||||||||||||||||
|
Operating leases
|
$
|
1,328,756
|
|
$
|
1,141,165
|
|
$
|
813,357
|
|
$
|
699,810
|
|
$
|
699,188
|
|
||||
|
Finance leases
|
21,547
|
|
22,352
|
|
15,337
|
|
8,029
|
|
8,027
|
|
|||||||||
|
Total leasing revenues
|
1,350,303
|
|
1,163,517
|
|
828,694
|
|
|
707,839
|
|
|
707,215
|
|
|||||||
|
Equipment trading revenues
(1)
|
83,039
|
|
37,419
|
|
16,418
|
|
—
|
|
—
|
|
|||||||||
|
Equipment trading expenses
(1)
|
(64,118
|
)
|
(33,235
|
)
|
(15,800
|
)
|
—
|
|
—
|
|
|||||||||
|
Trading margin
|
18,921
|
|
4,184
|
|
618
|
|
|
—
|
|
|
—
|
|
|||||||
|
Net gain (loss) on sale of leasing equipment
|
35,377
|
|
35,812
|
|
(20,347
|
)
|
2,013
|
|
31,616
|
|
|||||||||
|
Net gain (loss) on sale of building
|
20,953
|
|
—
|
|
—
|
|
—
|
|
—
|
|
|||||||||
|
Operating expenses:
|
|||||||||||||||||||
|
Depreciation and amortization
(2)
|
545,138
|
|
500,720
|
|
392,592
|
|
300,470
|
|
258,489
|
|
|||||||||
|
Direct operating expenses
|
48,326
|
|
62,891
|
|
84,256
|
|
54,440
|
|
58,014
|
|
|||||||||
|
Administrative expenses
|
80,033
|
|
87,609
|
|
65,618
|
|
53,435
|
|
55,659
|
|
|||||||||
|
Transaction and other costs
(3)
|
88
|
|
9,272
|
|
66,916
|
|
22,185
|
|
30,477
|
|
|||||||||
|
Provision (reversal) for doubtful accounts
|
(231
|
)
|
3,347
|
|
23,304
|
|
(2,156
|
)
|
1,324
|
|
|||||||||
|
Insurance recovery income
|
—
|
|
(6,764
|
)
|
—
|
|
—
|
|
—
|
|
|||||||||
|
Total operating expenses
|
673,354
|
|
657,075
|
|
632,686
|
|
|
428,374
|
|
|
403,963
|
|
|||||||
|
Operating income
|
752,200
|
|
546,438
|
|
176,279
|
|
|
281,478
|
|
|
334,868
|
|
|||||||
|
Other expenses (income):
|
|||||||||||||||||||
|
Interest and debt expense
|
322,731
|
|
282,347
|
|
184,014
|
|
140,644
|
|
137,370
|
|
|||||||||
|
Realized (gain) loss on derivative instruments, net
|
(2,072
|
)
|
900
|
|
3,438
|
|
5,496
|
|
9,385
|
|
|||||||||
|
Unrealized (gain) loss on derivative instruments, net
(4)
|
430
|
|
(1,397
|
)
|
(4,405
|
)
|
2,240
|
|
3,798
|
|
|||||||||
|
Debt termination expense
|
6,090
|
|
6,973
|
|
141
|
|
1,170
|
|
7,468
|
|
|||||||||
|
Other (income) expense, net
|
(2,292
|
)
|
(2,637
|
)
|
(1,076
|
)
|
211
|
|
(689
|
)
|
|||||||||
|
Total other expenses
|
324,887
|
|
286,186
|
|
182,112
|
|
|
149,761
|
|
|
157,332
|
|
|||||||
|
Income (loss) before income taxes
|
427,313
|
|
260,252
|
|
(5,833
|
)
|
131,717
|
|
|
177,536
|
|
||||||||
|
Income tax expense (benefit)
|
70,641
|
|
(93,274
|
)
|
(48
|
)
|
4,048
|
|
6,232
|
|
|||||||||
|
Net income (loss)
|
$
|
356,672
|
|
$
|
353,526
|
|
$
|
(5,785
|
)
|
$
|
127,669
|
|
|
$
|
171,304
|
|
|||
|
Less: income attributable to non-controlling interest
|
7,117
|
|
8,928
|
|
7,732
|
|
16,580
|
|
21,837
|
|
|||||||||
|
Net income (loss) attributable to shareholders
|
$
|
349,555
|
|
$
|
344,598
|
|
|
$
|
(13,517
|
)
|
|
$
|
111,089
|
|
|
$
|
149,467
|
|
|
|
Earnings Per Share Data:
|
|||||||||||||||||||
|
Net income (loss) per common share—Basic
|
$
|
4.38
|
|
$
|
4.55
|
|
$
|
(0.24
|
)
|
|
$
|
2.75
|
|
|
$
|
3.73
|
|
||
|
Net income (loss) per common share—Diluted
|
$
|
4.35
|
|
$
|
4.52
|
|
|
$
|
(0.24
|
)
|
|
$
|
2.71
|
|
|
$
|
3.52
|
|
|
|
Weighted average common shares and non-voting common shares outstanding:
|
|||||||||||||||||||
|
Basic
|
79,782
|
|
75,679
|
|
56,032
|
|
40,429
|
|
40,021
|
|
|||||||||
|
Diluted
|
80,364
|
|
76,188
|
|
56,032
|
|
40,932
|
|
42,458
|
|
|||||||||
|
Cash dividends paid per common share
|
$
|
2.01
|
|
$
|
1.80
|
|
$
|
1.35
|
|
$
|
—
|
|
$
|
5.38
|
|
||||
|
(1)
|
Triton acquired the Equipment trading segment as part of the Merger on July 12, 2016 and had no such reporting segment prior to that date.
|
|
(2)
|
Depreciation expense was increased by $1.8 million per quarter beginning October 1, 2015 as the result of a decrease in residual value estimates and an increase in the useful life estimates for certain dry containers included in Triton’s depreciation policy.
|
|
(3)
|
Includes retention and stock compensation expense pursuant to the Merger and the plans established as part of TCIL's 2011 re-capitalization.
|
|
(4)
|
Unrealized (gains) losses on derivative instruments, net are primarily due to changes in interest rates, and reflect changes in the fair value of interest rate swaps not designated as cash flow hedges.
|
36
|
As of December 31,
(In thousands) |
|||||||||||||||||||
|
2018
|
2017
|
2016
|
2015
|
2014
|
|||||||||||||||
|
Balance Sheet Data (end of period):
|
|||||||||||||||||||
|
Cash and cash equivalents (including restricted cash)
|
$
|
159,539
|
|
$
|
226,171
|
|
$
|
163,492
|
|
$
|
79,264
|
|
$
|
97,059
|
|
||||
|
Accounts receivable, net
|
264,382
|
|
199,876
|
|
173,585
|
|
110,970
|
|
112,596
|
|
|||||||||
|
Revenue earning assets, net
|
9,467,969
|
|
8,703,570
|
|
7,817,192
|
|
4,428,699
|
|
4,613,372
|
|
|||||||||
|
Total assets
|
10,270,013
|
|
9,577,625
|
|
8,713,571
|
|
4,658,997
|
|
4,863,259
|
|
|||||||||
|
Debt, net of unamortized debt costs
|
7,529,432
|
|
6,911,725
|
|
6,353,449
|
|
3,166,903
|
|
3,364,510
|
|
|||||||||
|
Shareholders' equity
|
2,203,696
|
|
2,076,284
|
|
1,663,233
|
|
1,217,329
|
|
1,106,160
|
|
|||||||||
|
Non-controlling interests
|
121,513
|
|
133,542
|
|
143,504
|
|
160,504
|
|
190,851
|
|
|||||||||
|
Total equity (including non-controlling interests)
|
2,325,209
|
|
2,209,826
|
|
1,806,737
|
|
1,377,833
|
|
1,297,011
|
|
|||||||||
|
Other Financial Data:
|
|||||||||||||||||||
|
Capital expenditures
|
1,603,507
|
|
1,562,863
|
|
629,332
|
|
398,799
|
|
809,446
|
|
|||||||||
|
Proceeds from sale of equipment, net of selling costs
|
163,256
|
|
190,744
|
|
145,572
|
|
171,719
|
|
195,282
|
|
|||||||||
37
ITEM 7. MANAGEMENT'S DISCUSSION AND ANALYSIS OF FINANCIAL CONDITION AND RESULTS OF OPERATIONS
The statements in this discussion regarding industry outlook, our expectations regarding our future performance, liquidity and capital resources and other non-historical statements are subject to numerous risks and uncertainties, including, but not limited to, the risks and uncertainties described under "Risk Factors" and "Cautionary Note Regarding Forward-Looking Statements" as discussed elsewhere in this Form 10-K. Our actual results may differ materially from those contained in or implied by any forward-looking statements.
Our Company
Triton International Limited (“Triton”, “we”, "our” or the “Company”) is the world's largest lessor of intermodal containers. Intermodal containers are large, standardized steel boxes used to transport freight by ship, rail or truck. Because of the handling efficiencies they provide, intermodal containers are the primary means by which many goods and materials are shipped internationally. We also lease chassis, which are used for the transportation of containers.
Triton was formed on July 12, 2016 through an all-stock merger between Triton Container International Limited and TAL International Group, Inc.
We operate our business in one industry, intermodal transportation equipment, and have two business segments, which also represent our reporting segments:
|
•
|
Equipment leasing - we own, lease and ultimately dispose of containers and chassis from our lease fleet.
|
|
•
|
Equipment trading - we purchase containers from shipping line customers, and other sellers of containers, and resell these containers to container retailers and users of containers for storage or one-way shipment.
|
Operations
Our consolidated operations include the acquisition, leasing, re-leasing and subsequent sale of multiple types of intermodal containers and chassis. As of
December 31, 2018
, our total fleet consisted of
3.7 million
containers and chassis, representing
6.2 million
twenty-foot equivalent units ("TEU") or
7.6 million
cost equivalent units ("CEU"). We have an extensive global presence, offering leasing services through
23
offices in
16
countries and approximately
400
third-party container depot facilities in approximately
45
countries as of
December 31, 2018
. Our primary customers include the world's largest container shipping lines. For the year ended
December 31, 2018
, our twenty largest customers accounted for
85%
of our lease billings, our five largest customers accounted for
54%
of our lease billings, and our two largest customers,
CMA CGM S.A.
and
Mediterranean Shipping Company S.A.
, accounted for
20%
and
14%
of our lease billings, respectively.
We lease five types of equipment: (1) dry containers, which are used for general cargo such as manufactured component parts, consumer staples, electronics and apparel, (2) refrigerated containers, which are used for perishable items such as fresh and frozen foods, (3) special containers, which are used for heavy and over-sized cargo such as marble slabs, building products and machinery, (4) tank containers, which are used to transport bulk liquid products such as chemicals, and (5) chassis, which are used for the transportation of containers.
Our in-house equipment sales group manages the sale process for our used containers and chassis from our equipment leasing fleet and buys and sells used and new containers and chassis acquired from third parties.
38
The following tables summarize our equipment fleet as of
December 31, 2018
,
2017
and
2016
, indicated in units, TEU and CEU.
|
|
Equipment Fleet in Units
|
Equipment Fleet in TEU
|
|||||||||||||||
|
|
December 31, 2018
|
December 31, 2017
|
December 31, 2016
|
December 31, 2018
|
December 31, 2017
|
December 31, 2016
|
|||||||||||
|
Dry
|
3,340,946
|
|
3,077,144
|
|
2,737,982
|
|
5,476,406
|
|
5,000,043
|
|
4,424,905
|
|
|||||
|
Refrigerated
|
228,778
|
|
218,429
|
|
217,243
|
|
440,781
|
|
419,673
|
|
416,992
|
|
|||||
|
Special
|
93,900
|
|
89,066
|
|
92,957
|
|
169,614
|
|
159,172
|
|
164,977
|
|
|||||
|
Tank
|
12,509
|
|
12,124
|
|
11,961
|
|
12,509
|
|
12,124
|
|
11,961
|
|
|||||
|
Chassis
|
24,832
|
|
22,523
|
|
22,128
|
|
45,787
|
|
41,068
|
|
40,233
|
|
|||||
|
Equipment leasing fleet
|
3,700,965
|
|
3,419,286
|
|
3,082,271
|
|
6,145,097
|
|
5,632,080
|
|
5,059,068
|
|
|||||
|
Equipment trading fleet
|
13,138
|
|
10,510
|
|
15,927
|
|
21,361
|
|
16,907
|
|
26,276
|
|
|||||
|
Total
|
3,714,103
|
|
3,429,796
|
|
3,098,198
|
|
6,166,458
|
|
5,648,987
|
|
5,085,344
|
|
|||||
|
|
Equipment Fleet in CEU
(1)
|
|||||||
|
|
December 31, 2018
|
December 31, 2017
|
December 31, 2016
|
|||||
|
Operating Leases
|
7,009,605
|
|
6,678,282
|
|
6,126,320
|
|
||
|
Finance Leases
|
538,867
|
|
328,024
|
|
368,468
|
|
||
|
Equipment trading fleet
|
47,476
|
|
51,762
|
|
72,646
|
|
||
|
Total
|
7,595,948
|
|
7,058,068
|
|
6,567,434
|
|
||
|
(1)
|
In the equipment fleet tables above, we have included total fleet count information based on CEU. CEU is a ratio used to convert the actual number of containers in our fleet to a figure based on the relative purchase prices of our various equipment types to that of a 20-foot dry container. For example, the CEU ratio for a 40-foot high cube dry container is 1.68, and a 40-foot high cube refrigerated container is 10.0. The CEU ratios used in this calculation are from our debt agreements and may differ slightly from CEU ratios used by others in the industry.
|
The following table summarizes the percentage of our equipment fleet in terms of units and CEU as of
December 31, 2018
:
|
Equipment Type
|
Percentage of
total fleet in units |
Percent of total fleet in CEU
|
|||
|
Dry
|
89.9
|
%
|
62.9
|
%
|
|
|
Refrigerated
|
6.2
|
|
29.6
|
|
|
|
Special
|
2.5
|
|
2.9
|
|
|
|
Tank
|
0.3
|
|
2.6
|
|
|
|
Chassis
|
0.7
|
|
1.4
|
|
|
|
Equipment leasing fleet
|
99.6
|
|
99.4
|
|
|
|
Equipment trading fleet
|
0.4
|
|
0.6
|
|
|
|
Total
|
100.0
|
%
|
100.0
|
%
|
|
We generally lease our equipment on a per diem basis to our customers under three types of leases:
|
•
|
Long-term leases typically have initial contractual terms ranging from three to eight years and provide us with stable cash flow and low transaction costs by requiring customers to maintain specific units on-hire for the duration of the lease.
|
|
•
|
Finance leases are typically structured as full payout leases and provide for a predictable recurring revenue stream with the lowest cost to the customer as customers are generally required to retain the equipment for the duration of its useful life.
|
|
•
|
Service leases command a premium per diem rate in exchange for providing customers with greater operational flexibility by allowing non-scheduled pick-up and drop-off of units during the lease term.
|
We also have expired long-term leases whose fixed terms have ended but for which the related units remain on-hire and for which we continue to receive rental payments pursuant to the terms of the initial contract. Some leases have contractual terms that have features reflective of both long-term and service leases and we classify such leases as either long-term or service leases, depending upon which features we believe are predominant.
The following table summarizes our lease portfolio by lease type, based on CEU on-hire as of
December 31, 2018
,
2017
and
2016
:
39
|
Lease Portfolio
|
December 31,
2018 |
|
December 31,
2017 |
|
December 31,
2016 |
|||
|
Long-term leases
|
66.6
|
%
|
72.2
|
%
|
69.7
|
%
|
||
|
Finance leases
|
7.5
|
|
4.9
|
|
6.3
|
|
||
|
Service leases
|
11.3
|
|
14.1
|
|
18.5
|
|
||
|
Expired long-term leases (units on-hire)
|
14.6
|
|
8.8
|
|
5.5
|
|
||
|
Total
|
100.0
|
%
|
100.0
|
%
|
100.0
|
%
|
||
As of
December 31, 2018
,
2017
and
2016
, our long-term and finance leases combined had an average remaining contractual term of approximately
47 months
,
43 months
, and
39 months
, respectively, assuming no leases are renewed.
Operating Performance
Market conditions remained favorable during much of
2018
. Demand for our containers was supported by several factors, including solid trade growth, an increased preference for leasing relative to direct container purchases by our shipping line customers, and a strong leasing share for Triton. The supply of containers remained well controlled, with a moderate inventory of available new containers and a very limited inventory of available used leasing containers. Pick-up activity for our containers remained strong throughout most of
2018
, reflecting solid trade growth and a favorable supply / demand environment for containers. Pick-up activity slowed in the fourth quarter, which typically represents the slow shipping season for dry containers.
The ongoing trade dispute and the imposition of higher tariffs on goods traded between the United States and China has created uncertainty surrounding future global economic and trade growth, though it seems the initial round of increased tariffs implemented in the second half of 2018 did not negatively impact containerized trade in
2018
. Looking forward, our customers have indicated to us that they believe the increased tariffs will not have a significant impact on overall global container trading volumes in 2019, but they have also indicated that they face more uncertainty on trade volumes than usual.
Fleet size.
During
2018
, we invested
$1.5 billion
in new and sale-leaseback containers. As of
December 31, 2018
, our fleet had a net book value of
$9,468.0 million
, which represent
an increase
of
8.8%
as compared to
December 31, 2017
.
Our continued high level of investment in
2018
was driven by solid containerized trade growth, a continued increase in the share of new containers purchased by leasing companies and our strong share of new leasing transactions. Market forecasters estimate that global containerized trade grew
5.1%
in
2018
, and we estimate that approximately
55%
of new shipping containers were purchased by leasing companies in
2018
. Our shipping line customers have generally been increasing their reliance on leased containers to conserve capital investment. Our customers have been facing difficult market conditions for several years, including excess vessel capacity, weak freight rates, and low profitability.
Utilization.
Our utilization averaged
98.6%
during
2018
, as compared to
96.9%
in
2017
. Our ending utilization was
97.8%
as of
December 31, 2018
, as compared to
98.6%
as of
December 31, 2017
. Our high utilization in
2018
was supported by strong demand for leased containers due to solid trade growth and an increased preference for leasing. Our utilization decreased in the fourth quarter of
2018
reflecting reduced demand due to the end of the peak shipping season for dry containers. As of
February 8, 2019
, our utilization was
97.6%
.
The following tables summarize our equipment fleet utilization
(1)
for the periods indicated below.
|
|
Quarter Ended
|
|||||||||
|
Average Utilization
|
Year Ended December 31,
|
December 31,
|
September 30,
|
June 30,
|
March 31,
|
|||||
|
2018
|
98.6%
|
98.2%
|
98.7%
|
98.8%
|
98.6%
|
|||||
|
2017
|
96.9%
|
98.3%
|
97.6%
|
96.5%
|
95.3%
|
|||||
|
2016
(2)
|
93.3%
|
93.6%
|
92.4%
|
93.3%
|
94.0%
|
|||||
40
|
Quarter Ended
|
||||||||
|
Ending Utilization
|
December 31,
|
September 30,
|
June 30,
|
March 31,
|
||||
|
2018
|
97.8%
|
98.6%
|
98.7%
|
98.7%
|
||||
|
2017
|
98.6%
|
98.0%
|
97.1%
|
95.8%
|
||||
|
2016
(2)
|
94.8%
|
92.6%
|
93.7%
|
93.5%
|
||||
|
(1)
|
Utilization is computed by dividing our total units on lease (in CEU) by the total units in our fleet (in CEU) excluding new units not yet leased and off-hire units designated for sale.
|
|
(2)
|
For the periods prior to the July 12, 2016 Merger, the utilization reflects the combined utilization of the TCIL and TAL equipment fleets.
|
Average lease rates.
Average lease rates for our dry container product line
increased
by
4.0%
in
2018
compared to
2017
. Market lease rates for dry containers were slightly above our portfolio average lease rates for most of 2018. Container prices and market lease rates decreased towards the end of
2018
, and are now below our portfolio average.
We have a large number of dry container leases which are expired or will expire in 2019. The average rates on these leases are above current market lease rates. We could face increased pressure on our average dry container lease rates if new container prices and market lease rates remain at their current level or were to decrease further.
Average lease rates for our refrigerated container product line
decreased
by
2.3%
in
2018
compared to
2017
. The cost of refrigerated containers has trended down over the last few years, which has led to lower market lease rates. Market lease rates for refrigerated containers have also been pressured for several years by new leasing company entrants. Market lease rates for refrigerated containers remain below the average lease rates of our refrigerated container lease portfolio, and we expect our average lease rates for refrigerated containers to continue to gradually trend down.
The average lease rates for our special container product line
decreased
by
0.9%
in
2018
compared to
2017
. Current market lease rates for special containers are comparable to the average lease rates in our lease portfolio.
Equipment disposals.
Average used dry container disposal prices
increased
by
20.9%
in
2018
as compared to
2017
, reflecting the tight supply / demand for leasing containers. Our volume of owned container disposals decreased in
2018
, also reflecting the tight supply of available containers. Used container sale prices are currently high relative to the price for new containers, and we may face pressure on used container sale prices if new container prices remain at their current level. However, we expect the disposal volume of our owned containers to increase in 2019. Our equipment trading results were strong in
2018
. We completed several block purchases of older containers from our shipping line customers, significantly increasing our trading volumes, and used container sale prices remained high throughout the year, leading to high per-unit margins. We expect our trading volumes to remain elevated in 2019, though we may face pressure on per unit margins if used container sale prices decrease.
Credit Risk.
We faced minimal credit losses in
2018
. However, our credit risk is currently elevated due to the ongoing financial pressure faced by our shipping line customers. The container shipping industry has faced several years of excess vessel capacity, weak freight rates and poor financial results due to aggressive ordering of mega container vessels. Most of our customers have recently generated financial losses and many are burdened with high levels of debt. In addition, we anticipate the high volume of new vessels entering service over the next several years will complicate our customers’ efforts to increase freight rates, and new environmental regulations expected to become effective in January 2020 will increase the cost of fuel and potentially require our shipping line customers to make large capital outlays. As a result, we expect our customers’ financial performance will remain under pressure for some time. The increased tariffs imposed on certain goods traded between the United States and China and the threat of additional tariffs could lead to reduced trade and lower freight rates and further increase the financial pressure on our customers.
We expect it will become more difficult for us to mitigate our exposure to credit risks in the future through the purchase of credit insurance. We let our credit insurance policies lapse at expiration in December 2016 and early 2017 since underwriters offered significantly reduced coverage and required a meaningful increase in insurance premiums as a result of the bankruptcy of Hanjin Shipping Co. We currently have a more limited credit insurance policy covering accounts receivable owed by some of our customers. This policy offers significantly reduced protections against a major customer default compared to the credit insurance we had in place previously, and the policy has exclusions and payment and other limitations. We continue to monitor the availability and pricing of credit insurance and related products.
41
Results of Operations
The following table summarizes our results of operations for the years ended
December 31, 2018
,
2017
and
2016
(in thousands):
|
|
Year Ended December 31, 2018
|
Year Ended December 31, 2017
|
Year Ended December 31, 2016
(1)
|
||||||||
|
Leasing revenues:
|
|||||||||||
|
Operating leases
|
$
|
1,328,756
|
|
$
|
1,141,165
|
|
$
|
813,357
|
|
||
|
Finance leases
|
21,547
|
|
22,352
|
|
15,337
|
|
|||||
|
Total leasing revenues
|
1,350,303
|
|
1,163,517
|
|
828,694
|
|
|||||
|
|
|
||||||||||
|
Equipment trading revenues
|
83,039
|
|
37,419
|
|
16,418
|
|
|||||
|
Equipment trading expenses
|
(64,118
|
)
|
(33,235
|
)
|
(15,800
|
)
|
|||||
|
Trading margin
|
18,921
|
|
4,184
|
|
618
|
|
|||||
|
|
|
||||||||||
|
Net gain (loss) on sale of leasing equipment
|
35,377
|
|
35,812
|
|
(20,347
|
)
|
|||||
|
Net gain (loss) on sale of building
|
20,953
|
|
—
|
|
—
|
|
|||||
|
|
|
||||||||||
|
Operating expenses:
|
|
|
|||||||||
|
Depreciation and amortization
|
545,138
|
|
500,720
|
|
392,592
|
|
|||||
|
Direct operating expenses
|
48,326
|
|
62,891
|
|
84,256
|
|
|||||
|
Administrative expenses
|
80,033
|
|
87,609
|
|
65,618
|
|
|||||
|
Transaction and other costs (income)
|
88
|
|
9,272
|
|
66,916
|
|
|||||
|
Provision (reversal) for doubtful accounts
|
(231
|
)
|
3,347
|
|
23,304
|
|
|||||
|
Insurance recovery income
|
—
|
|
(6,764
|
)
|
—
|
|
|||||
|
Total operating expenses
|
673,354
|
|
657,075
|
|
632,686
|
|
|||||
|
Operating income (loss)
|
752,200
|
|
546,438
|
|
176,279
|
|
|||||
|
Other expenses:
|
|
||||||||||
|
Interest and debt expense
|
322,731
|
|
282,347
|
|
184,014
|
|
|||||
|
Realized (gain) loss on derivative instruments, net
|
(2,072
|
)
|
900
|
|
3,438
|
|
|||||
|
Unrealized (gain) loss on derivative instruments, net
|
430
|
|
(1,397
|
)
|
(4,405
|
)
|
|||||
|
Debt termination expense
|
6,090
|
|
6,973
|
|
141
|
|
|||||
|
Other (income) expense, net
|
(2,292
|
)
|
(2,637
|
)
|
(1,076
|
)
|
|||||
|
Total other expenses
|
324,887
|
|
286,186
|
|
182,112
|
|
|||||
|
Income (loss) before income taxes
|
427,313
|
|
260,252
|
|
(5,833
|
)
|
|||||
|
Income tax expense (benefit)
|
70,641
|
|
(93,274
|
)
|
(48
|
)
|
|||||
|
Net income (loss)
|
$
|
356,672
|
|
$
|
353,526
|
|
$
|
(5,785
|
)
|
||
|
Less: income (loss) attributable to non-controlling interest
|
7,117
|
|
8,928
|
|
7,732
|
|
|||||
|
Net income (loss) attributable to shareholders
|
$
|
349,555
|
|
$
|
344,598
|
|
$
|
(13,517
|
)
|
||
|
(1)
|
The results for
December 31, 2016
are impacted by the Merger on a comparative basis. TCIL has been treated as the acquirer in the Merger for accounting purposes, and therefore, the results of our operations, included herein, for the periods prior to the Merger on
July 12, 2016
are for TCIL operations alone
|
42
Comparison of the Year Ended
December 31, 2018
to the Year Ended
December 31, 2017
The following table summarizes our comparative results for the periods indicated (in thousands):
|
|
Year Ended December 31, 2018
|
Year Ended December 31, 2017
|
Variance
|
||||||||
|
Leasing revenues:
|
|||||||||||
|
Operating leases
|
$
|
1,328,756
|
|
$
|
1,141,165
|
|
$
|
187,591
|
|
||
|
Finance leases
|
21,547
|
|
22,352
|
|
(805
|
)
|
|||||
|
Total leasing revenues
|
1,350,303
|
|
1,163,517
|
|
186,786
|
|
|||||
|
|
|
||||||||||
|
Equipment trading revenues
|
83,039
|
|
37,419
|
|
45,620
|
|
|||||
|
Equipment trading expenses
|
(64,118
|
)
|
(33,235
|
)
|
(30,883
|
)
|
|||||
|
Trading margin
|
18,921
|
|
4,184
|
|
14,737
|
|
|||||
|
|
|
||||||||||
|
Net gain (loss) on sale of leasing equipment
|
35,377
|
|
35,812
|
|
(435
|
)
|
|||||
|
Net gain (loss) on sale of building
|
20,953
|
|
—
|
|
20,953
|
|
|||||
|
|
|
||||||||||
|
Operating expenses:
|
|
|
|||||||||
|
Depreciation and amortization
|
545,138
|
|
500,720
|
|
44,418
|
|
|||||
|
Direct operating expenses
|
48,326
|
|
62,891
|
|
(14,565
|
)
|
|||||
|
Administrative expenses
|
80,033
|
|
87,609
|
|
(7,576
|
)
|
|||||
|
Transaction and other costs (income)
|
88
|
|
9,272
|
|
(9,184
|
)
|
|||||
|
Provision (reversal) for doubtful accounts
|
(231
|
)
|
3,347
|
|
(3,578
|
)
|
|||||
|
Insurance recovery income
|
—
|
|
(6,764
|
)
|
6,764
|
|
|||||
|
Total operating expenses
|
673,354
|
|
657,075
|
|
16,279
|
|
|||||
|
Operating income (loss)
|
752,200
|
|
546,438
|
|
205,762
|
|
|||||
|
Other expenses:
|
|
|
|||||||||
|
Interest and debt expense
|
322,731
|
|
282,347
|
|
40,384
|
|
|||||
|
Realized (gain) loss on derivative instruments, net
|
(2,072
|
)
|
900
|
|
(2,972
|
)
|
|||||
|
Unrealized (gain) loss on derivative instruments, net
|
430
|
|
(1,397
|
)
|
1,827
|
|
|||||
|
Debt termination expense
|
6,090
|
|
6,973
|
|
(883
|
)
|
|||||
|
Other (income) expense, net
|
(2,292
|
)
|
(2,637
|
)
|
345
|
|
|||||
|
Total other expenses
|
324,887
|
|
286,186
|
|
38,701
|
|
|||||
|
Income (loss) before income taxes
|
427,313
|
|
260,252
|
|
167,061
|
|
|||||
|
Income tax expense (benefit)
|
70,641
|
|
(93,274
|
)
|
163,915
|
|
|||||
|
Net income (loss)
|
$
|
356,672
|
|
$
|
353,526
|
|
$
|
3,146
|
|
||
|
Less: income (loss) attributable to non-controlling interest
|
7,117
|
|
8,928
|
|
(1,811
|
)
|
|||||
|
Net income (loss) attributable to shareholders
|
$
|
349,555
|
|
$
|
344,598
|
|
$
|
4,957
|
|
||
43
Leasing revenues.
Per diem revenues represent revenue earned under operating lease contracts. Fee and ancillary lease revenues represent fees billed for the pick-up and drop-off of containers in certain geographic locations and billings of certain reimbursable operating costs such as repair and handling expenses. Finance lease revenues represent interest income earned under finance lease contracts. The following table summarizes our leasing revenues for the periods indicated below (in thousands):
|
Leasing revenues
|
Year Ended December 31, 2018
|
Year Ended December 31, 2017
|
Variance
|
||||||||
|
Operating lease revenues:
|
|
||||||||||
|
Per diem revenues
|
$
|
1,278,354
|
|
$
|
1,100,507
|
|
$
|
177,847
|
|
||
|
Fee and ancillary revenues
|
50,402
|
|
40,658
|
|
9,744
|
|
|||||
|
Total operating lease revenues
|
1,328,756
|
|
1,141,165
|
|
187,591
|
|
|||||
|
Finance lease revenues
|
21,547
|
|
22,352
|
|
(805
|
)
|
|||||
|
Total leasing revenues
|
$
|
1,350,303
|
|
$
|
1,163,517
|
|
$
|
186,786
|
|
||
Total leasing revenues were
$1,350.3 million
, net of lease intangible amortization of
$61.5 million
, in
2018
compared to
$1,163.5 million
, net of lease intangible amortization of
$88.6 million
, in
2017
,
an increase
of
$186.8 million
.
Per diem revenues were
$1,278.4 million
in
2018
compared to
$1,100.5 million
in
2017
,
an increase
of
$177.9 million
. The primary reasons for this increase are as follows:
|
•
|
$133.4 million increase due to an increase of 671,636 CEU in the average number of containers on-hire under operating leases;
|
|
•
|
$24.0 million increase due to an increase in average CEU per diem rates;
|
|
•
|
$27.0 million increase due to reduced lease intangible amortization; partially offset by
|
|
•
|
$6.6 million decrease due to the reclassification of certain contracts from operating leases to finance leases in the fourth quarter of 2018 as a result of the renegotiation and extension of the contracts.
|
Fee and ancillary lease revenues were
$50.4 million
in
2018
compared to
$40.7 million
in
2017
,
an increase
of
$9.7 million
. The increase was primarily due to higher redelivery and repair fee revenue of $11.0 million associated with higher volumes of redeliveries, especially in the fourth quarter, partially offset by reduced handling fees of $1.3 million.
Finance lease revenues were
$21.5 million
in
2018
compared to
$22.4 million
in
2017
,
a decrease
of
$0.9 million
. The scheduled runoff of the existing portfolio was partially offset by the addition of several finance leases, primarily in the fourth quarter, as a result of the renegotiation and extension of certain contracts that were reclassified from operating leases to finance leases.
Trading margin.
Trading margin was
$18.9 million
in
2018
compared to
$4.2 million
in
2017
, an
increase
of
$14.7 million
.
The primary reasons for this increase are as follows:
|
•
|
$11.3 million increase due to an increase in trading volume; and
|
|
•
|
$3.4 million increase due to an increase in per unit margin.
|
Net gain (loss) on sale
of leasing equipment.
Gain on sale of equipment was
$35.4 million
in
2018
compared to a gain on sale of equipment of
$35.8 million
in
2017
,
a decrease
of
$0.4 million
. The decrease was primarily due to a 27.3% reduction in the volume of containers sold, partially offset by a 20.9% increase in average used container selling prices.
Net gain (loss) on sale of building.
On April 20, 2018 we completed the sale of an office building for net proceeds of
$27.6 million
and recognized a gain of
$21.0 million
.
Depreciation and amortization.
Depreciation and amortization was
$545.1 million
in
2018
compared to
$500.7 million
in
2017
,
an increase
of
$44.4 million
. The primary reasons for this increase are as follows:
|
•
|
$66.6 million increase due to a net increase in the size of our depreciable fleet; partially offset by a
|
|
•
|
$13.6 million decrease due to an increase in the number of containers that are fully depreciated;
|
|
•
|
$5.8 million decrease due to an increase in other fully depreciated assets; and
|
|
•
|
$3.5 million decrease due to the reclassification of certain contracts from operating leases to finance leases in the fourth quarter of 2018 as a result of the renegotiation and extension of the contracts.
|
Direct operating expenses.
Direct operating expenses primarily consist of our costs to repair equipment returned off lease, store the equipment when it is not on lease and reposition equipment that has been returned to locations with weak leasing demand.
44
Direct operating expenses were
$48.3 million
in
2018
compared to
$62.9 million
in
2017
,
a decrease
of
$14.6 million
. The primary reasons for the decrease are as follows:
|
•
|
$15.4 million decrease due to a decrease in storage, handling, and repositioning costs due to a decrease in the number of our containers that were off-hire
|
|
•
|
$1.5 million decrease due to a decrease in inspection costs due to less new equipment purchases; partially offset by a
|
|
•
|
$2.2 million increase due to an increase in repair costs as a result of an increase in the volume of redeliveries in the fourth quarter of 2018.
|
Administrative expenses.
Administrative expenses were
$80.0 million
in
2018
compared to
$87.6 million
in
2017
,
a decrease
of
$7.6 million
. The decrease was primarily due to a decrease in payroll and benefit expenses and professional fees of $6.9 million partially offset by an increase in foreign currency exchange loss of
$1.1 million
due to a stronger U.S. dollar.
Transaction and other costs (income).
Transaction and other costs include severance and employee compensation costs, legal costs and other professional fees related to the Merger in 2016. Transaction and other costs were
minimal
in
2018
compared to
$9.3 million
in
2017
. We accrued employee severance expenses in 2017, while Merger related activities were mostly complete by the start of 2018.
Provision for doubtful accounts.
Provision for doubtful accounts was a benefit of
$0.2 million
in
2018
compared to
$3.3 million
expense in
2017
, a decrease of
$3.5 million
. The decrease in 2018 was due to recoveries of previously reserved balances as well as a decrease in new provisions.
Insurance recovery income.
There was no significant insurance recovery income in
2018
compared to
$6.8 million
in
2017
. The insurance recovery income was due to the recognition of income related to the satisfaction of our credit insurance claims with respect to the lease default by Hanjin in 2016.
Interest and debt expense.
Interest and debt expense was
$322.7 million
in
2018
compared to
$282.3 million
in
2017
,
an increase
of
$40.4 million
. The primary reasons for this increase are as follows:
|
•
|
$22.3 million increase due to an increase in the average debt balance of $531.0 million during 2018 compared to 2017; and
|
|
•
|
$18.1 million increase due to an increase in the average effective interest rate to 4.39% in 2018 compared to 4.14% in 2017. The increase in the effective interest rate was primarily due to an increase in short-term interest rates on our unhedged variable-rate debt facilities.
|
Realized (gain) loss on derivative instruments, net.
Realized gain on derivative instruments, net was
$2.1 million
in
2018
, compared to a loss of
$0.9 million
in
2017
,
an increase
of
$3.0 million
. The increase is primarily due to an increase in average one-month LIBOR, partially offset by a reduction of the underlying swap notional amounts due to the amortization, terminations and expirations of certain interest rate swap contracts.
Unrealized loss (gain) on derivative instruments, net.
Unrealized loss on derivative instruments, net was
$0.4 million
in
2018
, compared to a gain of
$1.4 million
in
2017
,
a decrease
of
$1.8 million
. The unrealized loss in 2018 was due to a decrease in long-term interest rates compared to an increase in long-term interest rates in the comparative period in 2017. The loss was partially offset by a decrease in the notional value of our swap portfolio.
Debt termination expense.
Debt termination expense was
$6.1 million
in
2018
compared to
$7.0 million
in
2017
. The
decrease
of
$0.9 million
was mainly due to fewer debt facilities being amended or terminated.
Income taxes.
Income tax expense was
$70.6 million
in
2018
compared to an income tax benefit of
$93.3 million
in
2017
,
an increase
in income tax expense of
$163.9 million
. The primary reasons for the increase are as follows:
|
•
|
$24.7 million increase related to a U.S. entity to foreign entity intra-company asset sale; and
|
|
•
|
$139.4 million increase due to a one-time tax benefit recorded in 2017 that did not reoccur. The one-time benefit in 2017 reflected a decrease in our deferred tax liability resulting from the reduction of the U.S. corporate tax rate from 35% to 21% as part of the U.S. Tax Cuts and Jobs Act.
|
Income attributable to non-controlling interests.
Income attributable to non-controlling interests was
$7.1 million
in
2018
compared to
$8.9 million
in
2017
,
a decrease
of
$1.8 million
. The decrease is primarily due to a reduction in the size of the portfolio of containers owned by the entity in which the non-controlling interests maintain their ownership.
45
Comparison of the Year Ended
December 31, 2017
to Year Ended
December 31, 2016
The following table summarizes our comparative results for the periods indicated (in thousands):
|
|
Year Ended December 31, 2017
|
Year Ended December 31, 2016
(1)
|
Variance
|
||||||||
|
Leasing revenues:
|
|||||||||||
|
Operating leases
|
$
|
1,141,165
|
|
$
|
813,357
|
|
$
|
327,808
|
|
||
|
Finance leases
|
22,352
|
|
15,337
|
|
7,015
|
|
|||||
|
Total leasing revenues
|
1,163,517
|
|
828,694
|
|
334,823
|
|
|||||
|
|
|
||||||||||
|
Equipment trading revenues
|
37,419
|
|
16,418
|
|
21,001
|
|
|||||
|
Equipment trading expenses
|
(33,235
|
)
|
(15,800
|
)
|
(17,435
|
)
|
|||||
|
Trading margin
|
4,184
|
|
618
|
|
3,566
|
|
|||||
|
|
|
||||||||||
|
Net gain (loss) on sale of leasing equipment
|
35,812
|
|
(20,347
|
)
|
56,159
|
|
|||||
|
|
|
||||||||||
|
Operating expenses:
|
|
|
|||||||||
|
Depreciation and amortization
|
500,720
|
|
392,592
|
|
108,128
|
|
|||||
|
Direct operating expenses
|
62,891
|
|
84,256
|
|
(21,365
|
)
|
|||||
|
Administrative expenses
|
87,609
|
|
65,618
|
|
21,991
|
|
|||||
|
Transaction and other costs (income)
|
9,272
|
|
66,916
|
|
(57,644
|
)
|
|||||
|
Provision (reversal) for doubtful accounts
|
3,347
|
|
23,304
|
|
(19,957
|
)
|
|||||
|
Insurance recovery income
|
(6,764
|
)
|
—
|
|
(6,764
|
)
|
|||||
|
Total operating expenses
|
657,075
|
|
632,686
|
|
24,389
|
|
|||||
|
Operating income (loss)
|
546,438
|
|
176,279
|
|
370,159
|
|
|||||
|
Other expenses:
|
|
||||||||||
|
Interest and debt expense
|
282,347
|
|
184,014
|
|
98,333
|
|
|||||
|
Realized loss (gain) on derivative instruments, net
|
900
|
|
3,438
|
|
(2,538
|
)
|
|||||
|
Unrealized (gain) loss on derivative instruments, net
|
(1,397
|
)
|
(4,405
|
)
|
3,008
|
|
|||||
|
Debt termination expense
|
6,973
|
|
141
|
|
6,832
|
|
|||||
|
Other (income) expense, net
|
(2,637
|
)
|
(1,076
|
)
|
(1,561
|
)
|
|||||
|
Total other expenses
|
286,186
|
|
182,112
|
|
104,074
|
|
|||||
|
Income (loss) before income taxes
|
260,252
|
|
(5,833
|
)
|
266,085
|
|
|||||
|
Income tax expense (benefit)
|
(93,274
|
)
|
(48
|
)
|
(93,226
|
)
|
|||||
|
Net income (loss)
|
$
|
353,526
|
|
$
|
(5,785
|
)
|
$
|
359,311
|
|
||
|
Less: income (loss) attributable to non-controlling interest
|
8,928
|
|
7,732
|
|
1,196
|
|
|||||
|
Net income (loss) attributable to shareholders
|
$
|
344,598
|
|
$
|
(13,517
|
)
|
$
|
358,115
|
|
||
|
(1)
|
Our operating performance and revenues were significantly impacted by the Merger on July 12, 2016 and the subsequent inclusion of TAL's results of operations and equipment fleet in our financial results and operating metrics. TCIL has been treated as the acquirer in the Merger for accounting purposes, and therefore, the results of operations for Triton, included herein, for the periods prior to the date of the Merger are for TCIL operations alone.
|
46
Leasing revenues.
Per diem revenues represents revenue earned under operating lease contracts. Fee and ancillary lease revenue represents fees billed for the pick-up and drop-off of containers in certain geographic locations and billings of certain reimbursable operating costs such as repair and handling expenses. Finance lease revenue represents interest income earned under finance lease contracts. The following table summarize our leasing revenues for the periods indicated below (in thousands):
|
Leasing revenue
|
Year Ended December 31, 2017
|
Year Ended December 31, 2016
|
Variance
|
||||||||
|
Operating lease revenues:
|
|
||||||||||
|
Per diem revenues
|
$
|
1,100,507
|
|
$
|
762,011
|
|
$
|
338,496
|
|
||
|
Fee and ancillary revenues
|
40,658
|
|
51,346
|
|
(10,688
|
)
|
|||||
|
Total operating lease revenues
|
1,141,165
|
|
813,357
|
|
327,808
|
|
|||||
|
Finance leases
|
22,352
|
|
15,337
|
|
7,015
|
|
|||||
|
Total leasing revenues
|
$
|
1,163,517
|
|
$
|
828,694
|
|
$
|
334,823
|
|
||
Total leasing revenues were
$1,163.5 million
, net of lease intangible amortization of $88.6 million, in
2017
compared to
$828.7 million
, net of lease intangible amortization of $55.5 million, in
2016
, an increase of
$334.8 million
.
Per diem revenues were
$1,100.5 million
in
2017
compared to
$762.0 million
in
2016
, an increase of
$338.5 million
. The primary reasons for this increase are as follows:
|
•
|
$223.6 million increase due to the inclusion of TAL's per diem revenues for the full year in 2017 while TAL’s per diem revenues were included only after July 12
th
in 2016;
|
|
•
|
$128.3 million increase due to an increase of 1,131,167 CEU in the average number of containers on-hire under operating leases; partially offset by a
|
|
•
|
$14.9 million decrease due to a decrease in average CEU per diem rates.
|
Fee and ancillary lease revenues were
$40.7 million
in
2017
compared to
$51.3 million
in
2016
, a decrease of
$10.7 million
. The primary reasons for this decrease are as follows:
|
•
|
$10.2 million increase due to the inclusion of TAL's fees and ancillary lease revenues for the full year in 2017 while TAL’s fee and ancillary lease revenues were included only after July 12
th
in 2016; and a
|
|
•
|
$20.9 million decrease in redelivery fees due to a decrease in the volume of customer redeliveries resulting from strong lease demand.
|
Finance lease revenues were
$22.4 million
in
2017
compared to
$15.3 million
in
2016
, an increase of
$7.0 million
. The primary reasons for this increase are as follows:
|
•
|
$3.9 million increase due to the inclusion of TAL's finance lease revenues for the full year in 2017 while TAL’s finance lease revenues were included only after July 12
th
in 2016;
|
|
•
|
$4.7 million increase due to the inclusion of a finance lease contract that commenced in September 2016 for the twelve months in 2017 as compared to four months in 2016; and
|
|
•
|
$1.6 million decrease due to the amortization of the existing portfolio.
|
Trading margin.
Prior to the Merger, Triton did not have a trading business. Trading margin was
$4.2 million
in
2017
compared to
$0.6 million
in
2016
. The increase of
$3.6 million
is the result of the inclusion of the trading business for a full year in 2017, while the trading business was only included after July 12
th
in 2016, as well as a result of an increase in the trading disposal volume and margins.
47
Net gain (loss) on sale of leasing equipment.
Gain on sale of equipment was
$35.8 million
in
2017
compared to a loss on sale of equipment of
$20.3 million
in
2016
, an increase of
$56.1 million
. The primary reasons for this increase are as follows:
|
•
|
$8.9 million increase due to the inclusion of TAL's gains on sale of leasing equipment for the full year in 2017 while TAL's gains on sale of leasing equipment were included only after July 12
th
in 2016; and a
|
|
•
|
$47.2 million increase due to an approximately 50% increase in our average used container selling prices.
|
Depreciation and amortization.
Depreciation and amortization was
$500.7 million
in
2017
compared to
$392.6 million
in
2016
, an increase of
$108.1 million
. The primary reasons for this increase are as follows:
|
•
|
$95.8 million increase due to the inclusion of TAL's depreciation and amortization for the full year in 2017 while TAL's depreciation and amortization was included only after July 12
th
in 2016;
|
|
•
|
$33.2 million increase due to a net increase in the size of our depreciable fleet; partially offset by a
|
|
•
|
$13.1 million decrease due to an impairment charge recorded as depreciation expense in 2016. There was no impairment charge recorded as depreciation expense in 2017; and
|
|
•
|
$7.0 million decrease due to equipment becoming fully depreciated.
|
Direct operating expenses.
Direct operating expenses primarily consist of our costs to repair equipment returned off lease, store the equipment when it is not on lease and reposition equipment that has been returned to locations with weak leasing demand. Direct operating expenses were
$62.9 million
in
2017
compared to
$84.3 million
in
2016
, a decrease of
$21.4 million
. The primary reasons for this decrease are as follows:
|
•
|
$20.2 million increase due to the inclusion of TAL's direct operating expenses for the full year in 2017 while TAL’s direct operating expenses were included only after July 12
th
in 2016;
|
|
•
|
$22.2 million decrease due to a decrease in storage expenses resulting from decreases in the number of idle units; and
|
|
•
|
$16.5 million decrease due to a decrease in equipment repair and handling expenses resulting from decreases in the number of containers redelivered.
|
Administrative expenses.
Administrative expenses were
$87.6 million
in
2017
compared to
$65.6 million
in
2016
, an increase of
$22.0 million
. The primary reasons for this increase are as follows:
|
•
|
$23.5 million increase due to the inclusion of TAL administrative expenses for the full year in 2017 while TAL’s administrative expenses were included only after July 12
th
in 2016;
|
|
•
|
$3.0 million increase due to an increase in bonus expense as a result of improved financial performance;
|
|
•
|
$3.5 million increase due to a benefit in 2016 caused by a reclassification of accrued bonus expense from administrative expense to transaction and other costs that did not re-occur in 2017;
|
|
•
|
$3.5 million increase due to an increase in our professional fees and directors' share-based compensation expense; partially offset by a
|
|
•
|
$14.5 million decrease due to a decrease in employee compensation and benefit expense as a result of synergies gained from the Merger in addition to the $7.7 million in savings recognized in 2016. The $23.5 million increase in administrative expenses due to the inclusion of TAL administrative expenses in 2017, includes a benefit of $3.3 million related to employee compensation and benefit savings as a result of synergies gained from the Merger.
|
Transaction and other (income) costs.
Transaction and other costs include severance and employee compensation costs, legal costs and other professional fees. Transaction and other costs related to the Merger were $8.8 million in 2017 compared to $60.4 million in 2016. We accrued significant legal and other professional fees and employee severance expenses related to the Merger in 2016.
Transaction and other costs also include retention and stock compensation costs pursuant to the plans established in 2011. Transaction and other costs unrelated to the Merger were $0.5 million in 2017 and $6.5 million in 2016. The decrease in transaction and other costs unrelated to the Merger was mainly due to a reduction in stock compensation accruals on incentive stock initially granted in 2011.
Provision for doubtful accounts.
Provision for doubtful accounts was
$3.3 million
in
2017
compared to
$23.3 million
in
2016
. The 2016 provision for doubtful accounts is largely related to the lease default by Hanjin.
Insurance recovery income.
Insurance recovery income was
$6.8 million
in
2017
due to the recognition of a gain related to the satisfaction of our credit insurance claims with respect to the lease default by Hanjin. There was no insurance recovery income in 2016.
48
Interest and debt expense.
Interest and debt expense was
$282.3 million
in
2017
compared to
$184.0 million
in
2016
, an increase of
$98.3 million
. The primary reasons for this increase are as follows:
|
•
|
$65.2 million increase due to the inclusion of TAL's interest and debt expense for the full year in 2017 while TAL’s interest and debt expense was included only after July 12
th
in 2016;
|
|
•
|
$18.3 million increase due to a higher average debt balance during 2017 compared to 2016; and
|
|
•
|
$14.8 million increase due to an increase in the average effective interest rate to 4.33% in 2017 compared to 4.02% in 2016.
|
Realized (gain) loss on derivative instruments, net.
Realized loss on derivative instruments, net was
$0.9 million
in
2017
, compared to
$3.4 million
in
2016
, a decrease of
$2.5 million
. The decrease in the realized loss on derivative instruments, net is mainly due to the reduction of the underlying swap notional amounts due to amortization and the termination of three interest rate swaps and an increase in the average one-month LIBOR rate in 2017 compared to 2016. TAL's inclusion for the full year-to-date period in 2017 compared to partial inclusion in 2016 increased the realized loss on derivative instruments, net by $0.1 million in the 2017.
Unrealized (gain) loss on derivative instruments, net.
Unrealized gain on derivative instruments, net was
$1.4 million
in
2017
, compared to
$4.4 million
in
2016
, a decrease of
$3.0 million
. Long-term interest rates increased to a lesser extent between December 31, 2016 to December 31, 2017 compared to the increase between December 31, 2015 to December 31, 2016.
Debt termination expense.
Write-off of debt costs was
$7.0 million
in
2017
compared to
$0.1 million
in
2016
. The increase of
$6.9 million
was mainly due to the amendment or termination of certain existing debt facilities and the resulting write-off of the unamortized debt costs related to those facilities.
Income taxes.
Income tax benefit was
$93.3 million
in
2017
compared to an income tax benefit of
$0.05 million
in
2016
, an increase in income tax benefit of
$93.2 million
. As a result of the U.S. Tax Cuts and Jobs Act and the related reduction of the U.S. Corporate tax rate from 35% to 21%, we recorded a one-time tax benefit of $139.4 million in the fourth quarter in 2017 to reflect the deferred tax liability at the lower corporate tax rate. This benefit was partially offset by a tax provision for income taxes on operating income at the effective tax rate of 17.7%.
Income attributable to non-controlling interests.
Income attributable to non-controlling interests was
$8.9 million
in
2017
compared to
$7.7 million
in
2016
, an increase of
$1.2 million
. The increase was a result of higher income from gains on the disposition of container rental equipment attributable to the non-controlling interests, partially offset by a reduction in the size of the portfolio of containers owned by the entity in which the non-controlling interests maintain their ownership and a continuing decrease in the proportion of disposition income attributable to the non-controlling interests compared to the portion allocated to Triton.
49
Segments
Our leasing segment is discussed in our results of operations comparisons and the trading segment is discussed in the trading margin comparison within the results of operations comparisons.
For additional information on our segments, please see Note 11 - "Segment and Geographic Information" of the Notes to Consolidated Financial Statements included in Part IV, Item 15 of this Annual Report on Form 10-K.
Liquidity and Capital Resources
Our principal sources of liquidity are cash flows provided by operating activities, proceeds from the sale of our leasing equipment, principal payments on finance lease receivables, and borrowings under our credit facilities. Our principal uses of cash include capital expenditures, debt service requirements and paying dividends.
For the year ended
December 31, 2018
, cash provided by operating activities, together with the proceeds from the sale of our leasing equipment and principal payments on our finance leases, was
$1,157.5 million
. In addition, as of
December 31, 2018
we had
$49.0 million
of cash and cash equivalents and
$1.4 billion
of additional borrowing capacity under our current credit facilities.
As of
December 31, 2018
, our cash commitments in the next 12 months include
$972.3 million
of scheduled principal payments on our existing debt facilities, and
$50.6 million
of committed but unpaid capital expenditures.
We believe that cash provided by operating activities, existing cash, proceeds from the sale of our leasing equipment, principal payments on our finance lease receivables and availability under our borrowing facilities will be sufficient to meet our obligations over the next
twelve
months.
Debt Agreements
As of
December 31, 2018
, our outstanding indebtedness was comprised of the following (amounts in millions):
|
Amount
Outstanding
|
Maximum
Borrowing
Level
|
||||||
|
Institutional notes
|
$
|
2,198.2
|
|
$
|
2,198.2
|
|
|
|
Asset-backed securitization term notes
|
3,063.8
|
|
3,063.8
|
|
|||
|
Term loan facilities
|
1,543.4
|
|
1,543.4
|
|
|||
|
Asset-backed securitization warehouse
|
340.0
|
|
900.0
|
|
|||
|
Revolving credit facilities
|
375.0
|
|
1,235.0
|
|
|||
|
Capital lease obligations
|
75.5
|
|
75.5
|
|
|||
|
Total debt outstanding
|
$
|
7,595.9
|
|
$
|
9,015.9
|
|
|
|
Debt costs
|
(44.9
|
)
|
—
|
|
|||
|
Unamortized debt premiums & discounts
|
(5.3
|
)
|
—
|
|
|||
|
Unamortized fair value debt adjustment
|
(16.3
|
)
|
—
|
|
|||
|
Debt, net of unamortized debt costs
|
$
|
7,529.4
|
|
$
|
9,015.9
|
|
|
The maximum borrowing levels depicted in the chart above may not reflect the actual availability under all of the credit facilities. Certain of these facilities are governed by borrowing bases that limit borrowing capacity to an established percentage of relevant assets. As of
December 31, 2018
, the actual availability under all of our credit facilities was approximately
$425.2 million
.
As of
December 31, 2018
, we had a combined
$6,164.1 million
of total debt on facilities with fixed interest rates or floating interest rates that have been synthetically fixed through interest rate swap contracts. This accounts for
81.2%
of total debt.
Pursuant to the terms of certain debt agreements, we are also required to maintain certain restricted cash accounts. As of
December 31, 2018
, we had restricted cash of
$110.6 million
.
50
For additional information on our debt, please see Note 6 - "Debt" of the Notes to Consolidated Financial Statements included in Part IV, Item 15 of this Annual Report on Form 10-K.
Debt Covenants
We are subject to certain financial covenants under our debt agreements. The debt agreements are the obligations of our subsidiaries and all related debt covenants are calculated at the subsidiary level. Failure to comply with these covenants could result in a default under the related credit agreements and the acceleration of our outstanding debt if we were unable to obtain a waiver from the creditors. As of
December 31, 2018
, we were in compliance with all such covenants.
Non-GAAP Measures
We primarily rely on our results measured in accordance with generally accepted accounting principles ("GAAP") in evaluating our business. The covenant descriptions below include non-GAAP financial measures that are defined in our debt agreements. Fixed Charge Coverage Ratio, Minimum Consolidated Tangible Net Worth ("CTNW"), Funded Debt Ratio, Earnings Before Interest and Taxes ("EBIT"), Cash Interest Expense, Tangible Net Worth ("TNW"), and Indebtedness are non-GAAP financial measures defined in our debt agreements that are used to determine our compliance with certain covenants contained in our debt agreements and should not be used as a substitute for analysis of our results as reported under GAAP. However, we believe that the inclusion of this non-GAAP information provides additional information to investors regarding our debt covenant compliance.
TCIL Covenants
The Fixed Charge Coverage Ratio is the rolling six-quarter ratio of consolidated net income of our TCIL subsidiary available for fixed charges to fixed charges. Consolidated net income available for fixed charges excludes non-cash gains and losses on derivatives instruments, plus cash distributions received from certain unrestricted subsidiaries, plus all fixed charges. Fixed charges are the sum of interest expense and operating rental payments less interest income and the amortization of debt costs.
CTNW of our TCIL subsidiary comprises the equity of TCIL and its restricted subsidiaries, excluding any non-cash gains and/or losses from derivative instruments, less the sum of all intangible assets and restricted investments of TCIL and its subsidiaries. For the purpose of calculating CTNW, TCIL's investments in certain unrestricted subsidiaries are included in equity.
Funded Debt Ratio is the total debt of our TCIL subsidiary to CTNW.
TAL Covenants
EBIT to Cash Interest Expense is the rolling four-quarter ratio of EBIT to Cash Interest Expense for our TAL subsidiary. EBIT is calculated as earnings before interest expense, income taxes, net gain or losses on interest rate swaps, certain non-cash charges, and Merger costs. Cash Interest Expense is calculated as interest expense paid in cash and excludes interest income and amortization of debt costs.
TNW is calculated as total tangible assets less total indebtedness for our TAL subsidiary.
Indebtedness to TNW is calculated as the ratio of Indebtedness to TNW for our TAL subsidiary.
The compliance levels of our primary financial covenants as of
December 31, 2018
are summarized as follows:
|
Financial Covenant
|
Entity
|
Covenant Threshold
|
Actual Value
|
|||
|
Fixed Charge Coverage Ratio
|
TCIL
|
Shall not be less than 1.25:1
|
2.58:1
|
|||
|
Minimum Consolidated Tangible Net Worth
|
TCIL
|
Shall not be less than $855 million
|
$1,705.4 million
|
|||
|
Funded Debt Ratio
|
TCIL
|
Shall not exceed 4.0:1
|
3.33:1
|
|||
|
EBIT to Cash Interest Expense
|
TAL
|
Shall not be less than 1.10:1
|
2.21:1
|
|||
|
Minimum Tangible Net Worth
|
TAL
|
Shall not be less than $300 million
|
$982.7 million
|
|||
|
Indebtedness to TNW
|
TAL
|
Shall not exceed 4.75:1
|
2.20:1
|
|||
Share Repurchase
51
On August 1, 2018, the Company's Board of Directors authorized the repurchase of up to
$200.0 million
of its common shares. During the year ended
December 31, 2018
, the Company repurchased
1,853,148
common shares at an average price per-share of
$31.34
for a total of
$58.1 million
. As of
February 8, 2019
,
$134.9 million
remains available of the
$200.0 million
common share repurchase authorized by the Board in August 2018.
Cash Flow
The following table sets forth certain cash flow information for the years ended
December 31, 2018
,
2017
, and
2016
(in thousands):
|
|
Year Ended December 31, 2018
|
Year Ended December 31, 2017
|
Year Ended December 31, 2016
|
|||||||||
|
Net cash provided by (used in) operating activities
|
$
|
929,850
|
|
$
|
806,795
|
|
$
|
484,188
|
|
|||
|
Net cash provided by (used in) investing activities
|
$
|
(1,348,409
|
)
|
$
|
(1,311,391
|
)
|
$
|
(395,446
|
)
|
|||
|
Net cash provided by (used in) financing activities
|
$
|
351,927
|
|
—
|
|
$
|
567,275
|
|
$
|
(63,629
|
)
|
|
Operating Activities
Net cash provided by operating activities
increased
by
$123.1 million
to
$929.9 million
in
2018
, compared to
$806.8 million
in
2017
. The change was primarily due to an increase in pre-tax income as a result of a larger fleet size and higher utilization.
Net cash provided by operating activities increased by $322.6 million to $806.8 million in 2017, compared to $484.2 million in 2016. Operating cash flows increased by $115.4 million due to the inclusion of TAL’s cash flows for the full year in 2017 while TAL’s operating cash flows were included only after July 12, 2016. The remaining increase was mainly due to an increased level of profitability as a result of the increase in our fleet size and utilization.
Investing Activities
Net cash used in investing activities increased by
$37.0 million
to
$1,348.4 million
in
2018
compared to
$1,311.4 million
in
2017
primarily due to an increase in purchases of leasing equipment and a decrease in the volume of container disposals.
Net cash used in investing activities increased by $916.0 million to $1,311.4 million in 2017 compared to $395.4 million in 2016. This increase was primarily due to an increase in the purchase of leasing equipment of $933.6 million and by $50.3 million of cash acquired in the Merger in 2016 that did not re-occur in 2017. These increases were partially offset by a $67.1 million increase in cash provided by proceeds from the sale of equipment and principal payments on finance leases.
Financing Activities
Net cash provided by financing activities
decreased
by
$215.3 million
to
$351.9 million
in
2018
compared to
$567.3 million
in
2017
. The decrease was primarily due to proceeds of
$192.9 million
from issuances of common shares in
2017
compared with no issuance in
2018
. Additionally, $56.3 million of the decrease was due to the repurchase of common shares in
2018
. These changes were partially offset by
an increase
in net borrowings.
Net cash provided by financing activities increased by $630.9 million to $567.3 million in 2017 compared to cash used in financing activities of $63.6 million in 2016. The increase was primarily due to net borrowings, inclusive of debt issuance costs, under debt facilities of $528.6 million in 2017 compared to $53.3 million in 2016. In addition, we had proceeds from issuances of common shares of $192.9 million in 2017 compared to $7.4 million of share redemptions in 2016. These increases in cash provided by financing activities were partially offset by an increase in dividend payments of $50.8 million.
Contractual Obligations
We are party to various operating and capital leases and are obligated to make payments related to our borrowings. We are also obligated under various commercial commitments, including obligations to our equipment manufacturers. Our equipment manufacturer obligations are in the form of conventional accounts payable and are satisfied by cash flows from operations and financing activities.
52
The following table summarizes our contractual obligations and commercial commitments as of
December 31, 2018
:
|
|
Contractual Obligations by Period
|
||||||||||||||||||||||||||
|
Contractual Obligations:
|
Total
|
2019
|
2020
|
2021
|
2022
|
2023
|
2024 and thereafter
|
||||||||||||||||||||
|
|
(dollars in millions)
|
||||||||||||||||||||||||||
|
Principal debt obligations
|
$
|
7,520.4
|
|
$
|
964.3
|
|
$
|
825.7
|
|
$
|
812.3
|
|
$
|
1,707.2
|
|
$
|
1,476.1
|
|
$
|
1,734.8
|
|
||||||
|
Interest on debt obligations
(1)
|
1,234.0
|
|
303.4
|
|
265.5
|
|
229.6
|
|
177.0
|
|
117.4
|
|
141.1
|
|
|||||||||||||
|
Capital lease obligations
(2)
|
86.2
|
|
11.2
|
|
10.8
|
|
10.8
|
|
10.8
|
|
18.7
|
|
23.9
|
|
|||||||||||||
|
Operating leases (mainly facilities)
|
11.9
|
|
3.2
|
|
2.9
|
|
2.4
|
|
2.0
|
|
1.4
|
|
—
|
|
|||||||||||||
|
Purchase obligations:
|
|
|
|
|
|
|
|||||||||||||||||||||
|
Equipment purchases payable
|
22.4
|
|
22.4
|
|
—
|
|
—
|
|
—
|
|
—
|
|
—
|
|
|||||||||||||
|
Equipment purchase commitments
|
28.2
|
|
28.2
|
|
—
|
|
—
|
|
—
|
|
—
|
|
—
|
|
|||||||||||||
|
Severance benefit commitment
|
1.2
|
|
1.2
|
|
—
|
|
—
|
|
—
|
|
—
|
|
—
|
|
|||||||||||||
|
Total contractual obligations
|
$
|
8,904.3
|
|
$
|
1,333.9
|
|
$
|
1,104.9
|
|
$
|
1,055.1
|
|
$
|
1,897.0
|
|
$
|
1,613.6
|
|
$
|
1,899.8
|
|
||||||
|
(1)
|
Amounts include actual interest for fixed debt and estimated interest for floating rate debt based on
December 31, 2018
rates and the net effect of our interest rate swaps.
|
|
(2)
|
Amounts include interest.
|
Off-Balance Sheet Arrangements
As of
December 31, 2018
, we did not have any relationships with unconsolidated entities or financial partnerships, which are often referred to as structured finance or special purpose entities, which would have been established for the purpose of facilitating off-balance sheet arrangements. We are, therefore, not exposed to any financing, liquidity, market or credit risk that could arise if we had engaged in such relationships.
53
Critical Accounting Policies
Our consolidated financial statements have been prepared in conformity with GAAP, which requires us to make estimates and assumptions that affect the amounts and disclosures reported in the consolidated financial statements and accompanying notes. We base our estimates and judgments on historical experience and on various other assumptions that we believe are reasonable under the circumstances. We evaluate our estimates and assumptions on an ongoing basis. Our actual results may differ from these estimates under different assumptions or conditions.
Leasing Equipment
We purchase new equipment from equipment manufacturers for the purpose of leasing such equipment to customers. We also purchase used equipment with the intention of selling such equipment in one or more years from the date of purchase. Used units are typically purchased with an existing lease in place or were previously owned by one of our third party owner investors.
Leasing equipment is recorded at cost and depreciated to an estimated residual value on a straight-line basis over the estimated useful lives. Capitalized costs for new container rental equipment include the manufactured cost of the container, inspection, delivery, and associated costs incurred in moving the container from the manufacturer to the initial on-hire location of such container. Repair and maintenance costs that do not extend the lives of the container rental equipment are charged to direct operating expenses at the time the costs are incurred.
The estimated useful lives and residual values of our leasing equipment are based on historical disposal experience and our expectations for future used container sale prices. We review the estimates used in our depreciation policies on a regular basis to determine whether changes have taken place that would suggest that a change in our depreciation estimates of useful lives of our equipment or the assigned residual values is warranted. The Company completed its annual depreciation policy review during the fourth quarter of 2018 and concluded no change was necessary.
On January 1, 2018, we changed the estimated residual values for 20-foot refrigerated containers and 40-foot high cube refrigerated containers to
$2,350
and
$3,350
, respectively, as compared to the previous ranges of
$2,250
to
$2,500
for 20-foot refrigerated containers and
$3,250
to
$3,500
for 40-foot high cube refrigerated containers. The estimated residual values for 40-foot flat rack containers and 40-foot open top containers were changed to
$1,700
and
$2,300
, respectively, as compared to the previous ranges of
$1,500
to
$3,000
for 40-foot flat rack containers and
$2,300
to
$2,500
for 40-foot open top containers. In addition, the useful lives for 40-foot flat rack containers and 40-foot open top containers was changed to
16 years
from the previous range of
12 to 14 years
. The effects of changes to residual value and useful life estimates were immaterial to our consolidated financial statements.
The estimated useful lives and residual values for each major equipment type for the periods are indicated below as follows:
|
As of December 31, 2018
|
As of December 31, 2017
|
||||||||||
|
Equipment Type
|
Depreciable Life
|
Residual Value
|
Depreciable Life
|
Residual Value
|
|||||||
|
Dry containers
|
|||||||||||
|
20-foot dry container
|
13 years
|
$
|
1,000
|
|
13 years
|
$
|
1,000
|
|
|||
|
40-foot dry container
|
13 years
|
$
|
1,200
|
|
13 years
|
$
|
1,200
|
|
|||
|
40-foot high cube dry container
|
13 years
|
$
|
1,400
|
|
13 years
|
$
|
1,400
|
|
|||
|
Refrigerated containers
|
|||||||||||
|
20-foot refrigerated container
|
12 years
|
$
|
2,350
|
|
12 years
|
$2,250 to $2,500
|
|||||
|
40-foot high cube refrigerated container
|
12 years
|
$
|
3,350
|
|
12 years
|
$3,250 to $3,500
|
|||||
|
Special containers
|
|||||||||||
|
40-foot flat rack container
|
16 years
|
$
|
1,700
|
|
12 to 14 years
|
$1,500 to $3,000
|
|||||
|
40-foot open top container
|
16 years
|
$
|
2,300
|
|
12 to 14 years
|
$2,300 to $2,500
|
|||||
|
Tank containers
|
20 years
|
$
|
3,000
|
|
20 years
|
$
|
3,000
|
|
|||
|
Chassis
|
20 years
|
$
|
1,200
|
|
20 years
|
$
|
1,200
|
|
|||
Depreciation on leasing equipment commences on the date of initial on-hire.
For leasing equipment acquired through sale-leaseback transactions, we adjust our estimates for remaining useful life and residual values based on current conditions in the sales market for older containers and our expectations for how long the equipment will remain on-hire to the current lessee.
54
The net book value of our leasing equipment by equipment type is as follows (in thousands):
|
December 31, 2018
|
December 31, 2017
|
|||||||
|
Dry container units
|
$
|
6,666,560
|
|
$
|
5,941,097
|
|
||
|
Refrigerated container units
|
1,676,331
|
|
1,897,385
|
|
||||
|
Special container units
|
322,607
|
|
287,869
|
|
||||
|
Tank container units
|
107,284
|
|
105,821
|
|
||||
|
Chassis
|
150,669
|
|
132,312
|
|
||||
|
Total
|
$
|
8,923,451
|
|
$
|
8,364,484
|
|
||
Included in the amounts above are units not on lease at
December 31, 2018
and
2017
with a total net book value of
$551.1 million
and
$509.5 million
, respectively. Amortization on equipment purchased under capital lease obligations is included in depreciation and amortization expense on the consolidated statements of operations.
Valuation of Leasing Equipment
Leasing equipment is reviewed for impairment whenever events or changes in circumstances indicate that its carrying value may not be recoverable. Recoverability of an asset to be held and used is measured by a comparison of the carrying value to its estimated undiscounted future cash flows expected to be generated by the asset. If the carrying value of an asset exceeds our estimated undiscounted future cash flows, an impairment charge is recognized in the amount by which the carrying value of the asset exceeds the fair value of the asset. Key indicators of impairment on leasing equipment include, among other factors, a sustained decrease in operating profitability, a sustained decrease in utilization, or indications of technological obsolescence.
When testing for impairment, leasing equipment is generally grouped by equipment type, and is tested separately from other groups of assets and liabilities. Some of the significant estimates and assumptions used to determine future undiscounted cash flows and the measurement for impairment are the remaining useful life, expected utilization, expected future lease rates and expected disposal prices of the equipment. We consider the assumptions on expected utilization and the remaining useful life to have the greatest impact on its estimate of future undiscounted cash flows. These estimates are principally based on our historical experience and management's judgment of market conditions.
We did not record any impairment charges related to leasing equipment for the years ended
December 31, 2018
, and
2017
. For the year ended December 31,
2016
, the Company recorded
$13.1 million
of impairment charges in depreciation and amortization expense related to leasing equipment.
Equipment Held for Sale
When leasing equipment is returned off lease, we make a determination of whether to repair and re-lease the equipment or sell the equipment. At the time we determine that equipment will be sold, we reclassify the appropriate amounts previously recorded as leasing equipment to equipment held for sale. Equipment held for sale is carried at the lower of its estimated fair value, based on current transactions, less costs to sell, or carrying value. Depreciation expense on equipment held for sale is halted and disposals generally occur within 90 days. Initial write downs of equipment held for sale are recorded as an impairment charge and are included in net gain or loss on sale of leasing equipment. Subsequent increases or decreases to the fair value of those assets are recorded as adjustments to the carrying value of the equipment held for sale, however, any such adjustments may not exceed the respective equipment's carrying value at the time it was initially classified as held for sale. Realized gains and losses resulting from the sale of equipment held for sale are recorded as net gain or loss on sale of leasing equipment, and cash flows associated with the disposal of equipment held for sale are classified as cash flows from investing activities.
We acquired the Equipment Trading segment as part of the Merger on
July 12, 2016
and had no such reporting segment prior to that date. Equipment purchased for resale and included in the Equipment Trading segment is reported as equipment held for sale when the time frame between when equipment is purchased and when it is sold is expected to be less than one year.
During the years ended
December 31, 2018
,
2017
and
2016
, we recorded the following net gains or losses on equipment held for sale on the consolidated statements of operations (in thousands):
55
|
Year Ended December 31, 2018
|
Year Ended December 31, 2017
|
Year Ended December 31, 2016
|
|||||||||
|
Impairment (loss) reversal on equipment held for sale
|
$
|
(3,933
|
)
|
$
|
3
|
|
$
|
(19,399
|
)
|
||
|
Gain (loss) on sale of equipment-net of selling costs
|
39,310
|
|
35,809
|
|
(948
|
)
|
|||||
|
Net gain (loss) on sale of leasing equipment
|
$
|
35,377
|
|
$
|
35,812
|
|
$
|
(20,347
|
)
|
||
Goodwill
Goodwill is tested for impairment at least annually on October 31 of each fiscal year or more frequently if events occur or circumstances exist that indicate that the fair value of a reporting unit may be below its carrying value. Goodwill has been allocated to our reporting units which are also our operating segments.
In evaluating goodwill for impairment, we have the option to first assess qualitative factors to determine whether further impairment testing is necessary. Among other relevant events and circumstances that affect the fair value of reporting units, we consider individual factors such as macroeconomic conditions, changes in our industry and the markets in which we operate, as well as our reporting units' historical and expected future financial performance. If, after assessing the totality of events or circumstances, we determine it is more likely than not that the fair value of a reporting unit is greater than our carrying amount, then the quantitative goodwill impairment test is unnecessary. The quantitative goodwill impairment test compares the fair value of a reporting unit with our carrying amount, including goodwill. If the carrying amount of the reporting unit is less than its fair value, no impairment exists. If the carrying amount of a reporting unit exceeds its fair value, an impairment loss shall be recognized in an amount equal to that excess, limited to the total amount of goodwill allocated to that reporting unit.
We elected to perform the qualitative assessment for our evaluation of goodwill impairment during the year ended
December 31, 2018
and concluded there was no impairment. Since inception through
December 31, 2018
, we did not have any goodwill impairment.
For additional information on our accounting policies, please see Note 2 - "Summary of Significant Accounting Policies" of the Notes to Consolidated Financial Statements included in Part IV, Item 15 of this Annual Report on Form 10-K.
Recent Accounting Pronouncements
See Note 2 of the Notes to Consolidated Financial Statements included in Part IV, Item 15 of this Annual Report on Form 10-K for a full description of recent accounting pronouncements.
56
ITEM 7A. QUANTITATIVE AND QUALITATIVE DISCLOSURES ABOUT MARKET RISK
Market risk is the risk of loss to future earnings, values or cash flows that may result from changes in the price of a financial instrument. The fair value of a financial instrument, derivative or non-derivative, might change as a result of changes in interest rates, exchange rates, commodity prices, equity prices and other market changes. We have operations internationally and we are exposed to market risks in the ordinary course of our business. These risks include interest rate and foreign currency exchange rate risks.
Interest Rate Risk
We enter into interest rate swap and cap agreements to fix the interest rates on a portion of our floating rate debt. We assess and manage the external and internal risk associated with these derivative instruments in accordance with our overall operating goals. External risk is defined as those risks outside of our direct control, including counterparty credit risk, liquidity risk, systemic risk and legal risk. Internal risk relates to those operational risks within the management oversight structure and includes actions taken in contravention of our policy.
The primary external risk of our interest rate swap and cap agreements is counterparty credit exposure, which is defined as the ability of a counterparty to perform its financial obligations under a derivative agreement. All of our derivative agreements are with highly-rated financial institutions. Credit exposures are measured based on the market value of outstanding derivative instruments. Both current and potential exposures are calculated for each derivative agreement to monitor counterparty credit exposure.
As of
December 31, 2018
, we had interest rate swap and cap agreements in place to fix or limit interest rates on a portion of our borrowings under debt facilities with floating interest rates as summarized below:
|
Derivatives
|
Notional Amount
|
Weighted Average
Fixed Leg (Pay) Interest Rate
|
Cap Rate
|
Weighted Average
Remaining Term
|
||||
|
Interest Rate Swap
|
$1,565.6 million
|
2.24%
|
n/a
|
4.4 years
|
||||
|
Interest Rate Cap
|
$381.7 million
|
n/a
|
2.9%
|
0.1 years
|
||||
Certain of our interest rate swap and cap agreements are designated as cash flow hedges for accounting purposes, and any unrealized gains or losses related to the changes in fair value are recognized in accumulated comprehensive income and re-classed to interest and debt expense as they are realized. A portion of our swap portfolio is not designated and changes in the fair value of non-designated interest rate swap agreements are recognized on the consolidated statements of operations as unrealized gain or loss on derivative instruments, net and reclassified to realized gain or loss on derivative instruments as they are realized.
Approximately
52%
of our floating rate debt is hedged using interest rate swaps which helps mitigate the impact of changes in short-term interest rates. However, a 100 basis point increase in the interest rates on our floating rate debt (primarily LIBOR) would result in an increase of approximately
$13.5 million
in interest expense, net of realized gains on our swap instruments, over the next 12 months.
Foreign currency exchange rate risk
Although we have significant foreign-based operations, the majority of our revenues and our operating expenses for the years ended
December 31, 2018
,
2017
, and
2016
were denominated in U.S. dollars. We pay our non-U.S. employees in local currencies and certain operating expenses are denominated in foreign currencies. This activity is primarily denominated in the euro and the British pound. For the year ended
December 31, 2018
, we recognized
$1.0 million
in net foreign currency exchange loss in administrative expenses. Net foreign currency exchange gains and losses during the years ended
December 31, 2017
and
2016
were immaterial.
ITEM 8. FINANCIAL STATEMENTS AND SUPPLEMENTARY DATA
The Consolidated Financial Statements and financial statement schedules listed under Item 15—Exhibits and Financial Statement Schedules are filed as a part of this Item 8. Supplementary financial information may be found in
Note 16
to the Consolidated Financial Statements.
57
ITEM 9. CHANGES IN AND DISAGREEMENTS WITH ACCOUNTANTS ON ACCOUNTING AND FINANCIAL DISCLOSURE
None.
ITEM 9A. CONTROLS AND PROCEDURES
Management's Report Regarding the Effectiveness of Disclosure Controls and Procedures
We carried out an evaluation, under the supervision and with the participation of our management, including our Chief Executive Officer and our Senior Vice President and Chief Financial Officer, of the effectiveness of the design and operation of our disclosure controls and procedures (as defined in Rules 13a-15(e) and 15d-15(e) under the Exchange Act) as of the end of the period covered by this Annual Report on Form 10-K. Based upon management's evaluation of these disclosure controls and procedures, our Chief Executive Officer and our Senior Vice President and Chief Financial Officer concluded, as of the end of the period covered by this Annual Report on Form 10-K, that our disclosure controls and procedures were effective.
Management's Report on Internal Control Over Financial Reporting
We are responsible for establishing and maintaining adequate internal control over financial reporting. Our internal control over financial reporting is designed to provide reasonable assurance regarding the reliability of our financial reporting and the preparation of financial statements for external purposes in accordance with generally accepted accounting principles.
We assessed our internal control over financial reporting as of
December 31, 2018
and based our assessment on criteria established in Internal Control-
Integrated Framework
(2013) issued by the Committee of Sponsoring Organizations of the Treadway Commission.
Based on our assessment, we have concluded that our internal control over financial reporting was effective as of
December 31, 2018
.
KPMG LLP, an independent registered public accounting firm, has audited the consolidated financial statements included in this Annual Report on Form 10-K and, as part of the audit, has issued a report on the effectiveness of our internal control over financial reporting as of
December 31, 2018
.
Changes in Internal Controls
There were no changes in our internal control over financial reporting identified in management’s evaluation pursuant to Rules 13a-15(d) or 15d-15(d) of the Exchange Act during the three months ended
December 31, 2018
that materially affected, or are reasonably likely to materially affect, our internal control over financial reporting.
58
Report of Independent Registered Public Accounting Firm
To the Shareholders and Board of Directors
Triton International Limited:
Opinion on Internal Control Over Financial Reporting
We have audited Triton International Limited and subsidiaries’ (the Company) internal control over financial reporting as of
December 31, 2018
, based on criteria established in
Internal Control - Integrated Framework (2013)
issued by the Committee of Sponsoring Organizations of the Treadway Commission. In our opinion, the Company maintained, in all material respects, effective internal control over financial reporting as of
December 31, 2018
, based on criteria established in
Internal Control - Integrated Framework (2013)
issued by the Committee of Sponsoring Organizations of the Treadway Commission.
We also have audited, in accordance with the standards of the Public Company Accounting Oversight Board (United States) (PCAOB), the consolidated balance sheets of the Company as of December 31, 2018 and 2017, the related consolidated statements of operations, comprehensive income, shareholders’ equity, and cash flows for each of the years in the three-year period ended
December 31, 2018
, and the related notes and financial statement Schedule I - Condensed Financial Information of Registrant and Schedule II - Valuation and Qualifying Accounts (collectively, the consolidated financial statements), and our report dated
February 19, 2019
expressed an unqualified opinion on those consolidated financial statements.
Basis for Opinion
The Company’s management is responsible for maintaining effective internal control over financial reporting and for its assessment of the effectiveness of internal control over financial reporting, included in the accompanying Management’s Report on Internal Control over Financial Reporting. Our responsibility is to express an opinion on the Company’s internal control over financial reporting based on our audit. We are a public accounting firm registered with the PCAOB and are required to be independent with respect to the Company in accordance with the U.S. federal securities laws and the applicable rules and regulations of the Securities and Exchange Commission and the PCAOB.
We conducted our audit in accordance with the standards of the PCAOB. Those standards require that we plan and perform the audit to obtain reasonable assurance about whether effective internal control over financial reporting was maintained in all material respects. Our audit of internal control over financial reporting included obtaining an understanding of internal control over financial reporting, assessing the risk that a material weakness exists, and testing and evaluating the design and operating effectiveness of internal control based on the assessed risk. Our audit also included performing such other procedures as we considered necessary in the circumstances. We believe that our audit provides a reasonable basis for our opinion.
Definition and Limitations of Internal Control Over Financial Reporting
A company’s internal control over financial reporting is a process designed to provide reasonable assurance regarding the reliability of financial reporting and the preparation of financial statements for external purposes in accordance with generally accepted accounting principles. A company’s internal control over financial reporting includes those policies and procedures that (1) pertain to the maintenance of records that, in reasonable detail, accurately and fairly reflect the transactions and dispositions of the assets of the company; (2) provide reasonable assurance that transactions are recorded as necessary to permit preparation of financial statements in accordance with generally accepted accounting principles, and that receipts and expenditures of the company are being made only in accordance with authorizations of management and directors of the company; and (3) provide reasonable assurance regarding prevention or timely detection of unauthorized acquisition, use, or disposition of the company’s assets that could have a material effect on the financial statements.
Because of its inherent limitations, internal control over financial reporting may not prevent or detect misstatements. Also, projections of any evaluation of effectiveness to future periods are subject to the risk that controls may become inadequate because of changes in conditions, or that the degree of compliance with the policies or procedures may deteriorate.
|
/s/ KPMG LLP
|
||
New York, New York
February 19, 2019
59
ITEM 9B. OTHER INFORMATION
Not applicable.
PART III
ITEM 10. DIRECTORS, EXECUTIVE OFFICERS AND CORPORATE GOVERNANCE
The information required by this Item is incorporated herein by reference from the sections captioned "Election of Directors", "Executive Officers" and "Section 16(a) Beneficial Ownership Reporting Compliance" in our proxy statement to be issued in connection with the Annual General Meeting of Shareholders to be held on
April 25, 2019
, which will be filed with the SEC within 120 days after the end of our fiscal year ended
December 31, 2018
(the "
2019
Proxy Statement").
ITEM 11. EXECUTIVE COMPENSATION
The information required by this Item is incorporated herein by reference from the sections captioned "Director Compensation Table", "Compensation of Executive Officers, Compensation Discussion and Analysis", "Summary Compensation Table", and "Grants of Plan-Based Awards Table", "CEO-Average Worker Pay Ratio", and the other tables and information following the "Grants of Plan-Based Awards Table" in the
2019
Proxy Statement.
ITEM 12. SECURITY OWNERSHIP OF CERTAIN BENEFICIAL OWNERS AND MANAGEMENT AND RELATED SHAREHOLDER MATTERS
The information required by this Item is incorporated herein by reference from the sections captioned "Equity Compensation Plan Information" and "Information Regarding Beneficial Ownership of Management and Principal Shareholders" in the
2019
Proxy Statement.
ITEM 13. CERTAIN RELATIONSHIPS AND RELATED TRANSACTIONS, AND DIRECTOR INDEPENDENCE
The information required by this Item is incorporated herein by reference from the sections captioned "Certain Relationships and Related Transactions" and "Corporate Governance and Related Matters" in the
2019
Proxy Statement.
ITEM 14. PRINCIPAL ACCOUNTANT FEES AND SERVICES
The information required by this Item is incorporated herein by reference from the section captioned "Audit Fees" in the
2019
Proxy Statement.
60
PART IV
ITEM 15. EXHIBITS AND FINANCIAL STATEMENT SCHEDULES
(a)(1)
Financial Statements
The following financial statements are included in Item 8 of this report:
|
Page
|
|
(a)(2)
Financial Statement Schedules
The following financial statement schedules for the Company are filed as part of this report:
Schedules not listed above have been omitted because the information required to be set forth therein is not applicable or is shown in the accompanying Consolidated Financial Statements or notes thereto.
(a)(3)
List of Exhibits
The following exhibits are filed as part of and incorporated by reference into this Annual Report on Form 10-K:
|
Exhibit No.
|
Description
|
|
|
Amended and Restated By-Laws of Triton International Limited, dated July 12, 2016 (incorporated by reference to Exhibit 3.1 to the Company's Current Report on Form 8-K, filed July 14, 2016)
|
||
|
Memorandum of Association of Triton International Limited, dated September 29, 2015 (incorporated by reference to Exhibit 3.1 to the Company's Quarterly Report on Form 10-Q, filed June 23, 2016)
|
||
|
Form of Indemnification Agreement (incorporated by reference to Exhibit 3.1 to the Company's Current Report on Form 8-K, filed July 14, 2016)
|
||
|
TAL International Group, Inc. 2014 Equity Incentive Plan (incorporated by reference to Exhibit 3.1 to the Company's Current Report on Form 8-K, filed July 14, 2016)
|
||
|
Triton Container International Limited 2016 Equity Incentive Plan (incorporated by reference to Exhibit 3.1 to the Company's Current Report on Form 8-K, filed July 14, 2016)
|
||
|
Triton International Limited 2016 Equity Incentive Plan (incorporated by reference to Exhibit 3.1 to the Company's Current Report on Form 8-K, filed July 14, 2016)
|
||
|
Warburg Pincus Shareholders Agreement, as amended (incorporated by reference to Exhibit 3.1 to the Company's Current Report on Form 8-K, filed July 14, 2016)
|
||
|
Vestar Shareholders Agreement, as amended (incorporated by reference to Exhibit 3.1 to the Company's Current Report on Form 8-K, filed July 14, 2016)
|
||
61
|
Exhibit No.
|
Description
|
|
|
Ninth Restated and Amended Credit Agreement, dated as of April 15, 2016, by and among Triton Container International Limited, as Borrower, various lenders, and Bank of America, N.A., as Administrative Agent and an Issuer, and other parties thereto (incorporated by reference to Exhibit 10.1 to the Company’s Current Report on Form 8-K, filed on June 22, 2017)
|
||
|
First Amendment, dated as of February 6, 2017, to the Ninth Restated and Amended Credit Agreement, dated as of April 15, 2016, by and among Triton Container International Limited, as the Borrower, various lenders and Bank of America, N.A., as Administrative Agent and an Issuer, and other parties thereto (incorporated by reference to Exhibit 10.2 to the Company’s Current Report on Form 8-K, filed on June 22, 2017)
|
||
|
Second Amendment, dated June 16, 2017, to the Ninth Restated and Amended Credit Agreement, dated as of April 15, 2016, by and among Triton Container International Limited, as Borrower, various lenders, Bank of America, N.A., as Administrative Agent and an Issuer, and other parties thereto (incorporated by reference to Exhibit 10.3 to the Company’s Current Report on Form 8-K, filed on June 22, 2017)
|
||
|
Term Loan Agreement dated as of November 30, 2018 by and among Triton Container International Limited, as Borrower, various lenders, and PNC Bank, National Association, as a lender and Administrative Agent
|
||
|
*
|
List of Subsidiaries
|
|
|
*
|
Consent of Independent Registered Public Accounting Firm
|
|
|
*
|
Powers of Attorney (included on the signature page to this Annual Report on Form 10-K)
|
|
|
*
|
Certification of the Chief Executive Officer pursuant to Rules 13a-14(a) and 15d-14(a) of the Securities Exchange Act of 1934, as amended
|
|
|
*
|
Certification of the Chief Financial Officer pursuant to Rules 13a-14(a) and 15d-14(a) of the Securities Exchange Act of 1934, as amended
|
|
|
**
|
Certification by Chief Executive Officer pursuant to 18 U.S.C. Section 1350
|
|
|
**
|
Certification by Chief Financial Officer pursuant to 18 U.S.C. Section 1350
|
|
|
101.INS
|
XBRL Instance Document
|
|
|
101.SCH
|
XBRL Instance Extension Schema
|
|
|
101.CAL
|
XBRL Taxonomy Extension Calculation Linkbase
|
|
|
101.DEF
|
XBRL Taxonomy Extension Definition Linkbase
|
|
|
101.LAB
|
XBRL Taxonomy Extension Label Linkbase
|
|
|
101.PRE
|
XBRL Taxonomy Extension Presentation Linkbase
|
|
† Schedules have been omitted pursuant to Item 601(b)(2) of Regulation S-K. The Registrant will furnish the omitted schedules to the U.S. Securities and Exchange Commission upon request by the Commission.
* Filed herewith.
** Furnished herewith.
(b) Exhibits.
The Company hereby files as part of this Annual Report on Form 10-K the exhibits listed in Item 15(a)(3) set forth above.
62
(c) Financial Statement Schedules
The Company hereby files as part of this Annual Report on Form 10-K the financial statement schedule listed in Item 15(a)(2) set forth above.
63
SIGNATURES
Pursuant to the requirements of Section 13 or 15(d) of the Securities Exchange Act of 1934, the Registrant has duly caused this report to be signed on its behalf by the undersigned, thereunto duly authorized.
|
Date: February 19, 2019
|
TRITON INTERNATIONAL LIMITED
|
|
|
By:
|
/s/ BRIAN M. SONDEY
|
|
|
Brian M. Sondey
Chairman of the Board, Director and Chief Executive Officer
|
||
POWER OF ATTORNEY AND SIGNATURES
We, the undersigned officers and directors of Triton International Limited hereby severally constitute and appoint Brian M. Sondey and John Burns and each of them singly, our true and lawful attorneys, with the power to them and each of them singly, to sign for us and in our names in the capacities indicated below, any amendments to this Annual Report on Form 10-K, and generally to do all things in our names and on our behalf in such capacities to enable Triton International Limited
to comply with the provisions of the Securities Exchange Act of 1934, as amended, and all the requirements of the Securities and Exchange Commission.
Pursuant to the requirements of the Securities Exchange Act of 1934, this report has been signed below by the following persons on behalf of the Registrant, in the capacities indicated, on the
19th
day of
February
,
2019
.
64
|
Signature
|
Title(s)
|
|
/s/ BRIAN M. SONDEY
|
Chairman of the Board, Director and Chief Executive Officer
|
|
Brian M. Sondey
|
|
|
/s/ JOHN BURNS
|
Chief Financial Officer
|
|
John Burns
|
|
|
/s/ MICHELLE GALLAGHER
|
Vice President and Controller (Principal Accounting Officer)
|
|
Michelle Gallagher
|
|
|
/s/ ROBERT L. ROSNER
|
Lead Director
|
|
Robert L. Rosner
|
|
|
/s/ ROBERT W. ALSPAUGH
|
Director
|
|
Robert W. Alspaugh
|
|
|
/s/ KAREN AUSTIN
|
Director
|
|
Karen Austin
|
|
|
/s/ MALCOLM P. BAKER
|
Director
|
|
Malcolm P. Baker
|
|
|
/s/ DAVID A. COULTER
|
Director
|
|
David A. Coulter
|
|
|
/s/ CLAUDE GERMAIN
|
Director
|
|
Claude Germain
|
|
|
/s/ KENNETH HANAU
|
Director
|
|
Kenneth Hanau
|
|
|
/s/ JOHN S. HEXTALL
|
Director
|
|
John S. Hextall
|
|
|
/s/ SIMON R. VERNON
|
Director
|
|
Simon R. Vernon
|
|
65
INDEX TO FINANCIAL STATEMENTS
|
Page
|
|
|
CONSOLIDATED FINANCIAL STATEMENTS
|
|
F-1
Report of Independent Registered Public Accounting Firm
To the Shareholders and Board of Directors
Triton International Limited:
Opinion on the Consolidated Financial Statements
We have audited the accompanying consolidated balance sheets of Triton International Limited and subsidiaries (the Company) as of
December 31, 2018
and
2017
, the related consolidated statements of operations, comprehensive income, shareholders’ equity, and cash flows for each of the years in the three‑year period ended
December 31, 2018
, and the related notes and financial statement Schedule I - Condensed Financial Information of Registrant and Schedule II - Valuation and Qualifying Accounts (collectively, the consolidated financial statements). In our opinion, the consolidated financial statements present fairly, in all material respects, the financial position of the Company as of
December 31, 2018
and
2017
, and the results of its operations and its cash flows for each of the years in the three‑year period ended
December 31, 2018
, in conformity with U.S. generally accepted accounting principles.
We also have audited, in accordance with the standards of the Public Company Accounting Oversight Board (United States) (PCAOB), the Company’s internal control over financial reporting as of
December 31, 2018
, based on criteria established in
Internal Control - Integrated Framework (2013)
issued by the Committee of Sponsoring Organizations of the Treadway Commission, and our report dated
February 19, 2019
expressed an unqualified opinion on the effectiveness of the Company’s internal control over financial reporting.
Basis for Opinion
These consolidated financial statements are the responsibility of the Company’s management. Our responsibility is to express an opinion on these consolidated financial statements based on our audits. We are a public accounting firm registered with the PCAOB and are required to be independent with respect to the Company in accordance with the U.S. federal securities laws and the applicable rules and regulations of the Securities and Exchange Commission and the PCAOB.
We conducted our audits in accordance with the standards of the PCAOB. Those standards require that we plan and perform the audit to obtain reasonable assurance about whether the consolidated financial statements are free of material misstatement, whether due to error or fraud. Our audits included performing procedures to assess the risks of material misstatement of the consolidated financial statements, whether due to error or fraud, and performing procedures that respond to those risks. Such procedures included examining, on a test basis, evidence regarding the amounts and disclosures in the consolidated financial statements. Our audits also included evaluating the accounting principles used and significant estimates made by management, as well as evaluating the overall presentation of the consolidated financial statements. We believe that our audits provide a reasonable basis for our opinion.
|
/s/ KPMG LLP
|
|
We have served as the Company’s auditor since 2014.
New York, New York
February 19, 2019
F-2
TRITON INTERNATIONAL LIMITED
Consolidated Balance Sheets
(In thousands, except share data)
|
December 31, 2018
|
December 31, 2017
|
||||||
|
ASSETS:
|
|
|
|||||
|
Leasing equipment, net of accumulated depreciation of $2,533,446 and $2,218,897
|
$
|
8,923,451
|
|
$
|
8,364,484
|
|
|
|
Net investment in finance leases
|
478,065
|
|
295,891
|
|
|||
|
Equipment held for sale
|
66,453
|
|
43,195
|
|
|||
|
Revenue earning assets
|
9,467,969
|
|
8,703,570
|
|
|||
|
Cash and cash equivalents
|
48,950
|
|
132,031
|
|
|||
|
Restricted cash
|
110,589
|
|
94,140
|
|
|||
|
Accounts receivable, net of allowances of $1,240 and $3,002
|
264,382
|
|
199,876
|
|
|||
|
Goodwill
|
236,665
|
|
236,665
|
|
|||
|
Lease intangibles, net of accumulated amortization of $205,532 and $144,081
|
92,925
|
|
154,376
|
|
|||
|
Other assets
|
34,610
|
|
49,591
|
|
|||
|
Fair value of derivative instruments
|
13,923
|
|
7,376
|
|
|||
|
Total assets
|
$
|
10,270,013
|
|
$
|
9,577,625
|
|
|
|
LIABILITIES AND SHAREHOLDERS' EQUITY:
|
|
|
|||||
|
Equipment purchases payable
|
$
|
22,392
|
|
$
|
128,133
|
|
|
|
Fair value of derivative instruments
|
10,966
|
|
2,503
|
|
|||
|
Accounts payable and other accrued expenses
|
99,885
|
|
109,999
|
|
|||
|
Net deferred income tax liability
|
282,129
|
|
215,439
|
|
|||
|
Debt, net of unamortized debt costs of $44,889 and $40,636
|
7,529,432
|
|
6,911,725
|
|
|||
|
Total liabilities
|
7,944,804
|
|
7,367,799
|
|
|||
|
Shareholders' equity:
|
|
|
|||||
|
Common shares, $0.01 par value, 270,000,000 and 294,000,000 shares authorized, 80,843,472 and 80,687,757 shares issued, respectively
|
809
|
|
807
|
|
|||
|
Undesignated shares, $0.01 par value, 30,000,000 and 6,000,000 shares authorized, no shares issued and outstanding
|
—
|
|
—
|
|
|||
|
Treasury shares, at cost, 1,853,148 shares and no shares, respectively
|
(58,114
|
)
|
—
|
|
|||
|
Additional paid-in capital
|
896,811
|
|
889,168
|
|
|||
|
Accumulated earnings
|
1,349,627
|
|
1,159,367
|
|
|||
|
Accumulated other comprehensive income
|
14,563
|
|
26,942
|
|
|||
|
Total shareholders' equity
|
2,203,696
|
|
2,076,284
|
|
|||
|
Non-controlling interests
|
121,513
|
|
133,542
|
|
|||
|
Total equity
|
$
|
2,325,209
|
|
$
|
2,209,826
|
|
|
|
Total liabilities and equity
|
$
|
10,270,013
|
|
$
|
9,577,625
|
|
|
The accompanying Notes to the Consolidated Financial Statements are an integral part of these statements.
F-3
TRITON INTERNATIONAL LIMITED
Consolidated Statements of Operations
(In thousands, except per share data)
|
Year Ended December 31, 2018
|
Year Ended December 31, 2017
|
Year Ended December 31, 2016
|
|||||||||
|
Leasing revenues:
|
|
|
|||||||||
|
Operating leases
|
$
|
1,328,756
|
|
$
|
1,141,165
|
|
$
|
813,357
|
|
||
|
Finance leases
|
21,547
|
|
22,352
|
|
15,337
|
|
|||||
|
Total leasing revenues
|
1,350,303
|
|
1,163,517
|
|
828,694
|
|
|||||
|
Equipment trading revenues
|
83,039
|
|
37,419
|
|
16,418
|
|
|||||
|
Equipment trading expenses
|
(64,118
|
)
|
(33,235
|
)
|
(15,800
|
)
|
|||||
|
Trading margin
|
18,921
|
|
4,184
|
|
618
|
|
|||||
|
Net gain (loss) on sale of leasing equipment
|
35,377
|
|
35,812
|
|
(20,347
|
)
|
|||||
|
Net gain (loss) on sale of building
|
20,953
|
|
—
|
|
—
|
|
|||||
|
Operating expenses:
|
|
||||||||||
|
Depreciation and amortization
|
545,138
|
|
500,720
|
|
392,592
|
|
|||||
|
Direct operating expenses
|
48,326
|
|
62,891
|
|
84,256
|
|
|||||
|
Administrative expenses
|
80,033
|
|
87,609
|
|
65,618
|
|
|||||
|
Transaction and other costs (income)
|
88
|
|
9,272
|
|
66,916
|
|
|||||
|
Provision (reversal) for doubtful accounts
|
(231
|
)
|
3,347
|
|
23,304
|
|
|||||
|
Insurance recovery income
|
—
|
|
(6,764
|
)
|
—
|
|
|||||
|
Total operating expenses
|
673,354
|
|
657,075
|
|
632,686
|
|
|||||
|
Operating income (loss)
|
752,200
|
|
546,438
|
|
176,279
|
|
|||||
|
Other expenses:
|
|
||||||||||
|
Interest and debt expense
|
322,731
|
|
282,347
|
|
184,014
|
|
|||||
|
Realized (gain) loss on derivative instruments, net
|
(2,072
|
)
|
900
|
|
3,438
|
|
|||||
|
Unrealized (gain) loss on derivative instruments, net
|
430
|
|
(1,397
|
)
|
(4,405
|
)
|
|||||
|
Debt termination expense
|
6,090
|
|
6,973
|
|
141
|
|
|||||
|
Other (income) expense, net
|
(2,292
|
)
|
(2,637
|
)
|
(1,076
|
)
|
|||||
|
Total other expenses
|
324,887
|
|
286,186
|
|
182,112
|
|
|||||
|
Income (loss) before income taxes
|
427,313
|
|
260,252
|
|
(5,833
|
)
|
|||||
|
Income tax expense (benefit)
|
70,641
|
|
(93,274
|
)
|
(48
|
)
|
|||||
|
Net income (loss)
|
$
|
356,672
|
|
$
|
353,526
|
|
$
|
(5,785
|
)
|
||
|
Less: income (loss) attributable to non-controlling interest
|
7,117
|
|
8,928
|
|
7,732
|
|
|||||
|
Net income (loss) attributable to shareholders
|
$
|
349,555
|
|
$
|
344,598
|
|
$
|
(13,517
|
)
|
||
|
Net income per common share—Basic
|
$
|
4.38
|
|
$
|
4.55
|
|
$
|
(0.24
|
)
|
||
|
Net income per common share—Diluted
|
$
|
4.35
|
|
$
|
4.52
|
|
$
|
(0.24
|
)
|
||
|
Cash dividends paid per common share
|
$
|
2.01
|
|
$
|
1.80
|
|
$
|
1.35
|
|
||
|
Weighted average number of common shares outstanding—Basic
|
79,782
|
|
75,679
|
|
56,032
|
|
|||||
|
Dilutive restricted shares
|
582
|
|
509
|
|
—
|
|
|||||
|
Weighted average number of common shares outstanding—Diluted
|
80,364
|
|
76,188
|
|
56,032
|
|
|||||
The accompanying Notes to the Consolidated Financial Statements are an integral part of these statements.
F-4
TRITON INTERNATIONAL LIMITED
Consolidated Statements of Comprehensive Income
(In thousands)
|
Year Ended December 31, 2018
|
Year Ended December 31, 2017
|
Year Ended December 31, 2016
|
|||||||||
|
Net income (loss)
|
$
|
356,672
|
|
$
|
353,526
|
|
$
|
(5,785
|
)
|
||
|
Other comprehensive income (loss):
|
|||||||||||
|
Change in derivative instruments designated as cash flow hedges, net of income tax effect of $1,814, ($234), and $16,512
|
(3,933
|
)
|
(407
|
)
|
30,405
|
|
|||||
|
Reclassification of (gain) loss on derivative instruments designated as cash flow hedges, net of income tax effect of ($1,570), $171, and $423
|
(5,210
|
)
|
440
|
|
777
|
|
|||||
|
Foreign currency translation adjustment
|
(207
|
)
|
151
|
|
(758
|
)
|
|||||
|
Other comprehensive income (loss), net of tax
|
(9,350
|
)
|
184
|
|
30,424
|
|
|||||
|
Comprehensive income
|
347,322
|
|
353,710
|
|
24,639
|
|
|||||
|
Less:
|
|||||||||||
|
Other comprehensive income attributable to noncontrolling interest
|
7,117
|
|
8,928
|
|
7,732
|
|
|||||
|
Comprehensive income attributable to shareholders
|
$
|
340,205
|
|
$
|
344,782
|
|
$
|
16,907
|
|
||
The accompanying Notes to the Consolidated Financial Statements are an integral part of these statements.
F-5
TRITON INTERNATIONAL LIMITED
Consolidated Statements of Shareholders' Equity
(In thousands, except share amounts)
|
Class A, Class B and Common Shares*
|
Treasury Shares
|
|||||||||||||||||||||||||||||||||
|
Shares
|
Amount
|
Shares
|
Amount
|
Add'l Paid in Capital
|
Accumulated Earnings
|
Accumulated Other Comprehensive Income
|
Non-controlling Interest
|
Total Equity
|
||||||||||||||||||||||||||
|
Balance at January 1, 2016
|
40,428,585
|
|
$
|
505
|
|
—
|
|
$
|
—
|
|
$
|
176,088
|
|
$
|
1,044,402
|
|
$
|
(3,666
|
)
|
$
|
160,504
|
|
$
|
1,377,833
|
|
|||||||||
|
Issuance of common shares
|
605,334
|
|
7
|
|
—
|
|
—
|
|
(2
|
)
|
—
|
|
—
|
|
—
|
|
5
|
|
||||||||||||||||
|
Share-based compensation
|
—
|
|
—
|
|
—
|
|
—
|
|
5,399
|
|
—
|
|
—
|
|
—
|
|
5,399
|
|
||||||||||||||||
|
Adjustment to fair market value classified service-based options
|
—
|
|
—
|
|
—
|
|
—
|
|
(907
|
)
|
—
|
|
—
|
|
—
|
|
(907
|
)
|
||||||||||||||||
|
Settlement of liability classified service-based share options
|
517,912
|
|
5
|
|
—
|
|
—
|
|
7,075
|
|
—
|
|
—
|
|
—
|
|
7,080
|
|
||||||||||||||||
|
Share repurchase to settle shareholder tax obligations
|
(247,005
|
)
|
(2
|
)
|
—
|
|
—
|
|
(3,175
|
)
|
(216
|
)
|
—
|
|
—
|
|
(3,393
|
)
|
||||||||||||||||
|
Redemption / Cancellation of common shares
|
(263,393
|
)
|
(3
|
)
|
—
|
|
—
|
|
(4,014
|
)
|
—
|
|
—
|
|
—
|
|
(4,017
|
)
|
||||||||||||||||
|
Net income (loss)
|
—
|
|
—
|
|
—
|
|
—
|
|
—
|
|
(13,517
|
)
|
—
|
|
7,732
|
|
(5,785
|
)
|
||||||||||||||||
|
Foreign currency translation adjustment
|
—
|
|
—
|
|
—
|
|
—
|
|
—
|
|
—
|
|
(758
|
)
|
—
|
|
(758
|
)
|
||||||||||||||||
|
Issuance and conversion of Triton shares due to Merger
|
33,334,592
|
|
232
|
|
—
|
|
—
|
|
509,954
|
|
—
|
|
—
|
|
—
|
|
510,186
|
|
||||||||||||||||
|
Change in derivative instruments designated as cash flow hedges, net of income tax effect of $16,512
|
—
|
|
—
|
|
—
|
|
—
|
|
—
|
|
—
|
|
30,405
|
|
—
|
|
30,405
|
|
||||||||||||||||
|
Reclassification of realized loss on derivative instruments designated as cash flow hedges, net of income tax effect of $423
|
—
|
|
—
|
|
—
|
|
—
|
|
—
|
|
—
|
|
777
|
|
—
|
|
777
|
|
||||||||||||||||
|
Distributions to non-controlling interests
|
—
|
|
—
|
|
—
|
|
—
|
|
—
|
|
—
|
|
—
|
|
(24,732
|
)
|
(24,732
|
)
|
||||||||||||||||
|
Common shares dividend declared
|
—
|
|
—
|
|
—
|
|
—
|
|
—
|
|
(85,356
|
)
|
—
|
|
—
|
|
(85,356
|
)
|
||||||||||||||||
|
Balance as of December 31, 2016
|
74,376,025
|
|
$
|
744
|
|
—
|
|
—
|
|
$
|
690,418
|
|
$
|
945,313
|
|
$
|
26,758
|
|
$
|
143,504
|
|
$
|
1,806,737
|
|
||||||||||
|
Issuance of common shares
|
6,313,694
|
|
63
|
|
—
|
|
—
|
|
193,109
|
|
—
|
|
—
|
|
—
|
|
193,172
|
|
||||||||||||||||
|
Share-based compensation
|
—
|
|
—
|
|
—
|
|
—
|
|
5,641
|
|
—
|
|
—
|
|
—
|
|
5,641
|
|
||||||||||||||||
|
Cumulative adjustment for adoption of ASU 2016-09
|
—
|
|
—
|
|
—
|
|
—
|
|
—
|
|
6,582
|
|
—
|
|
—
|
|
6,582
|
|
||||||||||||||||
|
Share repurchase to settle shareholder tax obligations
|
(1,962
|
)
|
—
|
|
—
|
|
—
|
|
—
|
|
(70
|
)
|
—
|
|
—
|
|
(70
|
)
|
||||||||||||||||
|
Net income (loss)
|
—
|
|
—
|
|
—
|
|
—
|
|
—
|
|
344,598
|
|
—
|
|
8,928
|
|
353,526
|
|
||||||||||||||||
|
Foreign currency translation adjustment
|
—
|
|
—
|
|
—
|
|
—
|
|
—
|
|
—
|
|
151
|
|
—
|
|
151
|
|
||||||||||||||||
|
Change in derivative instruments designated as cash flow hedges, net of income tax effect of ($234)
|
—
|
|
—
|
|
—
|
|
—
|
|
—
|
|
—
|
|
(407
|
)
|
—
|
|
(407
|
)
|
||||||||||||||||
|
Reclassification of realized loss on derivative instruments designated as cash flow hedges, net of income tax effect of $171
|
—
|
|
—
|
|
—
|
|
—
|
|
—
|
|
—
|
|
440
|
|
—
|
|
440
|
|
||||||||||||||||
|
Distributions to non-controlling interests
|
—
|
|
—
|
|
—
|
|
—
|
|
—
|
|
—
|
|
—
|
|
(18,890
|
)
|
(18,890
|
)
|
||||||||||||||||
|
Common shares dividend declared
|
—
|
|
—
|
|
—
|
|
—
|
|
—
|
|
(137,056
|
)
|
—
|
|
—
|
|
(137,056
|
)
|
||||||||||||||||
|
Balance as of December 31, 2017
|
80,687,757
|
|
$
|
807
|
|
—
|
|
—
|
|
$
|
889,168
|
|
$
|
1,159,367
|
|
$
|
26,942
|
|
$
|
133,542
|
|
$
|
2,209,826
|
|
||||||||||
|
Share-based compensation
|
200,341
|
|
2
|
|
—
|
|
—
|
|
9,028
|
|
—
|
|
—
|
|
—
|
|
9,030
|
|
||||||||||||||||
|
Treasury shares acquired
|
—
|
|
—
|
|
1,853,148
|
|
(58,114
|
)
|
—
|
|
—
|
|
—
|
|
—
|
|
(58,114
|
)
|
||||||||||||||||
|
Share repurchase to settle shareholder tax obligations
|
(44,626
|
)
|
—
|
|
—
|
|
—
|
|
(1,385
|
)
|
—
|
|
—
|
|
—
|
|
(1,385
|
)
|
||||||||||||||||
|
Net income (loss)
|
—
|
|
—
|
|
—
|
|
—
|
|
—
|
|
349,555
|
|
—
|
|
7,117
|
|
356,672
|
|
||||||||||||||||
|
Foreign currency translation adjustment
|
—
|
|
—
|
|
—
|
|
—
|
|
—
|
|
|
(207
|
)
|
—
|
|
(207
|
)
|
|||||||||||||||||
|
Change in derivative instruments designated as cash flow hedges, net of income tax effect of $1,814
|
—
|
|
—
|
|
—
|
|
—
|
|
—
|
|
—
|
|
(3,933
|
)
|
—
|
|
(3,933
|
)
|
||||||||||||||||
|
Reclassification of realized (gain) on derivative instruments designated as cash flow hedges, net of income tax effect of ($1,570)
|
—
|
|
—
|
|
—
|
|
—
|
|
—
|
|
—
|
|
(5,210
|
)
|
—
|
|
(5,210
|
)
|
||||||||||||||||
|
Tax reclassifications to accumulated earnings for the adoption of ASU 2018-02
|
—
|
|
—
|
|
—
|
|
—
|
|
—
|
|
—
|
|
3,029
|
|
(3,029
|
)
|
—
|
|
—
|
|
||||||||||||||
|
Distributions to non-controlling interests
|
—
|
|
—
|
|
—
|
|
—
|
|
—
|
|
—
|
|
—
|
|
(19,146
|
)
|
(19,146
|
)
|
||||||||||||||||
|
Common shares dividend declared
|
—
|
|
—
|
|
—
|
|
—
|
|
—
|
|
(162,324
|
)
|
—
|
|
—
|
|
(162,324
|
)
|
||||||||||||||||
|
Balance as of December 31, 2018
|
80,843,472
|
|
$
|
809
|
|
1,853,148
|
|
$
|
(58,114
|
)
|
$
|
896,811
|
|
$
|
1,349,627
|
|
$
|
14,563
|
|
$
|
121,513
|
|
$
|
2,325,209
|
|
|||||||||
|
*
|
As a result of the Merger transaction completed on July 12, 2016, all Class A and B common shares held by TCIL shareholders were exchanged for Triton common shares at a
0.80
ratio, and therefore, the historical number of shares, options, and per share amounts were retroactively adjusted.
|
The accompanying Notes to the Consolidated Financial Statements are an integral part of these statements.
F-6
TRITON INTERNATIONAL LIMITED
Consolidated Statements of Cash Flows
(In thousands)
|
Year Ended December 31, 2018
|
Year Ended December 31, 2017
|
Year Ended December 31, 2016
|
|||||||||
|
Cash flows from operating activities:
|
|
|
|
||||||||
|
Net income (loss)
|
$
|
356,672
|
|
$
|
353,526
|
|
$
|
(5,785
|
)
|
||
|
Adjustments to reconcile net income (loss) to net cash provided by operating activities:
|
|
|
|
||||||||
|
Depreciation and amortization
|
545,138
|
|
500,720
|
|
392,592
|
|
|||||
|
Amortization of deferred financing cost and other debt related amortization
|
15,005
|
|
13,401
|
|
5,934
|
|
|||||
|
Lease related amortization
|
70,275
|
|
92,787
|
|
55,539
|
|
|||||
|
Share-based compensation expense
|
9,030
|
|
5,641
|
|
5,399
|
|
|||||
|
Net (gain) loss on sale of leasing equipment
|
(35,377
|
)
|
(35,812
|
)
|
20,347
|
|
|||||
|
Net (gain) loss on sale of building
|
(20,953
|
)
|
—
|
|
—
|
|
|||||
|
Unrealized (gain) loss on derivative instruments
|
430
|
|
(1,397
|
)
|
(4,405
|
)
|
|||||
|
Debt termination expense
|
6,090
|
|
6,973
|
|
141
|
|
|||||
|
Deferred income taxes
|
66,467
|
|
(94,678
|
)
|
(809
|
)
|
|||||
|
Changes in operating assets and liabilities:
|
|
|
|
||||||||
|
Accounts receivable
|
(65,385
|
)
|
(5,967
|
)
|
(1,602
|
)
|
|||||
|
Accounts payable and accrued expenses
|
(14,449
|
)
|
(42,402
|
)
|
10,694
|
|
|||||
|
Net equipment sold for resale activity
|
(2,341
|
)
|
8,821
|
|
4,031
|
|
|||||
|
Cash received (paid) for settlement of interest rate swaps
|
187
|
|
2,117
|
|
(37
|
)
|
|||||
|
Other assets
|
(939
|
)
|
3,065
|
|
2,149
|
|
|||||
|
Net cash provided by (used in) operating activities
|
929,850
|
|
806,795
|
|
484,188
|
|
|||||
|
Cash flows from investing activities:
|
|
|
|
||||||||
|
Purchases of leasing equipment and investments in finance leases
|
(1,603,507
|
)
|
(1,562,863
|
)
|
(629,332
|
)
|
|||||
|
Proceeds from sale of equipment, net of selling costs
|
163,256
|
|
190,744
|
|
145,572
|
|
|||||
|
Proceeds from the sale of building
|
27,630
|
|
—
|
|
—
|
|
|||||
|
Cash collections on finance lease receivables, net of income earned
|
64,372
|
|
60,673
|
|
38,650
|
|
|||||
|
Cash and cash equivalents acquired
|
—
|
|
—
|
|
50,349
|
|
|||||
|
Other
|
(160
|
)
|
55
|
|
(685
|
)
|
|||||
|
Net cash provided by (used in) investing activities
|
(1,348,409
|
)
|
(1,311,391
|
)
|
(395,446
|
)
|
|||||
|
Cash flows from financing activities:
|
|
|
|
||||||||
|
Issuance of common shares, net of underwriter expenses
|
—
|
|
192,931
|
|
—
|
|
|||||
|
Purchases of treasury shares
|
(56,274
|
)
|
—
|
|
—
|
|
|||||
|
Redemption of common shares
|
(1,385
|
)
|
(70
|
)
|
(7,410
|
)
|
|||||
|
Debt issuance costs
|
(19,575
|
)
|
(34,494
|
)
|
(6,554
|
)
|
|||||
|
Borrowings under debt facilities
|
4,043,637
|
|
3,102,825
|
|
661,971
|
|
|||||
|
Payments under debt facilities and capital lease obligations
|
(3,435,041
|
)
|
(2,539,711
|
)
|
(602,152
|
)
|
|||||
|
Dividends paid
|
(160,289
|
)
|
(135,557
|
)
|
(84,752
|
)
|
|||||
|
Distributions to noncontrolling interests
|
(19,146
|
)
|
(18,890
|
)
|
(24,732
|
)
|
|||||
|
Other
|
—
|
|
241
|
|
—
|
|
|||||
|
Net cash provided by (used in) financing activities
|
351,927
|
|
567,275
|
|
(63,629
|
)
|
|||||
|
Net (decrease) increase in cash, cash equivalents and restricted cash
|
$
|
(66,632
|
)
|
$
|
62,679
|
|
$
|
25,113
|
|
||
|
Cash, cash equivalents and restricted cash, beginning of period
|
226,171
|
|
163,492
|
|
138,379
|
|
|||||
|
Cash, cash equivalents and restricted cash, end of period
|
$
|
159,539
|
|
$
|
226,171
|
|
$
|
163,492
|
|
||
|
Supplemental disclosures:
|
|
|
|
||||||||
|
Interest paid
|
$
|
308,827
|
|
$
|
269,601
|
|
$
|
181,559
|
|
||
|
Income taxes paid (refunded)
|
$
|
4,484
|
|
$
|
(288
|
)
|
$
|
309
|
|
||
|
Supplemental non-cash investing activities:
|
|
|
|
||||||||
|
Equipment purchases payable
|
$
|
22,392
|
|
$
|
128,133
|
|
$
|
83,567
|
|
||
|
Shares issued to acquire TAL
|
$
|
—
|
|
$
|
—
|
|
$
|
510,186
|
|
||
The accompanying Notes to the Consolidated Financial Statements are an integral part of these statements.
F-7
TRITON INTERNATIONAL LIMITED
NOTES TO CONSOLIDATED FINANCIAL STATEMENTS
Note 1—Description of the Business and Basis of Presentation
Description of the Business and Basis of Presentation
Triton International Limited (“Triton” or the “Company”), through its subsidiaries, leases intermodal transportation equipment, primarily maritime containers, and provides maritime container management services through a worldwide network of service subsidiaries, third-party depots and other facilities. The majority of Triton’s business is derived from leasing its containers to shipping line customers through a variety of long-term and short-term contractual lease arrangements. The Company also sells containers from its existing fleet as well as containers specifically acquired for resale from third parties. The Company's registered office is located in Bermuda.
Triton was formed on July 12, 2016, by an all stock merger (the "Merger") of Triton Container International Limited ("TCIL") and TAL International Group, Inc. ("TAL").
The consolidated financial statements of Triton presented herein represent the historical financial statements of TCIL, the accounting acquirer, and include the results of operations of TAL after July 12, 2016, the date of the completion of the Merger. The consolidated financial statements include the accounts of the Company and its subsidiaries. Certain reclassifications have been made to the accompanying prior period financial statements and notes to conform to the current year's presentation.
Note 2—Summary of Significant Accounting Policies
Principles of Consolidation
The consolidated financial statements include the accounts of the Company and subsidiaries in which it has a controlling interest, and variable interest entities (VIEs) of which the Company is the primary beneficiary. The equity method of accounting is applied when the Company does not have a controlling interest in an entity but exerts significant influence over the entity. All significant intercompany balances and transactions have been eliminated in consolidation.
Use of Estimates
The preparation of financial statements in conformity with U.S. generally accepted accounting principles ("GAAP") requires management to make estimates and assumptions that affect the reported amounts of assets and liabilities, the reported amounts of revenues and expenses during the reporting period and disclosure of contingent assets and liabilities in the financial statements. Such estimates include, but are not limited to, the Company's estimates in connection with leasing equipment including residual values and depreciable lives, values of assets held for sale and other long-lived assets, provision for income tax, allowance for doubtful accounts, share-based compensation and goodwill and intangible assets. Actual results could differ from those estimates.
Segment Reporting
The Company conducts its business activities in one industry, intermodal transportation equipment, and has two reporting segments, Equipment leasing and Equipment trading. The Company also segregates total equipment leasing revenues and total equipment trading revenues by geographic location based upon the primary domicile of the Company’s customers.
Prior to the Merger on July 12, 2016, the Company had only one segment, the Equipment Leasing segment. As a result of the Merger, the Equipment Trading segment was acquired.
Concentration of Credit Risk
The Company's equipment lease and trade receivables subject it to potential credit risk. The Company extends credit to its customers based upon an evaluation of each customer's financial condition and credit history. Evaluations of the financial condition and associated credit risk of customers are performed on an ongoing basis. The Company's largest customer,
CMA CGM S.A.
, accounted for
20%
,
19%
, and
17%
of its lease billings during
2018
,
2017
, and
2016
, respectively, and accounted for
29%
and
23%
of its accounts receivable as of December 31,
2018
and
2017
, respectively. The Company's second largest customer,
Mediterranean Shipping Company S.A.
accounted for
14%
,
14%
, and
15%
of its lease billings during
2018
,
2017
, and
2016
, respectively, and
5%
and
8%
of its accounts receivable as of December 31,
2018
and
2017
, respectively.
F-8
TRITON INTERNATIONAL LIMITED
NOTES TO CONSOLIDATED FINANCIAL STATEMENTS (Continued)
Other financial instruments that are exposed to concentration of credit risk are cash and cash equivalents, and restricted cash balances. Cash and cash equivalents, and restricted cash are held with financial institutions of high quality. Balances may exceed the amount of insurance provided on such deposits.
Fair Value Measurements
Fair value represents the price that would be received upon the sale of an asset or paid to transfer a liability in an orderly transaction between market participants at the measurement date. The determination of fair value may require an entity to make significant judgments or develop assumptions about market participants to reflect risks specific to the asset being valued.
Cash and Cash Equivalents
Cash and cash equivalents consist of all cash balances and highly liquid investments having original maturities of three months or less at the time of purchase.
Restricted Cash
The Company’s restricted cash relates to amounts held at financial institutions pursuant to certain debt arrangements. The restricted cash balances represent cash proceeds collected and required to be used to pay debt service and other related expenses.
Allowance for Doubtful Accounts
The Company's allowance for doubtful accounts is estimated based upon a review of the collectibility of its receivables. This review is based on the risk profile of the receivables, credit quality indicators such as the level of past-due amounts and economic conditions. Generally, the Company does not require collateral on accounts receivable balances. An account is considered past due when a payment has not been received in accordance with the contractual terms. Changes in economic conditions or other events may necessitate additions or deductions to the allowance for doubtful accounts. The allowance for doubtful accounts is intended to provide for losses in the receivables, and requires the application of estimates and judgments as to the outcome of collection efforts, among other things. The Company believes its allowance for doubtful accounts is adequate to provide for credit losses inherent in its existing receivables.
To the extent amounts are expected to be recoverable from insurance policies, the Company records a receivable based on amounts incurred not to exceed insurance limits.
The Company experienced a major lessee default in 2016 when Hanjin Shipping Co. ("Hanjin"), a lessee of the Company, filed for court protection and immediately began a liquidation process. At that time, the Company had approximately
87,000
container units on lease to Hanjin with a net book value of
$243.3 million
. The Company recorded a loss of
$29.7 million
during the third quarter ended September 30, 2016, comprised of bad debt expense and a charge for costs not expected to be recovered due to deductibles in credit insurance policies. As of
December 31, 2018
, the Company recovered approximately
95%
of its containers previously leased to Hanjin.
The impact of the Hanjin liquidation was significantly lessened by credit insurance policies in place during 2016 which covered the majority of the recovery costs, the value of the containers that were unrecoverable and a portion of the lost lease revenue. The insurance policies did not cover Triton's pre-default receivables. The Company collected total payments from its insurance providers of
$67.0 million
in satisfaction of its claims and recorded a gain of
$6.8 million
to insurance recovery income within operating expenses for the year ended
December 31, 2017
. The net gain represents insurance proceeds received in excess of recovery costs incurred and the net book value of those units written off as unrecoverable.
Net Investment in Finance Leases
The Company has entered into various rental agreements that qualify as direct financing leases or sales-type leases. These leases are usually long-term in nature, typically ranging for a period of three to twelve years, and typically include an option to purchase the equipment at the end of the lease term at a bargain purchase price. At the inception of a direct financing lease or a sales-type lease, a net investment is recorded based on the gross investment (representing the total future minimum lease payments due under the lease plus the estimated residual value), net of unearned income.
F-9
TRITON INTERNATIONAL LIMITED
NOTES TO CONSOLIDATED FINANCIAL STATEMENTS (Continued)
For a direct financing lease, unearned income represents the excess of the gross investment over the net book value of the leased equipment at lease inception. For a sales-type lease, unearned income represents the excess of the gross investment over the fair value of the leased equipment (calculated as the present value of both the total future minimum lease payments due under the lease and the estimated residual value) at lease inception.
At the inception of a sales-type lease, gain (loss) is defined as the difference between (i) the net investment in the lease and (ii) the net book value of the subject containers on the Company’s books at the commencement of the lease.
Leasing Equipment
The Company purchases new equipment from equipment manufacturers for the purpose of leasing such equipment to customers. The Company also purchases used equipment with the intention of selling such equipment in one or more years from the date of purchase. Used units are typically purchased with an existing lease in place or were previously owned by one of the Company's third party owner investors.
Leasing equipment is recorded at cost and depreciated to an estimated residual value on a straight-line basis over the estimated useful lives. Capitalized costs for new container rental equipment include the manufactured cost of the container, inspection, delivery, and associated costs incurred in moving the container from the manufacturer to the initial on-hire location of such container. Repair and maintenance costs that do not extend the lives of the container rental equipment are charged to direct operating expenses at the time the costs are incurred.
The estimated useful lives and residual values of the Company's leasing equipment are based on historical disposal experience and the Company's expectations for future used container sale prices. The Company reviews estimates used in its depreciation policy on a regular basis to determine whether changes have taken place that would suggest that a change in its depreciation estimates for useful lives or the assigned residual values of its equipment is warranted. The Company completed its annual depreciation policy review during the fourth quarter of 2018 and concluded no change was necessary.
On January 1, 2018, the Company changed the estimated residual values for 20-foot refrigerated containers and 40-foot high cube refrigerated containers to
$2,350
and
$3,350
, respectively, as compared to the previous ranges of
$2,250
to
$2,500
for 20-foot refrigerated containers and
$3,250
to
$3,500
for 40-foot high cube refrigerated containers. The estimated residual values for 40-foot flat rack containers and 40-foot open top containers were changed to
$1,700
and
$2,300
, respectively, as compared to the previous ranges of
$1,500
to
$3,000
for 40-foot flat rack containers and
$2,300
to
$2,500
for 40-foot open top containers. In addition, the useful lives for 40-foot flat rack containers and 40-foot open top containers was changed to
16 years
from the previous range of
12 to 14 years
. The effects of changes to residual value and useful life estimates were immaterial to our consolidated financial statements.
The estimated useful lives and residual values for each major equipment type for the periods indicated below were as follows:
|
As of December 31, 2018
|
As of December 31, 2017
|
||||||||||
|
Equipment Type
|
Depreciable Life
|
Residual Value
|
Depreciable Life
|
Residual Value
|
|||||||
|
Dry containers
|
|||||||||||
|
20-foot dry container
|
13 years
|
$
|
1,000
|
|
13 years
|
$
|
1,000
|
|
|||
|
40-foot dry container
|
13 years
|
$
|
1,200
|
|
13 years
|
$
|
1,200
|
|
|||
|
40-foot high cube dry container
|
13 years
|
$
|
1,400
|
|
13 years
|
$
|
1,400
|
|
|||
|
Refrigerated containers
|
|||||||||||
|
20-foot refrigerated container
|
12 years
|
$
|
2,350
|
|
12 years
|
$2,250 to $2,500
|
|
||||
|
40-foot high cube refrigerated container
|
12 years
|
$
|
3,350
|
|
12 years
|
$3,250 to $3,500
|
|
||||
|
Special containers
|
|||||||||||
|
40-foot flat rack container
|
16 years
|
$
|
1,700
|
|
12 to 14 years
|
$1,500 to $3,000
|
|
||||
|
40-foot open top container
|
16 years
|
$
|
2,300
|
|
12 to 14 years
|
$2,300 to $2,500
|
|
||||
|
Tank containers
|
20 years
|
$
|
3,000
|
|
20 years
|
$
|
3,000
|
|
|||
|
Chassis
|
20 years
|
$
|
1,200
|
|
20 years
|
$
|
1,200
|
|
|||
F-10
TRITON INTERNATIONAL LIMITED
NOTES TO CONSOLIDATED FINANCIAL STATEMENTS (Continued)
Depreciation on leasing equipment commences on the date of initial on-hire.
For leasing equipment acquired through sale-leaseback transactions, the Company adjusts its estimates for remaining useful life and residual values based on current conditions in the sales market for older containers and the Company's expectations for how long the equipment will remain on-hire to the current lessee.
The net book value of the Company's leasing equipment by equipment type as of the dates indicated was (in thousands):
|
December 31, 2018
|
December 31, 2017
|
|||||||
|
Dry container units
|
$
|
6,666,560
|
|
$
|
5,941,097
|
|
||
|
Refrigerated container units
|
1,676,331
|
|
1,897,385
|
|
||||
|
Special container units
|
322,607
|
|
287,869
|
|
||||
|
Tank container units
|
107,284
|
|
105,821
|
|
||||
|
Chassis
|
150,669
|
|
132,312
|
|
||||
|
Total
|
$
|
8,923,451
|
|
$
|
8,364,484
|
|
||
Included in the amounts above are units not on lease at
December 31, 2018
and
2017
with a total net book value of
$551.1 million
and
$509.5 million
, respectively. Amortization on equipment purchased under capital lease obligations is included in depreciation and amortization expense on the consolidated statements of operations.
Valuation of Leasing Equipment
Leasing equipment is reviewed for impairment whenever events or changes in circumstances indicate that its carrying value may not be recoverable. Recoverability of an asset to be held and used is measured by a comparison of the carrying value to its estimated undiscounted future cash flows expected to be generated by the asset. If the carrying value of an asset exceeds its estimated undiscounted future cash flows, an impairment charge is recognized in the amount by which the carrying value of the asset exceeds the fair value of the asset. Key indicators of impairment on leasing equipment include, among other factors, a sustained decrease in operating profitability, a sustained decrease in utilization, or indications of technological obsolescence.
When testing for impairment, leasing equipment is generally grouped by equipment type, and is tested separately from other groups of assets and liabilities. Some of the significant estimates and assumptions used to determine future undiscounted cash flows and the measurement for impairment are the remaining useful life, expected utilization, expected future lease rates and expected disposal prices of the equipment. The Company considers the assumptions on expected utilization and the remaining useful life to have the greatest impact on its estimate of future undiscounted cash flows. These estimates are principally based on the Company's historical experience and management's judgment of market conditions.
The Company did not record any impairment charges related to leasing equipment for the years ended
December 31, 2018
and
2017
. For the year ended December 31,
2016
, the Company recorded
$13.1 million
of impairment charges in depreciation and amortization expense related to leasing equipment.
Equipment Held for Sale
When leasing equipment is returned off lease, the Company makes a determination of whether to repair and re-lease the equipment or sell the equipment. At the time the Company determines that equipment will be sold, it reclassifies the appropriate amounts previously recorded as leasing equipment to equipment held for sale. Equipment held for sale is carried at the lower of its estimated fair value less costs to sell or carrying value. Depreciation expense on equipment held for sale is halted and disposals generally occur within 90 days. Initial write downs of equipment held for sale to fair value are recorded as an impairment charge and are included in net gain or loss on sale of leasing equipment. Subsequent increases or decreases to the fair value of those assets are recorded as adjustments to the carrying value of the equipment held for sale, however, any such adjustments may not exceed the respective equipment's carrying value at the time it was initially classified as held for sale. Realized gains and losses resulting from the sale of equipment held for sale are recorded as net gain or loss on sale of leasing equipment, and cash flows associated with the disposal of equipment held for sale are classified as cash flows from investing activities.
F-11
TRITON INTERNATIONAL LIMITED
NOTES TO CONSOLIDATED FINANCIAL STATEMENTS (Continued)
The Company acquired the Equipment Trading segment as part of the Merger on July 12, 2016 and had no such reporting segment prior to that date. Equipment purchased for resale and included in the Equipment Trading segment is reported as equipment held for sale when the time frame between when equipment is purchased and when it is sold is expected to be less than one year.
During the years ended
December 31, 2018
,
2017
, and
2016
, the Company recorded the following net gains or losses on sale of leasing equipment held for sale on the consolidated statements of operations (in thousands):
|
Year Ended December 31, 2018
|
Year Ended December 31, 2017
|
Year Ended December 31, 2016
|
|||||||||
|
Impairment (loss) reversal on equipment held for sale
|
$
|
(3,933
|
)
|
$
|
3
|
|
$
|
(19,399
|
)
|
||
|
Gain (loss) on sale of equipment-net of selling costs
|
39,310
|
|
35,809
|
|
(948
|
)
|
|||||
|
Net gain (loss) on sale of leasing equipment
|
$
|
35,377
|
|
$
|
35,812
|
|
$
|
(20,347
|
)
|
||
Property, Furniture and Equipment
Costs of major additions of property, furniture, equipment and improvements are capitalized and are included in other assets on the consolidated balance sheets. The original cost is depreciated on a straight-line basis over the estimated useful lives of such property, furniture and equipment. Leasehold improvements are amortized on a straight-line basis over the shorter of the lease term or the estimated useful lives of the leased assets. Other fixed assets, which consist primarily of computer software and hardware, are recorded at cost and amortized on a straight-line basis over their respective estimated useful lives, which range from three to seven years. Expenditures for maintenance and repairs are expensed as they are incurred.
Business Combinations
The Company allocates the purchase price to assets acquired and liabilities assumed based on their estimated fair values. The excess of the purchase price over the fair values of identifiable assets and liabilities is recorded as goodwill. Determining the fair value of assets acquired and liabilities assumed requires management’s judgment and often involves the use of significant estimates and assumptions, including assumptions with respect to future cash flows, discount rates, asset lives and market multiples, among other items.
Goodwill
Goodwill is tested for impairment at least annually on October 31st of each fiscal year or more frequently if events occur or circumstances indicate that the fair value of a reporting unit may be below its carrying value. Goodwill has been allocated to the Company’s reporting units.
In evaluating goodwill for impairment, the Company has the option to first assess qualitative factors to determine whether further impairment testing is necessary. Among other relevant events and circumstances that affect the fair value of reporting units, the Company considers individual factors such as macroeconomic conditions, changes in its industry and the markets in which the Company operates, as well as its reporting units' historical and expected future financial performance. If, after assessing the totality of events or circumstances, the Company determines it is more likely than not that the fair value of a reporting unit is greater than its carrying amount, then the quantitative goodwill impairment test is unnecessary. The quantitative goodwill impairment test compares the fair value of a reporting unit with its carrying amount, including goodwill. If the carrying amount of the reporting unit is less than its fair value, no impairment exists. If the carrying amount of a reporting unit exceeds its fair value, an impairment loss shall be recognized in an amount equal to that excess, limited to the total amount of goodwill allocated to that reporting unit.
The Company elected to perform the qualitative assessment for its evaluation of goodwill impairment during the year ended
December 31, 2018
and concluded there was no impairment. Since inception through
December 31, 2018
, the Company has not recorded any goodwill impairment.
Intangible Assets
Intangible assets with finite useful lives such as acquired lease intangibles and customer relationships are initially recorded at fair value and are amortized over their respective estimated useful lives and subsequently reviewed for impairment whenever
F-12
TRITON INTERNATIONAL LIMITED
NOTES TO CONSOLIDATED FINANCIAL STATEMENTS (Continued)
events or changes in circumstances indicate that the carrying amount of the asset may not be recoverable. The Company has not recorded any impairment charges related to intangible assets for the years ended
December 31, 2018
,
2017
, and
2016
.
Revenue Recognition
Operating Leases with Customers
The Company enters into long-term leases and service leases with ocean carriers, principally as lessor in operating lease, for marine cargo equipment. Long-term leases provide Triton's customers with specified equipment for a specified term. The Company's leasing revenues are based upon the number of equipment units leased, the applicable per diem rate and the length of the lease. Long-term leases typically have initial contractual terms ranging from three to eight years. Revenues are recognized on a straight-line basis over the life of the respective lease. Advance billings are deferred and recognized in the period earned. Service leases do not specify the exact number of equipment units to be leased or the term that each unit will remain on-hire, but allow the lessee to pick-up and drop-off units at various locations specified in the lease agreement. Under a service lease, rental revenue is based on the number of equipment units on-hire for a given period. Revenue for customers considered to be non-performing is deferred and recognized when the amounts are received.
The Company recognizes billings to customers for damages and certain other operating costs as leasing revenue as it is earned based on the terms of the contractual agreements with the customer. As principal, the Company is responsible for fulfillment of the services, supplier selection and service specifications, and has ultimate responsibility to pay the supplier for the services whether or not it collects the amount billed to the lessee.
Finance Leases with Customers
The Company enters into finance leases as lessor for some of the equipment in its fleet. The net investment in finance leases represents the receivables due from lessees, net of unearned income and amounts previously billed, which are included in accounts receivable. Unearned income is recognized on a level yield basis over the lease term and is recorded as leasing revenue. Finance leases are usually long-term in nature and typically include an option to purchase the equipment at the end of the lease term for an amount determined to be a bargain.
Equipment Trading Revenues and Expenses
Equipment trading revenues represent the proceeds from the sale of equipment purchased for resale and are recognized as units are sold and delivered to the customer. The related expenses represent the cost of equipment sold as well as other selling costs that are recognized as incurred and are reflected as equipment trading expenses on the consolidated statements of operations.
Direct Operating Expenses
Direct operating expenses are directly related to the Company's equipment under and available for lease. These expenses primarily consist of the Company's costs to repair and maintain the equipment, to reposition the equipment and to store the equipment when it is not on lease. These costs are recognized when incurred. Certain positioning costs may be capitalized when incurred to place new equipment on an initial lease.
Debt Costs
Debt costs represent the fees incurred in connection with debt obligation arrangements. These costs are capitalized and amortized using the effective interest method or on a straight-line basis over the term of the related obligation, depending on the type of debt obligation to which they relate. Unamortized debt costs may be written off when the related debt obligations are refinanced or extinguished prior to maturity.
Derivative Instruments
The Company uses derivatives in the management of its interest rate exposure on its long-term borrowings. The Company records derivative instruments on its balance sheet at fair value and establishes criteria for both the designation and effectiveness of hedging activities.
F-13
TRITON INTERNATIONAL LIMITED
NOTES TO CONSOLIDATED FINANCIAL STATEMENTS (Continued)
The Company has entered into interest rate swap agreements with certain financial institutions. The interest rate swap agreements require the Company to make payments to counterparties at fixed rates in return for receipts based upon variable rates indexed to the London Interbank Offered Rate (“LIBOR”).
Derivative instruments are designated or non-designated for hedge accounting purposes. The fair value of the derivative instruments is measured at each balance sheet date and is reflected on a gross basis on the consolidated balance sheets. The change in fair value of the derivative instruments designated as a cash flow hedge are recorded on the consolidated balance sheets in accumulated other comprehensive income (loss) and are re-classified to interest expense when realized. The change in fair value of non-designated derivative instruments is recorded in the consolidated statements of operations as unrealized loss (gain) on derivative instruments, net and are reclassified to realized loss (gain) on derivative instruments when realized.
Income Taxes
The Company uses the liability method of accounting for income taxes, which requires recognition of deferred tax assets and liabilities based on the expected future tax consequences of temporary differences that currently exist between the tax basis and financial reporting basis of assets and liabilities. Deferred tax assets and liabilities are measured using enacted tax rates expected to apply to taxable income in the years in which those temporary differences are expected to be recovered or settled. Any change in the tax rate which has an effect on deferred tax assets and liabilities is recognized as an increase or decrease to income in the period that includes the enactment date of the law that resulted in the change in tax rate.
The Company recognizes the effect of income tax positions which are more-likely-than-not of being sustained. If a position does not meet the more-likely-than-not criteria, the Company records a reserve against the tax position such that a tax benefit is recognized only in the amount that has a greater than 50% likelihood of being recognized. The full impact of any change in recognition or measurement of an uncertain tax position is reflected in the period in which such change occurs. Potential interest and penalties associated with such uncertain tax positions are recorded as a component of income tax expense.
Foreign Currency Translation and Remeasurement
The Company uses U.S. dollar as its reporting currency. The net assets and operations of foreign subsidiaries included in the consolidated financial statements are attributable primarily to the Company's U.K. subsidiary. The accounts of this subsidiary have been converted at rates of exchange in effect at year end as to balance sheet accounts and at the historical weighted average of exchange rates for the statements of operations accounts. The effects of changes in exchange rates in translating foreign subsidiaries' financial statements are included in shareholders' equity as accumulated other comprehensive (loss) income.
The Company also has certain cash accounts, certain finance lease receivables and certain obligations that are denominated in currencies other than the Company's functional currency. These assets and liabilities are generally denominated in euros or British pounds, and are remeasured at each balance sheet date at the exchange rates in effect as of those dates. The impact of changes in exchange rates on the remeasurement of assets and liabilities are included in administrative expenses on the consolidated statements of operations. Transaction losses were
$1.0 million
for the year ended
December 31, 2018
and were immaterial for the years ended
December 31, 2017
and
2016
.
Share-based Compensation
The Company measures and recognizes share-based awards granted to employees based on estimated fair values. Share-based awards may be subject to forfeiture if certain employment conditions are not met. The Company does not estimate forfeitures in its expense calculations as forfeiture history has been minor. Time based awards are measured at the grant date and are recognized as compensation expense over the employee's requisite service period, generally the vesting period of the equity award, on a straight-line basis. Performance-based awards are recognized as compensation expense when satisfaction of the performance condition is considered probable.
Earnings Per Share
Basic earnings per share is computed by dividing net income attributable to shareholders by the weighted average number of common shares outstanding for the period. Any potential issuance of common shares, including those that are contingent and do not participate in dividends, are excluded from the weighted average number of common shares outstanding. Diluted earnings per share reflect the potential dilution that would occur if securities exercisable or convertible into common shares were exercised or converted into common shares, utilizing the treasury share method.
F-14
TRITON INTERNATIONAL LIMITED
NOTES TO CONSOLIDATED FINANCIAL STATEMENTS (Continued)
The Company excluded
207,991
, nil, and
169,403
of anti-dilutive restricted common shares from its calculation of diluted earnings per share for the years ended
December 31, 2018
,
2017
, and
2016
.
Recently Adopted Accounting Standards Updates
In March 2016, the FASB issued ASU No. 2016-08, Revenue from Contracts with Customers (Topic 606), amending previous updates regarding this topic. Leasing revenue recognition is specifically excluded from this ASU, and therefore, the new standard only applied to equipment trading revenues and sales of leasing equipment. The adoption of this ASU had minimal impact on the Company since the majority of its sales contracts are for containers and do not contain multiple elements. The standard allows for either “full retrospective” adoption, meaning the standard is applied to all of the periods presented, or “modified retrospective” adoption, meaning the standard is applied only to the most current period presented in the financial statements. The Company adopted the standard on January 1, 2018, using the modified retrospective approach. The adoption of Topic 606 did not impact its leasing revenue recognition model because, as noted above, leasing revenue recognition, including ancillary fees, is specifically excluded from this ASU.
The Company has assessed the requirements of the new revenue standard with respect to its equipment trading revenue and
sales of leasing equipment and has concluded that the timing and amount of recognition was not materially affected based on the
fact that there generally are no long-term contracts, multiple element arrangements, or significant customer acquisition costs related
to these revenue streams. The Company also considered the requirement to present disaggregated revenue for its equipment trading
revenue and sales of leasing equipment upon the adoption of Topic 606. The Company currently presents these revenue items separately in its statements of operations. As a result, the Company concluded that the adoption of Topic 606 did not have a significant impact on either the timing of its revenue recognition or manner of presentation.
In August 2016, the FASB issued ASU No. 2016-15, Statement of Cash Flows (Topic 230):
Classification of Certain Receipts
and Cash Payments
. The updated amendment provides guidance as to where certain cash flow items are presented, including debt
prepayment or debt extinguishment costs and proceeds from the settlement of insurance claims. The Company adopted the standard
on January 1, 2018. The adoption of this ASU did not have an impact on the consolidated financial statements since none of the cash flow items specified in the guidance changed the Company's presentation in the consolidated statement of cash flows.
In October 2016, the FASB issued ASU No. 2016-16, Accounting for Income Taxes (Topic 740):
Intra-Entity Transfers of
Assets Other than Inventory
. The ASU eliminates the deferral of the tax effects of intra-entity asset transfers other than inventory.
As a result, the tax expense from the intercompany sale of assets, other than inventory, and associated changes to deferred taxes will be recognized when the sale occurs even though the pre-tax effects of the transaction have not been recognized. The Company
adopted the standard on January 1, 2018. The adoption of this ASU did not have a significant impact on its consolidated financial
statements.
In November 2016, the FASB issued ASU No. 2016-18, Statement of Cash Flows (Topic 230):
Restricted Cash
. The amendments in this ASU require that a statement of cash flows explain the change during the period in the total of cash, cash equivalents and amounts generally described as restricted cash or restricted cash equivalents. As a result, amounts generally described as restricted cash and restricted cash equivalents should be included with cash and cash equivalents when reconciling the beginning-of-period and end-of-period total amounts shown on the statement of cash flows. The amendments do not provide a definition of restricted cash or restricted cash equivalents. The Company adopted this guidance on January 1, 2018 using the retrospective approach. As a result, the Company recorded an increase of
$43.8 million
in net cash provided by financing activities for the year ended
December 31, 2017
and an increase of
$31.4 million
used in financing activities for the year ended
December 31, 2016
related to presentation changes of its restricted cash balance from financing activities to the cash, cash equivalents and restricted cash balance within the consolidated statements of cash flows.
In May 2017, the FASB issued ASU No. 2017-09, Compensation-Stock Compensation (Topic 718):
Scope of Modification
Accounting.
ASU 2017-09 provides clarification on when modification accounting should be used for changes to the terms or conditions of a share-based payment award. This ASU does not change the accounting for modifications but clarifies that modification accounting guidance should only be applied if there is a change to the value, vesting conditions, or award classification
and would not be required if the changes are considered non-substantive. The Company adopted the standard on January 1, 2018
on a prospective basis. The adoption of this ASU did not have an impact on the consolidated financial statements since the Company
did not modify its share-based payment awards since adoption of the standard.
F-15
TRITON INTERNATIONAL LIMITED
NOTES TO CONSOLIDATED FINANCIAL STATEMENTS (Continued)
In February 2018, the FASB issued ASU No. 2018-02, Income Statement - Reporting Comprehensive Income (Topic 220):
Reclassification of Certain Tax Effects from Accumulated Other Comprehensive Income
. This ASU allows a reclassification from
accumulated other comprehensive income to accumulated earnings for tax effects resulting from the Tax Cuts and Jobs Act (the “Act”) and requires certain new disclosures. ASU 2018-02 will be effective for the Company for fiscal years beginning after December 15, 2018, with early adoption permitted. The update should be applied either in the period of adoption or retrospectively
to each period in which the effect of the change in the U.S. federal corporate income tax rate in the Act is recognized. The Company
elected to adopt this ASU on January 1, 2018 by making a one-time reclassification in the period of change of stranded tax effects from accumulated other comprehensive income to accumulated earnings related to the change in tax rates resulting from the Act. The reclassified amount of $3.0 million represents the difference between the amount initially recorded directly to accumulated other comprehensive income at the previously enacted U.S. federal corporate income tax rate as of December 31, 2017 and the amount that would have been recorded directly to accumulated other comprehensive income as of December 31, 2017 by using the newly enacted U.S. federal corporate income tax rate.
In March 2018, the FASB issued ASU No. 2018-05, Income Taxes (Topic 740):
Amendments to SEC Paragraphs Pursuant to SEC Staff Accounting Bulletin No. 118
. The amendments in this ASU add various Securities and Exchange Commission (“SEC) paragraphs pursuant to the issuance of SEC Accounting Bulletin No. 118, Income Tax Accounting Implications of the Tax Cuts and Jobs Act (“SAB 118”). The SEC issued SAB 118 to address concerns about reporting entities’ ability to timely comply with the accounting requirements to recognize all of the effects of the Act in the period of enactment. SAB 118 allows disclosure that
timely determination of some or all of the income tax effects from the Act are incomplete by the due date of the financial statements
and if possible to provide a reasonable estimate. The Company recorded the effects of the change in the tax law pursuant to SAB
118 as of December 31, 2017. The Company adopted the standard on January 1, 2018. There were no updates to the amounts recorded as of December 31, 2017 during 2018.
Recently Issued Accounting Standards Updates
In February 2016, the FASB issued ASU No. 2016-02, Leases (Topic 842) and subsequently issued amendments thereto, that replaced existing lease accounting guidance. The accounting standard will require lessees to recognize a right of use (“ROU”) asset and a corresponding lease liability on their balance sheets. The accounting that will be applied by lessors under ASC 842 is largely unchanged from previous GAAP. The majority of the Company’s leases with its customers will continue to be classified as operating leases. Certain targeted improvements were made to align, where necessary, lessor accounting with the lessee accounting model and ASC 606, Revenue from Contracts with Customers.
The Company plans to adopt the standard on its effective date of January 1, 2019 through a cumulative-effect adjustment. Additionally, the Company will elect the “package of practical expedients” which provides: (1) An entity need not reassess whether any expired or existing contracts are or contain leases; (2) An entity need not reassess the lease classification for any expired or existing leases; and (3) An entity need not reassess initial direct costs for any existing leases. Furthermore, the Company will elect the optional transition method and continue to apply the guidance in ASC 840, including its disclosure requirements, in the comparative periods.
On adoption, the Company expects to recognize a lease liability of approximately
$10.5 million
based on the present value of the remaining minimum rental payments under current leasing standards for existing operating leases and corresponding ROU assets of approximately
$9.0 million
. The Company expects to elect the short-term lease recognition exemption whereby a lease liability and corresponding ROU asset will not be recognized when leases, at the commencement date, have a lease term of 12 months or less.
The Company has assessed the requirements from both a lessee and lessor perspective and concluded the adoption of this standard will not have a significant impact on the consolidated financial statements.
In June 2016, the FASB issued ASU No. 2016-13, Financial Instruments - Credit Losses (Topic 326):
Measurement of Credit
Losses on Financial Instruments.
The guidance affects trade receivables and net investments in leases and requires the measurement
of expected credit losses to be based on relevant information from past events, including historical experiences, current conditions
and reasonable and supportable forecasts that affect collectability. The new guidance will be effective for fiscal years and interim
periods beginning after December 15, 2019 and early adoption is permitted for fiscal years beginning after December 15, 2018, including interim periods within those fiscal years. Different components of the guidance require modified retrospective and/or prospective adoption. Based on the composition of the Company's receivables, current market conditions and historical credit loss
activity, the Company does not expect the adoption of this ASU to have a significant impact on the consolidated financial statements.
F-16
TRITON INTERNATIONAL LIMITED
NOTES TO CONSOLIDATED FINANCIAL STATEMENTS (Continued)
In August 2017, FASB issued ASU No. 2017-12, Derivatives and Hedging (Topic 815):
Targeted Improvements to Accounting for Hedging Activities.
ASU 2017-12 changes the recognition and presentation requirements of hedge accounting, including: eliminating the requirement to separately measure and report hedge ineffectiveness; and presenting all items that affect earnings in the same income statement line item as the hedged item. The ASU also provides new alternatives for: applying hedge accounting
to additional hedging strategies; measuring the hedged item in fair value hedges of interest rate risk; reducing the cost and complexity of applying hedge accounting by easing the requirements for effectiveness testing, hedge documentation and application of the critical terms match method; and reducing the risk of material error correction if a company applies the shortcut method inappropriately. The Company plans to adopt the standard on its effective date of January 1, 2019 and will apply the modified retrospective approach upon adoption. The Company has evaluated the impact of this ASU and concluded the adoption of this standard will not have a significant impact on the consolidated financial statements.
In July 2018, the FASB issued ASU No. 2018-09, Codification Improvements. The amendments in this ASU represent changes to clarify, correct errors in, or make minor improvements to the Accounting Standards Codification (ASC). The transition and effective date guidance are based on the facts and circumstances of each amendment. Some of the amendments do not require transition guidance and will be effective upon issuance. However, many of the amendments in this ASU do have transition guidance with effective dates for annual periods beginning after December 15, 2018. The Company does not expect the adoption of this ASU to have a significant impact on the consolidated financial statements.
Note 3—Fair Value of Financial Instruments
Fair value represents the price that would be received upon the sale of an asset or paid to transfer a liability in an orderly transaction between market participants at the measurement date. The Company uses the following fair value hierarchy when selecting inputs for its valuation techniques, with the highest priority given to Level 1:
|
•
|
Level 1 - quoted prices (unadjusted) in active markets for identical assets or liabilities;
|
|
•
|
Level 2 - inputs other than quoted prices included within Level 1 that are either directly or indirectly observable; and
|
|
•
|
Level 3 - unobservable inputs in which little or no market activity exists, therefore requiring an entity to develop its own assumptions about the assumptions that market participants would use in pricing.
|
Fair Value of Debt
The Company does not measure debt, net of unamortized debt costs, at fair value in its consolidated balance sheets. The fair value was measured using Level 2 inputs and the carrying value and fair value are summarized in the following table (in thousands):
|
December 31, 2018
|
December 31, 2017
|
||||||
|
Liabilities
|
|
|
|||||
|
Total Debt - carrying value
(1)
|
$
|
7,595,922
|
|
$
|
6,986,333
|
|
|
|
Total Debt - fair value
|
$
|
7,559,063
|
|
$
|
6,991,537
|
|
|
|
(1)
|
Excludes unamortized debt costs of
$44.9
million and
$40.6
million, purchase price debt adjustments of
$16.3
million and
$27.5
million, and unamortized debt discounts of
$5.3
million and
$6.5
million as of
December 31, 2018
and
2017
, respectively.
|
Fair Value of Equipment Held for Sale
The Company’s equipment held for sale fair value is measured using Level 2 inputs and is based on recent sales prices and other factors. Equipment held for sale is recorded at the lower of fair value, less costs to sell, or carrying value and an impairment charge is recorded when the carrying value of the asset exceeds its fair value. The following table summarizes the portion of the Company’s equipment held for sale measured at fair value and the cumulative impairment charges recorded to net gain (loss) on sale of leasing equipment through the periods summarized below (in thousands):
|
December 31, 2018
|
December 31, 2017
|
||||||
|
Assets
|
|||||||
|
Equipment held for sale - assets at fair value
(1)
|
$
|
5,750
|
|
$
|
6,104
|
|
|
|
Cumulative impairment charges
(2)
|
$
|
(1,846
|
)
|
$
|
(2,242
|
)
|
|
|
(1)
|
Represents the fair value of containers included in equipment held for sale in the consolidated balance sheets that have been impaired to write down the carrying value of the containers to their estimated fair value less cost to sell.
|
|
(2)
|
Represents the cumulative impairment charges recognized on equipment held for sale from the date of designated held for sale status to the indicated period end date.
|
F-17
TRITON INTERNATIONAL LIMITED
NOTES TO CONSOLIDATED FINANCIAL STATEMENTS (Continued)
The Company recognized net impairment charges of
$3.9 million
for the year ended
December 31, 2018
, an
immaterial
net impairment reversal for the year ended
December 31, 2017
, and net impairment charges of
$19.4 million
for the year ended
December 31, 2016
.
Fair Value of Derivative Instruments
The Company has elected to use the income approach to value its interest rate swap and cap agreements, using Level 2 market expectations at the measurement date and standard valuation techniques to convert future amounts to a single present amount (discounted). The Level 2 inputs for the interest rate swap and cap valuations are inputs other than quoted prices that are observable for the asset or liability (specifically LIBOR and swap rates, basis swap adjustments and credit risk at commonly quoted intervals).
The fair value of derivative instruments on its consolidated balance sheets as of
December 31, 2018
and
December 31, 2017
were as follows (in thousands):
|
|
Asset Derivatives
|
Liability Derivatives
|
|||||||||||||
|
Derivative Instrument
|
December 31, 2018
|
December 31, 2017
|
December 31, 2018
|
December 31, 2017
|
|||||||||||
|
Interest rate cap and swap contracts, designated
|
$
|
10,531
|
|
$
|
3,554
|
|
$
|
10,966
|
|
$
|
2,503
|
|
|||
|
Interest rate swap contracts, not designated
|
3,392
|
|
3,822
|
|
—
|
|
—
|
|
|||||||
|
Total derivatives
|
$
|
13,923
|
|
$
|
7,376
|
|
$
|
10,966
|
|
$
|
2,503
|
|
|||
Fair Value of Other Assets and Liabilities
Cash and cash equivalents, restricted cash, accounts receivable, equipment purchases payable, and accounts payable carrying value amounts approximate fair values because of the short-term nature of these instruments. The Company’s other financial and non-financial assets, which include leasing equipment, net investment in finance leases, intangible assets and goodwill, are not required to be measured at fair value on a recurring basis. However, if certain triggering events occur, or if an annual impairment test is required and the Company determines that these other financial and non-financial assets are impaired after completing an evaluation, these assets would be written down to their fair value.
Note 4—Business Combination
The Company completed the Merger on July 12, 2016 and has accounted for the transaction as a business combination under the acquisition method of accounting. TCIL was treated as the acquirer for accounting purposes. The fair value of the consideration, or the purchase price, was
$510.2 million
. This amount was derived based on the fair value of the shares issued to former TAL stockholders on the closing date of July 12, 2016 when the closing stock price was
$15.28
per share. The Company finalized the allocation of the purchase price to the fair value of the TAL assets acquired and liabilities assumed as of December 31, 2016.
Intangible assets acquired are comprised of a lease intangible for leases acquired with lease rates that were above market and a customer intangible related to the chassis and tank customer lists acquired. The following table summarizes the intangible assets amortization as of
December 31, 2018
(in thousands):
|
Years ending December 31,
|
Above market lease intangibles
|
Customer intangibles
(1)
|
Total intangible assets
|
||||||||
|
2019
|
$
|
36,760
|
|
$
|
758
|
|
$
|
37,518
|
|
||
|
2020
|
22,491
|
|
—
|
|
22,491
|
|
|||||
|
2021
|
16,549
|
|
—
|
|
16,549
|
|
|||||
|
2022
|
10,497
|
|
—
|
|
10,497
|
|
|||||
|
2023
|
4,657
|
|
—
|
|
4,657
|
|
|||||
|
2024 and thereafter
|
1,971
|
|
—
|
|
1,971
|
|
|||||
|
Total
|
$
|
92,925
|
|
$
|
758
|
|
$
|
93,683
|
|
||
|
(1)
|
Customer intangibles are included in other assets on the consolidated balance sheets.
|
F-18
TRITON INTERNATIONAL LIMITED
NOTES TO CONSOLIDATED FINANCIAL STATEMENTS (Continued)
The Company incurred transaction and other costs related to the Merger which are included in transaction and other costs on the consolidated statements of operations.
Note 5—Restricted Cash
The components of restricted cash as of
December 31, 2018
and
December 31, 2017
were as follows (in thousands):
|
December 31, 2018
|
December 31, 2017
|
||||||
|
Collection accounts
|
$
|
20,873
|
|
$
|
23,676
|
|
|
|
Trust accounts
|
6,174
|
|
14,601
|
|
|||
|
Other restricted cash accounts
|
83,542
|
|
55,863
|
|
|||
|
Total restricted cash
|
$
|
110,589
|
|
$
|
94,140
|
|
|
Collection accounts
The Company maintains certain bank accounts (collectively, the “Collection Accounts”). Cash proceeds collected from leasing and disposition invoices are deposited into the Collection Accounts. Similarly, all expenses related to the operation of the containers are paid from the Collection Accounts. The Company is required to maintain as restricted cash the portion of the balances in the Collections Account that relate to certain units that are financed.
Trust accounts
Pursuant to certain debt agreements, cash is transferred from the Collection Accounts to separate accounts (the “Trust Accounts”). The Trust Accounts are maintained by the Company on behalf of certain asset-backed noteholders. The cash in the Trust Accounts is used to pay related Asset-Backed Securitization ("ABS") debt service and related expenses. After such payments, any remaining cash in these accounts is transferred to certain unrestricted bank accounts of the Company and is included in cash and cash equivalents on the consolidated balance sheets.
Other restricted cash accounts
Pursuant to certain asset-backed debt agreements, cash is transferred to separate accounts on a monthly basis in order to maintain an amount equal to projected interest expense for a specified number of months.
Note 6—Debt
Debt consisted of the following (in thousands):
|
December 31, 2018
|
December 31, 2017
|
||||||
|
Institutional notes
|
$
|
2,198,200
|
|
$
|
2,381,000
|
|
|
|
Asset-backed securitization term notes
|
3,063,821
|
|
2,384,926
|
|
|||
|
Term loan facilities
|
1,543,375
|
|
1,701,998
|
|
|||
|
Asset-backed securitization warehouse
|
340,000
|
|
110,000
|
|
|||
|
Revolving credit facilities
|
375,000
|
|
305,000
|
|
|||
|
Capital lease obligations
|
75,526
|
|
103,409
|
|
|||
|
Total debt outstanding
|
7,595,922
|
|
6,986,333
|
|
|||
|
Debt costs
|
(44,889
|
)
|
(40,636
|
)
|
|||
|
Unamortized debt premiums & discounts
|
(5,293
|
)
|
(6,456
|
)
|
|||
|
Unamortized fair value debt adjustment
|
(16,308
|
)
|
(27,516
|
)
|
|||
|
Debt, net of unamortized debt costs
|
$
|
7,529,432
|
|
$
|
6,911,725
|
|
|
The Company is subject to certain financial covenants under its debt agreements. The agreements remain the obligations of the respective subsidiaries, and all related debt covenants are calculated at the subsidiary level. As of
December 31, 2018
and
2017
, the Company was in compliance with all financial covenants in accordance with the terms of its debt agreements.
F-19
TRITON INTERNATIONAL LIMITED
NOTES TO CONSOLIDATED FINANCIAL STATEMENTS (Continued)
As of
December 31, 2018
, the Company had
$4,598.5 million
of total debt outstanding on facilities with fixed interest rates. These fixed rate facilities had a contractual weighted average interest rate of
4.24%
, are scheduled to mature between
2019
and
2029
, and had a weighted average remaining term of
3.9
years as of
December 31, 2018
.
As of
December 31, 2018
, the Company had
$2,997.4 million
of total debt outstanding on facilities with interest rates based on floating rate indices (primarily LIBOR). These floating rate facilities had a contractual weighted average interest rate of
4.23%
, are scheduled to mature between
2019
and
2025
, and had a weighted average remaining term of
3.7
years as of
December 31, 2018
.
The Company hedges the risks associated with fluctuations in interest rates on a portion of its floating rate borrowings by entering into interest rate swap agreements that convert a portion of its floating rate debt to a fixed rate basis, thus reducing the impact of interest rate changes on future interest expense. As of
December 31, 2018
, the Company had interest rate swaps in place with a notional amount of
$1,565.6 million
to fix the floating interest rates on a portion of its floating rate debt obligations, with a weighted average fixed leg interest rate of
2.24%
and a weighted average remaining term of
4.4
years. Including the impact of the Company's interest rate swaps, the contractual weighted average interest rate on its floating rate facilities was
4.08%
as of
December 31, 2018
.
As of
December 31, 2018
, the Company had
$6,164.1 million
of total debt with fixed interest rates or floating interest rates that have been synthetically fixed through interest rate swap contracts. This accounts for
81%
of total debt. These facilities had a contractual weighted average interest rate of
4.17%
and a weighted average remaining term of
4.1
years as of
December 31, 2018
.
Overall, the Company's total debt had a contractual weighted average interest rate of
4.18%
as of
December 31, 2018
, including the impact of the swap contracts.
The Company recorded
$6.1 million
,
$7.0 million
,
$0.1 million
of debt termination expense for the years ended
December 31, 2018
,
2017
and
2016
, respectively.
Debt Facilities
Effective April 1, 2017, both TCIL and TAL obtained the necessary consents from lenders and noteholders to appoint TCIL as manager of all of TAL’s container fleet including those containers in special purpose entities of TAL.
Institutional Notes
In accordance with the institutional note agreements, interest payments on the Company's institutional notes are due semi-annually. Institutional note maturities typically range from
7
-
12
years, with level principal payments due annually following an interest-only period. The Company's institutional notes are pre-payable (in whole or in part) at the Company's option at any time, subject to certain provisions in the note agreements, including the payment of a make-whole premium in respect to such prepayment. These facilities provide for an advance rate against the net book values of designated eligible equipment generally in the range from
83%
to
85%
. These institutional notes had a contractual weighted average interest rate of
4.71%
as of
December 31, 2018
and are scheduled to mature between
2020
and
2029
.
Asset-Backed Securitization Term Notes
Under the Company’s ABS facilities, indirect wholly-owned subsidiaries of the Company issue asset-backed notes. The issuance of asset-backed notes is the primary business objective of those subsidiaries. The facilities are intended to be bankruptcy remote so that such assets are not available to creditors of the Company or its affiliates until and unless the related secured borrowings have been fully discharged. These transactions do not meet accounting requirements for sales treatment and are recorded as secured borrowings.
The Company’s borrowings under the ABS facilities amortize in monthly installments, typically in level payments over five or more years. These facilities provide for an advance rate against the net book values of designated eligible equipment generally in the range from
77%
to
87%
. The net book values for purposes of calculating eligible equipment is determined according to the related debt agreement and may be different than those calculated per U.S. GAAP. The Company is required to maintain restricted cash balances on deposit in designated bank accounts equal to three to nine months of interest expense depending on the terms of each facility.
F-20
TRITON INTERNATIONAL LIMITED
NOTES TO CONSOLIDATED FINANCIAL STATEMENTS (Continued)
These ABS term notes had a contractual weighted average interest rate of
3.96%
as of
December 31, 2018
and are scheduled to mature between
2022
and
2028
.
During the year ended
December 31, 2018
, the Company completed offerings of the following Class A and B fixed rate asset-backed notes:
|
Date Completed
|
Total Offering
|
Contractual Weighted Average Interest Rate
|
Scheduled Maturity
|
|||
|
March 20, 2018
|
$450.0 million
|
3.99%
|
March 20, 2028
|
|||
|
June 20, 2018
|
$367.9 million
|
4.23%
|
June 20, 2028
|
|||
|
August 9, 2018
|
$260.6 million
|
3.67%
|
August 21, 2023
|
|||
On September 14, 2018, the Company extinguished a term note and paid the remaining balance of
$4.7 million
.
Term Loan Facilities
The term loan facilities amortize in monthly or quarterly installments. These facilities provide for an advance rate against the net book values of designated eligible equipment generally in the range from
79%
to
83%
. These term loan facilities had a contractual weighted average interest rate of
4.07%
as of
December 31, 2018
, and are scheduled to mature between
2019
and
2023
.
On April 20, 2018, the Company sold an office building for net proceeds of
$27.6 million
and recorded a gain on sale of
$21.0 million
. The proceeds of the sale were used to pay off the mortgage balance of
$18.3 million
plus accrued interest of
$0.1 million
.
On May 31, 2018, the Company extinguished a term loan and paid the outstanding balance of
$93.9 million
.
On August 1, 2018, the Company amended a term loan agreement and extended the maturity date to
April 20, 2022
.
On September 28, 2018, the Company concurrently extinguished a term loan and entered into a new revolving credit facility with a maturity date of
September 28, 2023
. The outstanding term loan balance of
$52.5 million
was repaid using proceeds drawn from the revolving credit facility.
On November 30, 2018, the Company entered into a new term loan of
$1.0 billion
. The term loan has a contractual interest rate of LIBOR plus
1.50%
and a scheduled maturity date of November 30, 2023. Concurrently, the Company utilized proceeds from the new term loan to extinguish three term loans with total outstanding balances of
$682.3 million
.
On December 27, 2018, the Company extinguished a term loan and paid the outstanding balance of
$155.6 million
.
Asset-Backed Securitization Warehouse Facilities
Under the Company’s ABS warehouse facilities, indirect wholly-owned subsidiaries of the Company issue asset-backed notes. The issuance of asset-backed notes is the primary business objective of those subsidiaries. The facilities are intended to be bankruptcy remote so that such assets are not available to creditors of the Company or its affiliates until and unless the related secured borrowings have been fully discharged. These transactions do not meet accounting requirements for sales treatment and are recorded as secured borrowings.
The Company's ABS warehouse facilities have a maximum combined borrowing capacity of
$900.0 million
as of
December 31, 2018
. A borrowing capacity of
$400.0 million
is available on a revolving basis until September 28, 2020, after which any borrowings would convert to term notes with a maturity date of September 20, 2024. This facility has a contractual interest rate of one-month LIBOR plus
1.85%
margin until the conversion date when it would have a contractual interest rate of one-month LIBOR plus
2.85%
.
During the revolving period, the borrowing capacity under the facilities is determined by applying an advance rate against the net book values of designated eligible equipment. The advance rate for these facilities is
81%
. The net book values for purposes of calculating eligible equipment is determined according to the related debt agreement and may be different than those calculated per U.S. GAAP. The Company is required to maintain restricted cash balances on deposit in designated bank accounts equal to
three
to
five
months of interest expense.
F-21
TRITON INTERNATIONAL LIMITED
NOTES TO CONSOLIDATED FINANCIAL STATEMENTS (Continued)
On August 20, 2018, the Company terminated a warehouse facility. There was
no
outstanding balance at the date of termination.
On December 13, 2018, the Company entered into an ABS warehouse facility with a borrowing capacity of
$500.0 million
. The facility is available on a revolving basis until December 13, 2021 paying interest at LIBOR plus
1.75%
, after which any borrowings would convert to term notes with a maturity date of
December 15, 2025
paying interest at LIBOR plus
2.85%
.
As of December 31, 2018, the ABS warehouse facilities had a contractual weighted average interest rate of
4.22%
.
Revolving Credit Facilities
The Company's revolving credit facilities have a maximum borrowing capacity of
$1,235.0 million
. These facilities provide for an advance rate against the net book values of designated eligible equipment. The approximate average advance rate for the two facilities is
83%
. The revolving credit facilities had a contractual weighted average interest rate of
4.48%
as of
December 31, 2018
and are scheduled to mature between
2022
and
2023
.
On May 8, 2018, the Company increased its credit limit on one of its revolving credit facilities from
$1,025.0 million
to
$1,125.0 million
. This revolving credit facility’s contractual interest rate remained at one-month LIBOR plus
2.00%
.
On September 28, 2018, the Company entered into a new
$110.0 million
revolving credit facility. This facility has an interest rate of
one
-month LIBOR plus
1.85%
and a scheduled maturity date of
September 28, 2023
.
On December 20, 2018, the Company terminated a revolving credit facility by paying off the remaining principal plus accrued interest balance of
$45.1 million
.
Debt maturities excluding capital lease obligations (in thousands):
|
Years ending December 31,
|
|||
|
2019
|
$
|
964,278
|
|
|
2020
|
825,737
|
|
|
|
2021
|
812,325
|
|
|
|
2022
|
1,707,174
|
|
|
|
2023
|
1,476,092
|
|
|
|
2024 and thereafter
|
1,734,790
|
|
|
|
Total
|
$
|
7,520,396
|
|
Capital Lease Obligations
The Company has entered into a series of capital lease transactions with various financial institutions to finance chassis and containers. Each lease is accounted for as a capital lease, with interest expense recognized on a level yield basis over the period preceding early purchase options, if any, which is generally
3
to
10
years from the transaction date. These agreements have fixed interest rates ranging from
3.60%
to
4.93%
, and mature between
2019
and
2024
.
At
December 31, 2018
, future lease payments under these capital leases were as follows (in thousands):
F-22
TRITON INTERNATIONAL LIMITED
NOTES TO CONSOLIDATED FINANCIAL STATEMENTS (Continued)
|
Years ending December 31,
|
|||
|
2019
|
$
|
11,210
|
|
|
2020
|
10,766
|
|
|
|
2021
|
10,766
|
|
|
|
2022
|
10,766
|
|
|
|
2023
|
18,734
|
|
|
|
2024 and thereafter
|
23,925
|
|
|
|
Total future payments
|
86,167
|
|
|
|
Less: amount representing interest
|
(10,641
|
)
|
|
|
Capital lease obligations
|
$
|
75,526
|
|
Note 7—Derivative Instruments
Interest Rate Swaps / Caps
The Company has entered into interest rate swap and cap agreements to manage interest rate risk exposure. Interest rate swap agreements are utilized to limit the Company's exposure to interest rate risk by converting a portion of its floating rate debt to a fixed rate basis, thus reducing the impact of interest rate changes on future interest expense. These agreements involve the receipt of floating rate amounts in exchange for fixed rate interest payments over the lives of the agreements without an exchange of the underlying principal amounts. The counterparties to the Company's interest rate swap agreements are highly rated financial institutions. In the unlikely event that the counterparties fail to meet the terms of the interest rate swap agreements, the Company's exposure is limited to the interest rate differential on the notional amount at each monthly settlement period over the life of the agreements. The Company does not anticipate any non-performance by the counterparties. Substantially all of the assets of certain indirect, wholly owned subsidiaries of the Company have been pledged as collateral for the underlying indebtedness and the amounts payable under the interest rate swap agreements for each of these entities. In addition, certain assets of the Company's subsidiaries, are pledged as collateral for various credit facilities and the amounts payable under certain interest rate swap agreements.
On January 18, 2018, the Company entered into an interest rate cap agreement for a total notional amount of
$400.0 million
. The agreement is amortizing over a
one
-year term. The Company has designated this interest rate cap agreement as a cash flow hedge for accounting purposes.
During the year ended
December 31, 2018
, the Company entered into the following interest rate swaps:
|
Date Completed
|
Notional Amount
|
Indexed To
|
Scheduled Maturity
|
|||
|
September 5, 2018
|
$257.6 million
|
3 month LIBOR
|
August 20, 2023
|
|||
|
September 21, 2018
|
$100.0 million
|
1 month LIBOR
|
September 28, 2025
|
|||
|
September 21, 2018
|
$200.0 million
|
1 month LIBOR
|
September 30, 2025
|
|||
During the year ended
December 31, 2018
, the Company canceled the following interest rate swaps:
|
Date Canceled
|
Notional Amount
|
Funds Received
|
||
|
December 20, 2018
|
$50.0 million
|
$0.2 million
|
||
As of
December 31, 2018
, the Company had interest rate swap and cap agreements in place to fix or limit the floating interest rates on a portion of the borrowings under its debt facilities summarized below:
|
Derivatives
|
Notional
Amount
|
Weighted Average
Fixed Leg (Pay) Interest Rate
|
Cap Rate
|
Weighted Average
Remaining Term |
||||
|
Interest Rate Swap
|
$1,565.6 million
|
2.24%
|
n/a
|
4.4 years
|
||||
|
Interest Rate Cap
|
$381.7 million
|
n/a
|
2.90%
|
0.1 years
|
||||
The following table represents pre-tax amounts in accumulated other comprehensive (loss) related to interest rate swap agreements expected to be recognized in income over the next twelve months (in thousands):
F-23
TRITON INTERNATIONAL LIMITED
NOTES TO CONSOLIDATED FINANCIAL STATEMENTS (Continued)
|
December 31, 2018
|
|||
|
Unrealized gain (loss) on derivative instruments designated as cash flow hedges
|
$
|
9,199
|
|
|
Net gain (loss) on terminated derivative instruments designated as cash flow hedges
|
631
|
|
|
The following table summarizes the impact of derivative instruments on the consolidated statements of operations and the consolidated statements of comprehensive income (loss) (in thousands):
|
|
Financial statement caption
|
Year Ended December 31, 2018
|
Year Ended December 31, 2017
|
Year Ended December 31, 2016
|
|||||||||
|
Derivative instrument
|
|||||||||||||
|
Non-designated derivative instruments
|
Realized (gain) loss on derivative instruments, net
|
$
|
(2,072
|
)
|
$
|
900
|
|
$
|
3,438
|
|
|||
|
Non-designated derivative instruments
|
Unrealized (gain) loss on derivative instruments, net
|
430
|
|
(1,397
|
)
|
(4,405
|
)
|
||||||
|
Designated derivative instruments
|
Other comprehensive loss (income)
|
2,119
|
|
641
|
|
(46,917
|
)
|
||||||
|
Designated derivative instruments
|
Interest and debt (income) expense
|
(6,780
|
)
|
611
|
|
1,200
|
|
||||||
Note 8—Net Investment in Finance Leases
The following table represents the components of the net investment in finance leases (in thousands):
|
December 31, 2018
|
December 31, 2017
|
||||||
|
Future minimum lease payment receivable
(1)
|
$
|
574,422
|
|
$
|
283,374
|
|
|
|
Estimated residual receivable
|
107,598
|
|
64,560
|
|
|||
|
Gross finance lease receivables
|
682,020
|
|
347,934
|
|
|||
|
Unearned income
(2)
|
(203,955
|
)
|
(52,043
|
)
|
|||
|
Net investment in finance leases
(3)
|
$
|
478,065
|
|
$
|
295,891
|
|
|
|
(1)
|
At the inception of the lease, the Company records the total minimum lease payments net of executory costs, if any. The gross finance lease receivable is reduced as billed to the customer and reclassified to accounts receivable until paid. There were
no
executory costs included in gross finance lease receivables as of
December 31, 2018
and
2017
.
|
|
(2)
|
The difference between the gross finance lease receivable and the fair value of the equipment at the lease inception is recorded as unearned income. Unearned income together with initial direct costs, are amortized to income over the lease term so as to produce a constant periodic rate of return. There were
no
unamortized initial direct costs as of
December 31, 2018
and
2017
.
|
|
(3)
|
As of
December 31, 2018
, three major customers represented
50%
,
24%
and
13%
of the Company's finance lease portfolio. As of
December 31, 2017
, two major customers represented
46%
and
28%
of the Company's finance lease portfolio. No other customer represented more than 10% of the Company's finance lease portfolio in each of those years.
|
Contractual maturities of the Company’s gross finance lease receivables subsequent to
December 31, 2018
are as follows (in thousands):
|
Years ending December 31,
|
|||
|
2019
|
$
|
109,184
|
|
|
2020
|
119,197
|
|
|
|
2021
|
84,266
|
|
|
|
2022
|
78,327
|
|
|
|
2023
|
60,528
|
|
|
|
2024 and thereafter
|
230,518
|
|
|
|
Total
|
$
|
682,020
|
|
The Company evaluates potential losses in its finance lease portfolio by regularly reviewing the specific receivables in the portfolio and analyzing loss experience.
The Company maintains allowances, if necessary, for doubtful accounts and estimated losses resulting from the inability of its lessees to make required payments under finance leases. These allowances are based on, but not limited to, each lessee’s payment history, management’s current assessment of each lessee’s financial condition and the recoverability. The Company currently does not have an allowance on its gross finance lease receivables.
F-24
TRITON INTERNATIONAL LIMITED
NOTES TO CONSOLIDATED FINANCIAL STATEMENTS (Continued)
Note 9—Share-Based Compensation and Other Equity Matters
2016 Triton Plan
On July 8, 2016, the Company’s 2016 Equity Incentive Plan (“2016 Equity Plan”) became effective. The 2016 Equity Plan provides for the granting of service-based and performance-based restricted shares to executives, employees and directors. The maximum aggregate number of shares that may be issued under the 2016 Equity Plan is initially
5,000,000
common shares. Any awards issued under the 2016 Equity Plan that are forfeited by the participant, will become available for future grant under the 2016 Equity Plan.
The following table summarizes the Company’s restricted share activity for the year ended
December 31, 2018
:
|
|
Number of Shares Outstanding
|
Weighted Average Fair Value
|
||||
|
Non-vested balance at December 31, 2017
|
752,014
|
|
$
|
16.10
|
|
|
|
Shares granted
|
360,846
|
|
28.23
|
|
||
|
Shares vested
(1)
|
(201,510
|
)
|
18.21
|
|
||
|
Shares forfeited
|
(5,855
|
)
|
29.17
|
|
||
|
Non-vested balance at December 31, 2018
|
905,495
|
|
$
|
20.38
|
|
|
|
(1)
|
Plan participants tendered
44,626
common shares to satisfy income tax withholding obligations. These shares were subsequently retired by the Company.
|
Additional shares may be granted based upon the satisfaction of certain performance criteria.
The share-based compensation expense for the years ended
December 31, 2018
,
2017
and
2016
included in administrative expenses on the consolidated statements of operations was
$9.0 million
,
$5.6 million
, and
$5.4 million
, respectively. Included in the expense are certain performance-based share expense where achievement of the performance condition was deemed probable.
As of
December 31, 2018
, the total unrecognized compensation costs related to restricted shares is approximately
$7.0 million
, which is expected to be recognized over the remaining weighted average vesting period of approximately
1.6 years
.
On
September 7, 2016
, the Company approved the grants of
47,075
restricted shares to non-employee directors at a fair value of
$14.55
per share that vested immediately. On May 10, 2017, the Company approved the grants of
38,675
restricted shares to directors at a fair value of
$28.04
per share that vested immediately. On May 2, 2018, the Company approved the grants of
39,320
restricted shares to directors at a fair value of
$31.85
per share that vested immediately.
All TCIL share counts in the following descriptions have been retroactively converted to reflect the share exchange ratios of
0.80
for TCIL related to the Merger.
TCIL Restricted Shares
On July 8, 2016, TCIL issued
113,942
restricted shares at a fair value of
$13.68
per share. The Company recognized
$0.5 million
of compensation costs which are included in transaction and other costs on the consolidated statements of operations for the year ended December 31, 2016. These unvested TCIL restricted shares converted to Triton restricted shares upon the Merger.
TAL Stock Based Compensation Plan
TAL’s previously existing stock-based compensation plans consisted of the 2005 Management Omnibus Incentive Plan and the 2014 Equity Incentive Plan. The TAL restricted shares granted in 2014 and 2015 vested on July 12, 2016 upon the closing of the Merger and were included in the purchase price consideration. TAL granted
140,000
restricted shares in January 2016 that were converted to Triton restricted shares upon the Merger.
TCIL Share Options
TCIL adopted a share-based compensation plan (the “Option Plan”) for the benefit of certain executives of TCIL and its consolidated subsidiaries effective May 23, 2011.
F-25
TRITON INTERNATIONAL LIMITED
NOTES TO CONSOLIDATED FINANCIAL STATEMENTS (Continued)
As a result of the Merger, TCIL settled and canceled all vested and unvested market based options for fully vested Class A and B common shares. There was no compensation costs related to options for the years ended
December 31, 2018
and 2017. The Company recognized
$2.3 million
compensation costs reported as transaction and other costs on the consolidated statements of operations for the year ended December 31, 2016 related to options granted during the years 2011 through 2013 and the settlement and cancellation.
TCIL Non-Employee Director Equity Plan
On July 12, 2016,
26,058
of restricted Class A common shares that were issued to participants of the non-employee director equity plan, became fully vested and the remaining unamortized compensation costs of
$0.4 million
was expensed and recorded in transaction and other costs on the consolidated statements of operations.
There was no compensation expense related to the TCIL non-employee director equity plan during the year ended December 31, 2018 and 2017. For the year ended December 31, 2016, compensation expense of
$0.3 million
was included in administrative expenses on the consolidated statements of operations.
Equity Issuance
On September 12, 2017, the Company completed a common share offering in which it sold
5,350,000
common shares at a public offering price of
$32.75
per share. On September 22, 2017, the Company sold an additional
802,500
common shares at a public offering price of
$32.75
per share pursuant to the full exercise of an option granted to the underwriters in connection with the offering. The aggregate net proceeds received by the Company from the offering, including the exercise of the option, amounted to
$192.9 million
after deducting underwriting discounts and commissions, and before deducting total expenses incurred in connection with the offering of approximately
$1.3 million
. The net proceeds were used for general corporate purposes, including the purchase of containers.
Share Repurchase Program
On August 1, 2018, the Company's Board of Directors authorized the repurchase of up to
$200.0 million
of its common shares. Purchases under the repurchase program may be made in the open market or privately negotiated transactions, and may include transactions pursuant to a repurchase plan administered in accordance with Rules 10b5-1 and 10b-18 under the Securities Exchange Act of 1934, as amended. Purchases may be made from time to time at the Company’s discretion and the timing and amount of any share repurchases will be determined based on share price, market conditions, legal requirements, and other factors. The repurchase program does not obligate the Company to acquire any particular amount of common shares, and the Company may suspend or discontinue the repurchase program at any time.
During the year ended
December 31, 2018
, the Company repurchased
1,853,148
common shares at an average price per-share of
$31.34
for a total of
$58.1 million
. As of
December 31, 2018
,
$141.9 million
remains available for common share repurchases.
The changes in the Company's common shares and treasury shares during the years ending
December 31, 2018
,
2017
and
2016
are shown in the table below:
F-26
TRITON INTERNATIONAL LIMITED
NOTES TO CONSOLIDATED FINANCIAL STATEMENTS (Continued)
|
Class A Common Shares
(1)
|
Class B Common Shares
(1)
|
Common Shares
|
Treasury Shares
|
||||||||
|
Balance as of January 1, 2016
|
35,628,585
|
|
4,800,000
|
|
—
|
|
—
|
|
|||
|
Share-based compensation
|
140,237
|
|
—
|
|
465,097
|
|
—
|
|
|||
|
Settlement of liability classified service-based share options
|
517,912
|
|
—
|
|
—
|
|
—
|
|
|||
|
Share repurchase to settle shareholder tax obligations
|
(232,715
|
)
|
—
|
|
(14,290
|
)
|
—
|
|
|||
|
Redemption / Cancellation of common shares
|
(32,536
|
)
|
—
|
|
(230,857
|
)
|
—
|
|
|||
|
Issuance and conversion of Triton shares due to Merger
|
(36,021,483
|
)
|
(4,800,000
|
)
|
74,156,075
|
|
—
|
|
|||
|
Balance as of December 31, 2016
|
—
|
|
—
|
|
74,376,025
|
|
—
|
|
|||
|
Issuance of common shares
|
—
|
|
—
|
|
6,152,500
|
|
—
|
|
|||
|
Share-based compensation
|
—
|
|
—
|
|
161,194
|
|
—
|
|
|||
|
Share repurchase to settle shareholder tax obligations
|
—
|
|
—
|
|
(1,962
|
)
|
—
|
|
|||
|
Balance as of December 31, 2017
|
—
|
|
—
|
|
80,687,757
|
|
—
|
|
|||
|
Share-based compensation
|
—
|
|
—
|
|
200,341
|
|
—
|
|
|||
|
Share repurchase to settle shareholder tax obligations
|
—
|
|
—
|
|
(44,626
|
)
|
—
|
|
|||
|
Repurchase of common shares
|
—
|
|
—
|
|
—
|
|
(1,853,148
|
)
|
|||
|
Balance as of December 31, 2018
|
—
|
|
—
|
|
80,843,472
|
|
(1,853,148
|
)
|
|||
(1) As a result of the Merger transaction completed on July 12, 2016, all Class A and B common shares held by TCIL shareholders were exchanged for Triton common shares at a
0.80
ratio, and therefore, the historical number of shares, options, and per share amounts were retroactively adjusted.
Dividends
The Company paid the following quarterly dividends during the years ended
December 31, 2018
,
2017
, and
2016
on its issued and outstanding common shares adjusted for the effects of the Merger:
|
Record Date
|
Payment Date
|
Aggregate Payment
|
Per Share
Payment
|
||
|
December 3, 2018
|
December 20, 2018
|
$41.0 Million
|
$0.52
|
||
|
September 4, 2018
|
September 25, 2018
|
$41.6 Million
|
$0.52
|
||
|
June 1, 2018
|
June 22, 2018
|
$41.6 Million
|
$0.52
|
||
|
March 12, 2018
|
March 28, 2018
|
$36.0 Million
|
$0.45
|
||
|
December 1, 2017
|
December 22, 2017
|
$36.0 Million
|
$0.45
|
||
|
September 1, 2017
|
September 22, 2017
|
$33.2 Million
|
$0.45
|
||
|
June 1, 2017
|
June 22, 2017
|
$33.2 Million
|
$0.45
|
||
|
March 20, 2017
|
March 30, 2017
|
$33.2 Million
|
$0.45
|
||
|
December 2, 2016
|
December 22, 2016
|
$33.2 Million
|
$0.45
|
||
|
September 8, 2016
|
September 22, 2016
|
$33.3 Million
|
$0.45
|
||
|
July 8, 2016
(1)
|
July 11, 2016
|
$18.3 Million
|
$0.45
|
||
__________________________________________
|
(1)
|
This dividend was prior to the Merger and represents TCIL dividend payments only.
|
Accumulated Other Comprehensive Income (Loss)
F-27
TRITON INTERNATIONAL LIMITED
NOTES TO CONSOLIDATED FINANCIAL STATEMENTS (Continued)
The following table summarizes the components of accumulated other comprehensive income (loss), net of tax, for the years ended
December 31, 2018
,
2017
, and
2016
(in thousands):
|
Cash Flow
Hedges |
Foreign
Currency Translation |
Accumulated Other Comprehensive (Loss) Income
|
|||||||||
|
Balance as of December 31, 2015
|
$
|
—
|
|
$
|
(3,666
|
)
|
$
|
(3,666
|
)
|
||
|
Change in derivative instruments designated as cash flow hedges
|
30,405
|
|
—
|
|
30,405
|
|
|||||
|
Reclassification of loss on derivative instruments designated as cash flow hedges
|
777
|
|
—
|
|
777
|
|
|||||
|
Foreign currency translation adjustment
|
—
|
|
(758
|
)
|
(758
|
)
|
|||||
|
Other comprehensive income (loss)
|
31,182
|
|
(758
|
)
|
30,424
|
|
|||||
|
Balance as of December 31, 2016
|
$
|
31,182
|
|
$
|
(4,424
|
)
|
$
|
26,758
|
|
||
|
Change in derivative instruments designated as cash flow hedges
|
(407
|
)
|
—
|
|
(407
|
)
|
|||||
|
Reclassification of loss on derivative instruments designated as cash flow hedges
|
440
|
|
—
|
|
440
|
|
|||||
|
Foreign currency translation adjustment
|
—
|
|
151
|
|
151
|
|
|||||
|
Other comprehensive income (loss)
|
33
|
|
151
|
|
184
|
|
|||||
|
Balance as of December 31, 2017
|
$
|
31,215
|
|
$
|
(4,273
|
)
|
$
|
26,942
|
|
||
|
Change in derivative instruments designated as cash flow hedges
|
(3,933
|
)
|
—
|
|
(3,933
|
)
|
|||||
|
Reclassification of gain on derivative instruments designated as cash flow hedges
|
(5,210
|
)
|
—
|
|
(5,210
|
)
|
|||||
|
Tax reclassifications to accumulated earnings for the adoption of ASU 2018-02
|
(3,029
|
)
|
—
|
|
(3,029
|
)
|
|||||
|
Foreign currency translation adjustment
|
—
|
|
(207
|
)
|
(207
|
)
|
|||||
|
Other comprehensive income (loss)
|
(12,172
|
)
|
(207
|
)
|
(12,379
|
)
|
|||||
|
Balance as of December 31, 2018
|
$
|
19,043
|
|
$
|
(4,480
|
)
|
$
|
14,563
|
|
||
The following table summarizes the reclassifications out of accumulated other comprehensive income (loss) (in thousands):
|
Amounts Reclassified From Accumulated Other Comprehensive Income (Loss)
|
Affected Line Item
in the Consolidated
Statements of Operations
|
||||||||||||
|
December 31, 2018
|
December 31, 2017
|
December 31, 2016
|
|||||||||||
|
Amounts reclassified from Accumulated other comprehensive (loss) before income tax
|
$
|
(6,780
|
)
|
$
|
611
|
|
$
|
1,200
|
|
Interest and debt expense
|
|||
|
Income tax (benefit)
|
1,570
|
|
(171
|
)
|
(423
|
)
|
Income tax expense
|
||||||
|
Amounts reclassified from Accumulated other comprehensive (loss), net of tax
|
$
|
(5,210
|
)
|
$
|
440
|
|
$
|
777
|
|
Net income
|
|||
Note 10—Non-Controlling Interests
The members of Triton Container Investments LLC, (“TCI”) have made varying capital contributions with respect to investments in eleven different groups of containers, each referred to as a “Tranche”. Pursuant to the terms of TCI’s limited liability company operating agreement (the “Operating Agreement”), TCI’s assets, liabilities and results of operations are allocated by Tranche to those members who invested in each Tranche.
As further provided in the Operating Agreement, TCI allocates all profits and losses, and may make periodic distributions, to its members. Such distributions were subject to restrictions contained in its various debt agreements.
The Operating Agreement provides for the TCI investors to initially receive:
|
•
|
90% of container disposition proceeds cash flows up to a certain targeted amount, by Tranche, after which the TCI investors’ sharing in additional disposition proceeds cash flows declines pursuant to a schedule to 50%; and
|
|
•
|
10% of all non-disposition proceeds cash flows up to a certain targeted amount, by Tranche, after which the TCI investors’ sharing in additional non-disposition proceeds cash flows increases pursuant to a schedule to 50%.
|
F-28
TRITON INTERNATIONAL LIMITED
NOTES TO CONSOLIDATED FINANCIAL STATEMENTS (Continued)
All remaining disposition and non-disposition proceeds cash flows are for the account of TCIL.
Because the terms of the Operating Agreement reflect a profit sharing arrangement in which the investors’ economic rights differ from their legal ownership interests, the non-controlling interests in TCI’s earnings are based on the terms of the contractual arrangement. Income is allocated to non-controlling interests consistent with the allocation of operating cash flows and disposition proceeds over the Tranche lives.
TCIL, a wholly owned subsidiary of the Company, contributed more than 50% of TCI’s consolidated members’ capital and controls TCI’s operations as its manager and therefore, TCI is consolidated into the Company. While TCIL, as manager, is limited by the Operating Agreement and cannot take certain actions that are inconsistent with the purpose of TCI, the TCI investors do not have the substantive ability to dissolve TCI or otherwise remove TCIL as manager without cause and do not have substantive participating rights.
Non-controlling interests included in the Company’s consolidated financial statements are comprised of (i) the amount of the initial investment made by the TCI investors, plus or minus (ii) the profits and/or losses allocated to the TCI investors pursuant to the terms of the Operating Agreement, plus or minus (iii) additional cash contributions made by and/or cash distributions received by the TCI investors. The income allocated to the TCI investors is determined based on a formula contained in the Operating Agreement and amounts allocated to non-controlling interests will vary based on the operating performance of the containers and the sale proceeds from the containers once the containers are retired from the fleet. Consolidated income tax expense is calculated based upon income attributable to the Company and, accordingly excludes income tax on the income attributable to the TCI investors, which is the responsibility of the owners of such interests. The Company held membership interests in TCI representing
56.0%
and
55.6%
of TCI’s total members’ capital as of
December 31, 2018
and
2017
, respectively.
Note 11—Segment and Geographic Information
Segment Information
The Company operates its business in one industry, intermodal transportation equipment, and has
two
operating segments which also represent its reporting segments:
|
•
|
Equipment leasing - the Company owns, leases and ultimately disposes of containers and chassis from its lease fleet.
|
|
•
|
Equipment trading - the Company purchases containers from shipping line customers, and other sellers of containers, and resells these containers to container retailers and users of containers for storage or one-way shipment. Included in the equipment trading segment revenues are leasing revenues from equipment purchased for resale that is currently on lease until the containers are dropped off.
|
These operating segments were determined based on the chief operating decision maker's review and resource allocation of the products and services offered.
The following tables summarizes our segment information and the consolidated totals reported (in thousands):
|
As of and for the Year Ended December 31, 2018
|
Equipment Leasing
|
Equipment Trading
|
Totals
|
||||||||
|
Total leasing revenues
|
$
|
1,346,031
|
|
$
|
4,272
|
|
$
|
1,350,303
|
|
||
|
Trading margin
|
—
|
|
18,921
|
|
18,921
|
|
|||||
|
Net gain on sale of leasing equipment
|
35,377
|
|
—
|
|
35,377
|
|
|||||
|
Depreciation and amortization expense
|
544,167
|
|
971
|
|
545,138
|
|
|||||
|
Interest and debt expense
|
321,290
|
|
1,441
|
|
322,731
|
|
|||||
|
Realized (gain) loss on derivative instruments, net
|
(2,066
|
)
|
(6
|
)
|
(2,072
|
)
|
|||||
|
Income (loss) before income taxes
(1)
|
416,270
|
|
17,563
|
|
433,833
|
|
|||||
|
Equipment held for sale
|
46,968
|
|
19,485
|
|
66,453
|
|
|||||
|
Goodwill
|
220,864
|
|
15,801
|
|
236,665
|
|
|||||
|
Total assets
|
10,224,421
|
|
45,592
|
|
10,270,013
|
|
|||||
|
Purchases of leasing equipment and investments in finance leases
(2)
|
1,603,507
|
|
—
|
|
1,603,507
|
|
|||||
F-29
TRITON INTERNATIONAL LIMITED
NOTES TO CONSOLIDATED FINANCIAL STATEMENTS (Continued)
|
As of and for the Year Ended December 31, 2017
|
Equipment Leasing
|
Equipment Trading
|
Totals
|
||||||||
|
Total leasing revenues
|
$
|
1,160,196
|
|
$
|
3,321
|
|
$
|
1,163,517
|
|
||
|
Trading margin
|
—
|
|
4,184
|
|
4,184
|
|
|||||
|
Net gain on sale of leasing equipment
|
35,812
|
|
—
|
|
35,812
|
|
|||||
|
Depreciation and amortization expense
|
500,099
|
|
621
|
|
500,720
|
|
|||||
|
Interest and debt expense
|
280,909
|
|
1,438
|
|
282,347
|
|
|||||
|
Realized (gain) loss on derivative instruments, net
|
900
|
|
—
|
|
900
|
|
|||||
|
Income (loss) before income taxes
(1)
|
262,574
|
|
3,254
|
|
265,828
|
|
|||||
|
Equipment held for sale
|
31,534
|
|
11,661
|
|
43,195
|
|
|||||
|
Goodwill
|
220,864
|
|
15,801
|
|
236,665
|
|
|||||
|
Total assets
|
9,534,330
|
|
43,295
|
|
9,577,625
|
|
|||||
|
Purchases of leasing equipment and investments in finance leases
(2)
|
1,562,863
|
|
—
|
|
1,562,863
|
|
|||||
|
As of and for the Year Ended December 31, 2016
(3)
|
Equipment Leasing
|
Equipment Trading
|
Totals
|
||||||||
|
Total leasing revenues
|
$
|
827,111
|
|
$
|
1,583
|
|
$
|
828,694
|
|
||
|
Trading margin
|
—
|
|
618
|
|
618
|
|
|||||
|
Net gain on sale of leasing equipment
|
(20,347
|
)
|
—
|
|
(20,347
|
)
|
|||||
|
Depreciation and amortization expense
|
392,250
|
|
342
|
|
392,592
|
|
|||||
|
Interest and debt expense
|
183,377
|
|
637
|
|
184,014
|
|
|||||
|
Realized (gain) loss on derivative instruments, net
|
3,438
|
|
—
|
|
3,438
|
|
|||||
|
Income (loss) before income taxes
(1)
|
(6,302
|
)
|
(3,795
|
)
|
(10,097
|
)
|
|||||
|
Equipment held for sale
|
81,804
|
|
18,059
|
|
99,863
|
|
|||||
|
Goodwill
|
220,864
|
|
15,801
|
|
236,665
|
|
|||||
|
Total assets
|
8,660,786
|
|
52,785
|
|
8,713,571
|
|
|||||
|
Purchases of leasing equipment and investments in finance leases
(2)
|
629,176
|
|
156
|
|
629,332
|
|
|||||
|
(1)
|
Segment income (loss) before income taxes excludes unrealized
loss
on interest rate swaps of
$0.4 million
for the years ended
December 31, 2018
, and unrealized
gain
of
$1.4 million
and
$4.4 million
, for the years ended
December 31, 2017
and
2016
, respectively, and
debt termination expense
of
$6.1 million
,
$7.0 million
, and
$0.1 million
for the years ended
December 31, 2018
,
2017
, and
2016
, respectively.
|
|
(2)
|
Represents cash disbursements for purchases of leasing equipment and investments in finance lease as reflected in the consolidated statements of cash flows for the periods indicated, but excludes cash flows associated with the purchase of equipment held for resale.
|
|
(3)
|
Prior to the Merger, all income and assets were attributed to the Equipment leasing segment.
|
There are
no
intercompany revenues or expenses between segments; certain administrative expenses are allocated between segments based on an estimate of services provided. A portion of the Company's equipment purchased for resale was purchased through certain sale-leaseback transactions with its shipping line customers. Due to the expected longer term nature of these transactions, these purchases are reflected as leasing equipment as opposed to equipment held for sale and the cash flows associated with these transactions are reflected as purchases of leasing equipment and proceeds from the sale of equipment in investing activities in the Company's consolidated statements of cash flows.
Geographic Segment Information
The Company generates the majority of its leasing revenues from international containers which are deployed by its customers in a wide variety of global trade routes. The majority of the Company's leasing related revenue is denominated in U.S. dollars.
The following table summarizes the geographic allocation of equipment leasing revenues for the years ended
December 31, 2018
,
2017
, and
2016
based on customers' primary domicile (in thousands):
F-30
TRITON INTERNATIONAL LIMITED
NOTES TO CONSOLIDATED FINANCIAL STATEMENTS (Continued)
|
|
Year Ended December 31, 2018
|
Year Ended December 31, 2017
|
Year Ended December 31, 2016
|
||||||||
|
Total equipment leasing revenues:
|
|
|
|||||||||
|
Asia
|
$
|
553,928
|
|
$
|
491,996
|
|
$
|
397,500
|
|
||
|
Europe
|
630,031
|
|
518,598
|
|
334,118
|
|
|||||
|
Americas
|
124,885
|
|
111,558
|
|
58,945
|
|
|||||
|
Bermuda
|
2,988
|
|
1,745
|
|
464
|
|
|||||
|
Other International
|
38,471
|
|
39,620
|
|
37,667
|
|
|||||
|
Total
|
$
|
1,350,303
|
|
$
|
1,163,517
|
|
$
|
828,694
|
|
||
Since the majority of the Company's containers are used internationally, where no one container is domiciled in one particular place for a prolonged period of time, all of the Company's long-lived assets are considered to be international.
The following table represents the geographic allocation of equipment trading revenues for the years ended
December 31, 2018
,
2017
and
2016
based on the location of the sale (in thousands):
|
|
Year Ended December 31, 2018
|
Year Ended December 31, 2017
|
Year Ended December 31, 2016
(1)
|
||||||||
|
Total equipment trading revenues:
|
|
|
|||||||||
|
Asia
|
$
|
18,536
|
|
$
|
17,342
|
|
$
|
7,410
|
|
||
|
Europe
|
21,211
|
|
8,383
|
|
4,439
|
|
|||||
|
Americas
|
34,167
|
|
7,747
|
|
3,082
|
|
|||||
|
Bermuda
|
—
|
|
22
|
|
—
|
|
|||||
|
Other International
|
9,125
|
|
3,925
|
|
1,487
|
|
|||||
|
Total
|
$
|
83,039
|
|
$
|
37,419
|
|
$
|
16,418
|
|
||
(1) Prior to the Merger on
July 12, 2016
, the Company had no equipment trading revenues.
Note 12—Income Taxes
The Company is a Bermuda exempted company. Bermuda does not impose a corporate income tax. The Company is subject to taxation in certain foreign jurisdictions on a portion of its income attributable to such jurisdictions. The two main subsidiaries of Triton are TCIL and TAL. TCIL is a Bermuda exempted company and therefore no income tax is imposed. However, a portion of TCIL’s income is subject to taxation in the U.S. and certain other foreign jurisdictions. TAL is a U.S. company and therefore is subject to taxation in the U.S.
Effects of the Tax Cuts and Jobs Act
U.S. income tax legislation, commonly referred to as the Tax Cuts and Jobs Act (the "Tax Act"), was enacted on December 22, 2017. Though certain key aspects of the law were recognized in accordance with ASC 740, Accounting for Income Taxes in 2017, other significant provisions were not effective and did not result in accounting effects for the Company until 2018.
The significant provisions that became effective and materially impacted the Company’s income taxes in 2018 include: an incremental tax (base erosion anti-abuse tax or BEAT) on excessive amounts paid to foreign related parties and limitations on the deductibility of named executive officer’s compensation. The impact on these provisions is recorded in the financial statements in 2018, consistent with the general principles of measurement and recognition of income taxes in accordance with ASC 740, Accounting for Income Taxes.
The following table sets forth the total income taxes for the periods indicated (in thousands):
F-31
TRITON INTERNATIONAL LIMITED
NOTES TO CONSOLIDATED FINANCIAL STATEMENTS (Continued)
|
December 31,
2018 |
December 31, 2017
|
December 31, 2016
|
|||||||||
|
Current taxes:
|
|||||||||||
|
Bermuda
|
$
|
—
|
|
$
|
—
|
|
$
|
—
|
|
||
|
U.S.
|
3,164
|
|
36
|
|
(80
|
)
|
|||||
|
Foreign
|
1,072
|
|
839
|
|
841
|
|
|||||
|
$
|
4,236
|
|
$
|
875
|
|
$
|
761
|
|
|||
|
Deferred taxes:
|
|||||||||||
|
Bermuda
|
$
|
—
|
|
$
|
—
|
|
$
|
—
|
|
||
|
U.S.
|
67,136
|
|
(94,079
|
)
|
(709
|
)
|
|||||
|
Foreign
|
(731
|
)
|
(70
|
)
|
(100
|
)
|
|||||
|
66,405
|
|
(94,149
|
)
|
(809
|
)
|
||||||
|
Total income taxes
|
$
|
70,641
|
|
$
|
(93,274
|
)
|
$
|
(48
|
)
|
||
The components of income (loss) before income taxes for the periods indicated below were as follows (in thousands):
|
December 31,
2018 |
December 31, 2017
|
December 31, 2016
|
|||||||||
|
Bermuda sources
|
$
|
128,905
|
|
$
|
134,849
|
|
$
|
765
|
|
||
|
U.S. sources
|
288,386
|
|
125,799
|
|
(7,451
|
)
|
|||||
|
Foreign sources
|
10,022
|
|
(396
|
)
|
853
|
|
|||||
|
Income (loss) before income taxes
|
$
|
427,313
|
|
$
|
260,252
|
|
$
|
(5,833
|
)
|
||
The difference between the Bermuda statutory income tax rate and the effective tax rate on the consolidated statements of operations for the periods indicated below were as follows:
|
December 31,
2018 |
December 31, 2017
|
December 31, 2016
|
||||||
|
Bermuda tax rate
|
—
|
%
|
—
|
%
|
—
|
%
|
||
|
Change in enacted tax act
|
1.02
|
%
|
(53.55
|
)%
|
—
|
%
|
||
|
U.S. income taxed at other than the statutory rate
|
14.67
|
%
|
17.10
|
%
|
41.68
|
%
|
||
|
Effect of uncertain tax positions
|
0.07
|
%
|
0.21
|
%
|
(10.16
|
)%
|
||
|
Foreign income taxed at other than the statutory rate
|
0.18
|
%
|
0.10
|
%
|
(4.15
|
)%
|
||
|
Effect of permanent differences
|
0.28
|
%
|
0.04
|
%
|
(1.58
|
)%
|
||
|
Other discrete items
|
0.31
|
%
|
0.26
|
%
|
(24.97
|
)%
|
||
|
Effective income tax rate
|
16.53
|
%
|
(35.84
|
)%
|
0.82
|
%
|
||
Deferred income tax assets and liabilities are comprised of the following (in thousands):
F-32
TRITON INTERNATIONAL LIMITED
NOTES TO CONSOLIDATED FINANCIAL STATEMENTS (Continued)
|
December 31, 2018
|
December 31, 2017
|
||||||
|
Deferred income tax assets:
|
|||||||
|
Net operating loss carryforwards
|
$
|
60,173
|
|
$
|
197,089
|
|
|
|
Passive activity loss carryforwards
|
—
|
|
7
|
|
|||
|
Allowance for losses
|
98
|
|
622
|
|
|||
|
Derivative instruments
|
934
|
|
1,529
|
|
|||
|
Deferred income
|
359
|
|
261
|
|
|||
|
Accrued liabilities and other payables
|
3,875
|
|
631
|
|
|||
|
Total gross deferred tax assets
|
65,439
|
|
200,139
|
|
|||
|
Less: Valuation allowance
|
—
|
|
—
|
|
|||
|
Net deferred tax assets
|
$
|
65,439
|
|
$
|
200,139
|
|
|
|
Deferred income tax liabilities:
|
|||||||
|
Accelerated depreciation
|
$
|
318,779
|
|
$
|
382,961
|
|
|
|
Goodwill and other intangible amortization
|
2,981
|
|
2,141
|
|
|||
|
Derivative instruments
|
2,306
|
|
790
|
|
|||
|
Deferred income
|
19,294
|
|
27,347
|
|
|||
|
Deferred partnership income (loss) (TCI)
|
967
|
|
1,134
|
|
|||
|
Other
|
3,241
|
|
1,205
|
|
|||
|
Total gross deferred tax liability
|
347,568
|
|
415,578
|
|
|||
|
Net deferred income tax liability
|
$
|
282,129
|
|
$
|
215,439
|
|
|
The Company has not
recorded
a valuation allowance for deferred tax assets as of
December 31, 2018
and
December 31, 2017
.
The Merger resulted in an ownership change under the Internal Revenue Code and certain state taxing authorities whereby federal net operating losses immediately prior to the Merger of
$700 million
will be subject to certain limitations. The Company does not expect such limitations to impact the ability to utilize net operating losses prior to their expiration.
In assessing the potential future realization of deferred tax assets, management considers whether it is more likely than not that some portion or all of the deferred tax assets will not be realized. The ultimate realization of deferred tax assets is dependent upon the generation of future taxable income during the periods in which those temporary differences become deductible. The Company considers the scheduled reversal of deferred tax liabilities, projected future taxable income and tax planning strategies in making this assessment. Based upon the level of historical taxable income and projections for future taxable income over the periods during which the deferred tax assets are deductible, the Company believes it is more likely than not that the Company will realize the benefits of these deductible differences at
December 31, 2018
.
Certain income taxes on unremitted earnings have not been reflected on the consolidated financial statements because such earnings are intended to be permanently reinvested in those jurisdictions. Such earnings and related withholding taxes are estimated to be approximately
$60 million
and
$18 million
, respectively, at
December 31, 2018
.
Net operating loss carryforwards for foreign income tax purposes of
$280.1 million
are available to offset future U.S. taxable income from
2019
through
2037
.
The Company files income tax returns in several jurisdictions including the U.S. and certain U.S. states.
The following table summarizes unrecognized tax benefit amounts as follows (in thousands):
F-33
TRITON INTERNATIONAL LIMITED
NOTES TO CONSOLIDATED FINANCIAL STATEMENTS (Continued)
|
December 31, 2018
|
December 31, 2017
|
||||||
|
Beginning balance at January 1
|
$
|
8,250
|
|
$
|
7,777
|
|
|
|
Increase related to current year’s tax position
|
1,652
|
|
1,315
|
|
|||
|
Lapse of statute of limitations
|
(1,367
|
)
|
(898
|
)
|
|||
|
Foreign exchange adjustment
|
55
|
|
56
|
|
|||
|
Ending balance at December 31
|
$
|
8,590
|
|
$
|
8,250
|
|
|
All unrecognized tax benefits as of
December 31, 2018
will impact income tax expense when recognized, however,
$7.2 million
of the unrecognized tax benefit is expected to have no net impact on after-tax income as a result of offsetting reimbursements from third parties. It is reasonably possible that the total amount of unrecognized tax benefit as of
December 31, 2018
will decrease by
$1.4 million
within the next twelve months due to statute of limitations lapses. This reduction will impact income tax expense when recognized. The 2015, 2016, 2017, and 2018 tax years remain subject to examination by major tax jurisdictions.
The following table summarizes interest and penalty expense as follows (in thousands):
|
|
December 31, 2018
|
December 31, 2017
|
December 31, 2016
|
||||||||
|
Interest expense (benefit)
|
$
|
98
|
|
$
|
144
|
|
$
|
121
|
|
||
|
Penalty expense (benefit)
|
$
|
(158
|
)
|
$
|
(64
|
)
|
$
|
(29
|
)
|
||
The following table summarizes the components of income taxes payable included in accounts payable and other accrued expenses on the consolidated balance sheets were as follows (in thousands):
|
December 31, 2018
|
December 31, 2017
|
||||||
|
Corporate income taxes payable
|
$
|
906
|
|
$
|
56
|
|
|
|
Unrecognized tax benefits
|
8,590
|
|
8,250
|
|
|||
|
Interest accrued
|
922
|
|
824
|
|
|||
|
Penalties
|
402
|
|
561
|
|
|||
|
Income taxes payable
|
$
|
10,820
|
|
$
|
9,691
|
|
|
Note 13—Other Postemployment Benefits
The Company’s U.S. employees participate in a defined contribution plan. Under the provisions of the plan, an employee is fully vested with respect to Company contributions after four years of service. The Company matches employee contributions of
100%
up to a maximum of
$6,000
of qualified compensation and may, at its discretion, make voluntary contributions. The Company's contributions were
$0.7 million
,
$1.0 million
, and
$0.7 million
for each of the years ended
December 31, 2018
,
2017
, and
2016
, respectively.
Note 14—Rental Income Under Operating Leases
The following is the minimum future rental income as of
December 31, 2018
under non-cancelable operating leases, assuming the minimum contractual lease term (in thousands):
|
Years ending December 31,
|
|||
|
2019
|
$
|
823,641
|
|
|
2020
|
697,766
|
|
|
|
2021
|
589,542
|
|
|
|
2022
|
478,160
|
|
|
|
2023
|
328,216
|
|
|
|
2024 and thereafter
|
594,529
|
|
|
|
Total
|
$
|
3,511,854
|
|
Note 15—Commitments and Contingencies
F-34
TRITON INTERNATIONAL LIMITED
NOTES TO CONSOLIDATED FINANCIAL STATEMENTS (Continued)
Lease Commitments
The Company has cancelable and non-cancelable operating lease agreements principally for facilities and for office equipment used in the Company’s operations. Total operating lease rental expense included in administrative expenses on the consolidated statements of operations was
$2.9 million
,
$2.4 million
, and
$2.3 million
for the years ended
December 31, 2018
,
2017
and
2016
, respectively.
Future minimum rental commitments under non-cancelable operating leases having an original term of more than one year as of
December 31, 2018
were as follows (in thousands):
|
Years ending December 31,
|
|||
|
2019
|
$
|
3,234
|
|
|
2020
|
2,933
|
|
|
|
2021
|
2,409
|
|
|
|
2022
|
2,041
|
|
|
|
2023
|
1,298
|
|
|
|
2024 and thereafter
|
—
|
|
|
|
Total
|
$
|
11,915
|
|
Container Equipment Purchase Commitments
As of
December 31, 2018
, the Company had commitments to purchase equipment in the amount of
$28.2 million
payable in
2019
.
Contingencies
The Company is party to various pending or threatened legal or regulatory proceedings arising in the ordinary course of its business. Based upon information presently available, the Company does not expect any liabilities arising from these matters to have a material effect on the consolidated financial position, results of operations or cash flows of the Company.
Employment Agreements and Indemnification Agreements
The Company has entered into employment arrangements and indemnification agreements with certain executive officers and with certain employees. The agreements specify various employment-related matters, including annual compensation, performance incentive bonuses, and severance benefits in the event of termination with or without cause.
Retention Bonus Plan
TCIL established a bonus plan in 2011 to award bonuses to certain employees for continued service (the “Retention Bonus Plan”) and in 2015, established an incremental retention bonus plan (the “Plan”) to award bonuses to certain employees for continued service who were not included in the Retention Bonus Plan. In accordance with the terms of the Retention Bonus Plan agreement, specified bonus amounts, plus interest compounded annually, were paid to all participants on the earlier of their termination date or June 2017.
TAL established a bonus plan in 2015 to award bonuses to certain TAL employees for continued service (the “TAL Retention Bonus Plan”). In accordance with the terms of the TAL Retention Bonus Plan agreement, the specified bonus amounts were paid to all participants on the earlier of their termination date or July 2017.
Severance Plan
The Company established severance plans in order to provide severance benefits to eligible employees who are involuntarily terminated for reasons other than cause, or who resign for “good reason”. Employees eligible for benefits under the severance plans would receive a severance award and other benefits based upon their tenure. The following table summarizes changes to the Company's total severance balance (in thousands):
F-35
TRITON INTERNATIONAL LIMITED
NOTES TO CONSOLIDATED FINANCIAL STATEMENTS (Continued)
|
|
Total
|
||
|
Balance at December 31, 2016
|
$
|
20,718
|
|
|
Accrual
|
6,023
|
|
|
|
Payments
|
(17,064
|
)
|
|
|
Balance at December 31, 2017
|
9,677
|
|
|
|
Accrual
|
—
|
|
|
|
Payments
|
(8,462
|
)
|
|
|
Balance at December 31, 2018
|
$
|
1,215
|
|
Note 16
—Selected Quarterly Financial Data (Unaudited)
The following table sets forth certain key interim financial information for the years ended
December 31, 2018
and
2017
:
|
(In thousands, except per share amounts)
|
|||||||||||||||
|
First
Quarter |
Second
Quarter |
Third Quarter
|
Fourth
Quarter |
||||||||||||
|
2018
|
|||||||||||||||
|
Total leasing revenues
|
$
|
315,097
|
|
$
|
329,771
|
|
$
|
350,078
|
|
$
|
355,357
|
|
|||
|
Trading margin
|
$
|
2,991
|
|
$
|
3,994
|
|
$
|
5,810
|
|
$
|
6,126
|
|
|||
|
Net gain on sale of leasing equipment
|
$
|
9,218
|
|
$
|
11,105
|
|
$
|
7,055
|
|
$
|
7,999
|
|
|||
|
Net income attributable to shareholders
|
$
|
80,892
|
|
$
|
104,870
|
|
$
|
94,236
|
|
$
|
69,557
|
|
|||
|
Net income per basic common share
|
$
|
1.01
|
|
$
|
1.31
|
|
$
|
1.18
|
|
$
|
0.88
|
|
|||
|
Net income per diluted common share
|
$
|
1.00
|
|
$
|
1.30
|
|
$
|
1.17
|
|
$
|
0.87
|
|
|||
|
2017
|
|||||||||||||||
|
Total leasing revenues
|
$
|
265,602
|
|
$
|
281,939
|
|
$
|
302,120
|
|
$
|
313,856
|
|
|||
|
Trading margin
|
$
|
392
|
|
$
|
1,328
|
|
$
|
1,369
|
|
$
|
1,095
|
|
|||
|
Net gain on sale of leasing equipment
|
$
|
5,161
|
|
$
|
9,639
|
|
$
|
10,263
|
|
$
|
10,749
|
|
|||
|
Net income attributable to shareholders
|
$
|
34,611
|
|
$
|
45,671
|
|
$
|
57,156
|
|
$
|
207,160
|
|
|||
|
Net income per basic common share
|
$
|
0.47
|
|
$
|
0.62
|
|
$
|
0.76
|
|
$
|
2.59
|
|
|||
|
Net income per diluted common share
|
$
|
0.47
|
|
$
|
0.62
|
|
$
|
0.75
|
|
$
|
2.57
|
|
|||
Note 17—Related Party Transactions
The Company has a 50% interest in TriStar Container Services (Asia) Private Limited (“TriStar”), which is primarily engaged in the selling and leasing of container equipment in the domestic and short sea markets in India. The Company's investment in TriStar is included in other assets on the consolidated balance sheet and accounted for using the equity method. The following table summarizes payments, direct finance lease, and loan payable balances with TriStar (in thousands):
|
December 31, 2018
|
December 31, 2017
|
||||||
|
Payments received from TriStar on direct finance leases
|
$
|
1,848
|
|
$
|
1,897
|
|
|
|
Payments received from TriStar on loan payable
|
$
|
—
|
|
$
|
128
|
|
|
|
Direct finance lease balance
|
$
|
10,710
|
|
$
|
10,648
|
|
|
|
Loan payable balance
|
$
|
—
|
|
$
|
—
|
|
|
Note 18—Subsequent Events
On
February 8, 2019
, the Company increased its borrowing capacity under one of its ABS warehouse facilities by
$300.0 million
to a maximum borrowing capacity of
$800.0 million
. No other terms were changed in the agreement.
On
February 12, 2019
, the Company's Board of Directors approved and declared a
$0.52
per share quarterly cash dividend on its issued and outstanding common shares, payable on
March 28, 2019
to shareholders of record at the close of business on
March 12, 2019
.
F-36
SCHEDULE I - CONDENSED FINANCIAL INFORMATION OF REGISTRANT
TRITON INTERNATIONAL LIMITED
Parent Company Condensed Balance Sheets
(In thousands, except share data)
|
December 31, 2018
|
December 31, 2017
|
||||||
|
ASSETS:
|
|||||||
|
Cash and cash equivalents
|
$
|
2
|
|
$
|
—
|
|
|
|
Investment in subsidiaries
|
2,250,159
|
|
2,078,936
|
|
|||
|
Other assets
|
10
|
|
—
|
|
|||
|
Total assets
|
$
|
2,250,171
|
|
$
|
2,078,936
|
|
|
|
LIABILITIES AND SHAREHOLDERS' EQUITY:
|
|||||||
|
Accounts payable and other accrued expenses
|
5,988
|
|
2,652
|
|
|||
|
Intercompany payable
|
487
|
|
—
|
|
|||
|
Intercompany loan
|
40,000
|
|
—
|
|
|||
|
Total liabilities
|
46,475
|
|
2,652
|
|
|||
|
Shareholders' equity
|
|||||||
|
Common shares, $0.01 par value, 270,000,000 and 294,000,000 shares authorized, 80,843,472 and 80,687,757 shares issued, respectively
|
809
|
|
807
|
|
|||
|
Undesignated shares, $0.01 par value, 30,000,000 and 6,000,000 shares authorized, no shares issued and outstanding
|
—
|
|
—
|
|
|||
|
Treasury shares, at cost, 1,853,148 shares and no shares, respectively
|
(58,114
|
)
|
—
|
|
|||
|
Additional paid-in capital
|
896,811
|
|
889,168
|
|
|||
|
Accumulated earnings
|
1,349,627
|
|
1,159,367
|
|
|||
|
Accumulated other comprehensive income
|
14,563
|
|
26,942
|
|
|||
|
Total shareholders' equity
|
2,203,696
|
|
2,076,284
|
|
|||
|
Total liabilities and shareholders' equity
|
$
|
2,250,171
|
|
$
|
2,078,936
|
|
|
S-1
TRITON INTERNATIONAL LIMITED
Parent Company Condensed Statements of Operations
(In thousands)
|
Year Ended December 31,
|
|||||||||||
|
2018
|
2017
|
2016
|
|||||||||
|
Revenues:
|
|||||||||||
|
Revenues
|
$
|
—
|
|
$
|
—
|
|
$
|
—
|
|
||
|
Total revenues
|
—
|
|
—
|
|
—
|
|
|||||
|
Operating expenses:
|
|||||||||||
|
Administrative expenses
|
5,343
|
|
4,011
|
|
276
|
|
|||||
|
Transaction and other costs (income)
|
—
|
|
—
|
|
10,706
|
|
|||||
|
Operating income (loss)
|
(5,343
|
)
|
(4,011
|
)
|
(10,982
|
)
|
|||||
|
Other expenses:
|
|||||||||||
|
Interest and debt expense
|
57
|
|
—
|
|
—
|
|
|||||
|
Net income (losses) from subsidiaries
|
354,955
|
|
348,609
|
|
(2,535
|
)
|
|||||
|
Total other income (expenses)
|
354,898
|
|
348,609
|
|
(2,535
|
)
|
|||||
|
Income (loss) before income taxes
|
349,555
|
|
344,598
|
|
(13,517
|
)
|
|||||
|
Income tax expense (benefit)
|
—
|
|
—
|
|
—
|
|
|||||
|
Net income (loss)
|
$
|
349,555
|
|
$
|
344,598
|
|
$
|
(13,517
|
)
|
||
S-2
TRITON INTERNATIONAL LIMITED
Parent Company Condensed Statements of Cash Flows
(In thousands)
|
Year Ended December 31,
|
|||||||||||
|
2018
|
2017
|
2016
|
|||||||||
|
Cash flows from operating activities:
|
|||||||||||
|
Net income (loss)
|
$
|
349,555
|
|
$
|
344,598
|
|
$
|
(13,517
|
)
|
||
|
Adjustments to reconcile net income (loss) to net cash provided by operating activities:
|
|||||||||||
|
Net (income) loss from subsidiaries
|
(354,955
|
)
|
(348,609
|
)
|
2,535
|
|
|||||
|
Dividends received from subsidiaries
|
220,304
|
|
197,171
|
|
77,376
|
|
|||||
|
Share-based compensation expense
|
1,252
|
|
1,084
|
|
—
|
|
|||||
|
Other
|
409
|
|
2,622
|
|
—
|
|
|||||
|
Net cash provided by (used in) operating activities
|
216,565
|
|
196,866
|
|
66,394
|
|
|||||
|
Cash flows from investing activities:
|
|||||||||||
|
Investment in subsidiary
|
(40,000
|
)
|
(254,240
|
)
|
—
|
|
|||||
|
Net cash provided by (used in) investing activities
|
(40,000
|
)
|
(254,240
|
)
|
—
|
|
|||||
|
Cash flows from financing activities:
|
|||||||||||
|
Issuance of common shares, net of underwriter expenses
|
—
|
|
192,931
|
|
—
|
|
|||||
|
Purchases of treasury shares
|
(56,274
|
)
|
—
|
|
—
|
|
|||||
|
Intercompany loan
|
40,000
|
|
—
|
|
—
|
|
|||||
|
Dividends paid
|
(160,289
|
)
|
(135,557
|
)
|
(66,394
|
)
|
|||||
|
Net cash provided by (used in) financing activities
|
(176,563
|
)
|
57,374
|
|
(66,394
|
)
|
|||||
|
Net increase (decrease) in cash and cash equivalents
|
$
|
2
|
|
$
|
—
|
|
$
|
—
|
|
||
|
Cash, cash equivalents and restricted cash, beginning of period
|
—
|
|
—
|
|
—
|
|
|||||
|
Cash, cash equivalents and restricted cash, end of period
|
$
|
2
|
|
$
|
—
|
|
$
|
—
|
|
||
S-3
SCHEDULE II
TRITON INTERNATIONAL LIMITED
Valuation and Qualifying Accounts
Years ended
December 31, 2018
,
2017
, and
2016
(In thousands)
|
For the year ended December 31,
|
|||||||||||
|
Finance Lease-Allowance for doubtful accounts:
|
2018
|
2017
|
2016
|
||||||||
|
Beginning Balance
|
$
|
—
|
|
$
|
527
|
|
$
|
526
|
|
||
|
Additions / (Reversals)
|
—
|
|
(527
|
)
|
1
|
|
|||||
|
(Write-offs) / Reversals
|
—
|
|
—
|
|
—
|
|
|||||
|
Ending Balance
|
$
|
—
|
|
$
|
—
|
|
$
|
527
|
|
||
|
Accounts Receivable-Allowance for doubtful accounts:
|
|||||||||||
|
Beginning Balance
|
$
|
3,002
|
|
$
|
28,082
|
|
$
|
8,297
|
|
||
|
Additions / (Reversals)
|
(568
|
)
|
581
|
|
19,811
|
|
|||||
|
(Write-offs) / Reversals
|
(1,194
|
)
|
(25,661
|
)
|
(26
|
)
|
|||||
|
Ending Balance
|
$
|
1,240
|
|
$
|
3,002
|
|
$
|
28,082
|
|
||
S-4
TABLE OF CONTENTS
Part IItem 1. BusinessItem 1A. Risk FactorsItem 1B. Unresolved Staff CommentsItem 2. PropertiesItem 3. Legal ProceedingsItem 4. Mine Safety DisclosuresPart IIItem 5. Market For Registrant's Common Equity, Related Shareholder Matters, and Issuer Purchases Of Equity SecuritiesItem 6. Selected Financial DataItem 7. Management's Discussion and Analysis Of Financial Condition and Results Of OperationsItem 7A. Quantitative and Qualitative Disclosures About Market RiskItem 8. Financial Statements and Supplementary DataItem 9. Changes in and Disagreements with Accountants on Accounting and Financial DisclosureItem 9A. Controls and ProceduresItem 9B. Other InformationPart IIIItem 10. Directors, Executive Officers and Corporate GovernanceItem 11. Executive CompensationItem 12. Security Ownership Of Certain Beneficial Owners and Management and Related Shareholder MattersItem 13. Certain Relationships and Related Transactions, and Director IndependenceItem 14. Principal Accountant Fees and ServicesPart IVItem 15. Exhibits and Financial Statement SchedulesNote 1 Description Of The Business and Basis Of PresentationNote 2 Summary Of Significant Accounting PoliciesNote 3 Fair Value Of Financial InstrumentsNote 4 Business CombinationNote 5 Restricted CashNote 6 DebtNote 7 Derivative InstrumentsNote 8 Net Investment in Finance LeasesNote 9 Share-based Compensation and Other Equity MattersNote 10 Non-controlling InterestsNote 11 Segment and Geographic InformationNote 12 Income TaxesNote 13 Other Postemployment BenefitsNote 14 Rental Income Under Operating LeasesNote 15 Commitments and ContingenciesNote 16 Selected Quarterly Financial Data (unaudited)Note 17 Related Party TransactionsNote 18 Subsequent Events