TRACTOR SUPPLY CO /DE/
10-Ks and 10-Qs
|
|
|
|
|
|
|
|
|
|
|
|
|
|
|
|
|
|
|
|
|
|
|
|
|
|
|
|
|
|
|
|
|
|
|
|
|
|
|
|
|
|
|
|
|
|
|
|
|
|
|
|
|
|
|
|
UNITED STATES
SECURITIES AND EXCHANGE COMMISSION
WASHINGTON, D.C. 20549
FORM 10-K
(Mark One)
x
ANNUAL REPORT PURSUANT TO SECTION 13 OR 15(d) OF THE SECURITIES EXCHANGE ACT OF 1934
For the fiscal year ended December 31, 2011
or
o
TRANSITION REPORT PURSUANT TO SECTION 13 OR 15(d) OF THE SECURITIES EXCHANGE ACT OF 1934
For the transition period from __________ to __________.
Commission file number
000-23314

TRACTOR SUPPLY COMPANY
(Exact name of registrant as specified in its charter)
|
Delaware
|
13-3139732
|
|
|
(State or Other Jurisdiction of
|
|
(I.R.S. Employer Identification No.)
|
|
Incorporation or Organization)
|
||
|
200 Powell Place, Brentwood, Tennessee
|
37027
|
|
|
(Address of Principal Executive Offices)
|
(Zip Code)
|
|
|
Registrant's Telephone Number, Including Area Code:
|
(615) 440-4000
|
|
Securities Registered Pursuant to Section 12(b) of the Act:
|
|
|
Title of each class
|
Name of each exchange on which registered
|
|
Common Stock, $.008 par value
|
NASDAQ Global Select Market
|
|
Securities Registered Pursuant to Section 12(g) of the Act: None
|
|
Indicate by check mark if the registrant is a well-known seasoned issuer, as defined in Rule 405 of the Securities Act.
YES
þ
NO
o
Indicate by check mark if the registrant is not required to file reports pursuant to Section 13 or Section 15(d) of the Act.
YES
o
NO
þ
Indicate by check mark whether the registrant (1) has filed all reports required to be filed by Section 13 or 15(d) of the Securities Exchange Act of 1934 during the preceding 12 months (or for such shorter period that the registrant was required to file such reports), and (2) has been subject to such filing requirements for the past 90 days.
YES
þ
NO
o
Indicate by check mark whether the registrant has submitted electronically and posted on its corporate Web site, if any, every Interactive Data File required to be submitted and posted pursuant to Rule 405 of Regulation S-T (§232.405 of this chapter) during the preceding 12 months (or for such shorter period that the registrant was required to submit and post such files).
YES
þ
NO
o
Indicate by check mark if disclosure of delinquent filers pursuant to Item 405 of Regulation S-K (§229.405 of this chapter) is not contained herein, and will not be contained, to the best of registrant’s knowledge, in definitive proxy or information statements incorporated by reference in Part III of this Form 10-K or any amendment to this Form 10-K.
o
Indicate by check mark whether the registrant is a large accelerated filer, an accelerated filer, a non-accelerated filer, or a smaller reporting company. See the definitions of “large accelerated file,” “accelerated filer” and “smaller reporting company” in Rule 12b-2 of the Exchange Act:
|
Large accelerated filer
|
þ
|
Accelerated filer
|
o
|
|
|
Non-accelerated filer
|
o
(Do not check if a smaller reporting company)
|
Smaller reporting company
|
o
|
Indicate by check mark whether the registrant is a shell company (as defined in Rule 12b-2 of the Act.)
YES
o
NO
þ
The aggregate market value of the Common Stock held by non-affiliates of the registrant, based on the closing price of the Common Stock on The NASDAQ Global Select Market on June 24, 2011, the last business day of the registrant’s most recently completed second fiscal quarter, was $4.3 billion. For purposes of this response, the registrant has assumed that its directors, executive officers, and beneficial owners of 5% or more of its Common Stock are the affiliates of the registrant.
Indicate the number of shares outstanding of each of the registrant’s classes of common stock as of the latest practicable date.
|
Class
|
Outstanding at January 28, 2012
|
|
|
Common Stock, $.008 par value
|
71,313,650 |
Documents Incorporated by Reference:
Portions of the Registrant’s definitive Proxy Statement for its 2012 Annual Meeting of Stockholders are incorporated by reference into Part III hereof.
TRACTOR SUPPLY COMPANY
INDEX
| Item no. | Form 10-K Report Page | ||
| Forward-Looking Statements | ii | ||
| PART I | 1 | ||
| 1. | Business | 1 | |
| 1A. | Risk Factors | 7 | |
| 1B. | Unresolved Staff Comments | 11 | |
| 2. | Properties | 11 | |
| 3. | Legal Proceedings | 11 | |
| 4. | Mine Safety Disclosures | 12 | |
| PART II | 13 | ||
| 5. | Market for Registrant’s Common Equity, Related Stockholder Matters and Issuer Purchases of Equity Securities | 13 | |
| 6. | Selected Financial Data | 16 | |
| 7. | Management’s Discussion and Analysis of Financial Condition and Results of Operations | 17 | |
| 7A. | Quantitative and Qualitative Disclosures About Market Risk | 31 | |
| 8. | Financial Statements and Supplementary Data | 32 | |
| 9. | Changes in and Disagreements with Accountants on Accounting and Financial Disclosure | 53 | |
| 9A. | Controls and Procedures | 53 | |
| 9B. | Other Information | 53 | |
| PART III | 54 | ||
| 10. | Directors, Executive Officers and Corporate Governance | 54 | |
| 11. | Executive Compensation | 54 | |
| 12. | Security Ownership of Certain Beneficial Owners and Management and Related Stockholder Matters | 54 | |
| 13. | Certain Relationships and Related Transactions, and Director Independence | 54 | |
| 14. | Principal Accountant Fees and Services | 55 | |
| PART IV | 55 | ||
| 15 | Exhibits, Financial Statement Schedules | 55 | |
i
FORWARD-LOOKING STATEMENTS OR INFORMATION
This Form 10-K and statements included or incorporated by reference in this Form 10-K include certain historical and forward-looking information. The forward-looking statements included are made pursuant to the safe harbor provisions of the Private Securities Litigation Reform Act of 1995 (the “Act”). All statements, other than statements of historical facts, which address activities, events or developments that we expect or anticipate will or may occur in the future, including such things as future capital expenditures (including their amount and nature), business strategy, expansion and growth of the business operations and other such matters are forward-looking
statements. To take advantage of the safe harbor provided by the Act, we are identifying certain factors that could cause actual results to differ materially from those expressed in any forward-looking statements, whether oral or written. These factors include, without limitation, general economic conditions affecting consumer spending, the timing and acceptance of new products in the stores, the mix of goods sold, purchase price volatility (including inflationary and deflationary pressures), the ability to increase sales at existing stores, the ability to manage growth and identify suitable locations, the ability to manage expenses, the availability of favorable credit sources, capital market conditions in general, failure to open new stores in the manner and number currently contemplated, the impact of new stores on our business, competition, weather
conditions, the seasonal nature of our business, effective merchandising initiatives and marketing emphasis, the ability to retain vendors, reliance on foreign suppliers, the ability to attract, train and retain qualified employees, product liability and other claims, changes in federal, state or local regulations, potential judgments, fines, legal fees and other costs, breach of privacy, ongoing and potential future legal or regulatory proceedings, management of our information systems, failure to secure or develop and implement new technologies, the failure of customer-facing technology systems, business disruption including from the implementation of supply chain technologies, effective tax rate changes and results of examination by taxing authorities, the ability to maintain an effective system of internal control over financial reporting, changes in accounting standards,
assumptions and estimates, and those described in Item 1A. “Risk Factors.” Forward-looking statements are based on currently available information and are based on our current expectations and projections about future events. We undertake no obligation to release publicly any revisions to these forward-looking statements to reflect events or circumstances after the date hereof or to reflect the occurrence of unanticipated events.
ii
Overview
Tractor Supply Company is the largest operator of retail farm and ranch stores in the United States and is focused on supplying the lifestyle needs of recreational farmers and ranchers and those who enjoy the rural lifestyle, as well as tradesmen and small businesses. We operate retail stores under the names
Tractor Supply Company
and
Del’s Farm Supply
and operate a website under the name
TractorSupply.com
. Our stores are located in towns outlying major metropolitan markets and in rural
communities, and they offer the following comprehensive selection of merchandise:
|
·
|
Equine, pet and small animal products, including items necessary for their health, care, growth and containment;
|
|
·
|
Hardware, truck, towing and tool products;
|
|
·
|
Seasonal products, including lawn and garden items, power equipment, gifts and toys;
|
|
·
|
Maintenance products for agricultural and rural use; and
|
|
·
|
Work/recreational clothing and footwear.
|
Our Tractor Supply stores typically range in size from 15,000 to 19,000 square feet of inside selling space along with additional outside selling space. We use a standard 15,250 square foot prototype for most new built-to-suit locations. In some smaller markets we utilize a 12,500 square foot format with slightly less inventory and lower occupancy cost than our prototype but a similar product assortment. For new stores located in existing buildings, one of several layout formats is utilized.
Tractor Supply Company has one reportable industry segment – farm and ranch retail sales, both at our retail locations and online.
At December 31, 2011, we operated 1,085 retail farm and ranch stores in 44 states.
Seasonality
Our business is highly seasonal. Historically, our sales and profits have been the highest in the second and fourth fiscal quarters due to the sale of seasonal products. We experience our highest inventory and accounts payable balances during the first fiscal quarter for purchases of seasonal products in anticipation of the spring selling season and again during the third fiscal quarter in anticipation of the cold-weather selling season.
Business Strategy
We believe our sales and earnings growth is a result of executing our business strategy, which includes the following key components:
Market Niche
We have identified a specialized market niche: supplying the lifestyle needs of recreational farmers and ranchers and those who enjoy the rural lifestyle (which we refer to as the “Out Here” lifestyle), as well as tradesmen and small businesses. By focusing our product mix on these core customers, we believe we are differentiated from general merchandise, home center and other specialty retailers.
Customer Service
We are committed to providing our customers reliable product availability and a high level of in-store service through our motivated, well-trained store team members. We believe the ability of our store team members to provide friendly, responsive and seasoned advice helps our customers find the right products to satisfy their everyday needs in addition to the specialty items needed to complete their rural lifestyle projects. We believe this commitment to customer service promotes strong customer loyalty and repeat shopping. As such, we provide our store team members with training, product knowledge and decision-making authority to enable them to meet our customers’ needs.
1
We endeavor to staff our stores with courteous, highly motivated team members and devote considerable resources to training store team members, often in cooperation with our vendors. Our training programs include (i) a management training program which covers all aspects of our store operations, (ii) regular training on customer service and selling skills, (iii) product knowledge modules produced in conjunction with key vendors, (iv) frequent management skills training classes, (v) semi-annual store manager meetings with vendor product presentations, (vi) vendor sponsored in-store training programs, and (vii) ongoing product information updates from our management headquarters, the Store Support
Center. We hire and train store team members with farming and ranching backgrounds, with particular emphasis on general maintenance, equine and welding.
We use a third party provider to measure our level of customer service. This process allows customers to provide feedback on their shopping experience. Based on the third party provider’s data, we consider our customer satisfaction scores to be among the best in class. We critically evaluate the feedback we receive from our customers and initiate improvements at the individual store level based on that feedback.
Store Environment
Our stores are designed and managed to make shopping an enjoyable experience and to maximize sales and operating efficiencies. Stores utilize several layouts designed to provide an open environment, optimal product placement and visual display locations. In addition, these layouts allow for departmental space to be easily reallocated and visual displays to be changed for seasonal products and promotions. Display and product placement information is sent to stores weekly to ensure quality and uniformity among the stores. Informative signs are located throughout each store to assist customers with purchasing decisions and merchandise location. These signs provide customers with a
comparison of product qualities, clear pricing and useful information regarding product benefits and suggestions for appropriate accessories. The general uniformity of our store layouts and visual displays afford our customers a feeling of familiarity and enhances the shopping experience. To further enhance the shopping experience, all of our store team members wear highly visible red vests, aprons or smocks with nametags, and our customer service and checkout counters are conveniently located.
Merchandising
We offer a differentiated assortment of products for those seeking to enjoy the “
Out Here”
lifestyle. Our broad product assortment is tailored to meet the regional and geographic needs of our markets, as well as the physical store size. Our full line of product offerings is supported by a strong in-stock inventory position with an average of 16,000 to 19,500 unique products per store. No one product accounted for more than 10% of our sales during 2011. Additionally, our store team members utilize our special order process to assist customers with related products we do not carry in our
stores.
Our stores carry a wide selection of high quality, nationally recognized, name brand merchandise. We also market a growing list of products under our “private-label programs,” i.e. products manufactured for us by a number of vendors. The trademarks in the private label brand names are owned by us. Our private label brands represented approximately 23% of our total sales in fiscal 2011 and approximately 21% of our total sales in fiscal 2010 and 2009. Our private label brand names include:
·
Producers Pride
and
Dumor
(livestock feed)
·
Retriever, Paws ‘n Claws,
and
4health
(pet foods)
·
Countyline
(livestock, farm and ranch equipment)
·
C.E. Schmidt
(apparel and footwear)
·
Huskee
(outdoor power equipment)
·
Royal Wing
(bird feeding supplies)
·
JobSmart
(tools and tool chests)
·
Traveller
(truck/automotive products)
·
Groundwork
(lawn and garden supplies)
·
Red Shed
(gifts and collectibles)
·
Bit & Bridle
and
Blue Mountain
(apparel)
·
Redstone
(heating products)
We believe that our ability to offer high quality private label products at compelling prices provides superior value for our customers, a strategic advantage for us, and positions us as a destination store.
2
The following chart indicates the percentage of sales represented by each of our major product categories during fiscal 2011, 2010 and 2009:
|
Percent of Sales
|
||||||||
|
Product Category:
|
2011
|
2010
|
2009
|
|||||
|
Livestock and Pet
|
40 | % | 39 | % | 39 | % | ||
|
Hardware, Tools and Truck
|
23 | 23 | 23 | |||||
|
Seasonal, Gift and Toy Products
|
21 | 22 | 22 | |||||
|
Clothing and Footwear
|
10 | 10 | 10 | |||||
|
Agriculture
|
6 | 6 | 6 | |||||
|
Total
|
100 | % | 100 | % | 100 | % | ||
Our products are sourced through both domestic and international vendors. Our business is not dependent upon any one vendor or particular group of vendors. We purchase our products from a core group of approximately 700 vendors, with no one vendor representing more than 10% of our purchases during fiscal 2011. Approximately 275 vendors accounted for approximately 90% of our purchases during fiscal 2011. We have not experienced any significant difficulty in obtaining satisfactory alternative sources of supply for our products, and we believe that adequate sources of supply exist at substantially similar costs for nearly all of our products. We have no
material long-term contractual commitments with any of our vendors.
We maintain a dedicated inventory management team to focus exclusively on all forecasting and replenishment functions. This centralized direction permits our buying teams to focus more strategic attention toward vendor line reviews, assortment planning and testing of new products and programs. Through the combined efforts of these teams, we continue to improve our overall inventory productivity and in-stock position.
Distribution
We currently operate a distribution network for supplying our stores with merchandise, and in fiscal 2011 our stores received approximately 70% of our merchandise through this network, while approximately 30% of our merchandise is shipped direct to the store from our vendors. Our seven distribution centers are located in Kentucky, Indiana, Georgia, Maryland, Texas, Nebraska, and Washington, representing total distribution capacity of 3.7 million square feet. In 2011 we completed construction of the 834,000 square foot facility in Kentucky, which became operational during the fourth quarter of fiscal 2011. We continue to improve the technology in our distribution centers, and currently two
of our seven facilities are utilizing a new warehouse management system that provides for better movement of inventory through automation. We will continue to refine this new system, and expect that it will be implemented across the entire distribution network over the next few years.
We manage our inbound and outbound transportation activity in-house through the use of a web-based transportation management system. We utilize several common carriers for store deliveries. We manage our transportation costs through carrier negotiations, the monitoring of transportation routes, and the scheduling of deliveries.
Marketing
We utilize an "everyday value prices" strategy to consistently offer our products at competitive prices complemented by strategically planned promotions throughout the year. We regularly monitor prices at competing stores and adjust our prices as appropriate.
To generate store traffic and position ourselves as a destination store, we promote broad selections of merchandise with newspaper circulars, customer targeted direct mail and email and internet offerings. Vendors frequently support these specific programs by offering temporary cost reductions, honoring coupons and funding gift card rebate programs. Our vendors also provide assistance with product presentation and fixture design, brochures, support for in-store events, and point-of-purchase materials for customer education and product knowledge for our team members.
3
Multi-Channel
We do business with our customers across multiple touch points including our stores, website, email and direct mail. Our goal is to be available when and how our customers choose to engage with our brand. Connecting with consumers online provides the opportunity to allow customers to shop at a time and place that fits their schedule while delivering enhanced product information, research and decision tools that support product selection and informational needs in specific subject areas. Additionally, we give our customers the ability to purchase products and have
them shipped to one of our retail stores, their homes or offices. We believe this capability further enhances customer service and extends our market to areas where our retail stores are not currently located.
Competition
We operate in a competitive retail industry. The principal competitive factors include location of stores, price and quality of merchandise, in-stock consistency, merchandise assortment and presentation, and customer service. We compete with general merchandise retailers, home center retailers, specialty and discount retailers, independently owned retail farm and ranch stores, numerous privately-held regional farm store chains and farm cooperatives, as well as internet-based retailers. However, we believe we have successfully differentiated ourselves from these entities by focusing on our specialized market niche for customers living the rural lifestyle.
Management and Team Members
As of December 31, 2011, we employed approximately 8,700 full-time and approximately 7,700 part-time team members. We also employ additional part-time team members during peak periods. We are not party to any collective bargaining agreements.
Our store operations are organized into nine regions. Each region is led by a regional manager and the region is further organized into districts, which are led by a district manager or area manager. Our regional managers, district managers, area managers, store managers and other distribution and support personnel have contributed significantly to our performance. We have internal advisory boards, one comprised of store managers and the other comprised of district managers. These groups bring a grassroots perspective to operational initiatives and generate chain-wide endorsement of proposed “best-practice” solutions.
All of our team members participate in one of various incentive programs, which provide the opportunity to receive additional compensation based upon team and/or Company performance. We also provide our team members the opportunity to participate in an employee stock purchase plan and a 401(k) retirement savings plan (we contribute to the 401(k) savings plan solely through a cash match). Additionally, we share in the cost of health insurance provided to our team members, and team members receive a discount on merchandise purchased at our stores.
We encourage a “promote from within” environment when internal resources permit. We also provide internal leadership development programs designed to mentor our high potential team members for continued progress and believe we have satisfactory relationships with our team members. Our district managers, area managers, and store managers have an average length of service of approximately six years. Management believes internal promotions, coupled with the hiring of individuals with previous retail experience, will provide the management structure necessary to support our planned store growth.
Continuous Improvement
We are committed to a continuous improvement program called Tractor Value System (“TVS”), which is our catalyst to drive continuous improvement throughout our organization. TVS is a business management system that emphasizes, through team member engagement, a focus on continuous improvement. Utilizing TVS, we improve processes by identifying and accepting the need for change of current practices to reduce costs, shorten lead times, and drive innovation. We have implemented numerous continuous improvement projects (comprised of team members from all areas of our business) to evaluate key operations and implement process changes that will improve efficiency, reduce costs and
strengthen processes. Team members are empowered and expected to challenge long-held paradigms and improve processes. Our management encourages the participation of all team members in decision-making, regularly solicits input and suggestions from our team members and incorporates suggestions into our improvement activities.
4
Management Information and Control Systems
We have invested considerable resources in our management information and control systems to ensure superior customer service, manage the purchase and distribution of our merchandise and improve our operating efficiencies. Our management information and control systems include a point-of-sale system, a supply chain management and replenishment system, a warehouse management system, a radio frequency and voice-activated picking system in the distribution centers, a price optimization system, a vendor purchase order control system and a merchandise presentation system. These systems are integrated through an enterprise resource planning (“ERP”) system. This ERP system tracks merchandise from
initial order through ultimate sale and interfaces with our financial systems.
We continue to evaluate and improve the functionality of our systems to maximize their effectiveness. Such efforts include ongoing hardware and software evaluations and upgrades to support optimal software configurations and application performance. We plan to upgrade our information technology and implement other efficiency-driving system enhancements (including the continued rollout of a new warehouse management system to distribution centers, point-of-sale system upgrades, enhanced security tools, and store and support center hardware refreshes) in 2012. Additionally, we will be upgrading our e-commerce website which will include the integration of order management, drop shipment, fulfillment
and call center activities. We will continue to strengthen the security of our information systems and support store and distribution center expansion. These efforts are directed toward constantly improving business processes and achieving the most efficient and effective use of systems to manage our operations while ensuring a secure and reliable environment.
Growth Strategy
Our current and long-term growth strategy is to: (1) expand geographic market presence through opening new retail stores, (2) enhance financial performance through same-store sales growth achieved through targeted merchandising programs with an “everyday value prices” philosophy and supported by strong customer service, (3) enhance product margin through strategic product sourcing and regional allocation, a strong private label offering, and optimization of product pricing, transportation and distribution costs, (4) leverage operating costs, especially advertising, distribution and corporate overhead by focusing on opportunities for continuous improvement and elimination of waste in all of
our processes, (5) expand market opportunities via internet sales accomplished by improving our product content and enhancing our customers’ online experience and (6) expand through selective acquisition, as such opportunities arise, to enhance penetration into new and existing markets as a complementary strategy to organic growth.
Over the past five years we have experienced considerable sales growth, with a compounded annual growth rate of approximately 12.3%. We plan to open 90 to 95 new stores in 2012, a selling square footage increase of approximately 8.0%. We opened 85 new stores in 2011 and 74 new stores in 2010, a square footage increase of approximately 7.8% and 7.4%, respectively.
We operated 1,085 retail farm and ranch stores in 44 states as of December 31, 2011. Given the size of the communities that we target, we believe that there is ample opportunity for new store growth in many existing and new markets. We have developed a proven method for selecting store sites and have identified over 1,000 additional markets for new Tractor Supply stores, inclusive of recently identified small market locations. Approximately 55% of our stores are in freestanding buildings and 45% are located in strip shopping centers. We lease approximately 93% of our store sites and own the remaining 7% of store sites.
5
Stewardship and Compliance with Environmental Matters
Our operations are subject to numerous federal, state and local laws and regulations that have been enacted or adopted regulating the discharge of materials into the environment, or otherwise relating to the protection of the environment. We are committed to conducting business in an environmentally responsible manner. This commitment impacts all areas of our business, including store construction and maintenance, energy usage, supply chain, product selection and delivery of product knowledge to our customers.
Executive Officers of the Registrant
Pursuant to General Instruction G(3) of Form 10-K, the following list is included in Part I of this Report in lieu of being included in the Proxy Statement for the Annual Meeting of Stockholders to be held on May 3, 2012.
The following is a list of the names and ages of all executive officers of the registrant, indicating all positions and offices with the registrant held by each such person and each person’s principal occupations and employment during at least the past five years:
|
Name
|
Position
|
Age
|
|
James F. Wright
|
Chairman of the Board and Chief Executive Officer
|
62
|
|
Gregory A. Sandfort
|
President and Chief Merchandising Officer
|
56
|
|
Anthony F. Crudele
|
Executive Vice President – Chief Financial Officer and Treasurer
|
55
|
|
Kimberly D. Vella
|
Senior Vice President and Chief People Officer
|
45
|
|
Benjamin F. Parrish, Jr.
|
Senior Vice President – General Counsel and Corporate Secretary
|
55
|
__________________
James F. Wright has served as Chairman of the Board and Chief Executive Officer of the Company since February 2009, and prior to that time served as Chairman of the Board, President and Chief Executive Officer from November 2007 to February 2009, President and Chief Executive Officer of the Company from October 2004 to November 2007, and as President and Chief Operating Officer of the Company from October 2000 to October 2004. Mr. Wright has served as a director of the Company since 2002.
Gregory A. Sandfort has served as President and Chief Merchandising Officer of the Company since February 2009, and prior to that time served as Executive Vice President-Chief Merchandising Officer of the Company since November 2007. Mr. Sandfort previously served as President and Chief Operating Officer at Michaels Stores, Inc. from March 2006 to August 2007 and as Executive Vice President – General Merchandise Manager at Michaels Stores, Inc. from January 2004 to February 2006.
Anthony F. Crudele has served as Executive Vice President-Chief Financial Officer and Treasurer since January 2007, after having served as Senior Vice President-Chief Financial Officer and Treasurer of the Company since November 2005. Mr. Crudele previously served as Chief Financial Officer at Gibson Guitar from August 2003 to September 2005, as Chief Financial Officer of Xcelerate Corp. from January 2000 to January 2003, and at The Sports Authority from 1989 through 1999 (serving as Chief Financial Officer from 1996 through 1999).
Kimberly D. Vella has served as Senior Vice President and Chief People Officer since July 2010, and prior to that time served as Senior Vice President-Human Resources of the Company since January 2007, after having served as Vice President-Human Resources of the Company since October 2001.
Benjamin F. Parrish, Jr. has served as Senior Vice President-General Counsel and Corporate Secretary of the Company since October 2010. Mr. Parrish previously served as Executive Vice President and General Counsel of MV Transportation, Inc., a transportation services company, from September 2008 until he joined the Company. He served as Senior Vice President and General Counsel of Central Parking Corporation, a parking services company, from 1998 to 2008.
Additional Information
We file reports with the Securities and Exchange Commission (“SEC”), including Annual Reports on Form 10-K, quarterly reports on Form 10-Q, current reports on Form 8-K and other reports as required. The public may read and copy any materials the Company files with the SEC at the SEC’s Public Reference Room at 100 F Street, NE, Washington, DC 20549. The public may obtain information on the operation of the Public Reference Room by calling the SEC at 1-800-SEC-0330. We are an electronic filer and the SEC maintains an Internet site at
sec.gov
that contains the reports, proxy and
information statements, and other information filed electronically.
6
We make available free of charge through our Internet website,
TractorSupply.com
, our Annual Report on Form 10-K, quarterly reports on Form 10-Q, current reports on Form 8-K, and all amendments to those reports as soon as reasonably practicable after such material is electronically filed with or furnished to the SEC. The information provided on our website is not part of this report, and is therefore not incorporated by reference unless such information is otherwise specifically referenced elsewhere in this report.
Our code of ethics, which is applicable to all of our team members, including our Chief Executive Officer, Chief Financial Officer and Controller, along with our Corporate Governance Guidelines and the charters of our Audit, Compensation, Nominating and Corporate Governance Committees of our Board of Directors, is posted on our website.
Our business faces many risks. Those risks of which we are currently aware and deem to be material are described below. If any of the events or circumstances described in the following risk factors occur, our business, financial condition or results of operations may significantly suffer, and the trading price of our common stock could decline. These risk factors should be read in conjunction with the other information in this Form 10-K.
General economic conditions may adversely affect our financial performance.
Our results of operations may be sensitive to changes in overall economic conditions that impact consumer spending, including discretionary spending. Economic conditions affecting disposable consumer income such as employment levels, business conditions, interest rates, tax rates, fuel and energy costs, higher labor and healthcare costs, the impact of natural disasters or acts of terrorism, and other matters could reduce consumer spending or cause consumers to shift their spending to lower-priced competitors. A general reduction in the level of discretionary spending or shifts in consumer discretionary spending to our competitors could adversely affect our growth and profitability. Additionally, changes
in the mix of products sold to a mix with a lower overall gross margin or other increased cost of sales, along with slower inventory turnover and greater markdowns on inventory, could adversely affect our operations and operating results.
Purchase price volatility, including inflationary and deflationary pressures, may adversely affect our financial performance.
Although we cannot determine the full effect of inflation and deflation on our operations, we believe our sales and results of operations are affected by both. We are subject to market risk with respect to the pricing of certain products and services, which include, among other items, steel, grain, petroleum, corn, cotton and other commodities as well as transportation services. Therefore, we may experience both inflationary and deflationary pressure on product cost, which may impact consumer demand and, as a result, sales and gross margin. Our strategy is to reduce or mitigate the effects of purchase price volatility principally by taking advantage of vendor incentive programs,
economies of scale from increased volume of purchases, adjusting retail prices and selectively buying from the most competitive vendors without sacrificing quality. Due to the competitive environment, such conditions could adversely impact our financial performance.
We may be unable to increase sales at our existing stores.
We experience fluctuations in our same-store sales, which are defined as stores which have completed twelve months of sales. Our success depends, in part, upon our ability to improve sales at our existing stores. Various factors affect same-store sales, including the general retail sales environment, our ability to efficiently source and distribute products, changes in our merchandise mix, competition, current economic conditions, the timing of release of new merchandise and promotional events, the success of marketing programs and weather conditions. These factors may cause our same-store sales results to differ materially from prior periods and from expectations. Past
same-store sales are not necessarily an indication of future results, and there can be no assurance that our same-store sales will not decrease in the future.
Our failure to effectively manage growth could impair our business.
Even if we are able to implement, to a significant degree, our key business strategy of expanding our store base, we may experience managerial or operational problems, which may prevent any expected increase in profitability or negatively impact our cash flow. To manage our planned expansion, we must ensure the continuing adequacy of our existing systems, controls and procedures, including product distribution facilities, store management, financial controls and information systems. There can be no assurance that we will be able to achieve our planned expansion, that the new stores will be effectively integrated into our existing operations or that such stores will be profitable.
7
Capital requirements for growth may not be available.
The construction and opening or acquisition of new stores and distribution facilities, along with the remodeling and renovation of existing stores, require significant amounts of capital. In the past, our growth has been funded primarily through bank borrowings and internally generated cash flow. Disruptions in the capital and credit markets could adversely affect the ability of the banks to meet their commitments. Our access to funds under the credit facility is dependent on the ability of the banks that are parties to the facility to meet their funding commitments. Those banks may not be able to meet their funding commitments to us if they experience shortages of capital and
liquidity or if they experience excessive volumes of borrowing requests within a short period of time. In addition, tighter lending practices have made it more challenging for our real estate developers to obtain financing under reasonable loan terms and conditions. Unfavorable lending trends could impact the timing of our store openings and materially adversely affect our ability to open new built-to-suit stores in desirable locations.
Longer term disruptions in the capital and credit markets as a result of uncertainty, changing or increased regulation, reduced alternatives, or failures of significant financial institutions could adversely affect our access to liquidity needed for our business. Any disruption could require us to take measures to conserve cash until the markets stabilize or until alternative credit arrangements or other funding for our business needs can be arranged. Such measures could include deferring capital expenditures and reducing or eliminating future share repurchases, cash dividends or other discretionary uses of cash.
Failure to open new stores in the manner and number currently contemplated could adversely affect our financial performance.
An integral part of our business strategy includes the expansion of our base of stores by opening new stores. This expansion strategy is dependent on our ability to find suitable locations, and we face competition from many retailers for such sites. If we are unable to implement this strategy, our ability to increase our sales, profitability, and cash flow could be impaired significantly. To the extent that we are unable to open new stores in the manner we anticipate (due to, among other reasons, site approval or unforeseen delays in construction), our sales growth may be impeded.
There can be no assurance that our new store openings will be successful or result in greater sales and profitability for the Company. New stores build their sales volumes and refine their merchandise selection over time and, as a result, generally have lower gross margins and higher operating expenses as a percentage of sales than our more mature stores. As we continue to open new stores, there may be a negative impact on our results from a lower contribution margin of these new stores until their sales levels ramp to chain average, if at all, as well as from the impact of related pre-opening costs.
Competition in our industry may hinder our ability to execute our business strategy and adversely affect our operations.
We operate in a very competitive market. The principal competitive factors include location of stores, price and quality of merchandise, in-stock consistency, merchandise assortment and presentation, and customer service. We believe we have successfully differentiated ourselves from general merchandise retailers, home center retailers and other specialty and discount retailers by focusing on our specialized market niche. However, we do face competition from these entities, as well as competition from independently-owned retail farm and ranch stores, privately-held regional farm store chains and farm cooperatives.
Weather conditions may have a significant impact on our financial results.
Historically, weather conditions have had a significant impact on our operating results. Weather conditions affect the demand for, and in some cases the supply of, products, which in turn has an impact on prices. In past years, we have experienced extreme weather conditions, including snow and ice storms, flood and wind damage, hurricanes, tornadoes and droughts in some states. Weather conditions also directly affect the demand for seasonal products, particularly during the winter heating season. Accordingly, the weather can have a material effect on our financial condition and results of operations.
Our merchandising initiatives and marketing emphasis may not provide expected results.
We believe our past performance has been based on, and future success will depend upon, in part, the ability to develop and execute merchandising initiatives with effective marketing. There is no assurance that we will be successful, or that new initiatives will be executed in a timely manner to satisfy our customers’ needs or expectations. Failure to execute and promote such initiatives in a timely manner could harm our ability to grow the business and could have a material adverse effect on our results of operations and financial condition. Additionally, our success depends on our ability to anticipate and respond in a timely manner to changing customer demand and
preferences for merchandise. If we misjudge the market, we may significantly overstock unpopular products and be forced to take significant inventory markdowns. Shortages of key items could also have a materially adverse impact on operating results.
We face risks associated with vendors from whom our products are sourced.
The products we sell are sourced from a variety of domestic and international vendors. As a general rule, we have agreements with our vendors in which the vendors agree to comply with applicable laws, including labor and environmental laws, and to indemnify us against certain liabilities and costs. Our ability to recover liabilities and costs under these vendor agreements is dependent upon the financial condition and integrity of the vendors.
8
We rely on foreign manufacturers for various products that we sell. In addition, many of our domestic suppliers purchase a portion of their products from foreign sources. We rely on long-term relationships with our suppliers but have no long-term contracts with such suppliers. Our future success will depend in large measure upon our ability to maintain our existing supplier relationships or to develop new ones. This reliance increases the risk of inadequate and untimely supplies of various products due to local political, economic, social, or environmental conditions, transportation delays, restrictive actions by foreign governments, or changes in United States laws and
regulations affecting imports or domestic distribution. Our vendors may be forced to reduce their production, shut down their operations or file for bankruptcy protection, which could make it difficult for us to serve the market’s needs and could have a material adverse effect on our business.
As an importer, our business is subject to the risks generally associated with doing business abroad, such as foreign governmental regulations, economic disruptions, delays in shipments, transportation capacity and costs, currency exchange rates and changes in political or economic conditions in countries from which we purchase products. If any such factors were to render the conduct of business in particular countries undesirable or impractical or if additional United States quotas, duties, taxes or other charges or restrictions were imposed upon the importation of our products in the future, our financial condition and results of operations could be materially adversely affected.
We are subject to the Foreign Corrupt Practices Act (the “FCPA”), which generally prohibits U.S. companies and their intermediaries from making improper payments to foreign officials for the purpose of obtaining or retaining business, and the anti-bribery laws of other jurisdictions. Failure to comply with the FCPA could subject us to, among other things, penalties and legal expenses that could harm our reputation and have a material adverse effect on our business, financial condition and results of operations.
Our failure to attract and retain qualified team members could adversely affect our financial performance.
Our ability to continue expanding operations depends on our ability to attract and retain a large and growing number of qualified team members. Our ability to meet labor needs while controlling wage and related labor costs is subject to numerous external factors, including the availability of a sufficient number of qualified persons in the work force, unemployment levels, prevailing wage rates, changing demographics, health and other insurance costs and changes in employment legislation. If we are unable to locate, attract or retain qualified personnel, or if costs of labor or related costs increase significantly, our financial performance could be adversely affected.
We may be subject to product liability and other claims in the ordinary course of business.
Our business involves a risk of product liability and other claims in the ordinary course of business. We maintain general liability and workers compensation insurance with self-insured retention for each policy type and a deductible for each occurrence. We also maintain umbrella limits above the primary general liability and product liability coverage. In many cases, we have indemnification rights against the manufacturers of the products and their products liability insurance. Our ability to recover under such insurance or indemnification arrangements is subject to the financial viability of the insurers and manufacturers and the specific allegations of a claim. No assurance can be
given that our insurance coverage or the manufacturers’ indemnity will be available or sufficient in any claims brought against us.
Our costs of doing business could increase as a result of changes in, increased enforcement of, or adoption of new federal, state or local laws and regulations.
We are subject to numerous federal, state and local laws and governmental regulations relating to environmental protection, personal injury, intellectual property, consumer product safety, building, land use and zoning requirements, workplace regulations, wage and hour, privacy and information security and employment law matters. If we fail to comply with existing or future laws or regulations, or if these laws or regulations are violated by importers, manufacturers or distributers, we may be subject to governmental or judicial fines or sanctions, while incurring substantial legal fees and costs. In addition, our capital expenditures could increase due to remediation measures that may be required if we are found
to be noncompliant with any existing or future laws or regulations.
A privacy breach could result in negative publicity and adversely affect the Company’s business.
The protection of customer, employee and Company data is critical to the Company. The regulatory environment surrounding information security and privacy is increasingly demanding, with the frequent imposition of new and constantly changing requirements. In connection with credit card sales, we transmit confidential credit card information. Third parties may have the technology or know-how to breach the security of this customer information, and our security measures and those of our technology vendors may not effectively preclude others from obtaining improper access to this information. Any security breach could expose us to risks of data loss, litigation and liability
and could seriously disrupt our operations and any resulting negative publicity could significantly harm our reputation.
9
In addition, states and the federal government are increasingly enacting laws and regulations to protect consumers against identity theft. We collect personal information from consumers in the course of doing business. These laws will likely increase the costs of doing business and, if we fail to comply with these laws and regulations or to implement appropriate safeguards or to detect and provide prompt notice of unauthorized access as required by some of these new laws, we could be subject to potential claims for damages and other remedies, which could harm our business.
If we experience difficulties with our management information systems, our financial performance may be adversely affected.
We depend on management information systems for many aspects of our business. We could be materially adversely affected if our management information systems are disrupted or if we are unable to improve, upgrade, maintain and expand systems, particularly in light of the contemplated continued store growth.
If we are unable to secure or develop and implement sufficiently robust new technologies to deliver business process solutions within the appropriate time frame, cost and functionality, our strategic business initiatives that are dependent upon these technologies may not be successful.
The success of our strategic business initiatives designed to increase our sales and improve margin is dependent in varying degrees on the timely delivery and the functionality of information technology systems to support them. Extended delays or cost overruns in securing, developing and otherwise implementing technology solutions to support the strategic business initiatives would delay and possibly even prevent us from realizing the projected benefits of those initiatives.
The implementation of our supply chain and technology initiatives could disrupt our operations in the near term, and these initiatives might not provide the anticipated benefits or might fail.
We have made, and we plan to continue to make, significant investments in our supply chain and technology. These initiatives are designed to streamline our distribution process so that we can optimize the delivery of goods and services to our stores and distribution centers in a timely manner and at a reasonable cost. The cost and potential problems and interruptions associated with the implementation of these initiatives, including those associated with managing third-party service providers and employing new web-based tools and services, could disrupt or reduce the efficiency of our operations in the near term. In addition, our improved supply chain and new or upgraded technology might not provide the
anticipated benefits, it might take longer than expected to realize the anticipated benefits, or the initiatives might fail altogether.
Effective tax rate changes and results of examinations by taxing authorities could materially impact our results.
Our future effective tax rates could be adversely affected by the earnings mix being lower than historical results in states where we have lower statutory rates and higher than historical results in states where we have higher statutory rates, by changes in the measurement of our deferred tax assets and liabilities, or by changes in tax laws or interpretations thereof. In addition, we are subject to periodic audits and examinations by the Internal Revenue Service ("IRS") and other state and local taxing authorities. Like many retailers, a portion of our sales are to tax-exempt customers. The business activities of our customers and the intended use of the unique products sold by us create a challenging
and complex compliance environment. These circumstances create risk that we could be challenged as to the propriety of our sales tax compliance. Our results could be materially impacted by the determinations and expenses related to these and other proceedings by the IRS and other state and local taxing authorities.
Failure to maintain an effective system of internal control over financial reporting could materially impact our business and results.
The Company's management is responsible for establishing and maintaining adequate internal control over financial reporting. An internal control system, no matter how well designed and operated, can provide only reasonable, not absolute, assurance that the objectives of the control system are met. Further, the design of a control system must reflect the fact that there are resource constraints, and the benefits of controls must be considered relative to their costs. Because of the inherent limitations in all internal control systems, internal control over financial reporting may not prevent or detect misstatements. Any failure to maintain an effective system of internal control over financial reporting could limit
our ability to report our financial results accurately and timely or to detect and prevent fraud, and could expose us to litigation or adversely affect the market price of our common stock.
10
None.
At December 31, 2011, we operated 1,085 stores in 44 states. We lease approximately 93% of our stores, two of our seven distribution centers and our management headquarters. Store leases typically have initial terms of 10 to 15 years, with two to four renewal periods of five years each, exercisable at our option. No single lease is material to our operations.
Following is a count of our store locations by state:
|
State
|
Number
of Stores
|
State
|
Number
of Stores
|
|||
|
Texas
|
129 |
Wisconsin
|
15 | |||
|
Ohio
|
71 |
Kansas
|
13 | |||
|
Michigan
|
65 |
Mississippi
|
13 | |||
|
New York
|
65 |
Maine
|
12 | |||
|
Pennsylvania
|
62 |
Nebraska
|
12 | |||
|
Tennessee
|
62 |
New Hampshire
|
12 | |||
|
North Carolina
|
47 |
New Jersey
|
11 | |||
|
Kentucky
|
44 |
Massachusetts
|
10 | |||
|
Georgia
|
43 |
Maryland
|
9 | |||
|
Indiana
|
40 |
Minnesota
|
9 | |||
|
Florida
|
38 |
Connecticut
|
8 | |||
|
Virginia
|
36 |
Iowa
|
8 | |||
|
Alabama
|
31 |
North Dakota
|
7 | |||
|
Oklahoma
|
28 |
South Dakota
|
6 | |||
|
South Carolina
|
26 |
Vermont
|
6 | |||
|
Louisiana
|
24 |
New Mexico
|
5 | |||
|
California
|
20 |
Delaware
|
3 | |||
|
Washington
|
19 |
Oregon
|
3 | |||
|
West Virginia
|
19 |
Hawaii
|
2 | |||
|
Arkansas
|
16 |
Montana
|
2 | |||
|
Illinois
|
16 |
Idaho
|
1 | |||
|
Missouri
|
16 |
Rhode Island
|
1 | |||
| 1,085 |
The Company received and responded to a Request for Information from the United States Environmental Protection Agency (“EPA”) relating to certain recreational vehicles and non-road spark ignition engines sold by the Company. In the first quarter of fiscal 2011, the Environmental Enforcement Section of the Department of Justice (“DOJ”), on behalf of the EPA, informed the Company that it believed the Company had violated the Clean Air Act by importing or causing the importation of certain engines not covered by certificates of conformity issued by the EPA, and that unless the DOJ and the Company were able to reach a settlement, the DOJ was prepared to commence a civil action. The
Company is currently engaged in settlement discussions with the DOJ that would call for the payment of a civil penalty and certain injunctive relief. The engines were purchased by the Company pursuant to agreements with three vendors under which the vendors represented that their products complied with all applicable laws and regulations and under which the vendors agreed to indemnify the Company for any liabilities or costs relating to, among other matters, the noncompliance or alleged noncompliance of their products. The Company has notified these vendors of the EPA’s position and currently is working with these vendors to provide additional information to the DOJ and EPA regarding the alleged violations. The Company expects to be reimbursed by these vendors for any liabilities or costs relating to this matter. The Company does not
expect the resolution of this matter to have a material adverse effect on its financial condition, results of operations or cash flows. We do not believe it is reasonably possible that a loss in excess of the amount accrued will be incurred.
11
We are also involved in various litigation matters arising in the ordinary course of business. We expect these matters will be resolved without material adverse effect on our consolidated financial position, results of operations or cash flows. We believe that any estimated loss related to such matters has been adequately provided in accrued liabilities to the extent probable and reasonably estimable.
Not applicable.
12
|
Item 5
.
|
Market for Registrant’s Common Equity, Related Stockholder Matters and Issuer Purchases of Equity Securities
|
Tractor Supply Company’s common stock trades on The Nasdaq Global Select Market under the symbol “TSCO”.
The table below sets forth the high and low sales prices of our common stock as reported by The Nasdaq Global Select market for each fiscal quarter of the periods indicated:
|
Price Range
|
|||||||||||
|
2011
|
2010
|
||||||||||
|
High
|
Low
|
High
|
Low
|
||||||||
|
First Quarter
|
$ | 57.41 | $ | 45.25 | $ | 30.29 | $ | 24.56 | |||
|
Second Quarter
|
$ | 66.63 | $ | 56.48 | $ | 35.93 | $ | 28.91 | |||
|
Third Quarter
|
$ | 73.09 | $ | 49.02 | $ | 39.14 | $ | 29.55 | |||
|
Fourth Quarter
|
$ | 78.22 | $ | 58.49 | $ | 48.79 | $ | 38.35 | |||
As of January 31, 2012, the approximate number of record holders of our common stock was 585 (excluding individual participants in nominee security position listings), and the estimated number of beneficial holders of our common stock was 100,000.
Issuer Purchases of Equity Securities
On April 28, 2011, the Company’s Board of Directors authorized a $600 million increase to the existing share repurchase program, bringing the total amount authorized to date under the program to an aggregate of $1 billion through April 2015. Stock repurchase activity during fiscal 2011 is set forth in the table below:
|
Period
|
Total Number
of Shares
Purchased
|
Average
Price Paid
Per Share
|
Total Number of Shares Purchased as Part of Publicly Announced
Plans or Programs
|
Maximum Dollar Value of Shares That May Yet Be
Purchased
Under the
Plans or Programs
|
|||||||
|
First Quarter
(a)
|
1,028,268 | $ | 52.53 | 1,011,500 | $ | 89,680,789 | |||||
|
Second Quarter
(a)
|
1,146,763 | 60.90 | 1,145,000 | 619,982,416 | (b) | ||||||
|
Third Quarter
|
805,040 | 61.12 | 805,040 | 570,781,909 | |||||||
|
Fourth Quarter:
|
|||||||||||
|
9/25/11 – 10/22/11
|
25,600 | 61.75 | 25,600 | 569,201,632 | |||||||
|
10/23/11 – 11/19/11
|
22,000 | 71.90 | 22,000 | 567,620,397 | |||||||
|
11/20/11 – 12/31/11
(a)
|
68,452 | 71.24 | 66,600 | 562,879,970 | |||||||
| 116,052 | 69.27 | 114,200 | 562,879,970 | ||||||||
|
As of December 31, 2011
|
3,096,123 | $ | 58.50 | 3,075,740 | $ | 562,879,970 | |||||
| (a) The total number of shares purchased and average price paid per share include shares withheld from vested restricted stock units to satisfy employees’ minimum statutory tax withholding requirements. |
| (b) On April 28, 2011, the Board authorized a $600 million increase to its existing share repurchase program. |
We expect to implement the balance of the repurchase program through purchases made from time to time either in the open market or through private transactions, in accordance with regulations of the SEC. The timing and amount of any shares repurchased under the program will depend on a variety of factors, including price, corporate and regulatory requirements, capital availability, and other market conditions.
Any additional share repurchase programs will be subject to the discretion of our Board of Directors and subject to our results of operations, financial condition, cash requirements and other factors deemed relevant by our Board of Directors. The program may be limited or terminated at any time without prior notice.
13
Common Stock Dividends
During 2011, the Board of Directors declared the following dividends:
|
Date Declared
|
Dividend Amount
Per Share
|
Stockholders of
Record Date
|
Date Paid
|
|||
|
February 4, 2011
|
$ | 0.07 |
February 22, 2011
|
March 8, 2011
|
||
|
April 28, 2011
|
$ | 0.12 |
May 16, 2011
|
June 1, 2011
|
||
|
July 28, 2011
|
$ | 0.12 |
August 15, 2011
|
August 30, 2011
|
||
|
October 26, 2011
|
$ | 0.12 |
November 14, 2011
|
November 29, 2011
|
||
During 2010, the Board of Directors declared the following dividends:
|
Date Declared
|
Dividend Amount
Per Share
|
Stockholders of
Record Date
|
Date Paid
|
|||
|
March 1, 2010
|
$ | 0.07 |
March 15, 2010
|
March 29, 2010
|
||
|
May 3, 2010
|
$ | 0.07 |
May 17, 2010
|
June 2, 2010
|
||
|
July 29, 2010
|
$ | 0.07 |
August 16, 2010
|
August 31, 2010
|
||
|
October 28, 2010
|
$ | 0.07 |
November 15, 2010
|
November 30, 2010
|
||
It is the present intention of the Board of Directors to continue to pay this quarterly cash dividend; however, the declaration and payment of future dividends will be determined by the Board of Directors in its sole discretion and will depend upon the earnings, financial condition, and capital needs of the Company and other factors which the Board of Directors deem relevant.
On February 8, 2012, our Board of Directors declared a quarterly cash dividend of $0.12 per share of the Company’s common stock. The dividend will be paid on March 13, 2012 to stockholders of record as of the close of business on February 27, 2012.
14
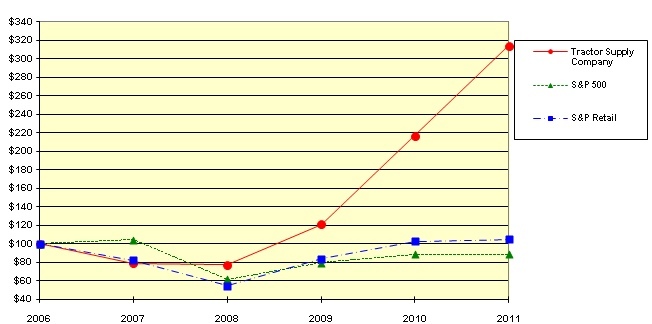
STOCK PERFORMANCE GRAPH
This performance graph shall not be deemed “filed” for purposes of Section 18 of the Securities Exchange Act of 1934, as amended (the “Exchange Act”) or otherwise subject to the liabilities under that Section and shall not be deemed to be incorporated by reference into any filing of Tractor Supply Company under the Securities Act of 1933, as amended, or the Exchange Act.
The following graph compares the cumulative total stockholder return on our Common Stock from December 30, 2006 to December 31, 2011 (the Company's fiscal year-end) with the cumulative total returns of the S&P 500 Index and the S&P Retail Index over the same period. The comparison assumes that $100 was invested on December 30, 2006 in our Common Stock and in each of the foregoing indices. The historical stock price performance shown on this graph is not necessarily indicative of future performance.
|
12/30/06
|
12/29/07
|
12/27/08
|
12/26/09
|
12/25/10
|
12/31/11
|
|||||||||||||||||||
|
Tractor Supply Company
|
$ | 100.00 | $ | 79.09 | $ | 77.21 | $ | 120.85 | $ | 216.51 | $ | 313.80 | ||||||||||||
|
S&P 500
|
$ | 100.00 | $ | 104.24 | $ | 61.54 | $ | 79.42 | $ | 88.61 | $ | 88.67 | ||||||||||||
|
S&P Retail Index
|
$ | 100.00 | $ | 82.15 | $ | 54.36 | $ | 83.64 | $ | 102.53 | $ | 104.81 | ||||||||||||
15
FIVE YEAR SELECTED FINANCIAL AND OPERATING HIGHLIGHTS
The following selected financial data is derived from the consolidated financial statements of Tractor Supply Company. Our fiscal year includes 52 or 53 weeks and ends on the last Saturday of the calendar year. References to fiscal year mean the year in which that fiscal year ended. Fiscal year 2011 consisted of 53 weeks while all other fiscal years below consisted of 52 weeks.
The following table provides summary historical financial information for the periods ended and as of the dates indicated (in thousands, except per share amounts and selected operating and other data):
|
2011
(53 weeks)
|
2010
(52 weeks)
|
2009
(52 weeks)
|
2008
(52 weeks)
|
2007
(52 weeks)
|
||||||||||||||||
|
Operating Results:
|
||||||||||||||||||||
|
Net sales
|
$ | 4,232,743 | $ | 3,638,336 | $ | 3,206,937 | $ | 3,007,949 | $ | 2,703,212 | ||||||||||
|
Gross margin
|
1,406,872 | 1,203,665 | 1,041,889 | 955,055 | 857,940 | |||||||||||||||
|
Selling, general and administrative expenses
|
973,822 | 867,644 | 784,066 | 715,961 | 641,603 | |||||||||||||||
|
Depreciation and amortization
|
80,347 | 69,797 | 66,258 | 60,731 | 51,064 | |||||||||||||||
|
Operating income
|
352,703 | 266,224 | 191,565 | 178,363 | 165,273 | |||||||||||||||
|
Interest expense, net
|
2,087 | 1,284 | 1,644 | 2,133 | 5,037 | |||||||||||||||
|
Income before income taxes
|
350,616 | 264,940 | 189,921 | 176,230 | 160,236 | |||||||||||||||
|
Income tax provision
|
127,876 | 96,968 | 70,176 | 68,237 | 60,777 | |||||||||||||||
|
Net income
|
$ | 222,740 | $ | 167,972 | $ | 119,745 | $ | 107,993 | $ | 99,459 | ||||||||||
|
Net income per share – basic
(a)
|
$ | 3.10 | $ | 2.31 | $ | 1.66 | $ | 1.47 | $ | 1.27 | ||||||||||
|
Net income per share – diluted
(a)
|
$ | 3.01 | $ | 2.25 | $ | 1.63 | $ | 1.44 | $ | 1.24 | ||||||||||
|
Weighted average shares – diluted
|
73,921 | 74,686 | 73,297 | 74,927 | 80,200 | |||||||||||||||
|
Dividends declared per common share outstanding
|
$ | 0.43 | $ | 0.28 | $ | -- | $ | -- | $ | -- | ||||||||||
|
Operating Data (percent of net sales):
|
||||||||||||||||||||
|
Gross margin
|
33.2 | % | 33.1 | % | 32.5 | % | 31.8 | % | 31.7 | % | ||||||||||
|
Selling, general and administrative expenses
|
23.0 | % | 23.9 | % | 24.4 | % | 23.8 | % | 23.7 | % | ||||||||||
|
Operating income
|
8.3 | % | 7.3 | % | 6.0 | % | 5.9 | % | 6.1 | % | ||||||||||
|
Net income
|
5.3 | % | 4.6 | % | 3.7 | % | 3.6 | % | 3.7 | % | ||||||||||
|
Store, Sales and Other Data:
|
||||||||||||||||||||
|
Stores open at end of year
|
1,085 | 1,001 | 930 | 855 | 764 | |||||||||||||||
|
Same-store sales increase (decrease)
(b)
|
8.2 | % | 7.0 | % | (1.1 | %) | 1.4 | % | 3.4 | % | ||||||||||
|
Average sales per store (000’s)
(c)
|
$ | 4,065 | $ | 3,781 | $ | 3,586 | $ | 3,703 | $ | 3,762 | ||||||||||
|
Average ticket
|
$ | 43.33 | $ | 42.07 | $ | 42.06 | $ | 44.55 | $ | 43.60 | ||||||||||
|
Average number of daily transactions per store
|
255 | 249 | 236 | 230 | 239 | |||||||||||||||
|
Total team members
|
16,400 | 14,700 | 13,300 | 12,800 | 11,600 | |||||||||||||||
|
Capital expenditures (000’s)
|
$ | 166,156 | $ | 96,511 | $ | 73,974 | $ | 91,759 | $ | 83,986 | ||||||||||
|
Balance Sheet Data (at end of period) (000’s):
|
||||||||||||||||||||
|
Working capital
|
$ | 629,624 | $ | 617,153 | $ | 475,847 | $ | 337,225 | $ | 340,405 | ||||||||||
|
Total assets
|
1,594,832 | 1,463,474 | 1,276,580 | 1,143,301 | 1,083,185 | |||||||||||||||
|
Long-term debt, less current portion
(d)
|
1,284 | 1,316 | 1,407 | 1,797 | 57,351 | |||||||||||||||
|
Stockholders’ equity
|
1,008,290 | 933,242 | 779,151 | 651,799 | 580,943 |
_______________________
| (a) Basic net income per share is calculated based on the weighted average number of common shares outstanding applied to net income. Diluted net income per share is calculated using the treasury stock method for stock options and restricted stock units. |
| (b) Same-store sales increases (decreases) are calculated on an annual basis, including relocations in 2011, 2010, 2009 and 2008 and excluding relocations in 2007, using all stores open at least one year. |
| (c) Average sales per store is calculated based on total sales divided by the weighted average number of stores open in the year. |
| (d) Long-term debt includes borrowings under the Company's revolving credit agreement and amounts outstanding under its capital lease obligations, excluding the current portion. |
16
Overview
Tractor Supply Company is the largest operator of retail farm and ranch stores in the United States and is focused on supplying the lifestyle needs of recreational farmers and ranchers and those who enjoy the rural lifestyle, as well as tradesmen and small businesses. We operate retail stores under the names
Tractor Supply Company
and
Del’s Farm Supply
and operate a website under the name
TractorSupply.com
. Our stores are located in towns outlying major metropolitan markets and in rural communities, and they
offer the following comprehensive selection of merchandise:
|
·
|
Equine, pet and small animal products, including items necessary for their health, care, growth and containment;
|
|
·
|
Hardware, truck, towing and tool products;
|
|
·
|
Seasonal products, including lawn and garden items, power equipment, gifts and toys;
|
|
·
|
Maintenance products for agricultural and rural use; and
|
|
·
|
Work/recreational clothing and footwear.
|
We operated 1,085 retail farm and ranch stores in 44 states as of December 31, 2011. Given the size of the communities that we target, we believe that there is ample opportunity for new store growth in existing and new markets. We have developed a proven method for selecting store sites and have identified over 1,000 additional markets for new Tractor Supply stores, inclusive of recently identified small market locations. Approximately 55% of our stores are in freestanding buildings and 45% are located in strip shopping centers.
Fiscal 2011 was once again a year of strong performance for our Company. We achieved double-digit increases in both sales and earnings on top of last year’s record results. In fiscal 2011, our net revenues increased 16.3% to $4.23 billion compared to $3.64 billion in fiscal 2010, and we increased our fiscal 2011 diluted earnings per share to $3.01 versus $2.25 in fiscal 2010. We also ended the year with $199 million in cash and restricted cash after returning nearly $211 million to our stockholders through stock repurchases and dividends.
Over the past five years we have experienced considerable sales growth, with a compounded annual growth rate of approximately 12.3%. We plan to open 90 to 95 new stores in 2012, a selling square footage increase of approximately 8.0%. We opened 85 new stores in 2011 and 74 new stores in 2010, a square footage increase of approximately 7.8% and 7.4%, respectively.
Our current and long-term growth strategy is to: (1) expand geographic market presence through opening new retail stores, (2) enhance financial performance through same-store sales growth achieved through targeted merchandising programs with an “everyday value prices” philosophy and supported by strong customer service, (3) enhance product margin through strategic product sourcing and regional allocation, a strong private label offering, and optimization of product pricing, transportation and distribution costs, (4) leverage operating costs, especially advertising, distribution and corporate overhead by focusing on opportunities for continuous improvement and elimination of waste in all of
our processes, (5) expand market opportunities via internet sales accomplished by improving our product content and enhancing our customers’ online experience and (6) expand through selective acquisition, as such opportunities arise, to enhance penetration into new and existing markets as a complementary strategy to organic growth.
Our store strategy features low initial capital expenditures, limited maintenance capital, and low occupancy and operating costs. The average cash investment for new leased stores opened in 2011 was approximately $1.2 million. A majority of the cash outlay was for initial acquisition of inventory and capital expenditures (principally leasehold improvements, fixtures and equipment), and approximately $82,000 for pre-opening costs. Our new stores are typically profitable in the first full year of operation and reach chain average in approximately five years.
Our capital allocation strategy focuses first on capital expenditure requirements (to support growth and invest in existing facilities and improved information technology processes and systems), and promotes effective stockholder return through our share repurchase and dividend programs. Our capital expenditures for fiscal 2011 and 2010 were $166.2 million and $96.5 million, respectively. We expect capital expenditures in 2012 to be approximately $160 million to $170 million as we continue to invest in new store growth, existing stores, distribution center capacity and information technology.
17
We place significant emphasis on our merchandising programs, evaluating the sales and profitability of our products through detailed line reviews, review of vendor performance measures and modification of the overall product offerings. Modifications of product offerings include increasing the quality and affordability of some items through strategic sourcing, improving our private label offerings and ensuring we have the best product mix in our stores based on the regional needs of our customers. We believe these efforts, coupled with a strong marketing program and in-depth product knowledge training of our store team members, have enhanced our sales and financial performance.
Significant Accounting Policies and Estimates
Management’s discussion and analysis of our financial position and results of operations are based upon our consolidated financial statements, which have been prepared in accordance with United States generally accepted accounting principles. The preparation of these financial statements requires management to make informed estimates and judgments that affect the reported amounts of assets, liabilities, revenues and expenses and related disclosure of contingent assets and liabilities. Our financial position and/or results of operations may be materially different when reported under different conditions or when using different assumptions in the application of such
policies. In the event estimates or assumptions prove to be different from actual amounts, adjustments are made in subsequent periods to reflect more current information. Our significant accounting policies are disclosed in Note 1 to our Consolidated Financial Statements. The following discussion addresses our most critical accounting policies, which are those that are both important to the portrayal of our financial condition and results of operations and that require significant judgment or use of complex estimates.
18
|
Description
|
Judgments and Uncertainties
|
Effect if Actual Results Differ From A
ssumptions
|
|
Inventory Valuation:
|
||
|
Inventory Impairment
|
||
|
We identify potentially excess and slow-moving inventory by evaluating turn rates, historical and expected future sales trends, age of merchandise, overall inventory levels, current cost of inventory and other benchmarks. The estimated inventory valuation reserve to recognize any impairment in value (i.e., an inability to realize the full carrying value) is based on our aggregate assessment of these valuation indicators under prevailing market conditions and current merchandising strategies.
|
We do not believe our merchandise inventories are subject to significant risk of obsolescence in the near term. However, changes in market conditions or consumer purchasing patterns could result in the need for additional reserves.
Our impairment reserve contains uncertainties because the calculation requires management to make assumptions and to apply judgment regarding forecasted customer demand and the promotional environment.
|
We have not made any material changes in the accounting methodology used to recognize inventory impairment reserves in the financial periods presented.
We do not believe there is a reasonable likelihood that there will be a material change in the future estimates or assumptions we use to calculate impairment. However, if assumptions regarding consumer demand or clearance potential for certain products are inaccurate, we may be exposed to losses or gains that could be material.
A 10% change in our impairment reserve at December 31, 2011, would have affected net income by approximately $590,000 in fiscal 2011.
|
|
Shrinkage
|
||
|
We perform physical inventories at each store at least once a year, and we have established reserves for estimating inventory shrinkage between physical inventory counts. The reserve is established by assessing the chain-wide average shrinkage experience rate, applied to the related periods' sales volumes. Such assessments are updated on a regular basis for the most recent individual store experiences.
|
The estimated store inventory shrink rate is based on historical experience. We believe historical rates are a reasonably accurate reflection of future trends.
Our shrinkage reserve contains uncertainties because the calculation requires management to make assumptions and to apply judgment regarding future shrinkage trends, the effect of loss prevention measures and new merchandising strategies.
|
We have not made any material changes in the accounting methodology used to recognize shrinkage in the financial periods presented.
We do not believe there is a reasonable likelihood that there will be a material change in the future estimates or assumptions we use to calculate our shrinkage reserve. However, if our estimates regarding inventory losses are inaccurate, we may be exposed to losses or gains that could be material.
A 10% change in our shrinkage reserve at December 31, 2011, would have affected net income by approximately $860,000 in fiscal 2011.
|
19
| Description | Judgments and Uncertainties | Effect if Actual Results Differ From A ssumptions |
|
Vendor Support
|
||
|
We receive funding from substantially all of our significant merchandise vendors for the promotion of our brand as well as the sale of their products through a variety of programs and arrangements, including guaranteed funding and volume rebate programs. The amounts received are subject to terms of vendor agreements, which have varying expiration dates ranging in duration from several months to a few years. Many agreements are negotiated annually and are based on expected annual purchases of the vendor’s product. Vendor funding is initially deferred as a reduction of the purchase price of inventory and then
recognized as a reduction of cost of merchandise as the related inventory is sold. During interim periods, the amount of expected funding is estimated based upon initial commitments, as well as anticipated purchase levels with applicable vendors.
|
The estimated purchase volume and related vendor funding is based on our current knowledge of inventory levels, sales trends and expected customer demand, as well as planned new store openings and relocations. Although we believe we can reasonably estimate purchase volume and related vendor funding at interim periods, it is possible that actual year-end results could significantly differ from previously estimated amounts.
Our allocation methodology contains uncertainties because the calculation requires management to make assumptions and to apply judgment regarding customer demand, purchasing activity, target thresholds, vendor attrition and collectibility.
|
We have not made any material changes in the accounting methodology used to establish our vendor support reserves in the financial periods presented.
At the end of each fiscal year, a significant portion of the actual purchase activity is known. Thus, we do not believe there is a reasonable likelihood that there will be a material change in the amounts recorded as vendor support.
We do not believe there is a significant collectibility risk related to vendor support amounts due us at the end of fiscal 2011.
If a 10% reserve had been applied against our outstanding vendor support due as of December 31, 2011, net income would have been affected by approximately $1.2 million.
Although it is unlikely that there will be any significant reduction in historical levels of vendor support, if such a reduction were to occur in future periods, the Company could experience a higher inventory balance and higher cost of sales.
|
|
Freight
|
||
|
We incur various types of transportation and delivery costs in connection with inventory purchases and distribution. Such costs are included as a component of the overall cost of inventories (on an aggregate basis) and recognized as a component of cost of merchandise sold as the related inventory is sold.
|
We allocate freight as a component of total cost of sales without regard to inventory mix or unique freight burden of certain categories. This assumption has been consistently applied for all years presented.
|
We have not made any material changes in the accounting methodology used to establish our capitalized freight balance or freight allocation in the financial periods presented.
If a 10% increase or decrease had been applied against our current inventory capitalized freight balance, net income would have been affected by approximately $4.1 million.
|
20
| Description | Judgments and Uncertainties | Effect if Actual Results Differ From A ssumptions |
|
Self-Insurance Reserves:
|
||
|
We self-insure a significant portion of our employee medical insurance, workers' compensation and general liability insurance plans. We have stop-loss insurance policies to protect from individual losses over specified dollar values.
When estimating our self-insured liabilities, we consider a number of factors, including historical claims experience, demographic factors and severity factors.
|
The full extent of certain claims, especially workers' compensation and general liability claims, may not become fully determined for several years.
Our self-insured liabilities contain uncertainties because management is required to make assumptions and to apply judgment to estimate the ultimate cost to settle reported claims and claims incurred but not reported as of the balance sheet date.
|
We have not made any material changes in the accounting methodology used to establish our self-insurance reserves in the financial periods presented.
We do not believe there is a reasonable likelihood that there will be a material change in the assumptions we use to calculate insurance reserves. However, if we experience a significant increase in the number of claims or the cost associated with these claims, we may be exposed to losses that could be material.
A 10% change in our self-insurance reserves at December 31, 2011, would have affected net income by approximately $2.0 million in fiscal 2011.
|
|
Sales Tax Audit Reserve:
|
||
|
A portion of our sales are to tax-exempt customers. We obtain exemption information as a necessary part of each tax-exempt transaction. Many of the states in which we conduct business will perform audits to verify our compliance with applicable sales tax laws. The business activities of our customers and the intended use of the unique products sold by us create a challenging and complex compliance environment. These circumstances also create some risk that we could be challenged as to the accuracy of our sales tax compliance.
While we believe we reasonably enforce sales tax compliance with our customers and endeavor to fully comply with all applicable sales tax regulations, there can be no assurance that we, upon final completion of such audits, would not have a significant liability for disallowed exemptions.
|
We review our past audit experience and assessments with applicable states to continually determine if we have potential exposure for non-compliance. Any estimated liability is based on an initial assessment of compliance risk and our historical experience with each state. We continually reassess the exposure based on historical audit results, changes in policies, preliminary and final assessments made by state sales tax auditors, and additional documentation that may be provided to reduce the assessment.
Our sales tax audit reserve contains uncertainties because management is required to make assumptions and to apply judgment regarding the complexity of agricultural-based exemptions, the ambiguity in state tax regulations, the number of ongoing audits, and the length of time required to settle with the state taxing authorities.
|
Our sales tax audit assessment methodology remained materially consistent in the financial periods presented.
We do not believe there is a reasonable likelihood that there will be a material change in the future estimates or assumptions we use to calculate the sales tax liability reserve. However, if our estimates regarding the ultimate sales tax liability are inaccurate, we may be exposed to losses or gains that could be material.
A 10% change in our sales tax audit reserve at December 31, 2011, would have affected net income by approximately $720,000 in fiscal 2011.
|
21
| Description | Judgments and Uncertainties | Effect if Actual Results Differ From A ssumptions |
|
Tax Contingencies:
|
||
|
Our income tax returns are periodically audited by U.S. federal and state tax authorities. These audits include questions regarding our tax filing positions, including the timing and amount of deductions and the allocation of income among various tax jurisdictions. At any time, multiple tax years are subject to audit by the various tax authorities. In evaluating the exposures associated with our various tax filing positions, we record a liability for unrecognized tax benefits resulting from uncertain tax positions taken or expected to be taken in a tax return. A number of years may elapse before a particular matter, for which we have established a reserve, is
audited and fully resolved or clarified. We recognize the effect of income tax positions only if those positions are more likely than not of being sustained. Recognized income tax positions are measured at the largest amount that is greater than 50% likely of being realized. Changes in recognition or measurement are reflected in the period in which the change in judgment occurs. We adjust our tax contingencies reserve and income tax provision in the period in which actual results of a settlement with tax authorities differs from our established reserve, the statute of limitations expires for the relevant tax authority to examine the tax position or when more information becomes available.
|
Our tax contingencies reserve contains uncertainties because management is required to make assumptions and to apply judgment to estimate the exposures associated with our various filing positions and whether or not the minimum requirements for recognition of tax benefits have been met.
|
We have not made any material changes in the accounting methodology used to establish our tax contingencies in the financial periods presented.
We do not believe there is a reasonable likelihood that there will be a material change in the reserves established for tax benefits not recognized.
Although management believes that the judgments and estimates discussed herein are reasonable, actual results could differ, and we may be exposed to losses or gains that could be material.
To the extent we prevail in matters for which reserves have been established, or are required to pay amounts in excess of our reserves, our effective income tax rate in a given financial statement period could be materially affected. An unfavorable tax settlement would require use of our cash and would result in an increase in our effective income tax rate in the period of resolution. A favorable tax settlement would be recognized as a reduction in our effective income tax rate in the period of resolution.
A 10% change in our unrecognized tax benefit reserve at December 31, 2011 would have affected net income by approximately $460,000 in fiscal 2011.
|
22
| Description | Judgments and Uncertainties | Effect if Actual Results Differ From A ssumptions |
|
Impairment of Long-Lived Assets:
|
||
|
Long-lived assets other than goodwill and indefinite-lived intangible assets, which are separately tested for impairment, are evaluated for impairment whenever events or changes in circumstances indicate that the carrying value may not be recoverable.
When evaluating long-lived assets for potential impairment, we first compare the carrying value of the asset to the asset’s estimated future cash flows (undiscounted and without interest charges). The evaluation for long-lived assets is performed at the lowest level of identifiable cash flows, which is generally the individual store level. The significant assumptions used to determine estimated undiscounted cash flows include cash inflows and outflows directly resulting from the use of those assets in operations, including margin on net sales, payroll and related items, occupancy costs, insurance allocations and other costs to operate a
store.
If the estimated future cash flows are less than the carrying value of the asset, we calculate an impairment loss. The impairment loss calculation compares the carrying value of the asset to the asset’s estimated fair value, which may be based on an estimated future cash flow model. We recognize an impairment loss if the amount of the asset’s carrying value exceeds the asset’s estimated fair value. If we recognize an impairment loss, the adjusted carrying amount of the asset becomes its new cost basis. For a depreciable long-lived asset, the new cost basis will be depreciated (amortized) over the remaining estimated useful life of that
asset.
|
Our impairment loss calculations contain uncertainties because they require management to make assumptions and to apply judgment to estimate future cash flows and asset fair values, including forecasting useful lives of the assets and selecting the discount rate that reflects the risk inherent in future cash flows.
|
We have not made any material changes in our impairment loss assessment methodology in the financial periods presented.
We do not believe there is a reasonable likelihood that there will be a material change in the estimates or assumptions we use to calculate long-lived asset impairment losses. None of these estimates and assumptions are significantly sensitive, and a 10% change in any of these estimates would not have a material impact on our analysis. However, if actual results are not consistent with our estimates and assumptions used in estimating future cash flows and asset fair values, we may be exposed to losses that could be material.
|
23
Quarterly Financial Data
Our unaudited quarterly operating results for each fiscal quarter of 2011 and 2010 are shown below (in thousands, except per share amounts):
|
First
Quarter
(13 weeks)
|
Second
Quarter
(13 weeks)
|
Third
Quarter
(13 weeks)
|
Fourth
Quarter
(14 weeks)
|
Total
|
||||||||||||||||
|
2011
|
||||||||||||||||||||
|
Net sales
|
$ | 836,576 | $ | 1,178,363 | $ | 977,776 | $ | 1,240,028 | $ | 4,232,743 | ||||||||||
|
Gross margin
|
273,606 | 402,497 | 327,603 | 403,166 | 1,406,872 | |||||||||||||||
|
Operating income
|
28,766 | 144,263 | 68,129 | 111,545 | 352,703 | |||||||||||||||
|
Net income
|
18,335 | 91,160 | 42,733 | 70,512 | 222,740 | |||||||||||||||
|
Net income per share:
(1)
|
||||||||||||||||||||
|
Basic
|
$ | 0.25 | $ | 1.27 | $ | 0.60 | $ | 0.99 | $ | 3.10 | ||||||||||
|
Diluted
|
$ | 0.24 | $ | 1.23 | $ | 0.58 | $ | 0.96 | $ | 3.01 | ||||||||||
|
Same-store sales increase
|
10.7 | % | 4.6 | % | 11.5 | % | 7.6 | % | 8.2 | % | ||||||||||
|
First
Quarter
(13 weeks)
|
Second
Quarter
(13 weeks)
|
Third
Quarter
(13 weeks)
|
Fourth
Quarter
(13 weeks)
|
Total
|
||||||||||||||||
|
2010
|
||||||||||||||||||||
|
Net sales
|
$ | 710,917 | $ | 1,065,656 | $ | 829,114 | $ | 1,032,649 | $ | 3,638,336 | ||||||||||
|
Gross margin
|
230,931 | 360,129 | 275,688 | 336,917 | 1,203,665 | |||||||||||||||
|
Operating income
|
16,467 | 123,648 | 47,407 | 78,702 | 266,224 | |||||||||||||||
|
Net income
|
10,582 | 77,318 | 29,863 | 50,209 | 167,972 | |||||||||||||||
|
Net income per share:
(1)
|
||||||||||||||||||||
|
Basic
|
$ | 0.15 | $ | 1.06 | $ | 0.41 | $ | 0.69 | $ | 2.31 | ||||||||||
|
Diluted
|
$ | 0.14 | $ | 1.04 | $ | 0.40 | $ | 0.67 | $ | 2.25 | ||||||||||
|
Same-store sales increase
|
2.8 | % | 6.1 | % | 5.0 | % | 13.1 | % | 7.0 | % | ||||||||||
|
(1)
Due to the nature of interim earnings per share calculations, the sum of quarterly earnings per share amounts may not equal the reported earnings per share for the year.
|
||||||||||||||||||||
24
Results of Operations
Our fiscal year includes 52 or 53 weeks and ends on the last Saturday of the calendar year. References to fiscal year mean the year in which that fiscal year ended. The fiscal year ended December 31, 2011 consisted of 53 weeks while fiscal years ended December 25, 2010 and December 26, 2009 contained 52 weeks.
The following table sets forth, for the periods indicated, certain items in our Consolidated Statements of Income expressed as a percentage of net sales.
|
2011
|
2010
|
2009
|
||||||||||
|
Net sales
|
100.0 | % | 100.0 | % | 100.0 | % | ||||||
|
Cost of merchandise sold
(a)
|
66.8 | 66.9 | 67.5 | |||||||||
|
Gross margin
(a)
|
33.2 | 33.1 | 32.5 | |||||||||
|
Selling, general and administrative expenses
(a)
|
23.0 | 23.9 | 24.4 | |||||||||
|
Depreciation and amortization
|
1.9 | 1.9 | 2.1 | |||||||||
|
Operating income
|
8.3 | 7.3 | 6.0 | |||||||||
|
Interest expense, net
|
-- | -- | 0.1 | |||||||||
|
Income before income taxes
|
8.3 | 7.3 | 5.9 | |||||||||
|
Income tax provision
|
3.0 | 2.7 | 2.2 | |||||||||
|
Net income
|
5.3 | % | 4.6 | % | 3.7 | % | ||||||
| (a) Our gross margin amounts may not be comparable to those of other retailers since some retailers include all of the costs related to their distribution network in cost of merchandise sold and others like us exclude a portion of these distribution network costs from gross margin and instead include them in selling, general and administrative (“SG&A”) expenses; refer to Note 1 – Significant Accounting Policies, of the Notes to Consolidated Financial Statements, included in Item 8 Financial Statements and Supplementary Data, of this Annual Report on Form 10-K. | ||||||||||||
Fiscal 2011 Compared to Fiscal 2010
Net sales increased 16.3% to $4.23 billion in fiscal 2011 from $3.64 billion in fiscal 2010. Fiscal 2011 included an additional week compared to fiscal 2010, representing approximately 170 basis points of the net sales increase. Same-store sales for fiscal 2011 were $3.99 billion, an 8.2% increase over fiscal 2010. This compares to a 7.0% same-store sales increase in the prior year. The same-store transaction count increased 5.0%, while same-store average ticket increased 3.1% for fiscal 2011. The same-store sales increase was driven by continued strong results in core consumable, usable and edible (C.U.E.) products, principally animal and pet-related merchandise. Emergency
response related merchandise also performed well during the year as a result of Hurricane Irene and tornadoes across the southeast. We estimate that same-store sales were favorably impacted by approximately 340 basis points due to inflation, principally in key C.U.E. categories. Additionally, fiscal 2011 had one additional comp sales day in the year, which had a favorable impact on same-store sales of approximately 30 basis points.
Store growth was approximately 8.4%, a net increase of 84 stores since December 25, 2010. Non-comp sales (defined as stores opened less than one year) for fiscal 2011 were $237.5 million, a 6.4% increase over total fiscal 2010 net sales. Non-comp sales for fiscal 2010 were $205.4 million, a 6.5% increase over total fiscal 2009 net sales.
In fiscal 2011, we opened 85 new stores (compared to 74 new stores in fiscal 2010), relocated three stores (compared to no relocations in fiscal 2010) and closed one store (compared to three closed stores in fiscal 2010).
The following chart indicates the percentage of sales represented by each of our major product categories during fiscal 2011 and 2010:
|
Percent of Sales
|
||||||
|
Product Category:
|
2011
|
2010
|
||||
|
Livestock and Pet
|
40 | % | 39 | % | ||
|
Hardware, Tools and Truck
|
23 | 23 | ||||
|
Seasonal, Gift and Toy Products
|
21 | 22 | ||||
|
Clothing and Footwear
|
10 | 10 | ||||
|
Agriculture
|
6 | 6 | ||||
|
Total
|
100 | % | 100 | % | ||
25
Gross margin increased 16.9% to $1.41 billion compared to $1.20 billion in 2010. As a percent of sales, gross margin increased 10 basis points to 33.2% for fiscal 2011 compared to 33.1% for fiscal 2010. The increase in gross margin reflects improved direct product margin, partially offset by increased transportation costs. Direct product margin increased as we continue to make progress on our four strategic margin initiatives which include inventory management, strategic sourcing, private branding and price optimization. We expect the effects of inflation to continue into and potentially throughout the remainder of fiscal 2012. Additionally, we expect
transportation costs to continue to increase as a result of rising fuel costs and planned increases in our import volume as a percent of total purchases. However, we expect that we will be able to maintain reasonable margins through effective sourcing of product and retail price management.
As a percent of sales, SG&A expenses including depreciation and amortization improved 90 basis points to 24.9% in fiscal 2011 from 25.8% in fiscal 2010. The SG&A improvement as a percent of sales for fiscal 2011 was primarily attributable to the leverage of strong same-store sales and expense control with respect to store operating costs. Total SG&A expenses for fiscal 2011 increased 12.5% to $1.05 billion from $937.4 million in fiscal 2010. The increase in SG&A expense primarily reflects new store growth, variable costs associated with our same-store sales performance, increased advertising for print media and special promotional events and expansion of our distribution
center capacity and ongoing implementation of the new warehouse management system. The Company’s new Franklin, Kentucky distribution center opened in the fourth quarter of 2011.
Our effective tax rate decreased to 36.5% for fiscal 2011 compared to 36.6% in fiscal 2010. This reduction in the effective tax rate resulted from the favorable impact of certain federal tax credits as well as the utilization of various state income tax credits during fiscal 2011 compared to fiscal 2010.
As a result of the foregoing factors, net income for fiscal 2011 increased 32.6% to $222.7 million, or $3.01 per diluted share, as compared to net income of $168.0 million, or $2.25 per diluted share, in fiscal 2010.
During 2011, we repurchased approximately 3.1 million shares of stock at a total cost of $180.0 million as part of our previously announced $1 billion share repurchase program. In 2010, we repurchased approximately 0.8 million shares at a total cost of $38.2 million.
Fiscal 2010 Compared to Fiscal 2009
Net sales increased 13.5% to $3.64 billion in fiscal 2010 from $3.21 billion in fiscal 2009. Same-store sales for fiscal 2010 were $3.43 billion, a 7.0% increase over fiscal 2009. This compares to a 1.1% same-store sales decrease in the prior year. The same-store transaction count increased 7.4%, while same-store average ticket decreased 0.3% for fiscal 2010. The same-store sales increase was broad-based and driven by strong results in core consumable categories, principally animal and pet-related products, as well as seasonal products, including heating, insulated outerwear and outdoor power equipment.
New store growth was approximately 7.6% or 71 net stores opened since December 26, 2009. Non-comp sales for fiscal 2010 were $205.4 million, a 6.5% increase over total fiscal 2009 net sales. Non-comp sales for fiscal 2009 were $230.7 million, a 7.7% increase over total fiscal 2008 net sales.
In fiscal 2010, we opened 74 new stores (compared to 76 new stores in fiscal 2009), relocated no stores (compared to two relocations in fiscal 2009) and closed three stores (compared to one closed store in fiscal 2009).
The following chart indicates the percentage of sales represented by each of our major product categories during fiscal 2010 and 2009:
|
Percent of Sales
|
||||||
|
Product Category:
|
2010
|
2009
|
||||
|
Livestock and Pet
|
39 | % | 39 | % | ||
|
Hardware, Tools and Truck
|
23 | 23 | ||||
|
Seasonal, Gift and Toy Products
|
22 | 22 | ||||
|
Clothing and Footwear
|
10 | 10 | ||||
|
Agriculture
|
6 | 6 | ||||
|
Total
|
100 | % | 100 | % | ||
Gross margin increased 15.5% to $1.20 billion compared to $1.04 billion in 2009. As a percent of sales, gross margin increased 60 basis points to 33.1% for fiscal 2010 compared to 32.5% for fiscal 2009. The improvement in gross margin is primarily due to expanded direct product margin and a decrease in shrink, partially offset by increased transportation costs. The direct product margin improvement resulted from progress on certain margin driving initiatives which include strategic sourcing, inventory management, and more effective pricing.
26
As a percent of sales, SG&A expenses including depreciation and amortization improved 70 basis points to 25.8% in fiscal 2010 from 26.5% in fiscal 2009. The SG&A improvement as a percent of sales was primarily attributable to the leverage of strong same-store sales and expense management, partially offset by an increase in incentive compensation expense. Total SG&A expenses increased 10.2% to $937.4 million from $850.3 million in fiscal 2009. The increase in SG&A expense primarily reflects new store growth, variable costs associated with our same-store sales growth and increased incentive compensation.
Our effective tax rate decreased to 36.6% for fiscal 2010 compared to 36.9% in fiscal 2009. This reduction in the effective tax rate resulted from a greater tax benefit received on the disqualified disposition of incentive stock options during fiscal 2010 compared to fiscal 2009.
As a result of the foregoing factors, net income for fiscal 2010 increased 40.3% to $168.0 million, or $2.25 per diluted share, as compared to net income of $119.7 million, or $1.63 per diluted share, in fiscal 2009.
During 2010, we repurchased approximately 0.8 million shares of stock at a total cost of $38.2 million as part of our previously announced share repurchase program. In 2009, we repurchased approximately 0.4 million shares at a total cost of $15.3 million.
Liquidity and Capital Resources
In addition to normal operating expenses, our primary ongoing cash requirements are for new store expansion, remodeling and relocation programs (including inventory purchases and capital expenditures), distribution center capacity and improvements, information technology, share repurchases and cash dividends. Our primary ongoing sources of liquidity are existing cash balances, funds provided from operations, borrowings available under our revolving credit agreement, capital and operating leases and normal trade credit. Our inventory and accounts payable levels typically build in the first and third fiscal quarters in anticipation of the spring and cold-weather selling seasons,
respectively.
Working Capital
At December 31, 2011, we had working capital of $629.6 million, a $12.5 million increase from December 25, 2010. This increase was primarily attributable to changes in the following components of current assets and current liabilities (in millions):
|
2011
|
2010
|
Variance
|
||||||||||
|
Current assets:
|
||||||||||||
|
Cash and cash equivalents
|
$ | 176.9 | $ | 257.3 | $ | (80.4 | ) | |||||
|
Restricted cash
|
21.9 | -- | 21.9 | |||||||||
|
Short-term investments
|
-- | 15.9 | (15.9 | ) | ||||||||
|
Inventories
|
830.8 | 736.5 | 94.3 | |||||||||
|
Prepaid expenses and other current assets
|
51.7 | 34.0 | 17.7 | |||||||||
|
Deferred income taxes
|
8.9 | -- | 8.9 | |||||||||
| 1,090.2 | 1,043.7 | 46.5 | ||||||||||
|
Current liabilities:
|
||||||||||||
|
Accounts payable
|
$ | 266.4 | $ | 247.4 | $ | 19.0 | ||||||
|
Accrued employee compensation
|
48.3 | 34.6 | 13.7 | |||||||||
|
Other accrued expenses
|
134.0 | 127.4 | 6.6 | |||||||||
|
Current portion of capital lease obligation
|
-- | 0.1 | (0.1 | ) | ||||||||
|
Income taxes payable
|
11.9 | 8.3 | 3.6 | |||||||||
|
Deferred income taxes
|
-- | 8.8 | (8.8 | ) | ||||||||
| 460.6 | 426.6 | 34.0 | ||||||||||
|
Working capital
|
$ | 629.6 | $ | 617.1 | $ | 12.5 | ||||||
In comparison to prior year-end, working capital increased primarily as a result of an increase in inventory, partially offset by a decrease in cash. The increase in inventory was primarily due to new store growth and inflation. Average inventory per store increased to $723,000 for fiscal 2011 compared to $709,000 for fiscal 2010. The decrease in cash is primarily attributable to an increased volume of share repurchases as well as an increase in capital expenditures, principally due to the construction of a new distribution center.
27
Borrowings and Credit Facilities
Through October 23, 2011 we were party to a Senior Credit Facility (the “Credit Agreement”), which provided for borrowings up to $350 million (with sublimits of $75 million and $20 million for letters of credit and swingline loans, respectively) with proceeds available to be used for working capital, capital expenditures, dividends, share repurchases and other matters. The Credit Agreement had an Increase Option for $150 million (subject to additional lender group commitments). The Credit Agreement was unsecured and would have matured in February 2012.
On October 24, 2011, we entered into a new Senior Credit Facility with largely the same lender group as under the previous Credit Agreement. The new Senior Credit Facility provides for borrowings of up to $250 million (with sublimits of $250 million and $20 million for letters of credit and swingline loans, respectively). This agreement is unsecured and matures in October 2016, with proceeds available to be used for working capital, capital expenditures, dividends, share repurchases and other matters.
At December 31, 2011 and December 25, 2010, there were no outstanding borrowings under either Senior Credit Facility. There were $15.0 million and $27.4 million outstanding letters of credit as of December 31, 2011 and December 25, 2010, respectively. Borrowings bear interest at either the bank’s base rate (3.25% at December 31, 2011) or the London Inter-Bank Offer Rate (“LIBOR”) (0.30% at December 31, 2011) plus an additional amount ranging from 0.40% to 1.00% per annum, adjusted quarterly based on our leverage ratio (0.50% at December 31, 2011). We are also required to pay, quarterly in arrears, a commitment fee ranging from 0.08% to 0.20% per annum
and adjusted quarterly based on our leverage ratio, for unused capacity (0.10% at December 31, 2011). There are no compensating balance requirements associated with the Senior Credit Facility.
The Senior Credit Facility requires quarterly compliance with respect to two material covenants: a fixed charge coverage ratio and a leverage ratio. The fixed charge coverage ratio principally compares earnings before interest, taxes, depreciation, amortization, stock compensation and rent expense (“consolidated EBITDAR”) to the sum of interest paid and rental expense (excluding straight-line rent). The leverage ratio principally compares total debt plus rental expense (excluding straight-line rent) multiplied by a factor of six to consolidated EBITDAR. The Senior Credit Facility also contains certain other restrictions regarding additional indebtedness,
capital expenditures, business operations, guarantees, investments, mergers, consolidations and sales of assets, transactions with subsidiaries or affiliates, and liens. We were in compliance with all covenants at December 31, 2011.
Sources and Uses of Cash
Our primary source of liquidity is cash provided by operations. Principal uses of cash for investing activities are capital expenditures, while uses of cash for financing activities are repurchase of the Company’s common stock and payment of common stock dividends. The following table presents a summary of cash flows from operating, investing and financing activities for the last three fiscal years (in millions):
|
2011
|
2010
|
2009
|
||||||||||
|
Net cash provided by operating activities
|
$ | 254.1 | $ | 222.6 | $ | 215.3 | ||||||
|
Net cash used in investing activities
|
(171.3 | ) | (112.1 | ) | (73.8 | ) | ||||||
|
Net cash used in financing activities
|
(163.2 | ) | (26.0 | ) | (5.6 | ) | ||||||
|
Net (decrease) increase in cash and cash equivalents
|
$ | (80.4 | ) | $ | 84.5 | $ | 135.9 | |||||
Operating Activities
The $31.5 million increase in net cash provided by operations in fiscal 2011 over fiscal 2010 is primarily due to changes in the following operating activities (in millions):
|
2011
|
2010
|
Variance
|
||||||||||
|
Net income
|
$ | 222.7 | $ | 168.0 | $ | 54.7 | ||||||
|
Depreciation and amortization
|
80.3 | 69.8 | 10.5 | |||||||||
|
Stock compensation expense
|
15.1 | 11.8 | 3.3 | |||||||||
|
Deferred income taxes
|
1.9 | 2.7 | (0.8 | ) | ||||||||
|
Inventories and accounts payable
|
(75.3 | ) | (74.3 | ) | (1.0 | ) | ||||||
|
Prepaid expenses and other current assets
|
(17.8 | ) | (3.2 | ) | (14.6 | ) | ||||||
|
Accrued expenses
|
20.0 | 38.5 | (18.5 | ) | ||||||||
|
Income taxes payable
|
3.6 | 1.0 | 2.6 | |||||||||
|
Other, net
|
3.6 | 8.3 | (4.7 | ) | ||||||||
|
Net cash provided by operations
|
$ | 254.1 | $ | 222.6 | $ | 31.5 | ||||||
28
Cash flow from operating activities continues to provide the primary source of our liquidity. The increase in net cash provided by operations in fiscal 2011 compared with fiscal 2010 was primarily due to stronger net income and the impact of higher depreciation and amortization expense partially offset by a decrease in cash provided by accrued expenses and an increase in cash used for prepaids and other current assets. The increase in depreciation and amortization expense is related to store growth and capital expenditures associated with the construction of a new distribution center. The decrease in cash provided by accrued expenses was primarily due to timing of payments. The increase in
cash used for prepaids and other current assets is primarily due to timing of payments due from our vendors.
The $7.3 million increase in net cash provided by operations in fiscal 2010 over fiscal 2009 is primarily due to changes in the following operating activities (in millions):
|
2010
|
2009
|
Variance
|
||||||||||
|
Net income
|
$ | 168.0 | $ | 119.7 | $ | 48.3 | ||||||
|
Depreciation and amortization
|
69.8 | 66.3 | 3.5 | |||||||||
|
Stock compensation expense
|
11.8 | 12.1 | (0.3 | ) | ||||||||
|
Deferred income taxes
|
2.7 | (11.1 | ) | 13.8 | ||||||||
|
Inventories and accounts payable
|
(74.3 | ) | (29.9 | ) | (44.4 | ) | ||||||
|
Prepaid expenses and other current assets
|
(3.2 | ) | 11.2 | (14.4 | ) | |||||||
|
Accrued expenses
|
38.5 | 22.3 | 16.2 | |||||||||
|
Income taxes payable
|
1.0 | 7.8 | (6.8 | ) | ||||||||
|
Other, net
|
8.3 | 16.9 | (8.6 | ) | ||||||||
|
Net cash provided by operations
|
$ | 222.6 | $ | 215.3 | $ | 7.3 | ||||||
The increase in net cash provided by operations in fiscal 2010 compared with fiscal 2009 was primarily due to stronger net income and an increase in cash provided by accrued expenses partially offset by an increase in cash used for inventory, net of accounts payable, and a decrease in cash provided by prepaids and other current assets. Continued store growth has resulted in increased inventory balances. Accounts payable levels have decreased as a result of more timely payments in order to capture payment discounts offered by vendors and also as a result of an increase in cash held in our bank concentration account. The bank concentration account nets against the related book overdraft
included in accounts payable. The increase in cash provided by accrued expenses is a result of timing of payments as well as incentive compensation earned in fiscal 2010 but not paid until fiscal 2011. The decrease in cash provided by prepaids and other current assets is primarily due to timing of payments due from our vendors.
Investing Activities
Investing activities used $171.3 million, $112.1 million and $73.8 million in fiscal 2011, 2010 and 2009, respectively. The majority of this cash requirement relates to our capital expenditures. Our significant store expansion, coupled with distribution network expansion and other required investments in infrastructure, resulted in the following capital expenditures (in millions):
|
2011
|
2010
|
2009
|
||||||||||
|
Distribution center capacity and improvements
|
$ | 56.3 | $ | 22.5 | $ | 4.3 | ||||||
|
New and relocated stores and stores not yet opened
|
44.9 | 28.6 | 31.7 | |||||||||
|
Purchase of previously leased and self developed stores
|
32.2 | 11.6 | -- | |||||||||
|
Existing stores
|
18.7 | 17.6 | 18.4 | |||||||||
|
Information technology
|
12.3 | 14.9 | 17.6 | |||||||||
|
Corporate and other
|
1.8 | 1.3 | 2.0 | |||||||||
| $ | 166.2 | $ | 96.5 | $ | 74.0 | |||||||
The above table reflects 85 new stores and three relocations in fiscal 2011, compared to 74 new stores during fiscal 2010. We also purchased 12 of our existing lease stores during fiscal 2011 compared to four existing stores in fiscal 2010. The increase in capital expenditures for distribution center capacity in fiscal 2011 compared to fiscal 2010 is primarily due to the construction of a new distribution center in Franklin, Kentucky and the implementation of a new warehouse management system in two of our seven distribution centers.
Our long-term growth strategy anticipates continued geographic market expansion and further concentration within existing markets. We currently estimate that capital expenditures will range between $160 million and $170 million in fiscal 2012. We plan to open approximately five to 10 more stores in fiscal 2012 compared to 2011. While we do not plan to open a new distribution center in fiscal 2012, we estimate to spend approximately $30 million on our distribution center network, principally for the acquisition of a site to relocate our southeast distribution center as well as other improvements in the existing distribution centers such as conveyor systems and other infrastructure
enhancements. Additionally, we plan to invest approximately $30 million in information technology upgrades, including point-of-sale system enhancements, continued roll-out of the new warehouse management system to distribution centers, an upgrade of our e-commerce site, and store and store support center hardware refreshes.
29
Financing Activities
Financing activities used $163.2 million, $26.0 million, and $5.6 million in fiscal 2011, 2010 and 2009, respectively. The cash used by financing activities in fiscal 2011 was mainly the result of repurchases of common stock and quarterly cash dividends paid to stockholders, partially offset by increased net proceeds from issuance of common stock related to share-based compensation.
On April 28, 2011, the Company’s Board of Directors authorized a $600 million increase to the existing share repurchase program, bringing the total amount authorized to date under the program to an aggregate of $1 billion of common stock, exclusive of any fees, commissions, or other expenses related to such repurchases, through April 2015. The repurchases may be made from time to time on the open market or in privately negotiated transactions. The timing and amount of any shares repurchased under the program will depend on a variety of factors, including price, corporate and regulatory requirements, capital availability, and other market conditions. Repurchased shares
will be held in treasury. The program may be limited or terminated at any time without prior notice.
We repurchased approximately 3.1 million, 0.8 million and 0.4 million shares under the share repurchase program at a total cost of $180.0 million, $38.2 million and $15.3 million in fiscal 2011, 2010 and 2009, respectively. Repurchased shares are accounted for at cost and will be held in treasury for future issuance. As of December 31, 2011, we had remaining authorization under the share repurchase program of $562.9 million exclusive of any fees, commissions, or other expenses.
In the second quarter of fiscal 2011, we increased our quarterly dividend from $0.07 per share to $0.12 per share. We paid dividends totaling $30.9 million and $20.4 million in fiscal 2011 and 2010, respectively.
We believe that our existing cash balances, expected cash flow from future operations, borrowings available under the Senior Credit Facility, operating and capital leases and normal trade credit will be sufficient to fund our operations and our capital expenditure needs, including new store openings, store acquisitions, relocations and renovations, and distribution center capacity, over the next several years.
Significant Contractual Obligations and Commercial Commitments
The following table reflects our future obligations and commitments as of December 31, 2011 (in thousands):
|
Payment Due by Period
|
||||||||||||||
|
Total
Contractual
Obligations
|
Less than
1 year
|
1-3 years
|
4-5 years
|
More than
5 years
|
||||||||||
|
Operating leases
|
$ | 1,620,771 | $ | 188,311 | $ | 358,343 | $ | 318,176 | $ | 755,941 | ||||
|
Capital leases
(1)
|
2,511 | 146 | 292 | 292 | 1,781 | |||||||||
|
Purchase obligations
(2)
|
9,413 | 9,413 | -- | -- | -- | |||||||||
| $ | 1,632,695 | $ | 197,870 | $ | 358,635 | $ | 318,468 | $ | 757,722 | |||||
| (1) Capital lease obligations include related interest. |
| (2) The amounts for purchase obligations include commitments for construction of stores expected to be opened in fiscal 2012, as well as the purchase of a previously leased store. |
At December 31, 2011, there were $15.0 million outstanding letters of credit under the Senior Credit Facility and a $20.9 million outstanding letter of credit at a financial institution outside of the Senior Credit Facility which is collateralized by a time deposit classified as restricted cash. The letter of credit outside the Senior Credit Facility will automatically increase by $1.0 million in the first quarter of fiscal 2012 bringing the total outstanding letter of credit balance to $21.9 million.
Off-Balance Sheet Arrangements
Our off-balance sheet arrangements are limited to operating leases and outstanding letters of credit. The balances for these arrangements are discussed above. We typically lease buildings for retail stores and offices rather than acquiring these assets which allows us to utilize financial capital to operate the business rather than invest in fixed assets. Letters of credit allow us to purchase inventory, primarily sourced overseas, in a timely manner and support certain risk management programs.
30
Recent Accounting Pronouncements
In September 2011, the Financial Accounting Standards Board (“FASB”) issued Accounting Standards Update (“ASU”) No. 2011-08, “Intangibles — Goodwill and Other (Topic 350): Testing Goodwill for Impairment.” The ASU gives an entity the option in its annual goodwill impairment test to first assess revised qualitative factors to determine whether it is more likely than not (a likelihood of more than 50%) that the fair value of a reporting unit is less than its carrying amount (“qualitative assessment”). If it is more likely than not the fair value of a reporting unit is more than its carrying amount, an entity would not be required to perform the existing
two-step impairment test. The amendments to Topic 350 are effective for annual and interim goodwill impairment tests performed for fiscal years beginning after December 15, 2011. The Company does not believe the adoption of ASU 2011-08 will have a material effect on its consolidated financial statements.
Interest Rate Risk
We may be exposed to changes in interest rates primarily from the Senior Credit Facility. The Senior Credit Facility bears interest at either the bank’s base rate (3.25% at both December 31, 2011 and December 25, 2010) or LIBOR (0.30% and 0.26% at December 31, 2011 and December 25, 2010, respectively) plus an additional amount per annum adjusted quarterly (ranging from 0.40% to 1.00% at December 31, 2011 and 0.35% to 0.90% at December 25, 2010) based on our leverage ratio (0.50% and 0.40% at December 31, 2011 and December 25, 2010, respectively). We are also required to pay (quarterly in arrears) a commitment fee (ranging from 0.08% to 0.20% at December 31, 2011 and
0.06% to 0.18% at December 25, 2010) based on the daily average unused portion of the credit line (0.10% at December 31, 2011 and 0.08% December 25, 2010).
Seasonality and Weather
Our business is highly seasonal. Historically, our sales and profits have been the highest in the second and fourth fiscal quarters due to the sale of seasonal products. Unseasonable weather, excessive precipitation, drought, and early or late frosts may also affect our sales. We believe, however, that the impact of extreme weather conditions is somewhat mitigated by the geographic dispersion of our stores and our ability to effectively manage inventory allocation.
We experience our highest inventory and accounts payable levels during our first fiscal quarter for purchases of seasonal product in anticipation of the spring selling season and again during our third fiscal quarter in anticipation of the cold-weather selling season.
Purchase Price Volatility
Although we cannot determine the full effect of inflation and deflation on our operations, we believe our sales and results of operations are affected by both. We are subject to market risk with respect to the pricing of certain products and services, which include, among other items, steel, grain, petroleum, corn, cotton and other commodities as well as transportation services. Therefore, we may experience both inflationary and deflationary pressure on product cost, which may impact consumer demand and, as a result, sales and gross margin. Our strategy is to reduce or mitigate the effects of purchase price volatility principally by taking advantage of vendor incentive programs,
economies of scale from increased volume of purchases, adjusting retail prices and selectively buying from the most competitive vendors without sacrificing quality. Due to the competitive environment, such conditions could adversely impact our financial performance.
31
INDEX
TRACTOR SUPPLY COMPANY
| Page | |
| Reports of Independent Registered Public Accounting Firm | 33 |
| Consolidated Statements of Income for the fiscal years ended December 31, 2011, December 25, 2010 and December 26, 2009 | 35 |
| Consolidated Balance Sheets as of December 31, 2011 and December 25, 2010 | 36 |
| Consolidated Statements of Stockholders’ Equity for the fiscal years ended December 31, 2011, December 25, 2010 and December 26, 2009 | 37 |
| Consolidated Statements of Cash Flows for the fiscal years ended December 31, 2011, December 25, 2010 and December 26, 2009 | 38 |
32
Report of Independent Registered Public Accounting Firm
The Board of Directors and Stockholders of
Tractor Supply Company
We have audited Tractor Supply Company’s internal control over financial reporting as of December 31, 2011, based on criteria established in Internal Control—Integrated Framework issued by the Committee of Sponsoring Organizations of the Treadway Commission (the COSO criteria). Tractor Supply Company’s management is responsible for maintaining effective internal control over financial reporting, and for its assessment of the effectiveness of internal control over financial reporting included in the accompanying Management’s Report on Internal Control Over Financial Reporting. Our responsibility is to express an opinion on the Company’s internal control over financial reporting based
on our audit.
We conducted our audit in accordance with the standards of the Public Company Accounting Oversight Board (United States). Those standards require that we plan and perform the audit to obtain reasonable assurance about whether effective internal control over financial reporting was maintained in all material respects. Our audit included obtaining an understanding of internal control over financial reporting, assessing the risk that a material weakness exists, testing and evaluating the design and operating effectiveness of internal control based on the assessed risk, and performing such other procedures as we considered necessary in the circumstances. We believe that our audit provides a reasonable basis for our
opinion.
A company’s internal control over financial reporting is a process designed to provide reasonable assurance regarding the reliability of financial reporting and the preparation of financial statements for external purposes in accordance with generally accepted accounting principles. A company’s internal control over financial reporting includes those policies and procedures that (1) pertain to the maintenance of records that, in reasonable detail, accurately and fairly reflect the transactions and dispositions of the assets of the company; (2) provide reasonable assurance that transactions are recorded as necessary to permit preparation of financial statements in accordance with generally accepted
accounting principles, and that receipts and expenditures of the company are being made only in accordance with authorizations of management and directors of the company; and (3) provide reasonable assurance regarding prevention or timely detection of unauthorized acquisition, use, or disposition of the company’s assets that could have a material effect on the financial statements.
Because of its inherent limitations, internal control over financial reporting may not prevent or detect misstatements. Also, projections of any evaluation of effectiveness to future periods are subject to the risk that controls may become inadequate because of changes in conditions, or that the degree of compliance with the policies or procedures may deteriorate.
In our opinion, Tractor Supply Company maintained, in all material respects, effective internal control over financial reporting as of December 31, 2011, based on
the COSO criteria
.
We also have audited, in accordance with the standards of the Public Company Accounting Oversight Board (United States), the consolidated balance sheets of Tractor Supply Company as of December 31, 2011 and December 25, 2010 and the related consolidated statements of income, stockholders’ equity, and cash flows for each of the three fiscal years in the period ended December 31, 2011 and our report dated February 29, 2012 expressed an unqualified opinion thereon.
/s/ Ernst & Young LLP
Nashville, Tennessee
February 29, 2012
33
Report of Independent Registered Public Accounting Firm
The Board of Directors and Stockholders of
Tractor Supply Company
We have audited the accompanying consolidated balance sheets of Tractor Supply Company as of December 31, 2011 and December 25, 2010, and the related consolidated statements of income, stockholders' equity, and cash flows for each of the three fiscal years in the period ended December 31, 2011. These financial statements are the responsibility of the Company's management. Our responsibility is to express an opinion on these financial statements based on our audits.
We conducted our audits in accordance with the standards of the Public Company Accounting Oversight Board (United States). Those standards require that we plan and perform the audit to obtain reasonable assurance about whether the financial statements are free of material misstatement. An audit includes examining, on a test basis, evidence supporting the amounts and disclosures in the financial statements. An audit also includes assessing the accounting principles used and significant estimates made by management, as well as evaluating the overall financial statement presentation. We believe that our audits provide a reasonable basis for our opinion.
In our opinion, the financial statements referred to above present fairly, in all material respects, the consolidated financial position of Tractor Supply Company at December 31, 2011 and December 25, 2010, and the consolidated results of its operations and its cash flows for each of the three fiscal years in the period ended December 31, 2011, in conformity with U.S. generally accepted accounting principles.
We also have audited, in accordance with the standards of the Public Company Accounting Oversight Board (United States), Tractor Supply Company's internal control over financial reporting as of December 31, 2011, based on criteria established in Internal Control-Integrated Framework issued by the Committee of Sponsoring Organizations of the Treadway Commission and our report dated February 29, 2012 expressed an unqualified opinion thereon.
/s/ Ernst & Young LLP
Nashville, Tennessee
February 29, 2012
34
TRACTOR SUPPLY COMPANY
CONSOLIDATED STATEMENTS OF INCOME
(in thousands, except per share amounts)
|
Fiscal Year
|
||||||||||||
|
2011
(53 weeks)
|
2010
(52 weeks)
|
2009
(52 weeks)
|
||||||||||
|
Net sales
|
$ | 4,232,743 | $ | 3,638,336 | $ | 3,206,937 | ||||||
|
Cost of merchandise sold
|
2,825,871 | 2,434,671 | 2,165,048 | |||||||||
|
Gross margin
|
1,406,872 | 1,203,665 | 1,041,889 | |||||||||
|
Selling, general and administrative expenses
|
973,822 | 867,644 | 784,066 | |||||||||
|
Depreciation and amortization
|
80,347 | 69,797 | 66,258 | |||||||||
|
Operating income
|
352,703 | 266,224 | 191,565 | |||||||||
|
Interest expense, net
|
2,087 | 1,284 | 1,644 | |||||||||
|
Income before income taxes
|
350,616 | 264,940 | 189,921 | |||||||||
|
Income tax expense
|
127,876 | 96,968 | 70,176 | |||||||||
|
Net income
|
$ | 222,740 | $ | 167,972 | $ | 119,745 | ||||||
|
Net income per share – basic
|
$ | 3.10 | $ | 2.31 | $ | 1.66 | ||||||
|
Net income per share – diluted
|
$ | 3.01 | $ | 2.25 | $ | 1.63 | ||||||
|
Weighted average shares outstanding:
|
||||||||||||
|
Basic
|
71,777 | 72,597 | 71,981 | |||||||||
|
Diluted
|
73,921 | 74,686 | 73,297 | |||||||||
|
Dividends declared per common share outstanding
|
$ | 0.43 | $ | 0.28 | $ | -- | ||||||
The accompanying notes are an integral part of these financial statements.
35
TRACTOR SUPPLY COMPANY
CONSOLIDATED BALANCE SHEETS
(in thousands, except share and per share amounts)
|
December 31,
2011
|
December 25,
2010
|
|||||||
|
ASSETS
|
||||||||
|
Current assets:
|
||||||||
|
Cash and cash equivalents
|
$ | 176,965 | $ | 257,339 | ||||
|
Restricted cash
|
21,870 | -- | ||||||
|
Short-term investments
|
-- | 15,913 | ||||||
|
Inventories
|
830,819 | 736,520 | ||||||
|
Prepaid expenses and other current assets
|
51,728 | 33,945 | ||||||
|
Deferred income taxes
|
8,867 | -- | ||||||
|
Total current assets
|
1,090,249 | 1,043,717 | ||||||
|
Property and Equipment:
|
||||||||
|
Land
|
36,962 | 30,350 | ||||||
|
Buildings and improvements
|
459,703 | 380,228 | ||||||
|
Furniture, fixtures and equipment
|
312,708 | 256,369 | ||||||
|
Computer software and hardware
|
107,753 | 94,878 | ||||||
|
Construction in progress
|
19,309 | 20,961 | ||||||
| 936,435 | 782,786 | |||||||
|
Accumulated depreciation and amortization
|
(455,580 | ) | (386,997 | ) | ||||
|
Property and equipment, net
|
480,855 | 395,789 | ||||||
|
Goodwill
|
10,258 | 10,258 | ||||||
|
Deferred income taxes
|
-- | 5,750 | ||||||
|
Other assets
|
13,470 | 7,960 | ||||||
|
Total assets
|
$ | 1,594,832 | $ | 1,463,474 | ||||
|
LIABILITIES AND STOCKHOLDERS’ EQUITY
|
||||||||
|
Current liabilities:
|
||||||||
|
Accounts payable
|
$ | 266,409 | $ | 247,388 | ||||
|
Accrued employee compensation
|
48,261 | 34,576 | ||||||
|
Other accrued expenses
|
134,048 | 127,386 | ||||||
|
Current portion of capital lease obligations
|
33 | 91 | ||||||
|
Income taxes payable
|
11,874 | 8,269 | ||||||
|
Deferred income taxes
|
-- | 8,854 | ||||||
|
Total current liabilities
|
460,625 | 426,564 | ||||||
|
Capital lease obligations, less current maturities
|
1,284 | 1,316 | ||||||
|
Deferred income taxes
|
13,827 | -- | ||||||
|
Deferred rent
|
75,731 | 70,697 | ||||||
|
Other long-term liabilities
|
35,075 | 31,655 | ||||||
|
Total liabilities
|
586,542 | 530,232 | ||||||
|
Stockholders’ equity:
|
||||||||
|
Preferred Stock,
40,000 shares authorized; $1.00 par value; no shares issued
|
-- | -- | ||||||
|
Common Stock,
200,000,000 shares authorized at December 31, 2011, 100,000,000 shares authorized at December 25, 2010; $.008 par value; 80,400,855 shares issued and 71,265,469 shares outstanding at December 31, 2011 and 78,835,508 shares issued and 72,775,862 shares outstanding at December 25, 2010
|
643 | 631 | ||||||
|
Additional paid-in capital
|
298,426 | 235,283 | ||||||
|
Treasury stock,
at cost, 9,135,386 shares at December 31, 2011 and 6,059,646 shares at December 25, 2010
|
(437,373 | ) | (257,376 | ) | ||||
|
Retained earnings
|
1,146,594 | 954,704 | ||||||
|
Total stockholders’ equity
|
1,008,290 | 933,242 | ||||||
|
Total liabilities and stockholders’ equity
|
$ | 1,594,832 | $ | 1,463,474 | ||||
The accompanying notes are an integral part of these financial statements.
36
TRACTOR SUPPLY COMPANY
CONSOLIDATED STATEMENTS OF STOCKHOLDERS’ EQUITY
(in thousands, except share amounts)
|
Common
Stock
|
Additional
Paid-in
Capital
|
Treasury
Stock
|
Retained
Earnings
|
Total
Stockholders’
Equity
|
||||||||||||||||
|
Stockholders’ equity at December 27, 2008
|
$ | 615 | $ | 167,757 | $ | (203,915 | ) | $ | 687,342 | $ | 651,799 | |||||||||
|
Issuance of common stock under employee stock purchase plan (101,470 shares)
|
1 | 1,630 | 1,631 | |||||||||||||||||
|
Exercise of stock options (755,348 shares) and restricted stock units (10,896 shares)
|
6 | 4,342 | 4,348 | |||||||||||||||||
|
Stock compensation
|
12,130 | 12,130 | ||||||||||||||||||
|
Tax benefit of stock options exercised
|
4,787 | 4,787 | ||||||||||||||||||
|
Repurchase of common stock (419,034 shares)
|
(3 | ) | 3 | (15,289 | ) | (15,289 | ) | |||||||||||||
|
Net income
|
119,745 | 119,745 | ||||||||||||||||||
|
Stockholders’ equity at December 26, 2009
|
619 | 190,649 | (219,204 | ) | 807,087 | 779,151 | ||||||||||||||
|
Issuance of common stock under employee stock purchase plan (74,788 shares)
|
1 | 1,739 | 1,740 | |||||||||||||||||
|
Exercise of stock options (1,550,077 shares) and restricted stock units (90,203 shares)
|
13 | 22,125 | 22,138 | |||||||||||||||||
|
Stock compensation
|
11,771 | 11,771 | ||||||||||||||||||
|
Tax benefit of stock options exercised
|
9,780 | 9,780 | ||||||||||||||||||
|
Restricted stock units withheld for taxes
|
(783 | ) | (783 | ) | ||||||||||||||||
|
Repurchase of common stock (826,311 shares)
|
(2 | ) | 2 | (38,172 | ) | (38,172 | ) | |||||||||||||
|
Dividends paid
|
(20,355 | ) | (20,355 | ) | ||||||||||||||||
|
Net income
|
167,972 | 167,972 | ||||||||||||||||||
|
Stockholders’ equity at December 25, 2010
|
631 | 235,283 | (257,376 | ) | 954,704 | 933,242 | ||||||||||||||
|
Issuance of common stock under employee stock purchase plan (53,333 shares)
|
2,337 | 2,337 | ||||||||||||||||||
|
Exercise of stock options (1,444,007 shares) and restricted stock units (68,007 shares)
|
12 | 29,111 | 29,123 | |||||||||||||||||
|
Stock compensation
|
15,041 | 15,041 | ||||||||||||||||||
|
Tax benefit of stock options exercised
|
17,769 | 17,769 | ||||||||||||||||||
|
Restricted stock units withheld for taxes
|
(1,115 | ) | (1,115 | ) | ||||||||||||||||
|
Repurchase of common stock (3,075,740 shares)
|
(179,997 | ) | (179,997 | ) | ||||||||||||||||
|
Dividends paid
|
(30,850 | ) | (30,850 | ) | ||||||||||||||||
|
Net income
|
222,740 | 222,740 | ||||||||||||||||||
|
Stockholders’ equity at December 31, 2011
|
$ | 643 | $ | 298,426 | $ | (437,373 | ) | $ | 1,146,594 | $ | 1,008,290 | |||||||||
The accompanying notes are an integral part of these financial statements.
37
TRACTOR SUPPLY COMPANY
CONSOLIDATED STATEMENTS OF CASH FLOWS
(in thousands)
|
Fiscal Year
|
||||||||||||
|
2011
(53 weeks)
|
2010
(52 weeks)
|
2009
(52 weeks)
|
||||||||||
|
Cash flows from operating activities
:
|
||||||||||||
|
Net income
|
$ | 222,740 | $ | 167,972 | $ | 119,745 | ||||||
|
Adjustments to reconcile net income to net cash provided by operating activities:
|
||||||||||||
|
Depreciation and amortization
|
80,347 | 69,797 | 66,258 | |||||||||
|
Loss on disposition of property and equipment
|
955 | 1,062 | 213 | |||||||||
|
Stock compensation expense
|
15,041 | 11,771 | 12,130 | |||||||||
|
Deferred income taxes
|
1,856 | 2,690 | (11,139 | ) | ||||||||
|
Change in assets and liabilities:
|
||||||||||||
|
Inventories
|
(94,299 | ) | (60,054 | ) | (4,745 | ) | ||||||
|
Prepaid expenses and other current assets
|
(17,783 | ) | (3,201 | ) | 11,164 | |||||||
|
Accounts payable
|
19,021 | (14,247 | ) | (25,193 | ) | |||||||
|
Accrued employee compensation
|
13,685 | 11,851 | 12,476 | |||||||||
|
Other accrued expenses
|
6,312 | 26,691 | 9,838 | |||||||||
|
Income taxes payable
|
3,605 | 1,004 | 7,801 | |||||||||
|
Other
|
2,664 | 7,272 | 16,769 | |||||||||
|
Net cash provided by operating activities
|
254,144 | 222,608 | 215,317 | |||||||||
|
Cash flows from investing activities
:
|
||||||||||||
|
Capital expenditures
|
(166,156 | ) | (96,511 | ) | (73,974 | ) | ||||||
|
Proceeds from sale of property and equipment
|
752 | 313 | 97 | |||||||||
|
Restricted cash deposits
|
(21,870 | ) | -- | -- | ||||||||
|
Purchases of short-term investments
|
-- | (15,913 | ) | -- | ||||||||
|
Proceeds from sale of short-term investments
|
15,913 | -- | -- | |||||||||
|
Net cash used in investing activities
|
(171,361 | ) | (112,111 | ) | (73,877 | ) | ||||||
|
Cash flows from financing activities
:
|
||||||||||||
|
Borrowings under revolving credit agreement
|
-- | -- | 274,033 | |||||||||
|
Repayments under revolving credit agreement
|
-- | -- | (274,033 | ) | ||||||||
|
Excess tax benefit of stock options exercised
|
17,435 | 9,815 | 4,280 | |||||||||
|
Principal payments under capital lease obligations
|
(90 | ) | (392 | ) | (548 | ) | ||||||
|
Restricted stock units withheld to satisfy tax obligations
|
(1,115 | ) | (783 | ) | -- | |||||||
|
Repurchase of common stock
|
(179,997 | ) | (38,172 | ) | (15,289 | ) | ||||||
|
Net proceeds from issuance of common stock
|
31,460 | 23,878 | 5,979 | |||||||||
|
Cash dividends paid to stockholders
|
(30,850 | ) | (20,355 | ) | -- | |||||||
|
Net cash used in financing activities
|
(163,157 | ) | (26,009 | ) | (5,578 | ) | ||||||
|
Net (decrease) increase in cash and cash equivalents
|
(80,374 | ) | 84,488 | 135,862 | ||||||||
|
Cash and cash equivalents at beginning of year
|
257,339 | 172,851 | 36,989 | |||||||||
|
Cash and cash equivalents at end of year
|
$ | 176,965 | $ | 257,339 | $ | 172,851 | ||||||
|
Supplemental disclosures of cash flow information:
|
||||||||||||
|
Cash paid during the year for:
|
||||||||||||
|
Interest
|
$ | 614 | $ | 305 | $ | 838 | ||||||
|
Income taxes
|
103,630 | 82,821 | 66,888 | |||||||||
|
Accruals for construction in progress
|
(350 | ) | -- | -- | ||||||||
The accompanying notes are an integral part of these financial statements.
38
Nature of Business
Tractor Supply Company (the “Company”, “we”, “us” and/or “our”) is the largest operator of retail farm and ranch stores in the United States. We are focused on supplying the lifestyle needs of recreational farmers and ranchers and those who enjoy the rural lifestyle, as well as tradesmen and small businesses. Stores are located in towns outlying major metropolitan markets and in rural communities. At December 31, 2011, we operated a total of 1,085 retail farm and ranch stores in 44 states and also offered a number of products online at
TractorSupply.com
.
Fiscal Year
Our fiscal year ends on the last Saturday of the calendar year and includes 52 or 53 weeks. The fiscal year ended December 31, 2011 consisted of 53 weeks. The fiscal years ended December 25, 2010 and December 26, 2009 consisted of 52 weeks.
Principles of Consolidation
The accompanying consolidated financial statements include the accounts of the Company and its subsidiaries. All intercompany accounts and transactions have been eliminated.
Management Estimates
Our preparation of consolidated financial statements in conformity with accounting principles generally accepted in the United States inherently requires estimates and assumptions by us that affect the reported amounts of assets and liabilities, revenues and expenses and related disclosures. Actual results could differ from those estimates.
Significant estimates and assumptions by management primarily impact the following key financial statement areas:
Inventory Valuation
Inventory Impairment Risk
We identify potentially excess and slow-moving inventory by evaluating turn rates, historical and expected future sales trends, age of merchandise, overall inventory levels, current cost of inventory and other benchmarks. The estimated inventory valuation reserve to recognize any impairment in value (i.e. an inability to realize the full carrying value) is based on our aggregate assessment of these valuation indicators under prevailing market conditions and current merchandising strategies. We do not believe our merchandise inventories are subject to significant risk of obsolescence in the near term. However, changes in market conditions or consumer purchasing patterns could result in the
need for additional reserves.
Shrinkage
We perform physical inventories at each store at least once a year, and we have established reserves for estimating inventory shrinkage between physical inventory counts. The reserve is established by assessing the chain-wide average shrinkage experience rate, applied to the related periods’ sales volumes. Such assessments are updated on a regular basis for the most recent individual store experiences. The estimated store inventory shrink rate is based on historical experience. We believe historical rates are a reasonably accurate reflection of future trends.
Vendor Support
We receive funding from substantially all of our significant merchandise vendors for the promotion of our brand as well as the sale of their products through a variety of programs and arrangements, including guaranteed funding and volume rebate programs. The amounts received are subject to terms of vendor agreements, which have varying expiration dates ranging in duration from several months to a few years. Many agreements are negotiated annually and are based on expected annual purchases of the vendor’s product. Vendor funding is initially deferred as a reduction of the purchase price of inventory and then recognized as a reduction of cost of merchandise as the related
inventory is sold.
During interim periods, the amount of expected funding is estimated based upon initial commitments, as well as anticipated purchase levels with applicable vendors. The estimated purchase volume and related vendor funding is based on our current knowledge of inventory levels, sales trends and expected customer demand, as well as planned new store openings and relocations. Although we believe we can reasonably estimate purchase volume and related vendor funding at interim periods, it is possible that actual year-end results could differ significantly from the previously estimated amounts.
39
Freight
We incur various types of transportation and delivery costs in connection with inventory purchases and distribution. Such costs are included as a component of the overall cost of inventories (on an aggregate basis) and recognized as a component of cost of merchandise sold as the related inventory is sold.
Self-Insurance Reserves
We self-insure a significant portion of our employee medical insurance, workers’ compensation and general liability insurance plans. We have stop-loss insurance policies to protect from individual losses over specified dollar values. The full extent of certain claims, especially workers’ compensation and general liability claims, may not become fully determined for several years. Therefore, we estimate potential obligations for liabilities that have been incurred but not yet reported based upon historical data and experience, including actuarial calculations. Although we believe the reserves established for these obligations are reasonably estimated, any significant increase in the number of
claims or costs associated with claims made under these plans could have a material adverse effect on our financial results. At December 31, 2011, we had recorded net insurance reserves of $31.2 million compared to $29.0 million at December 25, 2010.
Sales Tax Audit Reserve
A portion of our sales are to tax-exempt customers. We obtain exemption information as a necessary part of each tax-exempt transaction. Many of the states in which we conduct business will perform audits to verify our compliance with applicable sales tax laws. The business activities of our customers and the intended use of the unique products sold by us create a challenging and complex compliance environment. These circumstances also create some risk that we could be challenged as to the accuracy of our sales tax compliance. While we believe we reasonably enforce sales tax compliance with our customers and endeavor to fully comply with all applicable sales
tax regulations, there can be no assurance that we, upon final completion of such audits, will not have a significant liability for disallowed exemptions.
We review our past audit experience and assessments with applicable states to continually determine if we have potential exposure for non-compliance. Any estimated liability is based on an initial assessment of compliance risk and our historical experience with each state. We continually reassess the exposure based on historical audit results, changes in policies, preliminary and final assessments made by state sales tax auditors, and additional documentation that may be provided to reduce the assessment. The reserve for these tax audits can fluctuate depending on numerous factors, including the complexity of agricultural-based exemptions, the ambiguity in state tax
regulations, the number of ongoing audits and the length of time required to settle with the state taxing authorities.
Tax Contingencies
Our income tax returns are periodically audited by U.S. federal and state tax authorities. These audits include questions regarding our tax filing positions, including the timing and amount of deductions and the allocation of income among various tax jurisdictions. At any time, multiple tax years are subject to audit by the various tax authorities. In evaluating the exposures associated with our various tax filing positions, we record a liability for unrecognized tax benefits resulting from uncertain tax positions taken or expected to be taken in a tax return. A number of years may elapse before a particular matter, for which we have established a reserve, is audited and fully resolved or
clarified. We recognize the effect of income tax positions only if those positions are more likely than not of being sustained. Recognized income tax positions are measured at the largest amount that is greater than 50% likely of being realized. Changes in recognition or measurement are reflected in the period in which the change in judgment occurs. We adjust our tax contingencies reserve and income tax provision in the period in which actual results of a settlement with tax authorities differs from our established reserve, the statute of limitations expires for the relevant tax authority to examine the tax position or when more information becomes available.
Our tax contingencies reserve contains uncertainties because management is required to make assumptions and to apply judgment to estimate the exposures associated with our various filing positions and whether or not the minimum requirements for recognition of tax benefits have been met.
Our effective income tax rate is also affected by changes in tax law, the tax jurisdiction of new stores or business ventures, the level of earnings and the results of tax audits.
40
Impairment of Long-Lived Assets
Long-lived assets other than goodwill and indefinite-lived intangible assets, which are separately tested for impairment, are evaluated for impairment whenever events or changes in circumstances indicate that the carrying value may not be recoverable.
When evaluating long-lived assets for potential impairment, we first compare the carrying value of the asset to the asset’s estimated undiscounted future cash flows. The evaluation for long-lived assets is performed at the lowest level of identifiable cash flows, which is generally the individual store level. The significant assumptions used to determine estimated undiscounted cash flows include cash inflows and outflows directly resulting from the use of those assets in operations, including margin on net sales, payroll and related items, occupancy costs, insurance allocations and other costs to operate a store. If the estimated future cash flows are less than the carrying value of
the asset, we calculate an impairment loss. The impairment loss calculation compares the carrying value of the asset to the asset’s estimated fair value, which may be based on an estimated future cash flow model. We recognize an impairment loss if the amount of the asset’s carrying value exceeds the asset’s estimated fair value. If we recognize an impairment loss, the adjusted carrying amount of the asset becomes its new cost basis. For a depreciable long-lived asset, the new cost basis will be depreciated (amortized) over the remaining estimated useful life of that asset.
In fiscal 2011 and 2010, the Company recognized impairment charges of $0.5 million and $1.1 million related to the write-off of certain capitalized software development costs. These assets were not expected to provide any future benefit to the Company and were determined to have no significant fair value. During fiscal year 2009 impairment charges of $0.8 million were recorded representing the amount required to write-down the carrying value of certain leasehold improvements to the assets’ estimated fair value. Impairment charges are included in selling, general and administrative (“SG&A”) expenses in the Consolidated Statements of Income.
Revenue Recognition and Sales Returns
We recognize revenue at the time the customer takes possession of merchandise. If we receive payment before completion of our customer obligations (as per our special order and layaway programs), the revenue is deferred until the sale is complete.
We are required to collect certain taxes and fees from customers on behalf of government agencies and remit such collections to the applicable governmental entity on a periodic basis. These taxes are collected from customers at the time of purchase, but are not included in net sales. We record a liability upon collection from the customer and relieve the liability when payments are remitted to the applicable governmental agency.
We estimate a liability for sales returns based on a rolling average of historical return trends, and we believe that our estimate for sales returns is an accurate reflection of future returns associated with past sales. However, as with any estimate, refund activity may vary from estimated amounts. At December 31, 2011 we had a liability of $3.7 million reserved for sales returns, compared to $3.0 million at December 25, 2010.
We recognize revenue when a gift card or merchandise return card is redeemed by the customer and recognize income when the likelihood of the gift card or merchandise return card being redeemed by the customer is remote (referred to as “breakage”). The gift card and merchandise return card breakage rate is based upon historical redemption patterns and income is recognized for unredeemed gift card and merchandise return cards in proportion to those historical redemption patterns. We recognized breakage income of $1.5 million, $1.6 million and $1.1 million in fiscal 2011, 2010 and 2009, respectively.
Cost of Merchandise Sold
Cost of merchandise sold includes the total cost of products sold; freight expenses associated with moving merchandise inventories from our vendors to our distribution centers, from our distribution centers to our retail stores, and from one distribution center to another; vendor support; damaged, junked or defective product; cash discounts from payments to merchandise vendors; and adjustments for shrinkage (physical inventory losses), lower of cost or market valuation, slow moving product and excess inventory quantities.
41
Selling, General and Administrative Expenses
SG&A expenses include payroll and benefit costs for retail, distribution center and corporate employees; occupancy costs of retail, distribution center and corporate facilities; advertising; tender costs, including bank charges and costs associated with credit and debit card interchange fees; outside service fees; and other administrative costs, such as computer maintenance, supplies, travel and lodging.
Advertising Costs
Advertising costs consist of expenses incurred in connection with newspaper circulars and direct mail, as well as limited television, radio and other promotions. Costs are expensed when incurred with the exception of television advertising and circular and direct mail promotions, which are expensed upon first showing. Advertising expenses for fiscal 2011, 2010 and 2009 were approximately $56.0 million, $48.6 million and $45.7 million, respectively.
Prepaid advertising costs were approximately $0.3 million and $0.1 million at December 31, 2011 and December 25, 2010, respectively.
Warehousing and Distribution Center Costs
Costs incurred at our distribution centers for receiving, warehousing and preparing product for delivery are expensed as incurred and are included in SG&A expenses in the Consolidated Statements of Income. Because the Company does not include these costs in cost of sales, the Company’s gross margin may not be comparable to other retailers that include these costs in the calculation of gross margin. Distribution center costs for fiscal 2011, 2010 and 2009 were approximately $76.8 million, $64.4 million and $59.0 million, respectively.
Pre-opening Costs
Non-capital expenditures incurred in connection with opening new store and distribution centers, primarily payroll and rent, are expensed as incurred. Preopening costs were approximately $7.3 million, $7.1 million and $7.5 million in 2011, 2010 and 2009, respectively.
Share-Based Compensation
We have share-based compensation plans, which include incentive and non-qualified stock options, restricted stock units, and an employee stock purchase plan, covering certain members of management and non-employee directors.
We estimate the fair value of our stock option awards at the date of grant utilizing a
Black-Scholes
option pricing model. The
Black-Scholes
option valuation model was developed for use in estimating the fair value of short-term traded options that have no vesting restrictions and are fully transferable. However, key assumptions used in the
Black-Scholes
model are adjusted to incorporate the unique characteristics of our stock option awards. Option pricing models and generally accepted valuation techniques require management to make subjective
assumptions including expected stock price volatility, expected dividend yield, risk-free interest rate and expected life. We rely on historical volatility trends to estimate future volatility assumptions. The risk-free interest rates used were actual U.S. Treasury Constant Maturity rates for bonds matching the expected term of the option on the date of grant. The expected life of the option on the date of grant was estimated based on our historical experience for similar options.
In addition to the key assumptions used in the
Black-Scholes
model, the estimated forfeiture rate at the time of valuation (which is based on historical experience for similar options) is a critical assumption, as it reduces expense ratably over the vesting period. We adjust this estimate periodically, based on the extent to which actual forfeitures differ, or are expected to differ, from the previous estimate.
We believe our estimates are reasonable in the context of historical experience. Future results will depend on, among other matters, levels of share-based compensation granted in the future, actual forfeiture rates and the timing of option exercises.
Depreciation and Amortization
Depreciation includes expenses related to all retail, distribution center and corporate assets. Amortization includes expenses related to definite-lived intangible assets.
42
Income Taxes
We use the asset and liability method to account for income taxes whereby deferred tax assets and liabilities are determined based on differences between the financial carrying amounts of assets and liabilities and their tax bases. Deferred tax assets and liabilities are measured using the enacted tax rates and laws that are anticipated to be in effect when temporary differences reverse or are settled. The effect of a tax rate change is recognized in the period in which the law is enacted in the provision for income taxes. We record a valuation allowance when it is more likely than not that a deferred tax asset will not be realized.
Net Income Per Share
Basic earnings per share is calculated by dividing net income by the weighted average number of shares outstanding during the period. Diluted EPS is calculated by dividing net income by the weighted average diluted shares outstanding. Diluted shares are computed using the treasury stock method for stock options and restricted stock units.
Comprehensive Income
The Company’s comprehensive income is equal to net income in fiscal 2011, 2010 and 2009.
Cash and Cash Equivalents
Temporary cash investments, with a maturity of three months or less when purchased, are considered to be cash equivalents. The majority of payments due from banks for customer credit card transactions settle within 24-48 hours and are accordingly classified as cash and cash equivalents.
Sales generated through our private label credit cards are not reflected as accounts receivable. Under an agreement with Citi Cards, a division of Citigroup (“Citigroup”), consumer and business credit is extended directly to customers by Citigroup. All credit program and related services are performed and controlled directly by Citigroup. Payments due from Citigroup are classified as cash and cash equivalents as they settle within 24-48 hours and are accordingly classified as cash and cash equivalents.
Restricted Cash
At December 31, 2011, the Company’s restricted cash consisted of a $21.9 million time deposit held as collateral for a letter of credit for certain insurance policies through April 1, 2012.
Short-term Investments
At December 25, 2010, the Company’s short-term held-to-maturity investments consisted of a $15.9 million one-year U.S. Treasury note held as collateral for a letter of credit. The note matured on May 11, 2011. We had no short-term investments at December 31, 2011.
Fair Value
Fair value is defined as the price that would be received to sell an asset or paid to transfer a liability (an exit price) in an orderly transaction between market participants on the measurement date. The Company uses a three-tier fair value hierarchy, which prioritizes the inputs used in measuring fair value. These tiers include: Level 1, defined as observable inputs such as quoted prices in active markets; Level 2, defined as inputs other than quoted prices in active markets that are either directly or indirectly observable; and Level 3, defined as unobservable inputs in which little or no market data exists, therefore requiring an entity to develop its own assumptions.
Financial Instruments Not Carried at Fair Value
Our financial instruments consist of cash and cash equivalents, restricted cash, short-term investments, short-term receivables, trade payables and long-term debt instruments. The carrying values of cash and cash equivalents, restricted cash, short-term receivables and trade payables approximate current fair value. We had no borrowings under the revolving credit facility at December 31, 2011 and December 25, 2010.
The short-term investment note is classified as Level 1 as these types of investments trade with sufficient frequency and volume to enable us to obtain pricing information on an ongoing basis. This investment is stated at amortized cost, which approximates fair value.
43
Inventories
Inventories are stated at the lower of cost, as determined by the average cost method, or market. Inventory cost consists of the direct cost of merchandise including freight. Inventories are net of shrinkage, obsolescence, other valuations and vendor allowances.
Property and Equipment
Property and equipment are carried at cost. Depreciation is recorded using the straight-line method over the estimated useful lives of the assets. Improvements to leased premises are amortized using the straight-line method over the initial term of the lease or the useful life of the improvement, whichever is less. Leasehold improvements added late in the lease term are amortized over the term of the lease (including the first renewal option, if the renewal is reasonably assured) or the useful life of the improvement, whichever is less. The following estimated useful lives are generally applied:
|
Life
|
|
|
Buildings
|
30 – 35 years
|
|
Leasehold and building improvements
|
5 – 35 years
|
|
Furniture, fixtures and equipment
|
5 – 10 years
|
|
Computer software and hardware
|
3 – 5 years
|
We entered into an agreement with various governmental entities in the state of Kentucky to implement a tax abatement plan related to a new distribution center in Franklin, Kentucky (Simpson County). The tax abatement plan provides for abatement of real property taxes for up to thirty years with the exception of taxes levied by the Simpson County Board of Education. Under the plan, legal title to our real property was transferred to the City of Franklin, Kentucky (“Franklin”) effective December 2011, and Franklin issued bonds with a principal amount of $51.8 million. The bonds were issued to the Company, so no cash was exchanged. Franklin then leased the real
property back to the Company. The lease payments are equal to the amount of the payments on the bonds. At any time, we have the option to purchase the real property by paying off the bonds, plus $1. Due to the form of the transaction, we have not recorded the bond or the lease obligation associated with the sale lease-back transaction. The original cost of the Company’s property and equipment is recorded on the balance sheet and is being depreciated over its estimated useful life.
Capitalized Software Costs
The Company capitalizes certain costs related to the acquisition and development of software and amortizes these costs using the straight-line method over the estimated useful life of the software, which is three to five years. Computer software consists primarily of third-party software purchased for internal use. A subsequent addition, modification or upgrade to internal-use software is capitalized to the extent that it enhances the software’s functionality or extends its useful life. These costs are included in computer software and hardware in the accompanying Consolidated Balance Sheets. Certain software costs not meeting the criteria for capitalization are
expensed as incurred.
Goodwill
Goodwill and intangible assets with indefinite lives are not amortized. We evaluate goodwill for impairment annually and whenever events or changes in circumstances indicate the carrying value of the goodwill may not be recoverable. We complete our impairment evaluation by performing internal valuation analyses and considering other publicly available market information, as appropriate.
The test for goodwill impairment is a two step process. The first step of the goodwill impairment test, used to identify the potential for impairment, compares the fair value of a reporting unit with the carrying value of its net assets, including goodwill. If the fair value of the reporting unit is less than the carrying value of the reporting unit, the second step of the goodwill impairment test is performed to measure the amount of impairment loss to be recorded, if any. The second step, if required, would compare the implied fair value of goodwill with the current carrying amount of goodwill. If the implied fair value of goodwill is less than the carrying value, an
impairment charge would be recorded as a charge to our operations.
In the fourth quarter of fiscal 2011, we completed our annual impairment testing of goodwill and determined there was no impairment. We determined that the fair value of the reporting unit (including goodwill) was in excess of the carrying value of the reporting unit and as such, the second step was not necessary. In reaching this conclusion, the fair value of the reporting unit was determined based on a market approach. Under the market approach, the fair value is based on observed market prices.
44
Store Closing Costs
We regularly evaluate the performance of our stores and periodically close those that are under-performing. We record a liability for a cost associated with an exit or disposal activity when the liability is incurred, usually in the period the store closes. Store closing costs were not significant to results of operations for any of the fiscal years presented.
Leases
Assets under capital leases are amortized in accordance with our normal depreciation policy for owned assets or over the lease term, if shorter, and the related charge to operations is included in depreciation expense in the Consolidated Statements of Income.
Certain operating leases include rent increases during the initial lease term. For these leases, we recognize the related rental expense on a straight-line basis over the term of the lease (which includes the pre-opening period of construction, renovation, fixturing and merchandise placement) and record the difference between the expense charged to operations and amounts paid as a deferred rent liability.
We occasionally receive reimbursements from landlords to be used towards improving the related store to be leased. Leasehold improvements are recorded at their gross costs including items reimbursed by landlords. Related reimbursements are amortized on a straight-line basis as a reduction of rent expense over the initial lease term.
Share-based compensation includes stock option and restricted stock unit awards and certain transactions under our Employee Stock Purchase Plan (the “ESPP”). Share-based compensation expense is recognized based on grant date fair value of all stock options and restricted stock unit awards plus a discount on shares purchased by employees as a part of the ESPP. The discount under the ESPP represents the difference between the grant date market value and the employee’s purchase price.
There were no significant modifications to the Company's share-based compensation plans during fiscal 2011.
Share-based compensation expense including changes in expense for modifications of awards was $15.0 million, $11.8 million and $12.1 million for fiscal 2011, 2010 and 2009, respectively.
Stock Options
Under our 2009 Stock Incentive Plan, options may be granted to officers, non-employee directors and other employees. The per share exercise price of options granted shall not be less than the fair market value of the stock on the date of grant and such options will expire no later than ten years from the date of grant. Vesting of options commences at various anniversary dates following the dates of grant.
Under the terms of the 2009 Stock Incentive Plan, a maximum of 6,200,000 shares are available for grant as stock options or other awards. At December 31, 2011, we had 4,587,083 shares available for future equity awards under the Company’s 2009 Stock Incentive Plan.
The fair value is separately estimated for each option grant. The fair value of each option is recognized as compensation expense ratably over the vesting period. We have estimated the fair value of all stock option awards as of the date of the grant by applying a
Black-Scholes
pricing valuation model. The application of this valuation model involves assumptions that are judgmental and highly sensitive in the determination of compensation expense. The ranges of key assumptions used in determining the fair value of options granted during fiscal 2011, 2010 and 2009, as well as a summary of the methodology applied to
develop each assumption, are as follows:
45
|
Fiscal Year
|
||||||||
|
2011
|
2010
|
2009
|
||||||
|
Expected price volatility
|
38.0 – 38.7 | % | 38.5 – 38.9 | % | 39.3 – 54.0 | % | ||
|
Risk-free interest rate
|
0.9 – 2.4 | % | 1.0 – 2.7 | % | 0.6 – 2.5 | % | ||
|
Weighted average expected lives (in years)
|
4.7 – 5.6 | 4.8 – 5.8 | 4.7 – 5.6 | |||||
|
Forfeiture rate
|
5.5 – 7.6 | % | 5.4 – 7.7 | % | 1.4 – 8.0 | % | ||
|
Dividend yield
|
0.8 – 1.0 | % | 0.0 – 1.0 | % | 0.0 | % | ||
| Expected Price Volatility — This is a measure of the amount by which a price has fluctuated or is expected to fluctuate. We use actual historical changes in the market value of the stock to calculate expected price volatility because we believe that this is the best indicator of future volatility. We calculate daily market value changes from the date of grant over a past period generally representative of the expected life of the options to determine volatility. An increase in the expected volatility will increase compensation expense. |
| Risk-Free Interest Rate — This is the U.S. Treasury Constant Maturity rate over a term equal to the expected life of the option. An increase in the risk-free interest rate will increase compensation expense. |
| Weighted Average Expected Lives — This is the period of time over which the options granted are expected to remain outstanding and is based on historical experience. Options granted generally have a maximum term of ten years. An increase in the expected life will increase compensation expense. |
| Forfeiture Rate — This is the estimated percentage of options granted that are expected to be forfeited or cancelled before becoming fully vested. This estimate is based on historical experience. An increase in the forfeiture rate will decrease compensation expense |
| Dividend Yield — This is the estimated dividend yield for the weighted average expected life of the option granted. An increase in the dividend yield will decrease compensation expense |
We issue new shares for options when exercised. A summary of stock option activity is as follows:
|
Options
|
Weighted
Average Exercise
Price
|
Weighted Average Fair
Value
|
Weighted Average
Remaining
Contractual Term
|
Aggregate Intrinsic Value
(
in thousands)
|
||||||||
|
Outstanding December 27, 2008
|
5,108,014 | $ | 17.07 | 6.2 | $ | 19,296 | ||||||
|
Granted
|
1,126,132 | 17.28 | $ | 6.48 | ||||||||
|
Exercised
|
(755,348 | ) | 5.83 | |||||||||
|
Canceled
|
(177,954 | ) | 23.01 | |||||||||
|
Outstanding December 26, 2009
|
5,300,844 | $ | 18.53 | 6.4 | $ | 47,413 | ||||||
|
Granted
|
908,728 | 26.70 | $ | 10.32 | ||||||||
|
Exercised
|
(1,550,077 | ) | 14.28 | |||||||||
|
Canceled
|
(144,638 | ) | 21.82 | |||||||||
|
Outstanding December 25, 2010
|
4,514,857 | $ | 21.52 | 6.7 | $ | 121,350 | ||||||
|
Granted
|
546,655 | 52.18 | $ | 17.73 | ||||||||
|
Exercised
|
(1,444,007 | ) | 20.17 | |||||||||
|
Canceled
|
(65,630 | ) | 33.29 | |||||||||
|
Outstanding December 31, 2011
|
3,551,875 | $ | 26.57 | 6.5 | $ | 154,782 | ||||||
|
Exercisable at December 31, 2011
|
2,144,139 | $ | 21.70 | 5.4 | $ | 103,886 | ||||||
The aggregate intrinsic values in the table above represents the total difference between our closing stock price at each year-end and the option exercise price, multiplied by the number of in-the-money options at each year-end. As of December 31, 2011, total unrecognized compensation expense related to non-vested stock options is $10.1 million with a weighted average expense recognition period of 1.3 years.
There were no material modifications to options in 2011, 2010 or 2009.
46
Other information relative to option activity during fiscal 2011, 2010 and 2009 is as follows (in thousands):
|
2011
|
2010
|
2009
|
||||||||||
|
Total fair value of stock options vested
|
$ | 7,590 | $ | 8,417 | $ | 10,225 | ||||||
|
Total intrinsic value of stock options exercised
|
$ | 59,712 | $ | 31,388 | $ | 12,742 | ||||||
Restricted Stock Units
We issue shares for restricted stock unit awards once vesting occurs and related restrictions lapse. The units vest over a one to three-year term; some plan participants have elected to defer receipt of shares of common stock upon vesting of restricted stock units, and as a result, shares are not issued until a later date. The status of restricted stock units is presented below:
|
Restricted Stock Units
|
Shares
|
Weighted Average Grant Date
Fair Value
|
||||||
|
Restricted at December 27, 2008
|
277,406 | $ | 20.83 | |||||
|
Granted
|
308,102 | 17.50 | ||||||
|
Exercised
|
(10,896 | ) | 19.03 | |||||
|
Forfeited
|
(15,828 | ) | 20.37 | |||||
|
Restricted at December 26, 2009
|
558,784 | $ | 19.04 | |||||
|
Granted
|
148,862 | 27.37 | ||||||
|
Exercised
|
(119,184 | ) | 22.10 | |||||
|
Forfeited
|
(38,284 | ) | 19.28 | |||||
|
Restricted at December 26, 2010
|
550,178 | $ | 20.61 | |||||
|
Granted
|
63,484 | 53.23 | ||||||
|
Exercised
|
(88,390 | ) | 20.82 | |||||
|
Forfeited
|
-- | -- | ||||||
|
Restricted at December 31, 2011
|
525,272 | $ | 24.52 | |||||
Other information relative to restricted unit activity during fiscal 2011, 2010 and 2009 is as follows (in thousands):
|
2011
|
2010
|
2009
|
||||||||||
|
Total grant date fair value of restricted units vested and issued
|
$ | 1,840 | $ | 2,634 | $ | 207 | ||||||
|
Total intrinsic value of restricted units vested and issued
|
$ | 4,915 | $ | 3,329 | $ | 180 | ||||||
For the majority of restricted stock units granted, the number of shares issued on the date the restricted stock units vest is net of the minimum statutory tax withholding requirements that we pay on behalf of our employees. We issued 68,007 90,203, and 10,896 shares as a result of vested restricted stock units during fiscal 2011, 2010 and 2009, respectively. Although shares withheld are not issued, they are treated similar to common stock repurchases as they reduce the number of shares that would have been issued upon vesting. The 2011 and 2010 amounts are net of 20,383 and 28,981 shares, withheld to satisfy $1.1 million and $0.8 million of employees’ tax obligations,
respectively.
There were no material modifications to restricted stock units in 2011, 2010 or 2009.
As of December 31, 2011, total unrecognized compensation expense related to non-vested restricted stock units is $3.8 million with a weighted average expense recognition period of 1.5 years.
Employee Stock Purchase Plan
The ESPP provides our employees the opportunity to purchase, through payroll deductions, shares of common stock at a 15% discount. Pursuant to the terms of the ESPP, we issued 53,333, 74,788 and 101,470 shares of common stock during fiscal 2011, 2010 and 2009, respectively. The total cost related to the ESPP, including the compensation expense calculations, was approximately $642,000, $439,000 and $449,000 in fiscal 2011, 2010 and 2009, respectively. At December 31, 2011, there were 6,246,519 shares of common stock reserved for future issuance under the ESPP.
47
Through October 23, 2011 we were party to a Senior Credit Facility (the “Credit Agreement”), which provided for borrowings up to $350 million (with sublimits of $75 million and $20 million for letters of credit and swingline loans, respectively) with proceeds available to be used for working capital, capital expenditures, dividends, share repurchases and other matters. The Credit Agreement had an Increase Option for $150 million (subject to additional lender group commitments). The Credit Agreement was unsecured and would have matured in February 2012.
On October 24, 2011, we entered into a new Senior Credit Facility with largely the same lender group as under the previous Credit Agreement. The new Senior Credit Facility provides for borrowings of up to $250 million (with sublimits of $250 million and $20 million for letters of credit and swingline loans, respectively). This agreement is unsecured and matures in October 2016, with proceeds available to be used for working capital, capital expenditures, dividends, share repurchases and other matters.
At December 31, 2011 and December 25, 2010, there were no outstanding borrowings under either Senior Credit Facility. There were $15.0 million and $27.4 million outstanding letters of credit as of December 31, 2011 and December 25, 2010, respectively. Borrowings bear interest at either the bank’s base rate (3.25% at December 31, 2011) or the London Inter-Bank Offer Rate (0.30% at December 31, 2011) plus an additional amount ranging from 0.40% to 1.00% per annum, adjusted quarterly based on our leverage ratio (0.50% at December 31, 2011). We are also required to pay, quarterly in arrears, a commitment fee ranging from 0.08% to 0.20% per annum and adjusted quarterly
based on our leverage ratio, for unused capacity (0.10% at December 31, 2011). There are no compensating balance requirements associated with the Senior Credit Facility.
The Senior Credit Facility requires quarterly compliance with respect to two material covenants: a fixed charge coverage ratio and a leverage ratio. The fixed charge coverage ratio principally compares earnings before interest, taxes, depreciation, amortization, stock compensation and rent expense (“consolidated EBITDAR”) to the sum of interest paid and rental expense (excluding straight-line rent). The leverage ratio principally compares total debt plus rental expense (excluding straight-line rent) multiplied by a factor of six to consolidated EBITDAR. The Senior Credit Facility also contains certain other restrictions regarding additional indebtedness,
capital expenditures, business operations, guarantees, investments, mergers, consolidations and sales of assets, transactions with subsidiaries or affiliates, and liens. We were in compliance with all covenants at December 31, 2011.
We lease the majority of our office space and retail store locations, certain distribution centers, transportation equipment and other equipment under various noncancellable operating leases. The leases have varying terms and expire at various dates through 2029 for both capital leases and operating leases. Store leases typically have initial terms of between 10 and 15 years, with two to four optional renewal periods of five years each. Some leases require the payment of contingent rent that is based upon store sales above agreed-upon sales levels for the year. The sales levels vary for each store and are established in the lease agreements. Generally, most of
the leases also require that we pay associated taxes, insurance and maintenance costs.
Total rent expense for fiscal 2011, 2010 and 2009 was approximately $186.8 million, $173.4 million and $162.2 million, respectively. Total contingent rent expense for fiscal 2011, 2010 and 2009 was insignificant.
Future minimum payments, by year and in the aggregate, under leases with initial or remaining terms of one year or more consist of the following (in thousands):
|
Capital
Leases
|
Operating
Leases
|
|||||||
|
2012
|
$ | 146 | $ | 188,311 | ||||
|
2013
|
146 | 183,592 | ||||||
|
2014
|
146 | 174,751 | ||||||
|
2015
|
146 | 164,798 | ||||||
|
2016
|
146 | 153,378 | ||||||
|
Thereafter
|
1,781 | 755,941 | ||||||
|
Total minimum lease payments
|
2,511 | $ | 1,620,771 | |||||
|
Amount representing interest
|
(1,194 | ) | ||||||
|
Present value of minimum lease payments
|
1,317 | |||||||
|
Less: current portion
|
(33 | ) | ||||||
|
Long-term capital lease obligations
|
$ | 1,284 | ||||||
48
Assets under capital leases were as follows (in thousands):
|
2011
|
2010
|
|||||||
|
Building and improvements
|
$ | 1,581 | $ | 1,581 | ||||
|
Computer software and hardware
|
1,510 | 2,363 | ||||||
|
Less: accumulated depreciation and amortization
|
(2,187 | ) | (2,915 | ) | ||||
| $ | 904 | $ | 1,029 | |||||
The authorized capital stock of the Company consists of common stock and preferred stock. In 2011, the stockholders approved an amendment to the Company’s Certification of Incorporation to increase the number of authorized shares of common stock from 100,000,000 to 200,000,000 shares. The Company is also authorized to issue 40,000 shares of Preferred Stock, with such designations, rights and preferences as may be determined from time to time by the Board of Directors.
On April 28, 2011, the Company’s Board of Directors authorized a $600 million increase to the existing share repurchase program, bringing the total amount authorized to date under the program to an aggregate of $1 billion of common stock, exclusive of any fees, commissions, or other expenses related to such repurchases, through April 2015. The repurchases may be made from time to time on the open market or in privately negotiated transactions. The timing and amount of any shares repurchased under the program will depend on a variety of factors, including price, corporate and regulatory requirements, capital availability, and other market conditions. Repurchased shares will be
held in treasury. The program may be limited or terminated at any time without prior notice.
We repurchased 3.1 million, 0.8 million and 0.4 million shares under the share repurchase program at a total cost of $180.0 million, $38.2 million and $15.3 million in fiscal 2011, 2010 and 2009, respectively. As of December 31, 2011, we had remaining authorization under the share repurchase program of $562.9 million exclusive of any fees, commissions, or other expenses.
Net income per share is calculated as follows (in thousands, except per share amounts):
|
2011
|
||||||||||||
|
Net
Income
|
Shares
|
Per Share
Amount
|
||||||||||
|
Basic net income per share:
|
||||||||||||
|
Net income
|
$ | 222,740 | 71,777 | $ | 3.10 | |||||||
|
Diluted net income per share:
|
||||||||||||
|
Dilutive stock options and restricted stock units outstanding
|
-- | 2,144 | (0.09 | ) | ||||||||
|
Net income
|
$ | 222,740 | 73,921 | $ | 3.01 | |||||||
|
2010
|
||||||||||||
|
Net
Income
|
Shares
|
Per Share
Amount
|
||||||||||
|
Basic net income per share:
|
||||||||||||
|
Net income
|
$ | 167,972 | 72,597 | $ | 2.31 | |||||||
|
Diluted net income per share:
|
||||||||||||
|
Dilutive stock options and restricted stock units outstanding
|
-- | 2,089 | (0.06 | ) | ||||||||
|
Net income
|
$ | 167,972 | 74,686 | $ | 2.25 | |||||||
49
|
2009
|
||||||||||||
|
Net
Income
|
Shares
|
Per Share
Amount
|
||||||||||
|
Basic net income per share:
|
||||||||||||
|
Net income
|
$ | 119,745 | 71,981 | $ | 1.66 | |||||||
|
Diluted net income per share:
|
||||||||||||
|
Dilutive stock options and restricted stock units outstanding
|
-- | 1,316 | (0.03 | ) | ||||||||
|
Net income
|
$ | 119,745 | 73,297 | $ | 1.63 | |||||||
Anti-dilutive stock options excluded from the above calculations totaled 321,080, 521,941 and 3,305,874 in 2011, 2010 and 2009, respectively.
The provision for income taxes consists of the following (in thousands):
|
2011
|
2010
|
2009
|
||||||||||
|
Current tax expense:
|
||||||||||||
|
Federal
|
$ | 112,142 | $ | 85,854 | $ | 72,398 | ||||||
|
State
|
13,878 | 7,444 | 9,427 | |||||||||
|
Total current
|
126,020 | 93,298 | 81,825 | |||||||||
|
Deferred tax expense (benefit):
|
||||||||||||
|
Federal
|
3,220 | 2,116 | (9,425 | ) | ||||||||
|
State
|
(1,364 | ) | 1,554 | (2,224 | ) | |||||||
|
Total deferred
|
1,856 | 3,670 | (11,649 | ) | ||||||||
|
Total provision
|
$ | 127,876 | $ | 96,968 | $ | 70,176 | ||||||
Deferred income taxes reflect the net tax effects of temporary differences between the carrying amounts of assets and liabilities for financial reporting purposes and the amounts used for income tax purposes. Significant components of the deferred tax assets and liabilities are as follows (in thousands):
|
2011
|
2010
|
|||||||
|
Current tax assets:
|
||||||||
|
Inventory valuation
|
$ | 10,171 | $ | 8,738 | ||||
|
Accrued employee benefit costs
|
24,807 | 21,209 | ||||||
|
Accrued sales taxes
|
4,221 | 2,687 | ||||||
|
Other
|
9,251 | 5,972 | ||||||
| 48,450 | 38,606 | |||||||
|
Current tax liabilities:
|
||||||||
|
Inventory basis difference
|
(37,730 | ) | (45,952 | ) | ||||
|
Other
|
(1,853 | ) | (1,508 | ) | ||||
| (39,583 | ) | (47,460 | ) | |||||
|
Net current tax asset (liability)
|
$ | 8,867 | $ | (8,854 | ) | |||
|
Non-current tax assets:
|
||||||||
|
Capital lease obligation basis difference
|
$ | 1,010 | $ | 1,018 | ||||
|
Rent expenses in excess of cash payments required
|
23,584 | 21,066 | ||||||
|
Deferred compensation
|
15,555 | 13,870 | ||||||
|
Other
|
3,620 | 3,858 | ||||||
|
Valuation allowance
|
(1,637 | ) | (1,925 | ) | ||||
| 42,132 | 37,887 | |||||||
|
Non-current tax liabilities:
|
||||||||
|
Depreciation
|
(54,047 | ) | (30,696 | ) | ||||
|
Capital lease assets basis difference
|
(531 | ) | (551 | ) | ||||
|
Other
|
(1,381 | ) | (890 | ) | ||||
| (55,959 | ) | (32,137 | ) | |||||
|
Net non-current tax (liability) asset
|
$ | (13,827 | ) | $ | 5,750 | |||
|
Net deferred tax liabilities
|
$ | (4,960 | ) | $ | (3,104 | ) | ||
50
We have evaluated the need for a valuation allowance for all or a portion of the deferred tax assets. With the exception of state tax credit carryforwards, we believe that all of the deferred tax assets will more likely than not be realized through future earnings. We had state tax credit carryforwards of $2.7 million as of December 31, 2011 and December 25, 2010, with varying dates of expiration between 2013 and 2020. We provided a valuation allowance of $1.6 million and $1.9 million as of December 31, 2011 and December 25, 2010, respectively, due to our uncertainty of utilizing these credits before their expiration dates. A reconciliation of the
provision for income taxes to the amounts computed at the federal statutory rate is as follows (in thousands):
|
2011
|
2010
|
2009
|
||||||||||
|
Tax provision at statutory rate
|
$ | 122,715 | $ | 92,729 | $ | 66,473 | ||||||
|
Tax effect of:
|
||||||||||||
|
State income taxes, net of federal tax benefits
|
8,134 | 5,848 | 4,682 | |||||||||
|
Permanent differences
|
(2,973 | ) | (1,609 | ) | (979 | ) | ||||||
| $ | 127,876 | $ | 96,968 | $ | 70,176 | |||||||
The Company and its affiliates file income tax returns in the U.S. and various state and local jurisdictions. With few exceptions, we are no longer subject to federal, state and local income tax examinations by tax authorities for years before 2007. The IRS commenced an examination of the Company’s federal tax returns for 2006 and 2007 which was completed in February 2011, and no IRS adjustments were proposed. Various states have completed an examination of our income tax returns for 2001 through 2009 with minimal adjustments.
The total amount of unrecognized tax benefits that, if recognized, would decrease the effective tax rate, is $4.6 million at December 31, 2011. In addition, we recognize current interest and penalties accrued related to these uncertain tax positions as interest expense, and the amount is not material to the Consolidated Statements of Income. The Company estimates the overall decrease in unrecognized tax benefits in the next twelve months will range between $0.6 million and $1.1 million. A reconciliation of the beginning and ending gross amount of unrecognized tax benefits (exclusive of interest and penalties) is as follows (in thousands):
|
2011
|
2010
|
2009
|
||||||||||
|
Balance at beginning of year
|
$ | 4,801 | $ | 4,084 | $ | 3,249 | ||||||
|
Additions based on tax positions related to the current year
|
1,611 | 1,453 | 1,293 | |||||||||
|
Additions for tax positions of prior years
|
-- | -- | 437 | |||||||||
|
Reductions for tax positions of prior years
|
(638 | ) | (736 | ) | (688 | ) | ||||||
|
Reductions due to audit results
|
-- | -- | (207 | ) | ||||||||
|
Balance at end of year
|
$ | 5,774 | $ | 4,801 | $ | 4,084 | ||||||
We have a defined contribution benefit plan, the Tractor Supply Company 401(k) Retirement Savings Plan (the “Plan”), which provides retirement benefits for our employees. Employees become eligible on the first month following their fulfillment of the eligibility requirements. To be eligible, an employee must be at least 21 years of age, have completed 12 months of employment, and performed 1,000 hours of service in a year of service as defined by the Plan. We match (in cash) 100% of the employee’s elective contributions up to 3% of the employee’s eligible compensation plus 50% of the employee’s elective contributions from 3% to 6% of the
employee’s eligible compensation. In no event shall the total Company match made on behalf of the employee exceed 4.5% of the employee’s eligible compensation. All current contributions are immediately 100% vested. Company contributions to the Plan during fiscal 2011, 2010 and 2009, were approximately $4.3 million, $3.7 million and $3.2 million, respectively.
We offer, through a deferred compensation program, the opportunity for certain qualifying employees to elect a deferral of up to 40% of their annual base salary and up to 100% of their annual incentive bonus under their respective incentive bonus programs. To be eligible for the salary deferral, each participant must contribute the maximum amount of salary to the Plan subject to the Company’s match. Under the deferred compensation program, the participants’ salary deferral is matched by the Company, 100% on the first $3,000 of base salary contributed and 50% on the next $3,000 of base salary contributed, limited to a maximum annual matching contribution of $4,500. Each
participant’s account earns simple annual interest at the prime rate as in effect on January 1 each year. Each participant is fully vested in all amounts credited to their deferred compensation account. Payments under the program, which are made in cash and paid in ten annual installments or in a single lump sum payment at the election of the participant, are made within 30 days following the earlier of the participant’s (i) death, (ii) retirement, plus six months if the participant is a key employee, (iii) total and permanent disability, (iv) separation from service, plus six months if the participant is a key employee, or (v) some other date designated by the participant at the time of the initial deferral. The Company’s contributions, including accrued interest, were $0.4 million in fiscal 2011 and $0.3 million in each of the fiscal years 2010
and 2009.
51
Construction and Real Estate Commitments
At December 31, 2011, we had commitments related to construction projects for new stores totaling approximately $6.4 million and commitments to purchase one store previously under lease for approximately $3.0 million.
Litigation
The Company received and responded to a Request for Information from the United States Environmental Protection Agency (“EPA”) relating to certain recreational vehicles and non-road spark ignition engines sold by the Company. In the first quarter of fiscal 2011, the Environmental Enforcement Section of the Department of Justice (“DOJ”), on behalf of the EPA, informed the Company that it believed the Company had violated the Clean Air Act by importing or causing the importation of certain engines not covered by certificates of conformity issued by the EPA, and that unless the DOJ and the Company were able to reach a settlement, the DOJ was prepared to commence a civil action. The
Company is currently engaged in settlement discussions with the DOJ that would call for the payment of a civil penalty and certain injunctive relief. The engines were purchased by the Company pursuant to agreements with three vendors under which the vendors represented that their products complied with all applicable laws and regulations and under which the vendors agreed to indemnify the Company for any liabilities or costs relating to, among other matters, the noncompliance or alleged noncompliance of their products. The Company has notified these vendors of the EPA’s position and currently is working with these vendors to provide additional information to the DOJ and EPA regarding the alleged violations. The Company expects to be reimbursed by these vendors for any liabilities or costs relating to this matter. The Company does not
expect the resolution of this matter to have a material adverse effect on its financial condition, results of operations or cash flows. We do not believe it is reasonably possible that a loss in excess of the amount accrued will be incurred.
We are also involved in various litigation matters arising in the ordinary course of business. We expect these matters will be resolved without material adverse effect on our consolidated financial position, results of operations or cash flows. We believe that any estimated loss related to such matters has been adequately provided in accrued liabilities to the extent probable and reasonably estimable.
Tractor Supply Company has one reportable segment which is the retail sale of farm and ranch products. The Company manages the business on the basis of one operating segment. The following chart indicates the percentage of sales represented by each of our major product categories during fiscal 2011, 2010, and 2009:
|
Percent of Sales
|
||||||||
|
Product Category:
|
2011
|
2010
|
2009
|
|||||
|
Livestock and Pet
|
40 | % | 39 | % | 39 | % | ||
|
Hardware, Tools and Truck
|
23 | 23 | 23 | |||||
|
Seasonal, Gift and Toy Products
|
21 | 22 | 22 | |||||
|
Clothing and Footwear
|
10 | 10 | 10 | |||||
|
Agriculture
|
6 | 6 | 6 | |||||
|
Total
|
100 | % | 100 | % | 100 | % | ||
In September 2011, the FASB issued Accounting Standards Update No. 2011-08, “Intangibles — Goodwill and Other (Topic 350): Testing Goodwill for Impairment.” The ASU gives an entity the option in its annual goodwill impairment test to first assess revised qualitative factors to determine whether it is more likely than not (a likelihood of more than 50%) that the fair value of a reporting unit is more than its carrying amount (“qualitative assessment”). If it is more likely than not the fair value of a reporting unit is more than its carrying amount, an entity would not be required to perform the existing two-step impairment test. The amendments to Topic 350 are effective for
annual and interim goodwill impairment tests performed for fiscal years beginning after December 15, 2011. The Company does not believe the adoption of ASU 2011-08 will have a material effect on its consolidated financial statements.
52
On February 8, 2012, our Board of Directors declared a quarterly cash dividend of $0.12 per share of the Company’s common stock. The dividend will be paid on March 13, 2012 to stockholders of record as of the close of business on February 27, 2012.
None
Evaluation of Disclosure Controls and Procedures
We carried out an evaluation required by the Securities Exchange Act of 1934, as amended (the “1934 Act”), under the supervision and with the participation of our principal executive officer and principal financial officer, of the effectiveness of the design and operation of our disclosure controls and procedures (as defined in Rule 13a-15(e) and 15d-15(e) under the 1934 Act) as of December 31, 2011. Based on this evaluation, our principal executive officer and principal financial officer concluded that, as of December 31, 2011, our disclosure controls and procedures were effective.
Management’s Report on Internal Control Over Financial Reporting
Management of the Company is responsible for establishing and maintaining effective internal control over financial reporting as defined in Rule 13a-15(f) under the 1934 Act. The Company’s internal control over financial reporting is a process designed to provide reasonable assurance regarding the reliability of financial reporting and the preparation of financial statements for external purposes in accordance with generally accepted accounting principles.
Because of its inherent limitations, internal control over financial reporting may not prevent or detect misstatements. Therefore, even those systems determined to be effective can provide only reasonable assurance with respect to financial statement preparation and presentation.
Management assessed the effectiveness of the Company’s internal control over financial reporting as of December 31, 2011. In making this assessment, management used the criteria set forth by the Committee of Sponsoring Organizations of the Treadway Commission (COSO) in Internal Control – Integrated Framework. Based on this assessment, management believes that, as of December 31, 2011, the Company’s internal control over financial reporting is effective based on those criteria.
Ernst & Young LLP, the independent registered public accounting firm which also audited the Company’s consolidated financial statements, has issued a report on the Company’s internal control over financial reporting, which is included herein.
Change in Internal Control Over Financial Reporting
There were no changes in our internal control over financial reporting that occurred during our last fiscal quarter that have materially affected or are reasonably likely to materially affect our internal control over financial reporting.
None.
53
The information set forth under the caption "Executive Officers of the Registrant" in Part I of this Form 10-K is incorporated herein by reference.
The information set forth under the captions “Corporate Governance – Code of Ethics,” “Item 1: Election of Directors,” “Board Meetings and Committees,” and "Section 16(a) Beneficial Ownership Reporting Compliance" in our Proxy Statement for our Annual Meeting of Stockholders to be held on May 3, 2012 is incorporated herein by reference.
The information set forth under the captions “Corporate Governance – Compensation Committee Interlocks and Insider Participation,” “Compensation of Directors”, and “Executive Compensation” in our Proxy Statement for our Annual Meeting of Stockholders to be held on May 3, 2012 is incorporated herein by reference.
The information set forth under the caption "Security Ownership of Certain Beneficial Owners and Management" in our Proxy Statement for our Annual Meeting of Stockholders to be held on May 3, 2012 is incorporated herein by reference.
Following is a summary of our equity compensation plans as of December 31, 2011, under which equity securities are authorized for issuance, aggregated as follows:
|
Plan Category
|
Number of Securities to be
Issued Upon Exercise of
Outstanding Options,
Warrants, and Rights
|
Weighted Average
Exercise Price of
Outstanding Options,
Warrants and Rights
|
Number of Securities
Remaining Available
for Future Issuance
|
||||||
|
Equity compensation plans approved by security holders
:
|
|||||||||
|
Stock Incentive Plan
(1)
|
4,077,147 | $ | 23.15 | 4,587,083 | |||||
|
Employee Stock Purchase Plan
(2)
|
-- | -- | 6,246,519 | ||||||
|
Equity compensation plans not
approved by security holders
:
|
-- | -- | -- | ||||||
|
Total
|
4,077,147 | $ | 23.15 | 10,833,602 | |||||
| __________ | |||||||||
| (1) The 2006 Stock Incentive Plan was superseded in May 2009 by the 2009 Stock Incentive Plan. The 2000 Stock Incentive Plan was superseded in May 2006. The 1994 Stock Option Plan expired in February 2004. |
| (2) Represents shares available as of December 31, 2011. |
The information set forth in Note 2 to the “Notes to Consolidated Financial Statements” contained in this Form 10-K provides further information with respect to the material features of each plan.
The information set forth under the captions “Item 1 – Election of Directors”, “Corporate Governance” and “Related-Party Transactions” in our Proxy Statement for our Annual Meeting of Stockholders to be held on May 3, 2012 is incorporated herein by reference.
54
The information set forth under the caption “Item 2 – Ratification of Reappointment of Independent Registered Public Accounting Firm” in our Proxy Statement for our Annual Meeting of Stockholders to be held on May 3, 2012, is incorporated herein by reference.
|
(a) (1)
|
Financial Statements
|
See Consolidated Financial Statements under Item 8 on pages 35 through 53 of this Form 10-K.
(a) (2)
Financial Statement Schedules
All schedules for which provision is made in the applicable accounting regulations of the SEC are not required under the related instructions, are inapplicable or the information is included in the Consolidated Financial Statements and, therefore, have been omitted.
(a) (3)
Exhibits
The exhibits listed in the Index to Exhibits, which appears on pages 57 through 60 of this Form 10-K, are incorporated herein by reference or filed as part of this Form 10-K.
55
SIGNATURES
Pursuant to the requirements of Section 13 or 15(d) of the Securities Exchange Act of 1934, the Registrant has duly caused this report to be signed on its behalf by the undersigned, thereunto duly authorized.
|
TRACTOR SUPPLY COMPANY
|
||
|
Date: February 29, 2012
|
By:
|
/s/ Anthony F. Crudele
Executive Vice President – Chief Financial Officer and Treasurer
|
Pursuant to the requirements of the Securities Exchange Act of 1934, this report has been signed below by the following persons on behalf of the Registrant in the capacities and on the dates indicated.
|
Signature
|
Title
|
Date
|
|
/s/ Anthony F. Crudele
Anthony F. Crudele
|
Executive Vice President –
Chief Financial Officer and Treasurer (Principal Financial and Accounting Officer)
|
February 29, 2012
|
|
/s/ James F. Wright
James F. Wright
|
Chairman of the Board,
Chief Executive Officer and Director
(Principal Executive Officer)
|
February 29, 2012
|
|
/s/ Johnston C. Adams
Johnston C. Adams
|
Director
|
February 29, 2012
|
|
/s/ William Bass
William Bass
|
Director
|
February 29, 2012
|
|
/s/ Peter Bewley
Peter Bewley
|
Director
|
February 29, 2012
|
|
/
s/ Jack C. Bingleman
Jack C. Bingleman
|
Director
|
February 29, 2012
|
|
/s/ Richard W. Frost
Richard W. Frost
|
Director
|
February 29, 2012
|
|
/
s/ Cynthia T. Jamison
Cynthia T. Jamison
|
Director
|
February 29, 2012
|
|
/s/ George MacKenzie
George MacKenzie
|
Director
|
February 29, 2012
|
|
/s/ Edna K. Morris
Edna K. Morris
|
Director
|
February 29, 2012
|
56
EXHIBIT INDEX
| 3.1* |
Restated Certificate of Incorporation, as amended, of the Company (amended and restated for SEC filing purposes).
|
||
| 3.2 |
Second Amended and Restated By-laws (filed as Exhibit 3(ii) to Registrant’s Current Report on Form 8-K, filed with the Commission on February 11, 2009, Commission File No. 000-23314, and incorporated herein by reference).
|
||
| 4.1 |
Form of Specimen Certificate representing the Company's Common Stock, par value $.008 per share (filed as Exhibit 4.2 to Amendment No. 1 to Registrant's Registration Statement on Form S-1, Registration No. 33-73028, filed with the Commission on January 31, 1994, and incorporated herein by reference).
|
||
| 10.1 |
Tractor Supply Company 1994 Stock Option Plan (filed as Exhibit 10.28 to Registrant’s Registration Statement on Form S-1, Registration No. 33-73028, filed with the Commission on December 17, 1993, and incorporated herein by reference).+
|
||
| 10.2 |
Amendment to the Tractor Supply Company 1994 Stock Option Plan (filed as Exhibit 10.25 to Registrant’s Quarterly Report on Form 10-Q, Commission File No. 000-23314, filed with the Commission on August 8, 1997, and incorporated herein by reference).+
|
||
| 10.3 |
Second Amendment to the Tractor Supply Company 1994 Stock Option Plan (filed as Exhibit 10.44 to Registrant’s Annual Report on Form 10-K, filed with the Commission on March 24, 2000, Commission File No. 000-23314, and incorporated herein by reference).+
|
||
| 10.4 |
Third Amendment to the Tractor Supply Company 1994 Stock Option Plan, effective February 8, 2007 (filed as Exhibit 10.36 to Registrant’s Annual Report on Form 10-K, filed with the Commission on February 28, 2007, Commission File No. 000-23314, and incorporated herein by reference.)+
|
||
| 10.5 |
Certificate of Insurance relating to the Medical Expense Reimbursement Plan of the Company (filed as Exhibit 10.33 to Registrant’s Registration Statement on Form S-1, Registration No. 33-73028, filed with the Commission on December 17, 1993, and incorporated herein by reference).
|
||
| 10.6 |
Summary Plan Description of the Executive Life Insurance Plan of the Company (filed as Exhibit 10.34 to Registrant’s Registration Statement on Form S-1, Registration No. 33-73028, filed with the Commission on December 17, 1993, and incorporated herein by reference).+
|
||
| 10.7 |
Tractor Supply Company 1996 Associate Stock Purchase Plan (filed as Exhibit 4.4 to Registrant’s Registration Statement on Form S-8, Registration No. 333-10699, filed with the Commission on August 23, 1996, and incorporated herein by reference).+
|
||
| 10.8 |
Tractor Supply Company Restated 401(k) Retirement Plan (filed as Exhibit 4.1 to Registrant’s Registration Statement on Form S-3, Registration No. 333-35317, filed with the Commission on September 10, 1997, and incorporated herein by reference).+
|
||
| 10.9 |
First Amendment, dated December 22, 2003 to the Tractor Supply Company 401(k) Retirement Savings Plan (filed as Exhibit 10.53 to Registrant’s Annual Report on Form 10-K, filed with the Commission on March 8, 2004, Commission File No. 000-23314, and incorporated herein by reference).+
|
||
| 10.10 |
Second Amendment to Tractor Supply Company Restated 401(k) Retirement Plan (filed as Exhibit 10.57 to Registrant’s Annual Report on Form 10-K, filed with the Commission on March 23, 2001, Commission File No. 000-23314, and incorporated herein by reference).+
|
57
| 10.11 |
Trust Agreement (filed as Exhibit 4.2 to Registrant’s Registration Statement on Form S-3, Registration No. 333-35317, filed with the Commission on September 10, 1997, and incorporated herein by reference).
|
||
| 10.12 |
Tractor Supply Company 2000 Stock Incentive Plan (filed as Exhibit 4.5 to Registrant's Registration Statement on Form S-8, Registration No. 333-102768, filed with the Commission on January 28, 2003 and incorporated herein by reference).+
|
||
| 10.13 |
First Amendment to the Tractor Supply Company 2000 Stock Incentive Plan, effective February 8, 2007 (filed as Exhibit 10.37 to Registrant’s Annual Report on Form 10-K, filed with the Commission on February 28, 2007, Commission File No. 000-23314, and incorporated herein by reference.) +
|
||
| 10.14 |
First Amendment to Lease Agreement, dated as of December 18, 2000, between Tractor Supply Company and GOF Partners (filed as Exhibit 10.56 to Registrant’s Annual Report on Form 10-K, filed with the Commission on March 23, 2001, Commission File No. 000-23314, and incorporated herein by reference).
|
||
| 10.15 |
Transportation Management Services Agreement between UPS Logistics Group, Inc. and Tractor Supply Company dated May 10, 2001 (filed as Exhibit 10.58 to Registrant’s Quarterly Report on Form 10-Q, filed with the Commission on August 14, 2001 Commission File No. 000-23314, and incorporated herein by reference).
|
||
| 10.16 |
Tractor Supply Company Executive Deferred Compensation Plan, dated November 11, 2001 (filed as Exhibit 10.58 to Registrant’s Quarterly Report on Form 10-Q, filed with the Commission on May 13, 2002, Commission File No. 000-23314, and incorporated herein by reference).
|
||
| 10.17 |
Lease Agreement dated January 22, 2004 between Tractor Supply Company and The Prudential Insurance Company of America (filed as Exhibit 10.54 to Registrant’s Annual Report on Form 10-K, filed with the Commission on March 8, 2004, Commission File No. 000-23314, and incorporated herein by reference).
|
||
| 10.18 |
Tractor Supply Co. 2004 Cash Incentive Plan, effective April 15, 2004 (filed as Exhibit 10.1 to Registrant’s Quarterly Report on Form 10-Q, filed with the Commission on August 4, 2004, Commission File No. 000-23314, and incorporated herein by reference).
|
||
| 10.19 |
Amended and Restated Employment Agreement between Tractor Supply Company and James F. Wright dated December 21, 2010 (filed as Exhibit 10.2 to Registrant’s Current Report on Form 8-K, filed with the Commission on December 22, 2010, Commission File No. 000-23314, and incorporated herein by reference).+
|
||
| 10.20 |
Chairman of the Board Bonus Plan (filed as Exhibit 10.1 to Registrant’s Current Report on Form 8-K, filed with the Commission on April 25, 2005, Commission File No. 000-23314, and incorporated herein by reference).+
|
||
| 10.21 |
Form of Incentive Stock Option Agreement under the 2000 Stock Incentive Plan (filed as Exhibit 10.46 to Registrant’s Annual Report on Form 10-K, filed with the Commission on March 10, 2005, Commission File No. 000-23314, and incorporated herein by reference).+
|
||
| 10.22 |
Form of Incentive Stock Option Agreement under the 2000 Stock Incentive Plan (filed as Exhibit 10.44 to Registrant’s Annual Report on Form 10-K, filed with the Commission on March 16, 2006, Commission File No. 000-23314, and incorporated herein by reference).+
|
||
| 10.23 |
Form of Incentive Stock Option Agreement under the 2006 Stock Incentive Plan (filed as Exhibit 10.39 to Registrant’s Annual Report on Form 10-K, filed with the Commission on February 28, 2007, Commission File No. 000-23314, and incorporated herein by reference).+
|
58
| 10.24 |
Form of Incentive Stock Option Agreement under the 2006 Stock Incentive Plan (filed as Exhibit 10.45 to Registrant’s Annual Report on Form 10-K, filed with the Commission on February 27, 2008, Commission File No. 000-23314, incorporated herein by reference).+
|
||
| 10.25 |
Tractor Supply Company 2006 Stock Incentive Plan (filed as Exhibit 99.1 to the Registrant's Current Report on Form 8-K filed with the Commission on April 27, 2006, Commission File No. 000-23314 and incorporated herein by reference).+
|
||
| 10.26 |
Second Amendment to the Tractor Supply Company 2006 Stock Incentive Plan, effective February 8, 2007 (filed as Exhibit 10.38 to Registrant’s Annual Report on Form 10-K, filed with the Commission on February 28, 2007, Commission File No. 000-23314, and incorporated herein by reference.)+
|
||
| 10.27 |
Form of Incentive Stock Option Agreement under the 2006 Stock Incentive Plan (filed as Exhibit 10.41 to the Registrant’s Annual Report on Form 10-K, filed with the Commission on February 25, 2009, Commission File No. 000-23314, and incorporated herein by reference).+
|
||
| 10.28 |
Form of Change in Control Agreement for each of Anthony F. Crudele; Gregory A. Sandfort; and Kimberly D. Vella (filed as Exhibit 10.42 to Registrant’s Quarterly Report on Form 10-Q, filed with the Commission on August 4, 2009, Commission File No. 000-23314, and incorporated herein by reference).+
|
||
| 10.29 |
Amended and Restated Change in Control Agreement for James F. Wright (filed as Exhibit 10.1 to Current Report on Form 8-K, filed with the Commission on December 22, 2010, Commission File No. 000-23314, and incorporated herein by reference).+
|
||
| 10.30 |
Form of Incentive Stock Option Agreement under the Tractor Supply Company 2009 Stock Incentive Plan (filed as Exhibit 10.44 to Registrant’s Quarterly Report on Form 10-Q, filed with the Commission on August 4, 2009, Commission File No. 000-23314, and incorporated herein by reference).+
|
||
| 10.31 |
Form of Restricted Share Unit Agreement under the Tractor Supply Company 2009 Stock Incentive Plan (filed as Exhibit 10.45 to Registrant’s Quarterly Report on Form 10-Q, filed with the Commission on August 4, 2009, Commission File No. 000-23314, and incorporated herein by reference).+
|
||
| 10.32 |
Form of Nonqualified Stock Option Agreement under the Tractor Supply Company 2009 Stock Incentive Plan (filed as Exhibit 10.46 to Registrant’s Quarterly Report on Form 10-Q, filed with the Commission on August 4, 2009, Commission File No. 000-23314, and incorporated herein by reference).+
|
||
| 10.33 |
Form of Director Restricted Stock Unit Award Agreement (filed as Exhibit 10.48 to Registrant’s Quarterly Report on Form 10-Q, filed with the Commission on November 2, 2009, Commission File No. 000-23314, and incorporated herein by reference).+
|
||
| 10.34 |
Form of Restricted Share Unit Agreement for Officers (filed as Exhibit 10.49 to Registrant’s Quarterly Report on Form 10-Q, filed with the Commission on November 2, 2009, Commission File No. 000-23314, and incorporated herein by reference).+
|
||
| 10.35 |
Form of Deferred Stock Unit Award Agreement for Directors (filed as Exhibit 10.50 to Registrant’s Quarterly Report on Form 10-Q, filed with the Commission on November 2, 2009, Commission File No. 000-23314, and incorporated herein by reference).+
|
||
| 10.36 |
Tractor Supply Company 2009 Stock Incentive Plan (filed as Exhibit 99.1 to Registrant’s Current Report on Form 8-K, filed with the Commission on April 14, 2009, Commission File No. 000-23314, and incorporated herein by reference).+
|
59
| 10.37 |
Compensation Recoupment Policy (filed as Exhibit 10.42 to Registrant’s Quarterly Report on Form 10-Q, filed with the Commission on May 3, 2011, Commission File No. 000-23314, and incorporated herein by reference).+
|
||
| 10.38 |
Transition Agreement, dated as of July 29, 2011, by and between Tractor Supply Company and Stanley L. Ruta (filed as Exhibit 10.1 to Registrant’s Current Report on Form 8-K, filed with the Commission on August 1, 2011, Commission File No. 000-23314, and incorporated herein by reference).+
|
||
| 10.39 |
Credit Agreement, dated as of October 24, 2011, by and among Tractor Supply Company, as Borrower, certain subsidiaries of the Company, certain lenders and Bank of America, N.A., as Administrative Agent for the lenders (filed as Exhibit 10.1 to Registrant’s Current Report on Form 8-K, filed with the Commission on October 28, 2011, Commission File No. 000-23314, and incorporated herein by reference).
|
||
| 21* |
List of subsidiaries.
|
||
| 23* |
Consent of Ernst & Young LLP.
|
||
| 31.1* |
Certification of Chief Executive Officer under Section 302 of the Sarbanes-Oxley Act of 2002.
|
||
| 31.2* |
Certification of Chief Financial Officer under Section 302 of the Sarbanes-Oxley Act of 2002.
|
||
| 32* |
Certification of Chief Executive Officer and Chief Financial Officer under Section 906 of the Sarbanes-Oxley Act of 2002.
|
||
| 101* |
The following financial information from our Annual Report on Form 10-K for fiscal 2011, filed with the SEC on February 29, 2012, formatted in Extensible Business Reporting Language (XBRL): (i) the consolidated balance sheets at December 31, 2011 and December 25, 2010, (ii) the consolidated statements of income for years ended December 31, 2011, December 25, 2010, and December 26, 2009, (iii) the consolidated statements of cash flows for years ended December 31, 2011, December 25, 2010, and December 26, 2009, (iv) the consolidated statements of stockholders' equity for the years ended December 31, 2011, December 25, 2010, and December 26,
2009, and (v) the Notes to Consolidated Financial Statements.
(1)
|
*
Filed herewith
+ Management contract or compensatory plan or arrangement
|
|
(1)
|
The XBRL related information in Exhibit 101 to this Annual Report on Form 10-K shall not be deemed “filed” for purposes of Section 18 of the Securities Exchange Act of 1934, as amended, or otherwise subject to liability of that section and shall not be incorporated by reference into any filing or other document pursuant to the Securities Act of 1933, as amended, except as shall be expressly set forth by specific reference in such filing or document.
|
60
TABLE OF CONTENTS
Part IItem 1. BusinessItem 1A. Risk FactorsItem 1B. Unresolved Staff CommentsItem 2. PropertiesItem 3. Legal ProceedingsItem 4. Mine Safety DisclosuresPart IIItem 5. Market For Registrant S Common Equity, Related Stockholder Matters and Issuer Purchases Of Equity SecuritiesItem 6. Selected Financial DataItem 7. Management S Discussion and Analysis Of Financial Condition and Results Of OperationsItem 7A. Quantitative and Qualitative Disclosures About Market RiskItem 8. Financial Statements and Supplementary DataNote 1 Significant Accounting Policies:Note 2 - Share-based Compensation:Note 3 - Credit Agreement:Note 4 - Leases:Note 5 - Capital Stock:Note 6 - Treasury Stock:Note 7 - Net Income Per Share:Note 8 Income Taxes:Note 9 - Retirement Benefit Plans:Note 10 Commitments and Contingencies:Note 11 Segment Reporting:Note 12 - Impact Of Recently Issued Accounting Standards:Note 13 Subsequent Events:Item 9. Changes in and Disagreements with Accountants on Accounting and Financial DisclosureItem 9A. Controls and ProceduresItem 9B. Other InformationPart IIIItem 10. Directors, Executive Officers and Corporate GovernanceItem 11. Executive CompensationItem 12. Security Ownership Of Certain Beneficial Owners and Management and Related Stockholder MattersItem 13. Certain Relationships and Related Transactions, and Director IndependenceItem 14. Principal Accountant Fees and ServicesPart IVItem 15. Exhibits, Financial Statement Schedules