TYSON FOODS, INC.
10-Ks and 10-Qs
|
|
|
|
|
|
|
|
|
|
|
|
|
|
|
|
|
|
|
|
|
|
|
|
|
|
|
|
|
|
|
|
|
|
|
|
|
|
|
|
|
|
|
|
|
|
|
|
|
|
|
|
|
UNITED STATES
SECURITIES AND EXCHANGE COMMISSION
Washington, D.C. 20549
FORM 10-K
|
[X]
|
Annual Report Pursuant to Section 13 or 15(d) of the Securities Exchange Act of 1934
|
|
|
For the fiscal year ended
|
September 28, 2013
|
|
|
[ ]
|
Transition Report Pursuant to Section 13 or 15(d) of the Securities Exchange Act of 1934
|
|
|
For the transition period from
to
|
||

001-14704
(Commission File Number)
______________________________________________
TYSON FOODS, INC.
(Exact name of registrant as specified in its charter)
______________________________________________
|
Delaware
|
|
71-0225165
|
|
(State or other jurisdiction of
incorporation or organization)
|
|
(I.R.S. Employer Identification No.)
|
|
2200 Don Tyson Parkway, Springdale, Arkansas
|
|
72762-6999
|
|
(Address of principal executive offices)
|
|
(Zip Code)
|
|
Registrant’s telephone number, including area code:
|
|
(479) 290-4000
|
Securities Registered Pursuant to Section 12(b) of the Act:
|
Title of Each Class
|
|
Name of Each Exchange on Which Registered
|
|
Class A Common Stock, Par Value $0.10
|
|
New York Stock Exchange
|
Securities Registered Pursuant to Section 12(g) of the Act: Not Applicable
Indicate by check mark if the registrant is a well-known seasoned issuer, as defined in Rule 405 of the Securities Act. Yes
[X]
No [ ]
Indicate by check mark if the registrant is not required to file reports pursuant to Section 13 or Section 15(d) of the Act. Yes [ ] No
[X]
Indicate by check mark whether the registrant (1) has filed all reports required to be filed by Section 13 or 15(d) of the Securities Exchange Act of 1934 during the preceding 12 months (or for such shorter period that the registrant was required to file such reports), and (2) has been subject to such filing requirements for the past 90 days. Yes
[X]
No [ ]
Indicate by check mark whether the registrant has submitted electronically and posted on its corporate web site, if any, every Interactive Data File required to be submitted and posted pursuant to Rule 405 of Regulation S-T (§232.405 of this chapter) during the preceding 12 months (or for such shorter period that the registrant was required to submit and post such files). Yes
[X]
No [ ]
Indicate by check mark if disclosure of delinquent filers pursuant to Item 405 of Regulation S-K is not contained herein, and will not be contained, to the best of registrant’s knowledge, in definitive proxy or information statements incorporated by reference in Part III of this Form 10-K or any amendment to this Form 10-K. [ ]
Indicate by check mark whether the registrant is a large accelerated filer, an accelerated filer, a non-accelerated filer, or a smaller reporting company. See definitions of “large accelerated filer,” “accelerated filer” and “smaller reporting company” in Rule 12b-2 of the Exchange Act.
|
Large accelerated filer [
X
]
|
Accelerated filer [ ]
|
|
|
Non-accelerated filer [ ] (Do not check if a smaller reporting company)
|
Smaller reporting company [ ]
|
|
Indicate by check mark whether the registrant is a shell company (as defined in Rule 12b-2 of the Exchange Act). Yes [ ] No
[X]
On
March 30, 2013
, the aggregate market value of the registrant’s Class A Common Stock, $0.10 par value (Class A stock), and Class B Common Stock, $0.10 par value (Class B stock), held by non-affiliates of the registrant was
$6,927,429,212
and
$391,039
, respectively. Class B stock is not publicly listed for trade on any exchange or market system. However, Class B stock is convertible into Class A stock on a share-for-share basis, so the market value was calculated based on the market price of Class A stock.
On
October 26, 2013
, there were
273,804,571
shares of Class A stock and
70,013,055
shares of Class B stock outstanding.
INCORPORATION BY REFERENCE
Portions of the registrant’s definitive Proxy Statement for the registrant’s Annual Meeting of Shareholders to be held
January 31, 2014
, are incorporated by reference into Part III of this Annual Report on Form 10-K.
|
TABLE OF CONTENTS
|
||
|
PAGE
|
||
|
Item 1.
|
||
|
Item 1A.
|
||
|
Item 1B.
|
||
|
Item 2.
|
||
|
Item 3.
|
||
|
Item 4.
|
||
|
Item 5.
|
||
|
Item 6.
|
||
|
Item 7.
|
||
|
Item 7A.
|
||
|
Item 8.
|
||
|
Item 9.
|
||
|
Item 9A.
|
||
|
Item 9B.
|
||
|
Item 10.
|
||
|
Item 11.
|
||
|
Item 12.
|
||
|
Item 13.
|
||
|
Item 14.
|
||
|
Item 15.
|
||
1
GENERAL
Founded in 1935, Tyson Foods, Inc. and its subsidiaries (collectively, “Company,” “we,” “us” or “our”) are one of the world’s largest meat protein companies and the second-largest food production company in the
Fortune
500 with one of the most recognized brand names in the food industry. We produce, distribute and market chicken, beef, pork, prepared foods and related allied products. Our operations are conducted in four segments: Chicken, Beef, Pork and Prepared Foods. Some of the key factors influencing our business are customer demand for our products; the ability to maintain and grow relationships with customers and introduce new and innovative products to the marketplace; accessibility of international markets; market prices for our products; the cost and availability of live cattle and hogs, raw materials, grain and feed ingredients; and operating efficiencies of our facilities.
We operate a fully vertically integrated poultry production process. Our integrated operations consist of breeding stock, contract growers, feed production, processing, further-processing, marketing and transportation of chicken and related allied products, including animal and pet food ingredients. Through our wholly-owned subsidiary, Cobb-Vantress, Inc. (Cobb), we are one of the leading poultry breeding stock suppliers in the world. Investing in breeding stock research and development allows us to breed into our flocks the characteristics found to be most desirable.
We also process live fed cattle and hogs and fabricate dressed beef and pork carcasses into primal and sub-primal meat cuts, case ready beef and pork and fully-cooked meats. In addition, we derive value from allied products such as hides and variety meats sold to further processors and others.
We produce a wide range of fresh, value-added, frozen and refrigerated food products. Our products are marketed and sold primarily by our sales staff to grocery retailers, grocery wholesalers, meat distributors, warehouse club stores, military commissaries, industrial food processing companies, chain restaurants or their distributors, international export companies and domestic distributors who serve restaurants, foodservice operations such as plant and school cafeterias, convenience stores, hospitals and other vendors. Additionally, sales to the military and a portion of sales to international markets are made through independent brokers and trading companies.
FINANCIAL INFORMATION OF SEGMENTS
We operate in four segments: Chicken, Beef, Pork and Prepared Foods. The contribution of each segment to net sales and operating income (loss), and the identifiable assets attributable to each segment, are set forth in Note 17: Segment Reporting of the Notes to Consolidated Financial Statements.
DESCRIPTION OF SEGMENTS
Chicken:
Chicken operations include breeding and raising chickens, as well as processing live chickens into fresh, frozen and value-added chicken products and logistics operations to move products through the supply chain. Products are marketed domestically to food retailers, foodservice distributors, restaurant operators, hotel chains and noncommercial foodservice establishments such as schools, healthcare facilities, the military and other food processors, as well as to international markets. It also includes sales from allied products and our chicken breeding stock subsidiary.
Beef:
Beef operations include processing live fed cattle and fabricating dressed beef carcasses into primal and sub-primal meat cuts and case-ready products. This segment also includes sales from allied products such as hides and variety meats, as well as logistics operations to move products through the supply chain. Products are marketed domestically to food retailers, foodservice distributors, restaurant operators, hotel chains and noncommercial foodservice establishments such as schools, healthcare facilities, the military and other food processors, as well as to international markets.
Pork:
Pork operations include processing live market hogs and fabricating pork carcasses into primal and sub-primal cuts and case-ready products. This segment also includes our live swine group, related allied product processing activities and logistics operations to move products through the supply chain. Products are marketed domestically to food retailers, foodservice distributors, restaurant operators, hotel chains and noncommercial foodservice establishments such as schools, healthcare facilities, the military and other food processors, as well as to international markets.
Prepared Foods:
Prepared Foods operations include manufacturing and marketing frozen and refrigerated food products and logistics operations to move products through the supply chain. Products include pepperoni, bacon, beef and pork pizza toppings, pizza crusts, flour and corn tortilla products, appetizers, prepared meals, ethnic foods, soups, sauces, side dishes, meat dishes and processed meats. Products are marketed domestically to food retailers, foodservice distributors, restaurant operators, hotel chains and noncommercial foodservice establishments such as schools, healthcare facilities, the military and other food processors, as well as to international markets.
2
We have a 50/50 joint venture with Syntroleum Corporation, called Dynamic Fuels LLC (Dynamic Fuels), which produces renewable synthetic fuels. Construction of production facilities was completed in late fiscal 2010, and initial production began in October 2010. The plant was idled in October 2012 for scheduled maintenance and plant upgrades, which were completed in December 2012. Since then, the plant has remained idled. The results from Dynamic Fuels are included in Other.
RAW MATERIALS AND SOURCES OF SUPPLY
Chicken:
The primary raw materials used in our chicken operations are corn and soybean meal used as feed and live chickens raised primarily by independent contract growers. Our vertically-integrated chicken process begins with the grandparent breeder flocks and ends with broilers for processing. Breeder flocks (i.e., grandparents) are raised to maturity in grandparent growing and laying farms where fertile eggs are produced. Fertile eggs are incubated at the grandparent hatchery and produce pullets (i.e., parents). Pullets are sent to breeder houses, and the resulting eggs are sent to our hatcheries. Once chicks have hatched, they are sent to broiler farms. There, contract growers care for and raise the chicks according to our standards, with advice from our technical service personnel, until the broilers reach the desired processing weight. Adult chickens are transported to processing plants where they are slaughtered and converted into finished products, which are then sent to distribution centers and delivered to customers.
We operate our own feed mills to produce scientifically-formulated feeds. In fiscal
2013
, corn, soybean meal and other feed ingredients were major production costs, representing roughly
71%
of our cost of growing a live chicken. In addition to feed ingredients to grow the chickens, we use cooking ingredients, packaging materials and cryogenic agents. We believe our sources of supply for these materials are adequate for our present needs, and we do not anticipate any difficulty in acquiring these materials in the future. While we produce nearly all our inventory of breeder chickens and live broilers, we also purchase live, ice-packed or deboned chicken to meet production and sales requirements.
Beef:
The primary raw materials used in our beef operations are live cattle. We do not have facilities of our own to raise cattle but employ cattle buyers located throughout cattle producing areas who visit independent feed yards and public auctions and buy live cattle on the open spot market. These buyers are trained to select high quality animals, and we continually measure their performance. We also enter into various risk-sharing and procurement arrangements with producers to secure a supply of livestock for our facilities. We believe the sources of supply of live cattle are adequate for our present needs.
Pork:
The primary raw materials used in our pork operations are live hogs. The majority of our live hog supply is obtained through various procurement relationships with independent producers. We employ buyers who make purchase agreements of various time durations as well as purchase hogs on a daily basis, generally a few days before the animals are processed. These buyers are trained to select high quality animals, and we continually measure their performance. We believe the sources of supply of live hogs are adequate for our present needs. Additionally, we raise a number of weanling swine to sell to independent finishers and supply a minimal amount of live swine for our own processing needs.
Prepared Foods:
The primary raw materials used in our prepared foods operations are commodity based raw materials, including chicken, beef, pork, corn, flour and vegetables. Some of these raw materials are provided by our other segments, while others may be purchased from numerous suppliers and manufacturers. We believe the sources of supply of raw materials are adequate for our present needs.
SEASONAL DEMAND
Demand for chicken and beef products generally increases during the spring and summer months and generally decreases during the winter months. Pork and prepared foods products generally experience increased demand during the winter months, primarily due to the holiday season, while demand generally decreases during the spring and summer months.
CUSTOMERS
Wal-Mart Stores, Inc. accounted for
13.0%
of our fiscal
2013
consolidated sales. Sales to Wal-Mart Stores, Inc. were included in the Chicken, Beef, Pork and Prepared Foods segments. Any extended discontinuance of sales to this customer could, if not replaced, have a material impact on our operations. No other single customer or customer group represented more than 10% of fiscal
2013
consolidated sales.
3
COMPETITION
Our food products compete with those of other food producers and processors and certain prepared food manufacturers. Additionally, our food products compete in markets around the world.
We seek to achieve a leading market position for our products via our principal marketing and competitive strategy, which includes:
|
•
|
identifying target markets for value-added products;
|
|
•
|
concentrating production, sales and marketing efforts to appeal to and enhance demand from those markets; and
|
|
•
|
utilizing our national distribution systems and customer support services.
|
Past efforts indicate customer demand can be increased and sustained through application of our marketing strategy, as supported by our distribution systems. The principal competitive elements are price, product safety and quality, brand identification, breadth and depth of product offerings, availability of products, customer service and credit terms.
INTERNATIONAL
We sold products to approximately
130
countries in fiscal
2013
. Major sales markets include Brazil, Canada, Central America, China, the European Union, Japan, Mexico, the Middle East, South Korea, Taiwan, and Vietnam.
We have the following international operations:
|
•
|
Tyson de Mexico, a Mexican subsidiary, is a vertically-integrated poultry production company;
|
|
•
|
Cobb-Vantress, a chicken breeding stock subsidiary, has business interests in Argentina, Brazil, China, the Dominican Republic, India, Japan, the Netherlands, Peru, the Philippines, Russia, Spain, Sri Lanka, Thailand, Turkey, the United Kingdom and Venezuela;
|
|
•
|
Tyson do Brazil, a Brazilian subsidiary, is a vertically-integrated poultry production operation;
|
|
•
|
Tyson Rizhao, located in Rizhao, China, is a vertically-integrated poultry production operation;
|
|
•
|
Tyson Dalong, a joint venture in China in which we have a majority interest, is a chicken further processing facility;
|
|
•
|
Tyson Nantong, located in Nantong, China, is a vertically-integrated poultry production operation; and
|
|
•
|
Godrej Tyson Foods, a joint venture in India in which we have a majority interest, is a poultry processing business.
|
Our Tyson Rizhao and Tyson Nantong subsidiaries are currently in start-up phase. We continue to evaluate growth opportunities in foreign countries. Additional information regarding export sales, long-lived assets located in foreign countries and income (loss) from foreign operations is set forth in Part II, Item 8, Notes to Consolidated Financial Statements, Note 17: Segment Reporting and Note 9: Income Taxes.
RESEARCH AND DEVELOPMENT
We conduct continuous research and development activities to improve product development, to automate manual processes in our processing plants and growout operations, and to improve chicken breeding stock. Our Discovery Center includes 19 research kitchens and a USDA-inspected pilot plant. The Discovery Center enables us to bring new market-leading retail and foodservice products to the customer quickly and efficiently. Research and development costs totaled
$50 million
,
$43 million
, and
$42 million
in fiscal
2013
,
2012
and
2011
, respectively.
ENVIRONMENTAL REGULATION AND FOOD SAFETY
Our facilities for processing chicken, beef, pork and prepared foods, milling feed and housing live chickens and swine are subject to a variety of federal, state and local environmental laws and regulations, which include provisions relating to the discharge of materials into the environment and generally provide for protection of the environment. We believe we are in substantial compliance with such applicable laws and regulations and are not aware of any violations of such laws and regulations likely to result in material penalties or material increases in compliance costs. The cost of compliance with such laws and regulations has not had a material adverse effect on our capital expenditures, earnings or competitive position, and except as described below, is not anticipated to have a material adverse effect in the future.
Congress and the United States Environmental Protection Agency are considering various options to control greenhouse gas emissions. It is unclear at this time when or if such options will be finalized, or what the final form may be. Due to the uncertainty surrounding this issue, it is premature to speculate on the specific nature of impacts that imposition of greenhouse gas emission controls would have on us, and whether such impacts would have a material adverse effect.
4
We work to ensure our products meet high standards of food safety and quality. In addition to our own internal Food Safety and Quality Assurance oversight and review, our chicken, beef, pork and prepared foods products are subject to inspection prior to distribution, primarily by the United States Department of Agriculture (USDA) and the United States Food and Drug Administration (FDA). We are also participants in the United States Hazard Analysis Critical Control Point (HACCP) program and are subject to the Sanitation Standard Operating Procedures and the Public Health Security and Bioterrorism Preparedness and Response Act of 2002.
EMPLOYEES AND LABOR RELATIONS
As of
September 28, 2013
, we employed approximately
115,000
employees. Approximately
99,000
employees were employed in the United States and
16,000
employees were in foreign countries, primarily China, Mexico and Brazil. Approximately
30,000
employees in the United States were subject to collective bargaining agreements with various labor unions, with approximately
27%
of those employees included under agreements expiring in fiscal
2014
. The remaining agreements expire over the next several years. Approximately
8,000
employees in foreign countries were subject to collective bargaining agreements. We believe our overall relations with our workforce are good.
MARKETING AND DISTRIBUTION
Our principal marketing objective is to be the primary provider of chicken, beef, pork and prepared foods products for our customers and consumers. As such, we utilize our national distribution system and customer support services to achieve the leading market position for our products. On an ongoing basis, we identify distinct markets and business opportunities through continuous consumer and market research. In addition to supporting strong regional brands across multiple protein lines, we build the Tyson brand and Tyson owned brands primarily through well-defined product-specific advertising and public relations efforts focused toward key consumer targets with specific needs. These efforts are designed to present key Tyson products as everyday solutions to relevant consumer problems thereby becoming part of regular eating routines.
We have the ability to produce and ship fresh, frozen and refrigerated products worldwide. Domestically, our distribution system extends to a broad network of food distributors and is supported by our owned or leased cold storage warehouses, public cold storage facilities and our transportation system. Our distribution centers accumulate fresh and frozen products so we can fill and consolidate partial-truckload orders into full truckloads, thereby decreasing shipping costs while increasing customer service. In addition, we provide our customers a wide selection of products that do not require large volume orders. Our distribution system enables us to supply large or small quantities of products to meet customer requirements anywhere in the continental United States. Internationally, we utilize both rail and truck refrigerated transportation to domestic ports, where consolidations take place to transport to foreign destinations.
PATENTS AND TRADEMARKS
We have filed a number of patents and trademarks relating to our processes and products that either have been approved or are in the process of application. Because we do a significant amount of brand name and product line advertising to promote our products, we consider the protection of our trademarks to be important to our marketing efforts. We also have developed non-public proprietary information regarding our production processes and other product-related matters. We utilize internal procedures and safeguards to protect the confidentiality of such information and, where appropriate, seek patent and/or trademark protection for the technology we utilize.
INDUSTRY PRACTICES
Our agreements with customers are generally short-term, primarily due to the nature of our products, industry practices and fluctuations in supply, demand and price for such products. In certain instances where we are selling further processed products to large customers, we may enter into written agreements whereby we will act as the exclusive or preferred supplier to the customer, with pricing terms that are either fixed or variable.
AVAILABILITY OF SEC FILINGS AND CORPORATE GOVERNANCE DOCUMENTS ON INTERNET WEBSITE
We maintain an internet website for investors at http://ir.tyson.com. On this website, we make available, free of charge, annual reports on Form 10-K, quarterly reports on Form 10-Q, current reports on Form 8-K, XBRL (eXtensible Business Reporting Language)reports, and all amendments to any of those reports, as soon as reasonably practicable after we electronically file such reports with, or furnish to, the Securities and Exchange Commission. Also available on the website for investors are the Corporate Governance Principles, Audit Committee charter, Compensation and Leadership Development Committee charter, Governance and Nominating Committee charter, Strategy and Acquisitions Committee charter, Code of Conduct and Whistleblower Policy. Our corporate governance documents are available in print, free of charge to any shareholder who requests them.
5
CAUTIONARY STATEMENTS RELEVANT TO FORWARD-LOOKING INFORMATION FOR THE PURPOSE OF “SAFE HARBOR” PROVISIONS OF THE PRIVATE SECURITIES LITIGATION REFORM ACT OF 1995
Certain information in this report constitutes forward-looking statements. Such forward-looking statements include, but are not limited to, current views and estimates of our outlook for fiscal 2014, other future economic circumstances, industry conditions in domestic and international markets, our performance and financial results (e.g., debt levels, return on invested capital, value-added product growth, capital expenditures, tax rates, access to foreign markets and dividend policy). These forward-looking statements are subject to a number of factors and uncertainties that could cause our actual results and experiences to differ materially from anticipated results and expectations expressed in such forward-looking statements. We wish to caution readers not to place undue reliance on any forward-looking statements, which speak only as of the date made. We undertake no obligation to update any forward-looking statements, whether as a result of new information, future events or otherwise.
Among the factors that may cause actual results and experiences to differ from anticipated results and expectations expressed in such forward-looking statements are the following: (i) the effect of, or changes in, general economic conditions; (ii) fluctuations in the cost and availability of inputs and raw materials, such as live cattle, live swine, feed grains (including corn and soybean meal) and energy; (iii) market conditions for finished products, including competition from other global and domestic food processors, supply and pricing of competing products and alternative proteins and demand for alternative proteins; (iv) successful rationalization of existing facilities and operating efficiencies of the facilities; (v) risks associated with our commodity purchasing activities; (vi) access to foreign markets together with foreign economic conditions, including currency fluctuations, import/export restrictions and foreign politics; (vii) outbreak of a livestock disease (such as avian influenza (AI) or bovine spongiform encephalopathy (BSE)), which could have an adverse effect on livestock we own, the availability of livestock we purchase, consumer perception of certain protein products or our ability to access certain domestic and foreign markets; (viii) changes in availability and relative costs of labor and contract growers and our ability to maintain good relationships with employees, labor unions, contract growers and independent producers providing us livestock; (ix) issues related to food safety, including costs resulting from product recalls, regulatory compliance and any related claims or litigation; (x) changes in consumer preference and diets and our ability to identify and react to consumer trends; (xi) significant marketing plan changes by large customers or loss of one or more large customers; (xii) adverse results from litigation; (xiii) risks associated with leverage, including cost increases due to rising interest rates or changes in debt ratings or outlook; (xiv) compliance with and changes to regulations and laws (both domestic and foreign), including changes in accounting standards, tax laws, environmental laws, agricultural laws and occupational, health and safety laws; (xv) our ability to make effective acquisitions or joint ventures and successfully integrate newly acquired businesses into existing operations; (xvi) effectiveness of advertising and marketing programs; and (xvii) those factors listed under Item 1A. “Risk Factors.”
These risks, which should be considered carefully with the information provided elsewhere in this report, could materially adversely affect our business, financial condition or results of operations. Additional risks and uncertainties not currently known to us or that we currently deem to be immaterial also may materially adversely affect our business, financial condition or results of operations.
Fluctuations in commodity prices and in the availability of raw materials, especially feed grains, live cattle, live swine and other inputs could negatively impact our earnings.
Our results of operations and financial condition are dependent upon the cost and supply of raw materials such as feed grains, live cattle, live swine, energy and ingredients, as well as the selling prices for our products, many of which are determined by constantly changing market forces of supply and demand over which we have limited or no control. Corn, soybean meal and other feed ingredients are major production costs for vertically-integrated poultry processors such as us, representing roughly
71%
of our cost of growing a live chicken in fiscal
2013
. As a result, fluctuations in prices for these feed ingredients, which include competing demand for corn and soybean meal for use in the manufacture of renewable energy, can adversely affect our earnings. Production of feed ingredients is affected by, among other things, weather patterns throughout the world, the global level of supply inventories and demand for grains and other feed ingredients, as well as agricultural and energy policies of domestic and foreign governments.
We have cattle under contract at feed yards owned by third parties; however, most of the cattle we process are purchased from independent producers. We have cattle buyers located throughout cattle producing areas who visit feed yards and buy live cattle on the open spot market. We also enter into various risk-sharing and procurement arrangements with producers who help secure a supply of livestock for daily start-up operations at our facilities. The majority of our live swine supply is obtained through procurement arrangements with independent producers. We also employ buyers who purchase hogs on a daily basis, generally a few days before the animals are required for processing. In addition, we raise live swine and sell feeder pigs to independent producers for feeding to processing weight and have contract growers feed a minimal amount of company-owned live swine for our own processing needs. Any decrease in the supply of cattle or swine on the spot market could increase the price of these raw materials and further increase per head cost of production due to lower capacity utilization, which could adversely affect our financial results.
6
Market supply and demand and the prices we receive for our products may fluctuate due to competition from other food producers and processors.
We face competition from other food producers and processors. Some of the factors on which we compete and which may drive demand for our products include:
|
•
|
price;
|
|
•
|
product safety and quality;
|
|
•
|
brand identification;
|
|
•
|
breadth and depth of product offerings;
|
|
•
|
availability of our products and competing products;
|
|
•
|
customer service; and
|
|
•
|
credit terms.
|
Demand for our products also is affected by competitors’ promotional spending, the effectiveness of our advertising and marketing programs, and the availability or price of competing proteins.
We attempt to obtain prices for our products that reflect, in part, the price we must pay for the raw materials that go into our products. If we are not able to obtain higher prices for our products when the price we pay for raw materials increases, we may be unable to maintain positive margins.
Outbreaks of livestock diseases can adversely impact our ability to conduct our operations and demand for our products.
Demand for our products can be adversely impacted by outbreaks of livestock diseases, which can have a significant impact on our financial results. Efforts are taken to control disease risks by adherence to good production practices and extensive precautionary measures designed to ensure the health of livestock. However, outbreaks of disease and other events, which may be beyond our control, either in our own livestock or cattle and hogs owned by independent producers who sell livestock to us, could significantly affect demand for our products, consumer perceptions of certain protein products, the availability of livestock for purchase by us and our ability to conduct our operations. Moreover, the outbreak of livestock diseases, particularly in our Chicken segment, could have a significant effect on the livestock we own by requiring us to, among other things, destroy any affected livestock. Furthermore, an outbreak of disease could result in governmental restrictions on the import and export of our products to or from our suppliers, facilities or customers. This could also result in negative publicity that may have an adverse effect on our ability to market our products successfully and on our financial results.
We are subject to risks associated with our international activities, which could negatively affect our sales to customers in foreign countries, as well as our operations and assets in such countries.
In fiscal
2013
, we sold products to approximately
130
countries. Major sales markets include Brazil, Canada, Central America, China, the European Union, Japan, Mexico, the Middle East, South Korea, Taiwan, and Vietnam. Our sales to customers in foreign countries for fiscal
2013
totaled $5.7 billion, of which
$4.2 billion
related to export sales from the United States. In addition, we had approximately
$485 million
of long-lived assets located in foreign countries, primarily Brazil, China, Mexico and India, at the end of fiscal
2013
.
As a result, we are subject to various risks and uncertainties relating to international sales and operations, including:
|
•
|
imposition of tariffs, quotas, trade barriers and other trade protection measures imposed by foreign countries regarding the importation of poultry, beef, pork and prepared foods products, in addition to import or export licensing requirements imposed by various foreign countries;
|
|
•
|
closing of borders by foreign countries to the import of poultry, beef and pork products due to animal disease or other perceived health or safety issues;
|
|
•
|
impact of currency exchange rate fluctuations between the U.S. dollar and foreign currencies, particularly the Brazilian real, the British pound sterling, the Canadian dollar, the Chinese renminbi, the European euro, the Indian rupee and the Mexican peso;
|
|
•
|
political and economic conditions;
|
|
•
|
difficulties and costs to comply with, and enforcement of remedies under, a wide variety of complex domestic and international laws, treaties and regulations, including, without limitation, the United States Foreign Corrupt Practices Act and economic and trade sanctions enforced by the United States Department of the Treasury’s Office of Foreign Assets Control;
|
|
•
|
different regulatory structures and unexpected changes in regulatory environments;
|
|
•
|
tax rates that may exceed those in the United States and earnings that may be subject to withholding requirements and incremental taxes upon repatriation;
|
|
•
|
potentially negative consequences from changes in tax laws; and
|
|
•
|
distribution costs, disruptions in shipping or reduced availability of freight transportation.
|
7
Negative consequences relating to these risks and uncertainties could jeopardize or limit our ability to transact business in one or more of those markets where we operate or in other developing markets and could adversely affect our financial results.
We depend on the availability of, and good relations with, our employees.
We have approximately
115,000
employees, approximately
38,000
of whom are covered by collective bargaining agreements or are members of labor unions. Our operations depend on the availability and relative costs of labor and maintaining good relations with employees and the labor unions. If we fail to maintain good relations with our employees or with the labor unions, we may experience labor strikes or work stoppages, which could adversely affect our financial results.
We depend on contract growers and independent producers to supply us with livestock.
We contract primarily with independent contract growers to raise the live chickens processed in our poultry operations. A majority of our cattle and hogs are purchased from independent producers who sell livestock to us under marketing contracts or on the open market. If we do not attract and maintain contracts with growers or maintain marketing and purchasing relationships with independent producers, our production operations could be negatively affected.
If our products become contaminated, we may be subject to product liability claims and product recalls.
Our products may be subject to contamination by disease-producing organisms or pathogens, such as Listeria monocytogenes, Salmonella and E. coli. These organisms and pathogens are found generally in the environment; therefore, there is a risk that one or more, as a result of food processing, could be present in our products. These organisms and pathogens also can be introduced to our products as a result of improper handling at the further processing, foodservice or consumer level. These risks may be controlled, but may not be eliminated, by adherence to good manufacturing practices and finished product testing. We have little, if any, control over handling procedures once our products have been shipped for distribution. Even an inadvertent shipment of contaminated products may be a violation of law and may lead to increased risk of exposure to product liability claims, product recalls (which may not entirely mitigate the risk of product liability claims), increased scrutiny and penalties, including injunctive relief and plant closings, by federal and state regulatory agencies, and adverse publicity, which could exacerbate the associated negative consumer reaction. Any of these occurrences may have an adverse effect on our financial results.
Our operations are subject to general risks of litigation.
We are involved on an on-going basis in litigation arising in the ordinary course of business or otherwise. Trends in litigation may include class actions involving consumers, shareholders, employees or injured persons, and claims relating to commercial, labor, employment, antitrust, securities or environmental matters. Litigation trends and the outcome of litigation cannot be predicted with certainty and adverse litigation trends and outcomes could adversely affect our financial results.
Our level of indebtedness and the terms of our indebtedness could negatively impact our business and liquidity position.
Our indebtedness, including borrowings under our revolving credit facility, may increase from time to time for various reasons, including fluctuations in operating results, working capital needs, capital expenditures and possible acquisitions, joint ventures or other significant initiatives. Our consolidated indebtedness level could adversely affect our business because:
|
•
|
it may limit or impair our ability to obtain financing in the future;
|
|
•
|
our credit ratings (or any decrease to our credit ratings) could restrict or impede our ability to access capital markets at desired interest rates and increase our borrowing costs;
|
|
•
|
it may reduce our flexibility to respond to changing business and economic conditions or to take advantage of business opportunities that may arise;
|
|
•
|
a portion of our cash flow from operations must be dedicated to interest payments on our indebtedness and is not available for other purposes; and
|
|
•
|
it may restrict our ability to pay dividends.
|
Our revolving credit facility contains affirmative and negative covenants that, among other things, may limit or restrict our ability to: create liens and encumbrances; incur debt; merge, dissolve, liquidate or consolidate; dispose of or transfer assets; change the nature of our business; engage in certain transactions with affiliates; and enter into sale/leaseback or hedging transactions, in each case, subject to certain qualifications and exceptions. In addition, we are required to maintain minimum interest expense coverage and maximum debt to capitalization ratios.
Our 4.50% Senior notes due June 2022 also contain affirmative and negative covenants that, among other things, may limit or restrict our ability to: create liens; engage in certain sale/leaseback transactions; and engage in certain consolidations, mergers and sales of assets.
8
An impairment in the carrying value of goodwill could negatively impact our consolidated results of operations and net worth.
Goodwill is initially recorded at fair value and is not amortized, but is reviewed for impairment at least annually or more frequently if impairment indicators are present. In assessing the carrying value of goodwill, we make estimates and assumptions about sales, operating margins, growth rates and discount rates based on budgets, business plans, economic projections, anticipated future cash flows and marketplace data. There are inherent uncertainties related to these factors and management’s judgment in applying these factors. Goodwill valuations have been calculated principally using an income approach based on the present value of future cash flows of each reporting unit and are believed to reflect market participant views which would exist in an exit transaction. Under the income approach, we are required to make various judgmental assumptions about appropriate discount rates. Disruptions in global credit and other financial markets and deterioration of economic conditions, could, among other things, cause us to increase the discount rate used in the goodwill valuations. We could be required to evaluate the recoverability of goodwill prior to the annual assessment if we experience disruptions to the business, unexpected significant declines in operating results, divestiture of a significant component of our business or sustained market capitalization declines. These types of events and the resulting analyses could result in goodwill impairment charges in the future, which could be substantial. As of
September 28, 2013
, we had
$1.9 billion
of goodwill, which represented approximately
16%
of total assets.
Domestic and international government regulations could impose material costs.
Our operations are subject to extensive federal, state and foreign laws and regulations by authorities that oversee food safety standards and processing, packaging, storage, distribution, advertising, labeling and export of our products. Our facilities for processing chicken, beef, pork, prepared foods and milling feed and for housing live chickens and swine are subject to a variety of international, federal, state and local laws relating to the protection of the environment, including provisions relating to the discharge of materials into the environment, and to the health and safety of our employees. Our domestic chicken, beef and pork processing facilities are participants in the HACCP program and are subject to the Public Health Security and Bioterrorism Preparedness and Response Act of 2002. In addition, our products are subject to inspection prior to distribution, primarily by the USDA and the FDA. Also, our livestock procurement and poultry growout activities are regulated by the Grain Inspection, Packers and Stockyards Administration, which is part of USDA’s Marketing and Regulatory Programs. Loss of or failure to obtain necessary permits and registrations could delay or prevent us from meeting current product demand, introducing new products, building new facilities or acquiring new businesses and could adversely affect operating results. Additionally, we are routinely subject to new or modified laws, regulations and accounting standards. If we are found to be out of compliance with applicable laws and regulations in these or other areas, we could be subject to civil remedies, including fines, injunctions, recalls or asset seizures, as well as potential criminal sanctions, any of which could have an adverse effect on our financial results.
A material acquisition, joint venture or other significant initiative could affect our operations and financial condition.
We periodically evaluate potential acquisitions, joint ventures and other initiatives (collectively, “transactions”), and we may seek to expand our business through the acquisition of companies, processing plants, technologies, products and services, which could include material transactions. A material transaction may involve a number of risks, including:
|
•
|
failure to realize the anticipated benefits of the transaction;
|
|
•
|
difficulty integrating acquired businesses, technologies, operations and personnel with our existing business;
|
|
•
|
diversion of management attention in connection with negotiating transactions and integrating the businesses acquired;
|
|
•
|
exposure to unforeseen or undisclosed liabilities of acquired companies; and
|
|
•
|
the need to obtain additional debt or equity financing for any transaction.
|
We may not be able to address these risks and successfully develop these acquired companies or businesses into profitable units. If we are unable to do this, such expansion could adversely affect our financial results.
Market fluctuations could negatively impact our operating results as we hedge certain transactions.
Our business is exposed to fluctuating market conditions. We use derivative financial instruments to reduce our exposure to various market risks including changes in commodity prices, interest rates and foreign exchange rates. We hold certain positions, primarily in grain and livestock futures, that do not qualify as hedges for financial reporting purposes. These positions are marked to fair value, and the unrealized gains and losses are reported in earnings at each reporting date. Therefore, losses on these contracts will adversely affect our reported operating results. While these contracts reduce our exposure to changes in prices for commodity products, the use of such instruments may ultimately limit our ability to benefit from favorable commodity prices.
Deterioration of economic conditions could negatively impact our business.
Our business may be adversely affected by changes in economic conditions, including inflation, interest rates, access to capital markets, consumer spending rates, energy availability and costs (including fuel surcharges) and the effects of governmental initiatives to manage economic conditions. Any such changes could adversely affect the demand for our products, or the cost and availability of our needed raw materials, cooking ingredients and packaging materials, thereby negatively affecting our financial results.
9
Disruptions in global credit and other financial markets and deterioration of economic conditions could, among other things:
|
•
|
make it more difficult or costly for us to obtain financing for our operations or investments or to refinance our debt in the future;
|
|
•
|
cause our lenders to depart from prior credit industry practice and make more difficult or expensive the granting of any amendment of, or waivers under, our credit agreement to the extent we may seek them in the future;
|
|
•
|
impair the financial condition of some of our customers and suppliers, thereby increasing customer bad debts or non-performance by suppliers;
|
|
•
|
negatively impact global demand for protein products, which could result in a reduction of sales, operating income and cash flows;
|
|
•
|
decrease the value of our investments in equity and debt securities, including our marketable debt securities, company-owned life insurance and pension and other postretirement plan assets;
|
|
•
|
negatively impact our commodity purchasing activities if we are required to record losses related to derivative financial instruments; or
|
|
•
|
impair the financial viability of our insurers.
|
Changes in consumer preference could negatively impact our business.
The food industry in general is subject to changing consumer trends, demands and preferences. Trends within the food industry change often, and failure to identify and react to changes in these trends could lead to, among other things, reduced demand and price reductions for our products, and could have an adverse effect on our financial results.
The loss of one or more of our largest customers could negatively impact our business.
Our business could suffer significant setbacks in sales and operating income if our customers’ plans and/or markets change significantly or if we lost one or more of our largest customers, including, for example, Wal-Mart Stores, Inc., which accounted for
13.0%
of our sales in fiscal
2013
. Many of our agreements with our customers are short-term, primarily due to the nature of our products, industry practice and the fluctuation in demand and price for our products.
The consolidation of customers could negatively impact our business.
Our customers, such as supermarkets, warehouse clubs and food distributors, have consolidated in recent years, and consolidation is expected to continue throughout the United States and in other major markets. These consolidations have produced large, sophisticated customers with increased buying power who are more capable of operating with reduced inventories, opposing price increases, and demanding lower pricing, increased promotional programs and specifically tailored products. These customers also may use shelf space currently used for our products for their own private label products. Because of these trends, our volume growth could slow or we may need to lower prices or increase promotional spending for our products, any of which would adversely affect our financial results.
Extreme factors or forces beyond our control could negatively impact our business.
Natural disasters, fire, bioterrorism, pandemic or extreme weather, including droughts, floods, excessive cold or heat, hurricanes or other storms, could impair the health or growth of livestock or interfere with our operations due to power outages, fuel shortages, damage to our production and processing facilities or disruption of transportation channels, among other things. Any of these factors, as well as disruptions in our information systems, could have an adverse effect on our financial results.
Media campaigns related to food production present risks
.
Media outlets, including new social media platforms, provide the opportunity for individuals or organizations to publicize inappropriate or inaccurate stories or perceptions about our Company or the food production industry. Such practices have the ability to cause damage to our brands, the industry generally, or consumers' perceptions of our Company or the food production industry and may result in negative publicity and adversely affect our financial results.
Our renewable energy ventures and other initiatives might not be successful.
We have been exploring ways to convert animal fats and other by-products from our operations into value-added products. For example, our joint venture Dynamic Fuels produces renewable synthetic fuels. We will continue to explore other ways to commercialize opportunities outside our core business, such as renewable energy and other technologically-advanced platforms. These initiatives might not be as financially successful as we initially announced or might expect due to factors that include, but are not limited to, availability of tax credits, competing energy prices, failure to operate at the volumes anticipated, abilities of our joint venture partners and our limited experience in some of these new areas.
10
Tyson Limited Partnership can exercise significant control.
As of
September 28, 2013
, Tyson Limited Partnership (the TLP) owns
99.981%
of the outstanding shares of the Company's Class B Common Stock, $0.10 par value (Class B stock) and the TLP and members of the Tyson family own, in the aggregate,
2.09%
of the outstanding shares of the Company's Class A Common Stock, $0.10 par value (Class A stock), giving them, collectively, control of approximately
72.46%
of the total voting power of the Company's outstanding voting stock. At this time, the TLP does not have a managing general partner, as such, the management rights of the managing general partner may be exercised by a majority of the percentage interests of the general partners. As of
September 28, 2013
, Mr. John Tyson, Chairman of the Board of Directors, has
33.33%
of the general partner percentage interests, and Ms. Barbara Tyson, a director of the Company, has
11.115%
general partner percentage interests (the remaining general partnership interests are held by the Tyson Partnership Interest Trust (
44.44%
) and Harry C. Erwin, III (
11.115%
)). As a result of these holdings, positions and directorships, the partners in the TLP have the ability to exert substantial influence or actual control over our management and affairs and over substantially all matters requiring action by our stockholders, including amendments to our restated certificate of incorporation and by-laws, the election and removal of directors, any proposed merger, consolidation or sale of all or substantially all of our assets and other corporate transactions. This concentration of ownership may also delay or prevent a change in control otherwise favored by our other stockholders and could depress our stock price. Additionally, as a result of the TLP's significant ownership of our outstanding voting stock, we are eligible for “controlled company” exemptions from certain corporate governance requirements of the New York Stock Exchange.
None
We have production and distribution operations in the following states: Alabama, Arkansas, California, Florida, Georgia, Illinois, Indiana, Iowa, Kansas, Kentucky, Mississippi, Missouri, Nebraska, New Mexico, New York, North Carolina, Oklahoma, Pennsylvania, South Carolina, Tennessee, Texas, Utah, Virginia, Washington and Wisconsin. We also have sales offices throughout the United States. Additionally, we, either directly or through our subsidiaries, have sales offices, facilities or participate in joint venture operations in Argentina, Brazil, China, the Dominican Republic, Hong Kong, India, Ireland, Japan, Mexico, the Netherlands, Peru, the Philippines, Russia, South Korea, Spain, Sri Lanka, Taiwan, Thailand, Turkey, the United Arab Emirates, the United Kingdom and Venezuela.
|
Number of Facilities
|
||||||||
|
Owned
|
|
Leased
|
|
Total
|
|
|||
|
Chicken Segment:
|
||||||||
|
Processing plants
|
55
|
|
2
|
|
57
|
|
||
|
Rendering plants
|
15
|
|
—
|
|
15
|
|
||
|
Blending mills
|
2
|
|
—
|
|
2
|
|
||
|
Feed mills
|
38
|
|
2
|
|
40
|
|
||
|
Broiler hatcheries
|
62
|
|
7
|
|
69
|
|
||
|
Breeder houses
|
499
|
|
751
|
|
1,250
|
|
||
|
Broiler farm houses
|
411
|
|
1,062
|
|
1,473
|
|
||
|
Pet treats plant
|
1
|
|
—
|
|
1
|
|
||
|
Beef Segment Production Facilities
|
13
|
|
—
|
|
13
|
|
||
|
Pork Segment Production Facilities
|
9
|
|
—
|
|
9
|
|
||
|
Prepared Foods Segment Processing Plants
|
22
|
|
3
|
|
25
|
|
||
|
Distribution Centers
|
10
|
|
9
|
|
19
|
|
||
|
Cold Storage Facilities
|
60
|
|
11
|
|
71
|
|
||
|
Capacity
(1)
per week at
September 28, 2013
|
|
Fiscal 2013
Average Capacity
Utilization
|
|
|||||
|
Chicken Processing Plants
|
47 million head
|
|
87
|
%
|
||||
|
Beef Production Facilities
|
173,000 head
|
|
78
|
%
|
||||
|
Pork Production Facilities
|
444,000 head
|
|
88
|
%
|
||||
|
Prepared Foods Processing Plants
|
49 million pounds
|
|
83
|
%
|
||||
|
(1)
|
Capacity based on a five day week for Chicken and Prepared Foods, while Beef and Pork are based on a six day week.
|
11
Chicken:
Chicken processing plants include various phases of slaughtering, dressing, cutting, packaging, deboning and further-processing. We also have 15 animal nutrition operations, which are part of the Chicken rendering plants, and one pet treats plant. The blending mills, feed mills and broiler hatcheries have sufficient capacity to meet the needs of the chicken growout operations.
Beef:
Beef plants include various phases of slaughtering live cattle and fabricating beef products. Some also treat and tan hides. The Beef segment includes three case-ready operations that share facilities with the Pork segment. One of the beef facilities contains a tallow refinery. Carcass facilities reduce live cattle to dressed carcass form. Processing facilities conduct fabricating operations to produce boxed beef and allied products.
Pork:
Pork plants include various phases of slaughtering live hogs and fabricating pork products and allied products. The Pork segment includes three case-ready operations that share facilities with the Beef segment.
Prepared Foods:
Prepared Foods plants process fresh and frozen chicken, beef, pork and other raw materials into pizza toppings, branded and processed meats, appetizers, prepared meals, ethnic foods, soups, sauces, side dishes, pizza crusts, flour and corn tortilla products and meat dishes.
Our Dynamic Fuels joint venture produces renewable synthetic fuels. Construction of production facilities was completed in late fiscal 2010, and initial production began in October 2010. Dynamic Fuels operates one plant with designed annual capacity of 75 million gallons. The plant was idled in October 2012 for scheduled maintenance and plant upgrades, which were completed in December 2012. Since then, the plant has remained idled.
We believe our present facilities are generally adequate and suitable for our current purposes; however, seasonal fluctuations in inventories and production may occur as a reaction to market demands for certain products. We regularly engage in construction and other capital improvement projects intended to expand capacity and improve the efficiency of our processing and support facilities. We also consider the efficiencies of our operations and may from time to time consider changing the number or type of plants we operate to align with our capacity needs.
Refer to the description of certain legal proceedings pending against us under Part II, Item 8, Notes to Consolidated Financial Statements, Note 20: Commitments and Contingencies, which discussion is incorporated herein by reference. Listed below are certain additional legal proceedings involving the Company and/or its subsidiaries.
On May 8, 2008, a lawsuit was filed against the Company and two of our employees in the District Court of McCurtain County, Oklahoma styled Armstrong, et al. v. Tyson Foods, Inc., et al. (the Armstrong Case). The lawsuit was brought by a group of 52 poultry growers who allege that certain of our live production practices in Oklahoma constitute fraudulent inducement, fraud, unjust enrichment, negligence, gross negligence, unconscionability, violations of the Oklahoma Business Sales Act, Deceptive Trade Practice violations, violations of the Consumer Protection Act, and conversion, as well as other theories of recovery. The plaintiffs sought damages in an unspecified amount. On October 30, 2009, 20 additional growers represented by the same attorney filed a lawsuit against us in the same court asserting the same or similar claims, which is styled Clardy, et al. v. Tyson Foods, Inc., et al. (the Clardy Case). In both of these cases we have denied all allegations of wrongdoing. In June 2009, the plaintiffs in the Armstrong case requested an expedited trial date for a smaller group of plaintiffs they claimed were facing imminent financial peril. The Court ultimately severed a group of 10 plaintiffs from the Armstrong Case, and a trial began on March 15, 2010. On April 1, 2010, the jury returned a verdict against us and one of our employees, and on April 2, 2010, the Court entered a judgment in the amount of $8,655,735, which included punitive damages. Subsequent to the trial, the presiding judge disqualified from the cases and the Oklahoma Supreme Court appointed a new judge to the cases. Following this appointment, the trial court granted our motions for change of venue and to stay all future trials of plaintiffs in the Armstrong Case and the Clardy Case pending the outcome of our appeal of the initial Armstrong Case verdict. The trial court took under advisement the sizes of groupings of plaintiffs in future trials in response to our motion to sever the plaintiffs' claims into individual cases. We appealed the initial Armstrong Case verdict to the Oklahoma Supreme Court based on numerous irregularities and rulings during the trial, and the Oklahoma Supreme Court reversed the verdict and remanded the case back to the trial court. At this time, the district court has not set trial dates for the Armstrong Case or the Clardy Case.
In September 2013, the United States Department of Justice (DOJ) alleged that one of our subsidiaries did not comply with the Clean Water Act with respect to a spill that occurred in North Carolina in January 2010. The DOJ is seeking civil penalties, and we are currently engaged in settlement discussions.
Other Matters:
We currently have approximately
115,000
employees and, at any time, have various employment practices matters outstanding. In the aggregate, these matters are significant to the Company, and we devote significant resources to managing employment issues. Additionally, we are subject to other lawsuits, investigations and claims (some of which involve substantial amounts) arising out of the conduct of our business. While the ultimate results of these matters cannot be determined, they are not expected to have a material adverse effect on our consolidated results of operations or financial position.
12
Not applicable.
EXECUTIVE OFFICERS OF THE COMPANY
Our executive officers serve one-year terms from the date of their election, or until their successors are appointed and qualified. No family relationships exist among these officers. The name, title, age and calendar year of initial election to executive office of our executive officers are listed below:
|
Name
|
Title
|
Age
|
Year Elected
Executive Officer
|
|||
|
Curt T. Calaway
|
Senior Vice President, Controller and Chief Accounting Officer
|
40
|
2012
|
|||
|
Howell P. Carper
|
Executive Vice President of Strategy and New Ventures
|
60
|
2013
|
|||
|
Kenneth J. Kimbro
|
Executive Vice President and Chief Human Resources Officer
|
60
|
2009
|
|||
|
Donnie King
|
President of Prepared Foods, Customer and Consumer Solutions
|
51
|
2009
|
|||
|
Dennis Leatherby
|
Executive Vice President and Chief Financial Officer
|
53
|
1994
|
|||
|
James V. Lochner
|
Chief Operating Officer
|
61
|
2005
|
|||
|
Donnie Smith
|
President and Chief Executive Officer
|
54
|
2008
|
|||
|
Stephen Stouffer
|
President of Fresh Meats
|
53
|
2013
|
|||
|
John Tyson
|
Chairman of the Board of Directors
|
60
|
2011
|
|||
|
David L. Van Bebber
|
Executive Vice President and General Counsel
|
57
|
2008
|
|||
|
Noel White
|
President of Poultry
|
55
|
2009
|
|||
Curt T. Calaway was appointed Senior Vice President, Controller and Chief Accounting Officer in 2012, after serving as Vice President, Audit and Compliance since 2008, prior to which he served as the Company's Senior Director of Financial Reporting. Mr. Calaway was initially employed by the Company in 2006.
Howell P. (“Hal”) Carper was appointed Executive Vice President Strategy and New Ventures in 2013, after serving as Group Vice President, Research and Development, Logistics, and Technical Services since 2008, prior to which he served as Senior Vice President, Corporate Research and Development since 2003, and Senior Vice President and General Manager, Foodbrands Foodservice since 2001. Mr. Carper was appointed by IBP, inc. as Senior Vice President, Sales and Marketing in 1999. IBP, inc. was acquired by the Company in 2001. Prior to employment with IBP, inc., he served as Senior Vice President, Sales and Marketing with Foodbrands, Inc., which was acquired by IBP, inc. in 1997.
Kenneth J. Kimbro was appointed Executive Vice President and Chief Human Resources Officer in 2012, after serving as Senior Vice President, Chief Human Resources Officer since 2007, prior to which he served as Senior Vice President, Human Resources. Mr. Kimbro was initially employed by IBP, inc. in 1995.
Donnie King was appointed President of Prepared Foods, Customer and Consumer Solutions in 2013, after serving as Senior Group Vice President, Poultry and Prepared Foods since 2009, after serving as Group Vice President, Refrigerated and Deli since 2008, Group Vice President, Operations since 2007, Senior Vice President, Consumer Products Operations since 2006 and Senior Vice President, Poultry Operations since 2003. Mr. King was initially employed by Valmac Industries, Inc. in 1982. Valmac Industries, Inc. was acquired by the Company in 1984.
Dennis Leatherby was appointed Executive Vice President and Chief Financial Officer in 2008 after serving as Senior Vice President, Finance and Treasurer since 1998. He also served as Interim Chief Financial Officer from 2004 to 2006. Mr. Leatherby was initially employed by the Company in 1990.
James V. Lochner was appointed Chief Operating Officer in 2009, after serving as Senior Group Vice President, Fresh Meats since 2007, prior to which he served as Senior Group Vice President, Fresh Meats and Margin Optimization since 2006 and Senior Group Vice President, Margin Optimization, Purchasing and Logistics since 2005. Mr. Lochner was initially employed by IBP, inc. in 1983.
Donnie Smith was appointed President and Chief Executive Officer in November 2009, after serving as Senior Group Vice President, Poultry and Prepared Foods since January 2009, prior to which he served as Group Vice President of Consumer Products since 2008, Group Vice President of Logistics and Operations Services since 2007, Group Vice President Information Systems, Purchasing and Distribution since 2006 and Senior Vice President and Chief Information Officer since 2005. Mr. Smith was initially employed by the Company in 1980.
13
Stephen R. Stouffer was appointed President of Fresh Meats in 2013, after serving as Senior Vice President, Beef Margin Management since 2012, prior to which he served as Vice President, Ground Beef, Trim and Variety Meats Sales since 2009, and Director, Ground Beef, Trim and Carcass Sales since 2006. Mr. Stouffer was initially employed by IBP, inc. in 1982.
John Tyson has served as Chairman of the Board of Directors since 1998 and was previously Chief Executive Officer of the Company from 2001 until 2006. Mr. Tyson was initially employed by the Company in 1973.
David L. Van Bebber was appointed Executive Vice President and General Counsel in 2008, after serving as Senior Vice President and Deputy General Counsel since 2004. Mr. Van Bebber was initially employed by Lane Processing in 1982. Lane Processing was acquired by the Company in 1986.
Noel White was appointed President of Poultry in 2013, after serving as Senior Group Vice President, Fresh Meats since 2009, after serving as Senior Vice President, Pork Margin Management since 2007 and Group Vice President, Fresh Meats Operations/Commodity Sales since 2005. Mr. White was initially employed by IBP, inc. in 1983.
Carper, King, Stouffer and White were appointed to their new positions on November 14, 2013, and it is expected that these officers will fully transition to their respective positions by the end of the second quarter of fiscal 2014. On November 18, 2013, Mr. Lochner announced his decision to retire in September 2014.
14
We have issued and outstanding two classes of capital stock, Class A stock and Class B stock. Holders of Class B stock may convert such stock into Class A stock on a share-for-share basis. Holders of Class B stock are entitled to 10 votes per share and holders of Class A stock are entitled to one vote per share on matters submitted to shareholders for approval. As of
October 26, 2013
, there were approximately 24,000 holders of record of our Class A stock and eight holders of record of our Class B stock, excluding holders in the security position listings held by nominees.
DIVIDENDS
Cash dividends cannot be paid to holders of Class B stock unless they are simultaneously paid to holders of Class A stock. The per share amount of the cash dividend paid to holders of Class B stock cannot exceed 90% of the cash dividend simultaneously paid to holders of Class A stock. We have paid uninterrupted quarterly dividends on common stock each year since 1977. In fiscal
2013
, the annual dividend rate for Class A stock was $0.20 per share and the annual dividend rate for Class B stock was $0.18 per share. In fiscal
2012
, the annual dividend rate for Class A stock was $0.16 per share and the annual dividend rate for Class B stock was $0.144 per share. On November 15, 2012, the Board of Directors declared a special dividend of $0.10 per share for Class A stock and $0.09 per share for Class B stock, which was payable on December 14, 2012, to shareholders of record on November 30, 2012. Additionally, on November 14, 2013, the Board of Directors increased the quarterly dividend previously declared on August 1, 2013, to $0.075 per share on our Class A common stock and $0.0675 per share on our Class B common stock. The increased quarterly dividend is payable on December 13, 2013, to shareholders of record at the close of business on November 29, 2013.
MARKET INFORMATION
Our Class A stock is traded on the New York Stock Exchange under the symbol “TSN.” No public trading market currently exists for our Class B stock. The high and low closing sales prices of our Class A stock for each quarter of fiscal
2013
and
2012
are represented in the table below.
|
2013
|
2012
|
||||||||||||||
|
High
|
|
Low
|
|
High
|
|
Low
|
|
||||||||
|
First Quarter
|
$
|
19.79
|
|
$
|
16.02
|
|
$
|
20.91
|
|
$
|
16.68
|
|
|||
|
Second Quarter
|
24.82
|
|
19.40
|
|
20.37
|
|
18.52
|
|
|||||||
|
Third Quarter
|
25.88
|
|
23.26
|
|
19.58
|
|
17.66
|
|
|||||||
|
Fourth Quarter
|
31.83
|
|
26.03
|
|
18.56
|
|
14.17
|
|
|||||||
ISSUER PURCHASES OF EQUITY SECURITIES
The table below provides information regarding our purchases of Class A stock during the periods indicated.
|
Period
|
Total
Number of
Shares
Purchased
|
|
Average
Price Paid
per Share
|
|
Total Number of Shares
Purchased as Part of
Publicly Announced
Plans or Programs
|
|
Maximum Number of
Shares that May Yet Be
Purchased Under the Plans
or Programs
(1)
|
|
|||
|
Jun. 30, 2013 to Jul. 27, 2013
|
148,092
|
|
$
|
26.48
|
|
—
|
|
24,021,002
|
|
||
|
Jul. 28, 2013 to Aug. 31, 2013
|
5,359,099
|
|
31.13
|
|
5,074,839
|
|
18,946,163
|
|
|||
|
Sept. 1, 2013 to Sept. 28, 2013
|
4,887,545
|
|
29.68
|
|
4,773,867
|
|
14,172,296
|
|
|||
|
Total
|
10,394,736
|
|
(2)
|
$
|
30.38
|
|
9,848,706
|
|
(3)
|
14,172,296
|
|
|
(1)
|
On February 7, 2003, we announced our Board of Directors approved a program to repurchase up to 25 million shares of Class A stock from time to time in open market or privately negotiated transactions. The program has no fixed or scheduled termination date. On May 3, 2012, our Board of Directors approved an increase of 35 million shares authorized for repurchase under this program.
|
|
(2)
|
We purchased 546,030 shares during the period that were not made pursuant to our previously announced stock repurchase program, but were purchased to fund certain Company obligations under our equity compensation plans. These transactions included 451,243 shares purchased in open market transactions and 94,787 shares withheld to cover required tax withholdings on the vesting of restricted stock.
|
|
(3)
|
These shares were purchased during the period pursuant to our previously announced stock repurchase program.
|
15
PERFORMANCE GRAPH
The following graph shows a five-year comparison of cumulative total returns for our Class A stock, the Standard & Poor’s (S&P) 500 Index and a group of peer companies described below.
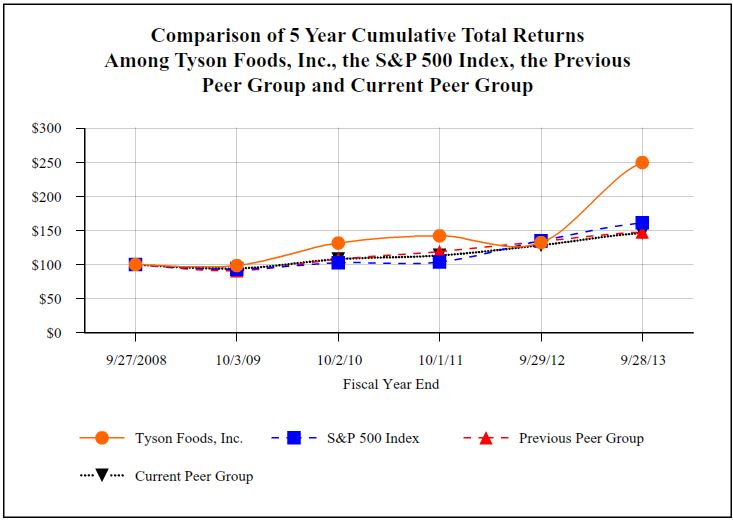
|
Fiscal Years Ending
|
|||||||||||||||||||||||
|
Base Period
9/27/08
|
|
10/3/09
|
|
10/2/10
|
|
10/1/11
|
|
9/29/12
|
|
9/28/13
|
|
||||||||||||
|
Tyson Foods, Inc.
|
$
|
100.00
|
|
$
|
98.76
|
|
$
|
131.69
|
|
$
|
141.88
|
|
$
|
132.08
|
|
$
|
249.51
|
|
|||||
|
S&P 500 Index
|
100.00
|
|
93.09
|
|
102.55
|
|
103.72
|
|
135.05
|
|
161.17
|
|
|||||||||||
|
Previous Peer Group
|
100.00
|
|
90.91
|
|
107.82
|
|
119.21
|
|
133.98
|
|
147.62
|
|
|||||||||||
|
Current Peer Group
|
100.00
|
|
94.35
|
|
107.96
|
|
113.44
|
|
128.37
|
|
146.05
|
|
|||||||||||
The total cumulative return on investment (change in the year-end stock price plus reinvested dividends), which is based on the stock price or composite index at the end of fiscal 2008, is presented for each of the periods for the Company, the S&P 500 Index, the previous peer group and the current peer group. Beginning in fiscal 2013, the Company’s Compensation and Leadership Development Committee selected a new peer group to more accurately reflect the Company’s peers in terms of industry standing and compensation benchmarking. The previous peer group includes: Campbell Soup Company, ConAgra Foods, Inc., General Mills, Inc., H.J. Heinz Co. (up to June 7, 2013), Hershey Foods Corp., Hormel Foods Corp., Kellogg Co., McCormick & Co., Pilgrim’s Pride Corporation, Sara Lee Corp. (up to June 28, 2012), Hillshire Brands Co. (beginning on June 28, 2012) and Smithfield Foods, Inc. (up to September 26, 2013). The current peer group includes: Archer-Daniels-Midland Company, Bunge Limited, Campbell Soup Company, ConAgra Foods, Inc., Dean Foods Company, General Mills, Inc., H.J. Heinz Co. (up to June 7, 2013), Hillshire Brands Co. (beginning on June 28, 2012), Hormel Foods Corp., Kellog Co., Kraft Foods Group Inc., McCormick & Co., Pilgrim's Pride Corporation, Sanderson Farms, Inc., Smithfield Foods, Inc. (up to September 26, 2013) and The J.M. Smucker Company. H.J. Heinz Co. and Smithfield Foods, Inc. were removed at the time their shares ceased public trading. Sara Lee Corp. changed its name to Hillshire Brands Co. following a spin-off of certain of its international businesses. The graph compares the performance of the Company with that of the S&P 500 Index and both peer groups, with the investment weighted on market capitalization.
16
FIVE-YEAR FINANCIAL SUMMARY
|
in millions, except per share and ratio data
|
|||||||||||||||||||
|
2013
|
|
2012
|
|
2011
|
|
2010
|
|
2009
|
|
||||||||||
|
Summary of Operations
|
|||||||||||||||||||
|
Sales
|
$
|
34,374
|
|
$
|
33,055
|
|
$
|
32,032
|
|
$
|
28,212
|
|
$
|
26,704
|
|
||||
|
Goodwill impairment
|
—
|
|
—
|
|
—
|
|
29
|
|
560
|
|
|||||||||
|
Operating income (loss)
|
1,375
|
|
1,286
|
|
1,289
|
|
1,574
|
|
(215
|
)
|
|||||||||
|
Net interest expense
|
138
|
|
344
|
|
231
|
|
333
|
|
310
|
|
|||||||||
|
Income (loss) from continuing operations
|
848
|
|
614
|
|
738
|
|
783
|
|
(550
|
)
|
|||||||||
|
Loss from discontinued operation, net of tax
|
(70
|
)
|
(38
|
)
|
(5
|
)
|
(18
|
)
|
(1
|
)
|
|||||||||
|
Net income (loss)
|
778
|
|
576
|
|
733
|
|
765
|
|
(551
|
)
|
|||||||||
|
Net income (loss) attributable to Tyson
|
778
|
|
583
|
|
750
|
|
780
|
|
(547
|
)
|
|||||||||
|
Diluted net income (loss) per share attributable to Tyson:
|
|||||||||||||||||||
|
Income (loss) from continuing operations
|
2.31
|
|
1.68
|
|
1.98
|
|
2.09
|
|
(1.47
|
)
|
|||||||||
|
Loss from discontinued operation
|
(0.19
|
)
|
(0.10
|
)
|
(0.01
|
)
|
(0.03
|
)
|
—
|
|
|||||||||
|
Net income (loss)
|
2.12
|
|
1.58
|
|
1.97
|
|
2.06
|
|
(1.47
|
)
|
|||||||||
|
Dividends declared per share:
|
|||||||||||||||||||
|
Class A
|
0.310
|
|
0.160
|
|
0.160
|
|
0.160
|
|
0.160
|
|
|||||||||
|
Class B
|
0.279
|
|
0.144
|
|
0.144
|
|
0.144
|
|
0.144
|
|
|||||||||
|
Balance Sheet Data
|
|||||||||||||||||||
|
Cash and cash equivalents
|
$
|
1,145
|
|
$
|
1,071
|
|
$
|
716
|
|
$
|
978
|
|
$
|
1,004
|
|
||||
|
Total assets
|
12,177
|
|
11,896
|
|
11,071
|
|
10,752
|
|
10,595
|
|
|||||||||
|
Total debt
|
2,408
|
|
2,432
|
|
2,182
|
|
2,536
|
|
3,477
|
|
|||||||||
|
Shareholders’ equity
|
6,233
|
|
6,042
|
|
5,685
|
|
5,201
|
|
4,431
|
|
|||||||||
|
Other Key Financial Measures
|
|||||||||||||||||||
|
Depreciation and amortization
|
$
|
519
|
|
$
|
499
|
|
$
|
506
|
|
$
|
497
|
|
$
|
513
|
|
||||
|
Capital expenditures
|
558
|
|
690
|
|
643
|
|
550
|
|
368
|
|
|||||||||
|
Return on invested capital
|
18.5
|
%
|
17.7
|
%
|
18.5
|
%
|
23.0
|
%
|
(3.0
|
)%
|
|||||||||
|
Effective tax rate for continuing operations
|
32.6
|
%
|
36.4
|
%
|
31.6
|
%
|
35.9
|
%
|
(1.5
|
)%
|
|||||||||
|
Total debt to capitalization
|
27.9
|
%
|
28.7
|
%
|
27.7
|
%
|
32.8
|
%
|
44.0
|
%
|
|||||||||
|
Book value per share
|
$
|
18.13
|
|
$
|
16.84
|
|
$
|
15.38
|
|
$
|
13.78
|
|
$
|
11.77
|
|
||||
|
Closing stock price high
|
31.83
|
|
20.91
|
|
19.92
|
|
20.40
|
|
13.88
|
|
|||||||||
|
Closing stock price low
|
16.02
|
|
14.17
|
|
14.84
|
|
12.02
|
|
4.40
|
|
|||||||||
Notes to Five-Year Financial Summary
|
a.
|
Fiscal 2013 included a $19 million currency translation adjustment gain recognized in conjunction with the receipt of proceeds constituting the final resolution of our investment in Canada.
|
|
b.
|
Fiscal 2012 included a pretax charge of $167 million related to the early extinguishment of debt.
|
|
c.
|
Fiscal 2011 included an $11 million non-operating gain related to the sale of interest in an equity method investment and a $21 million reduction to income tax expense related to a reversal of reserves for foreign uncertain tax positions.
|
|
d.
|
Fiscal 2010 included $61 million of interest expense related to losses on notes repurchased/redeemed during fiscal 2010, a $29 million non-tax deductible charge related to a full goodwill impairment related to an immaterial Chicken segment reporting unit and a $12 million non-operating charge related to the partial impairment of an equity method investment. Additionally, fiscal 2010 included insurance proceeds received of $38 million related to Hurricane Katrina.
|
|
e.
|
Fiscal 2009 was a 53-week year, while the other years presented were 52-week years.
|
|
f.
|
Fiscal 2009 included a $560 million non-tax deductible charge related to Beef segment goodwill impairment and a $15 million pretax charge related to closing a prepared foods plant.
|
|
g.
|
Return on invested capital is calculated by dividing operating income (loss) by the sum of the average of beginning and ending total debt and shareholders’ equity less cash and cash equivalents.
|
|
h.
|
For the total debt to capitalization calculation, capitalization is defined as total debt plus total shareholders’ equity.
|
|
i.
|
During fiscal 2013 we determined our Weifang operation (Weifang) was no longer core to the execution of our strategy in China. In July 2013, we completed the sale of Weifang. Non-cash charges related to the impairment of assets in Weifang amounted to $56 million and $15 million in the third quarter of fiscal 2013 and the fourth quarter of fiscal 2012, respectively. Weifang's results are reflected as a discontinued operation for all periods presented.
|
|
j.
|
Fiscal 2009 included the sale of the beef processing, cattle feed yard and fertilizer assets of three of our Alberta, Canada subsidiaries (collectively, Lakeside). Lakeside was reported as a discontinued operation for all periods presented.
|
17
DESCRIPTION OF THE COMPANY
We are one of the world’s largest meat protein companies and the second-largest food production company in the
Fortune
500 with one of the most recognized brand names in the food industry. We produce, distribute and market chicken, beef, pork, prepared foods and related allied products. Our operations are conducted in four segments: Chicken, Beef, Pork and Prepared Foods. Some of the key factors influencing our business are customer demand for our products; the ability to maintain and grow relationships with customers and introduce new and innovative products to the marketplace; accessibility of international markets; market prices for our products; the cost and availability of live cattle and hogs, raw materials, feed ingredients; and operating efficiencies of our facilities.
OVERVIEW
|
•
|
General – Operating income grew 7% in fiscal 2013 over fiscal 2012, which was led by record earnings in our Chicken segment and improved performance in our Beef segment. Revenues increased 4% to a record $34.4 billion, driven by price and mix improvements. We were able to overcome a $1.2 billion increase in input costs through strong operational execution and margin management. The following are a few of the key drivers:
|
|
•
|
We continued to execute our strategy of accelerating growth in domestic value-added chicken sales, prepared food sales and international chicken production, innovating products, services and customer insights and cultivating our talent development to support Tyson's growth for the future.
|
|
•
|
Market environment – Our Chicken segment delivered record results in fiscal 2013 driven by strong demand and favorable domestic market conditions. The Chicken segment experienced increased feed costs but was able to offset the impact with operational, mix and price improvements. Our Beef segment’s operating performance improved, despite lower domestic availability of fed cattle supplies, due to better operational execution, less volatile live cattle markets, and stronger export markets. Our Pork segment results remained within its normalized operating margin range, but were down slightly from last year due to periods of increased domestic availability of pork products. Our Prepared Foods segment was challenged by product mix and rapidly increasing raw material prices.
|
|
•
|
Discontinued Operation – After conducting an assessment during fiscal 2013 of our long-term business strategy in China, we determined our Weifang operation (Weifang), which was part of our Chicken segment, was no longer core to the execution of our strategy given the capital investment it required to execute our future business plan. We completed the sale of Weifang in July 2013. Weifang's results are reported as a discontinued operation for all periods presented.
|
|
•
|
Margins – Our total operating margin was
4.0%
in fiscal
2013
. Operating margins by segment were as follows:
|
|
•
|
Chicken –
5.3%
Beef –
2.1%
Pork –
6.1%
Prepared Foods –
3.0%
|
|
•
|
Debt and Liquidity – During fiscal
2013
, we generated
$1.3 billion
of operating cash flows. We repurchased
21.1 million
shares of our stock for
$550 million
under our share repurchase program in fiscal
2013
. At
September 28, 2013
, we had
$2.1 billion
of liquidity, which includes the availability under our credit facility and
$1.1 billion
of cash and cash equivalents.
|
|
•
|
Our accounting cycle resulted in a 52-week year for fiscal 2013, 2012 and 2011.
|
|
in millions, except per share data
|
|||||||||||
|
2013
|
|
2012
|
|
2011
|
|
||||||
|
Net income from continuing operations attributable to Tyson
|
$
|
848
|
|
$
|
621
|
|
$
|
752
|
|
||
|
Net income from continuing operations attributable to Tyson – per diluted share
|
2.31
|
|
1.68
|
|
1.98
|
|
|||||
|
Net loss from discontinued operation attributable to Tyson
|
(70
|
)
|
(38
|
)
|
(2
|
)
|
|||||
|
Net loss from discontinued operation attributable to Tyson – per diluted share
|
(0.19
|
)
|
(0.10
|
)
|
(0.01
|
)
|
|||||
|
Net income attributable to Tyson
|
778
|
|
583
|
|
750
|
|
|||||
|
Net income attributable to Tyson - per diluted share
|
2.12
|
|
1.58
|
|
1.97
|
|
|||||
2013
– Net income included the following item:
|
•
|
$19 million, or $0.05 per diluted share, related to recognized currency translation adjustment gain.
|
2012
– Net income included the following item:
|
•
|
$167 million pretax charge, or $0.29 per diluted share, related to the early extinguishment of debt.
|
2011
– Net income included the following items:
|
•
|
$11 million gain, or $0.03 per diluted share, related to a sale of interests in an equity method investment; and
|
|
•
|
$21 million reduction to income tax expense, or $0.05 per diluted share, related to a reversal of reserves for foreign uncertain tax positions.
|
18
SUMMARY OF RESULTS
|
Sales
|
in millions
|
||||||||||
|
2013
|
|
2012
|
|
2011
|
|
||||||
|
Sales
|
$
|
34,374
|
|
$
|
33,055
|
|
$
|
32,032
|
|
||
|
Change in sales volume
|
(0.2
|
)%
|
(4.3
|
)%
|
|||||||
|
Change in average sales price
|
4.6
|
%
|
7.8
|
%
|
|||||||
|
Sales growth
|
4.0
|
%
|
3.2
|
%
|
|||||||
2013 vs. 2012 –
|
•
|
Sales Volume
– Sales were negatively impacted by a slight decrease in sales volume, which accounted for a decrease of $255 million. This was primarily due to decreases in the Beef and Pork segments, partially offset by increases in the Chicken and Prepared Foods segments.
|
|
•
|
Average Sales Price
– Sales were positively impacted by higher average sales prices, which accounted for an increase of approximately $1.6 billion. All segments experienced increased average sales prices, largely due to continued tight domestic availability of protein, increased pricing associated with rising live and raw material costs, and improved mix. The majority of the increase was driven by the Chicken and Beef segments.
|
2012 vs. 2011 –
|
•
|
Sales Volume
– Sales were negatively impacted by a decrease in sales volume, which accounted for a decrease of $1.7 billion. All segments, with the exception of the Pork segment, had a decrease in sales volume, with the majority of the decrease in the Beef segment.
|
|
•
|
Average Sales Price
– The increase in sales was largely due to an increase in average sales prices, which accounted for an increase of approximately $2.7 billion. All segments, with the exception of the Pork segment, had an increase in average sales prices largely due to continued tight domestic availability of protein and increased live and raw material costs. These increases were partially offset by a decrease in average sales price in the Pork segment which was driven down by lower live hog costs.
|
|
Cost of Sales
|
in millions
|
||||||||||
|
2013
|
|
2012
|
|
2011
|
|
||||||
|
Cost of sales
|
$
|
32,016
|
|
$
|
30,865
|
|
$
|
29,837
|
|
||
|
Gross profit
|
2,358
|
|
2,190
|
|
2,195
|
|
|||||
|
Cost of sales as a percentage of sales
|
93.1
|
%
|
93.4
|
%
|
93.1
|
%
|
|||||
2013 vs. 2012 –
|
•
|
Cost of sales increased by approximately $1.2 billion due to higher input cost per pound.
|
|
•
|
The $1.2 billion impact of higher input costs was primarily driven by:
|
|
•
|
Increase in feed costs of $470 million in our Chicken segment.
|
|
•
|
Increase in live cattle and hog costs of approximately $395 million.
|
|
•
|
Increase in raw material and other input costs in our Prepared Foods segment of approximately $110 million.
|
|
•
|
Increase due to net losses of $15 million in fiscal 2013, compared to net gains of approximately $66 million in fiscal 2012, from our Pork segment commodity risk management activities. These amounts exclude the impact from related physical purchase transactions, which impact future period operating results.
|
2012 vs. 2011 –
|
•
|
Cost of sales increased by approximately $1.0 billion. Higher input cost per pound increased cost of sales by approximately $2.2 billion, while lower sales volume decreased cost of sales $1.2 billion.
|
|
•
|
The $2.2 billion impact of higher input costs per pound was primarily driven by:
|
|
•
|
Increase in live cattle and hog costs of approximately $1.5 billion.
|
|
•
|
Increase in feed costs of $320 million and increase in other growout operating costs of $50 million in our Chicken segment.
|
|
•
|
The $1.2 billion impact of lower sales volumes was driven by decreases in our Chicken, Beef and Prepared Foods segments, partially offset by an increase in sales volume in our Pork segment.
|
19
|
Selling, General and Administrative
|
in millions
|
||||||||||
|
2013
|
|
2012
|
|
2011
|
|
||||||
|
Selling, general and administrative
|
$
|
983
|
|
$
|
904
|
|
$
|
906
|
|
||
|
As a percentage of sales
|
2.9
|
%
|
2.7
|
%
|
2.8
|
%
|
|||||
2013 vs. 2012 –
|
•
|
Increase of $79 million in selling, general and administrative is primarily driven by:
|
|
•
|
Increase of $44 million related to employee costs including payroll and stock-based and incentive-based compensation.
|
|
•
|
Increase of $32 million related to advertising and sales promotions.
|
|
Interest Income
|
in millions
|
||||||||||
|
2013
|
|
2012
|
|
2011
|
|
||||||
|
$
|
(7
|
)
|
$
|
(12
|
)
|
$
|
(11
|
)
|
|||
2013/2012/2011
– Interest income remained relatively flat due to continued low interest rates.
|
Interest Expense
|
in millions
|
||||||||||
|
2013
|
|
2012
|
|
2011
|
|
||||||
|
Cash interest expense
|
$
|
117
|
|
$
|
151
|
|
$
|
195
|
|
||
|
Loss on early extinguishment of debt
|
—
|
|
167
|
|
—
|
|
|||||
|
Losses on notes repurchased
|
—
|
|
—
|
|
7
|
|
|||||
|
Non-cash interest expense
|
28
|
|
38
|
|
40
|
|
|||||
|
Total Interest Expense
|
$
|
145
|
|
$
|
356
|
|
$
|
242
|
|
||
2013/2012/2011 –
|
•
|
Cash interest expense included interest expense related to the coupon rates for senior notes and commitment/letter of credit fees incurred on our revolving credit facilities. The decrease in cash interest expense in fiscal 2013 is due to lower average coupon rates compared to fiscal 2012 and 2011. This decrease is driven by the full extinguishment of the 10.50% Senior Notes due 2014 (2014 Notes) in fiscal 2012, partially offset with the 4.5% Senior Notes due 2022 (2022 Notes) issued in fiscal 2012.
|
|
•
|
Loss on early extinguishment of debt included the amount paid exceeding the par value of debt, unamortized discount and unamortized debt issuance costs related to the full extinguishment of the 2014 Notes.
|
|
•
|
Losses on notes repurchased during fiscal 2011 included the amount paid exceeding the carrying value of the notes repurchased, which primarily included the repurchases of the 8.25% Notes due October 2011 (2011 Notes) and the 6.60% Senior Notes due April 2016 (2016 Notes).
|
|
•
|
Non-cash interest expense primarily included interest related to the amortization of debt issuance costs and discounts/premiums on note issuances. This includes debt issuance costs incurred on our revolving credit facility, the 2014 Notes and the accretion of the debt discount on the 3.25% Convertible Senior Notes due 2013 (2013 Notes).
|
|
Other (Income) Expense, net
|
in millions
|
||||||||||
|
2013
|
|
2012
|
|
2011
|
|
||||||
|
$
|
(20
|
)
|
$
|
(23
|
)
|
$
|
(20
|
)
|
|||
2013
–
Included $19 million related to recognized currency translation adjustment gain.
2012
–
Included $16 million of equity earnings in joint ventures and $4 million in net foreign currency exchange gains.
2011
–
Included $11 million gain related to a sale of interests in an equity method investment.
20
|
Effective Tax Rate
|
||||||||
|
2013
|
|
2012
|
|
2011
|
|
|||
|
32.6
|
%
|
36.4
|
%
|
31.6
|
%
|
|||
The effective tax rate on continuing operations was impacted by a number of items which result in a difference between our effective tax rate and the U.S. statutory rate of 35%. The table below reflects significant items impacting the rate as indicated.
2013 –
|
•
|
Domestic production activity deduction reduced the rate 3.2%.
|
|
•
|
General business credits reduced the rate 1.3%.
|
|
•
|
State income taxes increased the rate 2.4%.
|
2012 –
|
•
|
Domestic production activity deduction reduced the rate 1.8%.
|
|
•
|
General business credits reduced the rate 0.7%.
|
|
•
|
State income taxes increased the rate 1.5%.
|
|
•
|
Foreign rate differences and valuation allowances increased the rate 1.8%.
|
2011 –
|
•
|
Domestic production activity deduction reduced the rate 2.3%.
|
|
•
|
General business credits reduced the rate 0.9%.
|
|
•
|
State income taxes increased the rate 1.6%.
|
SEGMENT RESULTS
We operate in four segments: Chicken, Beef, Pork and Prepared Foods. The following table is a summary of sales and operating income (loss), which is how we measure segment income (loss).
|
in millions
|
|
||||||||||||||||||||||
|
Sales
|
Operating Income (Loss)
|
||||||||||||||||||||||
|
2013
|
|
2012
|
|
2011
|
|
2013
|
|
2012
|
|
2011
|
|
||||||||||||
|
Chicken
|
$
|
12,296
|
|
$
|
11,368
|
|
$
|
10,783
|
|
$
|
646
|
|
$
|
484
|
|
$
|
168
|
|
|||||
|
Beef
|
14,400
|
|
13,755
|
|
13,549
|
|
296
|
|
218
|
|
468
|
|
|||||||||||
|
Pork
|
5,408
|
|
5,510
|
|
5,460
|
|
332
|
|
417
|
|
560
|
|
|||||||||||
|
Prepared Foods
|
3,322
|
|
3,237
|
|
3,215
|
|
101
|
|
181
|
|
117
|
|
|||||||||||
|
Other
|
46
|
|
167
|
|
127
|
|
—
|
|
(14
|
)
|
(24
|
)
|
|||||||||||
|
Intersegment Sales
|
(1,098
|
)
|
(982
|
)
|
(1,102
|
)
|
—
|
|
—
|
|
—
|
|
|||||||||||
|
Total
|
$
|
34,374
|
|
$
|
33,055
|
|
$
|
32,032
|
|
$
|
1,375
|
|
$
|
1,286
|
|
$
|
1,289
|
|
|||||
21
|
Chicken Segment Results
|
in millions
|
|
|||||||||||||||||
|
2013
|
|
2012
|
|
Change 2013
vs. 2012
|
|
2011
|
|
Change 2012
vs. 2011
|
|
||||||||||
|
Sales
|
$
|
12,296
|
|
$
|
11,368
|
|
$
|
928
|
|
$
|
10,783
|
|
$
|
585
|
|
||||
|
Sales Volume Change
|
1.9
|
%
|
(3.5
|
)%
|
|||||||||||||||
|
Average Sales Price Change
|
6.1
|
%
|
9.3
|
%
|
|||||||||||||||
|
Operating Income
|
$
|
646
|
|
$
|
484
|
|
$
|
162
|
|
$
|
168
|
|
$
|
316
|
|
||||
|
Operating Margin
|
5.3
|
%
|
4.3
|
%
|
1.6
|
%
|
|||||||||||||
2013 vs. 2012 –
|
•
|
Sales Volume –
Sales volumes grew due to increased domestic and international production driven by stronger demand for our chicken products.
|
|
•
|
Average Sales Price –
The increase in average sales price was primarily due to mix changes and price increases associated with higher input costs. Since many of our sales contracts are formula based or shorter-term in nature, we were able to offset rising input costs through improved pricing and mix.
|
|
•
|
Operating Income –
Operating income was positively impacted by increased average sales price, improved live performance and operational execution, as well as improved performance in our foreign-produced operations. These increases were partially offset by increased feed costs of $470 million.
|
2012 vs. 2011 –
|
•
|
Sales Volume –
The decrease in sales volumes in fiscal 2012 was primarily attributable to the impact of domestic production cuts we made in late fiscal 2011 and maintained throughout fiscal 2012, in order to balance our supply with forecasted customer demand. These production cuts reduced our total domestic slaughter pounds by approximately 4% in fiscal 2012, but were partially offset by increases in international sales volumes and open-market meat purchases.
|
|
•
|
Average Sales Price –
The increase in average sales prices is primarily due to mix changes and price increases associated with reduced industry supply and increased input costs.
|
|
•
|
Operating Income –
The increase in operating income was largely due to the increase in average sales price and operational improvements, partially offset by reduced sales volumes, increased grain, feed ingredients and other growout costs and losses incurred in our foreign start-up businesses.
|
|
•
|
Feed Costs – Operating results were negatively impacted in fiscal 2012 by an increase in feed costs of $320 million and an increase in other growout operating costs of $50 million.
|
|
•
|
Operational Improvements – Operating results were positively impacted by approximately $115 million of operational improvements, primarily attributed to improvements in yield, mix and processing optimization.
|
|
•
|
Start-up Businesses – Our foreign start-up businesses in Brazil and China incurred operating losses of approximately $70 million in fiscal 2012.
|
22
|
Beef Segment Results
|
in millions
|
|
|||||||||||||||||
|
2013
|
|
2012
|
|
Change 2013
vs. 2012
|
|
2011
|
|
Change 2012
vs. 2011
|
|
||||||||||
|
Sales
|
$
|
14,400
|
|
$
|
13,755
|
|
$
|
645
|
|
$
|
13,549
|
|
$
|
206
|
|
||||
|
Sales Volume Change
|
(1.8
|
)%
|
(11.3
|
)%
|
|||||||||||||||
|
Average Sales Price Change
|
6.6
|
%
|
14.4
|
%
|
|||||||||||||||
|
Operating Income
|
$
|
296
|
|
$
|
218
|
|
$
|
78
|
|
$
|
468
|
|
$
|
(250
|
)
|
||||
|
Operating Margin
|
2.1
|
%
|
1.6
|
%
|
3.5
|
%
|
|||||||||||||
2013 vs. 2012 –
|
•
|
Sales Volume –
Sales volume decreased due to less outside trim and tallow purchases, partially offset by increased production volumes.
|
|
•
|
Average Sales Price –
Average sales price increased due to lower domestic availability of fed cattle supplies, which drove up livestock costs.
|
|
•
|
Operating Income –
Operating income increased due to improved operational execution, less volatile live cattle markets and improved export markets, partially offset by increased operating costs.
|
2012 vs. 2011 –
|
•
|
Sales and Operating Income –
|
|
•
|
Average sales price increased due to price increases associated with increased livestock costs. Sales volume decreased due to a reduction in live cattle processed and outside tallow purchases. Operating income decreased due to higher fed cattle costs and periods of reduced demand for beef products, which made it difficult to pass along increased input costs, as well as lower sales volumes and increased employee related operating costs.
|
|
Pork Segment Results
|
in millions
|
|
|||||||||||||||||
|
2013
|
|
2012
|
|
Change 2013
vs. 2012
|
|
2011
|
|
Change 2012
vs. 2011
|
|
||||||||||
|
Sales
|
$
|
5,408
|
|
$
|
5,510
|
|
$
|
(102
|
)
|
$
|
5,460
|
|
$
|
50
|
|
||||
|
Sales Volume Change
|
(3.6
|
)%
|
2.4
|
%
|
|||||||||||||||
|
Average Sales Price Change
|
1.9
|
%
|
(1.5
|
)%
|
|||||||||||||||
|
Operating Income
|
$
|
332
|
|
$
|
417
|
|
$
|
(85
|
)
|
$
|
560
|
|
$
|
(143
|
)
|
||||
|
Operating Margin
|
6.1
|
%
|
7.6
|
%
|
10.3
|
%
|
|||||||||||||
2013 vs. 2012 –
|
•
|
Sales Volume –
Sales volume decreased as a result of balancing our supply with customer demand and reduced exports.
|
|
•
|
Average Sales Price –
Demand for pork products improved, which drove up average sales price and livestock cost despite a slight increase in live hog supplies.
|
|
•
|
Operating Income –
While reduced compared to prior year, operating income remained strong in fiscal 2013 despite brief periods of imbalance in industry supply and customer demand. We were able to maintain strong operating margins by maximizing our revenues relative to the live hog markets, partially due to operational and mix performance.
|
|
•
|
Derivative Activities –
Operating results included net losses of $15 million in fiscal 2013, compared to net gains of $66 million in fiscal 2012 for commodity risk management activities related to futures contracts. These amounts exclude the impact from related physical sale and purchase transactions, which impact current and future period operating results.
|
2012 vs. 2011 –
|
•
|
Sales and Operating Income –
|
|
•
|
Average sales price decreased due to increased domestic availability of pork products, which drove lower live hog costs. Operating income decreased due to compressed pork margins caused by the excess domestic availability of pork products. We were able to maintain strong operating margins by maximizing our revenues relative to the live hog markets, partially due to strong export sales and operational and mix performance.
|
|
•
|
Derivative Activities – Operating results included net gains of $66 million in fiscal 2012, compared to net losses of $32 million in fiscal 2011 from commodity risk management activities related to futures contracts. These amounts exclude the impact from related physical sale and purchase transactions, which impact current and future period operating results.
|
23
|
Prepared Foods Segment Results
|
in millions
|
||||||||||||||||||
|
2013
|
|
2012
|
|
Change 2013
vs. 2012
|
|
2011
|
|
Change 2012
vs. 2011
|
|
||||||||||
|
Sales
|
$
|
3,322
|
|
$
|
3,237
|
|
$
|
85
|
|
$
|
3,215
|
|
$
|
22
|
|
||||
|
Sales Volume Change
|
1.9
|
%
|
(0.9
|
)%
|
|||||||||||||||
|
Average Sales Price Change
|
0.7
|
%
|
1.6
|
%
|
|||||||||||||||
|
Operating Income
|
$
|
101
|
|
$
|
181
|
|
$
|
(80
|
)
|
$
|
117
|
|
$
|
64
|
|
||||
|
Operating Margin
|
3.0
|
%
|
5.6
|
%
|
3.6
|
%
|
|||||||||||||
2013 vs. 2012 –
|
•
|
Sales Volume –
Sales volume increased as a result of improved demand for our prepared products and incremental volumes from the purchase of two businesses in fiscal 2013.
|
|
•
|
Average Sales Price –
Average sales price increased due to price increases associated with higher input costs.
|
|
•
|
Operating Income –
Operating income decreased, despite increases in sales volumes and average sales price, as the result of increased raw material and other input costs of approximately $110 million and additional costs incurred as we invested in our lunchmeat business and growth platforms. Because many of our sales contracts are formula based or shorter-term in nature, we are typically able to offset rising input costs through pricing. However, there is a lag time for price increases to take effect.
|
2012 vs. 2011 –
|
•
|
Sales and Operating Income –
Operating margins were positively impacted by lower raw material costs of $75 million and increased average sales prices, which were partially offset by lower volumes and increased operational costs of approximately $30 million, largely due to costs related to revamping our lunchmeat business and the start-up of a new pepperoni plant. Because many of our sales contracts are formula based or shorter-term in nature, we typically offset changing input costs through pricing. However, there is a lag time for price changes to take effect, which is what we experienced during fiscal 2011.
|
24
FISCAL 2014 OUTLOOK
In fiscal 2014, we expect overall domestic protein production (chicken, beef, pork and turkey) to increase approximately 1% from fiscal 2013 levels. Grain supplies are expected to increase in fiscal 2014, which should result in lower input costs. The following is a summary of the fiscal 2014 outlook for each of our segments, as well as an outlook on sales, capital expenditures, net interest expense, debt and liquidity, share repurchases and dividends:
|
•
|
Chicken
– We expect domestic chicken production to increase 3-4% in fiscal 2014 compared to fiscal 2013. Based on current futures prices, we expect lower feed costs in fiscal 2014 compared to fiscal 2013 of approximately $500 million. Many of our sales contracts are formula based or shorter-term in nature, which allows us to adjust pricing when input costs fluctuate. However, there may be a lag time for price changes to take effect. For fiscal 2014, we believe our Chicken segment will be in or above its normalized range of 5.0%-7.0%.
|
|
•
|
Beef
– We expect to see a reduction of industry fed cattle supplies of 2-3% in fiscal 2014 as compared to fiscal 2013. Although we generally expect adequate supplies in regions we operate our plants, there may be periods of imbalance of fed cattle supply and demand. For fiscal 2014, we believe our Beef segment's profitability will be similar to fiscal 2013, but could be below its normalized range of 2.5%-4.5%.
|
|
•
|
Pork
– We expect industry hog supplies to increase 1-2% in fiscal 2014 and exports to improve compared to fiscal 2013. For fiscal 2014, we believe our Pork segment will be in its normalized range of 6.0%-8.0%.
|
|
•
|
Prepared Foods
– We expect operational improvements and pricing to offset increased raw material costs. Because many of our sales contracts are formula based or shorter-term in nature, we are typically able to offset rising input costs through increased pricing. As we continue to invest heavily in our growth platforms, we believe our Prepared Foods segment could be slightly below its normalized range of 4.0%-6.0% for fiscal 2014.
|
|
•
|
Sales
– We expect fiscal 2014 sales to approximate $36 billion as we continue to execute our strategy of accelerating growth in domestic value-added chicken sales, prepared food sales and international chicken production.
|
|
•
|
Capital Expenditures
– We expect fiscal 2014 capital expenditures to approximate $700 million.
|
|
•
|
Net Interest Expense
– We expect net interest expense will approximate $100 million for fiscal 2014.
|
|
•
|
Debt and Liquidity
– Total liquidity at
September 28, 2013
, was
$2.1 billion
, well above our goal to maintain liquidity in excess of $1.2 billion. In October 2013, our 2013 notes, with a principal amount of $458 million, matured and we paid them off using cash on hand.
|
|
•
|
Share Repurchases
– We expect to continue repurchasing shares under our share repurchase program. As of
September 28, 2013
,
14.2 million
shares remain authorized for repurchases. The timing and extent to which we repurchase shares will depend upon, among other things, our working capital needs, market conditions, liquidity targets, our debt obligations and regulatory requirements.
|
|
•
|
Dividends
– On November 14, 2013, the Board of Directors increased the quarterly dividend previously declared on August 1, 2013, to $0.075 per share on our Class A common stock and $0.0675 per share on our Class B common stock. The increased quarterly dividend is payable on December 13, 2013, to shareholders of record at the close of business on November 29, 2013. The Board also declared a quarterly dividend of $0.075 per share on our Class A common stock and $0.0675 per share on our Class B common stock, payable on March 14, 2014, to shareholders of record at the close of business on February 28, 2014.
|
25
LIQUIDITY AND CAPITAL RESOURCES
Our cash needs for working capital, capital expenditures, growth opportunities, the repurchases of senior notes and share repurchases are expected to be met with current cash on hand, cash flows provided by operating activities, or short-term borrowings. Based on our current expectations, we believe our liquidity and capital resources will be sufficient to operate our business. However, we may take advantage of opportunities to generate additional liquidity or refinance existing debt through capital market transactions. The amount, nature and timing of any capital market transactions will depend on our operating performance and other circumstances; our then-current commitments and obligations; the amount, nature and timing of our capital requirements; any limitations imposed by our current credit arrangements; and overall market conditions.
|
Cash Flows from Operating Activities
|
in millions
|
||||||||||
|
2013
|
|
2012
|
|
2011
|
|
||||||
|
Net income
|
$
|
778
|
|
$
|
576
|
|
$
|
733
|
|
||
|
Non-cash items in net income:
|
|||||||||||
|
Depreciation and amortization
|
519
|
|
499
|
|
506
|
|
|||||
|
Deferred income taxes
|
(12
|
)
|
140
|
|
86
|
|
|||||
|
Loss on early extinguishment of debt
|
—
|
|
167
|
|
—
|
|
|||||
|
Impairment of assets
|
74
|
|
34
|
|
18
|
|
|||||
|
Other, net
|
26
|
|
18
|
|
49
|
|
|||||
|
Net changes in working capital
|
(71
|
)
|
(247
|
)
|
(346
|
)
|
|||||
|
Net cash provided by operating activities
|
$
|
1,314
|
|
$
|
1,187
|
|
$
|
1,046
|
|
||
|
•
|
Cash flows associated with Loss on early extinguishment of debt included the amount paid exceeding the par value of debt, unamortized discount and unamortized debt issuance costs related to the full extinguishment of the 2014 Notes.
|
|
•
|
Cash flows associated with changes in working capital:
|
|
•
|
2013 –
Decreased primarily due to a higher accounts receivable balance, partially offset by increases in accrued salaries, wages and benefits and income tax payable. The higher accounts receivable balance is largely due to significant increases in input costs and price increases associated with the increased input costs.
|
|
•
|
2012 –
Decreased due to the increase in inventory and accounts receivable balances, partially offset by the increase in accounts payable. The higher inventory and accounts receivable balances were driven by significant increases in input costs and price increases associated with the increased input costs.
|
|
•
|
2011 –
Decreased due to the increase in inventory and accounts receivable balances, partially offset by the increase in accounts payable. The higher inventory and accounts receivable balances were driven by significant increases in input costs and price increases associated with the increased input costs.
|
|
Cash Flows from Investing Activities
|
in millions
|
|
|||||||||
|
2013
|
|
2012
|
|
2011
|
|
||||||
|
Additions to property, plant and equipment
|
$
|
(558
|
)
|
$
|
(690
|
)
|
$
|
(643
|
)
|
||
|
Purchases of marketable securities, net
|
(18
|
)
|
(11
|
)
|
(80
|
)
|
|||||
|
Proceeds from notes receivable
|
—
|
|
—
|
|
51
|
|
|||||
|
Acquisitions, net of cash acquired
|
(106
|
)
|
—
|
|
—
|
|
|||||
|
Other, net
|
39
|
|
41
|
|
28
|
|
|||||
|
Net cash used for investing activities
|
$
|
(643
|
)
|
$
|
(660
|
)
|
$
|
(644
|
)
|
||
|
•
|
Additions to property, plant and equipment include acquiring new equipment and upgrading our facilities to maintain competitive standing and position us for future opportunities. In fiscal 2013, 2012, and 2011, our capital spending was primarily for production efficiencies in our operations and for ongoing development of foreign operations.
|
|
•
|
Capital spending for fiscal 2014 is expected to approximate $700 million, and will include spending on our operations for production and labor efficiencies, yield improvements and sales channel flexibility, as well as expansion of our foreign operations.
|
|
•
|
Purchases of marketable securities included funding for our deferred compensation plans.
|
|
•
|
Proceeds from notes receivable totaling $51 million in fiscal 2011 related to the collection of notes receivable received in conjunction with the sale of a business operation in fiscal 2009.
|
|
•
|
Acquisitions in fiscal 2013 related to acquiring two value-added food businesses as part of our strategic expansion initiative which are included in our Prepared Foods segment.
|
26
|
Cash Flows from Financing Activities
|
in millions
|
|
|||||||||
|
2013
|
|
2012
|
|
2011
|
|
||||||
|
Payments on debt
|
$
|
(91
|
)
|
$
|
(993
|
)
|
$
|
(500
|
)
|
||
|
Net proceeds from borrowings
|
68
|
|
1,116
|
|
115
|
|
|||||
|
Purchase of redeemable noncontrolling interest
|
—
|
|
—
|
|
(66
|
)
|
|||||
|
Purchases of Tyson Class A common stock
|
(614
|
)
|
(264
|
)
|
(207
|
)
|
|||||
|
Dividends
|
(104
|
)
|
(57
|
)
|
(59
|
)
|
|||||
|
Stock options exercised
|
123
|
|
34
|
|
51
|
|
|||||
|
Other, net
|
18
|
|
(7
|
)
|
8
|
|
|||||
|
Net cash used for financing activities
|
$
|
(600
|
)
|
$
|
(171
|
)
|
$
|
(658
|
)
|
||
|
•
|
Payments on debt included –
|
|
•
|
2013 – $91 million primarily related to borrowings at our foreign operations.
|
|
•
|
2012 – $885 million for the extinguishment of the 2014 Notes and $103 million related to borrowings at our foreign operations.
|
|
•
|
2011 – $315 million of 2011 Notes; $63 million of 2016 Notes; $2 million of 7.0% Notes due May 2018 (2018 Notes); and $103 million related to borrowings at our foreign operations.
|
|
•
|
Net proceeds from borrowings included –
|
|
•
|
2013 – $68 million primarily from our foreign operations. Total debt related to our foreign operations was $60 million at
September 28, 2013
($40 million current, $20 million long-term).
|
|
•
|
2012 – We received net proceeds of $995 million from the issuance of the 2022 Notes. We used the net proceeds towards the extinguishment of the 2014 Notes, including the payments of accrued interest and related premiums, and general corporate purposes. Additionally, our foreign operations received proceeds of $115 million from borrowings. Total debt related to our foreign operations was $102 million at September 29, 2012 ($62 million current, $40 million long-term).
|
|
•
|
2011 – Our foreign operations received proceeds of $106 million from borrowings. Total debt related to our foreign operations was $98 million at October 1, 2011 ($58 million current, $40 million long-term). Additionally, Dynamic Fuels received $9 million in proceeds from short-term notes in fiscal 2011.
|
|
•
|
In fiscal 2011, the minority interest partner in our 60%-owned Shandong Tyson Xinchang Foods joint ventures in China exercised put options requiring us to purchase its entire 40% equity interest. The transaction closed in fiscal 2011 for cash consideration totaling $66 million.
|
|
•
|
Purchases of Tyson Class A common stock include –
|
|
•
|
$550 million, $230 million and $170 million for shares repurchased pursuant to our share repurchase program in fiscal 2013, 2012 and 2011, respectively; and
|
|
•
|
$64 million, $34 million and $37 million for shares repurchased to fund certain obligations under our equity compensation plans in fiscal 2013, 2012 and 2011, respectively.
|
27
|
Liquidity
|
in millions
|
|
||||||||||||||||
|
Commitments
Expiration Date
|
Facility
Amount
|
|
Outstanding Letters of
Credit under Revolving
Credit Facility (no draw downs)
|
|
Amount
Borrowed
|
|
Amount
Available
|
|
||||||||||
|
Cash and cash equivalents
|
$
|
1,145
|
|
|||||||||||||||
|
Short-term investments
|
1
|
|
||||||||||||||||
|
Revolving credit facility
|
August 2017
|
$
|
1,000
|
|
$
|
42
|
|
$
|
—
|
|
958
|
|
||||||
|
Total liquidity
|
$
|
2,104
|
|
|||||||||||||||
|
•
|
The revolving credit facility supports our short-term funding needs and letters of credit. The letters of credit issued under this facility are primarily in support of workers’ compensation insurance programs and derivative activities.
|
|
•
|
Our 2013 Notes matured in October 2013. Upon maturity, we paid the $458 million principal value with cash on hand, and settled the conversion premium by issuing 11.7 million shares of our Class A stock from available treasury shares. Simultaneous to the settlement of the conversion premium, we received 11.7 million shares of our Class A stock from call options we entered into concurrently with the 2013 Note issuance.
|
|
•
|
At
September 28, 2013
, approximately
34%
of our cash was held in the international accounts of our foreign subsidiaries.
|
Generally, we do not rely on the foreign cash as a source of funds to support our ongoing domestic liquidity needs. Rather, we manage our worldwide cash requirements by reviewing available funds among our foreign subsidiaries and the cost effectiveness with which those funds can be accessed. The repatriation of cash balances from certain of our subsidiaries could have adverse tax consequences or be subject to regulatory capital requirements; however, those balances are generally available without legal restrictions to fund ordinary business operations. Our U.S. income taxes, net of applicable foreign tax credits, have not been provided on undistributed earnings of foreign subsidiaries. Our intention is to reinvest these earnings permanently or to repatriate the earnings only when it is tax effective to do so.
|
•
|
Our current ratio was
1.86
to 1 and
1.91
to 1 at
September 28, 2013
, and
September 29, 2012
, respectively.
|
Capital Resources
Credit Facility
Cash flows from operating activities and current cash on hand are our primary sources of liquidity for funding debt service, capital expenditures, dividends and share repurchases. We also have a revolving credit facility, with a committed maximum capacity of $1.0 billion, to provide additional liquidity for working capital needs, letters of credit and a source of financing for growth opportunities. As of
September 28, 2013
, we had outstanding letters of credit totaling
$42 million
issued under this facility, none of which were drawn upon, which left
$958 million
available for borrowing. Our revolving credit facility is funded by a syndicate of 44 banks, with commitments ranging from $0.3 million to $90 million per bank. The syndicate includes bank holding companies that are required to be adequately capitalized under federal bank regulatory agency requirements.
Capitalization
To monitor our credit ratings and our capacity for long-term financing, we consider various qualitative and quantitative factors. We monitor the ratio of our debt to our total capitalization as support for our long-term financing decisions. At
September 28, 2013
, and
September 29, 2012
, the ratio of our debt-to-total capitalization was
27.9%
and
28.7%
, respectively. For the purpose of this calculation, debt is defined as the sum of current and long-term debt. Total capitalization is defined as debt plus Total Shareholders’ Equity.
Warrants
In September 2008, in conjunction with the issuance of convertible bonds, we sold warrants in private transactions for total proceeds of $44 million. The warrants permit the purchasers to acquire up to approximately 27 million shares of our Class A stock at the current exercise price of $22.16 per share, subject to adjustment. The warrants are exercisable on various dates from January 2014 through April 2014. A 10% increase in our share price above the $22.16 warrant exercise price would result in the issuance of 2.5 million incremental shares. At $28.60, our closing share price on September 28, 2013, the incremental shares we would be required to issue upon exercise of the warrants would have resulted in 6.1 million shares.
Credit Ratings
2016 Notes
On February 24, 2011, Standard & Poor's Ratings Services, a Standard & Poor's Financial Services LLC business (S&P) upgraded the credit rating of these notes from "BB+" to "BBB-." On March 29, 2011, Moody's Investors Services, Inc. (Moody's) upgraded the credit rating of these notes from "Ba2" to "Ba1." These upgrades decreased the interest rate on the 2016 Notes from 7.35% to 6.85%, effective beginning with the six-month interest payment due April 1, 2011.
On June 7, 2012, Moody's upgraded the credit rating of these notes from "Ba1" to "Baa3." This upgrade decreased the interest rate on the 2016 Notes from 6.85% to 6.60%, effective beginning with the six-month interest payment due October 1, 2012.
28
On February 11, 2013, S&P upgraded the credit rating of the 2016 Notes from "BBB-" to "BBB." This upgrade did not impact the interest rate on the 2016 Notes.
A one-notch downgrade by Moody's would increase the interest rates on the 2016 Notes by 0.25%. A two-notch downgrade from S&P would increase the interest rates on the 2016 Notes by 0.25%.
Revolving Credit Facility
S&P’s corporate credit rating for Tyson Foods, Inc. is "BBB." Moody’s senior, unsecured, subsidiary guaranteed long-term debt rating for Tyson Foods, Inc. is "Baa3." Fitch Ratings', a wholly owned subsidiary of Fimalac, S.A. (Fitch), issuer default rating for Tyson Foods, Inc. is "BBB." The below table outlines the fees paid on the unused portion of the facility (Facility Fee Rate) and letter of credit fees (Undrawn Letter of Credit Fee and Borrowing Spread) depending on the rating levels of Tyson Foods, Inc. from S&P, Moody's and Fitch.
|
Ratings Level (S&P/Moody's/Fitch)
|
Facility Fee
Rate
|
|
Undrawn Letter of
Credit Fee and
Borrowing Spread
|
|
|
BBB+/Baa1/BBB+ or above
|
0.150
|
%
|
1.125
|
%
|
|
BBB/Baa2/BBB (current level)
|
0.175
|
%
|
1.375
|
%
|
|
BBB-/Baa3/BBB-
|
0.225
|
%
|
1.625
|
%
|
|
BB+/Ba1/BB+
|
0.275
|
%
|
1.875
|
%
|
|
BB/Ba2/BB or lower or unrated
|
0.325
|
%
|
2.125
|
%
|
In the event the rating levels are split, the applicable fees and spread will be based upon the rating level in effect for two of the rating agencies, or, if all three rating agencies have different rating levels, the applicable fees and spread will be based upon the rating level that is between the rating levels of the other two rating agencies.
Our revolving credit facility contains affirmative and negative covenants that, among other things, may limit or restrict our ability to: create liens and encumbrances; incur debt; merge, dissolve, liquidate or consolidate; dispose of or transfer assets; change the nature of our business; engage in certain transactions with affiliates; and enter into sale/leaseback or hedging transactions, in each case, subject to certain qualifications and exceptions. In addition, we are required to maintain minimum interest expense coverage and maximum debt to capitalization ratios.
Our 2022 Notes also contain affirmative and negative covenants that, among other things, may limit or restrict our ability to: create liens; engage in certain sale/leaseback transactions; and engage in certain consolidations, mergers and sales of assets.
We were in compliance with all debt covenants at
September 28, 2013
.
OFF-BALANCE SHEET ARRANGEMENTS
We do not have any off-balance sheet arrangements material to our financial position or results of operations. The off-balance sheet arrangements we have are guarantees of debt of outside third parties, including a lease and grower loans, and residual value guarantees covering certain operating leases for various types of equipment. See Part II, Item 8, Notes to Consolidated Financial Statements, Note 20: Commitments and Contingencies for further discussion.
29
CONTRACTUAL OBLIGATIONS
The following table summarizes our contractual obligations as of
September 28, 2013
:
|
in millions
|
|
||||||||||||||||||
|
Payments Due by Period
|
|||||||||||||||||||
|
2014
|
|
2015-2016
|
|
2017-2018
|
|
2019 and thereafter
|
|
Total
|
|
||||||||||
|
Debt and capital lease obligations:
|
|||||||||||||||||||
|
Principal payments
(1)
|
$
|
514
|
|
$
|
657
|
|
$
|
124
|
|
$
|
1,119
|
|
$
|
2,414
|
|
||||
|
Interest payments
(2)
|
112
|
|
202
|
|
115
|
|
205
|
|
634
|
|
|||||||||
|
Guarantees
(3)
|
37
|
|
37
|
|
17
|
|
31
|
|
122
|
|
|||||||||
|
Operating lease obligations
(4)
|
97
|
|
115
|
|
43
|
|
78
|
|
333
|
|
|||||||||
|
Purchase obligations
(5)
|
1,482
|
|
102
|
|
57
|
|
74
|
|
1,715
|
|
|||||||||
|
Capital expenditures
(6)
|
369
|
|
49
|
|
—
|
|
—
|
|
418
|
|
|||||||||
|
Other long-term liabilities
(7)
|
6
|
|
5
|
|
4
|
|
38
|
|
53
|
|
|||||||||
|
Total contractual commitments
|
$
|
2,617
|
|
$
|
1,167
|
|
$
|
360
|
|
$
|
1,545
|
|
$
|
5,689
|
|
||||
|
(1)
|
In the event of a default on payment, acceleration of the principal payments could occur.
|
|
(2)
|
Interest payments include interest on all outstanding debt. Payments are estimated for variable rate and variable term debt based on effective rates at
September 28, 2013
, and expected payment dates.
|
|
(3)
|
Amounts include guarantees of debt of outside third parties, which consist of a lease and grower loans, all of which are substantially collateralized by the underlying assets, as well as residual value guarantees covering certain operating leases for various types of equipment. The amounts included are the maximum potential amount of future payments.
|
|
(4)
|
Amounts include minimum lease payments under lease agreements.
|
|
(5)
|
Amounts include agreements to purchase goods or services that are enforceable and legally binding and specify all significant terms, including: fixed or minimum quantities to be purchased; fixed, minimum or variable price provisions; and the approximate timing of the transaction. The purchase obligations amount included items, such as future purchase commitments for grains, livestock contracts and fixed grower fees that provide terms that meet the above criteria. For certain grain purchase commitments with a fixed quantity provision, we have assumed the future obligations under the commitment based on available commodity futures prices as published in observable active markets as of
September 28, 2013
. We have excluded future purchase commitments for contracts that do not meet these criteria. Purchase orders are not included in the table, as a purchase order is an authorization to purchase and is cancelable. Contracts for goods or services that contain termination clauses without penalty have also been excluded.
|
|
(6)
|
Amounts include estimated amounts to complete buildings and equipment under construction as of
September 28, 2013
.
|
|
(7)
|
Amounts include items that meet the definition of a purchase obligation and are recorded in the Consolidated Balance Sheets.
|
In addition to the amounts shown above in the table, we have unrecognized tax benefits of
$175 million
and related interest and penalties of
$63 million
at
September 28, 2013
, recorded as liabilities.
The maximum contractual obligation associated with our cash flow assistance programs at
September 28, 2013
, based on the estimated fair values of the livestock supplier’s net tangible assets on that date, aggregated to approximately
$340 million
, or approximately
$296 million
remaining maximum commitment after netting the cash flow assistance related receivables.
RECENTLY ISSUED/ADOPTED ACCOUNTING PRONOUNCEMENTS
Refer to the discussion under Part II, Item 8, Notes to Consolidated Financial Statements, Note 1: Business and Summary of Significant Accounting Policies for recently issued accounting pronouncements and Note 2: Changes in Accounting Principles for recently adopted accounting pronouncements.
30
CRITICAL ACCOUNTING ESTIMATES
The preparation of consolidated financial statements requires us to make estimates and assumptions. These estimates and assumptions affect the reported amounts of assets and liabilities and disclosure of contingent assets and liabilities at the date of the consolidated financial statements and the reported amounts of revenues and expenses during the reporting period. Actual results could differ from those estimates. The following is a summary of certain accounting estimates we consider critical.
|
Description
|
Judgments and Uncertainties
|
Effect if Actual Results Differ From
Assumptions
|
||
|
Contingent liabilities
|
||||
|
We are subject to lawsuits, investigations and other claims related to wage and hour/labor, environmental, product, taxing authorities and other matters, and are required to assess the likelihood of any adverse judgments or outcomes to these matters, as well as potential ranges of probable losses.
A determination of the amount of reserves and disclosures required, if any, for these contingencies are made after considerable analysis of each individual issue. We accrue for contingent liabilities when an assessment of the risk of loss is probable and can be reasonably estimated. We disclose contingent liabilities when the risk of loss is reasonably possible or probable.
|
Our contingent liabilities contain uncertainties because the eventual outcome will result from future events, and determination of current reserves requires estimates and judgments related to future changes in facts and circumstances, differing interpretations of the law and assessments of the amount of damages, and the effectiveness of strategies or other factors beyond our control.
|
We have not made any material changes in the accounting methodology used to establish our contingent liabilities during the past three fiscal years.
We do not believe there is a reasonable likelihood there will be a material change in the estimates or assumptions used to calculate our contingent liabilities. However, if actual results are not consistent with our estimates or assumptions, we may be exposed to gains or losses that could be material.
|
||
|
Marketing and advertising costs
|
||||
|
We incur advertising, retailer incentive and consumer incentive costs to promote products through marketing programs. These programs include cooperative advertising, volume discounts, in-store display incentives, coupons and other programs.
Marketing and advertising costs are charged in the period incurred. We accrue costs based on the estimated performance, historical utilization and redemption of each program.
Cash consideration given to customers is considered a reduction in the price of our products, thus recorded as a reduction to sales. The remainder of marketing and advertising costs is recorded as a selling, general and administrative expense.
|
Recognition of the costs related to these programs contains uncertainties due to judgment required in estimating the potential performance and redemption of each program.
These estimates are based on many factors, including experience of similar promotional programs.
|
We have not made any material changes in the accounting methodology used to establish our marketing accruals during the past three fiscal years.
We do not believe there is a reasonable likelihood there will be a material change in the estimates or assumptions used to calculate our marketing accruals. However, if actual results are not consistent with our estimates or assumptions, we may be exposed to gains or losses that could be material.
A 10% change in our marketing accruals at September 28, 2013, would impact pretax earnings by approximately $6 million.
|
||
31
|
Description
|
Judgments and Uncertainties
|
Effect if Actual Results Differ From
Assumptions
|
||
|
Accrued self-insurance
|
||||
|
We are self insured for certain losses related to health and welfare, workers’ compensation, auto liability and general liability claims.
We use an independent third-party actuary to assist in determining our self-insurance liability. We and the actuary consider a number of factors when estimating our self-insurance liability, including claims experience, demographic factors, severity factors and other actuarial assumptions.
We periodically review our estimates and assumptions with our third-party actuary to assist us in determining the adequacy of our self-insurance liability. Our policy is to maintain an accrual within the central to high point of the actuarial range.
|
Our self-insurance liability contains uncertainties due to assumptions required and judgment used.
Costs to settle our obligations, including legal and healthcare costs, could increase or decrease causing estimates of our self-insurance liability to change.
Incident rates, including frequency and severity, could increase or decrease causing estimates in our self-insurance liability to change.
|
We have not made any material changes in the accounting methodology used to establish our self-insurance liability during the past three fiscal years.
We do not believe there is a reasonable likelihood there will be a material change in the estimates or assumptions used to calculate our self-insurance liability. However, if actual results are not consistent with our estimates or assumptions, we may be exposed to gains or losses that could be material.
A 10% increase in the actuarial estimate at September 28, 2013, would result in an increase in the amount we recorded for our self-insurance liability of approximately $11 million. A 10% decrease in the actuarial estimate at September 28, 2013, would result in a decrease in the amount we recorded for our self-insurance liability of approximately $17 million.
|
||
|
Income taxes
|
||||
|
We estimate total income tax expense based on statutory tax rates and tax planning opportunities available to us in various jurisdictions in which we earn income.
Federal income tax includes an estimate for taxes on earnings of foreign subsidiaries expected to be taxable upon remittance to the United States, except for earnings considered to be indefinitely invested in the foreign subsidiary.
Deferred income taxes are recognized for the future tax effects of temporary differences between financial and income tax reporting using tax rates in effect for the years in which the differences are expected to reverse.
Valuation allowances are recorded when it is likely a tax benefit will not be realized for a deferred tax asset.
We record unrecognized tax benefit liabilities for known or anticipated tax issues based on our analysis of whether, and the extent to which, additional taxes will be due.
|
Changes in tax laws and rates could affect recorded deferred tax assets and liabilities in the future.
Changes in projected future earnings could affect the recorded valuation allowances in the future.
Our calculations related to income taxes contain uncertainties due to judgment used to calculate tax liabilities in the application of complex tax regulations across the tax jurisdictions where we operate.
Our analysis of unrecognized tax benefits contains uncertainties based on judgment used to apply the more likely than not recognition and measurement thresholds.
|
We do not believe there is a reasonable likelihood there will be a material change in the tax related balances or valuation allowances. However, due to the complexity of some of these uncertainties, the ultimate resolution may result in a payment that is materially different from the current estimate of the tax liabilities.
To the extent we prevail in matters for which unrecognized tax benefit liabilities have been established, or are required to pay amounts in excess of our recorded unrecognized tax benefit liabilities, our effective tax rate in a given financial statement period could be materially affected. An unfavorable tax settlement would require use of our cash and generally result in an increase in our effective tax rate in the period of resolution. A favorable tax settlement would generally be recognized as a reduction in our effective tax rate in the period of resolution.
|
||
32
|
Description
|
Judgments and Uncertainties
|
Effect if Actual Results Differ From
Assumptions
|
||
|
Impairment of long-lived assets
|
||||
|
Long-lived assets are evaluated for impairment whenever events or changes in circumstances indicate the carrying value may not be recoverable. Examples include a significant adverse change in the extent or manner in which we use a long-lived asset or a change in its physical condition.
When evaluating long-lived assets for impairment, we compare the carrying value of the asset to the asset’s estimated undiscounted future cash flows. An impairment is indicated if the estimated future cash flows are less than the carrying value of the asset. The impairment is the excess of the carrying value over the fair value of the long-lived asset.
We recorded impairment charges related to long-lived assets of $74 million, $29 million and $18 million, in fiscal 2013, 2012 and 2011, respectively.
|
Our impairment analysis contains uncertainties due to judgment in assumptions and estimates surrounding undiscounted future cash flows of the long-lived asset, including forecasting useful lives of assets and selecting the discount rate that reflects the risk inherent in future cash flows to determine fair value.
Our Dynamic Fuels consolidated joint venture began commercial operations in October of 2010 and has incurred net operating losses of approximately $38
million since then. At September 28, 2013, Dynamic Fuels had $166 million of total assets, of which $142 million was net property, plant and equipment. The plant has experienced mechanical difficulties, pre-treatment system performance issues and hydrogen supply disruptions, which have contributed to plant down time and higher than expected operational costs. Upgrades to the feedstock pre-treatment systems and improvements to the mechanical reliability of the plant were completed in fiscal 2013.
The plant was idled in October 2012 for scheduled maintenance and plant upgrades, which were completed in December 2012. Since then, the plant has remained idled. An assessment of the recoverability of its carrying value was conducted as of September 28, 2013, for which it was determined no impairment was necessary. Another assessment of the recoverability of Dynamic Fuels' long-lived assets to determine whether an impairment exists may be necessary if the plant remains idled longer than expected, plant upgrades fail to improve operational performance, industry economics make the plant uneconomical to operate, or structural integrity concerns are discovered that adversely impact the plant operations.
|
We have not made any material changes in the accounting methodology used to evaluate the impairment of long-lived assets during the last three fiscal years.
We do not believe there is a reasonable likelihood there will be a material change in the estimates or assumptions used to calculate impairments of long-lived assets. However, if actual results are not consistent with our estimates and assumptions used to calculate estimated future cash flows, we may be exposed to impairment losses that could be material.
Additionally, we continue to evaluate our international operations and strategies, which may expose us to future impairment losses.
|
||
Impairment of goodwill and other indefinite life intangible assets
Description:
Goodwill is evaluated for impairment by first performing a qualitative assessment to determine whether a quantitative goodwill test is necessary. If it is determined, based on qualitative factors, the fair value of the reporting unit may be more likely than not less than carrying amount or if significant changes to macro-economic factors related to the reporting unit have occurred that could materially impact fair value, a quantitative goodwill impairment test would be required. We can elect to forgo the qualitative assessment and perform the quantitative test.
The quantitative goodwill impairment test is performed using a two-step process. The first step is to identify if a potential impairment exists by comparing the fair value of a reporting unit with its carrying amount, including goodwill. If the fair value of a reporting unit exceeds its carrying amount, goodwill of the reporting unit is not considered to have a potential impairment and the second step of the quantitative impairment test is not necessary. However, if the carrying amount of a reporting unit exceeds its fair value, the second step is performed to determine if goodwill is impaired and to measure the amount of impairment loss to recognize, if any.
The second step compares the implied fair value of goodwill with the carrying amount of goodwill. If the implied fair value of goodwill exceeds the carrying amount, then goodwill is not considered impaired. However, if the carrying amount of goodwill exceeds the implied fair value, an impairment loss is recognized in an amount equal to that excess.
33
The implied fair value of goodwill is determined in the same manner as the amount of goodwill recognized in a business combination (i.e., the fair value of the reporting unit is allocated to all the assets and liabilities, including any unrecognized intangible assets, as if the reporting unit had been acquired in a business combination and the fair value of the reporting unit was determined as the exit price a market participant would pay for the same business).
For other indefinite life intangible assets, a qualitative assessment can also be performed to determine whether the existence of events and circumstances indicates it is more likely than not an intangible asset is impaired. Similar to goodwill, we can also elect to forgo the qualitative test for indefinite life intangible assets and perform the quantitative test. Upon performing the quantitative test, if the carrying value of the intangible asset exceeds its fair value, an impairment loss is recognized in an amount equal to that excess. We elected to forgo the qualitative assessments on our indefinite life intangible assets for the fiscal 2013 impairment test.
We have elected to make the first day of the fourth quarter the annual impairment assessment date for goodwill and other indefinite life intangible assets. However, we could be required to evaluate the recoverability of goodwill and other indefinite life intangible assets prior to the required annual assessment if, among other things, we experience disruptions to the business, unexpected significant declines in operating results, divestiture of a significant component of the business or a sustained decline in market capitalization.
Judgments and Uncertainties:
We estimate the fair value of our reporting units, generally our operating segments, using various valuation techniques, with the primary technique being a discounted cash flow analysis, which uses significant unobservable inputs, or Level 3 inputs, as defined by the fair value hierarchy. A discounted cash flow analysis requires us to make various judgmental assumptions about sales, operating margins, growth rates and discount rates.
We include assumptions about sales, operating margins and growth rates which consider our budgets, business plans and economic projections, and are believed to reflect market participant views which would exist in an exit transaction. Assumptions are also made for varying perpetual growth rates for periods beyond the long-term business plan period. Generally, we utilize normalized operating margin assumptions based on future expectations and operating margins historically realized in the reporting units' industries.
Other indefinite life intangible asset fair values have been calculated for trademarks using a royalty rate method. Assumptions about royalty rates are based on the rates at which similar brands and trademarks are licensed in the marketplace.
Our impairment analysis contains uncertainties due to uncontrollable events that could positively or negatively impact the anticipated future economic and operating conditions.
Effect if Actual Results Differ From Assumptions:
We have not made any material changes in the accounting methodology used to evaluate impairment of goodwill and other intangible assets during the last three years other than the adoption of the new guidance allowing the option to first assess qualitative factors to determine whether it is necessary to perform the two-step quantitative impairment test.
The discount rate used in our annual goodwill impairment test increased to an average of 8.4% in fiscal 2013 from 8.0% in fiscal 2012. There were no significant changes in the other key estimates and assumptions.
During fiscal 2013, 2012 and 2011, all of our material reporting units that underwent a quantitative test passed the first step of the goodwill impairment analysis and therefore, the second step was not necessary.
Some of the inherent estimates and assumptions used in determining fair value of the reporting units are outside the control of management, including interest rates, cost of capital, tax rates and our credit ratings. While we believe we have made reasonable estimates and assumptions to calculate the fair value of the reporting units and other indefinite life intangible assets, it is possible a material change could occur. If our actual results are not consistent with our estimates and assumptions used to calculate fair value, we may be required to perform the second step, which could result in additional material impairments of our goodwill.
All of our material reporting units' estimated fair value exceeded their carrying value by more than 20% at the date of their most recent estimated fair value determination. Consequently, we do not currently consider any of our material reporting units at significant risk of failing the first step of the annual goodwill impairment test.
Our fiscal other indefinite life intangible asset impairment analysis did not result in an impairment charge. A hypothetical 20% decrease in the fair value of intangible assets would not result in a material impairment.
34
Market risk relating to our operations results primarily from changes in commodity prices, interest rates and foreign exchange rates, as well as credit risk concentrations. To address certain of these risks, we enter into various derivative transactions as described below. If a derivative instrument is accounted for as a hedge, depending on the nature of the hedge, changes in the fair value of the instrument either will be offset against the change in fair value of the hedged assets, liabilities or firm commitments through earnings, or be recognized in other comprehensive income (loss) until the hedged item is recognized in earnings. The ineffective portion of an instrument’s change in fair value is recognized immediately. Additionally, we hold certain positions, primarily in grain and livestock futures that either do not meet the criteria for hedge accounting or are not designated as hedges. With the exception of normal purchases and normal sales that are expected to result in physical delivery, we record these positions at fair value, and the unrealized gains and losses are reported in earnings at each reporting date. Changes in market value of derivatives used in our risk management activities relating to forward sales contracts are recorded in sales. Changes in market value of derivatives used in our risk management activities surrounding inventories on hand or anticipated purchases of inventories are recorded in cost of sales.
The sensitivity analyses presented below are the measures of potential losses of fair value resulting from hypothetical changes in market prices related to commodities. Sensitivity analyses do not consider the actions we may take to mitigate our exposure to changes, nor do they consider the effects such hypothetical adverse changes may have on overall economic activity. Actual changes in market prices may differ from hypothetical changes.
Commodities Risk:
We purchase certain commodities, such as grains and livestock, in the course of normal operations. As part of our commodity risk management activities, we use derivative financial instruments, primarily futures and options, to reduce the effect of changing prices and as a mechanism to procure the underlying commodity. However, as the commodities underlying our derivative financial instruments can experience significant price fluctuations, any requirement to mark-to-market the positions that have not been designated or do not qualify as hedges could result in volatility in our results of operations. Contract terms of a hedge instrument closely mirror those of the hedged item providing a high degree of risk reduction and correlation. Contracts designated and highly effective at meeting this risk reduction and correlation criteria are recorded using hedge accounting. The following table presents a sensitivity analysis resulting from a hypothetical change of 10% in market prices as of
September 28, 2013
, and
September 29, 2012
, on the fair value of open positions. The fair value of such positions is a summation of the fair values calculated for each commodity by valuing each net position at quoted futures prices. The market risk exposure analysis includes hedge and non-hedge derivative financial instruments.
|
Effect of 10% change in fair value
|
in millions
|
||||||
|
2013
|
|
2012
|
|
||||
|
Livestock:
|
|||||||
|
Cattle
|
$
|
13
|
|
$
|
42
|
|
|
|
Hogs
|
35
|
|
37
|
|
|||
|
Grain
|
23
|
|
30
|
|
|||
Interest Rate Risk:
At
September 28, 2013
, we had variable rate debt of $173 million with a weighted average interest rate of 3.4%. A hypothetical 10% increase in interest rates effective at
September 28, 2013
, and
September 29, 2012
, would have a minimal effect on interest expense.
Additionally, changes in interest rates impact the fair value of our fixed-rate debt. At
September 28, 2013
, we had fixed-rate debt of $2.2 billion with a weighted average interest rate of 6.0%. Market risk for fixed-rate debt is estimated as the potential increase in fair value, resulting from a hypothetical 10% decrease in interest rates. A hypothetical 10% decrease in interest rates would have increased the fair value of our fixed-rate debt by approximately $22 million at
September 28, 2013
, and $16 million at
September 29, 2012
. The fair values of our debt were estimated based on quoted market prices and/or published interest rates.
Foreign Currency Risk:
We have foreign exchange exposure from fluctuations in foreign currency exchange rates primarily as a result of certain receivable and payable balances. The primary currencies we have exposure to are the Brazilian real, the British pound sterling, the Canadian dollar, the Chinese renminbi, the European euro, the Indian rupee and the Mexican peso. We periodically enter into foreign exchange forward and option contracts to hedge some portion of our foreign currency exposure. A hypothetical 10% change in foreign exchange rates effective at
September 28, 2013
, and
September 29, 2012
, related to the foreign exchange forward and option contracts would have a $11 million and $21 million impact, respectively, on pretax income. In the future, we may enter into more foreign exchange forward and option contracts as a result of our international growth strategy.
35
Concentrations of Credit Risk:
Our financial instruments exposed to concentrations of credit risk consist primarily of cash equivalents and trade receivables. Our cash equivalents are in high quality securities placed with major banks and financial institutions. Concentrations of credit risk with respect to receivables are limited due to our large number of customers and their dispersion across geographic areas. We perform periodic credit evaluations of our customers’ financial condition and generally do not require collateral. At
September 28, 2013
, and
September 29, 2012
,
17.5%
and
17.1%
, respectively, of our net accounts receivable balance was due from Wal-Mart Stores, Inc. No other single customer or customer group represented greater than 10% of net accounts receivable.
36
TYSON FOODS, INC.
|
Three years ended September 28, 2013
|
|||||||||||
|
in millions, except per share data
|
|||||||||||
|
2013
|
|
2012
|
|
2011
|
|
||||||
|
Sales
|
$
|
34,374
|
|
$
|
33,055
|
|
$
|
32,032
|
|
||
|
Cost of Sales
|
32,016
|
|
30,865
|
|
29,837
|
|
|||||
|
Gross Profit
|
2,358
|
|
2,190
|
|
2,195
|
|
|||||
|
Selling, General and Administrative
|
983
|
|
904
|
|
906
|
|
|||||
|
Operating Income
|
1,375
|
|
1,286
|
|
1,289
|
|
|||||
|
Other (Income) Expense:
|
|||||||||||
|
Interest income
|
(7
|
)
|
(12
|
)
|
(11
|
)
|
|||||
|
Interest expense
|
145
|
|
356
|
|
242
|
|
|||||
|
Other, net
|
(20
|
)
|
(23
|
)
|
(20
|
)
|
|||||
|
Total Other (Income) Expense
|
118
|
|
321
|
|
211
|
|
|||||
|
Income from Continuing Operations before Income Taxes
|
1,257
|
|
965
|
|
1,078
|
|
|||||
|
Income Tax Expense
|
409
|
|
351
|
|
340
|
|
|||||
|
Income from Continuing Operations
|
848
|
|
614
|
|
738
|
|
|||||
|
Loss from Discontinued Operation, Net of Tax
|
(70
|
)
|
(38
|
)
|
(5
|
)
|
|||||
|
Net Income
|
778
|
|
576
|
|
733
|
|
|||||
|
Less: Net Loss Attributable to Noncontrolling Interests
|
—
|
|
(7
|
)
|
(17
|
)
|
|||||
|
Net Income Attributable to Tyson
|
$
|
778
|
|
$
|
583
|
|
$
|
750
|
|
||
|
Amounts Attributable to Tyson:
|
|||||||||||
|
Net Income from Continuing Operations
|
848
|
|
621
|
|
752
|
|
|||||
|
Net Loss from Discontinued Operation
|
(70
|
)
|
(38
|
)
|
(2
|
)
|
|||||
|
Net Income Attributable to Tyson
|
$
|
778
|
|
$
|
583
|
|
$
|
750
|
|
||
|
Weighted Average Shares Outstanding:
|
|||||||||||
|
Class A Basic
|
282
|
|
293
|
|
303
|
|
|||||
|
Class B Basic
|
70
|
|
70
|
|
70
|
|
|||||
|
Diluted
|
367
|
|
370
|
|
380
|
|
|||||
|
Net Income Per Share from Continuing Operations Attributable to Tyson:
|
|||||||||||
|
Class A Basic
|
$
|
2.46
|
|
$
|
1.75
|
|
$
|
2.05
|
|
||
|
Class B Basic
|
$
|
2.22
|
|
$
|
1.57
|
|
$
|
1.84
|
|
||
|
Diluted
|
$
|
2.31
|
|
$
|
1.68
|
|
$
|
1.98
|
|
||
|
Net Loss Per Share from Discontinued Operation Attributable to Tyson:
|
|||||||||||
|
Class A Basic
|
$
|
(0.20
|
)
|
$
|
(0.11
|
)
|
$
|
(0.01
|
)
|
||
|
Class B Basic
|
$
|
(0.18
|
)
|
$
|
(0.09
|
)
|
$
|
—
|
|
||
|
Diluted
|
$
|
(0.19
|
)
|
$
|
(0.10
|
)
|
$
|
(0.01
|
)
|
||
|
Net Income Per Share Attributable to Tyson:
|
|||||||||||
|
Class A Basic
|
$
|
2.26
|
|
$
|
1.64
|
|
$
|
2.04
|
|
||
|
Class B Basic
|
$
|
2.04
|
|
$
|
1.48
|
|
$
|
1.84
|
|
||
|
Diluted
|
$
|
2.12
|
|
$
|
1.58
|
|
$
|
1.97
|
|
||
|
Dividends Declared Per Share:
|
|||||||||||
|
Class A
|
$
|
0.310
|
|
$
|
0.160
|
|
$
|
0.160
|
|
||
|
Class B
|
$
|
0.279
|
|
$
|
0.144
|
|
$
|
0.144
|
|
||
See accompanying notes.
37
TYSON FOODS, INC.
CONSOLIDATED STATEMENTS OF COMPREHENSIVE INCOME
|
Three years ended September 28, 2013
|
|||||||||||
|
in millions
|
|||||||||||
|
2013
|
|
2012
|
|
2011
|
|
||||||
|
Net Income
|
$
|
778
|
|
$
|
576
|
|
$
|
733
|
|
||
|
Other Comprehensive Income (Loss), Net of Taxes:
|
|||||||||||
|
Derivatives accounted for as cash flow hedges
|
(14
|
)
|
17
|
|
(17
|
)
|
|||||
|
Investments
|
(3
|
)
|
—
|
|
(8
|
)
|
|||||
|
Currency translation
|
(37
|
)
|
3
|
|
(41
|
)
|
|||||
|
Postretirement benefits
|
9
|
|
(4
|
)
|
(13
|
)
|
|||||
|
Total Other Comprehensive Income (Loss), Net of Taxes
|
(45
|
)
|
16
|
|
(79
|
)
|
|||||
|
Comprehensive Income
|
733
|
|
592
|
|
654
|
|
|||||
|
Less: Comprehensive Income (Loss) Attributable to Noncontrolling Interests
|
—
|
|
(7
|
)
|
(17
|
)
|
|||||
|
Comprehensive Income Attributable to Tyson
|
$
|
733
|
|
$
|
599
|
|
$
|
671
|
|
||
See accompanying notes.
38
TYSON FOODS, INC.
|
September 28, 2013, and September 29, 2012
|
|||||||
|
in millions, except share and per share data
|
|||||||
|
2013
|
|
2012
|
|
||||
|
Assets
|
|||||||
|
Current Assets:
|
|||||||
|
Cash and cash equivalents
|
$
|
1,145
|
|
$
|
1,071
|
|
|
|
Accounts receivable, net
|
1,497
|
|
1,378
|
|
|||
|
Inventories
|
2,817
|
|
2,809
|
|
|||
|
Other current assets
|
145
|
|
145
|
|
|||
|
Total Current Assets
|
5,604
|
|
5,403
|
|
|||
|
Net Property, Plant and Equipment
|
4,053
|
|
4,022
|
|
|||
|
Goodwill
|
1,902
|
|
1,891
|
|
|||
|
Intangible Assets
|
138
|
|
129
|
|
|||
|
Other Assets
|
480
|
|
451
|
|
|||
|
Total Assets
|
$
|
12,177
|
|
$
|
11,896
|
|
|
|
Liabilities and Shareholders’ Equity
|
|||||||
|
Current Liabilities:
|
|||||||
|
Current debt
|
$
|
513
|
|
$
|
515
|
|
|
|
Accounts payable
|
1,359
|
|
1,372
|
|
|||
|
Other current liabilities
|
1,138
|
|
943
|
|
|||
|
Total Current Liabilities
|
3,010
|
|
2,830
|
|
|||
|
Long-Term Debt
|
1,895
|
|
1,917
|
|
|||
|
Deferred Income Taxes
|
479
|
|
558
|
|
|||
|
Other Liabilities
|
560
|
|
549
|
|
|||
|
Commitments and Contingencies (Note 20)
|
|
|
|
||||
|
Shareholders’ Equity:
|
|||||||
|
Common stock ($0.10 par value):
|
|||||||
|
Class A-authorized 900 million shares, issued 322 million shares
|
32
|
|
32
|
|
|||
|
Convertible Class B-authorized 900 million shares, issued 70 million shares
|
7
|
|
7
|
|
|||
|
Capital in excess of par value
|
2,292
|
|
2,278
|
|
|||
|
Retained earnings
|
4,999
|
|
4,327
|
|
|||
|
Accumulated other comprehensive loss
|
(108
|
)
|
(63
|
)
|
|||
|
Treasury stock, at cost – 48 million shares in 2013, and 33 million shares in 2012
|
(1,021
|
)
|
(569
|
)
|
|||
|
Total Tyson Shareholders’ Equity
|
6,201
|
|
6,012
|
|
|||
|
Noncontrolling Interests
|
32
|
|
30
|
|
|||
|
Total Shareholders’ Equity
|
6,233
|
|
6,042
|
|
|||
|
Total Liabilities and Shareholders’ Equity
|
$
|
12,177
|
|
$
|
11,896
|
|
|
See accompanying notes.
39
TYSON FOODS, INC.
CONSOLIDATED STATEMENTS OF SHAREHOLDERS’ EQUITY
|
Three years ended September 28, 2013
|
||||||||||||||||||||
|
in millions
|
||||||||||||||||||||
|
2013
|
2012
|
2011
|
||||||||||||||||||
|
Shares
|
|
Amount
|
|
Shares
|
|
Amount
|
|
Shares
|
|
Amount
|
|
|||||||||
|
Common Stock at beginning and end of year:
|
||||||||||||||||||||
|
Class A
|
322
|
|
$
|
32
|
|
322
|
|
$
|
32
|
|
322
|
|
$
|
32
|
|
|||||
|
Class B
|
70
|
|
7
|
|
70
|
|
7
|
|
70
|
|
7
|
|
||||||||
|
Capital in Excess of Par Value:
|
||||||||||||||||||||
|
Balance at beginning of year
|
2,278
|
|
2,261
|
|
2,243
|
|
||||||||||||||
|
Stock-based compensation
|
14
|
|
17
|
|
18
|
|
||||||||||||||
|
Balance at end of year
|
2,292
|
|
2,278
|
|
2,261
|
|
||||||||||||||
|
Retained Earnings:
|
||||||||||||||||||||
|
Balance at beginning of year
|
4,327
|
|
3,801
|
|
3,113
|
|
||||||||||||||
|
Net income attributable to Tyson
|
778
|
|
583
|
|
750
|
|
||||||||||||||
|
Dividends
|
(106
|
)
|
(57
|
)
|
(59
|
)
|
||||||||||||||
|
Redeemable noncontrolling interest accretion
|
—
|
|
—
|
|
(3
|
)
|
||||||||||||||
|
Balance at end of year
|
4,999
|
|
4,327
|
|
3,801
|
|
||||||||||||||
|
Accumulated Other Comprehensive Income (Loss), Net of Tax:
|
||||||||||||||||||||
|
Balance at beginning of year
|
(63
|
)
|
(79
|
)
|
—
|
|
||||||||||||||
|
Other Comprehensive Income (Loss)
|
(45
|
)
|
16
|
|
(79
|
)
|
||||||||||||||
|
Balance at end of year
|
(108
|
)
|
(63
|
)
|
(79
|
)
|
||||||||||||||
|
Treasury Stock:
|
||||||||||||||||||||
|
Balance at beginning of year
|
33
|
|
(569
|
)
|
22
|
|
(365
|
)
|
15
|
|
(229
|
)
|
||||||||
|
Purchase of Tyson Class A common stock
|
24
|
|
(614
|
)
|
14
|
|
(264
|
)
|
12
|
|
(207
|
)
|
||||||||
|
Stock-based compensation
|
(9
|
)
|
162
|
|
(3
|
)
|
60
|
|
(5
|
)
|
71
|
|
||||||||
|
Balance at end of year
|
48
|
|
(1,021
|
)
|
33
|
|
(569
|
)
|
22
|
|
(365
|
)
|
||||||||
|
Total Shareholders’ Equity Attributable to Tyson
|
$
|
6,201
|
|
$
|
6,012
|
|
$
|
5,657
|
|
|||||||||||
|
Equity Attributable to Noncontrolling Interests
|
||||||||||||||||||||
|
Balance at beginning of year
|
$
|
30
|
|
$
|
28
|
|
$
|
35
|
|
|||||||||||
|
Net loss attributable to noncontrolling interests
(1)
|
—
|
|
(7
|
)
|
(13
|
)
|
||||||||||||||
|
Contributions by noncontrolling interest
|
3
|
|
9
|
|
8
|
|
||||||||||||||
|
Net foreign currency translation adjustment and other
|
(1
|
)
|
—
|
|
(2
|
)
|
||||||||||||||
|
Total Equity Attributable to Noncontrolling Interests
|
$
|
32
|
|
$
|
30
|
|
$
|
28
|
|
|||||||||||
|
Total Shareholders’ Equity
|
$
|
6,233
|
|
$
|
6,042
|
|
$
|
5,685
|
|
|||||||||||
See accompanying notes.
|
(1)
|
Excludes net loss related to redeemable noncontrolling interest of
$(4) million
for fiscal
2011
.
|
40
TYSON FOODS, INC.
|
Three years ended September 28, 2013
|
|||||||||||
|
in millions
|
|||||||||||
|
2013
|
|
2012
|
|
2011
|
|
||||||
|
Cash Flows From Operating Activities:
|
|||||||||||
|
Net income
|
$
|
778
|
|
$
|
576
|
|
$
|
733
|
|
||
|
Adjustments to reconcile net income to cash provided by operating activities:
|
|||||||||||
|
Depreciation
|
474
|
|
443
|
|
433
|
|
|||||
|
Amortization
|
45
|
|
56
|
|
73
|
|
|||||
|
Deferred income taxes
|
(12
|
)
|
140
|
|
86
|
|
|||||
|
Loss on early extinguishment of debt
|
—
|
|
167
|
|
—
|
|
|||||
|
Impairment of assets
|
74
|
|
34
|
|
18
|
|
|||||
|
Other, net
|
26
|
|
18
|
|
49
|
|
|||||
|
Increase in accounts receivable
|
(126
|
)
|
(69
|
)
|
(114
|
)
|
|||||
|
(Increase) decrease in inventories
|
15
|
|
(259
|
)
|
(299
|
)
|
|||||
|
Increase (decrease) in accounts payable
|
(12
|
)
|
106
|
|
152
|
|
|||||
|
Increase (decrease) in income taxes payable/receivable
|
80
|
|
8
|
|
(73
|
)
|
|||||
|
Increase (decrease) in interest payable
|
(1
|
)
|
5
|
|
19
|
|
|||||
|
Net change in other current assets and liabilities
|
(27
|
)
|
(38
|
)
|
(31
|
)
|
|||||
|
Cash Provided by Operating Activities
|
1,314
|
|
1,187
|
|
1,046
|
|
|||||
|
Cash Flows From Investing Activities:
|
|||||||||||
|
Additions to property, plant and equipment
|
(558
|
)
|
(690
|
)
|
(643
|
)
|
|||||
|
Purchases of marketable securities
|
(135
|
)
|
(58
|
)
|
(146
|
)
|
|||||
|
Proceeds from sale of marketable securities
|
117
|
|
47
|
|
66
|
|
|||||
|
Proceeds from notes receivable
|
—
|
|
—
|
|
51
|
|
|||||
|
Acquisitions, net of cash acquired
|
(106
|
)
|
—
|
|
—
|
|
|||||
|
Other, net
|
39
|
|
41
|
|
28
|
|
|||||
|
Cash Used for Investing Activities
|
(643
|
)
|
(660
|
)
|
(644
|
)
|
|||||
|
Cash Flows From Financing Activities:
|
|||||||||||
|
Payments on debt
|
(91
|
)
|
(993
|
)
|
(500
|
)
|
|||||
|
Net proceeds from borrowings
|
68
|
|
1,116
|
|
115
|
|
|||||
|
Purchase of redeemable noncontrolling interest
|
—
|
|
—
|
|
(66
|
)
|
|||||
|
Purchases of Tyson Class A common stock
|
(614
|
)
|
(264
|
)
|
(207
|
)
|
|||||
|
Dividends
|
(104
|
)
|
(57
|
)
|
(59
|
)
|
|||||
|
Stock options exercised
|
123
|
|
34
|
|
51
|
|
|||||
|
Other, net
|
18
|
|
(7
|
)
|
8
|
|
|||||
|
Cash Used for Financing Activities
|
(600
|
)
|
(171
|
)
|
(658
|
)
|
|||||
|
Effect of Exchange Rate Change on Cash
|
3
|
|
(1
|
)
|
(6
|
)
|
|||||
|
Increase (Decrease) in Cash and Cash Equivalents
|
74
|
|
355
|
|
(262
|
)
|
|||||
|
Cash and Cash Equivalents at Beginning of Year
|
1,071
|
|
716
|
|
978
|
|
|||||
|
Cash and Cash Equivalents at End of Year
|
$
|
1,145
|
|
$
|
1,071
|
|
$
|
716
|
|
||
See accompanying notes.
41
NOTES TO CONSOLIDATED FINANCIAL STATEMENTS
TYSON FOODS, INC.
Description of Business:
Tyson Foods, Inc. (collectively, “Company,” “we,” “us” or “our”), founded in 1935 with world headquarters in Springdale, Arkansas, is one of the world’s largest meat protein companies and the second-largest food production company in the
Fortune
500. We produce a wide variety of brand name protein-based and prepared food products marketed in the United States and approximately
130
countries around the world.
Consolidation:
The consolidated financial statements include the accounts of all wholly-owned subsidiaries, as well as majority-owned subsidiaries over which we exercise control and, when applicable, entities for which we have a controlling financial interest or variable interest entities for which we are the primary beneficiary. All significant intercompany accounts and transactions have been eliminated in consolidation.
Fiscal Year:
We utilize a 52- or 53-week accounting period ending on the Saturday closest to September 30. The Company’s accounting cycle resulted in a 52-week year for fiscal
2013
,
2012
and
2011
.
Cash and Cash Equivalents:
Cash equivalents consist of investments in short-term, highly liquid securities having original maturities of three months or less, which are made as part of our cash management activity. The carrying values of these assets approximate their fair values. We primarily utilize a cash management system with a series of separate accounts consisting of lockbox accounts for receiving cash, concentration accounts where funds are moved to, and several zero-balance disbursement accounts for funding payroll, accounts payable, livestock procurement, grower payments, etc. As a result of our cash management system, checks issued, but not presented to the banks for payment, may result in negative book cash balances. These negative book cash balances are included in accounts payable and other current liabilities. At
September 28, 2013
, and
September 29, 2012
, checks outstanding in excess of related book cash balances totaled approximately
$246 million
and
$265 million
, respectively.
Accounts Receivable:
We record accounts receivable at net realizable value. This value includes an appropriate allowance for estimated uncollectible accounts to reflect any loss anticipated on the accounts receivable balances and charged to the provision for doubtful accounts. We calculate this allowance based on our history of write-offs, level of past due accounts and relationships with and economic status of our customers. At
September 28, 2013
, and
September 29, 2012
, our allowance for uncollectible accounts was
$46 million
and
$33 million
, respectively. We generally do not have collateral for our receivables, but we do periodically evaluate the credit worthiness of our customers.
Inventories:
Processed products, livestock and supplies and other are valued at the lower of cost or market. Cost includes purchased raw materials, live purchase costs, growout costs (primarily feed, contract grower pay and catch and haul costs), labor and manufacturing and production overhead, which are related to the purchase and production of inventories.
The following table reflects the major components of inventory at
September 28, 2013
, and
September 29, 2012
:
|
in millions
|
|
||||||
|
2013
|
|
2012
|
|
||||
|
Processed products:
|
|||||||
|
Weighted-average method – chicken and prepared foods
|
$
|
799
|
|
$
|
754
|
|
|
|
First-in, first-out method – beef and pork
|
624
|
|
611
|
|
|||
|
Livestock – first-in, first-out method
|
1,002
|
|
952
|
|
|||
|
Supplies and other – weighted-average method
|
392
|
|
492
|
|
|||
|
Total inventory
|
$
|
2,817
|
|
$
|
2,809
|
|
|
Property, Plant and Equipment:
Property, plant and equipment are stated at cost and generally depreciated on a straight-line method over the estimated lives for buildings and leasehold improvements of
10
to
33 years
, machinery and equipment of
three
to
12 years
and land improvements and other of
three
to
20 years
. Major repairs and maintenance costs that significantly extend the useful life of the related assets are capitalized. Normal repairs and maintenance costs are charged to operations.
We review the carrying value of long-lived assets at each balance sheet date if indication of impairment exists. Recoverability is assessed using undiscounted cash flows based on historical results and current projections of earnings before interest and taxes. We measure impairment as the excess of carrying cost over the fair value of an asset. The fair value of an asset is measured using discounted cash flows including market participant assumptions of future operating results and discount rates.
42
Goodwill and Other Intangible Assets:
Goodwill and indefinite life intangible assets are initially recorded at fair value and not amortized, but are reviewed for impairment at least annually or more frequently if impairment indicators arise. Our goodwill is allocated by reporting unit and is evaluated for impairment by first performing a qualitative assessment to determine whether a quantitative goodwill test is necessary. If it is determined, based on qualitative factors, the fair value of the reporting unit may be more likely than not less than carrying amount, or if significant changes to macro-economic factors related to the reporting unit have occurred that could materially impact fair value, a quantitative goodwill impairment test would be required. Additionally, we can elect to forgo the qualitative assessment and perform the quantitative test.
The first step of the quantitative test is to identify if a potential impairment exists by comparing the fair value of a reporting unit with its carrying amount, including goodwill. If the fair value of a reporting unit exceeds its carrying amount, goodwill of the reporting unit is not considered to have a potential impairment and the second step of the quantitative impairment test is not necessary. However, if the carrying amount of a reporting unit exceeds its fair value, the second step is performed to determine if goodwill is impaired and to measure the amount of impairment loss to recognize, if any. The second step compares the implied fair value of goodwill with the carrying amount of goodwill. If the implied fair value of goodwill exceeds the carrying amount, then goodwill is not considered impaired. However, if the carrying amount of goodwill exceeds the implied fair value, an impairment loss is recognized in an amount equal to that excess. The implied fair value of goodwill is determined in the same manner as the amount of goodwill recognized in a business combination (i.e., the fair value of the reporting unit is allocated to all the assets and liabilities, including any unrecognized intangible assets, as if the reporting unit had been acquired in a business combination and the fair value of the reporting unit was determined as the exit price a market participant would pay for the same business). We have elected to make the first day of the fourth quarter the annual impairment assessment date for goodwill and other indefinite life intangible assets.
We estimate the fair value of our reporting units using a discounted cash flow analysis, which uses significant unobservable inputs, or Level 3 inputs, as defined by the fair value hierarchy. This analysis requires us to make various judgmental estimates and assumptions about sales, operating margins, growth rates and discount factors and is believed to reflect market participant views which would exist in an exit transaction. Generally, we utilize normalized operating margin assumptions based on future expectations and operating margins historically realized in the reporting units' industries. Some of the inherent estimates and assumptions used in determining fair value of the reporting units are outside the control of management, including interest rates, cost of capital, tax rates and credit ratings. While we believe we have made reasonable estimates and assumptions to calculate the fair value of the reporting units, it is possible a material change could occur. If our actual results are not consistent with our estimates and assumptions used to calculate fair value, we may be required to perform the second step of the quantitative test in future years, which could result in material impairments of our goodwill.
During fiscal 2013, 2012 and 2011, all of our material reporting units that underwent the quantitative test passed the first step of the goodwill impairment analysis and therefore, the second step was not necessary.
For our other indefinite life intangible assets, a qualitative assessment can also be performed to determine whether the existence of events and circumstances indicates it is more likely than not an intangible asset is impaired. Similar to goodwill, we can also elect to forgo the qualitative test for indefinite life intangible assets and perform the quantitative test. Upon performing the quantitative test, if the carrying value of the intangible asset exceeds its fair value, an impairment loss is recognized in an amount equal to that excess. The fair value of trademarks is determined using a royalty rate method based on expected revenues by trademark.
Investments:
We have investments in joint ventures and other entities. We use the cost method of accounting when our voting interests are less than 20 percent. We use the equity method of accounting when our voting interests are in excess of 20 percent and we do not have a controlling interest or a variable interest in which we are the primary beneficiary. Investments in joint ventures and other entities are reported in the Consolidated Balance Sheets in Other Assets.
We also have investments in marketable debt securities. We have determined all of our marketable debt securities are available-for-sale investments. These investments are reported at fair value based on quoted market prices as of the balance sheet date, with unrealized gains and losses, net of tax, recorded in other comprehensive income. The amortized cost of debt securities is adjusted for amortization of premiums and accretion of discounts to maturity. Such amortization is recorded in interest income. The cost of securities sold is based on the specific identification method. Realized gains and losses on the sale of debt securities and declines in value judged to be other than temporary are recorded on a net basis in other income. Interest and dividends on securities classified as available-for-sale are recorded in interest income.
Variable Interest Entity:
We have an investment in a joint venture, Dynamic Fuels LLC (Dynamic Fuels), in which we have a
50%
ownership interest. Dynamic Fuels qualifies as a variable interest entity for which we consolidate as we are the primary beneficiary. At
September 28, 2013
, Dynamic Fuels had
$166 million
of total assets, of which
$142 million
was net property, plant and equipment, and
$113 million
of total liabilities, of which
$100 million
was long-term debt. At
September 29, 2012
, Dynamic Fuels had
$177 million
of total assets, of which
$146 million
was net property, plant and equipment, and
$124 million
of total liabilities, of which
$100 million
was long-term debt.
43
Accrued Self-Insurance:
We use a combination of insurance and self-insurance mechanisms in an effort to mitigate the potential liabilities for health and welfare, workers’ compensation, auto liability and general liability risks. Liabilities associated with our risks retained are estimated, in part, by considering claims experience, demographic factors, severity factors and other actuarial assumptions.
Capital Stock:
We have
two
classes of capital stock, Class A Common Stock,
$0.10
par value (Class A stock) and Class B Common Stock,
$0.10
par value (Class B stock). Holders of Class B stock may convert such stock into Class A stock on a share-for-share basis. Holders of Class B stock are entitled to
10
votes per share, while holders of Class A stock are entitled to
one
vote per share on matters submitted to shareholders for approval. As of
September 28, 2013
, Tyson Limited Partnership (the TLP) owned
99.981%
of the outstanding shares of Class B stock and the TLP and members of the Tyson family owned, in the aggregate,
2.09%
of the outstanding shares of Class A stock, giving them, collectively, control of approximately
72.46%
of the total voting power of the outstanding voting stock. Cash dividends cannot be paid to holders of Class B stock unless they are simultaneously paid to holders of Class A stock. The per share amount of the cash dividend paid to holders of Class B stock cannot exceed
90%
of the cash dividend simultaneously paid to holders of Class A stock. We pay quarterly cash dividends to Class A and Class B shareholders. On November 14, 2013, the Board of Directors increased the quarterly dividend previously declared on August 1, 2013, to
$0.0750
per share on our Class A common stock and
$0.0675
per share on our Class B common stock. The increased quarterly dividend is payable on December 13, 2013, to shareholders of record at the close of business on November 29, 2013. We paid Class A dividends per share of
$0.30
and Class B dividends per share of
$0.27
in fiscal
2013
which includes a special dividend of
$0.10
per share for Class A stock and
$0.09
per share for Class B stock paid on December 14, 2012, to shareholders of record on November 30, 2012. We paid Class A dividends per share of
$0.16
and Class B dividends per share of
$0.144
in each of fiscal years
2012
and
2011
.
The Class B stock is considered a participating security requiring the use of the two-class method for the computation of basic earnings per share. The two-class computation method for each period reflects the cash dividends paid for each class of stock, plus the amount of allocated undistributed earnings (losses) computed using the participation percentage, which reflects the dividend rights of each class of stock. Basic earnings per share were computed using the two-class method for all periods presented. The shares of Class B stock are considered to be participating convertible securities since the shares of Class B stock are convertible on a share-for-share basis into shares of Class A stock. Diluted earnings per share were computed assuming the conversion of the Class B shares into Class A shares as of the beginning of each period.
On May 11, 2011, we announced our Board of Directors reactivated a share repurchase program, which had no activity since fiscal 2005, to repurchase up to the remaining available
22.5 million
shares of Class A common stock under the program. In May 2012, our Board of Directors approved an increase of
35 million
shares authorized for repurchase under our share repurchase program. As of
September 28, 2013
,
14.2 million
shares remained available for repurchase. The share repurchase program has no fixed or scheduled termination date and the timing and extent to which we repurchase shares will depend upon, among other things, our working capital needs, market conditions, liquidity targets, our debt obligations and regulatory requirements. In addition to the share repurchase program, we purchase shares on the open market to fund certain obligations under our equity compensation plans.
A summary of cumulative share repurchases of our Class A Stock is as follows:
|
in millions
|
|||||||||||||||||||||
|
September 28, 2013
|
September 29, 2012
|
October 1, 2011
|
|||||||||||||||||||
|
Shares
|
Dollars
|
Shares
|
Dollars
|
Shares
|
Dollars
|
||||||||||||||||
|
Shares repurchased:
|
|||||||||||||||||||||
|
Under share repurchase program
|
21.1
|
|
$
|
550
|
|
12.5
|
|
$
|
230
|
|
9.7
|
|
$
|
170
|
|
||||||
|
To fund certain obligations under equity compensation plans
|
2.8
|
|
64
|
|
1.8
|
|
34
|
|
2.0
|
|
37
|
|
|||||||||
|
Total share repurchases
|
23.9
|
|
$
|
614
|
|
14.3
|
|
$
|
264
|
|
11.7
|
|
$
|
207
|
|
||||||
44
Financial Instruments:
We purchase certain commodities, such as grains and livestock in the course of normal operations. As part of our commodity risk management activities, we use derivative financial instruments, primarily futures and options, to reduce our exposure to various market risks related to these purchases, as well as to changes in foreign currency exchange rates. Contract terms of a financial instrument qualifying as a hedge instrument closely mirror those of the hedged item, providing a high degree of risk reduction and correlation. Contracts designated and highly effective at meeting risk reduction and correlation criteria are recorded using hedge accounting. If a derivative instrument is accounted for as a hedge, changes in the fair value of the instrument will be offset either against the change in fair value of the hedged assets, liabilities or firm commitments through earnings or recognized in other comprehensive income (loss) until the hedged item is recognized in earnings. The ineffective portion of an instrument’s change in fair value is immediately recognized in earnings as a component of cost of sales. Instruments we hold as part of our risk management activities that do not meet the criteria for hedge accounting are marked to fair value with unrealized gains or losses reported currently in earnings. Changes in market value of derivatives used in our risk management activities relating to forward sales contracts are recorded in sales, while changes surrounding inventories on hand or anticipated purchases of inventories or supplies are recorded in cost of sales. We generally do not hedge anticipated transactions beyond
18
months.
Revenue Recognition:
We recognize revenue when title and risk of loss are transferred to customers, which is generally on delivery based on terms of sale. Revenue is recognized as the net amount estimated to be received after deducting estimated amounts for discounts, trade allowances and product terms.
Litigation Reserves:
There are a variety of legal proceedings pending or threatened against us. Accruals are recorded when it is probable a liability has been incurred and the amount of the liability can be reasonably estimated based on current law, progress of each case, opinions and views of legal counsel and other advisers, our experience in similar matters and intended response to the litigation. These amounts, which are not discounted and are exclusive of claims against third parties, are adjusted periodically as assessment efforts progress or additional information becomes available. We expense amounts for administering or litigating claims as incurred. Accruals for legal proceedings are included in Other current liabilities in the Consolidated Balance Sheets.
Freight Expense:
Freight expense associated with products shipped to customers is recognized in cost of sales.
Advertising and Promotion Expenses:
Advertising and promotion expenses are charged to operations in the period incurred. Customer incentive and trade promotion activities are recorded as a reduction to sales based on amounts estimated as being due to customers, based primarily on historical utilization and redemption rates, while other advertising and promotional activities are recorded as selling, general and administrative expenses. Advertising and promotion expenses for fiscal
2013
,
2012
and
2011
were
$555 million
,
$496 million
and
$552 million
, respectively.
Research and Development:
Research and development costs are expensed as incurred. Research and development costs totaled
$50 million
,
$43 million
and
$42 million
in fiscal
2013
,
2012
and
2011
, respectively.
Use of Estimates:
The consolidated financial statements are prepared in conformity with accounting principles generally accepted in the United States, which require us to make estimates and assumptions that affect the amounts reported in the consolidated financial statements and accompanying notes. Actual results could differ from those estimates.
Recently Issued Accounting Pronouncements:
In December 2011 and February 2013, the Financial Accounting Standards Board (FASB) issued guidance enhancing disclosures related to offsetting of certain assets and liabilities. This guidance is effective for annual reporting periods beginning on or after January 1, 2013, and interim periods within those annual periods. We do not expect the adoption will have a significant impact on our consolidated financial statements.
45
In June 2011, the FASB issued guidance regarding the presentation of comprehensive income. This guidance is effective for annual periods, and interim periods within those years, beginning after December 15, 2011. We adopted this guidance in the first quarter of fiscal 2013. The adoption required a separate statement of comprehensive income and additional disclosures on our consolidated financial statements.
In February 2013, the FASB issued guidance clarifying disclosures related to amounts reclassified out of accumulated other comprehensive income by component. We adopted this guidance in the second quarter of fiscal 2013. The adoption required additional disclosures in our consolidated financial statements.
In July 2013, the FASB issued guidance to eliminate the diversity in practice in the presentation of unrecognized tax benefits when a net operating loss carryforward, a similar tax loss, or a tax credit carryforward exists. Under this guidance, an unrecognized tax benefit, or a portion of an unrecognized tax benefit, should be presented in the financial statements as a reduction to a deferred tax asset for a net operating loss carryforward, a similar tax loss, or a tax credit carryforward, except in certain circumstances. We adopted this guidance in the fourth quarter of fiscal 2013. The adoption did not have a significant impact on our consolidated financial statements.
During fiscal 2013, we acquired
two
value-added food businesses as part of our strategic expansion initiative, which are included in our Prepared Foods segment. The aggregate purchase price of the acquisitions was
$106 million
, which included
$50 million
for Property, Plant and Equipment,
$41 million
allocated to Intangible Assets and
$12 million
allocated to Goodwill.
In fiscal 2011, we paid
$66 million
to purchase the minority partner's
40%
equity interest in our Shandong Tyson Xinchang Foods' subsidiaries, pursuant to the minority partner's exercise of put options.
After conducting an assessment during fiscal 2013 of our long-term business strategy in China, we determined our Weifang operation (Weifang), which was part of our Chicken segment, was no longer core to the execution of our strategy given the capital investment it required to execute our future business plan. Consequently, we conducted an impairment test and recorded a
$56 million
impairment charge. We subsequently sold Weifang which resulted in reporting it as a discontinued operation. The sale was completed in July 2013 and did not result in a significant gain or loss as its carrying value approximated the sales proceeds at the time of sale. Weifang's prior periods results, including the impairment charge, have been reclassified and presented as a discontinued operation in our Consolidated Statements of Income. The following is a summary of the discontinued operation's results:
|
in millions
|
|
|||||||||||
|
2013
|
|
2012
|
|
2011
|
|
|||||||
|
Sales
|
$
|
108
|
|
$
|
223
|
|
$
|
234
|
|
|||
|
Pretax loss
|
68
|
|
38
|
|
4
|
|
||||||
|
Income tax expense
|
2
|
|
—
|
|
1
|
|
||||||
|
Loss from discontinued operation, net of tax
|
$
|
70
|
|
$
|
38
|
|
$
|
5
|
|
|||
46
The following table reflects major categories of property, plant and equipment and accumulated depreciation at
September 28, 2013
, and
September 29, 2012
:
|
in millions
|
|||||||
|
2013
|
|
2012
|
|
||||
|
Land
|
$
|
100
|
|
$
|
101
|
|
|
|
Building and leasehold improvements
|
2,945
|
|
2,868
|
|
|||
|
Machinery and equipment
|
5,504
|
|
5,208
|
|
|||
|
Land improvements and other
|
417
|
|
408
|
|
|||
|
Buildings and equipment under construction
|
236
|
|
298
|
|
|||
|
9,202
|
|
8,883
|
|
||||
|
Less accumulated depreciation
|
5,149
|
|
4,861
|
|
|||
|
Net property, plant and equipment
|
$
|
4,053
|
|
$
|
4,022
|
|
|
Approximately
$418 million
will be required to complete buildings and equipment under construction at
September 28, 2013
.
The following table reflects goodwill activity for fiscal
2013
and
2012
:
|
in millions
|
|||||||||||||||||||
|
Chicken
|
|
Beef
|
|
Pork
|
|
Prepared
Foods
|
|
Consolidated
|
|
||||||||||
|
Balance at October 1, 2011
|
|||||||||||||||||||
|
Goodwill
|
$
|
978
|
|
$
|
1,123
|
|
$
|
317
|
|
$
|
63
|
|
$
|
2,481
|
|
||||
|
Accumulated impairment losses
|
(29
|
)
|
(560
|
)
|
—
|
|
—
|
|
(589
|
)
|
|||||||||
|
949
|
|
563
|
|
317
|
|
63
|
|
1,892
|
|
||||||||||
|
Fiscal 2012 Activity:
|
|||||||||||||||||||
|
Impairment losses
|
—
|
|
—
|
|
—
|
|
—
|
|
—
|
|
|||||||||
|
Currency translation and other
|
(1
|
)
|
—
|
|
—
|
|
—
|
|
(1
|
)
|
|||||||||
|
Balance at September 29, 2012
|
|||||||||||||||||||
|
Goodwill
|
977
|
|
1,123
|
|
317
|
|
63
|
|
2,480
|
|
|||||||||
|
Accumulated impairment losses
|
(29
|
)
|
(560
|
)
|
—
|
|
—
|
|
(589
|
)
|
|||||||||
|
$
|
948
|
|
$
|
563
|
|
$
|
317
|
|
$
|
63
|
|
$
|
1,891
|
|
|||||
|
Fiscal 2013 Activity:
|
|||||||||||||||||||
|
Acquisition
|
$
|
—
|
|
$
|
—
|
|
$
|
—
|
|
$
|
12
|
|
$
|
12
|
|
||||
|
Impairment losses
|
—
|
|
—
|
|
—
|
|
—
|
|
—
|
|
|||||||||
|
Currency translation and other
|
(1
|
)
|
—
|
|
—
|
|
—
|
|
(1
|
)
|
|||||||||
|
Balance at September 28, 2013
|
|||||||||||||||||||
|
Goodwill
|
976
|
|
1,123
|
|
317
|
|
75
|
|
2,491
|
|
|||||||||
|
Accumulated impairment losses
|
(29
|
)
|
(560
|
)
|
—
|
|
—
|
|
(589
|
)
|
|||||||||
|
$
|
947
|
|
$
|
563
|
|
$
|
317
|
|
$
|
75
|
|
$
|
1,902
|
|
|||||
47
The following table reflects other intangible assets by type at
September 28, 2013
, and
September 29, 2012
:
|
in millions
|
|||||||
|
2013
|
|
2012
|
|
||||
|
Gross carrying value:
|
|||||||
|
Trademarks
|
$
|
85
|
|
$
|
56
|
|
|
|
Patents, intellectual property and other
|
152
|
|
142
|
|
|||
|
Land use rights
|
8
|
|
21
|
|
|||
|
Less accumulated amortization
|
107
|
|
90
|
|
|||
|
Total intangible assets
|
$
|
138
|
|
$
|
129
|
|
|
Beginning with the date benefits are realized, other intangible assets are generally amortized using the straight-line method over their estimated period of benefit of
three
to
30
years. Amortization expense of
$17 million
,
$16 million
and
$18 million
was recognized during fiscal
2013
,
2012
and
2011
, respectively. We estimate amortization expense on intangible assets for the next five fiscal years subsequent to
September 28, 2013
, will be:
2014
-
$18 million
;
2015
-
$18 million
;
2016
-
$17 million
;
2017
-
$14 million
;
2018
-
$13 million
.
Other current liabilities at
September 28, 2013
, and
September 29, 2012
, include:
|
|
in millions
|
||||||
|
|
2013
|
|
2012
|
|
|||
|
Accrued salaries, wages and benefits
|
$
|
419
|
|
$
|
382
|
|
|
|
Self-insurance reserves
|
267
|
|
274
|
|
|||
|
Other
|
452
|
|
287
|
|
|||
|
Total other current liabilities
|
$
|
1,138
|
|
$
|
943
|
|
|
The following table reflects major components of debt as of
September 28, 2013
, and
September 29, 2012
:
|
in millions
|
|
||||||
|
2013
|
|
2012
|
|
||||
|
Revolving credit facility
|
$
|
—
|
|
$
|
—
|
|
|
|
Senior notes:
|
|||||||
|
3.25% Convertible senior notes due October 2013 (2013 Notes)
|
458
|
|
458
|
|
|||
|
6.60% Senior notes due April 2016 (2016 Notes)
|
638
|
|
638
|
|
|||
|
7.00% Notes due May 2018
|
120
|
|
120
|
|
|||
|
4.50% Senior notes due June 2022 (2022 Notes)
|
1,000
|
|
1,000
|
|
|||
|
7.00% Notes due January 2028
|
18
|
|
18
|
|
|||
|
Discount on senior notes
|
(6
|
)
|
(28
|
)
|
|||
|
GO Zone tax-exempt bonds due October 2033 (0.07% at 9/28/2013)
|
100
|
|
100
|
|
|||
|
Other
|
80
|
|
126
|
|
|||
|
Total debt
|
2,408
|
|
2,432
|
|
|||
|
Less current debt
|
513
|
|
515
|
|
|||
|
Total long-term debt
|
$
|
1,895
|
|
$
|
1,917
|
|
|
Annual maturities of debt for the five fiscal years subsequent to
September 28, 2013
, are:
2014
-
$514 million
;
2015
-
$12 million
;
2016
-
$645 million
;
2017
-
$4 million
;
2018
-
$120 million
.
48
Revolving Credit Facility
We have a
$1.0 billion
revolving credit facility that supports short-term funding needs and letters of credit. The facility will mature and the commitments thereunder will terminate in
August 2017
. After reducing the amount available by outstanding letters of credit issued under this facility, the amount available for borrowing at
September 28, 2013
, was
$958 million
. At
September 28, 2013
, we had outstanding letters of credit issued under this facility totaling
$42 million
, none of which were drawn upon. We had an additional
$146 million
of bilateral letters of credit issued separately from the revolving credit facility, none of which were drawn upon. Our letters of credit are issued primarily in support of workers’ compensation insurance programs, derivative activities and Dynamic Fuels’ Gulf Opportunity Zone tax-exempt bonds.
This facility is unsecured. However, if at any time (the Collateral Trigger Date) we shall fail to have (a) a corporate rating from Moody's Investors Service, Inc. (Moody's) of "Ba1" or better, (b) a corporate rating from Standard & Poor's Ratings Services, a Standard & Poor's Financial Services LLC business (S&P), of "BB+" or better, or (c) a corporate rating from Fitch Ratings, a wholly owned subsidiary of Fimalac, S.A. (Fitch), of "BB+" or better, we, any subsidiary that has guaranteed any material indebtedness of the Company, and substantially all of our other domestic subsidiaries shall be required to secure the obligations under the credit agreement and related documents with a first-priority perfected security interest in our and such subsidiary's cash, deposit and securities accounts, accounts receivable and related assets, inventory and proceeds of any of the foregoing (the Collateral Requirement).
If on any date prior to any Collateral Trigger Date we shall have (a) a corporate rating from Moody's of "Baa2" or better, (b) a corporate rating from S&P of "BBB" or better and (c) a corporate rating from Fitch of "BBB" or better, in each case with stable or better outlook, then the Collateral Requirement will no longer be effective.
This facility is fully guaranteed by Tyson Fresh Meats, Inc (TFM Parent), our wholly owned subsidiary, until such date TFM Parent is released from all of its guarantees of other material indebtedness. If in the future any of our other subsidiaries shall guarantee any of our material indebtedness, such subsidiary shall also be required to guarantee the indebtedness, obligations and liabilities under this facility.
2013 Notes
In September 2008, we issued
$458 million
principal amount
3.25%
convertible senior unsecured notes due
October 15, 2013
, with interest payable semi-annually in arrears on April 15 and October 15. The 2013 Notes were originally accounted for as a combined instrument because the conversion feature did not meet the requirements to be accounted for separately as a derivative financial instrument. However, we adopted new accounting guidance in the first quarter of fiscal 2010 and applied it retrospectively to all periods presented. This new accounting guidance required us to separately account for the liability and equity conversion features. Upon retrospective adoption, our effective interest rate on the 2013 Notes was determined to be
8.26%
, which resulted in the recognition of a
$92 million
discount to these notes with the offsetting after tax amount of
$56 million
recorded to capital in excess of par value. This discount is being accreted over the
five
-year term of the convertible notes at the effective interest rate.
In connection with the issuance of the 2013 Notes, we entered into separate convertible note hedge transactions with respect to our Class A stock to minimize the potential economic dilution upon conversion of the 2013 Notes. We also entered into separate warrant transactions. We recorded the purchase of the note hedge transactions as a reduction to capital in excess of par value, net of
$36 million
pertaining to the related deferred tax asset, and we recorded the proceeds of the warrant transactions as an increase to capital in excess of par value. Subsequent changes in fair value of these instruments are not recognized in the financial statements as long as the instruments continue to meet the criteria for equity classification.
We purchased call options in private transactions for
$94 million
that permit us to acquire up to approximately
27 million
shares of our Class A stock at the current strike price of
$16.78
per share, subject to adjustment. The call options allow us to acquire a number of shares of our Class A stock initially equal to the number of shares of Class A stock issuable to the holders of the 2013 Notes upon conversion. These call options contractually expire upon the maturity of the 2013 Notes. We sold warrants in private transactions for total proceeds of
$44 million
. The warrants permit the purchasers to acquire up to approximately
27 million
shares of our Class A stock at the current exercise price of
$22.16
per share, subject to adjustment. The warrants are exercisable on various dates from
January 2014
through
April 2014
.
The convertible note hedge and warrant transactions, in effect, increased the conversion price of the 2013 Notes from
$16.78
per share to
$22.16
per share, thus reducing the potential future economic dilution associated with conversion of the 2013 Notes. If our share price is below
$22.16
upon exercise of the warrants, there is no economic net share impact. A
10%
increase in our share price above the
$22.16
warrant exercise price would result in the issuance of
2.5 million
incremental shares. At
$28.60
, our closing share price on September 28, 2013, the incremental shares we would be required to issue upon exercise of the warrants would have resulted in
6.1 million
shares. The 2013 Notes and the warrants have a dilutive effect on our earnings per share to the extent the price of our Class A stock during a given measurement period exceeds the respective exercise prices of those instruments. The call options are excluded from the calculation of diluted earnings per share as their impact is anti-dilutive.
The 2013 Notes matured on October 15, 2013 at which time we paid the
$458 million
principal value with cash on hand, and settled the conversion premium by issuing
11.7 million
shares of our Class A stock from available treasury shares. Simultaneous to the settlement of the conversion premium, we received
11.7 million
shares of our Class A stock from the call options.
49
2016 Notes
On February 24, 2011, S&P upgraded the credit rating of these notes from "BB+" to "BBB-." On March 29, 2011, Moody’s upgraded our credit rating from "Ba2" to "Ba1." These upgrades decreased the interest rate on the 2016 Notes from
7.35%
to
6.85%
, effective beginning with the six-month interest payment due April 1, 2011.
On June 7, 2012, Moody's upgraded the credit rating of these notes from "Ba1" to "Baa3." This upgrade decreased the interest rate on the 2016 Notes from
6.85%
to
6.60%
, effective beginning with the six-month interest payment due October 1, 2012.
2022 Notes
In June 2012, we issued
$1.0 billion
of senior unsecured notes, which will mature in June 2022. The 2022 Notes carry a
4.50%
interest rate, with interest payments due semi-annually on June 15 and December 15. After the original issue discount of
$5 million
, based on an issue price of
99.458%
, we received net proceeds of
$995 million
. In addition, we incurred offering expenses of
$9 million
.
GO Zone Tax-Exempt Bonds
In October 2008, Dynamic Fuels received
$100 million
in proceeds from the sale of Gulf Opportunity Zone tax-exempt bonds made available by the federal government to the regions affected by Hurricanes Katrina and Rita in 2005. These floating rate bonds are due October 1, 2033. We issued a letter of credit to effectively guarantee the bond issuance. If any amounts are disbursed related to this guarantee, we would seek recovery of
50%
(up to
$50 million
) from Syntroleum Corporation, our joint venture partner, in accordance with our 2008 warrant agreement with Syntroleum Corporation.
Debt Covenants
Our revolving credit facility contains affirmative and negative covenants that, among other things, may limit or restrict our ability to: create liens and encumbrances; incur debt; merge, dissolve, liquidate or consolidate; dispose of or transfer assets; change the nature of our business; engage in certain transactions with affiliates; and enter into sale/leaseback or hedging transactions, in each case, subject to certain qualifications and exceptions. In addition, we are required to maintain minimum interest expense coverage and maximum debt to capitalization ratios.
Our 2022 Notes also contain affirmative and negative covenants that, among other things, may limit or restrict our ability to: create liens; engage in certain sale/leaseback transactions; and engage in certain consolidations, mergers and sales of assets.
We were in compliance with all debt covenants at
September 28, 2013
.
Detail of the provision for income taxes from continuing operations consists of the following:
|
in millions
|
|
||||||||||
|
2013
|
|
2012
|
|
2011
|
|
||||||
|
Federal
|
$
|
341
|
|
$
|
310
|
|
$
|
320
|
|
||
|
State
|
38
|
|
22
|
|
21
|
|
|||||
|
Foreign
|
30
|
|
19
|
|
(1
|
)
|
|||||
|
|
$
|
409
|
|
$
|
351
|
|
$
|
340
|
|
||
|
Current
|
$
|
421
|
|
$
|
211
|
|
$
|
254
|
|
||
|
Deferred
|
(12
|
)
|
140
|
|
86
|
|
|||||
|
|
$
|
409
|
|
$
|
351
|
|
$
|
340
|
|
||
The reasons for the difference between the statutory federal income tax rate and our effective income tax rate from continuing operations are as follows:
|
2013
|
|
2012
|
|
2011
|
|
|||
|
Federal income tax rate
|
35.0
|
%
|
35.0
|
%
|
35.0
|
%
|
||
|
State income taxes
|
2.4
|
|
1.5
|
|
1.6
|
|
||
|
General business credits
|
(1.3
|
)
|
(0.7
|
)
|
(0.9
|
)
|
||
|
Domestic production deduction
|
(3.2
|
)
|
(1.8
|
)
|
(2.3
|
)
|
||
|
Foreign rate differences and valuation allowances
|
0.3
|
|
1.8
|
|
—
|
|
||
|
Other
|
(0.6
|
)
|
0.6
|
|
(1.8
|
)
|
||
|
|
32.6
|
%
|
36.4
|
%
|
31.6
|
%
|
||
50
During fiscal 2013, the domestic production deduction and estimated general business credits decreased tax expense by
$40 million
and
$17 million
, respectively.
During fiscal 2012, foreign valuation allowances increased tax expense by
$10 million
, and the domestic production deduction decreased tax expense by
$17 million
.
During fiscal 2011, the domestic production deduction and estimated general business credits decreased tax expense by
$25 million
and
$9 million
, respectively.
Approximately
$53 million
,
$2 million
and
$36 million
of income from continuing operations before income taxes for fiscal
2013
,
2012
and
2011
, respectively, were from operations based in countries other than the United States.
We recognize deferred income taxes for the future tax consequences attributable to differences between the financial statement carrying amounts of existing assets and liabilities and their respective tax bases. Deferred tax assets and liabilities are measured using tax rates expected to apply to taxable income in the years in which those temporary differences are expected to be recovered or settled.
The tax effects of major items recorded as deferred tax assets and liabilities as of
September 28, 2013
, and
September 29, 2012
, are as follows:
|
in millions
|
|
||||||||||||||
|
2013
|
2012
|
||||||||||||||
|
Deferred Tax
|
Deferred Tax
|
||||||||||||||
|
Assets
|
|
Liabilities
|
|
Assets
|
|
Liabilities
|
|
||||||||
|
Property, plant and equipment
|
$
|
—
|
|
$
|
525
|
|
$
|
—
|
|
$
|
542
|
|
|||
|
Suspended taxes from conversion to accrual method
|
—
|
|
71
|
|
—
|
|
76
|
|
|||||||
|
Intangible assets
|
—
|
|
29
|
|
—
|
|
35
|
|
|||||||
|
Inventory
|
8
|
|
110
|
|
9
|
|
105
|
|
|||||||
|
Accrued expenses
|
209
|
|
—
|
|
193
|
|
—
|
|
|||||||
|
Net operating loss and other carryforwards
|
77
|
|
—
|
|
101
|
|
—
|
|
|||||||
|
Insurance reserves
|
22
|
|
—
|
|
21
|
|
—
|
|
|||||||
|
Other
|
60
|
|
98
|
|
69
|
|
90
|
|
|||||||
|
$
|
376
|
|
$
|
833
|
|
$
|
393
|
|
$
|
848
|
|
||||
|
Valuation allowance
|
$
|
(77
|
)
|
$
|
(78
|
)
|
|||||||||
|
Net deferred tax liability
|
$
|
534
|
|
$
|
533
|
|
|||||||||
We record deferred tax amounts in Other current assets, Other Assets, Other current liabilities and Deferred Income Taxes in the Consolidated Balance Sheets.
The deferred tax liability for suspended taxes from conversion to accrual method represents the 1987 change from the cash to accrual method of accounting and will be recognized by 2027.
At
September 28, 2013
, our gross state tax net operating loss carryforwards approximated
$457 million
and expire in fiscal years
2014
through
2033
. Gross foreign net operating loss carryforwards approximated
$116 million
, of which
$27 million
expire in fiscal years
2017
through
2022
, and the remainder has no expiration. We also have tax credit carryforwards of approximately
$22 million
that expire in fiscal years
2014
through
2027
.
We have accumulated undistributed earnings of foreign subsidiaries aggregating approximately
$351 million
and
$230 million
at
September 28, 2013
, and
September 29, 2012
, respectively. These earnings are expected to be indefinitely reinvested outside of the United States. If those earnings were distributed in the form of dividends or otherwise, we would be subject to federal income taxes (subject to an adjustment for foreign tax credits), state income taxes and withholding taxes payable to the various foreign countries. It is not currently practicable to estimate the tax liability that might be payable on the repatriation of these foreign earnings.
51
The following table summarizes the activity related to our gross unrecognized tax benefits at
September 28, 2013
,
September 29, 2012
, and
October 1, 2011
:
|
in millions
|
|
||||||||||
|
2013
|
|
2012
|
|
2011
|
|
||||||
|
Balance as of the beginning of the year
|
$
|
168
|
|
$
|
174
|
|
$
|
184
|
|
||
|
Increases related to current year tax positions
|
3
|
|
3
|
|
4
|
|
|||||
|
Increases related to prior year tax positions
|
15
|
|
5
|
|
21
|
|
|||||
|
Reductions related to prior year tax positions
|
(6
|
)
|
(10
|
)
|
(24
|
)
|
|||||
|
Reductions related to settlements
|
(2
|
)
|
(1
|
)
|
(9
|
)
|
|||||
|
Reductions related to expirations of statute of limitations
|
(3
|
)
|
(3
|
)
|
(2
|
)
|
|||||
|
Balance as of the end of the year
|
$
|
175
|
|
$
|
168
|
|
$
|
174
|
|
||
The amount of unrecognized tax benefits, if recognized, that would impact our effective tax rate was
$149 million
and
$154 million
at
September 28, 2013
, and
September 29, 2012
, respectively. We classify interest and penalties on unrecognized tax benefits as income tax expense. At
September 28, 2013
, and
September 29, 2012
, before tax benefits, we had
$63 million
and
$64 million
, respectively, of accrued interest and penalties on unrecognized tax benefits.
As of
September 28, 2013
, we are subject to income tax examinations for U.S. federal income taxes for fiscal years 2004 through 2012. We are also subject to income tax examinations by major state and foreign jurisdictions for fiscal years 2003 through 2012 and 2002 through 2012, respectively. We estimate that during the next twelve months it is reasonably possible that unrecognized tax benefits could decrease by as much as
$44 million
primarily due to expiration of statutes in various jurisdictions and settlements with taxing authorities.
During fiscal 2013, we recorded a
$19 million
currency translation adjustment gain recognized in conjunction with the receipt of proceeds constituting the final resolution of our investment in Canada, which was recorded in the Consolidated Statements of Income in Other, net.
During fiscal 2012, we recorded
$16 million
of equity earnings in joint ventures and
$4 million
in net foreign currency exchange gains, which were recorded in the Consolidated Statements of Income in Other, net.
During fiscal 2011, we recorded an
$11 million
gain related to a sale of interests in an equity method investment. This gain was recorded in the Consolidated Statements of Income in Other, net.
52
The earnings and weighted average common shares used in the computation of basic and diluted earnings per share are as follows:
|
in millions, except per share data
|
|||||||||||
|
2013
|
|
2012
|
|
2011
|
|
||||||
|
Numerator:
|
|||||||||||
|
Income from continuing operations
|
$
|
848
|
|
$
|
614
|
|
$
|
738
|
|
||
|
Less: Net loss from continuing operations attributable to noncontrolling interests
|
—
|
|
(7
|
)
|
(14
|
)
|
|||||
|
Net income from continuing operations attributable to Tyson
|
848
|
|
621
|
|
752
|
|
|||||
|
Less dividends declared:
|
|||||||||||
|
Class A
|
87
|
|
47
|
|
49
|
|
|||||
|
Class B
|
19
|
|
10
|
|
10
|
|
|||||
|
Undistributed earnings
|
$
|
742
|
|
$
|
564
|
|
$
|
693
|
|
||
|
Class A undistributed earnings
|
$
|
606
|
|
$
|
464
|
|
$
|
574
|
|
||
|
Class B undistributed earnings
|
136
|
|
100
|
|
119
|
|
|||||
|
Total undistributed earnings
|
$
|
742
|
|
$
|
564
|
|
$
|
693
|
|
||
|
Denominator:
|
|||||||||||
|
Denominator for basic earnings per share:
|
|||||||||||
|
Class A weighted average shares
|
282
|
|
293
|
|
303
|
|
|||||
|
Class B weighted average shares, and shares under if-converted method for diluted earnings per share
|
70
|
|
70
|
|
70
|
|
|||||
|
Effect of dilutive securities:
|
|||||||||||
|
Stock options and restricted stock
|
5
|
|
4
|
|
6
|
|
|||||
|
Convertible 2013 Notes
|
7
|
|
3
|
|
1
|
|
|||||
|
Warrants
|
3
|
|
—
|
|
—
|
|
|||||
|
Denominator for diluted earnings per share – adjusted weighted average shares and assumed conversions
|
367
|
|
370
|
|
380
|
|
|||||
|
Net Income Per Share from Continuing Operations Attributable to Tyson:
|
|||||||||||
|
Class A Basic
|
$
|
2.46
|
|
$
|
1.75
|
|
$
|
2.05
|
|
||
|
Class B Basic
|
$
|
2.22
|
|
$
|
1.57
|
|
$
|
1.84
|
|
||
|
Diluted
|
$
|
2.31
|
|
$
|
1.68
|
|
$
|
1.98
|
|
||
|
Net Income Per Share Attributable to Tyson:
|
|||||||||||
|
Class A Basic
|
$
|
2.26
|
|
$
|
1.64
|
|
$
|
2.04
|
|
||
|
Class B Basic
|
$
|
2.04
|
|
$
|
1.48
|
|
$
|
1.84
|
|
||
|
Diluted
|
$
|
2.12
|
|
$
|
1.58
|
|
$
|
1.97
|
|
||
We had no stock-based compensation shares that were antidilutive for fiscal 2013. Approximately 4 million of our stock-based compensation shares were antidilutive for fiscal
2012
and
2011
. These shares were not included in the dilutive earnings per share calculation.
We have
two
classes of capital stock, Class A stock and Class B stock. Cash dividends cannot be paid to holders of Class B stock unless they are simultaneously paid to holders of Class A stock. The per share amount of cash dividends paid to holders of Class B stock cannot exceed
90%
of the cash dividends paid to holders of Class A stock.
We allocate undistributed earnings based upon a
1
to
0.9
ratio per share to Class A stock and Class B stock, respectively. We allocate undistributed earnings based on this ratio due to historical dividend patterns, voting control of Class B shareholders and contractual limitations of dividends to Class B stock.
53
Our business operations give rise to certain market risk exposures mostly due to changes in commodity prices, foreign currency exchange rates and interest rates. We manage a portion of these risks through the use of derivative financial instruments, primarily futures and options, to reduce our exposure to commodity price risk, foreign currency risk and interest rate risk. Forward contracts on various commodities, including grains, livestock and energy, are primarily entered into to manage the price risk associated with forecasted purchases of these inputs used in our production processes. Foreign exchange forward contracts are entered into to manage the fluctuations in foreign currency exchange rates, primarily as a result of certain receivable and payable balances. We also periodically utilize interest rate swaps to manage interest rate risk associated with our variable-rate borrowings.
Our risk management programs are periodically reviewed by our Board of Directors’ Audit Committee. These programs are monitored by senior management and may be revised as market conditions dictate. Our current risk management programs utilize industry-standard models that take into account the implicit cost of hedging. Risks associated with our market risks and those created by derivative instruments and the fair values are strictly monitored, using Value-at-Risk and stress tests. Credit risks associated with our derivative contracts are not significant as we minimize counterparty concentrations, utilize margin accounts or letters of credit, and deal with credit-worthy counterparties. Additionally, our derivative contracts are mostly short-term in duration and we generally do not make use of credit-risk-related contingent features. No significant concentrations of credit risk existed at
September 28, 2013
.
We recognize all derivative instruments as either assets or liabilities at fair value in the Consolidated Balance Sheets, with the exception of normal purchases and normal sales expected to result in physical delivery. The accounting for changes in the fair value (i.e., gains or losses) of a derivative instrument depends on whether it has been designated and qualifies as part of a hedging relationship and the type of hedging relationship. For those derivative instruments that are designated and qualify as hedging instruments, we designate the hedging instrument based upon the exposure being hedged (i.e., cash flow hedge or fair value hedge). We qualify, or designate, a derivative financial instrument as a hedge when contract terms closely mirror those of the hedged item, providing a high degree of risk reduction and correlation. If a derivative instrument is accounted for as a hedge, depending on the nature of the hedge, changes in the fair value of the instrument either will be offset against the change in fair value of the hedged assets, liabilities or firm commitments through earnings, or be recognized in other comprehensive income (loss) (OCI) until the hedged item is recognized in earnings. The ineffective portion of an instrument’s change in fair value is recognized in earnings immediately. We designate certain forward contracts as follows:
|
•
|
Cash Flow Hedges – include certain commodity forward and option contracts of forecasted purchases (i.e., grains) and certain foreign exchange forward contracts.
|
|
•
|
Fair Value Hedges – include certain commodity forward contracts of firm commitments (i.e., livestock).
|
Cash flow hedges
Derivative instruments, such as futures and options, are designated as hedges against changes in the amount of future cash flows related to procurement of certain commodities utilized in our production processes. We do not purchase forward and option commodity contracts in excess of our physical consumption requirements and generally do not hedge forecasted transactions beyond
18 months
. The objective of these hedges is to reduce the variability of cash flows associated with the forecasted purchase of those commodities. For the derivative instruments we designate and qualify as a cash flow hedge, the effective portion of the gain or loss on the derivative is reported as a component of OCI and reclassified into earnings in the same period or periods during which the hedged transaction affects earnings. Gains and losses representing hedge ineffectiveness are recognized in earnings in the current period. Ineffectiveness related to our cash flow hedges was not significant during fiscal
2013
,
2012
and
2011
.
We had the following aggregated notional values of outstanding forward and option contracts accounted for as cash flow hedges:
|
in millions, except soy meal tons
|
||||||||||
|
Metric
|
September 28, 2013
|
|
September 29, 2012
|
|
||||||
|
Commodity:
|
||||||||||
|
Corn
|
Bushels
|
5
|
|
12
|
|
|||||
|
Soy Meal
|
Tons
|
96,800
|
|
164,700
|
|
|||||
|
Foreign Currency
|
United States dollar
|
$
|
60
|
|
$
|
80
|
|
|||
As of
September 28, 2013
, the net amounts expected to be reclassified into earnings within the next 12 months are pretax losses of
$7 million
related to grain and pretax gains of
$1 million
related to foreign currency. During fiscal
2013
,
2012
and
2011
, we did not reclassify significant pretax gains/losses into earnings as a result of the discontinuance of cash flow hedges due to the probability the original forecasted transaction would not occur by the end of the originally specified time period or within the additional period of time allowed by generally accepted accounting principles.
54
The following table sets forth the pretax impact of cash flow hedge derivative instruments in the Consolidated Statements of Income:
|
in millions
|
|||||||||||||||||||||||||
|
Gain/(Loss)
Recognized in OCI
on Derivatives
|
Consolidated
Statements of Income
Classification
|
Gain/(Loss)
Reclassified from
OCI to Earnings
|
|||||||||||||||||||||||
|
2013
|
|
2012
|
|
2011
|
|
2013
|
|
2012
|
|
2011
|
|
||||||||||||||
|
Cash Flow Hedge – Derivatives designated as hedging instruments:
|
|||||||||||||||||||||||||
|
Commodity contracts
|
$
|
(29
|
)
|
$
|
24
|
|
$
|
(5
|
)
|
Cost of Sales
|
$
|
(5
|
)
|
$
|
(16
|
)
|
$
|
25
|
|
||||||
|
Foreign exchange contracts
|
(2
|
)
|
(8
|
)
|
9
|
|
Other Income/Expense
|
(4
|
)
|
4
|
|
—
|
|
||||||||||||
|
Total
|
$
|
(31
|
)
|
$
|
16
|
|
$
|
4
|
|
$
|
(9
|
)
|
$
|
(12
|
)
|
$
|
25
|
|
|||||||
Fair value hedges
We designate certain futures contracts as fair value hedges of firm commitments to purchase livestock for slaughter. Our objective of these hedges is to minimize the risk of changes in fair value created by fluctuations in commodity prices associated with fixed price livestock firm commitments. We had the following aggregated notional values of outstanding forward contracts entered into to hedge firm commitments which are accounted for as a fair value hedge:
|
in millions
|
|
|||||||
|
Metric
|
September 28, 2013
|
|
September 29, 2012
|
|
||||
|
Commodity:
|
||||||||
|
Live Cattle
|
Pounds
|
209
|
|
232
|
|
|||
|
Lean Hogs
|
Pounds
|
384
|
|
239
|
|
|||
For these derivative instruments we designate and qualify as a fair value hedge, the gain or loss on the derivative, as well as the offsetting gain or loss on the hedged item attributable to the hedged risk, are recognized in earnings in the same period. We include the gain or loss on the hedged items (i.e., livestock purchase firm commitments) in the same line item, Cost of Sales, as the offsetting gain or loss on the related livestock forward position.
|
in millions
|
||||||||||||||
|
Consolidated
Statements of Income
Classification
|
2013
|
|
2012
|
|
2011
|
|
||||||||
|
Gain/(Loss) on forwards
|
Cost of Sales
|
$
|
21
|
|
$
|
47
|
|
$
|
(78
|
)
|
||||
|
Gain/(Loss) on purchase contract
|
Cost of Sales
|
(21
|
)
|
(47
|
)
|
78
|
|
|||||||
Ineffectiveness related to our fair value hedges was not significant during fiscal
2013
,
2012
and
2011
.
Undesignated positions
In addition to our designated positions, we also hold forward and option contracts for which we do not apply hedge accounting. These include certain derivative instruments related to commodities price risk, including grains, livestock, energy and foreign currency risk. We mark these positions to fair value through earnings at each reporting date. We generally do not enter into undesignated positions beyond
18
months.
The objective of our undesignated grains, livestock and energy commodity positions is to reduce the variability of cash flows associated with the forecasted purchase of certain grains, energy and livestock inputs to our production processes. We also enter into certain forward sales of boxed beef and boxed pork and forward purchases of cattle and hogs at fixed prices. The fixed price sales contracts lock in the proceeds from a future sale and the fixed cattle and hog purchases lock in the cost. However, the cost of the livestock and the related boxed beef and boxed pork market prices at the time of the sale or purchase could vary from this fixed price. As we enter into fixed forward sales of boxed beef and boxed pork and forward purchases of cattle and hogs, we also enter into the appropriate number of livestock options and futures positions to mitigate a portion of this risk. Changes in market value of the open livestock options and futures positions are marked to market and reported in earnings at each reporting date, even though the economic impact of our fixed prices being above or below the market price is only realized at the time of sale or purchase. These positions generally do not qualify for hedge treatment due to location basis differences between the commodity exchanges and the actual locations when we purchase the commodities.
55
We have a foreign currency cash flow hedging program to hedge portions of forecasted transactions denominated in foreign currencies, primarily with forward and option contracts, to protect against the reduction in value of forecasted foreign currency cash flows. Our undesignated foreign currency positions generally would qualify for cash flow hedge accounting. However, to reduce earnings volatility, we normally will not elect hedge accounting treatment when the position provides an offset to the underlying related transaction that impacts current earnings.
We had the following aggregate outstanding notional values related to our undesignated positions:
|
in millions, except soy meal tons
|
||||||||||
|
Metric
|
September 28, 2013
|
|
September 29, 2012
|
|
||||||
|
Commodity:
|
||||||||||
|
Corn
|
Bushels
|
69
|
|
19
|
|
|||||
|
Soy Meal
|
Tons
|
204,600
|
|
1,200
|
|
|||||
|
Soy Oil
|
Pounds
|
11
|
|
17
|
|
|||||
|
Live Cattle
|
Pounds
|
60
|
|
68
|
|
|||||
|
Lean Hogs
|
Pounds
|
159
|
|
108
|
|
|||||
|
Foreign Currency
|
United States dollars
|
$
|
95
|
|
$
|
165
|
|
|||
The following table sets forth the pretax impact of the undesignated derivative instruments in the Consolidated Statements of Income:
|
in millions
|
||||||||||||||
|
Consolidated
Statements of Income
Classification
|
Gain/(Loss)
Recognized
in Earnings
|
|||||||||||||
|
2013
|
|
2012
|
|
2011
|
|
|||||||||
|
Derivatives not designated as hedging instruments:
|
||||||||||||||
|
Commodity contracts
|
Sales
|
$
|
(10
|
)
|
$
|
(10
|
)
|
$
|
20
|
|
||||
|
Commodity contracts
|
Cost of Sales
|
(24
|
)
|
51
|
|
(2
|
)
|
|||||||
|
Foreign exchange contracts
|
Other Income/Expense
|
2
|
|
—
|
|
(3
|
)
|
|||||||
|
Total
|
$
|
(32
|
)
|
$
|
41
|
|
$
|
15
|
|
|||||
56
The following table sets forth the fair value of all derivative instruments outstanding in the Consolidated Balance Sheets:
|
in millions
|
|||||||
|
Fair Value
|
|||||||
|
September 28, 2013
|
|
September 29, 2012
|
|
||||
|
Derivative Assets:
|
|||||||
|
Derivatives designated as hedging instruments:
|
|||||||
|
Commodity contracts
|
$
|
4
|
|
$
|
32
|
|
|
|
Foreign exchange contracts
|
1
|
|
—
|
|
|||
|
Total derivative assets – designated
|
5
|
|
32
|
|
|||
|
Derivatives not designated as hedging instruments:
|
|||||||
|
Commodity contracts
|
25
|
|
21
|
|
|||
|
Foreign exchange contracts
|
2
|
|
1
|
|
|||
|
Total derivative assets – not designated
|
27
|
|
22
|
|
|||
|
Total derivative assets
|
$
|
32
|
|
$
|
54
|
|
|
|
Derivative Liabilities:
|
|||||||
|
Derivatives designated as hedging instruments:
|
|||||||
|
Commodity contracts
|
$
|
29
|
|
$
|
6
|
|
|
|
Foreign exchange contracts
|
—
|
|
1
|
|
|||
|
Total derivative liabilities – designated
|
29
|
|
7
|
|
|||
|
Derivatives not designated as hedging instruments:
|
|||||||
|
Commodity contracts
|
72
|
|
96
|
|
|||
|
Foreign exchange contracts
|
1
|
|
2
|
|
|||
|
Total derivative liabilities – not designated
|
73
|
|
98
|
|
|||
|
Total derivative liabilities
|
$
|
102
|
|
$
|
105
|
|
|
Our derivative assets and liabilities are presented in our Consolidated Balance Sheets on a net basis. We net derivative assets and liabilities, including cash collateral when a legally enforceable master netting arrangement exists between the counterparty to a derivative contract and us. See Note 13: Fair Value Measurements for a reconciliation to amounts reported in the Consolidated Balance Sheets in Other current assets and Other current liabilities.
Fair value is defined as the price that would be received to sell an asset or paid to transfer a liability (an exit price) in the principal or most advantageous market for the asset or liability in an orderly transaction between market participants on the measurement date. The fair value hierarchy contains three levels as follows:
Level 1
— Unadjusted quoted prices available in active markets for the identical assets or liabilities at the measurement date.
Level 2
— Other observable inputs available at the measurement date, other than quoted prices included in Level 1, either directly or indirectly, including:
|
•
|
Quoted prices for similar assets or liabilities in active markets;
|
|
•
|
Quoted prices for identical or similar assets in non-active markets;
|
|
•
|
Inputs other than quoted prices that are observable for the asset or liability; and
|
|
•
|
Inputs derived principally from or corroborated by other observable market data.
|
Level 3 —
Unobservable inputs that cannot be corroborated by observable market data and reflect the use of significant management judgment. These values are generally determined using pricing models for which the assumptions utilize management’s estimates of market participant assumptions.
57
Assets and Liabilities Measured at Fair Value on a Recurring Basis
The fair value hierarchy requires the use of observable market data when available. In instances where the inputs used to measure fair value fall into different levels of the fair value hierarchy, the fair value measurement has been determined based on the lowest level input significant to the fair value measurement in its entirety. Our assessment of the significance of a particular item to the fair value measurement in its entirety requires judgment, including the consideration of inputs specific to the asset or liability.
The following tables set forth by level within the fair value hierarchy our financial assets and liabilities accounted for at fair value on a recurring basis according to the valuation techniques we used to determine their fair values:
|
in millions
|
|||||||||||||||||||
|
September 28, 2013
|
Level 1
|
|
Level 2
|
|
Level 3
|
|
Netting (a)
|
|
Total
|
|
|||||||||
|
Assets:
|
|||||||||||||||||||
|
Commodity Derivatives
|
$
|
—
|
|
$
|
29
|
|
$
|
—
|
|
$
|
(21
|
)
|
$
|
8
|
|
||||
|
Foreign Exchange Forward Contracts
|
—
|
|
3
|
|
—
|
|
(1
|
)
|
2
|
|
|||||||||
|
Available for Sale Securities:
|
|||||||||||||||||||
|
Current
|
—
|
|
1
|
|
—
|
|
—
|
|
1
|
|
|||||||||
|
Non-current
|
4
|
|
24
|
|
65
|
|
—
|
|
93
|
|
|||||||||
|
Deferred Compensation Assets
|
23
|
|
191
|
|
—
|
|
—
|
|
214
|
|
|||||||||
|
Total Assets
|
$
|
27
|
|
$
|
248
|
|
$
|
65
|
|
$
|
(22
|
)
|
$
|
318
|
|
||||
|
Liabilities:
|
|||||||||||||||||||
|
Commodity Derivatives
|
$
|
—
|
|
$
|
101
|
|
$
|
—
|
|
$
|
(101
|
)
|
$
|
—
|
|
||||
|
Foreign Exchange Forward Contracts
|
—
|
|
1
|
|
—
|
|
—
|
|
1
|
|
|||||||||
|
Total Liabilities
|
$
|
—
|
|
$
|
102
|
|
$
|
—
|
|
$
|
(101
|
)
|
$
|
1
|
|
||||
|
September 29, 2012
|
Level 1
|
|
Level 2
|
|
Level 3
|
|
Netting (a)
|
|
Total
|
|
|||||||||
|
Assets:
|
|||||||||||||||||||
|
Commodity Derivatives
|
$
|
—
|
|
$
|
53
|
|
$
|
—
|
|
$
|
(40
|
)
|
$
|
13
|
|
||||
|
Foreign Exchange Forward Contracts
|
—
|
|
1
|
|
—
|
|
(1
|
)
|
—
|
|
|||||||||
|
Available for Sale Securities:
|
|||||||||||||||||||
|
Current
|
—
|
|
3
|
|
—
|
|
—
|
|
3
|
|
|||||||||
|
Non-current
|
6
|
|
25
|
|
86
|
|
—
|
|
117
|
|
|||||||||
|
Deferred Compensation Assets
|
31
|
|
149
|
|
—
|
|
—
|
|
180
|
|
|||||||||
|
Total Assets
|
$
|
37
|
|
$
|
231
|
|
$
|
86
|
|
$
|
(41
|
)
|
$
|
313
|
|
||||
|
Liabilities:
|
|||||||||||||||||||
|
Commodity Derivatives
|
$
|
—
|
|
$
|
102
|
|
$
|
—
|
|
$
|
(100
|
)
|
$
|
2
|
|
||||
|
Foreign Exchange Forward Contracts
|
—
|
|
3
|
|
—
|
|
—
|
|
3
|
|
|||||||||
|
Total Liabilities
|
$
|
—
|
|
$
|
105
|
|
$
|
—
|
|
$
|
(100
|
)
|
$
|
5
|
|
||||
|
(a)
|
Our derivative assets and liabilities are presented in our Consolidated Balance Sheets on a net basis. We net derivative assets and liabilities, including cash collateral, when a legally enforceable master netting arrangement exists between the counterparty to a derivative contract and us. At
September 28, 2013
, and
September 29, 2012
, we had posted with various counterparties
$79 million
and
$59 million
, respectively, of cash collateral and held no cash collateral.
|
58
The following table provides a reconciliation between the beginning and ending balance of debt securities measured at fair value on a recurring basis in the table above that used significant unobservable inputs (Level 3):
|
in millions
|
|
||||||
|
September 28, 2013
|
|
September 29, 2012
|
|
||||
|
Balance at beginning of year
|
$
|
86
|
|
$
|
83
|
|
|
|
Total realized and unrealized gains (losses):
|
|||||||
|
Included in earnings
|
1
|
|
1
|
|
|||
|
Included in other comprehensive income (loss)
|
—
|
|
—
|
|
|||
|
Purchases
|
19
|
|
28
|
|
|||
|
Issuances
|
—
|
|
—
|
|
|||
|
Settlements
|
(41
|
)
|
(26
|
)
|
|||
|
Balance at end of year
|
$
|
65
|
|
$
|
86
|
|
|
|
Total gains (losses) for the periods included in earnings attributable to the change in unrealized gains (losses) relating to assets and liabilities still held at end of year
|
$
|
—
|
|
$
|
—
|
|
|
The following methods and assumptions were used to estimate the fair value of each class of financial instrument:
Derivative Assets and Liabilities:
Our commodities and foreign exchange forward contracts primarily include exchange-traded and over-the-counter contracts which are further described in Note 12: Derivative Financial Instruments. We record our commodity derivatives at fair value using quoted market prices adjusted for credit and non-performance risk and internal models that use as their basis readily observable market inputs including current and forward commodity market prices. Our foreign exchange forward contracts are recorded at fair value based on quoted prices and spot and forward currency prices adjusted for credit and non-performance risk. We classify these instruments in Level 2 when quoted market prices can be corroborated utilizing observable current and forward commodity market prices on active exchanges or observable market transactions of spot currency rates and forward currency prices.
Available for Sale Securities:
Our investments in marketable debt securities are classified as available-for-sale and are reported at fair value based on pricing models and quoted market prices adjusted for credit and non-performance risk. Short-term investments with maturities of less than
12
months are included in Other current assets in the Consolidated Balance Sheets and primarily include certificates of deposit and commercial paper. All other marketable debt securities are included in Other Assets in the Consolidated Balance Sheets and have maturities ranging up to
35
years. We classify our investments in U.S. government, U.S. agency, certificates of deposit and commercial paper debt securities as Level 2 as fair value is generally estimated using discounted cash flow models that are primarily industry-standard models that consider various assumptions, including time value and yield curve as well as other readily available relevant economic measures. We classify certain corporate, asset-backed and other debt securities as Level 3 as there is limited activity or less observable inputs into valuation models, including current interest rates and estimated prepayment, default and recovery rates on the underlying portfolio or structured investment vehicle. We also classified privately held redeemable preferred stock securities as Level 3 as there was limited activity or less observable inputs into valuation models, including interest rates and credit worthiness of the underlying private issuer. As of
September 28, 2013
, the privately held redeemable preferred stock had been fully redeemed. Significant changes to assumptions or unobservable inputs in the valuation of our Level 3 instruments would not have a significant impact to our consolidated financial statements.
Additionally, we have
0.8 million
shares of Syntroleum Corporation common stock and
0.4 million
warrants, which expire in June 2015, to purchase an equivalent amount of Syntroleum Corporation common stock at an average price of
$28.70
. We record the shares and warrants in Other Assets in the Consolidated Balance Sheets at fair value based on quoted market prices. We classify the shares as Level 1 as the fair value is based on unadjusted quoted prices available in active markets. We classify the warrants as Level 2 as fair value can be corroborated based on observable market data.
59
|
in millions
|
|||||||||||||||||||||||
|
September 28, 2013
|
September 29, 2012
|
||||||||||||||||||||||
|
Amortized
Cost Basis
|
|
Fair
Value
|
|
Unrealized
Gain/(Loss)
|
|
Amortized
Cost Basis
|
|
Fair
Value
|
|
Unrealized
Gain/(Loss)
|
|
||||||||||||
|
Available for Sale Securities:
|
|||||||||||||||||||||||
|
Debt Securities:
|
|||||||||||||||||||||||
|
U.S. Treasury and Agency
|
$
|
25
|
|
$
|
25
|
|
$
|
—
|
|
$
|
26
|
|
$
|
27
|
|
$
|
1
|
|
|||||
|
Corporate and Asset-Backed (a)
|
64
|
|
65
|
|
1
|
|
64
|
|
66
|
|
2
|
|
|||||||||||
|
Redeemable Preferred Stock
|
—
|
|
—
|
|
—
|
|
20
|
|
20
|
|
—
|
|
|||||||||||
|
Equity Securities:
|
|||||||||||||||||||||||
|
Common Stock and Warrants
|
9
|
|
4
|
|
(5
|
)
|
9
|
|
7
|
|
(2
|
)
|
|||||||||||
|
(a)
|
At
September 28, 2013
, and
September 29, 2012
, the amortized cost basis for Corporate and Asset-Backed debt securities had been reduced by accumulated other than temporary impairments of
$1 million
and
$2 million
, respectively.
|
Unrealized holding gains (losses), net of tax, are excluded from earnings and reported in OCI until the security is settled or sold. On a quarterly basis, we evaluate whether losses related to our available-for-sale securities are temporary in nature. Losses on equity securities are recognized in earnings if the decline in value is judged to be other than temporary. If losses related to our debt securities are determined to be other than temporary, the loss would be recognized in earnings if we intend, or more likely than not will be required, to sell the security prior to recovery. For debt securities in which we have the intent and ability to hold until maturity, losses determined to be other than temporary would remain in OCI, other than expected credit losses which are recognized in earnings. We consider many factors in determining whether a loss is temporary, including the length of time and extent to which the fair value has been below cost, the financial condition and near-term prospects of the issuer and our ability and intent to hold the investment for a period of time sufficient to allow for any anticipated recovery. During fiscal
2013
,
2012
and
2011
, we recognized no other than temporary impairments in earnings. No other than temporary losses were deferred in OCI as of
September 28, 2013
, and
September 29, 2012
.
Deferred Compensation Assets:
We maintain non-qualified deferred compensation plans for certain executives and other highly compensated employees. Investments are maintained within a trust and include money market funds, mutual funds and life insurance policies. The cash surrender value of the life insurance policies is invested primarily in mutual funds. The investments are recorded at fair value based on quoted market prices and are included in Other Assets in the Consolidated Balance Sheets. We classify the investments which have observable market prices in active markets in Level 1 as these are generally publicly-traded mutual funds. The remaining deferred compensation assets are classified in Level 2, as fair value can be corroborated based on observable market data. Realized and unrealized gains (losses) on deferred compensation are included in earnings.
Assets and Liabilities Measured at Fair Value on a Nonrecurring Basis
In addition to assets and liabilities that are recorded at fair value on a recurring basis, we record assets and liabilities at fair value on a nonrecurring basis. Generally, assets are recorded at fair value on a nonrecurring basis as a result of impairment charges. During fiscal 2013, we recorded a
$56 million
impairment charge related to our Weifang operation in China. The impairment charge resulted from the completion of an assessment of our long-term business strategy in China, in which we determined Weifang was no longer core to the execution of our future business plan. Our valuation of these assets incorporated unobservable Level 3 inputs. We did not have any other significant measurements of assets or liabilities at fair value on a nonrecurring basis subsequent to their initial recognition.
Other Financial Instruments
Fair value of our debt is principally estimated using Level 2 inputs based on quoted prices for those or similar instruments. Fair value and carrying value for our debt are as follows:
|
in millions
|
|||||||||||||||
|
September 28, 2013
|
September 29, 2012
|
||||||||||||||
|
Fair
Value
|
|
Carrying
Value
|
|
Fair
Value
|
|
Carrying
Value
|
|
||||||||
|
Total Debt
|
$
|
2,541
|
|
$
|
2,408
|
|
$
|
2,596
|
|
$
|
2,432
|
|
|||
60
Concentrations of Credit Risk
Our financial instruments exposed to concentrations of credit risk consist primarily of cash and cash equivalents and accounts receivable. Our cash equivalents are in high quality securities placed with major banks and financial institutions. Concentrations of credit risk with respect to receivables are limited due to the large number of customers and their dispersion across geographic areas. We perform periodic credit evaluations of our customers’ financial condition and generally do not require collateral. At
September 28, 2013
, and
September 29, 2012
,
17.5%
and
17.1%
, respectively, of our net accounts receivable balance was due from Wal-Mart Stores, Inc. No other single customer or customer group represented greater than 10% of net accounts receivable.
We issue shares under our stock-based compensation plans by issuing Class A stock from treasury. The total number of shares available for future grant under the Tyson Foods, Inc. 2000 Stock Incentive Plan (Incentive Plan) was
35,365,400
at
September 28, 2013
.
Stock Options
Shareholders approved the Incentive Plan in January 2001. The Incentive Plan is administered by the Compensation and Leadership Development Committee of the Board of Directors (Compensation Committee). The Incentive Plan includes provisions for granting incentive stock options for shares of Class A stock at a price not less than the fair value at the date of grant. Nonqualified stock options may be granted at a price equal to or more than the fair value of Class A stock on the date the option is granted. Stock options under the Incentive Plan generally become exercisable ratably over
three
years from the date of grant and must be exercised within
10
years from the date of grant. Our policy is to recognize compensation expense on a straight-line basis over the requisite service period for the entire award.
|
Shares Under
Option
|
|
Weighted
Average Exercise
Price Per Share
|
|
Weighted Average
Remaining
Contractual Life
(in Years)
|
Aggregate
Intrinsic Value
(in millions)
|
|
||||||
|
Outstanding, September 29, 2012
|
19,067,360
|
|
$
|
14.82
|
|
|||||||
|
Exercised
|
(8,778,028
|
)
|
13.96
|
|
||||||||
|
Canceled
|
(177,144
|
)
|
16.04
|
|
||||||||
|
Granted
|
3,799,980
|
|
19.36
|
|
||||||||
|
Outstanding, September 28, 2013
|
13,912,168
|
|
16.59
|
|
6.8
|
$
|
167
|
|
||||
|
Exercisable, September 28, 2013
|
6,423,287
|
|
$
|
14.87
|
|
4.9
|
$
|
88
|
|
|||
We generally grant stock options once a year. The weighted average grant-date fair value of options granted in fiscal
2013
,
2012
and
2011
was
$6.44
,
$6.99
and
$6.19
, respectively. The fair value of each option grant is established on the date of grant using a binomial lattice method. We use historical volatility for a period of time comparable to the expected life of the option to determine volatility assumptions. Expected life is calculated based on the contractual term of each grant and takes into account the historical exercise and termination behavior of participants. Risk-free interest rates are based on the five-year Treasury bond rate. Assumptions as of the grant date used in the fair value calculation of each year’s grants are outlined in the following table.
|
2013
|
|
2012
|
|
2011
|
|
|||
|
Expected life (in years)
|
6.2
|
|
6.7
|
|
6.7
|
|
||
|
Risk-free interest rate
|
0.7
|
%
|
0.9
|
%
|
1.5
|
%
|
||
|
Expected volatility
|
36.8
|
%
|
36.6
|
%
|
38.8
|
%
|
||
|
Expected dividend yield
|
1.0
|
%
|
1.0
|
%
|
1.0
|
%
|
||
We recognized stock-based compensation expense related to stock options, net of income taxes, of
$14 million
,
$15 million
and
$12 million
for fiscal
2013
,
2012
and
2011
, respectively. The related tax benefit for fiscal
2013
,
2012
and
2011
was
$9 million
,
$10 million
and
$7 million
, respectively. We had
3.9 million
,
3.4 million
and
3.8 million
options vest in fiscal
2013
,
2012
and
2011
, respectively, with a grant date fair value of
$22 million
,
$17 million
and
$16 million
, respectively.
In fiscal
2013
,
2012
and
2011
, we received cash of
$123 million
,
$34 million
and
$51 million
, respectively, for the exercise of stock options. Shares are issued from treasury for stock option exercises. The related tax benefit realized from stock options exercised during fiscal
2013
,
2012
and
2011
, was
$35 million
,
$7 million
and
$10 million
, respectively. The total intrinsic value of options exercised in fiscal
2013
,
2012
and
2011
, was
$90 million
,
$21 million
and
$26 million
, respectively. Cash flows resulting from tax deductions in excess of the compensation cost of those options (excess tax deductions) are classified as financing cash flows. We realized
$18 million
,
$3 million
and
$5 million
related to excess tax deductions during fiscal
2013
,
2012
and
2011
, respectively.
61
As of
September 28, 2013
, we had
$25 million
of total unrecognized compensation cost related to stock option plans that will be recognized over a weighted average period of
1.2 years
.
Restricted Stock
We issue restricted stock at the market value as of the date of grant, with restrictions expiring over periods through fiscal 2016. Unearned compensation is recognized over the vesting period for the particular grant using a straight-line method.
|
Number of Shares
|
|
Weighted
Average Grant-
Date Fair Value
Per Share
|
|
Weighted Average
Remaining
Contractual Life
(in Years)
|
Aggregate
Intrinsic Value
(in millions)
|
|
||||||
|
Nonvested, September 29, 2012
|
2,371,570
|
|
$
|
15.29
|
|
|||||||
|
Granted
|
185,804
|
|
20.64
|
|
||||||||
|
Dividends
|
21,010
|
|
24.68
|
|
||||||||
|
Vested
|
(1,368,834
|
)
|
14.74
|
|
||||||||
|
Forfeited
|
(70,851
|
)
|
17.43
|
|
||||||||
|
Nonvested, September 28, 2013
|
1,138,699
|
|
$
|
16.86
|
|
1.0
|
$
|
33
|
|
|||
As of
September 28, 2013
, we had
$8 million
of total unrecognized compensation cost related to restricted stock awards that will be recognized over a weighted average period of
1.0 year
.
We recognized stock-based compensation expense related to restricted stock, net of income taxes, of
$5 million
,
$7 million
and
$7 million
for fiscal
2013
,
2012
and
2011
, respectively. The related tax benefit for fiscal
2013
,
2012
and
2011
was
$3 million
,
$4 million
and
$5 million
, respectively. We had
1.4 million
,
1.2 million
and
0.9 million
restricted stock awards vest in fiscal
2013
,
2012
and
2011
, respectively, with a grant date fair value of
$20 million
,
$17 million
and
$14 million
, respectively.
Performance-Based Shares
We award performance-based shares of our Class A stock to certain senior executives. These awards are typically granted once a year. Performance-based shares vest based upon the passage of time and the achievement of performance or market performance criteria, ranging from
0%
to
200%
, as determined by the Compensation Committee prior to the date of the award. Vesting periods for these awards are generally
three
years. We review progress toward the attainment of the performance criteria each quarter during the vesting period. When it is probable the minimum performance criteria for an award will be achieved, we begin recognizing the expense equal to the proportionate share of the total fair value of the Class A stock price on the grant date. The total expense recognized over the duration of performance awards will equal the Class A stock price on the date of grant multiplied by the number of shares ultimately awarded based on the level of attainment of the performance criteria. For grants with market performance criteria, the total expense recognized over the duration of the award will equal the fair value as determined on the grant date, regardless if the market performance criteria is met.
The following table summarizes the performance-based shares at the maximum award amounts based upon the respective performance share agreements. Actual shares that will vest depend on the level of attainment of the performance-based criteria.
|
Number of Shares
|
|
Weighted
Average Grant-
Date Fair Value
Per Share
|
|
Weighted Average
Remaining
Contractual Life
(in Years)
|
||||
|
Nonvested, September 29, 2012
|
174,062
|
|
$
|
14.24
|
|
|||
|
Granted
|
924,651
|
|
21.35
|
|
||||
|
Vested
|
(32,468
|
)
|
12.35
|
|
||||
|
Forfeited
|
(64,935
|
)
|
12.35
|
|
||||
|
Nonvested, September 28, 2013
|
1,001,310
|
|
$
|
20.99
|
|
2.0
|
||
We recognized stock-based compensation expense related to performance shares, net of income taxes, of
$2.4 million
,
$0.2 million
and
$0.3 million
for fiscal
2013
,
2012
and
2011
, respectively. The related tax benefit for fiscal
2013
,
2012
and
2011
was
$1.5 million
,
$0.1 million
and
$0.2 million
, respectively. As of
September 28, 2013
, we had
$10 million
of total unrecognized compensation based upon our progress toward the attainment of criteria related to performance-based share awards that will be recognized over a weighted average period of
2.0 years
.
62
At
September 28, 2013
, we had
four
noncontributory defined benefit pension plans consisting of
three
funded qualified plans and
one
unfunded non-qualified plan. All
three
of our qualified plans are frozen and provide benefits based on a formula using years of service and a specified benefit rate. Effective January 1, 2004, we implemented a non-qualified defined benefit plan for certain contracted officers that uses a formula based on years of service and final average salary. We also have other postretirement benefit plans for which substantially all of our employees may receive benefits if they satisfy applicable eligibility criteria. The postretirement healthcare plans are contributory with participants’ contributions adjusted when deemed necessary.
We have defined contribution retirement programs for various groups of employees. We recognized expenses of
$50 million
,
$47 million
and
$45 million
in fiscal
2013
,
2012
and
2011
, respectively.
We use a fiscal year end measurement date for our defined benefit plans and other postretirement plans. We recognize the effect of actuarial gains and losses into earnings immediately for other postretirement plans rather than amortizing the effect over future periods.
Other postretirement benefits include postretirement medical costs and life insurance.
Benefit Obligations And Funded Status
The following table provides a reconciliation of the changes in the plans’ benefit obligations, assets and funded status at
September 28, 2013
, and
September 29, 2012
:
|
in millions
|
|||||||||||||||||||||||
|
Pension Benefits
|
Other Postretirement
|
||||||||||||||||||||||
|
Qualified
|
Non-Qualified
|
Benefits
|
|||||||||||||||||||||
|
2013
|
|
2012
|
|
2013
|
|
2012
|
|
2013
|
|
2012
|
|
||||||||||||
|
Change in benefit obligation
|
|||||||||||||||||||||||
|
Benefit obligation at beginning of year
|
$
|
101
|
|
$
|
99
|
|
$
|
81
|
|
$
|
62
|
|
$
|
64
|
|
$
|
44
|
|
|||||
|
Service cost
|
—
|
|
—
|
|
5
|
|
5
|
|
2
|
|
1
|
|
|||||||||||
|
Interest cost
|
4
|
|
4
|
|
3
|
|
3
|
|
2
|
|
2
|
|
|||||||||||
|
Plan participants’ contributions
|
—
|
|
—
|
|
—
|
|
—
|
|
1
|
|
1
|
|
|||||||||||
|
Actuarial (gain)/loss
|
(9
|
)
|
5
|
|
(2
|
)
|
13
|
|
7
|
|
25
|
|
|||||||||||
|
Benefits paid
|
(10
|
)
|
(7
|
)
|
(2
|
)
|
(2
|
)
|
(5
|
)
|
(9
|
)
|
|||||||||||
|
Benefit obligation at end of year
|
86
|
|
101
|
|
85
|
|
81
|
|
71
|
|
64
|
|
|||||||||||
|
Change in plan assets
|
|||||||||||||||||||||||
|
Fair value of plan assets at beginning of year
|
86
|
|
74
|
|
—
|
|
—
|
|
—
|
|
—
|
|
|||||||||||
|
Actual return on plan assets
|
3
|
|
13
|
|
—
|
|
—
|
|
—
|
|
—
|
|
|||||||||||
|
Employer contributions
|
6
|
|
6
|
|
2
|
|
2
|
|
4
|
|
8
|
|
|||||||||||
|
Plan participants’ contributions
|
—
|
|
—
|
|
—
|
|
—
|
|
1
|
|
1
|
|
|||||||||||
|
Benefits paid
|
(10
|
)
|
(7
|
)
|
(2
|
)
|
(2
|
)
|
(5
|
)
|
(9
|
)
|
|||||||||||
|
Fair value of plan assets at end of year
|
85
|
|
86
|
|
—
|
|
—
|
|
—
|
|
—
|
|
|||||||||||
|
Funded status
|
$
|
(1
|
)
|
$
|
(15
|
)
|
$
|
(85
|
)
|
$
|
(81
|
)
|
$
|
(71
|
)
|
$
|
(64
|
)
|
|||||
63
Amounts recognized in the Consolidated Balance Sheets consist of:
|
in millions
|
|||||||||||||||||||||||
|
Pension Benefits
|
Other Postretirement
|
||||||||||||||||||||||
|
Qualified
|
Non-Qualified
|
Benefits
|
|||||||||||||||||||||
|
2013
|
|
2012
|
|
2013
|
|
2012
|
|
2013
|
|
2012
|
|
||||||||||||
|
Accrued benefit liability
|
$
|
(1
|
)
|
$
|
(15
|
)
|
$
|
(85
|
)
|
$
|
(81
|
)
|
$
|
(71
|
)
|
$
|
(64
|
)
|
|||||
|
Accumulated other comprehensive (income)/loss:
|
|||||||||||||||||||||||
|
Unrecognized actuarial loss
|
30
|
|
39
|
|
23
|
|
29
|
|
—
|
|
—
|
|
|||||||||||
|
Unrecognized prior service (cost)/credit
|
—
|
|
—
|
|
—
|
|
1
|
|
(3
|
)
|
(4
|
)
|
|||||||||||
|
Net amount recognized
|
$
|
29
|
|
$
|
24
|
|
$
|
(62
|
)
|
$
|
(51
|
)
|
$
|
(74
|
)
|
$
|
(68
|
)
|
|||||
At
September 28, 2013
,
three
pension plans had an accumulated benefit obligation in excess of plan assets. At
September 29, 2012
, all pension plans had an accumulated benefit obligation in excess of plan assets. Plans with accumulated benefit obligations in excess of plan assets are as follows:
|
in millions
|
|||||||||||||||
|
Pension Benefits
|
|||||||||||||||
|
Qualified
|
Non-Qualified
|
||||||||||||||
|
2013
|
|
2012
|
|
2013
|
|
2012
|
|
||||||||
|
Projected benefit obligation
|
$
|
27
|
|
$
|
101
|
|
$
|
85
|
|
$
|
81
|
|
|||
|
Accumulated benefit obligation
|
27
|
|
101
|
|
72
|
|
69
|
|
|||||||
|
Fair value of plan assets
|
26
|
|
86
|
|
—
|
|
—
|
|
|||||||
The accumulated benefit obligation for all qualified pension plans was
$86 million
and
$101 million
at
September 28, 2013
, and
September 29, 2012
, respectively.
Net Periodic Benefit Cost
Components of net periodic benefit cost for pension and postretirement benefit plans recognized in the Consolidated Statements of Income are as follows:
|
in millions
|
|||||||||||||||||||||||||||||||||||
|
Pension Benefits
|
Other Postretirement
|
||||||||||||||||||||||||||||||||||
|
Qualified
|
Non-Qualified
|
Benefits
|
|||||||||||||||||||||||||||||||||
|
2013
|
|
2012
|
|
2011
|
|
2013
|
|
2012
|
|
2011
|
|
2013
|
|
2012
|
|
2011
|
|
||||||||||||||||||
|
Service cost
|
$
|
—
|
|
$
|
—
|
|
$
|
—
|
|
$
|
5
|
|
$
|
5
|
|
$
|
3
|
|
$
|
2
|
|
$
|
1
|
|
$
|
—
|
|
||||||||
|
Interest cost
|
4
|
|
4
|
|
5
|
|
3
|
|
3
|
|
2
|
|
2
|
|
2
|
|
2
|
|
|||||||||||||||||
|
Expected return on plan assets
|
(5
|
)
|
(6
|
)
|
(6
|
)
|
—
|
|
—
|
|
—
|
|
—
|
|
—
|
|
—
|
|
|||||||||||||||||
|
Amortization of prior service cost
|
—
|
|
—
|
|
—
|
|
1
|
|
1
|
|
1
|
|
(1
|
)
|
(1
|
)
|
(1
|
)
|
|||||||||||||||||
|
Recognized actuarial loss, net
|
4
|
|
3
|
|
3
|
|
3
|
|
1
|
|
—
|
|
7
|
|
24
|
|
1
|
|
|||||||||||||||||
|
Net periodic benefit cost
|
$
|
3
|
|
$
|
1
|
|
$
|
2
|
|
$
|
12
|
|
$
|
10
|
|
$
|
6
|
|
$
|
10
|
|
$
|
26
|
|
$
|
2
|
|
||||||||
As of
September 28, 2013
, the amounts expected to be reclassified into earnings within the next 12 months related to net periodic benefit cost for the qualified and non-qualified pensions are
$2 million
and
$2 million
, respectively.
64
Assumptions
Weighted average assumptions are as follows:
|
Pension Benefits
|
Other Postretirement
|
|||||||||||||||||||||||||
|
Qualified
|
Non-Qualified
|
Benefits
|
||||||||||||||||||||||||
|
2013
|
|
2012
|
|
2011
|
|
2013
|
|
2012
|
|
2011
|
|
2013
|
|
2012
|
|
2011
|
|
|||||||||
|
Discount rate to determine net periodic benefit cost
|
4.02
|
%
|
4.53
|
%
|
5.06
|
%
|
4.23
|
%
|
4.75
|
%
|
5.50
|
%
|
3.66
|
%
|
4.09
|
%
|
4.50
|
%
|
||||||||
|
Discount rate to determine benefit obligations
|
4.77
|
%
|
4.02
|
%
|
4.53
|
%
|
5.09
|
%
|
4.23
|
%
|
4.75
|
%
|
4.48
|
%
|
3.66
|
%
|
4.09
|
%
|
||||||||
|
Rate of compensation increase
|
N/A
|
|
N/A
|
|
N/A
|
|
3.50
|
%
|
3.50
|
%
|
3.50
|
%
|
N/A
|
|
N/A
|
|
N/A
|
|
||||||||
|
Expected return on plan assets
|
5.44
|
%
|
6.37
|
%
|
7.79
|
%
|
N/A
|
|
N/A
|
|
N/A
|
|
N/A
|
|
N/A
|
|
N/A
|
|
||||||||
To determine the expected return on plan assets assumption, we first examined historical rates of return for the various asset classes. We then determined a long-term projected rate-of-return based on expected returns over the next
five
to
10
years.
Our discount rate assumptions used to account for pension and other postretirement benefit plans reflect the rates at which the benefit obligations could be effectively settled. These were determined using a cash flow matching technique whereby the rates of a yield curve, developed from high-quality debt securities, were applied to the benefit obligations to determine the appropriate discount rate.
We have
three
other postretirement benefit plans which are all healthcare related.
Two
of these plans, which benefit obligations totaled
$23 million
at
September 28, 2013
, were not impacted by healthcare cost trend rates as they consist of fixed annual payments. The remaining plan, which benefit obligation was
$48 million
at
September 28, 2013
, covers retirees who do not yet qualify for Medicare and utilized an assumed healthcare cost trend rate of
7.6%
. A one-percentage point increase in assumed healthcare cost trend rate would have a
$9 million
impact on the postretirement benefit obligation. A one-percentage point decrease in assumed healthcare cost trend rate would have a
$5 million
impact on the postretirement benefit obligation.
Plan Assets
The fair value of plan assets for domestic pension benefit plans was
$71 million
and
$69 million
as of
September 28, 2013
, and
September 29, 2012
, respectively. The following table sets forth the actual and target asset allocation for pension plan assets:
|
2013
|
|
2012
|
|
Target Asset
Allocation
|
|
|||
|
Cash
|
1.6
|
%
|
1.6
|
%
|
—
|
%
|
||
|
Fixed Income Securities
|
79.1
|
|
46.0
|
|
83.0
|
|
||
|
U.S. Stock Funds
|
4.3
|
|
23.5
|
|
5.1
|
|
||
|
International Stock Funds
|
7.3
|
|
23.5
|
|
5.1
|
|
||
|
Real Estate
|
3.8
|
|
5.0
|
|
3.4
|
|
||
|
Alternatives
|
3.9
|
|
0.4
|
|
3.4
|
|
||
|
Total
|
100.0
|
%
|
100.0
|
%
|
100.0
|
%
|
||
A foreign subsidiary pension plan had
$14 million
and
$17 million
in plan assets at
September 28, 2013
, and
September 29, 2012
, respectively. All of this plan’s assets are held in an insurance contract consistent with its target asset allocation.
The plan trustees have established a set of investment objectives related to the assets of the domestic pension plans and regularly monitor the performance of the funds and portfolio managers. Objectives for the pension assets are (i) to provide growth of capital and income, (ii) to achieve a target weighted average annual rate of return competitive with other funds with similar investment objectives and (iii) to diversify to reduce risk. The investment objectives and target asset allocation were amended for fiscal 2013. Alternative investments may include, but are not limited to, hedge funds, private equity funds and fixed income funds.
65
The following table shows the categories of pension plan assets and the level under which fair values were determined in the fair value hierarchy, which is described in Note 13: Fair Value Measurements.
|
in millions
|
|||||||||||||||
|
September 28, 2013
|
|||||||||||||||
|
Level 1
|
|
Level 2 (a)
|
|
Level 3 (b)
|
|
Total
|
|
||||||||
|
Cash and cash equivalents
|
$
|
1
|
|
$
|
—
|
|
$
|
—
|
|
$
|
1
|
|
|||
|
Fixed Income Securities Bond Fund
|
—
|
|
56
|
|
—
|
|
56
|
|
|||||||
|
Equity Securities:
|
|||||||||||||||
|
U.S. stock funds
|
—
|
|
3
|
|
—
|
|
3
|
|
|||||||
|
International stock funds
|
—
|
|
5
|
|
—
|
|
5
|
|
|||||||
|
Global real estate funds
|
—
|
|
3
|
|
—
|
|
3
|
|
|||||||
|
Total equity securities
|
—
|
|
11
|
|
—
|
|
11
|
|
|||||||
|
Alternative Funds
|
—
|
|
—
|
|
3
|
|
3
|
|
|||||||
|
Insurance Contract
|
—
|
|
—
|
|
14
|
|
14
|
|
|||||||
|
Total plan assets
|
$
|
1
|
|
$
|
67
|
|
$
|
17
|
|
$
|
85
|
|
|||
|
(a)
|
Valued using the net asset value (NAV) provided by the trustee, which is a practical expedient to estimating fair value. The NAV is based on the fair value of the underlying investments within the funds and is determined daily.
|
|
(b)
|
Valued using the plan’s own assumptions about the assumptions market participants would use in pricing the assets based on the best information available, such as investment manager pricing.
|
A reconciliation of the change in the fair value measurement of the defined benefit plans’ consolidated assets using significant unobservable inputs (Level 3) is as follows:
|
in millions
|
|||||||||||
|
Alternative funds
|
|
Insurance contract
|
|
Total
|
|
||||||
|
Balance at September 29, 2012
|
$
|
—
|
|
$
|
17
|
|
$
|
17
|
|
||
|
Actual return on plan assets:
|
|||||||||||
|
Assets still held at reporting date
|
—
|
|
1
|
|
1
|
|
|||||
|
Assets sold during the period
|
—
|
|
—
|
|
—
|
|
|||||
|
Purchases, sales and settlements, net
|
3
|
|
(4
|
)
|
(1
|
)
|
|||||
|
Transfers in and/or out of Level 3
|
—
|
|
—
|
|
—
|
|
|||||
|
Balance at September 28, 2013
|
$
|
3
|
|
$
|
14
|
|
$
|
17
|
|
||
We believe there are no significant concentrations of risk within our plan assets as of
September 28, 2013
.
Contributions
Our policy is to fund at least the minimum contribution required to meet applicable federal employee benefit and local tax laws. In our sole discretion, we may from time to time fund additional amounts. Expected contributions to pension plans for fiscal 2014 are approximately
$8 million
. For fiscal
2013
,
2012
and
2011
, we funded
$8 million
,
$8 million
and
$7 million
, respectively, to pension plans.
66
Estimated Future Benefit Payments
The following benefit payments are expected to be paid:
|
in millions
|
|
||||||||||
|
Pension Benefits
|
Other Postretirement
|
|
|||||||||
|
Qualified
|
|
Non-Qualified
|
|
Benefits
|
|
||||||
|
2014
|
$
|
6
|
|
$
|
2
|
|
$
|
6
|
|
||
|
2015
|
7
|
|
3
|
|
6
|
|
|||||
|
2016
|
5
|
|
3
|
|
6
|
|
|||||
|
2017
|
5
|
|
3
|
|
5
|
|
|||||
|
2018
|
6
|
|
4
|
|
5
|
|
|||||
|
2019-2023
|
27
|
|
27
|
|
29
|
|
|||||
The above benefit payments for other postretirement benefit plans are not expected to be offset by Medicare Part D subsidies in 2013 or thereafter.
The components of accumulated other comprehensive loss are as follows:
|
in millions
|
|
||||||
|
|
2013
|
|
2012
|
|
|||
|
Accumulated other comprehensive income (loss), net of taxes:
|
|||||||
|
Unrealized net hedging gain (loss)
|
$
|
(4
|
)
|
$
|
10
|
|
|
|
Unrealized net gain (loss) on investments
|
(2
|
)
|
1
|
|
|||
|
Currency translation adjustment
|
(69
|
)
|
(32
|
)
|
|||
|
Postretirement benefits reserve adjustments
|
(33
|
)
|
(42
|
)
|
|||
|
Total accumulated other comprehensive loss
|
$
|
(108
|
)
|
$
|
(63
|
)
|
|
The before and after tax changes in the components of other comprehensive income (loss) are as follows:
|
in millions
|
||||||||||||||||||||||||||||||
|
2013
|
2012
|
2011
|
||||||||||||||||||||||||||||
|
Before Tax
|
Tax
|
After Tax
|
Before Tax
|
Tax
|
After Tax
|
Before Tax
|
Tax
|
After Tax
|
||||||||||||||||||||||
|
Derivatives accounted for as cash flow hedges:
|
||||||||||||||||||||||||||||||
|
(Gain) loss reclassified to Cost of Sales
|
$
|
5
|
|
$
|
(2
|
)
|
$
|
3
|
|
$
|
16
|
|
$
|
(7
|
)
|
$
|
9
|
|
$
|
(25
|
)
|
$
|
10
|
|
$
|
(15
|
)
|
|||
|
(Gain) loss reclassified to Other Income/Expense
|
4
|
|
(2
|
)
|
2
|
|
(4
|
)
|
2
|
|
(2
|
)
|
—
|
|
—
|
|
—
|
|
||||||||||||
|
Unrealized gain (loss)
|
(31
|
)
|
12
|
|
(19
|
)
|
16
|
|
(6
|
)
|
10
|
|
4
|
|
(6
|
)
|
(2
|
)
|
||||||||||||
|
Investments:
|
||||||||||||||||||||||||||||||
|
Gain reclassified to Other Income/Expense
|
(1
|
)
|
—
|
|
(1
|
)
|
—
|
|
—
|
|
—
|
|
—
|
|
—
|
|
—
|
|
||||||||||||
|
Unrealized gain (loss)
|
(4
|
)
|
2
|
|
(2
|
)
|
—
|
|
—
|
|
—
|
|
(12
|
)
|
4
|
|
(8
|
)
|
||||||||||||
|
Currency translation:
|
||||||||||||||||||||||||||||||
|
Translation gain reclassified to Other Income/Expense
|
(19
|
)
|
(1
|
)
|
(20
|
)
|
—
|
|
—
|
|
—
|
|
—
|
|
—
|
|
—
|
|
||||||||||||
|
Translation adjustment
|
(20
|
)
|
3
|
|
(17
|
)
|
2
|
|
1
|
|
3
|
|
(42
|
)
|
1
|
|
(41
|
)
|
||||||||||||
|
Postretirement benefits (Note 15)
|
15
|
|
(6
|
)
|
9
|
|
(6
|
)
|
2
|
|
(4
|
)
|
(21
|
)
|
8
|
|
(13
|
)
|
||||||||||||
|
Total Other Comprehensive Income (Loss)
|
$
|
(51
|
)
|
$
|
6
|
|
$
|
(45
|
)
|
$
|
24
|
|
$
|
(8
|
)
|
$
|
16
|
|
$
|
(96
|
)
|
$
|
17
|
|
$
|
(79
|
)
|
|||
67
We operate in
four
segments: Chicken, Beef, Pork and Prepared Foods. We measure segment profit as operating income (loss).
Chicken:
Chicken operations include breeding and raising chickens, as well as processing live chickens into fresh, frozen and value-added chicken products and logistics operations to move products through the supply chain. Products are marketed domestically to food retailers, foodservice distributors, restaurant operators, hotel chains and noncommercial foodservice establishments such as schools, healthcare facilities, the military and other food processors, as well as to international markets. It also includes sales from allied products and our chicken breeding stock subsidiary.
Beef:
Beef operations include processing live fed cattle and fabricating dressed beef carcasses into primal and sub-primal meat cuts and case-ready products. This segment also includes sales from allied products such as hides and variety meats, as well as logistics operations to move products through the supply chain. Products are marketed domestically to food retailers, foodservice distributors, restaurant operators, hotel chains and noncommercial foodservice establishments such as schools, healthcare facilities, the military and other food processors, as well as to international markets.
Pork:
Pork operations include processing live market hogs and fabricating pork carcasses into primal and sub-primal cuts and case-ready products. This segment also includes our live swine group, related allied product processing activities and logistics operations to move products through the supply chain. Products are marketed domestically to food retailers, foodservice distributors, restaurant operators, hotel chains and noncommercial foodservice establishments such as schools, healthcare facilities, the military and other food processors, as well as to international markets.
Prepared Foods:
Prepared Foods operations include manufacturing and marketing frozen and refrigerated food products and logistics operations to move products through the supply chain. Products include pepperoni, bacon, beef and pork pizza toppings, pizza crusts, flour and corn tortilla products, appetizers, prepared meals, ethnic foods, soups, sauces, side dishes, meat dishes and processed meats. Products are marketed domestically to food retailers, foodservice distributors, restaurant operators, hotel chains and noncommercial foodservice establishments such as schools, healthcare facilities, the military and other food processors, as well as to international markets.
The results from Dynamic Fuels are included in Other.
68
|
in millions
|
|||||||||||||||||||||||||||
|
Chicken
|
|
Beef
|
|
Pork
|
|
Prepared
Foods
|
|
Other
|
|
Intersegment
Sales
|
|
Consolidated
|
|
||||||||||||||
|
Fiscal year ended September 28, 2013
|
|||||||||||||||||||||||||||
|
Sales
|
$
|
12,296
|
|
$
|
14,400
|
|
$
|
5,408
|
|
$
|
3,322
|
|
$
|
46
|
|
$
|
(1,098
|
)
|
$
|
34,374
|
|
||||||
|
Operating Income
|
646
|
|
296
|
|
332
|
|
101
|
|
—
|
|
1,375
|
|
|||||||||||||||
|
Total Other (Income) Expense
|
118
|
|
|||||||||||||||||||||||||
|
Income from Continuing Operations before Income Taxes
|
1,257
|
|
|||||||||||||||||||||||||
|
Depreciation
|
291
|
|
87
|
|
30
|
|
61
|
|
5
|
|
474
|
|
|||||||||||||||
|
Total Assets
|
5,820
|
|
2,798
|
|
931
|
|
1,176
|
|
1,452
|
|
12,177
|
|
|||||||||||||||
|
Additions to property, plant and equipment
|
311
|
|
105
|
|
22
|
|
87
|
|
33
|
|
558
|
|
|||||||||||||||
|
Fiscal year ended September 29, 2012
|
|||||||||||||||||||||||||||
|
Sales
|
$
|
11,368
|
|
$
|
13,755
|
|
$
|
5,510
|
|
$
|
3,237
|
|
$
|
167
|
|
$
|
(982
|
)
|
$
|
33,055
|
|
||||||
|
Operating Income (Loss)
|
484
|
|
218
|
|
417
|
|
181
|
|
(14
|
)
|
1,286
|
|
|||||||||||||||
|
Total Other (Income) Expense
|
321
|
|
|||||||||||||||||||||||||
|
Income from Continuing Operations before Income Taxes
|
965
|
|
|||||||||||||||||||||||||
|
Depreciation
|
268
|
|
86
|
|
30
|
|
54
|
|
5
|
|
443
|
|
|||||||||||||||
|
Total Assets
|
5,902
|
|
2,634
|
|
895
|
|
960
|
|
1,505
|
|
11,896
|
|
|||||||||||||||
|
Additions to property, plant and equipment
|
451
|
|
100
|
|
32
|
|
99
|
|
8
|
|
690
|
|
|||||||||||||||
|
Fiscal year ended October 1, 2011
|
|||||||||||||||||||||||||||
|
Sales
|
$
|
10,783
|
|
$
|
13,549
|
|
$
|
5,460
|
|
$
|
3,215
|
|
$
|
127
|
|
$
|
(1,102
|
)
|
$
|
32,032
|
|
||||||
|
Operating Income (Loss)
|
168
|
|
468
|
|
560
|
|
117
|
|
(24
|
)
|
1,289
|
|
|||||||||||||||
|
Total Other (Income) Expense
|
211
|
|
|||||||||||||||||||||||||
|
Income from Continuing Operations before Income Taxes
|
1,078
|
|
|||||||||||||||||||||||||
|
Depreciation
|
259
|
|
84
|
|
28
|
|
58
|
|
4
|
|
433
|
|
|||||||||||||||
|
Total Assets
|
5,412
|
|
2,610
|
|
960
|
|
943
|
|
1,146
|
|
11,071
|
|
|||||||||||||||
|
Additions to property, plant and equipment
|
464
|
|
88
|
|
27
|
|
58
|
|
6
|
|
643
|
|
|||||||||||||||
We allocate expenses related to corporate activities to the segments, while the related assets and additions to property, plant and equipment remain in Other.
The Pork segment had sales of
$872 million
,
$771 million
and
$816 million
for fiscal
2013
,
2012
and
2011
, respectively, from transactions with other operating segments. The Beef segment had sales of
$226 million
,
$211 million
and
$286 million
for fiscal
2013
,
2012
and
2011
, respectively, from transactions with other operating segments.
Our largest customer, Wal-Mart Stores, Inc., accounted for
13.0%
,
13.8%
and
13.3%
of consolidated sales in fiscal
2013
,
2012
and
2011
, respectively. Sales to Wal-Mart Stores, Inc. were included in the Chicken, Beef, Pork and Prepared Foods segments. Any extended discontinuance of sales to this customer could, if not replaced, have a material impact on our operations.
The majority of our operations are domiciled in the United States. Approximately
96%
,
95%
and
96%
of sales to external customers for fiscal
2013
,
2012
and
2011
, respectively, were sourced from the United States. Approximately
$6.1 billion
and
$5.9 billion
of long-lived assets were located in the United States at
September 28, 2013
, and
September 29, 2012
, respectively. Approximately
$485 million
and
$564 million
of long-lived assets were located in foreign countries, primarily Brazil, China, Mexico and India, at
September 28, 2013
, and
September 29, 2012
, respectively.
We sell certain products in foreign markets, primarily Brazil, Canada, Central America, China, the European Union, Japan, Mexico, the Middle East, South Korea, Taiwan, and Vietnam. Our export sales from the United States totaled
$4.2 billion
,
$4.0 billion
and
$4.1 billion
for fiscal
2013
,
2012
and
2011
, respectively. Substantially all of our export sales are facilitated through unaffiliated brokers, marketing associations and foreign sales staffs. Sales of products produced in a country other than the United States were less than
10%
of consolidated sales for each of fiscal
2013
,
2012
and
2011
.
69
The following table summarizes cash payments for interest and income taxes:
|
in millions
|
|
||||||||||
|
2013
|
|
2012
|
|
2011
|
|
||||||
|
Interest, net of amounts capitalized
|
$
|
114
|
|
$
|
274
|
|
$
|
174
|
|
||
|
Income taxes, net of refunds
|
310
|
|
187
|
|
311
|
|
|||||
We have operating leases for
two
wastewater facilities with an entity owned by the Donald J. Tyson Revocable Trust (for which Mr. John Tyson, Chairman of the Company, is a trustee), Berry Street Waste Water Treatment Plant, LP (
90%
of which is owned by Tyson Limited Partnership (“TLP”)), and the sisters of Mr. Tyson. Total payments of approximately
$1 million
in each of fiscal
2013
,
2012
and
2011
were paid to such entity.
In fiscal
2012
and
2011
, we had an aircraft lease agreement with Tyson Family Aviation, LLC, of which Mr. Don Tyson (then our Senior Chairman), Mr. John Tyson and the Randal W. Tyson Testamentary Trust were members. Upon Mr. Don Tyson’s death on January 6, 2011, his membership interest passed to a trust in which Mr. John Tyson is a trustee. During fiscal 2012, Tyson Family Aviation, LLC sold the aircraft to a non-related party and we entered into an aircraft lease agreement with the new owner. Total payments to Tyson Family Aviation, LLC of approximately
$0.4 million
and
$1 million
were paid in fiscal
2012
and
2011
, respectively.
As part of the Company's previously approved stock repurchase plan, on September 11, 2013, we purchased
one million
shares of Class A common stock from the Tyson Limited Partnership for
$29.85 million
or
$29.85
per share. The Tyson Limited Partnership, of which John Tyson and director Barbara Tyson are general partners, owns
70 million
shares, or
99.981%
of Class B Common Stock and
2 million
shares of Class A common stock, giving it control of approximately
72.46%
of the total voting power of our outstanding voting stock.
Commitments
We lease equipment, properties and certain farms for which total rentals approximated
$200 million
,
$193 million
and
$183 million
, in fiscal
2013
,
2012
and
2011
, respectively. Most leases have initial terms of up to
seven
years, some with varying renewal periods. The most significant obligations assumed under the terms of the leases are the upkeep of the facilities and payments of insurance and property taxes.
Minimum lease commitments under non-cancelable leases at
September 28, 2013
, were:
|
in millions
|
|
||
|
2014
|
$
|
97
|
|
|
2015
|
69
|
|
|
|
2016
|
46
|
|
|
|
2017
|
27
|
|
|
|
2018
|
16
|
|
|
|
2019 and beyond
|
78
|
|
|
|
Total
|
$
|
333
|
|
We guarantee obligations of certain outside third parties, which consists of a lease and grower loans, all of which are substantially collateralized by the underlying assets. Terms of the underlying debt cover periods up to
ten
years, and the maximum potential amount of future payments as of
September 28, 2013
, was
$64 million
. We also maintain operating leases for various types of equipment, some of which contain residual value guarantees for the market value of the underlying leased assets at the end of the term of the lease. The remaining terms of the lease maturities cover periods over the next
seven
years. The maximum potential amount of the residual value guarantees is
$58 million
, of which
$52 million
would be recoverable through various recourse provisions and an additional undeterminable recoverable amount based on the fair value of the underlying leased assets. The likelihood of material payments under these guarantees is not considered probable. At
September 28, 2013
, and
September 29, 2012
, no material liabilities for guarantees were recorded.
70
We have cash flow assistance programs in which certain livestock suppliers participate. Under these programs, we pay an amount for livestock equivalent to a standard cost to grow such livestock during periods of low market sales prices. The amounts of such payments that are in excess of the market sales price are recorded as receivables and accrue interest. Participating suppliers are obligated to repay these receivables balances when market sales prices exceed this standard cost, or upon termination of the agreement. Our maximum obligation associated with these programs is limited to the fair value of each participating livestock supplier’s net tangible assets. The potential maximum obligation as of
September 28, 2013
, was approximately
$340 million
. The total receivables under these programs were
$44 million
and
$25 million
at
September 28, 2013
, and
September 29, 2012
, respectively, and are included, net of allowance for uncollectible amounts, in Accounts Receivable in our Consolidated Balance Sheets. Even though these programs are limited to the net tangible assets of the participating livestock suppliers, we also manage a portion of our credit risk associated with these programs by obtaining security interests in livestock suppliers’ assets. After analyzing residual credit risks and general market conditions, we have recorded an allowance for these programs’ estimated uncollectible receivables of
$15 million
and
$10 million
at
September 28, 2013
, and
September 29, 2012
, respectively.
Additionally, we enter into future purchase commitments for various items, such as grains, livestock contracts and fixed grower fees. At
September 28, 2013
, these commitments totaled:
|
in millions
|
|
||
|
2014
|
$
|
1,482
|
|
|
2015
|
54
|
|
|
|
2016
|
48
|
|
|
|
2017
|
33
|
|
|
|
2018
|
24
|
|
|
|
2019 and beyond
|
74
|
|
|
|
Total
|
$
|
1,715
|
|
Contingencies
We are involved in various claims and legal proceedings. We routinely assess the likelihood of adverse judgments or outcomes to those matters, as well as ranges of probable losses, to the extent losses are reasonably estimable. We record accruals for such matters to the extent that we conclude a loss is probable and the financial impact, should an adverse outcome occur, is reasonably estimable. Such accruals are reflected in the Company’s Consolidated Financial Statements. In our opinion, we have made appropriate and adequate accruals for these matters and believe the probability of a material loss beyond the amounts accrued to be remote; however, the ultimate liability for these matters is uncertain, and if accruals are not adequate, an adverse outcome could have a material effect on the consolidated financial condition or results of operations. Listed below are certain claims made against the Company and/or our subsidiaries for which the potential exposure is considered material to the Company’s Consolidated Financial Statements. We believe we have substantial defenses to the claims made and intend to vigorously defend these matters.
We have pending against us a lawsuit styled DeAsencio v. Tyson Foods, Inc. (E.D. Pennsylvania, August 22, 2000) in which the plaintiffs allege that we failed to compensate certain poultry plant employees for the time it takes to engage in pre- and post-shift activities such as changing into and out of protective and sanitary clothing and walking to and from the changing area, work areas and break areas in violation of the Fair Labor Standards Act (FLSA). They seek back wages, liquidated damages, pre- and post-judgment interest, and attorneys’ fees. Plaintiffs appealed a jury verdict and final judgment entered in our favor on June 22, 2006. On September 7, 2007, the U.S. Court of Appeals for the Third Circuit reversed the jury verdict and remanded the case to the District Court for further proceedings. We sought rehearing en banc, which was denied by the Court of Appeals on October 5, 2007. The United States Supreme Court denied our petition for a writ of certiorari on June 9, 2008. On October 4, 2013, the District Court ordered the parties to provide a status report within ten days or the case would be dismissed without prejudice. Neither party made such a filing, so the case was dismissed without prejudice.
71
We have pending
eleven
separate wage and hour actions involving Tyson Fresh Meats Inc.’s plants located in Garden City, Kansas (Garcia, et al. v. Tyson Foods, Inc., Tyson Fresh Meats, Inc., D. Kansas, May 15, 2006); Storm Lake, Iowa (Bouaphakeo (f/k/a Sharp), et al. v. Tyson Foods, Inc., N.D. Iowa, February 6, 2007); Columbus Junction, Iowa (Guyton (f/k/a Robinson), et al. v. Tyson Foods, Inc., d.b.a Tyson Fresh Meats, Inc., S.D. Iowa, September 12, 2007); Madison, Nebraska (Acosta, et al. v Tyson Foods, Inc. d.b.a Tyson Fresh Meats, Inc., D. Nebraska, February 29, 2008); Dakota City, Nebraska (Gomez, et al. v. Tyson Foods, Inc., D. Nebraska, January 16, 2008); Perry and Waterloo, Iowa (Edwards, et al. v. Tyson Foods, Inc. d.b.a Tyson Fresh Meats, Inc., S.D. Iowa, March 20, 2008); Logansport, Indiana (Carter, et al. v. Tyson Foods, Inc. and Tyson Fresh Meats, Inc., N.D. Indiana, April 29, 2008); Goodlettsville, Tennessee (Abadeer v. Tyson Foods, Inc., and Tyson Fresh Meats, Inc., M.D. Tennessee, February 6, 2009); Emporia, Kansas (Abdiaziz, et al. v. Tyson Foods, Inc., Tyson Fresh Meats, Inc., D. Kansas, September 30, 2011); and Joslin, Illinois (Murray, et al. v. Tyson Foods, Inc., C.D. Illinois, January 2, 2008; and DeVoss v. Tyson Foods, Inc. d.b.a. Tyson Fresh Meats, C.D. Illinois, March 2, 2011). The actions allege we failed to pay employees for all hours worked, including overtime compensation for the time it takes to change into protective work uniforms, safety equipment and other sanitary and protective clothing worn by employees, and for walking to and from the changing area, work areas and break areas in violation of the FLSA and analogous state laws. The plaintiffs seek back wages, liquidated damages, pre- and post-judgment interest, attorneys’ fees and costs. Each case is proceeding in its jurisdiction.
|
•
|
After a trial in the Garcia case involving our Garden City, Kansas facility, a jury verdict in favor of the plaintiffs was entered on March 17, 2011. Exclusive of pre- and post-judgment interest, attorneys’ fees and costs, the jury found violations of federal and state laws for pre- and post-shift work activities and awarded damages in the amount of
$503,011
. Plaintiffs’ counsel filed an application for attorneys’ fees and expenses which we contested. On December 7, 2012, the court granted plaintiffs' counsel's application and awarded a total of
$3,609,723
. We filed an appeal with the Tenth Circuit Court of Appeals on December 27, 2012. Oral argument is scheduled for November 18, 2013.
|
|
•
|
A jury trial was held in the Bouaphakeo case, which involves our Storm Lake, Iowa pork plant, which resulted in a jury verdict in favor of the plaintiffs for violations of federal and state laws for pre- and post-shift work activities. The trial court also awarded the plaintiffs liquidated damages, resulting in total damages awarded in the amount of
$5,784,758
. We have appealed the jury's verdict and trial court's award. The plaintiffs' counsel has also filed an application for attorneys' fees and expenses in the amount of
$2,692,145
.
|
|
•
|
A jury trial was held in the Guyton case, which involves our Columbus Junction, Iowa pork plant, which resulted in a jury verdict in favor of Tyson on April 25, 2012. The plaintiffs have appealed to the Eighth Circuit Court of Appeals.
|
|
•
|
A bench trial was held in the Acosta case, which involves our Madison, Nebraska pork plant, in January 2013. In May 2013 the trial court awarded the plaintiffs
$5,733,943
for unpaid overtime wages. Subsequently, the court ordered the class of plaintiffs expanded, and the plaintiffs submitted an updated calculation of
$6,258,492
for unpaid overtime wages as reflected by payroll data through the date of its order expanding the class. A judgment has not yet been entered.
|
|
•
|
A jury trial in the Gomez case, which involves our Dakota City, Nebraska beef plant, was held, and the jury found in favor of the plaintiffs on April 3, 2013. On October 2, 2013, the trial court denied the parties’ post-trial motions and entered judgment awarding unpaid overtime wages, liquidated damages, and penalties totaling
$4,960,787
. We filed a notice of appeal on November 12, 2013.
|
|
•
|
The trial court in the Edwards case, which involves the Perry and Waterloo, Iowa facilities, decertified the state law class and granted other pre-trial motions that resulted in judgment in our favor with respect to the plaintiffs’ claims.
|
|
•
|
The parties in the Carter case, which involves our Logansport, Indiana pork plant, agreed to settle all claims for
$950,000
. The parties filed a joint motion for approval of the settlement, but the plaintiffs subsequently filed a motion to certify a class of plaintiffs while the joint motion for approval of the settlement was pending. On October 30, 2013 we filed a motion with the court to enforce the settlement.
|
|
•
|
The trial court in the Abadeer case, which involves the Goodlettsville, Tennessee plant, granted the plaintiffs’ motion for summary judgment in part, finding that certain pre- and post-shift activities were compensable and our non-payment for those activities was willful and not in good faith. The trial for the remaining issues, including damages, is scheduled to begin April 15, 2014.
|
We have pending
one
wage and hour action involving our Tyson Prepared Foods plant located in Jefferson, Wisconsin (Weissman, et al. v. Tyson Prepared Foods, Inc., Jefferson County (Wisconsin) Circuit Court, October 20, 2010). The plaintiffs allege that employees should be paid for the time it takes to engage in pre- and post-shift activities such as changing into and out of protective and sanitary clothing and the associated time it takes to walk to and from their workstations post-donning and pre-doffing of protective and sanitary clothing.
Six
named plaintiffs seek to act as state law class representatives on behalf of all current and former employees who were allegedly not paid for time worked and seek back wages, liquidated damages, pre- and post-judgment interest, and attorneys’ fees and costs. On May 16, 2011, the plaintiffs filed a motion to certify a state law class of all hourly employees who have worked at the Jefferson plant from October 20, 2008, to the present. We filed motions for summary judgment seeking dismissal of the claims, or, in the alternative, to limit the claims made for non-compensable clothes changing activities. The court granted summary judgment in favor of Tyson on August 31, 2012, and the plaintiffs filed a notice of appeal on October 5, 2012. On August 1, 2013, the appeals court reversed and remanded the case to the trial court, concluding that the applicable activities at this plant are compensable, subject to certain defenses. We have petitioned the Wisconsin Supreme Court for further review.
72
On June 19, 2005, the Attorney General and the Secretary of the Environment of the State of Oklahoma filed a complaint in the U.S. District Court for the Northern District of Oklahoma against us,
three
of our subsidiaries and
six
other poultry integrators. The complaint, which was subsequently amended, asserts a number of state and federal causes of action including, but not limited to, counts under Comprehensive Environmental Response, Compensation, and Liability Act (CERCLA), Resource Conservation and Recovery Act (RCRA), and state-law public nuisance theories. The amended complaint asserts that defendants and certain contract growers who are not named in the amended complaint polluted the surface waters, groundwater and associated drinking water supplies of the Illinois River Watershed (IRW) through the land application of poultry litter. Oklahoma asserts that this alleged pollution has also caused extensive injury to the environment (including soils and sediments) of the IRW and that the defendants have been unjustly enriched. Oklahoma’s claims cover the entire IRW, which encompasses more than
one million
acres of land and the natural resources (including lakes and waterways) contained therein. Oklahoma seeks wide-ranging relief, including injunctive relief, compensatory damages in excess of
$800 million
, an unspecified amount in punitive damages and attorneys’ fees. We and the other defendants have denied liability, asserted various defenses, and filed a third-party complaint that asserts claims against other persons and entities whose activities may have contributed to the pollution alleged in the amended complaint. The district court has stayed proceedings on the third party complaint pending resolution of Oklahoma’s claims against the defendants. On October 31, 2008, the defendants filed a motion to dismiss for failure to join the Cherokee Nation as a required party or, in the alternative, for judgment as a matter of law based on the plaintiffs’ lack of standing. This motion was granted in part and denied in part on July 22, 2009. In its ruling, the district court dismissed Oklahoma’s claims for cost recovery and for natural resources damages under CERCLA and for unjust enrichment under Oklahoma common law. This ruling also narrowed the scope of Oklahoma’s remaining claims by dismissing all damage claims under its causes of action for Oklahoma common law nuisance, federal common law nuisance, and Oklahoma common law trespass, leaving only its claims for injunctive relief for trial. On August 18, 2009, the Court granted partial summary judgment in favor of the defendants on Oklahoma’s claims for violations of the Oklahoma Registered Poultry Feeding Operations Act. Oklahoma later voluntarily dismissed the remainder of this claim. On September 2, 2009, the Cherokee Nation filed a motion to intervene in the lawsuit. Its motion to intervene was denied on September 15, 2009, and the Cherokee Nation filed a notice of appeal of that ruling in the Tenth Circuit Court of Appeals on September 17, 2009. A non-jury trial of the case began on September 24, 2009. At the close of Oklahoma’s case-in-chief, the Court granted the defendants’ motions to dismiss claims based on RCRA, nuisance per se, and health risks related to bacteria. The defense rested its case on January 13, 2010, and closing arguments were held on February 11, 2010. On September 21, 2010, the Court of Appeals affirmed the district court’s denial of the Cherokee Nation’s motion to intervene. On October 6, 2010, the Cherokee Nation and the State of Oklahoma filed a petition for rehearing or
en banc
review seeking reconsideration of this ruling. The Court of Appeals denied this petition. The district court has not yet rendered its decision from the trial, which ended in February 2010.
73
|
in millions, except per share data
|
||||||||||||||||
|
First
Quarter
|
|
Second
Quarter
|
|
Third
Quarter
|
|
Fourth
Quarter
|
|
|||||||||
|
2013
|
||||||||||||||||
|
Sales
|
$
|
8,366
|
|
$
|
8,383
|
|
$
|
8,731
|
|
$
|
8,894
|
|
||||
|
Gross profit
|
539
|
|
468
|
|
682
|
|
669
|
|
||||||||
|
Operating income
|
304
|
|
236
|
|
419
|
|
416
|
|
||||||||
|
Net income
|
168
|
|
106
|
|
245
|
|
259
|
|
||||||||
|
Amounts attributable to Tyson:
|
||||||||||||||||
|
Net income from continuing operations
|
177
|
|
157
|
|
253
|
|
261
|
|
||||||||
|
Net loss from discontinued operation
|
(4
|
)
|
(62
|
)
|
(4
|
)
|
—
|
|
||||||||
|
Net income attributable to Tyson
|
173
|
|
95
|
|
249
|
|
261
|
|
||||||||
|
Net income per share from continuing operations attributable to Tyson:
|
||||||||||||||||
|
Class A Basic
|
$
|
0.51
|
|
$
|
0.45
|
|
$
|
0.73
|
|
$
|
0.77
|
|
||||
|
Class B Basic
|
$
|
0.46
|
|
$
|
0.40
|
|
$
|
0.66
|
|
$
|
0.70
|
|
||||
|
Diluted
|
$
|
0.49
|
|
$
|
0.43
|
|
$
|
0.69
|
|
$
|
0.70
|
|
||||
|
Net loss per share from discontinued operation attributable to Tyson:
|
||||||||||||||||
|
Class A Basic
|
$
|
(0.01
|
)
|
$
|
(0.18
|
)
|
$
|
(0.01
|
)
|
$
|
—
|
|
||||
|
Class B Basic
|
$
|
(0.01
|
)
|
$
|
(0.15
|
)
|
$
|
(0.02
|
)
|
$
|
—
|
|
||||
|
Diluted
|
$
|
(0.01
|
)
|
$
|
(0.17
|
)
|
$
|
(0.01
|
)
|
$
|
—
|
|
||||
|
Net income per share attributable to Tyson:
|
||||||||||||||||
|
Class A Basic
|
$
|
0.50
|
|
$
|
0.27
|
|
$
|
0.72
|
|
$
|
0.77
|
|
||||
|
Class B Basic
|
$
|
0.45
|
|
$
|
0.25
|
|
$
|
0.64
|
|
$
|
0.70
|
|
||||
|
Diluted
|
$
|
0.48
|
|
$
|
0.26
|
|
$
|
0.68
|
|
$
|
0.70
|
|
||||
|
2012
|
||||||||||||||||
|
Sales
|
$
|
8,258
|
|
$
|
8,221
|
|
$
|
8,261
|
|
$
|
8,315
|
|
||||
|
Gross profit
|
497
|
|
537
|
|
566
|
|
590
|
|
||||||||
|
Operating income
|
284
|
|
306
|
|
342
|
|
354
|
|
||||||||
|
Net income
|
156
|
|
166
|
|
73
|
|
181
|
|
||||||||
|
Amounts attributable to Tyson:
|
||||||||||||||||
|
Net income from continuing operations
|
162
|
|
170
|
|
82
|
|
207
|
|
||||||||
|
Net loss from discontinued operation
|
(6
|
)
|
(4
|
)
|
(6
|
)
|
(22
|
)
|
||||||||
|
Net income attributable to Tyson
|
156
|
|
166
|
|
76
|
|
185
|
|
||||||||
|
Net income per share from continuing operations attributable to Tyson:
|
||||||||||||||||
|
Class A Basic
|
$
|
0.45
|
|
$
|
0.48
|
|
$
|
0.23
|
|
$
|
0.59
|
|
||||
|
Class B Basic
|
$
|
0.41
|
|
$
|
0.43
|
|
$
|
0.20
|
|
$
|
0.53
|
|
||||
|
Diluted
|
$
|
0.43
|
|
$
|
0.46
|
|
$
|
0.22
|
|
$
|
0.57
|
|
||||
|
Net loss per share from discontinued operation attributable to Tyson:
|
||||||||||||||||
|
Class A Basic
|
$
|
(0.02
|
)
|
$
|
(0.01
|
)
|
$
|
(0.02
|
)
|
$
|
(0.06
|
)
|
||||
|
Class B Basic
|
$
|
(0.02
|
)
|
$
|
(0.01
|
)
|
$
|
(0.01
|
)
|
$
|
(0.05
|
)
|
||||
|
Diluted
|
$
|
(0.01
|
)
|
$
|
(0.02
|
)
|
$
|
(0.01
|
)
|
$
|
(0.06
|
)
|
||||
|
Net income per share attributable to Tyson:
|
||||||||||||||||
|
Class A Basic
|
$
|
0.43
|
|
$
|
0.47
|
|
$
|
0.21
|
|
$
|
0.53
|
|
||||
|
Class B Basic
|
$
|
0.39
|
|
$
|
0.42
|
|
$
|
0.19
|
|
$
|
0.48
|
|
||||
|
Diluted
|
$
|
0.42
|
|
$
|
0.44
|
|
$
|
0.21
|
|
$
|
0.51
|
|
||||
74
Second quarter fiscal 2013 net income included a
$19 million
currency translation adjustment gain recognized in conjunction with the receipt of proceeds constituting the final resolution of our investment in Canada and included a
$56 million
non-cash charge, reported as a discontinued operation, related to the impairment of Weifang.
Third quarter fiscal 2012 net income included a
$167 million
pretax charge related to the early extinguishment of debt. Fourth quarter fiscal 2012 net income included a
$15 million
non-cash charge related to the impairment of Weifang.
TFM Parent, our wholly-owned subsidiary, has fully and unconditionally guaranteed the 2016 Notes. Additionally, TFM Parent has fully and unconditionally guaranteed the 2022 Notes until such date TFM Parent has been released of its guarantee of both (i) Tyson's
$1.0 billion
revolving credit facility and (ii) the 2016 Notes, at which time TFM Parent's guarantee of the 2022 Notes is permanently released. The following financial information presents condensed consolidating financial statements, which include Tyson Foods, Inc. (TFI Parent); TFM Parent; the Non-Guarantor Subsidiaries (Non-Guarantors) on a combined basis; the elimination entries necessary to consolidate TFI Parent, TFM Parent and the Non-Guarantors; and Tyson Foods, Inc. on a consolidated basis, and is provided as an alternative to providing separate financial statements for the guarantor.
|
Condensed Consolidating Statement of Income and Comprehensive Income for the year ended September 28, 2013
|
in millions
|
||||||||||||||||||
|
TFI
Parent
|
|
TFM
Parent
|
|
Non-
Guarantors
|
|
Eliminations
|
|
Total
|
|
||||||||||
|
Sales
|
$
|
431
|
|
$
|
19,243
|
|
$
|
16,120
|
|
$
|
(1,420
|
)
|
$
|
34,374
|
|
||||
|
Cost of Sales
|
40
|
|
18,464
|
|
14,932
|
|
(1,420
|
)
|
32,016
|
|
|||||||||
|
Gross Profit
|
391
|
|
779
|
|
1,188
|
|
—
|
|
2,358
|
|
|||||||||
|
Selling, General and Administrative
|
68
|
|
201
|
|
714
|
|
—
|
|
983
|
|
|||||||||
|
Operating Income
|
323
|
|
578
|
|
474
|
|
—
|
|
1,375
|
|
|||||||||
|
Other (Income) Expense:
|
|
|
|
|
|
||||||||||||||
|
Interest expense, net
|
36
|
|
62
|
|
40
|
|
—
|
|
138
|
|
|||||||||
|
Other, net
|
4
|
|
(1
|
)
|
(23
|
)
|
—
|
|
(20
|
)
|
|||||||||
|
Equity in net earnings of subsidiaries
|
(582
|
)
|
(40
|
)
|
—
|
|
622
|
|
—
|
|
|||||||||
|
Total Other (Income) Expense
|
(542
|
)
|
21
|
|
17
|
|
622
|
|
118
|
|
|||||||||
|
Income from Continuing Operations before Income Taxes
|
865
|
|
557
|
|
457
|
|
(622
|
)
|
1,257
|
|
|||||||||
|
Income Tax Expense
|
87
|
|
172
|
|
150
|
|
—
|
|
409
|
|
|||||||||
|
Income from Continuing Operations
|
778
|
|
385
|
|
307
|
|
(622
|
)
|
848
|
|
|||||||||
|
Loss from Discontinued Operation, Net of Tax
|
—
|
|
—
|
|
(70
|
)
|
—
|
|
(70
|
)
|
|||||||||
|
Net Income
|
778
|
|
385
|
|
237
|
|
(622
|
)
|
778
|
|
|||||||||
|
Less: Net Loss Attributable to Noncontrolling Interests
|
—
|
|
—
|
|
—
|
|
—
|
|
—
|
|
|||||||||
|
Net Income Attributable to Tyson
|
$
|
778
|
|
$
|
385
|
|
$
|
237
|
|
$
|
(622
|
)
|
$
|
778
|
|
||||
|
|
|
|
|
|
|
|
|
|
|
||||||||||
|
Comprehensive Income (Loss)
|
$
|
733
|
|
$
|
380
|
|
$
|
212
|
|
$
|
(592
|
)
|
$
|
733
|
|
||||
|
Less: Comprehensive Income (Loss) Attributable to Noncontrolling Interest
|
—
|
|
—
|
|
—
|
|
—
|
|
—
|
|
|||||||||
|
Comprehensive Income (Loss) Attributable to Tyson
|
$
|
733
|
|
$
|
380
|
|
$
|
212
|
|
$
|
(592
|
)
|
$
|
733
|
|
||||
75
|
Condensed Consolidating Statement of Income and Comprehensive Income for the year ended September 29, 2012
|
in millions
|
||||||||||||||||||
|
TFI
Parent
|
|
TFM
Parent
|
|
Non-
Guarantors
|
|
Eliminations
|
|
Total
|
|
||||||||||
|
Sales
|
$
|
352
|
|
$
|
18,832
|
|
$
|
15,152
|
|
$
|
(1,281
|
)
|
$
|
33,055
|
|
||||
|
Cost of Sales
|
(4
|
)
|
18,088
|
|
14,061
|
|
(1,280
|
)
|
30,865
|
|
|||||||||
|
Gross Profit
|
356
|
|
744
|
|
1,091
|
|
(1
|
)
|
2,190
|
|
|||||||||
|
Selling, General and Administrative
|
59
|
|
205
|
|
641
|
|
(1
|
)
|
904
|
|
|||||||||
|
Operating Income
|
297
|
|
539
|
|
450
|
|
—
|
|
1,286
|
|
|||||||||
|
Other (Income) Expense:
|
|
|
|
|
|
||||||||||||||
|
Interest expense, net
|
49
|
|
143
|
|
152
|
|
—
|
|
344
|
|
|||||||||
|
Other, net
|
1
|
|
—
|
|
(24
|
)
|
—
|
|
(23
|
)
|
|||||||||
|
Equity in net earnings of subsidiaries
|
(427
|
)
|
(43
|
)
|
—
|
|
470
|
|
—
|
|
|||||||||
|
Total Other (Income) Expense
|
(377
|
)
|
100
|
|
128
|
|
470
|
|
321
|
|
|||||||||
|
Income from Continuing Operations before Income Taxes
|
674
|
|
439
|
|
322
|
|
(470
|
)
|
965
|
|
|||||||||
|
Income Tax Expense
|
91
|
|
130
|
|
130
|
|
—
|
|
351
|
|
|||||||||
|
Income from Continuing Operations
|
583
|
|
309
|
|
192
|
|
(470
|
)
|
614
|
|
|||||||||
|
Loss from Discontinued Operation, Net of Tax
|
—
|
|
—
|
|
(38
|
)
|
—
|
|
(38
|
)
|
|||||||||
|
Net Income
|
583
|
|
309
|
|
154
|
|
(470
|
)
|
576
|
|
|||||||||
|
Less: Net Loss Attributable to Noncontrolling Interests
|
—
|
|
—
|
|
(7
|
)
|
—
|
|
(7
|
)
|
|||||||||
|
Net Income Attributable to Tyson
|
$
|
583
|
|
$
|
309
|
|
$
|
161
|
|
$
|
(470
|
)
|
$
|
583
|
|
||||
|
|
|
|
|
|
|
|
|
|
|
||||||||||
|
Comprehensive Income (Loss)
|
$
|
599
|
|
$
|
324
|
|
$
|
166
|
|
$
|
(497
|
)
|
$
|
592
|
|
||||
|
Less: Comprehensive Income (Loss) Attributable to Noncontrolling Interests
|
—
|
|
—
|
|
(7
|
)
|
—
|
|
(7
|
)
|
|||||||||
|
Comprehensive Income (Loss) Attributable to Tyson
|
$
|
599
|
|
$
|
324
|
|
$
|
173
|
|
$
|
(497
|
)
|
$
|
599
|
|
||||
|
Condensed Consolidating Statement of Income and Comprehensive Income for the year ended October 1, 2011
|
in millions
|
||||||||||||||||||
|
TFI
Parent
|
|
TFM
Parent
|
|
Non-
Guarantors
|
|
Eliminations
|
|
Total
|
|
||||||||||
|
Sales
|
$
|
157
|
|
$
|
18,636
|
|
$
|
14,466
|
|
$
|
(1,227
|
)
|
$
|
32,032
|
|
||||
|
Cost of Sales
|
29
|
|
17,461
|
|
13,574
|
|
(1,227
|
)
|
29,837
|
|
|||||||||
|
Gross Profit
|
128
|
|
1,175
|
|
892
|
|
—
|
|
2,195
|
|
|||||||||
|
Selling, General and Administrative
|
52
|
|
215
|
|
639
|
|
—
|
|
906
|
|
|||||||||
|
Operating Income
|
76
|
|
960
|
|
253
|
|
—
|
|
1,289
|
|
|||||||||
|
Other (Income) Expense:
|
|||||||||||||||||||
|
Interest expense, net
|
(26
|
)
|
148
|
|
109
|
|
—
|
|
231
|
|
|||||||||
|
Other, net
|
(9
|
)
|
—
|
|
(11
|
)
|
—
|
|
(20
|
)
|
|||||||||
|
Equity in net earnings of subsidiaries
|
(673
|
)
|
(115
|
)
|
—
|
|
788
|
|
—
|
|
|||||||||
|
Total Other (Income) Expense
|
(708
|
)
|
33
|
|
98
|
|
788
|
|
211
|
|
|||||||||
|
Income from Continuing Operations before Income Taxes
|
784
|
|
927
|
|
155
|
|
(788
|
)
|
1,078
|
|
|||||||||
|
Income Tax Expense
|
34
|
|
272
|
|
34
|
|
—
|
|
340
|
|
|||||||||
|
Income from Continuing Operations
|
750
|
|
655
|
|
121
|
|
(788
|
)
|
738
|
|
|||||||||
|
Loss from Discontinued Operation, Net of Tax
|
—
|
|
—
|
|
(5
|
)
|
—
|
|
(5
|
)
|
|||||||||
|
Net Income
|
750
|
|
655
|
|
116
|
|
(788
|
)
|
733
|
|
|||||||||
|
Less: Net Loss Attributable to Noncontrolling Interests
|
—
|
|
—
|
|
(17
|
)
|
—
|
|
(17
|
)
|
|||||||||
|
Net Income Attributable to Tyson
|
$
|
750
|
|
$
|
655
|
|
$
|
133
|
|
$
|
(788
|
)
|
$
|
750
|
|
||||
|
|
|
|
|
|
|
|
|
|
|
||||||||||
|
Comprehensive Income (Loss)
|
$
|
671
|
|
$
|
606
|
|
$
|
77
|
|
$
|
(700
|
)
|
$
|
654
|
|
||||
|
Less: Comprehensive Income (Loss) Attributable to Noncontrolling Interests
|
—
|
|
—
|
|
(17
|
)
|
—
|
|
(17
|
)
|
|||||||||
|
Comprehensive Income (Loss) Attributable to Tyson
|
$
|
671
|
|
$
|
606
|
|
$
|
94
|
|
$
|
(700
|
)
|
$
|
671
|
|
||||
76
|
Condensed Consolidating Balance Sheet as of September 28, 2013
|
in millions
|
||||||||||||||||||
|
TFI
Parent
|
|
TFM
Parent
|
|
Non-
Guarantors
|
|
Eliminations
|
|
Total
|
|
||||||||||
|
Assets
|
|||||||||||||||||||
|
Current Assets:
|
|||||||||||||||||||
|
Cash and cash equivalents
|
$
|
—
|
|
$
|
21
|
|
$
|
1,124
|
|
$
|
—
|
|
$
|
1,145
|
|
||||
|
Accounts receivable, net
|
—
|
|
571
|
|
926
|
|
—
|
|
1,497
|
|
|||||||||
|
Inventories
|
—
|
|
1,039
|
|
1,778
|
|
—
|
|
2,817
|
|
|||||||||
|
Other current assets
|
351
|
|
88
|
|
117
|
|
(411
|
)
|
145
|
|
|||||||||
|
Total Current Assets
|
351
|
|
1,719
|
|
3,945
|
|
(411
|
)
|
5,604
|
|
|||||||||
|
Net Property, Plant and Equipment
|
32
|
|
891
|
|
3,130
|
|
—
|
|
4,053
|
|
|||||||||
|
Goodwill
|
—
|
|
881
|
|
1,021
|
|
—
|
|
1,902
|
|
|||||||||
|
Intangible Assets
|
—
|
|
21
|
|
117
|
|
—
|
|
138
|
|
|||||||||
|
Other Assets
|
895
|
|
162
|
|
244
|
|
(821
|
)
|
480
|
|
|||||||||
|
Investment in Subsidiaries
|
11,975
|
|
2,035
|
|
—
|
|
(14,010
|
)
|
—
|
|
|||||||||
|
Total Assets
|
$
|
13,253
|
|
$
|
5,709
|
|
$
|
8,457
|
|
$
|
(15,242
|
)
|
$
|
12,177
|
|
||||
|
Liabilities and Shareholders’ Equity
|
|||||||||||||||||||
|
Current Liabilities:
|
|||||||||||||||||||
|
Current debt
|
$
|
457
|
|
$
|
132
|
|
$
|
251
|
|
$
|
(327
|
)
|
$
|
513
|
|
||||
|
Accounts payable
|
27
|
|
575
|
|
757
|
|
—
|
|
1,359
|
|
|||||||||
|
Other current liabilities
|
4,625
|
|
200
|
|
901
|
|
(4,588
|
)
|
1,138
|
|
|||||||||
|
Total Current Liabilities
|
5,109
|
|
907
|
|
1,909
|
|
(4,915
|
)
|
3,010
|
|
|||||||||
|
Long-Term Debt
|
1,770
|
|
679
|
|
241
|
|
(795
|
)
|
1,895
|
|
|||||||||
|
Deferred Income Taxes
|
24
|
|
93
|
|
362
|
|
—
|
|
479
|
|
|||||||||
|
Other Liabilities
|
149
|
|
155
|
|
282
|
|
(26
|
)
|
560
|
|
|||||||||
|
Total Tyson Shareholders’ Equity
|
6,201
|
|
3,875
|
|
5,631
|
|
(9,506
|
)
|
6,201
|
|
|||||||||
|
Noncontrolling Interests
|
—
|
|
—
|
|
32
|
|
—
|
|
32
|
|
|||||||||
|
Total Shareholders’ Equity
|
6,201
|
|
3,875
|
|
5,663
|
|
(9,506
|
)
|
6,233
|
|
|||||||||
|
Total Liabilities and Shareholders’ Equity
|
$
|
13,253
|
|
$
|
5,709
|
|
$
|
8,457
|
|
$
|
(15,242
|
)
|
$
|
12,177
|
|
||||
77
|
Condensed Consolidating Balance Sheet as of September 29, 2012
|
in millions
|
||||||||||||||||||
|
TFI
Parent
|
|
TFM
Parent
|
|
Non-
Guarantors
|
|
Eliminations
|
|
Total
|
|
||||||||||
|
Assets
|
|||||||||||||||||||
|
Current Assets:
|
|||||||||||||||||||
|
Cash and cash equivalents
|
$
|
1
|
|
$
|
9
|
|
$
|
1,061
|
|
$
|
—
|
|
$
|
1,071
|
|
||||
|
Accounts receivable, net
|
1
|
|
499
|
|
878
|
|
—
|
|
1,378
|
|
|||||||||
|
Inventories
|
—
|
|
950
|
|
1,859
|
|
—
|
|
2,809
|
|
|||||||||
|
Other current assets
|
139
|
|
100
|
|
90
|
|
(184
|
)
|
145
|
|
|||||||||
|
Total Current Assets
|
141
|
|
1,558
|
|
3,888
|
|
(184
|
)
|
5,403
|
|
|||||||||
|
Net Property, Plant and Equipment
|
31
|
|
873
|
|
3,118
|
|
—
|
|
4,022
|
|
|||||||||
|
Goodwill
|
—
|
|
881
|
|
1,010
|
|
—
|
|
1,891
|
|
|||||||||
|
Intangible Assets
|
—
|
|
26
|
|
103
|
|
—
|
|
129
|
|
|||||||||
|
Other Assets
|
1,257
|
|
151
|
|
251
|
|
(1,208
|
)
|
451
|
|
|||||||||
|
Investment in Subsidiaries
|
11,849
|
|
2,005
|
|
—
|
|
(13,854
|
)
|
—
|
|
|||||||||
|
Total Assets
|
$
|
13,278
|
|
$
|
5,494
|
|
$
|
8,370
|
|
$
|
(15,246
|
)
|
$
|
11,896
|
|
||||
|
Liabilities and Shareholders’ Equity
|
|||||||||||||||||||
|
Current Liabilities:
|
|||||||||||||||||||
|
Current debt
|
$
|
439
|
|
$
|
—
|
|
$
|
167
|
|
$
|
(91
|
)
|
$
|
515
|
|
||||
|
Accounts payable
|
10
|
|
558
|
|
804
|
|
—
|
|
1,372
|
|
|||||||||
|
Other current liabilities
|
4,887
|
|
144
|
|
766
|
|
(4,854
|
)
|
943
|
|
|||||||||
|
Total Current Liabilities
|
5,336
|
|
702
|
|
1,737
|
|
(4,945
|
)
|
2,830
|
|
|||||||||
|
Long-Term Debt
|
1,774
|
|
809
|
|
486
|
|
(1,152
|
)
|
1,917
|
|
|||||||||
|
Deferred Income Taxes
|
—
|
|
135
|
|
432
|
|
(9
|
)
|
558
|
|
|||||||||
|
Other Liabilities
|
156
|
|
146
|
|
294
|
|
(47
|
)
|
549
|
|
|||||||||
|
Total Tyson Shareholders’ Equity
|
6,012
|
|
3,702
|
|
5,391
|
|
(9,093
|
)
|
6,012
|
|
|||||||||
|
Noncontrolling Interests
|
—
|
|
—
|
|
30
|
|
—
|
|
30
|
|
|||||||||
|
Total Shareholders’ Equity
|
6,012
|
|
3,702
|
|
5,421
|
|
(9,093
|
)
|
6,042
|
|
|||||||||
|
Total Liabilities and Shareholders’ Equity
|
$
|
13,278
|
|
$
|
5,494
|
|
$
|
8,370
|
|
$
|
(15,246
|
)
|
$
|
11,896
|
|
||||
|
Condensed Consolidating Statement of Cash Flows for the year ended September 28, 2013
|
in millions
|
||||||||||||||||||
|
TFI
Parent
|
|
TFM
Parent
|
|
Non-
Guarantors
|
|
Eliminations
|
|
Total
|
|
||||||||||
|
Cash Provided by (Used for) Operating Activities
|
$
|
294
|
|
$
|
337
|
|
$
|
696
|
|
$
|
(13
|
)
|
$
|
1,314
|
|
||||
|
Cash Flows from Investing Activities:
|
|||||||||||||||||||
|
Additions to property, plant and equipment
|
(4
|
)
|
(113
|
)
|
(441
|
)
|
—
|
|
(558
|
)
|
|||||||||
|
(Purchases of)/Proceeds from marketable securities, net
|
—
|
|
(13
|
)
|
(5
|
)
|
—
|
|
(18
|
)
|
|||||||||
|
Proceeds from notes receivable
|
—
|
|
—
|
|
—
|
|
—
|
|
—
|
|
|||||||||
|
Acquisitions, net of cash acquired
|
—
|
|
—
|
|
(106
|
)
|
—
|
|
(106
|
)
|
|||||||||
|
Other, net
|
—
|
|
3
|
|
36
|
|
—
|
|
39
|
|
|||||||||
|
Cash Provided by (Used for) Investing Activities
|
(4
|
)
|
(123
|
)
|
(516
|
)
|
—
|
|
(643
|
)
|
|||||||||
|
Cash Flows from Financing Activities:
|
|||||||||||||||||||
|
Net change in debt
|
5
|
|
—
|
|
(28
|
)
|
—
|
|
(23
|
)
|
|||||||||
|
Purchase of redeemable noncontrolling interest
|
—
|
|
—
|
|
—
|
|
—
|
|
—
|
|
|||||||||
|
Purchases of Tyson Class A common stock
|
(614
|
)
|
—
|
|
—
|
|
—
|
|
(614
|
)
|
|||||||||
|
Dividends
|
(104
|
)
|
—
|
|
(13
|
)
|
13
|
|
(104
|
)
|
|||||||||
|
Stock options exercised
|
123
|
|
—
|
|
—
|
|
—
|
|
123
|
|
|||||||||
|
Other, net
|
18
|
|
—
|
|
—
|
|
—
|
|
18
|
|
|||||||||
|
Net change in intercompany balances
|
281
|
|
(202
|
)
|
(79
|
)
|
—
|
|
—
|
|
|||||||||
|
Cash Provided by (Used for) Financing Activities
|
(291
|
)
|
(202
|
)
|
(120
|
)
|
13
|
|
(600
|
)
|
|||||||||
|
Effect of Exchange Rate Change on Cash
|
—
|
|
—
|
|
3
|
|
—
|
|
3
|
|
|||||||||
|
Increase (Decrease) in Cash and Cash Equivalents
|
(1
|
)
|
12
|
|
63
|
|
—
|
|
74
|
|
|||||||||
|
Cash and Cash Equivalents at Beginning of Year
|
1
|
|
9
|
|
1,061
|
|
—
|
|
1,071
|
|
|||||||||
|
Cash and Cash Equivalents at End of Year
|
$
|
—
|
|
$
|
21
|
|
$
|
1,124
|
|
$
|
—
|
|
$
|
1,145
|
|
||||
78
|
Condensed Consolidating Statement of Cash Flows for the year ended September 29, 2012
|
in millions
|
||||||||||||||||||
|
TFI
Parent
|
|
TFM
Parent
|
|
Non-
Guarantors
|
|
Eliminations
|
|
Total
|
|
||||||||||
|
Cash Provided by (Used for) Operating Activities
|
$
|
312
|
|
$
|
438
|
|
$
|
447
|
|
$
|
(10
|
)
|
$
|
1,187
|
|
||||
|
Cash Flows from Investing Activities:
|
|||||||||||||||||||
|
Additions to property, plant and equipment
|
(1
|
)
|
(104
|
)
|
(585
|
)
|
—
|
|
(690
|
)
|
|||||||||
|
(Purchases of)/Proceeds from marketable securities, net
|
—
|
|
(7
|
)
|
(4
|
)
|
—
|
|
(11
|
)
|
|||||||||
|
Proceeds from notes receivable
|
—
|
|
—
|
|
—
|
|
—
|
|
—
|
|
|||||||||
|
Acquisitions, net of cash acquired
|
—
|
|
—
|
|
—
|
|
—
|
|
—
|
|
|||||||||
|
Other, net
|
1
|
|
5
|
|
35
|
|
—
|
|
41
|
|
|||||||||
|
Cash Provided by (Used for) Investing Activities
|
—
|
|
(106
|
)
|
(554
|
)
|
—
|
|
(660
|
)
|
|||||||||
|
Cash Flows from Financing Activities:
|
|||||||||||||||||||
|
Net change in debt
|
107
|
|
—
|
|
16
|
|
—
|
|
123
|
|
|||||||||
|
Purchase of redeemable noncontrolling interest
|
—
|
|
—
|
|
—
|
|
—
|
|
—
|
|
|||||||||
|
Purchases of Tyson Class A common stock
|
(264
|
)
|
—
|
|
—
|
|
—
|
|
(264
|
)
|
|||||||||
|
Dividends
|
(57
|
)
|
—
|
|
(10
|
)
|
10
|
|
(57
|
)
|
|||||||||
|
Stock options exercised
|
34
|
|
—
|
|
—
|
|
—
|
|
34
|
|
|||||||||
|
Other, net
|
(8
|
)
|
—
|
|
1
|
|
—
|
|
(7
|
)
|
|||||||||
|
Net change in intercompany balances
|
(124
|
)
|
(324
|
)
|
448
|
|
—
|
|
—
|
|
|||||||||
|
Cash Provided by (Used for) Financing Activities
|
(312
|
)
|
(324
|
)
|
455
|
|
10
|
|
(171
|
)
|
|||||||||
|
Effect of Exchange Rate Change on Cash
|
—
|
|
—
|
|
(1
|
)
|
—
|
|
(1
|
)
|
|||||||||
|
Increase (Decrease) in Cash and Cash Equivalents
|
—
|
|
8
|
|
347
|
|
—
|
|
355
|
|
|||||||||
|
Cash and Cash Equivalents at Beginning of Year
|
1
|
|
1
|
|
714
|
|
—
|
|
716
|
|
|||||||||
|
Cash and Cash Equivalents at End of Year
|
$
|
1
|
|
$
|
9
|
|
$
|
1,061
|
|
$
|
—
|
|
$
|
1,071
|
|
||||
|
Condensed Consolidating Statement of Cash Flows for the year ended October 1, 2011
|
in millions
|
||||||||||||||||||
|
TFI
Parent
|
|
TFM
Parent
|
|
Non-
Guarantors
|
|
Eliminations
|
|
Total
|
|
||||||||||
|
Cash Provided by (Used for) Operating Activities
|
$
|
31
|
|
$
|
564
|
|
$
|
471
|
|
$
|
(20
|
)
|
$
|
1,046
|
|
||||
|
Cash Flows from Investing Activities:
|
|||||||||||||||||||
|
Additions to property, plant and equipment
|
(1
|
)
|
(107
|
)
|
(535
|
)
|
—
|
|
(643
|
)
|
|||||||||
|
(Purchases of)/Proceeds from marketable securities, net
|
—
|
|
(57
|
)
|
(23
|
)
|
—
|
|
(80
|
)
|
|||||||||
|
Proceeds from notes receivable
|
—
|
|
—
|
|
51
|
|
—
|
|
51
|
|
|||||||||
|
Acquisitions, net of cash acquired
|
—
|
|
—
|
|
—
|
|
—
|
|
—
|
|
|||||||||
|
Other, net
|
23
|
|
—
|
|
5
|
|
—
|
|
28
|
|
|||||||||
|
Cash Provided by (Used for) Investing Activities
|
22
|
|
(164
|
)
|
(502
|
)
|
—
|
|
(644
|
)
|
|||||||||
|
Cash Flows from Financing Activities:
|
|||||||||||||||||||
|
Net change in debt
|
(391
|
)
|
(6
|
)
|
12
|
|
—
|
|
(385
|
)
|
|||||||||
|
Purchase of redeemable noncontrolling interest
|
—
|
|
—
|
|
(66
|
)
|
—
|
|
(66
|
)
|
|||||||||
|
Purchases of Tyson Class A common stock
|
(207
|
)
|
—
|
|
—
|
|
—
|
|
(207
|
)
|
|||||||||
|
Dividends
|
(59
|
)
|
—
|
|
(20
|
)
|
20
|
|
(59
|
)
|
|||||||||
|
Stock options exercised
|
51
|
|
—
|
|
—
|
|
—
|
|
51
|
|
|||||||||
|
Other, net
|
(2
|
)
|
—
|
|
10
|
|
—
|
|
8
|
|
|||||||||
|
Net change in intercompany balances
|
554
|
|
(395
|
)
|
(159
|
)
|
—
|
|
—
|
|
|||||||||
|
Cash Provided by (Used for) Financing Activities
|
(54
|
)
|
(401
|
)
|
(223
|
)
|
20
|
|
(658
|
)
|
|||||||||
|
Effect of Exchange Rate Change on Cash
|
—
|
|
—
|
|
(6
|
)
|
—
|
|
(6
|
)
|
|||||||||
|
Increase (Decrease) in Cash and Cash Equivalents
|
(1
|
)
|
(1
|
)
|
(260
|
)
|
—
|
|
(262
|
)
|
|||||||||
|
Cash and Cash Equivalents at Beginning of Year
|
2
|
|
2
|
|
974
|
|
—
|
|
978
|
|
|||||||||
|
Cash and Cash Equivalents at End of Year
|
$
|
1
|
|
$
|
1
|
|
$
|
714
|
|
$
|
—
|
|
$
|
716
|
|
||||
79
Report of Independent Registered Public Accounting Firm
To the Board of Directors and Shareholders of
Tyson Foods, Inc.
In our opinion, the accompanying consolidated balance sheets and the related consolidated statements of income, comprehensive income, shareholders’ equity and cash flows present fairly, in all material respects, the financial position of Tyson Foods, Inc.
and its subsidiaries
at September 28, 2013
and September 29, 2012, and the results of their operations and their cash flows for each of the three years in the period ended September 28, 2013
in conformity with accounting principles generally accepted in the United States of America. In addition, in our opinion, the financial statement schedule listed in the index appearing under Item 15(a) presents fairly, in all material respects, the information set forth therein when read in conjunction with the related consolidated financial statements. Also in our opinion, the Company maintained, in all material respects, effective internal control over financial reporting as of September 28, 2013, based on criteria established in
Internal Control - Integrated Framework (1992)
issued by the Committee of Sponsoring Organizations of the Treadway Commission (COSO). The Company's management is responsible for these financial statements and financial statement schedule, for maintaining effective internal control over financial reporting and for its assessment of the effectiveness of internal control over financial reporting, included in
Management's Annual Report on Internal Control over Financial Reporting appearing under Item 9A. Our responsibility is to express opinions on these financial statements, on the financial statement schedule, and on the Company's internal control over financial reporting based on our integrated
audits. We conducted our audits in accordance with the standards of the Public Company Accounting Oversight Board (United States). Those standards require that we plan and perform the audits to obtain reasonable assurance about whether the financial statements are free of material misstatement and whether effective internal control over financial reporting was maintained in all material respects. Our audits of the financial statements included examining, on a test basis, evidence supporting the amounts and disclosures in the financial statements, assessing the accounting principles used and significant estimates made by management, and evaluating the overall financial statement presentation. Our audit of internal control over financial reporting included obtaining an understanding of internal control over financial reporting, assessing the risk that a material weakness exists, and testing and evaluating the design and operating effectiveness of internal control based on the assessed risk. Our audits also included performing such other procedures as we considered necessary in the circumstances. We believe that our audits provide a reasonable basis for our opinions.
A company’s internal control over financial reporting is a process designed to provide reasonable assurance regarding the reliability of financial reporting and the preparation of financial statements for external purposes in accordance with generally accepted accounting principles. A company’s internal control over financial reporting includes those policies and procedures that (i) pertain to the maintenance of records that, in reasonable detail, accurately and fairly reflect the transactions and dispositions of the assets of the company; (ii) provide reasonable assurance that transactions are recorded as necessary to permit preparation of financial statements in accordance with generally accepted accounting principles, and that receipts and expenditures of the company are being made only in accordance with authorizations of management and directors of the company; and (iii) provide reasonable assurance regarding prevention or timely detection of unauthorized acquisition, use, or disposition of the company’s assets that could have a material effect on the financial statements.
Because of its inherent limitations, internal control over financial reporting may not prevent or detect misstatements. Also, projections of any evaluation of effectiveness to future periods are subject to the risk that controls may become inadequate because of changes in conditions, or that the degree of compliance with the policies or procedures may deteriorate.
/s/ PricewaterhouseCoopers LLP
Fayetteville, AR
November 18, 2013
80
Not applicable.
Evaluation of Disclosure Controls and Procedures
An evaluation was performed, under the supervision and with the participation of management, including the Chief Executive Officer (CEO) and the Chief Financial Officer (CFO), of the effectiveness of the design and operation of our disclosure controls and procedures (as defined in Rule 13a-15(e) under the Securities Exchange Act of 1934, as amended (the 1934 Act)). Based on that evaluation, management, including the CEO and CFO, has concluded that, as of
September 28, 2013
, our disclosure controls and procedures were effective.
Changes in Internal Control Over Financial Reporting
In the quarter ended
September 28, 2013
, there have been no changes in the Company’s internal control over financial reporting that have materially affected, or are reasonably likely to materially affect, the Company’s internal control over financial reporting.
Management’s Annual Report on Internal Control Over Financial Reporting
Management is responsible for establishing and maintaining adequate internal control over financial reporting, as defined in Rule 13a-15(f) of the Securities Exchange Act of 1934. Our internal control over financial reporting was designed to provide reasonable assurance regarding the reliability of financial reporting and the preparation of financial statements for external purposes in accordance with accounting principles generally accepted in the United States of America. Because of its inherent limitations, internal control over financial reporting may not prevent or detect misstatements. Also, projections of any evaluation of effectiveness to future periods are subject to the risk that controls may become inadequate because of changes in conditions, or the degree of compliance with the policies or procedures may deteriorate.
Management conducted an evaluation of the effectiveness of our internal control over financial reporting as of
September 28, 2013
. In making this assessment, we used criteria set forth by the Committee of Sponsoring Organizations of the Treadway Commission (COSO) in
Internal Control – Integrated Framework (1992)
.
Based on this evaluation under the framework in
Internal Control – Integrated Framework (1992)
issued by COSO, Management concluded the Company’s internal control over financial reporting was effective as of
September 28, 2013
.
The Company’s independent registered public accounting firm, PricewaterhouseCoopers LLP, who has audited the fiscal
2013
financial statements included in this Form 10-K has also audited the Company’s internal control over financial reporting. Their report appears in Part II, Item 8.
On November 15, 2013, we entered into new employment agreements with Donnie King and Noel White pursuant to their appointments to the positions of President of Prepared Foods, Customer and Consumer Solutions and President of Poultry, respectively. These contracts replace the previous contracts for these officers entered into effective November 14, 2012.
Mr. King’s agreement provides for an annual base salary of $800,000. Mr. White’s agreement provides for an annual base salary of $725,000. Both agreements provide eligibility for participation in the Company’s annual performance incentive plan and supplemental executive retirement plan, as well as any benefit programs generally applicable to employees of the Company. In addition, Mr. King and Mr. White are eligible to receive, on such dates specified by the Company consistent with the Company’s treatment of similarly-situated employees, performance and stock incentive awards under the Company’s incentive plans then in effect (if any), subject to the discretion of senior management.
Mr. King and Mr. White are also entitled to the use of certain Company-owned assets, including aircraft for up to 25 hours annually, provided that such use does not interfere with the Company’s use of such assets and is consistent with the Company’s then existing policies. In addition, the Company will reimburse and gross-up any and all income tax liability of Mr. King or Mr. White in connection with the use of such Company-owned assets.
Both Mr. King and Mr. White may terminate their employment under the agreement, subject to confidentiality and non-compete obligations contained therein, upon thirty (30) days’ prior written notice to the Company. The Company has the right to terminate the agreement at any time upon written notice to either Mr. King or Mr. White. Any such termination without cause is subject to the Company’s obligation to continue to pay base salary for a period of time following termination consistent with the Company’s severance policy for similarly-situated officers and subject to provisions relating to the early vesting of stock options, restricted stock and performance stock awards.
Upon the occurrence of a change in control (as defined in the agreement), all previously granted restricted stock, performance stock and stock option awards will be treated in accordance with the applicable award agreement.
Copies of these agreements are filed as Exhibits 10.17 and 10.19 to this Form 10-K.
81
On November 18, 2013, James V. Lochner, the Company’s Chief Operating Officer, announced that he would retire on September 20, 2014. In connection with his announcement, the Company and Mr. Lochner entered into an amendment to Mr. Lochner’s November 14, 2012 employment agreement which provides that his employment agreement will terminate on September 20, 2014 and that he and the Company will enter into an advisory agreement effective September 21, 2014 to furnish advisory and consulting services to the Company for three years.
Under the advisory agreement, the Company will pay $438,611 to Mr. Lochner annually, as well as provide Mr. Lochner and his spouse coverage under the Company’s health care plan at the same cost paid by similarly-situated participants. Mr. Lochner will also be entitled to annual payments under the Company’s supplemental executive retirement plan beginning in 2015 in the amount of $561,389, less any required tax withholdings. The advisory agreement also contains certain confidentiality, non-competition, and non-solicitation provisions in favor of the Company.
A copy of this amendment is filed as Exhibit 10.12 to this Form 10-K.
82
See information set forth under the captions “Election of Directors” and “Section 16(a) Beneficial Ownership Reporting Compliance” in the Company’s definitive Proxy Statement for the Company’s Annual Meeting of Shareholders to be held
January 31, 2014
(the “Proxy Statement”), which information is incorporated herein by reference. Pursuant to general instruction G(3) of Annual Report on Form 10-K, certain information concerning our executive officers is included under the caption “Executive Officers of the Company” in Part I of this Report.
We have a code of ethics as defined in Item 406 of Regulation S-K, which code applies to all of our directors and employees, including our principal executive officers, principal financial officer, principal accounting officer or controller, and persons performing similar functions. This code of ethics, titled “Tyson Foods, Inc. Code of Conduct,” is available, free of charge on our website at http://ir.tyson.com.
See the information set forth under the captions “Executive Compensation,” “Director Compensation For Fiscal
2013
,” “Compensation Discussion and Analysis,” “Report of the Compensation and Leadership Development Committee,” and “Compensation and Leadership Development Committee Interlocks and Insider Participation” in the Proxy Statement, which information is incorporated herein by reference. However, pursuant to instructions to Item 407(e)(5) of the Securities and Exchange Commission Regulation S-K, the material appearing under the sub-heading “Report of the Compensation and Leadership Development Committee” shall not be deemed to be “filed” with the Commission, other than as provided in this Item 11.
See the information included under the captions “Security Ownership of Certain Beneficial Owners” and “Security Ownership of Management” in the Proxy Statement, which information is incorporated herein by reference.
Securities Authorized for Issuance Under Equity Compensation Plans
The following information reflects certain information about our equity compensation plans as of
September 28, 2013
:
|
Equity Compensation Plan Information
|
|||||||||
|
(a)
|
|
(b)
|
|
(c)
|
|
||||
|
Number of
Securities to be
issued upon
exercise of
outstanding
options
|
|
Weighted
average
exercise price
of outstanding
options
|
|
Number of Securities
remaining available for
future issuance under
equity compensation plans
(excluding Securities
reflected in column (a))
|
|
||||
|
Equity compensation plans approved by security holders
|
13,912,168
|
|
$
|
16.59
|
|
61,280,047
|
|
||
|
Equity compensation plans not approved by security holders
|
—
|
|
—
|
|
—
|
|
|||
|
Total
|
13,912,168
|
|
$
|
16.59
|
|
61,280,047
|
|
||
|
(a)
|
Outstanding options granted by the Company
|
|
(b)
|
Weighted average price of outstanding options
|
|
(c)
|
Shares available for future issuance as of September 28, 2013, under the Stock Incentive Plan (35,365,400), the Employee Stock Purchase Plan (18,267,039) and the Retirement Savings Plan (7,647,608)
|
See the information included under the captions “Election of Directors” and “Certain Transactions” in the Proxy Statement, which information is incorporated herein by reference.
See the information included under the captions “Audit Fees,” “Audit-Related Fees,” “Tax Fees,” “All Other Fees,” and “Audit Committee Pre-Approval Policy” in the Proxy Statement, which information is incorporated herein by reference.
83
|
(a)
|
The following documents are filed as a part of this report:
|
Consolidated Statements of Income
for the three years ended
September 28, 2013
Consolidated Statements of Comprehensive Income
for the three years ended
September 28, 2013
Consolidated Balance Sheets at
September 28, 2013
, and
September 29, 2012
Consolidated Statements of Shareholders’ Equity
for the three years ended
September 28, 2013
Consolidated Statements of Cash Flows
for the three years ended
September 28, 2013
Notes to Consolidated Financial Statements
Report of Independent Registered Public Accounting Firm
Financial Statement Schedule - Schedule II Valuation and Qualifying
Accounts for the three years ended
September 28, 2013
All other schedules are omitted because they are neither applicable nor required.
The exhibits filed with this report are listed in the Exhibit Index at the end of Item 15.
84
EXHIBIT INDEX
Exhibit No.
|
3.1
|
Restated Certificate of Incorporation of the Company (previously filed as Exhibit 3.1 to the Company’s Annual Report on Form 10-K for the fiscal year ended October 3, 1998, Commission File No. 001-14704, and incorporated herein by reference).
|
|
|
3.2
|
Fifth Amended and Restated By-laws of the Company (previously filed as Exhibit 3.2 to the Company’s Quarterly Report on Form 10-Q filed for the period ended June 29, 2013, Commission File No. 001-14704, and incorporated herein by reference).
|
|
|
4.1
|
Indenture dated June 1, 1995 between the Company and The Chase Manhattan Bank, N.A., as Trustee (the “Company Indenture”) (previously filed as Exhibit 4 to Registration Statement on Form S-3, filed with the Commission on December 18, 1997, Registration No. 333-42525, and incorporated herein by reference).
|
|
|
4.2
|
Form of 7.0% Note due January 15, 2028 issued under the Company Indenture (previously filed as Exhibit 4.2 to the Company’s Quarterly Report on Form 10-Q for the period ended December 27, 1997, Commission File No. 001-14704, and incorporated herein by reference).
|
|
|
4.3
|
Form of 7.0% Note due May 1, 2018 issued under the Company Indenture (previously filed as Exhibit 4.1 to the Company’s Quarterly Report on Form 10-Q for the period ended March 28, 1998, Commission File No. 001-14704, and incorporated herein by reference).
|
|
|
4.4
|
Form of 6.60% Senior Notes due April 1, 2016 issued under the Company Indenture (previously filed as Exhibit 4.1 to the Company’s Current Report on Form 8-K filed March 22, 2006, Commission File No. 001-14704, and incorporated herein by reference).
|
|
|
4.5
|
Supplemental Indenture among the Company, Tyson Fresh Meats, Inc. and JPMorgan Chase Bank, National Association, dated as of September 18, 2006, supplementing the Company Indenture (previously filed as Exhibit 10.1 to the Company’s Current Report on Form 8-K filed September 19, 2006, Commission File No. 001-14704, and incorporated herein by reference).
|
|
|
4.6
|
Supplemental Indenture dated as of September 15, 2008, between the Company and The Bank of New York Mellon Trust Company, National Association (as successor to JPMorgan Chase Bank, N.A. (formerly The Chase Manhattan Bank, N.A.)), as Trustee (including the form of 3.25% Convertible Senior Notes due 2013), supplementing the Company Indenture (previously filed as Exhibit 4.2 to the Company’s Current Report on Form 8-K filed September 15, 2008, Commission File No. 001-14704, and incorporated herein by reference).
|
|
|
4.7
|
Supplemental Indenture dated as of June 13, 2012, between the Company and The Bank of New York Mellon Trust Company, National Association (as successor to JPMorgan Chase Bank, N.A. (formerly The Chase Manhattan Bank, N.A.)), as Trustee, supplementing the Company Indenture (previously filed as Exhibit 4.1 to the Company's Current Report on Form 8-K filed June 13, 2012, Commission File No. 001-14704, and incorporated herein by reference).
|
|
|
4.8
|
Form of 4.50% Senior Note due 2022 (previously filed as Exhibit 4.2 and included in Exhibit 4.1 to the Company's Current Report on Form 8‑K filed June 13, 2012, Commission File No. 001‑14704, and incorporated herein by reference).
|
|
|
10.1
|
Credit Agreement, dated as of August 9, 2012, among the Company, JPMorgan Chase Bank, N.A., as the Administrative Agent, and certain other lenders party thereto (previously filed as Exhibit 10.1 to the Company's Current Report on Form 8-K filed August 13, 2012, Commission File No. 001-14704, and incorporated herein by reference).
|
|
|
10.2
|
Convertible note hedge transaction confirmation, dated as of September 9, 2008, by and between JPMorgan Chase Bank, National Association and the Company (previously filed as Exhibit 10.1 to the Company’s Current Report on Form 8-K filed September 15, 2008, Commission File No. 001-14704, and incorporated herein by reference).
|
|
|
10.3
|
Warrant transaction confirmation, dated as of September 9, 2008, by and between JPMorgan Chase Bank, National Association and the Company (previously filed as Exhibit 10.2 to the Company’s Current Report on Form 8-K filed September 15, 2008, Commission File No. 001-14704, and incorporated herein by reference).
|
|
|
10.4
|
Letter Agreement, dated as of September 9, 2008, by and between JPMorgan Chase Bank, National Association and the Company (previously filed as Exhibit 10.3 to the Company’s Current Report on Form 8-K filed September 15, 2008, Commission File No. 001-14704, and incorporated herein by reference).
|
|
|
10.5
|
Convertible note hedge transaction confirmation, dated as of September 9, 2008, by and between Merrill Lynch Financial Markets, Inc. and the Company (previously filed as Exhibit 10.4 to the Company’s Current Report on Form 8-K filed September 15, 2008, Commission File No. 001-14704, and incorporated herein by reference).
|
|
85
|
10.6
|
Warrant transaction confirmation, dated as of September 9, 2008, by and between Merrill Lynch Financial Markets, Inc. and the Company (previously filed as Exhibit 10.5 to the Company’s Current Report on Form 8-K filed September 15, 2008, Commission File No. 001-14704, and incorporated herein by reference).
|
|
|
10.7
|
Letter Agreement, dated as September 9, 2008, by and between Merrill Lynch Financial Markets, Inc. and the Company (previously filed as Exhibit 10.6 to the Company’s Current Report on Form 8-K filed September 15, 2008, Commission File No. 001-14704, and incorporated herein by reference).
|
|
|
10.8
|
Employment Agreement, dated as of November 25, 2012, by and between the Company and John Tyson (previously filed as Exhibit 10.1 to the Company’s Quarterly Report on Form 10-Q for the period ended December 29, 2012, Commission File No. 001-14704, and incorporated herein by reference).
|
|
|
10.9
|
Employment Agreement, dated August 27, 2012, by and between the Company and Curt T. Calaway (previously filed as Exhibit 10.11 to the Company's Annual Report on Form 10-K for the fiscal year ended September 29, 2012, Commission File No. 001-14704, and incorporated herein by reference).
|
|
|
10.10
|
Employment Agreement, dated November 14, 2012, by and between the Company and Donald J. Smith (previously filed as Exhibit 10.12 to the Company's Annual Report on Form 10-K for the fiscal year ended September 29, 2012, Commission File No. 001-14704, and incorporated herein by reference).
|
|
|
10.11
|
Employment Agreement, dated November 14, 2012, by and between the Company and James V. Lochner (previously filed as Exhibit 10.13 to the Company's Annual Report on Form 10-K for the fiscal year ended September 29, 2012, Commission File No. 001-14704, and incorporated herein by reference).
|
|
|
10.12
|
Employment Agreement, dated November 15, 2013, by and between the Company and James V. Lochner.
|
|
|
10.13
|
Employment Agreement, dated November 14, 2012, by and between the Company and David Van Bebber (previously filed as Exhibit 10.14 to the Company's Annual Report on Form 10-K for the fiscal year ended September 29, 2012, Commission File No. 001-14704, and incorporated herein by reference).
|
|
|
10.14
|
Employment Agreement, dated November 14, 2012, by and between the Company and Dennis Leatherby (previously filed as Exhibit 10.15 to the Company's Annual Report on Form 10-K for the fiscal year ended September 29, 2012, Commission File No. 001-14704, and incorporated herein by reference).
|
|
|
10.15
|
Employment Agreement, dated November 14, 2012, by and between the Company and Kenneth J. Kimbro (previously filed as Exhibit 10.16 to the Company's Annual Report on Form 10-K for the fiscal year ended September 29, 2012, Commission File No. 001-14704, and incorporated herein by reference).
|
|
|
10.16
|
Employment Agreement, dated November 14, 2012, by and between the Company and Donnie D. King (previously filed as Exhibit 10.17 to the Company's Annual Report on Form 10-K for the fiscal year ended September 29, 2012, Commission File No. 001-14704, and incorporated herein by reference).
|
|
|
10.17
|
Employment Agreement, dated November 15, 2013, by and between the Company and Donnie D. King.
|
|
|
10.18
|
Employment Agreement, dated November 14, 2012, by and between the Company and Noel W. White (previously filed as Exhibit 10.18 to the Company's Annual Report on Form 10-K for the fiscal year ended September 29, 2012, Commission File No. 001-14704, and incorporated herein by reference).
|
|
|
10.19
|
Employment Agreement, dated November 15, 2013, by and between the Company and Noel W. White.
|
|
|
10.20
|
Employment Agreement, dated November 15, 2013, by and between the Company and Howell P. Carper.
|
|
|
10.21
|
Employment Agreement, dated November 12, 2013, by and between the Company and Stephen R. Stouffer.
|
|
|
10.22
|
Indemnity Agreement, dated as of September 28, 2007, between the Company and John Tyson (previously filed as Exhibit 10.2 to the Company’s Current Report on Form 8-K filed September 28, 2007, Commission File No. 001-14704, and incorporated herein by reference).
|
|
|
10.23
|
Form of Indemnity Agreement between Tyson Foods, Inc. and its directors and certain executive officers (previously filed as Exhibit 10(t) to the Company’s Annual Report on Form 10-K for the fiscal year ended September 30, 1995, Commission File No. 0-3400, and incorporated herein by reference).
|
|
|
10.24
|
Tyson Foods, Inc. Annual Incentive Compensation Plan for Senior Executives adopted February 4, 2005, and reapproved February 5, 2010 (previously filed as Exhibit 10.34 to the Company’s Annual Report on Form 10-K for the fiscal year ended October 1, 2005, Commission File No. 001-14704, and incorporated herein by reference).
|
|
|
10.25
|
Amended and Restated Tyson Foods, Inc. Employee Stock Purchase Plan, effective as of February 1, 2013 (previously filed as Exhibit 99.2 to Registration Statement on Form S-8, filed with the Commission on February 22, 2013, Registration No. 333-186797, and incorporated herein by reference).
|
|
|
10.26
|
First Amendment to the Tyson Foods, Inc. Employee Stock Purchase Plan, effective February 1, 2013.
|
|
86
|
10.27
|
Amended and Restated Executive Savings Plan of Tyson Foods, Inc. effective January 1, 2013.
|
|
|
10.28
|
Amended and Restated Tyson Foods, Inc. 2000 Stock Incentive Plan effective February 1, 2013 (previously filed as Exhibit 99.1 to Registration Statement on Form S-8, filed with the Commission on February 22, 2013, Registration No. 333-186797, and incorporated herein by reference).
|
|
|
10.29
|
First Amendment to the Tyson Foods, Inc. 2000 Stock Incentive Plan effective May 1, 2013.
|
|
|
10.30
|
Amended and Restated Tyson Foods, Inc. Supplemental Executive Retirement and Life Insurance Premium Plan effective November 14, 2013.
|
|
|
10.31
|
Retirement Savings Plan of Tyson Foods, Inc. effective January 1, 2011 (previously filed as Exhibit 10.33 to the Company's Annual Report on Form 10-K for the fiscal year ended October 1, 2011, Commission File No. 001-14704, and incorporated herein by reference).
|
|
|
10.32
|
First Amendment to the Retirement Savings Plan of Tyson Foods, Inc., as Amended and Restated as of January 1, 2011.
|
|
|
10.33
|
Amended and Restated Retirement Income Plan of IBP, inc. effective August 1, 2000, and Amendment to Freeze the Retirement Income Plan of IBP, inc. effective December 31, 2002 (previously filed as Exhibit 10.46 to the Company’s Annual Report on Form 10-K for the fiscal year ended September 27, 2008, Commission File No. 001-14704, and incorporated herein by reference).
|
|
|
10.34
|
Form of Restricted Stock Agreement pursuant to which restricted stock awards were granted under the Tyson Foods, Inc. 2000 Stock Incentive Plan prior to July 31, 2009 (previously filed as Exhibit 10.48 to the Company’s Annual Report on Form 10-K for the fiscal year ended October 2, 2004, Commission File No. 001-14704, and incorporated herein by reference).
|
|
|
10.35
|
Form of Restricted Stock Agreement pursuant to which restricted stock awards are granted under the Tyson Foods, Inc. 2000 Stock Incentive Plan effective July 31, 2009 (previously filed as Exhibit 10.41 to the Company’s Annual Report on Form 10-K for the fiscal year ended October 3, 2009, Commission File No. 001-14704, and incorporated herein by reference).
|
|
|
10.36
|
Form of Restricted Stock Agreement pursuant to which restricted stock awards are granted under the Tyson Foods, Inc. 2000 Stock Incentive Plan effective January 1, 2010 (previously filed as Exhibit 10.41 to the Company’s Annual Report on Form 10-K for the fiscal year ended October 2, 2010, Commission File No. 001-14704, and incorporated herein by reference).
|
|
|
10.37
|
Form of Stock Incentive Agreement with key employees and contracted employees at band level 3-9 pursuant to which restricted stock awards are granted under the Tyson Foods, Inc. 2000 Stock Incentive Plan effective October 26, 2012 (previously filed as Exhibit 10.38 to the Company's Annual Report on Form 10-K for the fiscal year ended September 29, 2012, Commission File No. 001-14704, and incorporated herein by reference).
|
|
|
10.38
|
Form of Stock Incentive Agreement with the remaining contracted employees pursuant to which restricted stock awards are granted under the Tyson Foods, Inc. 2000 Stock Incentive Plan effective October 26, 2012 (previously filed as Exhibit 10.39 to the Company's Annual Report on Form 10-K for the fiscal year ended September 29, 2012, Commission File No. 001-14704, and incorporated herein by reference).
|
|
|
|
||
|
10.39
|
Form of Stock Option Grant Agreement pursuant to which stock option awards were granted under the Tyson Foods, Inc. 2000 Stock Incentive Plan prior to July 31, 2009 (previously filed as Exhibit 10.49 to the Company’s Annual Report on Form 10-K for the fiscal year ended October 2, 2004, Commission File No. 001-14704, and incorporated herein by reference).
|
|
|
|
||
|
10.40
|
Form of Stock Option Grant Agreement pursuant to which stock option awards are granted under the Tyson Foods, Inc. 2000 Stock Incentive Plan effective July 31, 2009 through February 3, 2010 (previously filed as Exhibit 10.43 to the Company’s Annual Report on Form 10-K for the fiscal year ended October 2, 2010, Commission File No. 001-14704, and incorporated herein by reference).
|
|
|
|
||
|
10.41
|
Form of Stock Option Grant Agreement pursuant to which stock option awards are granted under the Tyson Foods, Inc. 2000 Stock Incentive Plan effective February 4, 2010 (previously filed as Exhibit 10.44 to the Company’s Annual Report on Form 10-K for the fiscal year ended October 2, 2010, Commission File No. 001-14704, and incorporated herein by reference).
|
|
|
|
||
|
10.42
|
Form of Stock Option Grant Agreement with non-contracted employees pursuant to which stock option awards are granted under the Tyson Foods, Inc. 2000 Stock Incentive Plan effective November 29, 2010 (previously filed as Exhibit 10.40 to the Company's Annual Report on Form 10-K for the fiscal year ended October 1, 2011, Commission File No. 001-14704, and incorporated herein by reference).
|
|
|
|
||
|
10.43
|
Form of Stock Option Grant Agreement with contracted employees at band level 1-5 pursuant to which stock option awards are granted under the Tyson Foods, Inc. 2000 Stock Incentive Plan effective November 29, 2010 (previously filed as Exhibit 10.41 to the Company's Annual Report on Form 10-K for the fiscal year ended October 1, 2011, Commission File No. 001-14704, and incorporated herein by reference).
|
|
|
|
||
87
|
10.44
|
Form of Stock Option Grant Agreement with key employees and contracted employees at band level 6-9 pursuant to which stock option awards are granted under the Tyson Foods, Inc. 2000 Stock Incentive Plan effective November 29, 2010 (previously filed as Exhibit 10.42 to the Company's Annual Report on Form 10-K for the fiscal year ended October 1, 2011, Commission File No. 001-14704, and incorporated herein by reference).
|
|
|
|
||
|
10.45
|
Form of Stock Option Grant Agreement with non-contracted employees pursuant to which stock option awards are granted under the Tyson Foods, Inc. 2000 Stock Incentive Plan effective November 28, 2011 (previously filed as Exhibit 10.46 to the Company's Annual Report on Form 10-K for the fiscal year ended September 29, 2012, Commission File No. 001-14704, and incorporated herein by reference).
|
|
|
|
||
|
10.46
|
Form of Stock Option Grant Agreement with contracted employees at band level 1-5 pursuant to which stock option awards are granted under the Tyson Foods, Inc. 2000 Stock Incentive Plan effective November 28, 2011 (previously filed as Exhibit 10.47 to the Company's Annual Report on Form 10-K for the fiscal year ended September 29, 2012, Commission File No. 001-14704, and incorporated herein by reference).
|
|
|
|
||
|
10.47
|
Form of Stock Option Grant Agreement with key employees and contracted employees at band level 6-9 pursuant to which stock option awards are granted under the Tyson Foods, Inc. 2000 Stock Incentive Plan effective November 28, 2011 (previously filed as Exhibit 10.48 to the Company's Annual Report on Form 10-K for the fiscal year ended September 29, 2012, Commission File No. 001-14704, and incorporated herein by reference).
|
|
|
|
||
|
10.48
|
Form of Stock Incentive Agreement pursuant to which stock options are granted to contracted employees under the Tyson Foods, Inc. 2000 Stock Incentive Plan effective October 26, 2012 (previously filed as Exhibit 10.49 to the Company's Annual Report on Form 10-K for the fiscal year ended September 29, 2012, Commission File No. 001-14704, and incorporated herein by reference).
|
|
|
|
||
|
10.49
|
Form of Stock Incentive Agreement pursuant to which stock options are granted to non-contracted employees under the Tyson Foods, Inc. 2000 Stock Incentive Plan effective October 26, 2012 (previously filed as Exhibit 10.50 to the Company's Annual Report on Form 10-K for the fiscal year ended September 29, 2012, Commission File No. 001-14704, and incorporated herein by reference).
|
|
|
|
||
|
10.50
|
Form of Performance Stock Award Agreement pursuant to which performance stock awards are granted under the Tyson Foods, Inc. 2000 Stock Incentive Plan effective October 4, 2010 (previously filed as Exhibit 10.44 to the Company's Annual Report on Form 10-K for the fiscal year ended October 1, 2011, Commission File No. 001-14704, and incorporated herein by reference).
|
|
|
|
||
|
10.51
|
Form of Performance Stock Award Agreement pursuant to which performance stock awards are granted under the Tyson Foods, Inc. 2000 Stock Incentive Plan effective October 3, 2011 (previously filed as Exhibit 10.52 to the Company's Annual Report on Form 10-K for the fiscal year ended September 29, 2012, Commission File No. 001-14704, and incorporated herein by reference).
|
|
|
|
||
|
10.52
|
Form of Stock Incentive Agreement pursuant to which performance stock awards are granted under the Tyson Foods, Inc. 2000 Stock Incentive Plan effective October 26, 2012 (previously filed as Exhibit 10.53 to the Company's Annual Report on Form 10-K for the fiscal year ended September 29, 2012, Commission File No. 001-14704, and incorporated herein by reference).
|
|
|
|
||
|
10.53
|
Tyson Foods, Inc. Severance Pay Plan for Contracted Employees, effective October 31, 2012 (previously filed as Exhibit 10.54 to the Company's Annual Report on Form 10-K for the fiscal year ended September 29, 2012, Commission File No. 001-14704, and incorporated herein by reference).
|
|
|
12.1
|
Calculation of Ratio of Earnings to Fixed Charges.
|
|
|
14.1
|
Code of Conduct of the Company.
|
|
|
21
|
Subsidiaries of the Company.
|
|
|
23
|
Consent of PricewaterhouseCoopers, LLP.
|
|
|
31.1
|
Certification of Chief Executive Officer pursuant to SEC Rule 13a-14(a)/15d-14(a), as adopted pursuant to Section 302 of the Sarbanes-Oxley Act of 2002.
|
|
|
31.2
|
Certification of Chief Financial Officer pursuant to SEC Rule 13a-14(a)/15d-14(a), as adopted pursuant to Section 302 of the Sarbanes-Oxley Act of 2002.
|
|
|
32.1
|
Certification of Chief Executive Officer pursuant to 18 U.S.C. Section 1350, as adopted pursuant to Section 906 of the Sarbanes-Oxley Act of 2002.
|
|
|
32.2
|
Certification of Chief Financial Officer pursuant to 18 U.S.C. Section 1350, as adopted pursuant to Section 906 of the Sarbanes-Oxley Act of 2002.
|
|
88
|
101
|
The following financial information from our Annual Report on Form 10-K for the year ended September 28, 2013, formatted in XBRL (eXtensible Business Reporting Language): (i) Consolidated Statements of Income, (ii) Consolidated Statements of Comprehensive Income, (iii) Consolidated Balance Sheets, (iv) Consolidated Statements of Shareholders' Equity, (v) Consolidated Statements of Cash Flows, (vi) the Notes to Consolidated Financial Statements, and (vii) Financial Statement Schedule.
|
|
89
SIGNATURES
Pursuant to requirements of Section 13 or 15(d) of the Securities Exchange Act of 1934, the registrant has duly caused this report to be signed on its behalf by the undersigned, thereunto duly authorized.
|
TYSON FOODS, INC.
|
||||
|
By:
|
/s/ Dennis Leatherby
|
November 18, 2013
|
||
|
Dennis Leatherby
|
||||
|
Executive Vice President and Chief
Financial Officer
|
||||
90
Pursuant to the requirements of the Securities Exchange Act of 1934, this report has been signed below by the following persons on behalf of the registrant and in the capacities and on the date indicated.
|
/s/ Kathleen M. Bader
|
Director
|
November 18, 2013
|
||
|
Kathleen M. Bader
|
||||
|
/s/ Guardie E. Banister Jr.
|
Director
|
November 18, 2013
|
||
|
Gaurdie E. Banister Jr.
|
||||
|
/s/ Curt T. Calaway
|
Senior Vice President, Controller and
|
November 18, 2013
|
||
|
Curt T. Calaway
|
Chief Accounting Officer
|
|||
|
/s/ Jim Kever
|
Director
|
November 18, 2013
|
||
|
Jim Kever
|
||||
|
/s/ Dennis Leatherby
|
Executive Vice President and Chief Financial Officer
|
November 18, 2013
|
||
|
Dennis Leatherby
|
||||
|
/s/ Kevin M. McNamara
|
Director
|
November 18, 2013
|
||
|
Kevin M. McNamara
|
||||
|
/s/ Brad T. Sauer
|
Director
|
November 18, 2013
|
||
|
Brad T. Sauer
|
||||
|
/s/ Donnie Smith
|
President and Chief Executive Officer
|
November 18, 2013
|
||
|
Donnie Smith
|
||||
|
/s/ Robert C. Thurber
|
Director
|
November 18, 2013
|
||
|
Robert C. Thurber
|
||||
|
/s/ Barbara A. Tyson
|
Director
|
November 18, 2013
|
||
|
Barbara A. Tyson
|
||||
|
/s/ John Tyson
|
Chairman of the Board of Directors
|
November 18, 2013
|
||
|
John Tyson
|
||||
|
/s/ Albert C. Zapanta
|
Director
|
November 18, 2013
|
||
|
Albert C. Zapanta
|
||||
91
FINANCIAL STATEMENT SCHEDULE
TYSON FOODS, INC.
SCHEDULE II
VALUATION AND QUALIFYING ACCOUNTS
Three Years Ended
September 28, 2013
|
in millions
|
|
|||||||||||||||||||
|
Additions
|
||||||||||||||||||||
|
Balance at
Beginning
of Period
|
|
Charged to
Costs and
Expenses
|
|
Charged to
Other Accounts
|
|
(Deductions)
|
|
Balance at End
of Period
|
|
|||||||||||
|
Allowance for Doubtful Accounts:
|
||||||||||||||||||||
|
2013
|
$
|
33
|
|
$
|
17
|
|
$
|
—
|
|
$
|
(4
|
)
|
$
|
46
|
|
|||||
|
2012
|
31
|
|
7
|
|
—
|
|
(5
|
)
|
33
|
|
||||||||||
|
2011
|
32
|
|
3
|
|
—
|
|
(4
|
)
|
31
|
|
||||||||||
|
Inventory Lower of Cost or Market Allowance:
|
||||||||||||||||||||
|
2013
|
$
|
24
|
|
$
|
49
|
|
$
|
—
|
|
$
|
(57
|
)
|
$
|
16
|
|
|||||
|
2012
|
6
|
|
52
|
|
—
|
|
(34
|
)
|
24
|
|
||||||||||
|
2011
|
2
|
|
12
|
|
—
|
|
(8
|
)
|
6
|
|
||||||||||
|
Valuation Allowance on Deferred Tax Assets:
|
||||||||||||||||||||
|
2013
|
$
|
78
|
|
$
|
8
|
|
$
|
—
|
|
$
|
(9
|
)
|
$
|
77
|
|
|||||
|
2012
|
92
|
|
16
|
|
—
|
|
(30
|
)
|
78
|
|
||||||||||
|
2011
|
96
|
|
16
|
|
—
|
|
(20
|
)
|
92
|
|
||||||||||
92
TABLE OF CONTENTS
Part IItem 1. BusinessItem 1A. Risk FactorsItem 1B. Unresolved Staff CommentsItem 2. PropertiesItem 3. Legal ProceedingsItem 4. Mine Safety DisclosuresPart IIItem 5. Market For Registrant S Common Equity, Related Stockholder Matters and Issuer Purchases Of Equity SecuritiesItem 6. Selected Financial DataItem 7. Management S Discussion and Analysis Of Financial Condition and Results Of OperationsItem 7A. Quantitative and Qualitative Disclosures About Market RiskItem 8. Financial Statements and Supplementary DataNote 1: Business and Summary Of Significant Accounting PoliciesNote 2: Changes in Accounting PrinciplesNote 3: AcquisitionsNote 4: Discontinued OperationNote 5: Property, Plant and EquipmentNote 6: Goodwill and Other Intangible AssetsNote 7: Other Current LiabilitiesNote 8: DebtNote 9: Income TaxesNote 10: Other Income and ChargesNote 11: Earnings Per ShareNote 12: Derivative Financial InstrumentsNote 13: Fair Value MeasurementsNote 14: Stock-based CompensationNote 15: Pensions and Other Postretirement BenefitsNote 16: Comprehensive Income (loss)Note 17: Segment ReportingNote 18: Supplemental Cash Flows InformationNote 19: Transactions with Related PartiesNote 20: Commitments and ContingenciesNote 21: Quarterly Financial Data (unaudited)Note 22: Condensed Consolidating Financial StatementsItem 9. Changes in and Disagreements with Accountants on Accounting and Financial DisclosureItem 9A. Controls and ProceduresItem 9B. Other InformationPart IIIItem 10. Directors, Executive Officers and Corporate GovernanceItem 11. Executive CompensationItem 12. Security Ownership Of Certain Beneficial Owners and Management and Related Stockholder MattersItem 13. Certain Relationships and Related Transactions, and Director IndependenceItem 14. Principal Accounting Fees and ServicesPart IVItem 15. Exhibits, Financial Statement Schedules