TYSON FOODS, INC.
10-Ks and 10-Qs
|
|
|
|
|
|
|
|
|
|
|
|
|
|
|
|
|
|
|
|
|
|
|
|
|
|
|
|
|
|
|
|
|
|
|
|
|
|
|
|
|
|
|
|
|
|
|
|
|
|
|
|
|
UNITED STATES
SECURITIES AND EXCHANGE COMMISSION
Washington, D.C. 20549
FORM 10-K
|
[X]
|
Annual Report Pursuant to Section 13 or 15(d) of the Securities Exchange Act of 1934
|
|
|
For the fiscal year ended
|
October 1, 2016
|
|
|
[ ]
|
Transition Report Pursuant to Section 13 or 15(d) of the Securities Exchange Act of 1934
|
|
|
For the transition period from
to
|
||

001-14704
(Commission File Number)
______________________________________________
TYSON FOODS, INC.
(Exact name of registrant as specified in its charter)
______________________________________________
|
Delaware
|
|
71-0225165
|
|
(State or other jurisdiction of
incorporation or organization)
|
|
(I.R.S. Employer Identification No.)
|
|
2200 West Don Tyson Parkway, Springdale, Arkansas
|
|
72762-6999
|
|
(Address of principal executive offices)
|
|
(Zip Code)
|
|
Registrant’s telephone number, including area code:
|
|
(479) 290-4000
|
Securities Registered Pursuant to Section 12(b) of the Act:
|
Title of Each Class
|
|
Name of Each Exchange on Which Registered
|
|
Class A Common Stock, Par Value $0.10
|
|
New York Stock Exchange
|
Securities Registered Pursuant to Section 12(g) of the Act: Not Applicable
Indicate by check mark if the registrant is a well-known seasoned issuer, as defined in Rule 405 of the Securities Act. Yes [ ] No [
X
]
Indicate by check mark if the registrant is not required to file reports pursuant to Section 13 or Section 15(d) of the Act. Yes [ ] No
[X]
Indicate by check mark whether the registrant (1) has filed all reports required to be filed by Section 13 or 15(d) of the Securities Exchange Act of 1934 during the preceding 12 months (or for such shorter period that the registrant was required to file such reports), and (2) has been subject to such filing requirements for the past 90 days. Yes
[X]
No [ ]
Indicate by check mark whether the registrant has submitted electronically and posted on its corporate web site, if any, every Interactive Data File required to be submitted and posted pursuant to Rule 405 of Regulation S-T (§232.405 of this chapter) during the preceding 12 months (or for such shorter period that the registrant was required to submit and post such files). Yes
[X]
No [ ]
Indicate by check mark if disclosure of delinquent filers pursuant to Item 405 of Regulation S-K (§229.405 of this chapter) is not contained herein, and will not be contained, to the best of registrant’s knowledge, in definitive proxy or information statements incorporated by reference in Part III of this Form 10-K or any amendment to this Form 10-K. []
Indicate by check mark whether the registrant is a large accelerated filer, an accelerated filer, a non-accelerated filer, or a smaller reporting company. See definitions of “large accelerated filer,” “accelerated filer” and “smaller reporting company” in Rule 12b-2 of the Exchange Act.
|
Large accelerated filer [
X
]
|
Accelerated filer [ ]
|
|
|
Non-accelerated filer [ ] (Do not check if a smaller reporting company)
|
Smaller reporting company [ ]
|
|
Indicate by check mark whether the registrant is a shell company (as defined in Rule 12b-2 of the Exchange Act). Yes [ ] No
[X]
On
April 2, 2016
, the aggregate market value of the registrant’s Class A Common Stock, $0.10 par value (Class A stock), and Class B Common Stock, $0.10 par value (Class B stock), held by non-affiliates of the registrant was
$20,012,635,241
and
$732,308
, respectively. Class B stock is not publicly listed for trade on any exchange or market system. However, Class B stock is convertible into Class A stock on a share-for-share basis, so the market value was calculated based on the market price of Class A stock.
On
October 29, 2016
, there were
290,558,412
shares of Class A stock and
70,010,755
shares of Class B stock outstanding.
INCORPORATION BY REFERENCE
Portions of the registrant’s definitive Proxy Statement for the registrant’s Annual Meeting of Shareholders to be held
February 9, 2017
, are incorporated by reference into Part III of this Annual Report on Form 10-K.
|
TABLE OF CONTENTS
|
||
|
PAGE
|
||
|
Item 1.
|
||
|
Item 1A.
|
||
|
Item 1B.
|
||
|
Item 2.
|
||
|
Item 3.
|
||
|
Item 4.
|
||
|
Item 5.
|
||
|
Item 6.
|
||
|
Item 7.
|
||
|
Item 7A.
|
||
|
Item 8.
|
||
|
Item 9.
|
||
|
Item 9A.
|
||
|
Item 9B.
|
||
|
Item 10.
|
||
|
Item 11.
|
||
|
Item 12.
|
||
|
Item 13.
|
||
|
Item 14.
|
||
|
Item 15.
|
||
1
GENERAL
Founded in 1935, Tyson Foods, Inc. and its subsidiaries (collectively, “Company,” “we,” “us” or “our”) is one of the world's largest food companies with leading brands such as Tyson®, Jimmy Dean®, Hillshire Farm®, Sara Lee®, Ball Park®, Wright®, Aidells® and State Fair®. We are a recognized market leader in chicken, beef and pork as well as prepared foods, including bacon, breakfast sausage, turkey, lunchmeat, hot dogs, pizza crusts and toppings, tortillas and desserts. Our operations are conducted in four reportable segments: Chicken, Beef, Pork and Prepared Foods. Some of the key factors influencing our business are customer demand for our products; the ability to maintain and grow relationships with customers and introduce new and innovative products to the marketplace; accessibility of international markets; market prices for our products; the cost and availability of live cattle and hogs, raw materials, grain and feed ingredients; and operating efficiencies of our facilities.
We operate a fully vertically integrated chicken production process. Our integrated operations consist of breeding stock, contract growers, feed production, processing, further-processing, marketing and transportation of chicken and related allied products, including animal and pet food ingredients. Through our wholly-owned subsidiary, Cobb-Vantress, Inc., we are one of the leading poultry breeding stock suppliers in the world. Investing in breeding stock research and development allows us to breed into our flocks the characteristics found to be most desirable.
We also process live fed cattle and hogs and fabricate dressed beef and pork carcasses into primal and sub-primal meat cuts, case ready beef and pork and fully-cooked meats. In addition, we derive value from allied products such as hides and variety meats sold to further processors and others.
We produce a wide range of fresh, value-added, frozen and refrigerated food products. Our products are marketed and sold primarily by our sales staff to grocery retailers, grocery wholesalers, meat distributors, warehouse club stores, military commissaries, industrial food processing companies, chain restaurants or their distributors, live markets, international export companies and domestic distributors who serve restaurants, foodservice operations such as plant and school cafeterias, convenience stores, hospitals and other vendors. Additionally, sales to the military and a portion of sales to international markets are made through independent brokers and trading companies.
On August 28, 2014, we acquired and consolidated The Hillshire Brands Company ("Hillshire Brands"), a manufacturer and marketer of branded, convenient foods. Hillshire Brands' results of operations are included in the Prepared Foods segment. For further description of this transaction, refer to Part II, Item 8, Notes to Consolidated Financial Statements, Note 3: Acquisitions and Dispositions.
FINANCIAL INFORMATION OF SEGMENTS
We operate in four reportable segments: Chicken, Beef, Pork and Prepared Foods. Other primarily includes our foreign chicken production operations in China and India and third-party merger and integration costs. The contribution of each segment to net sales and operating income (loss), and the identifiable assets attributable to each segment, are set forth in Part II, Item 8, Notes to Consolidated Financial Statements, Note 16: Segment Reporting.
DESCRIPTION OF SEGMENTS
Chicken:
Chicken includes our domestic operations related to raising and processing live chickens into, and purchasing raw materials for, fresh, frozen and value-added chicken products, as well as sales from allied products. Products are marketed domestically to food retailers, foodservice distributors, restaurant operators, hotel chains and noncommercial foodservice establishments such as schools, healthcare facilities, the military and other food processors, as well as to international export markets. This segment also includes logistics operations to move products through our domestic supply chain and the global operations of our chicken breeding stock subsidiary.
Beef:
Beef includes our operations related to processing live fed cattle and fabricating dressed beef carcasses into primal and sub-primal meat cuts and case-ready products. Products are marketed domestically to food retailers, foodservice distributors, restaurant operators, hotel chains and noncommercial foodservice establishments such as schools, healthcare facilities, the military and other food processors, as well as to international export markets. This segment also includes sales from allied products such as hides and variety meats, as well as logistics operations to move products through the supply chain.
2
Pork:
Pork includes our operations related to processing live market hogs and fabricating pork carcasses into primal and sub-primal cuts and case-ready products. Products are marketed domestically to food retailers, foodservice distributors, restaurant operators, hotel chains and noncommercial foodservice establishments such as schools, healthcare facilities, the military and other food processors, as well as to international export markets. This segment also includes our live swine group, related allied product processing activities and logistics operations to move products through the supply chain.
Prepared Foods:
Prepared Foods includes our operations related to manufacturing and marketing frozen and refrigerated food products and logistics operations to move products through the supply chain. This segment includes brands such as Jimmy Dean®, Hillshire Farm®, Ball Park®, Wright®, State Fair®, Van's®, Sara Lee® and Chef Pierre®, as well as artisanal brands Aidells®, Gallo Salame®, and Golden Island®. Products primarily include pepperoni, bacon, breakfast sausage, turkey, lunchmeat, hot dogs, pizza crusts and toppings, flour and corn tortilla products, desserts, appetizers, snacks, prepared meals, ethnic foods, soups, sauces, side dishes, meat dishes, breadsticks and processed meats. Products are marketed domestically to food retailers, foodservice distributors, restaurant operators, hotel chains and noncommercial foodservice establishments such as schools, healthcare facilities, the military and other food processors, as well as to international export markets.
RAW MATERIALS AND SOURCES OF SUPPLY
Chicken:
The primary raw materials used in our domestic chicken operations are corn and soybean meal used as feed and live chickens raised primarily by independent contract growers. Our vertically-integrated chicken process begins with the grandparent breeder flocks and ends with broilers for processing. Breeder flocks (i.e., grandparents) are raised to maturity in grandparent growing and laying farms where fertile eggs are produced. Fertile eggs are incubated at the grandparent hatchery and produce pullets (i.e., parents). Pullets are sent to breeder houses, and the resulting eggs are sent to our hatcheries. Once chicks have hatched, they are sent to broiler farms. There, contract growers care for and raise the chicks according to our standards, with advice from our technical service personnel, until the broilers reach the desired processing weight. Adult chickens are transported to processing plants where they are slaughtered and converted into finished products, which are then sent to distribution centers and delivered to customers.
We operate feed mills to produce scientifically-formulated feeds. In fiscal
2016
, corn, soybean meal and other feed ingredients were major production costs, representing roughly
57%
of our cost of growing a live chicken domestically. In addition to feed ingredients to grow the chickens, we use cooking ingredients, packaging materials and cryogenic agents. We believe our sources of supply for these materials are adequate for our present needs, and we do not anticipate any difficulty in acquiring these materials in the future. While we produce nearly all our inventory of breeder chickens and live broilers, we also purchase ice-packed or deboned chicken to meet production and sales requirements.
Beef:
The primary raw materials used in our beef operations are live cattle. We do not have facilities of our own to raise cattle but employ cattle buyers located throughout cattle producing areas who visit independent feed yards and public auctions and buy live cattle on the open spot market. These buyers are trained to select high quality animals, and we continually measure their performance. We also enter into various risk-sharing and procurement arrangements with producers to secure a supply of livestock for our facilities. Although we generally expect adequate supply of live cattle in the regions we operate, there may be periods of imbalance in supply and demand.
Pork:
The primary raw materials used in our pork operations are live hogs. The majority of our live hog supply is obtained through various procurement relationships with independent producers. We employ hog buyers who make purchase agreements of various time durations as well as purchase hogs on a daily basis, generally a few days before the animals are processed. These buyers are trained to select high quality animals, and we continually measure their performance. We believe the supply of live hogs is adequate for our present needs. Additionally, we raise a small number of weanling swine to sell to independent finishers and supply a minimal amount of market hogs and live swine for our own processing needs.
Prepared Foods:
The primary raw materials used in our prepared foods operations are commodity based raw materials, including chicken, beef, pork, turkey, corn, flour, vegetables and other cooking ingredients. Some of these raw materials are provided by our other segments, while others may be purchased from numerous suppliers and manufacturers. We believe the sources of supply of raw materials are adequate for our present needs.
SEASONAL DEMAND
Demand for chicken, beef, and certain prepared foods products, such as hot dogs and smoked sausage, generally increases during the spring and summer months and generally decreases during the winter months. Pork and certain other prepared foods products, such as prepared meals, meat dishes, appetizers, frozen pies and breakfast sausage, generally experience increased demand during the winter months, primarily due to the holiday season, while demand generally decreases during the spring and summer months.
3
CUSTOMERS
Wal-Mart Stores, Inc. accounted for
17.5%
of our fiscal
2016
consolidated sales. Sales to Wal-Mart Stores, Inc. were included in all of our segments. Any extended discontinuance of sales to this customer could, if not replaced, have a material impact on our operations. No other single customer or customer group represented more than 10% of fiscal
2016
consolidated sales.
COMPETITION
Our food products compete with those of other food producers and processors and certain prepared food manufacturers. Additionally, our food products compete in markets around the world.
We seek to achieve a leading market position for our products via our principal marketing and competitive strategy, which includes:
|
•
|
identifying target markets for value-added products;
|
|
•
|
concentrating production, sales and marketing efforts to appeal to and enhance demand from those markets; and
|
|
•
|
utilizing our national distribution systems and customer support services.
|
Past efforts indicate customer demand can be increased and sustained through application of our marketing strategy, as supported by our distribution systems. The principal competitive elements are price, product safety and quality, brand identification, innovation, breadth and depth of product offerings, availability of products, customer service and credit terms.
FOREIGN OPERATIONS
We sold products in approximately
115
countries in fiscal
2016
. Major sales markets include Canada, Central America, China, the European Union, Japan, Mexico, the Middle East, South Korea and Taiwan.
We have the following foreign operations:
|
•
|
Cobb-Vantress, a chicken breeding stock subsidiary, has business interests in Argentina, Brazil, China, the Dominican Republic, India, Japan, the Netherlands, New Zealand, the Philippines, Russia, Spain, Turkey, the United Kingdom and Venezuela.
|
|
•
|
Tyson Rizhao, located in Rizhao, China, is a vertically-integrated chicken production operation.
|
|
•
|
Tyson Dalong, a joint venture in China in which we have a majority interest, is a chicken further-processing facility.
|
|
•
|
Tyson Nantong, located in Nantong, China, is a vertically-integrated chicken production operation.
|
|
•
|
Godrej Tyson Foods, a joint venture in India in which we have a majority interest, is primarily a chicken processing business.
|
|
•
|
Tyson Mexico Trading Company, a Mexican subsidiary, sells chicken products primarily through co-packer arrangements.
|
We continue to evaluate growth opportunities in foreign countries. Additional information regarding export sales and long-lived assets located in foreign countries is set forth in Part II, Item 8, Notes to Consolidated Financial Statements, Note 16: Segment Reporting.
RESEARCH AND DEVELOPMENT
We conduct continuous research and development activities to improve product development, to automate manual processes in our processing plants and growout operations, and to improve chicken breeding stock. With regards to our food products we have two research and development locations, our Discovery Center in Springdale, Arkansas, and another center located in Downers Grove, Illinois. The centers include over 80,000 square feet of United States Department of Agriculture (USDA) pilot plant space, two consumer sensory and focus group areas, a packaging lab and 25 research kitchens. The centers enable us to bring new market-leading retail and foodservice products to the customer quickly and efficiently. Research and development costs totaled
$96 million
,
$75 million
, and
$52 million
in fiscal
2016
,
2015
and
2014
, respectively.
ENVIRONMENTAL REGULATION AND FOOD SAFETY
Our facilities for processing chicken, beef, pork, turkey and prepared foods, milling feed and housing live chickens and swine are subject to a variety of international, federal, state and local environmental laws and regulations, which include provisions relating to the discharge of materials into the environment and generally provide for protection of the environment. We believe we are in substantial compliance with such applicable laws and regulations and are not aware of any violations of such laws and regulations likely to result in material penalties or material increases in compliance costs. The cost of compliance with such laws and regulations has not had a material adverse effect on our capital expenditures, earnings or competitive position, and except as described below, is not anticipated to have a material adverse effect in the future.
Congress, the United States Environmental Protection Agency and some states continue to consider various options to control greenhouse gas emissions. It is unclear at this time what options, if any, will be finalized, and whether such options would have a direct impact on the Company. Due to continuing uncertainty surrounding this issue, it is premature to speculate on the specific nature of impacts that imposition of greenhouse gas emission controls would have on us and whether such impacts would have a material adverse effect.
4
We work to ensure our products meet high standards of food safety and quality. In addition to our own internal Food Safety and Quality Assurance oversight and review, our chicken, beef, pork and prepared foods products are subject to inspection prior to distribution, primarily by the USDA and the United States Food and Drug Administration. We are also participants in the United States Hazard Analysis Critical Control Point program and are subject to the Sanitation Standard Operating Procedures and the Public Health Security and Bioterrorism Preparedness and Response Act of 2002. Additionally, our foreign operations are subject to various other food safety and quality assurance oversight and review.
EMPLOYEES AND LABOR RELATIONS
As of
October 1, 2016
, we employed approximately
114,000
employees. Approximately
108,000
employees were employed in the United States and
6,000
employees were employed in foreign countries, primarily in China. Approximately
29,000
employees in the United States were subject to collective bargaining agreements with various labor unions, with approximately
43%
of those employees at locations either under negotiation for contract renewal or included under agreements expiring in fiscal
2017
. The remaining agreements expire over the next several years. Approximately
4,000
employees in foreign countries were subject to collective bargaining agreements. We believe our overall relations with our workforce are good.
MARKETING AND DISTRIBUTION
Our principal marketing objective is to be the preferred provider of chicken, beef, pork and prepared foods products for our customers and consumers. We build the Tyson®, Jimmy Dean®, Hillshire Farm®, Sara Lee®, Ball Park®, Wright®, Aidells® and State Fair® brands while supporting strong regional and emerging brands primarily through well-defined, product-specific advertising, marketing, and public relations efforts focused toward key consumer targets with specific needs. We identify growth and business opportunities through consumer and customer insights derived via leading research and analytic capabilities. We utilize our national distribution system and customer support services to achieve the leading market position for our products and brands.
We have the ability to produce and ship fresh, frozen and refrigerated products worldwide. Domestically, our distribution system extends to a broad network of food distributors and is supported by our owned or leased cold storage warehouses, public cold storage facilities and our transportation system. Our distribution centers accumulate fresh and frozen products so we can fill and consolidate partial-truckload orders into full truckloads, thereby decreasing shipping costs while increasing customer service. In addition, we provide our customers a wide selection of products that do not require large volume orders. Our distribution system enables us to supply large or small quantities of products to meet customer requirements anywhere in the continental United States. Internationally, we utilize both rail and truck refrigerated transportation to domestic ports, where consolidations take place to transport to foreign destinations.
PATENTS AND TRADEMARKS
We have filed a number of patents relating to our processes and products that either have been approved or are in the process of review. Because we do a significant amount of brand name and product line advertising to promote our products, we consider the protection of our trademarks to be important to our marketing efforts and have registered and applied for the registration of a number of trademarks. We also have developed non-public proprietary information regarding our production processes and other product-related matters. We utilize internal procedures and safeguards to protect the confidentiality of such information and, where appropriate, seek patent and/or other protection for the technology we utilize.
INDUSTRY PRACTICES
Our agreements with customers are generally short-term, primarily due to the nature of our products, industry practices and fluctuations in supply, demand and price for such products. In certain instances where we are selling further processed products to large customers, we may enter into written agreements whereby we will act as the exclusive or preferred supplier to the customer, with pricing terms that are either fixed or variable.
AVAILABILITY OF SEC FILINGS AND CORPORATE GOVERNANCE DOCUMENTS ON INTERNET WEBSITE
We maintain an internet website for investors at http://ir.tyson.com. On this website, we make available, free of charge, annual reports on Form 10-K, quarterly reports on Form 10-Q, current reports on Form 8-K, XBRL (eXtensible Business Reporting Language) reports, and all amendments to any of those reports, as soon as reasonably practicable after we electronically file such reports with, or furnish to, the Securities and Exchange Commission. Also available on the website for investors are the Corporate Governance Principles, Audit Committee charter, Compensation and Leadership Development Committee charter, Governance and Nominating Committee charter, Strategy and Acquisitions Committee charter, Code of Conduct and Whistleblower Policy. Our corporate governance documents are available in print, free of charge to any shareholder who requests them.
5
CAUTIONARY STATEMENTS RELEVANT TO FORWARD-LOOKING INFORMATION FOR THE PURPOSE OF “SAFE HARBOR” PROVISIONS OF THE PRIVATE SECURITIES LITIGATION REFORM ACT OF 1995
Certain information in this report constitutes forward-looking statements. Such forward-looking statements include, but are not limited to, current views and estimates of our outlook for fiscal 2017, other future economic circumstances, industry conditions in domestic and international markets, our performance and financial results (e.g., debt levels, return on invested capital, value-added product growth, capital expenditures, tax rates, access to foreign markets and dividend policy). These forward-looking statements are subject to a number of factors and uncertainties that could cause our actual results and experiences to differ materially from anticipated results and expectations expressed in such forward-looking statements. We wish to caution readers not to place undue reliance on any forward-looking statements, which speak only as of the date made. We undertake no obligation to update any forward-looking statements, whether as a result of new information, future events or otherwise.
Among the factors that may cause actual results and experiences to differ from anticipated results and expectations expressed in such forward-looking statements are the following: (i) the effect of, or changes in, general economic conditions; (ii) fluctuations in the cost and availability of inputs and raw materials, such as live cattle, live swine, feed grains (including corn and soybean meal) and energy; (iii) market conditions for finished products, including competition from other global and domestic food processors, supply and pricing of competing products and alternative proteins and demand for alternative proteins; (iv) successful rationalization of existing facilities and operating efficiencies of the facilities; (v) risks associated with our commodity purchasing activities; (vi) access to foreign markets together with foreign economic conditions, including currency fluctuations, import/export restrictions and foreign politics; (vii) outbreak of a livestock disease (such as avian influenza (AI) or bovine spongiform encephalopathy (BSE)), which could have an adverse effect on livestock we own, the availability of livestock we purchase, consumer perception of certain protein products or our ability to access certain domestic and foreign markets; (viii) changes in availability and relative costs of labor and contract growers and our ability to maintain good relationships with employees, labor unions, contract growers and independent producers providing us livestock; (ix) issues related to food safety, including costs resulting from product recalls, regulatory compliance and any related claims or litigation; (x) changes in consumer preference and diets and our ability to identify and react to consumer trends; (xi) significant marketing plan changes by large customers or loss of one or more large customers; (xii) adverse results from litigation; (xiii) impacts on our operations caused by factors and forces beyond our control, such as natural disasters, fire, bioterrorism, pandemics or extreme weather; (xiv) risks associated with leverage, including cost increases due to rising interest rates or changes in debt ratings or outlook; (xv) compliance with and changes to regulations and laws (both domestic and foreign), including changes in accounting standards, tax laws, environmental laws, agricultural laws and occupational, health and safety laws; (xvi) our ability to make effective acquisitions or joint ventures and successfully integrate newly acquired businesses into existing operations; (xvii) cyber incidents, security breaches or other disruptions of our information technology systems; (xviii) effectiveness of advertising and marketing programs; and (xix) those factors listed under Item 1A. “Risk Factors.”
These risks, which should be considered carefully with the information provided elsewhere in this report, could materially adversely affect our business, financial condition or results of operations. Additional risks and uncertainties not currently known to us or that we currently deem to be immaterial also may materially adversely affect our business, financial condition or results of operations.
The integration of The Hillshire Brands Company may be more difficult, costly or time consuming than expected, and the acquisition may not result in any or all of the anticipated benefits, including cost synergies
.
The success of the acquisition of Hillshire Brands, including the realization of the anticipated benefits, will depend in part on our ability to successfully integrate Hillshire Brands’ businesses in an efficient and effective manner. We may not be able to accomplish this integration process smoothly or successfully. The necessity of coordinating geographically separated organizations, systems and facilities and addressing possible differences in business backgrounds, corporate cultures and management philosophies may increase the difficulties of integration. Failure to effectively integrate the businesses could adversely impact the expected benefits of the acquisition, including cost synergies stemming from supply chain efficiencies, merchandising activities and overlapping general and administrative functions.
The integration of two large companies is complex, and we will be required to devote significant management attention and incur substantial costs to integrate Hillshire Brands’ and Tyson’s business practices, policies, cultures and operations. This diversion of our management’s attention from day-to-day business operations and the execution and pursuit of strategic plans and initiatives could result in performance shortfalls, which could adversely impact the combined company’s business, operations and financial results. The integration process could also result in the loss of key employees, which could adversely impact the combined company’s future financial results.
Furthermore, during the integration planning process, we may encounter additional challenges and difficulties, including those related to, without limitation, managing a larger combined company; streamlining supply chains, consolidating corporate and administrative infrastructures and eliminating overlapping operations; retaining our existing vendors and customers; unanticipated issues in integrating information technology, communications and other systems; and unforeseen and unexpected liabilities related to the acquisition of Hillshire Brands’ business. Delays encountered in the integration could adversely impact the business, financial condition and operations of the combined company.
6
We continue to evaluate our estimates of synergies to be realized from the Hillshire Brands acquisition and refine them. Our actual cost savings could differ materially from our current estimates. Actual cost savings, the costs required to realize the cost savings and the source of the cost savings could differ materially from our estimates, and we cannot assure you that we will achieve the full amount of cost savings on the schedule anticipated or at all or that these cost savings programs will not have other adverse effects on our business. In light of these uncertainties, you should not place undue reliance on our estimated cost savings.
Finally, we may not be able to achieve the targeted operating or long-term strategic benefits of the Hillshire Brands acquisition or could incur higher transition costs. An inability to realize the full extent of, or any of, the anticipated benefits of the Hillshire Brands acquisition, as well as any delays encountered in the integration process, could have an adverse effect on our business, results of operations and financial condition.
Fluctuations in commodity prices and in the availability of raw materials, especially feed grains, live cattle, live swine and other inputs could negatively impact our earnings.
Our results of operations and financial condition, as well as the selling prices for our products, are dependent upon the cost and supply of commodities and raw materials such as pork, beef, poultry, corn, soybean, packaging materials and energy and, to a lesser extent, cheese, fruit, seasoning blends, flour, corn syrup, corn oils, butter and sugar. Corn, soybean meal and other feed ingredients, for instance, represented roughly
57%
of our cost of growing a live chicken in fiscal
2016
. Production and pricing of these commodities are determined by constantly changing market forces of supply and demand over which we have limited or no control. Such factors include, among other things, weather patterns throughout the world, outbreaks of disease, the global level of supply inventories and demand for grains and other feed ingredients, as well as agricultural and energy policies of domestic and foreign governments.
Volatility in our commodity and raw material costs directly impact our gross margin and profitability. The Company’s objective is to offset commodity price increases with pricing actions over time. However, we may not be able to increase our product prices enough to sufficiently offset increased raw material costs due to consumer price sensitivity or the pricing postures of our competitors. In addition, if we increase prices to offset higher costs, we could experience lower demand for our products and sales volumes. Conversely, decreases in our commodity and other input costs may create pressure on us to decrease our prices. While we use derivative financial instruments, primarily futures and options, to reduce the effect of changing prices and as a mechanism to procure the underlying commodity, we do not fully hedge against changes in commodities prices.
Over time, if we are unable to price our products to cover increased costs, to offset operating cost increases with continuous improvement savings or are not successful in our commodity hedging program, then commodity and raw material price volatility or increases could materially and adversely affect our profitability, financial condition and results of operations.
The prices we receive for our products may fluctuate due to competition from other food producers and processors.
The food industry in general is intensely competitive. We face competition from other food producers and processors that have various product ranges and geographic reach. Some of the factors on which we compete include: pricing, product safety and quality, brand identification, innovation, breadth and depth of product offerings, availability of our products and competing products, customer service, and credit terms.
From time to time in response to these competitive pressures or to maintain market share, we may need to reduce the prices for some of our products or increase or reallocate spending on marketing, advertising and promotions and new product innovation. Such pressures also may restrict our ability to increase prices in response to raw material and other cost increases. Any reduction in prices as a result of competitive pressures, or any failure to increase prices to offset cost increases, could harm our profit margins. If we reduce prices but we cannot increase sales volumes to offset the price changes, then our financial condition and results of operations will suffer. Alternatively, if we do not reduce our prices and our competitors seek advantage through pricing or promotional changes, our revenues and market share would be adversely affected.
Outbreaks of livestock diseases can adversely impact our ability to conduct our operations and demand for our products.
Demand for our products can be adversely impacted by outbreaks of livestock diseases, which can have a significant impact on our financial results. Efforts are taken to control disease risks by adherence to good production practices and extensive precautionary measures designed to ensure the health of livestock. However, outbreaks of disease and other events, which may be beyond our control, either in our own livestock or livestock owned by independent producers who sell livestock to us, could significantly affect demand for our products, consumer perceptions of certain protein products, the availability of livestock for purchase by us and our ability to conduct our operations. Moreover, the outbreak of livestock diseases, particularly in our Chicken segment, could have a significant effect on the livestock we own by requiring us to, among other things, destroy any affected livestock. Furthermore, an outbreak of disease could result in governmental restrictions on the import and export of our products to or from our suppliers, facilities or customers. This could also result in negative publicity that may have an adverse effect on our ability to market our products successfully and on our financial results.
7
We are subject to risks associated with our international activities, which could negatively affect our sales to customers in foreign countries, as well as our operations and assets in such countries.
In fiscal
2016
, we sold products to approximately
115
countries. Major sales markets include Canada, Central America, China, the European Union, Japan, Mexico, the Middle East, South Korea and Taiwan. Our sales to customers in foreign countries for fiscal
2016
totaled $4.1 billion, of which
$3.5 billion
related to export sales from the United States. In addition, we had approximately
$204 million
of long-lived assets located in foreign countries, primarily Brazil, China, and India, at the end of fiscal
2016
.
As a result, we are subject to various risks and uncertainties relating to international sales and operations, including:
|
•
|
imposition of tariffs, quotas, trade barriers and other trade protection measures imposed by foreign countries regarding the importation of poultry, beef, pork and prepared foods products, in addition to import or export licensing requirements imposed by various foreign countries;
|
|
•
|
closing of borders by foreign countries to the import of poultry, beef and pork products due to animal disease or other perceived health or safety issues;
|
|
•
|
impact of currency exchange rate fluctuations between the United States dollar and foreign currencies, particularly the Brazilian real, the British pound sterling, the Canadian dollar, the Chinese renminbi, the European euro, the Japanese yen and the Mexican peso;
|
|
•
|
political and economic conditions;
|
|
•
|
difficulties and costs to comply with, and enforcement of remedies under, a wide variety of complex domestic and international laws, treaties and regulations, including, without limitation, the United States Foreign Corrupt Practices Act and economic and trade sanctions enforced by the United States Department of the Treasury’s Office of Foreign Assets Control;
|
|
•
|
different regulatory structures and unexpected changes in regulatory environments;
|
|
•
|
tax rates that may exceed those in the United States and earnings that may be subject to withholding requirements and incremental taxes upon repatriation;
|
|
•
|
potentially negative consequences from changes in tax laws; and
|
|
•
|
distribution costs, disruptions in shipping or reduced availability of freight transportation.
|
Negative consequences relating to these risks and uncertainties could jeopardize or limit our ability to transact business in one or more of those markets where we operate or in other developing markets and could adversely affect our financial results.
We depend on the availability of, and good relations with, our employees.
We have approximately
114,000
employees, approximately
33,000
of whom are covered by collective bargaining agreements or are members of labor unions. Our operations depend on the availability and relative costs of labor and maintaining good relations with employees and the labor unions. If we fail to maintain good relations with our employees or with the labor unions, we may experience labor strikes or work stoppages, which could adversely affect our financial results.
If we are unable to attract, hire or retain key employees or a highly skilled and diverse global workforce, it could have a negative impact on our business, financial condition or results of operations.
Our continued growth requires us to attract, hire, retain and develop key employees, including our executive officers and senior management team, and maintain a highly skilled and diverse global workforce. We compete to attract and hire highly skilled employees and our own employees are highly sought after by our competitors and other companies. Competition could cause us to lose talented employees, and unplanned turnover could deplete our institutional knowledge and result in increased costs due to increased competition for employees.
We depend on contract growers and independent producers to supply us with livestock.
We contract primarily with independent contract growers to raise the live chickens and turkeys processed in our poultry operations. A majority of our cattle and hogs are purchased from independent producers who sell livestock to us under marketing contracts or on the open market. If we do not attract and maintain contracts with growers or maintain marketing and purchasing relationships with independent producers, our production operations could be negatively affected.
If our products become contaminated, we may be subject to product liability claims and product recalls.
Our products may be subject to contamination by disease-producing organisms or pathogens, such as Listeria monocytogenes, Salmonella and E. coli. These organisms and pathogens are found generally in the environment and there is a risk that one or more, as a result of food processing, could be present in our products. These organisms and pathogens also can be introduced to our products as a result of improper handling at the further-processing, foodservice or consumer level. These risks may be controlled, but may not be eliminated, by adherence to good manufacturing practices and finished product testing. We have little, if any, control over handling procedures once our products have been shipped for distribution. Even an inadvertent shipment of contaminated products may be a violation of law and may lead to increased risk of exposure to product liability claims, increased scrutiny and penalties, including injunctive relief and plant closings, by federal and state regulatory agencies, and adverse publicity, which could exacerbate the associated negative consumer reaction. Any of these occurrences may have an adverse effect on our financial results.
8
In addition, we may be required to recall some of our products if they spoil, become contaminated, are tampered with or are mislabeled. A widespread product recall could result in significant losses due to the costs of a recall, the destruction of product inventory and lost sales due to the unavailability of product for a period of time. Such a product recall also could result in adverse publicity, damage to our reputation, and a loss of consumer confidence in our products, which could have a material adverse effect on our business results and the value of our brands.
Changes in consumer preference and failure to maintain favorable consumer perception of our brands and products could negatively impact our business.
The food industry in general is subject to changing consumer trends, demands and preferences. Trends within the food industry change often, and failure to identify and react to changes in these trends could lead to, among other things, reduced demand and price reductions for our brands and products. We strive to respond to consumer preferences and social expectations, but we may not be successful in our efforts.
We could be adversely affected if consumers lose confidence in the safety and quality of certain food products or ingredients, or the food safety system generally. Prolonged negative perceptions concerning the health implications of certain food products or ingredients or loss of confidence in the food safety system generally could influence consumer preferences and acceptance of some of our products and marketing programs. Continued negative perceptions and failure to satisfy consumer preferences could materially and adversely affect our product sales, financial condition and results of operations.
We have a number of iconic brands with significant value. Maintaining and continually enhancing the value of these brands is critical to the success of our business. Brand value is based in large part on consumer perceptions. Success in promoting and enhancing brand value depends in large part on our ability to provide high-quality products. Brand value could diminish significantly due to a number of factors, including consumer perception that we have acted in an irresponsible manner, adverse publicity about our products (whether or not valid), our failure to maintain the quality of our products, the failure of our products to deliver consistently positive consumer experiences or the products becoming unavailable to consumers.
Failure to continually innovate and successfully launch new products and maintain our brand image through marketing investment could adversely impact our operating results.
Our financial success is dependent on anticipating changes in consumer preferences and dietary habits and successfully developing and launching new products and product extensions that consumers want. We devote significant resources to new product development and product extensions, however we may not be successful in developing innovative new products or our new products may not be commercially successful. To the extent we are not able to effectively gauge the direction of our key markets and successfully identify, develop, manufacture and market new or improved products in these changing markets, our financial results and our competitive position will suffer. In addition, our introduction of new products or product extensions may generate litigation or other legal proceedings against us by competitors claiming infringement of their intellectual property or other rights, which could negatively impact our results of operations.
We also seek to maintain and extend the image of our brands through marketing investments, including advertising, consumer promotions and trade spend. Due to inherent risks in the marketplace associated with advertising, promotions and new product introductions, including uncertainties about trade and consumer acceptance, our marketing investments may not prove successful in maintaining or increasing our market share and could result in lower sales and profits. Continuing global focus on health and wellness, including weight management, and increasing media attention to the role of food marketing could adversely affect our brand image or lead to stricter regulations and greater scrutiny of food marketing practices.
Our success in maintaining, extending and expanding our brand image also depends on our ability to adapt to a rapidly changing media environment, including our increasing reliance on social media and online dissemination of advertising campaigns. The growing use of social and digital media increases the speed and extent that information or misinformation and opinions can be shared. Negative posts or comments about us, our brands or our products on social or digital media could seriously damage our reputation and brand image.
We are subject to a variety of legal and regulatory restrictions on how and to whom we market our products, for instance marketing to children, which may limit our ability to maintain or extend our brand image. If we do not maintain or extend our brand image, then our product sales, financial condition and results of operations could be materially and adversely affected.
9
Failure to leverage our brand value propositions to compete against private label products, especially during economic downturn, may adversely affect our profitability.
In many product categories, we compete not only with other widely advertised branded products, but also with private label products that generally are sold at lower prices. Consumers are more likely to purchase our products if they believe that our products provide a higher quality and greater value than less expensive alternatives. If the difference in quality between our brands and private label products narrows, or if there is a perception of such a narrowing, consumers may choose not to buy our products at prices that are profitable for us. In addition, in periods of economic uncertainty, consumers tend to purchase more lower-priced private label or other economy brands. To the extent this occurs, we could experience a reduction in the sales volume of our higher margin products or a shift in our product mix to lower margin offerings. In addition, in times of economic uncertainty, consumers reduce the amount of food that they consume away from home at our foodservice customers, which in turn reduces our product sales.
Our level of indebtedness and the terms of our indebtedness could negatively impact our business and liquidity position.
Our indebtedness, including borrowings under our revolving credit facility, may increase from time to time for various reasons, including fluctuations in operating results, working capital needs, capital expenditures and possible acquisitions, joint ventures or other significant initiatives. Our consolidated indebtedness level could adversely affect our business because:
|
•
|
it may limit or impair our ability to obtain financing in the future;
|
|
•
|
our credit ratings (or any decrease to our credit ratings) could restrict or impede our ability to access capital markets at desired interest rates and increase our borrowing costs;
|
|
•
|
it may reduce our flexibility to respond to changing business and economic conditions or to take advantage of business opportunities that may arise;
|
|
•
|
a portion of our cash flow from operations must be dedicated to interest payments on our indebtedness and is not available for other purposes; and
|
|
•
|
it may restrict our ability to pay dividends.
|
Our revolving credit and term loan facilities contain affirmative and negative covenants that, among other things, may limit or restrict our ability to: create liens and encumbrances; incur debt; merge, dissolve, liquidate or consolidate; make acquisitions and investments; dispose of or transfer assets; change the nature of our business; engage in certain transactions with affiliates; and enter into hedging transactions, in each case, subject to certain qualifications and exceptions. In addition, we are required to maintain minimum interest expense coverage and maximum debt to capitalization ratios.
Our senior notes also contain affirmative and negative covenants that, among other things, may limit or restrict our ability to: create liens; engage in certain sale/leaseback transactions; and engage in certain consolidations, mergers and sales of assets.
An impairment in the carrying value of our goodwill or indefinite life intangible assets could negatively impact our consolidated results of operations and net worth.
Goodwill and indefinite life intangible assets are initially recorded at fair value and not amortized, but are reviewed for impairment at least annually or more frequently if impairment indicators arise. In assessing the carrying value of goodwill and indefinite life intangible assets, we make estimates and assumptions about sales, operating margins, growth rates, royalty rates and discount rates based on budgets, business plans, economic projections, anticipated future cash flows and marketplace data. There are inherent uncertainties related to these factors and management’s judgment in applying these factors. Goodwill valuations have been calculated principally using an income approach based on the present value of future cash flows of each reporting unit and are believed to reflect market participant views which would exist in an exit transaction. Indefinite life intangible asset valuations have been calculated principally using relief-from-royalty and excess earnings approaches and are believed to reflect market participant views which would exist in an exit transaction. Under these valuation approaches, we are required to make various judgmental assumptions about appropriate discount rates. Disruptions in global credit and other financial markets and deterioration of economic conditions, could, among other things, cause us to increase the discount rate used in the valuations. We could be required to evaluate the recoverability of goodwill and indefinite life intangible assets prior to the annual assessment if we experience disruptions to the business, unexpected significant declines in operating results, divestiture of a significant component of our business or sustained market capitalization declines. These types of events and the resulting analyses could result in impairment charges in the future, which could be substantial. As of
October 1, 2016
, we had $
10.7 billion
of goodwill and indefinite life intangible assets, which represented approximately
48%
of total assets.
New or more stringent domestic and international government regulations could impose material costs on us and could adversely affect our business.
Our operations are subject to extensive federal, state and foreign laws and regulations by authorities that oversee food safety standards and processing, packaging, storage, distribution, advertising, labeling and export of our products. See “Environmental Regulation and Food Safety” in Item 1 of this Annual Report on Form 10-K. Changes in laws or regulations that impose additional regulatory requirements on us could increase our cost of doing business or restrict our actions, causing our results of operations to be adversely affected. For example, increased governmental interest in advertising practices may result in regulations that could require us to change or restrict our advertising practices.
10
Increased government regulations to limit carbon dioxide and other greenhouse gas emissions as a result of concern over climate change may result in increased compliance costs, capital expenditures and other financial obligations for us. We use natural gas, diesel fuel and electricity in the manufacturing and distribution of our products. Legislation or regulation affecting these inputs could materially affect our profitability. In addition, climate change could affect our ability to procure needed commodities at costs and in quantities we currently experience and may require us to make additional unplanned capital expenditures.
Legal claims, class action lawsuits, other regulatory enforcement actions, or failure to comply with applicable legal standards or requirements could affect our product sales, reputation and profitability.
We operate in a highly regulated environment with constantly evolving legal and regulatory frameworks. Consequently, we are subject to heightened risk of legal claims or other regulatory enforcement actions. Although we have implemented policies and procedures designed to ensure compliance with existing laws and regulations, there can be no assurance that our employees, contractors, or agents will not violate our policies and procedures. Moreover, a failure to maintain effective control processes could lead to violations, unintentional or otherwise, of laws and regulations. Legal claims or regulatory enforcement actions arising out of our failure or alleged failure to comply with applicable laws and regulations, including those contained in Item 3, Legal Proceedings and Part II, Item 8, and Notes to Consolidated Financial Statements, Note 19: Commitments and Contingencies in this Annual Report on Form 10-K, could subject us to civil and criminal penalties, including debarment from governmental contracts that could materially and adversely affect our product sales, reputation, financial condition and results of operations. Loss of or failure to obtain necessary permits and registrations could delay or prevent us from meeting current product demand, introducing new products, building new facilities or acquiring new businesses and could adversely affect operating results.
The Company is subject to stringent environmental regulation and potentially subject to environmental litigation, proceedings, and investigations.
Our past and present business operations and ownership and operation of real property are subject to stringent federal, state, and local environmental laws and regulations pertaining to the discharge of materials into the environment, and the handling and disposition of wastes (including solid and hazardous wastes) or otherwise relating to protection of the environment. Compliance with these laws and regulations, and the ability to comply with any modifications to these laws and regulations, is material to our business. New matters or sites may be identified in the future that will require additional investigation, assessment, or expenditures. In addition, some of our facilities have been in operation for many years and, over time, we and other prior operators of these facilities may have generated and disposed of wastes that now may be considered hazardous. Future discovery of contamination of property underlying or in the vicinity of our present or former properties or manufacturing facilities and/or waste disposal sites could require us to incur additional expenses. The occurrence of any of these events, the implementation of new laws and regulations, or stricter interpretation of existing laws or regulations, could adversely affect our financial results.
We are increasingly dependent on information technology, and our business and reputation could suffer if we are unable to protect our information technology systems against, or effectively respond to, cyber-attacks, other cyber incidents or security breaches or if our information technology systems are otherwise disrupted.
Information technology is an important part of our business operations and we increasingly rely on information technology systems to manage business data and increase efficiencies in our production and distribution facilities and inventory management processes. We also use information technology to process financial information and results of operations for internal reporting purposes and to comply with regulatory, legal and tax requirements. In addition, we depend on information technology for digital marketing and electronic communications between our facilities, personnel, customers and suppliers. Like other companies, our information technology systems may be vulnerable to a variety of disruptions, including but not limited to the process of upgrading or replacing software, databases or components thereof, natural disasters, terrorist attacks, telecommunications failures, computer viruses, cyber-attacks, hackers, unauthorized access attempts and other security issues. Attempted cyber-attacks and other cyber incidents are occurring more frequently, are constantly evolving in nature, are becoming more sophisticated and are being made by groups and individuals with a wide range of motives and expertise.
We have implemented and continue to evaluate security initiatives and disaster recovery plans to mitigate our exposure to these risks, but these measures may not be adequate. Any significant failure of our systems, including failures that prevent our systems from functioning as intended or our failure to timely identify or appropriately respond to cyber-attacks or other cyber incidents, could cause transaction errors, processing inefficiencies, loss of customers and sales, have negative consequences on our employees and our business partners, have a negative impact on our operations or business reputation and expose us to liability, litigation and regulatory enforcement actions. In addition, if we are unable to prevent security breaches, we may suffer financial and reputational damage or penalties because of the unauthorized disclosure of confidential information belonging to us or to our business partners, customers, consumers or suppliers. Finally, the disclosure of non-public information through external media channels could lead to the loss of intellectual property or damage our reputation and brand image. Similar risks exist with respect to the third-party vendors that we rely upon for aspects of our information technology support services and administrative functions, including health and benefit plan administration and certain finance and accounting functions, and systems managed, hosted, provided and/or used by third parties and their vendors.
11
If we pursue strategic acquisitions or divestitures, we may not be able to successfully consummate favorable transactions or successfully integrate acquired businesses.
We periodically evaluate potential acquisitions, joint ventures and other initiatives, and may seek to expand our business through the acquisition of companies, processing plants, technologies, products and services. Acquisitions and joint ventures involve financial and operational risks and uncertainties, including:
|
•
|
challenges in realizing the anticipated benefits of the transaction;
|
|
•
|
difficulty integrating acquired businesses, technologies, operations and personnel with our existing business;
|
|
•
|
diversion of management attention in connection with negotiating transactions and integrating the businesses acquired;
|
|
•
|
difficulty identifying suitable candidates or consummating a transaction on terms that are favorable to us;
|
|
•
|
challenges in retaining the acquired businesses' customers and key employees;
|
|
•
|
inability to implement and maintain consistent standards, controls, procedures and information systems;
|
|
•
|
exposure to unforeseen or undisclosed liabilities of acquired companies; and
|
|
•
|
the availability and terms of additional debt or equity financing for any transaction.
|
We may not be able to address these risks and successfully develop these acquired companies or businesses into profitable units. If we are unable to do this, such expansion could adversely affect our financial results.
Market fluctuations could negatively impact our operating results as we hedge certain transactions.
Our business is exposed to fluctuating market conditions. We use derivative financial instruments to reduce our exposure to various market risks including changes in commodity prices, interest rates and foreign exchange rates. We hold certain positions, primarily in grain and livestock futures, that do not qualify as hedges for financial reporting purposes. These positions are marked to fair value, and the unrealized gains and losses are reported in earnings at each reporting date. Therefore, losses on these contracts will adversely affect our reported operating results. While these contracts reduce our exposure to changes in prices for commodity products, the use of such instruments may ultimately limit our ability to benefit from favorable commodity prices.
Deterioration of economic conditions could negatively impact our business.
Our business may be adversely affected by changes in economic conditions, including inflation, interest rates, access to capital markets, consumer spending rates, energy availability and costs (including fuel surcharges) and the effects of governmental initiatives to manage economic conditions. Any such changes could adversely affect the demand for our products, or the cost and availability of our needed raw materials, cooking ingredients and packaging materials, thereby negatively affecting our financial results.
Disruptions in global credit and other financial markets and deterioration of economic conditions could, among other things:
|
•
|
make it more difficult or costly for us to obtain financing for our operations or investments or to refinance our debt in the future;
|
|
•
|
cause our lenders to depart from prior credit industry practice and make more difficult or expensive the granting of any amendment of, or waivers under, our credit agreements to the extent we may seek them in the future;
|
|
•
|
impair the financial condition of some of our customers and suppliers, thereby increasing customer bad debts or non-performance by suppliers;
|
|
•
|
negatively impact global demand for protein products, which could result in a reduction of sales, operating income and cash flows;
|
|
•
|
decrease the value of our investments in equity and debt securities, including our marketable debt securities, company-owned life insurance and pension and other postretirement plan assets;
|
|
•
|
negatively impact our commodity purchasing activities if we are required to record losses related to derivative financial instruments; or
|
|
•
|
impair the financial viability of our insurers.
|
The loss of one or more of our largest customers could negatively impact our business.
Our business could suffer significant setbacks in sales and operating income if our customers’ plans and/or markets change significantly or if we lost one or more of our largest customers, including, for example, Wal-Mart Stores, Inc., which accounted for
17.5%
of our sales in fiscal
2016
. Our retail customers typically do not enter into written contracts, and if they do sign contracts, they generally are limited in scope and duration. There can be no assurance that significant customers will continue to purchase our products in the same mix or quantities or on the same terms as in the past. Many of our customers, such as supermarkets, warehouse clubs and food distributors, have consolidated in recent years, and consolidation is expected to continue throughout the United States and in other major markets. These consolidations have produced large, sophisticated customers with increased buying power who are more capable of operating with reduced inventories, opposing price increases, and demanding lower pricing, increased promotional programs and specifically tailored products. These customers also may use shelf space currently used for our products for their own private label products. Because of these trends, our volume growth could slow or we may need to lower prices or increase promotional spending for our products. The loss of a significant customer or a material reduction in sales to, or adverse change to trade terms with, a significant customer could materially and adversely affect our product sales, financial condition and results of operations.
12
Extreme factors or forces beyond our control could negatively impact our business.
Our ability to make, move and sell products is critical to our success. Natural disasters, fire, bioterrorism, pandemic or extreme weather, including droughts, floods, excessive cold or heat, hurricanes or other storms, could impair the health or growth of livestock or interfere with our operations due to power outages, fuel shortages, decrease in availability of water, damage to our production and processing facilities or disruption of transportation channels, among other things. Any of these factors could have an adverse effect on our financial results.
Failure to maximize or to successfully assert our intellectual property rights could impact our competitiveness.
We consider our intellectual property rights, particularly and most notably our trademarks, but also our trade secrets, patents and copyrights, to be a significant and valuable aspect of our business. We attempt to protect our intellectual property rights through a combination of trademark, trade secret, patent and copyright laws, as well as licensing agreements, third-party nondisclosure and assignment agreements and policing of third-party misuses of our intellectual property. We cannot be sure that these intellectual property rights will be maximized or that they can be successfully asserted. There is a risk that we will not be able to obtain and perfect our own or, where appropriate, license intellectual property rights necessary to support new product introductions.
We cannot be sure that these rights, if obtained, will not be invalidated, circumvented or challenged in the future. In addition, even if such rights are obtained in the United States, the laws of some of the other countries in which our products are or may be sold do not protect our intellectual property rights to the same extent as the laws of the United States. Our failure to perfect or successfully assert our intellectual property rights could make us less competitive and could have an adverse effect on our business, operating results and financial condition.
Tyson Limited Partnership can exercise significant control.
As of
October 1, 2016
, Tyson Limited Partnership (the TLP) owns
99.985%
of the outstanding shares of the Company's Class B Common Stock, $0.10 par value (Class B stock) and the TLP and members of the Tyson family own, in the aggregate,
2.06%
of the outstanding shares of the Company's Class A Common Stock, $0.10 par value (Class A stock), giving them, collectively, control of approximately
71.18%
of the total voting power of the Company's outstanding voting stock. At this time, the TLP does not have a managing general partner, as such, the management rights of the managing general partner may be exercised by a majority of the percentage interests of the general partners. As of
October 1, 2016
, Mr. John Tyson, Chairman of the Board of Directors, has
33.33%
of the general partner percentage interests, and Ms. Barbara Tyson, a director of the Company, has
11.115%
general partner percentage interests (the remaining general partnership interests are held by the Tyson Partnership Interest Trust (
44.44%
) and Harry C. Erwin, III (
11.115%
)). As a result of these holdings, positions and directorships, the partners in the TLP have the ability to exert substantial influence or actual control over our management and affairs and over substantially all matters requiring action by our stockholders, including amendments to our restated certificate of incorporation and by-laws, the election and removal of directors, any proposed merger, consolidation or sale of all or substantially all of our assets and other corporate transactions. This concentration of ownership may also delay or prevent a change in control otherwise favored by our other stockholders and could depress our stock price. Additionally, as a result of the TLP's significant ownership of our outstanding voting stock, we are eligible for “controlled company” exemptions from certain corporate governance requirements of the New York Stock Exchange.
We may incur additional tax expense or become subject to additional tax liabilities.
We are subject to taxes in the United States and numerous foreign jurisdictions. Significant judgment is required in determining our provision for income taxes. Our total income tax expense could be affected by changes in tax rates in various jurisdictions, changes in the valuation of deferred tax assets and liabilities or changes in tax laws or their interpretation. We are also subject to the examination of our tax returns and other tax matters by the Internal Revenue Service and other tax authorities. There can be no assurance as to the outcome of these examinations. If a taxing authority disagrees with the positions we have taken, we could face additional tax liability, including interest and penalties, which could adversely affect our financial results.
We could incur substantial tax liabilities as a result of the DEMB Master Blenders 1753 N.V (“DEMB”) Spin-Off.
On June 28, 2012, Hillshire Brands divested its international coffee and tea business segment through the spin-off of DEMB (the “Spin-Off”). Hillshire Brands intended for the Spin-Off and certain related transactions to qualify as tax-free under Sections 355, 368(a)(1)(D), and 361 and related provisions of the United States Internal Revenue Code, which we refer to as the Code, and Hillshire Brands received a private letter ruling from the IRS substantially to the effect that the Spin-Off and certain related transactions, including a debt exchange, will qualify as tax-free to Hillshire Brands and its stockholders for United States federal income tax purposes. Although a private letter ruling generally is binding on the IRS, if the factual representations or assumptions made in the private letter ruling request are untrue or incomplete in any material respect, or any material forward-looking covenants or undertakings are not complied with, then Hillshire Brands would not be able to rely on the ruling. In addition, the ruling is based on current law, and cannot be relied upon if the applicable law changes with retroactive effect. As a matter of practice the IRS does not rule on every requirement for a tax-free spin-off or tax-free debt-for-debt exchange, and the parties relied solely on the opinion of counsel for comfort that such additional requirements should be satisfied. The opinion of counsel relies on, among other things, the continuing validity of the ruling and various assumptions and representations as to factual matters made by Hillshire Brands and DEMB which, if inaccurate or incomplete in any material respect, would jeopardize the conclusions reached by counsel in its opinion.
13
The opinion is not binding on the IRS or the courts, and there can be no assurance that the IRS or the courts will not challenge the conclusions stated in the opinion or that any such challenge would not prevail. Accordingly, even though Hillshire Brands obtained a ruling and a “should” opinion of counsel, the IRS could assert that Hillshire Brands has not satisfied the requirements for tax-free treatment and such assertion, if successful, could result in significant United States federal income tax liabilities for us.
Events subsequent to the Spin-Off could cause the Spin-Off to become taxable. Under the terms of the tax sharing agreement Hillshire Brands entered into with DEMB in connection with the Spin-Off, DEMB will generally be required to indemnify Hillshire Brands for 100% of any taxes imposed on DEMB and its subsidiaries or Hillshire Brands and its subsidiaries in the event that the Spin-Off and certain related transactions were to fail to qualify for tax-free treatment as a result of an acquisition of DEMB (including the acquisition of DEMB by J.A. Benckiser), or actions or omissions (including breaches of certain representations and warranties made in the tax sharing agreement) by DEMB or any of its affiliates. However, if the Spin-Off or certain related transactions were to fail to qualify for tax-free treatment because of actions or omissions by Hillshire Brands or any of its affiliates, Hillshire Brands would be responsible for all such taxes. In addition, Hillshire Brands would be responsible for 50% of any taxes resulting from the failure of the Spin-Off and certain related transactions to qualify as tax-free, which failure is not due to actions or omissions (including breaches of certain representations and warranties made in the tax sharing agreement) by Hillshire Brands, DEMB or any of Hillshire Brands’ or DEMB's respective subsidiaries. There can be no assurance that the tax sharing agreement will be sufficient to protect Hillshire Brands against any tax liabilities that may arise, or that DEMB will be able to fully satisfy its indemnification obligations. Hillshire Brands’ inability to enforce the indemnification provisions of the tax sharing agreement or obtain indemnification payments in a timely manner could adversely affect our results of operations, cash flows and financial condition.
Participation in a Multiemployer Pension Plan could adversely affect our business.
Through our wholly owned subsidiary, Hillshire Brands, we participate in a “multiemployer” pension plan administered by a labor union representing some of its employees. We are required to make periodic contributions to this plan to allow them to meet their pension benefit obligations to their participants. Our required contributions to this fund could increase because of a shrinking contribution base as a result of the insolvency or withdrawal of other companies that currently contribute to this fund, inability or failure of withdrawing companies to pay their withdrawal liability, lower than expected returns on pension fund assets or other funding deficiencies. In the event that we withdraw from participation in this plan, then applicable law could require us to make an additional lump-sum contribution to the plan, and we would have to reflect that as an expense in our consolidated statement of operations and as a liability on our consolidated balance sheet. Our withdrawal liability would depend on the extent of the plan's funding of vested benefits. The multiemployer plan in which we participate is reported to have significant underfunded liabilities. Such underfunding could increase the size of our potential withdrawal liability. In the event a withdrawal or partial withdrawal was to occur with respect to the multiemployer plan, the impact to our consolidated financial statements could be material.
Volatility in the capital markets or interest rates could adversely impact our pension costs and the funded status of our pension plans.
We sponsor a number of defined benefit plans for employees in the United States. The difference between plan obligations and assets, which signifies the funded status of the plans, is a significant factor in determining the net periodic benefit costs of the pension plans and our ongoing funding requirements. As of
October 1, 2016
, the funded status of our defined benefit pension plans was an underfunded position of $
336 million
, as compared to an underfunded position of $
410 million
at the end of fiscal
2015
. Changes in interest rates and the market value of plan assets can impact the funded status of the plans and cause volatility in the net periodic benefit cost and our future funding requirements. The exact amount of cash contributions made to pension plans in any year is dependent upon a number of factors, including minimum funding requirements.
None.
14
We have production and distribution operations in the following states: Alabama, Arizona, Arkansas, California, Delaware, Florida, Georgia, Illinois, Indiana, Iowa, Kansas, Kentucky, Maryland, Michigan, Mississippi, Missouri, Nebraska, North Carolina, Oklahoma, Pennsylvania, South Carolina, Tennessee, Texas, Virginia, Washington and Wisconsin. We also have sales offices throughout the United States. Additionally, we have sales offices, facilities or participate in joint venture operations in Argentina, Brazil, Canada, China, the Dominican Republic, Hong Kong, India, Japan, Mexico, the Netherlands, New Zealand, the Philippines, Russia, South Korea, Spain, Taiwan, Turkey, the United Arab Emirates, the United Kingdom and Venezuela.
|
Number of Facilities
|
||||||||
|
Owned
|
|
Leased
|
|
Total
|
|
|||
|
Chicken Segment:
|
||||||||
|
Processing plants
|
44
|
|
1
|
|
45
|
|
||
|
Rendering plants
|
9
|
|
—
|
|
9
|
|
||
|
Blending mills
|
2
|
|
—
|
|
2
|
|
||
|
Feed mills
|
32
|
|
—
|
|
32
|
|
||
|
Broiler hatcheries
|
60
|
|
3
|
|
63
|
|
||
|
Breeder houses
|
430
|
|
44
|
|
474
|
|
||
|
Broiler farm houses
|
48
|
|
—
|
|
48
|
|
||
|
Pet treats plant
|
1
|
|
—
|
|
1
|
|
||
|
Beef Segment Production Facilities
|
12
|
|
—
|
|
12
|
|
||
|
Pork Segment Production Facilities
|
9
|
|
—
|
|
9
|
|
||
|
Prepared Foods Segment:
|
|
|
||||||
|
Processing plants
|
30
|
|
4
|
|
34
|
|
||
|
Turkey operation facilities
|
6
|
|
—
|
|
6
|
|
||
|
Distribution Centers
|
12
|
|
1
|
|
13
|
|
||
|
Cold Storage Facilities
|
50
|
|
—
|
|
50
|
|
||
|
Research and Development Facilities
|
1
|
|
1
|
|
2
|
|
||
|
Capacity
(1)
per week at
October 1, 2016
|
|
Fiscal 2016
Average Capacity
Utilization
|
|
|||||
|
Chicken Production Facilities
|
39 million head
|
|
89
|
%
|
||||
|
Beef Production Facilities
|
165,000 head
|
|
76
|
%
|
||||
|
Pork Production Facilities
|
456,000 head
|
|
91
|
%
|
||||
|
Prepared Foods Processing Facilities
(2)
|
78 million pounds
|
|
84
|
%
|
||||
|
(1)
|
Capacity per week based on the following: Chicken and Prepared Foods (five day week) and Beef and Pork (six day week).
|
|
(2)
|
In fiscal 2016, we changed the method of calculating capacity for our Prepared Foods processing plants. If we would have used the fiscal 2015 method, fiscal 2016 capacity would have been 74 million pounds with an 89% average capacity utilization.
|
Chicken:
Chicken processing plants include various phases of slaughtering, dressing, cutting, packaging, deboning and further-processing. We also have 29 animal nutrition operations, nine of which are associated with the Chicken rendering plants, 19 within various Chicken processing facilities and one pet treats plant. The blending mills, feed mills and broiler hatcheries have sufficient capacity to meet the needs of the chicken growout operations.
Beef:
Beef plants include various phases of slaughtering live cattle and fabricating beef products. We also have various plants which have rendering operations along with tanneries and hide treatment operations. The Beef segment includes three case-ready operations that share facilities with the Pork segment. One of the beef facilities contains a tallow refinery.
Pork:
Pork plants include various phases of slaughtering live hogs and fabricating pork products and allied products. The Pork segment includes three case-ready operations that share facilities with the Beef segment.
Prepared Foods:
Prepared Foods plants process fresh and frozen chicken, turkey, beef, pork and other raw materials into pizza toppings, branded and processed meats, desserts, appetizers, prepared meals, ethnic foods, soups, sauces, side dishes, pizza crusts, flour and corn tortilla products and meat dishes.
15
In addition, our foreign chicken production operations in China and India include four processing plants, two rendering plants, three feed mills and five broiler hatcheries. The processing plants include various phases of slaughtering, dressing, cutting, packaging, deboning and further-processing chicken. The feed mills and broiler hatcheries generally have sufficient capacity to meet the needs of the foreign chicken growout operations.
We believe our present facilities are generally adequate and suitable for our current purposes; however, seasonal fluctuations in inventories and production may occur as a reaction to market demands for certain products. We regularly engage in construction and other capital improvement projects intended to expand capacity and improve the efficiency of our processing and support facilities. We also consider the efficiencies of our operations and may from time to time consider changing the number or type of plants we operate to align with our capacity needs.
Refer to the description of certain legal proceedings pending against us under Part II, Item 8, Notes to Consolidated Financial Statements, Note 19: Commitments and Contingencies, which discussion is incorporated herein by reference. Listed below are certain additional legal proceedings involving the Company and/or its subsidiaries.
Our subsidiary, Tyson Poultry, Inc., has been in negotiations with Region 6 of the Unites States Environmental Protection Agency (the “EPA”) to resolve concerns about an accident at the Hope, Arkansas processing plant which occurred on April 23, 2016. The EPA alleged violation of the Clean Air Act Risk Management Plan requirements related to our anhydrous ammonia refrigeration system and the accident. Pursuant to an administrative settlement with the EPA, we will pay a penalty of $106,894, perform independent, third-party audits at 20 facilities in Arkansas, Oklahoma and Texas over the next 3 years, and construct a closed vent refrigeration system at a facility in Region 6 within the next 2 years.
On April 23, 2015, the EPA issued a Finding and Notice of Violation (the “NOV”) to Tyson Foods, Inc. and our subsidiary, Southwest Products, LLC, alleging violations of the California Truck and Bus Regulation. The NOV alleges that certain diesel-powered trucks operated by us in California did not comply with California’s emission requirements for in-use trucks and that we did not verify the compliance status of independent carriers hired to carry products in California. In January 2016, the EPA proposed that we pay a civil penalty of $283,990 to resolve these allegations. We are cooperating with the EPA and believe that we have defenses to the allegations of the NOV.
On June 17, 2014, the Missouri attorney general filed a civil lawsuit against us in the circuit court of Barry County, Missouri, concerning an incident that occurred in May 2014 in which some feed supplement was discharged from our plant in Monett, Missouri, to the City of Monett’s wastewater treatment plant allegedly leading to a fish kill in a local stream and odor issues around the plant. That lawsuit alleges six violations stemming from the incident and seeks penalties against us, compensation for damage to the stream, and reimbursement for the State of Missouri’s costs in investigating the matter. In January 2015, a consent judgment was entered that resolved the lawsuit. The judgment required payment of $540,000, which includes amounts for penalties, cost recovery and supplemental environmental projects. The EPA has also indicated to us that it has begun a criminal investigation into the incident. If we become subject to criminal charges, we may be subject to a fine and other relief, as well as government contract suspension and debarment. We are cooperating with the EPA but cannot predict the outcome of its investigation at this time. It is also possible that other regulatory agencies may commence investigations and allege additional violations.
On June 19, 2005, the Attorney General and the Secretary of the Environment of the State of Oklahoma filed a complaint in the United States District Court for the Northern District of Oklahoma against Tyson Foods, Inc., three subsidiaries and six other poultry integrators. The complaint, which was subsequently amended, asserts a number of state and federal causes of action including, but not limited to, counts under the Comprehensive Environmental Response, Compensation, and Liability Act, Resource Conservation and Recovery Act, and state-law public nuisance theories. Oklahoma alleges that the defendants and certain contract growers who were not joined in the lawsuit polluted the surface waters, groundwater and associated drinking water supplies of the Illinois River Watershed through the land application of poultry litter. Oklahoma’s claims were narrowed through various rulings issued before and during trial and its claims for natural resource damages were dismissed by the district court in a ruling issued on July 22, 2009, which was subsequently affirmed on appeal by the Tenth Circuit Court of Appeals. A non-jury trial of the remaining claims including Oklahoma’s request for injunctive relief began on September 24, 2009. Closing arguments were held on February 11, 2010. The district court has not yet rendered its decision from the trial.
Other Matters:
As of October 1, 2016, we had approximately
114,000
employees and, at any time, have various employment practices matters outstanding. In the aggregate, these matters are significant to the Company, and we devote significant resources to managing employment issues. Additionally, we are subject to other lawsuits, investigations and claims (some of which involve substantial amounts) arising out of the conduct of our business. While the ultimate results of these matters cannot be determined, they are not expected to have a material adverse effect on our consolidated results of operations or financial position.
Not applicable.
16
EXECUTIVE OFFICERS OF THE COMPANY
Our executive officers serve one-year terms from the date of their election, or until their successors are appointed and qualified. No family relationships exist among these officers. The name, title, age (as of October 1, 2016) and calendar year of initial election to executive office of our executive officers are listed below:
|
Name
|
Title
|
Age
|
Year Elected
Executive Officer
|
|||
|
John Tyson
|
Chairman of the Board of Directors
|
63
|
2011
|
|||
|
Curt T. Calaway
|
Senior Vice President, Controller and Chief Accounting Officer
|
43
|
2012
|
|||
|
Andrew P. Callahan
|
President, Retail Packaged Brands
|
50
|
2014
|
|||
|
Howell P. Carper
|
Executive Vice President, Operations Services
|
62
|
2013
|
|||
|
Sally Grimes
|
President, International and Chief Global Growth Officer
|
45
|
2014
|
|||
|
Thomas P. Hayes
|
President
|
51
|
2014
|
|||
|
Donnie King
|
President, North American Operations
|
54
|
2009
|
|||
|
Dennis Leatherby
|
Executive Vice President and Chief Financial Officer
|
56
|
1994
|
|||
|
Monica McGurk
|
Executive Vice President, Strategy and New Ventures and President, Foodservice
|
46
|
2016
|
|||
|
Mary Oleksiuk
|
Executive Vice President and Chief Human Resources Officer
|
54
|
2014
|
|||
|
Donnie Smith
|
Chief Executive Officer
|
56
|
2008
|
|||
|
Stephen Stouffer
|
President, Fresh Meats
|
56
|
2013
|
|||
|
David L. Van Bebber
|
Executive Vice President and General Counsel
|
60
|
2008
|
|||
|
Noel White
|
President, Poultry
|
58
|
2009
|
|||
John Tyson has served as Chairman of the Board of Directors since 1998 and was previously Chief Executive Officer of the Company from 2001 until 2006. Mr. Tyson was initially employed by the Company in 1973.
Curt T. Calaway was appointed Senior Vice President, Controller and Chief Accounting Officer in 2012, after serving as Vice President, Audit and Compliance since 2008, prior to which he served as the Company's Senior Director of Financial Reporting. Mr. Calaway was initially employed by the Company in 2006.
Andrew P. Callahan was appointed President, Retail Packaged Brands in September 2014. Mr. Callahan previously served as Executive Vice President and President, Retail of The Hillshire Brands Company (“Hillshire Brands”) since 2012, prior to which he served as Senior Vice President, Chief Customer Officer for Sara Lee Corporation's (“Sara Lee”) North American operations from 2011 to 2012, after serving as President of Sara Lee's North American Foodservice segment from 2009 to 2011. Hillshire Brands was acquired by the Company in August 2014.
Howell P. (“Hal”) Carper was appointed Executive Vice President, Operations Services in April 2016, after serving as Executive Vice President, Strategy and New Ventures since 2013. He previously served as Group Vice President, Research and Development, Logistics, and Technical Services since 2008, prior to which he served as Senior Vice President, Corporate Research and Development since 2003, and Senior Vice President and General Manager, Foodbrands Foodservice since 2001. Mr. Carper was appointed by IBP, inc. as Senior Vice President, Sales and Marketing in 1999. IBP, inc. was acquired by the Company in 2001. Prior to employment with IBP, inc., he served as Senior Vice President, Sales and Marketing with Foodbrands, Inc., which was acquired by IBP, inc. in 1997.
Sally Grimes was appointed President, International and Chief Global Growth Officer in June 2015 following her appointment as President and Global Growth Officer in 2014. Ms. Grimes previously served as Senior Vice President, Chief Innovation Officer and President, Gourmet Food Group of Hillshire Brands since 2012. Prior to joining Hillshire Brands, Ms. Grimes served as Global Vice President, Marketing for the writing and creative expression business unit at Newell Rubbermaid, Inc. from 2007 to 2012.
Thomas P. Hayes was appointed President in June 2016. Mr. Hayes previously served as Chief Commercial Officer since June 2015 after being appointed President, Foodservice in 2014. Mr. Hayes previously served as Executive Vice President and Chief Supply Chain Officer of Hillshire Brands since 2012, prior to which he served as Senior Vice President and Chief Supply Chain Officer for Sara Lee’s North American Retail and Foodservice businesses from 2009 to 2012. Mr. Hayes was initially employed by Sara Lee in 2006.
17
Donnie King was appointed President North American Operations in June 2015 following his appointment as President of North American Operations and Food Service in 2014. He previously served as President of Prepared Foods, Customer and Consumer Solutions since 2013, Senior Group Vice President, Poultry and Prepared Foods since 2009, Group Vice President, Refrigerated and Deli since 2008, Group Vice President, Operations since 2007, Senior Vice President, Consumer Products Operations since 2006 and Senior Vice President, Poultry Operations since 2003. Mr. King was initially employed by Valmac Industries, Inc. in 1982. Valmac Industries, Inc. was acquired by the Company in 1984.
Dennis Leatherby was appointed Executive Vice President and Chief Financial Officer in 2008 after serving as Senior Vice President, Finance and Treasurer since 1998. He also served as Interim Chief Financial Officer from 2004 to 2006. Mr. Leatherby was initially employed by the Company in 1990.
Monica McGurk was appointed Executive Vice President, Strategy and New Ventures and President, Foodservice in August 2016 after serving as Senior Vice President, Strategy and New Ventures since April 2016. Prior to joining the Company, Ms. McGurk served as Senior Vice President of Strategy, Decision Support and eCommerce for the North American Group of the Coca-Cola Company from 2014 to 2016, prior to which she served as Vice President, Strategy & eCommerce since late 2012. Prior to joining the Coca-Cola Company, she was the Chief Executive Officer and Executive Editor of The Alumni Factor from May through November 2012. Prior to this position, she was a partner with McKinsey & Company, a global management consulting firm with which she served in various roles for 19 years.
Mary Oleksiuk was appointed Executive Vice President and Chief Human Resources Officer in September 2014. Ms. Oleksiuk previously served as Senior Vice President, Chief Human Resources Officer for Hillshire Brands since 2012. Prior to joining Hillshire Brands, Ms. Oleksiuk served as Chief Human Resources Officer and Senior Vice President for Discover Financial Services from 2011 to 2012. From 2010 to 2011, she served as Senior Vice President, Global Human Resources with Alberto Culver Company and as Vice President, Global Human Resources with Alberto Culver Company from 2007 to 2010.
Donnie Smith was appointed President and Chief Executive Officer in November 2009 and continues to serve as Chief Executive Officer following Mr. Hayes’ appointment as President in June 2016. Mr. Smith served as Senior Group Vice President, Poultry and Prepared Foods since January 2009, prior to which he served as Group Vice President of Consumer Products since 2008, Group Vice President of Logistics and Operations Services since 2007, Group Vice President Information Systems, Purchasing and Distribution since 2006 and Senior Vice President and Chief Information Officer since 2005. Mr. Smith was initially employed by the Company in 1980.
Stephen R. Stouffer was appointed President, Fresh Meats in 2013, after serving as Senior Vice President, Beef Margin Management since 2012, prior to which he served as Vice President, Ground Beef, Trim and Variety Meats Sales since 2009, and Director, Ground Beef, Trim and Carcass Sales since 2006. Mr. Stouffer was initially employed by IBP, inc. in 1982.
David L. Van Bebber was appointed Executive Vice President and General Counsel in 2008, after serving as Senior Vice President and Deputy General Counsel since 2004. Mr. Van Bebber was initially employed by Lane Processing in 1982. Lane Processing was acquired by the Company in 1986.
Noel White was appointed President, Poultry in 2013, after serving as Senior Group Vice President, Fresh Meats since 2009, after serving as Senior Vice President, Pork Margin Management since 2007 and Group Vice President, Fresh Meats Operations/Commodity Sales since 2005. Mr. White was initially employed by IBP, inc. in 1983.
18
We have issued and outstanding two classes of capital stock, Class A stock and Class B stock. Holders of Class B stock may convert such stock into Class A stock on a share-for-share basis. Holders of Class B stock are entitled to 10 votes per share and holders of Class A stock are entitled to one vote per share on matters submitted to shareholders for approval. As of
October 29, 2016
, there were approximately 23,000 holders of record of our Class A stock and six holders of record of our Class B stock.
DIVIDENDS
Cash dividends cannot be paid to holders of Class B stock unless they are simultaneously paid to holders of Class A stock. The per share amount of the cash dividend paid to holders of Class B stock cannot exceed 90% of the cash dividend simultaneously paid to holders of Class A stock. We have paid uninterrupted quarterly dividends on common stock each year since 1977. In fiscal
2016
, the annual dividend rate for Class A stock was $0.60 per share and the annual dividend rate for Class B stock was $0.54 per share. In fiscal
2015
, the annual dividend rate for Class A stock was $0.40 per share and the annual dividend rate for Class B stock was $0.36 per share. On November 17, 2016, the Board of Directors increased the dividend previously declared on August 4, 2016, to $0.225 per share on our Class A stock and $0.2025 per share on our Class B stock. The increased quarterly dividend is payable on December 15, 2016, to shareholders of record at the close of business on December 1, 2016. Also on November 17, 2016, the Board of Directors declared a quarterly dividend of $0.225 per share on our Class A stock and $0.2025 per share on our Class B stock, payable on March 15, 2017, to shareholders of record at the close of business on March 1, 2017. We anticipate the remaining quarterly dividends in fiscal 2017 will be $0.225 and $0.2025 per share of our Class A and Class B stock, respectively. We also continue to anticipate our annual dividends to increase approximately $0.10 per year.
MARKET INFORMATION
Our Class A stock is traded on the New York Stock Exchange under the symbol “TSN.” No public trading market currently exists for our Class B stock. The high and low sales prices of our Class A stock for each quarter of fiscal
2016
and
2015
are represented in the table below.
|
2016
|
2015
|
||||||||||||||
|
High
|
|
Low
|
|
High
|
|
Low
|
|
||||||||
|
First Quarter
|
$
|
54.42
|
|
$
|
42.89
|
|
$
|
43.37
|
|
$
|
37.02
|
|
|||
|
Second Quarter
|
68.17
|
|
48.52
|
|
42.41
|
|
37.10
|
|
|||||||
|
Third Quarter
|
70.44
|
|
59.45
|
|
45.10
|
|
37.24
|
|
|||||||
|
Fourth Quarter
|
77.05
|
|
65.83
|
|
44.78
|
|
39.05
|
|
|||||||
ISSUER PURCHASES OF EQUITY SECURITIES
The table below provides information regarding our purchases of Class A stock during the periods indicated.
|
Period
|
Total
Number of
Shares
Purchased
|
|
Average
Price Paid
per Share
|
|
Total Number of Shares
Purchased as Part of
Publicly Announced
Plans or Programs
|
|
Maximum Number of
Shares that May Yet Be
Purchased Under the Plans
or Programs
(1)
|
|
|||
|
Jul. 3, 2016 to Jul. 30, 2016
|
4,706,269
|
|
$
|
70.20
|
|
4,598,556
|
|
44,488,878
|
|
||
|
Jul. 31, 2016 to Sept. 3, 2016
|
2,643,859
|
|
74.69
|
|
2,543,335
|
|
41,945,543
|
|
|||
|
Sept. 4, 2016 to Oct. 1, 2016
|
1,652,309
|
|
74.61
|
|
1,605,689
|
|
40,339,854
|
|
|||
|
Total
|
9,002,437
|
|
(2)
|
$
|
72.33
|
|
8,747,580
|
|
(3)
|
40,339,854
|
|
|
(1)
|
On February 7, 2003, we announced our Board of Directors approved a program to repurchase up to 25 million shares of Class A common stock from time to time in open market or privately negotiated transactions. On May 3, 2012, our Board of Directors approved an increase of 35 million shares, on January 30, 2014, our Board of Directors approved an increase of 25 million shares and, on February 4, 2016, our Board of Directors approved an increase of 50 million shares under the program. The program has no fixed or scheduled termination date.
|
|
(2)
|
We purchased 254,857 shares during the period that were not made pursuant to our previously announced stock repurchase program, but were purchased to fund certain Company obligations under our equity compensation plans. These transactions included 244,498 shares purchased in open market transactions and 10,359 shares withheld to cover required tax withholdings on the vesting of restricted stock.
|
|
(3)
|
These shares were purchased during the period pursuant to our previously announced stock repurchase program.
|
19
PERFORMANCE GRAPH
The following graph shows a five-year comparison of cumulative total returns for our Class A stock, the Standard & Poor’s (S&P) 500 Index and a group of peer companies described below.
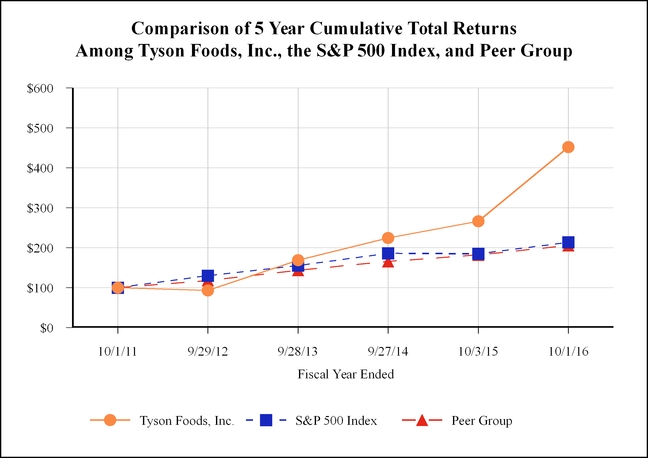
|
Fiscal Years Ended
|
|||||||||||||||||||||||
|
Base Period
10/1/11
|
|
9/29/12
|
|
9/28/13
|
|
9/27/14
|
|
10/3/15
|
|
10/1/16
|
|
||||||||||||
|
Tyson Foods, Inc.
|
$
|
100.00
|
|
$
|
93.09
|
|
$
|
168.50
|
|
$
|
224.16
|
|
$
|
266.17
|
|
$
|
452.03
|
|
|||||
|
S&P 500 Index
|
100.00
|
|
130.20
|
|
155.39
|
|
186.05
|
|
184.91
|
|
213.44
|
|
|||||||||||
|
Peer Group
|
100.00
|
|
117.85
|
|
143.56
|
|
165.74
|
|
182.04
|
|
205.49
|
|
|||||||||||
The total cumulative return on investment (change in the year-end stock price plus reinvested dividends), which is based on the stock price or composite index at the end of fiscal 2011, is presented for each of the periods for the Company, the S&P 500 Index, and our peer group. The peer group includes: Archer-Daniels-Midland Company, Bunge Limited, Campbell Soup Company, ConAgra Foods, Inc., Dean Foods Company, General Mills, Inc., Hormel Foods Corp., Kellogg Co., McCormick & Co., Mondelez International Inc., PepsiCo, Inc., Pilgrim's Pride Corporation, Sanderson Farms, Inc., The Hershey Company, and The J.M. Smucker Company. The graph compares the performance of the Company's Class A common stock with that of the S&P 500 Index and peer group, with the return of each company in the peer group weighted on market capitalization. The stock price performance of the Company's Class A common stock shown in the above graph is not necessarily indicative of future stock price performance.
The information in this "Performance Graph" section shall not be deemed to be "soliciting material" or to be "filed" with the Securities and Exchange Commission or subject to Regulation 14A or 14C, or to the liabilities of Section 18 of the Securities Exchange Act of 1934.
20
FIVE-YEAR FINANCIAL SUMMARY
|
in millions, except per share, percentage and ratio data
|
|||||||||||||||||||
|
2016
|
|
2015
|
|
2014
|
|
2013
|
|
2012
|
|
||||||||||
|
Summary of Operations
|
|||||||||||||||||||
|
Sales
|
$
|
36,881
|
|
$
|
41,373
|
|
$
|
37,580
|
|
$
|
34,374
|
|
$
|
33,055
|
|
||||
|
Operating income
|
2,833
|
|
2,169
|
|
1,430
|
|
1,375
|
|
1,286
|
|
|||||||||
|
Net interest expense
|
243
|
|
284
|
|
125
|
|
138
|
|
344
|
|
|||||||||
|
Income from continuing operations
|
1,772
|
|
1,224
|
|
856
|
|
848
|
|
614
|
|
|||||||||
|
Loss from discontinued operation, net of tax
|
—
|
|
—
|
|
—
|
|
(70
|
)
|
(38
|
)
|
|||||||||
|
Net income
|
1,772
|
|
1,224
|
|
856
|
|
778
|
|
576
|
|
|||||||||
|
Net income attributable to Tyson
|
1,768
|
|
1,220
|
|
864
|
|
778
|
|
583
|
|
|||||||||
|
Diluted net income per share attributable to Tyson:
|
|||||||||||||||||||
|
Income from continuing operations
|
4.53
|
|
2.95
|
|
2.37
|
|
2.31
|
|
1.68
|
|
|||||||||
|
Loss from discontinued operation
|
—
|
|
—
|
|
—
|
|
(0.19
|
)
|
(0.10
|
)
|
|||||||||
|
Net income
|
4.53
|
|
2.95
|
|
2.37
|
|
2.12
|
|
1.58
|
|
|||||||||
|
Dividends declared per share:
|
|||||||||||||||||||
|
Class A
|
0.650
|
|
0.425
|
|
0.325
|
|
0.310
|
|
0.160
|
|
|||||||||
|
Class B
|
0.585
|
|
0.383
|
|
0.294
|
|
0.279
|
|
0.144
|
|
|||||||||
|
Balance Sheet Data
|
|||||||||||||||||||
|
Cash and cash equivalents
|
$
|
349
|
|
$
|
688
|
|
$
|
438
|
|
$
|
1,145
|
|
$
|
1,071
|
|
||||
|
Total assets
|
22,373
|
|
22,969
|
|
23,906
|
|
12,167
|
|
11,882
|
|
|||||||||
|
Total debt
|
6,279
|
|
6,690
|
|
8,128
|
|
2,398
|
|
2,418
|
|
|||||||||
|
Shareholders’ equity
|
9,624
|
|
9,706
|
|
8,904
|
|
6,233
|
|
6,042
|
|
|||||||||
|
Other Key Financial Measures
|
|||||||||||||||||||
|
Depreciation and amortization
|
$
|
705
|
|
$
|
711
|
|
$
|
530
|
|
$
|
519
|
|
$
|
499
|
|
||||
|
Capital expenditures
|
695
|
|
854
|
|
632
|
|
558
|
|
690
|
|
|||||||||
|
EBITDA
|
3,538
|
|
2,906
|
|
1,897
|
|
1,818
|
|
1,731
|
|
|||||||||
|
Return on invested capital
|
18.1
|
%
|
13.4
|
%
|
11.9
|
%
|
18.5
|
%
|
17.7
|
%
|
|||||||||
|
Effective tax rate for continuing operations
|
31.8
|
%
|
36.3
|
%
|
31.6
|
%
|
32.6
|
%
|
36.4
|
%
|
|||||||||
|
Total debt to capitalization
|
39.5
|
%
|
40.8
|
%
|
47.7
|
%
|
27.8
|
%
|
28.6
|
%
|
|||||||||
|
Book value per share
|
$
|
25.67
|
|
$
|
24.25
|
|
$
|
21.86
|
|
$
|
18.13
|
|
$
|
16.84
|
|
||||
|
Stock price high
|
77.05
|
|
45.10
|
|
44.24
|
|
32.40
|
|
21.06
|
|
|||||||||
|
Stock price low
|
42.89
|
|
37.02
|
|
27.33
|
|
15.93
|
|
14.07
|
|
|||||||||
Notes to Five-Year Financial Summary
|
a.
|
Fiscal 2016 net income included $53 million related to the recognition of previously unrecognized tax benefits and audit settlements. In fiscal 2016, we adopted new accounting guidance, retrospectively, requiring classification of debt issuance costs as a reduction of the carrying value of the debt. In doing so, $29 million, $35 million, $50 million, $10 million and $14 million of deferred issuance costs have been reclassified from Other Assets to Long-Term Debt in our Consolidated Balance Sheets for fiscal 2016, 2015, 2014, 2013 and 2012 respectively. This change is reflected above in total assets, total debt, total debt to capitalization and return on invested capital ratios.
|
|
b.
|
Fiscal 2015 was a 53-week year, while the other years presented were 52-week years. Fiscal 2015 included a $169 million pretax impairment charge related to our China operation, $57 million pretax expense related to merger and integration costs, $59 million pretax impairment charges related to our Prepared Foods network optimization, $12 million pretax charges related to Denison impairment and plant closure costs, $8 million pretax gain related to net insurance proceeds (net of costs) related to a legacy Hillshire Brands plant fire, $21 million pretax gain on the sale of equity securities, $161 million pretax gain on the sale of the Mexico operation, $39 million pretax gain related to the impact of the additional week in fiscal 2015 and $26 million unrecognized tax benefit gain.
|
|
c.
|
Fiscal 2014 included a $42 million pretax impairment charge and other costs related to the sale of our Brazil operation and Mexico's undistributed earnings tax, $197 million pretax expense related to the Hillshire Brands acquisition, integration and costs associated with our Prepared Foods improvement plan, $40 million pretax expense related to the Hillshire Brands post-closing results, purchase price accounting, and costs related to a legacy Hillshire Brands plant fire, $27 million pretax expense related to the Hillshire Brands acquisition financing incremental interest cost and $52 million unrecognized tax benefit gain.
|
|
d.
|
Fiscal 2013 included a $19 million currency translation adjustment gain recognized in conjunction with the receipt of proceeds constituting the final resolution of our investment in Canada. Additionally in fiscal 2013, we determined our Weifang operation (Weifang) was no longer core to the execution of our strategy in China. In July 2013, we completed the sale of Weifang. Non-cash charges related to the impairment of assets in Weifang amounted to $56 million and $15 million in fiscal 2013 and 2012, respectively.
|
|
e.
|
Fiscal 2012 included a pretax charge of $167 million related to the early extinguishment of debt.
|
|
f.
|
Return on invested capital is calculated by dividing operating income by the sum of the average of beginning and ending total debt and shareholders’ equity less cash and cash equivalents.
|
|
g.
|
For the total debt to capitalization calculation, capitalization is defined as total debt plus total shareholders’ equity.
|
|
h.
|
In fiscal 2016, we changed our methodology of calculating the book value per share to include the remaining minimum shares that will be issued from our tangible equity units for each period presented above.
|
|
i.
|
"EBITDA" is a Non-GAAP measure and defined as net income less interest income, plus interest, taxes, depreciation and amortization. A reconciliation of net income to EBITDA immediately follows.
|
21
EBITDA RECONCILIATIONS
A reconciliation of net income to EBITDA is as follows:
|
in millions, except ratio data
|
|||||||||||||||||||
|
2016
|
|
2015
|
|
2014
|
|
2013
|
|
2012
|
|
||||||||||
|
Net income
|
$
|
1,772
|
|
$
|
1,224
|
|
$
|
856
|
|
$
|
778
|
|
$
|
576
|
|
||||
|
Less: Interest income
|
(6
|
)
|
(9
|
)
|
(7
|
)
|
(7
|
)
|
(12
|
)
|
|||||||||
|
Add: Interest expense
|
249
|
|
293
|
|
132
|
|
145
|
|
356
|
|
|||||||||
|
Add: Income tax expense (a)
|
826
|
|
697
|
|
396
|
|
411
|
|
351
|
|
|||||||||
|
Add: Depreciation
|
617
|
|
609
|
|
494
|
|
474
|
|
443
|
|
|||||||||
|
Add: Amortization (b)
|
80
|
|
92
|
|
26
|
|
17
|
|
17
|
|
|||||||||
|
EBITDA
|
$
|
3,538
|
|
$
|
2,906
|
|
$
|
1,897
|
|
$
|
1,818
|
|
$
|
1,731
|
|
||||
|
Total gross debt (c)
|
$
|
6,279
|
|
$
|
6,690
|
|
$
|
8,128
|
|
$
|
2,398
|
|
$
|
2,418
|
|
||||
|
Less: Cash and cash equivalents
|
(349
|
)
|
(688
|
)
|
(438
|
)
|
(1,145
|
)
|
(1,071
|
)
|
|||||||||
|
Less: Short-term investments
|
(4
|
)
|
(2
|
)
|
(1
|
)
|
(1
|
)
|
(3
|
)
|
|||||||||
|
Total net debt
|
$
|
5,926
|
|
$
|
6,000
|
|
$
|
7,689
|
|
$
|
1,252
|
|
$
|
1,344
|
|
||||
|
Ratio Calculations:
|
|||||||||||||||||||
|
Gross debt/EBITDA
|
1.8x
|
|
2.3x
|
|
4.3x
|
|
1.3x
|
|
1.4x
|
|
|||||||||
|
Net debt/EBITDA
|
1.7x
|
|
2.1x
|
|
4.1x
|
|
0.7x
|
|
0.8x
|
|
|||||||||
|
(a)
|
Includes income tax expense of discontinued operation.
|
|
(b)
|
Excludes the amortization of debt discount expense of
$8 million
,
$10 million
, $10 million, $28 million and $39 million for fiscal 2016, 2015, 2014, 2013 and 2012, respectively, as it is included in Interest expense.
|
|
(c)
|
In fiscal 2016, we adopted new accounting guidance, retrospectively, requiring classification of debt issuance costs as a reduction of the carrying value of the debt. In doing so, $29 million, $35 million, $50 million, $10 million and $14 million of deferred issuance costs have been reclassified from Other Assets to Long-Term Debt in our Consolidated Balance Sheets for fiscal 2016, 2015, 2014, 2013 and 2012, respectively.
|
EBITDA represents net income, net of interest, income tax and depreciation and amortization. Net debt to EBITDA represents the ratio of our debt, net of cash and short-term investments, to EBITDA. EBITDA and net debt to EBITDA are presented as supplemental financial measurements in the evaluation of our business. We believe the presentation of these financial measures helps investors to assess our operating performance from period to period, including our ability to generate earnings sufficient to service our debt, and enhances understanding of our financial performance and highlights operational trends. These measures are widely used by investors and rating agencies in the valuation, comparison, rating and investment recommendations of companies; however, the measurements of EBITDA and net debt to EBITDA may not be comparable to those of other companies, which limits their usefulness as comparative measures. EBITDA and net debt to EBITDA are not measures required by or calculated in accordance with generally accepted accounting principles (GAAP) and should not be considered as substitutes for net income or any other measure of financial performance reported in accordance with GAAP or as a measure of operating cash flow or liquidity. EBITDA is a useful tool for assessing, but is not a reliable indicator of, our ability to generate cash to service our debt obligations because certain of the items added to net income to determine EBITDA involve outlays of cash. As a result, actual cash available to service our debt obligations will be different from EBITDA. Investors should rely primarily on our GAAP results, and use non-GAAP financial measures only supplementally, in making investment decisions.
22
DESCRIPTION OF THE COMPANY
We are one of the world's largest food companies with leading brands such as Tyson®, Jimmy Dean®, Hillshire Farm®, Sara Lee®, Ball Park®, Wright®, Aidells® and State Fair®. We are a recognized market leader in chicken, beef and pork as well as prepared foods, including bacon, breakfast sausage, turkey, lunchmeat, hot dogs, pizza crusts and toppings, tortillas and desserts. Some of the key factors influencing our business are customer demand for our products; the ability to maintain and grow relationships with customers and introduce new and innovative products to the marketplace; accessibility of international markets; market prices for our products; the cost and availability of live cattle and hogs, raw materials, and feed ingredients; and operating efficiencies of our facilities.
We operate in four reportable segments: Chicken, Beef, Pork and Prepared Foods. Other primarily includes our foreign chicken production operations in China and India and third-party merger and integration costs.
On August 28, 2014, we acquired and consolidated The Hillshire Brands Company ("Hillshire Brands"), a manufacturer and marketer of branded, convenient foods. Hillshire Brands results from operations subsequent to the acquisition closing are included in the Prepared Foods segment.
OVERVIEW
|
•
|
Fiscal year – Our accounting cycle resulted in a 52-week year for both fiscal 2016 and 2014 and a 53-week year for fiscal 2015.
|
|
•
|
General – Our operating income grew 31% in fiscal 2016 over fiscal 2015, which was led by the Beef segment's $413 million improvement in operating income and record earnings in our Prepared Foods segment, as well as continued strong performance in the Chicken and Pork segments. Sales decreased 11% in fiscal 2016 over fiscal 2015, primarily due to declining beef prices, the impact of an additional week in fiscal 2015 and the sale of our Brazil and Mexico chicken production operations. We continued to execute our strategy of accelerating growth in domestic value-added chicken sales, prepared food sales, innovating products, services and customer insights and cultivating our talent development to support Tyson's growth for the future.
|
|
•
|
Integration – We continue to maintain focus on the integration of Hillshire Brands and synergy capture. We expect to realize synergies of around $675 million in fiscal 2017 from the acquisition as well as our profit improvement plan for our legacy Prepared Foods business. The amount expected to be realized in fiscal 2017 is reduced from our previous estimate of $700 million as some of the incremental synergies are now expected to be realized in fiscal 2018. The majority of these benefits are expected to be realized in the Prepared Foods segment. We will continue to invest a portion of the synergies in innovation, new product launches and support the growth of our brands. In fiscal 2016, we captured $258 million of incremental synergies above the $322 million captured in fiscal 2015, for a total of $580 million of synergies realized in fiscal 2016.
|
|
•
|
Market Environment – Domestic protein production (chicken, beef, pork and turkey according to the USDA) increased approximately 3% in fiscal 2016 over fiscal 2015 and export market conditions experienced some improvement over fiscal 2015. Our Chicken segment delivered strong results in fiscal 2016 driven by favorable demand for our products and lower feed costs. The Beef segment earnings improved over fiscal 2015 due to more favorable market conditions associated with an increase in cattle supply which resulted in lower fed cattle costs. The Pork segment's operating margin was above its normalized range as domestic market conditions were favorable with lower livestock cost and increased demand for our pork products. Our Prepared Foods segment delivered record operating income as we continued to realize synergies and lower input costs, partially offset with higher marketing, advertising, and promotion spend.
|
|
•
|
Margins – Our total operating margin was
7.7%
in fiscal
2016
. Operating margins by segment were as follows:
|
|
•
|
Chicken –
11.9%
|
|
•
|
Beef –
2.4%
|
|
•
|
Pork –
10.8%
|
|
•
|
Prepared Foods –
10.0%
|
|
•
|
Liquidity – During fiscal
2016
, we generated
$2.7 billion
of operating cash flows. We repurchased
30.8 million
shares of our Class A common stock for
$1,868 million
under our share repurchase program in fiscal
2016
. At
October 1, 2016
, we had
$1.3 billion
of liquidity, which included the availability under our revolving credit facility and
$349 million
of cash and cash equivalents.
|
23
|
in millions, except per share data
|
|||||||||||
|
2016
|
|
2015
|
|
2014
|
|
||||||
|
Net income attributable to Tyson
|
$
|
1,768
|
|
$
|
1,220
|
|
$
|
864
|
|
||
|
Net income attributable to Tyson - per diluted share
|
4.53
|
|
2.95
|
|
2.37
|
|
|||||
2016
– Included the following items:
|
•
|
$53 million, or $0.14 per diluted share, related to recognition of previously unrecognized tax benefits and audit settlements.
|
2015
– Included the following items:
|
•
|
$169 million, or ($0.41) per diluted share, related to an impairment charge in China.
|
|
•
|
$59 million, or ($0.09) per diluted share, related to Prepared Foods network optimization impairment charges.
|
|
•
|
$57 million, or ($0.09) per diluted share, related to merger and integration costs.
|
|
•
|
$12 million, or ($0.02) per diluted share, related to closure and impairment charges related to the ceasing of beef operations at our Denison facility.
|
|
•
|
$161 million, or $0.24 per diluted share, related to a gain on sale of the Mexico operation.
|
|
•
|
$39 million, or $0.06 per diluted share, related to the additional week in fiscal 2015.
|
|
•
|
$26 million, or $0.06 per diluted share, related to recognition of previously unrecognized tax benefits.
|
|
•
|
$21 million, or $0.03 per diluted share, related to a gain on sale of equity securities.
|
|
•
|
$8 million, or $0.02 per diluted share, of insurance proceeds (net of costs) related to a legacy Hillshire Brands plant fire.
|
2014
– Included the following items (fiscal 2014 per diluted share adjustments utilized a weighted average shares outstanding amount of 356 million):
|
•
|
$197 million, or ($0.37) per diluted share, related to the Hillshire Brands acquisition, integration and costs associated with our Prepared Foods improvement plan.
|
|
•
|
$42 million, or ($0.16) per diluted share, related to an impairment in our Brazil operation and Mexico undistributed earnings tax.
|
|
•
|
$40 million, or ($0.07) per diluted share, related to the Hillshire Brands post-closing results, purchase price accounting adjustments and costs related to a legacy Hillshire Brands plant fire.
|
|
•
|
$27 million, or ($0.12) per diluted share, related to the Hillshire Brands acquisition financing incremental interest costs and share dilution.
|
|
•
|
$52 million, or $0.15 per diluted share, related to a gain from previously unrecognized tax benefits.
|
SUMMARY OF RESULTS
|
Sales
|
in millions
|
||||||||||
|
2016
|
|
2015
|
|
2014
|
|
||||||
|
Sales
|
$
|
36,881
|
|
$
|
41,373
|
|
$
|
37,580
|
|
||
|
Change in sales volume
|
(4.6
|
)%
|
5.0
|
%
|
|||||||
|
Change in average sales price
|
(6.5
|
)%
|
4.8
|
%
|
|||||||
|
Sales growth
|
(10.9
|
)%
|
10.1
|
%
|
|||||||
2016 vs. 2015
–
|
•
|
Sales Volume
– Sales were negatively impacted by lower sales volume, which accounted for a decrease of $1.9 billion. Each segment had a decline in sales volume primarily attributed to the additional week in fiscal 2015. The decrease in sales volume was also attributable to the divestitures of the Mexico and Brazil chicken production operations in fiscal 2015. When excluding these impacts along with the divestiture of our Heinold Hog Markets business in the first quarter of fiscal 2015, total company sales volume increased 0.1%.
|
|
•
|
Average Sales Price
– Sales were negatively impacted by lower average sales prices, which accounted for a decrease of $2.6 billion. Each segment had a decrease in average sales prices largely due to decreased pricing associated with lower beef, pork, and chicken prices, with the largest decrease in the Beef segment.
|
24
2015 vs. 2014
–
|
•
|
Sales Volume
– Sales were positively impacted by higher sales volume, which accounted for an increase of $2.4 billion. The Chicken segment had an increase in sales volume primarily due to an extra week in fiscal 2015, and the Prepared Foods segment had an increase in sales volume primarily due to the acquisition and consolidation of Hillshire Brands in our final month of fiscal 2014 in addition to an extra week in fiscal 2015. The increase in sales volume was partially offset by a decrease in the Beef and Pork segments along with the divestitures of the Mexico and Brazil chicken operations in fiscal 2015.
|
|
•
|
Average Sales Price
– Sales were positively impacted by higher average sales prices, which accounted for an increase of $1.4 billion. The Beef and Prepared Foods segments each had an increase in average sales prices, partially offset by a decrease in average sales prices in the Chicken and Pork segments. The increase in average sales price was largely due to continued tight domestic availability of beef products along with the change in mix in the Prepared Foods segment as a result of the acquisition and consolidation of Hillshire Brands in our final month of fiscal 2014.
|
|
Cost of Sales
|
in millions
|
||||||||||
|
2016
|
|
2015
|
|
2014
|
|
||||||
|
Cost of sales
|
$
|
32,184
|
|
$
|
37,456
|
|
$
|
34,895
|
|
||
|
Gross profit
|
4,697
|
|
3,917
|
|
2,685
|
|
|||||
|
Cost of sales as a percentage of sales
|
87.3
|
%
|
90.5
|
%
|
92.9
|
%
|
|||||
2016 vs. 2015
–
|
•
|
Cost of sales decreased by approximately $5.3 billion. Lower input costs per pound decreased cost of sales approximately $3.6 billion and lower sales volume decreased cost of sales approximately $1.7 billion.
|
|
•
|
The approximate $3.6 billion impact of lower input costs was primarily driven by:
|
|
•
|
Decrease in live cattle cost of approximately $2.6 billion in our Beef segment.
|
|
•
|
Decrease in live hog costs of approximately $360 million in our Pork segment.
|
|
•
|
Decrease in raw material and other input costs of approximately $300 million in our Prepared Foods segment.
|
|
•
|
Decreases in feed costs of approximately $170 million in our Chicken segment.
|
|
•
|
Decrease due to net realized derivative gains of $96 million in fiscal 2016, compared to net realized derivative losses of $102 million in fiscal 2015 due to our risk management activities. These amounts exclude offsetting impacts from related physical purchase transactions, which are included in the change in live cattle and hog costs and raw material and feed costs described above. Additionally, cost of sales increased due to net unrealized gains of $11 million in fiscal 2016, compared to net unrealized gains of $80 million in fiscal 2015, primarily due to our Chicken, Beef and Pork segment commodity risk management activities.
|
|
•
|
The $1.7 billion impact of lower sales volume was primarily due to the sale of our Mexico chicken production operation in fiscal 2015 along with the additional week in fiscal 2015.
|
2015 vs. 2014
–
|
•
|
Cost of sales increased by approximately $2.6 billion. Higher input costs per pound increased cost of sales approximately $330 million and higher sales volume increased cost of sales approximately $2.3 billion.
|
|
•
|
The approximate $330 million impact of higher input costs was primarily driven by:
|
|
•
|
Increase in live cattle cost of approximately $1.1 billion and operating costs of approximately $90 million in our Beef segment.
|
|
•
|
Increase in input cost per pound related to the acquisition of Hillshire Brands on August 28, 2014.
|
|
•
|
Increase of $49 million and $12 million related to Prepared Foods network optimization impairment charges and Denison plant impairment and closure costs, respectively.
|
|
•
|
Decrease in live hog costs of approximately $500 million in our Pork segment.
|
|
•
|
Decrease in raw material and other input costs of approximately $290 million in our Prepared Foods segment.
|
|
•
|
Decreases in feed costs of approximately $450 million in our Chicken segment.
|
|
•
|
Decrease due to net unrealized gains of $55 million in fiscal 2015, compared to net unrealized losses of $39 million in fiscal 2014, from our Beef and Pork segment commodity risk management activities.
|
|
•
|
The $2.3 billion impact of higher sales volume was driven by an increase in sales volume in our Chicken and Prepared Foods segments, partially offset by decreases in sales volume in our Beef and Pork segments. Prepared Foods contributed a majority of the increase due to the acquisition of Hillshire Brands on August 28, 2014, in addition to the extra week in fiscal 2015.
|
25
|
Selling, General and Administrative
|
in millions
|
||||||||||
|
2016
|
|
2015
|
|
2014
|
|
||||||
|
Selling, general and administrative
|
$
|
1,864
|
|
$
|
1,748
|
|
$
|
1,255
|
|
||
|
As a percentage of sales
|
5.1
|
%
|
4.2
|
%
|
3.3
|
%
|
|||||
2016 vs. 2015
–
|
•
|
Increase of $116 million in selling, general and administrative was primarily driven by:
|
|
•
|
Increase of $88 million related to marketing, advertising and promotion expense to drive sales growth.
|
|
•
|
Increase of $71 million of employee costs including payroll and stock-based and incentive-based compensation.
|
|
•
|
Increase of $11 million related to bad debt expense.
|
|
•
|
Increase of $17 million in all other primarily related to professional fees, information technology costs and rent.
|
|
•
|
Decrease of $26 million due to a reduction in amortization and other expense related to our intangible assets.
|
|
•
|
Decrease of $25 million related to fiscal 2015 sale of our chicken production operations in Brazil and Mexico.
|
|
•
|
Decrease of $20 million of merger and integration costs.
|
2015 vs. 2014
–
|
•
|
Increase of $493 million in selling, general and administrative was primarily driven by:
|
|
•
|
Increase of $487 million related to the inclusion of Hillshire Brands in fiscal 2015 results with only one month in fiscal 2014 results.
|
|
•
|
Increase of $69 million related to incremental amortization associated with the acquired Hillshire Brands' intangibles.
|
|
•
|
Increase of $27 million related to employee costs including payroll and stock-based compensation.
|
|
•
|
Decrease of $59 million related to advertising and sales promotions in the legacy Tyson business primarily attributable to discontinuing certain programs that were present in fiscal 2014.
|
|
•
|
Decrease of $14 million related to merger and integration costs and employee severance and retention costs associated with the Hillshire Brands acquisition and implementation of our Prepared Foods strategy.
|
|
•
|
Decrease of $17 million in all other primarily related to professional fees.
|
|
Interest Income
|
in millions
|
||||||||||
|
2016
|
|
2015
|
|
2014
|
|
||||||
|
$
|
(6
|
)
|
$
|
(9
|
)
|
$
|
(7
|
)
|
|||
2016/2015/2014
– Interest income remained relatively flat due to continued low interest rates.
|
Interest Expense
|
in millions
|
||||||||||
|
2016
|
|
2015
|
|
2014
|
|
||||||
|
Cash interest expense
|
$
|
248
|
|
$
|
293
|
|
$
|
132
|
|
||
|
Non-cash interest expense
|
1
|
|
—
|
|
—
|
|
|||||
|
Total Interest Expense
|
$
|
249
|
|
$
|
293
|
|
$
|
132
|
|
||
2016/2015/2014
–
|
•
|
Cash interest expense primarily included interest expense related to the coupon rates for senior notes and term loans and commitment/letter of credit fees incurred on our revolving credit facilities. The decrease in cash interest expense in fiscal 2016 was primarily due to a reduction of our debt. The increase in cash interest expense in fiscal 2015 was primarily due to senior notes and term loans issued and debt assumed in connection with our completed acquisition of Hillshire Brands on August 28, 2014.
|
|
•
|
Non-cash interest expense primarily included amounts related to the amortization of debt issuance costs and discounts/premiums on note issuances, offset by interest capitalized.
|
|
Other (Income) Expense, net
|
in millions
|
||||||||||
|
2016
|
|
2015
|
|
2014
|
|
||||||
|
$
|
(8
|
)
|
$
|
(36
|
)
|
$
|
53
|
|
|||
2016
– Included $12 million of equity earnings in joint ventures and $4 million in net foreign currency exchange losses.
2015
– Included $12 million of equity earnings in joint ventures and $21 million of gains on the sale of equity securities.
2014
–
Included $60 million of costs associated with bridge financing facilities for the Hillshire Brands acquisition and $6 million of other than temporary impairment related to an available-for-sale security, partially offset with $14 million of equity earnings in joint ventures and net foreign currency exchange gains.
26
|
Effective Tax Rate
|
||||||||
|
2016
|
|
2015
|
|
2014
|
|
|||
|
31.8
|
%
|
36.3
|
%
|
31.6
|
%
|
|||
The effective tax rate on continuing operations was impacted by a number of items which result in a difference between our effective tax rate and the United States statutory rate of 35%. The table below reflects significant items impacting the rate as indicated.
2016
–
|
•
|
Domestic production activity deduction reduced the rate 2.6%.
|
|
•
|
Unrecognized tax benefits activity, mostly related to expiration of statutes of limitations and settlements with taxing authorities, reduced the rate 1.7%.
|
|
•
|
State income taxes increased the rate 2.7%.
|
2015
–
|
•
|
Domestic production activity deduction reduced the rate 3.7%.
|
|
•
|
Unrecognized tax benefits activity, mostly related to expiration of statutes of limitations, reduced the rate 1.8%.
|
|
•
|
State income taxes increased the rate 3.1%.
|
|
•
|
Foreign rate differences and valuation allowances increased the rate 3.8%.
|
2014
–
|
•
|
Domestic production activity deduction reduced the rate 4.0%.
|
|
•
|
Net decrease in unrecognized tax benefits, mostly related to expiration of statutes of limitations and settlements with taxing authorities, reduced the rate 4.7%.
|
|
•
|
State income taxes increased the rate 2.8%.
|
|
•
|
Foreign rate differences and valuation allowances increased the rate 2.8%.
|
SEGMENT RESULTS
We operate in four reportable segments: Chicken, Beef, Pork and Prepared Foods. Other primarily includes our foreign chicken production operations in China and India and third-party merger and integration costs. Additionally, the results from Dynamic Fuels, which was sold in fiscal 2014, are also included in Other fiscal 2014 results until the closing date of such sale. The following table is a summary of segment sales and operating income (loss), which is how we measure segment income (loss).
|
in millions
|
|
||||||||||||||||||||||
|
Sales
|
Operating Income (Loss)
|
||||||||||||||||||||||
|
2016
|
|
2015
|
|
2014
|
|
2016
|
|
2015
|
|
2014
|
|
||||||||||||
|
Chicken
|
$
|
10,927
|
|
$
|
11,390
|
|
$
|
11,116
|
|
$
|
1,305
|
|
$
|
1,366
|
|
$
|
883
|
|
|||||
|
Beef
|
14,513
|
|
17,236
|
|
16,177
|
|
347
|
|
(66
|
)
|
347
|
|
|||||||||||
|
Pork
|
4,909
|
|
5,262
|
|
6,304
|
|
528
|
|
380
|
|
455
|
|
|||||||||||
|
Prepared Foods
|
7,346
|
|
7,822
|
|
3,927
|
|
734
|
|
588
|
|
(60
|
)
|
|||||||||||
|
Other
|
380
|
|
879
|
|
1,381
|
|
(81
|
)
|
(99
|
)
|
(195
|
)
|
|||||||||||
|
Intersegment Sales
|
(1,194
|
)
|
(1,216
|
)
|
(1,325
|
)
|
—
|
|
—
|
|
—
|
|
|||||||||||
|
Total
|
$
|
36,881
|
|
$
|
41,373
|
|
$
|
37,580
|
|
$
|
2,833
|
|
$
|
2,169
|
|
$
|
1,430
|
|
|||||
27
|
Chicken Segment Results
|
in millions
|
|
|||||||||||||||||
|
2016
|
|
2015
|
|
Change 2016
vs. 2015
|
|
2014
|
|
Change 2015
vs. 2014 |
|
||||||||||
|
Sales
|
$
|
10,927
|
|
$
|
11,390
|
|
$
|
(463
|
)
|
$
|
11,116
|
|
$
|
274
|
|
||||
|
Sales Volume Change
|
(2.6
|
)%
|
4.2
|
%
|
|||||||||||||||
|
Average Sales Price Change
|
(1.5
|
)%
|
(1.6
|
)%
|
|||||||||||||||
|
Operating Income
|
$
|
1,305
|
|
$
|
1,366
|
|
$
|
(61
|
)
|
$
|
883
|
|
$
|
483
|
|
||||
|
Operating Margin
|
11.9
|
%
|
12.0
|
%
|
7.9
|
%
|
|||||||||||||
2016 vs. 2015
–
|
•
|
Sales Volume
– Sales volume decreased primarily due to the additional week in fiscal 2015, in addition to a planned temporary decrease in production in the fourth quarter of fiscal 2016 while we transitioned our mix to sell more value-added and less commodity products along with optimizing our mix and our buy versus grow strategy.
|
|
•
|
Average Sales Price
– Average sales price decreased as feed costs declined, partially offset by mix changes.
|
|
•
|
Operating Income
– Operating income was negatively impacted by the additional week in fiscal 2015 along with increases in operating costs and marketing, advertising and promotion expenses, partially offset by lower feed costs of $170 million.
|
2015 vs. 2014
–
|
•
|
Sales Volume
– Sales volume grew as a result of the additional week in fiscal 2015 as well as stronger demand for chicken products and mix of rendered product sales.
|
|
•
|
Average Sales Price
– Average sales price decreased as feed ingredient costs declined, partially offset by mix changes.
|
|
•
|
Operating Income
–
Operating income increased due to higher sales volume and lower feed ingredient costs of $450 million, partially offset by disruptions caused by export bans.
|
|
Beef Segment Results
|
in millions
|
|
|||||||||||||||||
|
2016
|
|
2015
|
|
Change 2016 vs. 2015
|
|
2014
|
|
Change 2015
vs. 2014 |
|
||||||||||
|
Sales
|
$
|
14,513
|
|
$
|
17,236
|
|
$
|
(2,723
|
)
|
$
|
16,177
|
|
$
|
1,059
|
|
||||
|
Sales Volume Change
|
(1.1
|
)%
|
(0.3
|
)%
|
|||||||||||||||
|
Average Sales Price Change
|
(14.9
|
)%
|
6.9
|
%
|
|||||||||||||||
|
Operating Income (Loss)
|
$
|
347
|
|
$
|
(66
|
)
|
$
|
413
|
|
$
|
347
|
|
$
|
(413
|
)
|
||||
|
Operating Margin
|
2.4
|
%
|
(0.4
|
)%
|
2.1
|
%
|
|||||||||||||
2016 vs. 2015
–
|
•
|
Sales Volume
– Sales volume decreased due to the additional week in fiscal 2015. When excluding the additional week in fiscal 2015, sales volume increased 0.8% due to increased availability of cattle supply and better demand for our beef products despite a reduction in live cattle processing capacity due to the closure of our Denison, Iowa, facility in the fourth quarter of fiscal 2015.
|
|
•
|
Average Sales Price
–
Average sales price decreased due to higher domestic availability of beef supplies and lower livestock cost.
|
|
•
|
Operating Income
–
Operating income increased due to more favorable market conditions as we maximized our revenues relative to the decline in live fed cattle cost, in addition to reduced losses from mark-to-market open derivative positions and lower-of-cost-or market inventory adjustments that were incurred in the fourth quarter of fiscal 2015, partially offset by higher operating costs.
|
2015 vs. 2014
–
|
•
|
Sales Volume
– Sales volume decreased due to reduced live cattle supplies available to process, partially offset by an additional week in fiscal 2015.
|
|
•
|
Average Sales Price
–
Average sales price increased due to lower domestic availability of beef products.
|
|
•
|
Operating Income
–
Operating income decreased due to unfavorable market conditions associated with a decrease in supply which drove up fed cattle costs, export market disruptions, the relative value of competing proteins and increased operating costs. Additionally, in fiscal 2015, we incurred $12 million in Denison plant impairment and closure costs and $81 million of losses from mark-to-market open derivative positions and lower-of-cost-or-market inventory adjustments, which was mostly the result of a large and rapid decline in live cattle futures in September of fiscal 2015.
|
28
|
Pork Segment Results
|
in millions
|
|
|||||||||||||||||
|
2016
|
|
2015
|
|
Change 2016 vs. 2015
|
|
2014
|
|
Change 2015 vs. 2014
|
|
||||||||||
|
Sales
|
$
|
4,909
|
|
$
|
5,262
|
|
$
|
(353
|
)
|
$
|
6,304
|
|
$
|
(1,042
|
)
|
||||
|
Sales Volume Change
|
(2.5
|
)%
|
(0.8
|
)%
|
|||||||||||||||
|
Average Sales Price Change
|
(4.4
|
)%
|
(15.8
|
)%
|
|||||||||||||||
|
Operating Income
|
$
|
528
|
|
$
|
380
|
|
$
|
148
|
|
$
|
455
|
|
$
|
(75
|
)
|
||||
|
Operating Margin
|
10.8
|
%
|
7.2
|
%
|
7.2
|
%
|
|||||||||||||
2016 vs. 2015
–
|
•
|
Sales Volume
– Sales volume decreased due to the divestiture of our Heinold Hog Markets business in the first quarter of fiscal 2015 and the additional week in fiscal 2015. Excluding these impacts, sales volume grew 1.2%, driven by better demand for our pork products.
|
|
•
|
Average Sales Price
–
Average sale price decreased due to increased live hog supplies and lower livestock cost.
|
|
•
|
Operating Income
– Operating income increased as we maximized our revenues relative to the decline in live hog markets and due to better plant utilization associated with increased volume processed, which were partially offset by higher operating costs, losses incurred in our live hog operation and the additional week in fiscal 2015.
|
2015 vs. 2014
–
|
•
|
Sales Volume
– Sales volume decreased due to the divestiture of our Heinold Hog Markets business in the first quarter of fiscal 2015. Excluding the impact of the divestiture, we had a 5.4% increase in sales volume as a result of the additional week in fiscal 2015 as well as better demand for our pork products.
|
|
•
|
Average Sales Price
–
Average sales price decreased due to an increase in live hog supplies, which drove down livestock cost and average sales price.
|
|
•
|
Operating Income
– While reduced compared to prior year, operating income remained strong as we maximized our revenues relative to live hog markets, partially attributable to operational and mix performance.
|
|
Prepared Foods Segment Results
|
in millions
|
||||||||||||||||||
|
2016
|
|
2015
|
|
Change 2016 vs. 2015
|
|
2014
|
|
Change 2015
vs. 2014
|
|
||||||||||
|
Sales
|
$
|
7,346
|
|
$
|
7,822
|
|
$
|
(476
|
)
|
$
|
3,927
|
|
$
|
3,895
|
|
||||
|
Sales Volume Change
|
(2.8
|
)%
|
70.7
|
%
|
|||||||||||||||
|
Average Sales Price Change
|
(3.4
|
)%
|
16.7
|
%
|
|||||||||||||||
|
Operating Income (Loss)
|
$
|
734
|
|
$
|
588
|
|
$
|
146
|
|
$
|
(60
|
)
|
$
|
648
|
|
||||
|
Operating Margin
|
10.0
|
%
|
7.5
|
%
|
(1.5
|
)%
|
|||||||||||||
2016 vs. 2015
–
|
•
|
Sales Volume
– Sales volume decreased due to the additional week in fiscal 2015 and lower sales volume in the first six months of fiscal 2016 due to changes in sales mix and the carryover effect of the 2015 turkey avian influenza occurrence into the first half of fiscal 2016.
|
|
•
|
Average Sales Price
–
Average sales price decreased primarily due to a decline in input costs, partially offset by a change in product mix.
|
|
•
|
Operating Income
–
Operating income increased due to mix changes as well as lower input costs of approximately $300 million, partially offset with higher marketing, advertising, and promotion spend along with the additional week in fiscal 2015. Additionally, Prepared Foods operating income was positively impacted by $441 million in synergies, of which $156 million was incremental synergies in fiscal 2016 above the $285 million of synergies realized in fiscal 2015. The positive impact of these synergies to operating income was partially offset with heavy investments in innovation, new product launches and supporting the growth of our brands.
|
29
2015 vs. 2014
–
|
•
|
Sales Volume
– Sales volume increased due to incremental volumes from the acquisition of Hillshire Brands and an additional week in fiscal 2015.
|
|
•
|
Average Sales Price
–
Average sales price increased primarily due to better product mix which was positively impacted by the acquisition of Hillshire Brands.
|
|
•
|
Operating Income
–
Operating income improved due to an increase in sales volume and average sales price mainly attributed to Hillshire Brands, as well as lower raw material costs of approximately $290 million for fiscal 2015 related to our legacy Prepared Foods business. Profit improvement initiatives and Hillshire Brands synergies positively impacted Prepared Foods operating income by $285 million for fiscal 2015. Additionally, in the fourth quarter of fiscal 2015, we incurred $59 million in impairment charges associated with optimizing our Prepared Foods network.
|
|
Other Results
|
in millions
|
||||||||||||||||||
|
2016
|
|
2015
|
|
Change 2016
vs. 2015 |
|
2014
|
|
Change 2015
vs. 2014
|
|
||||||||||
|
Sales
|
$
|
380
|
|
$
|
879
|
|
$
|
(499
|
)
|
$
|
1,381
|
|
$
|
(502
|
)
|
||||
|
Operating Loss
|
(81
|
)
|
(99
|
)
|
18
|
|
(195
|
)
|
96
|
|
|||||||||
2016 vs. 2015
–
|
•
|
Sales
–
Sales decreased due to the sale of the Mexico and Brazil chicken production operations in fiscal 2015.
|
|
•
|
Operating loss
– Operating loss improved due to better performance at our China operation and reduced third-party merger and integration costs partially offset by the results of the Mexico chicken production operation sold in fiscal 2015.
|
2015 vs. 2014
–
|
•
|
Sales
–
Sales decreased due to the sale of the Mexico and Brazil chicken production operations in fiscal 2015.
|
|
•
|
Operating loss
–
Operating loss improved $69 million from our international operations due to the sale of our Brazil operation and better market conditions in Mexico (prior to its sale in the fourth quarter of fiscal 2015), partially offset by challenging market conditions in China. Additionally, third-party merger and integration costs decreased by $12 million and losses associated with Dynamic Fuels, which was sold in fiscal 2014, decreased $15 million.
|
30
LIQUIDITY AND CAPITAL RESOURCES
Our cash needs for working capital, capital expenditures, growth opportunities, the repurchases of senior notes, repayment of term loans and share repurchases are expected to be met with current cash on hand, cash flows provided by operating activities, or short-term borrowings. Based on our current expectations, we believe our liquidity and capital resources will be sufficient to operate our business. However, we may take advantage of opportunities to generate additional liquidity or refinance existing debt through capital market transactions. The amount, nature and timing of any capital market transactions will depend on our operating performance and other circumstances; our then-current commitments and obligations; the amount, nature and timing of our capital requirements; any limitations imposed by our current credit arrangements; and overall market conditions.
|
Cash Flows from Operating Activities
|
in millions
|
||||||||||
|
2016
|
|
2015
|
|
2014
|
|
||||||
|
Net income
|
$
|
1,772
|
|
$
|
1,224
|
|
$
|
856
|
|
||
|
Non-cash items in net income:
|
|||||||||||
|
Depreciation and amortization
|
705
|
|
711
|
|
530
|
|
|||||
|
Deferred income taxes
|
84
|
|
38
|
|
(105
|
)
|
|||||
|
Convertible debt discount
|
—
|
|
—
|
|
(92
|
)
|
|||||
|
Gain on dispositions of businesses
|
—
|
|
(177
|
)
|
—
|
|
|||||
|
Impairment of assets
|
45
|
|
285
|
|
107
|
|
|||||
|
Stock-based compensation expense
|
81
|
|
69
|
|
51
|
|
|||||
|
Other, net
|
(34
|
)
|
71
|
|
(20
|
)
|
|||||
|
Net changes in operating assets and liabilities
|
63
|
|
349
|
|
(149
|
)
|
|||||
|
Net cash provided by operating activities
|
$
|
2,716
|
|
$
|
2,570
|
|
$
|
1,178
|
|
||
|
•
|
Operating cash outflow associated with the convertible debt discount related to the initial debt discount of $92 million on our 3.25% convertible notes issued in 2008, which matured on October 15, 2013, and were retired in fiscal 2014.
|
|
•
|
Gain on dispositions of businesses in fiscal 2015 primarily relates to the sale of the Mexico chicken production operation. Impairment of assets in fiscal 2015 included $59 million of impairment charges related to our Prepared Foods network optimization and $169 million of impairments related to our China operation. For further description regarding these charges refer to Part II, Item 8, Notes to Consolidated Financial Statements, Note 3: Acquisitions and Dispositions and Note 9: Other Income and Charges.
|
|
•
|
Other, net increase in fiscal 2015 is primarily driven by non-cash pension expense.
|
|
•
|
Cash flows associated with changes in operating assets and liabilities:
|
|
•
|
2016 –
Increased primarily due to decreased inventory and accounts receivable balances and increased accrual for incentive compensation, which were partially offset by decreased accounts payable, increased tax receivable and contributions to pension plans. The decreased inventory, accounts receivable and accounts payable balances were largely due to decreased raw material costs and timing of sales and payments.
|
|
•
|
2015 –
Increased primarily due to the decrease in inventory and accounts receivable balances and an increase in taxes payable, partially offset by the decrease in accounts payable. The decreased inventory, accounts receivable and accounts payable balances were largely due to decreased raw material costs and timing of sales and payments.
|
|
•
|
2014 –
Decreased primarily due to the increase in inventory and accounts receivable balances and decrease in income taxes payable, partially offset by the increase in accounts payable. The higher inventory, accounts receivable and accounts payable balances are primarily attributable to significant increases in input costs and price increases associated with the increased input costs.
|
|
Cash Flows from Investing Activities
|
in millions
|
|
|||||||||
|
2016
|
|
2015
|
|
2014
|
|
||||||
|
Additions to property, plant and equipment
|
$
|
(695
|
)
|
$
|
(854
|
)
|
$
|
(632
|
)
|
||
|
(Purchases of)/Proceeds from marketable securities, net
|
(9
|
)
|
14
|
|
15
|
|
|||||
|
Acquisitions, net of cash acquired
|
—
|
|
—
|
|
(8,193
|
)
|
|||||
|
Proceeds from sale of businesses
|
—
|
|
539
|
|
—
|
|
|||||
|
Other, net
|
20
|
|
31
|
|
10
|
|
|||||
|
Net cash used for investing activities
|
$
|
(684
|
)
|
$
|
(270
|
)
|
$
|
(8,800
|
)
|
||
31
|
•
|
Additions to property, plant and equipment included acquiring new equipment and upgrading our facilities to maintain competitive standing and position us for future opportunities.
|
|
•
|
Capital spending for fiscal 2017 is expected to approximate $1.0 billion and will include spending for production growth, safety, animal well-being, infrastructure replacements and upgrades, and operational improvements that will result in production and labor efficiencies, yield improvements and sales channel flexibility.
|
|
•
|
Purchases of marketable securities included funding for our deferred compensation plans.
|
|
•
|
Proceeds from sale of businesses primarily included proceeds, net of cash transferred, from the sale of the Mexico and Brazil operations.
|
|
•
|
Acquisitions in fiscal 2014 related to acquiring Hillshire Brands and an additional value-added food business as part of our strategy to accelerate growth in our prepared foods sales. Both of these acquisitions are included in the Prepared Foods segment. For further description regarding these transactions refer to Part II, Item 8, Notes to Consolidated Financial Statements, Note 3: Acquisitions and Dispositions.
|
|
Cash Flows from Financing Activities
|
in millions
|
|
|||||||||
|
2016
|
|
2015
|
|
2014
|
|
||||||
|
Payments on debt
|
$
|
(714
|
)
|
$
|
(1,995
|
)
|
$
|
(639
|
)
|
||
|
Proceeds from issuance of long-term debt
|
1
|
|
501
|
|
5,576
|
|
|||||
|
Borrowings on revolving credit facility
|
1,065
|
|
1,345
|
|
—
|
|
|||||
|
Payments on revolving credit facility
|
(765
|
)
|
(1,345
|
)
|
—
|
|
|||||
|
Proceeds from issuance of debt component of tangible equity units
|
—
|
|
—
|
|
205
|
|
|||||
|
Proceeds from issuance of common stock, net of issuance costs
|
—
|
|
—
|
|
873
|
|
|||||
|
Net proceeds from issuance of equity component of tangible equity units
|
—
|
|
—
|
|
1,255
|
|
|||||
|
Purchases of Tyson Class A common stock
|
(1,944
|
)
|
(495
|
)
|
(295
|
)
|
|||||
|
Dividends
|
(216
|
)
|
(147
|
)
|
(104
|
)
|
|||||
|
Stock options exercised
|
128
|
|
84
|
|
67
|
|
|||||
|
Other, net
|
68
|
|
17
|
|
(23
|
)
|
|||||
|
Net cash provided by (used for) financing activities
|
$
|
(2,377
|
)
|
$
|
(2,035
|
)
|
$
|
6,915
|
|
||
|
•
|
Payments on debt included –
|
|
•
|
2016 – We fully retired the $638 million outstanding balance of our 6.60% senior notes due April 2016.
|
|
•
|
2015 – We fully retired the $401 million outstanding balance of the 2.75% senior notes due September 2015 and paid $353 million related to the 5-year tranche A term loan facility and $1,172 million related to the 3-year tranche A term loan facility.
|
|
•
|
2014 – Our 3.25% convertible notes issued in 2008 matured on October 15, 2013, at which time we paid the $458 million principal value with cash on hand and settled the conversion premium by issuing 11.7 million shares of our Class A stock from available treasury shares. These notes were initially recorded at a $92 million discount, which equaled the fair value of an equity conversion premium instrument. The portion of the payment of these notes related to the initial $92 million discount was recorded in cash flows from operating activities. Simultaneous to the settlement of the conversion premium, we received 11.7 million shares of our Class A stock from the call options purchased at the time of issuance of the notes.
|
|
•
|
2014 – $194 million related to the 5-year tranche A term loan facility and $30 million related to the 3-year tranche A term loan facility.
|
|
•
|
Proceeds from issuance of long-term debt and borrowings/payments on revolving credit facility –
|
|
•
|
2016 – We had borrowings of $1,065 million and payments of $765 million on our revolving credit facility for fiscal 2016. We utilized our revolving credit facility to balance our cash position with the retirement of the 2016 Notes and changes in working capital. Additionally, total debt of our foreign subsidiaries was $7 million at October 1, 2016, $6 million of which is classified as long-term in our Consolidated Balance Sheets.
|
|
•
|
2015 – $500 million from term loans, the full balance of which was used to prepay outstanding borrowings under the 3-year tranche A term loan facility. In addition, we had borrowings and payments on our revolver of $1,345 million for fiscal 2015. We utilized our revolving credit facility to balance our cash position with term loan deleveraging and changes in working capital. Additionally, total debt of our foreign subsidiaries was $10 million at October 3, 2015, all of which is classified as long-term in our Consolidated Balance Sheets.
|
|
•
|
2014 – $2,300 million from term loans and $3,243 million from senior unsecured notes after original issue discounts of $7 million. Additionally, total debt related to our foreign subsidiaries was $8 million at September 27, 2014, all of which is classified as long-term in our Consolidated Balance Sheets.
|
32
|
•
|
Proceeds from issuance of debt and equity components of tangible equity units –
|
|
•
|
2014 – We issued 30 million, 4.75% tangible equity units (TEUs). Total proceeds, net of underwriting discounts and other expenses, were $1,454 million. Each TEU is comprised of a prepaid stock purchase contract and a senior amortizing note due July 15, 2017. We allocated the proceeds from the issuance of the TEUs to equity and debt based on the relative fair values of the respective components of each TEU. The fair value of the prepaid stock purchase contracts, which was $1,295 million, is recorded in Capital in Excess of Par Value, net of $40 million issuance costs. The fair value of the senior amortizing notes was $205 million which was recorded in debt.
|
|
•
|
Proceeds from issuance of common stock, net of issuance costs –
|
|
•
|
2014 – We issued 23.8 million shares of our Class A common stock, for total proceeds, net of underwriting discounts and other offering related fees and expenses, of $873 million.
|
|
•
|
Purchases of Tyson Class A common stock include –
|
|
•
|
$1,868 million, $455 million and $250 million for shares repurchased pursuant to our share repurchase program in fiscal 2016, 2015 and 2014, respectively.
|
|
•
|
$76 million, $40 million and $45 million for shares repurchased to fund certain obligations under our equity compensation plans in fiscal 2016, 2015 and 2014, respectively.
|
|
•
|
We expect to continue repurchasing shares under our share repurchase program. As of October 1, 2016,
40.3 million
shares remain authorized for repurchases. The timing and extent to which we repurchase shares will depend upon, among other things, our working capital needs, markets, industry conditions, liquidity targets, limitations under our debt obligations and regulatory requirements.
|
|
•
|
Subsequent to October 1, 2016, through November 18, 2016, we repurchased $255 million, or approximately 3.6 million shares, of our common stock under our share repurchase program.
|
|
•
|
Dividends paid during fiscal 2016 included a 50% increase to our fiscal 2015 quarterly dividend rate.
|
|
•
|
Other, net increase in fiscal 2016 is primarily driven by tax benefits associated with stock option exercises.
|
|
Liquidity
|
in millions
|
|
||||||||||||||||
|
Commitments
Expiration Date
|
Facility
Amount
|
|
Outstanding Letters of
Credit under Revolving
Credit Facility (no draw downs)
|
|
Outstanding Amount
Borrowed
|
|
Amount
Available
|
|
||||||||||
|
Cash and cash equivalents
|
$
|
349
|
|
|||||||||||||||
|
Short-term investments
|
4
|
|
||||||||||||||||
|
Revolving credit facility
|
September 2019
|
$
|
1,250
|
|
$
|
7
|
|
$
|
300
|
|
943
|
|
||||||
|
Total liquidity
|
$
|
1,296
|
|
|||||||||||||||
|
•
|
The revolving credit facility supports our short-term funding needs and letters of credit. The letters of credit issued under this facility are primarily in support of leasing obligations and workers’ compensation insurance programs. Our maximum borrowing under the revolving credit facility during fiscal 2016 was $335 million.
|
|
•
|
We expect net interest expense will approximate $225 million for fiscal 2017.
|
|
•
|
At
October 1, 2016
, approximately $286 million of our cash was held in the international accounts of our foreign subsidiaries. Generally, we do not rely on the foreign cash as a source of funds to support our ongoing domestic liquidity needs. Rather, we manage our worldwide cash requirements by reviewing available funds among our foreign subsidiaries and the cost effectiveness with which those funds can be accessed. The repatriation of cash balances from certain of our foreign subsidiaries could have adverse tax consequences or be subject to regulatory capital requirements; however, those balances are generally available without legal restrictions to fund ordinary business operations. United States income taxes, net of applicable foreign tax credits, have not been provided on undistributed earnings of foreign subsidiaries. Our intention is to reinvest the cash held by foreign subsidiaries permanently or to repatriate the cash only when it is tax efficient to do so.
|
|
•
|
Our current ratio was
1.77
to 1 and
1.52
to 1 at
October 1, 2016
, and
October 3, 2015
, respectively.
|
33
Capital Resources
Credit Facility
Cash flows from operating activities and current cash on hand are our primary sources of liquidity for funding debt service, capital expenditures, dividends and share repurchases. We also have a revolving credit facility, with a committed capacity of $1.25 billion, to provide additional liquidity for working capital needs, letters of credit and a source of financing for growth opportunities. As of
October 1, 2016
, we had $300 million borrowed and $7 million of outstanding letters of credit issued under this facility, none of which were drawn upon, which left $943 million available for borrowing. Our revolving credit facility is funded by a syndicate of 42 banks, with commitments ranging from $0.3 million to $85 million per bank. The syndicate includes bank holding companies that are required to be adequately capitalized under federal bank regulatory agency requirements.
Capitalization
To monitor our credit ratings and our capacity for long-term financing, we consider various qualitative and quantitative factors. We monitor the ratio of our net debt to EBITDA as support for our long-term financing decisions. At
October 1, 2016
, and
October 3, 2015
, the ratio of our net debt to EBITDA was 1.7x and 2.1x, respectively. Refer to Part II, Item 6, Selected Financial Data, for an explanation and reconciliation to comparable GAAP measures. The decrease in this ratio for fiscal 2016 is primarily due to increased EBITDA of $632 million.
Credit Ratings
Term Loans: Tranche B due April 2019 and Tranche B due August 2019
S&P’s credit rating for both term loans is "BBB." Moody’s Investor Service, Inc. (Moody's) credit rating for both term loans is "Baa2." Fitch Ratings, a wholly owned subsidiary of Fimlac, S.A. (Fitch) credit rating for both term loans is "BBB." The below table outlines the borrowing spread on the outstanding principal balance depending on the rating levels of both term loans from S&P, Moody's and Fitch.
|
Ratings Level (S&P/Moody's/Fitch)
|
Tranche B due April 2019 Borrowing Spread
|
|
Tranche B due August 2019 Borrowing Spread
|
|
|
BBB+/Baa1/BBB+
|
1.000
|
%
|
1.250
|
%
|
|
BBB/Baa2/BBB (current level)
|
1.125
|
%
|
1.500
|
%
|
|
BBB-/Baa3/BBB-
|
1.375
|
%
|
1.750
|
%
|
|
BB+/Ba1/BB+
|
1.625
|
%
|
2.000
|
%
|
|
BB/Ba2/BB or lower
|
1.875
|
%
|
2.500
|
%
|
Revolving Credit Facility
S&P’s corporate credit rating for Tyson Foods, Inc. is "BBB." Moody’s, senior unsecured, long-term debt rating for Tyson Foods, Inc. is "Baa2." Fitch's issuer default rating for Tyson Foods, Inc. is "BBB." The below table outlines the fees paid on the unused portion of the facility (Facility Fee Rate) and letter of credit fees (Undrawn Letter of Credit Fee and Borrowing Spread) depending on the rating levels of Tyson Foods, Inc. from S&P, Moody's and Fitch.
|
Ratings Level (S&P/Moody's/Fitch)
|
Facility Fee
Rate
|
|
Undrawn Letter of
Credit Fee and
Borrowing Spread
|
|
|
A-/A3/A- or above
|
0.100
|
%
|
1.000
|
%
|
|
BBB+/Baa1/BBB+
|
0.125
|
%
|
1.125
|
%
|
|
BBB/Baa2/BBB (current level)
|
0.150
|
%
|
1.250
|
%
|
|
BBB-/Baa3/BBB-
|
0.200
|
%
|
1.500
|
%
|
|
BB+/Ba1/BB+ or lower
|
0.250
|
%
|
1.750
|
%
|
In the event the rating levels are split, the applicable fees and spread will be based upon the rating level in effect for two of the rating agencies, or, if all three rating agencies have different rating levels, the applicable fees and spread will be based upon the rating level that is between the rating levels of the other two rating agencies.
34
Our revolving credit and term loan facilities contain affirmative and negative covenants that, among other things, may limit or restrict our ability to: create liens and encumbrances; incur debt; merge, dissolve, liquidate or consolidate; make acquisitions and investments; dispose of or transfer assets; change the nature of our business; engage in certain transactions with affiliates; and enter into hedging transactions, in each case, subject to certain qualifications and exceptions. In addition, we are required to maintain minimum interest expense coverage and maximum debt-to-capitalization ratios.
Our senior notes also contain affirmative and negative covenants that, among other things, may limit or restrict our ability to: create liens; engage in certain sale/leaseback transactions; and engage in certain consolidations, mergers and sales of assets.
We were in compliance with all debt covenants at
October 1, 2016
.
Pension Plans
As further described in Part II, Item 8, Notes to Consolidated Financial Statements, Note 14: Pensions and Other Postretirement Benefits, the funded status of our defined benefit pension plans is defined as the amount the projected benefit obligation exceeds the plan assets. The funded status of the plans is an underfunded position of $
336 million
at the end of fiscal 2016 as compared to an underfunded position of $
410 million
at the end of fiscal 2015.
We expect to contribute approximately
$40 million
of cash to our pension plans in fiscal 2017 as compared to approximately
$64 million
in fiscal 2016 and
$14 million
in fiscal 2015. The exact amount of cash contributions made to pension plans in any year is dependent upon a number of factors, including minimum funding requirements. As a result, the actual funding in fiscal 2017 may be different from the estimate.
OFF-BALANCE SHEET ARRANGEMENTS
We do not have any off-balance sheet arrangements material to our financial position or results of operations. The off-balance sheet arrangements we have are guarantees of debt of outside third parties, including leases and grower loans, and residual value guarantees covering certain operating leases for various types of equipment. See Part II, Item 8, Notes to Consolidated Financial Statements, Note 19: Commitments and Contingencies for further discussion.
35
CONTRACTUAL OBLIGATIONS
The following table summarizes our contractual obligations as of
October 1, 2016
:
|
in millions
|
|
||||||||||||||||||
|
Payments Due by Period
|
|||||||||||||||||||
|
2017
|
|
2018-2019
|
|
2020-2021
|
|
2022 and thereafter
|
|
Total
|
|
||||||||||
|
Debt and capital lease obligations:
|
|||||||||||||||||||
|
Principal payments
(1)
|
$
|
79
|
|
$
|
2,487
|
|
$
|
295
|
|
$
|
3,439
|
|
$
|
6,300
|
|
||||
|
Interest payments
(2)
|
226
|
|
428
|
|
351
|
|
1,218
|
|
2,223
|
|
|||||||||
|
Guarantees
(3)
|
20
|
|
37
|
|
40
|
|
30
|
|
127
|
|
|||||||||
|
Operating lease obligations
(4)
|
118
|
|
158
|
|
73
|
|
78
|
|
427
|
|
|||||||||
|
Purchase obligations
(5)
|
1,817
|
|
539
|
|
207
|
|
106
|
|
2,669
|
|
|||||||||
|
Capital expenditures
(6)
|
720
|
|
151
|
|
—
|
|
—
|
|
871
|
|
|||||||||
|
Other long-term liabilities
(7)
|
—
|
|
—
|
|
—
|
|
—
|
|
548
|
|
|||||||||
|
Total contractual commitments
|
$
|
2,980
|
|
$
|
3,800
|
|
$
|
966
|
|
$
|
4,871
|
|
$
|
13,165
|
|
||||
|
(1)
|
In the event of a default on payment, acceleration of the principal payments could occur.
|
|
(2)
|
Interest payments include interest on all outstanding debt. Payments are estimated for variable rate and variable term debt based on effective interest rates at
October 1, 2016
, and expected payment dates.
|
|
(3)
|
Amounts include guarantees of debt of outside third parties, which consist of leases and grower loans, all of which are substantially collateralized by the underlying assets, as well as residual value guarantees covering certain operating leases for various types of equipment. The amounts included are the maximum potential amount of future payments.
|
|
(4)
|
Amounts include minimum lease payments under lease agreements.
|
|
(5)
|
Amounts include agreements to purchase goods or services that are enforceable and legally binding and specify all significant terms, including: fixed or minimum quantities to be purchased; fixed, minimum or variable price provisions; and the approximate timing of the transaction. The purchase obligations amount included items, such as future purchase commitments for grains, livestock contracts and fixed grower fees, that provide terms that meet the above criteria. For certain grain purchase commitments with a fixed quantity provision, we have assumed the future obligations under the commitment based on available commodity futures prices as published in observable active markets as of
October 1, 2016
. We have excluded future purchase commitments for contracts that do not meet these criteria. Purchase orders are not included in the table, as a purchase order is an authorization to purchase and is cancelable. Contracts for goods or services that contain termination clauses without penalty have also been excluded.
|
|
(6)
|
Amounts include estimated amounts to complete buildings and equipment under construction as of
October 1, 2016
.
|
|
(7)
|
Other long-term liabilities primarily consist of deferred compensation, deferred income, self-insurance, and asset retirement obligations. We are unable to reliably estimate the amount of these payments beyond fiscal 2017; therefore, we have only included the total liability in the table above. We also have employee benefit obligations consisting of pensions and other postretirement benefits of $359 million that are excluded from the table above. A discussion of the Company's pension and postretirement plans, including funding matters, is included in Part II, Item 8, Notes to Consolidated Financial Statements, Note 14: Pensions and Other Postretirement Benefits.
|
In addition to the amounts shown above in the table, we have unrecognized tax benefits of $283 million and related interest and penalties of
$52 million
at
October 1, 2016
, recorded as liabilities.
The maximum contractual obligation associated with our cash flow assistance programs at
October 1, 2016
, based on the estimated fair values of the livestock supplier’s net tangible assets on that date, aggregated to approximately
$380 million
, or approximately $378 million remaining maximum commitment after netting the cash flow assistance related receivables.
RECENTLY ISSUED/ADOPTED ACCOUNTING PRONOUNCEMENTS
Refer to the discussion under Part II, Item 8, Notes to Consolidated Financial Statements, Note 1: Business and Summary of Significant Accounting Policies and Note 2: Changes in Accounting Principles.
36
CRITICAL ACCOUNTING ESTIMATES
The preparation of consolidated financial statements requires us to make estimates and assumptions. These estimates and assumptions affect the reported amounts of assets and liabilities and disclosure of contingent assets and liabilities at the date of the consolidated financial statements and the reported amounts of revenues and expenses during the reporting period. Actual results could differ from those estimates. The following is a summary of certain accounting estimates we consider critical.
|
Description
|
Judgments and Uncertainties
|
Effect if Actual Results Differ From
Assumptions
|
||
|
Contingent liabilities
|
||||
|
We are subject to lawsuits, investigations and other claims related to wage and hour/labor, environmental, product, taxing authorities and other matters, and are required to assess the likelihood of any adverse judgments or outcomes to these matters, as well as potential ranges of probable losses.
A determination of the amount of reserves and disclosures required, if any, for these contingencies is made after considerable analysis of each individual issue. We accrue for contingent liabilities when an assessment of the risk of loss is probable and can be reasonably estimated. We disclose contingent liabilities when the risk of loss is reasonably possible or probable.
|
Our contingent liabilities contain uncertainties because the eventual outcome will result from future events, and determination of current reserves requires estimates and judgments related to future changes in facts and circumstances, differing interpretations of the law and assessments of the amount of damages, and the effectiveness of strategies or other factors beyond our control.
|
We have not made any material changes in the accounting methodology used to establish our contingent liabilities during the past three fiscal years.
We do not believe there is a reasonable likelihood there will be a material change in the estimates or assumptions used to calculate our contingent liabilities. However, if actual results are not consistent with our estimates or assumptions, we may be exposed to gains or losses that could be material.
|
||
|
Marketing, advertising and promotion costs
|
||||
|
We promote our products with marketing, advertising, trade promotions, and consumer incentives. These programs include, but are not limited to, coupons, discounts, rebates, volume-based incentives, cooperative advertising, and other programs.
Marketing, advertising, and promotion costs are charged to operations in the period incurred. We accrue costs based on the estimated performance, historical utilization and redemption rates of each program.
Cash consideration given to customers is considered a reduction in the price of our products, thus recorded as a reduction to sales. The remainder of marketing, advertising and promotion costs is recorded as a selling, general and administrative expense.
|
Recognition of the costs related to these programs contains uncertainties due to judgment required in estimating the potential performance, utilization and redemption rates of each program.
These estimates are based on many factors, including experience of similar promotional programs.
|
We have not made any material changes in the accounting methodology used to establish our marketing, advertising, and promotion accruals during the past three fiscal years.
We do not believe there is a reasonable likelihood there will be a material change in the estimates or assumptions used to calculate our marketing, advertising, and promotion accruals. However, if actual results are not consistent with our estimates or assumptions, we may be exposed to gains or losses that could be material.
A 10% change in our marketing, advertising, and promotion accruals at October 1, 2016, would impact pretax earnings by approximately $21 million.
|
||
37
|
Description
|
Judgments and Uncertainties
|
Effect if Actual Results Differ From
Assumptions
|
||
|
Accrued self-insurance
|
||||
|
We are self-insured for certain losses related to health and welfare, workers’ compensation, auto liability and general liability claims.
We use an independent third-party actuary to assist in determining our self-insurance liability. We and the actuary consider a number of factors when estimating our self-insurance liability, including claims experience, demographic factors, severity factors and other actuarial assumptions.
We periodically review our estimates and assumptions with our third-party actuary to assist us in determining the adequacy of our self-insurance liability. Our policy is to maintain an accrual within the central to high point of the actuarial range.
|
Our self-insurance liability contains uncertainties due to assumptions required and judgment used.
Costs to settle our obligations, including legal and healthcare costs, could increase or decrease causing estimates of our self-insurance liability to change.
Incident rates, including frequency and severity, could increase or decrease causing estimates in our self-insurance liability to change.
|
We have not made any material changes in the accounting methodology used to establish our self-insurance liability during the past three fiscal years.
We do not believe there is a reasonable likelihood there will be a material change in the estimates or assumptions used to calculate our self-insurance liability. However, if actual results are not consistent with our estimates or assumptions, we may be exposed to gains or losses that could be material.
A 10% increase in the actuarial estimate at October 1, 2016, would result in an increase in the amount we recorded for our self-insurance liability of approximately $23 million. A 10% decrease in the actuarial estimate at October 1, 2016, would result in a decrease in the amount we recorded for our self-insurance liability of approximately $8 million.
|
||
38
|
Description
|
Judgments and Uncertainties
|
Effect if Actual Results Differ From
Assumptions
|
||
|
Defined benefit pension plans
|
||||
|
We sponsor nine defined benefit pension plans that provide retirement benefits to certain employees. We also participate in a multi-employer plan that provides defined benefits to certain employees covered by collective bargaining agreements. Such plans are usually administered by a board of trustees composed of the management of the participating companies and labor representatives.
We use independent third-party actuaries to assist us in determining our pension obligations and net periodic benefit cost. We and the actuaries review assumptions that include estimates of the present value of the projected future pension payment to all plan participants, taking into consideration the likelihood of potential future events such as salary increases and demographic experience. We accumulate and amortize the effect of actuarial gains and losses over future periods.
Net periodic benefit cost for the defined benefit pension plans was $18 million in fiscal 2016. The projected benefit obligation was $1,776 million at the end of fiscal 2016. Unrecognized actuarial loss was $72 million at the end of fiscal 2016. We currently expect net periodic benefit cost for fiscal 2017 to be approximately $26 million.
Plan assets are currently comprised of approximately 85% fixed income securities and 10% equity securities. Fixed income securities can include, but are not limited to, direct bond investments and pooled or indirect bond investments. Other investments may include, but are not limited to, international and domestic equities, real estate, commodities and private equity.
We expect to contribute approximately $40 million of cash to our pension plans in fiscal 2017. The exact amount of cash contributions made to pension plans in any year is dependent upon a number of factors, including minimum funding requirements.
|
Our defined benefit pension plans contain uncertainties due to assumptions required and judgments used.
The key assumptions used in developing the required estimates include such factors as discount rates, expected returns on plan assets, retirement rates, and mortality. These assumptions can have a material impact upon the funded status and the net periodic benefit cost.
The discount rates were determined using a cash flow matching technique whereby the rates of a yield curve, developed from high-quality debt securities, were applied to the benefit obligations to determine the appropriate discount rate. In determining the long-term rate of return on plan assets, we first examined historical rates of return for the various asset classes within the plans. We then determined a long-term projected rate-of-return based on expected returns. Investment, management and other fees paid out of plan assets are factored into the determination of asset return assumptions. Retirement rates are based primarily on actual plan experience, while standard actuarial tables are used to estimate mortality.
It is reasonably likely that changes in external factors will result in changes to the assumptions used to measure pension obligations and net periodic benefit cost in future periods.
The risks of participating in multiemployer plans are different from single-employer plans. The net pension cost of the multiemployer plans is equal to the annual contribution determined in accordance with the provisions of negotiated labor contracts. Assets contributed to such plans are not segregated or otherwise restricted to provide benefits only to our employees. The future cost of these plans is dependent on a number of factors including the funded status of the plans and the ability of the other participating companies to meet ongoing funding obligations.
|
We have not made any material changes in the accounting methodology used to establish our pension obligations and net periodic benefit cost during the past three fiscal years.
We do not believe there is a reasonable likelihood there will be a material change in the estimates or assumptions used to calculate our pension obligations and net periodic benefit cost. However, if actual results are not consistent with our estimates or assumptions, they are accumulated and amortized over future periods and, therefore generally affect the net periodic benefit cost in future periods.
A 1% increase in the discount rate at October 1, 2016, would result in a decrease in the projected benefit obligation and net periodic benefit cost of approximately $203 million and $5 million, respectively. A 1% decrease in the discount rate at October 1, 2016, would result in an increase in the projected benefit obligation and net periodic benefit cost of approximately $250 million and $12 million, respectively.
A 1% change in the return on plan assets at October 1, 2016, would impact the net periodic benefit cost by approximately $14 million.
The sensitivities reflect the impact of changing one assumption at a time with the remaining assumptions held constant. Economic factors and conditions often affect multiple assumptions simultaneously and that the effect of changes in assumptions are not necessarily linear.
|
||
39
|
Description
|
Judgments and Uncertainties
|
Effect if Actual Results Differ From
Assumptions
|
||
|
Income taxes
|
||||
|
We estimate total income tax expense based on statutory tax rates and tax planning opportunities available to us in various jurisdictions in which we earn income.
Federal income tax includes an estimate for taxes on earnings of foreign subsidiaries expected to be taxable upon remittance to the United States, except for earnings considered to be indefinitely invested in the foreign subsidiary.
Deferred income taxes are recognized for the future tax effects of temporary differences between financial and income tax reporting using tax rates in effect for the years in which the differences are expected to reverse.
Valuation allowances are recorded when it is likely a tax benefit will not be realized for a deferred tax asset.
We record unrecognized tax benefit liabilities for known or anticipated tax issues based on our analysis of whether, and the extent to which, additional taxes will be due.
|
Changes in tax laws and rates could affect recorded deferred tax assets and liabilities in the future.
Changes in projected future earnings could affect the recorded valuation allowances in the future.
Our calculations related to income taxes contain uncertainties due to judgment used to calculate tax liabilities in the application of complex tax regulations across the tax jurisdictions where we operate.
Our analysis of unrecognized tax benefits contains uncertainties based on judgment used to apply the more likely than not recognition and measurement thresholds.
|
We do not believe there is a reasonable likelihood there will be a material change in the tax related balances or valuation allowances. However, due to the complexity of some of these uncertainties, the ultimate resolution may result in a payment that is materially different from the current estimate of the tax liabilities.
To the extent we prevail in matters for which unrecognized tax benefit liabilities have been established, or are required to pay amounts in excess of our recorded unrecognized tax benefit liabilities, our effective tax rate in a given financial statement period could be materially affected. An unfavorable tax settlement would require use of our cash and generally result in an increase in our effective tax rate in the period of resolution. A favorable tax settlement would generally be recognized as a reduction in our effective tax rate in the period of resolution.
|
||
|
Impairment of long-lived assets and definite life intangibles
|
||||
|
Long-lived assets and definite life intangibles are evaluated for impairment whenever events or changes in circumstances indicate the carrying value may not be recoverable. Examples include a significant adverse change in the extent or manner in which we use the asset, a change in its physical condition, or an unexpected change in financial performance.
When evaluating long-lived assets and definite life intangibles for impairment, we compare the carrying value of the asset to the asset’s estimated undiscounted future cash flows. An impairment is indicated if the estimated future cash flows are less than the carrying value of the asset. For assets held for sale, we compare the carrying value of the disposal group to fair value. The impairment is the excess of the carrying value over the fair value of the asset.
We recorded impairment charges related to long-lived assets and definite life intangibles of $45 million, $262 million and $107 million, in fiscal 2016, 2015 and 2014, respectively.
|
Our impairment analysis contains uncertainties due to judgment in assumptions, including useful lives of assets, forecasted sales, operating margins, growth rates, royalty rates and discount rates based on budgets, business plans, economic projections, anticipated future cash flows and marketplace data that reflects the risk inherent in future cash flows to determine fair value.
|
We have not made any material changes in the accounting methodology used to evaluate the impairment of long-lived assets or definite life intangibles during the last three fiscal years.
We do not believe there is a reasonable likelihood there will be a material change in the estimates or assumptions used to calculate impairments of long-lived assets or definite life intangibles. However, if actual results are not consistent with our estimates and assumptions used to calculate estimated future cash flows, we may be exposed to impairment losses that could be material.
We periodically conduct projects to strategically evaluate optimization of such items as network capacity and manufacturing efficiencies. Additionally, we continue to evaluate our international operations and strategies. If we have a significant change in strategies, outlook, or a manner in which we plan to use these assets, we may be exposed to future impairments.
|
||
40
Impairment of goodwill and indefinite life intangible assets
Description:
Goodwill is evaluated for impairment by first performing a qualitative assessment to determine whether a quantitative goodwill test is necessary. If it is determined, based on qualitative factors, the fair value of the reporting unit may be more likely than not less than carrying amount or if significant changes to macro-economic factors related to the reporting unit have occurred that could materially impact fair value, a quantitative goodwill impairment test would be required. We can elect to forgo the qualitative assessment and perform the quantitative test.
The quantitative goodwill impairment test is performed using a two-step process. The first step is to identify if a potential impairment exists by comparing the fair value of a reporting unit with its carrying amount, including goodwill. If the fair value of a reporting unit exceeds its carrying amount, goodwill of the reporting unit is not considered to have a potential impairment and the second step of the quantitative impairment test is not necessary. However, if the carrying amount of a reporting unit exceeds its fair value, the second step is performed to determine if goodwill is impaired and to measure the amount of impairment loss to recognize, if any.
The second step compares the implied fair value of goodwill with the carrying amount of goodwill. If the implied fair value of goodwill exceeds the carrying amount, then goodwill is not considered impaired. However, if the carrying amount of goodwill exceeds the implied fair value, an impairment loss is recognized in an amount equal to that excess.
The implied fair value of goodwill is determined in the same manner as the amount of goodwill recognized in a business combination (i.e., the fair value of the reporting unit is allocated to all the assets and liabilities, including any unrecognized intangible assets, as if the reporting unit had been acquired in a business combination and the fair value of the reporting unit was determined as the exit price a market participant would pay for the same business).
For indefinite life intangible assets, a qualitative assessment can also be performed to determine whether the existence of events and circumstances indicates it is more likely than not an intangible asset is impaired. Similar to goodwill, we can also elect to forgo the qualitative test for indefinite life intangible assets and perform the quantitative test. Upon performing the quantitative test, if the carrying value of the intangible asset exceeds its fair value, an impairment loss is recognized in an amount equal to that excess. We elected to forgo the qualitative assessments on our indefinite life intangible assets for the fiscal 2016 impairment test.
We have elected to make the first day of the fourth quarter the annual impairment assessment date for goodwill and indefinite life intangible assets. However, we could be required to evaluate the recoverability of goodwill and indefinite life intangible assets prior to the required annual assessment if, among other things, we experience disruptions to the business, unexpected significant declines in operating results, divestiture of a significant component of the business or a sustained decline in market capitalization.
Judgments and Uncertainties:
We estimate the fair value of our reporting units, using various valuation techniques, with the primary technique being a discounted cash flow analysis, which uses significant unobservable inputs, or Level 3 inputs, as defined by the fair value hierarchy. A discounted cash flow analysis requires us to make various judgmental assumptions about sales, operating margins, growth rates and discount rates.
We include assumptions about sales, operating margins and growth rates which consider our budgets, business plans and economic projections, and are believed to reflect market participant views which would exist in an exit transaction. Assumptions are also made for varying perpetual growth rates for periods beyond the long-term business plan period. Generally, we utilize normalized operating margin assumptions based on future expectations and operating margins historically realized in the reporting units' industries.
The fair value of our indefinite life intangible assets is calculated principally using relief-from-royalty and multi-period excess earnings valuation approaches, which uses significant unobservable inputs, or Level 3 inputs, as defined by the fair value hierarchy, and is believed to reflect market participant views which would exist in an exit transaction. Under these valuation approaches, we are required to make estimates and assumptions about sales, operating margins, growth rates, royalty rates and discount rates based on budgets, business plans, economic projections, anticipated future cash flows and marketplace data.
Our impairment analysis contains uncertainties due to uncontrollable events that could positively or negatively impact the anticipated future economic and operating conditions.
Effect if Actual Results Differ From Assumptions:
We have not made any material changes in the accounting methodology used to evaluate impairment of goodwill and intangible assets during the last three years.
During fiscal 2016, 2015 and 2014, all of our material reporting units that underwent a quantitative test passed the first step of the goodwill impairment analysis and therefore, the second step was not necessary. In fiscal 2015, we recorded a $23 million full impairment of an immaterial reporting unit’s goodwill.
Some of the inherent estimates and assumptions used in determining fair value of the reporting units and indefinite life intangible assets are outside the control of management, including interest rates, cost of capital, tax rates and credit ratings. While we believe we have made reasonable estimates and assumptions to calculate the fair value of the reporting units and indefinite life intangibles, it is possible a material change could occur. If our actual results are not consistent with our estimates and assumptions used to calculate fair value, we may be required to perform the second step, which could result in additional material impairments of our goodwill.
41
All of our material reporting units' estimated fair value exceeded their carrying value by more than 20% at the date of their most recent estimated fair value determination. Consequently, we do not currently consider any of our material reporting units at significant risk of failing the first step of the annual goodwill impairment test.
The discount rate used in our annual goodwill impairment test decreased to 6.2% in fiscal 2016 from 6.8% in fiscal 2015. Discount rates continue to be low compared to historical levels. A 38% increase in the discount rate would have caused our Prepared Foods reporting unit, with $4,005 million of goodwill at October 1, 2016, to fail the first step of the goodwill impairment step and may have resulted in a material impairment upon completion of the second step.
We did not have material indefinite life intangible assets prior to the acquisition of Hillshire Brands in August 2014. Our fiscal 2016 and 2015 indefinite life intangible assets impairment analyses did not result in an impairment charge. All indefinite life intangible assets’ estimated fair value exceeded their carrying value by more than 20% at the date of their most recent estimated fair value determination. Consequently, we do not currently consider any of our material indefinite life intangible assets at significant risk of impairment.
The discount rate used in our annual indefinite life intangible assets impairment test was 7.9% in fiscal 2016 and 8.0% in fiscal 2015. A 20% increase in the discount rate would have caused the carrying value of two intangible assets, which have a combined carrying value of $2,476 million, to exceed fair value.
Market risk relating to our operations results primarily from changes in commodity prices, interest rates and foreign exchange rates, as well as credit risk concentrations. To address certain of these risks, we enter into various derivative transactions as described below. If a derivative instrument is accounted for as a hedge, depending on the nature of the hedge, changes in the fair value of the instrument either will be offset against the change in fair value of the hedged assets, liabilities or firm commitments through earnings, or be recognized in other comprehensive income (loss) until the hedged item is recognized in earnings. The ineffective portion of an instrument’s change in fair value is recognized immediately. Additionally, we hold certain positions, primarily in grain and livestock futures that either do not meet the criteria for hedge accounting or are not designated as hedges. With the exception of normal purchases and normal sales that are expected to result in physical delivery, we record these positions at fair value, and the unrealized gains and losses are reported in earnings at each reporting date. Changes in market value of derivatives used in our risk management activities relating to forward sales contracts are recorded in sales. Changes in market value of derivatives used in our risk management activities surrounding inventories on hand or anticipated purchases of inventories are recorded in cost of sales.
The sensitivity analyses presented below are the measures of potential losses of fair value resulting from hypothetical changes in market prices related to commodities. Sensitivity analyses do not consider the actions we may take to mitigate our exposure to changes, nor do they consider the effects such hypothetical adverse changes may have on overall economic activity. Actual changes in market prices may differ from hypothetical changes.
Commodities Risk:
We purchase certain commodities, such as grains and livestock in the course of normal operations. As part of our commodity risk management activities, we use derivative financial instruments, primarily futures and options, to reduce the effect of changing prices and as a mechanism to procure the underlying commodity. However, as the commodities underlying our derivative financial instruments can experience significant price fluctuations, any requirement to mark-to-market the positions that have not been designated or do not qualify as hedges could result in volatility in our results of operations. Contract terms of a hedge instrument closely mirror those of the hedged item providing a high degree of risk reduction and correlation. Contracts designated and highly effective at meeting this risk reduction and correlation criteria are recorded using hedge accounting. The following table presents a sensitivity analysis resulting from a hypothetical change of 10% in market prices as of
October 1, 2016
, and
October 3, 2015
, on the fair value of open positions. The fair value of such positions is a summation of the fair values calculated for each commodity by valuing each net position at quoted futures prices. The market risk exposure analysis included hedge and non-hedge derivative financial instruments.
|
Effect of 10% change in fair value
|
in millions
|
||||||
|
2016
|
|
2015
|
|
||||
|
Livestock:
|
|||||||
|
Live Cattle
|
$
|
5
|
|
$
|
13
|
|
|
|
Lean Hogs
|
7
|
|
12
|
|
|||
|
Grain:
|
|||||||
|
Corn
|
26
|
|
3
|
|
|||
|
Soy Meal
|
8
|
|
—
|
|
|||
42
Interest Rate Risk:
At
October 1, 2016
, we had variable rate debt of $
1,357 million
with a weighted average interest rate of
1.8%
. A hypothetical 10% increase in interest rates effective at
October 1, 2016
, and
October 3, 2015
, would have a minimal effect on interest expense.
Additionally, changes in interest rates impact the fair value of our fixed-rate debt. At
October 1, 2016
, we had fixed-rate debt of $4,922 million with a weighted average interest rate of
4.3%
. Market risk for fixed-rate debt is estimated as the potential increase in fair value, resulting from a hypothetical 10% decrease in interest rates. A hypothetical 10% decrease in interest rates would have increased the fair value of our fixed-rate debt by approximately $
71 million
at
October 1, 2016
, and $87 million at
October 3, 2015
. The fair values of our debt were estimated based on quoted market prices and/or published interest rates.
We have interest rate risk associated with our pension and post-retirement benefit obligations. Changes in interest rates impact the liabilities associated with these benefit plans as well as the amount of income or expense recognized for these plans. Declines in the value of the plan assets could diminish the funded status of the pension plans and potentially increase the requirements to make cash contributions to these plans. See Part II, Item 8, Notes to Consolidated Financial Statements, Note 14: Pensions and Other Postretirement Benefits for additional information.
Foreign Currency Risk:
We have foreign exchange exposure from fluctuations in foreign currency exchange rates primarily as a result of certain receivable and payable balances. The primary currencies we have exposure to are the Brazilian real, the British pound sterling, the Canadian dollar, the Chinese renminbi, the European euro, the Japanese yen and the Mexican peso. We periodically enter into foreign exchange forward and option contracts to hedge some portion of our foreign currency exposure. A hypothetical 10% change in foreign exchange rates effective at
October 1, 2016
, and
October 3, 2015
, related to the foreign exchange forward and option contracts would have a $3 million impact on pretax income.
Concentrations of Credit Risk:
Our financial instruments exposed to concentrations of credit risk consist primarily of cash equivalents and trade receivables. Our cash equivalents are in high quality securities placed with major banks and financial institutions. Concentrations of credit risk with respect to receivables are limited due to our large number of customers and their dispersion across geographic areas. We perform periodic credit evaluations of our customers’ financial condition and generally do not require collateral. At
October 1, 2016
, and
October 3, 2015
,
18.9%
and
20.0%
, respectively, of our net accounts receivable balance was due from Wal-Mart Stores, Inc. No other single customer or customer group represented greater than 10% of net accounts receivable.
43
TYSON FOODS, INC.
|
Three years ended October 1, 2016
|
|||||||||||
|
in millions, except per share data
|
|||||||||||
|
2016
|
|
2015
|
|
2014
|
|
||||||
|
Sales
|
$
|
36,881
|
|
$
|
41,373
|
|
$
|
37,580
|
|
||
|
Cost of Sales
|
32,184
|
|
37,456
|
|
34,895
|
|
|||||
|
Gross Profit
|
4,697
|
|
3,917
|
|
2,685
|
|
|||||
|
Selling, General and Administrative
|
1,864
|
|
1,748
|
|
1,255
|
|
|||||
|
Operating Income
|
2,833
|
|
2,169
|
|
1,430
|
|
|||||
|
Other (Income) Expense:
|
|||||||||||
|
Interest income
|
(6
|
)
|
(9
|
)
|
(7
|
)
|
|||||
|
Interest expense
|
249
|
|
293
|
|
132
|
|
|||||
|
Other, net
|
(8
|
)
|
(36
|
)
|
53
|
|
|||||
|
Total Other (Income) Expense
|
235
|
|
248
|
|
178
|
|
|||||
|
Income before Income Taxes
|
2,598
|
|
1,921
|
|
1,252
|
|
|||||
|
Income Tax Expense
|
826
|
|
697
|
|
396
|
|
|||||
|
Net Income
|
1,772
|
|
1,224
|
|
856
|
|
|||||
|
Less: Net Income (Loss) Attributable to Noncontrolling Interests
|
4
|
|
4
|
|
(8
|
)
|
|||||
|
Net Income Attributable to Tyson
|
$
|
1,768
|
|
$
|
1,220
|
|
$
|
864
|
|
||
|
Weighted Average Shares Outstanding:
|
|||||||||||
|
Class A Basic
|
315
|
|
335
|
|
284
|
|
|||||
|
Class B Basic
|
70
|
|
70
|
|
70
|
|
|||||
|
Diluted
|
390
|
|
413
|
|
364
|
|
|||||
|
Net Income Per Share Attributable to Tyson:
|
|||||||||||
|
Class A Basic
|
$
|
4.67
|
|
$
|
3.06
|
|
$
|
2.48
|
|
||
|
Class B Basic
|
$
|
4.24
|
|
$
|
2.79
|
|
$
|
2.26
|
|
||
|
Diluted
|
$
|
4.53
|
|
$
|
2.95
|
|
$
|
2.37
|
|
||
|
Dividends Declared Per Share:
|
|||||||||||
|
Class A
|
$
|
0.650
|
|
$
|
0.425
|
|
$
|
0.325
|
|
||
|
Class B
|
$
|
0.585
|
|
$
|
0.383
|
|
$
|
0.294
|
|
||
See accompanying notes.
44
TYSON FOODS, INC.
CONSOLIDATED STATEMENTS OF COMPREHENSIVE INCOME
|
Three years ended October 1, 2016
|
|||||||||||
|
in millions
|
|||||||||||
|
2016
|
|
2015
|
|
2014
|
|
||||||
|
Net Income
|
$
|
1,772
|
|
$
|
1,224
|
|
$
|
856
|
|
||
|
Other Comprehensive Income (Loss), Net of Taxes:
|
|||||||||||
|
Derivatives accounted for as cash flow hedges
|
(1
|
)
|
2
|
|
1
|
|
|||||
|
Investments
|
—
|
|
(1
|
)
|
4
|
|
|||||
|
Currency translation
|
4
|
|
36
|
|
(30
|
)
|
|||||
|
Postretirement benefits
|
42
|
|
20
|
|
(14
|
)
|
|||||
|
Total Other Comprehensive Income (Loss), Net of Taxes
|
45
|
|
57
|
|
(39
|
)
|
|||||
|
Comprehensive Income
|
1,817
|
|
1,281
|
|
817
|
|
|||||
|
Less: Comprehensive Income Attributable to Noncontrolling Interests
|
4
|
|
4
|
|
(8
|
)
|
|||||
|
Comprehensive Income Attributable to Tyson
|
$
|
1,813
|
|
$
|
1,277
|
|
$
|
825
|
|
||
See accompanying notes.
45
TYSON FOODS, INC.
|
October 1, 2016, and October 3, 2015
|
|||||||
|
in millions, except share and per share data
|
|||||||
|
2016
|
|
2015
|
|
||||
|
Assets
|
|||||||
|
Current Assets:
|
|||||||
|
Cash and cash equivalents
|
$
|
349
|
|
$
|
688
|
|
|
|
Accounts receivable, net
|
1,542
|
|
1,620
|
|
|||
|
Inventories
|
2,732
|
|
2,878
|
|
|||
|
Other current assets
|
265
|
|
195
|
|
|||
|
Total Current Assets
|
4,888
|
|
5,381
|
|
|||
|
Net Property, Plant and Equipment
|
5,170
|
|
5,176
|
|
|||
|
Goodwill
|
6,669
|
|
6,667
|
|
|||
|
Intangible Assets
|
5,084
|
|
5,168
|
|
|||
|
Other Assets
|
562
|
|
577
|
|
|||
|
Total Assets
|
$
|
22,373
|
|
$
|
22,969
|
|
|
|
Liabilities and Shareholders’ Equity
|
|||||||
|
Current Liabilities:
|
|||||||
|
Current debt
|
$
|
79
|
|
$
|
715
|
|
|
|
Accounts payable
|
1,511
|
|
1,662
|
|
|||
|
Other current liabilities
|
1,172
|
|
1,158
|
|
|||
|
Total Current Liabilities
|
2,762
|
|
3,535
|
|
|||
|
Long-Term Debt
|
6,200
|
|
5,975
|
|
|||
|
Deferred Income Taxes
|
2,545
|
|
2,449
|
|
|||
|
Other Liabilities
|
1,242
|
|
1,304
|
|
|||
|
Commitments and Contingencies (Note 19)
|
|
|
|
||||
|
Shareholders’ Equity:
|
|||||||
|
Common stock ($0.10 par value):
|
|||||||
|
Class A-authorized 900 million shares, issued 364 million shares
|
36
|
|
35
|
|
|||
|
Convertible Class B-authorized 900 million shares, issued 70 million shares
|
7
|
|
7
|
|
|||
|
Capital in excess of par value
|
4,355
|
|
4,307
|
|
|||
|
Retained earnings
|
8,348
|
|
6,813
|
|
|||
|
Accumulated other comprehensive loss
|
(45
|
)
|
(90
|
)
|
|||
|
Treasury stock, at cost – 73 million shares at October 1, 2016, and 47 million shares at October 3, 2015
|
(3,093
|
)
|
(1,381
|
)
|
|||
|
Total Tyson Shareholders’ Equity
|
9,608
|
|
9,691
|
|
|||
|
Noncontrolling Interests
|
16
|
|
15
|
|
|||
|
Total Shareholders’ Equity
|
9,624
|
|
9,706
|
|
|||
|
Total Liabilities and Shareholders’ Equity
|
$
|
22,373
|
|
$
|
22,969
|
|
|
See accompanying notes.
46
TYSON FOODS, INC.
CONSOLIDATED STATEMENTS OF SHAREHOLDERS’ EQUITY
|
Three years ended October 1, 2016
|
||||||||||||||||||||
|
in millions
|
||||||||||||||||||||
|
2016
|
2015
|
2014
|
||||||||||||||||||
|
Shares
|
|
Amount
|
|
Shares
|
|
Amount
|
|
Shares
|
|
Amount
|
|
|||||||||
|
Class A Common Stock:
|
||||||||||||||||||||
|
Balance at beginning of year
|
346
|
|
$
|
35
|
|
346
|
|
$
|
35
|
|
322
|
|
$
|
32
|
|
|||||
|
Issuance of Class A common stock
|
18
|
|
1
|
|
—
|
|
—
|
|
24
|
|
3
|
|
||||||||
|
Balance at end of year
|
364
|
|
36
|
|
346
|
|
35
|
|
346
|
|
35
|
|
||||||||
|
Class B Common Stock:
|
||||||||||||||||||||
|
Balance at beginning and end of year
|
70
|
|
7
|
|
70
|
|
7
|
|
70
|
|
7
|
|
||||||||
|
Capital in Excess of Par Value:
|
||||||||||||||||||||
|
Balance at beginning of year
|
4,307
|
|
4,257
|
|
2,292
|
|
||||||||||||||
|
Issuance of Class A common stock
|
—
|
|
—
|
|
870
|
|
||||||||||||||
|
Issuance of tangible equity units
|
—
|
|
—
|
|
1,255
|
|
||||||||||||||
|
Convertible debt settlement
|
—
|
|
—
|
|
(248
|
)
|
||||||||||||||
|
Convertible note hedge settlement
|
—
|
|
—
|
|
341
|
|
||||||||||||||
|
Warrant settlement
|
—
|
|
—
|
|
(289
|
)
|
||||||||||||||
|
Stock-based compensation
|
48
|
|
50
|
|
36
|
|
||||||||||||||
|
Balance at end of year
|
4,355
|
|
4,307
|
|
4,257
|
|
||||||||||||||
|
Retained Earnings:
|
||||||||||||||||||||
|
Balance at beginning of year
|
6,813
|
|
5,748
|
|
4,999
|
|
||||||||||||||
|
Net income attributable to Tyson
|
1,768
|
|
1,220
|
|
864
|
|
||||||||||||||
|
Dividends
|
(233
|
)
|
(155
|
)
|
(115
|
)
|
||||||||||||||
|
Balance at end of year
|
8,348
|
|
6,813
|
|
5,748
|
|
||||||||||||||
|
Accumulated Other Comprehensive Income (Loss), Net of Tax:
|
||||||||||||||||||||
|
Balance at beginning of year
|
(90
|
)
|
(147
|
)
|
(108
|
)
|
||||||||||||||
|
Other Comprehensive Income (Loss)
|
45
|
|
57
|
|
(39
|
)
|
||||||||||||||
|
Balance at end of year
|
(45
|
)
|
(90
|
)
|
(147
|
)
|
||||||||||||||
|
Treasury Stock:
|
||||||||||||||||||||
|
Balance at beginning of year
|
47
|
|
(1,381
|
)
|
40
|
|
(1,010
|
)
|
48
|
|
(1,021
|
)
|
||||||||
|
Purchase of Class A common stock
|
32
|
|
(1,944
|
)
|
12
|
|
(495
|
)
|
8
|
|
(295
|
)
|
||||||||
|
Convertible debt settlement
|
—
|
|
—
|
|
—
|
|
—
|
|
(12
|
)
|
248
|
|
||||||||
|
Convertible note hedge settlement
|
—
|
|
—
|
|
—
|
|
—
|
|
12
|
|
(341
|
)
|
||||||||
|
Warrant settlement
|
—
|
|
—
|
|
—
|
|
—
|
|
(12
|
)
|
289
|
|
||||||||
|
Stock-based compensation
|
(6
|
)
|
232
|
|
(5
|
)
|
124
|
|
(4
|
)
|
110
|
|
||||||||
|
Balance at end of year
|
73
|
|
(3,093
|
)
|
47
|
|
(1,381
|
)
|
40
|
|
(1,010
|
)
|
||||||||
|
Total Shareholders’ Equity Attributable to Tyson
|
$
|
9,608
|
|
$
|
9,691
|
|
$
|
8,890
|
|
|||||||||||
|
Equity Attributable to Noncontrolling Interests:
|
||||||||||||||||||||
|
Balance at beginning of year
|
$
|
15
|
|
$
|
14
|
|
$
|
32
|
|
|||||||||||
|
Net income (loss) attributable to noncontrolling interests
|
4
|
|
4
|
|
(8
|
)
|
||||||||||||||
|
Contributions by noncontrolling interest
|
—
|
|
—
|
|
—
|
|
||||||||||||||
|
Distributions to noncontrolling interest
|
(3
|
)
|
(1
|
)
|
(11
|
)
|
||||||||||||||
|
Net foreign currency translation adjustment and other
|
—
|
|
(2
|
)
|
1
|
|
||||||||||||||
|
Total Equity Attributable to Noncontrolling Interests
|
$
|
16
|
|
$
|
15
|
|
$
|
14
|
|
|||||||||||
|
Total Shareholders’ Equity
|
$
|
9,624
|
|
$
|
9,706
|
|
$
|
8,904
|
|
|||||||||||
See accompanying notes.
47
TYSON FOODS, INC.
|
Three years ended October 1, 2016
|
|||||||||||
|
in millions
|
|||||||||||
|
2016
|
|
2015
|
|
2014
|
|
||||||
|
Cash Flows From Operating Activities:
|
|||||||||||
|
Net income
|
$
|
1,772
|
|
$
|
1,224
|
|
$
|
856
|
|
||
|
Adjustments to reconcile net income to cash provided by operating activities:
|
|||||||||||
|
Depreciation
|
617
|
|
609
|
|
494
|
|
|||||
|
Amortization
|
88
|
|
102
|
|
36
|
|
|||||
|
Deferred income taxes
|
84
|
|
38
|
|
(105
|
)
|
|||||
|
Convertible debt discount
|
—
|
|
—
|
|
(92
|
)
|
|||||
|
Gain on dispositions of businesses
|
—
|
|
(177
|
)
|
—
|
|
|||||
|
Impairment of assets
|
45
|
|
285
|
|
107
|
|
|||||
|
Share-based compensation expense
|
81
|
|
69
|
|
51
|
|
|||||
|
Other, net
|
(34
|
)
|
71
|
|
(20
|
)
|
|||||
|
(Increase) decrease in accounts receivable
|
73
|
|
66
|
|
(93
|
)
|
|||||
|
(Increase) decrease in inventories
|
148
|
|
220
|
|
(148
|
)
|
|||||
|
Increase (decrease) in accounts payable
|
(130
|
)
|
(162
|
)
|
202
|
|
|||||
|
Increase (decrease) in income taxes payable/receivable
|
(19
|
)
|
177
|
|
(133
|
)
|
|||||
|
Increase (decrease) in interest payable
|
(1
|
)
|
(23
|
)
|
5
|
|
|||||
|
Net changes in other operating assets and liabilities
|
(8
|
)
|
71
|
|
18
|
|
|||||
|
Cash Provided by Operating Activities
|
2,716
|
|
2,570
|
|
1,178
|
|
|||||
|
Cash Flows From Investing Activities:
|
|||||||||||
|
Additions to property, plant and equipment
|
(695
|
)
|
(854
|
)
|
(632
|
)
|
|||||
|
Purchases of marketable securities
|
(46
|
)
|
(38
|
)
|
(18
|
)
|
|||||
|
Proceeds from sale of marketable securities
|
37
|
|
52
|
|
33
|
|
|||||
|
Acquisitions, net of cash acquired
|
—
|
|
—
|
|
(8,193
|
)
|
|||||
|
Proceeds from sale of businesses
|
—
|
|
539
|
|
—
|
|
|||||
|
Other, net
|
20
|
|
31
|
|
10
|
|
|||||
|
Cash Used for Investing Activities
|
(684
|
)
|
(270
|
)
|
(8,800
|
)
|
|||||
|
Cash Flows From Financing Activities:
|
|||||||||||
|
Payments on debt
|
(714
|
)
|
(1,995
|
)
|
(639
|
)
|
|||||
|
Proceeds from issuance of long-term debt
|
1
|
|
501
|
|
5,576
|
|
|||||
|
Borrowings on revolving credit facility
|
1,065
|
|
1,345
|
|
—
|
|
|||||
|
Payments on revolving credit facility
|
(765
|
)
|
(1,345
|
)
|
—
|
|
|||||
|
Proceeds from issuance of debt component of tangible equity units
|
—
|
|
—
|
|
205
|
|
|||||
|
Proceeds from issuance of common stock, net of issuance costs
|
—
|
|
—
|
|
873
|
|
|||||
|
Net proceeds from issuance of equity component of tangible equity units
|
—
|
|
—
|
|
1,255
|
|
|||||
|
Purchases of Tyson Class A common stock
|
(1,944
|
)
|
(495
|
)
|
(295
|
)
|
|||||
|
Dividends
|
(216
|
)
|
(147
|
)
|
(104
|
)
|
|||||
|
Stock options exercised
|
128
|
|
84
|
|
67
|
|
|||||
|
Other, net
|
68
|
|
17
|
|
(23
|
)
|
|||||
|
Cash Provided by (Used for) Financing Activities
|
(2,377
|
)
|
(2,035
|
)
|
6,915
|
|
|||||
|
Effect of Exchange Rate Change on Cash
|
6
|
|
(15
|
)
|
—
|
|
|||||
|
Increase (Decrease) in Cash and Cash Equivalents
|
(339
|
)
|
250
|
|
(707
|
)
|
|||||
|
Cash and Cash Equivalents at Beginning of Year
|
688
|
|
438
|
|
1,145
|
|
|||||
|
Cash and Cash Equivalents at End of Year
|
$
|
349
|
|
$
|
688
|
|
$
|
438
|
|
||
See accompanying notes.
48
NOTES TO CONSOLIDATED FINANCIAL STATEMENTS
TYSON FOODS, INC.
Description of Business:
Tyson Foods, Inc. (collectively, “Company,” “we,” “us” or “our”), founded in 1935 with world headquarters in Springdale, Arkansas, is one of the world's largest food companies with leading brands such as Tyson®, Jimmy Dean®, Hillshire Farm®, Sara Lee®, Ball Park®, Wright®, Aidells® and State Fair®. We are a recognized market leader in chicken, beef and pork as well as prepared foods, including bacon, breakfast sausage, turkey, lunchmeat, hot dogs, pizza crusts and toppings, tortillas and desserts.
Consolidation:
The consolidated financial statements include the accounts of all wholly-owned subsidiaries, as well as majority-owned subsidiaries over which we exercise control and, when applicable, entities for which we have a controlling financial interest or variable interest entities for which we are the primary beneficiary. All significant intercompany accounts and transactions have been eliminated in consolidation.
Fiscal Year:
We utilize a 52- or 53-week accounting period ending on the Saturday closest to September 30. The Company’s accounting cycle resulted in a 52-week year for fiscal
2016
and fiscal 2014 and a 53-week year for fiscal
2015
.
Cash and Cash Equivalents:
Cash equivalents consist of investments in short-term, highly liquid securities having original maturities of three months or less, which are made as part of our cash management activity. The carrying values of these assets approximate their fair values. We primarily utilize a cash management system with a series of separate accounts consisting of lockbox accounts for receiving cash, concentration accounts where funds are moved to, and several zero-balance disbursement accounts for funding payroll, accounts payable, livestock procurement, grower payments, etc. As a result of our cash management system, checks issued, but not presented to the banks for payment, may result in negative book cash balances. These negative book cash balances are included in accounts payable and other current liabilities. At
October 1, 2016
, and
October 3, 2015
, checks outstanding in excess of related book cash balances totaled approximately
$261 million
and
$257 million
, respectively.
Accounts Receivable:
We record accounts receivable at net realizable value. This value includes an appropriate allowance for estimated uncollectible accounts to reflect any loss anticipated on the accounts receivable balances and charged to the provision for doubtful accounts. We calculate this allowance based on our history of write-offs, level of past due accounts and relationships with and economic status of our customers. At
October 1, 2016
, and
October 3, 2015
, our allowance for uncollectible accounts was
$33 million
and
$27 million
, respectively. We generally do not have collateral for our receivables, but we do periodically evaluate the credit worthiness of our customers.
Inventories:
Processed products, livestock and supplies and other are valued at the lower of cost or market. Cost includes purchased raw materials, live purchase costs, growout costs (primarily feed, grower pay and catch and haul costs), labor and manufacturing and production overhead, which are related to the purchase and production of inventories.
In fiscal 2016,
61%
of the cost of inventories was determined by the first-in, first-out ("FIFO") method as compared to
63%
in fiscal 2015. The remaining cost of inventories for both years is determined by the weighted-average method.
The following table reflects the major components of inventory at
October 1, 2016
, and
October 3, 2015
:
|
in millions
|
|
||||||
|
2016
|
|
2015
|
|
||||
|
Processed products
|
$
|
1,530
|
|
$
|
1,631
|
|
|
|
Livestock
|
772
|
|
831
|
|
|||
|
Supplies and other
|
430
|
|
416
|
|
|||
|
Total inventory
|
$
|
2,732
|
|
$
|
2,878
|
|
|
Property, Plant and Equipment:
Property, plant and equipment are stated at cost and generally depreciated on a straight-line method over the estimated lives for buildings and leasehold improvements of
10
to
33 years
, machinery and equipment of
three
to
12 years
and land improvements and other of
three
to
20 years
. Major repairs and maintenance costs that significantly extend the useful life of the related assets are capitalized. Normal repairs and maintenance costs are charged to operations.
We review the carrying value of long-lived assets at each balance sheet date if indication of impairment exists. Recoverability is assessed using undiscounted cash flows based on historical results and current projections of earnings before interest, taxes, depreciation and amortization. We measure impairment as the excess of carrying value over the fair value of an asset. The fair value of an asset is measured using discounted cash flows including market participant assumptions of future operating results and discount rates.
49
Goodwill and Intangible Assets:
Definite life intangibles are initially recorded at fair value and amortized over the estimated period of benefit. Brands and trademarks are generally based on the straight-line method over
20
years or less. Customer relationships are generally amortized over
seven
to
17
years based on the pattern of revenue expected to be generated from the use of the asset. Amortization expense is generally recognized in selling, general, and administrative expense. We review the carrying value of definite life intangibles at each balance sheet date if indication of impairment exists. Recoverability is assessed using undiscounted cash flows based on historical results and current projections of earnings before interest, taxes, depreciation and amortization. We measure impairment as the excess of carrying value over the fair value of the definite life intangible asset. We use various valuation techniques to estimate fair value, with the primary techniques being discounted cash flows, relief-from-royalty and multi-period excess earnings valuation approaches, which use significant unobservable inputs, or Level 3 inputs, as defined by the fair value hierarchy. Under these valuation approaches, we are required to make estimates and assumptions about sales, operating margins, growth rates, royalty rates and discount rates based on budgets, business plans, economic projections, anticipated future cash flows and marketplace data.
Goodwill and indefinite life intangible assets are initially recorded at fair value and not amortized, but are reviewed for impairment at least annually or more frequently if impairment indicators arise. Our goodwill is allocated by reporting unit and is evaluated for impairment by first performing a qualitative assessment to determine whether a quantitative goodwill test is necessary. If it is determined, based on qualitative factors, the fair value of the reporting unit may be more likely than not less than carrying amount, or if significant changes to macro-economic factors related to the reporting unit have occurred that could materially impact fair value, a quantitative goodwill impairment test would be required. Additionally, we can elect to forgo the qualitative assessment and perform the quantitative test.
The first step of the quantitative test is to identify if a potential impairment exists by comparing the fair value of a reporting unit with its carrying amount, including goodwill. If the fair value of a reporting unit exceeds its carrying amount, goodwill of the reporting unit is not considered to have a potential impairment and the second step of the quantitative impairment test is not necessary. However, if the carrying amount of a reporting unit exceeds its fair value, the second step is performed to determine if goodwill is impaired and to measure the amount of impairment loss to recognize, if any. The second step compares the implied fair value of goodwill with the carrying amount of goodwill. If the implied fair value of goodwill exceeds the carrying amount, then goodwill is not considered impaired. However, if the carrying amount of goodwill exceeds the implied fair value, an impairment loss is recognized in an amount equal to that excess. The implied fair value of goodwill is determined in the same manner as the amount of goodwill recognized in a business combination (i.e., the fair value of the reporting unit is allocated to all the assets and liabilities, including any unrecognized intangible assets, as if the reporting unit had been acquired in a business combination and the fair value of the reporting unit was determined as the exit price a market participant would pay for the same business). We have elected to make the first day of the fourth quarter the annual impairment assessment date for goodwill and indefinite life intangible assets.
We estimate the fair value of our reporting units using a discounted cash flow analysis, which uses significant unobservable inputs, or Level 3 inputs, as defined by the fair value hierarchy. This analysis requires us to make various judgmental estimates and assumptions about sales, operating margins, growth rates and discount factors and is believed to reflect market participant views which would exist in an exit transaction. Generally, we utilize normalized operating margin assumptions based on future expectations and operating margins historically realized in the reporting units' industries. Some of the inherent estimates and assumptions used in determining fair value of the reporting units are outside the control of management, including interest rates, cost of capital, tax rates and credit ratings. While we believe we have made reasonable estimates and assumptions to calculate the fair value of the reporting units, it is possible a material change could occur. If our actual results are not consistent with our estimates and assumptions used to calculate fair value, we may be required to perform the second step of the quantitative test in future years, which could result in material impairments of our goodwill.
The discount rate used in our annual goodwill impairment test decreased to
6.2%
in fiscal 2016 from
6.8%
in fiscal 2015. The discount rate used in our indefinite life intangible test decreased to
7.9%
in fiscal 2016 from
8.0%
in fiscal 2015.
During fiscal 2016, 2015 and 2014, all of our material reporting units that underwent a quantitative test passed the first step of the goodwill impairment analysis and therefore, the second step was not necessary. In fiscal 2015, we recorded a
$23 million
full impairment of an immaterial reporting unit’s goodwill.
For our indefinite life intangible assets, a qualitative assessment can also be performed to determine whether the existence of events and circumstances indicates it is more likely than not an intangible asset is impaired. Similar to goodwill, we can also elect to forgo the qualitative test for indefinite life intangible assets and perform the quantitative test. Upon performing the quantitative test, if the carrying value of the intangible asset exceeds its fair value, an impairment loss is recognized in an amount equal to that excess.
The fair value of our indefinite life intangible assets is calculated principally using relief-from-royalty and multi-period excess earnings valuation approaches, which use significant unobservable inputs, or Level 3 inputs, as defined by the fair value hierarchy, and is believed to reflect market participant views which would exist in an exit transaction. Under these valuation approaches, we are required to make estimates and assumptions about sales, operating margins, growth rates, royalty rates and discount rates based on budgets, business plans, economic projections, anticipated future cash flows and marketplace data.
50
Investments:
We have investments in joint ventures and other entities. We generally use the cost method of accounting when our voting interests are less than 20 percent. We use the equity method of accounting when our voting interests are in excess of 20 percent and we do not have a controlling interest or a variable interest in which we are the primary beneficiary. Investments in joint ventures and other entities are reported in the Consolidated Balance Sheets in Other Assets.
We also have investments in marketable debt securities. We have determined all of our marketable debt securities are available-for-sale investments. These investments are reported at fair value based on quoted market prices as of the balance sheet date, with unrealized gains and losses, net of tax, recorded in other comprehensive income. The amortized cost of debt securities is adjusted for amortization of premiums and accretion of discounts to maturity. Such amortization is recorded in interest income. The cost of securities sold is based on the specific identification method. Realized gains and losses on the sale of debt securities and declines in value judged to be other than temporary are recorded on a net basis in other income. Interest and dividends on securities classified as available-for-sale are recorded in interest income.
Accrued Self-Insurance:
We use a combination of insurance and self-insurance mechanisms in an effort to mitigate the potential liabilities for health and welfare, workers’ compensation, auto liability and general liability risks. Liabilities associated with our risks retained are estimated, in part, by considering claims experience, demographic factors, severity factors and other actuarial assumptions.
Other Current Liabilities:
Other current liabilities at
October 1, 2016
, and
October 3, 2015
, include:
|
|
in millions
|
||||||
|
|
2016
|
|
2015
|
|
|||
|
Accrued salaries, wages and benefits
|
$
|
563
|
|
$
|
478
|
|
|
|
Accrued marketing, advertising and promotion expense
|
212
|
|
192
|
|
|||
|
Other
|
397
|
|
488
|
|
|||
|
Total other current liabilities
|
$
|
1,172
|
|
$
|
1,158
|
|
|
Defined Benefit Plans:
We recognize the funded status of defined pension and postretirement plans in the Consolidated Balance Sheets. The funded status is measured as the difference between the fair value of the plan assets and the benefit obligation. We measure our plan assets and liabilities at the end of our fiscal year. For a defined benefit pension plan, the benefit obligation is the projected benefit obligation; for any other defined benefit postretirement plan, such as a retiree health care plan, the benefit obligation is the accumulated postretirement benefit obligation. Any overfunded status is recognized as an asset and any underfunded status is recognized as a liability. Any transitional asset/liability, prior service cost or actuarial gain/loss that has not yet been recognized as a component of net periodic cost is recognized in accumulated other comprehensive income. Accumulated other comprehensive income will be adjusted as these amounts are subsequently recognized as a component of net periodic benefit costs in future periods.
Derivative Financial Instruments:
We purchase certain commodities, such as grains and livestock in the course of normal operations. As part of our commodity risk management activities, we use derivative financial instruments, primarily futures and options, to reduce our exposure to various market risks related to these purchases, as well as to changes in foreign currency exchange rates. Contract terms of a financial instrument qualifying as a hedge instrument closely mirror those of the hedged item, providing a high degree of risk reduction and correlation. Contracts designated and highly effective at meeting risk reduction and correlation criteria are recorded using hedge accounting. If a derivative instrument is accounted for as a hedge, changes in the fair value of the instrument will be offset either against the change in fair value of the hedged assets, liabilities or firm commitments through earnings or recognized in other comprehensive income (loss) until the hedged item is recognized in earnings. The ineffective portion of an instrument’s change in fair value is immediately recognized in earnings as a component of cost of sales. Instruments we hold as part of our risk management activities that do not meet the criteria for hedge accounting are marked to fair value with unrealized gains or losses reported currently in earnings. Changes in market value of derivatives used in our risk management activities relating to forward sales contracts are recorded in sales, while changes surrounding inventories on hand or anticipated purchases of inventories or supplies are recorded in cost of sales. We generally do not hedge anticipated transactions beyond
18
months.
Litigation Reserves:
There are a variety of legal proceedings pending or threatened against us. Accruals are recorded when it is probable a liability has been incurred and the amount of the liability can be reasonably estimated based on current law, progress of each case, opinions and views of legal counsel and other advisers, our experience in similar matters and intended response to the litigation. These amounts, which are not discounted and are exclusive of claims against third parties, are adjusted periodically as assessment efforts progress or additional information becomes available. We expense amounts for administering or litigating claims as incurred. Accruals for legal proceedings are included in Other current liabilities in the Consolidated Balance Sheets.
Revenue Recognition:
We recognize revenue when title and risk of loss are transferred to customers, which is generally on delivery based on terms of sale. Revenue is recognized as the net amount estimated to be received after deducting estimated amounts for discounts, trade allowances and product returns.
51
Freight Expense:
Freight expense associated with products shipped to customers is recognized in cost of sales.
Marketing and Promotion Costs:
We promote our products with marketing, advertising, trade promotions, and consumer incentives, which include, but are not limited to, coupons, discounts, rebates, and volume-based incentives. Marketing and promotion expenses are charged to operations in the period incurred. Customer incentive and trade promotion activities are recorded as a reduction to sales based on amounts estimated as being due to customers, based primarily on historical utilization and redemption rates, while other marketing and promotional activities are recorded as selling, general and administrative expense.
Advertising Expenses:
Advertising expense is charged to operations in the period incurred and is recorded as selling, general and administrative expense. Advertising expense totaled
$238 million
,
$181 million
and
$112 million
in fiscal
2016
,
2015
and
2014
, respectively.
Research and Development:
Research and development costs are expensed as incurred. Research and development costs totaled
$96 million
,
$75 million
and
$52 million
in fiscal
2016
,
2015
and
2014
, respectively.
Use of Estimates:
The consolidated financial statements are prepared in conformity with accounting principles generally accepted in the United States, which require us to make estimates and assumptions that affect the amounts reported in the consolidated financial statements and accompanying notes. Actual results could differ from those estimates.
Recently Issued Accounting Pronouncements:
In August 2016, the Financial Accounting Standards Board ("FASB") issued guidance which aims to eliminate diversity in practice in how certain cash receipts and cash payments are presented and classified in the statement of cash flows. The guidance is effective for annual reporting periods and interim periods within those annual reporting periods beginning after December 15, 2017, our fiscal 2019. Early adoption is permitted and the retrospective transition method should be applied. We are currently evaluating the impact this guidance will have on our consolidated financial statements.
In March 2016, the FASB issued guidance which simplifies several aspects of the accounting for employee share-based payment transactions, including the accounting for income taxes, forfeitures, and statutory tax withholding requirements, as well as classification of related amounts within the statement of cash flows and impact on earnings per share. The guidance is effective for annual reporting periods and interim periods within those annual reporting periods beginning after December 15, 2016, our fiscal 2018. Early adoption is permitted and the application of the guidance requires various transition methods depending on the specific amendment. We are currently evaluating the impact this guidance will have on our consolidated financial statements.
In February 2016, the FASB issued guidance which created new accounting and reporting guidelines for leasing arrangements. The guidance requires lessees to recognize a right-of-use asset and lease liability for all leases with terms of more than 12 months. Recognition, measurement and presentation of expenses and cash flows arising from a lease will depend on classification as a finance or operating lease. The guidance also requires qualitative and quantitative disclosures regarding the amount, timing, and uncertainty of cash flows arising from leases. The guidance is effective for annual reporting periods and interim periods within those annual reporting periods beginning after December 15, 2018, our fiscal 2020. Early adoption is permitted and the modified retrospective method should be applied. We are currently evaluating the impact this guidance will have on our consolidated financial statements.
In January 2016, the FASB issued guidance that requires most equity investments be measured at fair value, with subsequent changes in fair value recognized in net income. The guidance also impacts financial liabilities under the fair value option and the presentation and disclosure requirements on the classification and measurement of financial instruments. The guidance is effective for annual reporting periods and interim periods within those annual reporting periods beginning after December 15, 2017, our fiscal 2019. It should be applied by means of a cumulative-effect adjustment to the balance sheet as of the beginning of the fiscal year of adoption, unless, equity securities do not have readily determinable fair values, in which case, the amendments should be applied prospectively. We are currently evaluating the impact this guidance will have on our consolidated financial statements.
In July 2015, the FASB issued guidance which requires management to evaluate inventory at the lower of cost and net realizable value. The guidance is effective for annual reporting periods and interim periods within those annual reporting periods beginning after December 15, 2016, our fiscal 2018. Early adoption is permitted and the prospective transition method should be applied. We are currently evaluating the impact this guidance will have on our consolidated financial statements.
In April 2015, the FASB issued guidance on the recognition of fees paid by a customer for cloud computing arrangements. The guidance clarifies that if a cloud computing arrangement includes a software license, the customer should account for the software license consistent with the acquisition of other software licenses. If the arrangement does not include a software license, the customer should account for the arrangement as a service contract. The guidance is effective for annual reporting periods and interim periods within those annual reporting periods beginning after December 15, 2015, our fiscal 2017, and should be applied prospectively or retrospectively, of which we will apply prospectively. The adoption of this guidance is not expected to have a material impact on our consolidated financial statements.
52
In February 2015, the FASB issued guidance changing the analysis procedures that a reporting entity must perform to determine whether it should consolidate certain types of legal entities. All legal entities are subject to reevaluation under the revised consolidation model. The new guidance affects the following areas: (1) limited partnerships and similar legal entities, (2) evaluating fees paid to a decision maker or a service provider as a variable interest, (3) the effect of fee arrangements on the primary beneficiary determination, (4) the effect of related parties on the primary beneficiary determination, and (5) certain investment funds. This guidance is effective for annual reporting periods and interim periods within those annual reporting periods, beginning after December 15, 2015, our fiscal 2017. Early adoption is permitted and the retrospective or modified retrospective transition method should be applied. This new guidance is not expected to have a material impact on our consolidated financial statements.
In May 2014, the FASB issued guidance changing the criteria for recognizing revenue. The guidance provides for a single five-step model to be applied to all revenue contracts with customers. The standard also requires additional financial statement disclosures that will enable users to understand the nature, amount, timing and uncertainty of revenue and cash flows relating to customer contracts. Companies have an option to use either a retrospective approach or cumulative effect adjustment approach to implement the standard. This guidance is effective for annual reporting periods and interim periods within those annual reporting periods beginning after December 15, 2017, our fiscal 2019. Early adoption is permitted for fiscal years beginning after December 15, 2016, our fiscal 2018. We are currently evaluating the impact this guidance will have on our consolidated financial statements.
In November 2015, the FASB issued guidance to simplify the presentation of deferred income taxes. The guidance requires that deferred tax liabilities and assets be classified as non-current in the balance sheet. The guidance is effective for annual reporting periods and interim periods within those annual reporting periods beginning after December 15, 2016, our fiscal 2018, and may be applied either prospectively to all deferred tax liabilities and assets or retrospectively to all periods presented. Early adoption is permitted. We early adopted this guidance, prospectively, for the year ended October 1, 2016. As a result, prior period balances were not retrospectively adjusted. The adoption did not have a material impact on our consolidated financial statements.
In May 2015, the FASB issued guidance which removes the requirement to categorize all investments within the fair value hierarchy for which fair values are measured using the net asset value (NAV) per share practical expedient. The guidance is effective for annual reporting periods and interim periods within those annual reporting periods beginning after December 15, 2015, our fiscal 2017. Early adoption is permitted and the retrospective transition method should be applied. We early adopted this guidance, retrospectively, for the year ended October 1, 2016. As a result, investments that are measured using the NAV per share practical expedient have not been categorized in the fair value hierarchy as of October 1, 2016 and October 3, 2015. The adoption did not have a material impact on our consolidated financial statements.
In April 2015, the FASB issued guidance which requires debt issuance costs to be presented in the balance sheet as a direct deduction from the associated debt liability; however, debt issuance costs related to revolving credit facilities will remain in other assets. The guidance is effective for annual reporting periods and interim periods within those annual reporting periods beginning after December 15, 2015, our fiscal 2017, with early adoption permitted. We early adopted this guidance, retrospectively, for the year ended October 1, 2016. As a result,
$29 million
and
$35 million
of deferred issuance costs have been reclassified from Other Assets to Long-Term Debt in our Consolidated Balance Sheets as of October 1, 2016 and October 3, 2015, respectively.
In April 2015, the FASB issued guidance which allows entities with a fiscal year end that does not coincide with a calendar month end to make an accounting policy election to measure defined benefit plan assets and obligations as of the end of the month closest to their fiscal year end. The guidance is effective for annual reporting periods and interim periods within those annual reporting periods beginning after December 15, 2015, our fiscal 2017. Early adoption is permitted and the prospective transition method should be applied. We early adopted this guidance, prospectively, for the year ended October 1, 2016. We have elected to measure the fair value of our defined benefit and other postretirement benefit plans as of the close of business on the Friday prior to our year-end. The adoption did not have a material impact on our consolidated financial statements.
Acquisitions
On August 28, 2014, we acquired all of the outstanding stock of The Hillshire Brands Company ("Hillshire Brands") as part of our strategic expansion initiative. The purchase price was equal to
$63.00
per share for Hillshire Brands' outstanding common stock, or
$8,081 million
. In addition, we paid
$163 million
in cash for breakage costs incurred by Hillshire Brands related to a previously announced acquisition. We funded the acquisition with existing cash on hand, net proceeds from the issuance of new senior notes, Class A common stock (Class A stock), and tangible equity units as well as borrowings under a new term loan facility (refer to Note 6: Debt and Note 7: Equity). Hillshire Brands' results from operations subsequent to the acquisition closing are included in the Prepared Foods segment.
53
During fiscal 2015, we recorded measurement period adjustments, which reduced goodwill by
$14 million
, after obtaining additional information regarding, among other things, asset valuations and liabilities assumed. The amount was not considered material and therefore prior periods were not revised. The purchase price allocation was finalized during the fourth quarter of fiscal 2015.
We completed the allocation of goodwill to our segments in the fourth quarter of fiscal 2015 using the with-and-without approach of the synergy impact to fair value of our reporting units. The allocation of goodwill to our Chicken, Beef, Pork, and Prepared Foods segments was
$658 million
,
$113 million
,
$106 million
and
$3,913 million
, respectively. The fair value of this goodwill is not deductible for United States income tax purposes.
The following unaudited pro forma information presents the combined results of operations as if the acquisition of Hillshire Brands had occurred at the beginning of fiscal 2013. Hillshire Brands' pre-acquisition results have been added to our historical results. The pro forma results contained in the table below include adjustments for amortization of acquired intangibles, depreciation expense, interest expense related to the financing and related income taxes. Any potential cost savings or other operational efficiencies that could result from the acquisition are not included in these pro forma results.
These pro forma results have been prepared for comparative purposes only and are not necessarily indicative of the results of operations as they would have been had the acquisitions occurred on the assumed dates, nor is it necessarily an indication of future operating results.
|
in millions (unaudited)
|
|
||
|
2014
|
|
||
|
Pro forma sales
|
$
|
41,311
|
|
|
Pro forma net income from continuing operations attributable to Tyson
|
1,047
|
|
|
|
Pro forma net income per diluted share from continuing operations attributable to Tyson
|
$
|
2.50
|
|
During fiscal 2014 we acquired a value-added food business as part of our strategic expansion initiative, which is included in our Prepared Foods segment. The aggregate purchase price of the acquisition was
$56 million
, which included
$12 million
for Property, Plant and Equipment,
$27 million
allocated to Intangible Assets and
$18 million
allocated to Goodwill.
Dispositions
In fiscal 2014, we announced our plan to sell our Brazil and Mexico operations, which are included in Other for segment reporting, to JBS SA ("JBS") for
$575 million
in cash less debt and other adjustments. As a result, we conducted an impairment test and recorded a
$39 million
impairment charge in the fourth quarter of fiscal 2014 related to our Brazil operation. We completed the sale of the Brazil operation in the first quarter of fiscal 2015 and received net proceeds of
$148 million
including working capital, net debt adjustments and cash transferred. The sale did not result in a significant gain or loss as the carrying value of the Brazil operation approximated the sales proceeds at the time of sale.
We completed the sale of the Mexico operation in the fourth quarter of fiscal 2015 and received net proceeds of approximately
$374 million
including working capital, net debt adjustments and cash transferred. As a result of the sale, we recorded a pre-tax gain of
$161 million
, which was reflected in Cost of Sales in our Consolidated Statements of Income. We utilized the net proceeds to retire the
2.75%
senior notes due September 2015.
In the fourth quarter of fiscal 2015, to better align our overall production capacity with then-current cattle supplies, we ceased beef operations at our Denison, Iowa plant. As a result, we recorded
$12 million
in closure and impairment charges during the fourth quarter of fiscal 2015. These charges impacted the Beef segment’s operating income and were reflected in Cost of Sales in our Consolidated Statements of Income.
In the fourth quarter of fiscal 2015, we recorded a
$59 million
impairment and other related charges associated with a Prepared Foods project designed to optimize the combined Tyson and Hillshire Brands network capacity and to enhance manufacturing efficiencies for the future. These charges were reflected in the Prepared Foods segment’s operating income in the fourth quarter of fiscal 2015, of which
$49 million
was included in the Consolidated Statements of Income in Cost of Sales and
$10 million
was included in the Consolidated Statements of Income in Selling, General and Administrative. As a result of this project, we sold our Chicago, Illinois, hospitality plant in June 2016 and closed our Jefferson, Wisconsin, plant in July 2016. The sale of our Chicago, Illinois, plant and closure of our Jefferson, Wisconsin, plant did not have a significant impact on the Company's operating results.
In the third quarter of fiscal 2015, as part of our ongoing efforts to increase efficiencies in our Chicken business, we closed our Buena Vista, Georgia, plant. The closure costs did not have a significant impact on the Company's operating results.
54
In fiscal 2014, we recorded impairment charges of
$52 million
related to the closure of
three
Prepared Foods plants. The Company’s Cherokee, Iowa plant closed in September 2014 and the Buffalo, New York and Santa Teresa, New Mexico plants each closed in January 2015. Additionally, in April 2014, Hillshire Brands announced that it would discontinue all production at its Florence, Alabama plant. The plant closed in December 2014 and the closure costs did not have a significant impact on the Company's financial results.
In fiscal 2014, we sold our
50 percent
ownership interest of Dynamic Fuels LLC (Dynamic Fuels) for
$30 million
cash consideration at closing and up to
$35 million
in future cash payments contingent on Dynamic Fuels' production volumes over a period of up to
11.5
years. Additionally as part of the terms of the sale, we were released from our guarantee of the
$100 million
Gulf Opportunity Zone tax-exempt bonds, which were issued in October 2008 to fund a portion of the plant construction costs. Dynamic Fuels previously qualified as a variable interest entity which we consolidated, as we were the primary beneficiary. As a result of the sale, we deconsolidated Dynamic Fuels and recorded a gain of approximately
$3 million
, which is reflected in Cost of Sales in our Consolidated Statements of Income. We will recognize the future contingent payments in income as the required volumes are produced.
The following table reflects major categories of property, plant and equipment and accumulated depreciation at
October 1, 2016
, and
October 3, 2015
:
|
in millions
|
|||||||
|
2016
|
|
2015
|
|
||||
|
Land
|
$
|
126
|
|
$
|
122
|
|
|
|
Building and leasehold improvements
|
3,662
|
|
3,581
|
|
|||
|
Machinery and equipment
|
6,789
|
|
6,452
|
|
|||
|
Land improvements and other
|
300
|
|
286
|
|
|||
|
Buildings and equipment under construction
|
290
|
|
375
|
|
|||
|
11,167
|
|
10,816
|
|
||||
|
Less accumulated depreciation
|
5,997
|
|
5,640
|
|
|||
|
Net property, plant and equipment
|
$
|
5,170
|
|
$
|
5,176
|
|
|
Approximately
$871 million
will be required to complete buildings and equipment under construction at
October 1, 2016
.
55
The following table reflects goodwill activity for fiscal
2016
and
2015
:
|
in millions
|
|||||||||||||||||||||||||||
|
Chicken
|
|
Beef
|
|
Pork
|
|
Prepared
Foods
|
|
Other
(a)
|
|
Unallocated
|
|
Consolidated
|
|
||||||||||||||
|
Balance at September 27, 2014
|
|||||||||||||||||||||||||||
|
Goodwill
|
$
|
907
|
|
$
|
1,123
|
|
$
|
317
|
|
$
|
92
|
|
$
|
57
|
|
$
|
4,804
|
|
$
|
7,300
|
|
||||||
|
Accumulated impairment losses
|
—
|
|
(560
|
)
|
—
|
|
—
|
|
(34
|
)
|
—
|
|
(594
|
)
|
|||||||||||||
|
907
|
|
563
|
|
317
|
|
92
|
|
23
|
|
4,804
|
|
6,706
|
|
||||||||||||||
|
Fiscal 2015 Activity:
|
|||||||||||||||||||||||||||
|
Measurement period adjustments
|
—
|
|
—
|
|
—
|
|
—
|
|
—
|
|
(14
|
)
|
(14
|
)
|
|||||||||||||
|
Allocation of acquired goodwill
|
658
|
|
113
|
|
106
|
|
3,913
|
|
—
|
|
(4,790
|
)
|
—
|
|
|||||||||||||
|
Impairment losses
|
—
|
|
—
|
|
—
|
|
—
|
|
(23
|
)
|
—
|
|
(23
|
)
|
|||||||||||||
|
Currency translation and other
|
(2
|
)
|
—
|
|
—
|
|
—
|
|
—
|
|
—
|
|
(2
|
)
|
|||||||||||||
|
Balance at October 3, 2015
|
|||||||||||||||||||||||||||
|
Goodwill
|
1,563
|
|
1,236
|
|
423
|
|
4,005
|
|
57
|
|
—
|
|
7,284
|
|
|||||||||||||
|
Accumulated impairment losses
|
—
|
|
(560
|
)
|
—
|
|
—
|
|
(57
|
)
|
—
|
|
(617
|
)
|
|||||||||||||
|
$
|
1,563
|
|
$
|
676
|
|
$
|
423
|
|
$
|
4,005
|
|
$
|
—
|
|
$
|
—
|
|
$
|
6,667
|
|
|||||||
|
Fiscal 2016 Activity:
|
|||||||||||||||||||||||||||
|
Currency translation and other
|
2
|
|
—
|
|
—
|
|
—
|
|
—
|
|
—
|
|
2
|
|
|||||||||||||
|
Balance at October 1, 2016
|
|||||||||||||||||||||||||||
|
Goodwill
|
1,565
|
|
1,236
|
|
423
|
|
4,005
|
|
57
|
|
—
|
|
7,286
|
|
|||||||||||||
|
Accumulated impairment losses
|
—
|
|
(560
|
)
|
—
|
|
—
|
|
(57
|
)
|
—
|
|
(617
|
)
|
|||||||||||||
|
$
|
1,565
|
|
$
|
676
|
|
$
|
423
|
|
$
|
4,005
|
|
$
|
—
|
|
$
|
—
|
|
$
|
6,669
|
|
|||||||
(a) Other included the goodwill from our foreign chicken operation.
On August 28, 2014, we acquired and consolidated Hillshire Brands. The unallocated portion of goodwill at September 27, 2014, is attributable to our acquisition of Hillshire Brands. During fiscal 2015, we recorded measurement period adjustments, which reduced goodwill by
$14 million
and completed the allocation of goodwill to our segments (see Note 3: Acquisitions and Dispositions).
The following table reflects intangible assets by type at
October 1, 2016
, and
October 3, 2015
:
|
in millions
|
|||||||
|
2016
|
|
2015
|
|
||||
|
Amortizable intangible assets:
|
|||||||
|
Brands and trademarks
|
$
|
590
|
|
$
|
594
|
|
|
|
Customer relationships
|
564
|
|
564
|
|
|||
|
Patents, intellectual property and other
|
114
|
|
115
|
|
|||
|
Land use rights
|
9
|
|
9
|
|
|||
|
Total gross amortizable intangible assets
|
$
|
1,277
|
|
$
|
1,282
|
|
|
|
Less accumulated amortization
|
271
|
|
192
|
|
|||
|
Total net amortizable intangible assets
|
$
|
1,006
|
|
$
|
1,090
|
|
|
|
Brands and trademarks not subject to amortization
|
4,078
|
|
4,078
|
|
|||
|
Total intangible assets
|
$
|
5,084
|
|
$
|
5,168
|
|
|
Amortization expense of
$80 million
,
$92 million
and
$26 million
was recognized during fiscal
2016
,
2015
and
2014
, respectively. We estimate amortization expense on intangible assets for the next five fiscal years subsequent to
October 1, 2016
, will be:
2017
-
$78 million
;
2018
-
$76 million
;
2019
-
$72 million
;
2020
-
$69 million
;
2021
-
$66 million
.
56
The following table reflects major components of debt as of
October 1, 2016
, and
October 3, 2015
:
|
in millions
|
|
||||||
|
2016
|
|
2015
|
|
||||
|
Revolving credit facility
|
$
|
300
|
|
$
|
—
|
|
|
|
Senior notes:
|
|||||||
|
6.60% Senior notes due April 2016 (2016 Notes)
|
—
|
|
638
|
|
|||
|
7.00% Notes due May 2018
|
120
|
|
120
|
|
|||
|
2.65% Notes due August 2019 (2019 Notes)
|
1,000
|
|
1,000
|
|
|||
|
4.10% Notes due September 2020
|
284
|
|
285
|
|
|||
|
4.50% Senior notes due June 2022 (2022 Notes)
|
1,000
|
|
1,000
|
|
|||
|
3.95% Notes due August 2024 (2024 Notes)
|
1,250
|
|
1,250
|
|
|||
|
7.00% Notes due January 2028
|
18
|
|
18
|
|
|||
|
6.13% Notes due November 2032
|
163
|
|
163
|
|
|||
|
4.88% Notes due August 2034 (2034 Notes)
|
500
|
|
500
|
|
|||
|
5.15% Notes due August 2044 (2044 Notes)
|
500
|
|
500
|
|
|||
|
Discount on senior notes
|
(8
|
)
|
(10
|
)
|
|||
|
Term loans:
|
|||||||
|
Tranche B due April 2019 (1.69% at 10/1/2016)
|
500
|
|
500
|
|
|||
|
Tranche B due August 2019 (2.06% at 10/1/2016)
|
552
|
|
552
|
|
|||
|
Amortizing Notes - Tangible Equity Units (see Note 7: Equity)
|
71
|
|
140
|
|
|||
|
Other
|
58
|
|
69
|
|
|||
|
Unamortized debt issuance costs
|
(29
|
)
|
(35
|
)
|
|||
|
Total debt
|
6,279
|
|
6,690
|
|
|||
|
Less current debt
|
79
|
|
715
|
|
|||
|
Total long-term debt
|
$
|
6,200
|
|
$
|
5,975
|
|
|
Annual maturities of debt for the five fiscal years subsequent to
October 1, 2016
, are:
2017
-
$79 million
;
2018
-
$128 million
;
2019
-
$2,359 million
;
2020
-
$285 million
;
2021
-
$10 million
.
Revolving Credit Facility
We have a
$1.25 billion
revolving credit facility that supports short-term funding needs and letters of credit. The facility will mature and the commitments thereunder will terminate in
September 2019
. After reducing for the amount borrowed and outstanding letters of credit issued under this facility, the amount available for borrowing at
October 1, 2016
, was
$943 million
. At
October 1, 2016
, we had outstanding letters of credit issued under this facility totaling
$7 million
, none of which were drawn upon. We had an additional
$91 million
of bilateral letters of credit issued separately from the revolving credit facility, none of which were drawn upon. Our letters of credit are issued primarily in support of leasing obligations and workers’ compensation insurance programs.
If in the future any of our subsidiaries shall guarantee any of our material indebtedness, such subsidiary shall be required to guarantee the indebtedness, obligations and liabilities under this facility.
2013 Notes
In September 2008, we issued
$458 million
principal amount
3.25%
convertible senior unsecured notes due October 15, 2013. In connection with the issuance of the 2013 Notes, we entered into separate call option and warrant transactions with respect to our Class A stock to minimize the potential economic dilution upon conversion of the 2013 Notes. The call options contractually expired upon the maturity of the 2013 Notes. The 2013 Notes matured on October 15, 2013 at which time we paid the
$458 million
principal value with cash on hand and settled the conversion premium by issuing
11.7 million
shares of our Class A stock from available treasury shares. Simultaneously with the settlement of the conversion premium, we received
11.7 million
shares of our Class A stock from the call options. The warrants were settled on various dates in fiscal 2014 resulting in the issuance of
11.7 million
shares of Class A stock.
57
2016 Notes
On March 31, 2016, we repaid the entire outstanding
$638 million
principal balance on the 2016 Notes. Tyson Fresh Meats, Inc. (TFM Parent), our wholly owned subsidiary, fully and unconditionally guaranteed the 2016 Notes, 2019 Notes, 2022 Notes, 2024 Notes, 2034 Notes, 2044 Notes, amortizing notes related to our tangible equity units, our
$1.25 billion
revolving credit facility and term loans. As a result of the retirement of the 2016 Notes in the second quarter of fiscal 2016, all of TFM Parent's guarantees were released and TFM Parent is no longer required to disclose guarantor financial statements.
Term Loans
On May 5, 2016, we amended our existing
$500 million
tranche B term loan agreement which extended the maturity of the loan from April 2018 to April 2019.
Debt Covenants
Our revolving credit and term loan facilities contain affirmative and negative covenants that, among other things, may limit or restrict our ability to: create liens and encumbrances; incur debt; merge, dissolve, liquidate or consolidate; make acquisitions and investments; dispose of or transfer assets; change the nature of our business; engage in certain transactions with affiliates; and enter into hedging transactions, in each case, subject to certain qualifications and exceptions. In addition, we are required to maintain minimum interest expense coverage and maximum debt-to-capitalization ratios.
Our senior notes also contain affirmative and negative covenants that, among other things, may limit or restrict our ability to: create liens; engage in certain sale/leaseback transactions; and engage in certain consolidations, mergers and sales of assets.
We were in compliance with all debt covenants at
October 1, 2016
.
Capital Stock
We have
two
classes of capital stock, Class A stock,
$0.10
par value and Class B Common Stock,
$0.10
par value (Class B stock). Holders of Class B stock may convert such stock into Class A stock on a share-for-share basis. Holders of Class B stock are entitled to
10
votes per share, while holders of Class A stock are entitled to
one
vote per share on matters submitted to shareholders for approval. As of
October 1, 2016
, Tyson Limited Partnership (the TLP) owned
99.985%
of the outstanding shares of Class B stock and the TLP and members of the Tyson family owned, in the aggregate,
2.06%
of the outstanding shares of Class A stock, giving them, collectively, control of approximately
71.18%
of the total voting power of the outstanding voting stock.
The Class B stock is considered a participating security requiring the use of the two-class method for the computation of basic earnings per share. The two-class computation method for each period reflects the cash dividends paid for each class of stock, plus the amount of allocated undistributed earnings (losses) computed using the participation percentage, which reflects the dividend rights of each class of stock. Basic earnings per share were computed using the two-class method for all periods presented. The shares of Class B stock are considered to be participating convertible securities since the shares of Class B stock are convertible on a share-for-share basis into shares of Class A stock. Diluted earnings per share were computed assuming the conversion of the Class B shares into Class A shares as of the beginning of each period.
Dividends
Cash dividends cannot be paid to holders of Class B stock unless they are simultaneously paid to holders of Class A stock. The per share amount of the cash dividend paid to holders of Class B stock cannot exceed
90%
of the cash dividend simultaneously paid to holders of Class A stock. We pay quarterly cash dividends to Class A and Class B shareholders. We paid Class A dividends per share of
$0.60
,
$0.40
, and
$0.30
in fiscal 2016, 2015, and 2014, respectively. We paid Class B dividends per share of
$0.54
,
$0.36
, and
$0.27
in fiscal 2016, 2015, and 2014, respectively. On November 17, 2016, the Board of Directors increased the quarterly dividend previously declared on August 4, 2016, to
$0.225
per share on our Class A stock and
$0.2025
per share on our Class B stock. The increased quarterly dividend is payable on December 15, 2016, to shareholders of record at the close of business on December 1, 2016.
Share Repurchases
On February 4, 2016, our Board of Directors approved an increase of
50 million
shares authorized for repurchase under our share repurchase program. As of
October 1, 2016
,
40.3 million
shares remained available for repurchase. The share repurchase program has no fixed or scheduled termination date and the timing and extent to which we repurchase shares will depend upon, among other things, our working capital needs, markets, industry conditions, liquidity targets, limitations under our debt obligations and regulatory requirements. In addition to the share repurchase program, we purchase shares on the open market to fund certain obligations under our equity compensation plans.
58
A summary of cumulative share repurchases of our Class A stock for fiscal 2016, 2015 and 2014 is as follows:
|
in millions
|
|||||||||||||||||||||
|
October 1, 2016
|
October 3, 2015
|
September 27, 2014
|
|||||||||||||||||||
|
Shares
|
Dollars
|
Shares
|
Dollars
|
Shares
|
Dollars
|
||||||||||||||||
|
Shares repurchased:
|
|||||||||||||||||||||
|
Under share repurchase program
|
30.8
|
|
$
|
1,868
|
|
11.0
|
|
$
|
455
|
|
7.1
|
|
$
|
250
|
|
||||||
|
To fund certain obligations under equity compensation plans
|
1.3
|
|
76
|
|
0.9
|
|
40
|
|
1.2
|
|
45
|
|
|||||||||
|
Total share repurchases
|
32.1
|
|
$
|
1,944
|
|
11.9
|
|
$
|
495
|
|
8.3
|
|
$
|
295
|
|
||||||
Subsequent to October 1, 2016, through November 18, 2016, we repurchased approximately
3.6 million
shares of our common stock under our share repurchase program. These shares were repurchased for
$255 million
.
Share Issuance
In fiscal 2014, we issued
23.8 million
shares of our Class A stock, to provide funding for the Hillshire Brands acquisition. Total proceeds, net of underwriting discounts and other offering related fees and expenses were
$873 million
.
Tangible Equity Units
In fiscal 2014, we completed the public issuance of
30 million
,
4.75%
tangible equity units (TEUs). Total proceeds, net of underwriting discounts and other expenses, were
$1,454 million
. Each TEU, which has a stated amount of
$50
, is comprised of a prepaid stock purchase contract and a senior amortizing note due July 15, 2017. We allocated the proceeds from the issuance of the TEUs to equity and debt based on the relative fair values of the respective components of each TEU. The fair value of the prepaid stock purchase contracts, which was
$1,295 million
, was recorded in Capital in Excess of Par Value, net of issuance costs. The fair value of the senior amortizing notes, which was
$205 million
, was recorded in debt. Issuance costs associated with the TEU debt were recorded as deferred debt issuance cost and is amortized over the term of the instrument to July 15, 2017.
The aggregate values assigned upon issuance of each component of the TEU's, based on the relative fair value of the respective components of each TEU, were as follows:
|
in millions, except price per TEU
|
|||||||||||
|
Equity Component
|
Debt Component
|
Total
|
|||||||||
|
Price per TEU
|
$
|
43.17
|
|
$
|
6.83
|
|
$
|
50.00
|
|
||
|
Gross Proceeds
|
1,295
|
|
205
|
|
1,500
|
|
|||||
|
Issuance cost
|
(40
|
)
|
(6
|
)
|
(46
|
)
|
|||||
|
Net proceeds
|
$
|
1,255
|
|
$
|
199
|
|
$
|
1,454
|
|
||
Each senior amortizing note has an initial principal amount of
$6.83
and bears interest at
1.5%
per annum. On each January 15, April 15, July 15 and October 15, we will pay equal quarterly cash installments of
$0.59
per amortizing note which cash payment in the aggregate (principal and interest) is equivalent to
4.75%
per year with respect to the
$50
stated amount per TEU. Each installment constitutes a payment of interest and partial repayment of principal.
59
During fiscal 2016, holders settled
17.7 million
purchase contracts and, in exchange, the Company issued
18.8 million
shares of its Class A stock. Upon early settlement of these purchase contracts, the corresponding amortizing notes remain outstanding and beneficially owned by the holders that settled purchase contracts early. As of October 1, 2016,
12.3 million
TEU's remained outstanding. The remaining TEUs will continue to be held pursuant to their original terms and conditions, including automatic settlement on July 15, 2017, as described above. As a result of the purchase contracts tendered in fiscal 2016, our remaining obligation is to deliver between a minimum of
13.1 million
shares and a maximum of
16.4 million
shares of our Class A stock, subject to adjustment, based upon the Applicable Market Value (as defined below) of our Class A stock as described below:
|
•
|
If the Applicable Market Value is equal to or greater than the conversion price of
$46.90
per share, we will deliver
1.0660
shares of Class A stock per purchase contract, or a minimum of
13.1 million
Class A shares.
|
|
•
|
If the Applicable Market Value is greater than the reference price of
$37.52
but less than the conversion price of
$46.90
per share, we will deliver a number of shares per purchase contract equal to
$50
, divided by the Applicable Market Value.
|
|
•
|
If the Applicable Market Value is less than or equal to the reference price of
$37.52
per share, we will deliver
1.3326
shares of Class A stock per purchase contract, or a maximum of
16.4 million
Class A shares.
|
The "Applicable Market Value" means the average of the closing prices of our Class A stock on each of the
20
consecutive trading days beginning on, and including, the 23rd scheduled trading day immediately preceding July 15, 2017.
On September 15, 2016, we paid our quarterly dividend to shareholders of record at September 1, 2016, equal to
$0.15
per share on our Class A stock. The amount of the distribution exceeded the
$0.075
per share dividend threshold amount. Consequently, the settlement rates, reference price and conversion price were adjusted and are reflected above.
The TEUs have a dilutive effect on our earnings per share. The
13.1 million
minimum shares to be issued are included in the calculation of Class A Basic weighted average shares. The
3.3 million
share difference between the minimum shares and the
16.4 million
maximum shares are potentially dilutive securities, and accordingly, are included in our diluted earnings per share on a pro rata basis to the extent the Applicable Market Value is higher than the reference price but is less than the conversion price.
Detail of the provision for income taxes from continuing operations consists of the following:
|
in millions
|
|
||||||||||
|
2016
|
|
2015
|
|
2014
|
|
||||||
|
Federal
|
$
|
710
|
|
$
|
564
|
|
$
|
325
|
|
||
|
State
|
118
|
|
89
|
|
67
|
|
|||||
|
Foreign
|
(2
|
)
|
44
|
|
4
|
|
|||||
|
|
$
|
826
|
|
$
|
697
|
|
$
|
396
|
|
||
|
Current
|
$
|
742
|
|
$
|
659
|
|
$
|
501
|
|
||
|
Deferred
|
84
|
|
38
|
|
(105
|
)
|
|||||
|
|
$
|
826
|
|
$
|
697
|
|
$
|
396
|
|
||
The reasons for the difference between the statutory federal income tax rate and our effective income tax rate from continuing operations are as follows:
|
2016
|
|
2015
|
|
2014
|
|
|||
|
Federal income tax rate
|
35.0
|
%
|
35.0
|
%
|
35.0
|
%
|
||
|
State income taxes
|
2.7
|
|
3.1
|
|
2.8
|
|
||
|
Unrecognized tax benefits, net
|
(1.7
|
)
|
(1.8
|
)
|
(4.7
|
)
|
||
|
Domestic production deduction
|
(2.6
|
)
|
(3.7
|
)
|
(4.0
|
)
|
||
|
Foreign rate differences and valuation allowances
|
—
|
|
3.8
|
|
2.8
|
|
||
|
Other
|
(1.6
|
)
|
(0.1
|
)
|
(0.3
|
)
|
||
|
|
31.8
|
%
|
36.3
|
%
|
31.6
|
%
|
||
During fiscal 2016, the domestic production deduction and changes in unrecognized tax benefits decreased tax expense by
$68 million
and
$43 million
, respectively, and state tax expense, net of federal tax benefit, was
$70 million
.
60
During fiscal 2015, the domestic production deduction and changes in unrecognized tax benefits decreased tax expense by
$72 million
and
$34 million
, respectively, and state tax expense, net of federal tax benefit, was
$59 million
. Additionally, foreign rate differences, mostly driven by the China impairment, unfavorably impacted tax expense by
$73 million
. The sale of the Mexico and Brazil operations and related repatriation of proceeds did not have a significant impact on the effective income tax rate.
During fiscal 2014 the domestic production deduction and the decrease in unrecognized tax benefits decreased tax expense by
$50 million
and
$58 million
, respectively.
Approximately
$2,543 million
,
$1,908 million
, and
$1,270 million
of income from continuing operations before income taxes for fiscal
2016
,
2015
and
2014
, respectively, were from our operations based in the United States.
We recognize deferred income taxes for the future tax consequences attributable to differences between the financial statement carrying amounts of existing assets and liabilities and their respective tax bases. Deferred tax assets and liabilities are measured using tax rates expected to apply to taxable income in the years in which those temporary differences are expected to be recovered or settled.
The tax effects of major items recorded as deferred tax assets and liabilities as of
October 1, 2016
, and
October 3, 2015
, are as follows:
|
in millions
|
|
||||||||||||||
|
2016
|
2015
|
||||||||||||||
|
Deferred Tax
|
Deferred Tax
|
||||||||||||||
|
Assets
|
|
Liabilities
|
|
Assets
|
|
Liabilities
|
|
||||||||
|
Property, plant and equipment
|
$
|
—
|
|
$
|
857
|
|
$
|
—
|
|
$
|
783
|
|
|||
|
Intangible assets
|
—
|
|
1,979
|
|
—
|
|
2,000
|
|
|||||||
|
Accrued expenses
|
400
|
|
—
|
|
439
|
|
—
|
|
|||||||
|
Net operating loss and other carryforwards
|
86
|
|
—
|
|
97
|
|
—
|
|
|||||||
|
Other
|
140
|
|
259
|
|
122
|
|
238
|
|
|||||||
|
$
|
626
|
|
$
|
3,095
|
|
$
|
658
|
|
$
|
3,021
|
|
||||
|
Valuation allowance
|
$
|
(72
|
)
|
$
|
(68
|
)
|
|||||||||
|
Net deferred tax liability
|
$
|
2,541
|
|
$
|
2,431
|
|
|||||||||
At
October 1, 2016
, our gross state tax net operating loss carryforwards approximated
$845 million
and expire in fiscal years
2017
through
2036
. Gross foreign net operating loss carryforwards approximated
$35 million
and expire in fiscal years
2017
through
2022
. We also have tax credit carryforwards of approximately
$42 million
that expire in fiscal years
2017
through
2031
.
We have accumulated undistributed earnings of foreign subsidiaries aggregating approximately
$219 million
and
$139 million
at
October 1, 2016
, and
October 3, 2015
, respectively. The accumulated undistributed earnings at October 1, 2016 are expected to be indefinitely reinvested outside of the United States. If those earnings were distributed in the form of dividends or otherwise, we could be subject to federal income taxes (subject to an adjustment for foreign tax credits), state income taxes and withholding taxes payable to the various foreign countries. Due to the uncertainty of the manner in which the undistributed earnings would be brought back to the United States, the tax laws in effect at that time, as well as the availability of the Company to claim foreign tax credits, it is not currently practicable to estimate the tax liability that might be payable on the repatriation of these foreign earnings.
The following table summarizes the activity related to our gross unrecognized tax benefits at
October 1, 2016
,
October 3, 2015
, and
September 27, 2014
:
|
in millions
|
|
||||||||||
|
2016
|
|
2015
|
|
2014
|
|
||||||
|
Balance as of the beginning of the year
|
$
|
306
|
|
$
|
272
|
|
$
|
175
|
|
||
|
Increases related to current year tax positions
|
35
|
|
78
|
|
11
|
|
|||||
|
Increases related to prior year tax positions
|
31
|
|
11
|
|
17
|
|
|||||
|
Change related to Hillshire Brands balances
|
—
|
|
—
|
|
136
|
|
|||||
|
Reductions related to prior year tax positions
|
(48
|
)
|
(18
|
)
|
(20
|
)
|
|||||
|
Reductions related to settlements
|
(7
|
)
|
—
|
|
(1
|
)
|
|||||
|
Reductions related to expirations of statutes of limitations
|
(12
|
)
|
(37
|
)
|
(46
|
)
|
|||||
|
Balance as of the end of the year
|
$
|
305
|
|
$
|
306
|
|
$
|
272
|
|
||
61
The amount of unrecognized tax benefits, if recognized, that would impact our effective tax rate was
$205 million
and
$244 million
at
October 1, 2016
, and
October 3, 2015
, respectively. We classify interest and penalties on unrecognized tax benefits as income tax expense. At
October 1, 2016
, and
October 3, 2015
, before tax benefits, we had
$52 million
and
$46 million
, respectively, of accrued interest and penalties on unrecognized tax benefits.
As of
October 1, 2016
, we are subject to income tax examinations for United States federal income taxes for fiscal years 2013 through 2015. We are also subject to income tax examinations by major state and foreign jurisdictions for fiscal years 2005 through 2015 and 2002 through 2015, respectively. We estimate that during the next twelve months it is reasonably possible that unrecognized tax benefits could decrease by as much as
$10 million
primarily due to expiration of statutes in various jurisdictions.
During fiscal 2016, we recorded
$12 million
of equity earnings in joint ventures and
$4 million
in net foreign currency exchange losses, which were recorded in the Consolidated Statements of Income in Other, net.
During fiscal 2015, following the sale of our Mexico and Brazil chicken production operations, we reviewed our strategy and outlook for the remaining international businesses, which operations include our chicken production operations in China. Despite our belief in the potential for this business, our Chinese operations had not achieved profitability. Given the losses that were generated in this business, changes in the strategy and management of the business, and the depressed economic outlook for China at that time, we assessed our Chinese operations for potential impairment in the fourth quarter of fiscal 2015.
As a result of this evaluation, during the fourth quarter of fiscal 2015, we recorded a
$169 million
impairment charge. The impairment was comprised of
$126 million
of property, plant and equipment,
$23 million
of goodwill and
$20 million
of other assets. The China operation is included in Other for segment reporting and the impairment was included in Cost of Sales in the Consolidated Statements of Income.
During fiscal 2015, we recorded
$12 million
of equity earnings in joint ventures and
$21 million
of gains on the sale of equity securities, which were recorded in the Consolidated Statements of Income in Other, net.
During fiscal 2014, we recorded
$11 million
of equity earnings in joint ventures,
$3 million
in net foreign currency exchange gains,
$6 million
of other than temporary impairment related to an available-for-sale security and
$60 million
of costs associated with bridge financing facilities for the Hillshire Brands acquisition, which were recorded in the Consolidated Statements of Income in Other, net.
62
The earnings and weighted average common shares used in the computation of basic and diluted earnings per share are as follows:
|
in millions, except per share data
|
|||||||||||
|
2016
|
|
2015
|
|
2014
|
|
||||||
|
Numerator:
|
|||||||||||
|
Net income
|
$
|
1,772
|
|
$
|
1,224
|
|
$
|
856
|
|
||
|
Less: Net income (loss) attributable to noncontrolling interests
|
4
|
|
4
|
|
(8
|
)
|
|||||
|
Net income attributable to Tyson
|
1,768
|
|
1,220
|
|
864
|
|
|||||
|
Less dividends declared:
|
|||||||||||
|
Class A
|
192
|
|
129
|
|
94
|
|
|||||
|
Class B
|
41
|
|
26
|
|
21
|
|
|||||
|
Undistributed earnings
|
$
|
1,535
|
|
$
|
1,065
|
|
$
|
749
|
|
||
|
Class A undistributed earnings
|
$
|
1,279
|
|
$
|
896
|
|
$
|
612
|
|
||
|
Class B undistributed earnings
|
256
|
|
169
|
|
137
|
|
|||||
|
Total undistributed earnings
|
$
|
1,535
|
|
$
|
1,065
|
|
$
|
749
|
|
||
|
Denominator:
|
|||||||||||
|
Denominator for basic earnings per share:
|
|||||||||||
|
Class A weighted average shares
|
315
|
|
335
|
|
284
|
|
|||||
|
Class B weighted average shares, and shares under if-converted method for diluted earnings per share
|
70
|
|
70
|
|
70
|
|
|||||
|
Effect of dilutive securities:
|
|||||||||||
|
Stock options and restricted stock
|
5
|
|
5
|
|
5
|
|
|||||
|
Tangible Equity Units
|
—
|
|
3
|
|
1
|
|
|||||
|
Warrants
|
—
|
|
—
|
|
4
|
|
|||||
|
Denominator for diluted earnings per share – adjusted weighted average shares and assumed conversions
|
390
|
|
413
|
|
364
|
|
|||||
|
Net Income Per Share Attributable to Tyson:
|
|||||||||||
|
Class A Basic
|
$
|
4.67
|
|
$
|
3.06
|
|
$
|
2.48
|
|
||
|
Class B Basic
|
$
|
4.24
|
|
$
|
2.79
|
|
$
|
2.26
|
|
||
|
Diluted
|
$
|
4.53
|
|
$
|
2.95
|
|
$
|
2.37
|
|
||
We had no stock-based compensation shares that were antidilutive for fiscal 2016. We had approximately
5 million
and
4 million
of our stock-based compensation shares that were antidilutive for fiscal 2015 and fiscal 2014, respectively. These shares were not included in the dilutive earnings per share calculation.
We have
two
classes of capital stock, Class A stock and Class B stock. Cash dividends cannot be paid to holders of Class B stock unless they are simultaneously paid to holders of Class A stock. The per share amount of cash dividends paid to holders of Class B stock cannot exceed
90%
of the cash dividends paid to holders of Class A stock.
We allocate undistributed earnings based upon a
1
to
0.9
ratio per share to Class A stock and Class B stock, respectively. We allocate undistributed earnings based on this ratio due to historical dividend patterns, voting control of Class B shareholders and contractual limitations of dividends to Class B stock.
63
Our business operations give rise to certain market risk exposures mostly due to changes in commodity prices, foreign currency exchange rates and interest rates. We manage a portion of these risks through the use of derivative financial instruments to reduce our exposure to commodity price risk, foreign currency risk and interest rate risk. Our risk management programs are periodically reviewed by our Board of Directors' Audit Committee. These programs are monitored by senior management and may be revised as market conditions dictate. Our current risk management programs utilize industry-standard models that take into account the implicit cost of hedging. Risks associated with our market risks and those created by derivative instruments and the fair values are strictly monitored, using value-at-risk and stress tests. Credit risks associated with our derivative contracts are not significant as we minimize counterparty concentrations, utilize margin accounts or letters of credit, and deal with credit-worthy counterparties. Additionally, our derivative contracts are mostly short-term in duration and we generally do not make use of credit-risk-related contingent features. No significant concentrations of credit risk existed at
October 1, 2016
.
We had the following aggregated outstanding notional amounts related to our derivative financial instruments:
|
in millions, except soy meal tons
|
||||||||||
|
Metric
|
October 1, 2016
|
|
October 3, 2015
|
|
||||||
|
Corn
|
Bushels
|
50
|
|
18
|
|
|||||
|
Soy Meal
|
Tons
|
389,700
|
|
284,900
|
|
|||||
|
Live Cattle
|
Pounds
|
28
|
|
102
|
|
|||||
|
Lean Hogs
|
Pounds
|
158
|
|
166
|
|
|||||
|
Foreign Currency
|
United States dollar
|
$
|
38
|
|
$
|
42
|
|
|||
We recognize all derivative instruments as either assets or liabilities at fair value in the Consolidated Balance Sheets, with the exception of normal purchases and normal sales expected to result in physical delivery. For those derivative instruments that are designated and qualify as hedging instruments, we designate the hedging instrument based upon the exposure being hedged (i.e., cash flow hedge or fair value hedge). We designate certain forward contracts as follows:
|
•
|
Cash Flow Hedges – include certain commodity forward and option contracts of forecasted purchases (i.e., grains) and certain foreign exchange forward contracts.
|
|
•
|
Fair Value Hedges – include certain commodity forward contracts of firm commitments (i.e., livestock).
|
Cash flow hedges
Derivative instruments are designated as hedges against changes in the amount of future cash flows related to procurement of certain commodities utilized in our production processes. For the derivative instruments we designate and qualify as a cash flow hedge, the effective portion of the gain or loss on the derivative is reported as a component of other comprehensive income (OCI) and reclassified into earnings in the same period or periods during which the hedged transaction affects earnings. Gains and losses representing hedge ineffectiveness are recognized in earnings in the current period. Ineffectiveness related to our cash flow hedges was not significant during fiscal
2016
,
2015
and
2014
. As of
October 1, 2016
, the net amounts expected to be reclassified into earnings within the next 12 months are pretax losses of
$3 million
. During fiscal
2016
,
2015
and
2014
, we did not reclassify significant pretax gains/losses into earnings as a result of the discontinuance of cash flow hedges.
The following table sets forth the pretax impact of cash flow hedge derivative instruments in the Consolidated Statements of Income:
|
in millions
|
|||||||||||||||||||||||||
|
Gain (Loss)
Recognized in OCI
on Derivatives
|
Consolidated
Statements of Income
Classification
|
Gain (Loss)
Reclassified from
OCI to Earnings
|
|||||||||||||||||||||||
|
2016
|
|
2015
|
|
2014
|
|
2016
|
|
2015
|
|
2014
|
|
||||||||||||||
|
Cash Flow Hedge – Derivatives designated as hedging instruments:
|
|||||||||||||||||||||||||
|
Commodity contracts
|
$
|
(1
|
)
|
$
|
(4
|
)
|
$
|
(7
|
)
|
Cost of Sales
|
$
|
1
|
|
$
|
(7
|
)
|
$
|
(10
|
)
|
||||||
|
Foreign exchange contracts
|
—
|
|
—
|
|
(1
|
)
|
Other Income/Expense
|
—
|
|
—
|
|
—
|
|
||||||||||||
|
Total
|
$
|
(1
|
)
|
$
|
(4
|
)
|
$
|
(8
|
)
|
$
|
1
|
|
$
|
(7
|
)
|
$
|
(10
|
)
|
|||||||
64
Fair value hedges
We designate certain derivative contracts as fair value hedges of firm commitments to purchase livestock for slaughter. Our objective of these hedges is to minimize the risk of changes in fair value created by fluctuations in commodity prices associated with fixed price livestock firm commitments. For these derivative instruments we designate and qualify as a fair value hedge, the gain or loss on the derivative, as well as the offsetting gain or loss on the hedged item attributable to the hedged risk, are recognized in earnings in the same period. We include the gain or loss on the hedged items (i.e., livestock purchase firm commitments) in the same line item, Cost of Sales, as the offsetting gain or loss on the related livestock forward position.
|
in millions
|
||||||||||||||
|
Consolidated
Statements of Income
Classification
|
2016
|
|
2015
|
|
2014
|
|
||||||||
|
Gain (Loss) on forwards
|
Cost of Sales
|
$
|
89
|
|
$
|
17
|
|
$
|
(154
|
)
|
||||
|
Gain (Loss) on purchase contract
|
Cost of Sales
|
(89
|
)
|
(17
|
)
|
154
|
|
|||||||
Ineffectiveness related to our fair value hedges was not significant during fiscal
2016
,
2015
and
2014
.
Undesignated positions
In addition to our designated positions, we also hold derivative contracts for which we do not apply hedge accounting. These include certain derivative instruments related to commodities price risk, including grains, livestock, energy and foreign currency risk. We mark these positions to fair value through earnings at each reporting date.
The following table sets forth the pretax impact of the undesignated derivative instruments in the Consolidated Statements of Income:
|
in millions
|
||||||||||||||
|
Consolidated
Statements of Income
Classification
|
Gain (Loss)
Recognized
in Earnings
|
|||||||||||||
|
2016
|
|
2015
|
|
2014
|
|
|||||||||
|
Derivatives not designated as hedging instruments:
|
||||||||||||||
|
Commodity contracts
|
Sales
|
$
|
(73
|
)
|
$
|
(62
|
)
|
$
|
75
|
|
||||
|
Commodity contracts
|
Cost of Sales
|
17
|
|
(33
|
)
|
(136
|
)
|
|||||||
|
Foreign exchange contracts
|
Other Income/Expense
|
2
|
|
(4
|
)
|
—
|
|
|||||||
|
Total
|
$
|
(54
|
)
|
$
|
(99
|
)
|
$
|
(61
|
)
|
|||||
The fair value of all outstanding derivative instruments in the Consolidated Balance Sheets are included in Note 12: Fair Value Measurements.
Fair value is defined as the price that would be received to sell an asset or paid to transfer a liability (an exit price) in the principal or most advantageous market for the asset or liability in an orderly transaction between market participants on the measurement date. The fair value hierarchy contains three levels as follows:
Level 1
— Unadjusted quoted prices available in active markets for the identical assets or liabilities at the measurement date.
Level 2
— Other observable inputs available at the measurement date, other than quoted prices included in Level 1, either directly or indirectly, including:
|
•
|
Quoted prices for similar assets or liabilities in active markets;
|
|
•
|
Quoted prices for identical or similar assets in non-active markets;
|
|
•
|
Inputs other than quoted prices that are observable for the asset or liability; and
|
|
•
|
Inputs derived principally from or corroborated by other observable market data.
|
Level 3 —
Unobservable inputs that cannot be corroborated by observable market data and reflect the use of significant management judgment. These values are generally determined using pricing models for which the assumptions utilize management’s estimates of market participant assumptions.
65
Assets and Liabilities Measured at Fair Value on a Recurring Basis
The fair value hierarchy requires the use of observable market data when available. In instances where the inputs used to measure fair value fall into different levels of the fair value hierarchy, the fair value measurement has been determined based on the lowest level input significant to the fair value measurement in its entirety. Our assessment of the significance of a particular item to the fair value measurement in its entirety requires judgment, including the consideration of inputs specific to the asset or liability.
The following tables set forth by level within the fair value hierarchy our financial assets and liabilities accounted for at fair value on a recurring basis according to the valuation techniques we used to determine their fair values:
|
in millions
|
|
||||||||||||||||||
|
October 1, 2016
|
Level 1
|
|
Level 2
|
|
Level 3
|
|
Netting (a)
|
|
Total
|
|
|||||||||
|
Assets:
|
|||||||||||||||||||
|
Derivative Financial Instruments:
|
|||||||||||||||||||
|
Designated as hedges
|
$
|
—
|
|
$
|
72
|
|
$
|
—
|
|
$
|
(27
|
)
|
$
|
45
|
|
||||
|
Undesignated
|
—
|
|
38
|
|
—
|
|
(34
|
)
|
4
|
|
|||||||||
|
Available for Sale Securities:
|
|||||||||||||||||||
|
Current
|
—
|
|
2
|
|
2
|
|
—
|
|
4
|
|
|||||||||
|
Non-current
|
—
|
|
38
|
|
55
|
|
—
|
|
93
|
|
|||||||||
|
Deferred Compensation Assets
|
18
|
|
236
|
|
—
|
|
—
|
|
254
|
|
|||||||||
|
Total Assets
|
$
|
18
|
|
$
|
386
|
|
$
|
57
|
|
$
|
(61
|
)
|
$
|
400
|
|
||||
|
Liabilities:
|
|||||||||||||||||||
|
Derivative Financial Instruments:
|
|||||||||||||||||||
|
Designated as hedges
|
$
|
—
|
|
$
|
1
|
|
$
|
—
|
|
$
|
(1
|
)
|
$
|
—
|
|
||||
|
Undesignated
|
—
|
|
68
|
|
—
|
|
(68
|
)
|
—
|
|
|||||||||
|
Total Liabilities
|
$
|
—
|
|
$
|
69
|
|
$
|
—
|
|
$
|
(69
|
)
|
$
|
—
|
|
||||
|
October 3, 2015
|
Level 1
|
|
Level 2
|
|
Level 3
|
|
Netting (a)
|
|
Total
|
|
|||||||||
|
Assets:
|
|||||||||||||||||||
|
Derivative Financial Instruments:
|
|||||||||||||||||||
|
Designated as hedges
|
$
|
—
|
|
$
|
52
|
|
$
|
—
|
|
$
|
(35
|
)
|
$
|
17
|
|
||||
|
Undesignated
|
—
|
|
9
|
|
—
|
|
(9
|
)
|
—
|
|
|||||||||
|
Available for Sale Securities:
|
|||||||||||||||||||
|
Current
|
—
|
|
1
|
|
1
|
|
—
|
|
2
|
|
|||||||||
|
Non-current
|
—
|
|
33
|
|
60
|
|
—
|
|
93
|
|
|||||||||
|
Deferred Compensation Assets
|
9
|
|
222
|
|
—
|
|
—
|
|
231
|
|
|||||||||
|
Total Assets
|
$
|
9
|
|
$
|
317
|
|
$
|
61
|
|
$
|
(44
|
)
|
$
|
343
|
|
||||
|
Liabilities:
|
|||||||||||||||||||
|
Derivative Financial Instruments:
|
|||||||||||||||||||
|
Designated as hedges
|
$
|
—
|
|
$
|
2
|
|
$
|
—
|
|
$
|
(2
|
)
|
$
|
—
|
|
||||
|
Undesignated
|
—
|
|
49
|
|
—
|
|
(47
|
)
|
2
|
|
|||||||||
|
Total Liabilities
|
$
|
—
|
|
$
|
51
|
|
$
|
—
|
|
$
|
(49
|
)
|
$
|
2
|
|
||||
|
(a)
|
Our derivative assets and liabilities are presented in our Consolidated Balance Sheets on a net basis. We net derivative assets and liabilities, including cash collateral, when a legally enforceable master netting arrangement exists between the counterparty to a derivative contract and us. At
October 1, 2016
, and
October 3, 2015
, we had posted with various counterparties
$8 million
and
$5 million
, respectively, of cash collateral related to our derivative financial instruments and held no cash collateral.
|
66
The following table provides a reconciliation between the beginning and ending balance of debt securities measured at fair value on a recurring basis in the table above that used significant unobservable inputs (Level 3):
|
in millions
|
|
||||||
|
October 1, 2016
|
|
October 3, 2015
|
|
||||
|
Balance at beginning of year
|
$
|
61
|
|
$
|
67
|
|
|
|
Total realized and unrealized gains (losses):
|
|||||||
|
Included in earnings
|
—
|
|
—
|
|
|||
|
Included in other comprehensive income (loss)
|
—
|
|
—
|
|
|||
|
Purchases
|
12
|
|
20
|
|
|||
|
Issuances
|
—
|
|
—
|
|
|||
|
Settlements
|
(16
|
)
|
(26
|
)
|
|||
|
Balance at end of year
|
$
|
57
|
|
$
|
61
|
|
|
|
Total gains (losses) for the periods included in earnings attributable to the change in unrealized gains (losses) relating to assets and liabilities still held at end of year
|
$
|
—
|
|
$
|
—
|
|
|
The following methods and assumptions were used to estimate the fair value of each class of financial instrument:
Derivative Assets and Liabilities:
Our derivative financial instruments primarily include exchange-traded and over-the-counter contracts which are further described in Note 11: Derivative Financial Instruments. We record our derivative financial instruments at fair value using quoted market prices adjusted for credit and non-performance risk and internal models that use as their basis readily observable market inputs including current and forward market prices. We classify these instruments in Level 2 when quoted market prices can be corroborated utilizing observable current and forward commodity market prices on active exchanges or observable market transactions.
Available for Sale Securities:
Our investments in marketable debt securities are classified as available-for-sale and are reported at fair value based on pricing models and quoted market prices adjusted for credit and non-performance risk. Short-term investments with maturities of less than 12 months are included in Other current assets in the Consolidated Balance Sheets and primarily include certificates of deposit and commercial paper. All other marketable debt securities are included in Other Assets in the Consolidated Balance Sheets and have maturities ranging up to
31
years. We classify our investments in United States government, United States agency, certificates of deposit and commercial paper debt securities as Level 2 as fair value is generally estimated using discounted cash flow models that are primarily industry-standard models that consider various assumptions, including time value and yield curve as well as other readily available relevant economic measures. We classify certain corporate, asset-backed and other debt securities as Level 3 as there is limited activity or less observable inputs into valuation models, including current interest rates and estimated prepayment, default and recovery rates on the underlying portfolio or structured investment vehicle. Significant changes to assumptions or unobservable inputs in the valuation of our Level 3 instruments would not have a significant impact to our consolidated financial statements.
|
in millions
|
|||||||||||||||||||||||
|
October 1, 2016
|
October 3, 2015
|
||||||||||||||||||||||
|
Amortized
Cost Basis
|
|
Fair
Value
|
|
Unrealized
Gain/(Loss)
|
|
Amortized
Cost Basis
|
|
Fair
Value
|
|
Unrealized
Gain/(Loss)
|
|
||||||||||||
|
Available for Sale Securities:
|
|||||||||||||||||||||||
|
Debt Securities:
|
|||||||||||||||||||||||
|
United States Treasury and Agency
|
$
|
40
|
|
$
|
40
|
|
$
|
—
|
|
$
|
33
|
|
$
|
34
|
|
$
|
1
|
|
|||||
|
Corporate and Asset-Backed
|
56
|
|
57
|
|
1
|
|
60
|
|
61
|
|
1
|
|
|||||||||||
67
Unrealized holding gains (losses), net of tax, are excluded from earnings and reported in OCI until the security is settled or sold. On a quarterly basis, we evaluate whether losses related to our available-for-sale securities are temporary in nature. Losses on equity securities are recognized in earnings if the decline in value is judged to be other than temporary. If losses related to our debt securities are determined to be other than temporary, the loss would be recognized in earnings if we intend, or more likely than not will be required, to sell the security prior to recovery. For debt securities in which we have the intent and ability to hold until maturity, losses determined to be other than temporary would remain in OCI, other than expected credit losses which are recognized in earnings. We consider many factors in determining whether a loss is temporary, including the length of time and extent to which the fair value has been below cost, the financial condition and near-term prospects of the issuer and our ability and intent to hold the investment for a period of time sufficient to allow for any anticipated recovery. We recognized no other than temporary impairment in earnings for fiscal 2016 and fiscal 2015. No other than temporary losses were deferred in OCI as of
October 1, 2016
, and
October 3, 2015
.
Deferred Compensation Assets:
We maintain non-qualified deferred compensation plans for certain executives and other highly compensated employees. Investments are generally maintained within a trust and include money market funds, mutual funds and life insurance policies. The cash surrender value of the life insurance policies is invested primarily in mutual funds. The investments are recorded at fair value based on quoted market prices and are included in Other Assets in the Consolidated Balance Sheets. We classify the investments which have observable market prices in active markets in Level 1 as these are generally publicly-traded mutual funds. The remaining deferred compensation assets are classified in Level 2, as fair value can be corroborated based on observable market data. Realized and unrealized gains (losses) on deferred compensation are included in earnings.
Assets and Liabilities Measured at Fair Value on a Nonrecurring Basis
In addition to assets and liabilities that are recorded at fair value on a recurring basis, we record assets and liabilities at fair value on a nonrecurring basis. Generally, assets are recorded at fair value on a nonrecurring basis as a result of impairment charges. We did not have any significant measurements of assets or liabilities at fair value on a nonrecurring basis subsequent to their initial recognition during fiscal 2016.
In fiscal 2015, to better align our overall production capacity with then-current cattle supplies, we ceased beef operations at our Denison, Iowa, plant. As a result, we recorded a
$12 million
closure and impairment charges during the fourth quarter of fiscal 2015. These charges impacted the Beef segment’s operating income and were reflected in Cost of Sales in our Consolidated Statements of Income. Our valuation of these assets was primarily based on discounted cash flow models which included unobservable Level 3 inputs.
In the fourth quarter of fiscal 2015, we recorded a
$59 million
impairment and other related charges associated with a Prepared Foods project designed to optimize the combined Tyson and Hillshire Brands network capacity and to enhance manufacturing efficiencies for the future. These charges were reflected in the Prepared Foods segment’s operating income, of which
$49 million
was included in the Consolidated Statements of Income in Cost of Sales and
$10 million
was included in the Consolidated Statements of Income in Selling, General and Administrative. Our valuation of these assets was primarily based on discounted cash flow models which included unobservable Level 3 inputs.
Following the sale of our Mexico and Brazil chicken operations in fiscal 2015, we reviewed our long-term business strategy and outlook for the remaining international businesses, which operations include our chicken production operations in China and India. We assessed our Chinese operation for a potential impairment in the fourth quarter of fiscal 2015 and as a result of this evaluation, we recorded a
$169 million
charge to impair its long-lived assets to their fair value and to fully impair its goodwill. The China operation is included in Other for segment reporting and the impairment was included in Cost of Sales in the Consolidated Statements of Income. This impairment was comprised of
$126 million
of property, plant and equipment,
$23 million
of goodwill and
$20 million
of other assets. We utilized a discounted cash flow analysis which included unobservable Level 3 inputs.
Other Financial Instruments
Fair value of our debt is principally estimated using Level 2 inputs based on quoted prices for those or similar instruments. Fair value and carrying value for our debt are as follows:
|
in millions
|
|||||||||||||||
|
October 1, 2016
|
October 3, 2015
|
||||||||||||||
|
Fair
Value
|
|
Carrying
Value
|
|
Fair
Value
|
|
Carrying
Value
|
|
||||||||
|
Total Debt
|
$
|
6,698
|
|
$
|
6,279
|
|
$
|
6,900
|
|
$
|
6,690
|
|
|||
68
Concentrations of Credit Risk
Our financial instruments exposed to concentrations of credit risk consist primarily of cash and cash equivalents and accounts receivable. Our cash equivalents are in high quality securities placed with major banks and financial institutions. Concentrations of credit risk with respect to receivables are limited due to the large number of customers and their dispersion across geographic areas. We perform periodic credit evaluations of our customers’ financial condition and generally do not require collateral. At
October 1, 2016
, and
October 3, 2015
,
18.9%
and
20.0%
, respectively, of our net accounts receivable balance was due from Wal-Mart Stores, Inc. No other single customer or customer group represented greater than 10% of net accounts receivable.
We issue shares under our stock-based compensation plans by issuing Class A stock from treasury. The total number of shares available for future grant under the Tyson Foods, Inc. 2000 Stock Incentive Plan (Incentive Plan) was
20,726,621
at
October 1, 2016
.
Stock Options
Shareholders approved the Incentive Plan in January 2001. The Incentive Plan is administered by the Compensation and Leadership Development Committee of the Board of Directors (Compensation Committee). The Incentive Plan includes provisions for granting incentive stock options for shares of Class A stock at a price not less than the fair value at the date of grant. Nonqualified stock options may be granted at a price equal to or more than the fair value of Class A stock on the date the option is granted. Stock options under the Incentive Plan generally become exercisable ratably over
three years
from the date of grant and must be exercised within
10 years
from the date of grant. Our policy is to recognize compensation expense on a straight-line basis over the requisite service period for the entire award.
|
Shares Under
Option
|
|
Weighted
Average Exercise
Price Per Share
|
|
Weighted Average
Remaining
Contractual Life
(in Years)
|
Aggregate
Intrinsic Value
(in millions)
|
|
||||||
|
Outstanding, October 3, 2015
|
14,735,065
|
|
$
|
28.30
|
|
|||||||
|
Exercised
|
(5,286,342
|
)
|
24.13
|
|
||||||||
|
Forfeited or expired
|
(126,038
|
)
|
42.29
|
|
||||||||
|
Granted
|
1,868,971
|
|
50.00
|
|
||||||||
|
Outstanding, October 1, 2016
|
11,191,656
|
|
33.74
|
|
7.0
|
$
|
458
|
|
||||
|
Exercisable, October 1, 2016
|
5,334,155
|
|
$
|
23.87
|
|
5.7
|
$
|
271
|
|
|||
We generally grant stock options once a year. The weighted average grant-date fair value of options granted in fiscal
2016
,
2015
and
2014
was
$11.47
,
$11.51
and
$10.83
, respectively. The fair value of each option grant is established on the date of grant using a binomial lattice method. We use historical volatility for a period of time comparable to the expected life of the option to determine volatility assumptions. Expected life is calculated based on the contractual term of each grant and takes into account the historical exercise and termination behavior of participants. Risk-free interest rates are based on the five-year Treasury bond rate. Assumptions as of the grant date used in the fair value calculation of each year’s grants are outlined in the following table.
|
2016
|
|
2015
|
|
2014
|
|
|||
|
Expected life (in years)
|
6.4
|
|
6.1
|
|
6.0
|
|
||
|
Risk-free interest rate
|
1.6
|
%
|
1.6
|
%
|
1.3
|
%
|
||
|
Expected volatility
|
24.8
|
%
|
26.7
|
%
|
36.0
|
%
|
||
|
Expected dividend yield
|
1.2% - 2.6%
|
|
1.0
|
%
|
1.0
|
%
|
||
We recognized stock-based compensation expense related to stock options, net of income taxes, of
$23 million
,
$27 million
and
$20 million
for fiscal
2016
,
2015
and
2014
, respectively. The related tax benefit for fiscal
2016
,
2015
and
2014
was
$15 million
,
$17 million
and
$13 million
, respectively. We had
3.8 million
,
3.8 million
and
4.8 million
options vest in fiscal
2016
,
2015
and
2014
, respectively, with a grant date fair value of
$38 million
,
$32 million
and
$30 million
, respectively.
In fiscal
2016
,
2015
and
2014
, we received cash of
$128 million
,
$84 million
and
$67 million
, respectively, for the exercise of stock options. Shares are issued from treasury for stock option exercises. The related tax benefit realized from stock options exercised during fiscal
2016
,
2015
and
2014
, was
$80 million
,
$30 million
and
$33 million
, respectively. The total intrinsic value of options exercised in fiscal
2016
,
2015
and
2014
, was
$204 million
,
$79 million
and
$87 million
, respectively. Cash flows resulting from tax deductions in excess of the compensation cost of those options (excess tax deductions) are classified as financing cash flows. We realized
$58 million
,
$19 million
and
$24 million
related to excess tax deductions during fiscal
2016
,
2015
and
2014
, respectively.
69
As of
October 1, 2016
, we had
$29 million
of total unrecognized compensation cost related to stock option plans that will be recognized over a weighted average period of
1.1 years
.
Restricted Stock
We issue restricted stock at the market value as of the date of grant, with restrictions expiring over periods through fiscal 2019. Unearned compensation is recognized over the vesting period for the particular grant using a straight-line method.
|
Number of Shares
|
|
Weighted
Average Grant-
Date Fair Value
Per Share
|
|
Weighted Average
Remaining
Contractual Life
(in Years)
|
Aggregate
Intrinsic Value
(in millions)
|
|
||||||
|
Nonvested, October 3, 2015
|
1,107,928
|
|
$
|
36.76
|
|
|||||||
|
Granted
|
686,648
|
|
50.00
|
|
||||||||
|
Dividends
|
15,653
|
|
46.79
|
|
||||||||
|
Vested
|
(155,600
|
)
|
24.48
|
|
||||||||
|
Forfeited
|
(51,763
|
)
|
45.18
|
|
||||||||
|
Nonvested, October 1, 2016
|
1,602,866
|
|
$
|
43.45
|
|
1.3
|
$
|
120
|
|
|||
As of
October 1, 2016
, we had
$33 million
of total unrecognized compensation cost related to restricted stock awards that will be recognized over a weighted average period of
1.8 years
.
We recognized stock-based compensation expense related to restricted stock, net of income taxes, of
$14 million
,
$9 million
and
$6 million
for fiscal
2016
,
2015
and
2014
, respectively. The related tax benefit for fiscal
2016
,
2015
and
2014
was
$9 million
,
$6 million
and
$4 million
, respectively. We had
0.2 million
,
0.5 million
and
0.6 million
restricted stock awards vest in fiscal
2016
,
2015
and
2014
, respectively, with a grant date fair value of
$4 million
,
$10 million
and
$11 million
, respectively.
Performance-Based Shares
We award performance-based shares of our Class A stock to certain employees. These awards are typically granted once a year. Performance-based shares vest based upon the passage of time and the achievement of performance or market performance criteria, ranging from
0%
to
200%
, as determined by the Compensation Committee prior to the date of the award. Vesting periods for these awards are
three years
. We review progress toward the attainment of the performance criteria each quarter during the vesting period. When it is probable the minimum performance criteria for an award will be achieved, we begin recognizing the expense equal to the proportionate share of the total fair value of the Class A stock price on the grant date. The total expense recognized over the duration of performance awards will equal the Class A stock price on the date of grant multiplied by the number of shares ultimately awarded based on the level of attainment of the performance criteria. For grants with market performance criteria, the fair value is determined on the grant date and is calculated using the same inputs for expected volatility, expected dividend yield, and risk-free rate as stock options, noted above, with a duration of
three years
. The total expense recognized over the duration of the award will equal the fair value, regardless if the market performance criteria is met.
The following table summarizes the performance-based shares at the maximum award amounts based upon the respective performance share agreements. Actual shares that will vest depend on the level of attainment of the performance-based criteria.
|
Number of Shares
|
|
Weighted
Average Grant-
Date Fair Value
Per Share
|
|
Weighted Average
Remaining
Contractual Life
(in Years)
|
Aggregate
Intrinsic Value
(in millions)
|
|
||||||
|
Nonvested, October 3, 2015
|
1,835,100
|
|
$
|
32.03
|
|
|||||||
|
Granted
|
1,178,353
|
|
54.44
|
|
||||||||
|
Vested
|
(803,821
|
)
|
21.67
|
|
||||||||
|
Forfeited
|
(62,563
|
)
|
34.06
|
|
||||||||
|
Nonvested, October 1, 2016
|
2,147,069
|
|
$
|
48.15
|
|
1.4
|
$
|
160
|
|
|||
We recognized stock-based compensation expense related to performance shares, net of income taxes, of
$11 million
,
$5 million
and
$4 million
for fiscal
2016
,
2015
and
2014
, respectively. The related tax benefit for fiscal
2016
,
2015
and
2014
was
$7 million
,
$3 million
and
$2 million
, respectively. As of
October 1, 2016
, we had
$30 million
of total unrecognized compensation based upon our progress toward the attainment of criteria related to performance-based share awards that will be recognized over a weighted average period of
2 years
.
70
At
October 1, 2016
, we had
nine
defined benefit pension plans consisting of
six
funded qualified plans and
three
unfunded non-qualified plans. In regards to our qualified plans,
five
are frozen and noncontributory. The benefits provided under these plans are based on a formula using years of service and either a specified benefit rate or compensation level. The non-qualified defined benefit plans are for certain contracted officers and use a formula based on years of service and final average salary. We also have other postretirement benefit plans for which substantially all of our employees may receive benefits if they satisfy applicable eligibility criteria. The postretirement healthcare plans are contributory with participants’ contributions adjusted when deemed necessary.
We have defined contribution retirement programs for various groups of employees. We recognized expenses of
$67 million
,
$62 million
and
$53 million
in fiscal
2016
,
2015
and
2014
, respectively.
We use a fiscal year end measurement date for our defined benefit plans and other postretirement plans. We recognize the effect of actuarial gains and losses into earnings immediately for other postretirement plans rather than amortizing the effect over future periods.
Other postretirement benefits include postretirement medical costs and life insurance.
Benefit Obligations and Funded Status
The following table provides a reconciliation of the changes in the plans’ benefit obligations, assets and funded status at
October 1, 2016
, and
October 3, 2015
:
|
in millions
|
|||||||||||||||||||||||
|
Pension Benefits
|
Other Postretirement
|
||||||||||||||||||||||
|
Qualified
|
Non-Qualified
|
Benefits
|
|||||||||||||||||||||
|
2016
|
|
2015
|
|
2016
|
|
2015
|
|
2016
|
|
2015
|
|
||||||||||||
|
Change in benefit obligation
|
|||||||||||||||||||||||
|
Benefit obligation at beginning of year
|
$
|
1,785
|
|
$
|
1,849
|
|
$
|
201
|
|
$
|
182
|
|
$
|
114
|
|
$
|
163
|
|
|||||
|
Service cost
|
8
|
|
10
|
|
6
|
|
8
|
|
1
|
|
5
|
|
|||||||||||
|
Interest cost
|
65
|
|
78
|
|
9
|
|
8
|
|
3
|
|
7
|
|
|||||||||||
|
Plan amendments
|
—
|
|
—
|
|
—
|
|
—
|
|
(58
|
)
|
(60
|
)
|
|||||||||||
|
Plan participants’ contributions
|
—
|
|
—
|
|
—
|
|
—
|
|
1
|
|
2
|
|
|||||||||||
|
Actuarial (gain)/loss
|
21
|
|
(50
|
)
|
16
|
|
11
|
|
(15
|
)
|
9
|
|
|||||||||||
|
Benefits paid
|
(339
|
)
|
(102
|
)
|
(10
|
)
|
(8
|
)
|
(10
|
)
|
(12
|
)
|
|||||||||||
|
Other
|
14
|
|
—
|
|
—
|
|
—
|
|
—
|
|
—
|
|
|||||||||||
|
Benefit obligation at end of year
|
1,554
|
|
1,785
|
|
222
|
|
201
|
|
36
|
|
114
|
|
|||||||||||
|
Change in plan assets
|
|||||||||||||||||||||||
|
Fair value of plan assets at beginning of year
|
1,576
|
|
1,647
|
|
—
|
|
3
|
|
—
|
|
—
|
|
|||||||||||
|
Actual return on plan assets
|
135
|
|
25
|
|
—
|
|
—
|
|
—
|
|
—
|
|
|||||||||||
|
Employer contributions
|
54
|
|
6
|
|
10
|
|
8
|
|
9
|
|
10
|
|
|||||||||||
|
Plan participants’ contributions
|
—
|
|
—
|
|
—
|
|
—
|
|
1
|
|
2
|
|
|||||||||||
|
Benefits paid
|
(339
|
)
|
(102
|
)
|
(10
|
)
|
(8
|
)
|
(10
|
)
|
(12
|
)
|
|||||||||||
|
Other
|
14
|
|
—
|
|
—
|
|
(3
|
)
|
—
|
|
—
|
|
|||||||||||
|
Fair value of plan assets at end of year
|
1,440
|
|
1,576
|
|
—
|
|
—
|
|
—
|
|
—
|
|
|||||||||||
|
Funded status
|
$
|
(114
|
)
|
$
|
(209
|
)
|
$
|
(222
|
)
|
$
|
(201
|
)
|
$
|
(36
|
)
|
$
|
(114
|
)
|
|||||
71
Amounts recognized in the Consolidated Balance Sheets consist of:
|
in millions
|
|||||||||||||||||||||||
|
Pension Benefits
|
Other Postretirement
|
||||||||||||||||||||||
|
Qualified
|
Non-Qualified
|
Benefits
|
|||||||||||||||||||||
|
2016
|
|
2015
|
|
2016
|
|
2015
|
|
2016
|
|
2015
|
|
||||||||||||
|
Other current liabilities
|
$
|
—
|
|
$
|
—
|
|
$
|
(9
|
)
|
$
|
(9
|
)
|
$
|
(4
|
)
|
$
|
(20
|
)
|
|||||
|
Other liabilities
|
(114
|
)
|
(209
|
)
|
(213
|
)
|
(192
|
)
|
(32
|
)
|
(94
|
)
|
|||||||||||
|
Total liabilities
|
$
|
(114
|
)
|
$
|
(209
|
)
|
$
|
(222
|
)
|
$
|
(201
|
)
|
$
|
(36
|
)
|
$
|
(114
|
)
|
|||||
Amounts recognized in Accumulated Other Comprehensive Income consist of:
|
in millions
|
|||||||||||||||||||||||
|
Pension Benefits
|
Other Postretirement
|
||||||||||||||||||||||
|
Qualified
|
Non-Qualified
|
Benefits
|
|||||||||||||||||||||
|
2016
|
|
2015
|
|
2016
|
|
2015
|
|
2016
|
|
2015
|
|
||||||||||||
|
Accumulated other comprehensive (income)/loss:
|
|||||||||||||||||||||||
|
Actuarial loss
|
$
|
17
|
|
$
|
57
|
|
$
|
55
|
|
$
|
43
|
|
$
|
—
|
|
$
|
—
|
|
|||||
|
Prior service (credit) (a)
|
—
|
|
—
|
|
—
|
|
—
|
|
(98
|
)
|
(59
|
)
|
|||||||||||
|
Total accumulated other comprehensive (income)/loss:
|
$
|
17
|
|
$
|
57
|
|
$
|
55
|
|
$
|
43
|
|
$
|
(98
|
)
|
$
|
(59
|
)
|
|||||
|
(a)
|
The change in prior service credit is primarily attributed to the plan amendments to the other postretirement benefits as noted within the change in benefit obligation with remainder of the change being immaterial.
|
At
October 1, 2016
, and
October 3, 2015
,
eight
pension plans had an accumulated benefit obligation in excess of plan assets. Plans with accumulated benefit obligations in excess of plan assets are as follows:
|
in millions
|
|||||||||||||||
|
Pension Benefits
|
|||||||||||||||
|
Qualified
|
Non-Qualified
|
||||||||||||||
|
2016
|
|
2015
|
|
2016
|
|
2015
|
|
||||||||
|
Projected benefit obligation
|
$
|
1,550
|
|
$
|
1,781
|
|
$
|
222
|
|
$
|
201
|
|
|||
|
Accumulated benefit obligation
|
1,550
|
|
1,781
|
|
207
|
|
193
|
|
|||||||
|
Fair value of plan assets
|
1,436
|
|
1,572
|
|
—
|
|
—
|
|
|||||||
The accumulated benefit obligation for all qualified pension plans was
$1,554 million
and
$1,785 million
at
October 1, 2016
, and
October 3, 2015
, respectively.
72
Net Periodic Benefit Cost (Credit)
Components of net periodic benefit cost (credit) for pension and postretirement benefit plans recognized in the Consolidated Statements of Income are as follows:
|
in millions
|
|||||||||||||||||||||||||||||||||||
|
Pension Benefits
|
Other Postretirement
|
||||||||||||||||||||||||||||||||||
|
Qualified
|
Non-Qualified
|
Benefits
|
|||||||||||||||||||||||||||||||||
|
2016
|
|
2015
|
|
2014
|
|
2016
|
|
2015
|
|
2014
|
|
2016
|
|
2015
|
|
2014
|
|
||||||||||||||||||
|
Service cost
|
$
|
8
|
|
$
|
10
|
|
$
|
1
|
|
$
|
6
|
|
$
|
8
|
|
$
|
7
|
|
$
|
1
|
|
$
|
5
|
|
$
|
2
|
|
||||||||
|
Interest cost
|
65
|
|
78
|
|
10
|
|
9
|
|
8
|
|
5
|
|
3
|
|
7
|
|
3
|
|
|||||||||||||||||
|
Expected return on plan assets
|
(65
|
)
|
(102
|
)
|
(13
|
)
|
—
|
|
—
|
|
—
|
|
—
|
|
—
|
|
—
|
|
|||||||||||||||||
|
Amortization of prior service cost
|
—
|
|
—
|
|
—
|
|
—
|
|
—
|
|
—
|
|
(20
|
)
|
(1
|
)
|
—
|
|
|||||||||||||||||
|
Recognized actuarial loss (gain), net
|
2
|
|
2
|
|
2
|
|
5
|
|
4
|
|
2
|
|
(15
|
)
|
9
|
|
(8
|
)
|
|||||||||||||||||
|
Recognized settlement loss (gain)
|
(12
|
)
|
8
|
|
—
|
|
—
|
|
—
|
|
—
|
|
—
|
|
(2
|
)
|
—
|
|
|||||||||||||||||
|
Net periodic benefit cost (credit)
|
$
|
(2
|
)
|
$
|
(4
|
)
|
$
|
—
|
|
$
|
20
|
|
$
|
20
|
|
$
|
14
|
|
$
|
(31
|
)
|
$
|
18
|
|
$
|
(3
|
)
|
||||||||
As of
October 1, 2016
, the amounts expected to be reclassified into earnings within the next 12 months related to net periodic benefit cost for the qualified and non-qualified pensions are
$1 million
and
$6 million
, respectively. As of
October 1, 2016
, the amount expected to be reclassified into earnings within the next 12 months related to net periodic benefit credit for the other postretirement benefits is
$25 million
.
Assumptions
Weighted average assumptions are as follows:
|
Pension Benefits
|
Other Postretirement
|
|||||||||||||||||||||||||
|
Qualified
|
Non-Qualified
|
Benefits
|
||||||||||||||||||||||||
|
2016
|
|
2015
|
|
2014
|
|
2016
|
|
2015
|
|
2014
|
|
2016
|
|
2015
|
|
2014
|
|
|||||||||
|
Discount rate to determine net periodic benefit cost
|
4.47
|
%
|
4.32
|
%
|
4.37
|
%
|
4.41
|
%
|
4.36
|
%
|
5.01
|
%
|
3.54
|
%
|
3.97
|
%
|
4.41
|
%
|
||||||||
|
Discount rate to determine benefit obligations
|
3.72
|
%
|
4.47
|
%
|
4.32
|
%
|
3.77
|
%
|
4.41
|
%
|
4.36
|
%
|
3.09
|
%
|
3.54
|
%
|
3.97
|
%
|
||||||||
|
Rate of compensation increase
|
n/a
|
|
0.01
|
%
|
0.01
|
%
|
2.46
|
%
|
2.31
|
%
|
2.11
|
%
|
n/a
|
|
n/a
|
|
n/a
|
|
||||||||
|
Expected return on plan assets
|
4.15
|
%
|
4.61
|
%
|
6.37
|
%
|
n/a
|
|
n/a
|
|
n/a
|
|
n/a
|
|
n/a
|
|
n/a
|
|
||||||||
To determine the expected return on plan assets assumption, we first examined historical rates of return for the various asset classes within the plans. We then determined a long-term projected rate-of-return based on expected returns.
Our discount rate assumptions used to account for pension and other postretirement benefit plans reflect the rates at which the benefit obligations could be effectively settled. These were determined using a cash flow matching technique whereby the rates of a yield curve, developed from high-quality debt securities, were applied to the benefit obligations to determine the appropriate discount rate. As of October 1, 2016 and October 3, 2015, all pension and other postretirement benefit plans used the RP-2014 mortality tables.
We have
five
other postretirement benefit plans which are healthcare and life insurance related.
Two
of these plans, which benefit obligations totaled
$22 million
at
October 1, 2016
, were not impacted by healthcare cost trend rates as
one
consists of fixed annual payments and
one
is life insurance related.
Two
of the healthcare plans, which benefit obligations totaled
$2 million
at
October 1, 2016
, were not impacted by healthcare cost trend rates due to plan amendments. The remaining plan, which the benefit obligation totaled
$12 million
at
October 1, 2016
, utilized assumed healthcare cost trend rates of
9.0%
and
7.6%
for retirees who qualify and do not qualify for Medicare, respectively. The healthcare cost trend rate will be grading down to an ultimate rate of
4.5%
in 2024/2025.
73
A one-percentage-point change in assumed health-care cost trend rates would have the following effects:
|
in millions
|
|
||||||
|
One Percentage Point Increase
|
One Percentage Point Decrease
|
||||||
|
Effect on postretirement benefit obligation
|
$
|
1
|
|
$
|
1
|
|
|
Plan Assets
The following table sets forth the actual and target asset allocation for pension plan assets:
|
2016
|
|
2015
|
|
Target Asset
Allocation
|
|
|||
|
Cash
|
0.9
|
%
|
0.3
|
%
|
—
|
%
|
||
|
Fixed Income Securities
|
85.4
|
|
85.4
|
|
86.0
|
|
||
|
United States Stock Funds
|
3.7
|
|
3.9
|
|
4.0
|
|
||
|
International Stock Funds
|
6.2
|
|
6.8
|
|
6.5
|
|
||
|
Real Estate
|
3.8
|
|
3.6
|
|
3.5
|
|
||
|
Total
|
100.0
|
%
|
100.0
|
%
|
100.0
|
%
|
||
Additionally,
one
of our foreign subsidiary pension plans had
$28 million
and
$14 million
in plan assets held in an insurance trust at
October 1, 2016
, and
October 3, 2015
, respectively.
The plan trustees have established a set of investment objectives related to the assets of the domestic pension plans and regularly monitor the performance of the funds and portfolio managers. Objectives for the pension assets are (i) to provide growth of capital and income, (ii) to achieve a target weighted average annual rate of return competitive with funds with similar investment objectives and (iii) to diversify to reduce risk. The target asset allocations are based upon the funded status of the plans. As pension obligations become better funded, we will lower risk by increasing the allocation to fixed income.
Our domestic plan assets consist mainly of common collective trusts which are primarily comprised of fixed income funds, equity securities and other investments. Fixed income securities can include, but are not limited to, direct bond investments, and pooled or indirect bond investments. Other investments may include, but are not limited to, international and domestic equities, real estate, commodities and private equity. Derivative instruments may also be used in concert with either fixed income or equity investments to achieve desired exposure or to hedge certain risks. Derivative instruments can include, but are not limited to, futures, options, swaps or swaptions. Our domestic plan assets also include mutual funds. We believe there are no significant concentrations of risk within our plan assets as of
October 1, 2016
.
74
The following tables show the categories of pension plan assets and the level under which fair values were determined in the fair value hierarchy, which is described in Note 12: Fair Value Measurements.
|
in millions
|
|||||||||||||||
|
October 1, 2016
|
Level 1
|
|
Level 2
|
|
Level 3
|
|
Total
|
|
|||||||
|
Cash and cash equivalents
|
$
|
13
|
|
$
|
—
|
|
$
|
—
|
|
$
|
13
|
|
|||
|
Insurance contract at contract value (a)
|
—
|
|
—
|
|
28
|
|
28
|
|
|||||||
|
Total assets in fair value hierarchy
|
$
|
13
|
|
$
|
—
|
|
$
|
28
|
|
$
|
41
|
|
|||
|
Investments measured at net asset value:
|
|||||||||||||||
|
Common collective trusts (b)
|
$
|
1,399
|
|
||||||||||||
|
Total plan assets
|
$
|
1,440
|
|
||||||||||||
|
in millions
|
|||||||||||||||
|
October 3, 2015
|
Level 1
|
|
Level 2
|
|
Level 3
|
|
Total
|
|
|||||||
|
Cash and cash equivalents
|
$
|
5
|
|
$
|
—
|
|
$
|
—
|
|
$
|
5
|
|
|||
|
Insurance contract at contract value (a)
|
—
|
|
—
|
|
14
|
|
14
|
|
|||||||
|
Total assets in fair value hierarchy
|
$
|
5
|
|
$
|
—
|
|
$
|
14
|
|
$
|
19
|
|
|||
|
Investments measured at net asset value:
|
|
|
|
|
|||||||||||
|
Common collective trusts (b)
|
|
|
|
|
|
|
$
|
1,557
|
|
||||||
|
Total plan assets
|
|
|
|
|
|
|
$
|
1,576
|
|
||||||
|
(a)
|
We classify insurance contracts as Level 3 as there is limited activity or less observable inputs into valuation models, including current interest rates and estimated prepayment, default and recovery rates on the underlying portfolio or structured investment vehicle. The insurance contracts are valued using the plan’s own assumptions about the assumptions market participants would use in pricing the assets based on the best information available, such as investment manager pricing. Significant changes to assumptions or unobservable inputs in the valuation of our Level 3 instruments would not have a significant impact to our consolidated financial statements.
|
|
(b)
|
Funds that are measured at fair value using the net asset value (NAV) per share practical expedient have not been categorized in the fair value hierarchy. The amounts presented above are intended to permit reconciliation of the fair value hierarchy to the fair value of total plan assets in order to determine the amounts included in Other Liabilities in the Consolidated Balance Sheets.
|
A reconciliation of the change in the fair value measurement of the defined benefit plans’ consolidated assets using significant unobservable inputs (Level 3) is as follows:
|
in millions
|
|
|||||||
|
Insurance contract
|
|
Total
|
|
|||||
|
Balance at October 3, 2015
|
$
|
14
|
|
14
|
|
|||
|
Actual return on plan assets:
|
|
|
||||||
|
Assets still held at reporting date
|
—
|
|
—
|
|
||||
|
Assets sold during the period
|
—
|
|
—
|
|
||||
|
Purchases, sales and settlements, net
|
14
|
|
14
|
|
||||
|
Transfers in and/or out of Level 3
|
—
|
|
—
|
|
||||
|
Balance at October 1, 2016
|
$
|
28
|
|
$
|
28
|
|
||
Contributions
Our policy is to fund at least the minimum contribution required to meet applicable federal employee benefit and local tax laws. In our sole discretion, we may from time to time fund additional amounts. Expected contributions to pension plans for fiscal 2017 are approximately
$40 million
. For fiscal
2016
,
2015
and
2014
, we funded
$64 million
,
$14 million
and
$9 million
plans, respectively, to pension plans.
75
Estimated Future Benefit Payments
The following benefit payments are expected to be paid:
|
in millions
|
|
||||||||||
|
Pension Benefits
|
Other Postretirement
|
||||||||||
|
Qualified
|
Non-Qualified
|
Benefits
|
|||||||||
|
2017
|
$
|
86
|
|
$
|
9
|
|
$
|
5
|
|
||
|
2018
|
82
|
|
9
|
|
3
|
|
|||||
|
2019
|
83
|
|
9
|
|
3
|
|
|||||
|
2020
|
84
|
|
10
|
|
3
|
|
|||||
|
2021
|
85
|
|
11
|
|
3
|
|
|||||
|
2022-2026
|
434
|
|
62
|
|
13
|
|
|||||
The above benefit payments for other postretirement benefit plans are not expected to be offset by Medicare Part D subsidies in fiscal 2017 or thereafter.
The above benefit payments include anticipated payments for a partial settlement for deferred vested participants within
two
of our qualified pension plans. Assuming an election rate of
50%
and changes to the benefit obligation and accumulated other comprehensive income due to remeasurement, the partial settlement will result in
$2 million
of expense to be reclassified into earnings. Actual results may differ from estimated amounts.
Multi-Employer Plans
Additionally, we participate in a multi-employer plan that provides defined benefits to certain employees covered by collective bargaining agreements. Such plans are usually administered by a board of trustees composed of the management of the participating companies and labor representatives.
The risks of participating in multiemployer plans are different from single-employer plans. Assets contributed to the multiemployer plan by one employer may be used to provide benefits to employees of other participating employers. If a participating employer stops contributing to the plan, the unfunded obligation of the plan may be borne by the remaining participating employers. If we stop participating in a plan, we may be required to pay that plan an amount based on the underfunded status of the plan, referred to as a withdrawal liability. Contributions to the pension funds were not in excess of
5%
of the total plan contributions for plan year 2016.
The net pension cost of the plan is equal to the annual contribution determined in accordance with the provisions of negotiated labor contracts. Contributions to the plan were
$1 million
in fiscal 2016 and 2015. Assets contributed to such plans are not segregated or otherwise restricted to provide benefits only to our employees. The future cost of the plan is dependent on a number of factors including the funded status of the plan and the ability of the other participating companies to meet ongoing funding obligations.
Our participation in this multiemployer plan for fiscal 2016 is outlined below. The EIN/Pension Plan Number column provides the Employer Identification Number (EIN) and the three digit plan number. Unless otherwise noted, the most recent Pension Protection Act ("PPA") zone status available in fiscal 2016 and fiscal 2015 is for the plan's year beginning January 1, 2016, and 2015, respectively. The zone status is based on information that we have received from the plan and is certified by the plan's actuaries. The zone status is a secondary classification, critical and declining, within the red zone for fiscal 2016. Among other factors, plans in the red zone are generally less than 65 percent funded. Plans that are critical and declining status are projected to have an accumulated funding deficiency. The FIP/RP Status column indicates plans for which a financial improvement plan (FIP) or rehabilitation plan (RP) is either pending or has been implemented. The last column lists the expiration date(s) of the collective-bargaining agreements to which the plan is subject. There have been no significant changes that affect the comparability of contributions from year to year.
76
In addition to regular contributions, we could be obligated to pay additional contributions (known as complete or partial withdrawal liabilities) if it has unfunded vested benefits.
|
PPA Zone Status
|
FIP/RP Status
|
Contributions (in millions)
|
Surcharge Imposed
|
|||||||||||
|
Pension Fund Plan Name
|
EIN/Pension Plan Number
|
2016
|
2015
|
Implemented
|
2016
|
2015
|
2016
|
Expiration Date of Collective Bargaining Agreement
(a)
|
||||||
|
Bakery and Confectionery Union and Industry International Pension Fund
|
52-6118572/001
|
Red
|
Red
|
Nov 2012
|
$1
|
$1
|
10%
|
October 2015
|
||||||
(a) Renewal negotiations are in progress.
The components of accumulated other comprehensive loss are as follows:
|
in millions
|
|
||||||
|
|
2016
|
|
2015
|
|
|||
|
Accumulated other comprehensive income (loss), net of taxes:
|
|||||||
|
Unrealized net hedging loss
|
$
|
(2
|
)
|
$
|
(1
|
)
|
|
|
Unrealized net gain on investments
|
1
|
|
1
|
|
|||
|
Currency translation adjustment
|
(59
|
)
|
(63
|
)
|
|||
|
Postretirement benefits reserve adjustments
|
15
|
|
(27
|
)
|
|||
|
Total accumulated other comprehensive loss
|
$
|
(45
|
)
|
$
|
(90
|
)
|
|
The before and after tax changes in the components of other comprehensive income (loss) are as follows:
|
in millions
|
||||||||||||||||||||||||||||||
|
2016
|
2015
|
2014
|
||||||||||||||||||||||||||||
|
Before Tax
|
Tax
|
After Tax
|
Before Tax
|
Tax
|
After Tax
|
Before Tax
|
Tax
|
After Tax
|
||||||||||||||||||||||
|
Derivatives accounted for as cash flow hedges:
|
||||||||||||||||||||||||||||||
|
(Gain) loss reclassified to cost of sales
|
$
|
(1
|
)
|
$
|
1
|
|
$
|
—
|
|
$
|
7
|
|
$
|
(3
|
)
|
$
|
4
|
|
$
|
10
|
|
$
|
(4
|
)
|
$
|
6
|
|
|||
|
(Gain) loss reclassified to other income/expense
|
—
|
|
—
|
|
—
|
|
—
|
|
—
|
|
—
|
|
—
|
|
—
|
|
—
|
|
||||||||||||
|
Unrealized gain (loss)
|
(1
|
)
|
—
|
|
(1
|
)
|
(4
|
)
|
2
|
|
(2
|
)
|
(8
|
)
|
3
|
|
(5
|
)
|
||||||||||||
|
Investments:
|
||||||||||||||||||||||||||||||
|
(Gain) loss reclassified to other income/expense
|
—
|
|
—
|
|
—
|
|
(21
|
)
|
8
|
|
(13
|
)
|
8
|
|
(2
|
)
|
6
|
|
||||||||||||
|
Unrealized gain (loss)
|
(1
|
)
|
1
|
|
—
|
|
21
|
|
(9
|
)
|
12
|
|
(2
|
)
|
—
|
|
(2
|
)
|
||||||||||||
|
Currency translation:
|
||||||||||||||||||||||||||||||
|
Translation loss reclassified to cost of sales (a)
|
—
|
|
—
|
|
—
|
|
115
|
|
(8
|
)
|
107
|
|
—
|
|
—
|
|
—
|
|
||||||||||||
|
Translation adjustment
|
5
|
|
(1
|
)
|
4
|
|
(86
|
)
|
15
|
|
(71
|
)
|
(32
|
)
|
2
|
|
(30
|
)
|
||||||||||||
|
Postretirement benefits
|
67
|
|
(25
|
)
|
42
|
|
32
|
|
(12
|
)
|
20
|
|
(23
|
)
|
9
|
|
(14
|
)
|
||||||||||||
|
Total other comprehensive income (loss)
|
$
|
69
|
|
$
|
(24
|
)
|
$
|
45
|
|
$
|
64
|
|
$
|
(7
|
)
|
$
|
57
|
|
$
|
(47
|
)
|
$
|
8
|
|
$
|
(39
|
)
|
|||
(a) Translation loss reclassified to Cost of Sales related to disposition of a foreign operation, which is further described in Note 3: Acquisitions and Dispositions.
77
We operate in
four
reportable segments: Chicken, Beef, Pork and Prepared Foods. We measure segment profit as operating income (loss). Other primarily includes our foreign chicken production operations in China and India and third-party merger and integration costs.
Chicken:
Chicken includes our domestic operations related to raising and processing live chickens into, and purchasing raw materials for, fresh, frozen and value-added chicken products, as well as sales from allied products. Products are marketed domestically to food retailers, foodservice distributors, restaurant operators, hotel chains and noncommercial foodservice establishments such as schools, healthcare facilities, the military and other food processors, as well as to international export markets. This segment also includes logistics operations to move products through our domestic supply chain and the global operations of our chicken breeding stock subsidiary.
Beef:
Beef includes our operations related to processing live fed cattle and fabricating dressed beef carcasses into primal and sub-primal meat cuts and case-ready products. Products are marketed domestically to food retailers, foodservice distributors, restaurant operators, hotel chains and noncommercial foodservice establishments such as schools, healthcare facilities, the military and other food processors, as well as to international export markets. This segment also includes sales from allied products such as hides and variety meats, as well as logistics operations to move products through the supply chain.
Pork:
Pork includes our operations related to processing live market hogs and fabricating pork carcasses into primal and sub-primal cuts and case-ready products. Products are marketed domestically to food retailers, foodservice distributors, restaurant operators, hotel chains and noncommercial foodservice establishments such as schools, healthcare facilities, the military and other food processors, as well as to international export markets. This segment also includes our live swine group, related allied product processing activities and logistics operations to move products through the supply chain.
Prepared Foods:
Prepared Foods includes our operations related to manufacturing and marketing frozen and refrigerated food products and logistics operations to move products through the supply chain. This segment includes brands such as Jimmy Dean®, Hillshire Farm®, Ball Park®, Wright®, State Fair®, Van's®, Sara Lee® and Chef Pierre®, as well as artisanal brands Aidells®, Gallo Salame®, and Golden Island®. Products primarily include pepperoni, bacon, breakfast sausage, turkey, lunchmeat, hot dogs, pizza crusts and toppings, flour and corn tortilla products, desserts, appetizers, snacks, prepared meals, ethnic foods, soups, sauces, side dishes, meat dishes, breadsticks and processed meats. Products are marketed domestically to food retailers, foodservice distributors, restaurant operators, hotel chains and noncommercial foodservice establishments such as schools, healthcare facilities, the military and other food processors, as well as to international export markets.
78
We allocate expenses related to corporate activities to the segments, except for third-party merger and integration costs of
$37 million
,
$47 million
and
$59 million
in fiscal 2016, 2015 and 2014, respectively, which are included in Other. Assets and additions to property, plant and equipment relating to corporate activities remain in Other. In addition, at September 27, 2014, we included
$4.8 billion
of goodwill associated with our acquisition of Hillshire Brands in Other and we completed the allocation of goodwill to our segments in fiscal 2015. See Note 5: Goodwill and Intangible Assets for further description regarding the allocation of goodwill. The results from Dynamic Fuels are also included in Other in fiscal 2014.
Information on segments and a reconciliation to income from continuing operations before income taxes are follows:
|
in millions
|
|||||||||||||||||||||||||||
|
Chicken
|
|
Beef
|
|
Pork
|
|
Prepared
Foods
|
|
Other
|
|
Intersegment
Sales
|
|
Consolidated
|
|
||||||||||||||
|
Fiscal 2016
|
|||||||||||||||||||||||||||
|
Sales
|
$
|
10,927
|
|
$
|
14,513
|
|
$
|
4,909
|
|
$
|
7,346
|
|
$
|
380
|
|
$
|
(1,194
|
)
|
$
|
36,881
|
|
||||||
|
Operating Income (Loss)
|
1,305
|
|
347
|
|
528
|
|
734
|
|
(81
|
)
|
2,833
|
|
|||||||||||||||
|
Total Other (Income) Expense
|
235
|
|
|||||||||||||||||||||||||
|
Income from Continuing Operations before Income Taxes
|
2,598
|
|
|||||||||||||||||||||||||
|
Depreciation and amortization
|
274
|
|
94
|
|
33
|
|
286
|
|
10
|
|
697
|
|
|||||||||||||||
|
Total Assets
|
5,836
|
|
2,764
|
|
1,039
|
|
11,814
|
|
920
|
|
22,373
|
|
|||||||||||||||
|
Additions to property, plant and equipment
|
281
|
|
99
|
|
68
|
|
178
|
|
69
|
|
695
|
|
|||||||||||||||
|
Fiscal 2015
|
|||||||||||||||||||||||||||
|
Sales
|
$
|
11,390
|
|
$
|
17,236
|
|
$
|
5,262
|
|
$
|
7,822
|
|
$
|
879
|
|
$
|
(1,216
|
)
|
$
|
41,373
|
|
||||||
|
Operating Income (Loss)
|
1,366
|
|
(66
|
)
|
380
|
|
588
|
|
(99
|
)
|
2,169
|
|
|||||||||||||||
|
Total Other (Income) Expense
|
248
|
|
|||||||||||||||||||||||||
|
Income from Continuing Operations before Income Taxes
|
1,921
|
|
|||||||||||||||||||||||||
|
Depreciation and amortization
|
272
|
|
97
|
|
31
|
|
280
|
|
21
|
|
701
|
|
|||||||||||||||
|
Total Assets
|
5,731
|
|
3,009
|
|
927
|
|
12,006
|
|
1,296
|
|
22,969
|
|
|||||||||||||||
|
Additions to property, plant and equipment
|
405
|
|
113
|
|
50
|
|
167
|
|
119
|
|
854
|
|
|||||||||||||||
|
Fiscal 2014
|
|||||||||||||||||||||||||||
|
Sales
|
$
|
11,116
|
|
$
|
16,177
|
|
$
|
6,304
|
|
$
|
3,927
|
|
$
|
1,381
|
|
$
|
(1,325
|
)
|
$
|
37,580
|
|
||||||
|
Operating Income (Loss)
|
883
|
|
347
|
|
455
|
|
(60
|
)
|
(195
|
)
|
1,430
|
|
|||||||||||||||
|
Total Other (Income) Expense
|
178
|
|
|||||||||||||||||||||||||
|
Income from Continuing Operations before Income Taxes
|
1,252
|
|
|||||||||||||||||||||||||
|
Depreciation and amortization
|
253
|
|
91
|
|
33
|
|
95
|
|
48
|
|
520
|
|
|||||||||||||||
|
Total Assets
|
4,807
|
|
3,103
|
|
965
|
|
8,608
|
|
6,423
|
|
23,906
|
|
|||||||||||||||
|
Additions to property, plant and equipment
|
307
|
|
115
|
|
36
|
|
77
|
|
97
|
|
632
|
|
|||||||||||||||
The Chicken segment had sales of
$27 million
,
$18 million
and
$7 million
for fiscal
2016
,
2015
and
2014
, respectively, from transactions with other operating segments. The Pork segment had sales of
$840 million
,
$847 million
and
$1.0 billion
for fiscal
2016
,
2015
and
2014
, respectively, from transactions with other operating segments. The Beef segment had sales of
$327 million
,
$351 million
and
$307 million
for fiscal
2016
,
2015
and
2014
, respectively, from transactions with other operating segments. The aforementioned sales from intersegment transactions, which were at market prices, were included in the segment sales in the above table.
Our largest customer, Wal-Mart Stores, Inc., accounted for
17.5%
,
16.8%
and
14.6%
of consolidated sales in fiscal
2016
,
2015
and
2014
, respectively. Sales to Wal-Mart Stores, Inc. were included in all the segments. Any extended discontinuance of sales to this customer could, if not replaced, have a material impact on our operations.
79
The majority of our operations are domiciled in the United States. Approximately
98%
,
97%
and
96%
of sales to external customers for fiscal
2016
,
2015
and
2014
, respectively, were sourced from the United States. Approximately
$17.3 billion
and $17.4 billion of long-lived assets were located in the United States at
October 1, 2016
, and
October 3, 2015
. Excluding goodwill and intangible assets, long-lived assets located in the United States totaled approximately
$5.6 billion
at
October 1, 2016
, and
October 3, 2015
. Approximately
$204 million
and
$191 million
of long-lived assets were located in foreign countries, primarily Brazil, China and India, at
October 1, 2016
, and
October 3, 2015
, respectively. Excluding goodwill and intangible assets, long-lived assets in foreign countries totaled approximately
$180 million
and
$165 million
at
October 1, 2016
, and
October 3, 2015
, respectively.
We sell certain products in foreign markets, primarily Canada, Central America, China, the European Union, Japan, Mexico, the Middle East, South Korea, and Taiwan. Our export sales from the United States totaled
$3.5 billion
,
$4.1 billion
and
$4.7 billion
for fiscal
2016
,
2015
and
2014
, respectively. Substantially all of our export sales are facilitated through unaffiliated brokers, marketing associations and foreign sales staffs. Sales of products produced in a country other than the United States were less than
10%
of consolidated sales for each of fiscal
2016
,
2015
and
2014
.
The following table summarizes cash payments for interest and income taxes:
|
in millions
|
|
||||||||||
|
2016
|
|
2015
|
|
2014
|
|
||||||
|
Interest, net of amounts capitalized
|
$
|
242
|
|
$
|
308
|
|
$
|
118
|
|
||
|
Income taxes, net of refunds
|
686
|
|
437
|
|
590
|
|
|||||
We have operating leases for
two
wastewater facilities with an entity owned by the Donald J. Tyson Revocable Trust (for which Mr. John Tyson, Chairman of the Company, is a trustee), Berry Street Waste Water Treatment Plant, LP (
90%
of which is owned by TLP), and the sisters of Mr. Tyson. Total payments of approximately
$1 million
in each of fiscal
2016
,
2015
and
2014
were paid to lease the facilities.
In fiscal 2014, we purchased real estate from JHT, LLC, for
$0.5 million
to build a new data center. JHT, LLC (for which Mr. John Tyson is the manager), is owned
50%
by the Donald J. Tyson Revocable Trust and
50%
by the Randal W. Tyson Testamentary Trust.
As of October 1, 2016, the TLP, of which John Tyson and director Barbara Tyson are general partners, owned
70 million
shares, or
99.985%
of our outstanding Class B stock and, along with the members of the Tyson family, owned
6.0 million
shares of Class A stock, giving it control of approximately
71.18%
of the total voting power of our outstanding voting stock.
Commitments
We lease equipment, properties and certain farms for which total rentals approximated
$172 million
,
$165 million
and
$161 million
, in fiscal
2016
,
2015
and
2014
, respectively. Most leases have initial terms of up to
seven
years, some with varying renewal periods. The most significant obligations assumed under the terms of the leases are the upkeep of the facilities and payments of insurance and property taxes.
Minimum lease commitments under non-cancelable leases at
October 1, 2016
, were:
|
in millions
|
|
||
|
2017
|
$
|
118
|
|
|
2018
|
92
|
|
|
|
2019
|
66
|
|
|
|
2020
|
43
|
|
|
|
2021
|
30
|
|
|
|
2022 and beyond
|
78
|
|
|
|
Total
|
$
|
427
|
|
80
We guarantee obligations of certain outside third parties, consisting primarily of leases, debt and grower loans, which are substantially collateralized by the underlying assets. Terms of the underlying debt cover periods up to
10
years, and the maximum potential amount of future payments as of
October 1, 2016
, was
$35 million
. We also maintain operating leases for various types of equipment, some of which contain residual value guarantees for the market value of the underlying leased assets at the end of the term of the lease. The remaining terms of the lease maturities cover periods over the next
11
years. The maximum potential amount of the residual value guarantees is
$91 million
, of which
$83 million
could be recoverable through various recourse provisions and an additional undeterminable recoverable amount based on the fair value of the underlying leased assets. The likelihood of material payments under these guarantees is not considered probable. At
October 1, 2016
, and
October 3, 2015
, no material liabilities for guarantees were recorded.
We have cash flow assistance programs in which certain livestock suppliers participate. Under these programs, we pay an amount for livestock equivalent to a standard cost to grow such livestock during periods of low market sales prices. The amounts of such payments that are in excess of the market sales price are recorded as receivables and accrue interest. Participating suppliers are obligated to repay these receivables balances when market sales prices exceed this standard cost, or upon termination of the agreement. Our maximum obligation associated with these programs is limited to the fair value of each participating livestock supplier’s net tangible assets. The potential maximum obligation as of
October 1, 2016
, was approximately
$380 million
. The total receivables under these programs were
$2 million
at
October 1, 2016
. There were no receivables under this program and at
October 3, 2015
. These receivables are included, net of allowance for uncollectible amounts, in Accounts Receivable in our Consolidated Balance Sheets. Even though these programs are limited to the net tangible assets of the participating livestock suppliers, we also manage a portion of our credit risk associated with these programs by obtaining security interests in livestock suppliers’ assets. After analyzing residual credit risks and general market conditions, we had
no
allowance for these programs' estimated uncollectible receivables at
October 1, 2016
, and
October 3, 2015
.
When constructing new facilities or making major enhancements to existing facilities, we will occasionally enter into incentive agreements with local government agencies in order to reduce certain state and local tax expenditures. Under these agreements, we transfer the related assets to various local government entities and receive Industrial Revenue Bonds. We immediately lease the facilities from the local government entities and have an option to re-purchase the facilities for a nominal amount upon tendering the Industrial Revenue Bonds to the local government entities at various predetermined dates. The Industrial Revenue Bonds and the associated obligations for the leases of the facilities offset, and the underlying assets remain in property, plant and equipment. At October 1, 2016, total amounts under these type of arrangements totaled
$502 million
.
Additionally, we enter into future purchase commitments for various items, such as grains, livestock contracts and fixed grower fees. At
October 1, 2016
, these commitments totaled:
|
in millions
|
|
||
|
2017
|
$
|
1,817
|
|
|
2018
|
373
|
|
|
|
2019
|
166
|
|
|
|
2020
|
112
|
|
|
|
2021
|
95
|
|
|
|
2022 and beyond
|
106
|
|
|
|
Total
|
$
|
2,669
|
|
81
Contingencies
We are involved in various claims and legal proceedings. We routinely assess the likelihood of adverse judgments or outcomes to those matters, as well as ranges of probable losses, to the extent losses are reasonably estimable. We record accruals for such matters to the extent that we conclude a loss is probable and the financial impact, should an adverse outcome occur, is reasonably estimable. Such accruals are reflected in the Company’s consolidated financial statements. In our opinion, we have made appropriate and adequate accruals for these matters and believe the probability of a material loss beyond the amounts accrued to be remote; however, the ultimate liability for these matters is uncertain, and if accruals are not adequate, an adverse outcome could have a material effect on the consolidated financial condition or results of operations. Listed below are certain claims made against the Company and/or our subsidiaries for which the potential exposure is considered material to the Company’s consolidated financial statements. We believe we have substantial defenses to the claims made and intend to vigorously defend these matters.
Below are the details of
six
lawsuits involving our beef, pork and prepared foods plants in which certain present and past employees allege that we failed to compensate them for the time it takes to engage in pre- and post-shift activities, such as changing into and out of protective and sanitary clothing and walking to and from the changing area, work areas and break areas in violation of the Fair Labor Standards Act and various state laws. The plaintiffs seek back wages, liquidated damages, pre- and post-judgment interest, attorneys’ fees and costs. Each case is proceeding in its jurisdiction.
|
•
|
Bouaphakeo (f/k/a Sharp), et al. v. Tyson Foods, Inc., N.D. Iowa, February 6, 2007
- A jury trial was held involving our Storm Lake, Iowa pork plant which resulted in a jury verdict in favor of the plaintiffs for violations of federal and state laws for pre- and post-shift work activities. The trial court also awarded the plaintiffs liquidated damages, resulting in total damages awarded in the amount of
$5,784,758
. The plaintiffs' counsel has also filed an application for attorneys' fees and expenses in the amount of
$2,692,145
. We appealed the jury's verdict and trial court's award to the Eighth Circuit Court of Appeals. The appellate court affirmed the jury verdict and judgment on August 25, 2014, and we filed a petition for rehearing on September 22, 2014, which was denied. We filed a petition for a writ of certiorari with the United States Supreme Court, which was granted on June 8, 2015, and oral arguments before the Supreme Court occurred on November 10, 2015. On March 22, 2016, the Supreme Court affirmed the appellate court’s rulings and remanded to the trial court to allocate the lump sum award among the class participants.
|
|
•
|
Edwards, et al. v. Tyson Foods, Inc. d.b.a Tyson Fresh Meats, Inc., S.D. Iowa, March 20, 2008
- The trial court in this case, which involves our Perry and Waterloo, Iowa pork plants, decertified the state law class and granted other pre-trial motions that resulted in judgment in our favor with respect to the plaintiffs’ claims. The plaintiffs have filed a motion to modify this judgment.
|
|
•
|
Murray, et al. v. Tyson Foods, Inc., C.D. Illinois, January 2, 2008
; and
DeVoss v. Tyson Foods, Inc. d.b.a. Tyson Fresh Meats, C.D. Illinois, March 2, 2011
- These cases involve our Joslin, Illinois beef plant and are in their preliminary stages.
|
|
•
|
Dozier, Southerland, et al. v. The Hillshire Brands Company, E.D. North Carolina, September 2, 2014
- This case involves our Tarboro, North Carolina prepared foods plant. On March 25, 2016, the parties filed a joint motion for settlement totaling
$425,000
, which includes all of the plaintiffs’ attorneys’ fees and costs.
|
|
•
|
Awad, et al. v. Tyson Foods, Inc. and Tyson Fresh Meats, Inc., M.D. Tennessee, February 12, 2015
- On October 12, 2016, the parties filed a joint motion for approval of a
$725,000
settlement, and plaintiffs filed an application for attorneys’ fees and costs. The court granted its preliminary approval of the parties’ joint motion and the application for attorneys’ fees and costs, on October 21, 2016, and dismissed the action with prejudice.
|
Our subsidiary, The Hillshire Brands Company (formerly named Sara Lee Corporation), is a party to a consolidation of cases filed by individual complainants with the Republic of the Philippines, Department of Labor and Employment and the National Labor Relations Commission (NLRC) from 1998 through July 1999. The complaint is filed against Aris Philippines, Inc., Sara Lee Corporation, Sara Lee Philippines, Inc., Fashion Accessories Philippines, Inc., and Attorney Cesar C. Cruz (collectively, the “respondents”). The complaint alleges, among other things, that the respondents engaged in unfair labor practices in connection with the termination of manufacturing operations in the Philippines by Aris Philippines, Inc., a former subsidiary of The Hillshire Brands Company. In 2006, an labor arbiter ruled against the respondents and awarded the complainants PHP
3,453,664,710
(approximately US
$71 million
) in damages and fees. The respondents appealed the labor arbiter's ruling, and it was subsequently set aside by the NLRC in December 2006. Subsequent to the NLRC’s decision, the parties filed numerous appeals, motions for reconsideration and petitions for review, certain of which remained outstanding for several years. While various of those appeals, motions and/or petitions were pending, The Hillshire Brands Company, on June 23, 2014, without admitting liability, filed a settlement motion requesting that the Supreme Court of the Philippines order dismissal with prejudice of all claims against it and certain other respondents in exchange for payments allocated by the court among the complainants in an amount not to exceed PHP
342,287,800
(approximately US
$7.1 million
). Based in part on its finding that the consideration to be paid to the complainants as part of such settlement was insufficient, the Supreme Court of the Philippines denied the respondents’ settlement motion and all motions for reconsideration thereof. The Supreme Court of the Philippines also set aside as premature the NLRC’s December 2006 ruling. As a result, the cases are now back before the NLRC, which will once again rule on the respondents’ appeals regarding the labor arbiter’s 2006 ruling in favor of the complainants.
82
In the meantime, the respondents reached a settlement with a group comprising approximately
18%
of the class of
5,984
complainants, pursuant to which The Hillshire Brands Company would pay each settling complainant PHP
68,000
(approximately US
$1,402
). The settlement was approved by the NLRC on or around April 8, 2016, and certain motions for reconsideration relating thereto were resolved on June 30, 2016. If there are no further appeals or motions for reconsideration, The Hillshire Brands Company will make the payments associated with the settlement. In the meantime, The Hillshire Brands Company awaits the NLRC’s decision on the pending appeal with respect to all non-settling complainants.
On September 2, 2016, Maplevale Farms, Inc., acting on behalf of itself and a putative class of direct purchasers of poultry products, filed a class action complaint against us and certain of our poultry subsidiaries, as well as several other poultry processing companies, in the Northern District of Illinois. The complaint alleges, among other things, that beginning in January 2008 the defendants conspired and combined to fix, raise, maintain, and stabilize the price of broiler chickens in violation of United States antitrust laws. It is further alleged that the defendants concealed this conduct from the plaintiff and the putative class. The plaintiff and putative class are seeking treble damages, injunctive relief, pre- and post-judgment interest, costs, and attorneys’ fees. Subsequent to the filing of this initial complaint, additional lawsuits making similar claims on behalf of putative classes of direct and indirect purchaser classes were filed in the United States District Court for the Northern District of Illinois. The lawsuits brought on behalf of putative classes of indirect purchasers allege, in addition to violations of federal antitrust laws, causes of action under various state unfair competition laws, consumer protection laws, and unjust enrichment common laws. The court has consolidated, for pretrial purposes, each of the direct purchaser actions into
one
case and each of the indirect purchaser actions into
one
case. These
two
actions are styled In re Broiler Chicken Antitrust Litigation. On October 28, 2016, plaintiffs filed consolidated amended complaints in each of the
two
new consolidated actions. The allegations in those complaints are substantially similar to the allegations set forth above.
83
|
in millions, except per share data
|
||||||||||||||||
|
First
Quarter
|
|
Second
Quarter
|
|
Third
Quarter
|
|
Fourth
Quarter
|
|
|||||||||
|
2016
|
||||||||||||||||
|
Sales
|
$
|
9,152
|
|
$
|
9,170
|
|
$
|
9,403
|
|
$
|
9,156
|
|
||||
|
Gross profit
|
1,201
|
|
1,183
|
|
1,224
|
|
1,089
|
|
||||||||
|
Operating income
|
776
|
|
704
|
|
767
|
|
586
|
|
||||||||
|
Net income
|
461
|
|
434
|
|
485
|
|
392
|
|
||||||||
|
Net income attributable to Tyson
|
461
|
|
432
|
|
484
|
|
391
|
|
||||||||
|
Net income per share attributable to Tyson:
|
||||||||||||||||
|
Class A Basic
|
$
|
1.18
|
|
$
|
1.14
|
|
$
|
1.29
|
|
$
|
1.06
|
|
||||
|
Class B Basic
|
$
|
1.09
|
|
$
|
1.02
|
|
$
|
1.17
|
|
$
|
0.96
|
|
||||
|
Diluted
|
$
|
1.15
|
|
$
|
1.10
|
|
$
|
1.25
|
|
$
|
1.03
|
|
||||
|
2015
|
||||||||||||||||
|
Sales
|
$
|
10,817
|
|
$
|
9,979
|
|
$
|
10,071
|
|
$
|
10,506
|
|
||||
|
Gross profit
|
956
|
|
989
|
|
986
|
|
986
|
|
||||||||
|
Operating income
|
509
|
|
547
|
|
563
|
|
550
|
|
||||||||
|
Net income
|
310
|
|
311
|
|
344
|
|
259
|
|
||||||||
|
Net income attributable to Tyson
|
309
|
|
310
|
|
343
|
|
258
|
|
||||||||
|
Net income per share attributable to Tyson:
|
||||||||||||||||
|
Class A Basic
|
$
|
0.77
|
|
$
|
0.78
|
|
$
|
0.86
|
|
$
|
0.65
|
|
||||
|
Class B Basic
|
$
|
0.71
|
|
$
|
0.71
|
|
$
|
0.78
|
|
$
|
0.59
|
|
||||
|
Diluted
|
$
|
0.74
|
|
$
|
0.75
|
|
$
|
0.83
|
|
$
|
0.63
|
|
||||
Second quarter fiscal 2016 net income included a
$12 million
recognition of previously unrecognized tax benefits.
Third quarter fiscal 2016 net income included a
$15 million
recognition of previously unrecognized tax benefits and audit settlement.
Fourth quarter fiscal 2016 net income included a
$26 million
recognition of previously unrecognized tax benefits.
First quarter fiscal 2015 net income included
$19 million
pretax expense related to merger and integration,
$36 million
pretax loss due to costs related to a legacy Hillshire Brands plant fire and a
$26 million
unrecognized tax benefit gain.
Second quarter fiscal 2015 net income included
$14 million
pretax expense related to merger and integration and
$8 million
pretax gain due to insurance proceeds (net of costs) related to a legacy Hillshire Brands plant fire.
Third quarter fiscal 2015 net income included
$16 million
pretax expense related to merger and integration,
$11 million
pretax gains due to insurance proceeds (net of costs) related to a legacy Hillshire Brands plant fire and
$21 million
pretax gains on sale of equity securities.
Fourth quarter fiscal 2015 net income included
$8 million
pretax expense related to merger and integration,
$25 million
pretax gains due to insurance proceeds related to a legacy Hillshire Brands plant fire,
$169 million
pretax China impairment charge,
$59 million
pretax impairment charges related to our Prepared Foods network optimization,
$12 million
pretax closure and impairment charges related to the Denison plant closure,
$161 million
pretax gain on the sale of the Mexico operation and
$39 million
pretax gain related to our accounting cycle resulting in a 53-week year in fiscal 2015.
84
Report of Independent Registered Public Accounting Firm
To the Board of Directors and Shareholders of
Tyson Foods, Inc.
In our opinion, the accompanying consolidated balance sheets and the related consolidated statements of income, comprehensive income, shareholders’ equity and cash flows present fairly, in all material respects, the financial position of Tyson Foods, Inc.
and its subsidiaries
at October 1, 2016
and October 3, 2015, and the results of their operations and their cash flows for each of the three years in the period ended October 1, 2016
in conformity with accounting principles generally accepted in the United States of America. In addition, in our opinion, the financial statement schedule listed in the index appearing under Item 15(a)(2) presents fairly, in all material respects, the information set forth therein when read in conjunction with the related consolidated financial statements. Also in our opinion, the Company maintained, in all material respects, effective internal control over financial reporting as of October 1, 2016, based on criteria established in
Internal Control - Integrated Framework
(2013) issued by the Committee of Sponsoring Organizations of the Treadway Commission (COSO)
.
The Company's management is responsible for these financial statements and financial statement schedule, for maintaining effective internal control over financial reporting and for its assessment of the effectiveness of internal control over financial reporting, included in
Management's Annual Report on Internal Control over Financial Reporting appearing under Item 9A. Our responsibility is to express opinions on these financial statements, on the financial statement schedule, and on the Company's internal control over financial reporting based on our integrated
audits. We conducted our audits in accordance with the standards of the Public Company Accounting Oversight Board (United States). Those standards require that we plan and perform the audits to obtain reasonable assurance about whether the financial statements are free of material misstatement and whether effective internal control over financial reporting was maintained in all material respects. Our audits of the financial statements included examining, on a test basis, evidence supporting the amounts and disclosures in the financial statements, assessing the accounting principles used and significant estimates made by management, and evaluating the overall financial statement presentation. Our audit of internal control over financial reporting included obtaining an understanding of internal control over financial reporting, assessing the risk that a material weakness exists, and testing and evaluating the design and operating effectiveness of internal control based on the assessed risk. Our audits also included performing such other procedures as we considered necessary in the circumstances. We believe that our audits provide a reasonable basis for our opinions.
A company’s internal control over financial reporting is a process designed to provide reasonable assurance regarding the reliability of financial reporting and the preparation of financial statements for external purposes in accordance with generally accepted accounting principles. A company’s internal control over financial reporting includes those policies and procedures that (i) pertain to the maintenance of records that, in reasonable detail, accurately and fairly reflect the transactions and dispositions of the assets of the company; (ii) provide reasonable assurance that transactions are recorded as necessary to permit preparation of financial statements in accordance with generally accepted accounting principles, and that receipts and expenditures of the company are being made only in accordance with authorizations of management and directors of the company; and (iii) provide reasonable assurance regarding prevention or timely detection of unauthorized acquisition, use, or disposition of the company’s assets that could have a material effect on the financial statements.
Because of its inherent limitations, internal control over financial reporting may not prevent or detect misstatements. Also, projections of any evaluation of effectiveness to future periods are subject to the risk that controls may become inadequate because of changes in conditions, or that the degree of compliance with the policies or procedures may deteriorate.
/s/ PricewaterhouseCoopers LLP
Fayetteville, Arkansas
November 21, 2016
85
Not applicable.
Evaluation of Disclosure Controls and Procedures
An evaluation was performed, under the supervision and with the participation of management, including the Chief Executive Officer (CEO) and the Chief Financial Officer (CFO), of the effectiveness of the design and operation of our disclosure controls and procedures (as defined in Rule 13a-15(e) under the Securities Exchange Act of 1934, as amended (the 1934 Act)). Based on that evaluation, the CEO and CFO concluded that, as of
October 1, 2016
, our disclosure controls and procedures were effective.
Changes in Internal Control Over Financial Reporting
In the quarter ended
October 1, 2016
, there have been no changes in the Company’s internal control over financial reporting that have materially affected, or are reasonably likely to materially affect, the Company’s internal control over financial reporting.
Management’s Annual Report on Internal Control Over Financial Reporting
Management is responsible for establishing and maintaining adequate internal control over financial reporting, as defined in Rule 13a-15(f) of the 1934 Act. Our internal control over financial reporting was designed to provide reasonable assurance regarding the reliability of financial reporting and the preparation of financial statements for external purposes in accordance with generally accepted accounting principles. Because of its inherent limitations, internal control over financial reporting may not prevent or detect misstatements. Also, projections of any evaluation of effectiveness to future periods are subject to the risk that controls may become inadequate because of changes in conditions, or the degree of compliance with the policies or procedures may deteriorate.
Management conducted an evaluation of the effectiveness of our internal control over financial reporting as of
October 1, 2016
. In making this assessment, we used criteria set forth by the Committee of Sponsoring Organizations of the Treadway Commission (COSO) in
Internal Control – Integrated Framework (2013)
.
Based on this evaluation under the framework in
Internal Control – Integrated Framework (2013)
issued by COSO, management concluded the Company’s internal control over financial reporting was effective as of
October 1, 2016
.
The Company’s independent registered public accounting firm, PricewaterhouseCoopers LLP, who has audited the fiscal
2016
financial statements included in this Annual Report on Form 10-K, has also audited the effectiveness of the Company’s internal control over financial reporting as of October 1, 2016, as stated in its report which appears in Part II, Item 8 of this Annual Report on Form 10-K.
None
86
See information set forth under the captions “Election of Directors”, "Information Regarding the Board and its Committees" and "Report of the Audit Committee" in the Company’s definitive Proxy Statement for the Company’s Annual Meeting of Shareholders to be held
February 9, 2017
(the “Proxy Statement”), which information is incorporated herein by reference. Pursuant to general instruction G(3) of Annual Report on Form 10-K, certain information concerning our executive officers is included under the caption “Executive Officers of the Company” in Part I of this Annual Report on Form 10-K.
We have a code of ethics as defined in Item 406 of Regulation S-K, which code applies to all of our directors and employees, including our principal executive officers, principal financial officer, principal accounting officer or controller, and persons performing similar functions. This code of ethics, titled “Tyson Foods, Inc. Code of Conduct,” is available, free of charge on our website at http://ir.tyson.com.
We will post any amendments to the Code of Conduct, and any waivers that are required to be disclosed by the rules of either the Securities and Exchange Commission or the New York Stock Exchange, on our website.
See the information set forth under the captions “Executive Compensation,” “Director Compensation For Fiscal Year
2016
,” “Compensation Discussion and Analysis,” “Report of the Compensation and Leadership Development Committee,” “Compensation Committee Interlocks and Insider Participation”, and "Section 16(a) Beneficial Ownership Reporting Compliance" in the Proxy Statement, which information is incorporated herein by reference. However, pursuant to instructions to Item 407(e)(5) of Regulation S-K, the material appearing under the sub-heading “Report of the Compensation and Leadership Development Committee” shall be deemed "furnished" and not be deemed to be “filed” with the Securities and Exchange Commission, other than as provided in this Item 11.
See the information included under the captions “Security Ownership of Certain Beneficial Owners” and “Security Ownership of Management” in the Proxy Statement, which information is incorporated herein by reference.
Securities Authorized for Issuance Under Equity Compensation Plans
The following information reflects certain information about our equity compensation plans as of
October 1, 2016
:
|
Equity Compensation Plan Information
|
|||||||||
|
Number of
Securities to be
issued upon
exercise of
outstanding
options
|
|
Weighted
average
exercise price
of outstanding
options
|
|
Number of Securities remaining available for
future issuance under
equity compensation plans
(excluding Securities
reflected in the first column (a) (b))
|
|
||||
|
Equity compensation plans approved by security holders
|
11,191,656
|
|
$
|
33.74
|
|
43,783,785
|
|
||
|
Equity compensation plans not approved by security holders
|
—
|
|
—
|
|
—
|
|
|||
|
Total
|
11,191,656
|
|
$
|
33.74
|
|
43,783,785
|
|
||
|
(a)
|
Shares available for future issuance as of October 1, 2016, under the Stock Incentive Plan (20,726,621), the Employee Stock Purchase Plan (15,409,556) and the Retirement Savings Plan (7,647,608)
|
|
(b)
|
"Securities" and "shares" refer to the Company's Class A common stock.
|
See the information included under the captions “Election of Directors”, "Information Regarding the Board and its Committees" and “Certain Transactions” in the Proxy Statement, which information is incorporated herein by reference.
See the information included under the captions “Audit Fees,” “Audit-Related Fees,” “Tax Fees,” “All Other Fees,” and “Audit Committee Pre-Approval Policy” in the Proxy Statement, which information is incorporated herein by reference.
87
|
(a)
|
The following documents are filed as a part of this report:
|
(1) Consolidated Financial Statements
Consolidated Statements of Income for the three years ended
October 1, 2016
Consolidated Statements of Comprehensive Income for the three years ended
October 1, 2016
Consolidated Balance Sheets at
October 1, 2016
, and
October 3, 2015
Consolidated Statements of Shareholders’ Equity for the three years ended
October 1, 2016
Consolidated Statements of Cash Flows for the three years ended
October 1, 2016
Notes to Consolidated Financial Statements
Report of Independent Registered Public Accounting Firm
(2) Consolidated Financial Statement Schedules
Financial Statement Schedule - Schedule II Valuation and Qualifying Accounts for the three years ended
October 1, 2016
All other schedules are omitted because they are neither applicable nor required.
(3) Exhibits required by Item 601 of Regulation S-K
The exhibits filed with this report are listed in the Exhibit Index following the signature pages to this Annual
Report on Form 10-K and incorporated herein by reference.
88
SIGNATURES
Pursuant to requirements of Section 13 or 15(d) of the Securities Exchange Act of 1934, the registrant has duly caused this report to be signed on its behalf by the undersigned, thereunto duly authorized.
|
TYSON FOODS, INC.
|
||||
|
By:
|
/s/ Dennis Leatherby
|
November 21, 2016
|
||
|
Dennis Leatherby
|
||||
|
Executive Vice President and Chief
Financial Officer (Principal Financial Officer)
|
||||
89
Pursuant to the requirements of the Securities Exchange Act of 1934, this report has been signed below by the following persons on behalf of the registrant and in the capacities and on the date indicated.
|
/s/ Gaurdie E. Banister Jr.
|
Director
|
November 21, 2016
|
||
|
Gaurdie E. Banister Jr.
|
||||
|
/s/ Mike Beebe
|
Director
|
November 21, 2016
|
||
|
Mike Beebe
|
||||
|
/s/ Curt T. Calaway
|
Senior Vice President, Controller and
|
November 21, 2016
|
||
|
Curt T. Calaway
|
Chief Accounting Officer
|
|||
|
(Principal Accounting Officer)
|
||||
|
/s/ Mikel A. Durham
|
Director
|
November 21, 2016
|
||
|
Mikel A. Durham
|
||||
|
/s/ Thomas P. Hayes
|
Director and President
|
November 21, 2016
|
||
|
Thomas P. Hayes
|
||||
|
/s/ Dennis Leatherby
|
Executive Vice President and Chief Financial Officer
|
November 21, 2016
|
||
|
Dennis Leatherby
|
(Principal Financial Officer)
|
|||
|
/s/ Kevin M. McNamara
|
Director
|
November 21, 2016
|
||
|
Kevin M. McNamara
|
||||
|
/s/ Brad T. Sauer
|
Director
|
November 21, 2016
|
||
|
Brad T. Sauer
|
||||
|
/s/ Donnie Smith
|
Director and Chief Executive Officer
|
November 21, 2016
|
||
|
Donnie Smith
|
(Principal Executive Officer)
|
|||
|
/s/ Robert C. Thurber
|
Director
|
November 21, 2016
|
||
|
Robert C. Thurber
|
||||
|
/s/ Barbara A. Tyson
|
Director
|
November 21, 2016
|
||
|
Barbara A. Tyson
|
||||
|
/s/ John Tyson
|
Chairman of the Board of Directors
|
November 21, 2016
|
||
|
John Tyson
|
||||
90
EXHIBIT INDEX
Exhibit No.
|
2.1
|
Agreement and Plan of Merger, dated as of July 1, 2014, by and between the Company and Hillshire Brands (previously filed as Exhibit 2.1 to the Company's Current Report on Form 8-K filed July 2, 2014, Commission File No. 001-14704, and incorporated herein by reference). Exhibits and schedules have been omitted pursuant to Item 601(b)(2) of Regulation S-K, but a copy will be furnished supplementally to the Securities and Exchange Commission upon request.
|
|
|
2.2
|
Share Purchase Agreement dated November 9, 2010, by and among BBU, Inc., Grupo Bimbo, S.A.B. DE C.V. and Hillshire Brands Corporation (previously filed as Exhibit 2.1 to Quarterly Report on Form 10-Q for the period ended January 1, 2011, by The Hillshire Brands Company, Commission File No. 001-03344, and incorporated herein by reference). Exhibits and schedules have been omitted pursuant to Item 601(b)(2) of Regulation S-K, but a copy will be furnished supplementally to the Securities and Exchange Commission upon request.
|
|
|
2.3
|
Master Separation Agreement by and between Sara Lee Corporation, D.E MASTER BLENDERS 1753 B.V. and DE US, Inc., dated as of June 15, 2012 (previously filed as Exhibit 2.1 to Current Report on Form 8-K filed June 18, 2012 by The Hillshire Brands Company, Commission File No. 001-03344, and incorporated herein by reference). Exhibits and schedules have been omitted pursuant to Item 601(b)(2) of Regulation S-K, but a copy will be furnished supplementally to the Securities and Exchange Commission upon request.
|
|
|
3.1
|
Restated Certificate of Incorporation of the Company (previously filed as Exhibit 3.1 to the Company’s Annual Report on Form 10-K for the fiscal year ended October 3, 1998, Commission File No. 001-14704, and incorporated herein by reference).
|
|
|
3.2
|
Fifth Amended and Restated By-laws of the Company (previously filed as Exhibit 3.2 to the Company’s Quarterly Report on Form 10-Q filed for the period ended June 29, 2013, Commission File No. 001-14704, and incorporated herein by reference).
|
|
|
4.1
|
Indenture dated June 1, 1995, by and between the Company and The Chase Manhattan Bank, N.A., as Trustee (the “Company Indenture”) (previously filed as Exhibit 4 to Registration Statement on Form S-3, filed with the Commission on December 18, 1997, Registration No. 333-42525, and incorporated herein by reference).
|
|
|
4.2
|
Form of 7.0% Note due January 15, 2028, issued under the Company Indenture (previously filed as Exhibit 4.2 to the Company’s Quarterly Report on Form 10-Q for the period ended December 27, 1997, Commission File No. 001-14704, and incorporated herein by reference).
|
|
|
4.3
|
Form of 7.0% Note due May 1, 2018, issued under the Company Indenture (previously filed as Exhibit 4.1 to the Company’s Quarterly Report on Form 10-Q for the period ended March 28, 1998, Commission File No. 001-14704, and incorporated herein by reference).
|
|
|
4.4
|
Supplemental Indenture, dated as of September 18, 2006, by and among the Company, Tyson Fresh Meats, Inc. and JPMorgan Chase Bank, National Association, supplementing the Company Indenture (previously filed as Exhibit 10.1 to the Company’s Current Report on Form 8-K filed September 19, 2006, Commission File No. 001-14704, and incorporated herein by reference).
|
|
|
4.5
|
Supplemental Indenture dated as of September 15, 2008, by and between the Company and The Bank of New York Mellon Trust Company, National Association (as successor to JPMorgan Chase Bank, N.A. (formerly The Chase Manhattan Bank, N.A.)), as Trustee (including the form of 3.25% Convertible Senior Notes due 2013), supplementing the Company Indenture (previously filed as Exhibit 4.2 to the Company’s Current Report on Form 8-K filed September 15, 2008, Commission File No. 001-14704, and incorporated herein by reference).
|
|
|
4.6
|
Supplemental Indenture dated as of June 13, 2012, by and between the Company and The Bank of New York Mellon Trust Company, National Association (as successor to JPMorgan Chase Bank, N.A. (formerly The Chase Manhattan Bank, N.A.)), as Trustee, supplementing the Company Indenture (previously filed as Exhibit 4.1 to the Company's Current Report on Form 8-K filed June 13, 2012, Commission File No. 001-14704, and incorporated herein by reference).
|
|
|
4.7
|
Form of 4.50% Senior Note due 2022 (previously filed as Exhibit 4.2 and included in Exhibit 4.1 to the Company's Current Report on Form 8‑K filed June 13, 2012, Commission File No. 001‑14704, and incorporated herein by reference).
|
|
|
4.8
|
Supplemental Indenture dated as of August 8, 2014, by and between the Company and The Bank of New York Mellon Trust Company, National Association (as successor to JPMorgan Chase Bank, N.A. (formerly The Chase Manhattan Bank, N.A.)), as Trustee, supplementing the Company Indenture (previously filed as Exhibit 4.2 to the Company's Current Report on Form 8-K filed August 8, 2014, Commission File No. 001-14704, and incorporated herein by reference).
|
|
|
4.9
|
Form of 2.65% Senior Note due 2019 (previously filed as Exhibit 4.2 to the Company's Current Report on Form 8‑K filed August 8, 2014, Commission File No. 001‑14704, and incorporated herein by reference).
|
|
91
|
4.10
|
Supplemental Indenture dated as of August 8, 2014, by and between the Company and The Bank of New York Mellon Trust Company, National Association (as successor to JPMorgan Chase Bank, N.A. (formerly The Chase Manhattan Bank, N.A.)), as Trustee, supplementing the Company Indenture (previously filed as Exhibit 4.4 to the Company's Current Report on Form 8-K filed August 8, 2014, Commission File No. 001-14704, and incorporated herein by reference).
|
|
|
4.11
|
Form of 3.95% Senior Note due 2024 (included in Exhibit 4.4 to the Company's Current Report on Form 8‑K filed August 8, 2014, Commission File No. 001‑14704, and incorporated herein by reference).
|
|
|
4.12
|
Supplemental Indenture dated as of August 8, 2014, by and between the Company and The Bank of New York Mellon Trust Company, National Association (as successor to JPMorgan Chase Bank, N.A. (formerly The Chase Manhattan Bank, N.A.)), as Trustee, supplementing the Company Indenture (previously filed as Exhibit 4.6 to the Company's Current Report on Form 8-K filed August 8, 2014, Commission File No. 001-14704, and incorporated herein by reference).
|
|
|
4.13
|
Form of 4.875% Senior Note due 2034 (included in Exhibit 4.6 to the Company's Current Report on Form 8‑K filed August 8, 2014, Commission File No. 001‑14704, and incorporated herein by reference).
|
|
|
4.14
|
Supplemental Indenture dated as of August 8, 2014, by and between the Company and The Bank of New York Mellon Trust Company, National Association (as successor to JPMorgan Chase Bank, N.A. (formerly The Chase Manhattan Bank, N.A.)), as Trustee, supplementing the Company Indenture (previously filed as Exhibit 4.8 to the Company's Current Report on Form 8-K filed August 8, 2014, Commission File No. 001-14704, and incorporated herein by reference).
|
|
|
4.15
|
Form of 5.15% Senior Note due 2044 (previously filed as Exhibit 4.8 to the Company's Current Report on Form 8‑K filed August 8, 2014, Commission File No. 001‑14704, and incorporated herein by reference).
|
|
|
4.16
|
Purchase Contract Agreement dated as of August 5, 2014, by and between the Company and The Bank of New York Mellon Trust Company, N.A., as Purchase Contract Agent (previously filed as Exhibit 4.1 of the Company’s Current Report on Form 8-K filed August 5, 2014, Commission File No. 001-14704, and incorporated herein by reference).
|
|
|
4.17
|
Form of Unit (previously filed as Exhibit 4.1 to the Company’s Current Report on Form 8-K filed August 5, 2014, Commission File No. 001-14704, and incorporated herein by reference).
|
|
|
4.18
|
Form of Purchase Contract (previously filed as Exhibit 4.1 to the Company’s Current Report on Form 8-K filed August 5, 2014, Commission File No. 001-14704, and incorporated herein by reference).
|
|
|
4.19
|
Supplemental Indenture dated as of August 5, 2014, by and between the Company and The Bank of New York Mellon Trust Company, N.A., as Trustee, supplementing the Company Indenture (previously filed as Exhibit 4.5 of the Company’s Current Report on Form 8-K filed August 5, 2014, Commission File No. 001-14704, and incorporated herein by reference).
|
|
|
4.20
|
Form of Amortizing Note (previously filed as Exhibit 4.5 to the Company’s Current Report on Form 8-K filed August 5, 2014, Commission File No. 001-14704, and incorporated herein by reference).
|
|
|
4.21
|
Indenture dated October 2, 1990, between Sara Lee Corporation and Continental Bank, N.A., as Trustee (the “Sara Lee Indenture”) (previously filed as Exhibit 4.1 of Amendment No. 1 to Registration Statement No. 33-33603 on Form S-3 by Sara Lee Corporation, predecessor in interest to The Hillshire Brands Company, filed with the Commission on October 5, 1990, Commission File No. 001-03344, and incorporated herein by reference).
|
|
|
4.22
|
Form of 4.10% Notes due 2020 issued pursuant to the Sara Lee Indenture (previously filed as Exhibit 4.2 to Current Report on Form 8-K dated September 7, 2010 by The Hillshire Brands Company, Commission File No. 001-03344, and incorporated herein by reference).
|
|
|
4.23
|
Form of 6.13% Notes due 2032 issued pursuant to the Sara Lee Indenture (previously filed as Exhibit 4.25 to the Company’s Annual Report on Form 10-K for the fiscal year ended September 27, 2014, Commission File No. 001-14704, and incorporated herein by reference).
|
|
|
10.1
|
Credit Agreement, dated as of September 25, 2014, by and among the Company, JPMorgan Chase Bank, N.A., as the Administrative Agent, and certain other lenders party thereto (previously filed as Exhibit 10.1 to the Company's Current Report on Form 8-K filed September 29, 2014, Commission File No. 001-14704, and incorporated herein by reference).
|
|
|
10.2
|
Term Loan Agreement, dated as of July 15, 2014, by and among the Company, Morgan Stanley Senior Funding, Inc., as the Administrative Agent, and certain other lenders party thereto (previously filed as Exhibit 10.2 to the Company’s Current Report on Form 8-K filed July 17, 2014, Commission File No. 001-14704, and incorporated herein by reference).
|
|
92
|
10.3
|
Term Loan Agreement, dated as of April 7, 2015, by and among the Company, Bank of America, N.A. as lender, and Merill Lynch, Pierce, Fenner & Smith Incorporated, as sole lead arranger and sole bookrunner (previously filed as exhibit 10.1 to the Company's Current Report on Form 8-K filed April 8, 2015, Commission File No. 001-14704, and incorporated herein by reference).
|
|
|
10.4
|
Amendment No. 1 to Term Loan Agreement, dated as of May 5, 2016, by and between the Company and Bank of America, N.A. as lender (previously filed as Exhibit 10.1 to the Company’s Quarterly Report on Form 10-Q for the period ended April 2, 2016, Commission File No. 001-14704, and incorporated herein by reference).
|
|
|
10.5
|
*
|
Amended and Restated Employment Agreement, dated as of May 1, 2014, by and between the Company and John Tyson (previously filed as Exhibit 10.1 to the Company’s Quarterly Report on Form 10-Q for the period ended March 29, 2014, Commission File No. 001-14704, and incorporated herein by reference).
|
|
10.6
|
*
|
Employment Agreement, dated November 14, 2012, by and between the Company and Donald J. Smith (previously filed as Exhibit 10.12 to the Company's Annual Report on Form 10-K for the fiscal year ended September 29, 2012, Commission File No. 001-14704, and incorporated herein by reference).
|
|
10.7
|
*
|
Employment Agreement, dated November 14, 2012, by and between the Company and David Van Bebber (previously filed as Exhibit 10.14 to the Company's Annual Report on Form 10-K for the fiscal year ended September 29, 2012, Commission File No. 001-14704, and incorporated herein by reference).
|
|
10.8
|
*
|
Employment Agreement, dated November 14, 2012, by and between the Company and Dennis Leatherby (previously filed as Exhibit 10.15 to the Company's Annual Report on Form 10-K for the fiscal year ended September 29, 2012, Commission File No. 001-14704, and incorporated herein by reference).
|
|
10.9
|
*
|
Employment Agreement, dated November 15, 2013, by and between the Company and Donnie D. King(previously filed as Exhibit 10.17 to the Company's Annual Report on Form 10-K for the fiscal year ended September 28, 2013, Commission File No. 001-14704, and incorporated herein by reference).
|
|
10.10
|
*
|
Employment Agreement, dated November 15, 2013, by and between the Company and Noel W. White (previously filed as Exhibit 10.19 to the Company's Annual Report on Form 10-K for the fiscal year ended September 28, 2013, Commission File No. 001-14704, and incorporated herein by reference).
|
|
10.11
|
*
|
Employment Agreement, dated November 15, 2013, by and between the Company and Howell P. Carper(previously filed as Exhibit 10.20 to the Company's Annual Report on Form 10-K for the fiscal year ended September 28, 2013, Commission File No. 001-14704, and incorporated herein by reference).
|
|
10.12
|
*
|
Employment Agreement, dated November 12, 2013, by and between the Company and Stephen R. Stouffer(previously filed as Exhibit 10.21 to the Company's Annual Report on Form 10-K for the fiscal year ended September 28, 2013, Commission File No. 001-14704, and incorporated herein by reference).
|
|
10.13
|
*
|
Employment Agreement, dated August 29, 2014, by and between the Company and Andrew P. Callahan(previously filed as Exhibit 10.19 to the Company’s Annual Report on Form 10-K for the fiscal year ended September 27, 2014, Commission File No. 001-14704, and incorporated herein by reference).
|
|
10.14
|
*
|
Employment Agreement, dated August 29, 2014, by and between the Company and Sobhana (Sally) Grimes (previously filed as Exhibit 10.20 to the Company’s Annual Report on Form 10-K for the fiscal year ended September 27, 2014, Commission File No. 001-14704, and incorporated herein by reference).
|
|
10.15
|
*
|
Employment Agreement, dated August 29, 2014, by and between the Company and Thomas Hayes (previously filed as Exhibit 10.21 to the Company’s Annual Report on Form 10-K for the fiscal year ended September 27, 2014, Commission File No. 001-14704, and incorporated herein by reference).
|
|
10.16
|
*
|
Employment Agreement, dated August 29, 2014, by and between the Company and Mary Oleksiuk (previously filed as Exhibit 10.22 to the Company’s Annual Report on Form 10-K for the fiscal year ended September 27, 2014, Commission File No. 001-14704, and incorporated herein by reference).
|
|
10.17
|
*
|
Employment Agreement, dated November 17, 2015, by and between the Company and Donald J. Smith(previously filed as Exhibit 10.17 to the Company’s Annual Report on Form 10-K for the fiscal year ended October 3, 2015, Commission File No. 001-14704, and incorporated herein by reference).
|
|
10.18
|
*
|
Employment Agreement, dated August 28, 2015, by and between the Company and Curt T. Calaway (previously filed as Exhibit 10.19 to the Company’s Annual Report on Form 10-K for the fiscal year ended October 3, 2015, Commission File No. 001-14704, and incorporated herein by reference).
|
|
10.19
|
*
|
Employment Agreement, dated April 25, 2016, by and between the Company and Monica McGurk (previously filed as Exhibit 10.2 to the Company’s Quarterly Report on Form 10-Q for the period ended April 2, 2016, Commission File No. 001-14704, and incorporated herein by reference).
|
|
10.20
|
*
|
Amended and Restated Employment Agreement dated as of June 13, 2016, entered into between the Company and Thomas Hayes (previously filed as Exhibit 10.1 to the Company’s Current Report on Form 8-K filed June 14, 2016, Commission File No. 001-14704, and incorporated herein by reference).
|
93
|
10.21
|
*
|
Letter Agreement dated as of June 13, 2016, between the Company and Donnie Smith (previously filed as Exhibit 10.2 to the Company’s Current Report on Form 8-K filed June 14, 2016, Commission File No. 001-14704, and incorporated herein by reference).
|
|
10.22
|
*
|
Form of Retention Award Letter Agreement, dated August 29, 2014, by and between the Company and Andrew Callahan, Sobhana (Sally) Grimes, Thomas Hayes and Mary Oleksiuk (previously filed as Exhibit 10.23 to the Company’s Annual Report on Form 10-K for the fiscal year ended September 27, 2014, Commission File No. 001-14704, and incorporated herein by reference).
|
|
10.23
|
*
|
Indemnity Agreement, dated as of September 28, 2007, between the Company and John Tyson (previously filed as Exhibit 10.2 to the Company’s Current Report on Form 8-K filed September 28, 2007, Commission File No. 001-14704, and incorporated herein by reference).
|
|
10.24
|
*
|
Form of Indemnity Agreement between Tyson Foods, Inc. and its directors and certain executive officers (previously filed as Exhibit 10(t) to the Company’s Annual Report on Form 10-K for the fiscal year ended September 30, 1995, Commission File No. 0-3400, and incorporated herein by reference).
|
|
10.25
|
*
|
Tyson Foods, Inc. Annual Incentive Compensation Plan for Senior Executives adopted February 4, 2005, and reapproved February 5, 2010 (previously filed as Exhibit 10.34 to the Company’s Annual Report on Form 10-K for the fiscal year ended October 1, 2005, Commission File No. 001-14704, and incorporated herein by reference).
|
|
10.26
|
*
|
Amended and Restated Tyson Foods, Inc. Employee Stock Purchase Plan, effective as of February 1, 2013 (previously filed as Exhibit 99.2 to Registration Statement on Form S-8, filed with the Commission on February 22, 2013, Registration No. 333-186797, and incorporated herein by reference).
|
|
10.27
|
*
|
First Amendment to the Tyson Foods, Inc. Employee Stock Purchase Plan, effective February 1, 2013 (previously filed as Exhibit 10.26 to the Company’s Annual Report on Form 10-K for the fiscal year ended September 28, 2013, Commission File No. 001-14704, and incorporated herein by reference).
|
|
10.28
|
*
|
Amended and Restated Executive Savings Plan of Tyson Foods, Inc. effective January 1, 2013 (previously filed as Exhibit 10.27 to the Company’s Annual Report on Form 10-K for the fiscal year ended September 28, 2013, Commission File No. 001-14704, and incorporated herein by reference).
|
|
10.29
|
*
|
Amended and Restated Tyson Foods, Inc. 2000 Stock Incentive Plan effective February 1, 2013 (previously filed as Exhibit 99.1 to Registration Statement on Form S-8, filed with the Commission on February 22, 2013, Registration No. 333-186797, and incorporated herein by reference).
|
|
10.30
|
*
|
First Amendment to the Tyson Foods, Inc. 2000 Stock Incentive Plan effective May 1, 2013 (previously filed as Exhibit 10.29 to the Company’s Annual Report on Form 10-K for the fiscal year ended September 28, 2013, Commission File No. 001-14704, and incorporated herein by reference).
|
|
10.31
|
*
|
Amended and Restated Tyson Foods, Inc. Supplemental Executive Retirement and Life Insurance Premium Plan effective November 14, 2013 (previously filed as Exhibit 10.30 to the Company’s Annual Report on Form 10-K for the fiscal year ended September 28, 2013, Commission File No. 001-147-4, and incorporated herein by reference).
|
|
10.32
|
*
|
Retirement Savings Plan of Tyson Foods, Inc. effective January 1, 2011 (previously filed as Exhibit 10.33 to the Company's Annual Report on Form 10-K for the fiscal year ended October 1, 2011, Commission File No. 001-14704, and incorporated herein by reference).
|
|
10.33
|
*
|
First Amendment to the Retirement Savings Plan of Tyson Foods, Inc., as Amended and Restated as of January 1, 2011 (previously filed as Exhibit 10.32 to the Company’s Annual Report on Form 10-K for the fiscal year ended September 28, 2013, Commission File No. 001-14704, and incorporated herein by reference).
|
|
10.34
|
*
|
Amended and Restated Retirement Income Plan of IBP, inc. effective August 1, 2000, and Amendment to Freeze the Retirement Income Plan of IBP, inc. effective December 31, 2002 (previously filed as Exhibit 10.46 to the Company’s Annual Report on Form 10-K for the fiscal year ended September 27, 2008, Commission File No. 001-14704, and incorporated herein by reference).
|
|
10.35
|
*
|
Form of Restricted Stock Agreement pursuant to which restricted stock awards were granted under the Tyson Foods, Inc. 2000 Stock Incentive Plan prior to July 31, 2009 (previously filed as Exhibit 10.48 to the Company’s Annual Report on Form 10-K for the fiscal year ended October 2, 2004, Commission File No. 001-14704, and incorporated herein by reference).
|
|
10.36
|
*
|
Form of Restricted Stock Agreement pursuant to which restricted stock awards are granted under the Tyson Foods, Inc. 2000 Stock Incentive Plan effective July 31, 2009 (previously filed as Exhibit 10.41 to the Company’s Annual Report on Form 10-K for the fiscal year ended October 3, 2009, Commission File No. 001-14704, and incorporated herein by reference).
|
94
|
10.37
|
*
|
Form of Restricted Stock Agreement pursuant to which restricted stock awards are granted under the Tyson Foods, Inc. 2000 Stock Incentive Plan effective January 1, 2010 (previously filed as Exhibit 10.41 to the Company’s Annual Report on Form 10-K for the fiscal year ended October 2, 2010, Commission File No. 001-14704, and incorporated herein by reference).
|
|
10.38
|
*
|
Form of Stock Incentive Agreement with key employees and contracted employees at band level 3-9 pursuant to which restricted stock awards are granted under the Tyson Foods, Inc. 2000 Stock Incentive Plan effective October 26, 2012 (previously filed as Exhibit 10.38 to the Company's Annual Report on Form 10-K for the fiscal year ended September 29, 2012, Commission File No. 001-14704, and incorporated herein by reference).
|
|
10.39
|
*
|
Form of Stock Incentive Agreement with the remaining contracted employees pursuant to which restricted stock awards are granted under the Tyson Foods, Inc. 2000 Stock Incentive Plan effective October 26, 2012 (previously filed as Exhibit 10.39 to the Company's Annual Report on Form 10-K for the fiscal year ended September 29, 2012, Commission File No. 001-14704, and incorporated herein by reference).
|
|
10.40
|
*
|
Form of Stock Option Grant Agreement pursuant to which stock option awards were granted under the Tyson Foods, Inc. 2000 Stock Incentive Plan prior to July 31, 2009 (previously filed as Exhibit 10.49 to the Company’s Annual Report on Form 10-K for the fiscal year ended October 2, 2004, Commission File No. 001-14704, and incorporated herein by reference).
|
|
10.41
|
*
|
Form of Stock Option Grant Agreement pursuant to which stock option awards are granted under the Tyson Foods, Inc. 2000 Stock Incentive Plan effective July 31, 2009, through February 3, 2010 (previously filed as Exhibit 10.43 to the Company’s Annual Report on Form 10-K for the fiscal year ended October 2, 2010, Commission File No. 001-14704, and incorporated herein by reference).
|
|
10.42
|
*
|
Form of Stock Option Grant Agreement pursuant to which stock option awards are granted under the Tyson Foods, Inc. 2000 Stock Incentive Plan effective February 4, 2010 (previously filed as Exhibit 10.44 to the Company’s Annual Report on Form 10-K for the fiscal year ended October 2, 2010, Commission File No. 001-14704, and incorporated herein by reference).
|
|
|
||
|
10.43
|
*
|
Form of Stock Option Grant Agreement with non-contracted employees pursuant to which stock option awards are granted under the Tyson Foods, Inc. 2000 Stock Incentive Plan effective November 29, 2010 (previously filed as Exhibit 10.40 to the Company's Annual Report on Form 10-K for the fiscal year ended October 1, 2011, Commission File No. 001-14704, and incorporated herein by reference).
|
|
|
||
|
10.44
|
*
|
Form of Stock Option Grant Agreement with contracted employees at band level 1-5 pursuant to which stock option awards are granted under the Tyson Foods, Inc. 2000 Stock Incentive Plan effective November 29, 2010 (previously filed as Exhibit 10.41 to the Company's Annual Report on Form 10-K for the fiscal year ended October 1, 2011, Commission File No. 001-14704, and incorporated herein by reference).
|
|
|
||
|
10.45
|
*
|
Form of Stock Option Grant Agreement with key employees and contracted employees at band level 6-9 pursuant to which stock option awards are granted under the Tyson Foods, Inc. 2000 Stock Incentive Plan effective November 29, 2010 (previously filed as Exhibit 10.42 to the Company's Annual Report on Form 10-K for the fiscal year ended October 1, 2011, Commission File No. 001-14704, and incorporated herein by reference).
|
|
|
||
|
10.46
|
*
|
Form of Stock Option Grant Agreement with non-contracted employees pursuant to which stock option awards are granted under the Tyson Foods, Inc. 2000 Stock Incentive Plan effective November 28, 2011 (previously filed as Exhibit 10.46 to the Company's Annual Report on Form 10-K for the fiscal year ended September 29, 2012, Commission File No. 001-14704, and incorporated herein by reference).
|
|
|
||
|
10.47
|
*
|
Form of Stock Option Grant Agreement with contracted employees at band level 1-5 pursuant to which stock option awards are granted under the Tyson Foods, Inc. 2000 Stock Incentive Plan effective November 28, 2011 (previously filed as Exhibit 10.47 to the Company's Annual Report on Form 10-K for the fiscal year ended September 29, 2012, Commission File No. 001-14704, and incorporated herein by reference).
|
|
|
||
|
10.48
|
*
|
Form of Stock Option Grant Agreement with key employees and contracted employees at band level 6-9 pursuant to which stock option awards are granted under the Tyson Foods, Inc. 2000 Stock Incentive Plan effective November 28, 2011 (previously filed as Exhibit 10.48 to the Company's Annual Report on Form 10-K for the fiscal year ended September 29, 2012, Commission File No. 001-14704, and incorporated herein by reference).
|
|
|
||
|
10.49
|
*
|
Form of Stock Incentive Agreement pursuant to which stock options are granted to contracted employees under the Tyson Foods, Inc. 2000 Stock Incentive Plan effective October 26, 2012 (previously filed as Exhibit 10.49 to the Company's Annual Report on Form 10-K for the fiscal year ended September 29, 2012, Commission File No. 001-14704, and incorporated herein by reference).
|
|
|
||
|
10.50
|
*
|
Form of Stock Incentive Agreement pursuant to which stock options are granted to non-contracted employees under the Tyson Foods, Inc. 2000 Stock Incentive Plan effective October 26, 2012 (previously filed as Exhibit 10.50 to the Company's Annual Report on Form 10-K for the fiscal year ended September 29, 2012, Commission File No. 001-14704, and incorporated herein by reference).
|
|
|
||
95
|
10.51
|
*
|
Form of Performance Stock Award Agreement pursuant to which performance stock awards are granted under the Tyson Foods, Inc. 2000 Stock Incentive Plan effective October 4, 2010 (previously filed as Exhibit 10.44 to the Company's Annual Report on Form 10-K for the fiscal year ended October 1, 2011, Commission File No. 001-14704, and incorporated herein by reference).
|
|
|
||
|
10.52
|
*
|
Form of Performance Stock Award Agreement pursuant to which performance stock awards are granted under the Tyson Foods, Inc. 2000 Stock Incentive Plan effective October 3, 2011 (previously filed as Exhibit 10.52 to the Company's Annual Report on Form 10-K for the fiscal year ended September 29, 2012, Commission File No. 001-14704, and incorporated herein by reference).
|
|
|
||
|
10.53
|
*
|
Form of Stock Incentive Agreement pursuant to which performance stock awards are granted under the Tyson Foods, Inc. 2000 Stock Incentive Plan effective October 26, 2012 (previously filed as Exhibit 10.53 to the Company's Annual Report on Form 10-K for the fiscal year ended September 29, 2012, Commission File No. 001-14704, and incorporated herein by reference).
|
|
|
||
|
10.54
|
*
|
Form of Stock Incentive Award Agreement with non-contracted officers pursuant to which performance stock awards are granted under the Tyson Foods, Inc. 2000 Stock Incentive Plan effective November 30, 2015. 2000 Stock Incentive Plan effective November 30, 2015 (previously filed as Exhibit 10.1 to the Company’s Quarterly Report on Form 10-Q for the period ended January 2, 2016, Commission File No. 001-14704, and incorporated herein by reference).
|
|
10.55
|
*
|
Form of Stock Incentive Award Agreement with contracted officers pursuant to which performance stock awards are granted under the Tyson Foods, Inc. 2000 Stock Incentive Plan effective November 30, 2015 (previously filed as Exhibit 10.2 to the Company’s Quarterly Report on Form 10-Q for the period ended January 2, 2016, Commission File No. 001-14704, and incorporated herein by reference).
|
|
10.56
|
*
|
Form of Stock Incentive Award Agreement with contracted employees pursuant to which restricted stock awards are granted under the Tyson Foods, Inc. 2000 Stock Incentive Plan effective November 30, 2015 (previously filed as Exhibit 10.3 to the Company’s Quarterly Report on Form 10-Q for the period ended January 2, 2016, Commission File No. 001-14704, and incorporated herein by reference).
|
|
10.57
|
*
|
Form of Stock Incentive Award Agreement with non-contracted employees which include non-competition, non-solicitation and confidentiality agreements, pursuant to which restricted stock awards are granted under the Tyson Foods, Inc. 2000 Stock Incentive Plan effective November 30, 2015 (previously filed as Exhibit 10.4 to the Company’s Quarterly Report on Form 10-Q for the period ended January 2, 2016, Commission File No. 001-14704, and incorporated herein by reference).
|
|
10.58
|
*
|
Form of Stock Incentive Award Agreement with non-contracted employees pursuant to which restricted stock awards are granted under the Tyson Foods, Inc. 2000 Stock Incentive Plan effective November 30, 2015 (previously filed as Exhibit 10.5 to the Company’s Quarterly Report on Form 10-Q for the period ended January 2, 2016, Commission File No. 001-14704, and incorporated herein by reference).
|
|
10.59
|
*
|
Form of Stock Incentive Award Agreement pursuant to which restricted stock awards subject to performance criteria are granted under the Tyson Foods, Inc. 2000 Stock Incentive Plan effective November 30, 2015 (previously filed as Exhibit 10.6 to the Company’s Quarterly Report on Form 10-Q for the period ended January 2, 2016, Commission File No. 001-14704, and incorporated herein by reference).
|
|
10.60
|
*
|
Form of Stock Incentive Plan Stock Agreement pursuant to which restricted stock units awards are granted under the Tyson Foods, Inc. 2000 Stock Incentive Plan effective November 30, 2015 (previously filed as Exhibit 10.7 to the Company’s Quarterly Report on Form 10-Q for the period ended January 2, 2016, Commission File No. 001-14704, and incorporated herein by reference).
|
|
10.61
|
*
|
Form of Stock Incentive Agreement pursuant to which stock appreciation rights awards are granted under the Tyson Foods, Inc. 2000 Stock Incentive Plan effective November 30, 2015 (previously filed as Exhibit 10.8 to the Company’s Quarterly Report on Form 10-Q for the period ended January 2, 2016, Commission File No. 001-14704, and incorporated herein by reference).
|
|
10.62
|
*
|
Form of Stock Incentive Award Agreement with contracted employees pursuant to which stock options awards are granted under the Tyson Foods, Inc. 2000 Stock Incentive Plan effective November 30, 2015 (previously filed as Exhibit 10.9 to the Company’s Quarterly Report on Form 10-Q for the period ended January 2, 2016, Commission File No. 001-14704, and incorporated herein by reference).
|
|
10.63
|
*
|
Form of Stock Incentive Award Agreement with non-contracted employees which include non-competition, non-solicitation and confidentiality agreements, pursuant to which stock options awards are granted under the Tyson Foods, Inc. 2000 Stock Incentive Plan effective November 30, 2015 (previously filed as Exhibit 10.10 to the Company’s Quarterly Report on Form 10-Q for the period ended January 2, 2016, Commission File No. 001-14704, and incorporated herein by reference).
|
|
10.64
|
*
|
Form of Stock Incentive Award Agreement with non-contracted employees pursuant to which stock options awards are granted under the Tyson Foods, Inc. 2000 Stock Incentive Plan effective November 30, 2015 (previously filed as Exhibit 10.11 to the Company’s Quarterly Report on Form 10-Q for the period ended January 2, 2016, Commission File No. 001-14704, and incorporated herein by reference).
|
96
|
10.65
|
*
|
Tyson Foods, Inc. Severance Pay Plan for Contracted Employees, effective October 31, 2012 (previously filed as Exhibit 10.54 to the Company's Annual Report on Form 10-K for the fiscal year ended September 29, 2012, Commission File No. 001-14704, and incorporated herein by reference).
|
|
|
||
|
10.66
|
Tax Sharing Agreement, dated as of June 15, 2012, by and among Sara Lee Corporation, D.E MASTER BLENDERS 1753 B.V. and DE US, Inc. (previously filed as Exhibit 10.1 to the Current Report on Form 8-K dated June 18, 2012 by The Hillshire Brands Company, Commission File No. 001-03344, and incorporated herein by reference).
|
|
|
10.67
|
*
|
First Amendment to the Company's Supplemental Executive Retirement and Life Insurance Premium Plan as Amended and Restated as of November 14, 2014 (previously filed as Exhibit 10.57 to the Company's Annual Report on Form 10-K for the fiscal year ended September 27, 2014, Commission File No. 001-14704, and incorporated herein by reference).
|
|
10.68
|
*
|
Amended and Restated Tyson Foods, Inc. Supplemental Executive Retirement and Life Insurance Premium Plan effective January 1, 2017.
|
|
12.1
|
Calculation of Ratio of Earnings to Fixed Charges.
|
|
|
14.1
|
Code of Conduct of the Company (previously filed as Exhibit 14.1 to the Company's Annual Report on Form 10-K for the fiscal year ended September 28, 2013, Commission File No. 001-14704, and incorporated herein by reference).
|
|
|
21
|
Subsidiaries of the Company.
|
|
|
23
|
Consent of PricewaterhouseCoopers LLP.
|
|
|
31.1
|
Certification of Chief Executive Officer pursuant to SEC Rule 13a-14(a)/15d-14(a), as adopted pursuant to Section 302 of the Sarbanes-Oxley Act of 2002.
|
|
|
31.2
|
Certification of Chief Financial Officer pursuant to SEC Rule 13a-14(a)/15d-14(a), as adopted pursuant to Section 302 of the Sarbanes-Oxley Act of 2002.
|
|
|
32.1
|
Certification of Chief Executive Officer pursuant to 18 U.S.C. Section 1350, as adopted pursuant to Section 906 of the Sarbanes-Oxley Act of 2002.
|
|
|
32.2
|
Certification of Chief Financial Officer pursuant to 18 U.S.C. Section 1350, as adopted pursuant to Section 906 of the Sarbanes-Oxley Act of 2002.
|
|
|
101
|
The following financial information from our Annual Report on Form 10-K for the year ended October 1, 2016, formatted in XBRL (eXtensible Business Reporting Language): (i) Consolidated Statements of Income, (ii) Consolidated Statements of Comprehensive Income, (iii) Consolidated Balance Sheets, (iv) Consolidated Statements of Shareholders' Equity, (v) Consolidated Statements of Cash Flows, (vi) the Notes to Consolidated Financial Statements, and (vii) Financial Statement Schedule.
|
|
|
*
|
Indicates a management contract or compensatory plan or arrangement.
|
|
97
FINANCIAL STATEMENT SCHEDULE
TYSON FOODS, INC.
SCHEDULE II
VALUATION AND QUALIFYING ACCOUNTS
Three Years Ended
October 1, 2016
|
in millions
|
|
|||||||||||||||||||
|
Additions
|
||||||||||||||||||||
|
Balance at
Beginning
of Period
|
|
Charged to
Costs and
Expenses
|
|
Charged to
Other Accounts
|
|
(Deductions)
|
|
Balance at End
of Period
|
|
|||||||||||
|
Allowance for Doubtful Accounts:
|
||||||||||||||||||||
|
2016
|
$
|
27
|
|
$
|
10
|
|
$
|
—
|
|
$
|
(4
|
)
|
$
|
33
|
|
|||||
|
2015
|
34
|
|
1
|
|
—
|
|
(8
|
)
|
27
|
|
||||||||||
|
2014
|
46
|
|
5
|
|
—
|
|
(17
|
)
|
34
|
|
||||||||||
|
Inventory Lower of Cost or Market Allowance:
|
||||||||||||||||||||
|
2016
|
$
|
58
|
|
$
|
70
|
|
$
|
—
|
|
$
|
(89
|
)
|
$
|
39
|
|
|||||
|
2015
|
7
|
|
99
|
|
—
|
|
(48
|
)
|
58
|
|
||||||||||
|
2014
|
16
|
|
14
|
|
—
|
|
(23
|
)
|
7
|
|
||||||||||
|
Valuation Allowance on Deferred Tax Assets:
|
||||||||||||||||||||
|
2016
|
$
|
68
|
|
$
|
10
|
|
$
|
—
|
|
$
|
(6
|
)
|
$
|
72
|
|
|||||
|
2015
|
51
|
|
21
|
|
—
|
|
(4
|
)
|
68
|
|
||||||||||
|
2014
|
77
|
|
26
|
|
13
|
|
(65
|
)
|
51
|
|
||||||||||
98
TABLE OF CONTENTS
Part IItem 1. BusinessItem 1A. Risk FactorsItem 1B. Unresolved Staff CommentsItem 2. PropertiesItem 3. Legal ProceedingsItem 4. Mine Safety DisclosuresPart IIItem 5. Market For Registrant S Common Equity, Related Stockholder Matters and Issuer Purchases Of Equity SecuritiesItem 6. Selected Financial DataItem 7. Management S Discussion and Analysis Of Financial Condition and Results Of OperationsItem 7A. Quantitative and Qualitative Disclosures About Market RiskItem 8. Financial Statements and Supplementary DataNote 1: Business and Summary Of Significant Accounting PoliciesNote 2: Changes in Accounting PrinciplesNote 3: Acquisitions and DispositionsNote 4: Property, Plant and EquipmentNote 5: Goodwill and Intangible AssetsNote 6: DebtNote 7: EquityNote 8: Income TaxesNote 9: Other Income and ChargesNote 10: Earnings Per ShareNote 11: Derivative Financial InstrumentsNote 12: Fair Value MeasurementsNote 13: Stock-based CompensationNote 14: Pensions and Other Postretirement BenefitsNote 15: Comprehensive Income (loss)Note 16: Segment ReportingNote 17: Supplemental Cash Flows InformationNote 18: Transactions with Related PartiesNote 19: Commitments and ContingenciesNote 20: Quarterly Financial Data (unaudited)Item 9. Changes in and Disagreements with Accountants on Accounting and Financial DisclosureItem 9A. Controls and ProceduresItem 9B. Other InformationPart IIIItem 10. Directors, Executive Officers and Corporate GovernanceItem 11. Executive CompensationItem 12. Security Ownership Of Certain Beneficial Owners and Management and Related Stockholder MattersItem 13. Certain Relationships and Related Transactions, and Director IndependenceItem 14. Principal Accounting Fees and ServicesPart IVItem 15. Exhibits, Financial Statement Schedules